
Rockefeller Climate Solutions Fund
Rockefeller US Small Cap Core Fund
Core Financial Statements
May 31, 2024
UNITED STATES
SECURITIES AND EXCHANGE COMMISSION
Washington, D.C. 20549
FORM N-CSR
CERTIFIED SHAREHOLDER REPORT OF REGISTERED
MANAGEMENT INVESTMENT COMPANIES
Investment Company Act file number 811-10401
Trust for Professional Managers
(Exact name of registrant as specified in charter)
615 East Michigan Street
Milwaukee, WI 53202
(Address of principal executive offices) (Zip code)
Jay S. Fitton
U.S. Bancorp Fund Services, LLC
615 East Michigan Street
Milwaukee, WI 53202
(Name and address of agent for service)
(513) 520-5925
Registrant’s telephone number, including area code
Date of fiscal year end: November 30, 2024
Date of reporting period: May 31, 2024
Item 1. Reports to Stockholders.
| (a) |
 | Rockefeller Climate Solutions Fund |  |
| Institutional Class | RKCIX | ||
| Semi-Annual Shareholder Report | May 31, 2024 |
Class Name | Costs of a $10,000 investment | Costs paid as a percentage of a $10,000 investment |
| Institutional Class | $53 | 0.99% |
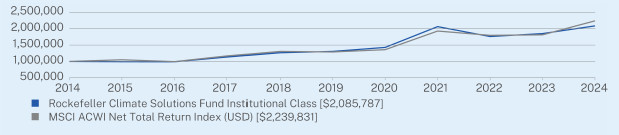
1 Year | 5 Year | 10 Year | |
Insitutional Class | 12.67 | 9.81 | 7.63 |
MSCI ACWI Net Total Return Index (USD) | 23.56 | 11.68 | 8.40 |
| * | The Fund’s past performance is not a good predictor of the Fund’s future performance. The returns do not reflect the deduction of taxes that a shareholder would pay on Fund distributions or redemption of Fund shares. |
| Rockefeller Climate Solutions Fund | PAGE 1 | TSR_SAR_89834G794 |
Net Assets | $94,833,954 |
Number of Holdings | 48 |
Portfolio Turnover | 11.10% |

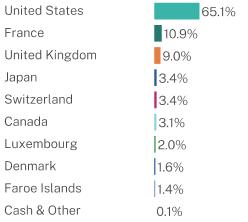
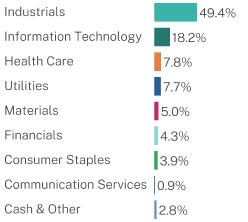
Top 10 Issuers | |
Mueller Industries, Inc. | 4.7% |
Schneider Electric SE | 3.8% |
Cie de Saint-Gobain | 3.6% |
Bureau Veritas SA | 3.5% |
Badger Meter, Inc. | 3.3% |
Air Products and Chemicals, Inc. | 3.1% |
StoneX Group, Inc. | 2.9% |
SSE PLC | 2.9% |
Trimble, Inc. | 2.9% |
Atkore, Inc. | 2.8% |
| * | The Global Industry Classification Standard (“GICS®”) was developed by and/or is the exclusive property of MSCI, Inc. (“MSCI”) and Standard & Poor’s Financial Services LLC (“S&P”). GICS® is a service mark of MSCI and S&P and has been licensed for use by U.S. Bank Global Fund Services. |
| Rockefeller Climate Solutions Fund | PAGE 2 | TSR_SAR_89834G794 |
 | Rockefeller Climate Solutions Fund |  |
| Class A | RKCAX | ||
| Semi-Annual Shareholder Report | May 31, 2024 |
Class Name | Costs of a $10,000 investment | Costs paid as a percentage of a $10,000 investment |
| Class A | $66 | 1.24% |
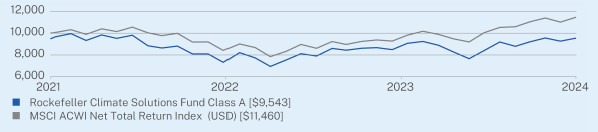
1 Year | Since Inception (07/21/2021) | |
Class A | 12.39 | 0.25 |
MSCI ACWI Net Total Return Index (USD) | 23.56 | 4.88 |
| * | The Fund’s past performance is not a good predictor of the Fund’s future performance. The returns do not reflect the deduction of taxes that a shareholder would pay on Fund distributions or redemption of Fund shares. |
| Rockefeller Climate Solutions Fund | PAGE 1 | TSR_SAR_89834G786 |
Net Assets | $94,833,954 |
Number of Holdings | 48 |
Portfolio Turnover | 11.10% |
Top 10 Issuers | |
Mueller Industries, Inc. | 4.7% |
Schneider Electric SE | 3.8% |
Cie de Saint-Gobain | 3.6% |
Bureau Veritas SA | 3.5% |
Badger Meter, Inc. | 3.3% |
Air Products and Chemicals, Inc. | 3.1% |
StoneX Group, Inc. | 2.9% |
SSE PLC | 2.9% |
Trimble, Inc. | 2.9% |
Atkore, Inc. | 2.8% |

| * | The Global Industry Classification Standard (“GICS®”) was developed by and/or is the exclusive property of MSCI, Inc. (“MSCI”) and Standard & Poor’s Financial Services LLC (“S&P”). GICS® is a service mark of MSCI and S&P and has been licensed for use by U.S. Bank Global Fund Services. |
| Rockefeller Climate Solutions Fund | PAGE 2 | TSR_SAR_89834G786 |
 | Rockefeller US Small Cap Core Fund |  |
| Class A | RKSAX | ||
| Semi-Annual Shareholder Report | May 31, 2024 |
Class Name | Costs of a $10,000 investment | Costs paid as a percentage of a $10,000 investment |
| Class A | $64 | 1.20% |
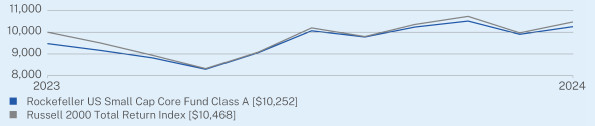
Since Inception (07/31/2023) | |
Class A | 8.20 |
Russell 2000 Total Return Index | 4.68 |
| * | The Fund’s past performance is not a good predictor of the Fund’s future performance. The returns do not reflect the deduction of taxes that a shareholder would pay on Fund distributions or redemption of Fund shares. |
| Rockefeller US Small Cap Core Fund | PAGE 1 | TSR_SAR_89834G653 |
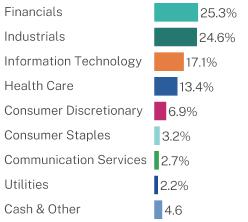
Net Assets | $87,355,320 |
Number of Holdings | 40 |
Portfolio Turnover | 24.55% |

Top 10 Issuers | |
Mueller Industries, Inc. | 4.7% |
Invesco Government & Agency Portfolio | 4.6% |
PROS Holdings, Inc. | 4.3% |
Stride, Inc. | 4.3% |
Merit Medical Systems, Inc. | 4.1% |
Korn Ferry | 4.1% |
StoneX Group, Inc. | 3.6% |
SunOpta, Inc. | 3.2% |
RadNet, Inc. | 3.0% |
Donnelley Financial Solutions, Inc. | 3.0% |
| * | The Global Industry Classification Standard (“GICS®”) was developed by and/or is the exclusive property of MSCI, Inc. (“MSCI”) and Standard & Poor’s Financial Services LLC (“S&P”). GICS® is a service mark of MSCI and S&P and has been licensed for use by U.S. Bank Global Fund Services. |
| Rockefeller US Small Cap Core Fund | PAGE 2 | TSR_SAR_89834G653 |
 | Rockefeller US Small Cap Core Fund |  |
| Class I | RKSIX | ||
| Semi-Annual Shareholder Report | May 31, 2024 |
Class Name | Costs of a $10,000 investment | Costs paid as a percentage of a $10,000 investment |
| Class I | $51 | 0.95% |
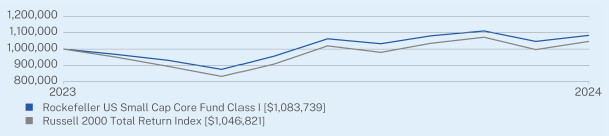
Since Inception (07/31/2023) | |
Class I | 8.37 |
Russell 2000 Total Return Index | 4.68 |
| * | The Fund’s past performance is not a good predictor of the Fund’s future performance. The returns do not reflect the deduction of taxes that a shareholder would pay on Fund distributions or redemption of Fund shares. |
| Rockefeller US Small Cap Core Fund | PAGE 1 | TSR_SAR_89834G646 |
Net Assets | $87,355,320 |
Number of Holdings | 40 |
Portfolio Turnover | 24.55% |
Top 10 Issuers | |
Mueller Industries, Inc. | 4.7% |
Invesco Government & Agency Portfolio | 4.6% |
PROS Holdings, Inc. | 4.3% |
Stride, Inc. | 4.3% |
Merit Medical Systems, Inc. | 4.1% |
Korn Ferry | 4.1% |
StoneX Group, Inc. | 3.6% |
SunOpta, Inc. | 3.2% |
RadNet, Inc. | 3.0% |
Donnelley Financial Solutions, Inc. | 3.0% |
| * | The Global Industry Classification Standard (“GICS®”) was developed by and/or is the exclusive property of MSCI, Inc. (“MSCI”) and Standard & Poor’s Financial Services LLC (“S&P”). GICS® is a service mark of MSCI and S&P and has been licensed for use by U.S. Bank Global Fund Services. |
| Rockefeller US Small Cap Core Fund | PAGE 2 | TSR_SAR_89834G646 |
| (b) | Not applicable for this Registrant. |
Item 2. Code of Ethics.
Not applicable for semi-annual reports.
Item 3. Audit Committee Financial Expert.
Not applicable for semi-annual reports.
Item 4. Principal Accountant Fees and Services.
Not applicable for semi-annual reports.
Item 5. Audit Committee of Listed Registrants.
Not applicable to registrants who are not listed issuers (as defined in Rule 10A-3 under the Securities Exchange Act of 1934).
Item 6. Investments.
| (a) | Schedule of Investments is included within the financial statements filed under Item 7(a) of this Form. |
| (b) | Not Applicable. |
Item 7. Financial Statements and Financial Highlights for Open-End Investment Companies.
| (a) |
Shares | Value | ||||||
Common Stocks — 97.2% | |||||||
Building Products — 10.9% | |||||||
A. O. Smith Corp. | 27,220 | $ 2,276,681 | |||||
AAON, Inc. | 18,617 | 1,397,206 | |||||
AZEK Co., Inc.(a) | 40,528 | 1,943,723 | |||||
Cie de Saint-Gobain | 38,502 | 3,399,382 | |||||
Geberit AG | 2,095 | 1,288,570 | |||||
10,305,562 | |||||||
Capital Markets — 2.9% | |||||||
StoneX Group, Inc.(a) | 37,131 | 2,787,424 | |||||
Chemicals — 5.1% | |||||||
Air Products and Chemicals, Inc. | 10,812 | 2,883,561 | |||||
DSM-Firmenich AG | 16,574 | 1,918,486 | |||||
4,802,047 | |||||||
Commercial Services & Supplies — 6.8% | |||||||
Rentokil Initial PLC | 403,585 | 2,151,594 | |||||
Tetra Tech, Inc. | 12,241 | 2,564,367 | |||||
Veralto Corp. | 17,211 | 1,696,661 | |||||
6,412,622 | |||||||
Construction & Engineering — 1.5% | |||||||
Stantec, Inc. | 17,349 | 1,400,191 | |||||
Diversified Telecommunication Services — 0.9% | |||||||
Iridium Communications, Inc. | 29,688 | 893,906 | |||||
Electric Utilities — 2.9% | |||||||
SSE PLC | 122,600 | 2,758,013 | |||||
Electrical Equipment — 8.8% | |||||||
Array Technologies, Inc.(a) | 37,406 | 530,417 | |||||
Atkore, Inc. | 17,636 | 2,683,317 | |||||
Schneider Electric SE | 14,497 | 3,616,704 | |||||
Vestas Wind Systems AS(a) | 52,907 | 1,484,485 | |||||
8,314,923 | |||||||
Electronic Equipment, Instruments & Components — 11.8% | |||||||
Badger Meter, Inc. | 16,270 | 3,139,459 | |||||
Halma PLC | 63,426 | 1,815,597 | |||||
TE Connectivity Ltd. | 10,526 | 1,575,742 | |||||
Teledyne Technologies, Inc.(a) | 4,781 | 1,897,818 | |||||
Trimble, Inc.(a) | 49,326 | 2,746,472 | |||||
11,175,088 | |||||||
1 |
Shares | Value | ||||||
Common Stocks — continued | |||||||
Food Products — 3.9% | |||||||
Bakkafrost P/F | 24,190 | $ 1,332,792 | |||||
Darling Ingredients, Inc.(a) | 58,055 | 2,345,422 | |||||
3,678,214 | |||||||
Financial Services — 1.3% | |||||||
Hannon Armstrong Sustainable Infrastructure Capital, Inc. | 37,647 | 1,253,269 | |||||
Health Care Providers & Services — 1.9% | |||||||
Progyny, Inc.(a) | 67,616 | 1,822,251 | |||||
Independent Power & Renewable Electricity Producers — 1.6% | |||||||
Brookfield Renewable Corp. - Class A | 31,340 | 988,464 | |||||
Sunnova Energy International, Inc.(a) | 106,014 | 553,393 | |||||
1,541,857 | |||||||
Industrial Conglomerates — 2.0% | |||||||
Hitachi Ltd. | 18,900 | 1,946,467 | |||||
Life Sciences Tools & Services — 5.9% | |||||||
Agilent Technologies, Inc. | 17,297 | 2,255,702 | |||||
Danaher Corp. | 5,397 | 1,385,949 | |||||
Eurofins Scientific SE(a) | 31,754 | 1,916,756 | |||||
5,558,407 | |||||||
Machinery — 13.4% | |||||||
ATS Corp.(a) | 49,182 | 1,566,809 | |||||
Kubota Corp. | 92,400 | 1,307,795 | |||||
Mueller Industries, Inc. | 75,168 | 4,428,147 | |||||
Pentair PLC | 22,600 | 1,839,188 | |||||
Timken Co. | 20,546 | 1,785,242 | |||||
Xylem, Inc./NY | 12,649 | 1,783,762 | |||||
12,710,943 | |||||||
Multi-Utilities — 2.0% | |||||||
CMS Energy Corp. | 30,451 | 1,916,281 | |||||
Professional Services — 6.1% | |||||||
Bureau Veritas SA | 110,009 | 3,313,153 | |||||
Verisk Analytics, Inc. | 9,923 | 2,508,336 | |||||
5,821,489 | |||||||
Semiconductors & Semiconductor Equipment — 0.8% | |||||||
Enphase Energy, Inc.(a) | 6,003 | 767,784 | |||||
Software — 5.6% | |||||||
ANSYS, Inc.(a) | 6,629 | 2,104,376 | |||||
Bentley Systems, Inc. - Class B | 34,560 | 1,736,294 | |||||
2 |
Shares | Value | ||||||
Common Stocks — continued | |||||||
Software — continued | |||||||
Roper Technologies, Inc. | 2,784 | $ 1,483,204 | |||||
5,323,874 | |||||||
Water Utilities — 1.1% | |||||||
American Water Works Co., Inc. | 8,041 | 1,051,522 | |||||
Total Common Stocks (Cost $85,009,991) | 92,242,134 | ||||||
Short-Term Investments — 2.7% | |||||||
Money Market Funds — 2.7% | |||||||
Invesco Government & Agency Portfolio - Class Institutional, 5.24%(b) | 2,532,511 | 2,532,511 | |||||
Total Short-Term Investments (Cost $2,532,511) | 2,532,511 | ||||||
Total Investments — 99.9% (Cost $87,542,502) | $94,774,645 | ||||||
Other Assets in Excess of Liabilities — 0.1% | 59,309 | ||||||
TOTAL NET ASSETS — 100.0% | $94,833,954 | ||||||
(a) | Non-income producing security. |
(b) | The rate shown represents the 7-day effective yield as of May 31, 2024. |
3 |
Shares | Value | ||||||
COMMON STOCKS — 95.4% | |||||||
Automobile Components — 2.6% | |||||||
Gentherm, Inc.(a) | 23,657 | $ 1,276,059 | |||||
XPEL, Inc.(a) | 26,298 | 999,324 | |||||
2,275,383 | |||||||
Banks — 2.0% | |||||||
First Bancorp. | 56,596 | 1,785,604 | |||||
Building Products — 4.0% | |||||||
AAON, Inc. | 17,063 | 1,280,578 | |||||
AZEK Co., Inc.(a) | 45,466 | 2,180,549 | |||||
3,461,127 | |||||||
Capital Markets — 8.8% | |||||||
Donnelley Financial Solutions, Inc.(a) | 43,560 | 2,655,418 | |||||
PJT Partners, Inc. - Class A | 17,970 | 1,916,860 | |||||
StoneX Group, Inc.(a) | 41,704 | 3,130,719 | |||||
7,702,997 | |||||||
Communications Equipment — 2.0% | |||||||
Calix, Inc.(a) | 49,963 | 1,783,679 | |||||
Construction & Engineering — 2.0% | |||||||
Sterling Infrastructure, Inc.(a) | 14,486 | 1,779,895 | |||||
Consumer Finance — 2.0% | |||||||
FirstCash Holdings, Inc. | 14,831 | 1,748,871 | |||||
Diversified Consumer Services — 4.3% | |||||||
Stride, Inc.(a) | 54,583 | 3,747,669 | |||||
Electrical Equipment — 2.4% | |||||||
Atkore, Inc. | 13,781 | 2,096,779 | |||||
Electronic Equipment, Instruments & Components — 8.6% | |||||||
Badger Meter, Inc. | 11,015 | 2,125,454 | |||||
CTS Corp. | 25,352 | 1,342,388 | |||||
Insight Enterprises, Inc.(a) | 10,629 | 2,077,970 | |||||
Napco Security Technologies, Inc. | 39,492 | 1,960,778 | |||||
7,506,590 | |||||||
Financial Services — 8.3% | |||||||
AvidXchange Holdings, Inc.(a) | 132,433 | 1,402,465 | |||||
Hannon Armstrong Sustainable Infrastructure Capital, Inc. | 70,042 | 2,331,698 | |||||
International Money Express, Inc.(a) | 77,045 | 1,607,159 | |||||
Walker & Dunlop, Inc. | 19,946 | 1,914,617 | |||||
7,255,939 | |||||||
Food Products — 3.2% | |||||||
SunOpta, Inc.(a) | 467,598 | 2,810,264 | |||||
4 |
Shares | Value | ||||||
Common Stocks — continued | |||||||
Gas Utilities — 2.2% | |||||||
ONE Gas, Inc. | 31,482 | $ 1,940,236 | |||||
Ground Transportation — 2.2% | |||||||
ArcBest Corp. | 17,784 | 1,876,568 | |||||
Health Care Equipment & Supplies — 5.6% | |||||||
Merit Medical Systems, Inc.(a) | 44,715 | 3,628,622 | |||||
Omnicell, Inc.(a) | 39,454 | 1,285,806 | |||||
4,914,428 | |||||||
Health Care Providers & Services — 7.7% | |||||||
Progyny, Inc.(a) | 64,382 | 1,735,095 | |||||
RadNet, Inc.(a) | 45,596 | 2,673,750 | |||||
US Physical Therapy, Inc. | 22,897 | 2,348,545 | |||||
6,757,390 | |||||||
Insurance — 4.2% | |||||||
Skyward Specialty Insurance Group, Inc.(a) | 34,237 | 1,277,725 | |||||
Stewart Information Services Corp. | 37,179 | 2,353,802 | |||||
3,631,527 | |||||||
Machinery — 6.8% | |||||||
ATS Corp.(a) | 58,191 | 1,852,219 | |||||
Mueller Industries, Inc. | 68,689 | 4,046,469 | |||||
5,898,688 | |||||||
Media — 2.7% | |||||||
TechTarget, Inc.(a) | 79,319 | 2,397,020 | |||||
Professional Services — 7.3% | |||||||
Huron Consulting Group, Inc.(a) | 19,884 | 1,755,956 | |||||
Korn Ferry | 53,858 | 3,551,397 | |||||
Paycor HCM, Inc.(a) | 84,047 | 1,039,661 | |||||
6,347,014 | |||||||
Software — 6.5% | |||||||
Agilysys, Inc.(a) | 20,056 | 1,914,746 | |||||
PROS Holdings, Inc.(a) | 127,897 | 3,770,404 | |||||
5,685,150 | |||||||
TOTAL COMMON STOCKS (Cost $77,766,141) | 83,402,818 | ||||||
5 |
Shares | Value | ||||||
Short-Term Investments — 4.6% | |||||||
Money Market Funds — 4.6% | |||||||
Invesco Government & Agency Portfolio - Class Institutional, 5.24%(b) | 3,991,760 | $ 3,991,760 | |||||
Total Short-Term Investments (Cost $3,991,760) | 3,991,760 | ||||||
Total Investments — 100.0% (Cost $81,757,901) | 87,394,578 | ||||||
Liabilities in Excess of Other Assets — 0.0%(c) | (39,258) | ||||||
TOTAL NET ASSETS — 100.0% | $87,355,320 | ||||||
| (a) | Non-income producing security. |
| (b) | The rate shown represents the 7-day effective yield as of May 31, 2024. |
| (c) | Represents less than 0.05% of net assets. |
6 |
Rockefeller Climate Solutions Fund | Rockefeller US Small Cap Core Fund | ||||||
Assets | |||||||
Investments, at value (cost $87,542,502 and 81,757,901 respectively) | $94,774,645 | $87,394,578 | |||||
Dividends and interest receivable | 119,827 | 46,415 | |||||
Receivable for capital shares sold | 16,710 | 309 | |||||
Other assets | 22,632 | 32,242 | |||||
Total Assets | 94,933,814 | 87,473,544 | |||||
Liabilities | |||||||
Payable to adviser | 40,996 | 40,804 | |||||
Payable to affiliates | 30,998 | 21,109 | |||||
Audit fees payable | 26,106 | 26,106 | |||||
Payable for fund shares redeemed | 1,316 | 695 | |||||
Payable for 12b-1 fees - Class A | 102 | 246 | |||||
Payable for investments purchased | — | 29,058 | |||||
Accrued expenses and other liabilities | 342 | 206 | |||||
Total Liabilities | 99,860 | 118,224 | |||||
Net Assets | $94,833,954 | $87,355,320 | |||||
Net Assets Consist of: | |||||||
Paid-in capital | $72,861,764 | $81,395,495 | |||||
Total distributable earnings | 21,972,190 | 5,959,825 | |||||
Net Assets | $94,833,954 | $87,355,320 | |||||
Institutional Class | |||||||
Net assets | $94,567,765 | $— | |||||
Shares of beneficial interest outstanding (unlimited shares authorized, $0.001 par value) | 9,414,957 | — | |||||
Net asset value, redemption price and offering price per share | $10.04 | $— | |||||
Class A | |||||||
Net assets | $266,189 | $145,378 | |||||
Shares of beneficial interest outstanding (unlimited shares authorized, $0.001 par value) | 26,587 | 13,432 | |||||
Net asset value, redemption price and offering price per share | $10.01 | $10.82 | |||||
Class I | |||||||
Net assets | $— | $87,209,942 | |||||
Shares of beneficial interest outstanding (unlimited shares authorized, $0.001 par value) | — | 8,050,020 | |||||
Net asset value, redemption price and offering price per share | $— | $10.83 | |||||
7 |
Rockefeller Climate Solutions Fund | Rockefeller US Small Cap Core Fund | ||||||
Investment Income | |||||||
Dividend income | $496,975 | $249,443 | |||||
Less: Foreign withholding taxes and issuance fees | (33,652) | — | |||||
Interest income | 67,921 | 59,705 | |||||
Total Investment Income | 531,244 | 309,148 | |||||
Expenses | |||||||
Management fees | 389,569 | 326,411 | |||||
Transfer agent fees and expenses | 64,629 | 23,315 | |||||
Administration and accounting fees | 55,496 | 42,411 | |||||
Audit and tax fees | 19,406 | 19,406 | |||||
Federal & state registration fees | 18,035 | 26,535 | |||||
Trustees’ fees | 14,755 | 14,169 | |||||
Legal fees | 14,382 | 11,437 | |||||
Custody fees | 9,722 | 4,294 | |||||
Chief Compliance Officer fees | 6,703 | 6,020 | |||||
Pricing fees | 2,554 | 642 | |||||
Insurance expense | 1,281 | 1,090 | |||||
Reports to shareholders | 881 | 926 | |||||
12b-1 fees – Class A | 314 | 170 | |||||
Other expenses | 4,491 | 4,451 | |||||
Total Expenses | 602,218 | 481,277 | |||||
Expense Waiver by Adviser (Note 4) | (148,171) | (116,295) | |||||
Net Expenses | 454,047 | 364,982 | |||||
Net Investment Income (Loss) | 77,197 | (55,834) | |||||
Realized and Unrealized Gain (Loss) on Investments | |||||||
Net realized gain/(loss) from: | |||||||
Investments | (82,913) | 643,189 | |||||
Foreign currency | 9,568 | — | |||||
Net change in unrealized appreciation/(depreciation) on: | |||||||
Investments | 11,496,487 | 7,995,366 | |||||
Foreign currency | (1,492) | — | |||||
Net Realized and Unrealized Gain on Investments | 11,421,650 | 8,638,555 | |||||
Net Increase in Net Assets from Operations | $11,498,847 | $8,582,721 | |||||
8 |
Period Ended May 31, 2024 (Unaudited) | Year Ended November 30, 2023 | ||||||
From Operations | |||||||
Net investment income | $77,197 | $381,804 | |||||
Net realized loss from investments and foreign currency translation | (73,345) | (4,107,421) | |||||
Net change in unrealized appreciation on investment and foreign currency translation | 11,494,995 | 6,967,218 | |||||
Net increase in net assets from operations | 11,498,847 | 3,241,601 | |||||
From Distributions | |||||||
Net dividends and distributions | (382,022) | (123,855) | |||||
Net decrease in net assets resulting from distributions paid | (382,022) | (123,855) | |||||
From Capital Share Transactions | |||||||
Proceeds from shares sold - Class A | 18,975 | 9,550 | |||||
Proceeds from shares sold - Institutional Class | 2,159,961 | 13,096,439 | |||||
Reinvestments - Class A | 184 | — | |||||
Reinvestments - Institutional Class | 202,049 | 43,627 | |||||
Cost of shares redeemed - Class A | (7,487) | (923,590) | |||||
Cost of shares redeemed - Institutional Class | (2,824,260) | (23,262,950) | |||||
Net decrease in net assets from capital share transactions | (450,578) | (11,036,924) | |||||
Total increase/(decrease) in net assets | 10,666,247 | (7,919,178) | |||||
Net Assets | |||||||
Beginning of period | 84,167,707 | 92,086,885 | |||||
End of period | $94,833,954 | $84,167,707 | |||||
9 |
Period Ended May 31, 2024 (Unaudited) | Period From July 31, 2023(1) to November 30, 2023 | ||||||
From Operations | |||||||
Net investment income (Loss) | $(55,834) | $32,919 | |||||
Net realized gain/(loss) from investments | 643,189 | (261,888) | |||||
Net change in unrealized appreciation/(depreciation) on from investments | 7,995,366 | (2,347,664) | |||||
Net increase/(decrease) in net assets from operations | 8,582,721 | (2,576,633) | |||||
From Distributions | |||||||
Net dividends and distributions | (46,263) | — | |||||
Net decrease in net assets resulting from distributions paid | (46,263) | — | |||||
From Capital Share Transactions | |||||||
Proceeds from shares sold - Class A | 29,000 | 105,000 | |||||
Proceeds from shares sold - Class I | 19,901,699 | 65,584,204 | |||||
Reinvestments - Class I | 11,811 | — | |||||
Cost of shares redeemed - Class I | (2,773,929) | (1,462,290) | |||||
Net increase in net assets from capital share transactions | 17,168,581 | 64,226,914 | |||||
Total increase in net assets | 25,705,039 | 61,650,281 | |||||
Net Assets | |||||||
Beginning of period | 61,650,281 | — | |||||
End of period | $87,355,320 | $61,650,281 | |||||
(1) | The Fund commenced operations on July 31, 2023. |
10 |
Per share data for a share outstanding throughout each period | ||
Period Ended May 31, 2024 (Unaudited) | Year Ended November 30, | Period Ended November 30, 2021(1) | |||||||||||
2023 | 2022 | ||||||||||||
Net Asset Value, Beginning of Period | $8.88 | $8.56 | $10.06 | $10.00 | |||||||||
Income from investment operations: | |||||||||||||
Net investment income/(loss)(2) | 0.01 | 0.04 | 0.03 | (0.01) | |||||||||
Net realized and unrealized gain/(loss) | 1.19 | 0.29 | (1.49) | 0.07 | |||||||||
Total from investment operations | 1.20 | 0.33 | (1.46) | 0.06 | |||||||||
Paid from net investment income | (0.04) | (0.01) | — | — | |||||||||
Paid from realized gains | — | — | (0.04) | — | |||||||||
Total distributions paid | (0.04) | (0.01) | (0.04) | — | |||||||||
Net Asset Value, End of Period | $10.04 | $8.88 | $8.56 | $10.06 | |||||||||
Total return | 13.63% | 3.87% | (14.55)% | 0.58%(3) | |||||||||
Supplemental Data and Ratios: | |||||||||||||
Net assets at end of period (000’s) | $94,568 | $83,944 | $90,942 | $113,235 | |||||||||
Ratio of expenses to average net assets: | |||||||||||||
Before waiver, expense reimbursement | 1.30% | 1.30% | 1.26% | 1.25%(4) | |||||||||
After waiver, expense reimbursement | 0.99% | 0.99% | 0.99% | 0.99%(4) | |||||||||
Ratio of net investment income/(loss) to average net assets: | |||||||||||||
Before waiver, expense reimbursement | (0.14)% | 0.15% | 0.04% | (0.69)%(4) | |||||||||
After waiver, expense reimbursement | 0.17% | 0.46% | 0.31% | (0.43)%(4) | |||||||||
Portfolio turnover rate | 11.10% | 38.13% | 16.93% | 13.14%(5) | |||||||||
(1) | Fund commenced operations on July 21, 2021. |
(2) | Net investment income per share has been calculated using the daily average shares method. |
(3) | Not annualized for periods less than one year. |
(4) | Annualized for periods less than one year. |
(5) | Portfolio turnover rate is not annualized and excludes the value of portfolio securities received as a result of in-kind subscriptions. |
11 |
Per share data for a share outstanding throughout each period | ||
Period Ended May 31, 2024 (Unaudited) | Year Ended November 30, | Period Ended November 30, 2021(1) | |||||||||||
2023 | 2022 | ||||||||||||
Net Asset Value, Beginning of Period | $8.84 | $8.53 | $10.05 | $10.00 | |||||||||
Income from investment operations: | |||||||||||||
Net investment income/(loss)(2) | — | 0.02 | 0.01 | (0.03) | |||||||||
Net realized and unrealized gain/(loss) | 1.19 | 0.29 | (1.49) | 0.08 | |||||||||
Total from investment operations | 1.19 | 0.31 | (1.48) | 0.05 | |||||||||
Paid from net investment income | (0.02) | — | — | — | |||||||||
Paid from realized gains | — | — | (0.04) | — | |||||||||
Total distributions paid | (0.02) | — | (0.04) | — | |||||||||
Net asset value, end of period | $10.01 | $8.84 | $8.53 | $10.05 | |||||||||
Total return | 13.48% | 3.61% | (14.76)% | 0.50%(3) | |||||||||
Supplemental data and ratios: | |||||||||||||
Net assets at end of period (000’s) | $266 | $224 | $1,145 | $887 | |||||||||
Ratio of expenses to average net assets: | |||||||||||||
Before waiver, expense reimbursement | 1.55% | 1.55% | 1.53% | 1.56%(4) | |||||||||
After waiver, expense reimbursement | 1.24% | 1.24% | 1.24% | 1.24%(4) | |||||||||
Ratio of net investment income/(loss) to average net assets: | |||||||||||||
Before waiver, expense reimbursement | (0.38)% | (0.08)% | (0.19)% | (1.21)%(4) | |||||||||
After waiver, expense reimbursement | (0.07)% | 0.23% | 0.08% | (0.89)%(4) | |||||||||
Portfolio turnover rate | 11.10% | 38.13% | 16.93% | 13.14%(5) | |||||||||
(1) | Fund commenced operations on July 21, 2021. |
(2) | Net investment income per share has been calculated using the daily average shares method. |
(3) | Not annualized for periods less than one year. |
(4) | Annualized for periods less than one year. |
(5) | Portfolio turnover rate is not annualized and excludes the value of portfolio securities received as a result of in-kind subscriptions. |
12 |
Per Share Data for a Share Outstanding Throughout each Period | ||
Period Ended May 31, 2024 (Unaudited) | Period Ended November 30, 2023(1) | ||||||
Net Asset Value, Beginning of Period | $9.57 | $10.00 | |||||
Income from investment operations: | |||||||
Net investment income/(loss)(2) | (0.01) | 0.01 | |||||
Net realized and unrealized gain/(loss) | 1.28 | (0.44) | |||||
Total from investment operations | 1.27 | (0.43) | |||||
Paid from net investment income | (0.01) | — | |||||
Paid from realized gains | — | — | |||||
Total distributions paid | (0.01) | — | |||||
Net Asset Value, End of Period | $10.83 | $9.57 | |||||
Total Return(3) | 13.24% | (4.30)% | |||||
Supplemental Data and Ratios: | |||||||
Net assets at end of period(000’s) | $87,210 | $61,548 | |||||
Ratio of expenses to average net assets: | |||||||
Before waiver, expense recoupment(4) | 1.25% | 1.55% | |||||
After waiver, expense recoupment(4) | 0.95% | 0.95% | |||||
Ratio of net investment income/(loss) to average net assets: | |||||||
Before waiver, expense recoupment(4) | (0.45)% | (0.43)% | |||||
After waiver, expense recoupment(4) | (0.15)% | 0.17% | |||||
Portfolio turnover rate(5) | 24.55% | 19.77% | |||||
(1) | Fund commenced operations on July 31, 2023. |
(2) | Net investment income per share has been calculated using the daily average shares method. |
(3) | Not annualized for periods less than one year. |
(4) | Annualized for periods less than one year. |
(5) | Portfolio turnover rate is not annualized and excludes the value of portfolio securities received as a result of in-kind subscriptions. |
13 |
Per Share Data for a Share Outstanding Throughout each Period | ||
Period Ended May 31, 2024 (Unaudited) | Period Ended November 30, 2023(1) | ||||||
Net Asset Value, Beginning of Period | $ 9.56 | $ 10.00 | |||||
Income from investment operations: | |||||||
Net investment income/(loss)(2) | (0.02) | — | |||||
Net realized and unrealized gain/(loss) | 1.28 | (0.44) | |||||
Total from investment operations | 1.26 | (0.44) | |||||
Net Asset Value, End of Period | $ 10.82 | $ 9.56 | |||||
Total Return(3) | 13.18% | (4.40%) | |||||
Supplemental Data and Ratios: | |||||||
Net assets at end of period (000’s) | $ 145 | $ 102 | |||||
Ratio of expenses to average net assets: | |||||||
Before waiver, expense reimbursement(4) | 1.50% | 3.98% | |||||
After waiver, expense reimbursement(4) | 1.20% | 1.20% | |||||
Ratio of net investment income/(loss) to average net assets: | |||||||
Before waiver, expense reimbursement(4) | (0.71)% | (2.89)% | |||||
After waiver, expense reimbursement(4) | (0.41)% | (0.11)% | |||||
Portfolio turnover rate(5) | 24.55% | 19.77% | |||||
(1) | Fund commenced operations on July 21, 2023. |
(2) | Net investment income per share has been calculated using the daily average shares method. |
(3) | Not annualized for periods less than one year. |
(4) | Annualized for periods less than one year. |
(5) | Portfolio turnover rate is not annualized and excludes the value of portfolio securities received as a result of in-kind subscriptions. |
14 |
15 |
| • | Level 1 – Quoted prices in active markets for identical securities. |
| • | Level 2 – Other significant observable inputs (including quoted prices for similar securities, interest rates, prepayment speeds, credit risk, etc.). |
| • | Level 3 – Significant unobservable inputs (including the Funds’ own assumptions in determining the fair value of investments). |
Level 1 | Level 2 | Level 3 | Total | ||||||||||
Assets(1): | |||||||||||||
Equities: | |||||||||||||
Common Stocks | $63,992,338 | $28,249,796 | $ — | $92,242,13 | |||||||||
Money Market Funds | 2,532,511 | — | — | 2,532,511 | |||||||||
Total Investments in Securities | $66,524,849 | $28,249,796 | $— | $94,774,645 | |||||||||
16 |
Level 1 | Level 2 | Level 3 | Total | ||||||||||
Assets(1): | |||||||||||||
Equities: | |||||||||||||
Common Stocks | $83,402,818 | $ — | $ — | $83,402,818 | |||||||||
Money Market Funds | 3,991,760 | — | — | 3,991,760 | |||||||||
Total Investments in Securities | $87,394,578 | $ — | $ — | $87,394,578 | |||||||||
(1) | See the Schedule of Investments for industry classifications. |
17 |
Rockefeller Climate Solutions Fund | Rockefeller US Small Cap Core Fund | ||||||
Distributions paid from: | |||||||
Ordinary Income | $ 123,855 | $ — | |||||
Long-Term Capital Gains | — | — | |||||
Total Distributions Paid | $123,855 | $— | |||||
Rockefeller Climate Solutions Fund | Rockefeller US Small Cap Core Fund | ||||||
Cost basis of investments for federal income tax purposes | $71,725,460 | $ 64,315,359 | |||||
Gross tax unrealized appreciation | 24,725,027 | 2,911,863 | |||||
Gross tax unrealized depreciation | (12,319,739) | (5,306,247) | |||||
Net tax unrealized appreciation | 12,405,288 | (2,394,384) | |||||
Undistributed ordinary income | 373,054 | 32,919 | |||||
Undistributed capital gains | — | — | |||||
Total other accumulated loss | (1,922,977) | (215,168) | |||||
Total distributable earnings | $10,855,365 | $(2,576,633) | |||||
Short-Term | Long-Term | ||||||
Rockefeller Climate Solutions Fund | 1,922,977 | — | |||||
Rockefeller US Small Cap Core Fund | 215,168 | — | |||||
18 |
Rockefeller Climate Solutions Fund | Rockefeller US Small Cap Core Fund | ||||||
Total Distributable Earnings/(Losses) | $ — | $ — | |||||
Paid-In Capital | — | — | |||||
Expense Limitation Cap | Expiration Date | ||||||
Rockefeller Climate Solutions Fund | 0.99% | March 31, 2025 | |||||
Rockefeller US Small Cap Core Fund | 0.95% | July 31, 2024* | |||||
| * | Beginning August 1, 2024, the Fund’s expense limitation cap will be 1.05% until March 31, 2025. |
Rockefeller Climate Solutions Fund | Rockefeller US Small Cap Core Fund | ||||||
November 30, 2024 | $ 100,316 | $— | |||||
November 30, 2025 | $261,030 | $— | |||||
November 30, 2026 | $260,048 | $ 115,968 | |||||
May 31, 2027 | $148,171 | $116,295 | |||||
19 |
Administration & Accounting | Incurred | Owed | |||||
Rockefeller Climate Solutions Fund | $ 55,496 | $ 20,674 | |||||
Rockefeller US Small Cap Core Fund | $42,411 | $10,738 | |||||
Pricing | Incurred | Owed | |||||
Rockefeller Climate Solutions Fund | $ 2,554 | $ 907 | |||||
Rockefeller US Small Cap Core Fund | $642 | $219 | |||||
Transfer Agency | Incurred | Owed | |||||
Rockefeller Climate Solutions Fund | $ 64,629 | $292 | |||||
Rockefeller US Small Cap Core Fund | $23,315 | $ 6,458 | |||||
Custody | Incurred | Owed | |||||
Rockefeller Climate Solutions Fund | $ 9,722 | $ 5,832 | |||||
Rockefeller US Small Cap Core Fund | $4,294 | $1,215 | |||||
Chief Compliance Officer | Incurred | Owed | |||||
Rockefeller Climate Solutions Fund | $ 6,703 | $ 3,293 | |||||
Rockefeller US Small Cap Core Fund | $6,020 | $2,479 | |||||
Class A | Period Ended May 31, 2024 | Year Ended November 30, 2023 | |||||
Shares Sold | 1,977 | 1,025 | |||||
Shares Reinvested | 20 | — | |||||
Shares Redeemed | (754) | (109,844) | |||||
Net increase (decrease) | 1,243 | (108,819) | |||||
20 |
Institutional Class | Period Ended May 31, 2024 | Year Ended November 30, 2023 | |||||
Shares Sold | 231,436 | 1,443,347 | |||||
Shares Reinvested | 21,586 | 5,256 | |||||
Shares Redeemed | (293,720) | (2,617,709) | |||||
Net decrease | (40,698) | (1,169,106) | |||||
Class A | Period Ended May 31, 2024 | Period Ended November 30, 2023 | |||||
Shares Sold | 2,778 | 10,654 | |||||
Shares Reinvested | — | — | |||||
Shares Redeemed | — | — | |||||
Net increase | 2,778 | 10,654 | |||||
Class I | Period Ended May 31, 2024 | Period Ended November 30, 2023 | |||||
Shares Sold | 1,881,552 | 6,591,654 | |||||
Shares Reinvested | — | — | |||||
Shares Redeemed | — | (158,190) | |||||
Net increase | 1,616,556 | 6,433,464 | |||||
Purchases | Sales | U.S. Government Securities Purchases | U.S. Government Securities Sales | ||||||||||
Rockefeller Climate Solutions Fund | $9,848,474 | $ 10,675,401 | $ — | $ — | |||||||||
Rockefeller US Small Cap Core Fund | $32,896,360 | $18,260,835 | $— | $— | |||||||||
| (10) | Recent Market Events |
21 |
| (11) | Subsequent Events |
22 |
Rockefeller Climate Solutions Fund | 100.00% | |||
Rockefeller US Small Cap Core Fund | 0.00% | |||
Rockefeller Climate Solutions Fund | 100.00% | |||
Rockefeller US Small Cap Core Fund | 0.00% | |||
Rockefeller Climate Solutions Fund | 0.00% | |||
Rockefeller US Small Cap Core Fund | 0.00% | |||
23 |
| (b) | Financial Highlights are included within the financial statements filed under Item 7(a) of this Form. |
Item 8. Changes in and Disagreements with Accountants for Open-End Investment Companies.
There were no changes in or disagreements with accountants during the period covered by this report.
Item 9. Proxy Disclosure for Open-End Investment Companies.
There were no matters submitted to a vote of shareholders during the period covered by this report.
Item 10. Remuneration Paid to Directors, Officers, and Others of Open-End Investment Companies.
This information is included within the financial statements filed under Item 7(a) of this Form.
Item 11. Statement Regarding Basis for Approval of Investment Advisory Contract.
Not applicable.
Item 12. Disclosure of Proxy Voting Policies and Procedures for Closed-End Management Investment Companies.
Not applicable to open-end investment companies.
Item 13. Portfolio Managers of Closed-End Management Investment Companies.
Not applicable to open-end investment companies.
Item 14. Purchases of Equity Securities by Closed-End Management Investment Company and Affiliated Purchasers.
Not applicable to open-end investment companies.
Item 15. Submission of Matters to a Vote of Security Holders.
There have been no material changes to the procedures by which shareholders may recommend nominees to the registrant’s board of trustees.
Item 16. Controls and Procedures.
| (a) | The Registrant’s Principal Executive Officer and Principal Financial Officer have reviewed the Registrant’s disclosure controls and procedures (as defined in Rule 30a-3(c) under the Investment Company Act of 1940 (the “Act”)) as of a date within 90 days of the filing of this report, as required by Rule 30a-3(b) under the Act and Rules 13a-15(b) or 15d-15(b) under the Securities Exchange Act of 1934. Based on their review, such officers have concluded that the disclosure controls and procedures are effective in ensuring that information required to be disclosed in this report is appropriately recorded, processed, summarized and reported and made known to them by others within the Registrant and by the Registrant’s service provider. |
| (b) | There were no changes in the Registrant’s internal control over financial reporting (as defined in Rule 30a-3(d) under the Act) that occurred during the period covered by this report that have materially affected, or are reasonably likely to materially affect, the Registrant’s internal control over financial reporting. |
Item 17. Disclosure of Securities Lending Activities for Closed-End Management Investment Companies
Not applicable to open-end investment companies.
Item 18. Recovery of Erroneously Awarded Compensation.
Not applicable.
Item 19. Exhibits.
| (a) | (1) Any code of ethics or amendment thereto, that is the subject of the disclosure required by Item 2, to the extent that the registrant intends to satisfy Item 2 requirements through filing an exhibit. Incorporated by reference to the Registrant’s Form N-CSR filed on February 6, 2019. |
| (b) | Certifications pursuant to Section 906 of the Sarbanes-Oxley Act of 2002.Furnished herewith. |
SIGNATURES
Pursuant to the requirements of the Securities Exchange Act of 1934 and the Investment Company Act of 1940, the registrant has duly caused this report to be signed on its behalf by the undersigned, thereunto duly authorized.
| (Registrant) | Trust for Professional Managers |
| By (Signature and Title) | /s/ John Buckel | ||
| John Buckel, President |
| Date | 8/1/2024 |
Pursuant to the requirements of the Securities Exchange Act of 1934 and the Investment Company Act of 1940, this report has been signed below by the following persons on behalf of the registrant and in the capacities and on the dates indicated.
| By (Signature and Title)* | /s/ John Buckel | ||
| John Buckel, President |
| Date | 8/1/2024 |
| By (Signature and Title)* | /s/ Jennifer Lima | ||
| Jennifer Lima, Treasurer |
| Date | 8/1/2024 |
* Print the name and title of each signing officer under his or her signature.