Performance Trust Total Return Bond Fund
Performance Trust Municipal Bond Fund
Performance Trust Multisector Bond Fund
Performance Trust Short Term Bond ETF
Core Financial Statements
August 31, 2024
UNITED STATES
SECURITIES AND EXCHANGE COMMISSION
Washington, D.C. 20549
FORM N-CSR
CERTIFIED SHAREHOLDER REPORT OF REGISTERED
MANAGEMENT INVESTMENT COMPANIES
Investment Company Act file number 811-10401
Trust for Professional Managers
(Exact name of registrant as specified in charter)
615 East Michigan Street
Milwaukee, WI 53202
(Address of principal executive offices) (Zip code)
Jay S. Fitton
U.S. Bancorp Fund Services, LLC
615 East Michigan Street
Milwaukee, WI 53202
(Name and address of agent for service)
(513) 520-5925
Registrant's telephone number, including area code
Date of fiscal year end: August 31, 2024
Date of reporting period: August 31, 2024
Item 1. Reports to Stockholders.
| (a) |
 | Performance Trust Total Return Bond Fund |  |
| Institutional Class | PTIAX | ||
| Annual Shareholder Report | August 31, 2024 |
Class Name | Costs of a $10,000 investment | Costs paid as a percentage of a $10,000 investment |
| Institutional Class | $80 | 0.76% |
Top Contributors | |
| ↑ | Collateralized Loan Obligations (CLOs), CMBS, Investment-Grade Corporates, High-Yield Corporates, Non-Agency RMBS, Taxable Municipals, Tax-Exempt Municipals |
Top Detractors | |
| ↓ | Long U.S. Treasuries, Short U.S. Treasuries, ABS |
| Performance Trust Total Return Bond Fund | PAGE 1 | TSR-AR-89833W394 |
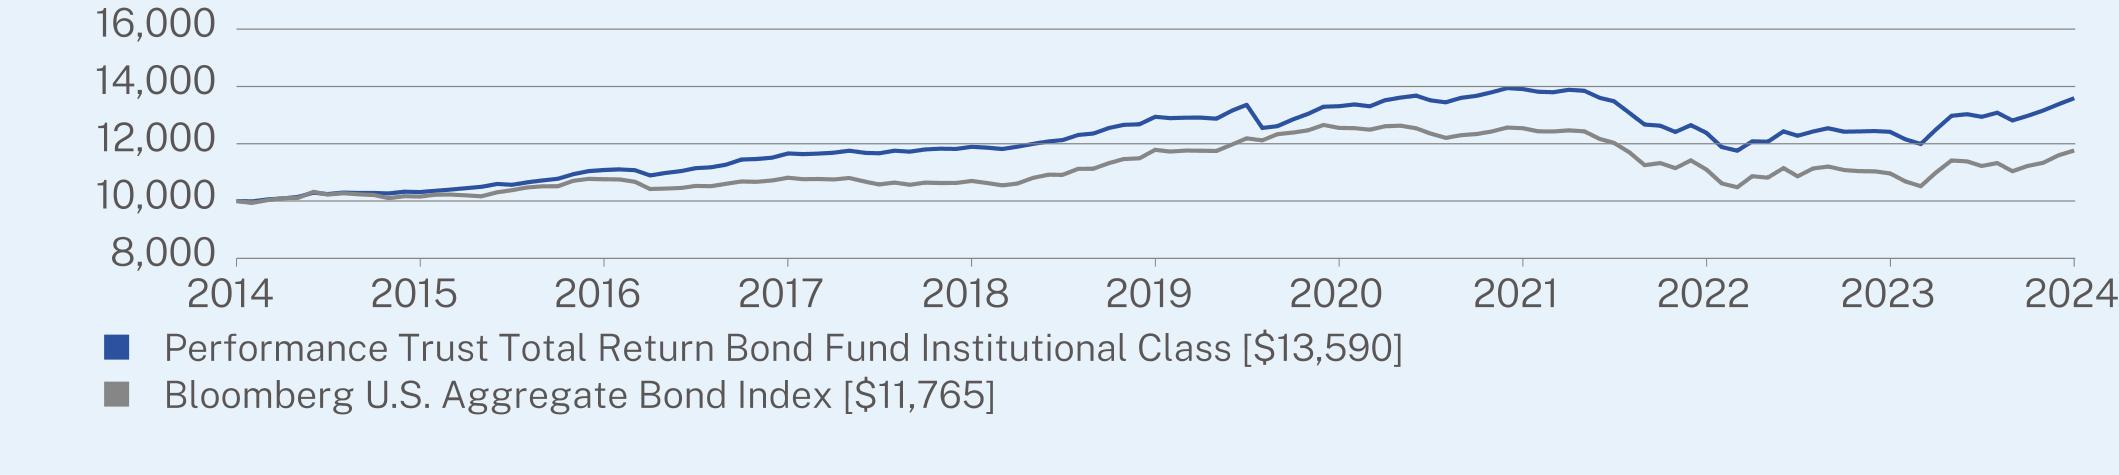
1 Year | 5 Year | 10 Year | |
Institutional Class (without sales charge) | 9.45 | 0.99 | 3.12 |
Bloomberg U.S. Aggregate Bond Index | 7.30 | -0.04 | 1.64 |
| * | The Fund’s past performance is not a good predictor of how the Fund will perform in the future. The graph and table do not reflect the deduction of taxes that a shareholder would pay on Fund distributions or redemption of Fund shares. |
Net Assets | $8,052,332,259 |
Number of Holdings | 1,566 |
Net Advisory Fee | $39,787,564 |
Portfolio Turnover | 34% |
Average Credit Quality | AA- |
Effective Duration | 6.65 years |
30-Day SEC Yield | 5.94% |
30-Day SEC Yield Unsubsidized | 5.91% |
Weighted Average Life | 12.04 years |
Distribution Yield | 4.30% |
| Performance Trust Total Return Bond Fund | PAGE 2 | TSR-AR-89833W394 |
Top 10 Issuers | |
United States Treasury Notes/Bonds | 11.1% |
Freddie Mac Multifamily Structured Pass Through Certificates | 4.2% |
Santander Drive Auto Receivables Trust | 2.7% |
United States Treasury Strip Principal | 2.6% |
Westlake Automobile Receivables Trust | 2.3% |
United States Treasury Bill | 2.2% |
Wells Fargo Commercial Mortgage Trust | 2.1% |
Benchmark Mortgage Trust | 2.0% |
Bank Securitization Trust | 2.0% |
GLS Auto Receivables Trust | 1.9% |
Top Sectors | |
Mortgage Securities | 24.2% |
US Municipal | 22.0% |
Asset Backed Securities | 19.3% |
Government | 13.7% |
| Financials* | 6.2% |
| Consumer Discretionary* | 4.2% |
| Health Care* | 2.2% |
| Industrials* | 1.2% |
| Technology* | 0.8% |
Cash & Other | 6.2% |
Credit Breakdown** | |
AAA | 39.7% |
AA | 24.4% |
A | 13.9% |
BBB | 10.4% |
BB | 5.4% |
B | 0.7% |
CCC | 1.1% |
CC | 0.0% |
C | 0.6% |
D | 0.1% |
Not Rated | 3.7% |
| * | The Global Industry Classification Standard (“GICS®”) was developed by and/or is the exclusive property of MSCI, Inc. (“MSCI”) and Standard & Poor’s Financial Services LLC (“S&P”). GICS® is a service mark of MSCI and S&P and has been licensed for use by U.S. Bank Global Fund Services. |
| ** | Credit rating agencies Fitch Ratings, Moody’s Investor Service, and Standards & Poor’s Corporation (S&P) rate the credit quality of debt issues. For reporting purposes, PT Asset Management, LLC (“PTAM”), the Fund’s investment adviser, generally assigns a composite rating based on stated ratings from Nationally Recognized Statistical Ratings Organizations (‘’NRSROs’’). For example, if Fitch, Moody’s, and S&P all provide ratings, PTAM assigns the median rating. In certain instances, such as US Treasury and Agency securities, PTAM will assign an internal PTAM rating. The internal PTAM rating can only be as high as the highest stated credit rating from an NRSRO. |
| Performance Trust Total Return Bond Fund | PAGE 3 | TSR-AR-89833W394 |
 | Performance Trust Total Return Bond Fund |  |
| Class A | PTAOX | ||
| Annual Shareholder Report | August 31, 2024 |
Class Name | Costs of a $10,000 investment | Costs paid as a percentage of a $10,000 investment |
| Class A | $106 | 1.01% |
Top Contributors | |
| ↑ | Collateralized Loan Obligations (CLOs), CMBS, Investment-Grade Corporates, High-Yield Corporates, Non-Agency RMBS, Taxable Municipals, Tax-Exempt Municipals |
Top Detractors | |
| ↓ | Long U.S. Treasuries, Short U.S. Treasuries, ABS |
| Performance Trust Total Return Bond Fund | PAGE 1 | TSR-AR-89833W121 |
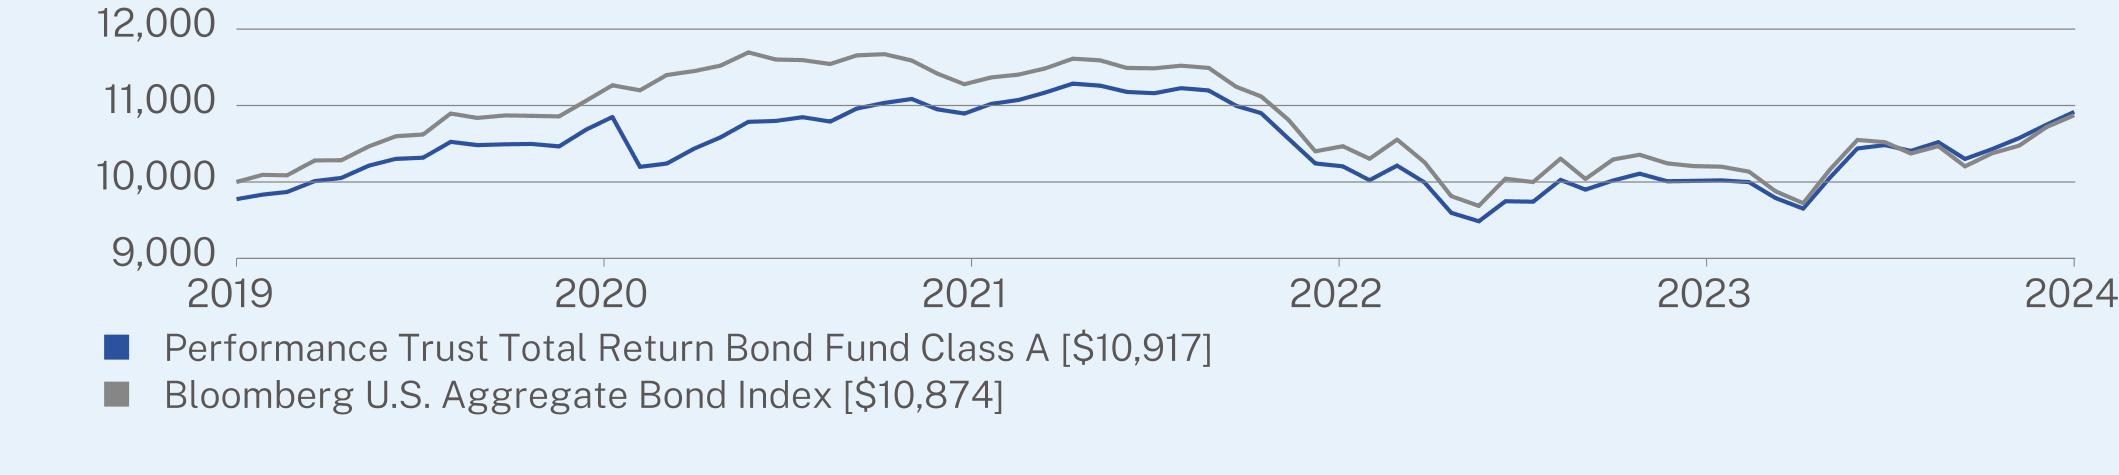
1 Year | 5 Year | Since Inception (01/02/2019) | |
Class A (without sales charge) | 9.19 | 0.73 | 1.97 |
Class A (with sales charge) | 6.74 | 0.28 | 1.56 |
Bloomberg U.S. Aggregate Bond Index | 7.30 | -0.04 | 1.49 |
| * | The Fund’s past performance is not a good predictor of how the Fund will perform in the future. The graph and table do not reflect the deduction of taxes that a shareholder would pay on Fund distributions or redemption of Fund shares. |
Net Assets | $8,052,332,259 |
Number of Holdings | 1,566 |
Net Advisory Fee | $39,787,564 |
Portfolio Turnover | 34% |
Average Credit Quality | AA- |
Effective Duration | 6.65 years |
30-Day SEC Yield | 5.56% |
30-Day SEC Yield Unsubsidized | 5.53% |
Weighted Average Life | 12.04 years |
Distribution Yield | 4.06% |
| Performance Trust Total Return Bond Fund | PAGE 2 | TSR-AR-89833W121 |
Top 10 Issuers | |
United States Treasury Notes/Bonds | 11.1% |
Freddie Mac Multifamily Structured Pass Through Certificates | 4.2% |
Santander Drive Auto Receivables Trust | 2.7% |
United States Treasury Strip Principal | 2.6% |
Westlake Automobile Receivables Trust | 2.3% |
United States Treasury Bill | 2.2% |
Wells Fargo Commercial Mortgage Trust | 2.1% |
Benchmark Mortgage Trust | 2.0% |
Bank Securitization Trust | 2.0% |
GLS Auto Receivables Trust | 1.9% |
Top Sectors | |
Mortgage Securities | 24.2% |
US Municipal | 22.0% |
Asset Backed Securities | 19.3% |
Government | 13.7% |
| Financials* | 6.2% |
| Consumer Discretionary* | 4.2% |
| Health Care* | 2.2% |
| Industrials* | 1.2% |
| Technology* | 0.8% |
Cash & Other | 6.2% |
Credit Breakdown** | |
AAA | 39.7% |
AA | 24.4% |
A | 13.9% |
BBB | 10.4% |
BB | 5.4% |
B | 0.7% |
CCC | 1.1% |
CC | 0.0% |
C | 0.6% |
D | 0.1% |
Not Rated | 3.7% |
| * | The Global Industry Classification Standard (“GICS®”) was developed by and/or is the exclusive property of MSCI, Inc. (“MSCI”) and Standard & Poor’s Financial Services LLC (“S&P”). GICS® is a service mark of MSCI and S&P and has been licensed for use by U.S. Bank Global Fund Services. |
| ** | Credit rating agencies Fitch Ratings, Moody’s Investor Service, and Standards & Poor’s Corporation (S&P) rate the credit quality of debt issues. For reporting purposes, PT Asset Management, LLC (“PTAM”), the Fund’s investment adviser, generally assigns a composite rating based on stated ratings from Nationally Recognized Statistical Ratings Organizations (‘’NRSROs’’). For example, if Fitch, Moody’s, and S&P all provide ratings, PTAM assigns the median rating. In certain instances, such as US Treasury and Agency securities, PTAM will assign an internal PTAM rating. The internal PTAM rating can only be as high as the highest stated credit rating from an NRSRO. |
| Performance Trust Total Return Bond Fund | PAGE 3 | TSR-AR-89833W121 |
 | Performance Trust Total Return Bond Fund |  |
| Class C | PTCOX | ||
| Annual Shareholder Report | August 31, 2024 |
Class Name | Costs of a $10,000 investment | Costs paid as a percentage of a $10,000 investment |
| Class C | $183 | 1.76% |
Top Contributors | |
| ↑ | Collateralized Loan Obligations (CLOs), CMBS, Investment-Grade Corporates, High-Yield Corporates, Non-Agency RMBS, Taxable Municipals, Tax-Exempt Municipals |
Top Detractors | |
| ↓ | Long U.S. Treasuries, Short U.S. Treasuries, ABS |
| Performance Trust Total Return Bond Fund | PAGE 1 | TSR-AR-89833W113 |
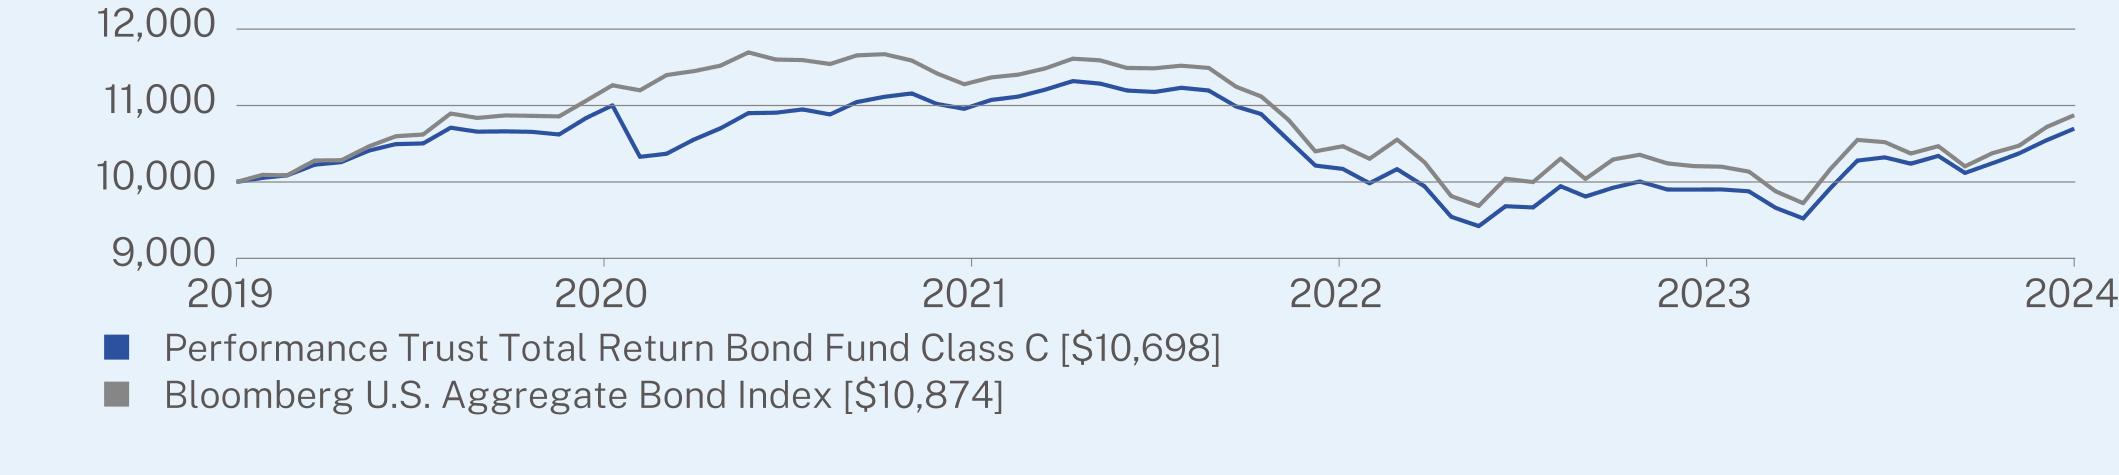
1 Year | 5 Year | Since Inception (01/02/2019) | |
Class C (without sales charge) | 8.31 | -0.02 | 1.20 |
Bloomberg U.S. Aggregate Bond Index | 7.30 | -0.04 | 1.49 |
| * | The Fund’s past performance is not a good predictor of how the Fund will perform in the future. The graph and table do not reflect the deduction of taxes that a shareholder would pay on Fund distributions or redemption of Fund shares. |
Net Assets | $8,052,332,259 |
Number of Holdings | 1,566 |
Net Advisory Fee | $39,787,564 |
Portfolio Turnover | 34% |
Average Credit Quality | AA- |
Effective Duration | 6.65 years |
30-Day SEC Yield | 4.94% |
30-Day SEC Yield Unsubsidized | 4.91% |
Weighted Average Life | 12.04 years |
Distribution Yield | 3.37% |
| Performance Trust Total Return Bond Fund | PAGE 2 | TSR-AR-89833W113 |
Top 10 Issuers | |
United States Treasury Notes/Bonds | 11.1% |
Freddie Mac Multifamily Structured Pass Through Certificates | 4.2% |
Santander Drive Auto Receivables Trust | 2.7% |
United States Treasury Strip Principal | 2.6% |
Westlake Automobile Receivables Trust | 2.3% |
United States Treasury Bill | 2.2% |
Wells Fargo Commercial Mortgage Trust | 2.1% |
Benchmark Mortgage Trust | 2.0% |
Bank Securitization Trust | 2.0% |
GLS Auto Receivables Trust | 1.9% |
Top Sectors | |
Mortgage Securities | 24.2% |
US Municipal | 22.0% |
Asset Backed Securities | 19.3% |
Government | 13.7% |
| Financials* | 6.2% |
| Consumer Discretionary* | 4.2% |
| Health Care* | 2.2% |
| Industrials* | 1.2% |
| Technology* | 0.8% |
Cash & Other | 6.2% |
Credit Breakdown** | |
AAA | 39.7% |
AA | 24.4% |
A | 13.9% |
BBB | 10.4% |
BB | 5.4% |
B | 0.7% |
CCC | 1.1% |
CC | 0.0% |
C | 0.6% |
D | 0.1% |
Not Rated | 3.7% |
| * | The Global Industry Classification Standard (“GICS®”) was developed by and/or is the exclusive property of MSCI, Inc. (“MSCI”) and Standard & Poor’s Financial Services LLC (“S&P”). GICS® is a service mark of MSCI and S&P and has been licensed for use by U.S. Bank Global Fund Services. |
| ** | Credit rating agencies Fitch Ratings, Moody’s Investor Service, and Standards & Poor’s Corporation (S&P) rate the credit quality of debt issues. For reporting purposes, PT Asset Management, LLC (“PTAM”), the Fund’s investment adviser, generally assigns a composite rating based on stated ratings from Nationally Recognized Statistical Ratings Organizations (‘’NRSROs’’). For example, if Fitch, Moody’s, and S&P all provide ratings, PTAM assigns the median rating. In certain instances, such as US Treasury and Agency securities, PTAM will assign an internal PTAM rating. The internal PTAM rating can only be as high as the highest stated credit rating from an NRSRO. |
| Performance Trust Total Return Bond Fund | PAGE 3 | TSR-AR-89833W113 |
 | Performance Trust Municipal Bond Fund |  |
| Institutional Class | PTIMX | ||
| Annual Shareholder Report | August 31, 2024 |
Class Name | Costs of a $10,000 investment | Costs paid as a percentage of a $10,000 investment |
| Institutional Class | $52 | 0.50% |
Top Contributors | |
| ↑ | Yield Curve Positioning, Bond Structure (Coupon and Call Protection), Longer Maturities |
| Performance Trust Municipal Bond Fund | PAGE 1 | TSR-AR-89833W170 |
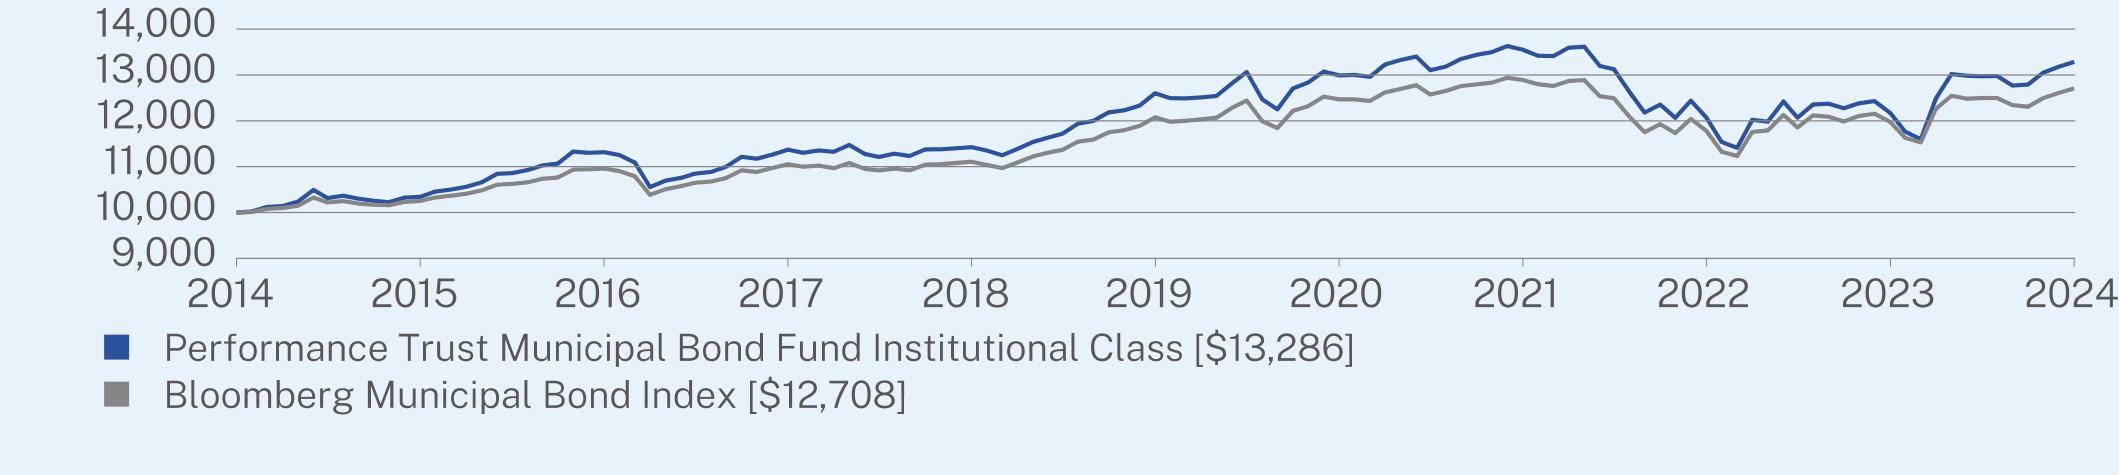
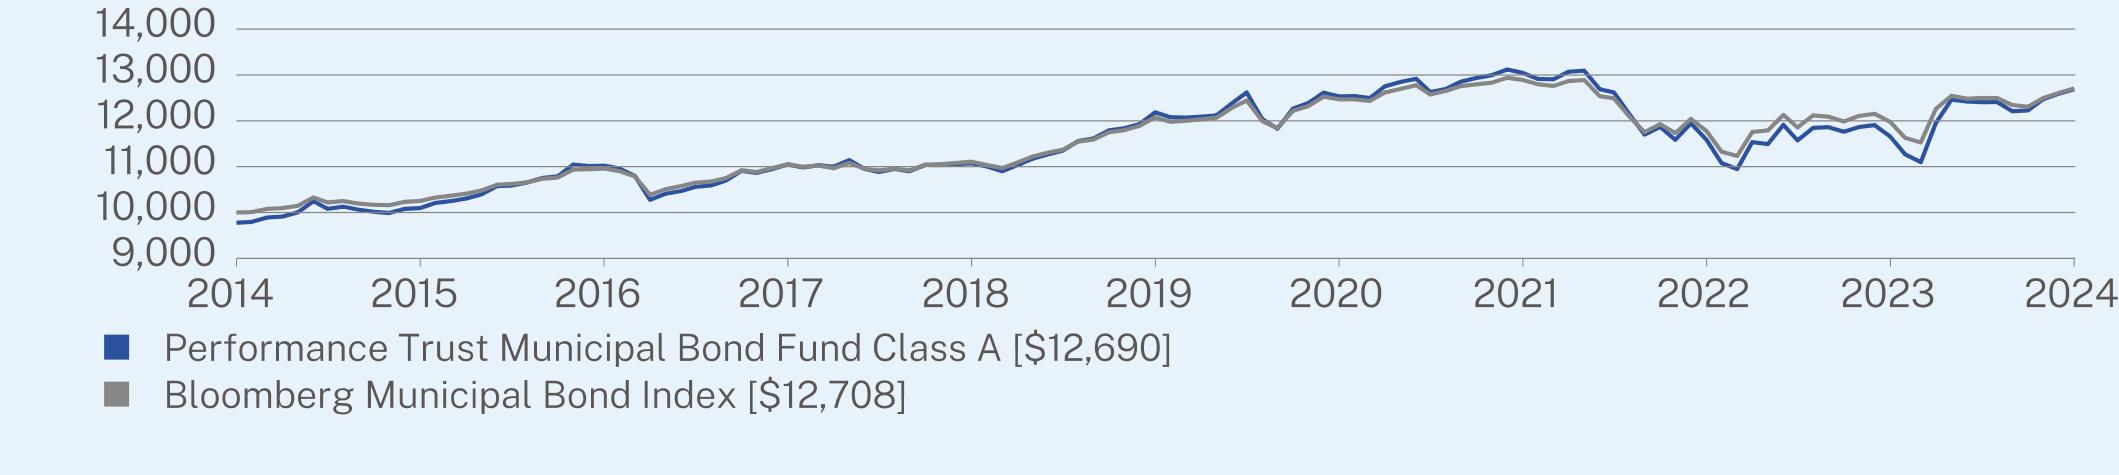
1 Year | 5 Year | 10 Year | |
Institutional Class (without sales charge) | 9.14 | 1.06 | 2.88 |
Bloomberg Municipal Bond Index | 6.09 | 1.02 | 2.43 |
| * | The Fund’s past performance is not a good predictor of how the Fund will perform in the future. The graph and table do not reflect the deduction of taxes that a shareholder would pay on Fund distributions or redemption of Fund shares. |
Net Assets | $726,757,400 |
Number of Holdings | 262 |
Net Advisory Fee | $2,681,761 |
Portfolio Turnover | 60% |
Average Credit Quality | AA |
Effective Duration | 9.83 years |
30-Day SEC Yield | 3.90% |
30-Day SEC Yield Unsubsidized | 3.90% |
Weighted Average Life | 9.83 years |
Distribution Yield | 3.74% |
| Performance Trust Municipal Bond Fund | PAGE 2 | TSR-AR-89833W170 |
Top 10 Issuers | |
Freddie Mac Multifamily ML Certificates | 5.0% |
First American Government Obligations Fund | 4.2% |
San Diego Unified School District | 2.1% |
Poway Unified School District | 2.1% |
Greater Clark Building Corp. | 2.1% |
City & County of Denver, CO Airport System Revenue | 2.0% |
University of North Carolina at Chapel Hill | 1.9% |
State of Texas | 1.8% |
Central Puget Sound Regional Transit Authority | 1.6% |
Minneapolis-St Paul Metropolitan Airports Commission | 1.5% |
Top Sectors | |
US Municipal | 91.3% |
Mortgage Securities | 7.0% |
| Financials* | 0.4% |
Cash & Other | 1.3% |
Credit Breakdown** | |
AAA | 16.2% |
AA | 55.6% |
A | 18.8% |
BBB | 4.6% |
BB | 0.5% |
B | 0.0% |
CCC | 0.0% |
CC | 0.0% |
C | 0.0% |
D | 0.0% |
Not Rated | 4.3% |
| * | The Global Industry Classification Standard (“GICS®”) was developed by and/or is the exclusive property of MSCI, Inc. (“MSCI”) and Standard & Poor’s Financial Services LLC (“S&P”). GICS® is a service mark of MSCI and S&P and has been licensed for use by U.S. Bank Global Fund Services. |
| ** | Credit rating agencies Fitch Ratings, Moody’s Investor Service, and Standards & Poor’s Corporation (S&P) rate the credit quality of debt issues. For reporting purposes, PT Asset Management, LLC (“PTAM”), the Fund’s investment adviser, generally assigns a composite rating based on stated ratings from Nationally Recognized Statistical Ratings Organizations (‘’NRSROs’’). For example, if Fitch, Moody’s, and S&P all provide ratings, PTAM assigns the median rating. In certain instances, such as US Treasury and Agency securities, PTAM will assign an internal PTAM rating. The internal PTAM rating can only be as high as the highest stated credit rating from an NRSRO. |
| Performance Trust Municipal Bond Fund | PAGE 3 | TSR-AR-89833W170 |
 | Performance Trust Municipal Bond Fund |  |
| Class A | PTRMX | ||
| Annual Shareholder Report | August 31, 2024 |
Class Name | Costs of a $10,000 investment | Costs paid as a percentage of a $10,000 investment |
| Class A | $77 | 0.74% |
Top Contributors | |
| ↑ | Yield Curve Positioning, Bond Structure (Coupon and Call Protection), Longer Maturities |
| Performance Trust Municipal Bond Fund | PAGE 1 | TSR-AR-89833W162 |
1 Year | 5 Year | 10 Year | |
Class A (without sales charge) | 8.84 | 0.81 | 2.64 |
Class A (with sales charge) | 6.38 | 0.35 | 2.41 |
Bloomberg Municipal Bond Index | 6.09 | 1.02 | 2.43 |
| * | The Fund’s past performance is not a good predictor of how the Fund will perform in the future. The graph and table do not reflect the deduction of taxes that a shareholder would pay on Fund distributions or redemption of Fund shares. |
Net Assets | $726,757,400 |
Number of Holdings | 262 |
Net Advisory Fee | $2,681,761 |
Portfolio Turnover | 60% |
Average Credit Quality | AA |
Effective Duration | 9.83 years |
30-Day SEC Yield | 3.57% |
30-Day SEC Yield Unsubsidized | 3.57% |
Weighted Average Life | 9.83 years |
Distribution Yield | 3.48% |
| Performance Trust Municipal Bond Fund | PAGE 2 | TSR-AR-89833W162 |
Top 10 Issuers | |
Freddie Mac Multifamily ML Certificates | 5.0% |
First American Government Obligations Fund | 4.2% |
San Diego Unified School District | 2.1% |
Poway Unified School District | 2.1% |
Greater Clark Building Corp. | 2.1% |
City & County of Denver, CO Airport System Revenue | 2.0% |
University of North Carolina at Chapel Hill | 1.9% |
State of Texas | 1.8% |
Central Puget Sound Regional Transit Authority | 1.6% |
Minneapolis-St Paul Metropolitan Airports Commission | 1.5% |
Top Sectors | |
US Municipal | 91.3% |
Mortgage Securities | 7.0% |
| Financials* | 0.4% |
Cash & Other | 1.3% |
Credit Breakdown** | |
AAA | 16.2% |
AA | 55.6% |
A | 18.8% |
BBB | 4.6% |
BB | 0.5% |
B | 0.0% |
CCC | 0.0% |
CC | 0.0% |
C | 0.0% |
D | 0.0% |
Not Rated | 4.3% |
| * | The Global Industry Classification Standard (“GICS®”) was developed by and/or is the exclusive property of MSCI, Inc. (“MSCI”) and Standard & Poor’s Financial Services LLC (“S&P”). GICS® is a service mark of MSCI and S&P and has been licensed for use by U.S. Bank Global Fund Services. |
| ** | Credit rating agencies Fitch Ratings, Moody’s Investor Service, and Standards & Poor’s Corporation (S&P) rate the credit quality of debt issues. For reporting purposes, PT Asset Management, LLC (“PTAM”), the Fund’s investment adviser, generally assigns a composite rating based on stated ratings from Nationally Recognized Statistical Ratings Organizations (‘’NRSROs’’). For example, if Fitch, Moody’s, and S&P all provide ratings, PTAM assigns the median rating. In certain instances, such as US Treasury and Agency securities, PTAM will assign an internal PTAM rating. The internal PTAM rating can only be as high as the highest stated credit rating from an NRSRO. |
| Performance Trust Municipal Bond Fund | PAGE 3 | TSR-AR-89833W162 |
 | Performance Trust Multisector Bond Fund |  |
| Institutional Class | PTCRX | ||
| Annual Shareholder Report | August 31, 2024 |
Class Name | Costs of a $10,000 investment | Costs paid as a percentage of a $10,000 investment |
| Institutional Class | $108 | 1.01% |
Top Contributors | |
| ↑ | Collateralized Loan Obligations (CLOs), CMBS, Investment-Grade Corporates, High-Yield Corporates, Non-Agency RMBS, Taxable Municipals, Tax-Exempt Municipals |
Top Detractors | |
| ↓ | Long U.S. Treasuries, ABS |
| Performance Trust Multisector Bond Fund | PAGE 1 | TSR-AR-89834E195 |
1 Year | Since Inception (12/31/2020) | |
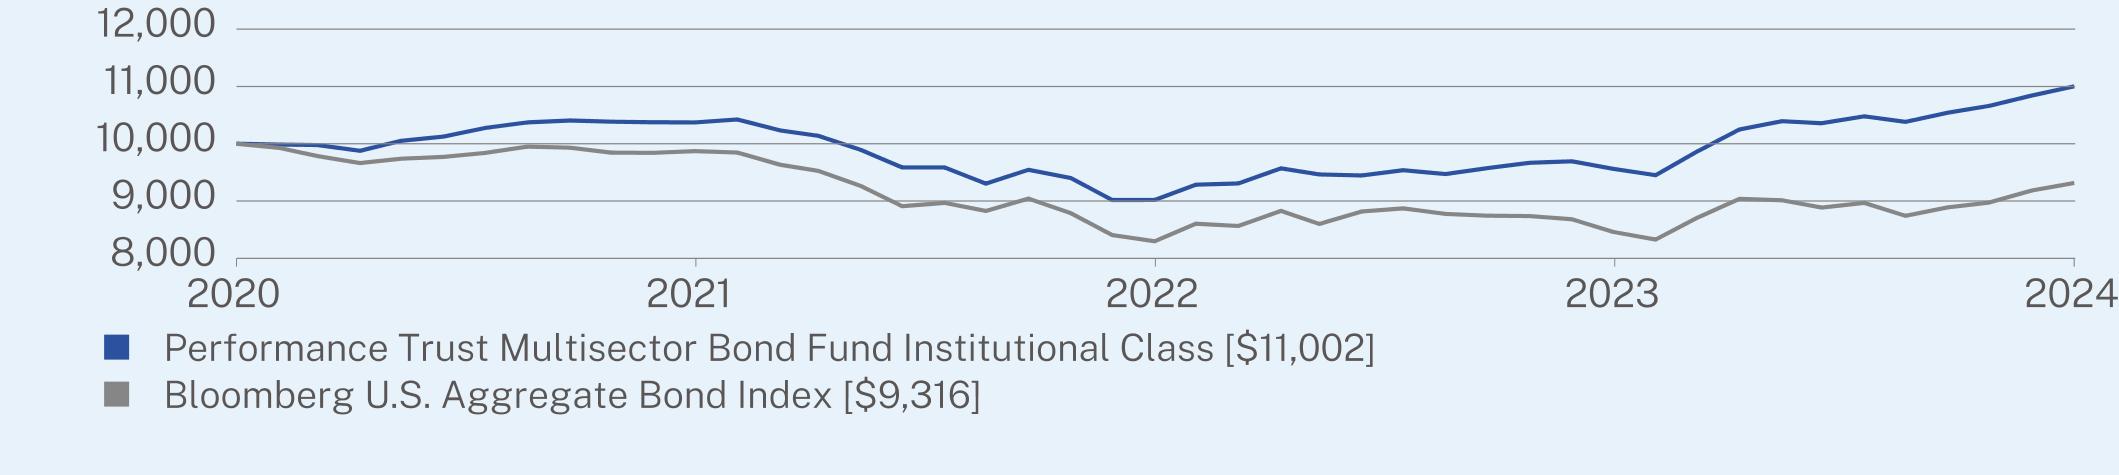
Institutional Class (without sales charge) | 13.49 | 2.64 |
Bloomberg U.S. Aggregate Bond Index | 7.30 | -1.92 |
| * | The Fund’s past performance is not a good predictor of how the Fund will perform in the future. The graph and table do not reflect the deduction of taxes that a shareholder would pay on Fund distributions or redemption of Fund shares. |
Net Assets | $136,140,870 |
Number of Holdings | 122 |
Net Advisory Fee | $811,320 |
Portfolio Turnover | 40% |
Average Credit Quality | BBB |
Effective Duration | 4.12 years |
30-Day SEC Yield | 5.63% |
30-Day SEC Yield Unsubsidized | 5.59% |
Weighted Average Life | 8.09 years |
Distribution Yield | 5.79% |
| Performance Trust Multisector Bond Fund | PAGE 2 | TSR-AR-89834E195 |
Top 10 Issuers | |
United States Treasury Notes/Bonds | 6.4% |
First American Government Obligations Fund | 4.6% |
Benchmark Mortgage Trust | 3.3% |
Wells Fargo Commercial Mortgage Trust | 3.1% |
Bank Securitization Trust | 3.0% |
Morgan Stanley Capital I Trust | 2.5% |
Apidos CLO | 2.4% |
GLS Auto Receivables Trust | 2.3% |
ARES CLO | 2.2% |
Blackstone, Inc. | 1.8% |
Top Sectors | |
Mortgage Securities | 26.9% |
Asset Backed Securities | 18.5% |
| Financials* | 15.4% |
| Consumer Discretionary* | 10.6% |
US Municipal | 6.9% |
Government | 6.4% |
| Industrials* | 3.4% |
| Communications* | 1.9% |
| Technology* | 1.7% |
Cash & Other | 8.3% |
Credit Breakdown** | |
AAA | 15.5% |
AA | 4.5% |
A | 14.6% |
BBB | 26.8% |
BB | 24.9% |
B | 5.3% |
CCC | 1.1% |
CC | 0.0% |
C | 0.0% |
D | 0.8% |
Not Rated | 6.5% |
| * | The Global Industry Classification Standard (“GICS®”) was developed by and/or is the exclusive property of MSCI, Inc. (“MSCI”) and Standard & Poor’s Financial Services LLC (“S&P”). GICS® is a service mark of MSCI and S&P and has been licensed for use by U.S. Bank Global Fund Services. |
| ** | Credit rating agencies Fitch Ratings, Moody’s Investor Service, and Standards & Poor’s Corporation (S&P) rate the credit quality of debt issues. For reporting purposes, PT Asset Management, LLC (“PTAM”), the Fund’s investment adviser, generally assigns a composite rating based on stated ratings from Nationally Recognized Statistical Ratings Organizations (‘’NRSROs’’). For example, if Fitch, Moody’s, and S&P all provide ratings, PTAM assigns the median rating. In certain instances, such as US Treasury and Agency securities, PTAM will assign an internal PTAM rating. The internal PTAM rating can only be as high as the highest stated credit rating from an NRSRO. |
| Performance Trust Multisector Bond Fund | PAGE 3 | TSR-AR-89834E195 |
 | Performance Trust Short Term Bond ETF |  |
| STBF (Principal U.S. Listing Exchange: CBOE) | ||
| Annual Shareholder Report | August 31, 2024 |
Fund Name | Costs of a $10,000 investment | Costs paid as a percentage of a $10,000 investment |
| Performance Trust Short Term Bond ETF* | $66 | 0.65% |
| * | Amount shown reflects the expenses of the Fund from inception date through August 31, 2024. Expenses would be higher if the Fund had been in operations for the full year. |
Top Contributors | |
| ↑ | Long U.S. Treasuries, CMBS, High-Yield Corporates, Non-Agency RMBS, and Taxable Municipals |
Top Detractors | |
| ↓ | Cash, Short U.S. Treasuries, CLOs, and Investment-Grade Corporates |
| Performance Trust Short Term Bond ETF | PAGE 1 | TSR-AR-89834G570 |
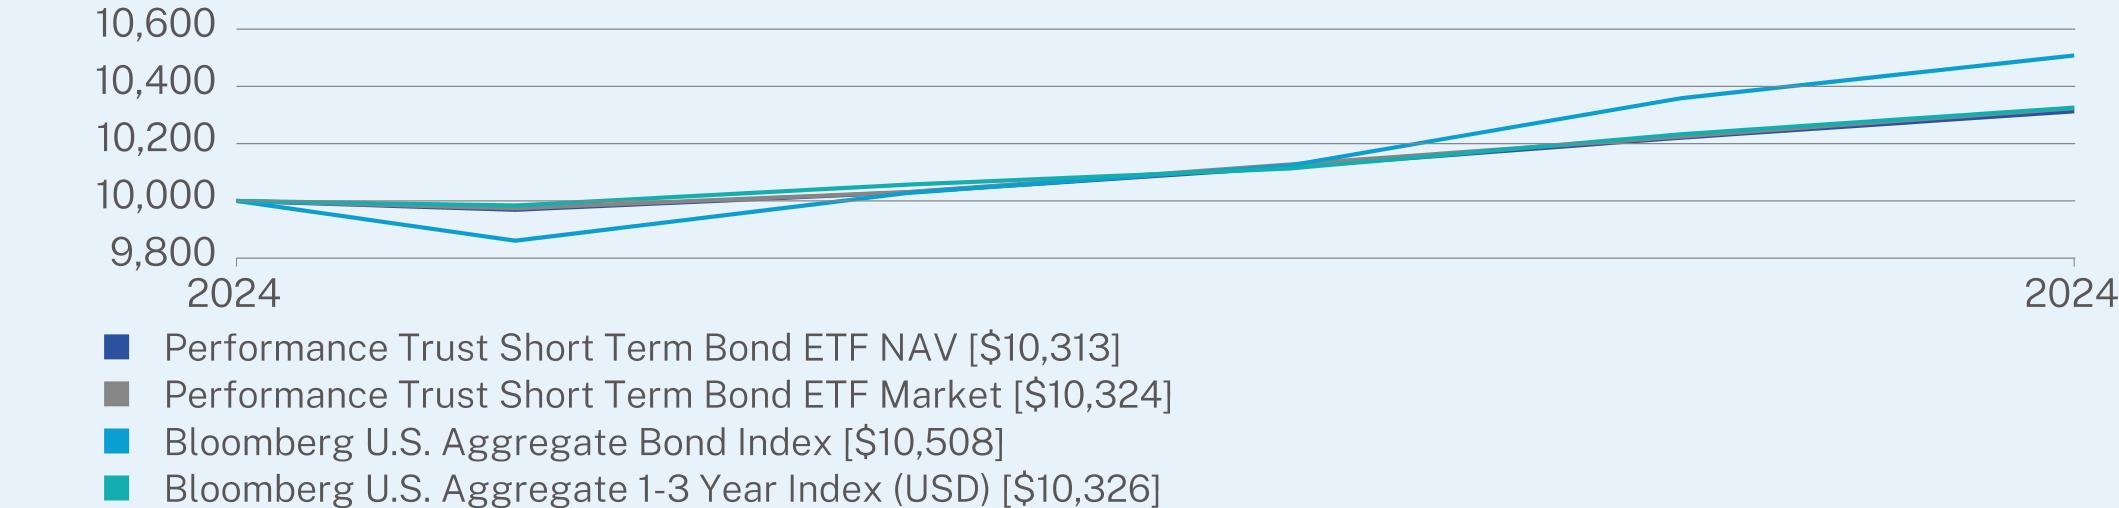
Since Inception (04/08/2024) | |
Performance Trust Short Term Bond ETF NAV | 3.13 |
Performance Trust Short Term Bond ETF Market | 3.24 |
Bloomberg U.S. Aggregate Bond Index | 5.08 |
Bloomberg U.S. Aggregate 1-3 Year Index (USD) | 3.26 |
| * | The Fund’s past performance is not a good predictor of how the Fund will perform in the future. The graph and table do not reflect the deduction of taxes that a shareholder would pay on Fund distributions or redemption of Fund shares. |
Net Assets | $12,664,873 |
Number of Holdings | 54 |
Net Advisory Fee | $27,127 |
Portfolio Turnover | 13% |
Average Credit Quality | AA- |
Effective Duration | 2.00 years |
30-Day SEC Yield | 7.95% |
30-Day SEC Yield Unsubsidized | 7.95% |
Weighted Average Life | 3.87 years |
| Performance Trust Short Term Bond ETF | PAGE 2 | TSR-AR-89834G570 |
Top 10 Issuers | |
United States Treasury Bill | 9.8% |
Bank5 Securitization Trust | 8.8% |
Freddie Mac Multifamily Structured Pass Through Certificates | 7.3% |
United States Treasury Notes/Bonds | 5.8% |
Westlake Automobile Receivables Trust | 5.2% |
Computershare Corporate Trust | 5.2% |
Santander Drive Auto Receivables Trust | 4.9% |
GLS Auto Receivables Trust | 4.0% |
ARES CLO | 3.9% |
First American Government Obligations Fund | 2.9% |
Top Sectors | |
Asset Backed Securities | 45.6% |
Mortgage Securities | 28.0% |
| Financials* | 6.3% |
Government | 5.8% |
US Municipal | 1.9% |
| Communications* | 1.4% |
Cash & Other | 11.0% |
Credit Breakdown** | |
AAA | 44.0% |
AA | 18.4% |
A | 14.4% |
BBB | 15.0% |
BB | 6.0% |
B | 0.0% |
CCC | 0.0% |
CC | 0.0% |
C | 0.0% |
D | 0.0% |
Not Rated | 2.2% |
| * | The Global Industry Classification Standard (“GICS®”) was developed by and/or is the exclusive property of MSCI, Inc. (“MSCI”) and Standard & Poor’s Financial Services LLC (“S&P”). GICS® is a service mark of MSCI and S&P and has been licensed for use by U.S. Bank Global Fund Services. |
| ** | Credit rating agencies Fitch Ratings, Moody’s Investor Service, and Standards & Poor’s Corporation (S&P) rate the credit quality of debt issues. For reporting purposes, PT Asset Management, LLC (“PTAM”), the Fund’s investment adviser, generally assigns a composite rating based on stated ratings from Nationally Recognized Statistical Ratings Organizations (‘’NRSROs’’). For example, if Fitch, Moody’s, and S&P all provide ratings, PTAM assigns the median rating. In certain instances, such as US Treasury and Agency securities, PTAM will assign an internal PTAM rating. The internal PTAM rating can only be as high as the highest stated credit rating from an NRSRO. |
| Performance Trust Short Term Bond ETF | PAGE 3 | TSR-AR-89834G570 |
| (b) | Not applicable. |
Item 2. Code of Ethics.
The registrant has adopted a code of ethics that applies to the registrant’s principal executive officer and principal financial officer. The registrant has not made any substantive amendments to its code of ethics during the period covered by this report. The registrant has not granted any waivers from any provisions of the code of ethics during the period covered by this report. A copy of the registrant’s Code of Ethics is incorporated by reference to the Registrant’s Form N-CSR filed on November 7, 2011.
Item 3. Audit Committee Financial Expert.
The registrant’s board of trustees has determined that there is at least one audit committee financial expert serving on its audit committee. Dr. Michael Akers and Lisa Zúñiga Ramírez are the “audit committee financial experts” and are considered to be “independent” as each term is defined in Item 3 of Form N-CSR.
Item 4. Principal Accountant Fees and Services.
The registrant has engaged its principal accountant to perform audit services, audit-related services, tax services and other services during the past two fiscal years. “Audit services” refer to performing an audit of the registrant's annual financial statements or services that are normally provided by the accountant in connection with statutory and regulatory filings or engagements for those fiscal years. “Audit-related services” refer to the assurance and related services by the principal accountant that are reasonably related to the performance of the audit. “Tax services” refer to professional services rendered by the principal accountant for tax compliance, tax advice, and tax planning. The following table details the aggregate fees billed or expected to be billed for each of the last two fiscal years for audit fees, audit-related fees, tax fees and other fees by the principal accountant.
| FYE 8/31/2024 | FYE 8/31/2023 | |
| (a) Audit Fees | $94,850 | $75,950 |
| (b) Audit-Related Fees | 0 | 0 |
| (c) Tax Fees | 12,000 | 9,000 |
| (d) All Other Fees | 0 | 0 |
(e)(1) The audit committee has adopted pre-approval policies and procedures that require the audit committee to pre-approve all audit and non-audit services of the registrant, including services provided to any entity affiliated with the registrant.
(e)(2) The percentage of fees billed by Cohen & Company Ltd. applicable to non-audit services pursuant to waiver of pre-approval requirement were as follows:
| FYE 8/31/2024 | FYE 8/31/2023 | |
| Audit-Related Fees | 0% | 0% |
| Tax Fees | 0% | 0% |
| All Other Fees | 0% | 0% |
(f) During the audit of the registrant’s financial statements all of the hours were attributed to work performed by persons other than full-time permanent employees of the principal accountant.
(g) The following table indicates the non-audit fees billed or expected to be billed by the registrant’s accountant for services to the registrant and to the registrant’s investment adviser (and any other controlling entity, etc.—not sub-adviser) for the last two years.
| Non-Audit Related Fees | FYE 8/31/2024 | FYE 8/31/2023 |
| Registrant | $0 | $0 |
| Registrant’s Investment Adviser | $0 | $0 |
(h) The audit committee of the board of trustees/directors has considered whether the provision of non-audit services that were rendered to the registrant’s investment adviser is compatible with maintaining the principal accountant’s independence and has concluded that the provision of such non-audit services by the accountant has not compromised the accountant’s independence.
(i) Not applicable
(j) Not applicable
Item 5. Audit Committee of Listed Registrants.
(a) The registrant is an issuer as defined in Rule 10A-3 under the Securities Exchange Act of 1934, (the “Act”) and has a separately-designated standing audit committee established in accordance with Section 3(a)(58)(A) of the Act. The committee consists of the independent members of the Board.
(b) Not applicable
Item 6. Investments
| (a) | Schedule of Investments is included as part of the report to shareholders filed under Item 7(a) of this Form. |
| (b) | Not Applicable. |
Item 7. Financial Statements and Financial Highlights for Open-End Investment Companies.
| (a) | ||
Page | |||
Schedule of Investments | |||
Statement of Changes in Net Assets | |||
Financial Highlights | |||
Par | Value | |||||
MUNICIPAL BONDS - 22.0% | ||||||
Alabama - 0.1% | ||||||
Baldwin County Public Building Authority, 2.00%, 03/01/2046 | $1,260,000 | $785,014 | ||||
Water Works Board of the City of Birmingham | ||||||
2.71%, 01/01/2038 | 6,835,000 | 5,529,466 | ||||
3.57%, 01/01/2045 | 385,000 | 320,284 | ||||
6,634,764 | ||||||
California - 5.3% | ||||||
Acton-Agua Dulce Unified School District, 0.00%, 05/01/2039(a) | 5,550,000 | 3,050,002 | ||||
Alameda County Joint Powers Authority, 7.05%, 12/01/2044 | 25,000,000 | 29,870,820 | ||||
Alvord Unified School District, 0.00%, 08/01/2046 | 2,105,000 | 2,483,669 | ||||
Bakersfield City School District, 0.00%, 05/01/2047 | 9,765,000 | 7,619,047 | ||||
Bay Area Toll Authority | ||||||
6.92%, 04/01/2040 | 7,105,000 | 8,322,255 | ||||
6.26%, 04/01/2049 | 12,010,000 | 13,648,972 | ||||
7.04%, 04/01/2050 | 3,455,000 | 4,303,033 | ||||
6.91%, 10/01/2050 | 6,850,000 | 8,492,360 | ||||
California Infrastructure & Economic Development Bank, 8.00%, 01/01/2050(b)(c) | 9,000,000 | 9,086,157 | ||||
Campbell Union School District, 0.00%, 08/01/2040(a) | 4,600,000 | 2,569,596 | ||||
Chaffey Community College District, 3.00%, 06/01/2038 | 3,705,000 | 3,441,052 | ||||
Chaffey Joint Union High School District, 3.14%, 08/01/2043 | 3,790,000 | 2,994,698 | ||||
City of Fresno, CA Water System Revenue, 6.75%, 06/01/2040 | 1,695,000 | 1,935,806 | ||||
City of Los Angeles, CA Department of Airports | ||||||
1.88%, 05/15/2030 | 230,000 | 196,035 | ||||
7.05%, 05/15/2040 | 13,160,000 | 15,786,231 | ||||
City of Los Angeles, CA Wastewater System Revenue | ||||||
5.71%, 06/01/2039 | 20,075,000 | 21,634,749 | ||||
5.81%, 06/01/2040 | 15,110,000 | 16,398,507 | ||||
City of Ontario, CA, 3.78%, 06/01/2038 | 3,000,000 | 2,674,553 | ||||
City of Sacramento, CA Transient Occupancy Tax Revenue, 3.86%, 06/01/2025 | 3,320,000 | 3,294,902 | ||||
City of Union City, CA, 0.00%, 07/01/2025(a) | 2,105,000 | 2,019,111 | ||||
Cucamonga Valley Water District Financing Authority, 3.01%, 09/01/2042 | 5,000,000 | 3,968,641 | ||||
Par | Value | |||||
Dry Creek Joint Elementary School District | ||||||
0.00%, 08/01/2037(a) | $2,960,000 | $1,894,844 | ||||
0.00%, 08/01/2038(a) | 3,640,000 | 2,220,260 | ||||
East Bay Municipal Utility District Water System Revenue, 5.87%, 06/01/2040 | 11,740,000 | 12,695,955 | ||||
East Side Union High School District, 5.32%, 04/01/2036 | 6,240,000 | 6,399,579 | ||||
Fullerton Public Financing Authority, 7.75%, 05/01/2031 | 1,025,000 | 1,148,237 | ||||
Glendora Unified School District, 0.00%, 08/01/2039(a) | 5,175,000 | 3,019,854 | ||||
Golden State Tobacco Securitization Corp. | ||||||
2.79%, 06/01/2031 | 10,930,000 | 9,611,734 | ||||
3.00%, 06/01/2046 | 9,925,000 | 9,185,523 | ||||
Inland Empire Tobacco Securitization Corp., 3.68%, 06/01/2038 | 17,720,000 | 16,879,248 | ||||
Lakeside Union School District, 0.00%, 08/01/2040(a) | 4,000,000 | 2,196,372 | ||||
Los Angeles Community College District, CA | ||||||
6.60%, 08/01/2042 | 13,620,000 | 15,707,343 | ||||
6.75%, 08/01/2049 | 4,000,000 | 4,764,362 | ||||
Los Angeles Department of Water & Power | ||||||
6.57%, 07/01/2045 | 6,055,000 | 7,049,019 | ||||
6.60%, 07/01/2050 | 2,000,000 | 2,359,954 | ||||
Marin Community College District, 2.70%, 08/01/2041 | 1,025,000 | 771,431 | ||||
Norwalk-La Mirada Unified School District, 0.00%, 08/01/2038(a) | 4,450,000 | 2,690,761 | ||||
Paramount Unified School District, 3.27%, 08/01/2051 | 13,425,000 | 10,202,914 | ||||
Peralta Community College District, 0.00%, 08/05/2031 | 12,350,000 | 11,805,719 | ||||
Perris Union High School District, 2.70%, 09/01/2042 | 3,000,000 | 2,251,102 | ||||
Poway Unified School District | ||||||
0.00%, 08/01/2039(a) | 8,335,000 | 4,821,156 | ||||
0.00%, 08/01/2040(a) | 12,000,000 | 6,577,813 | ||||
Riverside County Infrastructure Financing Authority, 3.19%, 11/01/2041 | 4,755,000 | 3,806,286 | ||||
Riverside County Transportation Commission Sales Tax Revenue, 6.81%, 06/01/2039 | 11,000,000 | 12,831,140 | ||||
San Diego County Regional Transportation Commission, 5.91%, 04/01/2048 | 8,125,000 | 8,771,337 | ||||
San Diego Unified School District, 0.00%, 07/01/2041(a) | 8,500,000 | 4,525,675 | ||||
1 |
Par | Value | |||||
MUNICIPAL BONDS - (Continued) | ||||||
California - (Continued) | ||||||
San Francisco City & County Public Utilities Commission Wastewater Revenue, 5.82%, 10/01/2040 | $16,035,000 | $17,322,540 | ||||
San Francisco City & County Redevelopment Financing Authority, 0.00%, 08/01/2036(a) | 5,240,000 | 2,923,882 | ||||
San Mateo Foster City School District, 3.06%, 08/01/2044 | 2,245,000 | 1,787,075 | ||||
Santa Ana Unified School District, 0.00%, 08/01/2037(a) | 3,955,000 | 2,522,173 | ||||
Santa Monica Community College District, 2.80%, 08/01/2044 | 2,300,000 | 1,695,804 | ||||
State of California | ||||||
7.55%, 04/01/2039 | 9,500,000 | 11,852,457 | ||||
7.60%, 11/01/2040 | 18,500,000 | 23,208,975 | ||||
University of California | ||||||
4.86%, 05/15/2112 | 16,146,000 | 14,919,351 | ||||
4.77%, 05/15/2115 | 16,372,000 | 14,817,680 | ||||
West Contra Costa Unified School District, 0.00%, 08/01/2036(a) | 5,000,000 | 3,339,882 | ||||
West Sonoma County Union High School District, 0.00%, 08/01/2037(a) | 1,840,000 | 1,155,675 | ||||
Yosemite Community College District, 0.00%, 08/01/2038(a) | 6,110,000 | 3,691,388 | ||||
Yuba Community College District, 0.00%, 08/01/2038(a) | 5,055,000 | 3,100,258 | ||||
430,314,954 | ||||||
Colorado - 0.4% | ||||||
Board of Governors of Colorado State University System, 6.06%, 03/01/2040 | 3,500,000 | 3,757,723 | ||||
City of Aurora, CO Water Revenue, 2.72%, 08/01/2046 | 890,000 | 655,041 | ||||
City of Colorado Springs, CO Utilities System Revenue, 6.01%, 11/15/2039 | 1,000,000 | 1,091,409 | ||||
City of Fountain, CO Electric Water & Wastewater Utility Enterprise Revenue, 3.20%, 12/01/2043 | 2,655,000 | 2,062,378 | ||||
City of Fruita, CO Healthcare Revenue, 5.00%, 01/01/2028 | 1,825,000 | 1,794,147 | ||||
Colorado Health Facilities Authority | ||||||
3.80%, 11/01/2044 | 13,815,000 | 11,556,379 | ||||
3.85%, 11/01/2049 | 2,030,000 | 1,647,056 | ||||
Regional Transportation District Sales Tax Revenue, 5.84%, 11/01/2050 | 10,000,000 | 10,843,015 | ||||
33,407,148 | ||||||
Par | Value | |||||
Connecticut - 0.4% | ||||||
State of Connecticut | ||||||
3.00%, 01/15/2036 | $10,595,000 | $9,988,615 | ||||
3.00%, 01/15/2037 | 7,090,000 | 6,614,166 | ||||
3.00%, 06/01/2037 | 8,865,000 | 8,232,100 | ||||
State of Connecticut Special Tax Revenue, 3.13%, 05/01/2040 | 7,075,000 | 6,356,793 | ||||
Town of West Hartford, CT, 2.76%, 07/01/2041 | 7,025,000 | 5,454,511 | ||||
36,646,185 | ||||||
Delaware - 0.2% | ||||||
University of Delaware, 5.87%, 11/01/2040 | 15,250,000 | 16,175,506 | ||||
District of Columbia - 0.7% | ||||||
District of Columbia Water & Sewer Authority | ||||||
5.52%, 10/01/2044 | 6,450,000 | 6,597,887 | ||||
4.81%, 10/01/2114 | 16,651,000 | 15,940,680 | ||||
Metropolitan Washington Airports Authority Dulles Toll Road Revenue, 8.00%, 10/01/2047 | 27,000,000 | 35,676,971 | ||||
58,215,538 | ||||||
Florida - 0.8% | ||||||
City of Gainesville, FL | ||||||
0.00%, 10/01/2027(a) | 4,610,000 | 4,024,880 | ||||
0.00%, 10/01/2028(a) | 1,400,000 | 1,171,092 | ||||
3.05%, 10/01/2040 | 10,840,000 | 8,664,506 | ||||
City of Gainesville, FL Utilities System Revenue, 6.02%, 10/01/2040 | 16,980,000 | 18,422,376 | ||||
County of Miami-Dade, FL Transit System, 5.62%, 07/01/2040 | 17,395,000 | 18,472,753 | ||||
JEA Water & Sewer System Revenue, 3.00%, 10/01/2041 | 5,045,000 | 4,408,360 | ||||
Orlando Utilities Commission, 5.66%, 10/01/2040 | 9,000,000 | 9,561,841 | ||||
64,725,808 | ||||||
Georgia - 0.0%(d) | ||||||
City of Atlanta, GA Water & Wastewater Revenue, 2.91%, 11/01/2043 | 2,125,000 | 1,607,184 | ||||
Tift County Hospital Authority, 2.98%, 12/01/2042 | 2,950,000 | 2,249,646 | ||||
3,856,830 | ||||||
Hawaii - 0.1% | ||||||
City & County Honolulu, HI Wastewater System Revenue, 2.57%, 07/01/2041 | 5,000,000 | 3,734,611 | ||||
State of Hawaii | ||||||
2.25%, 08/01/2038 | 3,950,000 | 2,979,424 | ||||
2.83%, 10/01/2039 | 3,950,000 | 3,151,057 | ||||
2.87%, 10/01/2041 | 2,270,000 | 1,756,848 | ||||
11,621,940 | ||||||
2 |
Par | Value | |||||
MUNICIPAL BONDS - (Continued) | ||||||
Illinois - 0.4% | ||||||
Chicago O’Hare International Airport, 6.40%, 01/01/2040 | $16,730,000 | $18,947,640 | ||||
Illinois Finance Authority, 3.51%, 05/15/2041 | 7,000,000 | 5,713,201 | ||||
Metropolitan Pier & Exposition Authority | ||||||
0.00%, 06/15/2036(a) | 4,025,000 | 2,483,336 | ||||
0.00%, 06/15/2038(a) | 2,750,000 | 1,545,339 | ||||
28,689,516 | ||||||
Indiana - 0.2% | ||||||
Indianapolis Local Public Improvement Bond Bank | ||||||
2.47%, 01/01/2040 | 9,500,000 | 7,387,915 | ||||
6.12%, 01/15/2040 | 7,700,000 | 8,317,321 | ||||
15,705,236 | ||||||
Kansas - 0.0%(d) | ||||||
Kansas Development Finance Authority, 4.93%, 04/15/2045 | 2,050,000 | 2,050,338 | ||||
Kentucky - 0.1% | ||||||
County of Warren, KY, 4.40%, 12/01/2038 | 1,540,000 | 1,457,023 | ||||
Louisville and Jefferson County Metropolitan Sewer District, 2.25%, 05/15/2044 | 5,215,000 | 3,599,550 | ||||
5,056,573 | ||||||
Louisiana - 0.3% | ||||||
City of New Orleans, LA Water System Revenue | ||||||
2.89%, 12/01/2041 | 3,050,000 | 2,412,973 | ||||
2.99%, 12/01/2045 | 5,000,000 | 3,790,721 | ||||
East Baton Rouge Sewerage Commission, 2.44%, 02/01/2039 | 2,500,000 | 1,929,616 | ||||
State of Louisiana Gasoline & Fuels Tax Revenue | ||||||
2.53%, 05/01/2041 | 12,065,000 | 9,030,818 | ||||
2.83%, 05/01/2043 | 9,685,000 | 7,163,249 | ||||
24,327,377 | ||||||
Maine - 0.2% | ||||||
City of Portland, ME | ||||||
2.50%, 04/01/2039 | 1,760,000 | 1,429,579 | ||||
2.50%, 04/01/2040 | 1,760,000 | 1,399,197 | ||||
2.50%, 04/01/2041 | 1,760,000 | 1,371,450 | ||||
Maine Health & Higher Educational Facilities Authority, 3.12%, 07/01/2043 | 14,250,000 | 11,069,045 | ||||
15,269,271 | ||||||
Maryland - 0.2% | ||||||
Maryland Economic Development Corp., 5.43%, 05/31/2056 | 3,800,000 | 3,873,739 | ||||
Par | Value | |||||
Maryland Health & Higher Educational Facilities Authority, 3.05%, 07/01/2040 | $10,000,000 | $7,723,271 | ||||
Maryland Stadium Authority, 2.81%, 05/01/2040 | 7,000,000 | 5,520,690 | ||||
17,117,700 | ||||||
Massachusetts - 0.2% | ||||||
Commonwealth of Massachusetts, 2.38%, 09/01/2043 | 3,250,000 | 2,452,998 | ||||
Commonwealth of Massachusetts Transportation Fund Revenue, 5.73%, 06/01/2040 | 11,165,000 | 11,658,155 | ||||
Massachusetts State College Building Authority, 5.93%, 05/01/2040 | 550,000 | 585,709 | ||||
14,696,862 | ||||||
Michigan - 1.0% | ||||||
City of Detroit, MI, 4.00%, 04/01/2044(e) | 8,700,000 | 6,966,818 | ||||
Detroit City School District, 7.75%, 05/01/2039 | 12,655,000 | 15,052,267 | ||||
Great Lakes Water Authority Sewage Disposal System Revenue, 3.06%, 07/01/2039 | 2,110,000 | 1,749,401 | ||||
Michigan Finance Authority | ||||||
3.27%, 06/01/2039 | 20,070,000 | 19,076,035 | ||||
3.56%, 06/15/2045 | 5,215,000 | 4,286,854 | ||||
Michigan State University, 4.17%, 08/15/2122 | 12,783,000 | 10,371,538 | ||||
Plymouth-Canton Community School District, 3.00%, 05/01/2040 | 1,675,000 | 1,456,244 | ||||
University of Michigan, 4.45%, 04/01/2122 | 19,211,000 | 16,855,445 | ||||
Western School District, 2.90%, 05/01/2040 | 1,500,000 | 1,182,162 | ||||
76,996,764 | ||||||
Minnesota - 0.3% | ||||||
Southern Minnesota Municipal Power Agency, 5.93%, 01/01/2043 | 1,450,000 | 1,574,264 | ||||
Western Minnesota Municipal Power Agency, 6.77%, 01/01/2046 | 13,000,000 | 15,128,226 | ||||
White Bear Lake Independent School District No. 624, 3.00%, 02/01/2044 | 8,330,000 | 7,041,251 | ||||
23,743,741 | ||||||
Mississippi - 0.1% | ||||||
Mississippi Development Bank, 5.46%, 10/01/2036 | 5,005,000 | 5,145,116 | ||||
Missouri - 0.1% | ||||||
Kansas City Land Clearance Redevelopment Authority, 6.40%, 10/15/2040(b) | 7,895,000 | 7,598,105 | ||||
3 |
Par | Value | |||||
MUNICIPAL BONDS - (Continued) | ||||||
Nebraska - 0.1% | ||||||
Lancaster County School District 001, 3.00%, 01/15/2043 | $6,075,000 | $5,195,172 | ||||
West Haymarket Joint Public Agency, 6.75%, 12/15/2045 | 5,000,000 | 5,877,263 | ||||
11,072,435 | ||||||
Nevada - 0.4% | ||||||
City of North Las Vegas, NV, 6.57%, 06/01/2040 | 14,700,000 | 16,636,884 | ||||
County of Clark Department of Aviation, 6.82%, 07/01/2045 | 8,605,000 | 10,143,074 | ||||
County of Clark, NV | ||||||
3.00%, 07/01/2038 | 4,000,000 | 3,611,569 | ||||
3.23%, 07/01/2044 | 2,000,000 | 1,549,577 | ||||
31,941,104 | ||||||
New Hampshire - 0.0%(d) | ||||||
New Hampshire Business Finance Authority, 3.28%, 10/01/2037 | 4,855,000 | 3,644,771 | ||||
New Jersey - 1.0% | ||||||
City of Bayonne, NJ, 2.81%, 07/01/2039 | 5,725,000 | 4,487,343 | ||||
Clifton Board Of Education, 2.13%, 08/15/2044 | 4,560,000 | 3,019,570 | ||||
County of Essex, NJ, 2.00%, 09/01/2044 | 3,560,000 | 2,438,503 | ||||
New Jersey Economic Development Authority, 0.00%, 02/15/2025(a) | 20,188,000 | 19,711,771 | ||||
New Jersey Institute of Technology, 3.42%, 07/01/2042 | 6,455,000 | 5,346,952 | ||||
New Jersey Transportation Trust Fund Authority | ||||||
0.00%, 12/15/2039(a) | 5,000,000 | 2,715,143 | ||||
0.00%, 12/15/2040(a) | 10,045,000 | 5,134,226 | ||||
New Jersey Turnpike Authority | ||||||
7.41%, 01/01/2040 | 11,396,000 | 13,929,952 | ||||
7.10%, 01/01/2041 | 17,054,000 | 20,255,907 | ||||
77,039,367 | ||||||
New York - 1.3% | ||||||
Metropolitan Transportation Authority, 7.34%, 11/15/2039 | 18,085,000 | 22,035,641 | ||||
New York City Industrial Development Agency, 2.44%, 01/01/2036 | 5,850,000 | 4,600,686 | ||||
New York City Municipal Water Finance Authority | ||||||
5.75%, 06/15/2041 | 12,480,000 | 13,292,475 | ||||
5.72%, 06/15/2042 | 5,650,000 | 5,982,885 | ||||
6.01%, 06/15/2042 | 15,900,000 | 17,336,150 | ||||
5.44%, 06/15/2043 | 4,000,000 | 4,082,147 | ||||
5.88%, 06/15/2044 | 1,165,000 | 1,246,139 | ||||
Par | Value | |||||
New York City Transitional Finance Authority Building Aid Revenue, 3.00%, 07/15/2038 | $1,400,000 | $1,291,826 | ||||
New York Liberty Development Corp. | ||||||
2.25%, 02/15/2041 | 13,595,000 | 9,809,165 | ||||
3.00%, 02/15/2042 | 5,500,000 | 4,679,063 | ||||
3.00%, 09/15/2043 | 12,500,000 | 10,485,220 | ||||
New York State Dormitory Authority, 5.10%, 08/01/2034 | 3,125,000 | 3,000,610 | ||||
Triborough Bridge & Tunnel Authority, 2.92%, 05/15/2040 | 3,890,000 | 3,019,908 | ||||
Western Nassau County Water Authority, 2.96%, 04/01/2041 | 1,500,000 | 1,187,656 | ||||
102,049,571 | ||||||
North Carolina - 0.0%(d) | ||||||
University of North Carolina at Charlotte, 2.76%, 04/01/2043 | 2,000,000 | 1,496,013 | ||||
Ohio - 0.9% | ||||||
American Municipal Power, Inc. | ||||||
6.45%, 02/15/2044 | 16,620,000 | 18,553,061 | ||||
8.08%, 02/15/2050 | 5,000,000 | 6,777,961 | ||||
County of Hamilton, OH, 3.76%, 06/01/2042 | 11,955,000 | 10,174,932 | ||||
Franklin County Convention Facilities Authority, 2.47%, 12/01/2034 | 15,000,000 | 12,200,445 | ||||
Ohio Higher Educational Facility Commission, 4.50%, 12/01/2026 | 4,025,000 | 3,947,678 | ||||
Ohio State University, 4.80%, 06/01/2111 | 18,448,000 | 17,302,676 | ||||
68,956,753 | ||||||
Oklahoma - 0.4% | ||||||
Oklahoma Development Finance Authority | ||||||
5.45%, 08/15/2028 | 5,270,000 | 5,076,216 | ||||
5.27%, 10/01/2042 | 9,608,323 | 9,840,241 | ||||
4.62%, 06/01/2044 | 5,000,000 | 4,899,224 | ||||
Oklahoma Municipal Power Authority | ||||||
2.55%, 01/01/2036 | 2,390,000 | 1,986,366 | ||||
2.80%, 01/01/2041 | 15,500,000 | 12,406,092 | ||||
6.44%, 01/01/2045 | 500,000 | 562,816 | ||||
34,770,955 | ||||||
Oregon - 0.2% | ||||||
Clackamas & Washington Counties School District No. 3, 0.00%, 06/15/2038(a) | 1,900,000 | 1,063,374 | ||||
Multnomah & Clackamas Counties School District No. 10JT Gresham-Barlow, 0.00%, 06/15/2039(a) | 9,500,000 | 5,149,738 | ||||
4 |
Par | Value | |||||
MUNICIPAL BONDS - (Continued) | ||||||
Oregon - (Continued) | ||||||
Salem-Keizer School District No. 24J | ||||||
0.00%, 06/15/2039(a) | $3,000,000 | $1,534,803 | ||||
0.00%, 06/15/2040(a) | 12,395,000 | 5,959,082 | ||||
Tri-County Metropolitan Transportation District of Oregon, 2.86%, 09/01/2041 | 750,000 | 586,750 | ||||
14,293,747 | ||||||
Pennsylvania - 0.6% | ||||||
Berks County Industrial Development Authority, 4.45%, 05/15/2027 | 800,000 | 796,274 | ||||
Commonwealth Financing Authority | ||||||
3.66%, 06/01/2038 | 7,020,000 | 6,367,047 | ||||
3.53%, 06/01/2042 | 3,160,000 | 2,683,362 | ||||
Commonwealth of Pennsylvania, 3.00%, 05/15/2036 | 1,255,000 | 1,151,286 | ||||
Montgomery County Industrial Development Authority, 3.15%, 11/15/2028 | 10,000,000 | 9,281,170 | ||||
Pennsylvania Economic Development Financing Authority, 3.14%, 06/15/2042 | 7,615,000 | 6,158,094 | ||||
Pennsylvania Turnpike Commission | ||||||
6.11%, 12/01/2039 | 9,296,000 | 10,212,957 | ||||
3.00%, 12/01/2042 | 9,830,000 | 8,472,301 | ||||
5.51%, 12/01/2045 | 1,500,000 | 1,542,153 | ||||
Union County Hospital Authority, 4.40%, 08/01/2028 | 865,000 | 861,458 | ||||
University of Pittsburgh-of the Commonwealth System of Higher Education, 3.56%, 09/15/2119 | 4,855,000 | 3,429,147 | ||||
50,955,249 | ||||||
Puerto Rico - 0.2% | ||||||
Commonwealth of Puerto Rico | ||||||
0.00%, 07/01/2033(a) | 592,257 | 399,168 | ||||
4.00%, 07/01/2041 | 482,722 | 458,808 | ||||
0.00%, 11/01/2043(e) | 2,034,695 | 1,289,488 | ||||
4.00%, 07/01/2046 | 502,024 | 466,147 | ||||
GDB Debt Recovery Authority of Puerto Rico, 7.50%, 08/20/2040 | 7,404,885 | 7,219,763 | ||||
Puerto Rico Highway & Transportation Authority, 0.00%, 07/01/2026(a) | 7,000,000 | 6,063,750 | ||||
15,897,124 | ||||||
Rhode Island - 0.0%(d) | ||||||
State of Rhode Island, 2.25%, 08/01/2041 | 1,550,000 | 1,130,435 | ||||
Par | Value | |||||
Tennessee - 0.8% | ||||||
County of Putnam, TN | ||||||
2.00%, 04/01/2038 | $4,115,000 | $3,175,921 | ||||
2.00%, 04/01/2039 | 4,195,000 | 3,148,608 | ||||
2.13%, 04/01/2041 | 4,360,000 | 3,182,707 | ||||
Metropolitan Government Nashville & Davidson County Sports Authority, 5.60%, 07/01/2056 | 13,200,000 | 13,989,718 | ||||
Metropolitan Government of Nashville & Davidson County, 1.75%, 01/01/2037 | 34,350,000 | 25,261,904 | ||||
New Memphis Arena Public Building Authority | ||||||
0.00%, 04/01/2044(a) | 6,020,000 | 2,384,717 | ||||
0.00%, 04/01/2045(a) | 6,000,000 | 2,246,907 | ||||
0.00%, 04/01/2046(a) | 4,900,000 | 1,742,180 | ||||
Tennessee State School Bond Authority, 2.66%, 11/01/2045 | 11,645,000 | 8,367,240 | ||||
63,499,902 | ||||||
Texas - 3.0% | ||||||
Austin Independent School District, 1.88%, 08/01/2038 | 12,265,000 | 8,950,232 | ||||
Central Texas Regional Mobility Authority, 3.27%, 01/01/2045 | 3,900,000 | 3,003,105 | ||||
City of Dallas, TX, 0.00%, 02/15/2032(a) | 15,000,000 | 10,683,812 | ||||
City of Frisco, TX | ||||||
2.00%, 02/15/2039 | 4,835,000 | 3,524,755 | ||||
2.00%, 02/15/2040 | 4,925,000 | 3,493,450 | ||||
City of Houston, TX | ||||||
6.29%, 03/01/2032 | 730,000 | 784,551 | ||||
5.54%, 03/01/2037 | 7,100,000 | 7,657,223 | ||||
3.96%, 03/01/2047 | 8,300,000 | 7,288,987 | ||||
City of Irving, TX, 7.38%, 08/15/2044 | 3,500,000 | 3,501,648 | ||||
City of San Antonio, TX Electric & Gas Systems Revenue | ||||||
5.99%, 02/01/2039 | 15,891,000 | 17,267,159 | ||||
5.72%, 02/01/2041 | 21,910,000 | 23,007,833 | ||||
Colony Economic Development Corp., 7.25%, 10/01/2042 | 5,000,000 | 4,989,817 | ||||
County of Bexar, TX, 3.03%, 08/15/2041 | 1,555,000 | 1,189,849 | ||||
Dallas Area Rapid Transit, 6.00%, 12/01/2044 | 3,500,000 | 3,775,920 | ||||
Dallas Convention Center Hotel Development Corp., 7.09%, 01/01/2042 | 23,220,000 | 26,637,106 | ||||
Dallas Fort Worth International Airport | ||||||
3.09%, 11/01/2040 | 18,265,000 | 15,075,107 | ||||
5.00%, 11/01/2042 | 1,225,000 | 1,240,831 | ||||
5.05%, 11/01/2047 | 2,500,000 | 2,488,624 | ||||
5 |
Par | Value | |||||
MUNICIPAL BONDS - (Continued) | ||||||
Texas - (Continued) | ||||||
Downtown Dallas Development Authority, 0.00%, 08/15/2036(a) | $6,730,000 | $3,769,140 | ||||
Forney Independent School District | ||||||
3.00%, 02/15/2039 | 1,000,000 | 890,398 | ||||
2.50%, 08/15/2039 | 7,330,000 | 5,815,183 | ||||
2.50%, 08/15/2040 | 7,300,000 | 5,668,419 | ||||
2.50%, 08/15/2041 | 4,385,000 | 3,339,140 | ||||
Fort Bend Grand Parkway Toll Road Authority, 3.00%, 03/01/2039 | 2,150,000 | 1,919,896 | ||||
New Hope Cultural Education Facilities Corp., 4.00%, 08/01/2020(f) | 169,148 | 0 | ||||
North Texas Tollway Authority | ||||||
8.41%, 02/01/2030 | 4,375,000 | 4,796,940 | ||||
3.00%, 01/01/2038 | 21,860,000 | 19,793,522 | ||||
3.01%, 01/01/2043 | 1,160,000 | 925,465 | ||||
6.72%, 01/01/2049 | 17,429,000 | 20,580,963 | ||||
Port of Beaumont Industrial Development Authority, 4.10%, 01/01/2028(b) | 10,500,000 | 9,337,196 | ||||
Port of Beaumont Navigation District, 10.00%, 07/01/2026(b) | 3,500,000 | 3,578,786 | ||||
Port of Houston Authority, 3.00%, 10/01/2039 | 5,000,000 | 4,642,755 | ||||
San Antonio Water System, 5.92%, 05/15/2040 | 1,540,000 | 1,661,121 | ||||
Stafford Municipal School District, 3.08%, 08/15/2041 | 1,525,000 | 1,229,220 | ||||
State of Texas, 2.13%, 08/01/2037 | 3,430,000 | 2,661,496 | ||||
Texas A&M University, 3.00%, 05/15/2039 | 2,395,000 | 2,156,117 | ||||
Texas Public Finance Authority, 2.47%, 02/01/2040 | 1,000,000 | 744,289 | ||||
Texas Water Development Board, 3.00%, 08/01/2039 | 3,000,000 | 2,688,919 | ||||
240,758,974 | ||||||
Utah - 0.1% | ||||||
County of Salt Lake, UT Convention Hotel Revenue, 5.75%, 10/01/2047(b) | 5,000,000 | 4,531,017 | ||||
Virginia - 0.4% | ||||||
Hampton Roads Sanitation District, 2.78%, 02/01/2039 | 1,300,000 | 1,060,378 | ||||
University of Virginia | ||||||
6.20%, 09/01/2039 | 1,120,000 | 1,246,196 | ||||
4.18%, 09/01/2117 | 18,500,000 | 15,643,994 | ||||
3.23%, 09/01/2119 | 22,240,000 | 14,421,401 | ||||
Par | Value | |||||
Virginia Housing Development Authority | ||||||
3.90%, 04/01/2042 | $3,155,000 | $2,620,069 | ||||
2.96%, 09/01/2045 | 1,205,000 | 834,749 | ||||
35,826,787 | ||||||
Washington - 1.3% | ||||||
Central Puget Sound Regional Transit Authority, 5.49%, 11/01/2039 | 15,230,000 | 15,961,148 | ||||
City of Tacoma, WA Water Revenue | ||||||
5.75%, 12/01/2039 | 20,000,000 | 21,392,756 | ||||
5.62%, 12/01/2040 | 4,750,000 | 5,008,771 | ||||
County of King, WA Sewer Revenue, 2.84%, 07/01/2047 | 2,000,000 | 1,426,621 | ||||
Douglas County Public Utility District No. 1 Wells Hydroelectric Project Revenue, 5.50%, 09/01/2040 | 8,750,000 | 8,923,568 | ||||
King County Housing Authority | ||||||
3.00%, 11/01/2039 | 3,600,000 | 3,103,958 | ||||
3.00%, 06/01/2040 | 18,995,000 | 15,986,901 | ||||
3.00%, 08/01/2040 | 3,195,000 | 2,684,275 | ||||
NJB Properties, 5.51%, 12/01/2036 | 6,960,000 | 7,402,660 | ||||
University of Washington | ||||||
6.06%, 07/01/2039 | 10,515,000 | 11,550,576 | ||||
5.00%, 10/01/2040 | 9,835,000 | 9,928,411 | ||||
103,369,645 | ||||||
Wisconsin - 0.2% | ||||||
County of Marathon, WI | ||||||
2.00%, 02/01/2037 | 1,495,000 | 1,186,169 | ||||
2.00%, 02/01/2037 | 885,000 | 702,181 | ||||
2.00%, 02/01/2038 | 1,525,000 | 1,184,280 | ||||
2.00%, 02/01/2038 | 1,110,000 | 862,001 | ||||
2.00%, 02/01/2039 | 1,460,000 | 1,099,830 | ||||
2.00%, 02/01/2039 | 1,105,000 | 831,697 | ||||
Milwaukee Redevelopment Authority, 0.00%, 04/01/2039(a) | 1,000,000 | 474,608 | ||||
Public Finance Authority | ||||||
7.50%, 06/01/2029(b) | 5,750,000 | 5,659,821 | ||||
4.15%, 05/15/2031 | 3,635,000 | 3,624,534 | ||||
15,625,121 | ||||||
TOTAL MUNICIPAL BONDS (Cost $1,798,198,665) | 1,774,854,242 | |||||
CORPORATE BONDS - 17.1% | ||||||
Aerospace & Defense - 0.1% | ||||||
Moog, Inc., 4.25%, 12/15/2027(b) | 4,440,000 | 4,280,819 | ||||
TransDigm, Inc., 6.63%, 03/01/2032(b) | 5,000,000 | 5,205,430 | ||||
9,486,249 | ||||||
6 |
Par | Value | |||||
CORPORATE BONDS - (Continued) | ||||||
Automobile Components - 0.1% | ||||||
Dana, Inc. | ||||||
4.25%, 09/01/2030 | $1,500,000 | $1,352,617 | ||||
4.50%, 02/15/2032 | 4,208,000 | 3,749,344 | ||||
5,101,961 | ||||||
Banks - 4.4% | ||||||
Atlantic Union Bankshares Corp., 2.88% to 12/15/2026 then 3 mo. Term SOFR + 1.86%, 12/15/2031 | 5,000,000 | 4,100,000 | ||||
Australia & New Zealand Banking Group Ltd., 6.74%, 12/08/2032(b) | 7,000,000 | 7,682,106 | ||||
Bank of America Corp. | ||||||
6.30% to 03/10/2026 then 3 mo. Term SOFR + 4.81%, Perpetual | 2,565,000 | 2,594,789 | ||||
2.65% to 03/11/2031 then SOFR + 1.22%, 03/11/2032 | 10,000,000 | 8,779,594 | ||||
Bank of Montreal, 3.09% to 01/10/2032 then 5 yr. CMT Rate + 1.40%, 01/10/2037 | 15,000,000 | 12,841,061 | ||||
Bank of NT Butterfield & Son Ltd., 5.25% to 06/15/2025 then 3 mo. Term SOFR + 5.06%, 06/15/2030 | 5,000,000 | 4,861,429 | ||||
Bank OZK, 2.75% to 10/01/2026 then 3 mo. Term SOFR + 2.09%, 10/01/2031 | 13,175,000 | 10,563,837 | ||||
Banner Corp., 5.00% to 06/30/2025 then 3 mo. Term SOFR + 4.89%, 06/30/2030 | 8,000,000 | 7,840,000 | ||||
Barclays PLC, 6.13% to 06/15/2026 then 5 yr. CMT Rate + 5.87%, Perpetual | 15,050,000 | 14,967,923 | ||||
CapStar Bank, 5.88%, 09/29/2026 | 7,515,000 | 7,581,675 | ||||
Central Pacific Financial Corp., 4.75% to 11/01/2025 then 3 mo. Term SOFR + 4.56%, 11/01/2030 | 5,000,000 | 4,826,251 | ||||
CNB Financial Corp., 3.25% to 06/15/2026 then 3 mo. Term SOFR + 2.58%, 06/15/2031(b) | 2,000,000 | 1,720,000 | ||||
Commonwealth Bank of Australia, 5.84%, 03/13/2034(b) | 5,000,000 | 5,219,598 | ||||
Deutsche Bank AG, 7.08% to 02/10/2033 then SOFR + 3.65%, 02/10/2034 | 3,000,000 | 3,177,268 | ||||
Fifth Third Bancorp, 8.25%, 03/01/2038 | 10,000,000 | 12,418,812 | ||||
First Busey Corp. | ||||||
5.25% to 06/01/2025 then 3 mo. Term SOFR + 5.11%, 06/01/2030 | 4,500,000 | 4,421,250 | ||||
Par | Value | |||||
5.00% to 06/15/2027 then 3 mo. Term SOFR + 2.52%, 06/15/2032 | $2,000,000 | $1,730,000 | ||||
First Financial Bancorp., 5.25% to 05/15/2025 then 3 mo. Term SOFR + 5.09%, 05/15/2030 | 10,500,000 | 10,188,470 | ||||
First Interstate BancSystem, Inc., 5.25% to 05/15/2025 then 3 mo. Term SOFR + 5.18%, 05/15/2030 | 5,000,000 | 4,919,262 | ||||
First Mid Bancshares, Inc., 3.95% to 10/15/2025 then 3 mo. Term SOFR + 3.83%, 10/15/2030 | 5,300,000 | 5,046,511 | ||||
Firstbank, 4.50% to 09/01/2025 then SOFR + 4.39%, 09/01/2030 | 9,000,000 | 8,640,000 | ||||
Heartland Financial USA, Inc., 2.75% to 09/15/2026 then 3 mo. Term SOFR + 2.10%, 09/15/2031 | 6,000,000 | 4,979,895 | ||||
Hilltop Holdings, Inc., 6.13% to 05/15/2030 then 3 mo. Term SOFR + 5.80%, 05/15/2035 | 11,750,000 | 9,563,207 | ||||
Home BancShares, Inc., 3.13% to 01/30/2027 then 3 mo. Term SOFR + 1.82%, 01/30/2032 | 18,436,000 | 15,487,732 | ||||
Huntington National Bank, 5.50% to 05/06/2025 then 3 mo. Term SOFR + 5.35%, 05/06/2030 | 10,750,000 | 10,597,219 | ||||
JPMorgan Chase & Co. | ||||||
6.25% to 10/23/2033 then SOFR + 1.81%, 10/23/2034 | 10,000,000 | 10,978,634 | ||||
5.34% to 01/23/2034 then SOFR + 1.62%, 01/23/2035 | 3,000,000 | 3,093,212 | ||||
Mercantile Bank Corp., 3.25% to 01/30/2027 then SOFR + 2.12%, 01/30/2032 | 7,000,000 | 5,705,000 | ||||
National Australia Bank Ltd., 3.35% to 01/12/2032 then 5 yr. CMT Rate + 1.70%, 01/12/2037(b) | 9,500,000 | 8,307,078 | ||||
NatWest Group PLC, 6.48% to 06/01/2029 then 5 yr. CMT Rate + 2.20%, 06/01/2034 | 1,000,000 | 1,046,230 | ||||
NBT Bancorp, Inc., 5.00% to 07/01/2025 then 3 mo. Term SOFR + 4.85%, 07/01/2030 | 7,500,000 | 7,178,794 | ||||
Pacific Premier Bancorp, Inc. | ||||||
7.88% (3 mo. Term SOFR + 2.76%), 05/15/2029 | 3,500,000 | 3,337,279 | ||||
5.38% to 06/15/2025 then 3 mo. Term SOFR + 5.17%, 06/15/2030 | 6,410,000 | 6,199,686 | ||||
Park National Corp., 4.50% to 09/01/2025 then 3 mo. Term SOFR + 4.39%, 09/01/2030 | 15,600,000 | 15,054,001 | ||||
7 |
Par | Value | |||||
CORPORATE BONDS - (Continued) | ||||||
Banks - (Continued) | ||||||
Peapack-Gladstone Financial Corp., 3.50% to 12/30/2025 then 3 mo. Term SOFR + 3.26%, 12/30/2030 | $4,500,000 | $3,963,787 | ||||
PNC Financial Services Group, Inc., 5.68% to 01/22/2034 then SOFR + 1.90%, 01/22/2035 | 5,000,000 | 5,221,973 | ||||
Regions Bank, 6.45%, 06/26/2037 | 15,601,000 | 16,663,511 | ||||
Renasant Corp. | ||||||
3.00% to 12/01/2026 then 3 mo. Term SOFR + 1.91%, 12/01/2031 | 7,000,000 | 5,775,835 | ||||
4.50% to 09/15/2030 then 3 mo. Term SOFR + 4.03%, 09/15/2035 | 9,000,000 | 6,836,590 | ||||
Santander Holdings USA, Inc., 6.17% to 01/09/2029 then SOFR + 2.50%, 01/09/2030 | 7,000,000 | 7,258,725 | ||||
Southside Bancshares, Inc., 3.88% to 11/15/2025 then 3 mo. Term SOFR + 3.66%, 11/15/2030 | 8,000,000 | 7,444,481 | ||||
Synovus Financial Corp., 7.54% to 02/07/2029 then 5 yr. Mid Swap Rate USD + 3.38%, 02/07/2029 | 4,000,000 | 3,891,295 | ||||
Texas Capital Bancshares, Inc., 4.00% to 05/06/2026 then 5 yr. CMT Rate + 3.15%, 05/06/2031 | 10,942,000 | 10,192,322 | ||||
Texas Capital Bank, NA, 5.25%, 01/31/2026 | 5,000,000 | 4,842,038 | ||||
Towne Bank, 3.13% to 02/15/2027 then 3 mo. Term SOFR + 1.68%, 02/15/2032 | 4,000,000 | 3,360,000 | ||||
Trustmark Corp., 3.63% to 12/01/2025 then 3 mo. Term SOFR + 3.39%, 12/01/2030 | 6,500,000 | 5,715,551 | ||||
Webster Financial Corp. | ||||||
4.10%, 03/25/2029 | 6,595,000 | 6,312,401 | ||||
4.00% to 12/30/2024 then 3 mo. Term SOFR + 2.53%, 12/30/2029 | 1,500,000 | 1,379,480 | ||||
Western Alliance Bank, 5.25% to 06/01/2025 then 3 mo. Term SOFR + 5.12%, 06/01/2030 | 10,000,000 | 9,706,443 | ||||
WSFS Financial Corp. | ||||||
7.65% (3 mo. Term SOFR + 2.31%), 12/15/2027 | 3,500,000 | 3,204,754 | ||||
2.75% to 12/15/2025 then 3 mo. Term SOFR + 2.49%, 12/15/2030 | 5,470,000 | 4,875,773 | ||||
352,292,762 | ||||||
Par | Value | |||||
Beverages - 0.1% | ||||||
Coca-Cola Co., 5.40%, 05/13/2064 | $5,000,000 | $5,186,007 | ||||
Biotechnology - 0.2% | ||||||
AbbVie, Inc. | ||||||
4.40%, 11/06/2042 | 11,398,000 | 10,497,663 | ||||
5.50%, 03/15/2064 | 5,000,000 | 5,210,952 | ||||
15,708,615 | ||||||
Building Products - 0.1% | ||||||
Builders FirstSource, Inc., 4.25%, 02/01/2032(b) | 7,800,000 | 7,132,840 | ||||
Capital Markets - 0.5% | ||||||
Ares Capital Corp. | ||||||
7.00%, 01/15/2027 | 3,000,000 | 3,112,757 | ||||
5.88%, 03/01/2029 | 4,000,000 | 4,068,608 | ||||
3.20%, 11/15/2031 | 15,473,000 | 13,359,999 | ||||
Brookfield Corp., 7.38%, 03/01/2033 | 3,000,000 | 3,397,839 | ||||
MSCI, Inc., 3.63%, 11/01/2031(b) | 15,200,000 | 13,805,360 | ||||
37,744,563 | ||||||
Chemicals - 0.1% | ||||||
Eastman Chemical Co. | ||||||
5.75%, 03/08/2033 | 3,000,000 | 3,134,518 | ||||
5.63%, 02/20/2034 | 7,000,000 | 7,214,171 | ||||
10,348,689 | ||||||
Commercial Services & Supplies - 0.1% | ||||||
Central Storage Safety Project Trust, 4.82%, 02/01/2038(b) | 5,557,440 | 5,181,380 | ||||
Consumer Finance - 0.5% | ||||||
Ally Financial, Inc., 6.70%, 02/14/2033 | 10,000,000 | 10,307,209 | ||||
Ford Motor Credit Co., LLC | ||||||
7.35%, 03/06/2030 | 8,750,000 | 9,476,727 | ||||
7.20%, 06/10/2030 | 3,000,000 | 3,230,736 | ||||
OneMain Finance Corp. | ||||||
3.88%, 09/15/2028 | 8,545,000 | 7,877,658 | ||||
5.38%, 11/15/2029 | 12,603,000 | 12,135,054 | ||||
43,027,384 | ||||||
Containers & Packaging - 0.6% | ||||||
AptarGroup, Inc., 3.60%, 03/15/2032 | 10,000,000 | 9,093,774 | ||||
Berry Global, Inc. | ||||||
4.50%, 02/15/2026(b) | 7,250,000 | 7,160,571 | ||||
5.63%, 07/15/2027(b) | 3,750,000 | 3,756,069 | ||||
5.65%, 01/15/2034(b) | 9,102,000 | 9,271,906 | ||||
Graphic Packaging International, LLC | ||||||
3.50%, 03/01/2029(b) | 3,000,000 | 2,788,958 | ||||
3.75%, 02/01/2030(b) | 13,523,000 | 12,519,019 | ||||
44,590,297 | ||||||
8 |
Par | Value | |||||
CORPORATE BONDS - (Continued) | ||||||
Distributors - 0.1% | ||||||
Genuine Parts Co., 2.75%, 02/01/2032 | $5,000,000 | $4,298,498 | ||||
LKQ Corp., 6.25%, 06/15/2033 | 2,175,000 | 2,287,281 | ||||
6,585,779 | ||||||
Diversified Consumer Services - 2.0% | ||||||
California Institute of Technology | ||||||
4.70%, 11/01/2111 | 16,053,000 | 14,353,259 | ||||
3.65%, 09/01/2119 | 5,172,000 | 3,656,735 | ||||
Case Western Reserve University, 5.41%, 06/01/2122 | 15,322,000 | 15,632,576 | ||||
Massachusetts Institute of Technology | ||||||
7.25%, 11/02/2096 | 2,750,000 | 3,618,580 | ||||
5.60%, 07/01/2111 | 14,180,000 | 15,859,452 | ||||
4.68%, 07/01/2114 | 11,861,000 | 11,177,960 | ||||
3.89%, 07/01/2116 | 10,233,000 | 8,060,345 | ||||
Nature Conservancy | ||||||
1.71%, 07/01/2031 | 1,250,000 | 1,006,032 | ||||
1.81%, 07/01/2032 | 1,150,000 | 906,063 | ||||
1.86%, 07/01/2033 | 532,000 | 407,965 | ||||
Prime Security Services Borrower, LLC | ||||||
5.75%, 04/15/2026(b) | 3,655,000 | 3,664,861 | ||||
3.38%, 08/31/2027(b) | 8,870,000 | 8,406,765 | ||||
Service Corp. International | ||||||
3.38%, 08/15/2030 | 8,692,000 | 7,808,641 | ||||
4.00%, 05/15/2031 | 9,144,000 | 8,400,286 | ||||
Trustees of the University of Pennsylvania | ||||||
4.67%, 09/01/2112 | 9,124,000 | 8,382,837 | ||||
3.61%, 02/15/2119 | 23,739,000 | 16,931,777 | ||||
United Jewish Appeal-Federation of Jewish Philanthropies of New York, Inc., 2.15%, 02/01/2031 | 4,565,000 | 3,989,183 | ||||
University of Southern California | ||||||
5.25%, 10/01/2111 | 2,528,000 | 2,638,410 | ||||
3.23%, 10/01/2120 | 7,200,000 | 4,672,818 | ||||
Washington University, 4.35%, 04/15/2122 | 20,202,000 | 17,281,864 | ||||
YMCA of Greater New York, 2.30%, 08/01/2026 | 5,730,000 | 5,389,651 | ||||
162,246,060 | ||||||
Electric Utilities - 0.6% | ||||||
Brazos Securitization LLC, 5.41%, 09/01/2050(b) | 9,700,000 | 10,051,208 | ||||
Denton County Electric Cooperative, Inc., Series 2022, 5.32%, 02/15/2048(b) | 17,000,000 | 16,880,551 | ||||
PG&E Recovery Funding LLC, 5.53%, 06/01/2049 | 20,000,000 | 20,913,805 | ||||
47,845,564 | ||||||
Par | Value | |||||
Electrical Equipment - 0.3% | ||||||
Regal Rexnord Corp. | ||||||
6.30%, 02/15/2030 | $4,676,000 | $4,938,240 | ||||
6.40%, 04/15/2033 | 2,000,000 | 2,122,487 | ||||
Sensata Technologies BV, 4.00%, 04/15/2029(b) | 2,000,000 | 1,884,833 | ||||
Sensata Technologies, Inc. | ||||||
4.38%, 02/15/2030(b) | 9,838,000 | 9,299,595 | ||||
3.75%, 02/15/2031(b) | 5,955,000 | 5,384,175 | ||||
6.63%, 07/15/2032(b) | 1,500,000 | 1,553,014 | ||||
25,182,344 | ||||||
Electronic Equipment, Instruments & Components - 0.4% | ||||||
CDW Finance Corp. | ||||||
3.25%, 02/15/2029 | 12,703,000 | 11,919,761 | ||||
5.55%, 08/22/2034 | 7,887,000 | 7,963,110 | ||||
Corning, Inc., 5.75%, 08/15/2040 | 15,588,000 | 16,142,807 | ||||
36,025,678 | ||||||
Financial Services - 0.2% | ||||||
American AGcredit FLCA, 3.38% to 06/15/2031 then SOFR + 2.12%, 06/15/2036(b) | 10,000,000 | 7,900,000 | ||||
Compeer Financial FLCA | ||||||
2.75% to 06/01/2026 then SOFR + 2.03%, 06/01/2031(b) | 5,000,000 | 4,421,705 | ||||
3.38% to 06/01/2031 then SOFR + 1.97%, 06/01/2036(b) | 4,750,000 | 3,682,438 | ||||
16,004,143 | ||||||
Food Products - 0.0%(d) | ||||||
Mars, Inc., 2.38%, 07/16/2040(b) | 4,960,000 | 3,463,483 | ||||
Ground Transportation - 0.3% | ||||||
ERAC USA Finance, LLC, 7.00%, 10/15/2037(b) | 18,952,000 | 22,436,756 | ||||
Healthcare Providers & Services - 1.5% | ||||||
Baptist Health South Florida, Inc., 4.34%, 11/15/2041 | 14,760,000 | 13,271,556 | ||||
Centene Corp. | ||||||
3.00%, 10/15/2030 | 11,090,000 | 9,865,528 | ||||
2.50%, 03/01/2031 | 11,000,000 | 9,353,728 | ||||
Cleveland Clinic Foundation, 4.86%, 01/01/2114 | 17,636,000 | 16,595,804 | ||||
Dignity Health, 5.27%, 11/01/2064 | 10,000,000 | 9,608,802 | ||||
Hackensack Meridian Health, Inc., 2.68%, 09/01/2041 | 14,920,000 | 10,964,567 | ||||
HCA, Inc., 5.45%, 09/15/2034 | 2,000,000 | 2,027,832 | ||||
HumanGood California Obligated Group, 3.00%, 10/01/2028 | 2,335,000 | 2,251,713 | ||||
New York and Presbyterian Hospital | ||||||
4.76%, 08/01/2116 | 13,700,000 | 12,409,182 | ||||
3.95%, 08/01/2119 | 5,000,000 | 3,786,330 | ||||
9 |
Par | Value | |||||
CORPORATE BONDS - (Continued) | ||||||
Healthcare Providers & Services - (Continued) | ||||||
Orlando Health Obligated Group, 2.89%, 10/01/2035 | $1,000,000 | $850,624 | ||||
Penn State Health, 3.81%, 11/01/2049 | 5,920,000 | 4,526,192 | ||||
Piedmont Healthcare, Inc., 2.72%, 01/01/2042 | 12,924,000 | 9,423,224 | ||||
Sutter Health, 3.16%, 08/15/2040 | 2,766,000 | 2,209,185 | ||||
Toledo Hospital, 6.02%, 11/15/2048 | 6,980,000 | 7,310,670 | ||||
UnitedHealth Group, Inc., 5.50%, 07/15/2044 | 5,000,000 | 5,163,397 | ||||
119,618,334 | ||||||
Hotel & Resort REITs - 0.1% | ||||||
Host Hotels & Resorts LP | ||||||
5.70%, 07/01/2034 | 2,000,000 | 2,029,716 | ||||
5.50%, 04/15/2035 | 5,000,000 | 4,958,462 | ||||
6,988,178 | ||||||
Hotels, Restaurants & Leisure - 0.2% | ||||||
Hilton Grand Vacations Borrower Escrow LLC, 6.63%, 01/15/2032(b) | 4,000,000 | 4,051,172 | ||||
Papa John’s International, Inc., 3.88%, 09/15/2029(b) | 4,374,000 | 4,013,535 | ||||
Station Casinos, LLC, 4.50%, 02/15/2028(b) | 3,750,000 | 3,600,450 | ||||
Wyndham Hotels & Resorts, Inc., 4.38%, 08/15/2028(b) | 5,730,000 | 5,488,920 | ||||
17,154,077 | ||||||
Household Durables - 0.4% | ||||||
Ashton Woods USA, LLC | ||||||
6.63%, 01/15/2028(b) | 2,570,000 | 2,590,987 | ||||
4.63%, 04/01/2030(b) | 4,100,000 | 3,862,523 | ||||
KB Home, 4.80%, 11/15/2029 | 1,882,000 | 1,839,279 | ||||
M/I Homes, Inc. | ||||||
4.95%, 02/01/2028 | 4,588,000 | 4,511,359 | ||||
3.95%, 02/15/2030 | 7,916,000 | 7,312,280 | ||||
Meritage Homes Corp., 3.88%, 04/15/2029(b) | 8,874,000 | 8,431,320 | ||||
Tempur Sealy International, Inc., 3.88%, 10/15/2031(b) | 5,241,000 | 4,612,418 | ||||
33,160,166 | ||||||
IT Services - 0.1% | ||||||
Gartner, Inc. | ||||||
3.63%, 06/15/2029(b) | 1,125,000 | 1,062,976 | ||||
3.75%, 10/01/2030(b) | 3,250,000 | 3,011,706 | ||||
4,074,682 | ||||||
Life Sciences Tools & Services - 0.0%(d) | ||||||
IQVIA, Inc., 5.00%, 10/15/2026(b) | 2,000,000 | 1,988,176 | ||||
Par | Value | |||||
Machinery - 0.2% | ||||||
AGCO Corp., 5.80%, 03/21/2034 | $7,000,000 | $7,208,293 | ||||
Allison Transmission, Inc., 3.75%, 01/30/2031(b) | 13,782,000 | 12,538,067 | ||||
19,746,360 | ||||||
Media - 0.4% | ||||||
CCO Holdings Capital Corp. | ||||||
4.75%, 02/01/2032(b) | 9,912,000 | 8,647,216 | ||||
4.25%, 01/15/2034(b) | 6,500,000 | 5,258,075 | ||||
Charter Communications Operating, LLC, 3.50%, 03/01/2042 | 2,716,000 | 1,875,320 | ||||
Sirius XM Radio, Inc. | ||||||
5.00%, 08/01/2027(b) | 2,317,000 | 2,266,919 | ||||
3.88%, 09/01/2031(b) | 15,124,000 | 12,991,418 | ||||
31,038,948 | ||||||
Mortgage Real Estate Investment Trusts (REITs) - 0.1% | ||||||
Arbor Realty SR, Inc., 5.00%, 12/30/2028(b) | 5,000,000 | 3,885,744 | ||||
Arbor Realty Trust, Inc., 4.50%, 03/15/2027(b) | 5,000,000 | 4,333,609 | ||||
8,219,353 | ||||||
Pharmaceuticals - 0.5% | ||||||
Bristol-Myers Squibb Co. | ||||||
4.13%, 06/15/2039 | 10,481,000 | 9,505,536 | ||||
5.65%, 02/22/2064 | 10,500,000 | 10,858,401 | ||||
Pfizer Investment Enterprises Pte Ltd., 5.11%, 05/19/2043 | 5,000,000 | 4,956,567 | ||||
Wyeth, LLC, 5.95%, 04/01/2037 | 13,738,000 | 15,032,413 | ||||
40,352,917 | ||||||
Professional Services - 0.5% | ||||||
Amentum Escrow Corp., 7.25%, 08/01/2032(b) | 1,503,000 | 1,575,865 | ||||
Booz Allen Hamilton, Inc. | ||||||
3.88%, 09/01/2028(b) | 2,220,000 | 2,137,292 | ||||
4.00%, 07/01/2029(b) | 10,895,000 | 10,535,360 | ||||
Leidos, Inc. | ||||||
4.38%, 05/15/2030 | 6,310,000 | 6,141,126 | ||||
2.30%, 02/15/2031 | 2,840,000 | 2,433,162 | ||||
Science Applications International Corp., 4.88%, 04/01/2028(b) | 14,388,000 | 13,968,608 | ||||
36,791,413 | ||||||
Real Estate Management & Development - 0.2% | ||||||
Cushman & Wakefield US Borrower LLC, 6.75%, 05/15/2028(b) | 2,300,000 | 2,335,014 | ||||
MMH Master LLC, 6.75%, 02/01/2044(b) | 10,250,000 | 10,652,925 | ||||
10 |
Par | Value | |||||
CORPORATE BONDS - (Continued) | ||||||
Real Estate Management & Development - (Continued) | ||||||
Wildflower Improvement Association, 6.63%, 03/01/2031(b) | $2,384,181 | $2,342,145 | ||||
15,330,084 | ||||||
Retail REITs - 0.2% | ||||||
American Finance Trust, Inc., 4.50%, 09/30/2028(b) | 5,000,000 | 4,597,704 | ||||
Simon Property Group LP, 6.75%, 02/01/2040 | 12,702,000 | 14,428,515 | ||||
19,026,219 | ||||||
Software - 0.4% | ||||||
Open Text Corp. | ||||||
3.88%, 02/15/2028(b) | 7,875,000 | 7,471,854 | ||||
3.88%, 12/01/2029(b) | 6,680,000 | 6,163,072 | ||||
Oracle Corp. | ||||||
3.85%, 07/15/2036 | 10,200,000 | 8,980,087 | ||||
6.50%, 04/15/2038 | 10,000,000 | 11,155,691 | ||||
33,770,704 | ||||||
Specialty Retail - 1.0% | ||||||
Asbury Automotive Group, Inc., 5.00%, 02/15/2032(b) | 11,700,000 | 11,026,621 | ||||
AutoNation, Inc., 3.85%, 03/01/2032 | 11,525,000 | 10,548,926 | ||||
Group 1 Automotive, Inc., 4.00%, 08/15/2028(b) | 18,014,000 | 17,056,728 | ||||
Home Depot, Inc. | ||||||
5.40%, 09/15/2040 | 11,497,000 | 12,004,446 | ||||
4.88%, 02/15/2044 | 2,113,000 | 2,046,773 | ||||
Ken Garff Automotive, LLC, 4.88%, 09/15/2028(b) | 10,159,000 | 9,879,635 | ||||
Lithia Motors, Inc. | ||||||
3.88%, 06/01/2029(b) | 1,120,000 | 1,039,782 | ||||
4.38%, 01/15/2031(b) | 7,000,000 | 6,457,986 | ||||
Penske Automotive Group, Inc., 3.75%, 06/15/2029 | 11,950,000 | 11,132,701 | ||||
81,193,598 | ||||||
Technology Hardware, Storage & Peripherals - 0.3% | ||||||
Dell International, LLC, 8.10%, 07/15/2036 | 18,910,000 | 23,287,790 | ||||
Trading Companies & Distributors - 0.3% | ||||||
Ashtead Capital, Inc. | ||||||
4.25%, 11/01/2029(b) | 5,000,000 | 4,815,178 | ||||
5.50%, 08/11/2032(b) | 8,553,000 | 8,647,132 | ||||
5.95%, 10/15/2033(b) | 2,492,000 | 2,588,460 | ||||
Herc Holdings, Inc., 6.63%, 06/15/2029(b) | 2,000,000 | 2,058,402 | ||||
Par | Value | |||||
United Rentals North America, Inc., 3.75%, 01/15/2032 | $5,100,000 | $4,606,874 | ||||
22,716,046 | ||||||
TOTAL CORPORATE BONDS (Cost $1,385,799,440) | 1,370,047,599 | |||||
ASSET-BACKED SECURITIES - 13.2% | ||||||
American Credit Acceptance Receivables Trust | ||||||
Series 2021-2, Class E, 2.54%, 07/13/2027(b) | 10,000,000 | 9,878,731 | ||||
Series 2021-3, Class E, 2.56%, 11/15/2027(b) | 9,094,000 | 8,915,426 | ||||
Series 2021-4, Class E, 3.12%, 02/14/2028(b) | 5,700,000 | 5,586,422 | ||||
Series 2022-2, Class C, 4.41%, 06/13/2028(b) | 2,344,986 | 2,342,443 | ||||
Series 2022-3, Class C, 4.86%, 10/13/2028(b) | 1,894,995 | 1,892,440 | ||||
Series 2022-4, Class C, 7.86%, 02/15/2029(b) | 3,359,184 | 3,382,492 | ||||
Series 2022-4, Class D, 8.00%, 02/15/2029(b) | 7,500,000 | 7,700,760 | ||||
Series 2023-1, Class C, 5.59%, 04/12/2029(b) | 5,600,000 | 5,610,706 | ||||
Series 2023-2, Class B, 5.61%, 06/14/2027(b) | 4,000,000 | 3,998,271 | ||||
Series 2023-2, Class C, 5.96%, 08/13/2029(b) | 10,580,000 | 10,638,953 | ||||
Series 2023-3, Class C, 6.44%, 10/12/2029(b) | 7,020,000 | 7,116,346 | ||||
Series 2023-4, Class C, 6.99%, 09/12/2030(b) | 7,500,000 | 7,702,856 | ||||
Series 2024-1, Class B, 5.60%, 11/12/2027(b) | 5,000,000 | 5,010,482 | ||||
Series 2024-1, Class C, 5.63%, 01/14/2030(b) | 5,000,000 | 5,030,403 | ||||
Series 2024-2, Class B, 6.10%, 12/13/2027(b) | 5,750,000 | 5,800,525 | ||||
Series 2024-2, Class C, 6.24%, 04/12/2030(b) | 4,750,000 | 4,838,590 | ||||
Series 2024-3, Class B, 5.66%, 08/14/2028(b) | 8,000,000 | 8,071,718 | ||||
Series 2024-3, Class C, 5.73%, 07/12/2030(b) | 6,350,000 | 6,439,671 | ||||
AmeriCredit Automobile Receivables Trust | ||||||
Series 2021-1, Class D, 1.21%, 12/18/2026 | 2,360,000 | 2,282,877 | ||||
Series 2023-1, Class A2A, 5.84%, 10/19/2026 | 3,000,867 | 3,003,378 | ||||
Series 2023-2, Class A3, 5.81%, 05/18/2028 | 15,000,000 | 15,229,227 | ||||
Series 2024-1, Class A2A, 5.75%, 02/18/2028 | 2,705,000 | 2,713,576 | ||||
Series 2024-1, Class A3, 5.43%, 01/18/2029 | 12,000,000 | 12,166,261 | ||||
11 |
Par | Value | |||||
ASSET-BACKED SECURITIES - (Continued) | ||||||
CarMax Auto Owner Trust | ||||||
Series 2022-3, Class D, 6.20%, 01/16/2029 | $6,250,000 | $6,359,075 | ||||
Series 2023-1, Class A2A, 5.23%, 01/15/2026 | 314,683 | 314,614 | ||||
Series 2023-2, Class A2A, 5.50%, 06/15/2026 | 5,603,675 | 5,604,994 | ||||
Series 2023-3, Class A2A, 5.72%, 11/16/2026 | 4,453,780 | 4,459,597 | ||||
Series 2024-1, Class A2A, 5.30%, 03/15/2027 | 7,777,709 | 7,782,550 | ||||
Series 2024-1, Class B, 5.17%, 08/15/2029 | 4,400,000 | 4,475,814 | ||||
Series 2024-2, Class A3, 5.50%, 01/16/2029 | 13,000,000 | 13,275,920 | ||||
CNH Equipment Trust | ||||||
Series 2023-A, Class A2, 5.34%, 09/15/2026 | 4,367,850 | 4,368,948 | ||||
Series 2023-B, Class A3, 5.60%, 02/15/2029 | 5,000,000 | 5,103,217 | ||||
Series 2024-A, Class A2, 5.19%, 07/15/2027 | 8,025,000 | 8,027,424 | ||||
CPS Auto Trust | ||||||
Series 2021-D, Class E, 4.06%, 12/15/2028(b) | 5,000,000 | 4,851,210 | ||||
Series 2023-A, Class C, 5.54%, 04/16/2029(b) | 2,500,000 | 2,506,110 | ||||
Series 2024-C, Class B, 5.68%, 12/15/2028(b) | 3,920,000 | 3,965,336 | ||||
DT Auto Owner Trust, Series 2020-2A, Class D, 4.73%, 03/16/2026(b) | 527,293 | 527,012 | ||||
Enterprise Fleet Financing, Series 2024-1, Class A2, 5.23%, 03/20/2030(b) | 7,000,000 | 7,045,240 | ||||
Enterprise Fleet Financing LLC | ||||||
Series 2024-3, Class A2, 5.31%, 04/20/2027(b) | 3,250,000 | 3,273,847 | ||||
Series 2024-3, Class A3, 4.98%, 08/21/2028(b) | 3,000,000 | 3,041,855 | ||||
Exeter Automobile Receivables Trust | ||||||
Series 2020-2A, Class E, 7.19%, 09/15/2027(b) | 9,948,822 | 10,011,606 | ||||
Series 2021-2A, Class D, 1.40%, 04/15/2027 | 1,234,981 | 1,196,287 | ||||
Series 2021-2A, Class E, 2.90%, 07/17/2028(b) | 1,500,000 | 1,448,248 | ||||
Series 2021-3A, Class E, 3.04%, 12/15/2028(b) | 5,000,000 | 4,766,578 | ||||
Series 2022-2A, Class D, 4.56%, 07/17/2028 | 2,860,000 | 2,832,462 | ||||
Series 2022-4A, Class B, 4.57%, 01/15/2027 | 745,738 | 745,353 | ||||
Series 2022-4A, Class C, 4.92%, 12/15/2028 | 4,000,000 | 3,989,022 | ||||
Par | Value | |||||
Series 2022-5A, Class B, 5.97%, 03/15/2027 | $2,801,597 | $2,802,356 | ||||
Series 2022-5A, Class C, 6.51%, 12/15/2027 | 5,060,000 | 5,090,587 | ||||
Series 2022-6A, Class B, 6.03%, 08/16/2027 | 7,639,532 | 7,648,149 | ||||
Series 2022-6A, Class C, 6.32%, 05/15/2028 | 5,202,000 | 5,250,017 | ||||
Series 2023-1A, Class D, 6.69%, 06/15/2029 | 2,960,000 | 3,027,264 | ||||
Series 2023-2A, Class A3, 5.60%, 08/17/2026 | 1,896,187 | 1,896,045 | ||||
Series 2023-2A, Class B, 5.61%, 09/15/2027 | 5,623,000 | 5,638,771 | ||||
Series 2023-3A, Class A3, 6.04%, 07/15/2026 | 3,005,332 | 3,005,815 | ||||
Series 2023-4A, Class B, 6.31%, 10/15/2027 | 7,945,000 | 7,994,327 | ||||
Series 2023-4A, Class C, 6.51%, 08/15/2028 | 5,000,000 | 5,089,571 | ||||
Series 2023-5A, Class B, 6.58%, 04/17/2028 | 5,330,000 | 5,419,142 | ||||
Series 2024-1A, Class A3, 5.31%, 08/16/2027 | 8,612,000 | 8,623,514 | ||||
Series 2024-1A, Class B, 5.29%, 08/15/2028 | 7,000,000 | 7,026,935 | ||||
Series 2024-2A, Class C, 5.74%, 05/15/2029 | 5,000,000 | 5,076,601 | ||||
Series 2024-3A, Class A3, 5.65%, 12/15/2027 | 4,000,000 | 4,034,498 | ||||
Series 2024-3A, Class C, 5.70%, 07/16/2029 | 3,250,000 | 3,308,765 | ||||
Series 2024-4A, Class A3, 5.28%, 08/15/2030 | 4,300,000 | 4,323,142 | ||||
Series 2024-4A, Class B, 5.29%, 08/15/2030 | 1,800,000 | 1,812,127 | ||||
Series 2024-4A, Class C, 5.48%, 08/15/2030 | 1,200,000 | 1,213,127 | ||||
First Investors Auto Owner Trust | ||||||
Series 2021-1A, Class C, 1.17%, 03/15/2027(b) | 942,341 | 932,027 | ||||
Series 2022-1A, Class C, 3.13%, 05/15/2028(b) | 5,000,000 | 4,876,670 | ||||
Flagship Credit Auto Trust | ||||||
Series 2020-2, Class D, 5.75%, 04/15/2026(b) | 2,077,577 | 2,078,827 | ||||
Series 2022-3, Class A3, 4.55%, 04/15/2027(b) | 5,637,565 | 5,620,184 | ||||
Series 2023-1, Class A2, 5.38%, 12/15/2026(b) | 1,270,807 | 1,270,158 | ||||
Series 2023-2, Class A2, 5.76%, 04/15/2027(b) | 4,518,715 | 4,521,749 | ||||
Ford Credit Auto Owner Trust | ||||||
Series 2023-B, Class A2A, 5.57%, 06/15/2026 | 6,198,657 | 6,202,407 | ||||
Series 2023-B, Class A3, 5.23%, 05/15/2028 | 7,120,000 | 7,187,995 | ||||
12 |
Par | Value | |||||
ASSET-BACKED SECURITIES - (Continued) | ||||||
GLS Auto Receivables Trust | ||||||
Series 2020-3A, Class E, 4.31%, 07/15/2027(b) | $4,765,000 | $4,736,585 | ||||
Series 2020-4A, Class E, 3.51%, 10/15/2027(b) | 7,500,000 | 7,392,091 | ||||
Series 2021-1A, Class E, 3.14%, 01/18/2028(b) | 3,250,000 | 3,170,519 | ||||
Series 2021-2A, Class E, 2.87%, 05/15/2028(b) | 5,410,000 | 5,174,672 | ||||
Series 2021-3A, Class E, 3.20%, 10/16/2028(b) | 5,700,000 | 5,423,001 | ||||
Series 2021-4A, Class C, 1.94%, 10/15/2027(b) | 6,151,980 | 6,076,294 | ||||
Series 2021-4A, Class E, 4.43%, 10/16/2028(b) | 5,000,000 | 4,817,252 | ||||
Series 2022-2A, Class B, 4.70%, 09/15/2026(b) | 2,212,102 | 2,209,629 | ||||
Series 2022-3A, Class B, 4.92%, 01/15/2027(b) | 2,312,372 | 2,308,451 | ||||
Series 2023-1A, Class B, 6.19%, 06/15/2027(b) | 1,901,000 | 1,904,954 | ||||
Series 2023-1A, Class C, 6.38%, 12/15/2028(b) | 7,172,000 | 7,249,351 | ||||
Series 2023-2A, Class A2, 5.70%, 01/15/2027(b) | 1,990,550 | 1,991,430 | ||||
Series 2023-2A, Class B, 5.52%, 11/15/2027(b) | 7,800,000 | 7,820,596 | ||||
Series 2023-2A, Class C, 5.69%, 03/15/2029(b) | 7,893,000 | 7,917,333 | ||||
Series 2023-3A, Class C, 6.01%, 05/15/2029(b) | 5,000,000 | 5,067,996 | ||||
Series 2023-4A, Class A3, 6.42%, 06/15/2027(b) | 2,075,000 | 2,097,211 | ||||
Series 2023-4A, Class B, 6.57%, 03/15/2028(b) | 10,000,000 | 10,175,270 | ||||
Series 2024-1A, Class A3, 5.40%, 09/15/2027(b) | 8,500,000 | 8,534,712 | ||||
Series 2024-1A, Class B, 5.49%, 07/17/2028(b) | 10,000,000 | 10,094,618 | ||||
Series 2024-1A, Class C, 5.64%, 12/17/2029(b) | 3,500,000 | 3,548,244 | ||||
Series 2024-2A, Class A3, 5.64%, 01/18/2028(b) | 10,000,000 | 10,099,871 | ||||
Series 2024-2A, Class B, 5.77%, 11/15/2028(b) | 10,000,000 | 10,150,531 | ||||
Series 2024-2A, Class C, 6.03%, 02/15/2030(b) | 3,250,000 | 3,325,699 | ||||
Series 2024-3A, Class A3, 5.02%, 04/17/2028(b) | 8,000,000 | 8,015,478 | ||||
Series 2024-3A, Class B, 5.08%, 01/16/2029(b) | 7,137,000 | 7,157,363 | ||||
Series 2024-3A, Class C, 5.21%, 02/18/2031(b) | 3,500,000 | 3,511,157 | ||||
Par | Value | |||||
GM Financial Consumer Automobile Receivables Trust | ||||||
Series 2023-2, Class A2A, 5.10%, 05/18/2026 | $2,438,329 | $2,436,869 | ||||
Series 2023-3, Class A2A, 5.74%, 09/16/2026 | 4,384,404 | 4,390,490 | ||||
Series 2024-2, Class A3, 5.10%, 03/16/2029 | 6,000,000 | 6,085,651 | ||||
Honda Auto Receivables Owner Trust | ||||||
Series 2023-2, Class A2, 5.41%, 04/15/2026 | 4,959,573 | 4,960,252 | ||||
Series 2023-2, Class A3, 4.93%, 11/15/2027 | 7,662,000 | 7,687,678 | ||||
Series 2023-3, Class A3, 5.41%, 02/18/2028 | 12,586,000 | 12,708,522 | ||||
Series 2024-1, Class A2, 5.36%, 09/15/2026 | 15,000,000 | 15,018,579 | ||||
Series 2024-1, Class A3, 5.21%, 08/15/2028 | 8,500,000 | 8,607,649 | ||||
John Deere Owner Trust | ||||||
Series 2023-B, Class A2, 5.59%, 06/15/2026 | 4,896,352 | 4,899,779 | ||||
Series 2023-C, Class A3, 5.48%, 05/15/2028 | 5,000,000 | 5,068,570 | ||||
NextGear Floorplan Master Trust, Series 2024-1A, Class A2, 5.12%, 03/15/2029(b) | 10,000,000 | 10,158,604 | ||||
Santander Consumer USA Holdings, Inc. | ||||||
Series 2024-4, Class A3, 4.85%, 01/16/2029 | 13,500,000 | 13,522,505 | ||||
Series 2024-4, Class C, 4.95%, 04/15/2030 | 6,500,000 | 6,514,361 | ||||
Santander Drive Auto Receivables Trust | ||||||
Series 2022-2, Class B, 3.44%, 09/15/2027 | 7,495,774 | 7,432,788 | ||||
Series 2022-2, Class C, 3.76%, 07/16/2029 | 5,075,000 | 4,990,310 | ||||
Series 2022-4, Class A3, 4.14%, 02/16/2027 | 1,402,077 | 1,399,595 | ||||
Series 2022-5, Class C, 4.74%, 10/16/2028 | 8,000,000 | 7,970,969 | ||||
Series 2022-6, Class A3, 4.49%, 11/16/2026 | 931,777 | 930,972 | ||||
Series 2022-6, Class B, 4.72%, 06/15/2027 | 14,955,000 | 14,908,059 | ||||
Series 2022-7, Class A3, 5.75%, 04/15/2027 | 3,705,223 | 3,707,926 | ||||
Series 2022-7, Class B, 5.95%, 01/17/2028 | 10,000,000 | 10,075,624 | ||||
Series 2022-7, Class C, 6.69%, 03/17/2031 | 9,695,000 | 9,981,417 | ||||
Series 2023-1, Class B, 4.98%, 02/15/2028 | 19,386,000 | 19,362,493 | ||||
13 |
Par | Value | |||||
ASSET-BACKED SECURITIES - (Continued) | ||||||
Series 2023-1, Class C, 5.09%, 05/15/2030 | $10,000,000 | $10,047,042 | ||||
Series 2023-2, Class A3, 5.21%, 07/15/2027 | 9,223,689 | 9,218,227 | ||||
Series 2023-2, Class B, 5.24%, 05/15/2028 | 1,360,000 | 1,363,056 | ||||
Series 2023-2, Class C, 5.47%, 12/16/2030 | 5,000,000 | 5,080,315 | ||||
Series 2023-3, Class A3, 5.61%, 10/15/2027 | 6,003,000 | 6,017,974 | ||||
Series 2023-4, Class A3, 5.73%, 04/17/2028 | 14,300,000 | 14,418,305 | ||||
Series 2023-4, Class B, 5.77%, 12/15/2028 | 4,379,000 | 4,452,139 | ||||
Series 2023-5, Class B, 6.16%, 12/17/2029 | 4,500,000 | 4,615,215 | ||||
Series 2023-6, Class A3, 5.93%, 07/17/2028 | 4,280,000 | 4,342,360 | ||||
Series 2023-6, Class C, 6.40%, 03/17/2031 | 5,000,000 | 5,235,211 | ||||
Series 2024-1, Class A3, 5.35%, 02/15/2028 | 7,250,000 | 7,279,770 | ||||
Series 2024-1, Class A3, 5.25%, 04/17/2028 | 15,000,000 | 15,068,598 | ||||
Series 2024-1, Class B, 5.31%, 01/16/2029 | 7,320,000 | 7,385,022 | ||||
Series 2024-1, Class C, 5.45%, 03/15/2030 | 1,000,000 | 1,011,412 | ||||
Series 2024-2, Class A3, 5.63%, 11/15/2028 | 12,300,000 | 12,475,876 | ||||
Series 2024-2, Class B, 5.78%, 07/16/2029 | 10,000,000 | 10,254,926 | ||||
Series 2024-3, Class A3, 5.63%, 01/16/2029 | 7,000,000 | 7,102,729 | ||||
Series 2024-3, Class B, 5.55%, 09/17/2029 | 8,600,000 | 8,765,730 | ||||
Series 2024-3, Class C, 5.64%, 08/15/2030 | 3,500,000 | 3,580,445 | ||||
SBNA Auto Receivables Trust, Series 2024-A, Class A3, 5.32%, 12/15/2028(b) | 6,285,000 | 6,327,500 | ||||
Toyota Auto Receivables Owner Trust | ||||||
Series 2022-C, Class A3, 3.76%, 04/15/2027 | 7,472,660 | 7,414,036 | ||||
Series 2023-A, Class A2, 5.05%, 01/15/2026 | 934,983 | 934,571 | ||||
Series 2023-C, Class A2A, 5.60%, 08/17/2026 | 5,176,891 | 5,183,072 | ||||
Series 2023-C, Class A3, 5.16%, 04/17/2028 | 5,124,000 | 5,166,996 | ||||
Westlake Automobile Receivables Trust | ||||||
Series 2021-1A, Class E, 2.33%, 08/17/2026(b) | 8,370,000 | 8,210,765 | ||||
Par | Value | |||||
Series 2021-2A, Class D, 1.23%, 12/15/2026(b) | $8,385,000 | $8,209,207 | ||||
Series 2021-2A, Class E, 2.38%, 03/15/2027(b) | 2,225,000 | 2,161,396 | ||||
Series 2021-3A, Class E, 3.42%, 04/15/2027(b) | 10,030,000 | 9,818,373 | ||||
Series 2022-1A, Class C, 3.11%, 03/15/2027(b) | 4,716,107 | 4,684,016 | ||||
Series 2022-2A, Class A3, 3.75%, 04/15/2026(b) | 63,441 | 63,399 | ||||
Series 2022-2A, Class B, 4.31%, 09/15/2027(b) | 8,825,000 | 8,802,857 | ||||
Series 2022-2A, Class D, 5.48%, 09/15/2027(b) | 10,385,000 | 10,409,010 | ||||
Series 2022-3A, Class B, 5.99%, 12/15/2027(b) | 10,000,000 | 10,026,639 | ||||
Series 2022-3A, Class C, 6.44%, 12/15/2027(b) | 5,160,000 | 5,214,955 | ||||
Series 2023-1A, Class A3, 5.21%, 01/18/2028(b) | 11,000,000 | 10,991,103 | ||||
Series 2023-1A, Class B, 5.41%, 01/18/2028(b) | 3,750,000 | 3,757,697 | ||||
Series 2023-1A, Class C, 5.74%, 08/15/2028(b) | 6,275,000 | 6,323,999 | ||||
Series 2023-2A, Class A3, 5.80%, 02/16/2027(b) | 10,000,000 | 10,028,669 | ||||
Series 2023-2A, Class B, 6.14%, 03/15/2028(b) | 5,690,000 | 5,740,983 | ||||
Series 2023-2A, Class C, 6.29%, 03/15/2028(b) | 8,760,000 | 8,872,854 | ||||
Series 2023-3A, Class A3, 5.82%, 05/17/2027(b) | 6,655,000 | 6,702,910 | ||||
Series 2023-3A, Class B, 5.92%, 09/15/2028(b) | 2,818,000 | 2,852,310 | ||||
Series 2023-3A, Class C, 6.02%, 09/15/2028(b) | 6,350,000 | 6,451,871 | ||||
Series 2023-4A, Class C, 6.64%, 11/15/2028(b) | 8,060,000 | 8,279,811 | ||||
Series 2024-1A, Class A3, 5.44%, 05/17/2027(b) | 7,250,000 | 7,297,505 | ||||
Series 2024-1A, Class B, 5.55%, 11/15/2027(b) | 10,000,000 | 10,066,502 | ||||
Series 2024-1A, Class C, 5.65%, 02/15/2029(b) | 6,330,000 | 6,396,092 | ||||
Series 2024-2A, Class A3, 5.56%, 02/15/2028(b) | 10,000,000 | 10,096,482 | ||||
Series 2024-2A, Class B, 5.62%, 03/15/2030(b) | 7,000,000 | 7,089,356 | ||||
Series 2024-2A, Class C, 5.68%, 03/15/2030(b) | 5,000,000 | 5,077,903 | ||||
World Omni Auto Receivables Trust | ||||||
Series 2023-A, Class A2A, 5.18%, 07/15/2026 | 1,603,702 | 1,603,135 | ||||
Series 2023-B, Class A2A, 5.25%, 11/16/2026 | 3,308,544 | 3,307,674 | ||||
14 |
Par | Value | |||||
ASSET-BACKED SECURITIES - (Continued) | ||||||
World Omni Select Auto Trust | ||||||
Series 2024-A, Class A2A, 5.37%, 02/15/2028 | $3,000,000 | $3,012,014 | ||||
Series 2024-A, Class A3, 4.98%, 02/15/2030 | 2,000,000 | 2,019,908 | ||||
TOTAL ASSET-BACKED SECURITIES (Cost $1,056,951,746) | 1,065,395,535 | |||||
NON-AGENCY COMMERCIAL MORTGAGE BACKED SECURITIES - 13.1% | ||||||
Arbor Multifamily Mortgage Securities Trust | ||||||
Series 2022-MF4, Class B, 3.39%, 02/15/2055(b)(e) | 7,852,000 | 6,786,331 | ||||
Series 2022-MF4, Class XD, 1.39%, 02/15/2055(b)(e)(g) | 19,700,000 | 1,536,157 | ||||
BANK | ||||||
Series 2017-BN4, Class A3, 3.36%, 05/15/2050 | 9,946,550 | 9,640,706 | ||||
Series 2017-BN5, Class A4, 3.13%, 06/15/2060 | 12,685,000 | 12,160,947 | ||||
Series 2017-BN8, Class A3, 3.23%, 11/15/2050 | 4,782,688 | 4,553,538 | ||||
Series 2018-BN10, Class D, 2.60%, 02/15/2061(b) | 2,000,000 | 1,622,781 | ||||
Series 2019-BN16, Class XA, 1.10%, 02/15/2052(e)(g) | 75,109,503 | 2,403,399 | ||||
Series 2019-BN17, Class XB, 0.71%, 04/15/2052(e)(g) | 123,653,000 | 2,954,256 | ||||
Series 2019-BN17, Class XD, 1.74%, 04/15/2052(b)(e)(g) | 11,541,000 | 708,577 | ||||
Series 2019-BN19, Class A2, 2.93%, 08/15/2061 | 2,000,000 | 1,825,567 | ||||
Series 2019-BN21, Class ASB, 2.81%, 10/17/2052 | 6,582,000 | 6,267,377 | ||||
Series 2019-BN21, Class XD, 1.23%, 10/17/2052(b)(e)(g) | 18,699,333 | 894,008 | ||||
Series 2019-BN23, Class C, 3.62%, 12/15/2052(e) | 8,713,000 | 7,344,762 | ||||
Series 2019-BN23, Class XB, 0.26%, 12/15/2052(e)(g) | 238,421,000 | 2,223,633 | ||||
Series 2019-BN24, Class ASB, 2.93%, 11/15/2062 | 3,250,000 | 3,114,514 | ||||
Series 2019-BN24, Class XB, 0.30%, 11/15/2062(e)(g) | 174,693,000 | 1,877,059 | ||||
Series 2020-BN25, Class B, 3.04%, 01/15/2063(e) | 2,574,500 | 2,217,497 | ||||
Series 2020-BN25, Class XA, 0.99%, 01/15/2063(e)(g) | 157,574,103 | 5,765,022 | ||||
Series 2020-BN26, Class A2, 2.04%, 03/15/2063 | 5,161,575 | 4,735,587 | ||||
Series 2020-BN26, Class XB, 0.71%, 03/15/2063(e)(g) | 226,593,000 | 6,730,379 | ||||
Series 2020-BN28, Class B, 2.34%, 03/15/2063 | 1,938,000 | 1,604,941 | ||||
Par | Value | |||||
Series 2020-BN28, Class XB, 1.09%, 03/15/2063(e)(g) | $29,969,467 | $1,526,726 | ||||
Series 2020-BN29, Class B, 2.42%, 11/15/2053 | 2,625,000 | 2,111,732 | ||||
Series 2020-BN29, Class C, 3.14%, 11/15/2053(e) | 1,170,000 | 926,324 | ||||
Series 2020-BN29, Class D, 2.50%, 11/15/2053(b) | 1,250,000 | 899,420 | ||||
Series 2020-BN29, Class XB, 0.73%, 11/15/2053(e)(g) | 132,417,000 | 4,571,406 | ||||
Series 2020-BN30, Class B, 2.45%, 12/15/2053(e) | 1,090,000 | 883,810 | ||||
Series 2020-BN30, Class C, 2.76%, 12/15/2053(e) | 5,450,000 | 4,251,822 | ||||
Series 2020-BN30, Class D, 2.50%, 12/15/2053(b)(e) | 9,150,000 | 6,601,448 | ||||
Series 2021-BN31, Class ASB, 1.74%, 02/15/2054 | 7,704,000 | 7,007,183 | ||||
Series 2021-BN32, Class C, 3.37%, 04/15/2054(e) | 800,000 | 651,788 | ||||
Series 2021-BN32, Class D, 2.50%, 04/15/2054(b) | 5,000,000 | 3,723,591 | ||||
Series 2021-BN34, Class AS, 2.57%, 06/15/2063 | 1,500,000 | 1,226,542 | ||||
Series 2021-BN34, Class B, 2.75%, 06/15/2063(e) | 8,000,000 | 6,371,430 | ||||
Series 2021-BN34, Class XA, 1.08%, 06/15/2063(e)(g) | 95,472,124 | 4,467,694 | ||||
Series 2021-BN35, Class B, 2.53%, 06/15/2064 | 2,365,000 | 1,944,330 | ||||
Series 2021-BN35, Class C, 2.90%, 06/15/2064(e) | 8,755,000 | 6,859,384 | ||||
Series 2021-BN35, Class XA, 1.14%, 06/15/2064(e)(g) | 105,598,014 | 5,346,153 | ||||
Series 2021-BN38, Class XA, 0.92%, 12/15/2064(e)(g) | 40,143,643 | 1,849,602 | ||||
Series 2022-BN40, Class D, 2.50%, 03/15/2064(b) | 3,955,000 | 2,759,297 | ||||
Series 2023-BN45, Class XD, 2.49%, 02/15/2056(b)(e)(g) | 22,611,000 | 3,402,397 | ||||
Series 2024-BNK47, Class XA, 1.04%, 06/15/2057(e)(g) | 65,135,285 | 4,009,181 | ||||
Series 2024-BNK47, Class XB, 0.61%, 06/15/2057(e)(g) | 220,695,000 | 7,340,272 | ||||
BANK5 | ||||||
Series 2023-5YR3, Class A2, 6.26%, 09/15/2056 | 9,995,908 | 10,512,872 | ||||
Series 2023-5YR3, Class B, 7.56%, 09/15/2056(e) | 2,000,000 | 2,130,486 | ||||
Series 2023-5YR4, Class AS, 7.27%, 12/15/2056(e) | 7,500,000 | 8,026,305 | ||||
Series 2024-5YR6, Class XA, 0.98%, 05/15/2057(b)(e)(g) | 112,690,361 | 3,447,063 | ||||
Series 2024-5YR7, Class AS, 6.49%, 06/15/2057(e) | 7,000,000 | 7,321,666 | ||||
Series 2024-5YR7, Class XA, 1.57%, 06/15/2057(e)(g) | 142,420,811 | 7,830,738 | ||||
15 |
Par | Value | |||||
NON-AGENCY COMMERCIAL MORTGAGE BACKED SECURITIES - (Continued) | ||||||
Series 2024-5YR8, Class B, 6.91%, 08/15/2057(e) | $7,000,000 | $7,343,041 | ||||
Series 2024-5YR8, Class C, 7.00%, 08/15/2057(e) | 6,000,000 | 6,054,871 | ||||
Series 2024-5YR9, Class AS, 6.18%, 08/15/2057(e) | 8,200,000 | 8,479,303 | ||||
Barclays Commercial Mortgage Trust, Series 2019-C3, Class ASB, 3.46%, 05/15/2052 | 1,969,258 | 1,923,608 | ||||
BBCMS Trust | ||||||
Series 2020-C6, Class XA, 1.15%, 02/15/2053(e)(g) | 92,009,198 | 3,887,407 | ||||
Series 2020-C6, Class XB, 0.79%, 02/15/2053(e)(g) | 59,000,000 | 2,044,120 | ||||
Series 2020-C7, Class XA, 1.72%, 04/15/2053(e)(g) | 21,705,665 | 1,194,667 | ||||
Series 2020-C7, Class XB, 1.10%, 04/15/2053(e)(g) | 17,140,000 | 852,089 | ||||
Series 2021-C10, Class XA, 1.40%, 07/15/2054(e)(g) | 73,464,103 | 4,429,290 | ||||
Series 2021-C10, Class XB, 1.14%, 07/15/2054(e)(g) | 74,931,500 | 4,340,077 | ||||
Series 2021-C11, Class XB, 1.08%, 09/15/2054(e)(g) | 29,540,000 | 1,715,208 | ||||
Series 2021-C12, Class B, 2.76%, 11/15/2054 | 9,000,000 | 7,196,348 | ||||
Series 2021-C12, Class XA, 1.06%, 11/15/2054(e)(g) | 101,096,218 | 4,807,813 | ||||
Series 2021-C12, Class XB, 0.71%, 11/15/2054(e)(g) | 59,992,000 | 2,295,318 | ||||
Series 2021-C9, Class AS, 2.53%, 02/15/2054 | 8,500,000 | 7,259,518 | ||||
Series 2021-C9, Class ASB, 1.96%, 02/15/2054 | 10,000,000 | 9,169,240 | ||||
Series 2021-C9, Class XB, 1.11%, 02/15/2054(e)(g) | 68,467,000 | 3,698,765 | ||||
Series 2022-C14, Class XA, 0.83%, 02/15/2055(e)(g) | 98,039,413 | 3,690,753 | ||||
Series 2022-C14, Class XB, 0.37%, 02/15/2055(e)(g) | 166,823,000 | 3,643,164 | ||||
Series 2022-C15, Class XD, 1.46%, 04/15/2055(b)(e)(g) | 25,000,000 | 2,185,305 | ||||
Series 2022-C17, Class XA, 1.32%, 09/15/2055(e)(g) | 65,037,797 | 4,788,460 | ||||
Series 2022-C17, Class XB, 0.66%, 09/15/2055(e)(g) | 52,655,000 | 2,144,628 | ||||
Series 2023-C19, Class A2B, 5.75%, 04/15/2056 | 10,000,000 | 10,188,518 | ||||
Series 2023-C21, Class A2, 6.51%, 09/15/2056(e) | 10,130,000 | 10,669,765 | ||||
Series 2024-5C27, Class XA, 1.04%, 07/15/2057(b)(e)(g) | 58,995,994 | 2,025,492 | ||||
Series 2024-C24, Class XA, 1.86%, 02/15/2057(e)(g) | 63,456,106 | 6,754,230 | ||||
Par | Value | |||||
Series 2024-C24, Class XB, 1.57%, 02/15/2057(e)(g) | $32,630,000 | $3,178,635 | ||||
Series 2024-C26, Class XA, 1.24%, 05/15/2057(e)(g) | 111,953,318 | 8,735,964 | ||||
Series 2024-C28, Class AS, 5.84%, 09/15/2057 | 5,000,000 | 5,201,151 | ||||
Series 2024-C28, Class XA, 1.33%, 09/15/2057(e)(g) | 36,500,000 | 3,022,131 | ||||
Series 2024-C28, Class XB, 0.82%, 09/15/2057(b)(e)(g) | 154,907,000 | 8,117,204 | ||||
Benchmark Mortgage Trust | ||||||
Series 2019-B12, Class XB, 0.58%, 08/15/2052(b)(e)(g) | 93,260,000 | 1,659,142 | ||||
Series 2019-B13, Class XB, 0.53%, 08/15/2057(b)(e)(g) | 82,774,000 | 1,462,799 | ||||
Series 2019-B13, Class XD, 1.63%, 08/15/2057(b)(e)(g) | 12,071,000 | 751,050 | ||||
Series 2019-B9, Class XA, 1.18%, 03/15/2052(e)(g) | 28,337,167 | 1,048,158 | ||||
Series 2019-B9, Class XD, 2.16%, 03/15/2052(b)(e)(g) | 11,513,000 | 835,567 | ||||
Series 2020-B16, Class XA, 1.04%, 02/15/2053(e)(g) | 118,539,636 | 4,592,972 | ||||
Series 2020-B16, Class XB, 0.30%, 02/15/2053(b)(e)(g) | 70,467,000 | 835,992 | ||||
Series 2020-B20, Class XB, 0.70%, 10/15/2053(e)(g) | 79,394,000 | 2,228,590 | ||||
Series 2020-B21, Class AAB, 1.80%, 12/17/2053 | 5,966,000 | 5,473,991 | ||||
Series 2021-B23, Class AAB, 1.77%, 02/15/2054 | 5,000,000 | 4,506,440 | ||||
Series 2021-B23, Class XA, 1.37%, 02/15/2054(e)(g) | 66,055,203 | 3,679,433 | ||||
Series 2021-B23, Class XB, 1.01%, 02/15/2054(b)(e)(g) | 105,441,000 | 5,310,473 | ||||
Series 2021-B24, Class ASB, 2.26%, 03/15/2054 | 6,400,000 | 5,852,957 | ||||
Series 2021-B24, Class XA, 1.26%, 03/15/2054(e)(g) | 66,302,520 | 3,264,192 | ||||
Series 2021-B24, Class XB, 0.71%, 03/15/2054(e)(g) | 99,123,000 | 3,452,464 | ||||
Series 2021-B25, Class XA, 1.20%, 04/15/2054(e)(g) | 78,553,672 | 4,117,516 | ||||
Series 2021-B25, Class XB, 0.78%, 04/15/2054(e)(g) | 93,350,000 | 3,607,109 | ||||
Series 2021-B26, Class B, 2.69%, 06/15/2054(e) | 6,000,000 | 4,761,511 | ||||
Series 2021-B26, Class C, 2.99%, 06/15/2054(e) | 1,650,000 | 1,191,462 | ||||
Series 2021-B26, Class D, 2.00%, 06/15/2054(b) | 2,250,000 | 1,441,389 | ||||
Series 2021-B26, Class XD, 1.48%, 06/15/2054(b)(e)(g) | 10,836,000 | 839,975 | ||||
Series 2021-B27, Class B, 2.36%, 07/15/2054 | 6,000,000 | 4,545,865 | ||||
Series 2021-B27, Class C, 2.70%, 07/15/2054 | 2,000,000 | 1,399,046 | ||||
16 |
Par | Value | |||||
NON-AGENCY COMMERCIAL MORTGAGE BACKED SECURITIES - (Continued) | ||||||
Series 2021-B27, Class D, 2.00%, 07/15/2054(b) | $5,000,000 | $2,995,486 | ||||
Series 2021-B27, Class XA, 1.37%, 07/15/2054(e)(g) | 51,638,874 | 2,917,994 | ||||
Series 2021-B27, Class XD, 1.60%, 07/15/2054(b)(e)(g) | 28,014,000 | 2,390,471 | ||||
Series 2021-B28, Class XA, 1.38%, 08/15/2054(e)(g) | 98,817,852 | 6,032,415 | ||||
Series 2021-B28, Class XB, 1.07%, 08/15/2054(e)(g) | 32,491,000 | 1,855,538 | ||||
Series 2021-B29, Class C, 2.75%, 09/15/2054(e) | 5,300,000 | 4,186,261 | ||||
Series 2021-B29, Class D, 2.00%, 09/15/2054(b) | 1,000,000 | 666,098 | ||||
Series 2021-B29, Class E, 2.00%, 09/15/2054(b) | 6,000,000 | 3,710,471 | ||||
Series 2021-B29, Class XD, 1.41%, 09/15/2054(b)(e)(g) | 27,615,000 | 2,038,335 | ||||
Series 2021-B30, Class C, 2.99%, 11/15/2054(e) | 8,181,000 | 6,016,267 | ||||
Series 2021-B30, Class E, 2.00%, 11/15/2054(b) | 2,250,000 | 1,245,543 | ||||
Series 2021-B30, Class XB, 0.59%, 11/15/2054(b)(e)(g) | 83,683,000 | 2,852,285 | ||||
Series 2021-B30, Class XD, 1.41%, 11/15/2054(b)(e)(g) | 18,582,000 | 1,392,485 | ||||
Series 2021-B31, Class XA, 0.88%, 12/15/2054(e)(g) | 142,785,719 | 5,920,553 | ||||
Series 2021-B31, Class XB, 0.54%, 12/15/2054(b)(e)(g) | 124,409,000 | 3,599,899 | ||||
Series 2021-B31, Class XD, 1.26%, 12/15/2054(b)(e)(g) | 31,991,000 | 2,247,956 | ||||
Series 2022-B32, Class AS, 3.53%, 01/15/2055(e) | 10,000,000 | 8,561,523 | ||||
Series 2022-B32, Class XD, 1.64%, 01/15/2055(b)(e)(g) | 39,202,000 | 3,369,083 | ||||
Series 2022-B33, Class XD, 1.73%, 03/15/2055(b)(e)(g) | 21,919,000 | 2,084,617 | ||||
Series 2023-B38, Class A2, 5.63%, 04/15/2056 | 12,000,000 | 12,111,622 | ||||
Series 2024-V5, Class AM, 6.42%, 01/10/2057(e) | 5,900,000 | 6,155,843 | ||||
Series 2024-V6, Class XA, 1.58%, 10/15/2028(e)(g) | 117,539,521 | 6,081,695 | ||||
Series 2024-V8, Class AM, 6.86%, 07/15/2057(e) | 5,000,000 | 5,297,559 | ||||
Series 2024-V9, Class AS, 6.06%, 08/15/2057(e) | 3,500,000 | 3,610,278 | ||||
BMO Mortgage Trust | ||||||
Series 2022-C1, Class C, 3.62%, 02/17/2055(e) | 2,000,000 | 1,647,416 | ||||
Series 2022-C1, Class XD, 1.89%, 02/17/2055(b)(e)(g) | 30,550,000 | 3,276,594 | ||||
Series 2023-C5, Class A2, 6.52%, 06/15/2056 | 10,000,000 | 10,396,062 | ||||
Par | Value | |||||
Series 2023-C7, Class XA, 1.04%, 12/15/2056(b)(e)(g) | $100,343,190 | $5,487,388 | ||||
Series 2024-5C3, Class AS, 6.29%, 02/15/2057(e) | 5,750,000 | 5,963,857 | ||||
Series 2024-5C3, Class XA, 1.35%, 02/15/2057(e)(g) | 101,189,000 | 4,263,922 | ||||
Series 2024-C9, Class XA, 1.08%, 07/15/2057(e)(g) | 50,007,587 | 3,440,372 | ||||
Series 2024-C9, Class XB, 0.55%, 07/15/2057(e)(g) | 181,757,000 | 6,369,020 | ||||
California Housing Finance Agency | ||||||
Series 2021-1, Class X, 0.80%, 11/20/2035(g) | 27,496,173 | 1,310,743 | ||||
Series 2021-3, Class X, 0.77%, 08/20/2036(g) | 25,171,214 | 1,265,105 | ||||
Cantor Commercial Real Estate Lending LP, Series 2019-CF2, Class XB, 0.75%, 11/15/2052(e)(g) | 134,736,000 | 3,667,447 | ||||
CCUBS Commercial Mortgage Trust, Series 2017-C1, Class XB, 0.42%, 11/15/2050(e)(g) | 40,062,667 | 372,058 | ||||
Citigroup Commercial Mortgage Trust | ||||||
Series 2016-C1, Class B, 4.12%, 05/10/2049 | 3,000,000 | 2,891,679 | ||||
Series 2016-C1, Class C, 5.10%, 05/10/2049(e) | 8,348,000 | 8,023,165 | ||||
Series 2016-C2, Class B, 3.18%, 08/10/2049 | 2,483,500 | 2,329,908 | ||||
Series 2016-P6, Class B, 4.30%, 12/10/2049(e) | 6,835,000 | 6,035,785 | ||||
Series 2017-B1, Class XB, 0.29%, 08/15/2050(e)(g) | 38,016,000 | 204,142 | ||||
Series 2017-C4, Class XA, 1.13%, 10/12/2050(e)(g) | 30,473,850 | 738,866 | ||||
Series 2017-C4, Class XB, 0.35%, 10/12/2050(e)(g) | 42,746,500 | 337,501 | ||||
Series 2017-P7, Class XB, 0.73%, 04/14/2050(e)(g) | 45,124,000 | 606,588 | ||||
Series 2017-P8, Class B, 4.19%, 09/15/2050 | 4,160,000 | 3,833,535 | ||||
Series 2018-B2, Class XB, 0.53%, 03/10/2051(e)(g) | 49,202,000 | 633,441 | ||||
Series 2018-C5, Class XB, 0.49%, 06/10/2051(b)(e)(g) | 28,400,000 | 360,728 | ||||
Series 2018-C6, Class AAB, 4.34%, 11/10/2051 | 4,205,167 | 4,152,099 | ||||
Series 2019-C7, Class B, 3.67%, 12/15/2072(e) | 10,000,000 | 8,940,954 | ||||
Series 2019-C7, Class XA, 0.98%, 12/15/2072(e)(g) | 74,878,110 | 2,646,889 | ||||
Series 2019-C7, Class XB, 0.41%, 12/15/2072(b)(e)(g) | 50,711,000 | 708,874 | ||||
Series 2019-C7, Class XD, 1.33%, 12/15/2072(b)(e)(g) | 39,933,000 | 2,200,959 | ||||
17 |
Par | Value | |||||
NON-AGENCY COMMERCIAL MORTGAGE BACKED SECURITIES - (Continued) | ||||||
Series 2019-GC41, Class AS, 3.02%, 08/10/2056 | $10,339,000 | $9,143,253 | ||||
Series 2019-GC41, Class XA, 1.16%, 08/10/2056(e)(g) | 49,173,779 | 1,813,244 | ||||
Series 2020-GC46, Class XA, 1.09%, 02/15/2053(e)(g) | 88,438,934 | 3,574,374 | ||||
Series 2020-GC46, Class XB, 0.44%, 02/15/2053(b)(e)(g) | 92,457,000 | 1,668,081 | ||||
Citigroup/Deutsche Bank Commercial Mortgage Trust | ||||||
Series 2017-CD3, Class XB, 0.70%, 02/10/2050(e)(g) | 61,857,000 | 871,305 | ||||
Series 2018-CD7, Class ASB, 4.21%, 08/15/2051 | 2,562,000 | 2,534,383 | ||||
Commercial Mortgage Pass Through Certificates | ||||||
Series 2019-GC44, Class XD, 1.14%, 08/15/2057(b)(e)(g) | 19,460,000 | 914,624 | ||||
Series 2024-277P, Class A, 6.34%, 08/10/2044(b) | 8,000,000 | 8,376,382 | ||||
Computershare Corporate Trust | ||||||
Series 2016-C37, Class D, 3.31%, 12/15/2049(b)(e) | 9,625,000 | 8,578,201 | ||||
Series 2017-C40, Class B, 4.38%, 10/15/2050(e) | 2,000,000 | 1,847,405 | ||||
Series 2017-C40, Class C, 4.44%, 10/15/2050(e) | 1,670,000 | 1,486,697 | ||||
Series 2018-C48, Class B, 4.90%, 01/15/2052(e) | 5,000,000 | 4,729,920 | ||||
Series 2019-C49, Class D, 3.00%, 03/15/2052(b) | 3,250,000 | 2,644,442 | ||||
Series 2019-C53, Class C, 3.58%, 10/15/2052(e) | 3,275,000 | 2,778,654 | ||||
Series 2024-C63, Class XA, 1.21%, 08/15/2057(e)(g) | 65,445,552 | 5,066,173 | ||||
Series 2024-C63, Class XB, 0.59%, 08/15/2057(e)(g) | 147,039,000 | 5,283,052 | ||||
CSAIL Commercial Mortgage Trust | ||||||
Series 2015-C1, Class XD, 0.50%, 04/15/2050(b)(e)(g) | 62,192,000 | 103,382 | ||||
Series 2016-C5, Class XD, 1.00%, 11/15/2048(b)(e)(g) | 46,821,000 | 414,843 | ||||
Series 2017-C8, Class XB, 0.43%, 06/15/2050(e)(g) | 74,773,000 | 640,962 | ||||
Series 2019-C17, Class XA, 1.46%, 09/15/2052(e)(g) | 78,926,298 | 4,024,476 | ||||
Series 2019-C18, Class C, 4.05%, 12/15/2052(e) | 3,987,000 | 3,471,189 | ||||
Series 2019-C18, Class XA, 1.13%, 12/15/2052(e)(g) | 94,228,469 | 3,574,246 | ||||
GS Mortgage Securities Corp. II | ||||||
Series 2012-BWTR, Class A, 2.95%, 11/05/2034(b) | 443,337 | 367,364 | ||||
Par | Value | |||||
Series 2012-BWTR, Class B, 3.26%, 11/05/2034(b) | $6,608,000 | $3,654,247 | ||||
Series 2015-GC32, Class B, 4.54%, 07/10/2048(e) | 6,453,000 | 6,275,515 | ||||
Series 2015-GC34, Class A3, 3.24%, 10/10/2048 | 8,905,503 | 8,736,808 | ||||
Series 2016-GS3, Class B, 3.40%, 10/10/2049(e) | 10,417,000 | 9,657,064 | ||||
Series 2017-GS8, Class XB, 0.51%, 11/10/2050(e)(g) | 44,642,000 | 505,106 | ||||
Series 2018-GS10, Class XD, 1.55%, 07/10/2051(b)(e)(g) | 24,049,000 | 1,265,341 | ||||
Series 2019-GC38, Class XD, 2.06%, 02/10/2052(b)(e)(g) | 20,916,000 | 1,505,335 | ||||
Series 2019-GC39, Class XB, 0.78%, 05/10/2052(e)(g) | 69,588,000 | 1,862,140 | ||||
Series 2019-GC39, Class XD, 1.76%, 05/10/2052(b)(e)(g) | 24,645,000 | 1,589,627 | ||||
Series 2019-GSA1, Class XA, 0.93%, 11/10/2052(e)(g) | 69,732,907 | 2,367,300 | ||||
Series 2020-GC45, Class AAB, 2.84%, 02/13/2053 | 12,881,000 | 12,275,237 | ||||
Series 2020-GSA2, Class XB, 1.05%, 12/12/2053(b)(e)(g) | 73,324,000 | 3,724,925 | ||||
JP Morgan Chase Commercial Mortgage Securities Trust | ||||||
Series 2007-CB20, Class X1, 0.00%, 02/12/2051(b)(e)(g) | 107,062 | 0 | ||||
Series 2017-JP6, Class XB, 0.70%, 07/15/2050(e)(g) | 68,830,000 | 1,100,124 | ||||
JPMBB Commercial Mortgage Securities Trust | ||||||
Series 2015-C30, Class B, 4.37%, 07/15/2048(e) | 3,585,000 | 2,893,937 | ||||
Series 2015-C32, Class XD, 0.50%, 11/15/2048(b)(e)(g) | 23,066,000 | 92,949 | ||||
JPMDB Commercial Mortgage Securities Trust, Series 2016-C4, Class B, 3.64%, 12/15/2049(e) | 5,500,000 | 4,946,262 | ||||
Mcp Holding Co. LLC, Series 2015-GC30, Class B, 4.16%, 05/10/2050(e) | 2,960,000 | 2,807,618 | ||||
Morgan Stanley ABS Capital I, Inc., Series 2021-L7, Class XB, 0.52%, 10/15/2054(e)(g) | 143,080,000 | 3,876,123 | ||||
Morgan Stanley Bank of America Merrill Lynch Trust | ||||||
Series 2015-C23, Class B, 4.28%, 07/15/2050(e) | 3,845,000 | 3,726,166 | ||||
Series 2015-C27, Class B, 4.64%, 12/15/2047(e) | 3,000,000 | 2,911,643 | ||||
Series 2016-C31, Class XD, 1.40%, 11/15/2049(b)(e)(g) | 21,212,500 | 481,573 | ||||
Series 2017-C34, Class B, 4.11%, 11/15/2052(e) | 5,224,000 | 4,717,182 | ||||
18 |
Par | Value | |||||
NON-AGENCY COMMERCIAL MORTGAGE BACKED SECURITIES - (Continued) | ||||||
Series 2017-C34, Class D, 2.70%, 11/15/2052(b) | $4,953,000 | $2,978,866 | ||||
Morgan Stanley Capital I Trust | ||||||
Series 2016-BN2, Class XB, 0.65%, 11/15/2049(e)(g) | 58,680,000 | 589,435 | ||||
Series 2017-H1, Class B, 4.08%, 06/15/2050 | 1,270,000 | 1,188,713 | ||||
Series 2017-H1, Class C, 4.28%, 06/15/2050(e) | 7,959,000 | 7,267,098 | ||||
Series 2017-H1, Class XD, 2.30%, 06/15/2050(b)(e)(g) | 8,725,000 | 443,107 | ||||
Series 2017-HR2, Class A3, 3.33%, 12/15/2050 | 11,639,332 | 11,131,381 | ||||
Series 2017-HR2, Class C, 4.46%, 12/15/2050(e) | 10,576,000 | 9,716,439 | ||||
Series 2018-H3, Class ASB, 4.12%, 07/15/2051 | 4,922,276 | 4,863,615 | ||||
Series 2018-H3, Class XB, 0.52%, 07/15/2051(e)(g) | 135,712,000 | 1,764,514 | ||||
Series 2018-H3, Class XD, 2.01%, 07/15/2051(b)(e)(g) | 15,363,500 | 927,571 | ||||
Series 2019-H7, Class C, 4.13%, 07/15/2052 | 9,593,000 | 8,600,758 | ||||
Series 2019-H7, Class D, 3.00%, 07/15/2052(b) | 2,402,000 | 1,871,387 | ||||
Series 2019-H7, Class XB, 0.79%, 07/15/2052(e)(g) | 130,723,000 | 3,692,846 | ||||
Series 2019-L2, Class XB, 0.79%, 03/15/2052(e)(g) | 127,093,000 | 3,213,953 | ||||
Series 2021-L5, Class B, 3.10%, 05/15/2054 | 6,627,000 | 5,638,202 | ||||
Series 2021-L5, Class D, 2.50%, 05/15/2054(b) | 3,500,000 | 2,478,079 | ||||
Series 2021-L5, Class XB, 0.84%, 05/15/2054(e)(g) | 70,387,500 | 2,994,742 | ||||
Series 2021-L6, Class B, 2.95%, 06/15/2054(e) | 7,500,000 | 6,108,941 | ||||
MSWF Commercial Mortgage Trust, Series 2023-2, Class XA, 1.14%, 12/15/2056(e)(g) | 16,846,331 | 1,084,159 | ||||
New Hampshire Business Finance Authority, Series 2023-2, Class X, 0.81%, 01/20/2038(e)(g) | 33,000,000 | 1,853,280 | ||||
UBS Commercial Mortgage Trust | ||||||
Series 2017-C1, Class XB, 1.08%, 06/15/2050(e)(g) | 13,000,000 | 285,314 | ||||
Series 2017-C6, Class XB, 0.62%, 12/15/2050(e)(g) | 63,420,500 | 1,057,239 | ||||
Series 2017-C7, Class XB, 0.48%, 12/15/2050(e)(g) | 170,396,000 | 2,043,883 | ||||
Series 2018-C12, Class XA, 1.02%, 08/15/2051(e)(g) | 40,434,535 | 1,118,160 | ||||
Series 2018-C12, Class XB, 0.40%, 08/15/2051(e)(g) | 139,858,000 | 1,720,757 | ||||
Par | Value | |||||
Series 2018-C13, Class ASB, 4.24%, 10/15/2051 | $2,754,416 | $2,714,172 | ||||
Series 2018-C13, Class XB, 0.40%, 10/15/2051(e)(g) | 128,678,000 | 1,781,264 | ||||
Series 2018-C13, Class XD, 2.18%, 10/15/2051(b)(e)(g) | 16,442,000 | 1,201,848 | ||||
Series 2018-C14, Class XB, 0.38%, 12/15/2051(e)(g) | 114,392,000 | 1,471,973 | ||||
Series 2018-C8, Class A3, 3.72%, 02/15/2051 | 2,000,458 | 1,938,742 | ||||
Series 2019-C17, Class XB, 0.99%, 10/15/2052(e)(g) | 128,213,000 | 4,862,888 | ||||
Series 2019-C18, Class AS, 3.38%, 12/15/2052(e) | 9,000,000 | 7,901,324 | ||||
Series 2019-C18, Class ASB, 2.99%, 12/15/2052 | 4,500,000 | 4,324,632 | ||||
UBS-Barclays Commercial Mortgage Trust | ||||||
Series 2019-C3, Class XB, 0.92%, 05/15/2052(e)(g) | 56,340,000 | 1,843,777 | ||||
Series 2019-C4, Class XB, 1.26%, 08/15/2052(e)(g) | 43,170,000 | 2,068,111 | ||||
Series 2019-C5, Class XB, 0.47%, 11/15/2052(e)(g) | 174,774,000 | 2,571,834 | ||||
Series 2019-C5, Class XD, 1.45%, 11/15/2052(b)(e)(g) | 12,996,000 | 743,660 | ||||
Washington State Housing Finance Commission, Series 2021-1, Class X, 0.73%, 12/20/2035(e)(g) | 20,216,392 | 879,009 | ||||
Wells Fargo Commercial Mortgage Trust | ||||||
Series 2015-C28, Class C, 4.22%, 05/15/2048(e) | 11,105,000 | 10,130,102 | ||||
Series 2015-C28, Class D, 4.22%, 05/15/2048(e) | 4,376,000 | 3,551,551 | ||||
Series 2015-C30, Class B, 4.40%, 09/15/2058(e) | 5,800,000 | 5,611,659 | ||||
Series 2015-NXS1, Class B, 3.66%, 05/15/2048(e) | 1,320,000 | 1,278,280 | ||||
Series 2016-C37, Class C, 4.61%, 12/15/2049(e) | 11,213,000 | 10,551,000 | ||||
Series 2016-LC24, Class XB, 1.12%, 10/15/2049(e)(g) | 66,264,075 | 1,175,028 | ||||
Series 2017-C42, Class XB, 0.46%, 12/15/2050(e)(g) | 116,750,000 | 1,256,463 | ||||
Series 2017-RB1, Class XB, 0.88%, 03/15/2050(e)(g) | 69,254,209 | 1,110,934 | ||||
Series 2018-C43, Class C, 4.51%, 03/15/2051(e) | 4,033,000 | 3,708,261 | ||||
Series 2018-C45, Class B, 4.56%, 06/16/2051 | 3,317,000 | 3,172,342 | ||||
Series 2018-C45, Class C, 4.73%, 06/15/2051 | 4,004,000 | 3,727,730 | ||||
Series 2018-C47, Class AS, 4.67%, 09/15/2061(e) | 8,000,000 | 7,836,670 | ||||
19 |
Par | Value | |||||
NON-AGENCY COMMERCIAL MORTGAGE BACKED SECURITIES - (Continued) | ||||||
Series 2018-C47, Class XB, 0.27%, 09/15/2061(e)(g) | $164,144,000 | $1,148,433 | ||||
Series 2018-C48, Class ASB, 4.25%, 01/15/2052 | 6,012,117 | 5,941,575 | ||||
Series 2018-C48, Class XB, 0.37%, 01/15/2052(e)(g) | 138,642,000 | 1,653,334 | ||||
Series 2019-C49, Class ASB, 3.93%, 03/15/2052 | 4,507,001 | 4,444,630 | ||||
Series 2019-C49, Class B, 4.55%, 03/15/2052 | 8,947,000 | 8,569,582 | ||||
Series 2019-C49, Class XB, 0.77%, 03/15/2052(e)(g) | 125,812,000 | 3,174,413 | ||||
Series 2019-C50, Class XB, 1.03%, 05/15/2052(e)(g) | 36,427,311 | 1,313,725 | ||||
Series 2019-C51, Class XB, 0.77%, 06/15/2052(e)(g) | 130,394,000 | 3,589,421 | ||||
Series 2019-C52, Class C, 3.56%, 08/15/2052 | 6,206,000 | 5,117,560 | ||||
Series 2019-C52, Class XA, 1.71%, 08/15/2052(e)(g) | 52,050,827 | 3,074,663 | ||||
Series 2019-C52, Class XB, 1.22%, 08/15/2052(e)(g) | 113,763,146 | 5,302,068 | ||||
Series 2019-C53, Class B, 3.51%, 10/15/2052(e) | 5,200,000 | 4,596,123 | ||||
Series 2019-C53, Class XB, 0.58%, 10/15/2052(e)(g) | 105,325,000 | 2,460,308 | ||||
Series 2020-C55, Class XB, 0.94%, 02/15/2053(e)(g) | 58,030,370 | 2,185,511 | ||||
Series 2020-C56, Class ASB, 2.42%, 06/15/2053 | 2,250,000 | 2,113,698 | ||||
Series 2020-C56, Class XB, 0.37%, 06/15/2053(e)(g) | 127,035,000 | 1,852,704 | ||||
Series 2020-C57, Class ASB, 1.91%, 08/15/2053 | 7,250,000 | 6,696,310 | ||||
Series 2020-C57, Class C, 4.16%, 08/15/2053(e) | 5,500,000 | 5,023,756 | ||||
Series 2020-C57, Class D, 2.50%, 08/15/2053(b) | 3,254,077 | 2,484,311 | ||||
Series 2020-C57, Class XA, 2.19%, 08/15/2053(e)(g) | 21,998,643 | 1,984,124 | ||||
Series 2020-C57, Class XB, 0.81%, 08/15/2053(e)(g) | 74,972,000 | 2,824,465 | ||||
Series 2020-C58, Class XB, 1.24%, 07/15/2053(e)(g) | 109,974,000 | 6,381,549 | ||||
Series 2021-C59, Class C, 3.28%, 04/15/2054 | 7,648,000 | 5,804,254 | ||||
Series 2021-C59, Class XB, 1.04%, 04/15/2054(e)(g) | 65,782,000 | 3,316,880 | ||||
Series 2021-C59, Class XD, 1.58%, 04/15/2054(b)(e)(g) | 40,274,000 | 3,125,057 | ||||
Series 2021-C60, Class B, 2.73%, 08/15/2054 | 7,114,678 | 5,878,205 | ||||
Series 2021-C60, Class C, 2.74%, 08/15/2054 | 4,475,000 | 3,560,805 | ||||
Par | Value | |||||
Series 2021-C60, Class XA, 1.62%, 08/15/2054(e)(g) | $40,289,116 | $2,865,612 | ||||
Series 2021-C60, Class XB, 1.21%, 08/15/2054(e)(g) | 40,551,000 | 2,534,154 | ||||
Series 2021-C61, Class B, 3.11%, 11/15/2054 | 6,221,000 | 5,226,494 | ||||
Series 2021-C61, Class XD, 1.53%, 11/15/2054(b)(e)(g) | 9,132,000 | 759,412 | ||||
TOTAL NON-AGENCY COMMERCIAL MORTGAGE BACKED SECURITIES (Cost $1,163,082,002) | 1,054,234,953 | |||||
U.S. TREASURY SECURITIES - 11.4% | ||||||
United States Treasury Notes/Bonds | ||||||
4.25%, 11/15/2040 | 30,000,000 | 30,501,562 | ||||
3.38%, 08/15/2042 | 30,000,000 | 26,603,906 | ||||
4.00%, 11/15/2042 | 10,000,000 | 9,668,359 | ||||
3.88%, 05/15/2043 | 100,000,000 | 94,628,906 | ||||
4.38%, 08/15/2043 | 250,000,000 | 252,998,048 | ||||
4.75%, 11/15/2043 | 225,000,000 | 239,027,344 | ||||
4.50%, 02/15/2044 | 124,750,000 | 128,161,133 | ||||
4.63%, 05/15/2044 | 60,000,000 | 62,625,000 | ||||
3.13%, 08/15/2044 | 60,000,000 | 50,402,344 | ||||
United States Treasury Strip Principal, 0.00%, 02/15/2044(a) | 50,000,000 | 21,597,597 | ||||
TOTAL U.S. TREASURY SECURITIES (Cost $871,230,020) | 916,214,199 | |||||
COLLATERALIZED LOAN OBLIGATIONS - 6.1% | ||||||
Allegany Park CLO Ltd., Series 2019-1A, Class DR, 8.38% (3 mo. Term SOFR + 3.10%), 01/20/2035(b) | 4,000,000 | 3,988,628 | ||||
Anchorage Capital CLO Ltd., Series 2018-10A, Class BR, 7.00% (3 mo. Term SOFR + 1.70%), 10/15/2031(b) | 7,500,000 | 7,500,000 | ||||
Annisa CLO Ltd., Series 2016-2A, Class BRR, 6.78% (3 mo. Term SOFR + 1.50%), 07/20/2031(b) | 13,925,000 | 13,923,983 | ||||
Apidos CLO | ||||||
Series 2013-12A, Class BRR, 6.75% (3 mo. Term SOFR + 1.45%), 04/15/2031(b) | 6,200,000 | 6,205,499 | ||||
Series 2013-12A, Class CRR, 7.10% (3 mo. Term SOFR + 1.80%), 04/15/2031(b) | 5,000,000 | 4,999,595 | ||||
Series 2013-12A, Class ER, 10.96% (3 mo. Term SOFR + 5.66%), 04/15/2031(b) | 6,150,000 | 6,130,074 | ||||
20 |
Par | Value | |||||
COLLATERALIZED LOAN OBLIGATIONS - (Continued) | ||||||
Series 2013-15A, Class CRR, 7.39% (3 mo. Term SOFR + 2.11%), 04/20/2031(b) | $5,500,000 | $5,500,561 | ||||
Series 2013-15A, Class DRR, 8.24% (3 mo. Term SOFR + 2.96%), 04/20/2031(b) | 5,000,000 | 5,001,490 | ||||
Series 2015-22A, Class CR, 8.49% (3 mo. Term SOFR + 3.21%), 04/20/2031(b) | 2,000,000 | 2,003,240 | ||||
Series 2016-24A, Class DR, 11.34% (3 mo. Term SOFR + 6.06%), 10/20/2030(b) | 2,550,000 | 2,545,869 | ||||
Series 2016-25A, Class A2R2, 7.08% (3 mo. Term SOFR + 1.80%), 10/20/2031(b) | 2,750,000 | 2,755,879 | ||||
Series 2017-28A, Class A1B, 6.69% (3 mo. Term SOFR + 1.41%), 01/20/2031(b) | 12,000,000 | 12,011,616 | ||||
Series 2018-29A, Class B, 7.45% (3 mo. Term SOFR + 2.16%), 07/25/2030(b) | 7,600,000 | 7,600,988 | ||||
Series 2018-29A, Class C, 8.30% (3 mo. Term SOFR + 3.01%), 07/25/2030(b) | 6,250,000 | 6,197,131 | ||||
Series 2019-31A, Class ER, 12.16% (3 mo. Term SOFR + 6.86%), 04/15/2031(b) | 4,400,000 | 4,402,574 | ||||
Series 2019-32A, Class B1R, 6.78% (3 mo. Term SOFR + 1.50%), 01/20/2033(b) | 7,160,000 | 7,148,616 | ||||
Series 2023-45A, Class D, 10.48% (3 mo. Term SOFR + 5.20%), 04/26/2036(b) | 1,750,000 | 1,791,165 | ||||
Series 2023-46A, Class D, 10.28% (3 mo. Term SOFR + 5.00%), 10/24/2036(b) | 1,000,000 | 1,037,146 | ||||
Series XXXA, Class A2R, 6.70% (3 mo. Term SOFR + 1.50%), 10/18/2031(b) | 9,000,000 | 9,000,000 | ||||
Series XXXA, Class BR, 7.05% (3 mo. Term SOFR + 1.85%), 10/18/2031(b) | 7,680,000 | 7,680,000 | ||||
ARES CLO | ||||||
Series 2014-32RA, Class B, 7.18% (3 mo. Term SOFR + 2.06%), 05/15/2030(b) | 250,000 | 250,080 | ||||
Series 2015-38A, Class A2R, 6.64% (3 mo. Term SOFR + 1.36%), 04/20/2030(b) | 1,400,000 | 1,400,111 | ||||
Series 2015-38A, Class DR, 8.04% (3 mo. Term SOFR + 2.76%), 04/20/2030(b) | 7,450,000 | 7,452,242 | ||||
Series 2015-4A, Class A3RR, 6.70% (3 mo. Term SOFR + 1.40%), 10/15/2030(b) | 10,100,000 | 10,087,446 | ||||
Par | Value | |||||
Series 2015-4A, Class BRR, 7.05% (3 mo. Term SOFR + 1.75%), 10/15/2030(b) | $3,000,000 | $2,999,760 | ||||
Series 2018-47A, Class D, 8.26% (3 mo. Term SOFR + 2.96%), 04/15/2030(b) | 3,165,000 | 3,167,035 | ||||
Series 2018-48A, Class B, 7.12% (3 mo. Term SOFR + 1.84%), 07/20/2030(b) | 1,450,000 | 1,452,408 | ||||
Series 2018-48A, Class D, 8.24% (3 mo. Term SOFR + 2.96%), 07/20/2030(b) | 1,050,000 | 1,050,319 | ||||
Series 2022-66A, Class DR, 10.28% (3 mo. Term SOFR + 5.00%), 07/25/2036(b) | 1,400,000 | 1,443,112 | ||||
BCRED MML CLO, Series 2022-1A, Class C, 8.03% (3 mo. Term SOFR + 2.75%), 04/20/2035(b) | 2,000,000 | 2,007,116 | ||||
Blackstone, Inc. | ||||||
Series 2017-1A, Class C, 9.24% (3 mo. Term SOFR + 3.96%), 04/20/2029(b) | 3,850,000 | 3,857,723 | ||||
Series 2017-1A, Class C, 7.95% (3 mo. Term SOFR + 2.66%), 01/17/2030(b) | 7,650,000 | 7,657,367 | ||||
Series 2017-1A, Class D, 8.84% (3mo. Term SOFR + 3.56%), 01/20/2030(b) | 7,550,000 | 7,576,138 | ||||
Series 2017-1A, Class D2, 11.15% (3mo. Term SOFR + 5.86%), 01/17/2030(b) | 2,000,000 | 1,977,420 | ||||
Series 2017-1A, Class E, 11.24% (3mo. Term SOFR + 5.96%), 01/20/2030(b) | 1,150,000 | 1,152,435 | ||||
Series 2018-1A, Class B, 6.95% (3mo. Term SOFR + 1.66%), 04/17/2030(b) | 3,750,000 | 3,750,356 | ||||
Series 2018-1A, Class D, 8.15% (3mo. Term SOFR + 2.86%), 04/17/2030(b) | 1,600,000 | 1,597,126 | ||||
Series 2018-1A, Class E, 10.95% (3mo. Term SOFR + 5.66%), 04/17/2030(b) | 5,000,000 | 4,948,485 | ||||
BlueMountain CLO Ltd. | ||||||
Series 2014-2A, Class BR2, 7.29% (3mo. Term SOFR + 2.01%), 10/20/2030(b) | 7,330,000 | 7,332,126 | ||||
Series 2017-3A, Class A2, 6.71% (3mo. Term SOFR + 1.41%), 01/15/2030(b) | 1,120,000 | 1,117,301 | ||||
Series 2018-1A, Class B, 7.22% (3mo. Term SOFR + 1.96%), 07/30/2030(b) | 9,496,770 | 9,507,786 | ||||
Series 2018-3A, Class BR, 7.13% (3mo. Term SOFR + 1.85%), 10/25/2030(b) | 1,000,000 | 995,746 | ||||
21 |
Par | Value | |||||
COLLATERALIZED LOAN OBLIGATIONS - (Continued) | ||||||
Bristol Park CLO, Series 2016-1A, Class AR, 6.55% (3mo. Term SOFR + 1.25%), 04/15/2029(b) | $2,514,145 | $2,516,128 | ||||
Carlyle Group, Inc. | ||||||
Series 2014-1A, Class BR2, 6.95% (3mo. Term SOFR + 1.66%), 04/17/2031(b) | 2,500,000 | 2,504,010 | ||||
Series 2015-1A, Class BR3, 7.09% (3mo. Term SOFR + 1.81%), 07/20/2031(b) | 7,500,000 | 7,504,350 | ||||
Cedar Funding Ltd., Series 2018-7A, Class BR, 6.65% (3mo. Term SOFR + 1.55%), 01/20/2031(b) | 8,835,000 | 8,835,000 | ||||
Chenango Park CLO, Series 2018-1A, Class C, 8.56% (3mo. Term SOFR + 3.26%), 04/15/2030(b) | 1,000,000 | 998,547 | ||||
CIFC Funding Ltd. | ||||||
Series 2017-4A, Class A1R, 6.49% (3mo. Term SOFR + 1.21%), 10/24/2030(b) | 1,319,051 | 1,321,457 | ||||
Series 2018-1A, Class C, 7.29% (3mo. Term SOFR + 2.01%), 04/18/2031(b) | 3,750,000 | 3,748,695 | ||||
Fillmore Park CLO, Series 2018-1A, Class E, 10.96% (3mo. Term SOFR + 5.66%), 07/15/2030(b) | 1,000,000 | 1,000,582 | ||||
Galaxy CLO Ltd., Series 2018-26A, Class BR, 6.72% (3mo. Term SOFR + 1.60%), 11/22/2031(b) | 3,850,000 | 3,854,555 | ||||
Goldentree Loan Opportunities Ltd. | ||||||
Series 2019-4A, Class E, 10.29% (3mo. Term SOFR + 5.01%), 04/24/2031(b) | 8,000,000 | 8,003,760 | ||||
Series 2019-5A, Class DRR, 8.07% (3mo. Term SOFR + 2.80%), 10/20/2032(b) | 5,000,000 | 4,995,720 | ||||
Series 2019-5A, Class E, 10.39% (3mo. Term SOFR + 5.11%), 10/20/2032(b) | 7,500,000 | 7,493,033 | ||||
Series 2022-16A, Class DR, 10.03% (3mo. Term SOFR + 4.75%), 01/20/2034(b) | 3,500,000 | 3,534,916 | ||||
Series 2023-17A, Class D, 10.28% (3mo. Term SOFR + 5.00%), 07/20/2036(b) | 1,750,000 | 1,796,634 | ||||
Golub Capital BDC, Inc., Series 2021-1A, Class C1, 8.36% (3mo. Term SOFR + 3.06%), 04/15/2033(b) | 7,000,000 | 7,006,272 | ||||
Par | Value | |||||
Hartwick Park CLO Ltd., Series 2023-1A, Class D, 9.78% (3mo. Term SOFR + 4.50%), 01/21/2036(b) | $5,000,000 | $5,049,950 | ||||
Invesco CLO Ltd., Series 2024-1RA, Class BR, 7.40% (3mo. Term SOFR + 2.10%), 04/15/2037(b) | 8,000,000 | 8,062,016 | ||||
KKR CLO Trust | ||||||
Series 15, Class BR2, 6.77% (3mo. Term SOFR + 1.55%), 01/18/2032(b) | 3,350,000 | 3,349,900 | ||||
Series 20, Class BR, 0.00% (3mo. Term SOFR + 1.55%), 10/16/2030 | 15,000,000 | 15,000,000 | ||||
Series 23, Class BR, 0.00% (3mo. Term SOFR + 1.55%), 10/20/2031(b) | 10,000,000 | 10,000,000 | ||||
LCM LP | ||||||
Series 15A, Class DR, 9.24% (3mo. Term SOFR + 3.96%), 07/20/2030(b) | 9,000,000 | 9,022,077 | ||||
Series 16A, Class BR2, 7.31% (3mo. Term SOFR + 2.01%), 10/15/2031(b) | 4,000,000 | 4,011,060 | ||||
Series 16A, Class CR2, 7.71% (3mo. Term SOFR + 2.41%), 10/15/2031(b) | 5,100,000 | 5,100,474 | ||||
Series 17A, Class BRR, 7.16% (3mo. Term SOFR + 1.86%), 10/15/2031(b) | 1,650,000 | 1,649,944 | ||||
Series 17A, Class ER, 11.56% (3mo. Term SOFR + 6.26%), 10/15/2031(b) | 1,000,000 | 811,886 | ||||
Series 22A, Class CR, 8.34% (3mo. Term SOFR + 3.06%), 10/20/2028(b) | 1,895,000 | 1,898,032 | ||||
Series 26A, Class D, 8.04% (3mo. Term SOFR + 2.76%), 01/20/2031(b) | 1,000,000 | 962,130 | ||||
Series 27A, Class C, 7.50% (3mo. Term SOFR + 2.21%), 07/16/2031(b) | 2,700,000 | 2,701,720 | ||||
Series 27A, Class D, 8.50% (3mo. Term SOFR + 3.21%), 07/16/2031(b) | 4,000,000 | 3,848,888 | ||||
Series 29A, Class BR, 7.16% (3mo. Term SOFR + 1.86%), 04/15/2031(b) | 4,750,000 | 4,745,126 | ||||
Series 34A, Class E, 12.08% (3mo. Term SOFR + 6.80%), 10/20/2034(b) | 3,250,000 | 2,917,431 | ||||
Series 35A, Class E, 12.17% (3mo. Term SOFR + 6.87%), 10/15/2034(b) | 4,750,000 | 4,067,458 | ||||
Series 36A, Class E, 12.27% (3mo. Term SOFR + 6.97%), 01/15/2034(b) | 6,000,000 | 5,151,774 | ||||
22 |
Par | Value | |||||
COLLATERALIZED LOAN OBLIGATIONS - (Continued) | ||||||
LCM XIII LP | ||||||
Series 14A, Class CR, 7.39% (3mo. Term SOFR + 2.11%), 07/20/2031(b) | $6,000,000 | $6,013,614 | ||||
Series 14A, Class ER, 11.04% (3mo. Term SOFR + 5.76%), 07/20/2031(b) | 1,000,000 | 757,888 | ||||
LCM XIV LP, Series 14A, Class BR, 7.12% (3mo. Term SOFR + 1.84%), 07/20/2031(b) | 10,800,000 | 10,811,837 | ||||
Madison Park Funding Ltd. | ||||||
Series 2016-24A, Class BR2, 6.83% (3mo. Term SOFR + 1.55%), 10/20/2029(b) | 11,000,000 | 11,014,971 | ||||
Series 2016-24A, Class CR2, 7.33% (3mo. Term SOFR + 2.05%), 10/20/2029(b) | 5,250,000 | 5,256,946 | ||||
Series 2018-28A, Class A2, 6.84% (3mo. Term SOFR + 1.54%), 07/15/2030(b) | 1,000,000 | 1,000,207 | ||||
Magnetite CLO Ltd. | ||||||
Series 2015-12A, Class ER, 11.24% (3mo. Term SOFR + 5.94%), 10/15/2031(b) | 8,923,000 | 8,947,770 | ||||
Series 2015-15A, Class DR, 8.30% (3mo. Term SOFR + 3.01%), 07/25/2031(b) | 2,000,000 | 2,000,594 | ||||
Series 2015-15A, Class ER, 10.75% (3mo. Term SOFR + 5.46%), 07/25/2031(b) | 4,000,000 | 4,008,184 | ||||
Series 2019-23A, Class ER, 11.85% (3mo. Term SOFR + 6.56%), 01/25/2035(b) | 2,750,000 | 2,759,355 | ||||
Series 2020-27A, Class ER, 11.54% (3mo. Term SOFR + 6.26%), 10/20/2034(b) | 5,250,000 | 5,267,692 | ||||
Series 2020-28A, Class ER, 11.69% (3mo. Term SOFR + 6.41%), 01/20/2035(b) | 2,250,000 | 2,223,623 | ||||
Series 2021-30A, Class E, 11.75% (3mo. Term SOFR + 6.46%), 10/25/2034(b) | 4,100,000 | 4,061,087 | ||||
Series 2023-34A, Class D, 10.48% (3mo. Term SOFR + 5.20%), 04/20/2036(b) | 2,950,000 | 3,001,752 | ||||
Series 2023-36A, Class E, 13.28% (3mo. Term SOFR + 8.00%), 04/22/2036(b) | 1,500,000 | 1,552,040 | ||||
Series 2023-39A, Class D, 9.43% (3mo. Term SOFR + 4.15%), 10/25/2033(b) | 2,000,000 | 2,007,088 | ||||
Myers Park CLO, Series 2018-1A, Class C, 7.59% (3mo. Term SOFR + 2.31%), 10/20/2030(b) | 1,240,000 | 1,240,138 | ||||
Par | Value | |||||
Neuberger Berman CLO Ltd., Series 2019-33A, Class DR, 8.45% (3mo. Term SOFR + 3.16%), 10/16/2033(b) | $2,000,000 | $1,988,150 | ||||
Niagara Park CLO, Series 2019-1A, Class ER, 11.50% (3mo. Term SOFR + 6.21%), 07/17/2032(b) | 2,000,000 | 2,004,746 | ||||
Octagon Investment Partners Ltd. | ||||||
Series 2013-1A, Class CR2, 7.25% (3mo. Term SOFR + 1.96%), 01/25/2031(b) | 1,500,000 | 1,500,897 | ||||
Series 2014-1A, Class BR3, 7.13% (3mo. Term SOFR + 2.01%), 02/14/2031(b) | 2,575,000 | 2,575,917 | ||||
Series 2016-1A, Class CR, 7.36% (3mo. Term SOFR + 2.06%), 07/15/2030(b) | 6,220,000 | 6,230,114 | ||||
Series 2017-1A, Class A1R, 6.54% (3mo. Term SOFR + 1.26%), 03/17/2030(b) | 2,293,166 | 2,294,367 | ||||
Series 2018-2A, Class B, 7.30% (3mo. Term SOFR + 2.01%), 07/25/2030(b) | 1,060,000 | 1,061,366 | ||||
Series 2018-3A, Class BR, 7.08% (3mo. Term SOFR + 1.80%), 10/20/2030(b) | 5,000,000 | 4,999,605 | ||||
Octagon Investment Partners XXII LLC | ||||||
Series 2014-1A, Class CRR, 7.44% (3mo. Term SOFR + 2.16%), 01/22/2030(b) | 3,970,000 | 3,975,796 | ||||
Series 2014-1A, Class DRR, 8.29% (3mo. Term SOFR + 3.01%), 01/22/2030(b) | 1,750,000 | 1,741,040 | ||||
OHA Credit Funding | ||||||
Series 2023-15A, Class C, 8.38% (3mo. Term SOFR + 3.10%), 04/20/2035(b) | 2,500,000 | 2,530,323 | ||||
Series 2023-15A, Class D, 10.28% (3mo. Term SOFR + 5.00%), 04/20/2035(b) | 1,000,000 | 1,021,731 | ||||
Symphony CLO Ltd., Series 2022-34A, Class DR, 10.53% (3mo. Term SOFR + 5.25%), 07/24/2036(b) | 1,000,000 | 1,029,498 | ||||
Voya CLO Ltd., Series 2016-3A, Class A3R2, 6.98% (3mo. Term SOFR + 1.70%), 10/18/2031(b) | 7,500,000 | 7,499,408 | ||||
Whetstone Park CLO Ltd., Series 2021-1A, Class B2, 2.79%, 01/20/2035(b) | 1,400,000 | 1,235,132 | ||||
Wind River CLO Ltd. | ||||||
Series 2018-2A, Class A2R, 6.60% (3mo. Term SOFR + 1.30%), 07/15/2030(b) | 5,000,000 | 4,999,650 | ||||
23 |
Par | Value | |||||
COLLATERALIZED LOAN OBLIGATIONS - (Continued) | ||||||
Series 2018-2A, Class BR, 6.90% (3mo. Term SOFR + 1.60%), 07/15/2030(b) | $10,000,000 | $9,984,810 | ||||
Zais CLO Ltd., Series 2018-11A, Class A2R, 6.68% (3mo. Term SOFR + 1.40%), 01/20/2032(b) | 5,000,000 | 4,999,650 | ||||
TOTAL COLLATERALIZED LOAN OBLIGATIONS (Cost $485,968,139) | 487,264,203 | |||||
NON-AGENCY RESIDENTIAL MORTGAGE BACKED SECURITIES - 5.6% | ||||||
Adjustable Rate Mortgage Trust | ||||||
Series 2005-10, Class 4A1, 6.33%, 01/25/2036(e) | 4,558,036 | 3,311,225 | ||||
Series 2005-3, Class 2A1, 4.81%, 07/25/2035(e) | 247,405 | 228,948 | ||||
Series 2006-2, Class 1A1, 4.79%, 05/25/2036(e) | 696,500 | 609,816 | ||||
American Home Mortgage Investment Trust, Series 2006-2, Class 3A5, 6.75%, 06/25/2036(h) | 2,747,648 | 405,969 | ||||
Banc of America Alternative Loan Trust | ||||||
Series 2005-11, Class 4A5, 5.75%, 12/25/2035 | 627,454 | 550,452 | ||||
Series 2005-11, Class 4A6, 5.75%, 12/25/2035 | 102,291 | 89,738 | ||||
Series 2006-2, Class 4CB1, 6.50%, 03/25/2036 | 2,203,093 | 1,829,153 | ||||
Series 2006-4, Class 3CB4, 6.00%, 05/25/2046 | 733,811 | 651,866 | ||||
Series 2006-4, Class 4CB1, 6.50%, 05/25/2046 | 416,085 | 378,514 | ||||
Series 2006-4, Class 5CB1, 6.50%, 05/25/2046 | 2,016,977 | 1,771,479 | ||||
Series 2006-5, Class CB17, 6.00%, 06/25/2046 | 224,171 | 193,318 | ||||
Series 2006-6, Class CB5, 6.00%, 07/25/2046 | 916,555 | 787,957 | ||||
Series 2006-9, Class 1CB1, 6.00%, 01/25/2037 | 151,131 | 133,225 | ||||
Series 2006-9, Class A2, 5.79% (1 mo. Term SOFR + 0.51%), 01/25/2037 | 749,286 | 559,209 | ||||
Banc of America Funding Corp. | ||||||
Series 2003-3, Class 1A7, 5.50%, 10/25/2033 | 136,129 | 133,303 | ||||
Series 2004-1, Class 2A1, 6.00%, 02/25/2034 | 427,888 | 439,781 | ||||
Series 2004-1, Class 4A1, 6.00%, 03/25/2034 | 2,598,094 | 2,693,834 | ||||
Series 2004-B, Class 4A2, 5.32%, 11/20/2034(e) | 1,327,602 | 1,250,123 | ||||
Par | Value | |||||
Series 2005-3, Class 1A20, 5.50%, 06/25/2035 | $55,457 | $50,607 | ||||
Series 2005-4, Class 2A1, 5.50%, 08/25/2035 | 30,954 | 29,475 | ||||
Series 2005-5, Class 1A11, 5.50%, 09/25/2035 | 140,916 | 140,364 | ||||
Series 2005-5, Class 2A1, 5.50%, 09/25/2035 | 1,360,194 | 1,349,547 | ||||
Series 2005-7, Class 2A3, 5.50%, 11/25/2035 | 2,423,023 | 2,267,971 | ||||
Series 2005-7, Class 3A15, 5.75%, 11/25/2035 | 2,851 | 2,881 | ||||
Series 2005-7, Class 3A9, 6.00%, 11/25/2035 | 14,180 | 14,184 | ||||
Series 2005-8, Class 4A28, 5.75%, 01/25/2036 | 1,749,526 | 1,587,963 | ||||
Series 2006-5, Class 3A2, 5.75%, 09/25/2036 | 242,294 | 220,335 | ||||
Series 2006-7, Class 1A9, 6.00%, 09/25/2036 | 389,353 | 330,156 | ||||
Series 2006-F, Class 2A1, 6.09%, 07/20/2036(e) | 4,705,851 | 4,083,023 | ||||
Series 2006-I, Class 1A1, 6.49%, 12/20/2036(e) | 445,773 | 438,837 | ||||
Series 2006-I, Class 2A1, 6.37%, 12/20/2036(e) | 1,831,608 | 1,804,062 | ||||
Series 2006-I, Class 2A2, 6.37%, 6/20/2036(e) | 318,600 | 299,996 | ||||
Series 2006-J, Class 4A1, 5.02%, 01/20/2047(e) | 94,697 | 81,692 | ||||
Series 2007-1, Class TA7, 6.69%, 01/25/2037(h) | 630,661 | 579,252 | ||||
Series 2007-2, Class TA1A, 5.45% (1 mo. Term SOFR + 0.17%), 03/25/2037 | 299,387 | 260,820 | ||||
Series 2007-3, Class TA4, 6.25% (1 mo. Term SOFR + 0.97%), 04/25/2037 | 794,194 | 646,642 | ||||
Series 2007-4, Class 5A3, 5.50%, 11/25/2034 | 164,064 | 142,314 | ||||
Series 2007-5, Class 1A1, 5.50%, 07/25/2037 | 1,235,219 | 995,904 | ||||
Series 2007-6, Class A1, 5.97% (1 mo. Term SOFR + 0.69%), 07/25/2037 | 873,468 | 824,801 | ||||
Series 2007-6, Class A2, 5.95% (1 mo. Term SOFR + 0.67%), 07/25/2037 | 3,605,114 | 3,400,651 | ||||
Series 2010-R3, Class 3A6, 6.00%, 09/26/2037(b)(e) | 6,051,942 | 5,944,901 | ||||
Series 2014-R3, Class 1A2, 6.33%, 06/26/2035(b)(e) | 1,249,467 | 1,247,366 | ||||
Series 2014-R3, Class 2A2, 6.66%, 06/26/2035(b)(e) | 1,843,875 | 1,775,973 | ||||
24 |
Par | Value | |||||
NON-AGENCY RESIDENTIAL MORTGAGE BACKED SECURITIES - (Continued) | ||||||
Banc of America Mortgage Securities, Inc. | ||||||
Series 2005-A, Class 2A1, 4.98%, 02/25/2035(e) | $1,032,587 | $1,003,126 | ||||
Series 2005-F, Class 2A1, 6.20%, 07/25/2035(e) | 548,826 | 514,110 | ||||
Series 2006-B, Class 3A1, 3.93%, 10/20/2046(e) | 356,289 | 306,555 | ||||
Series 2007-1, Class 1A26, 6.00%, 03/25/2037 | 1,463,002 | 1,235,947 | ||||
BCAP LLC Trust, Series 2007-AA2, Class 2A3, 7.50%, 04/25/2037(e) | 445,478 | 236,187 | ||||
Bear Stearns Alt-A Trust, Series 2006-6, Class 2A1, 4.50%, 11/25/2036(e) | 713,952 | 327,215 | ||||
Bear Stearns Asset Backed Securities Trust | ||||||
Series 2005-AC5, Class 1A1, 5.50% (1 mo. Term SOFR + 1.11%), 08/25/2035 | 403,474 | 246,807 | ||||
Series 2006-AC4, Class A1, 5.64% (1 mo. Term SOFR + 0.36%), 07/25/2036 | 2,632,986 | 1,979,007 | ||||
Series 2006-AC4, Class A2, 12.88% (-4 x 1 mo. Term SOFR + 35.75%), 07/25/2036(i) | 608,700 | 755,591 | ||||
Chase Mortgage Finance Corp. | ||||||
Series 2005-A1, Class 2A1, 4.87%, 12/25/2035(e) | 615,284 | 579,074 | ||||
Series 2005-A1, Class 2A2, 4.87%, 12/25/2035(e) | 641,459 | 603,709 | ||||
Series 2005-S2, Class A1, 5.50%, 10/25/2035 | 571,738 | 551,870 | ||||
Series 2005-S3, Class A9, 5.50%, 11/25/2035 | 4,793,697 | 3,488,083 | ||||
Series 2006-S3, Class 1A1, 6.00%, 11/25/2036 | 6,682,873 | 2,762,993 | ||||
Series 2006-S4, Class A3, 6.00%, 12/25/2036 | 1,226,693 | 538,333 | ||||
Series 2006-S4, Class A6, 6.00%, 12/25/2036 | 3,958,334 | 1,737,111 | ||||
Series 2007-A2, Class 6A2, 5.77%, 07/25/2037(e) | 749,777 | 638,723 | ||||
Series 2007-S1, Class A7, 6.00%, 02/25/2037 | 4,011,435 | 1,567,155 | ||||
Series 2007-S3, Class 1A10, 5.75%, 05/25/2037 | 668,665 | 282,065 | ||||
Series 2007-S3, Class 1A15, 6.00%, 05/25/2037 | 2,037,419 | 892,226 | ||||
Chaseflex Trust | ||||||
Series 2005-1, Class 1A3, 5.50%, 02/25/2035 | 226,944 | 199,189 | ||||
Par | Value | |||||
Series 2006-2, Class A3, 4.37%, 09/25/2036(e) | $1,898,184 | $1,716,147 | ||||
Citicorp Mortgage Securities, Inc. | ||||||
Series 2006-1, Class 1A4, 6.00%, 02/25/2036 | 71,572 | 64,700 | ||||
Series 2006-3, Class 1A10, 6.25%, 06/25/2036 | 1,350,992 | 1,243,257 | ||||
Series 2006-3, Class 1A4, 6.00%, 06/25/2036 | 1,122,080 | 1,016,761 | ||||
Series 2006-3, Class 1A9, 5.75%, 06/25/2036 | 319,915 | 285,371 | ||||
Series 2006-3, Class 2A1, 5.50%, 09/25/2024 | 34,296 | 29,617 | ||||
Series 2006-7, Class 1A1, 6.00%, 12/25/2036 | 2,570,730 | 2,090,370 | ||||
Series 2007-3, Class 1A4, 6.00%, 04/25/2037 | 376,838 | 353,671 | ||||
Series 2007-3, Class 3A1, 5.50%, 04/25/2037 | 32,727 | 31,915 | ||||
Citigroup Financial Products, Inc. | ||||||
Series 2004-2, Class 1A2, 9.25%, 08/25/2033(b) | 10,373 | 8,125 | ||||
Series 2004-HYB3, Class 2A, 6.45%, 09/25/2034(e) | 397,082 | 372,961 | ||||
Series 2005-1, Class 2A2A, 5.09%, 04/25/2035(e) | 268,943 | 252,764 | ||||
Series 2005-10, Class 1A1A, 5.00%, 12/25/2035(e) | 914,504 | 591,589 | ||||
Series 2005-2, Class 1A4, 4.73%, 05/25/2035(e) | 286,929 | 275,632 | ||||
Series 2005-5, Class 22A6, 6.00%, 08/25/2035 | 1,501,384 | 1,385,564 | ||||
Series 2005-WF1, Class M1, 5.83%, 11/25/2034(h) | 2,583,376 | 2,588,165 | ||||
Citigroup Mortgage Loan Trust, Inc. | ||||||
Series 2005-7, Class 1A2, 4.82%, 09/25/2035(e) | 331,928 | 292,369 | ||||
Series 2006-AR7, Class 2A2A, 5.09%, 11/25/2036(e) | 1,085,934 | 933,324 | ||||
Series 2007-AR4, Class 1A1A, 4.71%, 03/25/2037(e) | 883,225 | 738,258 | ||||
Citimortgage Alternative Loan Trust | ||||||
Series 2006-A2, Class A5, 5.99% (1 mo. Term SOFR + 0.71%), 05/25/2036 | 340,804 | 284,340 | ||||
Series 2006-A4, Class 1A1, 6.00%, 09/25/2036 | 872,639 | 799,015 | ||||
Series 2007-A1, Class 1A5, 6.00%, 01/25/2037 | 1,259,943 | 1,120,547 | ||||
Series 2007-A1, Class 1A7, 6.00%, 01/25/2037 | 2,024,836 | 1,800,813 | ||||
Countrywide Alternative Loan Trust | ||||||
Series 2004-13CB, Class A3, 6.00%, 07/25/2034 | 5,736,560 | 5,862,171 | ||||
25 |
Par | Value | |||||
NON-AGENCY RESIDENTIAL MORTGAGE BACKED SECURITIES - (Continued) | ||||||
Series 2004-24CB, Class 1A1, 6.00%, 11/25/2034 | $1,211,825 | $1,234,846 | ||||
Series 2004-27CB, Class A1, 6.00%, 12/25/2034 | 817,667 | 740,730 | ||||
Series 2004-28CB, Class 4A1, 5.00%, 01/25/2020(f) | 127,195 | 91,464 | ||||
Series 2004-28CB, Class 6A1, 6.00%, 01/25/2035 | 247,508 | 229,376 | ||||
Series 2005-13CB, Class A1, 5.50% (1 mo. Term SOFR + 0.61%), 05/25/2035 | 798,323 | 645,048 | ||||
Series 2005-21CB, Class A17, 6.00%, 06/25/2035 | 1,386,475 | 1,093,239 | ||||
Series 2005-21CB, Class A3, 5.25%, 06/25/2035 | 2,329,665 | 1,773,576 | ||||
Series 2005-43, Class 5A1, 5.77%, 09/25/2035(e) | 102,997 | 88,748 | ||||
Series 2005-54CB, Class 3A7, 5.50%, 11/25/2035 | 523,272 | 294,399 | ||||
Series 2005-63, Class 3A1, 4.62%, 11/25/2035(e) | 647,192 | 590,186 | ||||
Series 2005-65CB, Class 1A8, 5.50%, 01/25/2036 | 91,912 | 61,247 | ||||
Series 2005-65CB, Class 2A7, 0.00%, 12/25/2035(j) | 660,261 | 263,827 | ||||
Series 2005-6CB, Class 1A1, 7.50%, 04/25/2035 | 184,836 | 172,454 | ||||
Series 2005-6CB, Class 1A5, 5.75%, 04/25/2035 | 1,576,290 | 1,360,594 | ||||
Series 2005-73CB, Class 2A2, 5.75%, 01/25/2036 | 329,289 | 172,912 | ||||
Series 2005-75CB, Class A3, 5.50%, 01/25/2036 | 1,398,900 | 973,341 | ||||
Series 2005-75CB, Class A6, 5.50%, 01/25/2036 | 1,181,659 | 822,187 | ||||
Series 2005-80CB, Class 2A1, 6.00%, 02/25/2036 | 3,577,102 | 3,447,858 | ||||
Series 2005-80CB, Class 5A1, 6.00%, 02/25/2036 | 8,299,988 | 8,398,331 | ||||
Series 2005-86CB, Class A10, 5.50%, 02/25/2036 | 121,552 | 72,319 | ||||
Series 2005-86CB, Class A8, 5.50%, 02/25/2036 | 877,151 | 521,875 | ||||
Series 2005-9CB, Class 1A1, 5.50% (1 mo. Term SOFR + 0.61%), 05/25/2035 | 1,630,706 | 1,412,800 | ||||
Series 2005-9CB, Class 3A1, 6.00%, 05/25/2035 | 8,028,631 | 3,784,229 | ||||
Series 2005-J13, Class 2A7, 5.50%, 11/25/2035 | 636,580 | 446,215 | ||||
Series 2005-J6, Class 1A6, 5.50% (1 mo. Term SOFR + 0.61%), 07/25/2035 | 1,991,069 | 1,555,888 | ||||
Par | Value | |||||
Series 2006-12CB, Class A3, 5.75% (1 mo. Term SOFR + 5.75%), 05/25/2036 | $533,279 | $268,148 | ||||
Series 2006-14CB, Class A4, 6.00%, 06/25/2036 | 2,276,773 | 1,277,988 | ||||
Series 2006-16CB, Class A2, 6.00%, 06/25/2036 | 358,029 | 196,829 | ||||
Series 2006-16CB, Class A4, 6.00%, 06/25/2036 | 938,433 | 515,911 | ||||
Series 2006-16CB, Class A6, 6.00%, 06/25/2036 | 814,407 | 447,703 | ||||
Series 2006-23CB, Class 1A6, 6.00%, 08/25/2036 | 1,237,277 | 1,154,878 | ||||
Series 2006-23CB, Class 2A1, 6.50%, 08/25/2036 | 5,664,140 | 1,872,576 | ||||
Series 2006-24CB, Class A11, 5.75%, 08/25/2036 | 3,720,256 | 2,013,113 | ||||
Series 2006-24CB, Class A12, 5.75%, 08/25/2036 | 2,307,818 | 1,248,811 | ||||
Series 2006-26CB, Class A17, 6.25%, 09/25/2036 | 5,392,545 | 2,697,130 | ||||
Series 2006-30T1, Class 2A6, 6.50%, 11/25/2036 | 8,388,155 | 2,752,890 | ||||
Series 2006-31CB, Class A7, 6.00%, 11/25/2036 | 202,489 | 117,460 | ||||
Series 2006-31CB, Class A8, 5.75%, 11/25/2036 | 1,826,706 | 1,024,633 | ||||
Series 2006-39CB, Class 1A20, 6.00%, 01/25/2037 | 2,154,279 | 1,811,294 | ||||
Series 2006-41CB, Class 1A7, 6.00%, 01/25/2037 | 490,173 | 257,667 | ||||
Series 2006-6CB, Class 1A8, 5.50%, 05/25/2036 | 85,452 | 70,473 | ||||
Series 2006-J3, Class 4A2, 5.75%, 05/25/2026 | 262,140 | 251,412 | ||||
Series 2006-J6, Class A4, 6.00%, 09/25/2036 | 1,944,766 | 941,893 | ||||
Series 2006-J6, Class A5, 6.00%, 09/25/2036 | 2,619,657 | 1,268,758 | ||||
Series 2007-13, Class A1, 6.00%, 06/25/2047 | 2,403,794 | 1,277,524 | ||||
Series 2007-23CB, Class A1, 6.00%, 09/25/2037 | 4,194,012 | 2,101,426 | ||||
Series 2007-2CB, Class 2A14, 5.75%, 03/25/2037 | 5,414,940 | 2,772,549 | ||||
Series 2007-4CB, Class 1A6, 5.75%, 04/25/2037 | 1,355,259 | 1,134,956 | ||||
Series 2007-4CB, Class 1A7, 5.75%, 04/25/2037 | 1,019,429 | 853,717 | ||||
Series 2007-8CB, Class A1, 5.50%, 05/25/2037 | 5,501,153 | 2,922,699 | ||||
Series 2007-8CB, Class A9, 6.00%, 05/25/2037 | 743,306 | 417,169 | ||||
Series 2007-J2, Class 2A2, 6.00%, 07/25/2037 | 2,259,931 | 2,129,923 | ||||
Series 2008-2R, Class 3A1, 6.00%, 08/25/2037(e) | 6,950,962 | 3,373,499 | ||||
26 |
Par | Value | |||||
NON-AGENCY RESIDENTIAL MORTGAGE BACKED SECURITIES - (Continued) | ||||||
Countrywide Home Loan Mortgage Pass Through Trust | ||||||
Series 2003-42, Class 2A4, 5.15%, 10/25/2033(e) | $656,615 | $613,043 | ||||
Series 2003-44, Class A3, 5.00%, 10/25/2033 | 212,000 | 194,484 | ||||
Series 2004-14, Class 3A1, 6.83%, 08/25/2034(e) | 1,694,424 | 1,594,956 | ||||
Series 2004-21, Class A1, 4.00%, 11/25/2034 | 454,303 | 409,236 | ||||
Series 2004-24, Class A1, 5.50%, 12/25/2034 | 3,254,963 | 3,244,904 | ||||
Series 2004-24, Class A4, 5.50%, 12/25/2034 | 2,241,597 | 2,234,274 | ||||
Series 2004-4, Class A10, 5.50%, 05/25/2034 | 424,005 | 412,124 | ||||
Series 2004-HYB5, Class 3A1, 5.75%, 04/20/2035(e) | 654,485 | 612,909 | ||||
Series 2004-J9, Class 2A5, 5.50%, 01/25/2035 | 413,567 | 410,572 | ||||
Series 2005-13, Class A6, 5.50%, 06/25/2035 | 1,378,949 | 773,762 | ||||
Series 2005-20, Class A7, 5.25%, 12/25/2027 | 17,618 | 10,801 | ||||
Series 2005-27, Class 1A4, 5.50%, 12/25/2035 | 707,318 | 533,003 | ||||
Series 2005-27, Class 2A1, 5.50%, 12/25/2035 | 508,211 | 216,257 | ||||
Series 2005-31, Class 4A2, 4.77%, 01/25/2036(e) | 641,748 | 603,985 | ||||
Series 2005-HY10, Class 1A1, 5.46%, 02/20/2036(e) | 46,225 | 38,915 | ||||
Series 2005-HY10, Class 4A1, 4.06%, 02/20/2036(e) | 1,288,392 | 1,135,235 | ||||
Series 2005-HYB2, Class 2A, 4.98%, 05/20/2035(e) | 585,704 | 566,064 | ||||
Series 2005-J3, Class 2A5, 5.50%, 09/25/2035 | 44,519 | 41,464 | ||||
Series 2006-16, Class 2A1, 6.50%, 11/25/2036 | 472,260 | 153,166 | ||||
Series 2006-17, Class A6, 6.00%, 12/25/2036 | 2,090,360 | 888,443 | ||||
Series 2006-17, Class A8, 6.00% (1 mo. Term SOFR + 0.66%), 12/25/2036 | 2,827,162 | 1,199,220 | ||||
Series 2006-21, Class A11, 5.75%, 02/25/2037 | 1,120,897 | 493,382 | ||||
Series 2006-21, Class A13, 6.00%, 02/25/2037 | 2,588,303 | 1,189,191 | ||||
Series 2006-21, Class A5, 6.00%, 02/25/2037 | 590,968 | 271,519 | ||||
Series 2006-6, Class A1, 6.00%, 04/25/2036 | 566,230 | 279,212 | ||||
Series 2006-9, Class A8, 6.00%, 05/25/2036 | 1,105,101 | 528,086 | ||||
Par | Value | |||||
Series 2007-1, Class A4, 6.00%, 03/25/2037 | $1,903,974 | $859,013 | ||||
Series 2007-10, Class A22, 6.00%, 07/25/2037 | 1,764,402 | 804,665 | ||||
Series 2007-5, Class A2, 5.75%, 05/25/2037 | 1,489,128 | 744,746 | ||||
Series 2007-5, Class A29, 5.50%, 05/25/2037 | 2,592,952 | 1,244,290 | ||||
Series 2007-5, Class A4, 5.75%, 05/25/2037 | 771,712 | 385,950 | ||||
Series 2007-5, Class A51, 5.75%, 05/25/2037 | 5,053,974 | 2,527,604 | ||||
Series 2007-HY5, Class 1A1, 5.26%, 09/25/2047(e) | 5,139,872 | 4,037,684 | ||||
Series 2007-J2, Class 2A3, 6.00%, 07/25/2037 | 2,878,087 | 1,000,225 | ||||
Series 2007-J2, Class 2A6, 6.00%, 07/25/2037 | 185,878 | 64,599 | ||||
Credit Suisse First Boston Mortgage Securities Corp. | ||||||
Series 2004-8, Class 3A4, 5.50%, 12/25/2034 | 127,061 | 127,561 | ||||
Series 2005-10, Class 10A3, 6.00%, 11/25/2035 | 811,139 | 202,873 | ||||
Series 2005-10, Class 5A3, 5.50%, 11/25/2035 | 348,740 | 255,626 | ||||
Series 2005-10, Class 5A4, 5.50%, 11/25/2035 | 1,374,698 | 1,007,384 | ||||
Series 2005-3, Class 3A17, 5.50%, 07/25/2035 | 221,987 | 222,355 | ||||
Series 2005-9, Class 2A1, 5.50%, 10/25/2035 | 541,668 | 241,318 | ||||
Credit Suisse Management LLC, Series 2005-8, Class 7A1, 7.00%, 09/25/2035 | 2,548,248 | 1,117,241 | ||||
Credit Suisse Mortgage Capital Certificates | ||||||
Series 2006-1, Class 1A3, 5.50%, 02/25/2036 | 250,921 | 221,081 | ||||
Series 2006-1, Class 4A14, 5.50%, 02/25/2036 | 31,259 | 28,804 | ||||
Series 2006-2, Class 4A2, 5.75%, 03/25/2036 | 488,730 | 307,835 | ||||
Series 2006-2, Class 5A6, 6.00%, 03/25/2036 | 4,043,012 | 1,667,031 | ||||
Series 2006-4, Class 8A1, 7.00%, 05/25/2036 | 1,179,251 | 120,712 | ||||
Series 2006-7, Class 7A5, 6.00%, 08/25/2036 | 665,860 | 512,125 | ||||
Series 2006-CF1, Class B3, 5.50%, 11/25/2035(b)(h) | 2,565,000 | 2,506,654 | ||||
Series 2007-2, Class 3A8, 5.50%, 03/25/2037 | 1,239,041 | 597,425 | ||||
Series 2007-3, Class 4A13, 5.50%, 04/25/2037 | 249,451 | 202,714 | ||||
Series 2007-3, Class 4A15, 5.50%, 04/25/2037 | 348,986 | 283,599 | ||||
27 |
Par | Value | |||||
NON-AGENCY RESIDENTIAL MORTGAGE BACKED SECURITIES - (Continued) | ||||||
Series 2011-12R, Class 3A5, 5.53%, 07/27/2036(b)(e) | $614,907 | $621,104 | ||||
Series 2013-2R, Class 5A2, 3.90%, 05/27/2037(b)(e) | 1,709,327 | 1,152,024 | ||||
Deutsche ALT-A Securities, Inc. | ||||||
Series 2005-3, Class 3A1, 5.89% (1 mo. Term SOFR + 0.61%), 05/25/2035 | 732,338 | 629,248 | ||||
Series 2005-6, Class 1A4, 5.50%, 12/25/2035 | 1,307,570 | 1,054,164 | ||||
Series 2006-AB4, Class A1B1, 5.49% (1 mo. Term SOFR + 0.21%), 10/25/2036 | 381,904 | 306,715 | ||||
DFC HEL Trust, Series 2001-1, Class M1, 7.10% (1 mo. Term SOFR + 1.76%), 08/15/2031 | 1,175,222 | 1,149,828 | ||||
Federal National Mortgage Association, Series 2016-C01, Class 2M2, 12.41% (30 day avg SOFR US + 7.06%), 08/25/2028 | 837,296 | 879,142 | ||||
First Horizon Alternative Mortgage Securities | ||||||
Series 2004-AA6, Class A1, 6.44%, 01/25/2035(e) | 217,059 | 211,360 | ||||
Series 2004-AA7, Class 2A1, 6.73%, 02/25/2035(e) | 622,671 | 586,903 | ||||
Series 2005-AA5, Class 2A1, 6.17%, 07/25/2035(e) | 941,568 | 874,438 | ||||
Series 2005-AA7, Class 2A1, 6.01%, 09/25/2035(e) | 1,056,319 | 929,711 | ||||
Series 2005-FA11, Class 2A1, 5.25%, 01/25/2036 | 698 | 0 | ||||
Series 2005-FA8, Class 1A14, 5.50%, 11/25/2035 | 1,117,535 | 546,888 | ||||
Series 2006-FA1, Class 1A3, 5.75%, 04/25/2036 | 1,783,558 | 761,661 | ||||
Series 2006-FA2, Class 1A3, 6.00%, 05/25/2036 | 2,155,734 | 919,136 | ||||
Series 2006-FA2, Class 1A5, 6.00%, 05/25/2036 | 1,410,524 | 601,402 | ||||
Series 2006-FA6, Class 1A5, 6.25%, 11/25/2036 | 6,649,849 | 3,028,682 | ||||
Series 2006-FA6, Class 3A1, 5.75%, 11/25/2036 | 526 | 241 | ||||
Series 2007-AA1, Class 1A2, 4.83%, 05/25/2037(e) | 1,933,242 | 1,251,981 | ||||
Series 2007-FA4, Class 1A6, 6.25%, 08/25/2037(e) | 1,777,087 | 692,459 | ||||
First Horizon Asset Securities, Inc. | ||||||
Series 2005-AR3, Class 4A1, 7.54%, 08/25/2035(e) | 652,666 | 629,337 | ||||
Series 2006-4, Class 1A15, 6.00%, 02/25/2037 | 527,691 | 137,274 | ||||
Par | Value | |||||
Series 2006-4, Class 1A6, 5.75%, 02/25/2037 | $871,445 | $217,344 | ||||
Series 2006-AR4, Class 1A2, 5.11%, 01/25/2037(e) | 2,005,397 | 1,075,310 | ||||
Series 2007-AR1, Class 1A1, 5.16%, 05/25/2037(e) | 600,381 | 259,170 | ||||
Series 2007-AR2, Class 1A2, 7.29%, 08/25/2037(e) | 3,969,409 | 1,190,981 | ||||
GS Mortgage-Backed Securities Trust | ||||||
Series 2021-MM1, Class A8, 2.50%, 04/25/2052(b)(e) | 2,000,000 | 1,355,132 | ||||
Series 2021-PJ7, Class A14, 2.50%, 01/25/2052(b)(e) | 4,491,250 | 3,067,124 | ||||
Series 2022-PJ2, Class A31, 2.50%, 06/25/2052(b)(e) | 2,250,000 | 1,521,532 | ||||
Series 2022-PJ5, Class A31, 2.50%, 10/25/2052(b)(e) | 5,500,000 | 3,689,506 | ||||
GSAA Trust | ||||||
Series 2005-1, Class M2, 6.26%, 11/25/2034(h) | 1,991,398 | 1,954,625 | ||||
Series 2006-15, Class AF5, 6.69%, 09/25/2036(h) | 1,997,067 | 508,266 | ||||
Series 2006-18, Class AF6, 6.18%, 11/25/2036(h) | 1,810,959 | 447,316 | ||||
Series 2007-7, Class 1A2, 5.75% (1 mo. Term SOFR + 0.47%), 07/25/2037 | 529,337 | 495,774 | ||||
GSR Mortgage Loan Trust | ||||||
Series 2003-5F, Class 1A1, 3.00%, 08/25/2032 | 745,958 | 693,702 | ||||
Series 2004-15F, Class 2A1, 6.00%, 12/25/2034 | 709,738 | 594,488 | ||||
Series 2005-1F, Class 3A3, 6.00%, 01/25/2035 | 9,464 | 8,540 | ||||
Series 2005-4F, Class 3A1, 6.50%, 05/25/2035 | 46,019 | 45,846 | ||||
Series 2005-7F, Class 3A9, 6.00%, 09/25/2035 | 15,547 | 15,304 | ||||
Series 2005-AR4, Class 5A1, 6.21%, 07/25/2035(e) | 116,443 | 111,062 | ||||
Series 2005-AR5, Class 4A1, 5.51%, 10/25/2035(e) | 507,476 | 465,779 | ||||
Series 2005-AR7, Class 6A1, 4.35%, 11/25/2035(e) | 315,443 | 276,802 | ||||
Series 2006-2F, Class 2A1, 5.75%, 02/25/2036 | 382,977 | 329,302 | ||||
Harborview Mortgage Loan Trust, Series 2006-6, Class 3A1A, 4.86%, 08/19/2036(e) | 1,754,791 | 1,362,183 | ||||
Impac CMB Trust, Series 2005-5, Class A3W, 5.89% (1 mo. Term SOFR + 0.36%), 08/25/2035 | 332,934 | 311,939 | ||||
Impac Funding Corp. | ||||||
Series 2002-2, Class A3, 6.50%, 04/25/2033 | 726,350 | 709,997 | ||||
28 |
Par | Value | |||||
NON-AGENCY RESIDENTIAL MORTGAGE BACKED SECURITIES - (Continued) | ||||||
Series 2004-2, Class A5, 4.83%, 08/25/2034(h) | $65,355 | $64,331 | ||||
Indymac IMSC Mortgage Loan Trust, Series 2007-AR1, Class 2A1, 4.14%, 06/25/2037(e) | 340,956 | 217,426 | ||||
Indymac Index Mortgage Loan Trust | ||||||
Series 2004-AR11, Class 1A, 3.76%, 12/25/2034(e) | 842,597 | 760,311 | ||||
Series 2004-AR4, Class 3A, 5.53%, 08/25/2034(e) | 1,883,254 | 1,769,810 | ||||
Series 2005-AR23, Class 3A1, 3.88%, 11/25/2035(e) | 531,281 | 479,235 | ||||
Series 2005-AR23, Class 6A1, 4.01%, 11/25/2035(e) | 918,395 | 835,558 | ||||
Series 2005-AR25, Class 1A21, 4.05%, 12/25/2035(e) | 1,720,144 | 965,348 | ||||
Series 2005-AR3, Class 4A1, 3.98%, 04/25/2035(e) | 760,506 | 709,292 | ||||
Series 2005-AR35, Class 1A1, 3.72%, 02/25/2036(e) | 1,087,502 | 851,732 | ||||
Series 2005-AR9, Class 1A1, 4.73%, 07/25/2035(e) | 2,796,999 | 1,508,897 | ||||
Series 2006-AR25, Class 3A1, 4.10%, 09/25/2036(e) | 1,974,187 | 1,281,907 | ||||
Series 2006-AR25, Class 4A1, 3.75%, 09/25/2036(e) | 3,443,898 | 3,095,747 | ||||
Series 2006-AR3, Class 2A1C, 3.91%, 03/25/2036(e) | 4,605,820 | 3,194,925 | ||||
Series 2006-AR31, Class A5, 3.85%, 11/25/2036(e) | 3,559,759 | 3,288,126 | ||||
Series 2006-AR9, Class 3A1, 3.53%, 06/25/2036(e) | 1,491,194 | 1,290,843 | ||||
Jefferies, LLC, Series 2009-R1, Class 1A2, 4.44%, 11/26/2035(b)(e) | 444,308 | 392,835 | ||||
JP Morgan Mortgage Trust | ||||||
Series 2005-S3, Class 1A5, 5.75%, 01/25/2036 | 46,420 | 20,910 | ||||
Series 2007-A3, Class 2A3, 5.34%, 05/25/2037(e) | 2,084,998 | 1,720,116 | ||||
Series 2021-12, Class A3, 2.50%, 02/25/2052(b)(e) | 11,348,848 | 9,439,307 | ||||
Series 2021-13, Class A5, 2.50%, 04/25/2052(b)(e) | 30,000,000 | 20,565,159 | ||||
Series 2021-14, Class A5, 2.50%, 05/25/2052(b)(e) | 6,082,500 | 4,140,067 | ||||
Series 2021-15, Class A5, 2.50%, 06/25/2052(b)(e) | 2,750,000 | 1,865,279 | ||||
Series 2022-3, Class A5A, 2.50%, 08/25/2052(b)(e) | 11,588,632 | 7,820,282 | ||||
Series 2022-4, Class A5, 3.00%, 10/25/2052(b)(e) | 5,000,000 | 3,651,774 | ||||
Par | Value | |||||
Series 2024-3, Class A5, 3.00%, 05/25/2054(b)(e) | $10,000,000 | $7,261,037 | ||||
Series 2024-7, Class A5, 3.00%, 04/25/2053(b)(e) | 8,000,000 | 5,809,682 | ||||
Lehman Mortgage Trust | ||||||
Series 2005-2, Class 1A3, 5.75%, 12/25/2035 | 503,402 | 252,944 | ||||
Series 2005-3, Class 1A2, 0.00% (-1 x 1 mo. Term SOFR + 4.64%), 01/25/2036(g)(i) | 774,921 | 50,862 | ||||
Series 2005-3, Class 1A6, 5.50% (1 mo. Term SOFR + 0.61%), 01/25/2036 | 774,921 | 288,051 | ||||
Series 2006-1, Class 1A4, 5.50%, 02/25/2036 | 348,302 | 169,027 | ||||
Series 2006-3, Class 1A1, 6.00%, 07/25/2036 | 3,132,463 | 1,566,350 | ||||
Series 2006-3, Class 1A4, 6.00%, 07/25/2036 | 6,925,334 | 3,503,635 | ||||
Series 2007-4, Class 1A2, 5.75%, 05/25/2037 | 970,985 | 438,325 | ||||
Series 2007-4, Class 1A3, 5.75%, 05/25/2037 | 2,121,602 | 957,740 | ||||
Series 2007-5, Class 1A3, 5.75%, 06/25/2037 | 1,247,441 | 1,156,192 | ||||
Series 2007-5, Class 9A1, 6.00%, 06/25/2037 | 2,287,220 | 539,013 | ||||
Series 2007-5, Class 9A2, 6.00%, 06/25/2037 | 6,247,084 | 1,472,205 | ||||
MASTR Adjustable Rate Mortgages Trust | ||||||
Series 2004-4, Class 2A2, 5.71%, 05/25/2034(e) | 74,786 | 70,299 | ||||
Series 2005-1, Class 7A1, 4.16%, 02/25/2035(e) | 80,641 | 73,766 | ||||
MASTR Alternative Loans Trust | ||||||
Series 2003-5, Class 30B1, 5.86%, 08/25/2033(e) | 430,587 | 250,853 | ||||
Series 2003-7, Class 5A1, 6.25%, 11/25/2033 | 31,332 | 32,607 | ||||
Series 2004-11, Class 7A1, 6.50%, 10/25/2034 | 220,831 | 220,442 | ||||
Series 2004-6, Class 10A1, 6.00%, 07/25/2034 | 86,717 | 85,316 | ||||
Series 2004-6, Class 8A1, 5.50%, 07/25/2034 | 150,233 | 146,495 | ||||
Series 2005-2, Class 4A5, 5.50%, 03/25/2035 | 2,000,000 | 1,999,195 | ||||
MASTR Asset Securitization Trust, Series 2006-1, Class 2A1, 5.84% (1 mo. Term SOFR + 0.56%), 05/25/2036 | 555,600 | 107,595 | ||||
Merrill Lynch Mortgage Investors, Inc. | ||||||
Series 2005-A5, Class A8, 5.22%, 06/25/2035(e) | 227,031 | 217,314 | ||||
29 |
Par | Value | |||||
NON-AGENCY RESIDENTIAL MORTGAGE BACKED SECURITIES - (Continued) | ||||||
Series 2005-A7, Class 2A1, 5.44%, 09/25/2035(e) | $3,355,894 | $2,697,226 | ||||
Series 2006-F1, Class 1A1, 6.00%, 04/25/2036 | 1,780,224 | 766,578 | ||||
MLCC Mortgage Investors, Inc., Series 2004-D, Class A2, 5.90% (6 mo. Term SOFR + 1.15%), 09/25/2029 | 387,229 | 372,003 | ||||
Morgan Stanley Mortgage Loan Trust | ||||||
Series 2005-7, Class 6A3, 5.50%, 11/25/2035 | 604,786 | 587,141 | ||||
Series 2005-7, Class 7A3, 5.50%, 11/25/2035 | 285,635 | 246,365 | ||||
Series 2006-11, Class 2A1, 6.00%, 08/25/2036 | 1,907,164 | 827,367 | ||||
Series 2006-2, Class 7A1, 5.47%, 02/25/2036(e) | 1,238,038 | 724,643 | ||||
Morgan Stanley Reremic Trust, Series 2012-R3, Class 1B, 3.99%, 11/26/2036(b)(e) | 1,749,055 | 1,529,326 | ||||
Nomura Asset Acceptance Corp. | ||||||
Series 2005-AR3, Class 3A1, 5.69%, 07/25/2035(e) | 189,966 | 188,293 | ||||
Series 2005-WF1, Class 2A5, 5.66%, 03/25/2035(h) | 12,248 | 12,206 | ||||
Nomura Resecuritization Trust | ||||||
Series 2011-4RA, Class 1A10, 2.77%, 12/26/2036(b)(e) | 5,031,169 | 4,508,369 | ||||
Series 2014-5R, Class 1A9, 5.50%, 06/26/2035(b)(e) | 2,994,118 | 2,420,670 | ||||
Popular ABS, Inc. | ||||||
Series 2003-1, Class M1, 4.86%, 08/25/2033(e) | 377,927 | 375,065 | ||||
Series 2003-3, Class M1, 4.20%, 12/25/2033(e) | 814,951 | 805,321 | ||||
RAAC Series, Series 2005-SP1, Class 3A7, 6.00%, 09/25/2034 | 2,354 | 1,675 | ||||
RALI Trust | ||||||
Series 2006-QS1, Class A3, 5.75%, 01/25/2036 | 154,684 | 120,987 | ||||
Series 2006-QS13, Class 1A6, 6.00%, 09/25/2036 | 1,750,271 | 1,396,748 | ||||
Series 2006-QS17, Class A7, 6.00%, 12/25/2036 | 270,026 | 222,257 | ||||
Series 2006-QS9, Class 1A5, 6.00% (1 mo. Term SOFR + 0.81%), 07/25/2036 | 1,142,199 | 834,755 | ||||
Series 2007-QS10, Class A1, 6.50%, 09/25/2037 | 245,031 | 201,823 | ||||
Series 2007-QS6, Class A29, 6.00%, 04/25/2037 | 2,447,640 | 2,010,058 | ||||
RBSSP Resecuritization Trust, Series 2009-7, Class 3A2, 6.00%, 03/26/2036(b)(e) | 3,711,745 | 2,000,896 | ||||
Par | Value | |||||
RCKT Mortgage Trust | ||||||
Series 2021-4, Class A17, 2.50%, 09/25/2051(b)(e) | $5,000,000 | $3,422,612 | ||||
Series 2022-2, Class A18, 2.50%, 02/25/2052(b)(e) | 4,500,000 | 3,038,340 | ||||
Resecuritization Pass-Through Trust, Series 2005-8R, Class A3, 6.00%, 10/25/2034 | 1,439,693 | 1,414,070 | ||||
Residential Asset Securitization Trust | ||||||
Series 2003-A9, Class A2, 4.00%, 08/25/2033 | 800,837 | 734,714 | ||||
Series 2004-R2, Class A3, 5.50%, 08/25/2034 | 1,423,622 | 1,405,932 | ||||
Series 2005-A11, Class 1A4, 5.50%, 10/25/2035 | 222,650 | 146,289 | ||||
Series 2005-A11, Class 2A1, 4.85%, 10/25/2035 | 3,388,540 | 1,210,446 | ||||
Series 2005-A11, Class 2A5, 6.00%, 10/25/2035 | 385,727 | 169,630 | ||||
Series 2005-A15, Class 5A1, 5.75%, 02/25/2036 | 3,447,927 | 1,252,645 | ||||
Series 2005-A5, Class A7, 5.50%, 05/25/2035 | 993,864 | 707,289 | ||||
Series 2006-A15, Class A10, 5.99% (1 mo. Term SOFR + 0.71%), 01/25/2037 | 16,434,022 | 3,879,931 | ||||
Series 2006-A15, Class A11, 0.26% (-1 x 1 mo. Term SOFR + 5.54%), 01/25/2037(g)(i) | 16,434,022 | 1,558,368 | ||||
Series 2006-A5CB, Class A6, 6.00%, 06/25/2036 | 2,288,338 | 929,235 | ||||
RFMSI Trust | ||||||
Series 2005-SA4, Class 1A21, 5.87%, 09/25/2035(e) | 1,595,952 | 1,089,810 | ||||
Series 2005-SA4, Class 2A1, 5.61%, 09/25/2035(e) | 1,140,360 | 703,735 | ||||
Series 2006-S3, Class A1, 5.50%, 03/25/2036 | 1,577,966 | 1,271,685 | ||||
Series 2006-S4, Class A1, 6.00%, 04/25/2036 | 1,691,291 | 1,350,348 | ||||
Series 2006-S5, Class A12, 6.00%, 06/25/2036 | 151,159 | 127,889 | ||||
Series 2006-S5, Class A14, 6.00%, 06/25/2036 | 311,168 | 263,266 | ||||
Series 2006-S5, Class A15, 6.00%, 06/25/2036 | 1,304,036 | 1,103,289 | ||||
Series 2006-S5, Class A18, 6.00%, 06/25/2036 | 162,069 | 137,124 | ||||
Series 2006-S6, Class A10, 6.00%, 07/25/2036 | 88,041 | 76,044 | ||||
Series 2006-S6, Class A15, 6.00%, 07/25/2036 | 453,256 | 391,490 | ||||
Series 2006-S7, Class A6, 6.25%, 08/25/2036 | 956,505 | 783,770 | ||||
Series 2006-S7, Class A9, 6.50%, 08/25/2036 | 571,858 | 475,966 | ||||
30 |
Par | Value | |||||
NON-AGENCY RESIDENTIAL MORTGAGE BACKED SECURITIES - (Continued) | ||||||
Series 2006-S9, Class A3, 5.75%, 09/25/2036 | $1,297,058 | $1,036,550 | ||||
Series 2007-S1, Class A10, 6.00%, 01/25/2037 | 384,656 | 291,951 | ||||
Series 2007-S7, Class A7, 6.00%, 07/25/2037 | 1,367,805 | 1,075,312 | ||||
Specialty Underwriting & Residential Finance, Series 2006-BC2, Class A2D, 3.74%, 02/25/2037(h) | 746,195 | 257,818 | ||||
Structured Adjustable Rate Mortgage Loan Trust | ||||||
Series 2004-18, Class 3A2, 5.72%, 12/25/2034(e) | 374,764 | 343,908 | ||||
Series 2005-12, Class 2A1, 5.83%, 06/25/2035(e) | 514,610 | 391,886 | ||||
Series 2005-21, Class 7A1, 4.86%, 11/25/2035(e) | 2,938,090 | 1,919,231 | ||||
Series 2006-1, Class 6A1, 4.87%, 02/25/2036(e) | 982,478 | 731,888 | ||||
Series 2006-1, Class 7A4, 3.94%, 02/25/2036(e) | 89,238 | 76,041 | ||||
Series 2006-12, Class 2A1, 4.55%, 01/25/2037(e) | 519,725 | 380,090 | ||||
Series 2006-4, Class 6A, 4.09%, 05/25/2036(e) | 513,016 | 282,189 | ||||
Series 2007-5, Class 1A1, 5.83% (1 mo. Term SOFR + 0.55%), 06/25/2037 | 1,223,915 | 1,014,982 | ||||
Series 2007-6, Class 2A1, 5.77% (1 mo. Term SOFR + 0.49%), 07/25/2037 | 4,024,907 | 3,524,746 | ||||
Series 2007-9, Class 1A1, 7.01% (6 mo. Term SOFR + 1.93%), 10/25/2037 | 789,320 | 722,981 | ||||
Suntrust Adjustable Rate Mortgage Loan Trust | ||||||
Series 2007-1, Class 2A1, 5.61%, 02/25/2037(e) | 3,046,938 | 2,634,605 | ||||
Series 2007-2, Class 1A1, 6.05%, 04/25/2037(e) | 409,209 | 156,316 | ||||
Suntrust Alternative Loan Trust | ||||||
Series 2005-1F, Class 2A3, 5.75%, 12/25/2035 | 657,993 | 604,277 | ||||
Series 2005-1F, Class 2A8, 6.00%, 12/25/2035 | 1,519,448 | 1,405,279 | ||||
Series 2005-1F, Class 4A1, 6.50%, 12/25/2035 | 1,325,293 | 1,212,537 | ||||
TBW Mortgage Backed Pass Through Certificates, Series 2006-2, Class 3A1, 5.50%, 07/25/2036 | 80,750 | 7,268 | ||||
Vericrest Opportunity Loan Transferee, Series 2021-NPL4, Class A2, 4.95%, 03/27/2051(b)(h) | 1,698,225 | 1,632,040 | ||||
Par | Value | |||||
WaMu Mortgage Pass Through Certificates | ||||||
Series 2003-AR10, Class A6, 5.83%, 10/25/2033(e) | $5,324,549 | $5,094,988 | ||||
Series 2003-S4, Class CB1, 5.63%, 06/25/2033(e) | 2,067,832 | 2,044,965 | ||||
Series 2004-S2, Class 3A2, 6.00%, 06/25/2034 | 35,506 | 35,367 | ||||
Series 2005-AR14, Class 1A2, 4.90%, 12/25/2035(e) | 3,679,119 | 3,387,114 | ||||
Series 2006-AR10, Class 2A1, 4.44%, 09/25/2036(e) | 849,700 | 719,610 | ||||
Series 2006-AR16, Class 1A1, 4.26%, 12/25/2036(e) | 928,808 | 835,744 | ||||
Series 2006-AR8, Class 1A1, 4.89%, 08/25/2046(e) | 1,362,158 | 1,246,927 | ||||
Series 2007-HY2, Class 1A1, 4.30%, 12/25/2036(e) | 12,033,183 | 10,754,920 | ||||
Series 2007-HY3, Class 4A1, 5.15%, 03/25/2037(e) | 2,130,508 | 1,956,173 | ||||
Series 2007-HY5, Class 3A1, 4.09%, 05/25/2037(e) | 847,031 | 716,273 | ||||
Series 2007-HY7, Class 1A1, 4.13%, 07/25/2037(e) | 187,324 | 146,036 | ||||
Washington Mutual Alternative Mortgage Pass-Through Certificates | ||||||
Series 2005-1, Class 5A1, 6.00%, 03/25/2035 | 741,205 | 696,642 | ||||
Series 2005-4, Class 5A7, 5.50%, 06/25/2035 | 2,488,930 | 2,108,051 | ||||
Series 2005-5, Class CB4, 5.50%, 07/25/2035 | 860,995 | 796,036 | ||||
Series 2005-6, Class 1CB, 6.50%, 08/25/2035 | 207,148 | 188,421 | ||||
Series 2005-6, Class 2A1, 5.50%, 08/25/2035 | 2,311,619 | 2,004,237 | ||||
Series 2005-6, Class 2A8, 5.50%, 08/25/2035 | 505,350 | 438,152 | ||||
Series 2005-6, Class 3CB, 5.50%, 08/25/2035 | 1,000,900 | 890,489 | ||||
Series 2005-9, Class 4A4, 5.50%, 11/25/2035 | 349,873 | 298,177 | ||||
Series 2006-8, Class A6, 4.13%, 10/25/2036(h) | 2,380,060 | 827,637 | ||||
Series 2007-HY1, Class A2A, 5.71% (1 mo. Term SOFR + 0.43%), 02/25/2037 | 1,528,143 | 1,168,141 | ||||
Series 2007-HY2, Class 1A1, 4.19%, 04/25/2037(e) | 1,113,878 | 580,096 | ||||
Series 2007-OC1, Class A1, 5.87% (1 mo. Term SOFR + 0.59%), 01/25/2047 | 3,261,165 | 2,901,944 | ||||
Series 2007-OC2, Class A3, 6.01% (1 mo. Term SOFR + 0.73%), 06/25/2037 | 3,466,914 | 3,217,767 | ||||
31 |
Par | Value | |||||
NON-AGENCY RESIDENTIAL MORTGAGE BACKED SECURITIES - (Continued) | ||||||
Wells Fargo Alternative Loan Trust, Series 2007-PA1, Class A4, 6.00%, 03/25/2037 | $678,562 | $613,723 | ||||
Wells Fargo Mortgage Backed Securities Trust | ||||||
Series 2004-J, Class A1, 6.86%, 07/25/2034(e) | 2,682,223 | 2,488,971 | ||||
Series 2005-AR14, Class A1, 7.36%, 08/25/2035(e) | 433,150 | 422,811 | ||||
Series 2006-AR1, Class 1A1, 6.45%, 03/25/2036(e) | 1,274,162 | 1,213,852 | ||||
Series 2006-AR19, Class A1, 6.36%, 12/25/2036(e) | 1,274,574 | 1,253,873 | ||||
Series 2006-AR5, Class 1A1, 6.70%, 04/25/2036(e) | 2,747,172 | 2,723,453 | ||||
Series 2006-AR5, Class 2A1, 6.57%, 04/25/2036(e) | 1,098,648 | 1,049,570 | ||||
Series 2007-AR3, Class A1, 6.33%, 04/25/2037(e) | 525,823 | 461,293 | ||||
TOTAL NON-AGENCY RESIDENTIAL MORTGAGE BACKED SECURITIES (Cost $560,140,195) | 454,226,109 | |||||
AGENCY COMMERCIAL MORTGAGE BACKED SECURITIES - 5.1% | ||||||
California Housing Finance Agency, Series 2021-2, Class X, 0.82%, 03/25/2035(g) | 31,245,541 | 1,421,047 | ||||
Fannie Mae Pool, Pool AN8088, 3.33%, 01/01/2038 | 10,731,000 | 9,455,863 | ||||
Federal Home Loan Mortgage Corp. | ||||||
Pool WA3427, 3.33%, 07/01/2041 | 3,941,851 | 3,409,187 | ||||
Pool WA3428, 3.05%, 11/01/2041 | 3,369,280 | 2,787,264 | ||||
Series K164, Class X1, 0.47%, 05/25/2034(e)(g) | 248,196,665 | 6,518,017 | ||||
Series K513, Class X1, 0.88%, 12/25/2028(e)(g) | 107,810,500 | 2,965,791 | ||||
Series K522, Class X1, 0.63%, 05/25/2029(e)(g) | 129,030,259 | 2,578,889 | ||||
Federal National Mortgage Association | ||||||
Pool AN8580, 3.51%, 04/01/2038 | 3,300,000 | 3,023,529 | ||||
Pool BS1824, 2.59%, 04/01/2041 | 7,890,000 | 6,095,400 | ||||
Pool BZ0164, 2.80%, 06/01/2041 | 1,761,498 | 1,434,436 | ||||
Freddie Mac Multiclass Certificates Series | ||||||
Series 2020-RR09, Class CX, 2.68%, 08/27/2029(e)(g) | 42,360,000 | 3,603,150 | ||||
Par | Value | |||||
Series 2021-RR17, Class X, 2.04%, 08/27/2027(e)(g) | $70,015,000 | $2,804,563 | ||||
Freddie Mac Multifamily ML Certificates | ||||||
Series 2019-ML06, Class XUS, 1.13%, 06/25/2037(b)(e)(g) | 10,474,959 | 814,742 | ||||
Series 2020-ML07, Class XUS, 2.02%, 10/25/2036(e)(g) | 24,359,513 | 3,419,101 | ||||
Series 2021-ML08, Class XUS, 1.85%, 07/25/2037(g) | 32,216,231 | 4,195,198 | ||||
Series 2021-ML09, Class XUS, 1.49%, 02/25/2040(b)(e)(g) | 43,143,128 | 5,050,766 | ||||
Series 2021-ML10, Class XUS, 2.13%, 01/25/2038(b)(e)(g) | 13,960,512 | 2,005,567 | ||||
Series 2021-ML10, Class XUS, 1.52%, 06/25/2038(b)(e)(g) | 38,812,799 | 4,397,102 | ||||
Series 2021-ML11, Class XUS, 0.77%, 03/25/2038(b)(g) | 33,460,768 | 1,726,910 | ||||
Series 2021-ML12, Class XUS, 1.30%, 07/25/2041(b)(e)(g) | 17,766,412 | 1,707,708 | ||||
Freddie Mac Multifamily Structured Pass Through Certificates | ||||||
Series K042, Class X1, 1.13%, 12/25/2024(e)(g) | 101,772,400 | 60,779 | ||||
Series K046, Class X1, 0.45%, 03/25/2025(e)(g) | 417,135,278 | 298,961 | ||||
Series K049, Class X1, 0.67%, 07/25/2025(e)(g) | 85,295,552 | 273,824 | ||||
Series K061, Class XAM, 0.18%, 11/25/2026(e)(g) | 72,512,000 | 141,014 | ||||
Series K062, Class XAM, 0.31%, 12/25/2026(e)(g) | 79,423,000 | 361,065 | ||||
Series K063, Class X1, 0.40%, 01/25/2027(e)(g) | 353,669,108 | 1,993,314 | ||||
Series K064, Class X1, 0.73%, 03/25/2027(e)(g) | 119,228,975 | 1,518,453 | ||||
Series K065, Class XAM, 0.70%, 05/25/2027(e)(g) | 57,193,000 | 850,700 | ||||
Series K066, Class X1, 0.88%, 06/25/2027(e)(g) | 30,420,281 | 504,222 | ||||
Series K067, Class X1, 0.70%, 07/25/2027(e)(g) | 38,903,242 | 536,666 | ||||
Series K068, Class X1, 0.55%, 08/25/2027(e)(g) | 98,886,749 | 1,080,130 | ||||
Series K069, Class X1, 0.47%, 09/25/2027(e)(g) | 27,852,338 | 268,552 | ||||
Series K073, Class X1, 0.43%, 01/25/2028(e)(g) | 147,104,543 | 1,401,083 | ||||
Series K073, Class XAM, 0.33%, 01/25/2028(e)(g) | 54,203,000 | 392,175 | ||||
Series K080, Class X1, 0.27%, 07/25/2028(e)(g) | 419,558,631 | 2,285,084 | ||||
Series K081, Class X1, 0.22%, 08/25/2028(e)(g) | 151,116,108 | 600,989 | ||||
Series K084, Class X1, 0.33%, 10/25/2028(e)(g) | 331,582,586 | 2,917,628 | ||||
32 |
Par | Value | |||||
AGENCY COMMERCIAL MORTGAGE BACKED SECURITIES - (Continued) | ||||||
Series K089, Class XAM, 0.60%, 01/25/2029(e)(g) | $53,965,000 | $1,047,142 | ||||
Series K090, Class XAM, 0.77%, 03/25/2029(e)(g) | 50,517,000 | 1,351,072 | ||||
Series K091, Class XAM, 0.64%, 03/25/2029(e)(g) | 53,659,000 | 1,175,357 | ||||
Series K093, Class X1, 1.08%, 05/25/2029(e)(g) | 70,158,347 | 2,533,144 | ||||
Series K094, Class X1, 1.01%, 06/25/2029(e)(g) | 193,363,009 | 6,789,304 | ||||
Series K095, Class X1, 1.08%, 06/25/2029(e)(g) | 45,602,591 | 1,716,965 | ||||
Series K097, Class X1, 1.22%, 07/25/2029(e)(g) | 72,239,980 | 3,223,449 | ||||
Series K097, Class XAM, 1.48%, 09/25/2051(e)(g) | 66,115,000 | 3,854,928 | ||||
Series K098, Class X1, 1.26%, 08/25/2029(e)(g) | 78,063,397 | 3,679,854 | ||||
Series K098, Class XAM, 1.52%, 08/25/2029(e)(g) | 24,691,000 | 1,496,884 | ||||
Series K099, Class X1, 1.00%, 09/25/2029(e)(g) | 208,373,450 | 7,682,396 | ||||
Series K100, Class XAM, 1.03%, 09/25/2029(e)(g) | 62,086,000 | 2,556,838 | ||||
Series K101, Class XAM, 1.21%, 10/25/2029(e)(g) | 65,686,000 | 3,192,129 | ||||
Series K102, Class X1, 0.94%, 10/25/2029(e)(g) | 172,021,827 | 6,071,201 | ||||
Series K103, Class X1, 0.76%, 11/25/2029(e)(g) | 124,526,228 | 3,461,518 | ||||
Series K105, Class XAM, 1.89%, 01/25/2030(e)(g) | 64,122,000 | 5,277,882 | ||||
Series K107, Class X1, 1.71%, 01/25/2030(e)(g) | 45,809,236 | 3,224,191 | ||||
Series K107, Class XAM, 1.67%, 02/25/2030(e)(g) | 118,898,000 | 8,720,942 | ||||
Series K108, Class X1, 1.81%, 03/25/2030(e)(g) | 56,655,251 | 4,357,191 | ||||
Series K108, Class XAM, 1.78%, 03/25/2030(e)(g) | 70,601,000 | 5,679,088 | ||||
Series K110, Class X1, 1.81%, 04/25/2030(e)(g) | 34,387,144 | 2,538,108 | ||||
Series K111, Class X1, 1.68%, 05/25/2030(e)(g) | 108,180,813 | 7,870,836 | ||||
Series K112, Class X1, 1.54%, 05/25/2030(e)(g) | 152,224,930 | 10,184,807 | ||||
Series K112, Class XAM, 1.77%, 05/25/2030(e)(g) | 44,272,000 | 3,680,677 | ||||
Series K113, Class X1, 1.48%, 06/25/2030(e)(g) | 113,015,961 | 7,232,208 | ||||
Series K114, Class X1, 1.21%, 06/25/2030(e)(g) | 135,698,724 | 7,209,551 | ||||
Series K114, Class XAM, 1.44%, 06/25/2030(e)(g) | 54,977,000 | 3,678,819 | ||||
Par | Value | |||||
Series K115, Class X1, 1.42%, 06/25/2030(e)(g) | $53,724,955 | $3,345,705 | ||||
Series K115, Class XAM, 1.65%, 07/25/2030(e)(g) | 40,865,759 | 3,164,469 | ||||
Series K116, Class X1, 1.52%, 07/25/2030(e)(g) | 104,797,188 | 6,861,774 | ||||
Series K116, Class XAM, 1.70%, 08/25/2030(e)(g) | 23,000,000 | 1,869,302 | ||||
Series K118, Class X1, 1.05%, 09/25/2030(e)(g) | 119,810,697 | 5,561,565 | ||||
Series K118, Class XAM, 1.26%, 09/25/2030(e)(g) | 35,916,184 | 2,177,670 | ||||
Series K119, Class XAM, 1.23%, 10/25/2030(e)(g) | 51,000,000 | 3,004,267 | ||||
Series K121, Class X1, 1.12%, 10/25/2030(e)(g) | 48,355,905 | 2,363,637 | ||||
Series K121, Class XAM, 1.29%, 11/25/2030(e)(g) | 70,786,000 | 4,491,039 | ||||
Series K122, Class X1, 0.97%, 11/25/2030(e)(g) | 128,465,038 | 5,528,788 | ||||
Series K122, Class XAM, 1.17%, 11/25/2030(e)(g) | 35,211,000 | 2,011,150 | ||||
Series K123, Class XAM, 1.07%, 12/25/2030(e)(g) | 108,000,000 | 5,626,163 | ||||
Series K124, Class XAM, 1.03%, 01/25/2031(e)(g) | 89,626,000 | 4,524,312 | ||||
Series K125, Class X1, 0.67%, 01/25/2031(e)(g) | 282,421,431 | 8,352,021 | ||||
Series K125, Class XAM, 0.87%, 01/25/2031(e)(g) | 103,992,000 | 4,469,659 | ||||
Series K127, Class XAM, 0.59%, 02/25/2031(e)(g) | 186,332,000 | 5,199,017 | ||||
Series K128, Class X1, 0.61%, 03/25/2031(e)(g) | 162,376,321 | 4,336,308 | ||||
Series K128, Class XAM, 0.83%, 03/25/2031(e)(g) | 37,700,000 | 1,561,489 | ||||
Series K129, Class XAM, 1.32%, 05/25/2031(e)(g) | 31,700,000 | 2,161,807 | ||||
Series K130, Class X1, 1.14%, 06/25/2031(e)(g) | 130,564,318 | 7,339,556 | ||||
Series K130, Class XAM, 1.32%, 07/25/2031(e)(g) | 43,372,188 | 3,065,420 | ||||
Series K131, Class X1, 0.83%, 07/25/2031(e)(g) | 140,121,686 | 5,746,068 | ||||
Series K138, Class XAM, 0.79%, 01/25/2032(e)(g) | 195,000,000 | 8,546,168 | ||||
Series K141, Class X1, 0.41%, 02/25/2032(e)(g) | 184,884,464 | 3,746,832 | ||||
Series K141, Class XAM, 0.43%, 02/25/2032(e)(g) | 195,000,000 | 4,236,219 | ||||
Series K149, Class X1, 0.40%, 08/25/2032(e)(g) | 83,075,484 | 1,720,086 | ||||
Series K1511, Class X1, 0.93%, 03/25/2034(e)(g) | 130,644,637 | 6,615,374 | ||||
Series K1512, Class X1, 1.05%, 04/25/2034(e)(g) | 47,109,413 | 2,710,266 | ||||
33 |
Par | Value | |||||
AGENCY COMMERCIAL MORTGAGE BACKED SECURITIES - (Continued) | ||||||
Series K1513, Class X1, 0.99%, 08/25/2034(e)(g) | $75,479,973 | $4,265,464 | ||||
Series K1514, Class X1, 0.70%, 10/25/2034(e)(g) | 80,165,434 | 3,397,066 | ||||
Series K1515, Class X1, 1.63%, 02/25/2035(e)(g) | 78,258,781 | 8,528,603 | ||||
Series K1516, Class X1, 1.63%, 05/25/2035(e)(g) | 41,528,867 | 4,840,164 | ||||
Series K1517, Class X1, 1.44%, 07/25/2035(e)(g) | 88,223,999 | 8,946,522 | ||||
Series K152, Class X1, 1.10%, 01/25/2031(e)(g) | 28,598,323 | 1,291,583 | ||||
Series K1521, Class X1, 1.09%, 08/25/2036(e)(g) | 95,292,141 | 7,740,933 | ||||
Series K155, Class X1, 0.26%, 04/25/2033(e)(g) | 242,228,466 | 2,473,080 | ||||
Series K160, Class X1, 0.38%, 08/25/2033(e)(g) | 254,060,687 | 4,949,356 | ||||
Series K729, Class X1, 0.46%, 10/25/2024(e)(g) | 29,960,324 | 1,666 | ||||
Series K734, Class X1, 0.78%, 02/25/2026(e)(g) | 61,841,856 | 379,091 | ||||
Series K735, Class X1, 1.09%, 05/25/2026(e)(g) | 57,149,657 | 678,001 | ||||
Series K735, Class XAM, 1.50%, 05/25/2026(e)(g) | 70,547,000 | 1,352,654 | ||||
Series K737, Class XAM, 1.12%, 10/25/2026(e)(g) | 20,050,000 | 419,667 | ||||
Series K738, Class XAM, 1.48%, 03/25/2027(e)(g) | 24,099,000 | 739,678 | ||||
Series K739, Class XAM, 1.66%, 09/25/2027(e)(g) | 32,621,072 | 1,323,923 | ||||
Series K742, Class XAM, 1.02%, 04/25/2028(e)(g) | 89,849,000 | 2,859,921 | ||||
Series K743, Class XAM, 1.39%, 05/25/2028(e)(g) | 99,488,000 | 4,259,300 | ||||
Series K744, Class X1, 0.96%, 07/25/2028(e)(g) | 113,891,595 | 3,183,498 | ||||
Series K744, Class XAM, 1.33%, 07/25/2028(e)(g) | 122,906,000 | 5,120,055 | ||||
Series K747, Class XAM, 0.48%, 12/25/2028(e)(g) | 160,000,000 | 2,418,928 | ||||
Series K748, Class XAM, 0.64%, 01/25/2029(e)(g) | 175,000,000 | 3,842,003 | ||||
Series KG02, Class X1, 1.15%, 08/25/2029(e)(g) | 31,750,552 | 1,198,739 | ||||
Series KG03, Class X1, 1.48%, 06/25/2030(e)(g) | 15,395,432 | 959,668 | ||||
Series KG04, Class X1, 0.94%, 11/25/2030(e)(g) | 110,677,922 | 4,553,079 | ||||
Series KW03, Class X1, 0.91%, 06/25/2027(e)(g) | 12,727,496 | 216,807 | ||||
Par | Value | |||||
Series KW06, Class X1, 0.27%, 06/25/2028(e)(g) | $501,560,014 | $2,426,798 | ||||
Series KW09, Class X1, 0.94%, 05/25/2029(e)(g) | 61,695,570 | 1,709,103 | ||||
TOTAL AGENCY COMMERCIAL MORTGAGE BACKED SECURITIES (Cost $438,397,208) | 408,796,831 | |||||
U.S. GOVERNMENT AGENCY ISSUES - 2.3% | ||||||
United States Treasury Strip Principal | ||||||
0.00%, 02/15/2042(a) | 100,000,000 | 47,833,181 | ||||
0.00%, 05/15/2042(a) | 100,000,000 | 47,037,686 | ||||
0.00%, 02/15/2043(a) | 100,000,000 | 45,232,493 | ||||
0.00%, 05/15/2043(a) | 100,000,000 | 44,638,552 | ||||
TOTAL U.S. GOVERNMENT AGENCY ISSUES (Cost $178,388,852) | 184,741,912 | |||||
AGENCY RESIDENTIAL MORTGAGE-BACKED SECURITIES - 0.4% | ||||||
Federal Home Loan Mortgage Corp. | ||||||
Series 4937, Class MB, 3.00%, 12/25/2049 | 6,621,000 | 4,765,636 | ||||
Series 5200, Class YZ, 2.50%, 02/25/2052 | 14,848,217 | 10,114,653 | ||||
Series 5201, Class CB, 2.50%, 03/25/2052 | 5,797,999 | 4,140,257 | ||||
Federal National Mortgage Association, Series 2021-52, Class JZ, 2.50%, 08/25/2051 | 17,038,001 | 10,660,350 | ||||
TOTAL AGENCY RESIDENTIAL MORTGAGE-BACKED SECURITIES (Cost $28,808,291) | 29,680,896 | |||||
Shares | ||||||
EXCHANGE TRADED FUNDS - 0.0%(d)(m) | ||||||
Performance Trust Short Term Bond ETF | 40,000 | 1,014,200 | ||||
TOTAL EXCHANGE TRADED FUNDS (Cost $1,011,600) | 1,014,200 | |||||
SHORT-TERM INVESTMENTS - 3.4% | ||||||
Money Market Funds - 1.2% | ||||||
First American Government Obligations Fund - Class X, 5.23%(k) | 98,984,789 | 98,984,789 | ||||
34 |
Par | Value | |||||
U.S. Treasury Bills - 2.2% | ||||||
5.38%, 09/10/2024(l) | $30,000,000 | $29,969,576 | ||||
5.19%, 10/01/2024(l) | 15,000,000 | 14,939,683 | ||||
5.37%, 10/08/2024(l) | 30,000,000 | 29,850,302 | ||||
5.17%, 10/31/2024(l) | 15,000,000 | 14,876,589 | ||||
5.32%, 11/05/2024(l) | 30,000,000 | 29,735,662 | ||||
4.96%, 11/21/2024(l) | 15,000,000 | 14,835,746 | ||||
5.25%, 12/05/2024(l) | 30,000,000 | 29,621,645 | ||||
4.90%, 12/19/2024(l) | 15,000,000 | 14,783,827 | ||||
178,613,030 | ||||||
TOTAL SHORT-TERM INVESTMENTS (Cost $277,538,082) | 277,597,819 | |||||
TOTAL INVESTMENTS - 99.7% (Cost $8,245,514,240) | $8,024,068,498 | |||||
Other Assets in Excess of Liabilities - 0.3% | 28,263,761 | |||||
TOTAL NET ASSETS - 100.0% | $8,052,332,259 | |||||
(a) | Zero coupon bonds make no periodic interest payments. |
(b) | Security is exempt from registration pursuant to Rule 144A under the Securities Act of 1933, as amended. These securities may only be resold in transactions exempt from registration to qualified institutional investors. As of August 31, 2024, the value of these securities total $1,712,835,020 or 21.27% of the Fund’s net assets. |
(c) | Security subject to the Alternative Minimum Tax (“AMT”). As of August 31, 2024, the total value of securities subject to the AMT was $9,086,157 or 0.1% of net assets. |
(d) | Represents less than 0.05% of net assets. |
(e) | Coupon rate is variable or floats based on components including but not limited to reference rate and spread. These securities may not indicate a reference rate and/or spread in their description. The rate disclosed is as of August 31, 2024. |
(f) | Issuer is currently in default. |
(g) | Interest only security. |
(h) | Step coupon bond. The rate disclosed is as of August 31, 2024. |
(i) | Inverse floating rate security whose interest rate moves in the opposite direction of reference interest rates. Reference interest rates are typically based on a negative multiplier or slope. Interest rate may also be subject to a cap or floor. |
(j) | Principal only security. |
(k) | The rate shown represents the 7-day annualized effective yield as of August 31, 2024. |
(l) | The rate shown is the effective yield as of August 31, 2024. |
(m) | Affiliated security at August 31, 2024. |
35 |
Par | Value | |||||
MUNICIPAL BONDS - 91.3% | ||||||
Alabama - 3.1% | ||||||
Black Belt Energy Gas District | ||||||
5.50%, 06/01/2049(a) | $3,040,000 | $3,256,516 | ||||
5.50%, 11/01/2053(a) | 2,815,000 | 2,999,016 | ||||
5.50%, 10/01/2054(a) | 3,000,000 | 3,307,303 | ||||
County of Jefferson, AL Sewer Revenue, 5.25%, 10/01/2040 | 1,000,000 | 1,113,305 | ||||
Energy Southeast A Cooperative District | ||||||
5.50%, 11/01/2053(a) | 4,020,000 | 4,385,090 | ||||
5.75%, 04/01/2054(a) | 1,000,000 | 1,114,691 | ||||
Southeast Energy Authority A Cooperative District, 5.50%, 01/01/2053(a) | 5,730,000 | 6,208,388 | ||||
22,384,309 | ||||||
Alaska - 0.2% | ||||||
CIVIC Ventures, 5.00%, 09/01/2033 | 1,750,000 | 1,762,453 | ||||
Arizona - 0.8% | ||||||
Industrial Development Authority of the City of Phoenix Arizona, 4.00%, 07/01/2026(b) | 1,300,000 | 1,308,026 | ||||
State of Arizona Distribution Revenue | ||||||
5.50%, 07/01/2038 | 2,060,000 | 2,581,060 | ||||
5.50%, 07/01/2042 | 1,545,000 | 1,937,594 | ||||
5,826,680 | ||||||
California - 19.6% | ||||||
Acton-Agua Dulce Unified School District, 0.00%, 05/01/2039(c) | 2,000,000 | 1,099,100 | ||||
Alhambra Unified School District, 0.00%, 08/01/2037(c) | 11,000,000 | 7,095,476 | ||||
Baldwin Park Unified School District, 0.00%, 08/01/2037(c) | 1,000,000 | 624,907 | ||||
Belmont-Redwood Shores School District, 0.00%, 08/01/2039(c) | 4,000,000 | 2,269,136 | ||||
California Educational Facilities Authority, 5.00%, 05/01/2049 | 5,000,000 | 6,210,325 | ||||
California Health Facilities Financing Authority, 5.00%, 11/01/2047 | 5,285,000 | 6,414,276 | ||||
California Municipal Finance Authority, 4.00%, 12/01/2026(b) | 1,235,000 | 1,204,934 | ||||
California Pollution Control Financing Authority | ||||||
5.00%, 07/01/2037(b)(d) | 1,750,000 | 1,929,617 | ||||
5.00%, 07/01/2038(b)(d) | 2,000,000 | 2,192,609 | ||||
Campbell Union School District | ||||||
0.00%, 08/01/2038(c) | 4,700,000 | 2,898,340 | ||||
0.00%, 08/01/2039(c) | 4,700,000 | 2,762,828 | ||||
City of San Diego, CA Tobacco Settlement Revenue Funding Corp., 4.00%, 06/01/2032 | 855,000 | 858,503 | ||||
Coachella Valley Unified School District, 0.00%, 08/01/2043(c) | 1,015,000 | 464,116 | ||||
Par | Value | |||||
Dry Creek Joint Elementary School District, 0.00%, 08/01/2036(c) | $3,375,000 | $2,257,062 | ||||
El Rancho Unified School District, 0.00%, 08/01/2035(c) | 350,000 | 242,949 | ||||
Fowler Unified School District, 5.50%, 08/01/2053 | 4,945,000 | 5,561,880 | ||||
Gateway Unified School District, 0.00%, 08/01/2037(c) | 1,745,000 | 1,101,581 | ||||
Hope Elementary School District | ||||||
0.00%, 08/01/2036(c) | 500,000 | 333,988 | ||||
0.00%, 08/01/2037(c) | 540,000 | 345,243 | ||||
0.00%, 08/01/2038(c) | 550,000 | 335,021 | ||||
0.00%, 08/01/2040(c) | 1,085,000 | 594,836 | ||||
Inland Empire Tobacco Securitization Corp., 3.68%, 06/01/2038 | 5,905,000 | 5,624,828 | ||||
Lakeside Union School District | ||||||
0.00%, 08/01/2037(c) | 4,000,000 | 2,534,741 | ||||
0.00%, 08/01/2038(c) | 4,035,000 | 2,441,099 | ||||
0.00%, 08/01/2039(c) | 4,375,000 | 2,523,287 | ||||
Lemon Grove School District, 0.00%, 08/01/2039(c) | 940,000 | 538,981 | ||||
Los Angeles County Public Works Financing Authority, 5.50%, 12/01/2049 | 7,000,000 | 8,154,504 | ||||
Manhattan Beach Unified School District | ||||||
0.00%, 09/01/2038(c) | 2,700,000 | 1,649,130 | ||||
0.00%, 09/01/2040(c) | 2,085,000 | 1,146,841 | ||||
0.00%, 09/01/2041(c) | 1,295,000 | 674,373 | ||||
Millbrae School District, 0.00%, 07/01/2039(c) | 1,735,000 | 1,028,784 | ||||
Mount San Antonio Community College District, 0.00%, 08/01/2043 | 1,505,000 | 1,503,480 | ||||
M-S-R Energy Authority, 6.50%, 11/01/2039 | 2,695,000 | 3,496,454 | ||||
Newport Mesa Unified School District | ||||||
0.00%, 08/01/2037(c) | 100,000 | 65,080 | ||||
0.00%, 08/01/2038(c) | 1,000,000 | 620,898 | ||||
Norwalk-La Mirada Unified School District, 0.00%, 08/01/2038(c) | 680,000 | 411,173 | ||||
Oceanside Unified School District | ||||||
0.00%, 08/01/2035(c) | 135,000 | 92,908 | ||||
0.00%, 08/01/2036(c) | 370,000 | 242,565 | ||||
0.00%, 08/01/2037(c) | 810,000 | 507,460 | ||||
0.00%, 08/01/2039(c) | 435,000 | 245,799 | ||||
Paramount Unified School District, 0.00%, 08/01/2037(c) | 630,000 | 400,236 | ||||
Pittsburg Unified School District Financing Authority | ||||||
0.00%, 09/01/2041(c) | 2,650,000 | 1,370,819 | ||||
0.00%, 09/01/2042(c) | 1,925,000 | 937,880 | ||||
Placentia-Yorba Linda Unified School District, 0.00%, 08/01/2041(c) | 5,325,000 | 2,799,364 | ||||
36 |
Par | Value | |||||
MUNICIPAL BONDS - (Continued) | ||||||
California - (Continued) | ||||||
Poway Unified School District | ||||||
0.00%, 08/01/2037(c) | $6,320,000 | $4,041,716 | ||||
0.00%, 08/01/2038(c) | 6,445,000 | 3,926,088 | ||||
0.00%, 08/01/2040(c) | 4,905,000 | 2,688,681 | ||||
0.00%, 08/01/2046(c) | 12,165,000 | 4,609,143 | ||||
Rowland Unified School District, 0.00%, 08/01/2041(c) | 5,145,000 | 2,709,230 | ||||
San Bernardino City Unified School District, 0.00%, 08/01/2035(c) | 250,000 | 174,656 | ||||
San Bernardino Community College District | ||||||
0.00%, 08/01/2038(c) | 210,000 | 123,201 | ||||
0.00%, 08/01/2044(c) | 12,485,000 | 5,413,225 | ||||
San Diego Community College District | ||||||
0.00%, 08/01/2039(c) | 8,525,000 | 4,982,026 | ||||
0.00%, 08/01/2041(c) | 1,860,000 | 977,806 | ||||
San Diego Unified School District | ||||||
0.00%, 07/01/2037(c) | 595,000 | 387,626 | ||||
0.00%, 07/01/2038(c) | 1,655,000 | 1,028,926 | ||||
0.00%, 07/01/2040(c) | 7,760,000 | 4,354,134 | ||||
0.00%, 07/01/2041(c) | 7,870,000 | 4,190,242 | ||||
0.00%, 07/01/2041 | 3,270,000 | 3,338,503 | ||||
0.00%, 07/01/2043(c) | 4,370,000 | 2,109,493 | ||||
Santa Barbara Secondary High School District, 0.00%, 08/01/2040(c) | 6,365,000 | 3,426,708 | ||||
St Helena Unified School District, 0.00%, 06/01/2036 | 2,805,000 | 3,524,265 | ||||
State of California, 5.00%, 09/01/2024 | 755,000 | 755,000 | ||||
West Contra Costa Unified School District, 0.00%, 08/01/2036(c) | 5,995,000 | 4,004,519 | ||||
142,572,599 | ||||||
Colorado - 2.4% | ||||||
City & County of Denver, CO Airport System Revenue | ||||||
5.75%, 11/15/2036(d) | 6,325,000 | 7,674,945 | ||||
5.75%, 11/15/2041(d) | 5,805,000 | 6,617,013 | ||||
City of Fruita, CO Healthcare Revenue, 5.00%, 01/01/2028 | 575,000 | 565,279 | ||||
Colorado Bridge & Tunnel Enterprise, 5.00%, 12/01/2042 | 1,000,000 | 1,113,395 | ||||
E-470 Public Highway Authority, 5.00%, 09/01/2040 | 1,270,000 | 1,270,000 | ||||
17,240,632 | ||||||
Connecticut - 0.7% | ||||||
Connecticut State Health & Educational Facilities Authority, 5.00%, 07/01/2032 | 2,400,000 | 2,402,523 | ||||
State of Connecticut Special Tax Revenue, 5.25%, 07/01/2040 | 2,500,000 | 2,865,178 | ||||
5,267,701 | ||||||
Par | Value | |||||
District of Columbia - 1.2% | ||||||
District of Columbia, 5.50%, 07/01/2047 | $6,150,000 | $6,944,276 | ||||
Metropolitan Washington Airports Authority Aviation Revenue, 5.00%, 10/01/2024(d) | 1,975,000 | 1,977,348 | ||||
8,921,624 | ||||||
Florida - 4.5% | ||||||
Bay County School Board | ||||||
5.50%, 07/01/2041 | 1,315,000 | 1,468,941 | ||||
5.50%, 07/01/2042 | 1,300,000 | 1,446,460 | ||||
City of Fort Lauderdale, FL Water & Sewer Revenue, 5.50%, 09/01/2048 | 1,500,000 | 1,706,820 | ||||
City of Fort Myers, FL Utility System Revenue, 5.50%, 10/01/2049 | 5,000,000 | 5,654,379 | ||||
City of Lakeland, FL Department of Electric Utilities | ||||||
5.00%, 10/01/2037 | 1,925,000 | 2,287,812 | ||||
5.00%, 10/01/2038 | 1,565,000 | 1,843,745 | ||||
County of Miami-Dade, FL | ||||||
0.00%, 10/01/2040(c) | 5,000,000 | 2,589,564 | ||||
0.00%, 10/01/2041(c) | 1,820,000 | 890,224 | ||||
0.00%, 10/01/2042(c) | 1,550,000 | 719,346 | ||||
0.00%, 10/01/2045(c) | 4,500,000 | 1,831,550 | ||||
County of Sarasota, FL Utility System Revenue, 5.25%, 10/01/2047 | 2,500,000 | 2,755,306 | ||||
Florida Development Finance Corp. | ||||||
5.50%, 09/15/2025(b) | 570,000 | 565,613 | ||||
5.00%, 09/15/2040(b) | 2,050,000 | 1,988,365 | ||||
Hillsborough County Aviation Authority, 5.50%, 10/01/2049(d) | 2,000,000 | 2,219,985 | ||||
JEA Water & Sewer System Revenue, 5.00%, 10/01/2024 | 3,085,000 | 3,089,108 | ||||
Lee County Industrial Development Authority, 4.13%, 11/15/2029 | 2,000,000 | 2,009,304 | ||||
33,066,522 | ||||||
Georgia - 2.6% | ||||||
City of Atlanta, GA, 4.50%, 12/01/2029 | 2,445,000 | 2,453,662 | ||||
City of Atlanta, GA Department of Aviation | ||||||
5.25%, 07/01/2043(d) | 1,000,000 | 1,099,256 | ||||
5.25%, 07/01/2044(d) | 2,000,000 | 2,183,336 | ||||
City of Conyers, GA, 4.30%, 03/01/2031 | 1,185,000 | 1,116,965 | ||||
Georgia Ports Authority, 5.00%, 07/01/2041 | 4,145,000 | 4,608,823 | ||||
Main Street Natural Gas, Inc. | ||||||
5.00%, 05/01/2054(a) | 5,040,000 | 5,448,045 | ||||
5.00%, 12/01/2054(a) | 1,685,000 | 1,803,802 | ||||
18,713,889 | ||||||
Hawaii - 0.2% | ||||||
State of Hawaii, 5.00%, 10/01/2024 | 1,270,000 | 1,271,782 | ||||
37 |
Par | Value | |||||
MUNICIPAL BONDS - (Continued) | ||||||
Illinois - 2.2% | ||||||
Chicago O’Hare International Airport | ||||||
5.00%, 01/01/2025 | $1,125,000 | $1,132,235 | ||||
5.00%, 01/01/2043 | 2,000,000 | 2,200,265 | ||||
5.50%, 01/01/2044 | 2,000,000 | 2,220,246 | ||||
City of Joliet, IL, 5.50%, 12/15/2042 | 2,315,000 | 2,579,936 | ||||
Metropolitan Pier & Exposition Authority, 0.00%, 12/15/2036(c) | 6,500,000 | 3,977,585 | ||||
Will County School District No. 114 Manhattan, 5.50%, 01/01/2045 | 3,765,000 | 4,155,502 | ||||
16,265,769 | ||||||
Indiana - 9.4% | ||||||
Avon Community School Building Corp. | ||||||
5.50%, 07/15/2040 | 1,120,000 | 1,299,212 | ||||
5.50%, 07/15/2041 | 1,370,000 | 1,579,338 | ||||
5.50%, 01/15/2043 | 2,750,000 | 3,132,986 | ||||
Clark-Pleasant Community School Building Corp., 5.25%, 01/15/2042 | 2,500,000 | 2,780,662 | ||||
Fishers Town Hall Building Corp. | ||||||
5.50%, 07/15/2038 | 1,030,000 | 1,200,267 | ||||
5.50%, 07/15/2039 | 700,000 | 810,633 | ||||
5.50%, 07/15/2040 | 1,500,000 | 1,728,127 | ||||
5.50%, 07/15/2043 | 2,000,000 | 2,281,518 | ||||
Fort Wayne Redevelopment Authority, 5.00%, 12/15/2041 | 2,040,000 | 2,227,277 | ||||
Franklin Township-Marion County Multiple School Building Corp. | ||||||
5.00%, 07/15/2042 | 1,250,000 | 1,381,958 | ||||
5.00%, 07/15/2043 | 1,250,000 | 1,375,985 | ||||
Greater Clark Building Corp. | ||||||
6.00%, 07/15/2038 | 6,050,000 | 7,232,751 | ||||
6.00%, 01/15/2042 | 5,655,000 | 6,597,626 | ||||
6.00%, 01/15/2043 | 1,135,000 | 1,341,390 | ||||
Greater Clark County School Building Corp., 5.00%, 07/15/2041 | 1,280,000 | 1,423,342 | ||||
Indianapolis Local Public Improvement Bond Bank, 6.00%, 02/01/2048 | 8,750,000 | 10,196,395 | ||||
IPS Multi-School Building Corp., 5.50%, 07/15/2042 | 1,250,000 | 1,413,846 | ||||
Lake Ridge Multi-School Building Corp., 5.50%, 07/15/2040 | 1,805,000 | 2,034,804 | ||||
Lebanon Middle School Building Corp., 5.00%, 01/15/2044 | 2,000,000 | 2,190,191 | ||||
Noblesville High School Building Corp. | ||||||
6.00%, 07/15/2038 | 390,000 | 473,310 | ||||
6.00%, 07/15/2040 | 500,000 | 601,130 | ||||
6.00%, 01/15/2043 | 1,015,000 | 1,202,959 | ||||
Tippecanoe County School Building Corp., 6.00%, 01/15/2042 | 970,000 | 1,133,138 | ||||
Par | Value | |||||
Tri-Creek High School Building Corp., 5.50%, 07/15/2040 | $4,260,000 | $4,874,966 | ||||
Wawasee High School Building Corp., 5.00%, 07/15/2042 | 6,865,000 | 7,575,221 | ||||
68,089,032 | ||||||
Iowa - 0.2% | ||||||
Iowa Tobacco Settlement Authority, 4.00%, 06/01/2049 | 1,630,000 | 1,635,664 | ||||
Kansas - 0.2% | ||||||
Johnson County Unified School District No. 229 Blue Valley, 5.00%, 10/01/2024 | 1,390,000 | 1,391,939 | ||||
Kentucky - 1.2% | ||||||
County of Trimble, KY, 1.30%, 09/01/2044(a)(d) | 3,500,000 | 3,217,511 | ||||
Kentucky Economic Development Finance Authority, 5.00%, 05/15/2026 | 425,000 | 420,343 | ||||
Kentucky Public Energy Authority, 5.00%, 05/01/2055(a) | 1,050,000 | 1,115,166 | ||||
Kentucky State Property & Building Commission | ||||||
5.50%, 11/01/2041 | 1,215,000 | 1,392,525 | ||||
5.50%, 11/01/2042 | 2,050,000 | 2,351,351 | ||||
8,496,896 | ||||||
Louisiana - 0.3% | ||||||
Louisiana Stadium & Exposition District, 5.00%, 07/01/2039 | 1,675,000 | 1,870,629 | ||||
Maryland - 1.0% | ||||||
County of Anne Arundel, MD, 5.00%, 10/01/2024 | 825,000 | 826,223 | ||||
Maryland Stadium Authority, 5.00%, 05/01/2050 | 5,775,000 | 6,601,574 | ||||
7,427,797 | ||||||
Massachusetts - 1.5% | ||||||
Massachusetts Bay Transportation Authority Sales Tax Revenue, 4.00%, 07/01/2039 | 6,420,000 | 6,423,410 | ||||
Massachusetts Development Finance Agency, 5.00%, 07/15/2040 | 3,750,000 | 4,556,072 | ||||
10,979,482 | ||||||
Michigan - 1.1% | ||||||
Lansing Board of Water & Light, 5.00%, 07/01/2043 | 1,795,000 | 2,012,920 | ||||
Michigan Finance Authority, 3.27%, 06/01/2039 | 6,100,000 | 5,797,898 | ||||
7,810,818 | ||||||
Minnesota - 1.7% | ||||||
Minneapolis-St Paul Metropolitan Airports Commission, 5.25%, 01/01/2042(d) | 10,000,000 | 11,036,838 | ||||
38 |
Par | Value | |||||
MUNICIPAL BONDS - (Continued) | ||||||
Minnesota - (Continued) | ||||||
State of Minnesota, 5.00%, 10/01/2024 | $975,000 | $976,446 | ||||
12,013,284 | ||||||
Missouri - 0.4% | ||||||
Jackson County School District No. R-IV Blue Springs, 5.50%, 03/01/2044 | 2,280,000 | 2,646,411 | ||||
Nevada - 0.4% | ||||||
Las Vegas Valley Water District, 5.00%, 12/01/2024 | 585,000 | 587,950 | ||||
State of Nevada Department of Business & Industry, 8.13%, 01/01/2050(d) | 2,000,000 | 2,019,147 | ||||
2,607,097 | ||||||
New Hampshire - 0.4% | ||||||
New Hampshire Business Finance Authority, 4.88%, 12/01/2033(b) | 3,220,000 | 3,226,758 | ||||
New Jersey - 1.1% | ||||||
New Jersey Economic Development Authority, 5.50%, 01/01/2027(d) | 300,000 | 300,401 | ||||
New Jersey Transportation Trust Fund Authority | ||||||
0.00%, 12/15/2038(c) | 1,050,000 | 597,800 | ||||
0.00%, 12/15/2039(c) | 5,000,000 | 2,747,886 | ||||
0.00%, 12/15/2039(c) | 7,635,000 | 4,146,023 | ||||
7,792,110 | ||||||
New York - 4.2% | ||||||
Build NYC Resource Corp. | ||||||
4.00%, 06/15/2031(b) | 600,000 | 583,280 | ||||
4.00%, 06/15/2041(b) | 1,350,000 | 1,196,378 | ||||
New York City Transitional Finance Authority, 5.50%, 05/01/2044 | 3,575,000 | 4,111,046 | ||||
New York City Transitional Finance Authority Future Tax Secured Revenue, 5.50%, 11/01/2045 | 8,830,000 | 9,999,788 | ||||
New York State Dormitory Authority | ||||||
5.00%, 10/01/2047 | 4,235,000 | 5,167,977 | ||||
5.00%, 10/01/2048 | 4,000,000 | 4,878,281 | ||||
Triborough Bridge & Tunnel Authority, 5.00%, 05/15/2052 | 4,065,000 | 4,885,015 | ||||
30,821,765 | ||||||
North Carolina - 2.2% | ||||||
North Carolina Medical Care Commission | ||||||
3.75%, 10/01/2028 | 550,000 | 552,299 | ||||
4.25%, 10/01/2028 | 250,000 | 252,356 | ||||
University of North Carolina at Chapel Hill | ||||||
5.00%, 02/01/2045 | 5,785,000 | 6,754,861 | ||||
5.00%, 02/01/2049 | 6,325,000 | 7,366,972 | ||||
Par | Value | |||||
Watauga Public Facilities Corp., 5.25%, 06/01/2042 | $1,250,000 | $1,396,134 | ||||
16,322,622 | ||||||
North Dakota - 0.4% | ||||||
Cass County Joint Water Resource District, 3.45%, 04/01/2027 | 3,000,000 | 3,014,991 | ||||
Ohio - 1.3% | ||||||
County of Cuyahoga, OH Sales Tax Revenue, 4.00%, 01/01/2025 | 1,625,000 | 1,630,416 | ||||
County of Hamilton, OH, 5.00%, 11/15/2049 | 6,095,000 | 7,161,298 | ||||
State of Ohio, 5.00%, 10/01/2024 | 990,000 | 991,491 | ||||
9,783,205 | ||||||
Oklahoma - 1.3% | ||||||
Grand River Dam Authority, 5.00%, 06/01/2042 | 8,425,000 | 9,466,398 | ||||
Oregon - 0.4% | ||||||
Port of Portland, OR Airport Revenue, 5.25%, 07/01/2042(d) | 2,450,000 | 2,698,411 | ||||
Pennsylvania - 3.5% | ||||||
Allegheny County Sanitary Authority, 5.75%, 06/01/2047 | 6,835,000 | 7,826,942 | ||||
City of Philadelphia, PA Water & Wastewater Revenue, 5.50%, 06/01/2047 | 2,365,000 | 2,652,429 | ||||
Commonwealth of Pennsylvania, 5.00%, 09/15/2024 | 2,705,000 | 2,706,539 | ||||
Delaware Valley Regional Finance Authority, 4.54% (1 mo. Term SOFR + 0.88%), 09/01/2048 | 1,000,000 | 1,000,104 | ||||
Pennsylvania Turnpike Commission | ||||||
5.00%, 12/01/2041 | 3,000,000 | 3,357,274 | ||||
5.25%, 12/01/2041 | 1,000,000 | 1,119,823 | ||||
5.25%, 12/01/2042 | 1,000,000 | 1,115,361 | ||||
5.00%, 12/01/2043 | 2,350,000 | 2,632,471 | ||||
Southeastern Pennsylvania Transportation Authority, 5.25%, 06/01/2041 | 2,585,000 | 2,901,993 | ||||
25,312,936 | ||||||
Puerto Rico - 0.8% | ||||||
Commonwealth of Puerto Rico | ||||||
0.00%, 07/01/2033(c) | 189,697 | 127,852 | ||||
4.00%, 07/01/2041 | 154,613 | 146,954 | ||||
0.00%, 11/01/2043(a) | 651,922 | 413,155 | ||||
4.00%, 07/01/2046 | 160,797 | 149,305 | ||||
GDB Debt Recovery Authority of Puerto Rico, 7.50%, 08/20/2040 | 2,182,033 | 2,127,482 | ||||
Puerto Rico Highway & Transportation Authority, 5.85%, 03/01/2027 | 1,395,000 | 1,388,025 | ||||
39 |
Par | Value | |||||
MUNICIPAL BONDS - (Continued) | ||||||
Puerto Rico - (Continued) | ||||||
Puerto Rico Sales Tax Financing Corp. Sales Tax Revenue, 0.00%, 07/01/2029(c) | $1,589,000 | $1,324,250 | ||||
5,677,023 | ||||||
Rhode Island - 1.1% | ||||||
Rhode Island Health and Educational Building Corp. | ||||||
5.50%, 05/15/2042 | 3,335,000 | 3,721,656 | ||||
5.50%, 05/15/2047 | 4,000,000 | 4,390,078 | ||||
8,111,734 | ||||||
South Carolina - 2.0% | ||||||
County of Horry, SC, 5.25%, 09/01/2047 | 4,000,000 | 4,414,628 | ||||
Patriots Energy Group Financing Agency, 5.25%, 02/01/2054(a) | 6,000,000 | 6,527,169 | ||||
South Island Public Service District, 5.25%, 04/01/2042 | 3,325,000 | 3,706,494 | ||||
14,648,291 | ||||||
Tennessee - 1.0% | ||||||
Metropolitan Government of Nashville & Davidson County, 5.00%, 05/15/2042 | 1,500,000 | 1,695,248 | ||||
Metropolitan Nashville Airport Authority, 5.50%, 07/01/2037(d) | 1,650,000 | 1,874,229 | ||||
Tennergy Corp., 5.00%, 10/01/2054(a) | 3,255,000 | 3,470,254 | ||||
7,039,731 | ||||||
Texas - 10.9% | ||||||
Board of Regents of the University of Texas System, 5.00%, 08/15/2049 | 4,915,000 | 5,857,819 | ||||
Central Texas Turnpike System, 5.00%, 08/15/2037 | 7,245,000 | 7,266,956 | ||||
City of Austin, TX Electric Utility Revenue, 5.00%, 11/15/2024 | 1,000,000 | 1,003,750 | ||||
City of Austin, TX Water & Wastewater System Revenue | ||||||
5.00%, 11/15/2040 | 1,225,000 | 1,366,165 | ||||
5.00%, 11/15/2041 | 1,700,000 | 1,882,816 | ||||
City of Dallas, TX Waterworks & Sewer System Revenue, 5.00%, 10/01/2024 | 1,285,000 | 1,286,732 | ||||
City of Houston, TX Airport System Revenue, 5.25%, 07/01/2039(d) | 2,745,000 | 3,052,891 | ||||
City of San Antonio, TX Electric & Gas Systems Revenue | ||||||
5.25%, 02/01/2040 | 6,000,000 | 6,820,099 | ||||
5.50%, 02/01/2049 | 1,950,000 | 2,210,770 | ||||
Colony Economic Development Corp., 7.25%, 10/01/2042 | 1,500,000 | 1,496,945 | ||||
Colony Local Development Corp., 7.25%, 10/01/2033 | 700,000 | 700,170 | ||||
Par | Value | |||||
Dallas Fort Worth International Airport, 5.00%, 11/01/2041 | $5,000,000 | $5,597,255 | ||||
Denton Independent School District, 4.00%, 08/15/2032 | 3,035,000 | 3,049,720 | ||||
Lower Colorado River Authority | ||||||
5.50%, 05/15/2047 | 5,000,000 | 5,566,087 | ||||
5.50%, 05/15/2048 | 3,000,000 | 3,328,170 | ||||
North Texas Tollway Authority, 0.00%, 01/01/2038(c) | 1,055,000 | 642,902 | ||||
Port of Beaumont Industrial Development Authority, 4.10%, 01/01/2028(b) | 3,000,000 | 2,667,770 | ||||
Port of Beaumont Navigation District, 10.00%, 07/01/2026(b) | 1,500,000 | 1,533,766 | ||||
Pottsboro Higher Education Finance Corp., 2.00%, 08/15/2040 | 775,000 | 560,855 | ||||
Prosper Independent School District, 5.00%, 02/15/2042 | 5,000,000 | 5,628,144 | ||||
State of Texas | ||||||
5.00%, 10/01/2024 | 3,790,000 | 3,795,107 | ||||
5.00%, 10/01/2024 | 1,390,000 | 1,391,873 | ||||
4.00%, 10/01/2031 | 2,965,000 | 2,966,609 | ||||
5.00%, 10/01/2044 | 4,720,000 | 4,726,735 | ||||
West Harris County Regional Water Authority, 5.50%, 12/15/2042 | 4,500,000 | 5,062,509 | ||||
79,462,615 | ||||||
Utah - 1.4% | ||||||
City of Salt Lake City, UT Airport Revenue, 5.25%, 07/01/2041(d) | 600,000 | 658,958 | ||||
Wasatch County School District Local Building Authority, 5.50%, 06/01/2047 | 7,570,000 | 8,331,922 | ||||
Wildflower Improvement Association, 6.63%, 03/01/2031(b) | 1,248,857 | 1,226,838 | ||||
10,217,718 | ||||||
Virginia - 0.3% | ||||||
Virginia Beach Development Authority, 5.38%, 09/01/2029 | 2,000,000 | 2,081,039 | ||||
Washington - 3.4% | ||||||
Central Puget Sound Regional Transit Authority, 5.00%, 11/01/2046 | 10,000,000 | 11,869,119 | ||||
County of Snohomish, WA, 5.00%, 12/01/2024 | 650,000 | 653,246 | ||||
King & Snohomish Counties School District No. 417 Northshore, 5.00%, 12/01/2042 | 5,000,000 | 5,631,245 | ||||
Port of Seattle, WA, 5.25%, 07/01/2043(d) | 1,500,000 | 1,636,153 | ||||
State of Washington, 5.00%, 06/01/2045 | 4,000,000 | 4,452,935 | ||||
Washington State Housing Finance Commission, 5.00%, 01/01/2055(b) | 500,000 | 441,235 | ||||
24,683,933 | ||||||
40 |
Par | Value | |||||
Wisconsin - 0.7% | ||||||
Public Finance Authority | ||||||
5.50%, 12/15/2028(b) | $2,000,000 | $2,011,895 | ||||
7.50%, 06/01/2029(b) | 2,000,000 | 1,968,634 | ||||
5.00%, 07/15/2030(b) | 1,000,000 | 1,005,100 | ||||
4,985,629 | ||||||
TOTAL MUNICIPAL BONDS (Cost $640,070,595) | 663,609,918 | |||||
AGENCY COMMERCIAL MORTGAGE BACKED SECURITIES - 5.2% | ||||||
California Housing Finance Agency, Series 2021-2, Class X, 0.82%, 03/25/2035(e) | 40,859,554 | 1,858,292 | ||||
Freddie Mac Multifamily ML Certificates | ||||||
Series 2019-ML05, Class XCA, 0.25%, 11/25/2033(a)(e) | 45,130,659 | 755,939 | ||||
Series 2019-ML06, Class XUS, 1.13%, 06/25/2037(a)(b)(e) | 10,474,019 | 814,669 | ||||
Series 2020-ML07, Class XUS, 2.02%, 10/25/2036(a)(b)(e) | 14,959,161 | 2,099,668 | ||||
Series 2021-ML08, Class XUS, 1.85%, 07/25/2037(e) | 34,340,504 | 4,471,820 | ||||
Series 2021-ML09, Class XUS, 1.49%, 02/25/2040(a)(b)(e) | 38,340,795 | 4,488,557 | ||||
Series 2021-ML10, Class XUS, 2.13%, 01/25/2038(a)(b)(e) | 19,137,384 | 2,749,277 | ||||
Series 2021-ML10, Class XUS, 1.52%, 06/25/2038(a)(b)(e) | 49,932,095 | 5,656,807 | ||||
Series 2021-ML11, Class XUS, 0.77%, 03/25/2038(b)(e) | 90,576,695 | 4,674,663 | ||||
Series 2021-ML12, Class XUS, 1.30%, 07/25/2041(a)(b)(e) | 24,644,141 | 2,368,795 | ||||
Series 2022-ML13, Class XUS, 0.96%, 07/25/2036(a)(e) | 82,244,663 | 4,444,502 | ||||
Series 2022-ML13, Class XUS, 0.98%, 09/25/2036(e) | 52,783,772 | 3,557,626 | ||||
TOTAL AGENCY COMMERCIAL MORTGAGE BACKED SECURITIES (Cost $40,708,225) | 37,940,615 | |||||
NON-AGENCY COMMERCIAL MORTGAGE BACKED SECURITIES - 1.8% | ||||||
California Housing Finance Agency | ||||||
Series 2021-1, Class X, 0.80%, 11/20/2035(e) | 48,215,443 | 2,298,430 | ||||
Series 2021-3, Class X, 0.77%, 08/20/2036(e) | 25,171,214 | 1,265,105 | ||||
New Hampshire Business Finance Authority | ||||||
Series 2022-2, Class X, 0.69%, 10/20/2036(e) | 67,278,478 | 3,148,633 | ||||
Series 2023-2, Class X, 0.81%, 01/20/2038(a)(e) | 60,000,000 | 3,369,600 | ||||
Par | Value | |||||
Washington State Housing Finance Commission, Series 2021-1, Class X, 0.73%, 12/20/2035(a)(e) | $65,083,714 | $2,829,840 | ||||
TOTAL NON-AGENCY COMMERCIAL MORTGAGE BACKED SECURITIES (Cost $13,373,001) | 12,911,608 | |||||
CORPORATE BONDS - 0.4% | ||||||
Real Estate Management & Development - 0.4% | ||||||
MMH Master LLC, 6.38%, 02/01/2034(b) | 2,897,000 | 3,010,334 | ||||
TOTAL CORPORATE BONDS (Cost $2,903,418) | 3,010,334 | |||||
Shares | ||||||
SHORT-TERM INVESTMENTS - 4.2% | ||||||
Money Market Funds - 4.2% | ||||||
First American Government Obligations Fund - Class X, 5.23%(f) | 30,307,392 | 30,307,392 | ||||
TOTAL SHORT-TERM INVESTMENTS (Cost $30,307,392) | 30,307,392 | |||||
TOTAL INVESTMENTS - 102.9% (Cost $727,362,629) | $747,779,867 | |||||
Liabilities in Excess of Other Assets - (2.9)% | (21,022,467) | |||||
TOTAL NET ASSETS - 100.0% | $726,757,400 | |||||
(a) | Coupon rate is variable or floats based on components including but not limited to reference rate and spread. These securities may not indicate a reference rate and/or spread in their description. The rate disclosed is as of August 31, 2024. |
(b) | Security is exempt from registration pursuant to Rule 144A under the Securities Act of 1933, as amended. These securities may only be resold in transactions exempt from registration to qualified institutional investors. As of August 31, 2024, the value of these securities total $50,913,588 or 7.0% of the Fund’s net assets. |
(c) | Zero coupon bonds make no periodic interest payments. |
(d) | Security subject to the Alternative Minimum Tax (“AMT”). As of August 31, 2024, the total value of securities subject to the AMT was $52,388,647 or 7.2% of net assets. |
(e) | Interest only security. |
(f) | The rate shown represents the 7-day effective yield as of August 31, 2024. |
41 |
Par | Value | |||||
CORPORATE BONDS - 35.5% | ||||||
Aerospace & Defense - 1.5% | ||||||
Moog, Inc., 4.25%, 12/15/2027(a) | $ 1,000,000 | $ 964,148 | ||||
TransDigm, Inc., 6.63%, 03/01/2032(a) | 1,000,000 | 1,041,086 | ||||
2,005,234 | ||||||
Banks - 10.9% | ||||||
Banner Corp., 5.00% to 06/30/2025 then 3 mo. Term SOFR + 4.89%, 06/30/2030 | 1,000,000 | 980,000 | ||||
Barclays PLC, 6.13% to 06/15/2026 then 5 yr. CMT Rate + 5.87%, Perpetual | 1,000,000 | 994,546 | ||||
Deutsche Bank AG, 7.08% to 02/10/2033 then SOFR + 3.65%, 02/10/2034 | 1,000,000 | 1,059,089 | ||||
First Busey Corp., 5.25% to 06/01/2025 then 3 mo. Term SOFR + 5.11%, 06/01/2030 | 1,000,000 | 982,500 | ||||
First Financial Bancorp., 5.25% to 05/15/2025 then 3 mo. Term SOFR + 5.09%, 05/15/2030 | 1,000,000 | 970,331 | ||||
Home BancShares, Inc., 3.13% to 01/30/2027 then 3 mo. Term SOFR + 1.82%, 01/30/2032 | 1,500,000 | 1,260,121 | ||||
National Australia Bank Ltd., 3.35% to 01/12/2032 then 5 yr. CMT Rate + 1.70%, 01/12/2037(a) | 1,000,000 | 874,429 | ||||
Park National Corp., 4.50% to 09/01/2025 then 3 mo. Term SOFR + 4.39%, 09/01/2030 | 1,400,000 | 1,351,000 | ||||
Renasant Corp., 4.50% to 09/15/2030 then 3 mo. Term SOFR + 4.03%, 09/15/2035 | 1,500,000 | 1,139,432 | ||||
Synovus Financial Corp., 7.54% to 02/07/2029 then 5 yr. Mid Swap Rate USD + 3.38%, 02/07/2029 | 1,000,000 | 972,824 | ||||
Texas Capital Bancshares, Inc., 4.00% to 05/06/2026 then 5 yr. CMT Rate + 3.15%, 05/06/2031 | 1,000,000 | 931,486 | ||||
Webster Financial Corp., 3.88% to 11/01/2025 then 3 mo. Term SOFR + 3.69%, 11/01/2030 | 1,000,000 | 930,031 | ||||
Western Alliance Bank, 5.25% to 06/01/2025 then 3 mo. Term SOFR + 5.12%, 06/01/2030 | 1,500,000 | 1,455,967 | ||||
Par | Value | |||||
WSFS Financial Corp., 2.75% to 12/15/2025 then 3 mo. Term SOFR + 2.49%, 12/15/2030 | $ 1,000,000 | $ 891,366 | ||||
14,793,122 | ||||||
Building Products - 0.7% | ||||||
JELD-WEN, Inc., 4.88%, 12/15/2027(a) | 1,000,000 | 967,952 | ||||
Capital Markets - 1.7% | ||||||
Ares Capital Corp., 3.20%, 11/15/2031 | 1,300,000 | 1,122,472 | ||||
MSCI, Inc., 3.63%, 11/01/2031(a) | 1,250,000 | 1,135,309 | ||||
2,257,781 | ||||||
Consumer Finance - 2.8% | ||||||
Ally Financial, Inc., 6.70%, 02/14/2033 | 1,250,000 | 1,288,401 | ||||
Ford Motor Credit Co., LLC, 7.35%, 03/06/2030 | 1,250,000 | 1,353,818 | ||||
OneMain Finance Corp., 5.38%, 11/15/2029 | 1,250,000 | 1,203,588 | ||||
3,845,807 | ||||||
Containers & Packaging - 1.6% | ||||||
Berry Global, Inc., 5.63%, 07/15/2027(a) | 1,000,000 | 1,001,619 | ||||
Graphic Packaging International, LLC, 3.50%, 03/01/2029(a) | 1,255,000 | 1,166,714 | ||||
2,168,333 | ||||||
Diversified Consumer Services - 2.1% | ||||||
Prime Security Services Borrower, LLC, 3.38%, 08/31/2027(a) | 1,000,000 | 947,775 | ||||
Service Corp. International, 4.00%, 05/15/2031 | 1,000,000 | 918,666 | ||||
Washington University, 4.35%, 04/15/2122 | 1,200,000 | 1,026,544 | ||||
2,892,985 | ||||||
Electrical Equipment - 0.9% | ||||||
Sensata Technologies, Inc., 4.38%, 02/15/2030(a) | 1,250,000 | 1,181,591 | ||||
Financial Services - 0.2% | ||||||
Compeer Financial FLCA, 3.38% to 06/01/2031 then SOFR + 1.97%, 06/01/2036(a) | 250,000 | 193,813 | ||||
Hotels, Restaurants & Leisure - 1.9% | ||||||
Station Casinos, LLC, 4.50%, 02/15/2028(a) | 1,250,000 | 1,200,150 | ||||
Wyndham Hotels & Resorts, Inc., 4.38%, 08/15/2028(a) | 1,500,000 | 1,436,890 | ||||
2,637,040 | ||||||
Household Durables - 1.6% | ||||||
Ashton Woods USA, LLC, 6.63%, 01/15/2028(a) | 1,000,000 | 1,008,166 | ||||
42 |
Par | Value | |||||
CORPORATE BONDS - (Continued) | ||||||
Household Durables - (Continued) | ||||||
M/I Homes, Inc., 3.95%, 02/15/2030 | $ 1,300,000 | $ 1,200,854 | ||||
2,209,020 | ||||||
Media - 1.9% | ||||||
CCO Holdings Capital Corp., 4.75%, 02/01/2032(a) | 1,500,000 | 1,308,598 | ||||
Sirius XM Radio, Inc., 3.88%, 09/01/2031(a) | 1,500,000 | 1,288,490 | ||||
2,597,088 | ||||||
Professional Services - 1.8% | ||||||
Amentum Escrow Corp., 7.25%, 08/01/2032(a) | 1,000,000 | 1,048,479 | ||||
Science Applications International Corp., 4.88%, 04/01/2028(a) | 1,500,000 | 1,456,277 | ||||
2,504,756 | ||||||
Real Estate Management & Development - 0.8% | ||||||
Cushman & Wakefield US Borrower, LLC, 8.88%, 09/01/2031(a) | 1,000,000 | 1,083,942 | ||||
Software - 0.9% | ||||||
Open Text Corp., 3.88%, 02/15/2028(a) | 1,250,000 | 1,186,009 | ||||
Specialty Retail - 3.3% | ||||||
Asbury Automotive Group, Inc., 5.00%, 02/15/2032(a) | 1,250,000 | 1,178,058 | ||||
Group 1 Automotive, Inc., 4.00%, 08/15/2028(a) | 1,000,000 | 946,860 | ||||
Ken Garff Automotive, LLC, 4.88%, 09/15/2028(a) | 1,500,000 | 1,458,751 | ||||
Lithia Motors, Inc., 4.38%, 01/15/2031(a) | 1,000,000 | 922,569 | ||||
4,506,238 | ||||||
Technology Hardware, Storage & Peripherals - 0.9% | ||||||
Dell International, LLC, 8.10%, 07/15/2036 | 1,000,000 | 1,231,507 | ||||
TOTAL CORPORATE BONDS (Cost $46,515,310) | 48,262,218 | |||||
NON-AGENCY COMMERCIAL MORTGAGE BACKED SECURITIES - 20.5% | ||||||
BANK | ||||||
Series 2018-BN10, Class D, 2.60%, 02/15/2061(a) | 1,000,000 | 811,390 | ||||
Series 2019-BN23, Class C, 3.62%, 12/15/2052(b) | 1,000,000 | 842,966 | ||||
Series 2020-BN29, Class D, 2.50%, 11/15/2053(a) | 850,000 | 611,605 | ||||
Series 2021-BN35, Class C, 2.90%, 06/15/2064(b) | 1,500,000 | 1,175,223 | ||||
Par | Value | |||||
Series 2022-BN40, Class D, 2.50%, 03/15/2064(a) | $ 1,000,000 | $ 697,673 | ||||
BANK5, Series 2024-5YR8, Class C, 7.00%, 08/15/2057(b) | 1,000,000 | 1,009,145 | ||||
BBCMS Trust | ||||||
Series 2022-C17, Class XA, 1.32%, 09/15/2055(b)(c) | 14,937,482 | 1,099,784 | ||||
Series 2024-5C27, Class XA, 1.04%, 07/15/2057(a)(b)(c) | 35,497,590 | 1,218,728 | ||||
Benchmark Mortgage Trust | ||||||
Series 2021-B26, Class C, 2.99%, 06/15/2054(b) | 1,250,000 | 902,623 | ||||
Series 2021-B27, Class XD, 1.60%, 07/15/2054(a)(b)(c) | 15,000,000 | 1,279,970 | ||||
Series 2021-B29, Class C, 2.75%, 09/15/2054(b) | 1,250,000 | 987,326 | ||||
Series 2024-V6, Class XA, 1.58%, 10/15/2028(b)(c) | 24,992,350 | 1,293,147 | ||||
BMO Mortgage Trust, Series 2023-C7, Class XA, 1.04%, 12/15/2056(a)(b)(c) | 24,992,824 | 1,366,763 | ||||
Citigroup Commercial Mortgage Trust | ||||||
Series 2016-C1, Class C, 5.10%, 05/10/2049(b) | 1,000,000 | 961,088 | ||||
Series 2016-C2, Class B, 3.18%, 08/10/2049 | 1,000,000 | 938,155 | ||||
Computershare Corporate Trust | ||||||
Series 2016-C37, Class D, 3.31%, 12/15/2049(a)(b) | 1,250,000 | 1,114,052 | ||||
Series 2019-C49, Class D, 3.00%, 03/15/2052(a) | 1,500,000 | 1,220,512 | ||||
GS Mortgage Securities Corp. II | ||||||
Series 2012-BWTR, Class A, 2.95%, 11/05/2034(a) | 996,262 | 825,536 | ||||
Series 2012-BWTR, Class B, 3.26%, 11/05/2034(a) | 478,000 | 264,336 | ||||
Morgan Stanley Bank of America Merrill Lynch Trust, Series 2017-C34, Class D, 2.70%, 11/15/2052(a) | 1,000,000 | 601,427 | ||||
Morgan Stanley Capital I Trust | ||||||
Series 2017-H1, Class C, 4.28%, 06/15/2050(b) | 1,500,000 | 1,369,600 | ||||
Series 2017-HR2, Class C, 4.46%, 12/15/2050(b) | 1,400,000 | 1,286,215 | ||||
Series 2019-H7, Class D, 3.00%, 07/15/2052(a) | 1,000,000 | 779,095 | ||||
Morgan Stanley Capital I, Inc., Series 2021-L5, Class C, 3.16%, 05/15/2054 | 1,385,000 | 1,157,607 | ||||
Wells Fargo Commercial Mortgage Trust | ||||||
Series 2015-C28, Class D, 4.22%, 05/15/2048(b) | 1,000,000 | 811,598 | ||||
Series 2018-C43, Class C, 4.51%, 03/15/2051(b) | 1,250,000 | 1,149,349 | ||||
Series 2019-C52, Class C, 3.56%, 08/15/2052 | 1,000,000 | 824,615 | ||||
43 |
Par | Value | |||||
NON-AGENCY COMMERCIAL MORTGAGE BACKED SECURITIES - (Continued) | ||||||
Series 2020-C57, Class C, 4.16%, 08/15/2053(b) | $ 1,500,000 | $1,370,115 | ||||
TOTAL NON-AGENCY COMMERCIAL MORTGAGE BACKED SECURITIES (Cost $27,470,793) | 27,969,643 | |||||
COLLATERALIZED LOAN OBLIGATIONS - 12.3% | ||||||
Apidos CLO | ||||||
Series 2013-12A, Class ER, 10.96% (3 mo. Term SOFR + 5.66%), 04/15/2031(a) | 1,250,000 | 1,245,950 | ||||
Series 2019-31A, Class ER, 12.16% (3 mo. Term SOFR + 6.86%), 04/15/2031(a) | 1,000,000 | 1,000,585 | ||||
Series 2023-46A, Class D, 10.28% (3 mo. Term SOFR + 5.00%), 10/24/2036(a) | 1,000,000 | 1,037,146 | ||||
ARES CLO | ||||||
Series 2015-4A, Class CRR, 8.05% (3 mo. Term SOFR + 2.75%), 10/15/2030(a) | 1,000,000 | 1,000,544 | ||||
Series 2018-47A, Class D, 8.26% (3 mo. Term SOFR + 2.96%), 04/15/2030(a) | 1,000,000 | 1,000,643 | ||||
Series 2018-48A, Class D, 8.24% (3 mo. Term SOFR + 2.96%), 07/20/2030(a) | 1,000,000 | 1,000,304 | ||||
Blackstone, Inc. | ||||||
Series 2018-1A, Class D, 8.06% (3 mo. Term SOFR + 2.76%), 04/15/2031(a) | 1,425,000 | 1,423,926 | ||||
Series 2018-1A, Class E, 10.95% (3 mo. Term SOFR + 5.66%), 04/17/2030(a) | 1,000,000 | 989,697 | ||||
Dryden Senior Loan Fund, Series 2023-105A, Class D, 10.48% (3 mo. Term SOFR + 5.20%), 04/18/2036(a) | 1,500,000 | 1,525,414 | ||||
Goldentree Loan Opportunities Ltd., Series 2022-16A, Class DR, 10.03% (3 mo. Term SOFR + 4.75%), 01/20/2034(a) | 1,000,000 | 1,009,976 | ||||
LCM LP, Series 22A, Class CR, 8.34% (3 mo. Term SOFR + 3.06%), 10/20/2028(a) | 1,000,000 | 1,001,600 | ||||
Long Point Park CLO, Series 2017-1A, Class C, 7.95% (3 mo. Term SOFR + 2.66%), 01/17/2030(a) | 1,250,000 | 1,251,204 | ||||
Neuberger Berman CLO Ltd. | ||||||
Series 2019-33A, Class DR, 8.45% (3 mo. Term SOFR + 3.16%), 10/16/2033(a) | 1,000,000 | 994,075 | ||||
Par | Value | |||||
Series 2019-35A, Class E, 12.54% (3 mo. Term SOFR + 7.26%), 01/19/2033(a) | $ 1,000,000 | $ 998,075 | ||||
Octagon Credit Investors LLC, Series 2022-1A, Class DR, 10.19% (3 mo. Term SOFR + 5.09%), 11/16/2036(a) | 1,250,000 | 1,282,105 | ||||
TOTAL COLLATERALIZED LOAN OBLIGATIONS (Cost $16,506,335) | 16,761,244 | |||||
MUNICIPAL BONDS - 6.9% | ||||||
California - 0.7% | ||||||
California Infrastructure & Economic Development Bank, 8.00%, 01/01/2050(a)(d) | 1,000,000 | 1,009,573 | ||||
Florida - 0.8% | ||||||
City of Gainesville, FL Utilities System Revenue, 6.02%, 10/01/2040 | 1,000,000 | 1,084,946 | ||||
Illinois - 0.5% | ||||||
Metropolitan Pier & Exposition Authority, 0.00%, 06/15/2038(e) | 1,250,000 | 702,427 | ||||
Michigan - 0.8% | ||||||
University of Michigan, 4.45%, 04/01/2122 | 1,221,000 | 1,071,287 | ||||
Ohio - 0.9% | ||||||
Ohio State University, 4.80%, 06/01/2111 | 1,250,000 | 1,172,395 | ||||
Oklahoma - 0.7% | ||||||
Oklahoma Development Finance Authority, 5.45%, 08/15/2028 | 1,000,000 | 963,229 | ||||
Pennsylvania - 0.8% | ||||||
Pennsylvania Turnpike Commission, 3.00%, 12/01/2042 | 1,250,000 | 1,077,353 | ||||
Tennessee - 0.5% | ||||||
New Memphis Arena Public Building Authority, 0.00%, 04/01/2043(e) | 1,625,000 | 680,965 | ||||
Texas - 1.0% | ||||||
Port of Beaumont Industrial Development Authority, 4.10%, 01/01/2028(a) | 1,500,000 | 1,333,885 | ||||
Wisconsin - 0.2% | ||||||
Public Finance Authority, 7.50%, 06/01/2029(a) | 250,000 | 246,079 | ||||
TOTAL MUNICIPAL BONDS (Cost $9,053,532) | 9,342,139 | |||||
44 |
Par | Value | |||||
NON-AGENCY RESIDENTIAL MORTGAGE BACKED SECURITIES - 6.4% | ||||||
Banc of America Alternative Loan Trust, Series 2006-2, Class 4CB1, 6.50%, 03/25/2036 | $ 1,152,306 | $ 956,720 | ||||
Citimortgage Alternative Loan Trust | ||||||
Series 2006-A5, Class 1A13, 5.84% (1 mo. Term SOFR + 0.56%), 10/25/2036 | 1,141,973 | 841,790 | ||||
Series 2007-A1, Class 1A5, 6.00%, 01/25/2037 | 1,636,488 | 1,455,432 | ||||
Countrywide Alternative Loan Trust, Series 2005-80CB, Class 5A1, 6.00%, 02/25/2036 | 1,337,136 | 1,352,979 | ||||
Countrywide Home Loan Mortgage Pass Through Trust, Series 2006-17, Class A8, 6.00% (1 mo. Term SOFR + 0.66%), 12/25/2036 | 344,085 | 145,953 | ||||
Credit Suisse Management, LLC, Series 2005-11, Class 3A3, 5.50%, 12/25/2035 | 355,704 | 151,198 | ||||
Vericrest Opportunity Loan Transferee, Series 2021-NPL4, Class A2, 4.95%, 03/27/2051(a)(f) | 360,229 | 346,190 | ||||
WaMu Mortgage Pass Through Certificates | ||||||
Series 2005-AR14, Class 1A2, 4.90%, 12/25/2035(b) | 1,190,728 | 1,096,222 | ||||
Series 2006-AR12, Class 1A1, 4.49%, 10/25/2036(b) | 1,437,495 | 1,312,287 | ||||
Wells Fargo Mortgage Backed Securities Trust, Series 2007-AR6, Class A1, 6.73%, 10/25/2037(b) | 1,129,570 | 1,087,241 | ||||
TOTAL NON-AGENCY RESIDENTIAL MORTGAGE BACKED SECURITIES (Cost $8,916,186) | 8,746,012 | |||||
U.S. TREASURY SECURITIES - 6.4% | ||||||
United States Treasury Notes/Bonds | ||||||
4.25%, 11/15/2040 | 1,000,000 | 1,016,719 | ||||
3.88%, 05/15/2043 | 2,000,000 | 1,892,578 | ||||
4.38%, 08/15/2043 | 1,000,000 | 1,011,992 | ||||
4.75%, 11/15/2043 | 2,300,000 | 2,443,390 | ||||
4.50%, 02/15/2044 | 1,250,000 | 1,284,180 | ||||
4.63%, 05/15/2044 | 1,000,000 | 1,043,750 | ||||
TOTAL U.S. TREASURY SECURITIES (Cost $8,496,107) | 8,692,609 | |||||
ASSET-BACKED SECURITIES - 6.2% | ||||||
American Credit Acceptance Receivables Trust | ||||||
Series 2021-2, Class E, 2.54%, 07/13/2027(a) | 1,000,000 | 987,873 | ||||
Par | Value | |||||
Series 2021-3, Class E, 2.56%, 11/15/2027(a) | $ 1,000,000 | $980,363 | ||||
CPS Auto Trust, Series 2021-D, Class E, 4.06%, 12/15/2028(a) | 1,000,000 | 970,242 | ||||
Exeter Automobile Receivables Trust, Series 2021-2A, Class E, 2.90%, 07/17/2028(a) | 1,500,000 | 1,448,248 | ||||
GLS Auto Receivables Trust | ||||||
Series 2020-2A, Class D, 7.48%, 04/15/2027(a) | 1,194,296 | 1,199,340 | ||||
Series 2021-2A, Class E, 2.87%, 05/15/2028(a) | 1,000,000 | 956,501 | ||||
Series 2021-3A, Class E, 3.20%, 10/16/2028(a) | 1,000,000 | 951,404 | ||||
Westlake Automobile Receivables Trust, Series 2021-3A, Class E, 3.42%, 04/15/2027(a) | 1,000,000 | 978,901 | ||||
TOTAL ASSET-BACKED SECURITIES (Cost $8,406,322) | 8,472,872 | |||||
Shares | ||||||
SHORT-TERM INVESTMENTS - 4.6% | ||||||
Money Market Funds - 4.6% | ||||||
First American Government Obligations Fund - Class X, 5.23%(g) | 6,201,867 | 6,201,867 | ||||
TOTAL SHORT-TERM INVESTMENTS (Cost $6,201,867) | 6,201,867 | |||||
TOTAL INVESTMENTS - 98.8% (Cost $131,566,452) | $134,448,604 | |||||
Other Assets in Excess of Liabilities - 1.2% | 1,692,266 | |||||
TOTAL NET ASSETS - 100.0% | $136,140,870 | |||||
(a) | Security is exempt from registration pursuant to Rule 144A under the Securities Act of 1933, as amended. These securities may only be resold in transactions exempt from registration to qualified institutional investors. As of August 31, 2024, the value of these securities total $63,958,605 or 47.0% of the Fund’s net assets. |
(b) | Coupon rate is variable or floats based on components including but not limited to reference rate and spread. These securities may not indicate a reference rate and/or spread in their description. The rate disclosed is as of August 31, 2024. |
45 |
(c) | Interest only security. |
(d) | Security subject to the Alternative Minimum Tax (“AMT”). As of August 31, 2024, the total value of securities subject to the AMT was $1,009,573 or 0.7% of net assets. |
(e) | Zero coupon bonds make no periodic interest payments but are issued at a discount from par value. |
(f) | Step coupon bond. The rate disclosed is as of August 31, 2024. |
(g) | The rate shown represents the 7-day effective yield as of August 31, 2024. |
46 |
Par | Value | |||||
COLLATERALIZED LOAN OBLIGATIONS - 24.5% | ||||||
AMMC CDO, Series 2016-18A, Class BR, 6.93% (3 mo. Term SOFR + 1.86%), 05/26/2031(a) | $250,000 | $249,988 | ||||
Apidos CLO, Series 2013-12A, Class ER, 10.96% (3 mo. Term SOFR + 5.66%), 04/15/2031(a) | 250,000 | 247,315 | ||||
ARES CLO | ||||||
Series 2014-32RA, Class B, 7.18% (3 mo. Term SOFR + 2.06%), 05/15/2030(a) | 250,000 | 249,455 | ||||
Series 2015-4A, Class A3RR, 6.70% (3 mo. Term SOFR + 1.40%), 10/15/2030(a) | 250,000 | 249,439 | ||||
Blackstone, Inc., Series 2018-1A, Class D, 8.15% (3 mo. Term SOFR + 2.86%), 04/17/2030(a) | 250,000 | 248,676 | ||||
BlueMountain CLO Ltd., Series 2017-3A, Class C, 7.26% (3 mo. Term SOFR + 1.96%), 01/15/2030(a) | 250,000 | 249,518 | ||||
Galaxy CLO Ltd., Series 2018-26A, Class BR, 6.72% (3 mo. Term SOFR + 1.60%), 11/22/2031(a) | 250,000 | 250,046 | ||||
Madison Park Funding Ltd., Series 2016-24A, Class CR2, 7.33% (3 mo. Term SOFR + 2.05%), 10/20/2029(a) | 250,000 | 250,206 | ||||
Myers Park CLO, Series 2018-1A, Class B1, 7.14% (3 mo. Term SOFR + 1.86%), 10/20/2030(a) | 310,000 | 309,966 | ||||
Octagon Investment Partners Ltd., Series 2017-1A, Class CR, 7.61% (3 mo. Term SOFR + 2.31%), 07/15/2029(a) | 300,000 | 299,785 | ||||
Octagon Investment Partners XXII LLC, Series 2014-1A, Class DRR, 8.29% (3 mo. Term SOFR + 3.01%), 01/22/2030(a) | 250,000 | 247,845 | ||||
Voya CLO Ltd., Series 2016-3A, Class A3R2, 6.98% (3 mo. Term SOFR + 1.70%), 10/18/2031(a) | 250,000 | 249,730 | ||||
TOTAL COLLATERALIZED LOAN OBLIGATIONS (Cost $3,108,218) | 3,101,969 | |||||
ASSET-BACKED SECURITIES - 21.1% | ||||||
American Credit Acceptance Receivables Trust, Series 2024-2, Class C, 6.24%, 04/12/2030(a) | 250,000 | 254,349 | ||||
AmeriCredit Automobile Receivables Trust, Series 2023-2, Class A2, 6.19%, 04/19/2027 | 135,309 | 135,838 | ||||
CPS Auto Trust, Series 2023-A, Class C, 5.54%, 04/16/2029(a) | 250,000 | 250,455 | ||||
Par | Value | |||||
Exeter Automobile Receivables Trust, Series 2023-1A, Class D, 6.69%, 06/15/2029 | $250,000 | $255,369 | ||||
GLS Auto Receivables Trust | ||||||
Series 2023-2A, Class B, 5.52%, 11/15/2027(a) | 250,000 | 250,511 | ||||
Series 2023-2A, Class C, 5.69%, 03/15/2029(a) | 250,000 | 250,495 | ||||
Santander Drive Auto Receivables Trust | ||||||
Series 2023-2, Class A3, 5.21%, 07/15/2027 | 211,721 | 211,548 | ||||
Series 2023-4, Class B, 5.77%, 12/15/2028 | 200,000 | 202,875 | ||||
Series 2024-2, Class A3, 5.63%, 11/15/2028 | 200,000 | 202,661 | ||||
Westlake Automobile Receivables Trust | ||||||
Series 2021-1A, Class E, 2.33%, 08/17/2026(a) | 250,000 | 245,148 | ||||
Series 2021-2A, Class E, 2.38%, 03/15/2027(a) | 250,000 | 242,687 | ||||
Series 2023-3A, Class B, 5.92%, 09/15/2028(a) | 170,000 | 171,942 | ||||
TOTAL ASSET-BACKED SECURITIES (Cost $2,649,659) | 2,673,878 | |||||
NON-AGENCY COMMERCIAL MORTGAGE BACKED SECURITIES - 18.5% | ||||||
BANK5 | ||||||
Series 2023-5YR3, Class B, 7.56%, 09/15/2056(b) | 225,000 | 238,896 | ||||
Series 2024-5YR6, Class XA, 0.98%, 05/15/2057(a)(b)(c) | 9,999,145 | 305,554 | ||||
Series 2024-5YR7, Class XA, 1.57%, 06/15/2057(b)(c) | 4,799,825 | 263,634 | ||||
Series 2024-5YR9, Class AS, 6.18%, 08/15/2057(b) | 300,000 | 309,093 | ||||
BBCMS Trust, Series 2024-5C27, Class XA, 1.04%, 07/15/2057(a)(b)(c) | 8,399,430 | 288,089 | ||||
Computershare Corporate Trust | ||||||
Series 2016-C37, Class D, 3.31%, 12/15/2049(a)(b) | 250,000 | 221,724 | ||||
Series 2018-C43, Class B, 4.25%, 03/15/2051(b) | 250,000 | 234,507 | ||||
Series 2019-C49, Class D, 3.00%, 03/15/2052(a) | 250,000 | 201,682 | ||||
Morgan Stanley Capital I Trust, Series 2017-H1, Class B, 4.08%, 06/15/2050 | 300,000 | 279,798 | ||||
TOTAL NON-AGENCY COMMERCIAL MORTGAGE BACKED SECURITIES (Cost $2,313,557) | 2,342,977 | |||||
47 |
Par | Value | |||||
CORPORATE BONDS - 7.7% | ||||||
Banks - 5.6% | ||||||
Bank of America Corp., 6.30% to 03/10/2026 then 3 mo. Term SOFR + 4.81%, Perpetual | $175,000 | $176,157 | ||||
Bank OZK, 2.75% to 10/01/2026 then 3 mo. Term SOFR + 2.09%, 10/01/2031 | 200,000 | 159,603 | ||||
Pacific Premier Bancorp, Inc., 5.38% to 06/15/2025 then 3 mo. Term SOFR + 5.17%, 06/15/2030 | 138,000 | 133,027 | ||||
Park National Corp., 4.50% to 09/01/2025 then 3 mo. Term SOFR + 4.39%, 09/01/2030 | 250,000 | 238,750 | ||||
707,537 | ||||||
Consumer Finance - 0.7% | ||||||
OneMain Finance Corp., 3.88%, 09/15/2028 | 100,000 | 91,989 | ||||
Media - 1.4% | ||||||
Sirius XM Radio, Inc., 5.00%, 08/01/2027(a) | 183,000 | 178,681 | ||||
TOTAL CORPORATE BONDS (Cost $978,254) | 978,207 | |||||
AGENCY COMMERCIAL MORTGAGE BACKED SECURITIES - 7.3% | ||||||
Freddie Mac Multifamily Structured Pass Through Certificates | ||||||
Series K098, Class XAM, 1.52%, 08/25/2029(b)(c) | 1,985,000 | 120,246 | ||||
Series K107, Class X1, 1.71%, 01/25/2030(b)(c) | 4,224,854 | 297,019 | ||||
Series K115, Class X1, 1.42%, 06/25/2030(b)(c) | 3,490,968 | 217,161 | ||||
Series K744, Class X1, 0.96%, 07/25/2028(b)(c) | 10,472,903 | 292,554 | ||||
TOTAL AGENCY COMMERCIAL MORTGAGE BACKED SECURITIES (Cost $918,974) | 926,980 | |||||
U.S. TREASURY SECURITIES - 5.8% | ||||||
United States Treasury Notes/Bonds | ||||||
3.88%, 05/15/2043 | 175,000 | 165,600 | ||||
4.38%, 08/15/2043 | 175,000 | 177,099 | ||||
4.75%, 11/15/2043 | 175,000 | 185,910 | ||||
4.50%, 02/15/2044 | 200,000 | 205,469 | ||||
TOTAL U.S. TREASURY SECURITIES (Cost $678,691) | 734,078 | |||||
Par | Value | |||||
NON-AGENCY RESIDENTIAL MORTGAGE BACKED SECURITIES - 2.2% | ||||||
Wells Fargo Mortgage Backed Securities Trust, Series 2007-AR6, Class A1, 6.73%, 10/25/2037(b) | $282,393 | $270,978 | ||||
TOTAL NON-AGENCY RESIDENTIAL MORTGAGE BACKED SECURITIES (Cost $265,726) | 270,978 | |||||
MUNICIPAL BONDS - 1.9% | ||||||
Oklahoma Development Finance Authority, 5.45%, 08/15/2028 | 250,000 | 240,512 | ||||
TOTAL MUNICIPAL BONDS (Cost $237,012) | 240,512 | |||||
Shares | ||||||
SHORT-TERM INVESTMENTS - 12.6% | ||||||
Money Market Funds - 2.9% | ||||||
First American Government Obligations Fund - Class X, 5.23%(d) | 363,400 | 363,400 | ||||
Par | ||||||
U.S. Treasury Bills - 9.7% | ||||||
5.45%, 09/17/2024(e) | 250,000 | 249,492 | ||||
5.43%, 10/22/2024(e) | 400,000 | 397,217 | ||||
5.94%, 11/14/2024(e) | 250,000 | 247,503 | ||||
7.11%, 03/20/2025(e) | 350,000 | 341,696 | ||||
1,235,908 | ||||||
TOTAL SHORT-TERM INVESTMENTS (Cost $1,597,922) | 1,599,308 | |||||
TOTAL INVESTMENTS - 101.6% (Cost $12,748,013) | $12,868,887 | |||||
Liabilities in Excess of Other Assets - (1.6)% | (204,014) | |||||
TOTAL NET ASSETS - 100.0% | $12,664,873 | |||||
(a) | Security is exempt from registration pursuant to Rule 144A under the Securities Act of 1933, as amended. These securities may only be resold in transactions exempt from registration to qualified institutional investors. As of August 31, 2024, the value of these securities total $5,963,286 or 47.1% of the Fund’s net assets. |
(b) | Coupon rate is variable or floats based on components including but not limited to reference rate and spread. These securities may not indicate a reference rate and/or spread in their description. The rate disclosed is as of August 31, 2024. |
(c) | Interest only security. |
(d) | The rate shown represents the 7-day effective yield as of August 31, 2024. |
(e) | The rate shown is the effective yield as of August 31, 2024. |
48 |
Performance Trust Total Return Bond Fund | Performance Trust Municipal Bond Fund | Performance Trust Multisector Bond Fund | Performance Trust Short Term Bond ETF | |||||||||
Assets | ||||||||||||
Investments in unaffiliated securities, at value (cost $8,244,502,640, $727,362,629, $131,566,452 and $12,748,013, respectively) | $8,023,054,298 | $747,779,867 | $134,448,604 | $12,868,887 | ||||||||
Investments in affiliated securities, at value (cost $1,011,600) (Note 8) | 1,014,200 | — | — | — | ||||||||
Dividend and interest receivable | 72,180,814 | 6,625,304 | 1,249,011 | 105,340 | ||||||||
Receivable for fund shares sold | 16,418,313 | 564,492 | 498,761 | — | ||||||||
Other assets | 158,552 | 36,528 | 8,082 | 1,139 | ||||||||
Total assets | 8,112,826,177 | 755,006,191 | 136,204,458 | 12,975,366 | ||||||||
Liabilities | ||||||||||||
Payable for investments purchased | 54,630,457 | 27,878,539 | — | 310,493 | ||||||||
Payable for fund shares redeemed | 2,931,757 | 251,710 | 21,379 | — | ||||||||
Payable to adviser (Note 4) | 1,301,717 | 15,115 | 11,414 | — | ||||||||
Payable to affiliates | 762,463 | 80,347 | 22,288 | — | ||||||||
Payable for distribution fees | 39,392 | 4,194 | — | — | ||||||||
Payable for shareholder servicing fees | 20,462 | — | — | — | ||||||||
Accrued expenses and other liabilities | 807,670 | 18,886 | 8,507 | — | ||||||||
Total liabilities | 60,493,918 | 28,248,791 | 63,588 | 310,493 | ||||||||
Net Assets | 8,052,332,259 | 726,757,400 | 136,140,870 | 12,664,873 | ||||||||
Net Assets Consist of: | ||||||||||||
Paid-in capital | $8,821,079,865 | $799,737,048 | $136,648,922 | $12,508,752 | ||||||||
Total accumulated gain (loss) | (768,747,606) | (72,979,648) | (508,052) | 156,121 | ||||||||
Net assets | $8,052,332,259 | $726,757,400 | $136,140,870 | $12,664,873 | ||||||||
Total Return Bond Fund, Municipal Bond Fund and Multisector Bond Fund Shares - Institutional Class | ||||||||||||
Net assets | $7,962,595,613 | $706,807,451 | $136,140,870 | |||||||||
Shares of beneficial interest outstanding (unlimited number of shares authorized, $0.001 par value) | 396,551,955 | 30,516,329 | 15,045,150 | |||||||||
Net asset value, redemption and offering price per share | $20.08 | $23.16 | $9.05 | |||||||||
49 |
Performance Trust Total Return Bond Fund | Performance Trust Municipal Bond Fund | Performance Trust Multisector Bond Fund | Performance Trust Short Term Bond ETF | |||||||||
Total Return Bond Fund and Municipal Bond Fund Shares - Class A | ||||||||||||
Net assets | $38,273,257 | $19,949,949 | ||||||||||
Shares of beneficial interest outstanding (unlimited number of shares authorized, $0.001 par value) | 1,906,025 | 860,578 | ||||||||||
Net asset value, redemption and offering price per share | $20.08 | $23.18 | ||||||||||
Maximum offering price per share (Net asset value per share divided by 0.9775)(1) | $20.54 | $23.72 | ||||||||||
Total Return Bond Fund Shares - Class C | ||||||||||||
Net assets | $51,463,389 | |||||||||||
Shares of beneficial interest outstanding (unlimited number of shares authorized, $0.001 par value) | 2,574,341 | |||||||||||
Net asset value, redemption and offering price per share | $19.99 | |||||||||||
Short Term Bond ETF Shares - Total Fund | ||||||||||||
Net assets | $12,664,873 | |||||||||||
Shares of beneficial interest outstanding (unlimited number of shares authorized, $0.001 par value) | 500,000 | |||||||||||
Net asset value, redemption and offering price per share | $25.33 | |||||||||||
(1) | Reflects a maximum sales charge of 2.25% |
50 |
Performance Trust Total Return Bond Fund | Performance Trust Municipal Bond Fund | Performance Trust Multisector Bond Fund | Performance Trust Short Term Bond ETF(1) | |||||||||
Investment Income | ||||||||||||
Interest income | $346,118,631 | $28,835,533 | $7,338,138 | $269,013 | ||||||||
Total investment income | 346,118,631 | 28,835,533 | 7,338,138 | 269,013 | ||||||||
Expenses | ||||||||||||
Advisory fees (Note 4) | 39,787,564 | 2,681,761 | 837,896 | 27,127 | ||||||||
Sub-transfer agent fees | 5,700,427 | — | — | — | ||||||||
Administration and accounting fees | 2,601,023 | 292,935 | 77,620 | — | ||||||||
Transfer agent fees and expenses | 1,025,135 | 105,144 | 25,022 | — | ||||||||
Federal and state registration fees | 518,290 | 95,477 | 31,273 | — | ||||||||
Distribution fees – Class C | 343,407 | — | — | — | ||||||||
Reports to shareholders | 335,599 | 21,732 | 5,475 | — | ||||||||
Custody fees | 327,847 | 34,422 | 6,077 | — | ||||||||
Shareholder servicing fees – Class C | 114,469 | — | — | — | ||||||||
Distribution fees – Class A | 78,658 | 77,765 | — | — | ||||||||
Audit and tax fees | 41,750 | 21,600 | 21,600 | — | ||||||||
Legal fees | 34,841 | 14,209 | 12,265 | — | ||||||||
Insurance expense | 30,429 | 5,867 | 3,257 | — | ||||||||
Trustees’ fees | 24,854 | 24,854 | 24,854 | — | ||||||||
Chief Compliance Officer fees | 11,667 | 11,667 | 11,667 | — | ||||||||
Interest expense | — | — | 17,110 | — | ||||||||
Other expenses | 41,904 | 9,854 | 6,179 | — | ||||||||
Total expenses | 51,017,864 | 3,397,287 | 1,080,295 | 27,127 | ||||||||
Expense reimbursement by adviser (Note 4) | — | — | (26,576) | — | ||||||||
Net expenses | 51,017,864 | 3,397,287 | 1,053,719 | 27,127 | ||||||||
Net investment income | 295,100,767 | 25,438,246 | 6,284,419 | 241,886 | ||||||||
Realized and Unrealized Gain (Loss) on Investments | ||||||||||||
Net realized gain (loss) from: | ||||||||||||
Unaffiliated issuers | (191,084,206) | (8,530,162) | 222,773 | (3,814) | ||||||||
Affiliated issuers (Note 8) | — | — | — | — | ||||||||
Change in net unrealized appreciation/ depreciation from investments | ||||||||||||
Unaffiliated issuers | 505,341,652 | 36,643,805 | 6,835,278 | 120,874 | ||||||||
Affiliated issuers (Note 8) | 2,600 | — | — | — | ||||||||
Net realized and unrealized gain on investments | 314,260,046 | 28,113,643 | 7,058,051 | 117,060 | ||||||||
Net Increase in Net Assets from Operations | $609,360,813 | $53,551,889 | $13,342,470 | $358,946 | ||||||||
(1) | The inception date for the Fund was April 8, 2024 and investment operations commenced April 9, 2024. |
51 |
Year Ended August 31, | ||||||
2024 | 2023 | |||||
From Operations | ||||||
Net investment income | $295,100,767 | $204,968,824 | ||||
Net realized loss from investments | (191,084,206) | (231,808,333) | ||||
Change in net unrealized appreciation from investments | 505,344,252 | 22,979,067 | ||||
Net increase (decrease) in net assets from operations | 609,360,813 | (3,860,442) | ||||
From Distributions | ||||||
Distributions | ||||||
Institutional Class | (290,301,547) | (204,912,825) | ||||
Class A | (1,316,452) | (1,118,873) | ||||
Class C | (1,593,320) | (1,234,132) | ||||
Decrease in net assets resulting from distributions paid | (293,211,319) | (207,265,830) | ||||
From Capital Share Transactions | ||||||
Proceeds from shares sold | ||||||
Institutional Class | 3,566,155,574 | 2,537,736,439 | ||||
Class A | 19,783,554 | 14,637,086 | ||||
Class C | 17,996,780 | 6,801,990 | ||||
Shares issued in reinvestment of distributions declared | ||||||
Institutional Class | 252,281,268 | 179,815,401 | ||||
Class A | 1,268,006 | 1,066,967 | ||||
Class C | 1,585,632 | 1,232,346 | ||||
Cost for shares redeemed | ||||||
Institutional Class | (1,880,613,477) | (2,263,701,105) | ||||
Class A | (13,436,801) | (17,867,623) | ||||
Class C | (12,342,818) | (11,396,206) | ||||
Net increase in net assets from capital share transactions | 1,952,677,718 | 448,325,295 | ||||
Total increase in net assets | $2,268,827,212 | $237,199,023 | ||||
Net Assets | ||||||
Beginning of year | 5,783,505,047 | 5,546,306,024 | ||||
End of year | $8,052,332,259 | $5,783,505,047 | ||||
52 |
Year Ended August 31, | ||||||
2024 | 2023 | |||||
From Operations | ||||||
Net investment income | $25,438,246 | $22,808,967 | ||||
Net realized loss from investments | (8,530,162) | (35,660,856) | ||||
Change in net unrealized appreciation from investments | 36,643,805 | 14,938,824 | ||||
Net increase in net assets from operations | 53,551,889 | 2,086,935 | ||||
From Distributions | ||||||
Distributions | ||||||
Institutional Class | (24,385,730) | (21,059,221) | ||||
Class A | (1,079,218) | (1,245,577) | ||||
Decrease in net assets resulting from distributions paid | (25,464,948) | (22,304,798) | ||||
From Capital Share Transactions | ||||||
Proceeds from shares sold | ||||||
Institutional Class | 333,841,958 | 323,241,552 | ||||
Class A | 17,475,083 | 15,146,083 | ||||
Shares issued in reinvestment of distributions declared | ||||||
Institutional Class | 21,502,857 | 18,735,579 | ||||
Class A | 1,032,054 | 1,177,425 | ||||
Cost for shares redeemed | ||||||
Institutional Class | (263,739,709) | (404,806,981) | ||||
Class A | (34,287,043) | (26,368,296) | ||||
Net increase (decrease) in net assets from capital share transactions | 75,825,200 | (72,874,638) | ||||
Total increase (decrease) in net assets | $103,912,141 | $(93,092,501) | ||||
Net Assets | ||||||
Beginning of year | 622,845,259 | 715,937,760 | ||||
End of year | $726,757,400 | $622,845,259 | ||||
53 |
Year Ended August 31, | ||||||
2024 | 2023 | |||||
From Operations | ||||||
Net investment income | $6,284,419 | $5,046,932 | ||||
Net realized income (loss) from investments | 222,773 | (3,458,486) | ||||
Change in net unrealized appreciation from investments | 6,835,278 | 1,093,792 | ||||
Net increase in net assets from operations | 13,342,470 | 2,682,238 | ||||
From Distributions | ||||||
Distributions - Institutional Class | (6,245,595) | (5,020,968) | ||||
Decrease in net assets resulting from distributions paid | (6,245,595) | (5,020,968) | ||||
From Capital Share Transactions | ||||||
Proceeds from shares sold - Institutional Class | 51,101,277 | 41,110,523 | ||||
Shares issued in reinvestment of distributions declared - Institutional Class | 6,135,817 | 4,935,606 | ||||
Cost for shares redeemed - Institutional Class | (17,663,001) | (36,252,578) | ||||
Net increase in net assets from capital share transactions | 39,574,093 | 9,793,551 | ||||
Total increase in net assets | $46,670,968 | $7,454,821 | ||||
Net Assets | ||||||
Beginning of year | 89,469,902 | 82,015,081 | ||||
End of year | $136,140,870 | $89,469,902 | ||||
54 |
Period Ended August 31, 2024(1) | |||
From Operations | |||
Net investment income | $241,886 | ||
Net realized loss from investments | (3,814) | ||
Change in net unrealized appreciation from investments | 120,874 | ||
Net increase in net assets from operations | 358,946 | ||
From Distributions | |||
Distributions - Institutional Class | (202,825) | ||
Decrease in net assets resulting from distributions paid | (202,825) | ||
From Capital Share Transactions | |||
Proceeds from shares sold | 12,502,750 | ||
Transaction fees | 6,002 | ||
Net increase in net assets from capital share transactions | 12,508,752 | ||
Total increase in net assets | $12,664,873 | ||
Net Assets | |||
Beginning of period | — | ||
End of period | $12,664,873 | ||
(1) | The inception date for the Fund was April 8, 2024 and investment operations commenced April 9, 2024. |
55 |
Year Ended August 31, | |||||||||||||||
2024 | 2023 | 2022 | 2021 | 2020 | |||||||||||
Net asset value, beginning of year | $19.18 | $19.89 | $23.17 | $22.99 | $23.22 | ||||||||||
Income (loss) from investment operations: | |||||||||||||||
Net investment income(1) | 0.86 | 0.75 | 0.72 | 0.78 | 0.82 | ||||||||||
Net realized and unrealized gain (loss) on investments(2) | 0.90 | (0.70) | (3.22) | 0.23 | (0.18) | ||||||||||
Total from investment operations | 1.76 | 0.05 | (2.50) | 1.01 | 0.64 | ||||||||||
Less distributions paid: | |||||||||||||||
From net investment income | (0.86) | (0.76) | (0.70) | (0.83) | (0.87) | ||||||||||
From net realized gain on investments | — | — | (0.08) | — | — | ||||||||||
Total distributions paid | (0.86) | (0.76) | (0.78) | (0.83) | (0.87) | ||||||||||
Paid-in capital from redemption fees (Note 2) | — | — | — | — | 0.00(3) | ||||||||||
Net asset value, end of year | $20.08 | $19.18 | $19.89 | $23.17 | $22.99 | ||||||||||
Total return | 9.45% | 0.30% | -11.00% | 4.49% | 2.87% | ||||||||||
Supplemental Data and Ratios: | |||||||||||||||
Net assets at end of year (000’s) | $7,962,596 | $5,712,347 | $5,466,750 | $6,327,797 | $4,264,846 | ||||||||||
Ratio of expenses to average net assets | 0.76% | 0.76% | 0.75% | 0.76% | 0.78% | ||||||||||
Ratio of net investment income to average net assets | 4.46% | 3.90% | 3.34% | 3.39% | 3.64% | ||||||||||
Portfolio turnover rate(4) | 33.62% | 35.55% | 53.11% | 30.80% | 41.75% | ||||||||||
(1) | Per share net investment income was calculated using the average shares outstanding method. |
(2) | Realized gains and losses per share in the caption are balancing amounts necessary to reconcile the change in net asset value per share for the period, and may not reconcile with the aggregate gains and losses in the Statements of Operations due to share transactions for the period. |
(3) | Rounds to less than $0.005 per share. |
(4) | Portfolio turnover rates are calculated at the Fund level (not by individual share class). |
56 |
Year Ended August 31, | |||||||||||||||
2024 | 2023 | 2022 | 2021 | 2020 | |||||||||||
Net asset value, beginning of year | $19.18 | $19.89 | $23.18 | $22.99 | $23.23 | ||||||||||
INCOME (LOSS) FROM INVESTMENT OPERATIONS: | |||||||||||||||
Net investment income(1) | 0.82 | 0.70 | 0.67 | 0.72 | 0.76 | ||||||||||
Net realized and unrealized gain (loss) on investments(2) | 0.90 | (0.70) | (3.23) | 0.24 | (0.18) | ||||||||||
Total from investment operations | 1.72 | 0.00 | (2.56) | 0.96 | 0.58 | ||||||||||
LESS DISTRIBUTIONS PAID: | |||||||||||||||
From net investment income | (0.82) | (0.71) | (0.65) | (0.77) | (0.82) | ||||||||||
From net realized gain on investments | — | — | (0.08) | — | — | ||||||||||
Total distributions paid | (0.82) | (0.71) | (0.73) | (0.77) | (0.82) | ||||||||||
Paid-in capital from redemption fees (Note 2) | — | — | — | — | 0.00(3) | ||||||||||
Net asset value, end of year | $20.08 | $19.18 | $19.89 | $23.18 | $22.99 | ||||||||||
Total return(4) | 9.19% | 0.05% | -11.26% | 4.28% | 2.60% | ||||||||||
SUPPLEMENTAL DATA AND RATIOS: | |||||||||||||||
Net assets at end of year (000’s) | $38,273 | $29,145 | $32,476 | $32,802 | $19,297 | ||||||||||
Ratio of expenses to average net assets | 1.01% | 1.01% | 1.00% | 1.01% | 1.03% | ||||||||||
Ratio of net investment income to average net assets | 4.21% | 3.63% | 3.12% | 3.12% | 3.40% | ||||||||||
Portfolio turnover rate(5) | 33.62% | 35.55% | 53.11% | 30.80% | 41.75% | ||||||||||
(1) | Per share net investment income was calculated using the average shares outstanding method. |
(2) | Realized gains and losses per share in the caption are balancing amounts necessary to reconcile the change in net asset value per share for the period, and may not reconcile with the aggregate gains and losses in the Statements of Operations due to share transactions for the period. |
(3) | Rounds to less than $0.005 per share. |
(4) | Based on net asset value, which does not reflect sales charge. |
(5) | Portfolio turnover rates are calculated at the Fund level (not by individual share class). |
57 |
Year Ended August 31, | |||||||||||||||
2024 | 2023 | 2022 | 2021 | 2020 | |||||||||||
Net asset value, beginning of year | $19.11 | $19.81 | $23.10 | $22.92 | $23.18 | ||||||||||
INCOME (LOSS) FROM INVESTMENT OPERATIONS: | |||||||||||||||
Net investment income(1) | 0.67 | 0.56 | 0.52 | 0.55 | 0.59 | ||||||||||
Net realized and unrealized gain (loss) on investments(2) | 0.88 | (0.69) | (3.23) | 0.24 | (0.18) | ||||||||||
Total from investment operations | 1.55 | (0.13) | (2.71) | 0.79 | 0.41 | ||||||||||
LESS DISTRIBUTIONS PAID: | |||||||||||||||
From net investment income | (0.67) | (0.57) | (0.50) | (0.61) | (0.67) | ||||||||||
From net realized gain on investments | — | — | (0.08) | — | — | ||||||||||
Total distributions paid | (0.67) | (0.57) | (0.58) | (0.61) | (0.67) | ||||||||||
Paid-in capital from redemption fees (Note 2) | — | — | — | — | 0.00 (3) | ||||||||||
Net asset value, end of year | $19.99 | $19.11 | $19.81 | $23.10 | $22.92 | ||||||||||
Total return | 8.31% | -0.65% | -11.92% | 3.49% | 1.83% | ||||||||||
SUPPLEMENTAL DATA AND RATIOS: | |||||||||||||||
Net assets at end of year (000’s) | $51,463 | $42,012 | $47,081 | $56,625 | $31,184 | ||||||||||
Ratio of expenses to average net assets | 1.76% | 1.76% | 1.75% | 1.76% | 1.78% | ||||||||||
Ratio of net investment income to average net assets | 3.46% | 2.88% | 2.33% | 2.37% | 2.66% | ||||||||||
Portfolio turnover rate(4) | 33.62% | 35.55% | 53.11% | 30.80% | 41.75% | ||||||||||
(1) | Per share net investment income was calculated using the average shares outstanding method. |
(2) | Realized gains and losses per share in the caption are balancing amounts necessary to reconcile the change in net asset value per |
(3) | Rounds to less than $0.005 per share. |
(4) | Portfolio turnover rates are calculated at the Fund level (not by individual share class). |
58 |
Year Ended August 31, | |||||||||||||||
2024 | 2023 | 2022 | 2021 | 2020 | |||||||||||
Net asset value, beginning of year | $22.05 | $22.65 | $25.94 | $25.52 | $25.49 | ||||||||||
INCOME (LOSS) FROM INVESTMENT OPERATIONS: | |||||||||||||||
Net investment income(1) | 0.86 | 0.82 | 0.50 | 0.49 | 0.54 | ||||||||||
Net realized and unrealized gain (loss) on investments(2) | 1.12 | (0.62) | (3.31) | 0.61 | 0.22 | ||||||||||
Total from investment operations | 1.98 | 0.20 | (2.81) | 1.10 | 0.76 | ||||||||||
LESS DISTRIBUTIONS PAID: | |||||||||||||||
From net investment income | (0.87) | (0.80) | (0.48) | (0.58) | (0.66) | ||||||||||
From return of capital | — | — | — | (0.06) | — | ||||||||||
From net realized gain on investments | — | — | — | (0.04) | (0.07) | ||||||||||
Total distributions paid | (0.87) | (0.80) | (0.48) | (0.68) | (0.73) | ||||||||||
Paid-in capital from redemption fees (Note 2) | — | — | — | — | 0.00(3) | ||||||||||
Net asset value, end of year | $23.16 | $22.05 | $22.65 | $25.94 | $25.52 | ||||||||||
Total return | 9.14% | 0.88% | -10.96% | 4.35% | 3.07% | ||||||||||
SUPPLEMENTAL DATA AND RATIOS: | |||||||||||||||
Net assets at end of year (000’s) | $706,807 | $588,234 | $670,095 | $818,825 | $500,176 | ||||||||||
RATIO OF EXPENSES TO AVERAGE NET ASSETS: | |||||||||||||||
Before waiver, expense reimbursements and recoupments | 0.50% | 0.49% | 0.48% | 0.49% | 0.53% | ||||||||||
After waiver, expense reimbursements and recoupments | 0.50% | 0.49% | 0.48% | 0.50% | 0.55% | ||||||||||
RATIO OF NET INVESTMENT INCOME TO AVERAGE NET ASSETS: | |||||||||||||||
Before waiver, expense reimbursements and recoupments | 3.81% | 3.65% | 2.02% | 1.92% | 2.19% | ||||||||||
After waiver, expense reimbursements and recoupments | 3.81% | 3.65% | 2.02% | 1.91% | 2.17% | ||||||||||
Portfolio turnover rate(4) | 59.72% | 68.24% | 81.53% | 15.91% | 27.12% | ||||||||||
(1) | Per share net investment income was calculated using the average shares outstanding method. |
(2) | Realized gains and losses per share in the caption are balancing amounts necessary to reconcile the change in net asset value per share for the period, and may not reconcile with the aggregate gains and losses in the Statements of Operations due to share transactions for the period. |
(3) | Rounds to less than $0.005 per share. |
(4) | Portfolio turnover rates are calculated at the Fund level (not by individual share class). |
59 |
Year Ended August 31, | |||||||||||||||
2024 | 2023 | 2022 | 2021 | 2020 | |||||||||||
Net asset value, beginning of year | $22.07 | $22.67 | $25.96 | $25.54 | $25.51 | ||||||||||
INCOME (LOSS) FROM INVESTMENT OPERATIONS: | |||||||||||||||
Net investment income(1) | 0.80 | 0.76 | 0.44 | 0.42 | 0.48 | ||||||||||
Net realized and unrealized gain (loss) on investments(2) | 1.11 | (0.62) | (3.31) | 0.61 | 0.22 | ||||||||||
Total from investment operations | 1.91 | 0.14 | (2.87) | 1.03 | 0.70 | ||||||||||
LESS DISTRIBUTIONS PAID: | |||||||||||||||
From net investment income | (0.80) | (0.74) | (0.42) | (0.50) | (0.60) | ||||||||||
From return of capital | — | — | — | (0.07) | — | ||||||||||
From net realized gain on investments | — | — | — | (0.04) | (0.07) | ||||||||||
Total distributions paid | (0.80) | (0.74) | (0.42) | (0.61) | (0.67) | ||||||||||
Paid-in capital from redemption fees (Note 2) | — | — | — | — | 0.00(3) | ||||||||||
Net asset value, end of year | $23.18 | $22.07 | $22.67 | $25.96 | $25.54 | ||||||||||
Total return(4) | 8.84% | 0.62% | -11.17% | 4.09% | 2.83% | ||||||||||
SUPPLEMENTAL DATA AND RATIOS: | |||||||||||||||
Net assets at end of year (000’s) | $19,950 | $34,611 | $45,843 | $55,918 | $42,552 | ||||||||||
RATIO OF EXPENSES TO AVERAGE NET ASSETS: | |||||||||||||||
Before waiver, expense reimbursements and recoupments | 0.74% | 0.74% | 0.73% | 0.74% | 0.78% | ||||||||||
After waiver, expense reimbursements and recoupments | 0.74% | 0.74% | 0.73% | 0.77% | 0.80% | ||||||||||
RATIO OF NET INVESTMENT INCOME TO AVERAGE NET ASSETS: | |||||||||||||||
Before waiver, expense reimbursements and recoupments | 3.56% | 3.39% | 1.78% | 1.67% | 1.93% | ||||||||||
After waiver, expense reimbursements and recoupments | 3.56% | 3.39% | 1.78% | 1.64% | 1.91% | ||||||||||
Portfolio turnover rate(5) | 59.72% | 68.24% | 81.53% | 15.91% | 27.12% | ||||||||||
(1) | Per share net investment income was calculated using the average shares outstanding method. |
(2) | Realized gains and losses per share in the caption are balancing amounts necessary to reconcile the change in net asset value per share for the period, and may not reconcile with the aggregate gains and losses in the Statements of Operations due to share transactions for the period. |
(3) | Rounds to less than $0.005 per share. |
(4) | Based on net asset value, which does not reflect sales charge. |
(5) | Portfolio turnover rates are calculated at the Fund level (not by individual share class). |
60 |
Year Ended August 31, | Period Ended August 31, 2021(1) | |||||||||||
2024 | 2023 | 2022 | ||||||||||
Net asset value, beginning of year/period | $8.47 | $8.72 | $10.07 | $10.00 | ||||||||
INCOME (LOSS) FROM INVESTMENT OPERATIONS: | ||||||||||||
Net investment income(2) | 0.52 | 0.51 | 0.38 | 0.39 | ||||||||
Net realized and unrealized gain (loss) on investments(3) | 0.58 | (0.25) | (1.33) | 0.01 | ||||||||
Total from investment operations | 1.10 | 0.26 | (0.95) | 0.40 | ||||||||
LESS DISTRIBUTIONS PAID: | ||||||||||||
From net investment income | (0.52) | (0.51) | (0.39) | (0.33) | ||||||||
From net realized gain on investments | — | — | (0.01) | — | ||||||||
Total distributions paid | (0.52) | (0.51) | (0.40) | (0.33) | ||||||||
Paid-in capital from redemption fees (Note 2) | — | — | — | — | ||||||||
Net asset value, end of year/period | $9.05 | $8.47 | $8.72 | $10.07 | ||||||||
Total return(4) | 13.49% | 3.12% | -9.66% | 4.06% | ||||||||
SUPPLEMENTAL DATA AND RATIOS: | ||||||||||||
Net assets at end of year/period (000’s) | $136,141 | $89,470 | $82,015 | $13,025 | ||||||||
RATIO OF EXPENSES TO AVERAGE NET ASSETS: | ||||||||||||
Before waiver and expense reimbursement(5) | 1.03% | 1.06% | 1.19% | 2.47% | ||||||||
After waiver and expense reimbursement(5) | 1.01% | 0.99% | 0.99% | 0.99% | ||||||||
RATIO OF NET INVESTMENT INCOME TO AVERAGE NET ASSETS: | ||||||||||||
Before waiver and expense reimbursement(5) | 5.98% | 5.91% | 3.98% | 4.34% | ||||||||
After waiver and expense reimbursement(5) | 6.00% | 5.98% | 4.18% | 5.82% | ||||||||
Portfolio turnover rate(4) | 40.36% | 74.40% | 59.74% | 109.25% | ||||||||
(1) | The inception date for the Fund was December 31, 2020 and investment operations commenced January 4, 2021. |
(2) | Per share net investment income was calculated using the average shares outstanding method. |
(3) | Realized gains and losses per share in the caption are balancing amounts necessary to reconcile the change in net asset value per share for the period, and may not reconcile with the aggregate gains and losses in the Statements of Operations due to share transactions for the period. |
(4) | Not annualized for periods less than one year. |
(5) | Annualized for periods less than one year. |
61 |
Period Ended August 31, 2024(1) | |||
Net asset value, beginning of period | $25.00 | ||
INCOME FROM INVESTMENT OPERATIONS: | |||
Net investment income(2) | 0.58 | ||
Net realized and unrealized gain on investments(3) | 0.20 | ||
Total from investment operations | 0.78 | ||
LESS DISTRIBUTIONS PAID: | |||
From net investment income | (0.45) | ||
From net realized gain on investments | — | ||
Total distributions paid | (0.45) | ||
Paid-in capital from redemption fees (Note 2) | — | ||
Net asset value, end of period | $25.33 | ||
Total return(4)(6) | 3.13% | ||
SUPPLEMENTAL DATA AND RATIOS: | |||
Net assets at end of period (000’s) | $12,665 | ||
Ratio of expenses to average net assets(5) | 0.65% | ||
Ratio of net investment income to average net assets(5) | 5.80% | ||
Portfolio turnover rate(4) | 13.30% | ||
(1) | The inception date for the Fund was April 8, 2024 and investment operations commenced April 9, 2024. |
(2) | Per share net investment income was calculated using the average shares outstanding method. |
(3) | Realized gains and losses per share in the caption are balancing amounts necessary to reconcile the change in net asset value per share for the period, and may not reconcile with the aggregate gains and losses in the Statements of Operations due to share transactions for the period. |
(4) | Not annualized for periods less than one year. |
(5) | Annualized for periods less than one year. |
(6) | Total return represents the rate that investor would have earned or lost on an investment in the Fund, assuming reinvestment of dividends. Total return for a period less than one year is not annualized. Total return represented is total return of Net Asset Value. Total return of the Market Value is 3.24% for the period ended August 31, 2024. |
62 |
| A. | Investment Valuation – Each equity security owned by a Fund that is listed on a securities exchange, except securities listed on the NASDAQ Stock Market, LLC (“NASDAQ”), is valued at its last sale price at the close of that exchange on the date as of which assets are valued. If the security is listed on more than one exchange, a Fund will use the price of the exchange that the Fund generally considers to be the principal exchange on which the security is traded. Portfolio securities listed on NASDAQ will be valued at the NASDAQ Official Closing Price, which may not necessarily represent the last sale price. If there has been no sale on such exchange or on NASDAQ on such day, the security is valued at the mean between the most recent quoted bid and asked prices on such day or the security shall be valued at the latest sales price on the “composite market” for the day such security is being valued. The composite market is defined as a consolidation of the trade information provided by national securities and foreign exchanges and over-the-counter markets as published by an approved independent pricing service (a “Pricing Service”). |
63 |
| Level 1 – | Quoted prices in active markets for identical securities. |
| Level 2 – | Other significant observable inputs (including quoted prices for similar securities, interest rates, prepayment speeds, credit risk, etc.). |
| Level 3 – | Significant unobservable inputs (including a Fund’s own assumptions in determining the fair value of investments). The inputs or methodology used for valuing securities are not necessarily an indication of the risk associated with investing in those securities. The following is a summary of the inputs used to value the Funds’ investments carried at fair value as of August 31, 2024: |
Level 1 | Level 2 | Level 3 | Total | |||||||||
Investments: | ||||||||||||
Municipal Bonds | $— | $1,774,854,242 | $— | $1,774,854,242 | ||||||||
Corporate Bonds | — | 1,370,047,599 | — | 1,370,047,599 | ||||||||
Asset-Backed Securities | — | 1,065,395,535 | — | 1,065,395,535 | ||||||||
Non-Agency Commercial Mortgage Backed Securities | — | 1,054,234,953 | — | 1,054,234,953 | ||||||||
U.S. Treasury Securities | — | 916,214,199 | — | 916,214,199 | ||||||||
Collateralized Loan Obligations | — | 487,264,203 | — | 487,264,203 | ||||||||
64 |
Level 1 | Level 2 | Level 3 | Total | |||||||||
Non-Agency Residential Mortgage Backed Securities | $— | $454,226,109 | $— | $454,226,109 | ||||||||
Agency Commercial Mortgage Backed Securities | — | 408,796,831 | — | 408,796,831 | ||||||||
U.S. Government Agency Issues | — | 184,741,912 | — | 184,741,912 | ||||||||
Agency Residential Mortgage-Backed Securities | — | 29,680,896 | — | 29,680,896 | ||||||||
Exchange Traded Funds | 1,014,200 | — | — | 1,014,200 | ||||||||
Money Market Funds | 98,984,789 | — | — | 98,984,789 | ||||||||
U.S. Treasury Bills | — | 178,613,030 | — | 178,613,030 | ||||||||
Total Investments | $99,998,989 | $7,924,069,509 | $— | $8,024,068,498 | ||||||||
Level 1 | Level 2 | Level 3 | Total | |||||||||
Investments: | ||||||||||||
Municipal Bonds | $— | $663,609,918 | $— | $663,609,918 | ||||||||
Agency Commercial Mortgage Backed Securities | — | 37,940,615 | — | 37,940,615 | ||||||||
Non-Agency Commercial Mortgage Backed Securities | — | 12,911,608 | — | 12,911,608 | ||||||||
Corporate Bonds | — | 3,010,334 | — | 3,010,334 | ||||||||
Money Market Funds | 30,307,392 | — | — | 30,307,392 | ||||||||
Total Investments | $30,307,392 | $717,472,475 | $– | $747,779,867 | ||||||||
Level 1 | Level 2 | Level 3 | Total | |||||||||
Investments: | ||||||||||||
Corporate Bonds | $— | $48,262,218 | $— | $48,262,218 | ||||||||
Non-Agency Commercial Mortgage Backed Securities | — | 27,969,643 | — | 27,969,643 | ||||||||
Collateralized Loan Obligations | — | 16,761,244 | — | 16,761,244 | ||||||||
Municipal Bonds | — | 9,342,139 | — | 9,342,139 | ||||||||
Non-Agency Residential Mortgage Backed Securities | — | 8,746,012 | — | 8,746,012 | ||||||||
U.S. Treasury Securities | — | 8,692,609 | — | 8,692,609 | ||||||||
Asset-Backed Securities | — | 8,472,872 | — | 8,472,872 | ||||||||
Money Market Funds | 6,201,867 | — | — | 6,201,867 | ||||||||
Total Investments | $6,201,867 | $128,246,737 | $– | $134,448,604 | ||||||||
65 |
Level 1 | Level 2 | Level 3 | Total | |||||||||
Investments: | ||||||||||||
Collateralized Loan Obligations | $— | $3,101,969 | $— | $3,101,969 | ||||||||
Asset-Backed Securities | — | 2,673,878 | — | 2,673,878 | ||||||||
Non-Agency Commercial Mortgage Backed Securities | — | 2,342,977 | — | 2,342,977 | ||||||||
Corporate Bonds | — | 978,207 | — | 978,207 | ||||||||
Agency Commercial Mortgage Backed Securities | — | 926,980 | — | 926,980 | ||||||||
U.S. Treasury Securities | — | 734,078 | — | 734,078 | ||||||||
Non-Agency Residential Mortgage Backed Securities | — | 270,978 | — | 270,978 | ||||||||
Municipal Bonds | — | 240,512 | — | 240,512 | ||||||||
Money Market Funds | 363,400 | — | — | 363,400 | ||||||||
U.S. Treasury Bills | — | 1,235,908 | — | 1,235,908 | ||||||||
Total Investments | $363,400 | $12,505,487 | $— | $12,868,887 | ||||||||
| B. | Short Positions – The Funds may sell a security they do not own in anticipation of a decline in the fair value of that security. When a Fund sells a security short, it must borrow the security sold short and deliver it to the broker-dealer through which it made the short sale. A gain, limited to the price at which a Fund sold the security short, or a loss, unlimited in size, will be recognized upon the termination of a short sale. The Funds are liable for any dividends or interest payable on securities while those securities are in a short position. Such amounts are recorded on the ex-dividend date as a dividend expense. As collateral for its short positions, the Funds are required under the 1940 Act to maintain segregated assets consisting of cash, cash equivalents or liquid securities. The segregated assets are valued consistent with Note 2a above. The amount of segregated assets is required to be adjusted daily to reflect changes in the fair value of the securities sold short. As of August 31, 2024, the Funds did not have any open short positions and accordingly did not have securities or cash held as collateral. |
| C. | Federal Income Taxes – Each Fund intends to comply with the requirements of Subchapter M of the Internal Revenue Code of 1986, as amended (the “Code”) necessary to qualify as a regulated investment company and to make the requisite distributions of income and capital gains to their shareholders sufficient to relieve them from all or substantially all federal income taxes. Therefore, no federal income tax provision has been provided. As of and during the year/period ended August 31, 2024, the Funds did not have a liability for any unrecognized tax benefits. The Funds recognize interest and penalties, if any, related to uncertain tax benefits as income tax expense in the Statements of Operations. During the year/period ended August 31, 2024, the Funds did not incur any interest or penalties. The Funds are not subject to examination by U.S. taxing authorities for the tax periods prior to the year/period ended August 31, 2021. |
| D. | Distributions to Shareholders – The Funds will distribute any net investment income monthly. The Funds will distribute any net realized long- or short-term capital gains at least annually. Distributions from net realized gains for book purposes may include short-term capital gains. All short-term capital gains are included in ordinary income for tax purposes. Distributions to shareholders are recorded on the ex-dividend date. The Funds may also pay a special distribution at the end of the calendar year to comply with federal tax requirements. Income and capital gain distributions may differ from GAAP, primarily due to timing differences in the recognition of income, gains and losses by the Funds. To the extent that these differences are attributable to permanent book and tax accounting differences, the components of net assets have been adjusted. |
66 |
| E. | Use of Estimates – The preparation of financial statements in conformity with GAAP requires management to make estimates and assumptions that affect the reported amounts of assets and liabilities and disclosure of contingent assets and liabilities at the date of the financial statements and the reported amounts of revenues and expenses during the reporting period. Actual results could differ from those estimates. |
| F. | Share Valuation – The NAV per share of a Fund is calculated by dividing the sum of the value of the securities held by the Fund, plus cash or other assets, minus all liabilities (including estimated accrued expenses) by the total number of shares outstanding for the Fund, rounded to the nearest cent. The Funds’ shares will not be priced on the days on which the New York Stock Exchange (“NYSE”) is closed for trading. The Total Return Bond Fund and the Municipal Bond Fund charged a 2.00% redemption fee on shares redeemed within sixty days of purchase through December 28, 2019. These fees were deducted from the redemption proceeds otherwise payable to the shareholder. Effective December 29, 2019, the Total Return Bond Fund and the Municipal Bond Fund eliminated the redemption fees. |
| G. | Allocation of Income, Expenses and Gains/Losses – Income, expenses (other than those deemed attributable to a specific share class), and gains and losses of each Fund are allocated daily to each class of shares based upon the ratio of net assets represented by each class as a percentage of the net assets of the Fund. Expenses deemed directly attributable to a class of shares are recorded by the specific class. Most expenses are allocated by class based on relative net assets. Distribution and service (Rule 12b-1) fees are expensed at 0.25% of average daily net assets of the Class A shares of the Total Return Bond Fund and the Municipal Bond Fund and 0.75% of average daily net assets of the Class C shares of the Total Return Bond Fund. Shareholder servicing fees are expensed at 0.25% of average daily net assets of Class C shares of the Total Return Bond Fund. Expenses associated with a specific fund in the Trust are charged to that fund. Common expenses of the Trust are typically allocated evenly between the funds of the Trust, or by other equitable means. |
| H. | Other – Investment transactions are recorded on the trade date. The Funds determine the gain or loss from investment transactions on an identified cost basis by comparing the original cost of the security lot sold with the net sale proceeds. Dividend income, less foreign withholding tax, is recognized on the ex-dividend date and interest income is recognized on an accrual basis. Discounts, premiums and interest-only strips are accreted or amortized over the expected life of the respective securities using the constant yield method. Gains and losses on principal payments and short-falls of mortgage backed securities (paydown gains and losses) are included as an adjustment to interest income in the Statements of Operations. |
Year Ended August 31, | ||||||
2024 | 2023 | |||||
Ordinary Income | $293,211,319 | $207,265,830 | ||||
Tax-Exempt Income | — | — | ||||
Long-Term Capital Gain | — | — | ||||
Return of Capital | — | — | ||||
Year Ended August 31, | ||||||
2024 | 2023 | |||||
Ordinary Income | $2,924,724 | $2,634,721 | ||||
Tax-Exempt Income | 22,540,224 | 19,670,077 | ||||
Long-Term Capital Gain | — | — | ||||
Return of Capital | — | — | ||||
67 |
Year Ended August 31, | ||||||
2024 | 2023 | |||||
Ordinary Income | $6,245,595 | $5,020,968 | ||||
Tax-Exempt Income | — | — | ||||
Long-Term Capital Gain | — | — | ||||
Return of Capital | — | — | ||||
Period Ended August 31, | ||||||
2024 | 2023 | |||||
Ordinary Income | $202,825 | N/A | ||||
Tax-Exempt Income | — | N/A | ||||
Long-Term Capital Gain | — | N/A | ||||
Return of Capital | — | N/A | ||||
Cost basis of investments for federal income tax purposes | $8,246,125,301 | ||
Gross tax unrealized appreciation | $178,128,503 | ||
Gross tax unrealized depreciation | (400,185,306) | ||
Net tax unrealized depreciation | (222,056,803) | ||
Undistributed ordinary income | 18,021,195 | ||
Undistributed long-term capital gain | — | ||
Total distributable earnings | 18,021,195 | ||
Other accumulated losses | (564,711,998) | ||
Total accumulated loss | $(768,747,606) | ||
Cost basis of investments for federal income tax purposes | $727,371,165 | ||
Gross tax unrealized appreciation | $28,191,935 | ||
Gross tax unrealized depreciation | (7,783,233) | ||
Net tax unrealized depreciation | 20,408,702 | ||
Undistributed ordinary income | 1,219,626 | ||
Undistributed long-term capital gain | — | ||
Total distributable earnings | 1,219,626 | ||
Other accumulated losses | (94,607,976) | ||
Total accumulated loss | $(72,979,648) | ||
68 |
Cost basis of investments for federal income tax purposes | $131,566,452 | ||
Gross tax unrealized appreciation | $4,644,621 | ||
Gross tax unrealized depreciation | (1,762,469) | ||
Net tax unrealized appreciation | 2,882,152 | ||
Undistributed ordinary income | 340,642 | ||
Undistributed long-term capital gain | — | ||
Total distributable earnings | 340,642 | ||
Other accumulated losses | (3,730,846) | ||
Total accumulated loss | $(508,052) | ||
Cost basis of investments for federal income tax purposes | $12,748,013 | ||
Gross tax unrealized appreciation | $139,829 | ||
Gross tax unrealized depreciation | (18,955) | ||
Net tax unrealized appreciation | 120,874 | ||
Undistributed ordinary income | 39,886 | ||
Undistributed long-term capital gain | — | ||
Total distributable earnings | 39,886 | ||
Other accumulated losses | (4,639) | ||
Total accumulated gains | $156,121 | ||
Short Term | Long Term | |||||
Total Return Bond Fund | $212,029,822 | $352,682,156 | ||||
Municipal Bond Fund | 46,273,069 | 48,334,907 | ||||
Multisector Bond Fund | 1,246,008 | 2,484,838 | ||||
Short Term Bond ETF | 4,639 | — | ||||
Total Distributable Earnings | Paid-in capital | |||||
Total Return Bond Fund | $ — | $ — | ||||
Municipal Bond Fund | — | — | ||||
Multisector Bond Fund | — | — | ||||
Short Term Bond ETF | — | — | ||||
69 |
Total Return Bond Fund | Municipal Bond Fund | Multisector Bond Fund | |||||||
August 31, 2025 | $ — | $ — | $ 81,663 | ||||||
August 31, 2026 | $— | $— | $57,546 | ||||||
August 31, 2027 | $— | $— | $26,576 | ||||||
70 |
12b-1 Fees | Shareholder Servicing Fees | |||||
Total Return Bond Fund | ||||||
Class A | $78,658 | N/A | ||||
Class C | $343,407 | $114,469 | ||||
Municipal Bond Fund | ||||||
Class A | $77,765 | N/A | ||||
Administration and Accounting | Incurred | Owed | ||||
Total Return Bond Fund | $2,601,023 | $500,134 | ||||
Municipal Bond Fund | 292,935 | 52,901 | ||||
Multisector Bond Fund | 77,620 | 14,789 | ||||
Transfer Agency | Incurred | Owed | ||||
Total Return Bond Fund | $1,025,135(1) | $194,690 | ||||
Municipal Bond Fund | 105,144 | 18,878 | ||||
Multisector Bond Fund | 25,022 | 4,501 | ||||
(1) | This amount does not include sub-transfer agency fees. |
Custody | Incurred | Owed | ||||
Total Return Bond Fund | $327,847 | $65,693 | ||||
Municipal Bond Fund | 34,422 | 6,622 | ||||
Multisector Bond Fund | 6,077 | 1,053 | ||||
Chief Compliance Officer | Incurred | Owed | ||||
Total Return Bond Fund | $11,667 | $1,946 | ||||
Municipal Bond Fund | 11,667 | 1,946 | ||||
Multisector Bond Fund | 11,667 | 1,945 | ||||
71 |
Security Name | Share Balance 8/31/24 | Fair Value at 9/1/2023 | Purchases | Sales | Realized Gain (Loss)(1) | Change in Unrealized Appreciation | Fair Value at 8/31/24 | Dividend income(1) | ||||||||||||||||
Performance Trust Short Term Bond ETF | 40,000 | $ — | $1,011,600 | $ — | $ — | $2,600 | $1,014,200 | $ — | ||||||||||||||||
(1) | Dividend income and realized gain amounts are reported for the period in which the security was deemed an affiliate. |
Year Ended August 31, | ||||||
2024 | 2023 | |||||
Shares sold | 183,406,541 | 131,375,592 | ||||
Shares issued to holders in reinvestment of distributions | 13,008,865 | 9,309,147 | ||||
Shares redeemed | (97,636,980) | (117,749,091) | ||||
Net increase | 98,778,426 | 22,935,648 | ||||
Year Ended August 31, | ||||||
2024 | 2023 | |||||
Shares sold | 1,013,823 | 755,662 | ||||
Shares issued to holders in reinvestment of distributions | 65,410 | 55,229 | ||||
Shares redeemed | (692,395) | (924,350) | ||||
Net increase (decrease) | 386,838 | (113,459) | ||||
Year Ended August 31, | ||||||
2024 | 2023 | |||||
Shares sold | 929,405 | 353,323 | ||||
Shares issued to holders in reinvestment of distributions | 82,114 | 64,024 | ||||
Shares redeemed | (636,173) | (594,892) | ||||
Net increase (decrease) | 375,346 | (177,545) | ||||
72 |
Year Ended August 31, | ||||||
2024 | 2023 | |||||
Shares sold | 14,756,272 | 14,508,691 | ||||
Shares issued to holders in reinvestment of distributions | 951,165 | 835,569 | ||||
Shares redeemed | (11,865,084) | (18,249,919) | ||||
Net increase (decrease) | 3,842,353 | (2,905,659) | ||||
Year Ended August 31, | ||||||
2024 | 2023 | |||||
Shares sold | 768,198 | 676,462 | ||||
Shares issued to holders in reinvestment of distributions | 45,732 | 52,486 | ||||
Shares redeemed | (1,521,594) | (1,182,877) | ||||
Net decrease | (707,664) | (453,929) | ||||
Year Ended August 31, | ||||||
2024 | 2023 | |||||
Shares sold | 5,806,759 | 4,853,465 | ||||
Shares issued to holders in reinvestment of distributions | 706,606 | 583,958 | ||||
Shares redeemed | (2,031,483) | (4,275,220) | ||||
Net increase | 4,481,882 | 1,162,203 | ||||
Period Ended August 31, | ||||||
2024 | 2023 | |||||
Shares sold | 500,000 | N/A | ||||
Shares issued to holders in reinvestment of distributions | — | N/A | ||||
Shares redeemed | — | N/A | ||||
Net increase | 500,000 | N/A | ||||
73 |
Total Return Bond Fund | Municipal Bond Fund | Multisector Bond Fund | Short Term Bond ETF | |||||||||
Purchases | ||||||||||||
U.S Government | $1,049,917,318 | $— | $6,559,807 | $1,070,146 | ||||||||
Other | 3,011,874,897 | 424,530,010 | 69,167,327 | 11,360,679 | ||||||||
Sales | ||||||||||||
U.S Government | $566,369,734 | $— | $5,634,901 | $380,500 | ||||||||
Other | 1,604,598,042 | 362,610,411 | 35,620,274 | 838,922 | ||||||||
74 |
Ordinary Income | |||
Short Term Bond ETF | $66,461 | ||
Ordinary Income | |||
Total Return Bond Fund | |||
Institutional Class | $32,482,064 | ||
Class A | 151,194 | ||
Class C | 186,395 | ||
Municipal Bond Fund | |||
Institutional Class | $2,138,427 | ||
Class A | 57,796 | ||
Multisector Bond Fund | |||
Institutional Class | $609,813 | ||
75 |
Ordinary Income | |||
Short Term Bond ETF | $73,532 | ||
Ordinary Income | |||
Total Return Bond Fund | | ||
Institutional Class | $31,084,042 | ||
Class A | 144,482 | ||
Class C | 156,234 | ||
Municipal Bond Fund | | ||
Institutional Class | $2,085,779 | ||
Class A | 50,951 | ||
Multisector Bond Fund | | ||
Institutional Class | $609,902 | ||
76 |
Fund Name | Statements of Operations | Statements of Changes in Net Assets | Financial Highlights | ||||||
Performance Trust Total Return Bond Fund (formerly Performance Trust Strategic Bond Fund) and Performance Trust Municipal Bond Fund | For the year ended August 31, 2024 | For the years ended August 31, 2024 and 2023 | For the years ended August 31, 2024, 2023, 2022, 2021, and 2020 | ||||||
Performance Trust Multisector Bond Fund (formerly Performance Trust Credit Fund) | For the year ended August 31, 2024 | For the years ended August 31, 2024 and 2023 | For the years ended August 31, 2024, 2023, 2022, and for the period from January 4, 2021 (commencement of operations) through August 31, 2021 | ||||||
Performance Trust Short Term Bond ETF | For the period from April 9, 2024 (commencement of operations) through August 31, 2024 | ||||||||

77 |
78 |
79 |
80 |
81 |
82 |
Total Return Bond Fund | 0.00% | ||
Municipal Bond Fund | 0.00% | ||
Multisector Bond Fund | 0.00% | ||
Short Term Bond ETF | 0.00% | ||
83 |
| (b) | Financial Highlights are included within the financial statements filed under Item 7(a) of this Form. |
Item 8. Changes in and Disagreements with Accountants for Open-End Investment Companies.
There were no changes in or disagreements with accountants during the period covered by this report.
Item 9. Proxy Disclosure for Open-End Investment Companies.
There were no matters submitted to a vote of shareholders during the period covered by this report.
Item 10. Remuneration Paid to Directors, Officers, and Others of Open-End Investment Companies.
See Item 7(a) for compensation information related to the Performance Trust mutual funds. For the Performance Trust Short Term Bond ETF, all fund expenses, including Trustee compensation, are paid by the Investment Adviser pursuant to the Investment Advisory Agreement. Additional information related to those fees is available in the Fund’s Statement of Additional Information.
Item 11. Statement Regarding Basis for Approval of Investment Advisory Contract.
This information is included within the financial statements filed under Item 7(a) of this Form.
Item 12. Disclosure of Proxy Voting Policies and Procedures for Closed-End Management Investment Companies.
Not applicable to open-end investment companies.
Item 13. Portfolio Managers of Closed-End Management Investment Companies.
Not applicable to open-end investment companies.
Item 14. Purchases of Equity Securities by Closed-End Management Investment Company and Affiliated Purchasers.
Not applicable to open-end investment companies.
Item 15. Submission of Matters to a Vote of Security Holders.
There have been no material changes to the procedures by which shareholders may recommend nominees to the registrant’s board of trustees.
Item 16. Controls and Procedures.
| (a) | The Registrant’s Principal Executive Officer and Principal Financial Officer have reviewed the Registrant's disclosure controls and procedures (as defined in Rule 30a-3(c) under the Investment Company Act of 1940 (the “Act”)) as of a date within 90 days of the filing of this report, as required by Rule 30a-3(b) under the Act and Rules 13a-15(b) or 15d-15(b) under the Securities Exchange Act of 1934. Based on their review, such officers have concluded that the disclosure controls and procedures are effective in ensuring that information required to be disclosed in this report is appropriately recorded, processed, summarized and reported and made known to them by others within the Registrant and by the Registrant’s service provider. |
| (b) | There were no changes in the Registrant’s internal control over financial reporting (as defined in Rule 30a-3(d) under the Act) that occurred during the period covered by this report that have materially affected, or are reasonably likely to materially affect, the Registrant’s internal control over financial reporting. |
Item 17. Disclosure of Securities Lending Activities for Closed-End Management Investment Companies
Not applicable to open-end investment companies.
Item 18. Recovery of Erroneously Awarded Compensation.
Not applicable
Item 19. Exhibits.
| (a) | (1) Any code of ethics or amendment thereto, that is the subject of the disclosure required by Item 2, to the extent that the registrant intends to satisfy Item 2 requirements through filing an exhibit. Incorporated by reference to the Registrant’s Form N-CSR filed November 7, 2011. |
(2) Any policy required by the listing standards adopted pursuant to Rule 10D-1 under the Exchange Act (17 CFR 240.10D-1) by the registered national securities exchange or registered national securities association upon which the registrant's securities are listed. Not applicable.
(3) A separate certification for each principal executive officer and principal financial officer of the registrant as required by Rule 30a-2(a) under the Investment Company Act of 1940 (17 CFR 270.30a-2(a)). Filed herewith.
(4) Any written solicitation to purchase securities under Rule 23c-1 under the Act sent or given during the period covered by the report by or on behalf of the registrant to 10 or more persons. Not applicable.
(5) Change in the registrant's independent public accountant. Provide the information called for by Item 4 of Form 8-K under the Exchange Act (17 CFR 249.308). Unless otherwise specified by Item 4, or related to and necessary for a complete understanding of information not previously disclosed, the information should relate to events occurring during the reporting period. Not applicable.
| (b) | Certifications pursuant to Section 906 of the Sarbanes-Oxley Act of 2002. Furnished herewith. |
SIGNATURES
Pursuant to the requirements of the Securities Exchange Act of 1934 and the Investment Company Act of 1940, the registrant has duly caused this report to be signed on its behalf by the undersigned, thereunto duly authorized.
| (Registrant) | Trust for Professional Managers |
| By (Signature and Title)* | /s/ John Buckel | ||
| John Buckel, Principal Executive Officer |
| Date | October 29, 2024 |
Pursuant to the requirements of the Securities Exchange Act of 1934 and the Investment Company Act of 1940, this report has been signed below by the following persons on behalf of the registrant and in the capacities and on the dates indicated.
| By (Signature and Title)* | /s/ John Buckel | ||
| John Buckel, Principal Executive Officer |
| Date | October 29, 2024 |
| By (Signature and Title)* | /s/ Jennifer Lima | ||
| Jennifer Lima, Principal Financial Officer |
| Date | October 29, 2024 |
* Print the name and title of each signing officer under his or her signature.