CONVERGENCE LONG/SHORT EQUITY ETF (CLSE)
Listed on Cboe BZX Exchange, Inc.
Core Financial Statements
November 30, 2024
UNITED STATES
SECURITIES AND EXCHANGE COMMISSION
Washington, D.C. 20549
FORM N-CSR
CERTIFIED SHAREHOLDER REPORT OF REGISTERED
MANAGEMENT INVESTMENT COMPANIES
Investment Company Act file number 811-10401
Trust for Professional Managers
(Exact name of registrant as specified in charter)
615 East Michigan Street
Milwaukee, WI 53202
(Address of principal executive offices) (Zip code)
Jay Fitton
U.S. Bancorp Fund Services, LLC
615 East Michigan Street
Milwaukee, WI 53202
(Name and address of agent for service)
(513) 520-5925
Registrant’s telephone number, including area code
Date of fiscal year end: November 30, 2024
Date of reporting period: November 30, 2024
Item 1. Reports to Stockholders.
| (a) |
 | Convergence Long/Short Equity ETF |  |
| CLSE (Principal U.S. Listing Exchange: CBOE) | ||
| Annual Shareholder Report | November 30, 2024 |
Fund Name | Costs of a $10,000 investment | Costs paid as a percentage of a $10,000 investment |
| Convergence Long/Short Equity ETF | $172 | 1.44% |
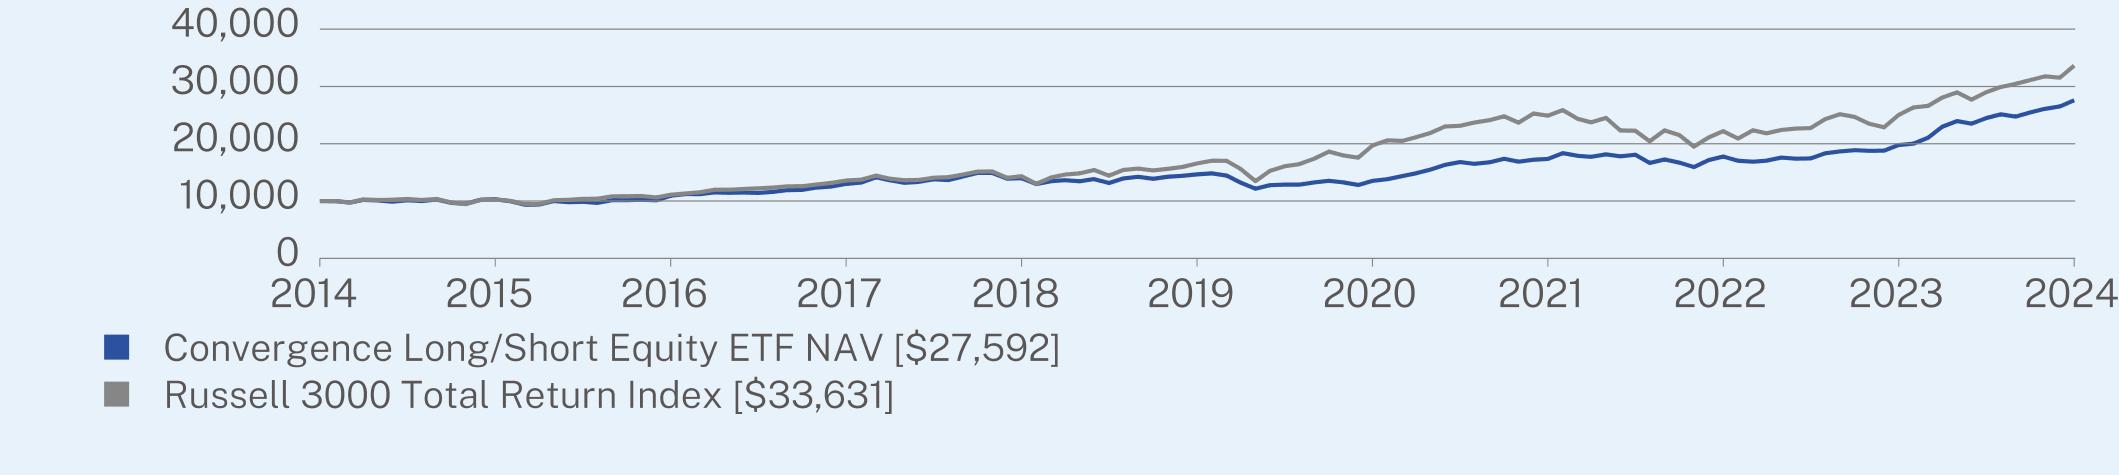
1 Year | 5 Year | 10 Year | |
Convergence Long/Short Equity ETF NAV | 39.57 | 13.49 | 10.68 |
Russell 3000 Total Return Index | 34.49 | 15.23 | 12.89 |
| * | The Fund’s past performance is not a good predictor of how the Fund will perform in the future. The graph and table do not reflect the deduction of taxes that a shareholder would pay on Fund distributions or redemption of Fund shares. |
| Convergence Long/Short Equity ETF | PAGE 1 | TSR-AR-89834G760 |
Net Assets | $206,842,070 |
Number of Holdings | 343 |
Advisory Fee | $1,047,946 |
Portfolio Turnover | 225% |
Top Holdings | (%) |
NVIDIA Corp. | 4.4% |
Alphabet, Inc. - Class A | 3.4% |
Meta Platforms, Inc. - Class A | 3.3% |
Amazon.com, Inc. | 2.7% |
AppLovin Corp. - Class A | 2.3% |
Arista Networks, Inc. | 2.0% |
Walmart, Inc. | 2.0% |
Hewlett Packard Enterprise Co. | 1.9% |
Carvana Co. | 1.8% |
Lam Research Corp. | 1.8% |
| Convergence Long/Short Equity ETF | PAGE 2 | TSR-AR-89834G760 |
| (b) | Not applicable. |
Item 2. Code of Ethics.
The registrant has adopted a code of ethics that applies to the registrant’s principal executive officer and principal financial officer. The registrant has not made any substantive amendments to its code of ethics during the period covered by this report. The registrant has not granted any waivers from any provisions of the code of ethics during the period covered by this report. Incorporated by reference to the registrant’s Form N-CSR filed on February 3, 2017.
Item 3. Audit Committee Financial Expert.
The registrant’s board of trustees has determined that there is at least one audit committee financial expert serving on its audit committee. Dr. Michael Akers and Lisa Zúñiga Ramírez are the “audit committee financial experts” and are considered to be “independent” as each term is defined in Item 3 of Form N-CSR.
Item 4. Principal Accountant Fees and Services.
The registrant has engaged its principal accountant to perform audit services, audit-related services, tax services and other services during the past two fiscal years. “Audit services” refer to performing an audit of the registrant’s annual financial statements or services that are normally provided by the accountant in connection with statutory and regulatory filings or engagements for those fiscal years. “Audit-related services” refer to the assurance and related services by the principal accountant that are reasonably related to the performance of the audit. “Tax services” refer to professional services rendered by the principal accountant for tax compliance, tax advice, and tax planning. The following table details the aggregate fees billed or expected to be billed for each of the last two fiscal years for audit fees, audit-related fees, tax fees and other fees by the principal accountant.
| FYE 11/30/2024 | FYE 11/30/2023 | |
| (a) Audit Fees | $17,500 | $17,000 |
| (b) Audit-Related Fees | $0 | $0 |
| (c) Tax Fees | $3,000 | $3,000 |
| (d) All Other Fees | $0 | $0 |
(e)(1) The audit committee has adopted pre-approval policies and procedures that require the audit committee to pre-approve all audit and non-audit services of the registrant, including services provided to any entity affiliated with the registrant.
(e)(2) The percentage of fees billed by Cohen & Company, Ltd. applicable to non-audit services pursuant to waiver of pre-approval requirement were as follows:
| FYE 11/30/2024 | FYE 11/30/2023 | |
| Audit-Related Fees | 0% | 0% |
| Tax Fees | 0% | 0% |
| All Other Fees | 0% | 0% |
(f) All of the principal accountant’s hours spent on auditing the registrant’s financial statements were attributed to work performed by full-time permanent employees of the principal accountant.
(g) The following table indicates the non-audit fees billed or expected to be billed by the registrant’s accountant for services to the registrant and to the registrant’s investment adviser (and any other controlling entity, etc.—not sub-adviser) for the last two years.
| Non-Audit Related Fees | FYE 11/30/2024 | FYE 11/30/2023 |
| Registrant | 0 | 0 |
| Registrant’s Investment Adviser | 0 | 0 |
(h) The audit committee of the board of trustees/directors has considered whether the provision of non-audit services that were rendered to the registrant’s investment adviser is compatible with maintaining the principal accountant’s independence and has concluded that the provision of such non-audit services by the accountant has not compromised the accountant’s independence.
(i) The registrant has not been identified by the U.S. Securities and Exchange Commission as having filed an annual report issued by a registered public accounting firm branch or office that is located in a foreign jurisdiction where the Public Company Accounting Oversight Board is unable to inspect or completely investigate because of a position taken by an authority in that jurisdiction.
(j) The registrant is not a foreign issuer.
Item 5. Audit Committee of Listed Registrants.
| (a) | The registrant is an issuer as defined in Rule 10A-3 under the Securities Exchange Act of 1934, (the “Act”) and has a separately-designated standing audit committee established in accordance with Section 3(a)(58)(A) of the Act. The entire Board of Trustees is acting as the registrant’s audit committee. |
| (b) | Not applicable. |
Item 6. Investments.
| (a) | Schedule of Investments is included as part of the report to shareholders filed under Item 7(a) of this Form. |
| (b) | Not Applicable. |
Item 7. Financial Statements and Financial Highlights for Open-End Investment Companies.
| (a) |
Page | |||
Shares | Value | |||||
COMMON STOCKS — 114.6% | ||||||
Administrative and Support Services — 5.6% | ||||||
Booking Holdings, Inc.(a) | 187 | $972,770 | ||||
Bread Financial Holdings, Inc.(a) | 33,155 | 1,950,509 | ||||
Duolingo, Inc.(a)(b) | 2,954 | 1,028,790 | ||||
Expedia Group, Inc.(a)(b) | 6,972 | 1,287,171 | ||||
Janus Henderson Group PLC(a) | 43,698 | 1,978,645 | ||||
PayPal Holdings, Inc.(a)(b) | 33,188 | 2,879,723 | ||||
Sezzle, Inc.(a)(b) | 3,578 | 1,517,179 | ||||
11,614,787 | ||||||
Air Transportation — 0.3% | ||||||
United Airlines Holdings, Inc.(a)(b) | 7,259 | 702,889 | ||||
Ambulatory Health Care Services — 1.2% | ||||||
DaVita, Inc.(a)(b) | 10,505 | 1,745,616 | ||||
Natera, Inc.(b) | 2,334 | 391,598 | ||||
Veracyte, Inc.(a)(b) | 6,946 | 298,331 | ||||
2,435,545 | ||||||
Beverage and Tobacco Product Manufacturing — 0.8% | ||||||
Altria Group, Inc.(a) | 29,435 | 1,699,577 | ||||
Broadcasting and Content Providers — 0.3% | ||||||
Fox Corp. - Class A(a) | 12,903 | 607,989 | ||||
Building Material and Garden Equipment and Supplies Dealers — 1.2% | ||||||
Home Depot, Inc.(a) | 5,789 | 2,484,234 | ||||
Chemical Manufacturing — 5.6% | ||||||
AbbVie, Inc.(a) | 8,793 | 1,608,504 | ||||
Bristol-Myers Squibb Co.(a) | 36,198 | 2,143,646 | ||||
CF Industries Holdings, Inc.(a) | 9,006 | 807,478 | ||||
Corcept Therapeutics, Inc.(a)(b) | 7,421 | 428,043 | ||||
Gilead Sciences, Inc.(a) | 24,098 | 2,230,993 | ||||
Halozyme Therapeutics, Inc.(a)(b) | 26,712 | 1,287,518 | ||||
Jazz Pharmaceuticals PLC(a)(b) | 3,501 | 425,687 | ||||
Procter & Gamble Co.(a) | 5,544 | 993,817 | ||||
United Therapeutics Corp.(a)(b) | 3,731 | 1,382,298 | ||||
Vertex Pharmaceuticals, Inc.(a)(b) | 819 | 383,398 | ||||
11,691,382 | ||||||
Computer and Electronic Product Manufacturing — 17.8% | ||||||
Advanced Energy Industries, Inc.(a) | 1,199 | 137,933 | ||||
Amphenol Corp. - Class A(a) | 15,701 | 1,140,678 | ||||
Apple, Inc. | 7,548 | 1,791,367 | ||||
Arista Networks, Inc.(a)(b) | 10,259 | 4,163,307 | ||||
Broadcom, Inc.(a) | 17,108 | 2,772,865 | ||||
InterDigital, Inc.(a) | 17,329 | 3,395,791 | ||||
Lam Research Corp.(a) | 49,976 | 3,692,227 | ||||
Micron Technology, Inc.(a) | 29,206 | 2,860,728 | ||||
1 |
Shares | Value | |||||
COMMON STOCKS — (Continued) | ||||||
Computer and Electronic Product Manufacturing — (Continued) | ||||||
Monolithic Power Systems, Inc.(a) | 1,060 | $601,698 | ||||
NetApp, Inc.(a) | 17,583 | 2,156,379 | ||||
NVIDIA Corp.(a) | 65,161 | 9,008,508 | ||||
QUALCOMM, Inc.(a) | 21,889 | 3,470,063 | ||||
Vertiv Holdings Co. - Class A(a) | 12,656 | 1,614,906 | ||||
36,806,450 | ||||||
Construction of Buildings — 0.4% | ||||||
NVR, Inc.(a)(b) | 53 | 489,486 | ||||
Toll Brothers, Inc.(a) | 2,703 | 446,454 | ||||
935,940 | ||||||
Credit Intermediation and Related Activities — 9.4% | ||||||
Bank of America Corp.(a) | 36,440 | 1,731,264 | ||||
Comerica, Inc.(a) | 17,952 | 1,297,032 | ||||
Euronet Worldwide, Inc.(a)(b) | 10,093 | 1,061,077 | ||||
Fifth Third Bancorp(a) | 34,100 | 1,638,846 | ||||
JPMorgan Chase & Co.(a) | 5,475 | 1,367,217 | ||||
Northern Trust Corp.(a) | 21,210 | 2,357,704 | ||||
PNC Financial Services Group, Inc.(a) | 7,142 | 1,533,530 | ||||
Regions Financial Corp.(a) | 56,995 | 1,553,684 | ||||
Synchrony Financial(a) | 35,552 | 2,400,471 | ||||
UMB Financial Corp.(a) | 11,108 | 1,393,943 | ||||
Wells Fargo & Co.(a) | 21,413 | 1,631,028 | ||||
Zions Bancorp NA(a) | 24,694 | 1,494,481 | ||||
19,460,277 | ||||||
Fabricated Metal Product Manufacturing — 1.4% | ||||||
Mueller Industries, Inc.(a) | 19,397 | 1,566,696 | ||||
Mueller Water Products, Inc. - Class A(a) | 55,515 | 1,390,095 | ||||
2,956,791 | ||||||
Food and Beverage Retailers — 0.2% | ||||||
Kroger Co.(a) | 5,929 | 362,143 | ||||
Food Manufacturing — 1.5% | ||||||
Pilgrim's Pride Corp.(a)(b) | 35,123 | 1,812,698 | ||||
Tyson Foods, Inc. - Class A(a) | 19,369 | 1,249,301 | ||||
3,061,999 | ||||||
Food Services and Drinking Places — 0.3% | ||||||
Cava Group, Inc.(a)(b) | 3,857 | 543,451 | ||||
Funds, Trusts, and Other Financial Vehicles — 1.3% | ||||||
Garmin Ltd.(a) | 3,661 | 778,329 | ||||
SEI Investments Co.(a) | 23,969 | 1,980,558 | ||||
2,758,887 | ||||||
General Merchandise Retailers — 2.0% | ||||||
Walmart, Inc.(a) | 44,734 | 4,137,895 | ||||
2 |
Shares | Value | |||||
COMMON STOCKS — (Continued) | ||||||
Health and Personal Care Retailers — 0.0%(c) | ||||||
CVS Health Corp.(a) | 49 | $2,933 | ||||
Heavy and Civil Engineering Construction — 3.3% | ||||||
Fluor Corp.(a)(b) | 3,752 | 210,600 | ||||
Granite Construction, Inc.(a) | 18,100 | 1,798,597 | ||||
MasTec, Inc.(a)(b) | 9,987 | 1,438,727 | ||||
Primoris Services Corp.(a) | 21,063 | 1,763,184 | ||||
Sterling Infrastructure, Inc.(a)(b) | 8,016 | 1,558,711 | ||||
6,769,819 | ||||||
Hospitals — 1.7% | ||||||
Encompass Health Corp.(a) | 5,789 | 595,920 | ||||
Tenet Healthcare Corp.(a)(b) | 9,892 | 1,411,390 | ||||
Universal Health Services, Inc. - Class B(a) | 7,170 | 1,469,850 | ||||
3,477,160 | ||||||
Insurance Carriers and Related Activities — 3.3% | ||||||
Allstate Corp.(a) | 4,760 | 987,176 | ||||
Cincinnati Financial Corp.(a) | 1,111 | 177,571 | ||||
CNA Financial Corp.(a) | 15,940 | 804,014 | ||||
Frontdoor, Inc.(a)(b) | 18,771 | 1,099,981 | ||||
HealthEquity, Inc.(a)(b) | 1,586 | 161,043 | ||||
MetLife, Inc.(a) | 11,769 | 1,038,379 | ||||
Progressive Corp.(a) | 3,714 | 998,620 | ||||
Prudential Financial, Inc.(a) | 3,023 | 391,206 | ||||
Reinsurance Group of America, Inc.(a) | 5,001 | 1,142,228 | ||||
6,800,218 | ||||||
Merchant Wholesalers, Durable Goods — 1.0% | ||||||
Allison Transmission Holdings, Inc.(a) | 11,642 | 1,379,577 | ||||
Avnet, Inc.(a) | 11,145 | 609,743 | ||||
1,989,320 | ||||||
Merchant Wholesalers, Nondurable Goods — 3.0% | ||||||
Amneal Pharmaceuticals, Inc.(a)(b) | 207,970 | 1,719,912 | ||||
Cardinal Health, Inc.(a) | 14,727 | 1,800,228 | ||||
Cencora, Inc.(a) | 7,300 | 1,836,315 | ||||
McKesson Corp.(a) | 1,520 | 955,320 | ||||
6,311,775 | ||||||
Mining (except Oil and Gas) — 1.0% | ||||||
Coeur Mining, Inc.(a)(b) | 36,725 | 237,244 | ||||
CONSOL Energy, Inc.(a) | 11,719 | 1,531,673 | ||||
Southern Copper Corp.(a) | 3,887 | 390,072 | ||||
2,158,989 | ||||||
3 |
Shares | Value | |||||||||||
COMMON STOCKS — (Continued) | ||||||||||||
Miscellaneous Manufacturing — 1.7% | ||||||||||||
Johnson & Johnson(a) | 11,360 | $1,760,913 | ||||||||||
Peloton Interactive, Inc. - Class A(a)(b) | 80,067 | 827,893 | ||||||||||
ResMed, Inc.(a) | 3,384 | 842,684 | ||||||||||
3,431,490 | ||||||||||||
Motor Vehicle and Parts Dealers — 2.9% | ||||||||||||
Cargurus, Inc.(a)(b) | 47,716 | 1,804,619 | ||||||||||
Carvana Co.(a)(b) | 14,693 | 3,826,351 | ||||||||||
Murphy USA, Inc.(a) | 780 | 427,284 | ||||||||||
6,058,254 | ||||||||||||
Nonmetallic Mineral Product Manufacturing — 1.1% | ||||||||||||
Corning, Inc.(a) | 27,341 | 1,330,686 | ||||||||||
Eagle Materials, Inc.(a) | 2,836 | 876,097 | ||||||||||
Owens Corning(a) | 14 | 2,879 | ||||||||||
2,209,662 | ||||||||||||
Oil and Gas Extraction — 1.1% | ||||||||||||
APA Corp.(a) | 26,137 | 592,003 | ||||||||||
CNX Resources Corp.(a)(b) | 39,670 | 1,607,429 | ||||||||||
2,199,432 | ||||||||||||
Paper Manufacturing — 0.5% | ||||||||||||
Sylvamo Corp.(a) | 12,273 | 1,132,675 | ||||||||||
Petroleum and Coal Products Manufacturing — 0.3% | ||||||||||||
Valero Energy Corp.(a) | 4,267 | 593,454 | ||||||||||
Professional, Scientific, and Technical Services — 13.9% | ||||||||||||
Alphabet, Inc. - Class A(a) | 41,394 | 6,993,516 | ||||||||||
Alphabet, Inc. - Class C(a) | 5,663 | 965,485 | ||||||||||
AppLovin Corp. - Class A(a)(b) | 13,852 | 4,664,661 | ||||||||||
Booz Allen Hamilton Holding Corp.(a) | 2,297 | 340,370 | ||||||||||
CACI International, Inc. - Class A(a)(b) | 1,588 | 730,289 | ||||||||||
Exelixis, Inc.(a)(b) | 16,353 | 596,230 | ||||||||||
F5, Inc.(a)(b) | 5,269 | 1,319,094 | ||||||||||
Gen Digital, Inc.(a) | 62,315 | 1,922,418 | ||||||||||
GoDaddy, Inc. - Class A(a)(b) | 15,131 | 2,989,432 | ||||||||||
Leidos Holdings, Inc. | 4,014 | 663,916 | ||||||||||
Nutanix, Inc. - Class A(a)(b) | 33,719 | 2,201,176 | ||||||||||
Oracle Corp.(a) | 14,773 | 2,730,641 | ||||||||||
Paylocity Holding Corp.(a)(b) | 2,350 | 487,719 | ||||||||||
Science Applications International Corp.(a) | 5,284 | 656,537 | ||||||||||
Ubiquiti, Inc.(a) | 4,416 | 1,530,100 | ||||||||||
28,791,584 | ||||||||||||
Publishing Industries — 7.3% | ||||||||||||
ACI Worldwide, Inc.(a)(b) | 49,180 | 2,794,408 | ||||||||||
Box, Inc. - Class A(a)(b) | 4,248 | 149,062 | ||||||||||
4 |
Shares | Value | |||||
COMMON STOCKS — (Continued) | ||||||
Publishing Industries — (Continued) | ||||||
Commvault Systems, Inc.(a)(b) | 16,951 | $2,908,622 | ||||
DocuSign, Inc.(a)(b) | 35,330 | 2,815,448 | ||||
Hewlett Packard Enterprise Co.(a) | 186,618 | 3,960,034 | ||||
Palantir Technologies, Inc. - Class A(a)(b) | 35,681 | 2,393,481 | ||||
15,021,055 | ||||||
Rail Transportation — 0.5% | ||||||
Union Pacific Corp.(a) | 4,166 | 1,019,254 | ||||
Real Estate — 0.2% | ||||||
Jones Lang LaSalle, Inc.(a)(b) | 1,583 | 444,190 | ||||
Rental and Leasing Services — 1.0% | ||||||
Netflix, Inc.(a)(b) | 1,960 | 1,738,148 | ||||
Ryder System, Inc.(a) | 2,641 | 445,906 | ||||
2,184,054 | ||||||
Securities, Commodity Contracts, and Other Financial Investments and Related Activities — 2.2% | ||||||
Blackrock, Inc.(a) | 1,549 | 1,584,317 | ||||
StoneX Group, Inc.(a)(b) | 18,070 | 1,874,943 | ||||
Victory Capital Holdings, Inc. - Class A(a) | 14,663 | 1,018,786 | ||||
4,478,046 | ||||||
Specialty Trade Contractors — 1.9% | ||||||
ABM Industries, Inc.(a) | 6,979 | 398,989 | ||||
EMCOR Group, Inc.(a) | 3,139 | 1,601,267 | ||||
IES Holdings, Inc.(a)(b) | 6,016 | 1,864,088 | ||||
3,864,344 | ||||||
Sporting Goods, Hobby, Musical Instrument, Book, and Miscellaneous Retailers — 2.8% | ||||||
Amazon.com, Inc.(a)(b) | 26,635 | 5,537,150 | ||||
Coupang, Inc.(a)(b) | 12,599 | 319,511 | ||||
5,856,661 | ||||||
Support Activities for Mining — 1.3% | ||||||
Royal Gold, Inc.(a) | 6,779 | 991,497 | ||||
TechnipFMC PLC(a) | 54,044 | 1,695,360 | ||||
2,686,857 | ||||||
Support Activities for Transportation — 0.8% | ||||||
CH Robinson Worldwide, Inc.(a) | 11,287 | 1,191,682 | ||||
Matson, Inc.(a) | 2,739 | 419,560 | ||||
1,611,242 | ||||||
Telecommunications — 1.1% | ||||||
AT&T, Inc.(a) | 33,841 | 783,758 | ||||
T-Mobile US, Inc.(a) | 6,126 | 1,512,754 | ||||
2,296,512 | ||||||
5 |
Shares | Value | |||||
COMMON STOCKS — (Continued) | ||||||
Transportation Equipment Manufacturing — 2.9% | ||||||
Atmus Filtration Technologies, Inc.(a) | 28,920 | $1,251,947 | ||||
General Motors Co.(a) | 31,127 | 1,730,350 | ||||
Tesla, Inc.(a)(b) | 8,635 | 2,980,456 | ||||
5,962,753 | ||||||
Utilities — 4.3% | ||||||
Avista Corp.(a) | 25,925 | 1,003,038 | ||||
Cheniere Energy, Inc.(a) | 9,574 | 2,144,672 | ||||
GE Vernova, Inc.(a)(b) | 2,991 | 999,353 | ||||
NRG Energy, Inc.(a) | 16,125 | 1,638,461 | ||||
Pinnacle West Capital Corp.(a) | 7,443 | 697,409 | ||||
Spire, Inc.(a) | 13,592 | 994,799 | ||||
Vistra Corp.(a) | 8,488 | 1,356,722 | ||||
8,834,454 | ||||||
Water Transportation — 0.4% | ||||||
Carnival Corp.(a)(b) | 31,117 | 791,305 | ||||
Web Search Portals, Libraries, Archives, and Other Information Services — 3.3% | ||||||
Meta Platforms, Inc. - Class A(a) | 11,829 | 6,793,631 | ||||
Wood Product Manufacturing — 0.5% | ||||||
Louisiana-Pacific Corp.(a) | 8,671 | 1,024,912 | ||||
TOTAL COMMON STOCKS (Cost $198,442,657) | 237,056,271 | |||||
REAL ESTATE INVESTMENT TRUSTS — 2.6% | ||||||
Professional, Scientific, and Technical Services — 0.4% | ||||||
Outfront Media, Inc.(a) | 40,205 | 772,338 | ||||
Real Estate — 1.8% | ||||||
CareTrust REIT, Inc.(a) | 28,813 | 858,339 | ||||
COPT Defense Properties(a) | 23,643 | 779,037 | ||||
Equity Residential(a) | 9,809 | 751,958 | ||||
Lamar Advertising Co. - Class A(a) | 5,089 | 682,028 | ||||
Simon Property Group, Inc.(a) | 3,860 | 708,696 | ||||
3,780,058 | ||||||
Securities, Commodity Contracts, and Other Financial Investments and Related Activities — 0.4% | ||||||
Innovative Industrial Properties, Inc.(a) | 7,057 | 769,354 | ||||
TOTAL REAL ESTATE INVESTMENT TRUSTS (Cost $4,926,405) | 5,321,750 | |||||
6 |
Shares | Value | |||||
SHORT-TERM INVESTMENTS — 0.2% | ||||||
Money Market Funds — 0.2% | ||||||
First American Government Obligations Fund - Class X, 4.56%(d) | 467,866 | $467,866 | ||||
TOTAL SHORT-TERM INVESTMENTS (Cost $467,866) | 467,866 | |||||
TOTAL INVESTMENTS — 117.4% (Cost $203,836,928) | $242,845,887 | |||||
Liabilities in Excess of Other Assets — (17.4)% | (36,003,817) | |||||
TOTAL NET ASSETS — 100.0% | $206,842,070 | |||||
(a) | All or a portion of security has been pledged as collateral. The total value of assets committed as collateral as of November 30, 2024 is $238,066,004. |
(b) | Non-income producing security. |
(c) | Represents less than 0.05% of net assets. |
(d) | The rate shown represents the 7-day annualized effective yield as of November 30, 2024. |
7 |
Shares | Value | |||||
COMMON STOCKS — (49.5)% | ||||||
Accommodation — (0.3)% | ||||||
Hilton Grand Vacations, Inc. | (2,787) | $(118,141) | ||||
Penn Entertainment, Inc. | (4,521) | (97,608) | ||||
Vail Resorts, Inc. | (2,679) | (480,184) | ||||
(695,933) | ||||||
Administrative and Support Services — (1.9)% | ||||||
ACV Auctions, Inc. - Class A | (11,585) | (262,053) | ||||
Live Nation Entertainment, Inc. | (4,651) | (643,001) | ||||
MSCI, Inc. | (1,772) | (1,080,264) | ||||
RB Global, Inc. | (2,627) | (256,815) | ||||
Remitly Global, Inc. | (34,326) | (705,743) | ||||
ROBLOX Corp. - Class A | (13,878) | (695,704) | ||||
Six Flags Entertainment Corp. | (3,936) | (181,804) | ||||
(3,825,384) | ||||||
Air Transportation — (0.1)% | ||||||
JetBlue Airways Corp. | (24,624) | (147,005) | ||||
Amusement, Gambling, and Recreation Industries — (0.2)% | ||||||
Walt Disney Co. | (3,359) | (394,582) | ||||
Beverage and Tobacco Product Manufacturing — (0.5)% | ||||||
Celsius Holdings, Inc. | (19,523) | (555,430) | ||||
Monster Beverage Corp. | (9,118) | (502,675) | ||||
(1,058,105) | ||||||
Broadcasting and Content Providers — (0.4)% | ||||||
Warner Bros Discovery, Inc. | (88,139) | (923,697) | ||||
Chemical Manufacturing — (2.9)% | ||||||
Air Products and Chemicals, Inc. | (958) | (320,288) | ||||
Albemarle Corp. | (3,232) | (348,087) | ||||
Apellis Pharmaceuticals, Inc. | (10,455) | (354,738) | ||||
Arrowhead Pharmaceuticals, Inc. | (13,050) | (339,692) | ||||
Bridgebio Pharma, Inc. | (24,637) | (667,416) | ||||
Coty, Inc. - Class A | (47,448) | (350,641) | ||||
elf Beauty, Inc. | (4,314) | (558,749) | ||||
Estee Lauder Cos., Inc. - Class A | (3,786) | (273,046) | ||||
Exact Sciences Corp. | (2,847) | (176,742) | ||||
Huntsman Corp. | (8,488) | (166,195) | ||||
Ionis Pharmaceuticals, Inc. | (12,943) | (462,453) | ||||
Madrigal Pharmaceuticals, Inc. | (1,148) | (376,762) | ||||
Moderna, Inc. | (27,992) | (1,205,336) | ||||
QuidelOrtho Corp. | (8,038) | (329,558) | ||||
(5,929,703) | ||||||
8 |
Shares | Value | |||||
COMMON STOCKS — (Continued) | ||||||
Clothing, Clothing Accessories, Shoe, and Jewelry Retailers — (0.3)% | ||||||
Foot Locker, Inc. | (9,984) | $(251,098) | ||||
Lululemon Athletica, Inc. | (1,053) | (337,655) | ||||
(588,753) | ||||||
Computer and Electronic Product Manufacturing — (10.8)% | ||||||
Allegro MicroSystems, Inc. | (46,274) | (1,005,534) | ||||
Bruker Corp. | (12,330) | (714,523) | ||||
Cisco Systems, Inc. | (21,971) | (1,300,903) | ||||
Cognex Corp. | (27,373) | (1,094,373) | ||||
Dell Technologies, Inc. - Class C | (8,821) | (1,125,471) | ||||
Dolby Laboratories, Inc. - Class A | (11,649) | (912,350) | ||||
EchoStar Corp. - Class A | (37,033) | (936,565) | ||||
Enphase Energy, Inc. | (3,600) | (256,860) | ||||
First Solar, Inc. | (13,148) | (2,620,002) | ||||
Intel Corp. | (76,204) | (1,832,706) | ||||
Lattice Semiconductor Corp. | (18,447) | (1,046,867) | ||||
Masimo Corp. | (2,158) | (372,341) | ||||
Microchip Technology, Inc. | (20,606) | (1,404,711) | ||||
ON Semiconductor Corp. | (11,596) | (824,707) | ||||
Roper Technologies, Inc. | (2,486) | (1,408,170) | ||||
Super Micro Computer, Inc. | (27,087) | (884,120) | ||||
Teledyne Technologies, Inc. | (2,353) | (1,141,817) | ||||
Texas Instruments, Inc. | (8,189) | (1,646,235) | ||||
Western Digital Corp. | (20,788) | (1,517,316) | ||||
Zebra Technologies Corp. - Class A | (898) | (365,486) | ||||
(22,411,057) | ||||||
Construction of Buildings — (0.2)% | ||||||
Century Communities, Inc. | (1,551) | (140,148) | ||||
LGI Homes, Inc. | (1,763) | (193,031) | ||||
(333,179) | ||||||
Credit Intermediation and Related Activities — (2.6)% | ||||||
Banc of California, Inc. | (31,974) | (550,912) | ||||
Citigroup, Inc. | (5,714) | (404,951) | ||||
Credit Acceptance Corp. | (1,662) | (827,177) | ||||
Eastern Bankshares, Inc. | (19,711) | (367,413) | ||||
First Citizens BancShares, Inc./NC - Class A | (328) | (752,760) | ||||
Flagstar Financial, Inc. | (49,577) | (593,437) | ||||
KeyCorp | (23,076) | (449,520) | ||||
Mr Cooper Group, Inc. | (6,270) | (618,661) | ||||
Popular, Inc. | (3,017) | (299,769) | ||||
Truist Financial Corp. | (4,454) | (212,367) | ||||
Western Alliance Bancorp | (4,219) | (394,941) | ||||
(5,471,908) | ||||||
9 |
Shares | Value | |||||
COMMON STOCKS — (Continued) | ||||||
Data Processing, Hosting & Related Services — (0.8)% | ||||||
Airbnb, Inc. - Class A | (6,632) | $(902,681) | ||||
Alight, Inc. - Class A | (33,057) | (264,456) | ||||
Five9, Inc. | (12,439) | (513,482) | ||||
(1,680,619) | ||||||
Electrical Equipment, Appliance, and Component Manufacturing — (0.2)% | ||||||
SharkNinja, Inc. | (3,186) | (320,352) | ||||
Fabricated Metal Product Manufacturing — (0.4)% | ||||||
Chart Industries, Inc. | (1,782) | (344,372) | ||||
Enovis Corp. | (9,866) | (481,559) | ||||
(825,931) | ||||||
Food Manufacturing — (0.7)% | ||||||
Darling Ingredients, Inc. | (9,748) | (395,086) | ||||
Hershey Co. | (2,658) | (468,154) | ||||
Lamb Weston Holdings, Inc. | (6,589) | (508,934) | ||||
(1,372,174) | ||||||
Furniture, Home Furnishings, Electronics, and Appliance Retailers — (1.1)% | ||||||
Floor & Decor Holdings, Inc. - Class A | (10,379) | (1,164,627) | ||||
RH | (3,121) | (1,202,022) | ||||
(2,366,649) | ||||||
General Merchandise Retailers — (1.4)% | ||||||
Dollar General Corp. | (10,572) | (816,898) | ||||
Dollar Tree, Inc. | (12,717) | (906,341) | ||||
Five Below, Inc. | (13,018) | (1,206,769) | ||||
(2,930,008) | ||||||
Insurance Carriers and Related Activities — (1.7)% | ||||||
Arthur J Gallagher & Co. | (1,151) | (359,388) | ||||
Assured Guaranty Ltd. | (3,464) | (323,122) | ||||
Berkshire Hathaway, Inc. - Class B | (2,853) | (1,378,056) | ||||
Brighthouse Financial, Inc. | (6,428) | (335,991) | ||||
Kinsale Capital Group, Inc. | (870) | (442,343) | ||||
Markel Group, Inc. | (163) | (290,616) | ||||
RenaissanceRe Holdings Ltd. | (1,046) | (299,313) | ||||
(3,428,829) | ||||||
Machinery Manufacturing — (1.3)% | ||||||
AGCO Corp. | (3,934) | (398,160) | ||||
Brunswick Corp./DE | (2,208) | (177,766) | ||||
General Electric Co. | (7,365) | (1,341,608) | ||||
Terex Corp. | (6,700) | (367,093) | ||||
Xylem, Inc./NY | (3,742) | (474,299) | ||||
(2,758,926) | ||||||
Management of Companies and Enterprises — (1.6)% | ||||||
Atlanta Braves Holdings, Inc. - Class C | (5,793) | (233,748) | ||||
CNH Industrial NV | (33,489) | (420,622) | ||||
10 |
Shares | Value | |||||
COMMON STOCKS — (Continued) | ||||||
Management of Companies and Enterprises — (Continued) | ||||||
Rivian Automotive, Inc. - Class A | (88,236) | $(1,079,126) | ||||
Smurfit WestRock PLC | (7,004) | (385,360) | ||||
StoneCo Ltd. - Class A | (54,793) | (519,438) | ||||
U-Haul Holding Co. | (5,103) | (318,631) | ||||
White Mountains Insurance Group Ltd. | (216) | (434,158) | ||||
(3,391,083) | ||||||
Merchant Wholesalers, Durable Goods — (1.0)% | ||||||
LKQ Corp. | (8,950) | (351,646) | ||||
Pool Corp. | (3,502) | (1,320,569) | ||||
SiteOne Landscape Supply, Inc. | (2,204) | (337,763) | ||||
(2,009,978) | ||||||
Merchant Wholesalers, Nondurable Goods — (0.2)% | ||||||
Birkenstock Holding PLC | (7,232) | (373,605) | ||||
Mining (except Oil and Gas) — (0.7)% | ||||||
Martin Marietta Materials, Inc. | (438) | (262,800) | ||||
Summit Materials, Inc. - Class A | (9,010) | (458,969) | ||||
Uranium Energy Corp. | (49,812) | (413,938) | ||||
Vulcan Materials Co. | (921) | (265,368) | ||||
(1,401,075) | ||||||
Miscellaneous Manufacturing — (1.8)% | ||||||
Dexcom, Inc. | (17,993) | (1,403,274) | ||||
Edwards Lifesciences Corp. | (7,986) | (569,801) | ||||
Inari Medical, Inc. | (6,755) | (350,720) | ||||
Inspire Medical Systems, Inc. | (3,910) | (753,692) | ||||
Neogen Corp. | (37,228) | (527,893) | ||||
PROCEPT BioRobotics Corp. | (2,094) | (200,165) | ||||
(3,805,545) | ||||||
Motor Vehicle and Parts Dealers — (0.2)% | ||||||
Asbury Automotive Group, Inc. | (1,183) | (307,379) | ||||
Oil and Gas Extraction — (0.7)% | ||||||
EQT Corp. | (11,589) | (526,604) | ||||
Expand Energy Corp. | (4,488) | (444,133) | ||||
Northern Oil & Gas, Inc. | (10,280) | (447,077) | ||||
(1,417,814) | ||||||
Performing Arts, Spectator Sports, and Related Industries — (0.3)% | ||||||
Caesars Entertainment, Inc. | (8,002) | (307,997) | ||||
Churchill Downs, Inc. | (2,612) | (371,191) | ||||
(679,188) | ||||||
Plastics and Rubber Products Manufacturing — (0.6)% | ||||||
West Pharmaceutical Services, Inc. | (4,036) | (1,314,444) | ||||
11 |
Shares | Value | |||||
COMMON STOCKS — (Continued) | ||||||
Primary Metal Manufacturing — (0.2)% | ||||||
Alcoa Corp. | (4,934) | $(229,086) | ||||
Steel Dynamics, Inc. | (1,931) | (280,516) | ||||
(509,602) | ||||||
Professional, Scientific, and Technical Services — (3.4)% | ||||||
Accenture PLC - Class A | (3,116) | (1,129,145) | ||||
Aspen Technology, Inc. | (6,881) | (1,720,250) | ||||
Atlassian Corp. - Class A | (3,770) | (993,697) | ||||
CG oncology, Inc. | (6,280) | (218,230) | ||||
Charles River Laboratories International, Inc. | (1,404) | (279,480) | ||||
Cleanspark, Inc. | (36,407) | (522,441) | ||||
Cytokinetics, Inc. | (11,049) | (573,001) | ||||
Elastic NV | (6,655) | (728,456) | ||||
Take-Two Interactive Software, Inc. | (4,135) | (778,951) | ||||
(6,943,651) | ||||||
Publishing Industries — (3.0)% | ||||||
Braze, Inc. - Class A | (30,986) | (1,230,764) | ||||
Cadence Design Systems, Inc. | (3,033) | (930,555) | ||||
Dayforce, Inc. | (3,664) | (293,083) | ||||
News Corp. - Class B | (36,367) | (1,167,017) | ||||
NEXTracker, Inc. - Class A | (11,716) | (447,083) | ||||
Paycor HCM, Inc. | (16,854) | (304,383) | ||||
Synopsys, Inc. | (1,912) | (1,067,833) | ||||
ZoomInfo Technologies, Inc. | (68,393) | (748,219) | ||||
(6,188,937) | ||||||
Real Estate — (0.1)% | ||||||
St Joe Co. | (3,253) | (166,163) | ||||
Rental and Leasing Services — (0.3)% | ||||||
Air Lease Corp. | (11,673) | (594,156) | ||||
Repair and Maintenance — (0.5)% | ||||||
Driven Brands Holdings, Inc. | (17,791) | (299,778) | ||||
Mister Car Wash, Inc. | (25,820) | (206,560) | ||||
Valvoline, Inc. | (15,763) | (625,949) | ||||
(1,132,287) | ||||||
Securities, Commodity Contracts, and Other Financial Investments and Related Activities — (2.0)% | ||||||
Aurora Innovation, Inc. | (97,414) | (630,269) | ||||
Franklin Resources, Inc. | (33,206) | (755,769) | ||||
Goldman Sachs Group, Inc. | (1,568) | (954,238) | ||||
LPL Financial Holdings, Inc. | (2,196) | (714,029) | ||||
Nasdaq, Inc. | (7,646) | (634,541) | ||||
XP, Inc. - Class A | (25,141) | (340,409) | ||||
(4,029,255) | ||||||
12 |
Shares | Value | |||||
COMMON STOCKS — (Continued) | ||||||
Support Activities for Mining — (1.0)% | ||||||
Atlas Energy Solutions, Inc. | (20,878) | $(492,095) | ||||
Gulfport Energy Corp. | (3,011) | (529,334) | ||||
Patterson-UTI Energy, Inc. | (65,075) | (546,630) | ||||
Valaris Ltd. | (12,286) | (567,490) | ||||
(2,135,549) | ||||||
Support Activities for Transportation — (0.3)% | ||||||
Norfolk Southern Corp. | (1,000) | (275,850) | ||||
XPO, Inc. | (2,060) | (313,965) | ||||
(589,815) | ||||||
Telecommunications — (0.5)% | ||||||
Charter Communications, Inc. - Class A | (2,437) | (967,404) | ||||
Transportation Equipment Manufacturing — (1.4)% | ||||||
AAR Corp. | (5,582) | (388,061) | ||||
AeroVironment, Inc. | (1,278) | (248,571) | ||||
Aptiv PLC | (11,982) | (665,360) | ||||
Boeing Co. | (6,608) | (1,027,147) | ||||
Gentex Corp. | (6,160) | (188,250) | ||||
Oshkosh Corp. | (2,926) | (332,423) | ||||
(2,849,812) | ||||||
Truck Transportation — (0.3)% | ||||||
Knight-Swift Transportation Holdings, Inc. | (3,276) | (194,463) | ||||
Saia, Inc. | (763) | (434,208) | ||||
(628,671) | ||||||
Utilities — (1.0)% | ||||||
AES Corp. | (22,405) | (292,161) | ||||
American Water Works Co., Inc. | (3,933) | (538,585) | ||||
Atmos Energy Corp. | (1,333) | (201,710) | ||||
Brookfield Infrastructure Corp. - Class A | (6,046) | (271,405) | ||||
Essential Utilities, Inc. | (12,816) | (513,024) | ||||
Sempra | (3,558) | (333,278) | ||||
(2,150,163) | ||||||
Web Search Portals, Libraries, Archives, and Other Information Services — (0.4)% | ||||||
Pinterest, Inc. - Class A | (30,234) | (916,695) | ||||
Wood Product Manufacturing — (0.2)% | ||||||
Trex Co., Inc. | (4,913) | (368,622) | ||||
TOTAL COMMON STOCKS (Proceeds $100,252,698) | (102,333,687) | |||||
REAL ESTATE INVESTMENT TRUSTS — (1.5)% | ||||||
Forestry and Logging — (0.1)% | ||||||
PotlatchDeltic Corp. | (5,551) | (248,907) | ||||
13 |
Shares | Value | |||||
REAL ESTATE INVESTMENT TRUSTS — (Continued) | ||||||
Real Estate — (1.0)% | ||||||
Equinix, Inc. | (305) | $(299,351) | ||||
Kite Realty Group Trust | (12,448) | (343,191) | ||||
Prologis, Inc. | (1,936) | (226,086) | ||||
Public Storage | (1,391) | (484,138) | ||||
Rayonier, Inc. | (4,712) | (150,171) | ||||
Rexford Industrial Realty, Inc. | (7,573) | (318,672) | ||||
Starwood Property Trust, Inc. | (17,732) | (361,201) | ||||
(2,182,810) | ||||||
Securities, Commodity Contracts, and Other Financial Investments and Related Activities — (0.2)% | ||||||
Americold Realty Trust, Inc. | (13,939) | (332,584) | ||||
Warehousing and Storage — (0.2)% | ||||||
Extra Space Storage, Inc. | (1,910) | (326,534) | ||||
TOTAL REAL ESTATE INVESTMENT TRUSTS (Proceeds $3,036,742) | (3,090,835) | |||||
EXCHANGE TRADED FUNDS — (0.5)% | ||||||
Invesco QQQ Trust Series 1 | (1,987) | (1,012,854) | ||||
iShares Core S&P 500 ETF | (2) | (1,210) | ||||
TOTAL EXCHANGE TRADED FUNDS (Proceeds $1,000,932) | $(1,014,064) | |||||
TOTAL SECURITIES SOLD SHORT — (51.5)% (Proceeds $104,290,372) | $(106,438,586) | |||||
14 |
Assets | |||
Investments, at value (cost $203,836,928) | $242,845,887 | ||
Deposit for short sales at broker | 70,375,555 | ||
Dividends and interest receivable | 238,592 | ||
Cash | 28 | ||
Total assets | 313,460,062 | ||
Liabilities | |||
Securities sold short, at value (proceeds $104,290,372) | 106,438,586 | ||
Dividends payable on short positions | 27,686 | ||
Payable to Adviser | 151,720 | ||
Total liabilities | 106,617,992 | ||
Net Assets | $206,842,070 | ||
Net Assets Consist of: | |||
Paid-in capital | 186,896,579 | ||
Total distributable earnings | 19,945,491 | ||
Net assets | $206,842,070 | ||
Shares of beneficial interest outstanding (unlimited number of shares authorized, $0.001 par value) | 8,797,329 | ||
Net asset value, redemption price and offering price per share | $23.51 | ||
15 |
Investment Income | |||
Dividend income | $1,625,453 | ||
Prime broker interest income, net | 1,609,253 | ||
Interest Income | 21,345 | ||
Total investment income | 3,256,051 | ||
Expenses | |||
Management fees | 1,047,946 | ||
Dividends on short positions | 543,784 | ||
Other expenses | 1,220 | ||
Total expenses | 1,592,950 | ||
Net investment income | 1,663,101 | ||
Realized and Unrealized Gain (Loss) on Investments | |||
Net realized gain (loss) from: | |||
Investments | (2,367,051) | ||
In-kind redemptions | 13,020,196 | ||
Short transactions | (14,565,219) | ||
Change in net unrealized appreciation (depreciation) on: | |||
Investments | 35,029,112 | ||
Short positions | (3,140,226) | ||
Realized and Unrealized Gain on Investments | 27,976,812 | ||
Net Increase in Net Assets from Operations | $29,639,913 | ||
16 |
Year Ended November 30, 2024 | Year Ended November 30, 2023 | |||||
From Operations | ||||||
Net investment income | $1,663,101 | $372,285 | ||||
Net realized gain (loss) from: | ||||||
Investments | (2,367,051) | (1,792,565) | ||||
In-kind redemptions | 13,020,196 | 4,103,411 | ||||
Short transactions | (14,565,219) | 1,128,853 | ||||
Change in net unrealized appreciation (depreciation) on: | ||||||
Investments | 35,029,112 | 565,669 | ||||
Short positions | (3,140,226) | (1,480,089) | ||||
Net increase in net assets from operations | 29,639,913 | 2,897,564 | ||||
From Distributions | ||||||
Dividend and distributions | (389,482) | (194,639) | ||||
Decrease in net assets resulting from distributions paid | (389,482) | (194,639) | ||||
From Capital Share Transactions | ||||||
Proceeds from shares sold | 192,047,617 | 23,548,901 | ||||
Payments for shares redeemed | (46,297,986) | (18,785,490) | ||||
Payments for transaction fees (Note 8) | 838 | 46 | ||||
Net increase in net assets from capital share transactions | 145,750,469 | 4,763,457 | ||||
Total Increase In Net Assets | 175,000,900 | 7,466,382 | ||||
Net Assets | ||||||
Beginning of year | 31,841,170 | 24,374,788 | ||||
End of year | $ 206,842,070 | $31,841,170 | ||||
17 |
CASH FLOWS FROM OPERATING ACTIVITIES: | |||
Net increase in net assets resulting from operations | $29,639,913 | ||
Adjustments to reconcile net increase in net assets from operations to net cash used in operating activities: | |||
Purchases of investments | (503,419,595) | ||
Proceeds from sales of short-term investments, net | 76,562 | ||
Proceeds from sales of long-term investments | 343,555,762 | ||
Return of capital distributions received from underlying investments | 134,667 | ||
Increase in dividends and interest receivable | (178,657) | ||
Decrease in receivable for investment securities sold | 655,080 | ||
Proceeds from securities sold short | 275,735,999 | ||
Purchases to cover securities sold short | (202,152,863) | ||
Decrease in payable for investment securities purchased | (1,034,665) | ||
Increase in dividends payable on short positions | 7,507 | ||
Increase in payable to Adviser | 129,279 | ||
Net change in unrealized appreciation on investments | (35,029,112) | ||
Net change in unrealized on short positions | 3,140,226 | ||
Net realized gain on investments | (10,653,145) | ||
Net realized gain on short transactions | 14,565,219 | ||
Net cash used in operating activities | (84,827,823) | ||
CASH FLOWS FROM FINANCING ACTIVITIES: | |||
Proceeds from shares sold | 192,388,653 | ||
Payment on shares redeemed | (46,297,986) | ||
Proceeds from transaction fees | 838 | ||
Cash distributions paid to shareholders | (389,482) | ||
Net cash provided by financing activities | 145,702,023 | ||
Net change in cash | 60,874,200 | ||
CASH: | |||
Beginning balance | 9,501,383 | ||
Ending balance | $70,375,583 | ||
SUPPLEMENTAL DISCLOSURES: | |||
Cash received for interest | 1,779,194 | ||
Cash paid for interest | (169,940) | ||
Non-cash operating activities - purchases of investment securities in-kind | (47,402,303) | ||
Non-cash operating activities - sales of investment securities in-kind | 213,314,189 | ||
Non-cash financing activities - proceeds from shares sold in-kind | (47,402,303) | ||
Non-cash financing activities - payment on shares redeemed in-kind | 213,314,189 | ||
Non-cash financing activities - increase in receivable for fund shares sold | 341,036 | ||
RESTRICTED AND UNRESTRICTED CASH | |||
Beginning balances | |||
Cash | — | ||
Deposit for short sales at broker | 9,501,383 | ||
9,501,383 | |||
Ending balances | |||
Cash | 28 | ||
Deposit for short sales at broker | 70,375,555 | ||
70,375,583 | |||
18 |
Year Ended November 30, | |||||||||||||||
2024 | 2023 | 2022(5) | 2021 | 2020 | |||||||||||
Net asset value, beginning of year | $17.05 | $15.45 | $17.94 | $14.03 | $19.76 | ||||||||||
Income from investment operations: | |||||||||||||||
Net investment income (loss)(1) | 0.32 | 0.23 | 0.07 | (0.03) | 0.01 | ||||||||||
Net realized and unrealized gain (loss) on investments | 6.34 | 1.49 | 0.31 | 3.98 | (1.11) | ||||||||||
Total from Investment Operations | 6.66 | 1.72 | 0.38 | 3.95 | (1.10) | ||||||||||
Less distributions paid: | |||||||||||||||
From net investment income | (0.20) | (0.12) | — | (0.04) | (0.13) | ||||||||||
From net realized gains | — | — | (2.87) | — | (4.50) | ||||||||||
Total distributions paid | (0.20) | (0.12) | (2.87) | (0.04) | (4.63) | ||||||||||
Net asset value, end of year | $23.51 | $17.05 | $15.45 | $17.94 | $14.03 | ||||||||||
Market Price, End of Year | $23.55 | $17.04 | $15.43 | $— | $— | ||||||||||
Total Return on NAV(2) | 39.57% | 11.28% | 2.39% | 28.26% | −7.68% | ||||||||||
Supplemental Data and Ratios: | |||||||||||||||
Net assets at end of year (000’s) | $206,842 | $31,841 | $24,375 | $29,313 | $22,537 | ||||||||||
Ratio of expenses to average net assets: | |||||||||||||||
Before waiver, expense reimbursement and recoupments(3) | 1.44% | 1.55% | 1.58% | 2.56% | 2.58% | ||||||||||
After waiver, expense reimbursement and recoupments(3) | 1.44% | 1.55% | 1.38% | 2.11% | 2.39% | ||||||||||
Ratio of net investment income (loss) to average net assets: | |||||||||||||||
Before waiver, expense reimbursement and recoupments | 1.51% | 1.50% | 0.26% | (0.63)% | (0.13)% | ||||||||||
After waiver, expense reimbursement and recoupments | 1.51% | 1.50% | 0.46% | (0.18)% | 0.06% | ||||||||||
Portfolio turnover rate | 225.05%(4) | 283.70%(4) | 244.44%(4) | 303.76% | 251.72% | ||||||||||
(1) | Per share net investment income (loss) was calculated using the daily average shares outstanding method. |
(2) | Total return represents the rate that the investor would have earned or lost on an investment in the Fund, assuming reinvestment of dividends. Total return represented is total return of Net Asset Value. |
(3) | The ratio of expenses to average net assets includes dividends on short positions, interest and broker expenses. The annualized before waiver, expense reimbursement and recoupments after waiver, expense reimbursement and recoupments ratios excluding dividends on short positions, interest and broker expenses were 0.95% and 0.95%, 0.95% and 0.95%, 1.28% and 1.08%, 1.95% and 1.50%, 1.69% and 1.50%, for the years ended November 30, 2024, November 30, 2023, November 30, 2022, November 30, 2021, November 30, 2020, respectively. |
(4) | Excludes the impact of in-kind transactions. |
(5) | The Fund converted from a mutual fund to an ETF pursuant to an Agreement and Plan of Reorganization on February 18, 2022. See Note 1 in the Notes to Financial Statements for additional information about the Reorganization. |
19 |
Convergence Long/Short Equity Fund Net Assets* | Shares Issued to Shareholders of Convergence Long/Short Equity Fund | Convergence Long/Short Equity ETF Net Assets | Combined Net Assets | Tax Status of Transfer | |||||||||
$26,419,556 | 1,707,329 | $ — | $26,419,556 | Non-Taxable | |||||||||
| * | Includes accumulated net investment losses, accumulated realized gains and unrealized appreciation in the amounts of $(86,871), $2,453,571, and $8,049,316, respectively. |
| (a) | Investment Valuation. Each security owned by the Fund, including long and short positions of common stock and real estate investment trusts, that is listed on a securities exchange, except those listed on the NASDAQ Stock Market LLC (“NASDAQ”), is valued at its last sale price on that exchange on the date as of which assets are valued. When the security is listed on more than one exchange, the Fund will use the price of the exchange that the Fund generally considers to be the principal exchange on which the stock is traded. |
20 |
Level 1 | Level 2 | Level 3 | Total | |||||||||
Assets(1): | ||||||||||||
Common Stock | $237,056,271 | $ — | $ — | $237,056,271 | ||||||||
Real Estate Investment Trusts | 5,321,750 | — | — | 5,321,750 | ||||||||
Short-Term Investments | 467,866 | — | — | 467,866 | ||||||||
Total Assets | $242,845,887 | $— | $— | $242,845,887 | ||||||||
21 |
Level 1 | Level 2 | Level 3 | Total | |||||||||
Liabilities: | ||||||||||||
Securities Sold Short | ||||||||||||
Common Stocks | $(102,333,687) | $ — | $ — | $(102,333,687) | ||||||||
Real Estate Investment Trusts | (3,090,835) | — | — | (3,090,835) | ||||||||
Exchange Traded Funds | (1,014,064) | — | — | (1,014,064) | ||||||||
Total Securities Sold Short | (106,438,586) | — | — | (106,438,586) | ||||||||
Total Liabilities | $(106,438,586) | $— | $— | $(106,438,586) | ||||||||
(1) | See the Schedule of Investments for industry classifications. |
| (b) | Short Positions. The Fund may sell a security it does not own in anticipation of a decline in the fair value of that security. When the Fund sells a security short, it must borrow the security sold short and deliver it to the broker-dealer through which it made the short sale. A gain, limited to the price at which the Fund sold the security short, or a loss, unlimited in size, will be recognized upon the termination of a short sale. For financial statement purposes, an amount equal to the settlement amount is included in the Statement of Assets and Liabilities as a liability. The amount of the liability is subsequently marked-to-market to reflect the current value of the short positions. Subsequent fluctuations in the market prices of the securities sold, but not yet purchased, may require purchasing the securities at prices which could differ from the amount reflected in the Statement of Assets and Liabilities. The Fund is liable for any dividends or interest payable on securities while those securities are in a short position. Such amounts are recorded on the ex-dividend date as a dividend expense, and interest expense is accrued daily. As collateral for its short positions, the Fund is required to maintain segregated assets consisting of cash, cash equivalents or liquid securities. The segregated assets are valued consistent with Note 2a above. The amount of segregated assets is required to be adjusted daily to the extent additional collateral is required based on the change in fair value of the securities sold short. The Fund’s securities sold short and deposits for short sales are held with one major securities broker-dealer. The Fund does not require this broker-dealer to maintain collateral in support of the receivable for proceeds on securities sold short. |
22 |
| (c) | Federal Income Taxes. The Fund complies with the requirements of Subchapter M of the Internal Revenue Code, as amended, necessary to qualify as a regulated investment company and makes the requisite distributions of income and capital gains to their shareholders sufficient to relieve them from all or substantially all federal income taxes. Therefore, no federal income tax provision has been provided. |
| (d) | Distributions to Shareholders. The Fund will distribute any net investment income and any net capital gains at least annually. Distributions from net realized gains for book purposes may include short-term capital gains. All short-term capital gains are included in ordinary income for tax purposes. Distributions to shareholders are recorded on the ex-dividend date. The Fund may also pay a special distribution at the end of the calendar year to comply with federal tax requirements. |
| (e) | Use of Estimates. The preparation of financial statements in conformity with GAAP requires management to make estimates and assumptions that affect the reported amounts of assets and liabilities and disclosure of contingent assets and liabilities at the date of the financial statements and the reported amounts of revenues and expenses during the reporting period. Actual results could differ from those estimates. |
| (f) | Share Valuation. The NAV per share of the Fund is calculated by dividing the sum of the fair value of the securities held by the Fund, plus cash or other assets, minus all liabilities (including estimated accrued expenses) by the total number of shares outstanding for the Fund, rounded to the nearest cent. The Fund’s shares will not be priced on the days on which the New York Stock Exchange is closed for trading. The Fund does not charge a redemption fee, and therefore the offering and redemption price per share are equal to the Fund’s NAV per share. |
| (g) | Allocation of Income, Expenses and Gains/Losses. Expenses associated with a specific fund in the Trust are charged to that fund. Common Trust expenses are typically allocated evenly between the funds of the Trust, or by other equitable means. |
| (h) | Other. Investment transactions are recorded on the trade date. The Fund determines the gain or loss from investment transactions on the identified cost basis by comparing original cost of the security lot sold with the net sale proceeds. Dividend income and expense is recognized on the ex-dividend date and interest income and expense is recognized on an accrual basis. Dividend income from real estate investment trusts (“REITs”) is recognized on the ex-date and included in dividend income. The calendar year-end classification of distributions received from REITs during the fiscal year are reported subsequent to year end; accordingly, the Fund estimates the character of REIT distributions based on the most recent information available and adjusts for actual classifications in the calendar year the information is reported. |
23 |
November 30, | ||||||
2024 | 2023 | |||||
Ordinary Income | $389,482 | $194,639 | ||||
Long-Term Capital Gain | $— | $— | ||||
Cost basis of investments for federal income tax purposes(1) | $102,956,854 | ||
Gross tax unrealized appreciation | $46,128,048 | ||
Gross tax unrealized depreciation | (12,677,601) | ||
Net tax unrealized appreciation | 33,450,447 | ||
Undistributed ordinary income | 1,637,694 | ||
Undistributed long-term capital gain | — | ||
Other accumulated losses | (15,142,650) | ||
Total distributable earnings | $19,945,491 | ||
(1) | Includes securities sold short. |
Paid-in capital | $12,733,059 | ||
Total distributable earnings | $(12,733,059) | ||
24 |
Year Ended November 30, | ||||||
2024 | 2023 | |||||
Shares sold | 9,150,000 | 1,520,000 | ||||
Shares reinvested | — | — | ||||
Shares redeemed | (2,220,000) | (1,230,000) | ||||
Net increase | 6,930,000 | 290,000 | ||||
Purchases | Sales | Creations In-Kind | Redemptions In-Kind | |||||||
$290,105,406 | $296,175,886 | $213,314,189 | $47,402,303 | |||||||
25 |
Record Date | Ex-Date | Reinvestment/ Payable Date | Ordinary Income Rate | Ordinary Distribution Paid | |||||||||
12/16/24 | 12/16/24 | 12/17/24 | 0.21204209 | $1,971,425 | |||||||||
26 |

27 |
28 |
29 |
30 |
31 |
Investment Adviser | Convergence Investment Partners, LLC 3801 PGA Boulevard Suite 1001 Palm Beach Gardens, Florida 33410 | ||
Legal Counsel | Godfrey & Kahn, S.C. 833 East Michigan Street Suite 1800 Milwaukee, Wisconsin 53202 | ||
Independent Registered Public Accounting Firm | Cohen & Company, Ltd. 342 North Water Street Suite 830 Milwaukee, Wisconsin 53202 | ||
Transfer Agent, Fund Accountant and Fund Administrator | U.S. Bancorp Fund Services, LLC 615 East Michigan Street Milwaukee, Wisconsin 53202 | ||
Custodian | U.S. Bank National Association Custody Operations 1555 North River Center Drive Milwaukee, Wisconsin 53212 | ||
Distributor | Foreside Fund Services Three Canal Plaza Suite 100 Portland, Maine 04101 | ||
| (b) | Financial Highlights are included within the financial statements filed under Item 7(a) of this Form. |
Item 8. Changes in and Disagreements with Accountants for Open-End Investment Companies.
There were no changes in or disagreements with accountants during the period covered by this report.
Item 9. Proxy Disclosure for Open-End Investment Companies
There were no matters submitted to a vote of shareholders during the period covered by this report.
Item 10. Remuneration Paid to Directors, Officers, and Others of Open-End Investment Companies.
All fund expenses, including Trustee compensation, are paid by the Investment Adviser pursuant to the Investment Advisory Agreement. Additional information related to those fees is available in the Fund’s Statement of Additional Information.
Item 11. Statement Regarding Basis for Approval of Investment Advisory Contract.
This information is included within the financial statements filed under Item 7(a) of this Form
Item 12. Disclosure of Proxy Voting Policies and Procedures for Closed-End Management Investment Companies.
Not applicable to open-end investment companies.
Item 13. Portfolio Managers of Closed-End Management Investment Companies.
Not applicable to open-end investment companies.
Item 14. Purchases of Equity Securities by Closed-End Management Investment Company and Affiliated Purchasers.
Not applicable to open-end investment companies.
Item 15. Submission of Matters to a Vote of Security Holders.
There have been no material changes to the procedures by which shareholders may recommend nominees to the registrant’s board of trustees.
Item 16. Controls and Procedures.
| (a) | The Registrant’s Principal Executive Officer and Principal Financial Officer have reviewed the Registrant’s disclosure controls and procedures (as defined in Rule 30a-3(c) under the Investment Company Act of 1940 (the “Act”)) as of a date within 90 days of the filing of this |
report, as required by Rule 30a-3(b) under the Act and Rules 13a-15(b) or 15d-15(b) under the Securities Exchange Act of 1934. Based on their review, such officers have concluded that the disclosure controls and procedures are effective in ensuring that information required to be disclosed in this report is appropriately recorded, processed, summarized and reported and made known to them by others within the Registrant and by the Registrant’s service provider.
| (b) | There were no changes in the Registrant’s internal control over financial reporting (as defined in Rule 30a-3(d) under the Act) that occurred during the period covered by this report that have materially affected, or are reasonably likely to materially affect, the Registrant’s internal control over financial reporting. |
Item 17. Disclosure of Securities Lending Activities for Closed-End Management Investment Companies
Not applicable to open-end investment companies.
Item 18. Recovery of Erroneously Awarded Compensation.
Not applicable
Item 19. Exhibits.
(2) Any policy required by the listing standards adopted pursuant to Rule 10D-1 under the Exchange Act (17 CFR 240.10D-1) by the registered national securities exchange or registered national securities association upon which the registrant’s securities are listed. Not applicable.
(4) Any written solicitation to purchase securities under Rule 23c-1 under the Act sent or given during the period covered by the report by or on behalf of the registrant to 10 or more persons. Not Applicable.
(5) Change in the registrant’s independent public accountant. Provide the information called for by Item 4 of Form 8-K under the Exchange Act (17 CFR 249.308). Not Applicable.
| (b) | Certifications pursuant to Section 906 of the Sarbanes-Oxley Act of 2002. Furnished herewith. |
SIGNATURES
Pursuant to the requirements of the Securities Exchange Act of 1934 and the Investment Company Act of 1940, the registrant has duly caused this report to be signed on its behalf by the undersigned, thereunto duly authorized.
| (Registrant) | Trust for Professional Managers |
| By (Signature and Title)* | /s/ John Buckel | ||
| John Buckel, Principal Executive Officer |
| Date | 1/30/2025 |
Pursuant to the requirements of the Securities Exchange Act of 1934 and the Investment Company Act of 1940, this report has been signed below by the following persons on behalf of the registrant and in the capacities and on the dates indicated.
| By (Signature and Title)* | /s/ John Buckel | ||
| John Buckel, Principal Executive Officer |
| Date | 1/30/2025 |
| By (Signature and Title)* | /s/ Jennifer Lima | ||
| Jennifer Lima, Principal Financial Officer |
| Date | 1/30/2025 |
* Print the name and title of each signing officer under his or her signature.