UNITED STATES
SECURITIES AND EXCHANGE COMMISSION
Washington, D.C. 20549
FORM N-CSR
CERTIFIED SHAREHOLDER REPORT OF REGISTERED
MANAGEMENT INVESTMENT COMPANIES
Investment Company Act file number 811-10401
Trust for Professional Managers
(Exact name of registrant as specified in charter)
615 East Michigan Street
Milwaukee, WI 53202
(Address of principal executive offices) (Zip code)
Jay S. Fitton
U.S. Bancorp Fund Services, LLC
615 East Michigan Street
Milwaukee, WI 53202
(Name and address of agent for service)
(513)-629-8104
Registrant’s telephone number, including area code
Date of fiscal year end: August 31, 2023
Date of reporting period: February 28, 2023
Item 1. Reports to Stockholders.

PMC Funds
PMC Core Fixed Income Fund
Advisor Class Shares: (PMFIX)
Institutional Class Shares: (PMFQX)
PMC Diversified Equity Fund
Advisor Class Shares: (PMDEX)
Institutional Class Shares: (PMDQX)
Semi-Annual Report
February 28, 2023
Table of Contents
PMC Funds
Letter to Shareholders
To our Shareholders:
We are pleased to present you with the Semi-Annual Report for the PMC Funds mutual fund family. This report covers the six-month period ended February 28, 2023 as well as the period since the inception of the PMC Funds.
The table below presents the standardized performance of the PMC Funds relative to their respective benchmarks. The past twelve month period has been one in which the global economy has remained mired in a period of continued high inflation and slowing growth. In addition, the Russia-Ukraine war has now entered its second year with the outcome still uncertain. While the health effects of Covid have subsided somewhat, the accompanying economic tremors continue to linger. Inflation remains stubbornly high, in part due to the war in Ukraine, but primarily as a result of the enormous amount of stimulus that entered the economy during the pandemic. Energy prices have come down from their peaks, but remain well above the levels when the Biden administration took over and began to aggressively promote a transition to a green economy. In order to combat surging inflation, the Federal Open Market Committee (FOMC), led by Fed Chairman Jay Powell, aggressively raised the federal funds target rate seven times in 2022, and has raised it once more in 2023, moving from a range of 0%-0.25% to its present range of 4.50%-4.75%. Investors anticipate that the fed funds target will exceed 5% in the next few months. The FOMC has indicated that more rate increases are likely in order to rein in inflation. Inflation hovering near record levels and the FOMC’s efforts to bring it under control have combined to send bond yields surging, and prices declining. The U.S. economy has regained some momentum over the past six months, posting real GDP growth rates of 2.9% and 2.7% in 2022’s third and fourth quarters, respectively. These positive results followed two quarters of negative growth as the FOMC embarked on its rate-hike regime.
The Bureau of Economic Analysis reported its second estimate of fourth quarter 2022 gross domestic product (GDP)1 of 2.7%, modestly lower than the third quarter reading. The employment situation has been very resilient in the face of a slowing economy, as employers added 239,000, 504,000 and 311,000 jobs in December, January and February, respectively. The February report showed an average of approximately 351,000 jobs added each month of the quarter, and that the unemployment rate fell to 3.6%.
��
In general, financial markets have generated mixed results over the past six months, with broad-based stock indexes reclaiming some of the ground lost earlier in 2022 that resulted from the surge in inflation and attendant rise in bond yields. The MSCI World Index Net Return advanced slightly more than 4% over the six months ended February 28, 2023. The Bloomberg U.S. Aggregate Bond Index declined more than 2% during the same period as a result of the rise in interest rates. The yield on the 10-year U.S. Treasury climbed from 3.2% to 3.9% over the six months ended February 28, 2023.
| 1 | | Gross Domestic Product (‘GDP”) is the total monetary value of all the finished goods and services produced within a country’s borders in a specific period. |
3
Total Returns as of February 28, 2023*
*Periods of Less than 1-Year Are Unannualized
| | | | | | | | | | | | | | | | | | | | | | | | | | | | | | | | |
Fund
| | Three
Months
| | | Six
Months
| | | One
Year
| | | Five
Year
| | | Ten
Year
| | | Since
Inception
| | | Inception
Date
| | | Gross
Expense
Ratio
| |
PMC Diversified Equity Fund (Advisor Class) | | | 0.31 | % | | | 6.44 | % | | | -5.68 | % | | | 4.62 | % | | | 7.29 | % | | | 8.45 | % | | | 8-26-09 | | | | 0.93 | %*** |
PMC Diversified Equity Fund (Inst. Class) | | | 0.37 | % | | | 6.57 | % | | | -5.41 | % | | | N/A | | | | N/A | | | | 6.36 | %** | | | 7-1-19 | | | | 0.68 | %*** |
MSCI World Index Net Return | | | 0.06 | % | | | 4.04 | % | | | -7.33 | % | | | 6.88 | % | | | 8.77 | % | | | 9.06 | % | | | | | | | | |
| | | | | | | | |
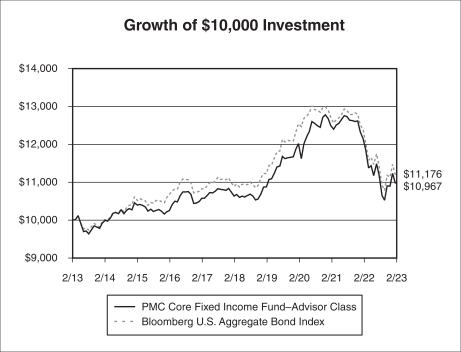
PMC Core Fixed Income Fund (Advisor Class) | | | 0.55 | % | | | -1.97 | % | | | -9.71 | % | | | 0.61 | % | | | 0.93 | % | | | 3.24 | % | | | 9-28-07 | | | | 1.13 | %*** |
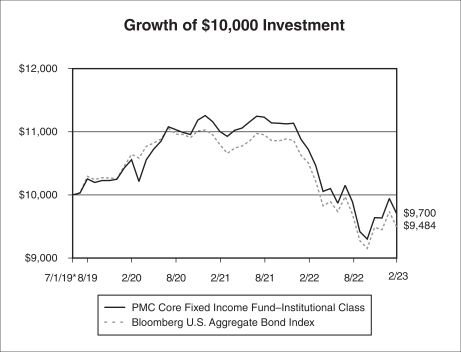
PMC Core Fixed Income Fund (Inst. Class) | | | 0.64 | % | | | -1.89 | % | | | -9.50 | % | | | N/A | | | | N/A | | | | -0.83 | %** | | | 7-1-19 | | | | 0.88 | %*** |
Bloomberg U.S. Aggregate Bond Index | | | -0.04 | % | | | -2.13 | % | | | -9.72 | % | | | 0.53 | % | | | 1.12 | % | | | 2.81 | % | | | | | | | | |
| ** | | Performance shown as of Institutional class inception date of 7-1-19 |
| *** | | Gross expense ratio as disclosed in the prospectus dated December 29, 2022. Please see the Financial Highlights in this report for the most recent expense ratio. |
The MSCI World Index Net Return captures large and mid-cap representation across 23 Developed Markets countries. The Bloomberg U.S. Aggregate Bond Index is a broad-based flagship benchmark that measures the investment grade, US dollar-denominated, fixed-rate taxable bond market. An investor cannot invest directly in an index.
Past performance is no guarantee of future returns. Current performance may be higher or lower than the performance data shown. Investment return and principal value will fluctuate so that an investor’s shares, when redeemed, may be worth more or less than original cost. For the most recent month-end performance, please visit the Funds’ website at www.investpmc.com or by calling 866-762-7338. Performance results reflect contractual expense subsidies and waivers in effect until December 29, 2023; without these waivers, returns would have been less favorable.
PMC Diversified Equity Fund
The PMC Diversified Equity Fund was launched on August 26, 2009, and provides broad equity asset class exposure, diversified globally. The Fund’s investment objective is long-term capital appreciation.
One of the primary drivers of the Fund’s performance is its exposure to the well-known value, momentum and quality asset pricing factors. Stocks with positive aggregate exposures to these factors contributed positively to performance during the six months ended February 28, 2023. The notable exception is the momentum factor, which is the tendency for stocks that have performed well on a relative basis over the recent past to continue to do so going forward in the near term. While the momentum factor performed well for several years leading into 2022, it has lagged over the past six months. However, the value and quality factors have performed very well over that time. Analysts were correct a year ago in their predictions that the FOMC moving to raise interest rates would benefit factor performance by creating a greater distinction in the performance of individual stocks. Such positive factor performance was a primary contributor to the Fund’s relative performance, as it outperformed the benchmark MSCI World Index Net Return over the six-month period ended February 28, 2023. Over that period the Fund’s Advisor Class shares generated a total return of 6.44%, outpacing the 4.04% return of the benchmark MSCI World Index Net Return. The primary driver of the Fund’s performance during the period was the strong aggregate performance of the asset pricing factors toward which the portfolio is tilted. In particular, the Fund’s orientation toward value stocks was a key driver of the outperformance relative to the benchmark. Performance was also positively impacted by having an exposure to stocks exhibiting higher quality characteristics. The Fund’s modestly lower weighted average market capitalization than the index had a negative impact on performance during the period, as stocks of smaller companies underperformed those of larger companies. Relative performance was also advantaged during the six-month period from an underweight to the information technology sector, and security selection in the consumer discretionary and health care sectors. Among the detractors to performance during the period was security selection in the information technology sector and underweights to the industrials and energy sectors. As is typically the case, the strategy’s factor orientation resulted in over- or underweights to specific stocks that had a meaningful impact on performance. Over the past six months
4
underweights to well-known companies such as Amazon.com, Inc. (AMZN), Apple, Inc. (AAPL), and Meta Platforms, Inc. (FB) benefited performance. However, an underweight to NVIDIA Corp. (NVDA), and overweights to Berkshire Hathaway, Inc. (BRK/A) and Tyson Foods, Inc. (TSN) detracted from performance.
In addition to the risk that the investment strategy employed in the Fund will underperform the benchmark index generally, the primary risks continue to primarily involve systematic risk. Because the Adviser controls the risk of the portfolio relative to the benchmark, the overall portfolio should track the Fund’s benchmark fairly closely on a relative basis. However, in general market declines the Fund’s fully invested strategy would incur a setback commensurate with the decline in the benchmark.
PMC Core Fixed Income Fund
The PMC Core Fixed Income Fund provides broad exposure to the core segments of the domestic fixed income market. The Fund’s investment objective is to provide current income consistent with low volatility of principal, and in addition to the Adviser, one sub-adviser manages a portion of the Fund assets: Neuberger Berman Investment Advisers LLC.
Over the six months ended February 28, 2023, the environment for fixed income securities has been one of a continued rise in bond yields - and drop in bond prices – resulting from several factors, including the FOMC’s decision to raise interest rates to combat the surge in inflation. Against this backdrop, the Fund’s Advisor Class shares generated a negative return of -1.97% for the six-month period ended February 28, 2023, modestly outperforming the Bloomberg U.S. Aggregate Bond Index return of -2.13%. The primary factors negatively impacting performance over the past six-month period were an underweight to U.S. Treasury bonds and an overweight to corporate bonds, each of which was a key positive contributor to performance during the period. An overweight to securitized bonds and security selection with the Treasury segment were the primary detractors.
The primary risks to the strategies employed by the Fund’s sub-adviser remain in place and exist at both the macro level and in individual security selection. Due to the Fund’s aggregate overweight exposure to credit securities, the Fund remains likely to underperform the benchmark somewhat if the Federal Reserve makes a policy misstep, and Treasury securities consequently rise relative to credits. In addition, if the general level of interest rates continues to rise rapidly, the Fund will not be immune to further losses. Similarly, if certain of the individual credits currently owned by the Fund are adversely affected by economic events, the Fund itself will also be affected.
Remarks
U.S. investors remain on high alert as a result of continued high inflation, the FOMC’s aggressive interest rate increases, geopolitical tensions, and the upcoming presidential election cycle, among other things. The consensus among economists seems to be that despite the ratcheting up of interest rates, the economy may yet be able to avert a recession. However, the bond market seems to have a different opinion, as the yield curve is once again inverted, typically a sure sign of a looming recession. In addition to raising interest rates, the FOMC is also reducing the size of its balance sheet, which reached unprecedented levels as a result of the steps taken following the financial crisis in 2008. The decline in oil prices from the peak following the onset of the Russia-Ukraine war is a positive occurrence that will help the economy’s glidepath in averting a recession.
As always, we appreciate your continued trust and confidence in the PMC Funds. We will continue to do all we can to ensure that such trust and confidence are well placed and will manage the PMC Funds with that goal clearly in mind.

Brandon R. Thomas
Co-Founder and Chief Investment Officer
Envestnet
5
Envestnet Asset Management
The views in this report were those of the Fund’s investment adviser and the Core Fixed Income Fund’s sub-adviser, as applicable, as of the date of this report, and may not reflect their views on the date the report is first published or anytime thereafter. These views are intended to assist the shareholders of the Funds in understanding their investments in the Funds and do not constitute investment advice.
Holdings are subject to change and are not a recommendation to buy or sell any security. Please see the schedule of holdings for a full list of fund holdings.
Investments in smaller companies carry greater risk than is customarily associated with larger companies for various reasons such as volatility of earnings and prospects, higher failure rates, and limited markets, product lines or financial resources. Investing overseas involves special risks, including the volatility of currency exchange rates and, in some cases, limited geographic focus, political and economic instability, and relatively illiquid markets. Income (bond) funds are subject to interest rate risk, which is the risk that debt securities in a fund’s portfolio will decline in value because of increases in market interest rates. Please see the prospectus (https://www.investpmc.com/sites/default/files/documents/PMC%20Statutory%20Prospectus%2012.29.2022.pdf) for a complete description of the risks associated with investing in the PMC Funds.
PMC Funds are distributed by Foreside Fund Services, LLC. Foreside Fund Services, LLC is not an affiliate of Envestnet Asset Management, Inc./Envestnet PMC.
6
PMC FUNDS
Expense Examples
(Unaudited)
As a shareholder of the PMC Core Fixed Income Fund or the PMC Diversified Equity Fund (each a “Fund”, and together the “Funds”), you incur two types of costs: (1) transaction costs and (2) ongoing costs, including management fees, distribution (12b-1) fees (Advisor Class shares only) and other Fund expenses. This Example is intended to help you understand your ongoing costs (in dollars) of investing in the Funds, and to compare these costs with the ongoing costs of investing in other mutual funds. The Example is based on an investment of $1,000 invested at the beginning of the period and held for the entire period (September 1, 2022 - February 28, 2023).
The first lines of the following tables provide information about actual account values and actual expenses. Although the Funds do not charge a sales load, you will be assessed fees for outgoing wire transfers, returned checks and stop payment orders at prevailing rates charged by U.S. Bancorp Fund Services, LLC, the Funds’ transfer agent. Individual Retirement Accounts (“IRA”) will be charged a $15.00 annual maintenance fee. To the extent the Funds invest in shares of exchange-traded funds or other investment companies as part of their investment strategy, you will indirectly bear your proportionate share of any fees and expenses charged by the underlying funds in which the Funds invest in addition to the direct expenses of the Funds. Actual expenses of the underlying funds are expected to vary among the various underlying funds. These expenses are not included in the Example. The Example includes, but is not limited to, management fees, distribution (12b-1) fees, fund administration and accounting, custody and transfer agent fees. You may use the information in this line, together with the amount you invested, to estimate the expenses that you paid over the period. Simply divide your account value by $1,000 (for example, an $8,600 account value divided by $1,000 = 8.6), then multiply the result by the number in the first line under the heading entitled “Expenses Paid During Period” to estimate the expenses you paid on your account during this period.
| | Hypothetical | | Example for Comparison Purposes |
The second lines of the following tables provide information about hypothetical account values and hypothetical expenses based on the Funds’ actual expense ratio and an assumed rate of return of 5% per year before expenses, which is not the Funds’ actual returns. The hypothetical account values and expenses may not be used to estimate the actual ending account balance or expenses you paid for the period. You may use this information to compare the ongoing costs of investing in the Funds and other funds. To do so, compare this 5% hypothetical example with the 5% hypothetical examples that appear in the shareholder reports of other funds. Please note that the expenses shown in the table are meant to highlight your ongoing costs only and do not reflect any transactional costs, such as sales charges (loads), or exchange fees. Therefore, the second lines of the tables are useful in comparing ongoing costs only, and will not help you determine the relative total costs of owning different funds. In addition, if these transactional costs were included, your costs would have been higher.
| | | | | | | | | | | | |
| | | Beginning
Account Value
9/1/22
| | | Ending
Account Value
2/28/23
| | | Expenses Paid
During Period
9/1/22-2/28/23*
| |
PMC Core Fixed Income Fund–Advisor Class | | | | | | | | | | | | |
Actual | | $ | 1,000.00 | | | $ | 980.30 | | | $ | 4.17 | |
Hypothetical (5% return before expenses) | | | 1,000.00 | | | | 1,020.58 | | | | 4.26 | |
| * | | Expenses are equal to the Fund’s annualized expense ratio of 0.85%, multiplied by the average account value over the period, multiplied by 181/365 to reflect the one-half year period. |
| | | | | | | | | | | | |
| | | Beginning
Account Value
9/1/22
| | | Ending
Account Value
2/28/23
| | | Expenses Paid
During Period
9/1/22-2/28/23*
| |
PMC Core Fixed Income Fund–Institutional Class | | | | | | | | | | | | |
Actual | | $ | 1,000.00 | | | $ | 981.10 | | | $ | 2.95 | |
Hypothetical (5% return before expenses) | | | 1,000.00 | | | | 1,021.82 | | | | 3.01 | |
| * | | Expenses are equal to the Fund’s annualized expense ratio of 0.60%, multiplied by the average account value over the period, multiplied by 181/365 to reflect the one-half year period. |
7
| | | | | | | | | | | | |
| | | Beginning
Account Value
9/1/22
| | | Ending
Account Value
2/28/23
| | | Expenses Paid
During Period
9/1/22-2/28/23*
| |
PMC Diversified Equity Fund–Advisor Class | | | | | | | | | | | | |
Actual | | $ | 1,000.00 | | | $ | 1,064.40 | | | $ | 4.81 | |
Hypothetical (5% return before expenses) | | | 1,000.00 | | | | 1,020.13 | | | | 4.71 | |
| * | | Expenses are equal to the Fund’s annualized expense ratio of 0.94%, multiplied by the average account value over the period, multiplied by 181/365 to reflect the one-half year period. |
| | | | | | | | | | | | |
| | | Beginning
Account Value
9/1/22
| | | Ending
Account Value
2/28/23
| | | Expenses Paid
During Period
9/1/22-2/28/23*
| |
PMC Diversified Equity Fund–Institutional Class | | | | | | | | | | | | |
Actual | | $ | 1,000.00 | | | $ | 1,065.70 | | | $ | 3.53 | |
Hypothetical (5% return before expenses) | | | 1,000.00 | | | | 1,021.37 | | | | 3.46 | |
| * | | Expenses are equal to the Fund’s annualized expense ratio of 0.69%, multiplied by the average account value over the period, multiplied by 181/365 to reflect the one-half year period. |
8
PMC CORE FIXED INCOME FUND (PMFIX, PMFQX)
Investment Highlights (Unaudited)
The investment objective of the Fund is to provide current income consistent with low volatility of principal. The Fund’s allocation of portfolio holdings as of February 28, 2023 is shown below.
Allocation of Portfolio Holdings
% of Net assets
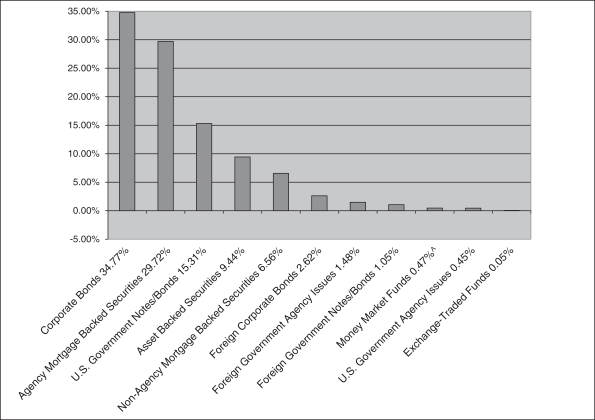
| ^ | | Excludes securities lending collateral. |
9
PMC CORE FIXED INCOME FUND–ADVISOR CLASS (PMFIX)
Investment Highlights (Unaudited) (Continued)
Average Annual Returns as of February 28, 2023
| | | | | | | | |
| | | PMC Core
Fixed Income
Fund–Advisor
Class
| | | Bloomberg U.S.
Aggregate Bond
Index
| |
One Year | | | -9.71 | % | | | -9.72 | % |
Five Year | | | 0.61 | % | | | 0.53 | % |
Ten Year | | | 0.93 | % | | | 1.12 | % |
Since Inception (9/28/07) | | | 3.24 | % | | | 2.81 | % |
| | |
|
|
| |
|
|
|
Performance data quoted represents past performance and does not guarantee future results. The investment return and principal value of an investment will fluctuate so that an investor’s shares, when redeemed, may be worth more or less than their original cost. Current performance of the Fund may be lower or higher than the performance quoted. Performance data current to the most recent month end may be obtained by calling the Fund (toll free) at (866) PMC-7338.
Short-term performance, in particular, is not a good indication of the Fund’s future performance, and an investment should not be made based solely on historical returns.
Investment performance reflects fee waivers in effect. In the absence of such waivers, total return would be reduced.
The returns shown assume reinvestment of Fund distributions and do not reflect the deduction of taxes that a shareholder would pay on Fund distributions or the redemption of Fund shares. The graph illustrates performance of a hypothetical investment made in the Fund and a broad-based securities index on February 28, 2013. The graph does not reflect any future performance.
The Bloomberg U.S. Aggregate Bond Index is an index composed of U.S. securities in Treasury, Government-Related, Corporate and Securitized Sectors. It includes securities that are of investment-grade quality or better, have at least one year to maturity and have an outstanding par value of at least $250 million.
One cannot invest directly in an index.
10
PMC CORE FIXED INCOME FUND–INSTITUTIONAL CLASS (PMFQX)
Investment Highlights (Unaudited) (Continued)
Average Annual Returns as of February 28, 2023
| | | | | | | | |
| | | PMC Core
Fixed Income
Fund–Institutional
Class
| | | Bloomberg U.S.
Aggregate Bond
Index
| |
One Year | | | -9.50 | % | | | -9.72 | % |
Since Inception (7/1/19) | | | -0.83 | % | | | -1.44 | % |
| | |
|
|
| |
|
|
|
Performance data quoted represents past performance and does not guarantee future results. The investment return and principal value of an investment will fluctuate so that an investor’s shares, when redeemed, may be worth more or less than their original cost. Current performance of the Fund may be lower or higher than the performance quoted. Performance data current to the most recent month end may be obtained by calling the Fund (toll free) at (866) PMC-7338.
Short-term performance, in particular, is not a good indication of the Fund’s future performance, and an investment should not be made based solely on historical returns.
Investment performance reflects fee waivers in effect. In the absence of such waivers, total return would be reduced.
The returns shown assume reinvestment of Fund distributions and do not reflect the deduction of taxes that a shareholder would pay on Fund distributions or the redemption of Fund shares. The graph illustrates performance of a hypothetical investment made in the Fund and a broad-based securities index on July 1, 2019, the inception date of the Institutional Class. The graph does not reflect any future performance.
The Bloomberg U.S. Aggregate Bond Index is an index composed of U.S. securities in Treasury, Government-Related, Corporate and Securitized Sectors. It includes securities that are of investment-grade quality or better, have at least one year to maturity and have an outstanding par value of at least $250 million.
One cannot invest directly in an index.
11
PMC DIVERSIFIED EQUITY FUND (PMDEX, PMDQX)
Investment Highlights (Unaudited)
The investment objective of the Fund is long-term capital appreciation. The Fund’s allocation of portfolio holdings as of February 28, 2023 is shown below.
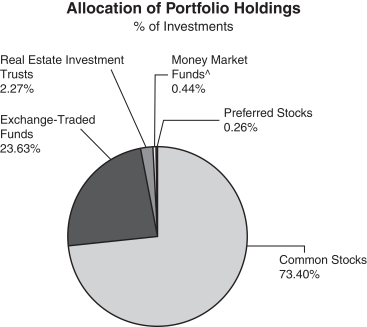
| | ^ | | Excludes securities lending collateral. |
12
PMC DIVERSIFIED EQUITY FUND–ADVISOR CLASS (PMDEX)
Investment Highlights (Unaudited) (Continued)
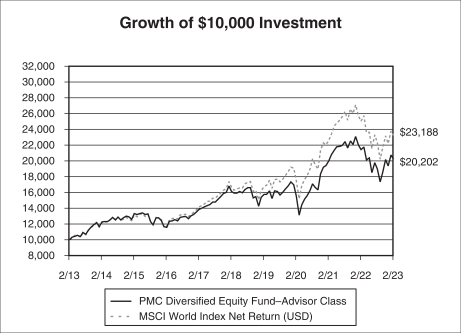
Average Annual Returns as of February 28, 2023
| | | | | | | | |
| | | PMC Diversified
Equity Fund–
Advisor Class
| | | MSCI
World Index
Net Return
| |
One Year | | | -5.68 | % | | | -7.33 | % |
Five Year | | | 4.62 | % | | | 6.88 | % |
Ten Year | | | 7.29 | % | | | 8.77 | % |
Since Inception (8/26/09) | | | 8.45 | % | | | 9.06 | % |
| | |
|
|
| |
|
|
|
On May 25, 2018, Envestnet Asset Management, Inc. (the “Adviser”), the Fund’s investment adviser, assumed all responsibilities for selecting investments in the Fund’s portfolio in connection with a change to the Fund’s investment strategies. The Fund’s performance prior to this date reflects the Fund’s returns achieved when the Adviser actively managed a portion of the Fund’s portfolio and used a “manager of managers” investment strategy by engaging sub-advisers to manage other portions of the Fund’s portfolio.
Performance data quoted represents past performance and does not guarantee future results. The investment return and principal value of an investment will fluctuate so that an investor’s shares, when redeemed, may be worth more or less than their original cost. Current performance of the Fund may be lower or higher than the performance quoted. Performance data current to the most recent month end may be obtained by calling the Fund (toll free) at (866) PMC-7338.
Short-term performance, in particular, is not a good indication of the Fund’s future performance, and an investment should not be made based solely on historical returns.
Investment performance reflects fee waivers in effect. In the absence of such waivers, total return would be reduced.
The returns shown assume reinvestment of Fund distributions and do not reflect the deduction of taxes that a shareholder would pay on Fund distributions or the redemption of Fund shares. The graph illustrates performance of a hypothetical investment made in the Fund and a broad-based securities index on February 28, 2013. The graph does not reflect any future performance.
The MSCI World Index Net Return is a free float-adjusted market capitalization weighted index that is designed to measure the equity market performance of developed markets. Net return indices reinvest dividends after the deduction of taxes, using a tax rate applicable to non-resident investors who do not benefit from table taxation treaties. The MSCI World Index consists of the following 23 developed market country indices: Australia, Austria, Belgium, Canada, Denmark, Finland, France, Germany, Hong Kong, Ireland, Israel, Italy, Japan, Netherlands, New Zealand, Norway, Portugal, Singapore, Spain, Sweden, Switzerland, the United Kingdom, and the United States.
One cannot invest directly in an index.
Continued
13
PMC DIVERSIFIED EQUITY FUND–ADVISOR CLASS (PMDEX)
Investment Highlights (Unaudited) (Continued)
14
PMC DIVERSIFIED EQUITY FUND–INSTITUTIONAL CLASS (PMDQX)
Investment Highlights (Unaudited) (Continued)
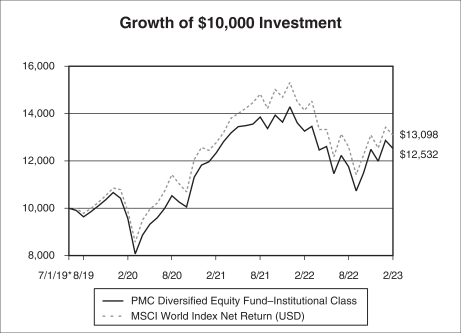
Average Annual Returns as of February 28, 2023
| | | | | | | | |
| | | PMC Diversified
Equity Fund–
Institutional Class
| | | MSCI
World Index
Net Return
| |
One Year | | | -5.41 | % | | | -7.33 | % |
Since Inception (7/1/19) | | | 6.36 | % | | | 7.65 | % |
| | |
|
|
| |
|
|
|
Performance data quoted represents past performance and does not guarantee future results. The investment return and principal value of an investment will fluctuate so that an investor’s shares, when redeemed, may be worth more or less than their original cost. Current performance of the Fund may be lower or higher than the performance quoted. Performance data current to the most recent month end may be obtained by calling the Fund (toll free) at (866) PMC-7338.
Short-term performance, in particular, is not a good indication of the Fund’s future performance, and an investment should not be made based solely on historical returns.
Investment performance reflects fee waivers in effect. In the absence of such waivers, total return would be reduced.
The returns shown assume reinvestment of Fund distributions and do not reflect the deduction of taxes that a shareholder would pay on Fund distributions or the redemption of Fund shares. The graph illustrates performance of a hypothetical investment made in the Fund and a broad-based securities index on July 1, 2019, the inception date of the Institutional Class. The graph does not reflect any future performance.
The MSCI World Index Net Return is a free float-adjusted market capitalization weighted index that is designed to measure the equity market performance of developed markets. Net return indices reinvest dividends after the deduction of taxes, using a tax rate applicable to non-resident investors who do not benefit from table taxation treaties. The MSCI World Index consists of the following 23 developed market country indices: Australia, Austria, Belgium, Canada, Denmark, Finland, France, Germany, Hong Kong, Ireland, Israel, Italy, Japan, Netherlands, New Zealand, Norway, Portugal, Singapore, Spain, Sweden, Switzerland, the United Kingdom, and the United States.
One cannot invest directly in an index.
15
PMC CORE FIXED INCOME FUND | Schedule of Investments |
February 28, 2023 (Unaudited)
| | | | | | | | |
| | |
| | | Principal
Amount
| | | Value
| |
| ASSET BACKED SECURITIES—9.44% | | | | | | | | |
37 Capital CLO I | | | | | | | | |
2021-1, 5.992% (3 Month LIBOR USD + 1.200%), 10/15/2034(b)(c) | | $ | 1,000,000 | | | $ | 981,267 | |
AM Capital Funding LLC | | | | | | | | |
2018-1, 4.980%, 12/15/2023(b) | | | 760,000 | | | | 738,475 | |
Amur Equipment Finance Receivables XI LLC | | | | | | | | |
2022-2A, 5.300%, 06/21/2028(b) | | | 255,000 | | | | 252,627 | |
Angel Oak Mortgage Trust | | | | | | | | |
2021-3, 1.068%, 05/25/2066(b)(d) | | | 660,696 | | | | 543,648 | |
Aqua Finance Trust 2021-A | | | | | | | | |
2021-A, 1.540%, 07/17/2046(b) | | | 498,111 | | | | 444,106 | |
Avis Budget Rental Car Funding AESOP LLC | | | | | | | | |
2019-3 A, 2.360%, 03/20/2026(b) | | | 376,000 | | | | 354,041 | |
2020-2 B, 2.960%, 02/20/2027(b) | | | 567,000 | | | | 519,134 | |
2021-2 A, 1.660%, 02/20/2028(b) | | | 1,184,000 | | | | 1,030,431 | |
2021-2 B, 1.900%, 02/20/2028(b) | | | 495,000 | | | | 422,072 | |
Beacon Container Finance II LLC | | | | | | | | |
2021-1A, 2.250%, 10/22/2046(b) | | | 920,400 | | | | 793,316 | |
BlueMountain CLO Ltd. | | | | | | | | |
2013-2R, 5.995% (3 Month LIBOR USD + 1.180%), 10/22/2030(b)(c) | | | 355,818 | | | | 353,917 | |
Cedar Funding VI CLO Ltd. | | | | | | | | |
2016-6A, 5.858% (3 Month LIBOR USD + 1.050%), 04/20/2034(b)(c) | | | 1,480,000 | | | | 1,439,818 | |
Crown Castle Towers LLC | | | | | | | | |
4.241%, 07/15/2048(b) | | | 439,000 | | | | 399,987 | |
Dryden 75 CLO Ltd. | | | | | | | | |
2019-75R2, 5.832% (3 Month LIBOR USD + 1.040%), 04/15/2034(b)(c) | | | 850,000 | | | | 833,542 | |
Fort Washington CLO Ltd. | | | | | | | | |
2021-2A, 6.028% (3 Month LIBOR USD + 1.220%), 10/20/2034(b)(c) | | | 2,000,000 | | | | 1,965,658 | |
GCAT Trust | | | | | | | | |
2019-NQM3, 2.686%, 11/25/2059(b)(d) | | | 112,609 | | | | 105,348 | |
2021-NQM5, 1.262%, 07/25/2066(b)(d) | | | 886,657 | | | | 698,397 | |
JPMorgan Chase Bank NA—CACLN | | | | | | | | |
2021-3, 0.760%, 02/26/2029(b) | | | 933,157 | | | | 884,941 | |
Madison Park Funding XXVI Ltd. | | | | | | | | |
2007-26, 6.002% (3 Month LIBOR USD + 1.200%), 07/29/2030(b)(c) | | | 2,286,025 | | | | 2,272,464 | |
Magnetite XXIII Ltd. | | | | | | | | |
2019-23R, 5.948% (3 Month LIBOR USD + 1.130%), 01/25/2035(b)(c) | | | 1,000,000 | | | | 984,007 | |
MetroNet Infrastructure Issuer LLC | | | | | | | | |
2022-1A, 6.350%, 10/20/2052(b) | | | 693,000 | | | | 662,631 | |
MVW LLC | | | | | | | | |
2021-2A A, 1.430%, 05/20/2039(b) | | | 752,819 | | | | 667,509 | |
2021-2A B, 1.830%, 05/20/2039(b) | | | 614,216 | | | | 544,359 | |
2022-1, 4.400%, 11/21/2039(b) | | | 275,556 | | | | 263,436 | |
2021-1W, 1.440%, 01/22/2041(b) | | | 310,800 | | | | 280,967 | |
Navient Private Education Refi Loan Trust | | | | | | | | |
2021-B, 0.940%, 07/15/2069(b) | | | 909,138 | | | | 785,166 | |
2021-C, 1.060%, 10/15/2069(b) | | | 580,935 | | | | 504,174 | |
2021-E, 0.970%, 12/16/2069(b) | | | 1,387,227 | | | | 1,168,827 | |
Navient Student Loan Trust | | | | | | | | |
2019-7, 5.117% (1 Month LIBOR USD + 0.500%), 01/25/2068(b)(c) | | | 52,584 | | | | 52,548 | |
PFS Financing Corp. | | | | | | | | |
2021-B, 0.770%, 08/15/2026(b) | | | 1,890,000 | | | | 1,763,315 | |
The accompanying notes are an integral part of these financial statements.
16
PMC CORE FIXED INCOME FUND | Schedule of Investments |
February 28, 2023 (Unaudited) (Continued)
| | | | | | | | |
| | |
| | | Principal
Amount
| | | Value
| |
Prestige Auto Receivables Trust | | | | | | | | |
2021-1, 1.530%, 02/15/2028(b) | | $ | 599,000 | | | $ | 555,190 | |
RASC Trust | | | | | | | | |
2005-KS12, 5.307% (1 Month LIBOR USD + 0.460%), 01/25/2036(c) | | | 65,853 | | | | 65,561 | |
SBA Tower Trust | | | | | | | | |
2020-1-2, 2.328%, 01/15/2028(b) | | | 618,000 | | | | 533,394 | |
2021-3, 2.593%, 10/15/2031(b) | | | 1,243,000 | | | | 974,096 | |
Sierra Timeshare Receivables Funding LLC | | | | | | | | |
2019-2, 2.590%, 05/20/2036(b) | | | 309,436 | | | | 297,569 | |
2020-2, 3.510%, 07/20/2037(b) | | | 358,479 | | | | 337,574 | |
2021-2, 1.350%, 09/20/2038(b) | | | 268,393 | | | | 251,207 | |
SoFi Consumer Loan Program Trust | | | | | | | | |
2023-1S, 5.810%, 05/15/2031(b) | | | 440,000 | | | | 439,825 | |
Starwood Mortgage Residential Trust | | | | | | | | |
2021-3, 1.127%, 06/25/2056(b)(d) | | | 556,947 | | | | 453,024 | |
2021-6, 1.920%, 11/25/2066(b)(d) | | | 883,248 | | | | 735,873 | |
Taco Bell Funding LLC | | | | | | | | |
2021-1, 1.946%, 08/25/2051(b) | | | 790,988 | | | | 684,910 | |
Thayer Park CLO Ltd. | | | | | | | | |
2017-R, 5.848% (3 Month LIBOR USD + 1.040%), 04/20/2034(b)(c) | | | 500,000 | | | | 491,938 | |
Towd Point Mortgage Trust | | | | | | | | |
2017-5, 4.202% (1 Month LIBOR USD + 0.600%), 02/25/2057(b)(c) | | | 158,821 | | | | 158,339 | |
2017-2 A1, 2.750%, 04/25/2057(b)(d) | | | 9,029 | | | | 8,933 | |
2017-2, 3.250%, 04/25/2057(b)(d) | | | 351,000 | | | | 338,757 | |
2017-4, 2.750%, 06/25/2057(b)(d) | | | 99,274 | | | | 94,474 | |
2017-3, 2.750%, 07/25/2057(b)(d) | | | 107,027 | | | | 104,335 | |
2022-4, 3.750%, 09/25/2062(b) | | | 1,954,770 | | | | 1,805,027 | |
TRESTLES CLO Ltd. | | | | | | | | |
2017-1, 5.808% (3 Month LIBOR USD + 0.990%), 04/25/2032(b)(c) | | | 500,000 | | | | 492,873 | |
TRESTLES CLO V Ltd. | | | | | | | | |
2021-5, 5.978% (3 Month LIBOR USD + 1.170%), 10/20/2034(b)(c) | | | 1,000,000 | | | | 981,506 | |
Vantage Data Centers Issuer LLC | | | | | | | | |
2019-1, 3.188%, 07/15/2044(b) | | | 1,269,940 | | | | 1,214,552 | |
2021-1, 2.165%, 10/15/2046(b) | | | 1,078,000 | | | | 938,113 | |
Verus Securitization Trust | | | | | | | | |
2021-3, 1.046%, 06/25/2066(b)(d) | | | 728,557 | | | | 607,900 | |
2021-6, 1.630%, 10/25/2066(b)(d) | | | 1,154,613 | | | | 950,214 | |
2022-7, 5.152%, 07/25/2067(b) | | | 922,351 | | | | 899,625 | |
Voya CLO Ltd. | | | | | | | | |
2014-2A, 5.812% (3 Month LIBOR USD + 1.020%), 04/17/2030(b)(c) | | | 1,528,132 | | | | 1,514,767 | |
| | | | | | |
|
|
|
TOTAL ASSET BACKED SECURITIES (Cost $41,872,070) | | | | | | | 38,639,704 | |
| | | | | | |
|
|
|
| CORPORATE BONDS—34.77% | | | | | | | | |
Accommodation—0.07% | | | | | | | | |
Wyndham Hotels & Resorts, Inc. | | | | | | | | |
4.375%, 08/15/2028(b) | | | 165,000 | | | | 149,590 | |
Wynn Las Vegas LLC | | | | | | | | |
5.500%, 03/01/2025(b) | | | 125,000 | | | | 121,703 | |
| | | | | | |
|
|
|
| | | | | | | | 271,293 | |
| | | | | | |
|
|
|
Administrative and Support Services—0.64% | | | | | | | | |
ASGN, Inc. | | | | | | | | |
4.625%, 05/15/2028(b) | | | 350,000 | | | | 316,620 | |
The accompanying notes are an integral part of these financial statements.
17
PMC CORE FIXED INCOME FUND | Schedule of Investments |
February 28, 2023 (Unaudited) (Continued)
| | | | | | | | |
| | |
| | | Principal
Amount
| | | Value
| |
Booking Holdings, Inc. | | | | | | | | |
3.550%, 03/15/2028 | | $ | 1,100,000 | | | $ | 1,030,231 | |
Korn Ferry | | | | | | | | |
4.625%, 12/15/2027(b) | | | 100,000 | | | | 92,630 | |
Live Nation Entertainment, Inc. | | | | | | | | |
4.750%, 10/15/2027(b) | | | 145,000 | | | | 130,279 | |
PayPal Holdings, Inc. | | | | | | | | |
2.400%, 10/01/2024(f) | | | 1,110,000 | | | | 1,063,046 | |
| | | | | | |
|
|
|
| | | | | | | | 2,632,806 | |
| | | | | | |
|
|
|
Air Transportation—0.49% | | | | | | | | |
Mileage Plus Holdings LLC / Mileage Plus Intellectual Property Assets Ltd. | | | | | | | | |
6.500%, 06/20/2027(b) | | | 180,000 | | | | 180,180 | |
Southwest Airlines Co. | | | | | | | | |
5.250%, 05/04/2025 | | | 800,000 | | | | 797,033 | |
United Airlines Pass Through Trust | | | | | | | | |
5.875%, 10/15/2027 | | | 1,022,393 | | | | 1,016,746 | |
| | | | | | |
|
|
|
| | | | | | | | 1,993,959 | |
| | | | | | |
|
|
|
Ambulatory Health Care Services—0.04% | | | | | | | | |
Acadia Healthcare Co, Inc. | | | | | | | | |
5.000%, 04/15/2029(b) | | | 195,000 | | | | 177,630 | |
| | | | | | |
|
|
|
Beverage and Tobacco Product Manufacturing—2.10% | | | | | | | | |
Anheuser-Busch InBev Worldwide, Inc. | | | | | | | | |
4.700%, 02/01/2036 | | | 1,435,000 | | | | 1,347,638 | |
4.350%, 06/01/2040 | | | 1,006,000 | | | | 882,886 | |
4.600%, 04/15/2048 | | | 523,000 | | | | 460,787 | |
4.750%, 04/15/2058 | | | 510,000 | | | | 453,835 | |
Molson Coors Beverage Co. | | | | | | | | |
4.200%, 07/15/2046 | | | 660,000 | | | | 513,735 | |
Philip Morris International, Inc. | | | | | | | | |
3.125%, 08/17/2027 | | | 2,666,000 | | | | 2,472,574 | |
5.125%, 02/15/2030(f) | | | 1,450,000 | | | | 1,423,081 | |
5.750%, 11/17/2032 | | | 1,045,000 | | | | 1,056,801 | |
| | | | | | |
|
|
|
| | | | | | | | 8,611,337 | |
| | | | | | |
|
|
|
Broadcasting (except Internet)—1.59% | | | | | | | | |
CCO Holdings LLC / CCO Holdings Capital Corp. | | | | | | | | |
4.250%, 02/01/2031(b) | | | 298,000 | | | | 239,473 | |
Charter Communications Operating LLC / Charter Communications Operating Capital | | | | | | | | |
3.900%, 06/01/2052 | | | 1,335,000 | | | | 840,936 | |
5.500%, 04/01/2063 | | | 775,000 | | | | 600,131 | |
Comcast Corp. | | | | | | | | |
4.150%, 10/15/2028 | | | 1,711,000 | | | | 1,636,715 | |
CSC Holdings LLC | | | | | | | | |
4.625%, 12/01/2030(b) | | | 435,000 | | | | 234,193 | |
DISH DBS Corp. | | | | | | | | |
5.875%, 11/15/2024 | | | 110,000 | | | | 102,750 | |
Fox Corp. | | | | | | | | |
5.576%, 01/25/2049 | | | 770,000 | | | | 700,003 | |
Paramount Global | | | | | | | | |
4.200%, 05/19/2032(f) | | | 970,000 | | | | 798,369 | |
Sirius XM Radio, Inc. | | | | | | | | |
4.125%, 07/01/2030(b)(f) | | | 315,000 | | | | 256,292 | |
The accompanying notes are an integral part of these financial statements.
18
PMC CORE FIXED INCOME FUND | Schedule of Investments |
February 28, 2023 (Unaudited) (Continued)
| | | | | | | | |
| | |
| | | Principal
Amount
| | | Value
| |
Warnermedia Holdings, Inc. | | | | | | | | |
5.050%, 03/15/2042(b) | | $ | 530,000 | | | $ | 428,038 | |
5.141%, 03/15/2052(b) | | | 835,000 | | | | 656,839 | |
| | | | | | |
|
|
|
| | | | | | | | 6,493,739 | |
| | | | | | |
|
|
|
Building Material and Garden Equipment and Supplies Dealers—0.29% | | | | | | | | |
Home Depot, Inc. | | | | | | | | |
2.700%, 04/01/2023 | | | 1,202,000 | | | | 1,199,518 | |
| | | | | | |
|
|
|
Chemical Manufacturing—1.67% | | | | | | | | |
AbbVie, Inc. | | | | | | | | |
4.050%, 11/21/2039 | | | 270,000 | | | | 227,614 | |
4.250%, 11/21/2049 | | | 485,000 | | | | 403,054 | |
Amgen, Inc. | | | | | | | | |
5.750%, 03/02/2063 | | | 1,695,000 | | | | 1,664,728 | |
Biogen, Inc. | | | | | | | | |
2.250%, 05/01/2030 | | | 2,894,000 | | | | 2,342,418 | |
Bristol-Myers Squibb Co. | | | | | | | | |
3.550%, 03/15/2042 | | | 300,000 | | | | 243,531 | |
Eli Lilly & Co. | | | | | | | | |
4.950%, 02/27/2063 | | | 1,225,000 | | | | 1,212,851 | |
Viatris, Inc. | | | | | | | | |
4.000%, 06/22/2050 | | | 1,140,000 | | | | 730,080 | |
| | | | | | |
|
|
|
| | | | | | | | 6,824,276 | |
| | | | | | |
|
|
|
Computer and Electronic Product Manufacturing—2.04% | | | | | | | | |
Apple, Inc. | | | | | | | | |
1.800%, 09/11/2024 | | | 2,818,000 | | | | 2,685,770 | |
Dell International LLC / EMC Corp. | | | | | | | | |
5.450%, 06/15/2023 | | | 289,000 | | | | 288,826 | |
6.200%, 07/15/2030(f) | | | 1,140,000 | | | | 1,157,360 | |
Intel Corp. | | | | | | | | |
3.750%, 03/25/2027(f) | | | 1,146,000 | | | | 1,094,523 | |
Marvell Technology, Inc. | | | | | | | | |
2.950%, 04/15/2031 | | | 1,036,000 | | | | 835,195 | |
Microchip Technology, Inc. | | | | | | | | |
4.333%, 06/01/2023 | | | 690,000 | | | | 687,832 | |
Northrop Grumman Corp. | | | | | | | | |
4.950%, 03/15/2053 | | | 870,000 | | | | 816,892 | |
QUALCOMM, Inc. | | | | | | | | |
6.000%, 05/20/2053 | | | 280,000 | | | | 301,145 | |
Thermo Fisher Scientific, Inc. | | | | | | | | |
4.950%, 11/21/2032 | | | 494,000 | | | | 492,000 | |
| | | | | | |
|
|
|
| | | | | | | | 8,359,543 | |
| | | | | | |
|
|
|
Construction of Buildings—0.02% | | | | | | | | |
Shea Homes LP / Shea Homes Funding Corp. | | | | | | | | |
4.750%, 02/15/2028 | | | 75,000 | | | | 65,952 | |
| | | | | | |
|
|
|
Credit Intermediation and Related Activities—5.07% | | | | | | | | |
Bank of America Corp. | | | | | | | | |
3.875%, 08/01/2025 | | | 1,604,000 | | | | 1,559,041 | |
3.559% to 04/23/2026, then 3 Month LIBOR USD + 1.060%, 04/23/2027(a) | | | 1,610,000 | | | | 1,513,540 | |
3.705% to 04/24/2027, then 3 Month LIBOR USD + 1.512%, 04/24/2028(a) | | | 660,000 | | | | 614,365 | |
2.884% to 10/22/2029, then 3 Month LIBOR USD + 1.190%, 10/22/2030(a) | | | 743,000 | | | | 628,975 | |
4.571% to 04/27/2032, then SOFR + 1.830%, 04/27/2033(a) | | | 725,000 | | | | 674,473 | |
The accompanying notes are an integral part of these financial statements.
19
PMC CORE FIXED INCOME FUND | Schedule of Investments |
February 28, 2023 (Unaudited) (Continued)
| | | | | | | | |
| | |
| | | Principal
Amount
| | | Value
| |
Citigroup, Inc. | | | | | | | | |
3.200%, 10/21/2026 | | $ | 1,115,000 | | | $ | 1,037,496 | |
4.300%, 11/20/2026 | | | 890,000 | | | | 853,899 | |
1.122% to 01/28/2026, then SOFR + 0.765%, 01/28/2027(a) | | | 1,610,000 | | | | 1,415,191 | |
3.887% to 01/10/2027, then 3 Month LIBOR USD + 1.825%, 01/10/2028(a) | | | 835,000 | | | | 785,230 | |
3.520% to 10/27/2027, then 3 Month LIBOR USD + 1.413%), 10/27/2028(a) | | | 455,000 | | | | 416,790 | |
2.976% to 11/05/2029 then SOFR + 1.422%, 11/05/2030(a) | | | 495,000 | | | | 421,696 | |
Ford Motor Credit Co. LLC | | | | | | | | |
5.113%, 05/03/2029 | | | 310,000 | | | | 283,650 | |
General Motors Financial Co., Inc. | | | | | | | | |
5.100%, 01/17/2024 | | | 370,000 | | | | 368,367 | |
3.600%, 06/21/2030 | | | 700,000 | | | | 601,620 | |
JPMorgan Chase & Co. | | | | | | | | |
2.700%, 05/18/2023 | | | 480,000 | | | | 477,450 | |
2.950%, 10/01/2026 | | | 1,658,000 | | | | 1,542,713 | |
2.580% to 04/22/2031, then SOFR + 1.250%, 04/22/2032(a) | | | 1,535,000 | | | | 1,243,330 | |
OneMain Finance Corp. | | | | | | | | |
3.500%, 01/15/2027 | | | 255,000 | | | | 214,420 | |
Synchrony Financial | | | | | | | | |
2.875%, 10/28/2031(f) | | | 920,000 | | | | 691,950 | |
Wells Fargo & Co. | | | | | | | | |
2.406% to 10/30/2024, then 3 Month LIBOR USD + 0.825%, 10/30/2025(a) | | | 900,000 | | | | 853,541 | |
2.393% to 06/02/2027, then SOFR + 2.100%, 06/02/2028(a) | | | 1,020,000 | | | | 902,382 | |
4.150%, 01/24/2029(f) | | | 1,581,000 | | | | 1,481,775 | |
2.572% to 02/11/2030, then SOFR + 1.262%, 02/11/2031(a) | | | 1,045,000 | | | | 869,546 | |
4.897% to 07/25/2032, then SOFR + 2.100%, 07/25/2033(a) | | | 1,025,000 | | | | 978,575 | |
5.013% to 04/04/2050, then SOFR + 4.502%, 04/04/2051(a) | | | 365,000 | | | | 335,059 | |
| | | | | | |
|
|
|
| | | | | | | | 20,765,074 | |
| | | | | | |
|
|
|
Electrical Equipment, Appliance, and Component Manufacturing—0.05% | | | | | | | | |
Energizer Holdings, Inc. | | | | | | | | |
4.375%, 03/31/2029(b)(f) | | | 250,000 | | | | 213,125 | |
| | | | | | |
|
|
|
Electronics and Appliance Stores—0.02% | | | | | | | | |
AMC Networks, Inc. | | | | | | | | |
4.250%, 02/15/2029 | | | 100,000 | | | | 73,624 | |
| | | | | | |
|
|
|
Food Manufacturing—0.03% | | | | | | | | |
Post Holdings, Inc. | | | | | | | | |
4.625%, 04/15/2030(b) | | | 150,000 | | | | 130,205 | |
| | | | | | |
|
|
|
Food Services and Drinking Places—0.49% | | | | | | | | |
Aramark Services, Inc. | | | | | | | | |
5.000%, 02/01/2028(b) | | | 235,000 | | | | 216,411 | |
McDonald’s Corp. | | | | | | | | |
3.500%, 07/01/2027 | | | 1,622,000 | | | | 1,530,588 | |
Starbucks Corp. | | | | | | | | |
2.550%, 11/15/2030 | | | 148,000 | | | | 123,556 | |
Yum! Brands, Inc. | | | | | | | | |
5.375%, 04/01/2032 | | | 155,000 | | | | 143,757 | |
| | | | | | |
|
|
|
| | | | | | | | 2,014,312 | |
| | | | | | |
|
|
|
General Merchandise Stores—0.12% | | | | | | | | |
Target Corp. | | | | | | | | |
4.500%, 09/15/2032(f) | | | 495,000 | | | | 474,967 | |
| | | | | | |
|
|
|
The accompanying notes are an integral part of these financial statements.
20
PMC CORE FIXED INCOME FUND | Schedule of Investments |
February 28, 2023 (Unaudited) (Continued)
| | | | | | | | |
| | |
| | | Principal
Amount
| | | Value
| |
Health and Personal Care Stores—0.51% | | | | | | | | |
CVS Health Corp. | | | | | | | | |
4.125%, 04/01/2040 | | $ | 560,000 | | | $ | 459,402 | |
5.625%, 02/21/2053(f) | | | 1,705,000 | | | | 1,643,712 | |
| | | | | | |
|
|
|
| | | | | | | | 2,103,114 | |
| | | | | | |
|
|
|
Hospitals—0.06% | | | | | | | | |
Tenet Healthcare Corp. | | | | | | | | |
6.125%, 10/01/2028(f) | | | 265,000 | | | | 245,364 | |
| | | | | | |
|
|
|
Insurance Carriers and Related Activities—1.32% | | | | | | | | |
Berkshire Hathaway, Inc. | | | | | | | | |
2.750%, 03/15/2023 | | | 2,543,000 | | | | 2,540,793 | |
Equitable Holdings, Inc. | | | | | | | | |
5.000%, 04/20/2048 | | | 545,000 | | | | 480,554 | |
MetLife, Inc. | | | | | | | | |
6.500%, 12/15/2032 | | | 2,137,000 | | | | 2,386,008 | |
| | | | | | |
|
|
|
| | | | | | | | 5,407,355 | |
| | | | | | |
|
|
|
Machinery Manufacturing—0.25% | | | | | | | | |
Deere & Co. | | | | | | | | |
5.375%, 10/16/2029 | | | 986,000 | | | | 1,023,107 | |
| | | | | | |
|
|
|
Management of Companies and Enterprises—0.31% | | | | | | | | |
Abbott Laboratories | | | | | | | | |
3.400%, 11/30/2023 | | | 1,128,000 | | | | 1,115,070 | |
Park Intermediate Holdings LLC / PK Domestic Property LLC | | | | | | | | |
5.875%, 10/01/2028(b) | | | 195,000 | | | | 173,668 | |
| | | | | | |
|
|
|
| | | | | | | | 1,288,738 | |
| | | | | | |
|
|
|
Merchant Wholesalers, Durable Goods—0.53% | | | | | | | | |
CDW LLC / CDW Finance Corp. | | | | | | | | |
2.670%, 12/01/2026 | | | 328,000 | | | | 291,629 | |
3.276%, 12/01/2028 | | | 1,915,000 | | | | 1,653,637 | |
3.569%, 12/01/2031 | | | 265,000 | | | | 219,587 | |
| | | | | | |
|
|
|
| | | | | | | | 2,164,853 | |
| | | | | | |
|
|
|
Merchant Wholesalers, Nondurable Goods—0.08% | | | | | | | | |
Performance Food Group, Inc. | | | | | | | | |
5.500%, 10/15/2027(b) | | | 90,000 | | | | 85,427 | |
Univar Solutions USA, Inc. | | | | | | | | |
5.125%, 12/01/2027(b) | | | 250,000 | | | | 237,879 | |
| | | | | | |
|
|
|
| | | | | | | | 323,306 | |
| | | | | | |
|
|
|
Nonstore Retailers—0.73% | | | | | | | | |
Amazon.com, Inc. | | | | | | | | |
3.800%, 12/05/2024 | | | 1,637,000 | | | | 1,601,599 | |
eBay, Inc. | | | | | | | | |
2.600%, 05/10/2031(f) | | | 1,680,000 | | | | 1,379,138 | |
| | | | | | |
|
|
|
| | | | | | | | 2,980,737 | |
| | | | | | |
|
|
|
Oil and Gas Extraction—1.15% | | | | | | | | |
CQP Holdco LP / BIP-V Chinook Holdco LLC | | | | | | | | |
5.500%, 06/15/2031(b) | | | 155,000 | | | | 135,901 | |
Dominion Energy, Inc. | | | | | | | | |
4.350%, 08/15/2032(f) | | | 1,415,000 | | | | 1,305,553 | |
5.375%, 11/15/2032(f) | | | 1,150,000 | | | | 1,128,520 | |
The accompanying notes are an integral part of these financial statements.
21
PMC CORE FIXED INCOME FUND | Schedule of Investments |
February 28, 2023 (Unaudited) (Continued)
| | | | | | | | |
| | |
| | | Principal
Amount
| | | Value
| |
Occidental Petroleum Corp. | | | | | | | | |
4.300%, 08/15/2039 | | $ | 260,000 | | | $ | 204,755 | |
Phillips 66 | | | | | | | | |
1.300%, 02/15/2026 | | | 1,290,000 | | | | 1,150,335 | |
Pioneer Natural Resources Co. | | | | | | | | |
2.150%, 01/15/2031 | | | 997,000 | | | | 785,853 | |
| | | | | | |
|
|
|
| | | | | | | | 4,710,917 | |
| | | | | | |
|
|
|
Petroleum and Coal Products Manufacturing—0.69% | | | | | | | | |
BP Capital Markets America, Inc. | | | | | | | | |
4.812%, 02/13/2033(f) | | | 2,115,000 | | | | 2,075,214 | |
Marathon Petroleum Corp. | | | | | | | | |
4.700%, 05/01/2025 | | | 775,000 | | | | 764,319 | |
| | | | | | |
|
|
|
| | | | | | | | 2,839,533 | |
| | | | | | |
|
|
|
Pipeline Transportation—0.87% | | | | | | | | |
Buckeye Partners LP | | | | | | | | |
3.950%, 12/01/2026 | | | 75,000 | | | | 66,394 | |
DT Midstream, Inc. | | | | | | | | |
4.125%, 06/15/2029(b) | | | 125,000 | | | | 106,996 | |
Energy Transfer LP | | | | | | | | |
6.625% to 02/25/2028, then 3 Month LIBOR USD + 4.155%(a)(f)(h) | | | 785,000 | | | | 643,463 | |
7.125% to 05/15/2030, then 5 Year CMT Rate + 5.306%(a)(h) | | | 1,055,000 | | | | 930,910 | |
EQM Midstream Partners LP | | | | | | | | |
5.500%, 07/15/2028 | | | 350,000 | | | | 312,727 | |
MPLX LP | | | | | | | | |
4.700%, 04/15/2048 | | | 815,000 | | | | 653,518 | |
Plains All American Pipeline LP / PAA Finance Corp. | | | | | | | | |
4.650%, 10/15/2025 | | | 780,000 | | | | 761,403 | |
Tallgrass Energy Partners LP / Tallgrass Energy Finance Corp. | | | | | | | | |
6.000%, 09/01/2031(b) | | | 110,000 | | | | 94,193 | |
| | | | | | |
|
|
|
| | | | | | | | 3,569,604 | |
| | | | | | |
|
|
|
Plastics and Rubber Products Manufacturing—0.03% | | | | | | | | |
Goodyear Tire & Rubber Co. | | | | | | | | |
5.250%, 04/30/2031 | | | 125,000 | | | | 107,361 | |
| | | | | | |
|
|
|
Professional, Scientific, and Technical Services—0.50% | | | | | | | | |
MPLX LP | | | | | | | | |
5.650%, 03/01/2053(f) | | | 495,000 | | | | 454,326 | |
Presidio Holdings, Inc. | | | | | | | | |
4.875%, 02/01/2027(b) | | | 185,000 | | | | 168,674 | |
ServiceNow, Inc. | | | | | | | | |
1.400%, 09/01/2030 | | | 1,894,000 | | | | 1,444,107 | |
| | | | | | |
|
|
|
| | | | | | | | 2,067,107 | |
| | | | | | |
|
|
|
Publishing Industries (except Internet)—1.59% | | | | | | | | |
Microsoft Corp. | | | | | | | | |
3.125%, 11/03/2025 | | | 2,676,000 | | | | 2,565,054 | |
Oracle Corp. | | | | | | | | |
2.875%, 03/25/2031 | | | 1,045,000 | | | | 865,743 | |
4.000%, 07/15/2046 | | | 615,000 | | | | 448,487 | |
6.900%, 11/09/2052 | | | 1,240,000 | | | | 1,331,935 | |
5.550%, 02/06/2053 | | | 1,195,000 | | | | 1,089,312 | |
The accompanying notes are an integral part of these financial statements.
22
PMC CORE FIXED INCOME FUND | Schedule of Investments |
February 28, 2023 (Unaudited) (Continued)
| | | | | | | | |
| | |
| | | Principal
Amount
| | | Value
| |
Ziff Davis, Inc. | | | | | | | | |
4.625%, 10/15/2030(b) | | $ | 255,000 | | | $ | 215,322 | |
| | | | | | |
|
|
|
| | | | | | | | 6,515,853 | |
| | | | | | |
|
|
|
Real Estate—0.79% | | | | | | | | |
Alexandria Real Estate Equities, Inc. | | | | | | | | |
4.750%, 04/15/2035 | | | 350,000 | | | | 330,944 | |
Public Storage | | | | | | | | |
2.300%, 05/01/2031 | | | 3,058,000 | | | | 2,501,599 | |
RHP Hotel Properties LP / RHP Finance Corp. | | | | | | | | |
4.750%, 10/15/2027 | | | 205,000 | | | | 188,662 | |
Uniti Group LP / Uniti Fiber Holdings Inc / CSL Capital LLC | | | | | | | | |
7.875%, 02/15/2025(b) | | | 190,000 | | | | 193,808 | |
| | | | | | |
|
|
|
| | | | | | | | 3,215,013 | |
| | | | | | |
|
|
|
Rental and Leasing Services—0.03% | | | | | | | | |
Harsco Corp. | | | | | | | | |
5.750%, 07/31/2027(b) | | | 165,000 | | | | 141,418 | |
| | | | | | |
|
|
|
Securities, Commodity Contracts, and Other Financial Investments and Related Activities—2.87% | | | | | | | | |
Charles Schwab Corp. | | | | | | | | |
2.300%, 05/13/2031 | | | 1,898,000 | | | | 1,563,559 | |
CME Group, Inc. | | | | | | | | |
3.000%, 03/15/2025 | | | 1,085,000 | | | | 1,044,055 | |
CommScope, Inc. | | | | | | | | |
8.250%, 03/01/2027(b)(f) | | | 377,000 | | | | 321,474 | |
Goldman Sachs Group, Inc. | | | | | | | | |
3.800%, 03/15/2030 | | | 1,459,000 | | | | 1,323,958 | |
Morgan Stanley | | | | | | | | |
0.791% to 01/22/2024, then SOFR + 0.509%, 01/22/2025(a)(f) | | | 1,300,000 | | | | 1,243,380 | |
6.250%, 08/09/2026 | | | 2,436,000 | | | | 2,510,819 | |
3.950%, 04/23/2027 | | | 935,000 | | | | 884,084 | |
3.591% to 07/22/2027, then 3 Month LIBOR USD + 1.340%, 07/22/2028(a) | | | 1,625,000 | | | | 1,501,048 | |
2.699% to 01/22/2030, then SOFR + 1.143%, 01/22/2031(a) | | | 1,190,000 | | | | 994,425 | |
MPH Acquisition Holdings LLC | | | | | | | | |
5.500%, 09/01/2028(b) | | | 205,000 | | | | 155,559 | |
Prime Security Services Borrower LLC / Prime Finance, Inc. | | | | | | | | |
5.750%, 04/15/2026(b) | | | 230,000 | | | | 222,505 | |
| | | | | | |
|
|
|
| | | | | | | | 11,764,866 | |
| | | | | | |
|
|
|
Support Activities for Mining—0.97% | | | | | | | | |
Diamondback Energy, Inc. | | | | | | | | |
3.125%, 03/24/2031(f) | | | 1,310,000 | | | | 1,098,306 | |
6.250%, 03/15/2033 | | | 1,275,000 | | | | 1,298,888 | |
Halliburton Co. | | | | | | | | |
5.000%, 11/15/2045 | | | 1,115,000 | | | | 984,594 | |
Hess Corp. | | | | | | | | |
5.600%, 02/15/2041 | | | 470,000 | | | | 438,883 | |
Hilcorp Energy I LP / Hilcorp Finance Co. | | | | | | | | |
6.250%, 11/01/2028(b) | | | 160,000 | | | | 148,775 | |
| | | | | | |
|
|
|
| | | | | | | | 3,969,446 | |
| | | | | | |
|
|
|
The accompanying notes are an integral part of these financial statements.
23
PMC CORE FIXED INCOME FUND | Schedule of Investments |
February 28, 2023 (Unaudited) (Continued)
| | | | | | | | |
| | |
| | | Principal
Amount
| | | Value
| |
Telecommunications—1.87% | | | | | | | | |
AT&T, Inc. | | | | | | | | |
2.550%, 12/01/2033 | | $ | 1,100,000 | | | $ | 841,685 | |
3.650%, 06/01/2051 | | | 845,000 | | | | 600,802 | |
3.500%, 09/15/2053 | | | 265,000 | | | | 181,149 | |
3.550%, 09/15/2055 | | | 184,000 | | | | 124,090 | |
Frontier Communications Holdings LLC | | | | | | | | |
5.875%, 10/15/2027(b) | | | 235,000 | | | | 218,719 | |
T-Mobile USA, Inc. | | | | | | | | |
2.875%, 02/15/2031 | | | 125,000 | | | | 103,861 | |
4.375%, 04/15/2040 | | | 550,000 | | | | 467,175 | |
3.000%, 02/15/2041 | | | 1,186,000 | | | | 828,356 | |
4.500%, 04/15/2050 | | | 645,000 | | | | 533,280 | |
3.300%, 02/15/2051 | | | 350,000 | | | | 233,753 | |
Verizon Communications, Inc. | | | | | | | | |
4.329%, 09/21/2028 | | | 2,494,000 | | | | 2,390,798 | |
4.016%, 12/03/2029 | | | 400,000 | | | | 369,316 | |
2.355%, 03/15/2032 | | | 950,000 | | | | 746,379 | |
| | | | | | |
|
|
|
| | | | | | | | 7,639,363 | |
| | | | | | |
|
|
|
Transportation Equipment Manufacturing—2.13% | | | | | | | | |
Boeing Co. | | | | | | | | |
4.875%, 05/01/2025 | | | 1,371,000 | | | | 1,351,751 | |
3.900%, 05/01/2049 | | | 185,000 | | | | 132,991 | |
5.805%, 05/01/2050 | | | 2,125,000 | | | | 2,016,806 | |
Ford Motor Co. | | | | | | | | |
4.750%, 01/15/2043 | | | 90,000 | | | | 65,789 | |
General Motors Co. | | | | | | | | |
6.125%, 10/01/2025(f) | | | 1,448,000 | | | | 1,465,044 | |
Lockheed Martin Corp. | | | | | | | | |
5.250%, 01/15/2033 | | | 375,000 | | | | 384,240 | |
Raytheon Technologies Corp. | | | | | | | | |
7.500%, 09/15/2029 | | | 2,240,000 | | | | 2,523,413 | |
5.375%, 02/27/2053 | | | 515,000 | | | | 515,199 | |
TransDigm, Inc. | | | | | | | | |
6.250%, 03/15/2026(b) | | | 275,000 | | | | 271,712 | |
| | | | | | |
|
|
|
| | | | | | | | 8,726,945 | |
| | | | | | |
|
|
|
Utilities—2.53% | | | | | | | | |
American Electric Power Co., Inc. | | | | | | | | |
5.625%, 03/01/2033 | | | 745,000 | | | | 743,783 | |
Calpine Corp. | | | | | | | | |
4.500%, 02/15/2028(b) | | | 310,000 | | | | 279,326 | |
DTE Energy Co. | | | | | | | | |
3.400%, 06/15/2029 | | | 607,000 | | | | 539,652 | |
Exelon Corp. | | | | | | | | |
5.300%, 03/15/2033 | | | 1,635,000 | | | | 1,610,849 | |
4.700%, 04/15/2050 | | | 475,000 | | | | 412,452 | |
ITC Holdings Corp. | | | | | | | | |
2.950%, 05/14/2030(b) | | | 525,000 | | | | 447,922 | |
Kinder Morgan Energy Partners LP | | | | | | | | |
4.150%, 02/01/2024 | | | 755,000 | | | | 745,028 | |
Kinder Morgan, Inc. | | | | | | | | |
5.550%, 06/01/2045 | | | 1,745,000 | | | | 1,577,565 | |
The accompanying notes are an integral part of these financial statements.
24
PMC CORE FIXED INCOME FUND | Schedule of Investments |
February 28, 2023 (Unaudited) (Continued)
| | | | | | | | |
| | |
| | | Principal
Amount
| | | Value
| |
New Fortress Energy, Inc. | | | | | | | | |
6.500%, 09/30/2026(b) | | $ | 95,000 | | | $ | 87,052 | |
NextEra Energy Capital Holdings, Inc. | | | | | | | | |
5.250%, 02/28/2053 | | | 730,000 | | | | 688,322 | |
Southern Co. | | | | | | | | |
2.950%, 07/01/2023(f) | | | 313,000 | | | | 310,428 | |
Vistra Operations Co. LLC | | | | | | | | |
4.375%, 05/01/2029(b)(f) | | | 265,000 | | | | 229,210 | |
WEC Energy Group, Inc. | | | | | | | | |
5.150%, 10/01/2027 | | | 1,795,000 | | | | 1,786,789 | |
Wisconsin Electric Power Co. | | | | | | | | |
4.750%, 09/30/2032 | | | 905,000 | | | | 884,440 | |
| | | | | | |
|
|
|
| | | | | | | | 10,342,818 | |
| | | | | | |
|
|
|
Warehousing and Storage—0.09% | | | | | | | | |
Iron Mountain, Inc. | | | | | | | | |
5.250%, 03/15/2028(b) | | | 45,000 | | | | 41,470 | |
4.875%, 09/15/2029(b)(f) | | | 240,000 | | | | 210,272 | |
5.250%, 07/15/2030(b) | | | 150,000 | | | | 130,971 | |
| | | | | | |
|
|
|
| | | | | | | | 382,713 | |
| | | | | | |
|
|
|
Waste Management and Remediation Services—0.11% | | | | | | | | |
Waste Management, Inc. | | | | | | | | |
4.150%, 04/15/2032(f) | | | 497,000 | | | | 465,628 | |
| | | | | | |
|
|
|
Wood Product Manufacturing—0.03% | | | | | | | | |
Standard Industries, Inc. | | | | | | | | |
4.750%, 01/15/2028(b) | | | 130,000 | | | | 116,895 | |
| | | | | | |
|
|
|
TOTAL CORPORATE BONDS (Cost $159,919,475) | | | | | | | 142,413,414 | |
| | | | | | |
|
|
|
FOREIGN CORPORATE BONDS—2.62% | | | | | | | | |
Air Transportation—0.76% | | | | | | | | |
Delta Air Lines, Inc. / SkyMiles IP Ltd. | | | | | | | | |
4.500%, 10/20/2025(b) | | | 3,208,090 | | | | 3,117,626 | |
| | | | | | |
|
|
|
Chemical Manufacturing—0.05% | | | | | | | | |
NOVA Chemicals Corp. | | | | | | | | |
4.875%, 06/01/2024(b) | | | 120,000 | | | | 117,720 | |
5.250%, 06/01/2027(b) | | | 75,000 | | | | 67,601 | |
| | | | | | |
|
|
|
| | | | | | | | 185,321 | |
| | | | | | |
|
|
|
Credit Intermediation and Related Activities—0.71% | | | | | | | | |
Banco Santander SA | | | | | | | | |
1.849%, 03/25/2026 | | | 1,600,000 | | | | 1,419,205 | |
3.490%, 05/28/2030(f) | | | 400,000 | | | | 345,056 | |
HSBC Holdings PLC | | | | | | | | |
6.000% to 05/22/2027, then 5 Year Mid Swap Rate USD + 3.746%(a)(h) | | | 910,000 | | | | 844,025 | |
Virgin Media Vendor Financing Notes IV DAC | | | | | | | | |
5.000%, 07/15/2028(b)(f) | | | 350,000 | | | | 304,118 | |
| | | | | | |
|
|
|
| | | | | | | | 2,912,404 | |
| | | | | | |
|
|
|
Management of Companies and Enterprises—0.97% | | | | | | | | |
Carnival Corp. | | | | | | | | |
10.500%, 02/01/2026(b) | | | 95,000 | | | | 98,471 | |
7.625%, 03/01/2026(b)(f) | | | 340,000 | | | | 306,595 | |
The accompanying notes are an integral part of these financial statements.
25
PMC CORE FIXED INCOME FUND | Schedule of Investments |
February 28, 2023 (Unaudited) (Continued)
| | | | | | | | |
| | |
| | | Principal
Amount
| | | Value
| |
Credit Suisse Group AG | | | | | | | | |
4.194% to 04/01/2030, then SOFR + 3.730%, 04/01/2031(a)(b) | | $ | 560,000 | | | $ | 444,502 | |
3.091% to 05/14/2031, then SOFR + 1.730%, 05/14/2032(a)(b) | | | 830,000 | | | | 584,556 | |
6.537% to 08/12/2032, then SOFR + 3.920%, 08/12/2033(a)(b) | | | 950,000 | | | | 848,866 | |
Natwest Group PLC | | | | | | | | |
3.032% to 11/28/2030, then 5 Year CMT Rate + 2.350%, 11/28/2035(a)(f) | | | 2,170,000 | | | | 1,678,417 | |
| | | | | | |
|
|
|
| | | | | | | | 3,961,407 | |
| | | | | | |
|
|
|
Mining (except Oil and Gas)—0.03% | | | | | | | | |
Hudbay Minerals, Inc. | | | | | | | | |
6.125%, 04/01/2029(b) | | | 125,000 | | | | 110,485 | |
| | | | | | |
|
|
|
Support Activities for Transportation—0.06% | | | | | | | | |
American Airlines Inc/AAdvantage Loyalty IP Ltd. | | | | | | | | |
5.500%, 04/20/2026(b) | | | 235,000 | | | | 228,875 | |
| | | | | | |
|
|
|
Water Transportation—0.04% | | | | | | | | |
Royal Caribbean Cruises Ltd. | | | | | | | | |
5.500%, 04/01/2028(b)(f) | | | 205,000 | | | | 178,863 | |
| | | | | | |
|
|
|
TOTAL FOREIGN CORPORATE BONDS (Cost $12,421,135) | | | | | | | 10,694,981 | |
| | | | | | |
|
|
|
FOREIGN GOVERNMENT AGENCY ISSUES—1.48% | | | | | | | | |
Asian Development Bank | | | | | | | | |
3.125%, 04/27/2032 | | | 960,000 | | | | 886,042 | |
Development Bank of Japan, Inc. | | | | | | | | |
1.000%, 08/27/2030(b) | | | 260,000 | | | | 200,920 | |
European Investment Bank | | | | | | | | |
3.875%, 03/15/2028 | | | 455,000 | | | | 447,113 | |
3.750%, 02/14/2033 | | | 435,000 | | | | 425,108 | |
International Bank for Reconstruction & Development | | | | | | | | |
3.125%, 06/15/2027 | | | 640,000 | | | | 608,623 | |
3.875%, 02/14/2030 | | | 695,000 | | | | 680,540 | |
International Finance Corp. | | | | | | | | |
3.625%, 09/15/2025 | | | 660,000 | | | | 644,272 | |
Japan International Cooperation Agency | | | | | | | | |
3.250%, 05/25/2027 | | | 790,000 | | | | 739,365 | |
Kreditanstalt fuer Wiederaufbau | | | | | | | | |
3.000%, 05/20/2027 | | | 740,000 | | | | 701,412 | |
Province of Ontario Canada | | | | | | | | |
2.125%, 01/21/2032 | | | 865,000 | | | | 724,812 | |
| | | | | | |
|
|
|
TOTAL FOREIGN GOVERNMENT AGENCY ISSUES (Cost $6,486,949) | | | | | | | 6,058,207 | |
| | | | | | |
|
|
|
FOREIGN GOVERNMENT NOTES/BONDS—1.05% | | | | | | | | |
Colombia Government International Bond | | | | | | | | |
4.000%, 02/26/2024(f) | | | 590,000 | | | | 580,583 | |
3.000%, 01/30/2030(f) | | | 570,000 | | | | 430,480 | |
Dominican Republic International Bond | | | | | | | | |
6.875%, 01/29/2026(b) | | | 330,000 | | | | 335,655 | |
6.850%, 01/27/2045(b) | | | 560,000 | | | | 501,868 | |
Hungary Government International Bond | | | | | | | | |
7.625%, 03/29/2041 | | | 360,000 | | | | 404,862 | |
Indonesia Government International Bond | | | | | | | | |
4.350%, 01/08/2027(b) | | | 550,000 | | | | 536,733 | |
Mexico Government International Bond | | | | | | | | |
4.350%, 01/15/2047 | | | 740,000 | | | | 572,531 | |
The accompanying notes are an integral part of these financial statements.
26
PMC CORE FIXED INCOME FUND | Schedule of Investments |
February 28, 2023 (Unaudited) (Continued)
| | | | | | | | |
| | |
| | | Principal
Amount
| | | Value
| |
Republic of South Africa Government International Bond | | | | | | | | |
5.000%, 10/12/2046 | | $ | 150,000 | | | $ | 103,518 | |
Romanian Government International Bond | | | | | | | | |
6.125%, 01/22/2044(b) | | | 505,000 | | | | 476,594 | |
Saudi Government International Bond | | | | | | | | |
4.500%, 10/26/2046(b) | | | 400,000 | | | | 345,914 | |
| | | | | | |
|
|
|
TOTAL FOREIGN GOVERNMENT NOTES/BONDS (Cost $5,068,438) | | | | | | | 4,288,738 | |
| | | | | | |
|
|
|
NON-AGENCY MORTGAGE BACKED SECURITIES—6.56% | | | | | | | | |
Angel Oak Mortgage Trust | | | | | | | | |
2019-6, 2.620%, 11/25/2059(b)(d) | | | 76,014 | | | | 73,287 | |
Bank | | | | | | | | |
2021-BNK31, 1.739%, 02/15/2054 | | | 454,000 | | | | 382,858 | |
2022-BNK39, 2.928%, 02/15/2055 | | | 179,000 | | | | 151,322 | |
2023-BNK45 B, 6.148%, 02/15/2056(d) | | | 483,000 | | | | 493,820 | |
2023-BNK45 C, 6.280%, 02/15/2056(d) | | | 522,000 | | | | 495,348 | |
BBCMS Mortgage Trust | | | | | | | | |
2021-C11, 1.382%, 09/15/2054(d)(e) | | | 7,957,530 | | | | 616,294 | |
BB-UBS Trust | | | | | | | | |
2012-SHOW, 3.430%, 11/05/2036(b) | | | 1,646,000 | | | | 1,532,438 | |
Benchmark Mortgage Trust | | | | | | | | |
2020-B21, 1.978%, 12/17/2053 | | | 251,000 | | | | 199,489 | |
2021-B23, 1.766%, 02/15/2054 | | | 612,000 | | | | 515,977 | |
2021-B26, 0.886%, 06/15/2054(d)(e) | | | 9,534,698 | | | | 468,187 | |
2021-B31 D, 2.250%, 12/15/2054(b) | | | 278,000 | | | | 148,626 | |
2021-B31 C, 3.195%, 12/15/2054(d) | | | 415,000 | | | | 302,576 | |
BX Commercial Mortgage Trust | | | | | | | | |
2021-VOLT, 6.238% (1 Month LIBOR USD + 1.650%), 09/15/2036(b)(c) | | | 1,085,000 | | | | 1,048,909 | |
2020-VIV2, 3.542%, 03/09/2044(b)(d) | | | 650,000 | | | | 538,226 | |
BX Trust | | | | | | | | |
2019-OC11, 3.202%, 12/09/2041(b) | | | 971,000 | | | | 838,392 | |
BXP Trust | | | | | | | | |
2017-GM, 3.379%, 06/13/2039(b) | | | 331,000 | | | | 299,755 | |
CAMB Commercial Mortgage Trust | | | | | | | | |
2019-LIFE, 5.838% (1 Month LIBOR USD + 1.250%), 12/15/2037(b)(c) | | | 978,000 | | | | 971,906 | |
Citigroup Commercial Mortgage Trust | | | | | | | | |
2013-GCJ11, 3.732%, 04/10/2046(d) | | | 455,000 | | | | 453,773 | |
2013-GC17, 5.095%, 11/10/2046(d) | | | 145,000 | | | | 142,368 | |
2014-GC25, 0.944%, 10/10/2047(d)(e) | | | 1,277,882 | | | | 14,178 | |
2015-GC27, 1.306%, 02/10/2048(d)(e) | | | 896,342 | | | | 16,661 | |
2022-GC48, 4.580%, 05/15/2054(d) | | | 619,207 | | | | 594,899 | |
COMM Mortgage Trust | | | | | | | | |
2012-CCRE4, 3.251%, 10/15/2045 | | | 476,000 | | | | 432,540 | |
2014-UBS2, 3.472%, 03/10/2047 | | | 150,030 | | | | 148,378 | |
2014-CR16, 0.945%, 04/10/2047(d)(e) | | | 1,209,383 | | | | 9,394 | |
2014-LC15, 1.045%, 04/10/2047(d)(e) | | | 1,178,574 | | | | 8,143 | |
2014-CR17, 0.947%, 05/10/2047(d)(e) | | | 1,024,450 | | | | 7,749 | |
2014-UBS3, 1.055%, 06/10/2047(d)(e) | | | 853,238 | | | | 7,175 | |
2014-UBS6, 0.835%, 12/10/2047(d)(e) | | | 1,390,079 | | | | 15,229 | |
2014-CCRE21, 3.987%, 12/10/2047 | | | 281,514 | | | | 269,966 | |
Connecticut Avenue Securities Trust | | | | | | | | |
2021-R01, 6.034% (SOFR30A + 1.550%), 10/25/2041(b)(c) | | | 480,000 | | | | 469,257 | |
2022-R01, 6.384% (SOFR30A + 1.900%), 12/25/2041(b)(c) | | | 1,435,000 | | | | 1,400,875 | |
2022-R03, 7.984% (SOFR30A + 3.500%), 03/25/2042(b)(c) | | | 1,065,000 | | | | 1,078,603 | |
The accompanying notes are an integral part of these financial statements.
27
PMC CORE FIXED INCOME FUND | Schedule of Investments |
February 28, 2023 (Unaudited) (Continued)
| | | | | | | | |
| | |
| | | Principal
Amount
| | | Value
| |
2022-R07 1M1, 7.442% (SOFR30A + 2.950%), 06/25/2042(b)(c) | | $ | 569,706 | | | $ | 580,788 | |
2022-R07 1M2, 9.142% (SOFR30A + 4.650%), 06/25/2042(b)(c) | | | 1,005,000 | | | | 1,073,087 | |
2022-R08, 7.034% (SOFR30A + 2.550%), 07/25/2042(b)(c) | | | 1,657,536 | | | | 1,675,193 | |
2023-R02, 6.792% (SOFR30A + 2.300%), 01/25/2043(b)(c) | | | 731,850 | | | | 737,215 | |
CSAIL Commercial Mortgage Trust | | | | | | | | |
2015-C1, 4.044%, 04/15/2050(d) | | | 450,000 | | | | 409,919 | |
2019-C17, 3.016%, 09/15/2052 | | | 850,000 | | | | 739,649 | |
2015-C2, 0.716%, 06/15/2057(d)(e) | | | 1,402,841 | | | | 16,284 | |
FIVE Mortgage Trust | | | | | | | | |
2023-V1, 6.405%, 02/10/2056(d) | | | 315,000 | | | | 306,454 | |
GS Mortgage Securities Trust | | | | | | | | |
2014-GC18, 1.021%, 01/10/2047(d)(e) | | | 3,172,261 | | | | 17,363 | |
2014-GC26, 0.935%, 11/10/2047(d)(e) | | | 1,711,711 | | | | 20,943 | |
2015-GC34, 3.278%, 10/10/2048 | | | 69,865 | | | | 67,493 | |
2019-GC42, 3.693%, 09/10/2052(d) | | | 449,000 | | | | 365,420 | |
2020-GC47, 2.377%, 05/12/2053 | | | 73,000 | | | | 61,105 | |
Hilton USA Trust | | | | | | | | |
2016-HHV, 3.719%, 11/05/2038(b) | | | 283,000 | | | | 259,367 | |
Hudson Yards Mortgage Trust | | | | | | | | |
2019-55HY, 2.943%, 12/10/2041(b)(d) | | | 865,000 | | | | 736,369 | |
J.P. Morgan Chase Commercial Mortgage Securities Trust | | | | | | | | |
2022-OPO, 3.377%, 01/05/2039(b) | | | 501,000 | | | | 414,349 | |
Morgan Stanley Capital I Trust | | | | | | | | |
2015-MS1, 3.779%, 05/15/2048(d) | | | 200,000 | | | | 191,153 | |
2018-L1, 4.719%, 10/15/2051(d) | | | 325,000 | | | | 296,596 | |
2018-H4, 5.070%, 12/15/2051(d) | | | 293,000 | | | | 252,581 | |
2020-HR8, 2.041%, 07/15/2053 | | | 335,000 | | | | 270,797 | |
New Residential Mortgage Loan Trust | | | | | | | | |
2019-NQM5, 2.710%, 11/25/2059(b)(d) | | | 145,216 | | | | 132,690 | |
OBX Trust | | | | | | | | |
2021-NQM3, 1.054%, 07/25/2061(b)(d) | | | 776,137 | | | | 602,316 | |
Taubman Centers Commercial Mortgage Trust | | | | | | | | |
2022-DPM, 7.494% (TSFR1M + 2.932%), 05/15/2037(b)(c) | | | 1,045,000 | | | | 1,032,646 | |
UBS Commercial Mortgage Trust | | | | | | | | |
2017-C2, 3.487%, 08/15/2050 | | | 1,025,000 | | | | 943,344 | |
2017-C4 AS, 3.836%, 10/15/2050(d) | | | 200,000 | | | | 182,541 | |
Verus Securitization Trust | | | | | | | | |
2019-4, 2.642%, 11/25/2059(b) | | | 41,501 | | | | 39,657 | |
Wells Fargo Commercial Mortgage Trust | | | | | | | | |
2015-C29, 3.637%, 06/15/2048 | | | 130,000 | | | | 124,090 | |
2016-NXS6, 4.386%, 11/15/2049(d) | | | 625,000 | | | | 547,946 | |
2018-C48, 4.302%, 01/15/2052 | | | 333,945 | | | | 317,848 | |
WFRBS Commercial Mortgage Trust | | | | | | | | |
2014-LC14, 1.236%, 03/15/2047(d)(e) | | | 638,394 | | | | 4,245 | |
2014-C22 XA, 0.781%, 09/15/2057(d)(e) | | | 2,796,333 | | | | 23,538 | |
2014-C22 AS, 4.069%, 09/15/2057(d) | | | 290,000 | | | | 274,947 | |
| | | | | | |
|
|
|
TOTAL NON-AGENCY MORTGAGE BACKED SECURITIES (Cost $30,158,196) | | | | | | | 26,864,531 | |
| | | | | | |
|
|
|
| AGENCY MORTGAGE BACKED SECURITIES—29.72% | | | | | | | | |
Fannie Mae Connecticut Avenue Securities | | | | | | | | |
2017-C06, 7.417% (1 Month LIBOR USD + 2.800%), 02/25/2030(c) | | | 1,070,674 | | | | 1,090,589 | |
2017-C07 1M2, 7.017% (1 Month LIBOR USD + 2.400%), 05/25/2030(c) | | | 496,888 | | | | 501,079 | |
2018-C01, 6.867% (1 Month LIBOR USD + 2.250%), 07/25/2030(c) | | | 1,098,169 | | | | 1,112,030 | |
2018-C02, 6.817% (1 Month LIBOR USD + 2.200%), 08/25/2030(c) | | | 1,056,536 | | | | 1,062,801 | |
2018-C04, 7.167% (1 Month LIBOR USD + 2.550%), 12/25/2030(c) | | | 1,539,792 | | | | 1,570,981 | |
The accompanying notes are an integral part of these financial statements.
28
PMC CORE FIXED INCOME FUND | Schedule of Investments |
February 28, 2023 (Unaudited) (Continued)
| | | | | | | | |
| | |
| | | Principal
Amount
| | | Value
| |
Fannie Mae Interest Strip | | | | | | | | |
4.000%, 08/01/2043(e) | | $ | 1,272,771 | | | $ | 236,830 | |
Fannie Mae Pool | | | | | | | | |
MA0096, 4.500%, 06/01/2029 | | | 2,761 | | | | 2,717 | |
AB3000, 4.500%, 05/01/2031 | | | 8,086 | | | | 7,957 | |
AB1389, 4.500%, 08/01/2040 | | | 24,135 | | | | 23,965 | |
MA0510, 4.500%, 09/01/2040 | | | 263 | | | | 261 | |
AE8714, 3.500%, 11/01/2040 | | | 9,364 | | | | 8,790 | |
890310, 4.500%, 12/01/2040 | | | 5,826 | | | | 5,785 | |
AH3952, 4.000%, 01/01/2041 | | | 74,791 | | | | 71,907 | |
AL0791, 4.000%, 02/01/2041 | | | 25,397 | | | | 24,533 | |
AE0954, 4.500%, 02/01/2041 | | | 20,680 | | | | 20,534 | |
AS7001, 3.000%, 04/01/2041 | | | 494,114 | | | | 447,529 | |
AL0245, 4.000%, 04/01/2041 | | | 5,351 | | | | 5,161 | |
AL0065, 4.500%, 04/01/2041 | | | 9,719 | | | | 9,651 | |
AB3194, 4.500%, 06/01/2041 | | | 6,559 | | | | 6,513 | |
AH7395, 4.500%, 06/01/2041 | | | 900 | | | | 875 | |
FM0040, 3.000%, 10/01/2041 | | | 91,529 | | | | 82,900 | |
AL1547, 4.500%, 11/01/2041 | | | 3,835 | | | | 3,808 | |
AJ9278, 3.500%, 12/01/2041 | | | 4,888 | | | | 4,590 | |
AJ6346, 3.500%, 12/01/2041 | | | 15,816 | | | | 14,852 | |
AK6744, 4.000%, 03/01/2042 | | | 29,989 | | | | 28,833 | |
AK9393, 3.500%, 04/01/2042 | | | 9,866 | | | | 9,265 | |
AK6568, 3.500%, 04/01/2042 | | | 19,838 | | | | 18,629 | |
AO1214, 3.500%, 04/01/2042 | | | 53,521 | | | | 50,258 | |
AL4029, 4.500%, 04/01/2042 | | | 28,368 | | | | 28,168 | |
AL7306, 4.500%, 09/01/2042 | | | 16,680 | | | | 16,398 | |
AP8743, 3.500%, 10/01/2042 | | | 152,741 | | | | 143,413 | |
AL3714, 3.500%, 01/01/2043 | | | 14,624 | | | | 13,723 | |
AL2897, 3.500%, 01/01/2043 | | | 21,857 | | | | 20,514 | |
AQ9330, 3.500%, 01/01/2043 | | | 19,784 | | | | 18,569 | |
AB7965, 3.500%, 02/01/2043 | | | 12,394 | | | | 11,632 | |
AT1001, 3.500%, 04/01/2043 | | | 14,548 | | | | 13,643 | |
AT2021, 3.500%, 04/01/2043 | | | 12,896 | | | | 12,109 | |
AB9046, 3.500%, 04/01/2043 | | | 38,040 | | | | 35,699 | |
AB9260, 3.500%, 05/01/2043 | | | 34,015 | | | | 31,884 | |
AU0949, 3.500%, 08/01/2043 | | | 30,167 | | | | 28,327 | |
AS0212, 3.500%, 08/01/2043 | | | 34,048 | | | | 31,921 | |
AU3751, 4.000%, 08/01/2043 | | | 62,900 | | | | 60,501 | |
AS0531, 4.000%, 09/01/2043 | | | 29,881 | | | | 28,922 | |
AU6857, 4.000%, 09/01/2043 | | | 27,019 | | | | 26,194 | |
AU4658, 4.500%, 09/01/2043 | | | 5,516 | | | | 5,401 | |
MA1600, 3.500%, 10/01/2043 | | | 14,775 | | | | 13,849 | |
AS1042, 4.000%, 11/01/2043 | | | 24,617 | | | | 23,678 | |
AL4450, 4.500%, 12/01/2043 | | | 11,534 | | | | 11,358 | |
AS1333, 4.500%, 12/01/2043 | | | 10,087 | | | | 9,926 | |
AS1559, 4.000%, 01/01/2044 | | | 17,088 | | | | 16,437 | |
AS2516, 4.500%, 05/01/2044 | | | 11,935 | | | | 11,744 | |
MA1926, 4.500%, 06/01/2044 | | | 12,117 | | | | 11,923 | |
AS2751, 4.500%, 06/01/2044 | | | 14,514 | | | | 14,281 | |
AL6223, 4.500%, 08/01/2044 | | | 14,106 | | | | 13,880 | |
AX0118, 4.000%, 09/01/2044 | | | 108,298 | | | | 104,841 | |
AS3467, 4.000%, 10/01/2044 | | | 9,135 | | | | 8,760 | |
AX2491, 4.000%, 10/01/2044 | | | 7,215 | | | | 6,921 | |
The accompanying notes are an integral part of these financial statements.
29
PMC CORE FIXED INCOME FUND | Schedule of Investments |
February 28, 2023 (Unaudited) (Continued)
| | | | | | | | |
| | |
| | | Principal
Amount
| | | Value
| |
AL6432, 4.000%, 01/01/2045 | | $ | 23,159 | | | $ | 22,208 | |
AL6520, 4.000%, 02/01/2045 | | | 83,392 | | | | 79,992 | |
AZ0862, 3.500%, 07/01/2045 | | | 44,172 | | | | 41,222 | |
AZ0814, 3.500%, 07/01/2045 | | | 25,799 | | | | 24,087 | |
BM1953, 3.500%, 08/01/2045 | | | 55,316 | | | | 51,938 | |
AZ4775, 3.500%, 10/01/2045 | | | 11,018 | | | | 10,280 | |
AZ4788, 4.000%, 10/01/2045 | | | 236,770 | | | | 227,117 | |
AS6311, 3.500%, 12/01/2045 | | | 16,078 | | | | 14,977 | |
CA2929, 3.500%, 12/01/2045 | | | 90,631 | | | | 84,542 | |
AS6405, 4.000%, 12/01/2045 | | | 184,812 | | | | 177,220 | |
AS6464, 3.500%, 01/01/2046 | | | 21,573 | | | | 20,079 | |
BC4114, 3.500%, 02/01/2046 | | | 129,614 | | | | 120,737 | |
AL8219, 4.000%, 02/01/2046 | | | 190,002 | | | | 183,572 | |
AL8387, 4.000%, 03/01/2046 | | | 468,775 | | | | 449,699 | |
FM1370, 3.000%, 04/01/2046 | | | 32,253 | | | | 29,210 | |
BC0793, 3.500%, 04/01/2046 | | | 108,037 | | | | 100,655 | |
AS7200, 4.500%, 05/01/2046 | | | 6,409 | | | | 6,300 | |
AS7388, 3.500%, 06/01/2046 | | | 451,811 | | | | 421,679 | |
AL8735, 4.000%, 06/01/2046 | | | 110,591 | | | | 106,082 | |
AS7580, 3.000%, 07/01/2046 | | | 101,961 | | | | 91,834 | |
AS7801, 3.500%, 08/01/2046 | | | 95,008 | | | | 88,133 | |
MA2737, 3.000%, 09/01/2046 | | | 571,558 | | | | 514,376 | |
MA2771, 3.000%, 10/01/2046 | | | 86,246 | | | | 77,587 | |
AS8056, 3.000%, 10/01/2046 | | | 56,577 | | | | 50,876 | |
BM3932, 3.500%, 10/01/2046 | | | 79,321 | | | | 73,765 | |
AS8269, 3.000%, 11/01/2046 | | | 72,650 | | | | 65,303 | |
MA2872, 4.500%, 01/01/2047 | | | 59,269 | | | | 58,168 | |
AS8700, 4.500%, 01/01/2047 | | | 23,227 | | | | 22,829 | |
BE5475, 3.500%, 02/01/2047 | | | 36,931 | | | | 34,185 | |
AL9879, 3.500%, 02/01/2047 | | | 1,349,741 | | | | 1,253,120 | |
FM4894, 4.000%, 03/01/2047 | | | 429,609 | | | | 411,963 | |
AS8982, 4.500%, 03/01/2047 | | | 7,796 | | | | 7,654 | |
FM1000, 3.000%, 04/01/2047 | | | 205,288 | | | | 184,027 | |
CA5843, 3.000%, 04/01/2047 | | | 113,402 | | | | 102,341 | |
MA2959, 3.500%, 04/01/2047 | | | 77,837 | | | | 71,799 | |
BM5784, 3.500%, 05/01/2047 | | | 97,215 | | | | 90,305 | |
BM5348, 3.500%, 05/01/2047 | | | 44,678 | | | | 41,468 | |
BM5347, 3.500%, 05/01/2047 | | | 88,328 | | | | 82,028 | |
AS9536, 3.500%, 05/01/2047 | | | 39,630 | | | | 36,742 | |
MA3008, 4.500%, 05/01/2047 | | | 16,173 | | | | 15,744 | |
AS9829, 3.500%, 06/01/2047 | | | 36,199 | | | | 33,531 | |
AS9831, 4.000%, 06/01/2047 | | | 52,315 | | | | 50,025 | |
BE3702, 4.000%, 06/01/2047 | | | 46,988 | | | | 44,941 | |
BM5179, 3.000%, 07/01/2047 | | | 65,953 | | | | 59,450 | |
BE3767, 3.500%, 07/01/2047 | | | 45,673 | | | | 42,321 | |
CA0062, 4.000%, 07/01/2047 | | | 40,319 | | | | 38,517 | |
MA3121, 4.000%, 09/01/2047 | | | 490,010 | | | | 468,261 | |
FM4019, 3.500%, 10/01/2047 | | | 415,864 | | | | 384,708 | |
CA0559, 4.500%, 10/01/2047 | | | 49,788 | | | | 48,882 | |
FM1467, 3.000%, 12/01/2047 | | | 64,675 | | | | 58,759 | |
BH7058, 3.500%, 12/01/2047 | | | 116,019 | | | | 107,212 | |
MA3210, 3.500%, 12/01/2047 | | | 107,108 | | | | 99,311 | |
FM2897, 3.000%, 02/01/2048 | | | 204,041 | | | | 183,894 | |
CA4140, 3.000%, 02/01/2048 | | | 64,900 | | | | 58,131 | |
The accompanying notes are an integral part of these financial statements.
30
PMC CORE FIXED INCOME FUND | Schedule of Investments |
February 28, 2023 (Unaudited) (Continued)
| | | | | | | | |
| | |
| | | Principal
Amount
| | | Value
| |
CA1535, 3.500%, 02/01/2048 | | $ | 22,096 | | | $ | 20,446 | |
BJ8783, 3.500%, 02/01/2048 | | | 67,783 | | | | 62,703 | |
MA3278, 4.500%, 02/01/2048 | | | 208,350 | | | | 203,634 | |
CA1218, 4.500%, 02/01/2048 | | | 35,157 | | | | 34,316 | |
FM5923, 3.500%, 03/01/2048 | | | 565,394 | | | | 523,329 | |
BM3590, 3.500%, 03/01/2048 | | | 83,958 | | | | 77,691 | |
BJ0648, 3.500%, 03/01/2048 | | | 45,139 | | | | 41,763 | |
BJ0650, 3.500%, 03/01/2048 | | | 48,214 | | | | 44,608 | |
BM3900, 4.000%, 04/01/2048 | | | 85,668 | | | | 81,711 | |
CA1710, 4.500%, 05/01/2048 | | | 61,178 | | | | 59,888 | |
FM2385, 3.000%, 09/01/2048 | | | 124,130 | | | | 111,131 | |
FM1572, 3.000%, 09/01/2048 | | | 204,953 | | | | 184,551 | |
BM5024, 3.000%, 11/01/2048 | | | 54,652 | | | | 48,868 | |
FM2915, 3.000%, 11/01/2048 | | | 446,396 | | | | 404,407 | |
FM1239, 3.500%, 11/01/2048 | | | 72,123 | | | | 66,705 | |
FM5108, 3.500%, 11/01/2048 | | | 586,854 | | | | 544,842 | |
FM2239, 3.000%, 12/01/2048 | | | 110,239 | | | | 98,971 | |
CA2922, 3.000%, 12/01/2048 | | | 181,565 | | | | 162,234 | |
FM1051, 4.500%, 05/01/2049 | | | 147,412 | | | | 144,509 | |
FM4895, 4.000%, 06/01/2049 | | | 372,561 | | | | 355,871 | |
CA3683, 4.500%, 06/01/2049 | | | 51,644 | | | | 50,573 | |
BO2201, 3.000%, 09/01/2049 | | | 153,622 | | | | 136,406 | |
CA4571, 4.000%, 11/01/2049 | | | 359,532 | | | | 340,236 | |
BO8947, 3.000%, 01/01/2050 | | | 81,836 | | | | 72,751 | |
BO6164, 3.000%, 01/01/2050 | | | 67,241 | | | | 59,809 | |
FM3619, 4.500%, 01/01/2050 | | | 94,000 | | | | 91,235 | |
BP2099, 3.000%, 02/01/2050 | | | 338,605 | | | | 301,183 | |
BP1424, 3.000%, 03/01/2050 | | | 127,532 | | | | 113,063 | |
FM7592, 3.500%, 03/01/2050 | | | 569,697 | | | | 524,509 | |
FM4334, 3.000%, 04/01/2050 | | | 173,894 | | | | 154,676 | |
CA5519, 3.000%, 04/01/2050 | | | 73,999 | | | | 65,698 | |
CA5559, 3.500%, 04/01/2050 | | | 578,649 | | | | 531,865 | |
MA3992, 3.500%, 04/01/2050 | | | 143,710 | | | | 132,133 | |
CA5670, 3.000%, 05/01/2050 | | | 118,767 | | | | 105,235 | |
CA5668, 3.000%, 05/01/2050 | | | 280,587 | | | | 248,996 | |
CA6086, 3.000%, 06/01/2050 | | | 1,125,452 | | | | 1,002,260 | |
BP6466, 3.000%, 07/01/2050 | | | 184,311 | | | | 163,407 | |
CA6291, 3.000%, 07/01/2050 | | | 81,536 | | | | 72,255 | |
BP6481, 4.500%, 07/01/2050 | | | 34,639 | | | | 33,733 | |
BQ0239, 2.500%, 08/01/2050 | | | 187,593 | | | | 161,289 | |
BQ0188, 3.000%, 08/01/2050 | | | 99,380 | | | | 88,067 | |
BP6716, 2.500%, 09/01/2050 | | | 342,192 | | | | 291,138 | |
BK3044, 2.500%, 09/01/2050 | | | 322,690 | | | | 274,613 | |
MA4121, 3.000%, 09/01/2050 | | | 547,583 | | | | 487,830 | |
FM9143, 4.500%, 09/01/2050 | | | 129,306 | | | | 126,450 | |
MA4160, 3.000%, 10/01/2050 | | | 464,130 | | | | 411,106 | |
MA4170, 4.500%, 10/01/2050 | | | 292,557 | | | | 284,962 | |
FM7475, 4.500%, 10/01/2050 | | | 21,814 | | | | 21,360 | |
FM5316, 2.000%, 12/01/2050 | | | 190,315 | | | | 155,690 | |
MA4208, 2.000%, 12/01/2050 | | | 2,386,801 | | | | 1,953,563 | |
MA4237, 2.000%, 01/01/2051 | | | 200,357 | | | | 163,968 | |
BR1269, 2.500%, 01/01/2051 | | | 754,440 | | | | 648,399 | |
MA4256, 2.500%, 02/01/2051 | | | 672,569 | | | | 570,207 | |
MA4282, 2.500%, 03/01/2051 | | | 428,489 | | | | 363,011 | |
The accompanying notes are an integral part of these financial statements.
31
PMC CORE FIXED INCOME FUND | Schedule of Investments |
February 28, 2023 (Unaudited) (Continued)
| | | | | | | | |
| | |
| | | Principal
Amount
| | | Value
| |
BR7795, 2.500%, 04/01/2051 | | $ | 694,330 | | | $ | 589,874 | |
MA4306, 2.500%, 04/01/2051 | | | 276,424 | | | | 234,583 | |
MA4307, 3.000%, 04/01/2051 | | | 809,725 | | | | 715,622 | |
MA4325, 2.000%, 05/01/2051 | | | 693,880 | | | | 567,281 | |
FM7189, 2.500%, 05/01/2051 | | | 489,005 | | | | 415,438 | |
BT2488, 2.500%, 05/01/2051 | | | 431,008 | | | | 366,026 | |
MA4326, 2.500%, 05/01/2051 | | | 456,629 | | | | 387,932 | |
FM7738, 2.500%, 06/01/2051 | | | 491,222 | | | | 419,204 | |
MA4356, 2.500%, 06/01/2051 | | | 909,058 | | | | 772,154 | |
BT0417, 2.500%, 06/01/2051 | | | 296,869 | | | | 252,067 | |
MA4378, 2.000%, 07/01/2051 | | | 654,165 | | | | 534,603 | |
BT1339, 2.500%, 07/01/2051 | | | 759,285 | | | | 644,939 | |
FS1550, 2.500%, 07/01/2051 | | | 344,084 | | | | 292,807 | |
CB1038, 2.500%, 07/01/2051 | | | 322,566 | | | | 273,935 | |
CB1027, 2.500%, 07/01/2051 | | | 260,142 | | | | 220,826 | |
FM8178, 2.500%, 07/01/2051 | | | 795,704 | | | | 675,447 | |
MA4379, 2.500%, 07/01/2051 | | | 358,292 | | | | 304,277 | |
MA4380, 3.000%, 07/01/2051 | | | 795,310 | | | | 702,053 | |
MA4399, 2.500%, 08/01/2051 | | | 2,369,289 | | | | 2,011,730 | |
BT3273, 2.500%, 08/01/2051 | | | 773,037 | | | | 656,131 | |
FM8422, 2.500%, 08/01/2051 | | | 763,671 | | | | 648,643 | |
FM8360, 2.500%, 08/01/2051 | | | 359,078 | | | | 305,502 | |
MA4401, 3.500%, 08/01/2051 | | | 234,872 | | | | 214,595 | |
BT7263, 2.500%, 09/01/2051 | | | 462,172 | | | | 392,557 | |
MA4437, 2.000%, 10/01/2051 | | | 343,839 | | | | 280,337 | |
CB2852, 2.000%, 11/01/2051 | | | 1,333,305 | | | | 1,089,414 | |
MA4465, 2.000%, 11/01/2051 | | | 92,630 | | | | 75,654 | |
MA4493, 2.500%, 12/01/2051 | | | 435,365 | | | | 369,385 | |
FS0121, 2.000%, 01/01/2052 | | | 562,623 | | | | 460,325 | |
CB2548, 2.500%, 01/01/2052 | | | 139,717 | | | | 118,838 | |
BV4119, 2.500%, 03/01/2052 | | | 510,386 | | | | 433,077 | |
BV4139, 2.500%, 03/01/2052 | | | 206,892 | | | | 176,226 | |
MA4600, 3.500%, 05/01/2052 | | | 478,121 | | | | 435,918 | |
CB3622, 4.000%, 05/01/2052 | | | 479,881 | | | | 451,259 | |
BU8667, 4.000%, 05/01/2052 | | | 551,626 | | | | 518,894 | |
MA4626, 4.000%, 06/01/2052 | | | 695,078 | | | | 653,044 | |
CB3914, 4.000%, 06/01/2052 | | | 523,640 | | | | 491,919 | |
BV2558, 5.000%, 06/01/2052 | | | 691,126 | | | | 680,058 | |
BV2634, 4.000%, 07/01/2052 | | | 531,203 | | | | 498,859 | |
MA4656, 4.500%, 07/01/2052 | | | 335,122 | | | | 323,143 | |
BV2623, 4.500%, 07/01/2052 | | | 266,759 | | | | 257,209 | |
BW0036, 4.500%, 07/01/2052 | | | 410,297 | | | | 397,064 | |
FS2603, 4.500%, 08/01/2052 | | | 685,134 | | | | 660,589 | |
CB4404, 5.000%, 08/01/2052 | | | 715,288 | | | | 703,686 | |
BV7959, 5.000%, 08/01/2052 | | | 723,840 | | | | 712,299 | |
BV8055, 4.500%, 09/01/2052 | | | 695,668 | | | | 670,762 | |
BW6232, 5.000%, 09/01/2052 | | | 892,234 | | | | 877,829 | |
BW1201, 5.000%, 09/01/2052 | | | 779,139 | | | | 766,590 | |
MA4785, 5.000%, 10/01/2052 | | | 729,792 | | | | 717,936 | |
FS3642, 5.000%, 11/01/2052 | | | 346,840 | | | | 341,259 | |
MA4842, 5.500%, 12/01/2052 | | | 1,128,081 | | | | 1,128,171 | |
MA4868, 0.000%, 01/01/2053 | | | 669,336 | | | | 658,463 | |
MA4919, 5.500%, 02/01/2053 | | | 647,013 | | | | 646,651 | |
MA4941, 5.500%, 03/01/2053 | | | 700,000 | | | | 700,034 | |
The accompanying notes are an integral part of these financial statements.
32
PMC CORE FIXED INCOME FUND | Schedule of Investments |
February 28, 2023 (Unaudited) (Continued)
| | | | | | | | |
| | |
| | | Principal
Amount
| | | Value
| |
Fannie Mae Principal Strip | | | | | | | | |
0.000%, 07/15/2037 | | $ | 1,370,000 | | | $ | 710,020 | |
Fannie Mae REMICS | | | | | | | | |
2012-70, 1.383% (1 Month LIBOR USD + 6.000%), 07/25/2042(c)(e) | | | 903,910 | | | | 95,572 | |
2012-68, 1.433% (1 Month LIBOR USD + 6.050%), 07/25/2042(c)(e) | | | 1,493,297 | | | | 146,286 | |
2013-6, 1.483% (1 Month LIBOR USD + 6.100%), 02/25/2043(c)(e) | | | 960,411 | | | | 105,326 | |
2013-18, 1.483% (1 Month LIBOR USD + 6.100%), 03/25/2043(c)(e) | | | 1,046,270 | | | | 103,264 | |
2014-90, 1.533% (1 Month LIBOR USD + 6.150%), 01/25/2045(c)(e) | | | 1,603,339 | | | | 181,713 | |
2015-32, 1.583% (1 Month LIBOR USD + 6.200%), 05/25/2045(c)(e) | | | 930,062 | | | | 101,933 | |
2016-40, 1.233% (1 Month LIBOR USD + 5.850%), 07/25/2046(c)(e) | | | 605,194 | | | | 56,452 | |
2018-07, 4.000%, 02/25/2048(e) | | | 1,189,903 | | | | 225,558 | |
2020-52, 4.500%, 08/25/2050(e) | | | 1,092,525 | | | | 229,420 | |
Freddie Mac Gold Pool | | | | | | | | |
G1-3122, 5.000%, 04/01/2023 | | | 8 | | | | 8 | |
G1-4953, 3.500%, 01/01/2029 | | | 14,260 | | | | 13,727 | |
A8-6315, 4.500%, 05/01/2039 | | | 14,001 | | | | 13,876 | |
A8-6521, 4.500%, 05/01/2039 | | | 28,005 | | | | 27,840 | |
A9-3617, 4.500%, 08/01/2040 | | | 2,377 | | | | 2,363 | |
Q0-0285, 4.500%, 04/01/2041 | | | 3,599 | | | | 3,578 | |
Q0-0876, 4.500%, 05/01/2041 | | | 23,134 | | | | 22,998 | |
Q0-2173, 4.500%, 07/01/2041 | | | 16,026 | | | | 15,931 | |
Q0-3705, 4.000%, 10/01/2041 | | | 16,773 | | | | 16,209 | |
C0-3795, 3.500%, 04/01/2042 | | | 112,395 | | | | 105,662 | |
Q0-9004, 3.500%, 06/01/2042 | | | 10,386 | | | | 9,764 | |
C0-9004, 3.500%, 07/01/2042 | | | 11,019 | | | | 10,359 | |
Q0-9896, 3.500%, 08/01/2042 | | | 14,065 | | | | 13,222 | |
Q1-1348, 3.500%, 09/01/2042 | | | 29,430 | | | | 27,654 | |
Q1-8305, 3.500%, 05/01/2043 | | | 12,210 | | | | 11,465 | |
Q1-9475, 3.500%, 06/01/2043 | | | 20,690 | | | | 19,427 | |
G6-0030, 3.500%, 07/01/2043 | | | 65,202 | | | | 61,282 | |
Q2-0780, 3.500%, 08/01/2043 | | | 25,841 | | | | 24,260 | |
Q2-0857, 3.500%, 08/01/2043 | | | 16,045 | | | | 15,075 | |
G0-7459, 3.500%, 08/01/2043 | | | 13,127 | | | | 12,329 | |
G0-8541, 3.500%, 08/01/2043 | | | 22,994 | | | | 21,590 | |
V8-0509, 4.000%, 10/01/2043 | | | 13,714 | | | | 13,171 | |
G0-8558, 4.000%, 11/01/2043 | | | 15,145 | | | | 14,540 | |
Q2-6367, 4.000%, 05/01/2044 | | | 4,208 | | | | 4,053 | |
Q2-6513, 4.500%, 06/01/2044 | | | 11,716 | | | | 11,562 | |
Q2-9916, 4.000%, 11/01/2044 | | | 17,245 | | | | 16,561 | |
Q4-5219, 3.500%, 01/01/2045 | | | 78,955 | | | | 73,896 | |
G0-7961, 3.500%, 03/01/2045 | | | 17,887 | | | | 16,748 | |
G0-8633, 4.000%, 03/01/2045 | | | 33,772 | | | | 32,422 | |
G0-8636, 3.500%, 04/01/2045 | | | 20,745 | | | | 19,381 | |
G0-8637, 4.000%, 04/01/2045 | | | 17,112 | | | | 16,428 | |
Q3-3869, 4.000%, 06/01/2045 | | | 11,692 | | | | 11,101 | |
Q3-5225, 3.500%, 08/01/2045 | | | 10,284 | | | | 9,606 | |
G0-8659, 3.500%, 08/01/2045 | | | 56,981 | | | | 53,182 | |
V8-1873, 4.000%, 08/01/2045 | | | 14,950 | | | | 14,352 | |
G0-8660, 4.000%, 08/01/2045 | | | 67,433 | | | | 64,799 | |
G0-8672, 4.000%, 10/01/2045 | | | 11,423 | | | | 10,974 | |
V8-1992, 4.000%, 10/01/2045 | | | 207,484 | | | | 198,072 | |
G0-8676, 3.500%, 11/01/2045 | | | 24,786 | | | | 23,141 | |
G6-0480, 4.500%, 11/01/2045 | | | 10,022 | | | | 9,879 | |
G0-8681, 3.500%, 12/01/2045 | | | 18,377 | | | | 17,137 | |
The accompanying notes are an integral part of these financial statements.
33
PMC CORE FIXED INCOME FUND | Schedule of Investments |
February 28, 2023 (Unaudited) (Continued)
| | | | | | | | |
| | |
| | | Principal
Amount
| | | Value
| |
G0-8682, 4.000%, 12/01/2045 | | $ | 22,907 | | | $ | 21,991 | |
Q3-8473, 4.000%, 01/01/2046 | | | 22,785 | | | | 21,874 | |
Q3-9644, 3.500%, 03/01/2046 | | | 85,082 | | | | 79,344 | |
Q3-9434, 3.500%, 03/01/2046 | | | 3,858 | | | | 3,598 | |
G0-8693, 3.500%, 03/01/2046 | | | 4,108 | | | | 3,828 | |
G0-8699, 4.000%, 03/01/2046 | | | 35,712 | | | | 34,284 | |
G0-8702, 3.500%, 04/01/2046 | | | 42,212 | | | | 39,310 | |
G0-8706, 3.500%, 05/01/2046 | | | 19,376 | | | | 18,188 | |
Q4-0375, 3.500%, 05/01/2046 | | | 27,786 | | | | 25,868 | |
Q4-0718, 3.500%, 05/01/2046 | | | 122,069 | | | | 113,614 | |
G0-8708, 4.500%, 05/01/2046 | | | 26,827 | | | | 26,429 | |
Q4-1208, 3.500%, 06/01/2046 | | | 60,396 | | | | 56,309 | |
Q4-5458, 4.000%, 08/01/2046 | | | 60,426 | | | | 58,009 | |
G0-8721, 3.000%, 09/01/2046 | | | 41,416 | | | | 37,313 | |
G0-8735, 4.500%, 10/01/2046 | | | 37,044 | | | | 36,425 | |
G0-8741, 3.000%, 01/01/2047 | | | 757,712 | | | | 681,546 | |
G0-8743, 4.000%, 01/01/2047 | | | 33,668 | | | | 32,266 | |
Q4-6279, 3.500%, 02/01/2047 | | | 46,885 | | | | 43,577 | |
Q4-6539, 4.500%, 03/01/2047 | | | 3,425 | | | | 3,337 | |
G0-8757, 3.500%, 04/01/2047 | | | 7,792 | | | | 7,234 | |
G0-8759, 4.500%, 04/01/2047 | | | 12,564 | | | | 12,342 | |
V8-3204, 4.500%, 05/01/2047 | | | 29,894 | | | | 29,191 | |
Q4-9100, 4.000%, 07/01/2047 | | | 73,440 | | | | 70,275 | |
Q4-9394, 4.500%, 07/01/2047 | | | 67,247 | | | | 65,987 | |
Q4-9888, 3.500%, 08/01/2047 | | | 40,353 | | | | 37,433 | |
Q5-0035, 3.500%, 08/01/2047 | | | 58,540 | | | | 54,320 | |
Q5-0109, 3.500%, 08/01/2047 | | | 8,607 | | | | 7,983 | |
G6-1228, 4.000%, 08/01/2047 | | | 111,551 | | | | 107,635 | |
G0-8779, 3.500%, 09/01/2047 | | | 166,979 | | | | 152,753 | |
G0-8785, 4.000%, 10/01/2047 | | | 85,933 | | | | 81,565 | |
Q5-2319, 3.500%, 11/01/2047 | | | 128,911 | | | | 119,443 | |
G6-1631, 3.500%, 11/01/2047 | | | 153,484 | | | | 142,662 | |
G6-1467, 4.000%, 11/01/2047 | | | 110,158 | | | | 104,555 | |
G6-1281, 3.500%, 01/01/2048 | | | 72,633 | | | | 67,298 | |
G0-8800, 3.500%, 02/01/2048 | | | 98,294 | | | | 91,018 | |
Q5-4463, 4.000%, 02/01/2048 | | | 55,427 | | | | 53,180 | |
G6-7710, 3.500%, 03/01/2048 | | | 137,480 | | | | 126,985 | |
Freddie Mac Multifamily Structured Pass Through Certificates | | | | | | | | |
K-098, 1.392%, 08/25/2029(d)(e) | | | 1,985,000 | | | | 148,438 | |
Freddie Mac Pool | | | | | | | | |
ZS-9972, 3.000%, 03/01/2042 | | | 704,269 | | | | 637,811 | |
ZM-0630, 4.000%, 01/01/2046 | | | 238,890 | | | | 229,077 | |
ZT-0390, 4.000%, 03/01/2046 | | | 89,489 | | | | 86,076 | |
ZM-1590, 3.000%, 08/01/2046 | | | 510,927 | | | | 458,181 | |
SD-0035, 3.000%, 04/01/2047 | | | 453,213 | | | | 410,561 | |
ZM-4908, 3.500%, 11/01/2047 | | | 206,257 | | | | 190,886 | |
ZA-5250, 4.000%, 01/01/2048 | | | 188,585 | | | | 180,594 | |
ZS-4759, 3.500%, 03/01/2048 | | | 125,852 | | | | 116,433 | |
ZM-6197, 4.000%, 04/01/2048 | | | 443,964 | | | | 424,402 | |
SD-0298, 3.000%, 11/01/2048 | | | 320,261 | | | | 288,657 | |
ZN-2103, 4.500%, 12/01/2048 | | | 30,335 | | | | 29,708 | |
ZA-7141, 3.000%, 06/01/2049 | | | 64,785 | | | | 57,621 | |
SD-8005, 3.500%, 08/01/2049 | | | 583,309 | | | | 537,334 | |
SD-8013, 4.500%, 09/01/2049 | | | 87,193 | | | | 85,231 | |
The accompanying notes are an integral part of these financial statements.
34
PMC CORE FIXED INCOME FUND | Schedule of Investments |
February 28, 2023 (Unaudited) (Continued)
| | | | | | | | |
| | |
| | | Principal
Amount
| | | Value
| |
SI-2009, 3.000%, 10/01/2049 | | $ | 388,059 | | | $ | 345,187 | |
QA-5549, 3.000%, 12/01/2049 | | | 211,332 | | | | 187,699 | |
QA-7325, 3.000%, 02/01/2050 | | | 162,649 | | | | 144,665 | |
QA-6750, 3.000%, 02/01/2050 | | | 122,405 | | | | 109,145 | |
QA-8311, 3.000%, 03/01/2050 | | | 189,697 | | | | 170,162 | |
SD-8068, 3.000%, 06/01/2050 | | | 530,994 | | | | 471,528 | |
RA-2970, 2.500%, 07/01/2050 | | | 176,776 | | | | 150,883 | |
SD-8074, 3.000%, 07/01/2050 | | | 77,960 | | | | 69,275 | |
SD-8075, 3.500%, 07/01/2050 | | | 450,206 | | | | 414,064 | |
QB-2682, 2.500%, 08/01/2050 | | | 133,081 | | | | 113,237 | |
SD-8084, 3.000%, 08/01/2050 | | | 228,377 | | | | 202,383 | |
SD-8086, 4.000%, 08/01/2050 | | | 167,761 | | | | 158,823 | |
RA-3484, 3.000%, 09/01/2050 | | | 266,835 | | | | 236,146 | |
SD-8098, 2.000%, 10/01/2050 | | | 2,316,269 | | | | 1,895,832 | |
QB-4785, 2.500%, 10/01/2050 | | | 187,868 | | | | 159,835 | |
QB-6037, 2.500%, 11/01/2050 | | | 138,599 | | | | 117,903 | |
SD-8122, 2.500%, 01/01/2051 | | | 401,539 | | | | 341,581 | |
SD-8129, 2.500%, 02/01/2051 | | | 542,312 | | | | 461,537 | |
RA-4527, 2.500%, 02/01/2051 | | | 275,425 | | | | 235,080 | |
SD-8135, 2.500%, 03/01/2051 | | | 194,315 | | | | 165,352 | |
QC-0945, 2.500%, 04/01/2051 | | | 791,673 | | | | 672,767 | |
SD-8147, 2.500%, 05/01/2051 | | | 454,672 | | | | 386,240 | |
QC-2565, 2.000%, 06/01/2051 | | | 539,900 | | | | 441,224 | |
QC-4235, 2.500%, 07/01/2051 | | | 696,805 | | | | 591,359 | |
SD-8156, 2.500%, 07/01/2051 | | | 423,497 | | | | 359,624 | |
QC-3907, 2.500%, 07/01/2051 | | | 451,841 | | | | 383,551 | |
SD-8160, 2.000%, 08/01/2051 | | | 811,126 | | | | 662,711 | |
QC-5978, 2.500%, 08/01/2051 | | | 602,010 | | | | 512,399 | |
QC-6209, 2.500%, 08/01/2051 | | | 378,314 | | | | 321,245 | |
SD-8167, 2.500%, 09/01/2051 | | | 1,100,288 | | | | 933,032 | |
RA-5855, 2.500%, 09/01/2051 | | | 729,204 | | | | 618,884 | |
SD-8169, 3.500%, 09/01/2051 | | | 106,080 | | | | 96,723 | |
QC-8520, 2.500%, 10/01/2051 | | | 281,378 | | | | 238,750 | |
SD-0780, 2.500%, 12/01/2051 | | | 493,449 | | | | 418,796 | |
SD-8189, 2.500%, 01/01/2052 | | | 439,869 | | | | 373,183 | |
RA-6686, 4.000%, 01/01/2052 | | | 224,899 | | | | 211,415 | |
QD-7594, 2.500%, 02/01/2052 | | | 672,779 | | | | 573,267 | |
SD-8205, 2.500%, 04/01/2052 | | | 682,312 | | | | 578,851 | |
QE-4039, 4.000%, 06/01/2052 | | | 1,221,180 | | | | 1,147,710 | |
QE-5195, 4.000%, 06/01/2052 | | | 631,308 | | | | 593,026 | |
SD-1883, 4.000%, 06/01/2052 | | | 640,906 | | | | 602,876 | |
QE-5474, 4.000%, 07/01/2052 | | | 341,661 | | | | 320,897 | |
SD-1060, 4.000%, 07/01/2052 | | | 338,065 | | | | 318,004 | |
QE-6058, 4.500%, 07/01/2052 | | | 890,839 | | | | 858,935 | |
SD-8231, 4.500%, 07/01/2052 | | | 335,171 | | | | 323,189 | |
SD-8233, 5.000%, 07/01/2052 | | | 661,900 | | | | 651,147 | |
SD-1382, 4.000%, 08/01/2052 | | | 818,200 | | | | 769,291 | |
QE-6925, 4.500%, 08/01/2052 | | | 259,390 | | | | 250,104 | |
SD-1576, 5.000%, 08/01/2052 | | | 926,858 | | | | 911,944 | |
SD-1803, 0.000%, 09/01/2052 | | | 323,235 | | | | 324,436 | |
QE-9381, 4.000%, 09/01/2052 | | | 879,978 | | | | 826,404 | |
SD-1709, 5.500%, 09/01/2052 | | | 815,685 | | | | 818,055 | |
SD-8258, 5.000%, 10/01/2052 | | | 678,414 | | | | 667,393 | |
SD-1719, 5.500%, 10/01/2052 | | | 862,198 | | | | 865,987 | |
The accompanying notes are an integral part of these financial statements.
35
PMC CORE FIXED INCOME FUND | Schedule of Investments |
February 28, 2023 (Unaudited) (Continued)
| | | | | | | | |
| | |
| | | Principal
Amount
| | | Value
| |
SD-1884, 5.000%, 11/01/2052 | | $ | 108,006 | | | $ | 106,285 | |
SD-1913, 5.000%, 11/01/2052 | | | 423,450 | | | | 416,833 | |
SD-8268, 5.500%, 11/01/2052 | | | 389,320 | | | | 389,356 | |
SD-8288, 5.000%, 01/01/2053 | | | 941,094 | | | | 925,805 | |
QF-6551, 5.500%, 01/01/2053 | | | 647,282 | | | | 647,141 | |
SD-8289, 5.500%, 01/01/2053 | | | 644,500 | | | | 644,149 | |
SD-2174, 6.000%, 01/01/2053 | | | 595,687 | | | | 604,516 | |
SD-8300, 5.500%, 02/01/2053 | | | 154,368 | | | | 154,282 | |
Freddie Mac REMICS | | | | | | | | |
4121, 1.612% (1 Month LIBOR USD + 6.200%), 10/15/2042(c)(e) | | | 911,942 | | | | 90,802 | |
4122, 4.000%, 10/15/2042(e) | | | 940,704 | | | | 174,512 | |
4159, 1.562% (1 Month LIBOR USD + 6.150%), 01/15/2043(c)(e) | | | 1,745,337 | | | | 193,088 | |
4459, 4.000%, 08/15/2043(e) | | | 1,933,848 | | | | 350,379 | |
4385, 4.500%, 09/15/2044(e) | | | 188,169 | | | | 35,496 | |
4572, 1.462% (1 Month LIBOR USD + 6.050%), 04/15/2046(c)(e) | | | 416,835 | | | | 40,660 | |
4583, 1.412% (1 Month LIBOR USD + 6.000%), 05/15/2046(c)(e) | | | 427,570 | | | | 43,893 | |
4616, 1.412% (1 Month LIBOR USD + 6.000%), 09/15/2046(c)(e) | | | 999,322 | | | | 107,045 | |
4623, 1.412% (1 Month LIBOR USD + 6.000%), 10/15/2046(c)(e) | | | 926,520 | | | | 106,927 | |
4648, 1.412% (1 Month LIBOR USD + 6.000%), 01/15/2047(c)(e) | | | 393,229 | | | | 40,242 | |
5013, 3.000%, 09/25/2050(e) | | | 2,575,378 | | | | 374,097 | |
Freddie Mac STACR REMIC Trust | | | | | | | | |
2021-DNA7, 6.284% (SOFR30A + 1.800%), 11/25/2041(b)(c) | | | 473,000 | | | | 453,092 | |
2022-HQA1, 7.984% (SOFR30A + 3.500%), 03/25/2042(b)(c) | | | 309,000 | | | | 315,590 | |
2022-DNA2, 6.884% (SOFR30A + 2.400%), 02/25/2042(b)(c) | | | 1,650,000 | | | | 1,614,781 | |
2022-DNA3, 7.384% (SOFR30A + 2.900%), 04/25/2042(b)(c) | | | 1,162,000 | | | | 1,160,730 | |
Freddie Mac Structured Agency Credit Risk Debt Notes | | | | | | | | |
2017-HQA3, 6.967% (1 Month LIBOR USD + 2.350%), 04/25/2030(c) | | | 668,014 | | | | 673,693 | |
2018-DNA1, 6.417% (1 Month LIBOR USD + 1.800%), 07/25/2030(c) | | | 299,105 | | | | 298,219 | |
2018-HQA1, 6.917% (1 Month LIBOR USD + 2.300%), 09/25/2030(c) | | | 624,714 | | | | 630,362 | |
2019-CS03, 4.617% (1 Month LIBOR USD + 0.000%), 10/25/2032(b)(c) | | | 96,903 | | | | 96,704 | |
Ginnie Mae | | | | | | | | |
#TBA, 5.000%, 03/15/2041 | | | 1,500,000 | | | | 1,482,724 | |
#TBA, 5.500%, 10/20/2052 | | | 1,335,000 | | | | 1,340,254 | |
Ginnie Mae II Pool | | | | | | | | |
MA0699M, 3.500%, 01/20/2043 | | | 23,571 | | | | 22,238 | |
MA0783M, 3.500%, 02/20/2043 | | | 32,084 | | | | 30,269 | |
MA0934M, 3.500%, 04/20/2043 | | | 22,902 | | | | 21,606 | |
MA3663M, 3.500%, 05/20/2046 | | | 39,543 | | | | 36,970 | |
MA3803M, 3.500%, 07/20/2046 | | | 15,339 | | | | 14,324 | |
MA4510M, 3.500%, 06/20/2047 | | | 62,347 | | | | 58,209 | |
MA4586M, 3.500%, 07/20/2047 | | | 86,094 | | | | 80,409 | |
MA4652M, 3.500%, 08/20/2047 | | | 57,880 | | | | 54,019 | |
MA4900M, 3.500%, 12/20/2047 | | | 43,801 | | | | 40,905 | |
MA6542M, 3.500%, 03/20/2050 | | | 235,837 | | | | 220,542 | |
MA6600M, 3.500%, 04/20/2050 | | | 17,617 | | | | 16,362 | |
MA6601M, 4.000%, 04/20/2050 | | | 79,538 | | | | 75,811 | |
MA7138M, 3.500%, 01/20/2051 | | | 229,901 | | | | 213,440 | |
MA7192M, 2.000%, 02/20/2051 | | | 287,685 | | | | 241,894 | |
MA7193M, 2.500%, 02/20/2051 | | | 289,755 | | | | 252,096 | |
MA7254M, 2.000%, 03/20/2051 | | | 293,412 | | | | 247,614 | |
MA7255M, 2.500%, 03/20/2051 | | | 718,741 | | | | 625,239 | |
MA7311M, 2.000%, 04/20/2051 | | | 836,405 | | | | 705,419 | |
MA7312M, 2.500%, 04/20/2051 | | | 794,532 | | | | 691,535 | |
MA7367M, 2.500%, 05/20/2051 | | | 292,604 | | | | 254,228 | |
The accompanying notes are an integral part of these financial statements.
36
PMC CORE FIXED INCOME FUND | Schedule of Investments |
February 28, 2023 (Unaudited) (Continued)
| | | | | | | | |
| | |
| | | Principal
Amount
| | | Value
| |
MA7418M, 2.500%, 06/20/2051 | | $ | 611,669 | | | $ | 531,157 | |
MA7472M, 2.500%, 07/20/2051 | | | 401,532 | | | | 348,492 | |
MA7589M, 2.500%, 09/20/2051 | | | 898,176 | | | | 779,113 | |
MA7648M, 2.000%, 10/20/2051 | | | 292,948 | | | | 246,056 | |
MA7766M, 2.000%, 12/20/2051 | | | 369,447 | | | | 310,003 | |
MA8045M, 4.000%, 05/20/2052 | | | 655,606 | | | | 619,990 | |
MA8099M, 3.500%, 06/20/2052 | | | 97,194 | | | | 89,429 | |
MA8151M, 4.500%, 07/20/2052 | | | 907,546 | | | | 880,414 | |
MA8200M, 4.000%, 08/20/2052 | | | 196,958 | | | | 186,258 | |
MA8201M, 4.500%, 08/20/2052 | | | 1,158,957 | | | | 1,124,300 | |
MA8268M, 4.500%, 09/20/2052 | | | 548,590 | | | | 532,181 | |
MA8269M, 5.000%, 09/20/2052 | | | 641,982 | | | | 635,730 | |
MA8347M, 4.500%, 10/20/2052 | | | 743,028 | | | | 720,803 | |
MA8429M, 5.500%, 11/20/2052 | | | 522,038 | | | | 524,853 | |
MA8569M, 5.000%, 01/20/2053 | | | 474,009 | | | | 469,393 | |
MA8570M, 5.500%, 01/20/2053 | | | 349,399 | | | | 351,283 | |
Government National Mortgage Association | | | | | | | | |
2013-23, 3.500%, 02/20/2043(e) | | | 1,060,106 | | | | 161,667 | |
2015-162, 2.152% (1 Month LIBOR USD + 6.750%), 11/20/2045(c)(e) | | | 859,889 | | | | 109,485 | |
2018-007, 1.602% (1 Month LIBOR USD + 6.200%), 01/20/2048(c)(e) | | | 971,867 | | | | 91,894 | |
2020-173, 2.500%, 11/20/2050(e) | | | 2,276,851 | | | | 298,748 | |
2021-116, 2.500%, 06/20/2051(e) | | | 2,543,867 | | | | 336,267 | |
Uniform Mortgage Backed Securities | | | | | | | | |
#TBA, 5.000%, 03/15/2041 | | | 1,175,000 | | | | 1,154,858 | |
#TBA, 5.500%, 03/15/2041 | | | 1,795,000 | | | | 1,792,248 | |
#TBA, 6.000%, 03/15/2041 | | | 830,000 | | | | 840,035 | |
| | | | | | |
|
|
|
TOTAL AGENCY MORTGAGE BACKED SECURITIES (Cost $133,306,870) | | | | | | | 121,697,323 | |
| | | | | | |
|
|
|
| U.S. GOVERNMENT AGENCY ISSUES—0.45% | | | | | | | | |
Federal Home Loan Mortgage Corp. | | | | | | | | |
0.375%, 09/23/2025 | | | 225,000 | | | | 202,238 | |
Federal National Mortgage Association | | | | | | | | |
0.500%, 11/07/2025 | | | 255,000 | | | | 228,654 | |
0.750%, 10/08/2027 | | | 745,000 | | | | 639,268 | |
0.875%, 08/05/2030 | | | 575,000 | | | | 456,085 | |
Tennessee Valley Authority | | | | | | | | |
5.250%, 09/15/2039 | | | 320,000 | | | | 336,071 | |
| | | | | | |
|
|
|
TOTAL U.S. GOVERNMENT AGENCY ISSUES (Cost $2,179,806) | | | | | | | 1,862,316 | |
| | | | | | |
|
|
|
| U.S. GOVERNMENT NOTES/BONDS—15.31% | | | | | | | | |
United States Treasury Note/Bond | | | | | | | | |
4.500%, 11/15/2025 | | | 7,450,000 | | | | 7,437,777 | |
3.875%, 12/31/2027 | | | 14,385,000 | | | | 14,173,720 | |
3.500%, 01/31/2028 | | | 6,575,000 | | | | 6,375,179 | |
2.750%, 08/15/2032 | | | 1,380,000 | | | | 1,253,213 | |
4.125%, 11/15/2032 | | | 7,115,000 | | | | 7,222,837 | |
3.500%, 02/15/2033 | | | 7,465,000 | | | | 7,211,890 | |
4.500%, 05/15/2038 | | | 845,000 | | | | 895,518 | |
1.750%, 08/15/2041 | | | 500,000 | | | | 345,830 | |
2.375%, 02/15/2042 | | | 1,495,000 | | | | 1,148,347 | |
3.125%, 02/15/2042 | | | 1,070,000 | | | | 929,667 | |
3.250%, 05/15/2042 | | | 2,830,000 | | | | 2,497,364 | |
3.375%, 08/15/2042 | | | 1,180,000 | | | | 1,060,433 | |
3.375%, 05/15/2044 | | | 1,380,000 | | | | 1,229,089 | |
The accompanying notes are an integral part of these financial statements.
37
PMC CORE FIXED INCOME FUND | Schedule of Investments |
February 28, 2023 (Unaudited) (Continued)
| | | | | | | | |
| | |
| | | Principal
Amount
| | | Value
| |
3.125%, 08/15/2044 | | $ | 2,040,000 | | | $ | 1,741,849 | |
3.000%, 05/15/2047 | | | 1,515,000 | | | | 1,258,782 | |
3.125%, 05/15/2048 | | | 470,000 | | | | 400,060 | |
3.375%, 11/15/2048 | | | 1,985,000 | | | | 1,770,915 | |
1.875%, 11/15/2051 | | | 1,980,000 | | | | 1,281,277 | |
3.000%, 08/15/2052 | | | 5,320,000 | | | | 4,451,759 | |
| | | | | | |
|
|
|
TOTAL U.S. GOVERNMENT NOTES/BONDS (Cost $64,113,378) | | | | | | | 62,685,506 | |
| | | | | | |
|
|
|
| | |
| | | Shares
| | | | |
| EXCHANGE TRADED FUNDS—0.05% | | | | | | | | |
iShares Core U.S. Aggregate Bond ETF(f) | | | 2,294 | | | | 223,229 | |
| | | | | | |
|
|
|
TOTAL EXCHANGE TRADED FUNDS (Cost $226,723) | | | | | | | 223,229 | |
| | | | | | |
|
|
|
| INVESTMENTS PURCHASED WITH COLLATERAL FROM SECURITIES LENDING—5.19% | | | | | |
Money Market Fund—5.19% | | | | | | | | |
Mount Vernon Liquid Assets Portfolio, LLC, 4.670%(g) | | | 21,255,649 | | | | 21,255,649 | |
| | | | | | |
|
|
|
TOTAL INVESTMENTS PURCHASED WITH COLLATERAL FROM SECURITIES LENDING (Cost $21,255,649) | | | | | | | 21,255,649 | |
| | | | | | |
|
|
|
| SHORT-TERM INVESTMENTS—0.47% | | | | | | | | |
First American Government Obligations Fund, Class X, 4.368%(g) | | | 1,905,833 | | | | 1,905,833 | |
| | | | | | |
|
|
|
| TOTAL SHORT-TERM INVESTMENTS (Cost $1,905,833) | | | | | | | 1,905,833 | |
| | | | | | |
|
|
|
| Total Investments (Cost $478,914,522)—107.11% | | | | | | | 438,589,431 | |
Liabilities in Excess of Other Assets—(7.11)% | | | | (29,105,970 | ) |
| | | | | | |
|
|
|
| TOTAL NET ASSETS—100.00% | | | | | | $ | 409,483,461 | |
| | | | | | |
|
|
|
Percentages are stated as a percent of net assets.
| (a) | | Variable rate security; the rate shown represents the rate at February 28, 2023. |
| (b) | | Securities issued under Rule 144A under the Securities Act of 1933. Such securities are deemed to be liquid. |
| (c) | | Floating rate security; the rate shown represents the rate at February 28, 2023. The coupon is based on an underlying pool of loans and other conditions at the time the loans are securitized. |
| (d) | | Variable rate security; the rate shown represents the rate at February 28, 2023. The coupon is based on an underlying pool of loans and other conditions at the time the loans are securitized. |
| (e) | | Represents an interest-only security that entitles holders to receive only interest payments on underlying mortgages. |
| (f) | | All or portion of this security is out on loan as of February 28, 2023. Total value of securities out on loan is $20,809,116. |
| (g) | | The rate shown represents the seven day yield at February 28, 2023. |
| (h) | | Perpetual maturity. The date referenced is the next call date. |
Abbreviations
| # | | TBA Pool number to be announced |
The accompanying notes are an integral part of these financial statements.
38
PMC DIVERSIFIED EQUITY FUND | Schedule of Investments |
February 28, 2023 (Unaudited)
| | | | | | | | |
| | |
| | | Shares
| | | Value
| |
| COMMON STOCKS—73.17% | | | | | | | | |
Accommodation—0.16% | | | | | | | | |
Galaxy Entertainment Group Ltd.—ADR | | | 11,334 | | | $ | 378,136 | |
Melco Resorts & Entertainment Ltd.—ADR(a) | | | 7,939 | | | | 101,460 | |
MGM Resorts International | | | 7,663 | | | | 329,586 | |
Sodexo SA—ADR | | | 33,242 | | | | 615,309 | |
Wynn Macau Ltd.—ADR(a) | | | 10,935 | | | | 113,615 | |
| | | | | | |
|
|
|
| | | | | | | | 1,538,106 | |
| | | | | | |
|
|
|
Administrative and Support Services—1.74% | | | | | | | | |
ABM Industries, Inc.(c) | | | 6,173 | | | | 298,835 | |
ABN AMRO Bank NV—ADR | | | 81,960 | | | | 1,442,496 | |
AdaptHealth Corp.(a)(c) | | | 8,866 | | | | 141,767 | |
ADT, Inc.(c) | | | 3,635 | | | | 27,408 | |
AMN Healthcare Services, Inc.(a)(c) | | | 3,103 | | | | 279,301 | |
AMTD IDEA Group—ADR(a)(c) | | | 111,387 | | | | 174,878 | |
Brambles Ltd.—ADR | | | 78,851 | | | | 1,377,527 | |
Conduent, Inc.(a) | | | 9,388 | | | | 37,364 | |
Deutsche Post AG—ADR | | | 22,128 | | | | 939,997 | |
DiDi Global, Inc.—ADR(a) | | | 44,968 | | | | 178,973 | |
DouYu International Holdings Ltd.—ADR(a) | | | 88,252 | | | | 110,315 | |
ExlService Holdings, Inc.(a) | | | 119 | | | | 19,577 | |
Fair Isaac Corp.(a)(c) | | | 834 | | | | 564,943 | |
FleetCor Technologies, Inc.(a) | | | 9,677 | | | | 2,078,523 | |
GoodRx Holdings, Inc.(a) | | | 2,458 | | | | 13,003 | |
HeadHunter Group PLC—ADR(e)(g) | | | 3,254 | | | | 48,908 | |
HUYA, Inc.—ADR(a) | | | 34,144 | | | | 146,819 | |
Jiayin Group, Inc.—ADR(a) | | | 19,969 | | | | 58,109 | |
loanDepot, Inc. | | | 5,412 | | | | 11,257 | |
MasterCard, Inc.—Class A | | | 9,460 | | | | 3,361,043 | |
Multiplan Corp.(a)(c) | | | 42,856 | | | | 43,285 | |
PDD Holdings, Inc.—ADR(a) | | | 11,839 | | | | 1,038,635 | |
Tuniu Corp.—ADR(a) | | | 13,744 | | | | 25,152 | |
Visa, Inc.(c) | | | 17,856 | | | | 3,927,249 | |
WEX, Inc.(a) | | | 1,937 | | | | 373,473 | |
ZTO Express Cayman, Inc.—ADR | | | 246 | | | | 5,919 | |
| | | | | | |
|
|
|
| | | | | | | | 16,724,756 | |
| | | | | | |
|
|
|
Air Transportation—0.30% | | | | | | | | |
Air France-KLM—ADR | | | 21,563 | | | | 40,538 | |
Cathay Pacific Airways Ltd.—ADR(a) | | | 35,151 | | | | 171,888 | |
Deutsche Lufthansa AG—ADR(a) | | | 32,004 | | | | 330,281 | |
Ryanair Holdings PLC—ADR(a) | | | 6,570 | | | | 609,499 | |
Swire Pacific Ltd.—Class A—ADR(c) | | | 87,518 | | | | 712,397 | |
United Airlines Holdings, Inc.(a) | | | 20,090 | | | | 1,043,877 | |
| | | | | | |
|
|
|
| | | | | | | | 2,908,480 | |
| | | | | | |
|
|
|
Ambulatory Health Care Services—0.16% | | | | | | | | |
Acadia Healthcare Co., Inc.(a)(c) | | | 5,349 | | | | 387,857 | |
DBV Technologies SA—ADR(a)(c) | | | 86,173 | | | | 124,951 | |
NextGen Healthcare, Inc.(a)(c) | | | 5,846 | | | | 105,871 | |
Novocure Ltd.(a)(b) | | | 2,918 | | | | 224,599 | |
Oak Street Health, Inc.(a)(c) | | | 3,613 | | | | 127,900 | |
Option Care Health, Inc.(a) | | | 10,076 | | | | 309,031 | |
Select Medical Holdings Corp.(c) | | | 4,575 | | | | 124,394 | |
The accompanying notes are an integral part of these financial statements.
39
PMC DIVERSIFIED EQUITY FUND | Schedule of Investments |
February 28, 2023 (Unaudited) (Continued)
| | | | | | | | |
| | |
| | | Shares
| | | Value
| |
Sonic Healthcare Ltd.—ADR(c) | | | 5,330 | | | $ | 116,194 | |
| | | | | | |
|
|
|
| | | | | | | | 1,520,797 | |
| | | | | | |
|
|
|
Amusement, Gambling, and Recreation Industries—0.02% | | | | | | | | |
Light & Wonder, Inc.(a) | | | 2,702 | | | | 169,172 | |
| | | | | | |
|
|
|
Animal Production and Aquaculture—0.04% | | | | | | | | |
Cal-Maine Foods, Inc.(c) | | | 5,927 | | | | 336,654 | |
Cresud SACIF y A—ADR | | | 822 | | | | 6,280 | |
| | | | | | |
|
|
|
| | | | | | | | 342,934 | |
| | | | | | |
|
|
|
Apparel Manufacturing—0.06% | | | | | | | | |
G-III Apparel Group Ltd.(a) | | | 1,666 | | | | 27,681 | |
HUGO BOSS AG—ADR | | | 16,558 | | | | 226,348 | |
Lululemon Athletica, Inc.(a) | | | 188 | | | | 58,130 | |
Ralph Lauren Corp.(c) | | | 2,180 | | | | 257,653 | |
| | | | | | |
|
|
|
| | | | | | | | 569,812 | |
| | | | | | |
|
|
|
Beverage and Tobacco Product Manufacturing—1.05% | | | | | | | | |
Altria Group, Inc. | | | 16,785 | | | | 779,328 | |
Anheuser-Busch InBev SA/NV—ADR | | | 6,380 | | | | 387,266 | |
Coca-Cola Femsa SAB de CV—ADR | | | 8,810 | | | | 634,408 | |
Embotelladora Andina SA—Class B—ADR | | | 8,592 | | | | 126,732 | |
Japan Tobacco, Inc.—ADR(c) | | | 224,430 | | | | 2,266,743 | |
Kirin Holdings Co. Ltd.—ADR | | | 127,183 | | | | 1,902,658 | |
Molson Coors Brewing Co.—Class B(c) | | | 22,546 | | | | 1,199,222 | |
PepsiCo, Inc. | | | 14,583 | | | | 2,530,588 | |
Treasury Wine Estates Ltd.—ADR | | | 29,164 | | | | 273,558 | |
| | | | | | |
|
|
|
| | | | | | | | 10,100,503 | |
| | | | | | |
|
|
|
Broadcasting (except Internet)—1.02% | | | | | | | | |
Comcast Corp.—Class A | | | 8,301 | | | | 308,548 | |
DISH Network Corp.—Class A(a)(c) | | | 32,047 | | | | 365,656 | |
Fox Corp.—Class A(c) | | | 58,601 | | | | 2,052,207 | |
Fox Corp.—Class B | | | 69,201 | | | | 2,231,732 | |
Grupo Televisa SAB—ADR | | | 15,556 | | | | 77,158 | |
ITV PLC—ADR(c) | | | 27,367 | | | | 293,648 | |
Liberty Media Corp-Liberty SiriusXM(a) | | | 17,145 | | | | 555,327 | |
Liberty Media Corp-Liberty SiriusXM(a) | | | 31,516 | | | | 1,015,445 | |
Nexstar Media Group, Inc.—Class A(c) | | | 3,535 | | | | 657,157 | |
Paramount Global—Class A(c) | | | 17,806 | | | | 437,671 | |
Sinclair Broadcast Group, Inc.—Class A(c) | | | 10,975 | | | | 178,563 | |
Sirius XM Holdings, Inc.(c) | | | 378,794 | | | | 1,662,906 | |
Tencent Music Entertainment Group—ADR(a) | | | 1,162 | | | | 8,761 | |
| | | | | | |
|
|
|
| | | | | | | | 9,844,779 | |
| | | | | | |
|
|
|
Building Material and Garden Equipment and Supplies Dealers—0.60% | | | | | | | | |
Lowe’s Companies, Inc. | | | 4,314 | | | | 887,605 | |
Snap-on, Inc.(c) | | | 19,457 | | | | 4,838,566 | |
| | | | | | |
|
|
|
| | | | | | | | 5,726,171 | |
| | | | | | |
|
|
|
Chemical Manufacturing—7.79% | | | | | | | | |
10X Genomics, Inc.(a) | | | 757 | | | | 35,973 | |
AbbVie, Inc. | | | 8,978 | | | | 1,381,714 | |
Abcam PLC—ADR(a) | | | 11,331 | | | | 163,280 | |
Air Liquide SA—ADR | | | 1,342 | | | | 42,635 | |
The accompanying notes are an integral part of these financial statements.
40
PMC DIVERSIFIED EQUITY FUND | Schedule of Investments |
February 28, 2023 (Unaudited) (Continued)
| | | | | | | | |
| | |
| | | Shares
| | | Value
| |
Alkermes PLC(a)(b) | | | 856 | | | $ | 22,889 | |
Amgen, Inc. | | | 7,212 | | | | 1,670,732 | |
Astellas Pharma, Inc.—ADR | | | 77,835 | | | | 1,089,690 | |
AstraZeneca PLC—ADR | | | 55,308 | | | | 3,604,975 | |
Bavarian Nordic A/S—ADR(a) | | | 27,985 | | | | 286,846 | |
Bayer AG—ADR | | | 181,176 | | | | 2,694,087 | |
Beiersdorf AG—ADR | | | 10,335 | | | | 246,283 | |
Biogen, Inc.(a) | | | 8,026 | | | | 2,165,896 | |
Bristol-Myers Squibb Co. | | | 65,305 | | | | 4,503,434 | |
Cellectis SA—ADR(a) | | | 26,282 | | | | 57,820 | |
CF Industries Holdings, Inc. | | | 7,376 | | | | 633,525 | |
Chugai Pharmaceutical Co. Ltd.—ADR | | | 40,570 | | | | 503,068 | |
Clinuvel Pharmaceuticals Ltd.—ADR | | | 4,395 | | | | 56,696 | |
Corcept Therapeutics, Inc.(a)(c) | | | 12,040 | | | | 250,793 | |
CSL Ltd.—ADR | | | 343 | | | | 34,183 | |
Daiichi Sankyo Co. Ltd.—ADR | | | 26,109 | | | | 824,000 | |
Dow, Inc. | | | 18,155 | | | | 1,038,466 | |
Eli Lilly & Co. | | | 5,243 | | | | 1,631,726 | |
Gilead Sciences, Inc. | | | 52,520 | | | | 4,229,436 | |
GSK PLC—ADR | | | 23,969 | | | | 821,418 | |
Halozyme Therapeutics, Inc.(a) | | | 3,593 | | | | 172,428 | |
Harmony Biosciences Holdings, Inc.(a)(c) | | | 5,293 | | | | 233,051 | |
Huntsman Corp. | | | 3,623 | | | | 106,299 | |
Hypera SA—ADR | | | 48,329 | | | | 369,717 | |
Incitec Pivot Ltd.—ADR | | | 326,848 | | | | 753,385 | |
Innoviva, Inc.(a)(c) | | | 5,570 | | | | 67,230 | |
Ironwood Pharmaceuticals, Inc.(a)(c) | | | 28,195 | | | | 317,758 | |
Jazz Pharmaceuticals PLC(a)(b) | | | 3,220 | | | | 452,088 | |
Johnson Matthey PLC—ADR | | | 6,857 | | | | 366,918 | |
Kiniksa Pharmaceuticals Ltd.(a)(b) | | | 17,985 | | | | 231,287 | |
Kose Corp.—ADR(a) | | | 9,996 | | | | 225,410 | |
Kuraray Co. Ltd.—ADR | | | 8,304 | | | | 223,336 | |
Lantheus Holdings, Inc.(a) | | | 4,179 | | | | 309,079 | |
Maravai LifeSciences Holdings, Inc.—Class A(a) | | | 2,408 | | | | 35,518 | |
Merck & Co., Inc. | | | 50,810 | | | | 5,398,055 | |
Merck KGaA—ADR | | | 2,998 | | | | 113,564 | |
Moderna, Inc.(a)(c) | | | 18,086 | | | | 2,510,518 | |
Mosaic Co.(c) | | | 16,280 | | | | 865,933 | |
Neurocrine Biosciences, Inc.(a) | | | 2,852 | | | | 294,041 | |
Novartis AG—ADR | | | 78,670 | | | | 6,617,721 | |
Novo Nordisk A/S—ADR | | | 22,659 | | | | 3,194,692 | |
Olaplex Holdings, Inc.(a)(c) | | | 188,132 | | | | 925,609 | |
Olin Corp. | | | 4,572 | | | | 264,033 | |
Ono Pharmaceutical Co. Ltd.—ADR | | | 132,905 | | | | 893,122 | |
Organon & Co.(c) | | | 6,158 | | | | 150,809 | |
Otsuka Holdings Co. Ltd.—ADR | | | 53,579 | | | | 807,971 | |
Perrigo Co. PLC(b) | | | 2,660 | | | | 100,255 | |
Pfizer, Inc. | | | 59,271 | | | | 2,404,624 | |
Prestige Consumer Healthcare, Inc.(a) | | | 5,526 | | | | 332,942 | |
QuidelOrtho Corp.(a) | | | 2,662 | | | | 231,434 | |
Regeneron Pharmaceuticals, Inc.(a) | | | 2,449 | | | | 1,862,269 | |
REGENXBIO, Inc.(a)(c) | | | 11,684 | | | | 259,969 | |
Repligen Corp.(a)(c) | | | 1,073 | | | | 187,099 | |
Sanofi—ADR | | | 68,996 | | | | 3,232,463 | |
Sasol Ltd.—ADR | | | 309 | | | | 4,465 | |
The accompanying notes are an integral part of these financial statements.
41
PMC DIVERSIFIED EQUITY FUND | Schedule of Investments |
February 28, 2023 (Unaudited) (Continued)
| | | | | | | | |
| | |
| | | Shares
| | | Value
| |
Shionogi & Co Ltd.—ADR | | | 18,538 | | | $ | 204,289 | |
Supernus Pharmaceuticals, Inc.(a)(c) | | | 10,658 | | | | 400,634 | |
Takeda Pharmaceutical Co. Ltd.—ADR | | | 169,815 | | | | 2,606,660 | |
Teva Pharmaceutical Industries Ltd.—ADR(a) | | | 83,890 | | | | 831,350 | |
Trinity Biotech PLC—ADR(a) | | | 78,537 | | | | 82,464 | |
Twist Bioscience Corp.(a) | | | 1,646 | | | | 32,031 | |
Unilever PLC—ADR | | | 50,890 | | | | 2,540,938 | |
United Therapeutics Corp.(a) | | | 2,159 | | | | 531,200 | |
Veracyte, Inc.(a)(c) | | | 12,750 | | | | 313,778 | |
Verona Pharma PLC—ADR(a) | | | 3,455 | | | | 74,075 | |
Vertex Pharmaceuticals, Inc.(a) | | | 3,674 | | | | 1,066,525 | |
Viatris, Inc. | | | 63,620 | | | | 725,268 | |
Westlake Corp.(c) | | | 7,810 | | | | 930,483 | |
Xencor, Inc.(a) | | | 2,753 | | | | 88,454 | |
Yara International ASA—ADR | | | 79,810 | | | | 1,892,295 | |
| | | | | | |
|
|
|
| | | | | | | | 74,825,101 | |
| | | | | | |
|
|
|
Clothing and Clothing Accessories Stores—0.65% | | | | | | | | |
Academy Sports & Outdoors, Inc.(c) | | | 7,305 | | | | 432,091 | |
ASOS PLC—ADR(a) | | | 29,721 | | | | 310,882 | |
Bath & Body Works, Inc. | | | 4,520 | | | | 184,732 | |
Brilliant Earth Group, Inc.(a) | | | 2,548 | | | | 13,122 | |
Buckle, Inc.(c) | | | 6,746 | | | | 275,169 | |
Burberry Group PLC—ADR | | | 40,060 | | | | 1,188,120 | |
Caleres, Inc.(c) | | | 8,907 | | | | 232,562 | |
Figs, Inc.(a) | | | 19,359 | | | | 178,296 | |
Foot Locker, Inc.(c) | | | 5,116 | | | | 223,672 | |
Guess?, Inc. | | | 7,320 | | | | 154,013 | |
Lojas Renner SA—ADR(c) | | | 3,437 | | | | 12,408 | |
Pandora A/S—ADR | | | 10,934 | | | | 258,054 | |
PRADA SpA—ADR | | | 24,051 | | | | 325,410 | |
Ross Stores, Inc. | | | 1,832 | | | | 202,509 | |
Scholastic Corp. | | | 6,720 | | | | 306,499 | |
Signet Jewelers Ltd.(b) | | | 2,529 | | | | 181,127 | |
TJX Cos., Inc. | | | 20,668 | | | | 1,583,169 | |
Urban Outfitters, Inc.(a) | | | 6,451 | | | | 173,854 | |
| | | | | | |
|
|
|
| | | | | | | | 6,235,689 | |
| | | | | | |
|
|
|
Computer and Electronic Product Manufacturing—8.24% | | | | | | | | |
Advanced Energy Industries, Inc.(c) | | | 4,744 | | | | 441,572 | |
Advantest Corp.—ADR | | | 7,862 | | | | 622,670 | |
Allegro MicroSystems, Inc.(a)(c) | | | 731 | | | | 31,930 | |
Amkor Technology, Inc.(c) | | | 13,681 | | | | 352,423 | |
Amphenol Corp.—Class A | | | 95,220 | | | | 7,381,453 | |
Analog Devices, Inc. | | | 23,749 | | | | 4,357,229 | |
Apple, Inc. | | | 17,951 | | | | 2,646,157 | |
Arista Networks, Inc.(a) | | | 8,018 | | | | 1,112,097 | |
Avanos Medical, Inc.(a) | | | 6,483 | | | | 181,978 | |
Broadcom, Inc. | | | 7,134 | | | | 4,239,665 | |
Canaan, Inc.—ADR(a)(c) | | | 304,813 | | | | 853,476 | |
ChipMOS Technologies, Inc.—ADR | | | 1,135 | | | | 26,707 | |
Cirrus Logic, Inc.(a)(c) | | | 7,184 | | | | 738,156 | |
Cisco Systems, Inc. | | | 30,101 | | | | 1,457,490 | |
Diodes, Inc.(a)(c) | | | 5,158 | | | | 472,937 | |
Dolby Laboratories, Inc.—Class A | | | 1,563 | | | | 128,604 | |
The accompanying notes are an integral part of these financial statements.
42
PMC DIVERSIFIED EQUITY FUND | Schedule of Investments |
February 28, 2023 (Unaudited) (Continued)
| | | | | | | | |
| | |
| | | Shares
| | | Value
| |
Enphase Energy, Inc.(a)(c) | | | 2,540 | | | $ | 534,746 | |
Himax Technologies, Inc.—ADR(c) | | | 76,173 | | | | 565,965 | |
Hologic, Inc.(a) | | | 16,706 | | | | 1,330,466 | |
HP, Inc. | | | 6,192 | | | | 182,788 | |
Infineon Technologies AG—ADR | | | 23,660 | | | | 838,274 | |
International Business Machines Corp. | | | 15,280 | | | | 1,975,704 | |
Jabil, Inc.(c) | | | 12,796 | | | | 1,062,452 | |
JinkoSolar Holding Co. Ltd.—ADR(a) | | | 7,213 | | | | 382,289 | |
Juniper Networks, Inc.(c) | | | 96,053 | | | | 2,956,511 | |
Keysight Technologies, Inc.(a) | | | 22,538 | | | | 3,605,177 | |
Lam Research Corp. | | | 6,015 | | | | 2,923,350 | |
Lattice Semiconductor Corp.(a) | | | 234 | | | | 19,881 | |
MACOM Technology Solutions Holdings, Inc.(a)(c) | | | 2,359 | | | | 161,686 | |
MaxLinear, Inc.(a) | | | 380 | | | | 13,000 | |
Methode Electronics, Inc. | | | 5,181 | | | | 252,470 | |
Microchip Technology, Inc. | | | 69,694 | | | | 5,647,304 | |
Micron Technology, Inc.(c) | | | 11,566 | | | | 668,746 | |
Monolithic Power Systems, Inc.(c) | | | 1,473 | | | | 713,359 | |
NetApp, Inc. | | | 10,940 | | | | 706,177 | |
Nitto Denko Corp.—ADR | | | 1,165 | | | | 35,026 | |
Northrop Grumman Corp. | | | 2,600 | | | | 1,206,686 | |
Olink Holding AB—ADR(a)(c) | | | 15,577 | | | | 365,125 | |
ON Semiconductor Corp.(a) | | | 55,794 | | | | 4,319,014 | |
Onto Innovation, Inc.(a) | | | 5,170 | | | | 426,370 | |
OSI Systems, Inc.(a) | | | 4,358 | | | | 403,333 | |
Plexus Corp.(a) | | | 1,421 | | | | 136,260 | |
Power Integrations, Inc.(c) | | | 1,968 | | | | 161,868 | |
Qorvo, Inc.(a) | | | 5,916 | | | | 596,865 | |
QUALCOMM, Inc. | | | 17,222 | | | | 2,127,434 | |
Rambus, Inc.(a)(c) | | | 2,374 | | | | 105,002 | |
Renesas Electronics Corp.—ADR(a)(c) | | | 259,935 | | | | 1,676,581 | |
Ricoh Co Ltd.—ADR(c) | | | 77,162 | | | | 601,092 | |
Rohm Co. Ltd.—ADR | | | 33,532 | | | | 1,291,653 | |
Sanmina Corp.(a)(c) | | | 14,008 | | | | 846,924 | |
Seiko Epson Corp.—ADR | | | 117,528 | | | | 798,368 | |
Semtech Corp.(a) | | | 1,903 | | | | 58,631 | |
Silicon Laboratories, Inc.(a) | | | 671 | | | | 119,794 | |
SiTime Corp.(a) | | | 446 | | | | 55,371 | |
Skyworks Solutions, Inc.(c) | | | 3,790 | | | | 422,850 | |
STMicroelectronics NV(b) | | | 56,435 | | | | 2,717,910 | |
Sumitomo Electric Industries Ltd.—ADR(c) | | | 57,515 | | | | 708,010 | |
Super Micro Computer, Inc.(a)(c) | | | 4,356 | | | | 426,757 | |
Taiwan Semiconductor Manufacturing Co. Ltd.—ADR | | | 12,188 | | | | 1,061,209 | |
TDK Corp.—ADR | | | 39,503 | | | | 1,328,091 | |
Texas Instruments, Inc. | | | 32,513 | | | | 5,574,354 | |
Trane Technologies PLC(b) | | | 248 | | | | 45,873 | |
TTM Technologies, Inc.(a)(c) | | | 10,928 | | | | 145,233 | |
United Microelectronics Corp.—ADR | | | 87,817 | | | | 713,952 | |
Universal Display Corp. | | | 879 | | | | 119,412 | |
Vishay Intertechnology, Inc.(c) | | | 23,966 | | | | 508,798 | |
VTech Holdings Ltd.—ADR(c) | | | 83,297 | | | | 455,635 | |
| | | | | | |
|
|
|
| | | | | | | | 79,144,370 | |
| | | | | | |
|
|
|
The accompanying notes are an integral part of these financial statements.
43
PMC DIVERSIFIED EQUITY FUND | Schedule of Investments |
February 28, 2023 (Unaudited) (Continued)
| | | | | | | | |
| | |
| | | Shares
| | | Value
| |
Construction of Buildings—2.13% | | | | | | | | |
ACS Actividades de Construccion y Servicios SA—ADR | | | 281,784 | | | $ | 1,690,705 | |
Barratt Developments PLC—ADR(c) | | | 51,135 | | | | 581,916 | |
DR Horton, Inc.(c) | | | 53,074 | | | | 4,908,283 | |
KB Home | | | 7,702 | | | | 271,650 | |
Kingspan Group PLC—ADR | | | 3,022 | | | | 198,757 | |
Lennar Corp.—Class A | | | 34,762 | | | | 3,362,876 | |
Lennar Corp.—Class B | | | 23,633 | | | | 1,929,871 | |
MDC Holdings, Inc.(c) | | | 1,842 | | | | 68,154 | |
Meritage Homes Corp.(a) | | | 4,173 | | | | 455,817 | |
Mitie Group PLC—ADR | | | 65,943 | | | | 255,199 | |
NVR, Inc.(a) | | | 246 | | | | 1,272,711 | |
Persimmon PLC—ADR(c) | | | 9,699 | | | | 338,883 | |
PulteGroup, Inc. | | | 72,754 | | | | 3,977,460 | |
Taylor Morrison Home Corp.(a) | | | 13,043 | | | | 467,331 | |
Toll Brothers, Inc. | | | 7,354 | | | | 440,799 | |
Tri Pointe Homes, Inc.(a) | | | 8,336 | | | | 198,730 | |
| | | | | | |
|
|
|
| | | | | | | | 20,419,142 | |
| | | | | | |
|
|
|
Couriers and Messengers—0.16% | | | | | | | | |
Air Transport Services Group, Inc.(a) | | | 7,993 | | | | 167,293 | |
United Parcel Service, Inc.—Class B(c) | | | 7,488 | | | | 1,366,486 | |
| | | | | | |
|
|
|
| | | | | | | | 1,533,779 | |
| | | | | | |
|
|
|
Credit Intermediation and Related Activities—3.30% | | | | | | | | |
Akbank TAS—ADR | | | 245,491 | | | | 429,609 | |
Ally Financial, Inc.(c) | | | 1,397 | | | | 41,980 | |
Ameris Bancorp | | | 257 | | | | 12,303 | |
ASE Technology Holding Co Ltd.—ADR(c) | | | 95,854 | | | | 687,273 | |
Associated Banc-Corp(c) | | | 527 | | | | 12,200 | |
B&M European Value Retail SA—ADR(c) | | | 1,871 | | | | 44,174 | |
Banco Bilbao Vizcaya Argentaria SA—ADR | | | 462,696 | | | | 3,590,522 | |
Banco de Chile—ADR | | | 6,736 | | | | 139,368 | |
Banco do Brasil SA—ADR | | | 94,943 | | | | 749,100 | |
Banco Santander Mexico SA Institucion de Banca Multiple Grupo Financiero Santand—ADR | | | 35,066 | | | | 232,838 | |
Banco Santander SA—ADR | | | 274,278 | | | | 1,072,427 | |
Bank Central Asia Tbk PT—ADR(c) | | | 5,478 | | | | 78,883 | |
Bank Hapoalim BM—ADR | | | 7,076 | | | | 283,041 | |
Bank Mandiri Persero Tbk PT—ADR | | | 26,646 | | | | 352,793 | |
Bank of China Ltd.—ADR | | | 152,904 | | | | 1,400,371 | |
Bank of East Asia Ltd.—ADR | | | 130,225 | | | | 177,106 | |
Barclays PLC—ADR | | | 28,690 | | | | 242,717 | |
Capital One Financial Corp. | | | 394 | | | | 42,978 | |
Commerzbank AG—ADR(a) | | | 32,217 | | | | 390,953 | |
DBS Group Holdings Ltd.—ADR | | | 327 | | | | 33,361 | |
Deutsche Bank AG(b) | | | 82,869 | | | | 1,032,548 | |
Discover Financial Services | | | 15,942 | | | | 1,785,504 | |
Encore Capital Group, Inc.(a)(c) | | | 606 | | | | 31,318 | |
FinVolution Group—ADR | | | 113,329 | | | | 574,578 | |
First Citizens BancShares, Inc.(c) | | | 133 | | | | 97,590 | |
FNB Corp/PA(c) | | | 5,793 | | | | 82,666 | |
Huntington Bancshares, Inc. | | | 7,098 | | | | 108,741 | |
ICICI Bank Ltd.—ADR | | | 39,940 | | | | 825,959 | |
LendingClub Corp.(a)(c) | | | 2,734 | | | | 25,700 | |
The accompanying notes are an integral part of these financial statements.
44
PMC DIVERSIFIED EQUITY FUND | Schedule of Investments |
February 28, 2023 (Unaudited) (Continued)
| | | | | | | | |
| | |
| | | Shares
| | | Value
| |
Mediobanca Banca di Credito Finanziario SpA—ADR | | | 81,580 | | | $ | 865,564 | |
Mr Cooper Group, Inc.(a) | | | 11,316 | | | | 525,402 | |
Nelnet, Inc.—Class A | | | 8,087 | | | | 759,127 | |
OFG Bancorp(b) | | | 7,117 | | | | 216,499 | |
OneMain Holdings, Inc.(c) | | | 6,087 | | | | 262,289 | |
Oversea-Chinese Banking Corp. Ltd.—ADR | | | 100,857 | | | | 1,891,070 | |
PennyMac Financial Services, Inc. | | | 6,599 | | | | 399,042 | |
Piraeus Financial Holdings SA—ADR | | | 77,046 | | | | 198,008 | |
Provident Financial Services, Inc. | | | 521 | | | | 12,165 | |
Regions Financial Corp.(c) | | | 2,013 | | | | 46,943 | |
Rocket Cos, Inc.—Class A(c) | | | 140,843 | | | | 1,107,026 | |
S&T Bancorp, Inc. | | | 331 | | | | 12,333 | |
Sberbank of Russia PJSC—ADR(a)(e)(g) | | | 119,989 | | | | — | |
Standard Bank Group Ltd.—ADR | | | 3,525 | | | | 35,567 | |
Standard Chartered PLC—ADR | | | 85,604 | | | | 1,611,923 | |
State Street Corp.(c) | | | 558 | | | | 49,483 | |
Svenska Handelsbanken AB—ADR | | | 107,650 | | | | 565,163 | |
Swedbank AB—ADR | | | 32,911 | | | | 670,726 | |
Synchrony Financial | | | 24,908 | | | | 889,465 | |
Turkiye Garanti Bankasi AS—ADR | | | 154,384 | | | | 208,418 | |
UBS Group AG(b) | | | 167,658 | | | | 3,651,591 | |
UniCredit SpA—ADR | | | 184,694 | | | | 1,878,338 | |
United Overseas Bank Ltd.—ADR | | | 28,514 | | | | 1,265,451 | |
| | | | | | |
|
|
|
| | | | | | | | 31,700,194 | |
| | | | | | |
|
|
|
Crop Production—0.33% | | | | | | | | |
British American Tobacco PLC—ADR | | | 81,409 | | | | 3,098,427 | |
SLC Agricola SA—ADR | | | 3,108 | | | | 28,438 | |
| | | | | | |
|
|
|
| | | | | | | | 3,126,865 | |
| | | | | | |
|
|
|
Data Processing, Hosting and Related Services—0.90% | | | | | | | | |
Automatic Data Processing, Inc. | | | 6,242 | | | | 1,372,116 | |
Chindata Group Holdings Ltd.—ADR(a) | | | 36,854 | | | | 249,502 | |
CSG Systems International, Inc. | | | 972 | | | | 54,626 | |
Fiserv, Inc.(a) | | | 52,927 | | | | 6,091,369 | |
Marqeta, Inc.(a)(c) | | | 4,734 | | | | 27,457 | |
Sciplay Corp.—Class A(a) | | | 14,117 | | | | 233,495 | |
Sohu.com Ltd.—ADR(a) | | | 34,838 | | | | 498,880 | |
TaskUS, Inc.(a) | | | 8,433 | | | | 145,090 | |
Zai Lab Ltd.—ADR(a) | | | 161 | | | | 5,981 | |
| | | | | | |
|
|
|
| | | | | | | | 8,678,516 | |
| | | | | | |
|
|
|
Educational Services—0.21% | | | | | | | | |
Adtalem Global Education, Inc.(a)(c) | | | 7,870 | | | | 307,874 | |
Graham Holdings Co.—Class B | | | 369 | | | | 231,238 | |
Grand Canyon Education, Inc.(a) | | | 2,787 | | | | 315,740 | |
Informa PLC—ADR | | | 7,090 | | | | 113,795 | |
New Oriental Education & Technology Group, Inc.—ADR(a) | | | 5,590 | | | | 216,445 | |
Strategic Education, Inc. | | | 2,665 | | | | 227,191 | |
Stride, Inc.(a)(c) | | | 3,422 | | | | 145,332 | |
Sunlands Technology Group—ADR(c) | | | 2,747 | | | | 27,140 | |
TAL Education Group—ADR(a) | | | 56,295 | | | | 395,753 | |
| | | | | | |
|
|
|
| | | | | | | | 1,980,508 | |
| | | | | | |
|
|
|
The accompanying notes are an integral part of these financial statements.
45
PMC DIVERSIFIED EQUITY FUND | Schedule of Investments |
February 28, 2023 (Unaudited) (Continued)
| | | | | | | | |
| | |
| | | Shares
| | | Value
| |
Electrical Equipment, Appliance, and Component Manufacturing—0.45% | | | | | | | | |
Acuity Brands, Inc.(c) | | | 66 | | | $ | 12,801 | |
Arcelik AS—ADR | | | 10,518 | | | | 313,436 | |
Atos SE—ADR(a) | | | 57,225 | | | | 163,097 | |
Hitachi Ltd.—ADR | | | 17,637 | | | | 1,779,397 | |
Hubbell, Inc.(c) | | | 4,212 | | | | 1,059,486 | |
Littelfuse, Inc.(c) | | | 904 | | | | 233,892 | |
Panasonic Holdings Corp.—ADR | | | 46,344 | | | | 403,657 | |
Schneider Electric SE—ADR | | | 1,102 | | | | 35,319 | |
Siemens AG—ADR | | | 4,258 | | | | 325,482 | |
| | | | | | |
|
|
|
| | | | | | | | 4,326,567 | |
| | | | | | |
|
|
|
Electronics and Appliance Stores—0.12% | | | | | | | | |
Best Buy Co., Inc.(c) | | | 9,779 | | | | 812,733 | |
Sega Sammy Holdings, Inc.—ADR | | | 84,503 | | | | 361,673 | |
| | | | | | |
|
|
|
| | | | | | | | 1,174,406 | |
| | | | | | |
|
|
|
Fabricated Metal Product Manufacturing—0.33% | | | | | | | | |
Assa Abloy AB—ADR | | | 2,913 | | | | 35,306 | |
Atkore, Inc.(a) | | | 2,848 | | | | 415,865 | |
Emerson Electric Co. | | | 4,189 | | | | 346,472 | |
Mueller Industries, Inc.(c) | | | 8,401 | | | | 621,422 | |
Nucor Corp. | | | 10,660 | | | | 1,784,910 | |
Valmont Industries, Inc. | | | 39 | | | | 12,376 | |
| | | | | | |
|
|
|
| | | | | | | | 3,216,351 | |
| | | | | | |
|
|
|
Food and Beverage Stores—0.65% | | | | | | | | |
Carrefour SA—ADR | | | 278,018 | | | | 1,106,512 | |
J Sainsbury PLC—ADR | | | 49,766 | | | | 639,493 | |
Jeronimo Martins SGPS SA—ADR | | | 15,785 | | | | 647,343 | |
Koninklijke Ahold Delhaize NV—ADR | | | 49,687 | | | | 1,578,059 | |
Kroger Co. | | | 34,506 | | | | 1,488,588 | |
Sendas Distribuidora SA—ADR | | | 1,514 | | | | 26,480 | |
Sprouts Farmers Market, Inc.(a)(c) | | | 8,566 | | | | 259,464 | |
Weis Markets, Inc.(c) | | | 6,715 | | | | 513,295 | |
| | | | | | |
|
|
|
| | | | | | | | 6,259,234 | |
| | | | | | |
|
|
|
Food Manufacturing—1.46% | | | | | | | | |
Ajinomoto Co., Inc.—ADR | | | 20,577 | | | | 629,450 | |
Archer-Daniels-Midland Co. | | | 34,393 | | | | 2,737,683 | |
Associated British Foods PLC—ADR | | | 1,748 | | | | 42,197 | |
Bunge Ltd.(b) | | | 951 | | | | 90,821 | |
Campbell Soup Co.(c) | | | 40,973 | | | | 2,151,902 | |
General Mills, Inc. | | | 35,744 | | | | 2,842,005 | |
Ingredion, Inc.(c) | | | 4,440 | | | | 441,336 | |
JBS SA—ADR | | | 708 | | | | 5,232 | |
JM Smucker Co. | | | 1,120 | | | | 165,637 | |
Kellogg Co.(c) | | | 24,762 | | | | 1,632,806 | |
Lamb Weston Holdings, Inc. | | | 485 | | | | 48,810 | |
Marfrig Global Foods SA—ADR | | | 35,477 | | | | 44,346 | |
Nestle SA—ADR | | | 19,625 | | | | 2,208,107 | |
Post Holdings, Inc.(a)(c) | | | 4,830 | | | | 434,507 | |
Premier Foods PLC—ADR | | | 26,462 | | | | 181,397 | |
Tate & Lyle PLC—ADR(c) | | | 3,857 | | | | 150,635 | |
Tyson Foods, Inc.—Class A | | | 3,099 | | | | 183,585 | |
| | | | | | |
|
|
|
| | | | | | | | 13,990,456 | |
| | | | | | |
|
|
|
The accompanying notes are an integral part of these financial statements.
46
PMC DIVERSIFIED EQUITY FUND | Schedule of Investments |
February 28, 2023 (Unaudited) (Continued)
| | | | | | | | |
| | |
| | | Shares
| | | Value
| |
Food Services and Drinking Places—0.21% | | | | | | | | |
Casey’s General Stores, Inc.(c) | | | 1,556 | | | $ | 323,570 | |
Cintas Corp. | | | 103 | | | | 45,162 | |
Darden Restaurants, Inc. | | | 9,730 | | | | 1,391,293 | |
Texas Roadhouse, Inc.(c) | | | 1,490 | | | | 151,295 | |
Yelp, Inc.(a) | | | 3,441 | | | | 103,299 | |
Yum! Brands, Inc. | | | 346 | | | | 43,997 | |
| | | | | | |
|
|
|
| | | | | | | | 2,058,616 | |
| | | | | | |
|
|
|
Funds, Trusts, and Other Financial Vehicles—0.60% | | | | | | | | |
Absa Group Ltd.—ADR(c) | | | 5,397 | | | | 116,953 | |
Coca-Cola Bottlers Japan Holdings, Inc.—ADR | | | 6,942 | | | | 36,619 | |
Dentsu Group, Inc.—ADR(c) | | | 10,411 | | | | 335,130 | |
Fast Retailing Co. Ltd.—ADR(c) | | | 14,329 | | | | 847,704 | |
Mizuho Financial Group, Inc.—ADR | | | 421,286 | | | | 1,327,050 | |
Nitori Holdings Co. Ltd.—ADR | | | 13,441 | | | | 150,674 | |
Seven & i Holdings Co. Ltd.—ADR | | | 56,502 | | | | 1,264,514 | |
Sumitomo Mitsui Financial Group, Inc.—ADR | | | 62,208 | | | | 543,076 | |
Taisho Pharmaceutical Holdings Co. Ltd.—ADR | | | 45,707 | | | | 447,472 | |
Up Fintech Holding Ltd.—ADR(a)(c) | | | 31,129 | | | | 116,111 | |
Woolworths Holdings Ltd.(b) | | | 134,415 | | | | 573,939 | |
| | | | | | |
|
|
|
| | | | | | | | 5,759,242 | |
| | | | | | |
|
|
|
Furniture and Home Furnishings Stores—0.04% | | | | | | | | |
Williams-Sonoma, Inc.(c) | | | 2,692 | | | | 336,285 | |
| | | | | | |
|
|
|
Furniture and Related Product Manufacturing—0.00% | | | | | | | | |
Natuzzi SpA—ADR(a) | | | 4,215 | | | | 25,079 | |
| | | | | | |
|
|
|
Gasoline Stations—0.23% | | | | | | | | |
Cango, Inc.—ADR | | | 8,630 | | | | 11,478 | |
Chevron Corp. | | | 13,946 | | | | 2,242,098 | |
| | | | | | |
|
|
|
| | | | | | | | 2,253,576 | |
| | | | | | |
|
|
|
General Merchandise Stores—0.71% | | | | | | | | |
BJ’s Wholesale Club Holdings, Inc.(a) | | | 868 | | | | 62,322 | |
Dillard’s, Inc.—Class A(c) | | | 580 | | | | 206,718 | |
Dollar General Corp. | | | 4,934 | | | | 1,067,224 | |
Dollar Tree, Inc.(a)(c) | | | 7,193 | | | | 1,044,999 | |
Dufry AG—ADR(a) | | | 110,753 | | | | 487,867 | |
Macy’s, Inc.(c) | | | 15,931 | | | | 325,948 | |
Marks & Spencer Group PLC—ADR(a) | | | 465,390 | | | | 1,847,598 | |
MINISO Group Holding Ltd.—ADR(c) | | | 15,214 | | | | 272,331 | |
Pan Pacific International Holdings Corp.—ADR | | | 45,074 | | | | 820,798 | |
PriceSmart, Inc. | | | 1,351 | | | | 94,192 | |
Walmart, Inc. | | | 4,121 | | | | 585,718 | |
| | | | | | |
|
|
|
| | | | | | | | 6,815,715 | |
| | | | | | |
|
|
|
Health and Personal Care Stores—0.23% | | | | | | | | |
Ulta Beauty, Inc.(a) | | | 4,220 | | | | 2,189,336 | |
| | | | | | |
|
|
|
Heavy and Civil Engineering Construction—0.01% | | | | | | | | |
Fluor Corp.(a) | | | 1,867 | | | | 68,463 | |
Skanska AB—ADR(c) | | | 1,878 | | | | 34,762 | |
| | | | | | |
|
|
|
| | | | | | | | 103,225 | |
| | | | | | |
|
|
|
The accompanying notes are an integral part of these financial statements.
47
PMC DIVERSIFIED EQUITY FUND | Schedule of Investments |
February 28, 2023 (Unaudited) (Continued)
| | | | | | | | |
| | |
| | | Shares
| | | Value
| |
Hospitals—0.10% | | | | | | | | |
Encompass Health Corp. | | | 7,810 | | | $ | 441,421 | |
HCA Healthcare, Inc. | | | 839 | | | | 204,255 | |
Nuvalent, Inc.(a) | | | 649 | | | | 19,658 | |
Universal Health Services, Inc.—Class B(c) | | | 2,156 | | | | 287,976 | |
| | | | | | |
|
|
|
| | | | | | | | 953,310 | |
| | | | | | |
|
|
|
Insurance Carriers and Related Activities—5.98% | | | | | | | | |
Aflac, Inc. | | | 64,388 | | | | 4,388,042 | |
Ageas SA/NV—ADR(c) | | | 42,765 | | | | 1,929,984 | |
AIA Group Ltd.—ADR | | | 27,095 | | | | 1,152,079 | |
American Equity Invesment Life Holding Co. | | | 7,477 | | | | 311,417 | |
American Financial Group, Inc. | | | 2,389 | | | | 320,389 | |
American International Group, Inc. | | | 40,910 | | | | 2,500,010 | |
Assicurazioni Generali SpA—ADR(c) | | | 100,593 | | | | 987,823 | |
Assured Guaranty Ltd. | | | 5,381 | | | | 335,828 | |
AXA SA—ADR | | | 128,295 | | | | 4,046,424 | |
Centene Corp.(a) | | | 5,291 | | | | 361,904 | |
Chubb Ltd. | | | 9,575 | | | | 2,020,517 | |
Cigna Corp. | | | 6,774 | | | | 1,978,685 | |
CNO Financial Group, Inc. | | | 9,156 | | | | 234,577 | |
Elevance Health, Inc. | | | 5,749 | | | | 2,700,133 | |
Enact Holdings, Inc.(c) | | | 13,829 | | | | 335,353 | |
Equitable Holdings, Inc. | | | 53,956 | | | | 1,695,298 | |
Essent Group Ltd.(b) | | | 7,210 | | | | 309,670 | |
Everest Re Group Ltd.(b) | | | 4,342 | | | | 1,667,198 | |
Genworth Financial, Inc.—Class A(a) | | | 44,999 | | | | 280,344 | |
Globe Life, Inc. | | | 7,082 | | | | 861,809 | |
Hannover Rueck SE—ADR | | | 1,027 | | | | 99,799 | |
Hartford Financial Services Group, Inc. | | | 23,193 | | | | 1,815,548 | |
Humana, Inc. | | | 2,639 | | | | 1,306,358 | |
Jackson Financial, Inc.(c) | | | 13,093 | | | | 594,160 | |
Loews Corp. | | | 20,312 | | | | 1,240,860 | |
MetLife, Inc. | | | 1,530 | | | | 109,747 | |
MGIC Investment Corp.(c) | | | 48,927 | | | | 673,236 | |
MS&AD Insurance Group Holdings, Inc.—ADR | | | 15,129 | | | | 246,300 | |
Muenchener Rueckversicherungs-Gesellschaft AG—ADR | | | 14,349 | | | | 494,467 | |
National Western Life Group, Inc.—Class A | | | 317 | | | | 85,523 | |
Nedbank Group Ltd.—ADR | | | 14,432 | | | | 181,700 | |
Old Republic International Corp.(c) | | | 23,260 | | | | 613,366 | |
Oscar Health, Inc.(a) | | | 14,965 | | | | 82,906 | |
Principal Financial Group, Inc.(c) | | | 50,304 | | | | 4,505,227 | |
Radian Group, Inc. | | | 21,385 | | | | 456,570 | |
RLI Corp.(c) | | | 1,173 | | | | 161,768 | |
Sampo OYJ—ADR | | | 49,242 | | | | 1,195,596 | |
Suncorp Group Ltd.—ADR(c) | | | 26,784 | | | | 230,878 | |
Tokio Marine Holdings, Inc.—ADR | | | 55,467 | | | | 1,176,732 | |
Travelers Companies, Inc. | | | 12,982 | | | | 2,403,228 | |
United Fire Group, Inc. | | | 5,221 | | | | 149,007 | |
UnitedHealth Group, Inc. | | | 8,380 | | | | 3,988,377 | |
Unum Group | | | 11,681 | | | | 520,389 | |
W.R. Berkley Corp. | | | 22,676 | | | | 1,500,924 | |
Willis Towers Watson PLC(b) | | | 8,294 | | | | 1,943,782 | |
Zurich Insurance Group AG—ADR | | | 67,780 | | | | 3,209,383 | |
| | | | | | |
|
|
|
| | | | | | | | 57,403,315 | |
| | | | | | |
|
|
|
The accompanying notes are an integral part of these financial statements.
48
PMC DIVERSIFIED EQUITY FUND | Schedule of Investments |
February 28, 2023 (Unaudited) (Continued)
| | | | | | | | |
| | |
| | | Shares
| | | Value
| |
Leather and Allied Product Manufacturing—0.07% | | | | | | | | |
Skechers U.S.A., Inc.—Class A(a) | | | 4,422 | | | $ | 196,823 | |
Tapestry, Inc.(c) | | | 10,833 | | | | 471,344 | |
| | | | | | |
|
|
|
| | | | | | | | 668,167 | |
| | | | | | |
|
|
|
Machinery Manufacturing—1.89% | | | | | | | | |
AGCO Corp.(c) | | | 1,101 | | | | 155,032 | |
Applied Materials, Inc.(c) | | | 16,497 | | | | 1,916,127 | |
ASML Holding NV(b) | | | 6,148 | | | | 3,797,804 | |
Canon, Inc.—ADR | | | 88,439 | | | | 1,898,785 | |
Caterpillar, Inc. | | | 2,278 | | | | 545,695 | |
Cummins, Inc.(c) | | | 1,844 | | | | 448,239 | |
Deere & Co. | | | 1,227 | | | | 514,407 | |
Disco Corp.—ADR | | | 16,927 | | | | 1,062,339 | |
Fabrinet(a)(b) | | | 4,815 | | | | 586,804 | |
KION Group AG—ADR | | | 5,246 | | | | 51,149 | |
KLA Corp. | | | 9,013 | | | | 3,419,353 | |
Komatsu Ltd.—ADR | | | 57,596 | | | | 1,377,696 | |
Konica Minolta, Inc.—ADR | | | 36,996 | | | | 320,570 | |
Nikon Corp.—ADR | | | 37,969 | | | | 372,476 | |
NOW, Inc.(a) | | | 15,414 | | | | 198,070 | |
NSK Ltd.—ADR | | | 17,266 | | | | 190,358 | |
Rheinmetall AG—ADR | | | 14,760 | | | | 751,062 | |
SMC Corp.—ADR | | | 1,353 | | | | 34,407 | |
Terex Corp.(c) | | | 269 | | | | 15,927 | |
THK Co. Ltd.—ADR | | | 24,109 | | | | 268,454 | |
Tokyo Electron Ltd.—ADR | | | 2,371 | | | | 203,479 | |
| | | | | | |
|
|
|
| | | | | | | | 18,128,233 | |
| | | | | | |
|
|
|
Management of Companies and Enterprises—3.02% | | | | | | | | |
ABB Ltd.—ADR | | | 16,476 | | | | 548,651 | |
Alibaba Group Holding Ltd.—ADR(a) | | | 22,207 | | | | 1,949,553 | |
America Movil SAB de CV—Class A—ADR | | | 3,135 | | | | 63,484 | |
America Movil SAB de CV—Class L—ADR | | | 16,984 | | | | 349,531 | |
AP Moeller—Maersk A/S—ADR | | | 72,119 | | | | 842,350 | |
ASMPT Ltd.—ADR(c) | �� | | 25,879 | | | | 663,538 | |
ATN International, Inc. | | | 1,151 | | | | 48,400 | |
Autohome, Inc.—ADR | | | 9,029 | | | | 275,385 | |
Balfour Beatty PLC—ADR | | | 56,399 | | | | 500,823 | |
BB Seguridade Participacoes SA—ADR | | | 42,175 | | | | 281,096 | |
BNP Paribas SA—ADR | | | 33,919 | | | | 1,161,047 | |
Bouygues SA—ADR | | | 92,988 | | | | 624,879 | |
Capri Holdings Ltd.(a)(b) | | | 4,304 | | | | 213,349 | |
Cie Financiere Richemont SA—ADR | | | 81,011 | | | | 1,212,735 | |
Daimler Truck Holding AG—ADR(a) | | | 2,504 | | | | 39,513 | |
Direct Line Insurance Group PLC—ADR | | | 34,441 | | | | 306,869 | |
DSV A/S—ADR | | | 12,305 | | | | 1,117,725 | |
Emeren Group Ltd.—ADR(a) | | | 33,276 | | | | 150,740 | |
Grupo Aeroportuario del Sureste SAB de CV—ADR | | | 2,008 | | | | 574,649 | |
Innovage Holding Corp.(a)(c) | | | 3,680 | | | | 27,931 | |
Ipsen SA—ADR | | | 30,650 | | | | 880,881 | |
JGC Holdings Corp.—ADR | | | 34,206 | | | | 879,094 | |
K+S AG—ADR | | | 28,811 | | | | 344,436 | |
KE Holdings, Inc.—ADR(a) | | | 13,270 | | | | 242,178 | |
Kering SA—ADR(c) | | | 7,818 | | | | 459,386 | |
The accompanying notes are an integral part of these financial statements.
49
PMC DIVERSIFIED EQUITY FUND | Schedule of Investments |
February 28, 2023 (Unaudited) (Continued)
| | | | | | | | |
| | |
| | | Shares
| | | Value
| |
KOC Holding AS—ADR | | | 13,285 | | | $ | 265,036 | |
Koninklijke Philips NV(b) | | | 2,234 | | | | 36,481 | |
Kuehne + Nagel International AG—ADR(c) | | | 25,420 | | | | 1,315,993 | |
Logitech International SA(b) | | | 15,926 | | | | 868,763 | |
LVMH Moet Hennessy Louis Vuitton SE—ADR | | | 21,454 | | | | 3,574,879 | |
LyondellBasell Industries NV—Class A(b) | | | 524 | | | | 50,299 | |
NatWest Group PLC—ADR(a)(c) | | | 40,422 | | | | 286,188 | |
POSCO Holdings, Inc.—ADR | | | 177 | | | | 10,795 | |
Prosus NV—ADR | | | 22,659 | | | | 324,703 | |
QIWI PLC—ADR(a)(e)(g) | | | 29,317 | | | | 166,227 | |
Shell PLC—ADR | | | 53,315 | | | | 3,239,953 | |
Shinhan Financial Group Co. Ltd.—ADR | | | 7,927 | | | | 232,023 | |
Sonova Holding AG—ADR | | | 715 | | | | 35,081 | |
Thales SA—ADR | | | 5,064 | | | | 141,286 | |
thyssenkrupp AG—ADR | | | 27,538 | | | | 206,673 | |
Trip.com Group Ltd.—ADR(a) | | | 1,294 | | | | 46,002 | |
Trivago NV—ADR(a) | | | 84,517 | | | | 145,369 | |
Valeo—ADR | | | 3,887 | | | | 40,619 | |
Vinci SA—ADR | | | 72,865 | | | | 2,071,188 | |
Vista Energy SAB de CV—ADR(a) | | | 22,358 | | | | 403,338 | |
Vivendi SE—ADR | | | 3,400 | | | | 34,867 | |
Wilmar International Ltd.—ADR | | | 57,938 | | | | 1,689,009 | |
Xunlei Ltd.—ADR(a) | | | 50,111 | | | | 88,696 | |
| | | | | | |
|
|
|
| | | | | | | | 29,031,691 | |
| | | | | | |
|
|
|
Merchant Wholesalers, Durable Goods—2.59% | | | | | | | | |
Allison Transmission Holdings, Inc. | | | 6,587 | | | | 312,883 | |
Arrow Electronics, Inc.(a) | | | 3,332 | | | | 393,143 | |
Avnet, Inc.(c) | | | 10,901 | | | | 487,384 | |
Beacon Roofing Supply, Inc.(a) | | | 6,335 | | | | 411,775 | |
Cars.com, Inc.(a)(c) | | | 9,656 | | | | 185,395 | |
Cie de Saint-Gobain—ADR | | | 97,556 | | | | 1,160,428 | |
Cricut, Inc. | | | 677 | | | | 7,224 | |
Ferguson PLC(b) | | | 315 | | | | 45,392 | |
Fresenius Medical Care AG & Co. KGaA—ADR | | | 1,820 | | | | 35,781 | |
Genuine Parts Co. | | | 15,118 | | | | 2,673,770 | |
Glencore PLC—ADR | | | 150,848 | | | | 1,790,566 | |
GMS, Inc.(a) | | | 6,168 | | | | 374,459 | |
Henry Schein, Inc.(a) | | | 1,651 | | | | 129,290 | |
ITOCHU Corp.—ADR | | | 34,187 | | | | 2,039,084 | |
La-Z-Boy, Inc.(c) | | | 3,036 | | | | 98,306 | |
Lenovo Group Ltd.—ADR | | | 16,004 | | | | 289,352 | |
LKQ Corp. | | | 37,329 | | | | 2,138,578 | |
Luckin Coffee, Inc.—ADR(a) | | | 13,204 | | | | 392,159 | |
Mitsui & Co. Ltd.—ADR | | | 3,197 | | | | 1,802,884 | |
ODP Corp.(a) | | | 2,737 | | | | 123,931 | |
OneConnect Financial Technology Co. Ltd.—ADR(a) | | | 700 | | | | 4,844 | |
Owens & Minor, Inc.(a)(c) | | | 4,170 | | | | 63,926 | |
Patterson Companies, Inc.(c) | | | 5,737 | | | | 152,145 | |
Prysmian SpA—ADR | | | 56,973 | | | | 1,094,166 | |
Reliance Steel & Aluminum Co. | | | 4,869 | | | | 1,206,733 | |
Rexel SA—ADR(c) | | | 43,421 | | | | 1,080,215 | |
Rush Enterprises, Inc.—Class A(c) | | | 10,785 | | | | 611,294 | |
Rush Enterprises, Inc.—Class B | | | 2,207 | | | | 132,376 | |
Sims Ltd.—ADR | | | 54,555 | | | | 581,556 | |
The accompanying notes are an integral part of these financial statements.
50
PMC DIVERSIFIED EQUITY FUND | Schedule of Investments |
February 28, 2023 (Unaudited) (Continued)
| | | | | | | | |
| | |
| | | Shares
| | | Value
| |
Smiths Group PLC—ADR | | | 39,907 | | | $ | 845,031 | |
TE Connectivity Ltd.(b) | | | 18,355 | | | | 2,336,958 | |
Travis Perkins PLC—ADR | | | 17,443 | | | | 209,927 | |
Volkswagen AG—ADR | | | 23,553 | | | | 418,301 | |
WESCO International, Inc.(a) | | | 1,804 | | | | 298,706 | |
WW Grainger, Inc.(c) | | | 1,397 | | | | 933,797 | |
Xinyi Glass Holdings Ltd.—ADR | | | 159 | | | | 5,939 | |
| | | | | | |
|
|
|
| | | | | | | | 24,867,698 | |
| | | | | | |
|
|
|
Merchant Wholesalers, Nondurable Goods—1.37% | | | | | | | | |
AmerisourceBergen Corp. | | | 12,431 | | | | 1,933,766 | |
Atea Pharmaceuticals, Inc.(a) | | | 24,724 | | | | 87,523 | |
Cardinal Health, Inc. | | | 11,771 | | | | 891,182 | |
CSPC Pharmaceutical Group Ltd.—ADR | | | 54,421 | | | | 231,833 | |
ENN Energy Holdings Ltd.—ADR | | | 5,352 | | | | 306,669 | |
Gazprom Neft PJSC—ADR(a)(e)(g) | | | 6,793 | | | | — | |
Genfit SA—ADR(a) | | | 37,573 | | | | 160,812 | |
Grifols SA—ADR(a) | | | 12,831 | | | | 111,116 | |
Imperial Brands PLC—ADR(c) | | | 54,623 | | | | 1,325,700 | |
Industria de Diseno Textil SA—ADR | | | 65,461 | | | | 1,008,754 | |
Kunlun Energy Co. Ltd.—ADR | | | 7,803 | | | | 62,502 | |
LUKOIL PJSC—ADR(a)(e)(g) | | | 10,626 | | | | — | |
Marubeni Corp.—ADR | | | 10,758 | | | | 1,374,603 | |
McKesson Corp. | | | 2,907 | | | | 1,016,898 | |
Performance Food Group Co.(a)(c) | | | 2,147 | | | | 121,499 | |
Roche Holding AG—ADR | | | 82,988 | | | | 2,991,718 | |
Sinopharm Group Co. Ltd.—ADR | | | 41,164 | | | | 550,157 | |
Suntory Beverage & Food Ltd.—ADR | | | 2,096 | | | | 36,869 | |
Univar Solutions, Inc.(a)(c) | | | 15,901 | | | | 552,560 | |
Universal Corp. | | | 4,894 | | | | 247,587 | |
Vibra Energia SA—ADR(c) | | | 17,671 | | | | 101,688 | |
Yue Yuen Industrial Holdings Ltd.—ADR | | | 8,525 | | | | 62,659 | |
| | | | | | |
|
|
|
| | | | | | | | 13,176,095 | |
| | | | | | |
|
|
|
Mining (except Oil and Gas)—0.41% | | | | | | | | |
Alpha Metallurgical Resources, Inc. | | | 1,427 | | | | 239,365 | |
Anglo American PLC—ADR | | | 84,820 | | | | 1,465,690 | |
Arch Resources, Inc.(c) | | | 1,891 | | | | 297,548 | |
Freeport-McMoRan, Inc. | | | 3,178 | | | | 130,203 | |
Peabody Energy Corp.(a) | | | 7,913 | | | | 216,025 | |
Sociedad Quimica y Minera de Chile SA—ADR | | | 228 | | | | 20,235 | |
Vale SA—ADR | | | 82,694 | | | | 1,351,220 | |
Warrior Met Coal, Inc. | | | 6,058 | | | | 231,840 | |
| | | | | | |
|
|
|
| | | | | | | | 3,952,126 | |
| | | | | | |
|
|
|
Miscellaneous Manufacturing—0.80% | | | | | | | | |
3M Co. | | | 399 | | | | 42,988 | |
Ansell Ltd.—ADR | | | 12,921 | | | | 943,621 | |
Bandai Namco Holdings, Inc.—ADR | | | 9,720 | | | | 301,903 | |
Chow Tai Fook Jewellery Group Ltd.—ADR(c) | | | 3,990 | | | | 77,366 | |
Cochlear Ltd.—ADR | | | 2,274 | | | | 170,846 | |
ConvaTec Group PLC—ADR | | | 12,832 | | | | 139,740 | |
EssilorLuxottica SA—ADR(c) | | | 16,550 | | | | 1,434,057 | |
Getinge AB—ADR | | | 15,054 | | | | 322,607 | |
Globus Medical, Inc.(a) | | | 1,539 | | | | 89,785 | |
The accompanying notes are an integral part of these financial statements.
51
PMC DIVERSIFIED EQUITY FUND | Schedule of Investments |
February 28, 2023 (Unaudited) (Continued)
| | | | | | | | |
| | |
| | | Shares
| | | Value
| |
Haemonetics Corp.(a)(c) | | | 4,480 | | | $ | 348,410 | |
Inspire Medical Systems, Inc.(a) | | | 513 | | | | 133,344 | |
Johnson & Johnson | | | 13,504 | | | | 2,069,622 | |
Merit Medical Systems, Inc.(a) | | | 4,697 | | | | 331,514 | |
Nintendo Co., Ltd.—ADR | | | 3,515 | | | | 32,795 | |
Shockwave Medical, Inc.(a) | | | 1,148 | | | | 218,396 | |
Siemens Healthineers AG—ADR | | | 5,063 | | | | 131,841 | |
Smith & Nephew PLC—ADR | | | 23,875 | | | | 682,109 | |
STAAR Surgical Co.(a)(c) | | | 3,099 | | | | 171,654 | |
Tiger Brands Ltd.—ADR | | | 6,980 | | | | 85,365 | |
| | | | | | |
|
|
|
| | | | | | | | 7,727,963 | |
| | | | | | |
|
|
|
Miscellaneous Store Retailers—0.04% | | | | | | | | |
Cavco Industries, Inc.(a) | | | 126 | | | | 35,910 | |
FirstCash Holdings, Inc.(c) | | | 3,667 | | | | 323,613 | |
| | | | | | |
|
|
|
| | | | | | | | 359,523 | |
| | | | | | |
|
|
|
Motion Picture and Sound Recording Industries—0.05% | | | | | | | | |
Adeia, Inc. | | | 11,625 | | | | 114,623 | |
World Wrestling Entertainment, Inc.(c) | | | 3,762 | | | | 316,008 | |
| | | | | | |
|
|
|
| | | | | | | | 430,631 | |
| | | | | | |
|
|
|
Motor Vehicle and Parts Dealers—0.54% | | | | | | | | |
Asbury Automotive Group, Inc.(a)(c) | | | 2,175 | | | | 493,943 | |
AutoNation, Inc.(a)(c) | | | 3,684 | | | | 502,903 | |
AutoZone, Inc.(a) | | | 557 | | | | 1,385,002 | |
Group 1 Automotive, Inc.(c) | | | 2,124 | | | | 469,553 | |
Lithia Motors, Inc.—Class A(c) | | | 1,106 | | | | 282,229 | |
Murphy USA, Inc.(c) | | | 866 | | | | 220,908 | |
O’Reilly Automotive, Inc.(a) | | | 1,005 | | | | 834,251 | |
Penske Automotive Group, Inc.(c) | | | 4,276 | | | | 616,384 | |
Sonic Automotive, Inc.—Class A(c) | | | 6,556 | | | | 372,971 | |
| | | | | | |
|
|
|
| | | | | | | | 5,178,144 | |
| | | | | | |
|
|
|
National Security and International Affairs—0.09% | | | | | | | | |
Leidos Holdings, Inc. | | | 9,250 | | | | 897,898 | |
| | | | | | |
|
|
|
Nonmetallic Mineral Product Manufacturing—0.51% | | | | | | | | |
Apogee Enterprises, Inc. | | | 5,813 | | | | 266,003 | |
Corning, Inc. | | | 96,199 | | | | 3,265,955 | |
O-I Glass, Inc.(a) | | | 575 | | | | 12,777 | |
Quanex Building Products Corp. | | | 11,715 | | | | 304,004 | |
TOTO Ltd.—ADR(a) | | | 8,518 | | | | 283,224 | |
Wienerberger AG—ADR | | | 120,243 | | | | 753,923 | |
| | | | | | |
|
|
|
| | | | | | | | 4,885,886 | |
| | | | | | |
|
|
|
Nonstore Retailers—0.11% | | | | | | | | |
Baozun, Inc.—ADR(a) | | | 39,765 | | | | 250,122 | |
Box, Inc.(a)(c) | | | 7,548 | | | | 251,725 | |
DoorDash, Inc.(a) | | | 3,272 | | | | 178,848 | |
Grupo Aval Acciones y Valores SA—ADR | | | 9,315 | | | | 21,145 | |
Jumia Technologies AG—ADR(a)(c) | | | 43,326 | | | | 146,009 | |
Just Eat Takeaway.com NV—ADR(a)(c) | | | 19,488 | | | | 85,747 | |
ZOZO, Inc.—ADR | | | 32,325 | | | | 142,311 | |
| | | | | | |
|
|
|
| | | | | | | | 1,075,907 | |
| | | | | | |
|
|
|
The accompanying notes are an integral part of these financial statements.
52
PMC DIVERSIFIED EQUITY FUND | Schedule of Investments |
February 28, 2023 (Unaudited) (Continued)
| | | | | | | | |
| | |
| | | Shares
| | | Value
| |
Nursing and Residential Care Facilities—0.04% | | | | | | | | |
Ensign Group, Inc.(c) | | | 4,034 | | | $ | 360,962 | |
| | | | | | |
|
|
|
Oil and Gas Extraction—1.36% | | | | | | | | |
Antero Resources Corp.(a)(c) | | | 11,740 | | | | 307,588 | |
APA Corp.(c) | | | 6,518 | | | | 250,161 | |
BHP Group Ltd.—ADR | | | 47,007 | | | | 2,866,017 | |
Chesapeake Energy Corp. | | | 4,484 | | | | 362,352 | |
Comstock Resources, Inc.(c) | | | 10,550 | | | | 128,077 | |
Coterra Energy, Inc. | | | 7,180 | | | | 179,285 | |
Eni SpA—ADR | | | 39,321 | | | | 1,115,144 | |
EQT Corp.(c) | | | 37,040 | | | | 1,228,987 | |
Gazprom PJSC—ADR(a)(e)(g) | | | 186,205 | | | | — | |
Marathon Oil Corp. | | | 24,828 | | | | 624,424 | |
Occidental Petroleum Corp. | | | 12,962 | | | | 759,055 | |
Ovintiv, Inc. | | | 1,672 | | | | 71,511 | |
Pampa Energia SA—ADR(a) | | | 8,675 | | | | 286,188 | |
PDC Energy, Inc.(c) | | | 2,086 | | | | 139,991 | |
Petroleo Brasileiro SA—ADR | | | 17,522 | | | | 194,319 | |
Range Resources Corp.(c) | | | 637 | | | | 17,161 | |
Repsol SA—ADR | | | 121,490 | | | | 1,926,831 | |
SM Energy Co.(c) | | | 3,758 | | | | 110,899 | |
Surgutneftegas PJSC—ADR(a)(e)(g) | | | 15,549 | | | | — | |
TotalEnergies SE—ADR | | | 39,467 | | | | 2,443,402 | |
| | | | | | |
|
|
|
| | | | | | | | 13,011,392 | |
| | | | | | |
|
|
|
Other Information Services—0.40% | | | | | | | | |
Chegg, Inc.(a) | | | 4,509 | | | | 71,648 | |
Meta Platforms, Inc.—Class A(a) | | | 21,260 | | | | 3,719,224 | |
| | | | | | |
|
|
|
| | | | | | | | 3,790,872 | |
| | | | | | |
|
|
|
Paper Manufacturing—0.14% | | | | | | | | |
Boise Cascade Co. | | | 2,736 | | | | 189,085 | |
International Paper Co. | | | 1,255 | | | | 45,669 | |
Packaging Corp. of America(c) | | | 7,454 | | | | 1,019,111 | |
Sappi Ltd.—ADR | | | 27,439 | | | | 71,616 | |
Suzano SA—ADR | | | 581 | | | | 5,305 | |
WestRock Co. | | | 1,375 | | | | 43,175 | |
| | | | | | |
|
|
|
| | | | | | | | 1,373,961 | |
| | | | | | |
|
|
|
Performing Arts, Spectator Sports, and Related Industries—0.07% | | | | | | | | |
Entain PLC—ADR | | | 14,522 | | | | 236,418 | |
Flutter Entertainment PLC—ADR(a) | | | 3,744 | | | | 301,505 | |
OPAP SA—ADR(c) | | | 17,498 | | | | 132,635 | |
| | | | | | |
|
|
|
| | | | | | | | 670,558 | |
| | | | | | |
|
|
|
Personal and Laundry Services—0.05% | | | | | | | | |
Kingfisher PLC—ADR | | | 71,281 | | | | 491,839 | |
| | | | | | |
|
|
|
Petroleum and Coal Products Manufacturing—1.19% | | | | | | | | |
Carlisle Cos, Inc. | | | 114 | | | | 29,437 | |
CVR Energy, Inc. | | | 971 | | | | 30,810 | |
Equinor ASA—ADR | | | 40,969 | | | | 1,249,964 | |
Exxon Mobil Corp. | | | 52,470 | | | | 5,766,978 | |
HF Sinclair Corp.(c) | | | 7,960 | | | | 395,771 | |
Marathon Petroleum Corp. | | | 12,381 | | | | 1,530,292 | |
The accompanying notes are an integral part of these financial statements.
53
PMC DIVERSIFIED EQUITY FUND | Schedule of Investments |
February 28, 2023 (Unaudited) (Continued)
| | | | | | | | |
| | |
| | | Shares
| | | Value
| |
OMV AG—ADR | | | 15,003 | | | $ | 732,596 | |
PBF Energy, Inc.—Class A | | | 9,689 | | | | 423,506 | |
Valero Energy Corp. | | | 7,908 | | | | 1,041,721 | |
YPF SA—ADR(a) | | | 23,008 | | | | 270,804 | |
| | | | | | |
|
|
|
| | | | | | | | 11,471,879 | |
| | | | | | |
|
|
|
Pipeline Transportation—0.01% | | | | | | | | |
Enagas SA—ADR | | | 3,937 | | | | 34,803 | |
Naturgy Energy Group SA—ADR | | | 6,548 | | | | 35,556 | |
| | | | | | |
|
|
|
| | | | | | | | 70,359 | |
| | | | | | |
|
|
|
Plastics and Rubber Products Manufacturing—0.03% | | | | | | | | |
Bridgestone Corp.—ADR | | | 16,750 | | | | 319,590 | |
| | | | | | |
|
|
|
Postal Service—0.08% | | | | | | | | |
International Distributions Services PLC—ADR | | | 130,797 | | | | 745,543 | |
| | | | | | |
|
|
|
Primary Metal Manufacturing—0.88% | | | | | | | | |
APERAM SA(b)(c) | | | 15,102 | | | | 593,433 | |
ArcelorMittal SA(b) | | | 27,986 | | | | 846,577 | |
Belden, Inc. | | | 5,176 | | | | 436,751 | |
Boliden AB—ADR | | | 3,150 | | | | 258,631 | |
Century Aluminum Co.(a) | | | 7,966 | | | | 96,150 | |
Commercial Metals Co. | | | 12,839 | | | | 664,418 | |
Encore Wire Corp.(c) | | | 3,111 | | | | 600,453 | |
Mechel PJSC—ADR(a)(e)(g) | | | 59,509 | | | | — | |
Nippon Steel Corp.—ADR(c) | | | 177,963 | | | | 1,324,044 | |
Norsk Hydro ASA—ADR | | | 155,688 | | | | 1,144,306 | |
Steel Dynamics, Inc.(c) | | | 7,005 | | | | 883,401 | |
Sumitomo Metal Mining Co. Ltd.—ADR | | | 35,549 | | | | 330,606 | |
Tenaris SA—ADR | | | 15,398 | | | | 508,288 | |
Ternium SA—ADR | | | 9,029 | | | | 384,726 | |
United States Steel Corp.(c) | | | 11,647 | | | | 356,748 | |
| | | | | | |
|
|
|
| | | | | | | | 8,428,532 | |
| | | | | | |
|
|
|
Printing and Related Support Activities—0.08% | | | | | | | | |
Dai Nippon Printing Co. Ltd.—ADR | | | 7,086 | | | | 94,811 | |
TOPPAN, Inc.—ADR | | | 67,889 | | | | 614,055 | |
Warner Music Group Corp.—Class A | | | 3,019 | | | | 95,280 | |
| | | | | | |
|
|
|
| | | | | | | | 804,146 | |
| | | | | | |
|
|
|
Professional, Scientific, and Technical Services—2.73% | | | | | | | | |
AppLovin Corp.(a) | | | 60,735 | | | | 819,923 | |
Aspen Technology, Inc.(a)(c) | | | 901 | | | | 191,021 | |
Avadel Pharmaceuticals PLC—ADR(a)(c) | | | 14,620 | | | | 145,469 | |
Axonics, Inc.(a) | | | 432 | | | | 25,959 | |
Baidu, Inc.—ADR(a) | | | 108 | | | | 14,871 | |
BioNTech SE—ADR(c) | | | 7,228 | | | | 940,001 | |
CACI International, Inc.—Class A(a) | | | 1,408 | | | | 412,544 | |
Capgemini SE—ADR | | | 9,160 | | | | 343,317 | |
CDW Corp.(c) | | | 7,947 | | | | 1,608,632 | |
Clear Channel Outdoor Holdings, Inc.(a) | | | 22,953 | | | | 40,627 | |
Cognizant Technology Solutions Corp.—Class A | | | 7,645 | | | | 478,806 | |
Commonwealth Bank of Australia—ADR | | | 13,577 | | | | 912,917 | |
Cullinan Oncology, Inc.(a) | | | 5,393 | | | | 60,887 | |
Digital Turbine, Inc.(a) | | | 10,514 | | | | 112,920 | |
The accompanying notes are an integral part of these financial statements.
54
PMC DIVERSIFIED EQUITY FUND | Schedule of Investments |
February 28, 2023 (Unaudited) (Continued)
| | | | | | | | |
| | |
| | | Shares
| | | Value
| |
DoubleVerify Holdings, Inc.(a)(c) | | | 581 | | | $ | 15,263 | |
DXC Technology Co.(a) | | | 1,695 | | | | 47,019 | |
Ebix, Inc.(c) | | | 8,896 | | | | 154,612 | |
Endava PLC—ADR(a) | | | 553 | | | | 43,986 | |
Exelixis, Inc.(a) | | | 16,353 | | | | 279,309 | |
Gartner, Inc.(a)(c) | | | 4,688 | | | | 1,536,773 | |
Genmab A/S—ADR(a)(c) | | | 17,527 | | | | 658,314 | |
GoDaddy, Inc.(a) | | | 7,785 | | | | 589,402 | |
Gravity Co. Ltd.—ADR(a) | | | 1,666 | | | | 90,047 | |
H&R Block, Inc.(c) | | | 6,582 | | | | 242,218 | |
Huron Consulting Group, Inc.(a) | | | 1,518 | | | | 106,548 | |
Immutep Ltd.—ADR(a) | | | 19,556 | | | | 32,072 | |
Insight Enterprises, Inc.(a)(c) | | | 6,480 | | | | 867,802 | |
Interpublic Group of Companies, Inc.(c) | | | 56,779 | | | | 2,017,926 | |
Jack Henry & Associates, Inc. | | | 10,124 | | | | 1,662,766 | |
Jardine Matheson Holdings Ltd.—ADR | | | 13,458 | | | | 668,324 | |
Medpace Holdings, Inc.(a) | | | 1,824 | | | | 353,637 | |
NetScout Systems, Inc.(a) | | | 7,455 | | | | 212,020 | |
Omnicom Group, Inc.(c) | | | 26,701 | | | | 2,418,309 | |
Publicis Groupe SA—ADR | | | 81,775 | | | | 1,621,598 | |
PubMatic, Inc.—Class A(a) | | | 7,164 | | | | 108,750 | |
SAP SE—ADR | | | 302 | | | | 34,374 | |
Science Applications International Corp.(c) | | | 3,730 | | | | 397,767 | |
Shift4 Payments, Inc.(a)(c) | | | 2,800 | | | | 180,600 | |
Squarespace, Inc.(a) | | | 2,208 | | | | 51,689 | |
Sumitomo Corp.—ADR | | | 86,800 | | | | 1,476,903 | |
Swatch Group AG—ADR | | | 91,236 | | | | 1,577,589 | |
Syneos Health, Inc.(a) | | | 1,657 | | | | 66,645 | |
Teledyne Technologies, Inc.(a)(c) | | | 3,146 | | | | 1,353,000 | |
Thermon Group Holdings, Inc.(a) | | | 10,672 | | | | 282,274 | |
Timken Co.(c) | | | 1,995 | | | | 170,473 | |
Veradigm, Inc.(a)(c) | | | 10,966 | | | | 182,145 | |
Vir Biotechnology, Inc.(a)(c) | | | 9,134 | | | | 208,255 | |
Worldline SA/France—ADR(a)(c) | | | 6,976 | | | | 145,101 | |
Wuxi Biologics Cayman, Inc.—ADR(a) | | | 13,335 | | | | 184,823 | |
Yiren Digital Ltd.—ADR(a) | | | 21,553 | | | | 57,547 | |
| | | | | | |
|
|
|
| | | | | | | | 26,203,774 | |
| | | | | | |
|
|
|
Publishing Industries (except Internet)—2.03% | | | | | | | | |
Akamai Technologies, Inc.(a) | | | 1,408 | | | | 102,221 | |
American Well Corp.(a) | | | 21,778 | | | | 60,761 | |
Consensus Cloud Solutions, Inc.(a) | | | 3,019 | | | | 123,900 | |
Dropbox, Inc.(a)(c) | | | 144,400 | | | | 2,945,759 | |
Electronic Arts, Inc. | | | 5,907 | | | | 655,323 | |
Fujitsu Ltd.—ADR | | | 23,563 | | | | 604,155 | |
Gaotu Techedu, Inc.—ADR(a)(c) | | | 121,313 | | | | 406,399 | |
Hello Group, Inc.—ADR(c) | | | 20,248 | | | | 178,385 | |
Hewlett Packard Enterprise Co. | | | 135,833 | | | | 2,120,353 | |
Microsoft Corp. | | | 2,514 | | | | 627,042 | |
N-able, Inc.(a) | | | 13,519 | | | | 160,065 | |
National Instruments Corp. | | | 4,664 | | | | 235,579 | |
News Corp.—Class A | | | 164,691 | | | | 2,824,451 | |
News Corp.—Class B(c) | | | 70,589 | | | | 1,218,366 | |
Nexon Co. Ltd.—ADR | | | 7,262 | | | | 157,513 | |
Oracle Corp. | | | 10,000 | | | | 874,000 | |
The accompanying notes are an integral part of these financial statements.
55
PMC DIVERSIFIED EQUITY FUND | Schedule of Investments |
February 28, 2023 (Unaudited) (Continued)
| | | | | | | | |
| | |
| | | Shares
| | | Value
| |
Pearson PLC—ADR | | | 61,794 | | | $ | 678,498 | |
Progress Software Corp.(c) | | | 3,982 | | | | 228,726 | |
PTC, Inc.(a) | | | 136 | | | | 17,045 | |
Qualys, Inc.(a)(c) | | | 399 | | | | 47,142 | |
Spire, Inc. | | | 8,151 | | | | 573,830 | |
SPS Commerce, Inc.(a) | | | 143 | | | | 21,542 | |
Synopsys, Inc.(a) | | | 6,319 | | | | 2,298,598 | |
Trend Micro, Inc.—ADR(c) | | | 11,555 | | | | 547,476 | |
Tuya, Inc.—ADR(a)(c) | | | 64,220 | | | | 132,935 | |
Vipshop Holdings Ltd.—ADR(a) | | | 73,310 | | | | 1,091,586 | |
Youdao, Inc.—ADR(a) | | | 12,017 | | | | 97,939 | |
Ziff Davis, Inc.(a)(c) | | | 6,352 | | | | 501,681 | |
| | | | | | |
|
|
|
| | | | | | | | 19,531,270 | |
| | | | | | |
|
|
|
Real Estate—0.50% | | | | | | | | |
Anywhere Real Estate, Inc.(a) | | | 5,211 | | | | 30,172 | |
CBRE Group, Inc.—Class A(a) | | | 4,485 | | | | 381,853 | |
Daiwa House Industry Co. Ltd.—ADR | | | 1,542 | | | | 35,435 | |
Forestar Group, Inc.(a) | | | 8,529 | | | | 121,709 | |
Holcim Ltd.—ADR | | | 60,244 | | | | 742,182 | |
IRSA Inversiones y Representaciones SA—ADR | | | 840 | | | | 5,653 | |
Jones Lang LaSalle, Inc.(a) | | | 274 | | | | 47,802 | |
Marcus & Millichap, Inc.(c) | | | 13,696 | | | | 470,732 | |
Mitsubishi Estate Co. Ltd.—ADR | | | 21,742 | | | | 268,731 | |
Mitsui Fudosan Co. Ltd.—ADR | | | 1,612 | | | | 92,271 | |
RMR Group, Inc.—Class A | | | 11,065 | | | | 311,369 | |
Sekisui House Ltd.—ADR | | | 44,460 | | | | 839,626 | |
Sun Hung Kai Properties Ltd.—ADR(c) | | | 79,442 | | | | 1,083,589 | |
Zillow Group, Inc.—Class C(a)(c) | | | 9,150 | | | | 384,300 | |
| | | | | | |
|
|
|
| | | | | | | | 4,815,424 | |
| | | | | | |
|
|
|
Rental and Leasing Services—0.47% | | | | | | | | |
Ashtead Group PLC—ADR | | | 130 | | | | 34,665 | |
Avis Budget Group, Inc.(a)(c) | | | 577 | | | | 126,744 | |
Hertz Global Holdings, Inc.(a) | | | 688 | | | | 12,735 | |
Netflix, Inc.(a) | | | 1,858 | | | | 598,518 | |
ORIX Corp.—ADR | | | 3,021 | | | | 270,017 | |
PROG Holdings, Inc.(a) | | | 586 | | | | 14,486 | |
Ryder System, Inc. | | | 6,026 | | | | 590,006 | |
Triton International Ltd.(b)(c) | | | 10,725 | | | | 739,381 | |
United Rentals, Inc.(c) | | | 4,445 | | | | 2,082,615 | |
| | | | | | |
|
|
|
| | | | | | | | 4,469,167 | |
| | | | | | |
|
|
|
Securities, Commodity Contracts, and Other Financial Investments and Related
Activities—1.79% | | | | | | | | |
360 DigiTech, Inc.—ADR | | | 23,036 | | | | 469,013 | |
3i Group PLC—ADR | | | 182,978 | | | | 1,809,104 | |
Affiliated Managers Group, Inc. | | | 3,561 | | | | 567,659 | |
Amarin Corp. PLC—ADR(a) | | | 26,300 | | | | 53,389 | |
Ambac Financial Group, Inc.(a) | | | 13,421 | | | | 222,118 | |
Ameriprise Financial, Inc. | | | 3,116 | | | | 1,068,383 | |
Astra International, Tbk PT—ADR | | | 63,281 | | | | 504,666 | |
BGC Partners, Inc. | | | 37,078 | | | | 180,199 | |
Bidvest Group Ltd.—ADR | | | 6,473 | | | | 166,874 | |
CaixaBank SA—ADR | | | 525,701 | | | | 725,467 | |
The accompanying notes are an integral part of these financial statements.
56
PMC DIVERSIFIED EQUITY FUND | Schedule of Investments |
February 28, 2023 (Unaudited) (Continued)
| | | | | | | | |
| | |
| | | Shares
| | | Value
| |
Chemed Corp.(c) | | | 797 | | | $ | 415,699 | |
Daqo New Energy Corp.—ADR(a) | | | 21,882 | | | | 966,747 | |
EDAP TMS SA—ADR(a) | | | 20,752 | | | | 244,251 | |
Evercore, Inc.—Class A(c) | | | 1,887 | | | | 247,537 | |
First Pacific Co. Ltd.—ADR | | | 275,175 | | | | 445,784 | |
Franklin Resources, Inc.(c) | | | 1,647 | | | | 48,537 | |
Futu Holdings Ltd.—ADR(a)(c) | | | 19,317 | | | | 950,589 | |
GCM Grosvenor, Inc. | | | 20,101 | | | | 165,431 | |
Goldman Sachs Group, Inc. | | | 6,240 | | | | 2,194,296 | |
Hims & Hers Health, Inc.(a)(c) | | | 23,698 | | | | 267,076 | |
Indivior PLC—ADR(a) | | | 21,873 | | | | 425,649 | |
Invesco Ltd.(b) | | | 798 | | | | 14,093 | |
Jefferies Financial Group, Inc. | | | 14,205 | | | | 536,807 | |
Julius Baer Group Ltd.—ADR | | | 10,845 | | | | 143,046 | |
Keppel Corp Ltd.—ADR | | | 55,641 | | | | 610,660 | |
Lazard Ltd.(b) | | | 2,467 | | | | 92,167 | |
LexinFintech Holdings Ltd.—ADR(a) | | | 83,525 | | | | 231,364 | |
LPL Financial Holdings, Inc. | | | 1,347 | | | | 336,157 | |
Morgan Stanley | | | 462 | | | | 44,583 | |
MYT Netherlands Parent BV—ADR(a)(c) | | | 13,514 | | | | 110,409 | |
Navient Corp. | | | 7,280 | | | | 131,404 | |
Offerpad Solutions, Inc.(a) | | | 8,914 | | | | 5,067 | |
Randstad NV—ADR(c) | | | 57,474 | | | | 1,761,865 | |
Raymond James Financial, Inc.(c) | | | 407 | | | | 44,143 | |
Sea Ltd.—ADR(a) | | | 1,651 | | | | 103,171 | |
Sibanye Stillwater Ltd.—ADR(c) | | | 23,263 | | | | 188,430 | |
TechnoPro Holdings, Inc.—ADR | | | 6,243 | | | | 31,527 | |
TPG, Inc.(c) | | | 18,714 | | | | 617,936 | |
Uxin Ltd.—ADR(a) | | | 11,276 | | | | 31,798 | |
| | | | | | |
|
|
|
| | | | | | | | 17,173,095 | |
| | | | | | |
|
|
|
Specialty Trade Contractors���0.12% | | | | | | | | |
Comfort Systems USA, Inc. | | | 1,476 | | | | 214,669 | |
EMCOR Group, Inc. | | | 5,105 | | | | 853,658 | |
NetEase, Inc.—ADR | | | 1,115 | | | | 86,569 | |
Sunrun, Inc.(a)(c) | | | 1,632 | | | | 39,233 | |
| | | | | | |
|
|
|
| | | | | | | | 1,194,129 | |
| | | | | | |
|
|
|
Sporting Goods, Hobby, Musical Instrument, and Book Stores—0.04% | | | | | | | | |
Dick’s Sporting Goods, Inc.(c) | | | 2,886 | | | | 371,226 | |
| | | | | | |
|
|
|
Support Activities for Mining—0.49% | | | | | | | | |
Civitas Resources, Inc.(c) | | | 240 | | | | 16,841 | |
Cleveland-Cliffs, Inc.(a) | | | 1,351 | | | | 28,817 | |
ConocoPhillips | | | 10,303 | | | | 1,064,815 | |
Fortescue Metals Group Ltd.—ADR | | | 19,501 | | | | 563,579 | |
Inpex Corp.—ADR | | | 16,477 | | | | 173,668 | |
Liberty Energy, Inc. | | | 3,829 | | | | 58,392 | |
Rio Tinto PLC—ADR | | | 20,568 | | | | 1,434,206 | |
South32 Ltd.—ADR | | | 78,715 | | | | 1,142,941 | |
Subsea 7 SA—ADR | | | 19,144 | | | | 246,958 | |
| | | | | | |
|
|
|
| | | | | | | | 4,730,217 | |
| | | | | | |
|
|
|
Support Activities for Transportation—0.65% | | | | | | | | |
CH Robinson Worldwide, Inc.(c) | | | 16,841 | | | | 1,683,426 | |
CK Hutchison Holdings Ltd.—ADR | | | 124,183 | | | | 736,405 | |
The accompanying notes are an integral part of these financial statements.
57
PMC DIVERSIFIED EQUITY FUND | Schedule of Investments |
February 28, 2023 (Unaudited) (Continued)
| | | | | | | | |
| | |
| | | Shares
| | | Value
| |
Expeditors International of Washington, Inc. | | | 19,357 | | | $ | 2,023,967 | |
Grupo Aeroportuario del Centro Norte SAB de CV—ADR | | | 1,933 | | | | 150,755 | |
Hub Group, Inc.—Class A(a) | | | 4,471 | | | | 410,125 | |
JB Hunt Transport Services, Inc.(c) | | | 5,307 | | | | 959,453 | |
Matson, Inc.(c) | | | 2,497 | | | | 166,075 | |
XPO, Inc.(a)(c) | | | 4,509 | | | | 150,420 | |
| | | | | | |
|
|
|
| | | | | | | | 6,280,626 | |
| | | | | | |
|
|
|
Telecommunications—2.49% | | | | | | | | |
AT&T, Inc. | | | 301,717 | | | | 5,705,469 | |
Deutsche Telekom AG—ADR | | | 68,193 | | | | 1,536,381 | |
Eutelsat Communications SA—ADR | | | 253,748 | | | | 443,374 | |
Frontier Communications Parent, Inc.(a)(c) | | | 14,103 | | | | 385,858 | |
Gogo, Inc.(a) | | | 4,833 | | | | 79,551 | |
JOYY, Inc.—ADR(c) | | | 18,551 | | | | 582,501 | |
KDDI Corp.—ADR | | | 127,343 | | | | 1,863,028 | |
Koninklijke KPN NV—ADR | | | 171,184 | | | | 590,585 | |
KT Corp.—ADR(a) | | | 111,181 | | | | 1,286,364 | |
Magyar Telekom Telecommunications PLC—ADR | | | 35,539 | | | | 202,572 | |
Mobile TeleSystems PJSC—ADR(a)(e)(g) | | | 46,068 | | | | — | |
Nippon Telegraph & Telephone Corp.—ADR | | | 50,338 | | | | 1,460,809 | |
Nokia Oyj—ADR | | | 463,370 | | | | 2,131,502 | |
Orange SA—ADR | | | 192,464 | | | | 2,209,487 | |
Oxford Industries, Inc.(c) | | | 2,921 | | | | 343,539 | |
Partner Communications Co. Ltd.—ADR(a)(c) | | | 42,597 | | | | 232,154 | |
Rostelecom PJSC—ADR(a)(e)(g) | | | 24,510 | | | | — | |
SK Telecom Co. Ltd.—ADR(c) | | | 8,580 | | | | 163,277 | |
SoftBank Corp.—ADR | | | 3,049 | | | | 34,210 | |
Spark New Zealand Ltd.—ADR | | | 31,629 | | | | 488,036 | |
Swisscom AG—ADR | | | 610 | | | | 38,009 | |
Telecom Italia SpA/Milano—ADR(a) | | | 18,217 | | | | 58,385 | |
Telefonaktiebolaget LM Ericsson—ADR | | | 116,701 | | | | 641,856 | |
Tencent Holdings Ltd.—ADR | | | 35,860 | | | | 1,576,406 | |
T-Mobile US, Inc.(a) | | | 13,013 | | | | 1,850,188 | |
| | | | | | |
|
|
|
| | | | | | | | 23,903,541 | |
| | | | | | |
|
|
|
Textile Product Mills—0.12% | | | | | | | | |
Hermes International—ADR | | | 6,247 | | | | 1,135,330 | |
| | | | | | |
|
|
|
Transit and Ground Passenger Transportation—0.03% | | | | | | | | |
Yalla Group Ltd.—ADR(a)(c) | | | 66,590 | | | | 289,667 | |
| | | | | | |
|
|
|
Transportation Equipment Manufacturing—3.05% | | | | | | | | |
AAR Corp.(a)(c) | | | 6,425 | | | | 349,456 | |
American Axle & Manufacturing Holdings, Inc.(a) | | | 15,795 | | | | 138,996 | |
BAE Systems PLC—ADR | | | 17,293 | | | | 760,114 | |
Bayerische Motoren Werke AG—ADR(c) | | | 84,706 | | | | 2,914,733 | |
BorgWarner, Inc.(c) | | | 52,016 | | | | 2,615,364 | |
General Dynamics Corp. | | | 9,756 | | | | 2,223,489 | |
General Motors Co. | | | 12,405 | | | | 480,570 | |
Harley-Davidson, Inc.(c) | | | 6,547 | | | | 311,310 | |
Honda Motor Co. Ltd.—ADR | | | 105,433 | | | | 2,738,094 | |
Huntington Ingalls Industries, Inc. | | | 1,243 | | | | 267,494 | |
Isuzu Motors Ltd.—ADR | | | 68,074 | | | | 812,804 | |
Kawasaki Heavy Industries Ltd.—ADR(c) | | | 106,182 | | | | 921,766 | |
LCI Industries(c) | | | 1,889 | | | | 213,098 | |
The accompanying notes are an integral part of these financial statements.
58
PMC DIVERSIFIED EQUITY FUND | Schedule of Investments |
February 28, 2023 (Unaudited) (Continued)
| | | | | | | | |
| | |
| | | Shares
| | | Value
| |
Leonardo SpA—ADR | | | 236,522 | | | $ | 1,315,062 | |
Lockheed Martin Corp.(c) | | | 3,072 | | | | 1,456,927 | |
Mazda Motor Corp.—ADR | | | 314,558 | | | | 1,393,492 | |
Mercedes-Benz Group AG—ADR(c) | | | 175,580 | | | | 3,369,381 | |
Niu Technologies—ADR(a) | | | 20,057 | | | | 84,239 | |
PACCAR, Inc. | | | 35,590 | | | | 2,569,598 | |
Raytheon Technologies Corp. | | | 452 | | | | 44,337 | |
Renault SA—ADR(a) | | | 177,633 | | | | 1,582,710 | |
Shimano, Inc.—ADR | | | 2,212 | | | | 34,319 | |
Subaru Corp.—ADR | | | 131,048 | | | | 1,044,453 | |
Suzuki Motor Corp.—ADR | | | 2,739 | | | | 383,323 | |
Textron, Inc. | | | 615 | | | | 44,606 | |
Thor Industries, Inc.(c) | | | 5,792 | | | | 527,014 | |
Umicore SA—ADR | | | 10,552 | | | | 87,582 | |
Volvo AB—ADR | | | 1,856 | | | | 37,027 | |
Wabash National Corp.(c) | | | 8,882 | | | | 243,367 | |
Westinghouse Air Brake Technologies Corp. | | | 3,564 | | | | 371,832 | |
| | | | | | |
|
|
|
| | | | | | | | 29,336,557 | |
| | | | | | |
|
|
|
Truck Transportation—0.21% | | | | | | | | |
ArcBest Corp.(c) | | | 1,448 | | | | 139,298 | |
bpost SA—ADR | | | 8,226 | | | | 43,927 | |
Heartland Express, Inc. | | | 8,722 | | | | 140,686 | |
Knight-Swift Transportation Holdings, Inc.(c) | | | 11,133 | | | | 632,800 | |
Schneider National, Inc.—Class B(c) | | | 25,457 | | | | 714,322 | |
Werner Enterprises, Inc.(c) | | | 7,364 | | | | 342,058 | |
| | | | | | |
|
|
|
| | | | | | | | 2,013,091 | |
| | | | | | |
|
|
|
Utilities—2.26% | | | | | | | | |
AGL Energy Ltd.—ADR | | | 128,306 | | | | 596,623 | |
American Electric Power Co., Inc. | | | 19,848 | | | | 1,746,029 | |
Black Hills Corp.(c) | | | 1,048 | | | | 64,358 | |
CenterPoint Energy, Inc. | | | 34,638 | | | | 963,629 | |
Cia de Saneamento Basico do Estado de Sao Paulo—ADR | | | 2,903 | | | | 28,885 | |
Cia Energetica de Minas Gerais—ADR(c) | | | 42,808 | | | | 127,568 | |
Clearway Energy, Inc. | | | 404 | | | | 12,003 | |
Consolidated Edison, Inc. | | | 46,780 | | | | 4,179,792 | |
Edison International(c) | | | 679 | | | | 44,957 | |
EDP Energias de Portugal SA—ADR | | | 717 | | | | 36,225 | |
Engie SA—ADR | | | 157,549 | | | | 2,293,914 | |
Exelon Corp. | | | 12,112 | | | | 489,204 | |
First Solar, Inc.(a) | | | 2,072 | | | | 350,458 | |
FirstEnergy Corp. | | | 22,526 | | | | 890,678 | |
Galp Energia SGPS SA—ADR | | | 112,097 | | | | 675,384 | |
Iberdrola SA—ADR | | | 65,982 | | | | 3,025,604 | |
National Grid PLC—ADR | | | 22,960 | | | | 1,444,414 | |
New Jersey Resources Corp. | | | 242 | | | | 12,349 | |
OGE Energy Corp.(c) | | | 18,047 | | | | 644,639 | |
PG&E Corp.(a) | | | 99,395 | | | | 1,552,550 | |
Pinnacle West Capital Corp.(c) | | | 9,178 | | | | 676,235 | |
PPL Corp.(c) | | | 1,586 | | | | 42,933 | |
Red Electrica Corp. SA—ADR | | | 35,151 | | | | 289,644 | |
Sempra Energy | | | 289 | | | | 43,338 | |
Snam SpA—ADR | | | 8,588 | | | | 83,819 | |
Terna—Rete Elettrica Nazionale—ADR | | | 21,327 | | | | 479,644 | |
The accompanying notes are an integral part of these financial statements.
59
PMC DIVERSIFIED EQUITY FUND | Schedule of Investments |
February 28, 2023 (Unaudited) (Continued)
| | | | | | | | |
| | |
| | | Shares
| | | Value
| |
Tokyo Gas Co. Ltd.—ADR(c) | | | 93,121 | | | $ | 884,650 | |
Xcel Energy, Inc. | | | 664 | | | | 42,874 | |
| | | | | | |
|
|
|
| | | | | | | | 21,722,400 | |
| | | | | | |
|
|
|
Warehousing and Storage—0.03% | | | | | | | | |
Landstar System, Inc.(c) | | | 1,652 | | | | 298,665 | |
| | | | | | |
|
|
|
Water Transportation—0.12% | | | | | | | | |
Nippon Yusen KK—ADR | | | 213,012 | | | | 1,111,923 | |
| | | | | | |
|
|
|
Wood Product Manufacturing—0.24% | | | | | | | | |
Builders FirstSource, Inc.(a) | | | 5,748 | | | | 487,315 | |
Greif, Inc.—Class A | | | 4,885 | | | | 347,079 | |
Greif, Inc.—Class B | | | 2,222 | | | | 182,826 | |
Owens Corning(c) | | | 5,867 | | | | 573,734 | |
Skyline Champion Corp.(a)(c) | | | 850 | | | | 58,149 | |
UFP Industries, Inc.(c) | | | 8,145 | | | | 696,642 | |
| | | | | | |
|
|
|
| | | | | | | | 2,345,745 | |
| | | | | | |
|
|
|
TOTAL COMMON STOCKS (Cost $595,056,216) | | | | | | | 702,799,829 | |
| | | | | | |
|
|
|
| PREFERRED STOCKS—0.26% | | | | | | | | |
Credit Intermediation and Related Activities—0.05% | | | | | | | | |
Itau Unibanco Holding SA—ADR, 3.930%(d) | | | 101,867 | | | | 489,980 | |
| | | | | | |
|
|
|
Merchant Wholesalers, Durable Goods—0.06% | | | | | | | | |
Volkswagen AG—ADR, 20.672%(d) | | | 44,400 | | | | 604,728 | |
| | | | | | |
|
|
|
Oil and Gas Extraction—0.06% | | | | | | | | |
Petroleo Brasileiro SA—ADR, 40.139%(d) | | | 59,939 | | | | 585,005 | |
Surgutneftegas PJSC—ADR(a)(d)(e)(g) | | | 47,748 | | | | — | |
| | | | | | |
|
|
|
| | | | | | | | 585,005 | |
| | | | | | |
|
|
|
Primary Metal Manufacturing—0.08% | | | | | | | | |
Gerdau SA—ADR, 12.878%(d) | | | 126,597 | | | | 692,486 | |
| | | | | | |
|
|
|
Utilities—0.01% | | | | | | | | |
Cia Energetica de Minas Gerais—ADR, 13.058%(d) | | | 58,560 | | | | 114,192 | |
| | | | | | |
|
|
|
TOTAL PREFERRED STOCKS (Cost $2,786,690) | | | | | | | 2,486,391 | |
| | | | | | |
|
|
|
| EXCHANGE-TRADED FUNDS—23.55% | | | | | | | | |
iShares Core S&P Small-Cap ETF(c) | | | 97,034 | | | | 9,935,311 | |
iShares MSCI EAFE ETF(c) | | | 360,459 | | | | 24,997,832 | |
iShares MSCI Emerging Markets ETF(c) | | | 151,185 | | | | 5,779,803 | |
iShares Russell 1000 ETF | | | 105,543 | | | | 23,129,748 | |
iShares Russell 2000 ETF(c) | | | 49,268 | | | | 9,271,252 | |
SPDR S&P 500 ETF Trust(c) | | | 67,822 | | | | 26,875,146 | |
Vanguard FTSE All-World ex-US ETF(c) | | | 534,130 | | | | 27,833,514 | |
Vanguard FTSE Developed Markets ETF(c) | | | 638,106 | | | | 28,185,143 | |
Vanguard FTSE Emerging Markets ETF(c) | | | 153,941 | | | | 6,068,354 | |
Vanguard Large-Cap ETF(c) | | | 148,893 | | | | 26,952,610 | |
Vanguard S&P 500 ETF(c) | | | 73,824 | | | | 26,880,057 | |
Vanguard Small-Cap ETF(c) | | | 52,040 | | | | 10,278,941 | |
| | | | | | |
|
|
|
TOTAL EXCHANGE-TRADED FUNDS (Cost $219,383,460) | | | | | | | 226,187,711 | |
| | | | | | |
|
|
|
| REAL ESTATE INVESTMENT TRUSTS—2.26% | | | | | | | | |
Accommodation—0.13% | | | | | | | | |
Apple Hospitality REIT, Inc.(c) | | | 49,811 | | �� | | 822,380 | |
Sunstone Hotel Investors, Inc.(c) | | | 36,349 | | | | 384,209 | |
| | | | | | |
|
|
|
| | | | | | | | 1,206,589 | |
| | | | | | |
|
|
|
The accompanying notes are an integral part of these financial statements.
60
PMC DIVERSIFIED EQUITY FUND | Schedule of Investments |
February 28, 2023 (Unaudited) (Continued)
| | | | | | | | |
| | |
| | | Shares
| | | Value
| |
Administrative and Support Services—0.02% | | | | | | | | |
GEO Group, Inc.(a)(c) | | | 21,446 | | | $ | 187,867 | |
| | | | | | |
|
|
|
Funds, Trusts, and Other Financial Vehicles—0.05% | | | | | | | | |
Apollo Commercial Real Estate Finance, Inc. | | | 38,258 | | | | 439,584 | |
| | | | | | |
|
|
|
Heavy and Civil Engineering Construction—0.03% | | | | | | | | |
British Land Co. PLC—ADR(c) | | | 6,343 | | | | 34,633 | |
Cyrela Brazil Realty SA Empreendimentos e Participacoes—ADR | | | 79,476 | | | | 229,685 | |
| | | | | | |
|
|
|
| | | | | | | | 264,318 | |
| | | | | | |
|
|
|
Real Estate—1.80% | | | | | | | | |
Alexander’s, Inc. | | | 372 | | | | 81,435 | |
Apartment Investment and Management Co. | | | 70,252 | | | | 526,890 | |
Brixmor Property Group, Inc. | | | 16,009 | | | | 362,444 | |
CoreCivic, Inc.(a)(c) | | | 23,074 | | | | 224,049 | |
DiamondRock Hospitality Co. | | | 15,779 | | | | 137,593 | |
EPR Properties(c) | | | 13,199 | | | | 539,047 | |
Franklin Street Properties Corp. | | | 2,902 | | | | 7,023 | |
Getty Realty Corp.(c) | | | 10,863 | | | | 372,927 | |
Global Net Lease, Inc.(c) | | | 40,236 | | | | 568,132 | |
Host Hotels & Resorts, Inc.(c) | | | 201,318 | | | | 3,382,141 | |
InvenTrust Properties Corp. | | | 4,403 | | | | 106,509 | |
Ladder Capital Corp. | | | 26,006 | | | | 293,868 | |
LTC Properties, Inc. | | | 1,521 | | | | 54,482 | |
Omega Healthcare Investors, Inc.(c) | | | 22,537 | | | | 603,766 | |
PotlatchDeltic Corp.(c) | | | 8,862 | | | | 409,070 | |
Public Storage | | | 2,224 | | | | 664,865 | |
Regency Centers Corp. | | | 48,069 | | | | 3,023,539 | |
Rithm Capital Corp. | | | 77,712 | | | | 707,179 | |
Simon Property Group, Inc. | | | 12,239 | | | | 1,494,260 | |
SITE Centers Corp.(c) | | | 14,274 | | | | 190,843 | |
Tanger Factory Outlet Centers, Inc.(c) | | | 11,782 | | | | 222,562 | |
Urstadt Biddle Properties, Inc.—Class A | | | 13,777 | | | | 238,342 | |
Ventas, Inc.(c) | | | 21,842 | | | | 1,062,613 | |
VICI Properties, Inc.(c) | | | 21,075 | | | | 706,645 | |
WP Carey, Inc.(c) | | | 16,164 | | | | 1,311,870 | |
| | | | | | |
|
|
|
| | | | | | | | 17,292,094 | |
| | | | | | |
|
|
|
Securities, Commodity Contracts, and Other Financial Investments and Related
Activities—0.05% | | | | | | | | |
Medical Properties Trust, Inc.(c) | | | 51,875 | | | | 534,313 | |
| | | | | | |
|
|
|
Warehousing and Storage—0.01% | | | | | | | | |
Iron Mountain, Inc.(c) | | | 2,610 | | | | 137,678 | |
| | | | | | |
|
|
|
Wood Product Manufacturing—0.17% | | | | | | | | |
Weyerhaeuser Co.(c) | | | 53,899 | | | | 1,684,344 | |
| | | | | | |
|
|
|
TOTAL REAL ESTATE INVESTMENT TRUSTS (Cost $21,630,784) | | | | | | | 21,746,787 | |
| | | | | | |
|
|
|
| INVESTMENTS PURCHASED WITH COLLATERAL FROM SECURITIES LENDING—29.96% | | | | | | | | |
Money Market Fund—29.96% | | | | | | | | |
Mount Vernon Liquid Assets Portfolio, LLC, 4.670%(f) | | | 287,724,513 | | | | 287,724,513 | |
| | | | | | |
|
|
|
TOTAL INVESTMENTS PURCHASED WITH COLLATERAL FROM SECURITIES LENDING (Cost $287,724,513) | | | | | | | 287,724,513 | |
| | | | | | |
|
|
|
The accompanying notes are an integral part of these financial statements.
61
PMC DIVERSIFIED EQUITY FUND | Schedule of Investments |
February 28, 2023 (Unaudited) (Continued)
| | | | | | | | |
| | |
| | | Shares
| | | Value
| |
| SHORT-TERM INVESTMENTS—0.44% | | | | | | | | |
First American Government Obligations Fund, Class X, 4.368%(f) | | | 4,221,105 | | | $ | 4,221,105 | |
| | | | | | |
|
|
|
TOTAL SHORT-TERM INVESTMENTS (Cost $4,221,105) | | | | | | | 4,221,105 | |
| | | | | | |
|
|
|
| Total Investments (Cost $1,130,802,768)—129.64% | | | | | | | 1,245,166,336 | |
Liabilities in Excess of Other Assets—(29.64)% | | | | | | | (284,685,184 | ) |
| | | | | | |
|
|
|
TOTAL NET ASSETS—100.00% | | | | | | $ | 960,481,152 | |
| | | | | | |
|
|
|
Percentages are stated as a percent of net assets.
| (a) | | Non-income producing security. |
| (b) | | Foreign issued security. |
| (c) | | All or portion of this security is out on loan as of February 28, 2023. Total value of securities out on loan is $279,360,854. |
| (d) | | Perpetual preferred stock with no stated maturity. |
| (e) | | Represents an illiquid security. The total market value of these securities were $215,135, representing 0.02% of net assets. |
| (f) | | The rate shown represents the seven day yield at February 28, 2023. |
| (g) | | Fair valued security. Value determined using significant unobservable inputs. |
| | |
| | | Abbreviations |
| AB | | Aktiebolag is a Swedish term for a stock company. |
| ADR | | American Depositary Receipt |
| AG | | Aktiengesellschaft is a German term that refers to a corporation that is limited by shares, i.e. owned by shareholders. |
| A/S | | An abbreviation used by many countries to signify a stock company whereby shareholders have limited liability. |
| ASA | | Allmennaksjeselskap is a Norwegian term for a stock company. |
| KGaA | | Kommanditgesellschaft auf Aktien is a German term that refers to a Limited Partnership that has shares. |
| NV | | Naamloze Vennootschap is a Dutch term for publicly traded companies. |
| OYJ | | Julkinen osakeyhtio is a Finnish term for publicly-traded companies. |
| PJSC | | An abbreviation used by many countries to signify an open joint-stock company. |
| PLC | | Public Limited Company is a publicly traded company which signifies that shareholders have limited liability. |
| SA | | An abbreviation used by many countries to signify a publicly traded company. |
| SAB de CV | | Sociedad Anonima de Capital Variable is a Spanish term for an SA with variable capital. |
| SE | | Societas Europea is a term for a European Public Limited Liability Company. |
| SpA | | Soicieta per Azioni is an Italian term for limited share company. |
The accompanying notes are an integral part of these financial statements.
62
PMC Funds
February 28, 2023 (Unaudited)
| | | | | | | | |
| Statements of Assets and Liabilities | |
| | | Core Fixed
Income Fund
| | | Diversified
Equity Fund
| |
| Assets | | | | | | | | |
Investments, at value(1)(2) | | $ | 438,589,431 | | | $ | 1,245,166,336 | |
Receivables: | | | | | | | | |
Investments sold | | | 13,453,176 | | | | 1,950,253 | |
Dividends and interest | | | 2,860,296 | | | | 2,355,188 | |
Fund shares sold | | | 269,497 | | | | 434,716 | |
Securities lending | | | 1,998 | | | | 117,580 | |
Other Assets | | | 28,041 | | | | 32,035 | |
| | |
|
|
| |
|
|
|
Total Assets | | | 455,202,439 | | | | 1,250,056,108 | |
| | |
|
|
| |
|
|
|
| Liabilities | | | | | | | | |
Payables: | | | | | | | | |
Investments purchased | | | 23,827,503 | | | | — | |
Fund shares redeemed | | | 320,904 | | | | 1,067,869 | |
Line of credit | | | — | | | | 108,000 | |
Collateral on securities loaned | | | 21,255,649 | | | | 287,724,513 | |
Affiliates | | | 142,446 | | | | 213,859 | |
Adviser | | | 110,961 | | | | 401,202 | |
Distributor | | | 7,856 | | | | 20,030 | |
Accrued expenses and other liabilities | | | 53,659 | | | | 39,483 | |
| | |
|
|
| |
|
|
|
Total Liabilities | | | 45,718,978 | | | | 289,574,956 | |
| | |
|
|
| |
|
|
|
| Net Assets | | $ | 409,483,461 | | | $ | 960,481,152 | |
| | |
|
|
| |
|
|
|
| Net assets consist of: | | | | | | | | |
Paid-in capital | | $ | 479,410,846 | | | $ | 826,191,951 | |
Total distributable earnings (deficit) | | | (69,927,385 | ) | | | 134,289,201 | |
| | |
|
|
| |
|
|
|
| Net assets | | $ | 409,483,461 | | | $ | 960,481,152 | |
| | |
|
|
| |
|
|
|
| Advisor Class Shares | | | | | | | | |
Net assets | | | 39,708,807 | | | | 99,634,980 | |
Shares of beneficial interest outstanding (unlimited shares of $0.001 par value authorized) | | | 2,731,000 | | | | 3,713,365 | |
Net asset value and redemption price per share | | $ | 14.54 | | | $ | 26.83 | |
| | |
|
|
| |
|
|
|
| Institutional Class Shares | | | | | | | | |
Net assets | | | 369,774,654 | | | | 860,846,172 | |
Shares of beneficial interest outstanding (unlimited shares of $0.001 par value authorized) | | | 25,584,991 | | | | 32,219,466 | |
Net asset value and redemption price per share | | $ | 14.45 | | | $ | 26.72 | |
| | |
|
|
| |
|
|
|
(1) Cost of investments | | $ | 478,914,522 | | | $ | 1,130,802,768 | |
(2) Includes loaned securities with a value of | | $ | 20,809,116 | | | $ | 279,360,854 | |
The accompanying notes are an integral part of these financial statements.
63
PMC Funds
For the Six Months Ended February 28, 2023 (Unaudited)
| | | | | | | | |
| Statements of Operations | |
| | |
| | | Core Fixed
Income Fund
| | | Diversified
Equity Fund
| |
| Investment Income: | | | | | | | | |
Interest | | $ | 7,242,644 | | | $ | 52,666 | |
Dividends | | | 3,281 | | | | 8,937,144 | (1) |
Securities lending | | | 18,195 | | | | 712,829 | |
| | |
|
|
| |
|
|
|
| | | | 7,264,120 | | | | 9,702,639 | |
| | |
|
|
| |
|
|
|
| Expenses: | | | | | | | | |
Investment management fees | | | 1,335,818 | | | | 2,455,391 | |
Transfer agent fees and expenses | | | 159,671 | | | | 215,100 | |
Fund accounting fees | | | 115,892 | | | | 128,495 | |
Fund administration fees | | | 106,237 | | | | 216,948 | |
Distribution fees—Advisor Class | | | 54,112 | | | | 127,395 | |
Custody fees | | | 37,043 | | | | 55,052 | |
Reports to shareholders | | | 25,326 | | | | 36,218 | |
Federal and state registration fees | | | 18,420 | | | | 18,249 | |
Audit and tax fees | | | 21,444 | | | | 20,639 | |
Legal fees | | | 9,577 | | | | 11,462 | |
Trustees’ fees | | | 9,240 | | | | 9,240 | |
Chief Compliance Officer fees | | | 8,688 | | | | 6,154 | |
Insurance fees | | | 3,163 | | | | 4,332 | |
Other expenses | | | 5,224 | | | | 26,833 | |
| | |
|
|
| |
|
|
|
Total expenses before waiver or recoupment | | | 1,909,855 | | | | 3,331,508 | |
Recoupment or (waivers) by Adviser (Note 4) | | | (622,642 | ) | | | — | |
| | |
|
|
| |
|
|
|
Net expenses | | | 1,287,213 | | | | 3,331,508 | |
| | |
|
|
| |
|
|
|
| Net Investment Income | | | 5,976,907 | | | | 6,371,131 | |
| | |
|
|
| |
|
|
|
| Realized and Unrealized Gain (Loss): | | | | | | | | |
Net realized gain (loss) on: | | | | | | | | |
Investments | | | (16,433,864 | ) | | | 17,420,598 | |
Foreign currency translations | | | — | | | | (34 | ) |
| | |
|
|
| |
|
|
|
| | | | (16,433,864 | ) | | | 17,420,564 | |
| | |
|
|
| |
|
|
|
Net change in unrealized appreciation on: | | | | | | | | |
Investments | | | 2,213,155 | | | | 36,089,524 | |
Foreign currency translations | | | — | | | | 114 | |
| | |
|
|
| |
|
|
|
| | | | 2,213,155 | | | | 36,089,638 | |
| | |
|
|
| |
|
|
|
Net gain (loss) on investments and foreign currency | | | (14,220,709 | ) | | | 53,510,202 | |
| | |
|
|
| |
|
|
|
Net Increase (Decrease) in Net Assets Resulting from Operations | | $ | (8,243,802 | ) | | $ | 59,881,333 | |
| | |
|
|
| |
|
|
|
| (1) | | Net of $679,387 in foreign withholding tax and ADR issuance fees. |
The accompanying notes are an integral part of these financial statements.
64
PMC Funds
| | | | | | | | |
| Statements of Changes in Net Assets | |
| |
| | | Core Fixed Income Fund
| |
| | |
| | | Six Months
Ended
February 28,
2023
(Unaudited)
| | | Year Ended
August 31,
2022
| |
| Operations: | | | | | | | | |
Net investment income | | $ | 5,976,907 | | | $ | 8,061,814 | |
Net realized loss on investments and foreign currency | | | (16,433,864 | ) | | | (13,664,537 | ) |
Net change in unrealized appreciation (depreciation) | | | 2,213,155 | | | | (53,405,265 | ) |
| | |
|
|
| |
|
|
|
Net decrease in net assets resulting from operations | | | (8,243,802 | ) | | | (59,007,988 | ) |
| | |
| Dividends and distributions to shareholders: | | | | | | | | |
Net dividends and distributions—Advisor Class | | | (975,810 | ) | | | (1,595,925 | ) |
Net dividends and distributions—Institutional Class | | | (9,508,545 | ) | | | (12,321,690 | ) |
| | |
|
|
| |
|
|
|
Net decrease in net assets resulting from distributions paid | | | (10,484,355 | ) | | | (13,917,615 | ) |
| | |
|
|
| |
|
|
|
| Fund share transactions: | | | | | | | | |
Shares sold—Advisor Class | | | 1,976,198 | | | | 7,168,556 | |
Shares issued to holders in reinvestment of dividends—Advisor Class | | | 924,231 | | | | 1,491,948 | |
Shares redeemed—Advisor Class | | | (9,941,230 | ) | | | (14,596,658 | ) |
Shares sold—Institutional Class | | | 24,122,854 | | | | 86,898,216 | |
Shares issued to holders in reinvestment of dividends—Institutional Class | | | 9,327,707 | | | | 12,049,084 | |
Shares redeemed—Institutional Class | | | (30,401,309 | ) | | | (69,108,827 | ) |
| | |
|
|
| |
|
|
|
Net increase (decrease) in net assets from share transactions | | | (3,991,549 | ) | | | 23,902,319 | |
| | |
|
|
| |
|
|
|
Net decrease in net assets | | | (22,719,706 | ) | | | (49,023,284 | ) |
| | |
| Net Assets: | | | | | | | | |
Beginning of period | | | 432,203,167 | | | | 481,226,451 | |
| | |
|
|
| |
|
|
|
End of period | | $ | 409,483,461 | | | $ | 432,203,167 | |
| | |
|
|
| |
|
|
|
| Change in shares outstanding: | | | | | | | | |
Shares sold—Advisor Class | | | 134,634 | | | | 441,871 | |
Shares issued to holders in reinvestment of dividends—Advisor Class | | | 62,702 | | | | 87,096 | |
Shares redeemed—Advisor Class | | | (677,700 | ) | | | (907,842 | ) |
Shares sold—Institutional Class | | | 1,650,770 | | | | 5,358,720 | |
Shares issued to holders in reinvestment of dividends—Institutional Class | | | 636,704 | | | | 707,521 | |
Shares redeemed—Institutional Class | | | (2,084,264 | ) | | | (4,317,982 | ) |
| | |
|
|
| |
|
|
|
Net increase (decrease) | | | (277,154 | ) | | | 1,369,384 | |
| | |
|
|
| |
|
|
|
The accompanying notes are an integral part of these financial statements.
65
PMC Funds
| | | | | | | | |
| Statements of Changes in Net Assets | |
| |
| | | Diversified Equity Fund
| |
| | |
| | | Six Months
Ended
February 28,
2023
(Unaudited)
| | | Year Ended
August 31,
2022
| |
| Operations: | | | | | | | | |
Net investment income | | $ | 6,371,131 | | | $ | 17,834,029 | |
Net realized gain on investments and foreign currency | | | 17,420,564 | | | | 18,110,194 | |
Net change in unrealized appreciation (depreciation) | | | 36,089,638 | | | | (204,917,579 | ) |
| | |
|
|
| |
|
|
|
Net increase (decrease) in net assets resulting from operations | | | 59,881,333 | | | | (168,973,356 | ) |
| | |
| Dividends and distributions to shareholders: | | | | | | | | |
Net dividends and distributions—Advisor Class | | | (2,458,329 | ) | | | (12,392,239 | ) |
Net dividends and distributions—Institutional Class | | | (21,858,127 | ) | | | (84,074,812 | ) |
| | |
|
|
| |
|
|
|
Net decrease in net assets resulting from distributions paid | | | (24,316,456 | ) | | | (96,467,051 | ) |
| | |
|
|
| |
|
|
|
| Fund share transactions: | | | | | | | | |
Shares sold—Advisor Class | | | 2,887,661 | | | | 7,572,421 | |
Shares issued to holders in reinvestment of dividends—Advisor Class | | | 2,215,697 | | | | 11,072,585 | |
Shares redeemed—Advisor Class | | | (16,335,974 | ) | | | (32,248,448 | ) |
Shares sold—Institutional Class | | | 48,040,774 | | | | 160,802,988 | |
Shares issued to holders in reinvestment of dividends—Institutional Class | | | 21,411,668 | | | | 81,786,080 | |
Shares redeemed—Institutional Class | | | (64,812,614 | ) | | | (134,799,799 | ) |
| | |
|
|
| |
|
|
|
Net increase (decrease) in net assets from share transactions | | | (6,592,788 | ) | | | 94,185,827 | |
| | |
|
|
| |
|
|
|
Net increase (decrease) in net assets | | | 28,972,089 | | | | (171,254,580 | ) |
| | |
| Net Assets: | | | | | | | | |
Beginning of period | | | 931,509,063 | | | | 1,102,763,643 | |
| | |
|
|
| |
|
|
|
End of period | | $ | 960,481,152 | | | $ | 931,509,063 | |
| | |
|
|
| |
|
|
|
| Change in shares outstanding: | | | | | | | | |
Shares sold—Advisor Class | | | 109,834 | | | | 250,610 | |
Shares issued to holders in reinvestment of dividends—Advisor Class | | | 86,315 | | | | 363,274 | |
Shares redeemed—Advisor Class | | | (624,746 | ) | | | (1,120,394 | ) |
Shares sold—Institutional Class | | | 1,858,697 | | | | 5,455,371 | |
Shares issued to holders in reinvestment of dividends—Institutional Class | | | 838,030 | | | | 2,696,541 | |
Shares redeemed—Institutional Class | | | (2,496,937 | ) | | | (4,671,737 | ) |
| | |
|
|
| |
|
|
|
Net increase (decrease) | | | (228,807 | ) | | | 2,973,665 | |
| | |
|
|
| |
|
|
|
The accompanying notes are an integral part of these financial statements.
66
PMC Core Fixed Income Fund—Advisor Class
| | | | | | | | | | | | | | | | | | | | | | | | |
| Financial Highlights | | | | | | | | | | | | | | | | | | |
| |
| | | Per Share Data for a Share Outstanding Throughout Each Year/Period | |
| | | | | | |
| | | Six Months
Ended
February 28,
2023
(Unaudited)
| | | Year
Ended
August 31,
2022
| | | Year
Ended
August 31,
2021
| | | Year
Ended
August 31,
2020
| | | Year
Ended
August 31,
2019
| | | Year
Ended
August 31,
2018
| |
Net asset value, beginning of year/period | | $ | 15.17 | | | $ | 17.74 | | | $ | 18.50 | | | $ | 17.65 | | | $ | 16.53 | | | $ | 17.05 | |
| | |
|
|
| |
|
|
| |
|
|
| |
|
|
| |
|
|
| |
|
|
|
| Income from investment operations: | | | | | | | | | | | | | | | | | | | | | | | | |
Net investment income(1) | | | 0.19 | | | | 0.25 | | | | 0.27 | | | | 0.35 | | | | 0.42 | | | | 0.37 | |
Net realized and unrealized gain (loss) | | | (0.49 | ) | | | (2.36 | ) | | | 0.01 | | | | 0.92 | | | | 1.09 | | | | (0.61 | ) |
| | |
|
|
| |
|
|
| |
|
|
| |
|
|
| |
|
|
| |
|
|
|
Total from investment operations | | | (0.30 | ) | | | (2.11 | ) | | | 0.28 | | | | 1.27 | | | | 1.51 | | | | (0.24 | ) |
| | |
|
|
| |
|
|
| |
|
|
| |
|
|
| |
|
|
| |
|
|
|
| Less distributions paid: | | | | | | | | | | | | | | | | | | | | | | | | |
Dividends from net investment income | | | (0.33 | ) | | | (0.24 | ) | | | (0.33 | ) | | | (0.40 | ) | | | (0.39 | ) | | | (0.28 | ) |
Distributions from net realized gains | | | — | | | | (0.22 | ) | | | (0.71 | ) | | | (0.02 | ) | | | — | | | | 0.00 | (4) |
| | |
|
|
| |
|
|
| |
|
|
| |
|
|
| |
|
|
| |
|
|
|
Total distributions paid | | | (0.33 | ) | | | (0.46 | ) | | | (1.04 | ) | | | (0.42 | ) | | | (0.39 | ) | | | (0.28 | ) |
| | |
|
|
| |
|
|
| |
|
|
| |
|
|
| |
|
|
| |
|
|
|
Net asset value, end of year/period | | $ | 14.54 | | | $ | 15.17 | | | $ | 17.74 | | | $ | 18.50 | | | $ | 17.65 | | | $ | 16.53 | |
| | |
|
|
| |
|
|
| |
|
|
| |
|
|
| |
|
|
| |
|
|
|
Total return(2) | | | -1.97 | % | | | -12.20 | % | | | 1.53 | % | | | 7.39 | % | | | 9.37 | % | | | -1.42 | % |
| | | | | | |
| Ratios / supplemental data | | | | | | | | | | | | | | | | | | | | | | | | |
Net assets, end of year/period (000’s) | | $ | 39,709 | | | $ | 48,723 | | | $ | 63,678 | | | $ | 121,267 | | | $ | 399,389 | | | $ | 398,089 | |
Ratio of expenses to average net assets before waiver and reimbursements(3) | | | 1.15 | % | | | 1.13 | % | | | 1.22 | % | | | 1.31 | % | | | 1.28 | % | | | 1.30 | % |
Ratio of expenses to average net assets after waiver and reimbursements(3) | | | 0.85 | % | | | 0.85 | % | | | 0.92 | %(6) | | | 1.00 | %(5) | | | 1.00 | %(5) | | | 1.00 | %(5) |
Ratio of net investment income to average net assets before waiver and reimbursements(3) | | | 2.37 | % | | | 1.22 | % | | | 1.22 | % | | | 1.72 | % | | | 2.22 | % | | | 1.91 | % |
Ratio of net investment income to average net assets after waiver and reimbursements(3) | | | 2.67 | % | | | 1.50 | % | | | 1.52 | % | | | 2.03 | % | | | 2.50 | % | | | 2.21 | % |
Portfolio turnover rate(2) | | | 95.1 | % | | | 201.7 | % | | | 227.0 | % | | | 180.7 | % | | | 144.3 | % | | | 160.1 | % |
| (1) | | Per share net investment income was calculated using average shares outstanding. |
| (2) | | Not annualized for periods less than one year. |
| (3) | | Annualized for periods less than one year. |
| (4) | | Round to less than 0.5 cent per share. |
| (5) | | Reflects expense cap of 0.75% (plus Rule 12b-1 fees of 0.25%). |
| (6) | | Effective January 26, 2021, the expense limitation cap was reduced from 0.75% to 0.60% (plus Rule 12b-1 fees of 0.25%). |
The accompanying notes are an integral part of these financial statements.
67
PMC Core Fixed Income Fund—Institutional Class
| | | | | | | | | | | | | | | | | | | | |
| Financial Highlights | | | | | | | | | | | | | | | |
|
| Per Share Data for a Share Outstanding Throughout Each Year/Period | |
| | | | | |
| | | Six Months
Ended
February 28,
2023
(Unaudited)
| | | Year
Ended
August 31,
2022
| | | Year
Ended
August 31,
2021
| | | Year
Ended
August 31,
2020
| | | Period
Ended
August 31,
2019(1)
| |
Net asset value, beginning of year/period | | $ | 15.11 | | | $ | 17.67 | | | $ | 18.47 | | | $ | 17.66 | | | $ | 17.23 | |
| | |
|
|
| |
|
|
| |
|
|
| |
|
|
| |
|
|
|
| Income from investment operations: | | | | | | | | | | | | | | | | | | | | |
Net investment income(2) | | | 0.21 | | | | 0.29 | | | | 0.30 | | | | 0.39 | | | | 0.07 | |
Net realized and unrealized gain (loss) | | | (0.49 | ) | | | (2.35 | ) | | | 0.02 | | | | 0.92 | | | | 0.36 | |
| | |
|
|
| |
|
|
| |
|
|
| |
|
|
| |
|
|
|
Total from investment operations | | | (0.28 | ) | | | (2.06 | ) | | | 0.32 | | | | 1.31 | | | | 0.43 | |
| | |
|
|
| |
|
|
| |
|
|
| |
|
|
| |
|
|
|
| Less distributions paid: | | | | | | | | | | | | | | | | | | | | |
Dividends from net investment income | | | (0.38 | ) | | | (0.28 | ) | | | (0.41 | ) | | | (0.48 | ) | | | — | |
Distributions from net realized gains | | | — | | | | (0.22 | ) | | | (0.71 | ) | | | (0.02 | ) | | | — | |
| | |
|
|
| |
|
|
| |
|
|
| |
|
|
| |
|
|
|
Total distributions paid | | | (0.38 | ) | | | (0.50 | ) | | | (1.12 | ) | | | (0.50 | ) | | | — | |
| | |
|
|
| |
|
|
| |
|
|
| |
|
|
| |
|
|
|
Net asset value, end of year/period | | $ | 14.45 | | | $ | 15.11 | | | $ | 17.67 | | | $ | 18.47 | | | $ | 17.66 | |
| | |
|
|
| |
|
|
| |
|
|
| |
|
|
| |
|
|
|
Total return(3) | | | -1.89 | % | | | -11.95 | % | | | 1.77 | % | | | 7.65 | % | | | 2.50 | % |
| | | | | |
| Ratios / supplemental data | | | | | | | | | | | | | | | | | | | | |
Net assets, end of year/period (000’s) | | $ | 369,775 | | | $ | 383,481 | | | $ | 417,548 | | | $ | 284,610 | | | $ | 1 | |
Ratio of expenses to average net assets before waiver and reimbursements(4) | | | 0.90 | % | | | 0.88 | % | | | 0.96 | % | | | 1.06 | % | | | 0.75 | % |
Ratio of expenses to average net assets after waiver and reimbursements(4) | | | 0.60 | % | | | 0.60 | % | | | 0.66 | %(5) | | | 0.75 | % | | | 0.75 | % |
Ratio of net investment income to average net assets before waiver and reimbursements(4) | | | 2.63 | % | | | 1.49 | % | | | 1.42 | % | | | 1.87 | % | | | 2.33 | % |
Ratio of net investment income to average net assets after waiver and reimbursements(4) | | | 2.93 | % | | | 1.77 | % | | | 1.72 | % | | | 2.18 | % | | | 2.33 | % |
Portfolio turnover rate(3) | | | 95.1 | % | | | 201.7 | % | | | 227.0 | % | | | 180.7 | % | | | 144.3 | % |
| (1) | | Institutional Class shares commenced operations on July 1, 2019. |
| (2) | | Per share net investment income was calculated using average shares outstanding. |
| (3) | | Not annualized for periods less than one year. |
| (4) | | Annualized for periods less than one year. |
| (5) | | Effective January 26, 2021, the expense limitation cap was reduced from 0.75% to 0.60%. |
The accompanying notes are an integral part of these financial statements.
68
PMC Diversified Equity Fund—Advisor Class
| | | | | | | | | | | | | | | | | | | | | | | | |
| Financial Highlights | |
| |
| | | Per Share Data for a Share Outstanding Throughout Each Year/Period | |
| | | | | | |
| | | Six Months
Ended
February 28,
2023
(Unaudited)
| | | Year
Ended
August 31,
2022
| | | Year
Ended
August 31,
2021
| | | Year
Ended
August 31,
2020
| | | Year
Ended
August 31,
2019
| | | Year
Ended
August 31,
2018
| |
Net asset value, beginning of year/period | | $ | 25.83 | | | $ | 33.27 | | | $ | 25.61 | | | $ | 23.77 | | | $ | 28.40 | | | $ | 26.68 | |
| | |
|
|
| |
|
|
| |
|
|
| |
|
|
| |
|
|
| |
|
|
|
| Income (loss) from investment operations: | | | | | | | | | | | | | | | | | | | | | | | | |
Net investment income(1) | | | 0.15 | | | | 0.43 | | | | 0.32 | | | | 0.29 | | | | 0.34 | | | | 0.19 | |
Net realized and unrealized gain (loss) | | | 1.48 | | | | (5.10 | ) | | | 7.61 | | | | 1.86 | | | | (2.21 | ) | | | 3.08 | |
| | |
|
|
| |
|
|
| |
|
|
| |
|
|
| |
|
|
| |
|
|
|
Total from investment operations | | | 1.63 | | | | (4.67 | ) | | | 7.93 | | | | 2.15 | | | | (1.87 | ) | | | 3.27 | |
| | |
|
|
| |
|
|
| |
|
|
| |
|
|
| |
|
|
| |
|
|
|
| Less distributions paid: | | | | | | | | | | | | | | | | | | | | | | | | |
Dividends from net investment income | | | (0.29 | ) | | | (0.53 | ) | | | (0.27 | ) | | | (0.31 | ) | | | (0.17 | ) | | | (0.17 | ) |
Distributions from net realized gains | | | (0.34 | ) | | | (2.24 | ) | | | — | | | | — | | | | (2.59 | ) | | | (1.38 | ) |
| | |
|
|
| |
|
|
| |
|
|
| |
|
|
| |
|
|
| |
|
|
|
Total distributions paid | | | (0.63 | ) | | | (2.77 | ) | | | (0.27 | ) | | | (0.31 | ) | | | (2.76 | ) | | | (1.55 | ) |
| | |
|
|
| |
|
|
| |
|
|
| |
|
|
| |
|
|
| |
|
|
|
Net asset value, end of year/period | | $ | 26.83 | | | $ | 25.83 | | | $ | 33.27 | | | $ | 25.61 | | | $ | 23.77 | | | $ | 28.40 | |
| | |
|
|
| |
|
|
| |
|
|
| |
|
|
| |
|
|
| |
|
|
|
Total return(2) | | | 6.44 | % | | | -15.34 | % | | | 31.20 | % | | | 9.01 | % | | | -5.54 | % | | | 12.50 | % |
| | | | | | |
| Ratios / supplemental data | | | | | | | | | | | | | | | | | | | | | | | | |
Net assets, end of year/period (000’s) | | $ | 99,635 | | | $ | 107,004 | | | $ | 154,671 | | | $ | 235,018 | | | $ | 818,269 | | | $ | 844,442 | |
Ratio of expenses to average net assets before waiver, reimbursements or recoupment(3) | | | 0.94 | % | | | 0.93 | % | | | 0.93 | % | | | 0.95 | % | | | 0.94 | % | | | 1.26 | % |
Ratio of expenses to average net assets after waiver, reimbursements or recoupment(3) | | | 0.94 | % | | | 0.93 | % | | | 0.97 | %(4) | | | 0.98 | %(4) | | | 0.98 | %(4) | | | 1.25 | %(5) |
Ratio of net investment income to average net assets before waiver, reimbursements or recoupment(3) | | | 1.16 | % | | | 1.46 | % | | | 1.14 | % | | | 1.21 | % | | | 1.42 | % | | | 0.67 | % |
Ratio of net investment income to average net assets after waiver, reimbursements or recoupment(3) | | | 1.16 | % | | | 1.46 | % | | | 1.10 | % | | | 1.18 | % | | | 1.38 | % | | | 0.68 | % |
Portfolio turnover rate(2) | | | 62.2 | % | | | 59.6 | % | | | 72.3 | % | | | 55.1 | % | | | 111.4 | % | | | 104.3 | % |
| (1) | | Per share net investment income was calculated using average shares outstanding. |
| (2) | | Not annualized for periods less than one year. |
| (3) | | Annualized for periods less than one year. |
| (4) | | Reflects expense cap of 0.73% (plus Rule 12b-1 fees of 0.25%). |
| (5) | | Effective June 1, 2018 the expense limitation cap was reduced from 1.35% to 0.98%. This reflects the expense limitation cap of 1.10% from September 1, 2017 through May 31, 2018 (plus Rule 12b-1 fees of 0.25%) and 0.73% from June 1, 2018 through August 31, 2018 (plus Rule 12b-1 fees of 0.25%). |
The accompanying notes are an integral part of these financial statements.
69
PMC Diversified Equity Fund—Institutional Class
| | | | | | | | | | | | | | | | | | | | |
| Financial Highlights | |
|
| Per Share Data for a Share Outstanding Throughout Each Year/Period | |
| | | | | |
| | | Six Months
Ended
February 28,
2023
(Unaudited)
| | | Year
Ended
August 31,
2022
| | | Year
Ended
August 31,
2021
| | | Year
Ended
August 31,
2020
| | | Period
Ended
August 31,
2019(1)
| |
Net asset value, beginning of year/period | | $ | 25.75 | | | $ | 33.22 | | | $ | 25.59 | | | $ | 23.78 | | | $ | 24.69 | |
| | |
|
|
| |
|
|
| |
|
|
| |
|
|
| |
|
|
|
| Income from investment operations: | | | | | | | | | | | | | | | | | | | | |
Net investment income(2) | | | 0.18 | | | | 0.51 | | | | 0.42 | | | | 0.39 | | | | 0.06 | |
Net realized and unrealized gain (loss) | | | 1.48 | | | | (5.09 | ) | | | 7.58 | | | | 1.84 | | | | (0.97 | ) |
| | |
|
|
| |
|
|
| |
|
|
| |
|
|
| |
|
|
|
Total from investment operations | | | 1.66 | | | | (4.58 | ) | | | 8.00 | | | | 2.23 | | | | (0.91 | ) |
| | |
|
|
| |
|
|
| |
|
|
| |
|
|
| |
|
|
|
| Less distributions paid: | | | | | | | | | | | | | | | | | | | | |
Dividends from net investment income | | | (0.35 | ) | | | (0.65 | ) | | | (0.37 | ) | | | (0.42 | ) | | | — | |
Distributions from net realized gains | | | (0.34 | ) | | | (2.24 | ) | | | — | | | | — | | | | — | |
| | |
|
|
| |
|
|
| |
|
|
| |
|
|
| |
|
|
|
Total distributions paid | | | (0.69 | ) | | | (2.89 | ) | | | (0.37 | ) | | | (0.42 | ) | | | — | |
| | |
|
|
| |
|
|
| |
|
|
| |
|
|
| |
|
|
|
Net asset value, end of year/period | | $ | 26.72 | | | $ | 25.75 | | | $ | 33.22 | | | $ | 25.59 | | | $ | 23.78 | |
| | |
|
|
| |
|
|
| |
|
|
| |
|
|
| |
|
|
|
Total return(3) | | | 6.57 | % | | | -15.13 | % | | | 31.56 | % | | | 9.36 | % | | | -3.69 | % |
| | | | | |
| Ratios / supplemental data | | | | | | | | | | | | | | | | | | | | |
Net assets, end of year/period (000’s) | | $ | 860,846 | | | $ | 824,505 | | | $ | 948,092 | | | $ | 664,055 | | | $ | 1 | |
Ratio of expenses to average net assets(4) | | | 0.69 | % | | | 0.68 | % | | | 0.68 | % | | | 0.71 | % | | | 0.73 | % |
Ratio of net investment income to average net assets(4) | | | 1.40 | % | | | 1.73 | % | | | 1.43 | % | | | 1.64 | % | | | 1.42 | % |
Portfolio turnover rate(3) | | | 62.2 | % | | | 59.6 | % | | | 72.3 | % | | | 55.1 | % | | | 111.4 | % |
| (1) | | Institutional Class shares commenced operations on July 1, 2019. |
| (2) | | Per share net investment income was calculated using average shares outstanding. |
| (3) | | Not annualized for periods less than one year. |
| (4) | | Annualized for periods less than one year. |
The accompanying notes are an integral part of these financial statements.
70
PMC FUNDS
Notes to Financial Statements
February 28, 2023 (Unaudited)
Trust for Professional Managers (the “Trust”) was organized as a Delaware statutory trust under a Declaration of Trust dated May 29, 2001. The Trust is registered under the Investment Company Act of 1940, as amended (the “1940 Act”), as an open-end management investment company. Each of the PMC Funds (each, a “Fund” and together, the “Funds”) represents a distinct series with its own investment objective and policies within the Trust. The investment objective of the PMC Core Fixed Income Fund (the “Core Fixed Income Fund”) is to provide current income consistent with low volatility of principal. The investment objective of the PMC Diversified Equity Fund (the “Diversified Equity Fund”) is long-term capital appreciation. The Trust may issue an unlimited number of shares of beneficial interest at $0.001 par value. The Advisor Class of the Core Fixed Income Fund became effective and commenced operations on September 28, 2007. The Institutional Class of the Core Fixed Income Fund became effective and commenced operations on July 1, 2019. The Advisor Class of the Diversified Equity Fund became effective and commenced operations on August 26, 2009. The Institutional Class of the Diversified Equity Fund became effective and commenced operations on July 1, 2019. The Advisor Class shares are subject to a 0.25% Rule 12b-1 distribution fee. Each class of shares has identical rights and privileges except with respect to distribution fees and voting rights on matters affecting a single class of shares. Envestnet Asset Management, Inc. (the “Adviser”) serves as the Funds’ investment adviser. Neuberger Berman Investment Advisers LLC serves as the Core Fixed Income Fund’s sub-adviser.
The Funds are investment companies and accordingly follow the investment company accounting and reporting guidance of the Financial Accounting Standards Board (FASB) Accounting Standard Codification Topic 946 “Financial Services-Investment Companies”.
| (2) | | Significant Accounting Policies |
The following is a summary of significant accounting policies consistently followed by the Funds in the preparation of the financial statements. These policies are in conformity with accounting principles generally accepted in the United States of America (“GAAP”).
Each security owned by the Funds that is listed on a securities exchange, except for securities listed on the NASDAQ Stock Market, LLC (“NASDAQ”), is valued at its last sale price on that exchange on the date as of which assets are valued. If the security is listed on more than one exchange, the Funds will use the price of the exchange that the Funds generally consider to be the principal exchange on which the stock is traded.
Fund securities listed on the NASDAQ will be valued at the NASDAQ Official Closing Price, which may not necessarily represent the last sale price. If there has been no sale on such exchange or on NASDAQ on such day, the security is valued at the mean between the bid and asked prices on such day or at the latest sale price on the Composite Market (defined as the consolidation of the trade information provided by national securities and foreign exchanges and over-the-counter markets as published by an approved pricing service (“Pricing Service”)).
Debt securities, including short-term debt instruments having a maturity of 60 days or less, are valued at the mean in accordance with prices supplied by an approved Pricing Service. Pricing Services may use various valuation methodologies such as the mean between the bid and the asked prices, matrix pricing and other analytical pricing models as well as market transactions and dealer quotations. If a price is not available from a Pricing Service, the most recent quotation obtained from one or more broker-dealers know to follow the issue will be obtained. Quotations will be valued at the mean between the bid and the offer. Any discount or premium is accreted or amortized using the constant yield method over the life of the security, or where applicable, the first call date of the security.
Money market funds, demand notes and repurchase agreements are valued at cost. If cost does not represent current market value the securities will be priced at fair value.
Redeemable securities issued by open-end, registered investment companies are valued at the net asset values (“NAVs”) of such companies for purchase and/or redemption orders placed on that day. All exchange-traded funds are valued at the last reported sale price on the exchange on which the security is principally traded.
71
PMC FUNDS
Notes to Financial Statements, continued
February 28, 2023 (Unaudited)
Futures contracts are valued at the last settlement price at the close of trading on the relevant exchange or board of trade. Futures contracts for which reliable market quotations are not readily available shall each be valued at a price, supplied by a Pricing Service approved by the Trust’s Board of Trustees (the “Board”) which is in the opinion of such Pricing Service representative of the market value of such positions at the time of determination of the NAV, it being the opinion of the Board that the valuations supplied by such Pricing Service accurately reflect the fair value of such position.
Forward foreign currency contracts are valued at the mean between the bid and asked prices.
If market quotations are not readily available, any security or other financial instrument is valued at its fair value in accordance with Rule 2a-5 of the 1940 Act as determined under the Adviser’s fair value pricing procedures, subject to oversight by the Board. These fair value procedures will also be used to price a security when corporate events, events in the securities market and/or world events cause the Adviser to believe that a security’s last sale price may not reflect its actual market value. The intended effect of using fair value pricing procedures is to ensure that the Funds are accurately priced. The Adviser will regularly evaluate whether the Funds’ fair value pricing procedures continue to be appropriate in light of the specific circumstances of each Fund and the quality of prices obtained through application of such procedures.
FASB Accounting Standards Codification, “Fair Value Measurement” Topic 820 (“ASC 820”), establishes an authoritative definition of fair value and sets out a hierarchy for measuring fair value. ASC 820 requires an entity to evaluate certain factors to determine whether there has been a significant decrease in volume and level of activity for the security such that recent transactions and quoted prices may not be determinative of fair value and further analysis and adjustment may be necessary to estimate fair value. ASC 820 also requires enhanced disclosure regarding the inputs and valuation techniques used to measure fair value in those instances as well as expanded disclosure of valuation levels for major security types. These inputs are summarized in the three broad levels listed below:
| | • | | Level 1—Quoted prices in active markets for identical securities. |
| | • | | Level 2—Other significant observable inputs (including quoted prices for similar securities, interest rates, prepayment speeds, credit risk, etc.). |
| | • | | Level 3—Significant unobservable inputs (including the Funds’ own assumptions in determining the fair value of investments). |
The inputs or methodology used for valuing securities are not necessarily an indication of the risk associated with investing in those securities. The following is a summary of the inputs used to value the Funds’ investments carried at fair value as of February 28, 2023:
Core Fixed Income Fund
| | | | | | | | | | | | | | | | |
| | | Level 1
| | | Level 2
| | | Level 3
| | | Total
| |
| Fixed Income Securities | | | | | | | | | | | | | | | | |
Asset Backed Securities | | $ | — | | | $ | 38,639,704 | | | $ | — | | | $ | 38,639,704 | |
Corporate Bonds* | | | — | | | | 142,413,414 | | | | — | | | | 142,413,414 | |
Foreign Corporate Bonds* | | | — | | | | 10,694,981 | | | | — | | | | 10,694,981 | |
Foreign Government Agency Issues | | | — | | | | 6,058,207 | | | | — | | | | 6,058,207 | |
Foreign Government Notes/Bonds | | | — | | | | 4,288,738 | | | | — | | | | 4,288,738 | |
Non-Agency Mortgage Backed Securities | | | — | | | | 26,864,531 | | | | — | | | | 26,864,531 | |
Agency Mortgage Backed Securities | | | — | | | | 121,697,323 | | | | — | | | | 121,697,323 | |
U.S. Government Agency Issues | | | — | | | | 1,862,316 | | | | — | | | | 1,862,316 | |
U.S. Government Notes/Bonds | | | — | | | | 62,685,506 | | | | — | | | | 62,685,506 | |
| | |
|
|
| |
|
|
| |
|
|
| |
|
|
|
| Total Fixed Income Securities | | | — | | | | 415,204,720 | | | | — | | | | 415,204,720 | |
72
PMC FUNDS
Notes to Financial Statements, continued
February 28, 2023 (Unaudited)
| | | | | | | | | | | | | | | | |
| | | Level 1
| | | Level 2
| | | Level 3
| | | Total
| |
| Exchange-Traded Funds | | | 223,229 | | | | — | | | | — | | | | 223,229 | |
| Money Market Funds | | | 23,161,482 | | | | — | | | | — | | | | 23,161,482 | |
| | |
|
|
| |
|
|
| |
|
|
| |
|
|
|
| Total Investments in Securities | | $ | 23,384,711 | | | $ | 415,204,720 | | | $ | — | | | $ | 438,589,431 | |
| | |
|
|
| |
|
|
| |
|
|
| |
|
|
|
| | * | | For further breakdown by industry, please refer to the Schedule of Investments. |
The Fund did not hold any Level 3 securities during the six months ended February 28, 2023.
Diversified Equity Fund
| | | | | | | | | | | | | | | | |
| | | Level 1
| | | Level 2
| | | Level 3^
| | | Total
| |
| Equity | | | | | | | | | | | | | | | | |
Common Stocks* | | $ | 697,873,324 | | | $ | 4,711,370 | | | $ | 215,135 | | | $ | 702,799,829 | |
Preferred Stocks* | | | 2,486,391 | | | | — | | | | 0 | | | | 2,486,391 | |
Exchange-Traded Funds | | | 226,187,711 | | | | — | | | | — | | | | 226,187,711 | |
Real Estate Investment Trusts* | | | 21,746,787 | | | | — | | | | — | | | | 21,746,787 | |
| | |
|
|
| |
|
|
| |
|
|
| |
|
|
|
| Total Equity | | | 948,294,213 | | | | 4,711,370 | | | | 215,135 | | | | 953,220,718 | |
| Money Market Funds | | | 291,945,618 | | | | — | | | | — | | | | 291,945,618 | |
| | |
|
|
| |
|
|
| |
|
|
| |
|
|
|
| Total Investments in Securities | | $ | 1,240,239,831 | | | $ | 4,711,370 | | | $ | 215,135 | | | $ | 1,245,166,336 | |
| | |
|
|
| |
|
|
| |
|
|
| |
|
|
|
| | * | | For further breakdown by industry, please refer to the Schedule of Investments. |
| | ^ | | The Fund measures Level 3 activity as of the end of each financial reporting period. |
As of February 28, 2023, the Diversified Equity Fund held level 3 investments that were valued at the most recent trade price in an inactive market. The Level 3 investments in securities represented less than 1% of the Diversified Equity Fund’s net assets and were not considered a significant portion of the Fund’s portfolio. As the Level 3 investments were not considered significant to the financial statements, a reconciliation of Level 3 investments for the six months ended February 28, 2023 is not presented.
Foreign currencies and other assets denominated in foreign currencies are translated to U.S. dollars at the exchange rate of such currencies against the U.S. dollar using the applicable currency exchange rate as of the close of the New York Stock Exchange (“NYSE”), generally at 4:00 P.M., Eastern time.
The Funds may use certain options, futures and forward foreign currency contracts (collectively, “derivative instruments”) as a substitute for a comparable market position in the underlying security, to attempt to hedge or limit the exposure of a Fund’s position, to create a synthetic money market position, for certain tax-related purposes and to effect closing transactions.
Options and futures prices can diverge from the prices of their underlying instruments. Options and futures prices are affected by such factors as current and anticipated short-term interest rates, changes in volatility of the underlying instrument and the time remaining until expiration of the contract, which may not affect security prices the same way. Imperfect or no correlation also may result from differing levels of demand in the options and futures markets and the securities markets, from structural differences in how options and futures and securities are traded and from imposition of daily price fluctuation limits or trading halts.
The Funds did not hold derivative instruments during the six months ended February 28, 2023.
| | (b) | | Foreign Securities and Currency |
Investment securities and other assets and liabilities denominated in foreign currencies are translated into U.S. dollar amounts at the date of valuation. Purchases and sales of investment securities and income and expense items denominated in foreign currencies are translated into U.S. dollar amounts on the respective dates of such transactions.
73
PMC FUNDS
Notes to Financial Statements, continued
February 28, 2023 (Unaudited)
The Funds isolate the portion of the results of operations from changes in foreign exchange rates on investments from those resulting from changes in market prices of securities held. Reported net realized foreign exchange gains or losses arise from sales of portfolio securities, sales and maturities of short-term securities, sales of foreign currencies, currency gains or losses realized between the trade and settlement dates on securities transactions, and the difference between the amounts of dividends, interest and foreign withholding taxes recorded on the Funds’ books, and the U.S. dollar equivalent of the amounts actually received or paid. Net unrealized foreign exchange gains and losses arise from changes in the values of assets and liabilities, including investments in securities at fiscal period end, resulting from changes in the exchange rate.
Investments in foreign securities entail certain risks. There may be a possibility of nationalization or expropriation of assets, confiscatory taxation, political or financial instability, and diplomatic developments that could affect the value of the Funds’ investments in certain foreign countries. Since foreign securities normally are denominated and traded in foreign currencies, the value of the Funds’ assets may be affected favorably or unfavorably by currency exchange rates, currency exchange control regulations, foreign withholding taxes, and restrictions or prohibitions on the repatriation of foreign currencies. There may be less information publicly available about a foreign issuer than about a U.S. issuer, and foreign issuers are not generally subject to accounting, auditing, and financial reporting standards and practices comparable to those in the United States. The securities of some foreign issuers are less liquid and at times more volatile than securities of comparable U.S. issuers.
The Funds may enter into futures contracts traded on domestic exchanges, including stock index futures contracts, as a substitute for a comparable market position in the underlying security, to attempt to hedge or limit the exposure of a Fund’s position, to create a synthetic money market position, for certain tax-related purposes and to effect closing transactions. Upon entering into a contract, the Funds deposit and maintain as collateral such initial margin as required by the exchange on which the transaction is effected. Pursuant to the contract, the Funds agree to receive from or pay to the broker an amount of cash equal to the daily fluctuation in value of the contract. Such receipts or payments are known as variation margin and are recorded by the Funds as unrealized gains and losses. When the contract is closed, the Funds record a realized gain or loss equal to the difference between the value of the contract at the time it was opened and the value at the time it was closed. A stock index futures contract does not involve the physical delivery of the underlying stocks in the index. As collateral for futures contracts, the Funds are required to maintain assets consisting of cash, cash equivalents or liquid securities. This collateral is required to be adjusted daily to reflect the market value of the purchase obligation for long futures contracts or the market value of the instrument underlying the contract, but not less than the market price at which the futures contract was established, for short futures contracts. The Funds did not enter into any futures contracts during the six months ended February 28, 2023.
The risks inherent in the use of futures contracts include 1) adverse changes in the value of such instruments and 2) the possible absence of a liquid secondary market for any particular instrument at any time. Futures contracts may also expose the Funds to counterparty credit risk. The Funds will not enter into these contracts unless they own either 1) an offsetting position in the securities or 2) the position provides cash and liquid assets with a value marked-to-market daily, sufficient to cover the counter-party’s potential obligations.
| | (d) | | Forward Foreign Currency Contracts |
The Core Fixed Income Fund might purchase a particular currency or enter into a forward foreign currency contract to preserve the U.S. dollar price of securities it intends to or has contracted to purchase. Alternatively, it might sell a particular currency on either a spot or forward basis to hedge against an anticipated decline in the dollar value of securities it intends to or has contracted to sell. Although this strategy could minimize the risk of loss due to a decline in the value of the hedged currency, it could also
74
PMC FUNDS
Notes to Financial Statements, continued
February 28, 2023 (Unaudited)
limit any potential gain from an increase in the value of the currency. When entering into a forward foreign currency contract, the Fund agrees to receive or deliver a fixed quantity of foreign currency for an agreed-upon price at a future date. The market value of the contract fluctuates with changes in currency exchange rates. The contract is marked-to-market daily and the change in market value is recorded by the Fund as an unrealized gain or loss. The Fund records a realized gain or loss equal to the difference between the value of the contract at the time it was opened and the value at the time it was closed. The risks inherent in the use of currency forward exchange contracts include adverse changes in the value of such instruments and exposure to counterparty credit risk. Forward contracts are subject to the risks that the counterparty to such contract will default on its obligations. Since a forward foreign currency exchange contract is not guaranteed by an exchange or clearing house, a default on the contract would deprive the Fund of unrealized profits, transaction costs or the benefits of a currency hedge or force the Fund to cover its purchase or sale commitments, if any, at the current market price. The Fund did not enter into any forward foreign currency contracts during the six months ended February 28, 2023.
The Core Fixed Income Fund may enter into written call options to hedge against changes in the value of equities. The writing of call options is intended to reduce the volatility of the portfolio and to earn premium income. Written call options expose the Fund to minimal counterparty credit risk since they are exchange traded and the exchange’s clearing house guarantees the options against default. The Fund may also purchase put options to provide protection against adverse price effects from anticipated changes in prices of securities. In addition, the Fund may enter into written put options to hedge against changes in the value of purchased put options.
The Fund may purchase and write call and put options on securities and indices and enter into related closing transactions.
When the Fund writes an option, an amount equal to the premium received by the Fund is recorded as a liability and is subsequently adjusted to the current fair value of the option written. Premiums received from writing options that expire unexercised are treated by the Fund on the expiration date as realized gains from options written. The difference between the premium and the amount paid on effecting a closing purchase transaction, including brokerage commissions, is also treated as a realized gain, or, if the premium is less than the amount paid for the closing purchase transaction, as a realized loss. If a call option is exercised, the premium is added to the proceeds from the sale of the underlying security or currency in determining whether the Fund has realized a gain or a loss. If a put option is exercised, the premium is deducted from the cost basis of the security purchased. The Fund, as writer of an option, bears the market risk of an unfavorable change in the price of the security underlying the written option.
When purchasing options, the Fund will recognize a realized loss equal to the premium paid to purchase the option, if the option expires unexercised. The difference between the proceeds received on effecting a closing sale transaction and the premium paid will be recognized as a realized gain or loss. If a put option is exercised, the premium paid is deducted from the proceeds on the sale of the underlying security in determining whether the Fund has a realized gain or loss. The Fund did not enter into any options contracts during the six months ended February 28, 2023.
When the Funds loan securities held in their portfolios, the Funds receive compensation in the form of fees, or retain a portion of the interest on the investment of any cash received as collateral. The loans are secured by collateral at least equal to: (i) 105% of the market value of the loaned securities that are foreign securities, or 102% of the market value of any other loaned securities, at the time the securities are loaned; and (ii) 100% of the market value of the loaned securities at all times. Gain or loss in the value of securities loaned that may occur during the term of the loan will be for the account of the Funds. The Funds have the right under the lending agreement to recover the securities from the borrower on demand.
75
PMC FUNDS
Notes to Financial Statements, continued
February 28, 2023 (Unaudited)
The Funds comply with the requirements of Subchapter M of the Internal Revenue Code of 1986, as amended (the “Code”), necessary to qualify as a regulated investment company and make the requisite distributions of income and capital gains to their shareholders sufficient to relieve them from all or substantially all federal income taxes. Therefore, no federal income tax provision has been provided.
| | (h) | | Distributions to Shareholders |
The Funds will distribute net investment income and net realized capital gains at least annually. Distributions from net realized gains for book purposes may include short-term capital gains. All short-term capital gains are included in ordinary income for tax purposes. Distributions to shareholders are recorded on the ex-dividend date. The Funds may also pay a special distribution at the end of the calendar year to comply with federal tax requirements.
The preparation of financial statements in conformity with GAAP requires management to make estimates and assumptions that affect the reported amounts of assets and liabilities and disclosure of contingent assets and liabilities at the date of the financial statements and the reported amounts of revenues and expenses during the reporting period. Actual results could differ from those estimates.
The NAV per share of a Fund is calculated by dividing the sum of the value of the securities held by the Fund, plus cash or other assets, minus all liabilities (including estimated accrued expenses) by the total number of shares outstanding for the Fund, rounded to the nearest cent. The Funds’ shares will not be priced on the days on which the NYSE is closed for trading. The Funds do not charge a redemption fee, therefore the offering and redemption price per share are equal to a Fund’s net asset value per share.
| | (k) | | Allocation of Income, Expenses and Gains/Losses |
Income, expenses (other than those deemed attributable to a specific share class), and gains and losses of each Fund are allocated daily to each class of shares based upon the ratio of net assets represented by each class as a percentage of the net assets of the Fund. Expenses deemed directly attributable to a class of shares are recorded by the specific class. Most expenses are allocated by class based on relative net assets. Distribution (Rule 12b-1) fees are expensed at 0.25% of average daily net assets of the Advisor Class shares of the Funds. Expenses associated with a specific fund in the Trust are charged to that fund. Common expenses are typically allocated evenly between the funds of the Trust or other equitable means.
Investment transactions are recorded on the trade date. The Funds determine the gain or loss from investment transactions on the identified cost basis by comparing the original cost of the security lot sold with the net sale proceeds. Dividend income is recognized on the ex-dividend date, and interest income is recognized on an accrual basis.
LIBOR, formerly known as the London Interbank Offered Rate, is an interest rate benchmark that will no longer be offered after June 30, 2023. The U.S. Congress passed the Adjustable Interest Rate (LIBOR) Act on March 15, 2022. The LIBOR Act replaces references to LIBOR for U.S. contracts that will not mature before June 30, 2023 with benchmark replacements based on the Secured Overnight Financing Rate (“SOFR”). SOFR is
76
PMC FUNDS
Notes to Financial Statements, continued
February 28, 2023 (Unaudited)
a broad measure of the cost of borrowing cash overnight collateralized by U.S. Treasury securities and is published daily by the Federal Reserve Bank of New York. The benchmark replacement rate may not have the same value or economic equivalence as LIBOR. The transition from LIBOR could have a significant impact on the financial markets, including increased volatility and illiquidity in markets for instruments that currently rely on LIBOR to determine interest rates and a reduction in the values of some LIBOR-based investments. The transition to an alternative interest rate may not be orderly, may occur over various time periods or may have unintended consequences.
The tax character of distributions paid to shareholders were as follows:
| | | | | | | | |
Core Fixed Income Fund
| | Ordinary
Income
| | | Long-Term
Capital Gains
| |
Year Ended August 31, 2022 | | $ | 9,240,233 | | | $ | 4,677,382 | |
Year Ended August 31, 2021 | | $ | 18,061,447 | | | $ | 6,455,736 | |
| | | | | | | | |
Diversified Equity Fund
| | Ordinary
Income
| | | Long-Term
Capital Gains
| |
Year Ended August 31, 2022 | | $ | 21,468,568 | | | $ | 74,998,483 | |
Year Ended August 31, 2021 | | $ | 12,172,244 | | | $ | — | |
As of August 31, 2022, the components of accumulated earnings (losses) for income tax purposes were as follows:
| | | | | | | | |
| | | Core Fixed
Income
Fund
| | | Diversified
Equity Fund
| |
Cost basis of investments for federal income tax purposes | | $ | 521,337,713 | | | $ | 975,588,223 | |
| | |
|
|
| |
|
|
|
Gross tax unrealized appreciation | | $ | 605,550 | | | $ | 155,426,128 | |
Gross tax unrealized depreciation | | | (43,759,713 | ) | | | (79,654,039 | ) |
| | |
|
|
| |
|
|
|
Net tax unrealized appreciation | | $ | (43,154,163 | ) | | $ | 75,772,089 | |
| | |
|
|
| |
|
|
|
Undistributed ordinary income | | $ | 6,443,256 | | | $ | 12,064,740 | |
Undistributed long-term capital gain | | | — | | | | 12,251,579 | |
| | |
|
|
| |
|
|
|
Total distributable earnings | | $ | 6,443,256 | | | $ | 24,316,319 | |
Other accumulated loss | | | (14,488,321 | ) | | | (1,364,084 | ) |
| | |
|
|
| |
|
|
|
Total accumulated earnings | | $ | (51,199,228 | ) | | $ | 98,724,324 | |
| | |
|
|
| |
|
|
|
The difference between book-basis and tax-basis cost is attributable primarily to the tax deferral of losses on wash sale adjustments.
At August 31, 2022, the Core Fixed Income Fund deferred, on a tax basis, post-October capital losses of $14,488,321.
Additionally, GAAP requires that certain components of net assets relating to permanent differences be reclassified between financial and tax reporting. These reclassifications have no effect on net assets or net asset value per share. For the year ended August 31, 2022, no reclassifications were made between total distributable earnings and paid in capital.
The Funds had no material uncertain tax positions and have not recorded a liability for unrecognized tax benefits as of August 31, 2022. Also, the Funds recognized no interest and penalties related to uncertain tax benefits in fiscal year 2022. At August 31, 2022, the fiscal years 2019 through 2022 remain open to examination in the Funds’ major tax jurisdictions.
77
PMC FUNDS
Notes to Financial Statements, continued
February 28, 2023 (Unaudited)
The Trust has entered into an Investment Advisory Agreement (the “Agreement”), on behalf of the Funds, with the Adviser to furnish investment advisory services to the Funds. Under terms of the Agreement, the Trust, on behalf of the Funds, the Adviser is entitled to receive from the Diversified Equity Fund a management fee equal to 0.53% of the Fund’s average daily net assets and is entitled to receive from the Core Fixed Income Fund a management fee equal to 0.65% of the Fund’s average daily net assets if the Fund’s net assets are $2,500,000,000 or less; 0.625% if the Fund’s net assets are greater than $2,500,000,000 but less than $5,000,000,000; and 0.60% if the Fund’s assets are greater than $5,000,000,000.
The Adviser has contractually agreed to waive its management fees and/or reimburse other expenses of each Fund at least through December 29, 2023 to the extent necessary to ensure that the Fund’s total annual operating expenses (excluding front-end or contingent deferred sales loads, Rule 12b-1 plan fees, shareholder servicing plan fees, taxes, leverage, interest, brokerage commissions and other transactional expenses, expenses incurred in connections with any merger or reorganizations, dividends or interest on short positions, acquired fund fees and expenses, or extraordinary expenses such as litigation) do not exceed 0.60% for the Core Fixed Income Fund and 0.73% for the Diversified Equity Fund (the “Expense Limitation Cap”) of each Fund’s average daily net assets.
Any such waiver or reimbursement is subject to later adjustment to allow the Adviser to recoup amounts waived or reimbursed to the extent actual fees and expenses for a fiscal period do not exceed the lesser of: (1) the Expense Limitation Cap in place at the time of the waiver or reimbursement or (2) the Expense Limitation Cap in place at the time of recoupment; provided, however, that the Adviser shall only be entitled to recoup such amounts over the following three year period from the date of the waiver or reimbursement.
The following table shows the remaining waived or reimbursed expenses subject to potential recovery expiring by:
| | | | | | | | |
| | | Core Fixed
Income Fund
| | | Diversified
Equity Fund
| |
August 31, 2023 | | $ | 741,170 | | | $ | — | |
August 31, 2024 | | $ | 1,255,760 | | | $ | — | |
August 31, 2025 | | $ | 1,309,991 | | | $ | — | |
February 28, 2026 | | $ | 622,642 | | | $ | — | |
Sub-advisory services are provided to the Core Fixed Income Fund, pursuant to an agreement between the Adviser and Neuberger Berman Investment Advisers LLC (the “Sub-Adviser”). Under the terms of the sub-advisory agreement, the Adviser compensates the Sub-Adviser based on the Fund’s average daily net assets.
The Trust has adopted a Distribution Plan pursuant to Rule 12b-1 under the 1940 Act (the “12b-1 Plan”), on behalf of the Advisor Class shares of the Funds, which authorizes the Trust to pay Foreside Fund Services, LLC (the “Distributor”), the Funds’ principal distributor, a distribution fee of 0.25% of each Fund’s average daily net assets of Advisor Class shares. During the six months ended February 28, 2023, the Funds incurred fees pursuant to the 12b-1 Plan as follows:
| | | | |
Core Fixed Income Fund | | $ | 54,112 | |
Diversified Equity Fund | | $ | 127,395 | |
| (6) | | Related Party Transactions |
U.S. Bancorp Fund Services, LLC (doing business as U.S. Bank Global Fund Services (“Fund Services”)) acts as the Funds’ Administrator under an Administration Agreement. Fund Services prepares various federal and state regulatory filings, reports and returns for the Funds; prepares reports and materials to be supplied to the
78
PMC FUNDS
Notes to Financial Statements, continued
February 28, 2023 (Unaudited)
Trustees; monitors the activities of the Funds’ custodian, transfer agent and accountants; coordinates the preparation and payment of the Funds’ expenses and reviews the Funds’ expense accruals. Fees incurred for the six months ended February 28, 2023, and owed as of February 28, 2023, are as follows:
| | | | | | | | |
| | | Incurred
| | | Owed
| |
Core Fixed Income Fund | | $ | 106,237 | | | $ | 34,127 | |
Diversified Equity Fund | | $ | 216,948 | | | $ | 75,527 | |
Fund Services also serves as the fund accountant and transfer agent to the Funds. U.S. Bank, N.A. (“U.S. Bank”), an affiliate of Fund Services, serves as each Fund’s custodian. Fees incurred for the six months ended February 28, 2023, and owed as of February 28, 2023 are as follows:
| | | | | | | | |
Fund Accounting
| | Incurred
| | | Owed
| |
Core Fixed Income Fund | | $ | 115,892 | | | $ | 37,983 | |
Diversified Equity Fund | | $ | 128,495 | | | $ | 44,141 | |
| | | | | | | | |
Transfer Agency
| | Incurred
| | | Owed
| |
Core Fixed Income Fund | | $ | 159,671 | | | $ | 54,076 | |
Diversified Equity Fund | | $ | 215,100 | | | $ | 72,519 | |
| | | | | | | | |
Custody
| | Incurred
| | | Owed
| |
Core Fixed Income Fund | | $ | 37,043 | | | $ | 13,406 | |
Diversified Equity Fund | | $ | 55,052 | | | $ | 19,686 | |
The Funds each have an unsecured line of credit with U.S. Bank (see Note 8).
Certain officers of the Funds are also employees of Fund Services. A Trustee of the Trust is affiliated with Fund Services and U.S. Bank.
The Trust’s Chief Compliance Officer is also an employee of Fund Services. Each Fund’s allocation of the Trust’s Chief Compliance Officer fee incurred for the six months ended February 28, 2023, and owed as of February 28, 2023 is as follows:
| | | | | | | | |
| | | Incurred
| | | Owed
| |
Core Fixed Income Fund | | $ | 8,688 | | | $ | 2,854 | |
Diversified Equity Fund | | $ | 6,154 | | | $ | 1,986 | |
| (7) | | Investment Transactions |
Purchases and sales of investment securities (excluding short-term instruments) for the six months ended February 28, 2023 are summarized below.
| | | | | | | | |
| | | Core Fixed
Income Fund
| | | Diversified
Equity Fund
| |
Purchases: | | | | | | | | |
U.S. Government | | $ | 235,877,879 | | | $ | — | |
Other | | | 161,367,491 | | | | 576,804,147 | |
| | |
|
|
| |
|
|
|
Total Purchases | | $ | 397,245,370 | | | $ | 576,804,147 | |
Sales | | | | | | | | |
U.S. Government | | $ | 213,061,772 | | | $ | — | |
Other | | | 203,672,449 | | | | 599,760,117 | |
| | |
|
|
| |
|
|
|
Total Sales | | $ | 416,734,221 | | | $ | 599,760,117 | |
79
PMC FUNDS
Notes to Financial Statements, continued
February 28, 2023 (Unaudited)
At February 28, 2023, the Core Fixed Income Fund and Diversified Equity Fund had unsecured lines of credit in the lesser amount of $20,000,000 and $35,000,000, respectively, or 33.33% of the fair value of unencumbered assets of each Fund, as defined, which both mature August 5, 2023. These unsecured lines of credit are intended to provide short-term financing, if necessary, subject to certain restrictions, in connection with shareholder redemptions. The credit facility is with the Funds’ custodian, U.S. Bank. Interest was scheduled to be incurred at the bank’s prime rate of 5.50% from September 1, 2022 through September 21, 2022, 6.25% from September 22, 2022 through November 2, 2022, 7.00% from November 3, 2022 through December 14, 2022, 7.50% from December 15, 2022 through February 1, 2023, and 7.75% from February 2, 2023 through February 28, 2023. The following table provides information regarding usage of the line of credit for the six months ended February 28, 2023 for the Funds. The Core Fixed Income Fund did not have an outstanding balance on its line of credit as of February 28, 2023. The Diversified Equity Fund had an outstanding balance of $108,000 on its line of credit as of February 28, 2023.
| | | | | | | | | | | | | | | | | | | | |
| | | Days
Utilitized
| | | Average
Amount of
Borrowing
| | | Interest
Expense*
| | | Maximum
Amount of
Borrowing
| | | Date of
Maximum
Borrowing
| |
Core Fixed Income Fund | | | 7 | | | $ | 27,000 | | | $ | 38 | | | $ | 45,000 | | | | 1/30/2023 | |
Diversified Equity Fund | | | 15 | | | $ | 6,702,400 | | | $ | 20,965 | | | $ | 32,269,000 | | | | 1/6/2023 | |
| * | | Interest expense is reported within Other Expenses on the Statements of Operations. |
Pursuant to the terms of a securities lending agreement with U.S. Bank, each Fund may lend securities from its portfolio to brokers, dealers and financial institutions in order to increase the return on its portfolio, primarily through the receipt of borrowing fees and earnings on invested collateral. Any such loan must be continuously secured by collateral in cash or cash equivalents maintained on a current basis in an amount at least equal to the market value of the securities loaned by a Fund. During the time securities are on loan, the borrower will pay the applicable Fund any accrued income on those securities, and the Fund may invest the cash collateral and earn income or receive an agreed-upon fee from a borrower that has delivered cash-equivalent collateral. In determining whether or not to lend a security to a particular broker, dealer or financial institution, the Adviser considers all relevant facts and circumstances, including the size, creditworthiness and reputation of the broker, dealer or financial institution.
Securities lending involves the risk of a default or insolvency of the borrower. In either of these cases, a Fund could experience delays in recovering securities or collateral or could lose all or part of the value of the loaned securities. A Fund also could lose money in the event of a decline in the value of the collateral provided for loaned securities. Additionally, the loaned portfolio securities may not be available to a Fund on a timely basis and that Fund may therefore lose the opportunity to sell the securities at a desirable price. Any decline in the value of a security that occurs while the security is out on loan would continue to be borne by the applicable Fund.
As of February 28, 2023, the value of the securities on loan and value of collateral received for securities lending were as follows:
| | | | | | | | | | | | |
| | | Loaned Securities
Value
| | | Value of Cash Collateral
| | | % of Net Assets
| |
Core Fixed Income Fund | | $ | 20,809,116 | | | $ | 21,255,649 | | | | 5.08 | % |
Diversified Equity Fund | | $ | 279,360,854 | | | $ | 287,724,513 | | | | 29.09 | % |
80
PMC FUNDS
Notes to Financial Statements, continued
February 28, 2023 (Unaudited)
The Funds receive cash as collateral in return for securities lent as part of the securities lending program. The collateral is invested in the Mount Vernon Liquid Assets Portfolio, LLC. The Schedule of Investments for each Fund includes the particular cash collateral holding as of February 28, 2023. The remaining contractual maturity of all securities lending transactions is overnight and continuous.
The Funds are not subject to a master netting agreement with respect to securities lending; therefore, no additional disclosures regarding netting arrangements are required.
The fee and interest income earned by the Funds on investments of cash collateral received from borrowers for the securities loaned to them are reflected in the Funds’ Statements of Operations.
| (10) | | Recent Market Events |
U.S. and international markets have experienced volatility in recent months and years due to a number of economic, political and global macro factors including the impact of the coronavirus (COVID-19) as a global pandemic, uncertainties regarding interest rates, rising inflation, trade tensions, and the threat of tariffs imposed by the U.S. and other countries. The recovery from COVID-19 is proceeding at slower than expected rates and may last for a prolonged period of time. As a result of continuing political tensions and armed conflicts, including the war between Ukraine and Russia, the U.S. and the European Union imposed sanctions on certain Russian individuals and companies, including certain financial institutions, and have limited certain exports and imports to and from Russia. The war has contributed to recent market volatility and may continue to do so. Continuing market volatility as a result of recent market conditions or other events may have an adverse effect on the performance of the Funds.
On April 20, 2023, the Board approved the replacement of Deloitte & Touche LLP as the independent registered public accounting firm for the Funds. The reports of Deloitte & Touche LLP on the financial statements of the Funds for the past five fiscal years contained no adverse opinion or disclaimer of opinion, and were not qualified or modified as to uncertainty, audit scope or accounting principle.
In connection with its audits for the five most recent fiscal years and through April 20, 2023, there have been no disagreements with Deloitte & Touche LLP on any matter of accounting principles or practices, financial statement disclosure, or auditing scope or procedure, which disagreements, if not resolved to the satisfaction of Deloitte & Touche LLP would have caused them to make reference thereto in their report on the financial statements for such years.
The Trust, with the approval of the Board and the Audit Committee, engaged Cohen & Company, Ltd. as the new independent registered public accounting firm for the Funds for the fiscal year ending August 31, 2023.
81
Notice of Privacy Policy & Practices
We collect non-public personal information about you from the following sources:
| | • | | information we receive about you on applications or other forms; |
| | • | | information you give us orally; and |
| | • | | information about your transactions with us or others. |
The types of non-public personal information we collect and share can include:
| | • | | social security numbers; |
| | • | | wire transfer instructions; and |
| | • | | checking account information. |
What Information We Disclose
We do not disclose any non-public personal information about our shareholders or former shareholders without the shareholder’s authorization, except as permitted by law or in response to inquiries from governmental authorities. We may share information with affiliated parties and unaffiliated third parties with whom we have contracts for servicing the Funds. We will provide unaffiliated third parties with only the information necessary to carry out their assigned responsibility. All shareholder records will be disposed of in accordance with applicable law. We maintain physical, electronic and procedural safeguards to protect your non-public personal information and require third parties to treat your non-public personal information with the same high degree of confidentiality.
How We Protect Your Information
In the event that you hold shares of the Funds through a financial intermediary, including, but not limited to, a broker-dealer, bank or trust company, the privacy policy of your financial intermediary would govern how your non-public personal information would be shared with unaffiliated third parties.
82
PMC FUNDS
Additional Information
(Unaudited)
Tax Information
For the fiscal year ended August 31, 2022, certain dividends paid by the Funds may be subject to a maximum tax rate of 15%, as provided for by the Jobs and Growth Tax Relief Reconciliation Act of 2003. The percentage of dividends declared from ordinary income designated as qualified dividend income was as follows:
| | | | |
Core Fixed Income Fund | | | 0.00 | % |
Diversified Equity Fund | | | 100.00 | % |
For corporate shareholders, the percent of ordinary income distributions qualifying for the corporate dividends received deduction for the fiscal year ended August 31, 2022 was as follows:
| | | | |
Core Fixed Income Fund | | | 0.00 | % |
Diversified Equity Fund | | | 49.99 | % |
For the fiscal year ended August 31, 2022, taxable ordinary income distributions are designated as short-term capital gain distributions under Section 871(k)(2)(c) of the Code for the Funds as follows:
| | | | |
Core Fixed Income Fund | | | 15.90 | % |
Diversified Equity Fund | | | 0.00 | % |
Indemnification
Under the Trust’s organizational documents, its officers and Trustees are indemnified against certain liabilities arising out of the performance of their duties to the Funds. In addition, in the normal course of business, the Funds enter into contracts that provide general indemnifications to other parties. The Funds’ maximum exposure under these arrangements is unknown as this would involve future claims that may be made against the Funds that have not yet occurred. However, the Funds have not had prior claims or losses pursuant to these contracts and expect the risk of loss to be remote.
Information about Trustees
The business and affairs of the Trust are managed under the direction of the Trust’s Board of Trustees. Information pertaining to the Trustees of the Trust is set forth below. The Funds’ Statement of Additional Information includes additional information about the Trust’s Trustees and is available, without charge, upon request by calling (866) PMC-7338.
Independent Trustees
| | | | | | | | | | |
| | | | | | |
Name, Address and
Year of Birth
| | Position(s)
Held with
the Trust
| | Term of
Office and
Length of
Time Served
| | Number of
Portfolios
in the Trust
Overseen
by Trustee
| | Principal Occupation(s)
During the Past
Five Years
| | Other Directorships
Held by Trustee During
the Past Five Years
|
Michael D. Akers, Ph.D. 615 E. Michigan St. Milwaukee, WI 53202 Year of Birth: 1955 | | Trustee | | Indefinite Term; Since August 22, 2001 | | 22 | | Professor Emeritus, Department of Accounting (June 2019-present), Professor, Department of Accounting (2004-2019), Chair, Department of Accounting (2004-2017), Marquette University. | | Independent Trustee, USA MUTUALS (an open-end investment company (2001-2021). |
| | | | | |
Gary A. Drska 615 E. Michigan St. Milwaukee, WI 53202 Year of Birth: 1956 | | Trustee | | Indefinite Term; Since August 22, 2001 | | 22 | | Retired; Pilot, Frontier/Midwest Airlines, Inc. (airline company) (1986-2021). | | Independent Trustee, USA MUTUALS (an open-end investment company (2001-2021). |
83
PMC Funds
Additional Information (Continued)
(Unaudited)
| | | | | | | | | | |
| | | | | | |
Name, Address and
Year of Birth
| | Position(s)
Held with
the Trust
| | Term of
Office and
Length of
Time Served
| | Number of
Portfolios
in the Trust
Overseen
by Trustee
| | Principal Occupation(s)
During the Past
Five Years
| | Other Directorships
Held by Trustee During
the Past Five Years
|
| | | | | |
Vincent P. Lyles 615 E. Michigan St. Milwaukee, WI 53202 Year of Birth: 1961 | | Trustee | | Indefinite Term; Since April 6, 2022 | | 22 | | Executive Director, Milwaukee Succeeds (education advocacy organization) (2023-present); System Vice President of Community Relations, Advocate Aurora Health Care (health care provider) (2019-2022); President and Chief Executive Officer, Boys & Girls Club of Greater Milwaukee (2012-2018). | | Independent Director, BMO Funds, Inc. (an open-end investment company) (2017–2022). |
| | | | | |
Erik K. Olstein 615 E. Michigan St. Milwaukee, WI 53202 Year of Birth: 1967 | | Trustee | | Indefinite Term; Since April 6, 2022 | | 22 | | Retired; President and Chief Operating Officer (2000-2020), Vice President of Sales and Chief Operating Officer (1995-2000), Olstein Capital Management, L.P. (asset management firm); Secretary and Assistant Treasurer, The Olstein Funds (1995-2018). | | Trustee, The Olstein Funds (an open-end investment company) (1995–2018). |
| | | | | |
Lisa Zúñiga Ramírez 615 E. Michigan St. Milwaukee, WI 53202 Year of Birth: 1969 | | Trustee | | Indefinite Term; Since April 6, 2022 | | 22 | | Retired; Principal and Senior Portfolio Manager, Segall, Bryant & Hamill, LLC (asset management firm) (2018-2020); Partner and Senior Portfolio Manager, Denver Investments LLC (asset management firm) (2009-2018). | | N/A |
| | | | | |
Gregory M. Wesley 615 E. Michigan St. Milwaukee, WI 53202 Year of Birth: 1969 | | Trustee | | Indefinite Term; Since April 6, 2022 | | 22 | | Senior Vice President of Strategic Alliances and Business Development, Medical College of Wisconsin (2016-present). | | N/A |
|
Interested Trustee and Officers |
| | | | | |
John P. Buckel* 615 E. Michigan St. Milwaukee, WI 53202 Year of Birth: 1957 | | Chairperson, Trustee, President and Principal Executive Officer | | Indefinite Term; Chairperson and Trustee (since January 19, 2023); President and Principal Executive Officer (since January 24, 2013) | | 22 | | Vice President, U.S. Bancorp Fund Services, LLC (2004-present). | | N/A |
| | | | | |
Jennifer A. Lima 615 E. Michigan St. Milwaukee, WI 53202 Year of Birth: 1974 | | Vice President, Treasurer and Principal Financial and Accounting Officer | | Indefinite Term; Since January 24, 2013 | | N/A | | Vice President, U.S. Bancorp Fund Services, LLC (2002-present). | | N/A |
| * | | Mr. Buckel is deemed to be an “interested person” of the Trust as defined by the 1940 Act due to his position and material business relationship with the Trust. |
84
PMC Funds
Additional Information (Continued)
(Unaudited)
| | | | | | | | | | |
| | | | | | |
Name, Address and Year of Birth
| | Position(s) Held with the Trust
| | Term of Office and Length of Time Served
| | Number of Portfolios in the Trust Overseen by Trustee
| | Principal Occupation(s) During the Past Five Years
| | Other Directorships Held by Trustee During the Past Five Years
|
Deanna B. Marotz 615 E. Michigan St. Milwaukee, WI 53202 Year of Birth: 1965 | | Chief Compliance Officer, Vice President and Anti-Money Laundering Officer | | Indefinite Term; Since October 21, 2021 | | N/A | | Senior Vice President, U.S. Bancorp Fund Services, LLC (2021-present); Chief Compliance Officer of Keeley-Teton Advisors, LLC and Teton Advisors, Inc. (2017-2021). | | N/A |
| | | | | |
Jay S. Fitton 615 E. Michigan St. Milwaukee, WI 53202 Year of Birth: 1970 | | Secretary | | Indefinite Term; Since July 22, 2019 | | N/A | | Assistant Vice President, U.S. Bancorp Fund Services, LLC (2019-present); Partner, Practus, LLP (2018-2019); Counsel, Drinker Biddle & Reath LLP (2016-2018). | | N/A |
| | | | | |
Kelly A. Strauss 615 E. Michigan St. Milwaukee, WI 53202 Year of Birth: 1987 | | Assistant Treasurer | | Indefinite Term; Since April 23, 2015 | | N/A | | Assistant Vice President, U.S. Bancorp Fund Services, LLC (2011-present). | | N/A |
| | | | | |
Laura Carroll 615 E. Michigan St. Milwaukee, WI 53202 Year of Birth: 1985 | | Assistant Treasurer | | Indefinite Term; Since August 20, 2018 | | N/A | | Assistant Vice President, U.S. Bancorp Fund Services, LLC (2007-present). | | N/A |
| | | | | |
Shannon Coyle 615 E. Michigan St. Milwaukee, WI 53202 Year of Birth: 1990 | | Assistant Treasurer | | Indefinite Term; Since August 26, 2022 | | N/A | | Officer, U.S. Bancorp Fund Services, LLC (2015-present). | | N/A |
85
A NOTE ON FORWARD LOOKING STATEMENTS
Except for historical information contained in this report for the Funds, the matters discussed in this report may constitute forward-looking statements made pursuant to the safe-harbor provisions of the Securities Litigation Reform Act of 1995. These include any Adviser, Sub-adviser or portfolio manager predictions, assessments, analyses or outlooks for individual securities, industries, market sectors and/or markets. These statements involve risks and uncertainties. In addition to the general risks described for the Funds in the current Prospectus, other factors bearing on this report include the accuracy of the Adviser’s, sub-adviser’s or portfolio manager’s forecasts and predictions, and the appropriateness of the investment programs designed by the Adviser, sub-adviser or portfolio manager to implement their strategies efficiently and effectively. Any one or more of these factors, as well as other risks affecting the securities markets and investment instruments generally, could cause the actual results of the Funds to differ materially as compared to benchmarks associated with the Funds.
ADDITIONAL INFORMATION
The Funds have adopted proxy voting policies and procedures that delegate to the Adviser the authority to vote proxies. A description of the Funds’ proxy voting policies and procedures is available without charge, upon request, by calling the Funds toll free at (866) PMC-7338. A description of these policies and procedures is also included in the Funds’ Statement of Additional Information, which is available on the SEC’s website at http://www.sec.gov.
The Funds’ proxy voting record for the most recent 12-month period ended June 30 is available without charge, either upon request by calling the Funds toll free at (866) PMC-7338 or by accessing the SEC’s website at http://www.sec.gov.
The Funds file their complete schedule of portfolio holdings with the SEC for the first and third quarters of each fiscal year on Part F of Form N-PORT. Shareholders may view the Funds’ filings on the SEC’s website at http://www.sec.gov.
HOUSEHOLDING
In an effort to decrease costs, the Funds intend to reduce the number of duplicate prospectuses and certain other shareholder documents you receive by sending only one copy of each to those addresses shared by two or more accounts and to shareholders we reasonably believe are from the same family or household. Once implemented, if you would like to discontinue householding for your accounts, please call toll-free at (866) PMC-7338 to request individual copies of these documents. Once the Funds receive notice to stop householding, we will begin sending individual copies 30 days after receiving your request. This policy does not apply to account statements.
PMC FUNDS
| | |
Investment Adviser | | Envestnet Asset Management, Inc. 35 E. Wacker Drive, Suite 2400 Chicago, Illinois 60601 |
| |
Legal Counsel | | Godfrey & Kahn, S.C. 833 East Michigan Street, Suite 1800 Milwaukee, Wisconsin 53202 |
| |
Independent Registered Public Accounting Firm | | Deloitte & Touche LLP 111 South Wacker Drive Chicago, Illinois 60606 |
| |
Transfer Agent, Fund Accountant and Fund Administrator | | U.S. Bancorp Fund Services, LLC 615 East Michigan Street Milwaukee, Wisconsin 53202 |
| |
Custodian | | U.S. Bank, N.A. Custody Operations 1555 North RiverCenter Drive, Suite 302 Milwaukee, Wisconsin 53212 |
| |
Distributor | | Foreside Fund Services, LLC 3 Canal Plaza, Suite 100 Portland, Maine 04101 |
This report is intended for shareholders of the Funds and may not be used as sales literature unless preceded or accompanied by a current prospectus.
(b) Not applicable for this Registrant.
Item 2. Code of Ethics.
Not applicable for semi-annual reports.
Item 3. Audit Committee Financial Expert.
Not applicable for semi-annual reports.
Item 4. Principal Accountant Fees and Services.
Not applicable for semi-annual reports.
Item 5. Audit Committee of Listed Registrants.
Not applicable to registrants who are not listed issuers (as defined in Rule 10A-3 under the Securities Exchange Act of 1934).
Item 6. Investments.
| (a) | Schedule of Investments is included as part of the report to shareholders filed under Item 1 of this Form. |
Item 7. Disclosure of Proxy Voting Policies and Procedures for Closed-End Management Investment Companies.
Not applicable to open-end investment companies.
Item 8. Portfolio Managers of Closed-End Management Investment Companies.
Not applicable to open-end investment companies.
Item 9. Purchases of Equity Securities by Closed-End Management Investment Company and Affiliated Purchasers.
Not applicable to open-end investment companies.
Item 10. Submission of Matters to a Vote of Security Holders.
There have been no material changes to the procedures by which shareholders may recommend nominees to the registrant’s board of trustees.
Item 11. Controls and Procedures.
| (a) | The Registrant’s President and Treasurer have reviewed the Registrant’s disclosure controls and procedures (as defined in Rule 30a-3(c) under the Investment Company Act of 1940 (the “Act”)) as of a date within 90 days of the filing of this report, as required by Rule 30a-3(b) under the Act and Rules 13a-15(b) or 15d-15(b) under the Securities Exchange Act of 1934. Based on their review, such officers have concluded that the disclosure controls and procedures are effective in ensuring that information required to be disclosed in this report is appropriately recorded, processed, summarized and reported and made known to them by others within the Registrant and by the Registrant’s service provider. |
| (b) | There were no changes in the Registrant’s internal control over financial reporting (as defined in Rule 30a-3(d) under the Act) that occurred during the last fiscal half-year of the period covered by this report that has materially affected, or is reasonably likely to materially affect, the Registrant’s internal control over financial reporting. |
Item 12. Disclosure of Securities Lending Activities for Closed-End Management Investment Companies.
Not applicable to open-end investment companies.
Item 13. Exhibits.
(2) A separate certification for each principal executive and principal financial officer pursuant to Section 302 of the Sarbanes-Oxley Act of 2002. Filed herewith.
(3) Any written solicitation to purchase securities under Rule 23c-1 under the Act sent or given during the period covered by the report by or on behalf of the registrant to 10 or more persons. Not applicable to open-end investment companies.
(4) Change in the registrant’s independent public accountant. Filed herewith.
2
SIGNATURES
Pursuant to the requirements of the Securities Exchange Act of 1934 and the Investment Company Act of 1940, the registrant has duly caused this report to be signed on its behalf by the undersigned, thereunto duly authorized.
| | |
| (Registrant) | | Trust for Professional Managers |
| | |
| |
| By (Signature and Title)* | | /s/ John Buckel |
| | John Buckel, President |
Pursuant to the requirements of the Securities Exchange Act of 1934 and the Investment Company Act of 1940, this report has been signed below by the following persons on behalf of the registrant and in the capacities and on the dates indicated.
| | |
| By (Signature and Title)* | | /s/ John Buckel |
| | John Buckel, President |
| | |
| |
| By (Signature and Title)* | | /s/ Jennifer Lima |
| | Jennifer Lima, Treasurer |
* Print the name and title of each signing officer under his or her signature.
3