UNITED STATES
SECURITIES AND EXCHANGE COMMISSION
Washington, D.C. 20549
FORM N-CSR
CERTIFIED SHAREHOLDER REPORT OF REGISTERED
MANAGEMENT INVESTMENT COMPANIES
Investment Company Act file number 811-10401
Trust for Professional Managers
(Exact name of registrant as specified in charter)
615 East Michigan Street
Milwaukee, Wl 53202
(Address of principal executive offices) (Zip code)
Jay S. Fitton
U.S. Bancorp Fund Services, LLC
615 East Michigan Street
Milwaukee, Wl 53202
(Name and address of agent for service)
(513) 520-5925
Registrant's telephone number, including area code
Date of fiscal year end: May 31, 2024
Date of reporting period: November 30, 2023
Item 1. Reports to Stockholders.
(a)

| | | | | | | | | |
| | | | | | | | | |
| | SEMI-ANNUAL
REPORT | | | Jensen Quality
Value Fund | | Jensen Global
Quality Growth Fund | |
| | 11/30/2023 | | | |
| | | | | | | | |
| | | | | | | | |
| | | | | | Class I Shares | Class Y Shares | Class J Shares | |
| | | | | | | | | |

Letter from The Investment Adviser
Dear Fellow Shareholders,
The Jensen Quality Value Fund (the “Fund”)—Class Y Shares—posted a return of 7.13% for the six-month period ended November 30, 2023, compared to a return of 8.15% for the Russell Midcap Total Return Index. Please see pages 13 through 15 of this report for complete standardized performance information for the Fund.
Market Perspective
After a challenging 2022, punctuated by inflationary pressure, rising interest rates and ongoing geopolitical risk, 2023 saw market performance improve, driven by easing recessionary fears, the potential end of interest rate hikes from the Federal Reserve and slowing in the rate of inflation. However, risks to the “soft landing” narrative remain, including geopolitical conflicts, slowing growth and rising unemployment in China, a financially stressed U.S. consumer, and concerns that interest rates may remain “higher for longer” to combat persistent inflation.
The Effect at Jensen
For the six months ended November 30, 2023, the Fund’s performance relative to the Russell Midcap Total Return Index was aided by overweight positions in the Industrials sector; underweights in the Utilities, Real Estate and Communication Services sectors; and specific companies in the Information Technology, Health Care, Consumer Discretionary and Materials sectors. Performance was hindered by overweight positions in the Consumer Staples and Health Care sectors, underweights in the Financials and Energy sectors, and specific companies in the Consumer Staples sector.
During the period, the strategy continued its high allocation to quality companies as defined by the S&P Earnings and Dividend Quality Rankings. The Fund’s allocation to the highest-quality companies, those rated A+, A and A-, averaged 48% of portfolio assets compared to 23% of the Russell Midcap Total Return Index. This significant overweight to quality was modestly supportive of the Fund’s relative returns during the period. While low-quality businesses can outperform in some periods, we believe that over the full market cycle, investors in higher-quality businesses have the potential to be rewarded with better returns and lower volatility.
The top contributor to Fund performance for the six-month period was Lennox International (LII), a designer and manufacturer of heating, ventilation and air conditioning equipment. During the period, Lennox reported solid revenue and earnings growth that exceeded the expectations of many investors. Lennox was selected for the Fund because of its compelling valuation at the time of purchase and its positive fundamental attributes, including strong free cash flow production, healthy balance sheet, well-known brands, attractive long-term growth drivers and a solid market position.
Other notable companies that contributed positively to portfolio performance are: Broadridge Financial Solutions (BR), a provider of investor communications and trading services for the financial industry; Williams-Sonoma (WSM), a specialty retailer of home products including the Pottery Barn brand; United Rentals (URI), the largest tool and equipment rental company in the
| | | |
Semi-Annual Report | Jensen Quality Value Fund | 1 |
United States; and Laboratory Corporation of America (LH), a provider of medical laboratory services and diagnostic testing.
The largest negative contributor to Fund performance during the period was ResMed (RMD), a medical device company focused on treatments for respiratory disorders. During the period, ResMed reported strong sales growth, but relatively weak profit margins due to rising input costs. Additionally, investors expressed concern that new GLP-1 diet drugs may become a substitute for ResMed’s products. ResMed was originally selected for the Fund due to its attractive valuation at the time of purchase and its compelling fundamental attributes, which include its strong long-term growth drivers, leading market position, good balance sheet and recurring revenue business model.
Other notable holdings that weighed on relative performance included: General Mills (GIS), a packaged foods company; Bio-Techne (TECH), a provider of life sciences reagents and diagnostics tools; Kellanova (K), the packaged foods company formerly known as Kellogg; and Campbell Soup (CPB), also a packaged foods company. In general, food company stocks underperformed during the period due to slow revenue growth rates and high commodity prices, which pressured profit margins.
Fund Additions and Eliminations
During the six months ended November 30, 2023, the investment team continued to purchase the shares of companies we considered undervalued and sell the shares of companies we believed to be overvalued. The team added the following companies to the Fund’s portfolio:
| • | Booz Allen Hamilton (BAH) is a technology and management consulting company providing services to governments, corporations and non-profits. We believe the company’s skilled workforce, technical know-how and long-term client relationships make it the vendor of choice for premier government and corporate contracts. |
| • | ULTA Beaty (ULTA) is a specialty retailer of beauty products, including cosmetics, haircare, perfumes and skincare products. We believe ULTA possesses a strong brand, unique and differentiated product offerings, a robust omnichannel distribution model, and a strong market position as the leading beauty destination in the United States. |
| • | Waters Corporation (WAT) is a provider of scientific measurement devices, including liquid chromatography and mass spectrometry equipment. We believe the company benefits from a large installed base of instruments, technology leadership, vertically integrated production and a diversified customer base. |
During the six-month period, the investment team also sold the following companies in order to upgrade the fundamental quality of the Fund’s portfolio: Hasbro (HAS), a toy and games company, and ResMed (RMD), as described previously. As of November 30, 2023, the Fund held 39 companies.
| | | |
| 2 | Jensen Quality Value Fund | Semi-Annual Report |
The Jensen Outlook
As we look forward to 2024, we maintain a more cautious outlook for market returns in the coming months. Returns in the overall market in 2023 have been better than 2022 but we are mindful that the economic challenges that have been building over the last couple of years are still very much present today. While there are some signs of improvement, particularly with softening inflation from the generationally high levels reached in the middle of 2022, overall inflation remains above long-term targets of the U.S. Federal Reserve. The Federal Reserve has paused on its path of increasing interest rates—which was seen as a positive sign by many investors. This will, however, keep interest costs at higher levels than in the past, reducing the cash available for more productive uses for highly leveraged businesses. The full effect of higher interest rates has likely not fully impacted the economy, and this may remain a substantial headwind for many companies when older debts are refinanced at higher rates. There also remain increased tensions that threaten the geopolitical status quo of the last 40 years.
In addition to, or perhaps because of, these factors, we note that the business performance of companies and recent market return patterns could influence the outlook for 2024, and reverse or at least pause the “risk-on” character of 2023. We would also note that the threat of an economic recession in the U.S. has not disappeared. The U.S. Treasury yield curve has been inverted since early July 2022 with the yield on two-year Treasury bonds exceeding the yield on 10-year Treasury bonds. Such occurrences are relatively rare and have accurately predicted the 10 most recent economic recessions. While the economy currently appears to be weathering the threat of a recession, there is still much debate about whether one will occur.
In our view, there are many opportunities for higher-quality, more resilient businesses to garner favor from investors looking for lower volatility in the face of the issues discussed here. We continue to have confidence in the high-quality businesses owned in the Fund because of our focus that favors characteristics such as strong and resilient business models, durable competitive advantages, pricing power, steady operating margins, and strong free cash flow generation that is consistently reinvested into future growth opportunities, rewarding shareholders in the shorter term via growing dividends and stock buybacks. Likewise, our disciplined approach to valuation, which utilizes our deep research to construct discounted cash flow models reflecting the opportunities (and threats) to the companies in which we invest, has provided us confidence to invest in these sound businesses.
While the economic uncertainty and the corresponding volatility of market returns have been worrying for many investors over the last year, the Jensen Investment Team remains convinced that the strategy and process guiding our management of the Fund is sound. Our goal remains the ownership of a portfolio of companies positioned to accrue business value. We seek to participate in this value creation as investors via the long-term ownership of fairly priced, high-quality stocks. We believe the attributes noted above allow quality companies to generate business returns consistently above their cost of capital, ultimately resulting in shareholder value creation.
| | | |
Semi-Annual Report | Jensen Quality Value Fund | 3 |
Lastly, we remain steadfast in our belief that paying attention to company fundamentals can help investors manage risk. This should offer a measure of capital protection in more volatile or generally lower-market-return environments and provide the opportunity for long-term capital appreciation.
We are tremendously grateful for the ongoing support of our firm and investment strategies from our partners and fellow shareholders. Thank you.
We invite you to seek additional information about the Jensen Quality Value Fund at www.jenseninvestment.com where additional content, including updated holdings and performance information, is available. We take our investment responsibilities seriously and appreciate the trust you have placed in us. As always, we welcome your feedback.
Sincerely,
The Jensen Quality Value Investment Team
| | | |
| 4 | Jensen Quality Value Fund | Semi-Annual Report |
This discussion and analysis of the Fund is as of November 30, 2023, and is subject to change; any forecasts made cannot be guaranteed and should not be considered investment advice. Past performance is no guarantee of future results. Fund holdings and sector weightings are subject to change and are not recommendations to buy or sell any security. For more complete information regarding performance and holdings, please refer to the financial statements and schedule of investments headings of this report. Mutual fund investing involves risk, and principal loss is possible. The Fund invests in mid- and smaller capitalization companies, which involve additional risks such as limited liquidity and greater volatility. Growth stocks typically are more volatile than value stocks; however, value stocks have a lower expected growth rate in earnings and sales. The Russell Midcap Total Return Index is an unmanaged index, which measures the performance of the 800 smallest companies in the Russell 1000 Index. S&P Earnings and Dividend Quality Rankings: S&P ranks index constituents from A+ through C based on trailing earnings and dividend consistency. We consider stocks rated A- and above as high quality and those rated B+ and below as low quality. Risk-on risk-off is an investment paradigm where asset prices are dictated by changes in investors’ risk tolerance and investment choices. Free Cash Flow: Is equal to the after-tax net income of a company plus depreciation and amortization less capital expenditures. Earnings Growth: The annual rate of growth of earnings typically measured as Earnings Per Share Growth. Must be preceded or accompanied by a prospectus for the Jensen Quality Value Fund. The Jensen Quality Value Fund is distributed by Quasar Distributors, LLC. |
| | | |
Semi-Annual Report | Jensen Quality Value Fund | 5 |
Letter from the Investment Adviser
Dear Fellow Shareholders,
The Jensen Global Quality Growth Fund (the “Fund”)—Class Y Shares—returned 4.22% for the six-month period ended November 30, 2023, compared to 8.28% for the MSCI All Country World Index Net (USD) over this period. Please see pages 17 through 19 of this report for complete standardized performance information for the Fund.
Market Perspective
After a robust start to calendar 2023, when investors focused on the anticipation of declining inflation and looked through concerns of higher interest rates impacting economies around the world, global stock markets pivoted somewhat in response to the impact of higher inflation and rising commodity and oil prices in the six-month period ended November 30, 2023.
Nonetheless, despite the challenges facing companies and their investors, including ongoing inflationary pressures, generationally high interest rates, continuing hawkish commentary from central banks in developed economies and rising geopolitical risk, overall global stock market returns remained positive during the period and for the entire year.
The market sentiment was fueled by strong performance from energy companies as oil prices were elevated for much of the period. Additionally, information technology companies continued to rebound from the substantial declines in their share prices last year—a trend that also benefited the Fund. Offsetting this performance was the momentum-driven impact from a concentrated number of U.S.-domestic companies in which the Fund has no exposure, including Nvidia (NVDA) in the IT sector, Meta Platforms (META) in the Communication Services sector, and Tesla (TSLA) and Amazon (AMZN) in the Consumer Discretionary sector. Neither Nvidia, Tesla nor Amazon qualify for inclusion in the Jensen investable universe due to a pattern of inconsistent returns on equity. While such concentrations were noticeably lower in the global benchmark compared to domestic indexes, the impact was still a meaningful headwind to the Fund’s relative performance. At the same time, the Fund’s consumer-facing companies were less favored during the period as inflation, economic slowing and consumer sentiment weighed on global spending on goods.
The Fund’s performance was also held back by its focus on higher-quality stocks during the period, as investment performance from lower-quality stocks (B+ and lower, as measured by the S&P Earnings and Dividend Quality Rankings) was stronger than that of higher-quality stocks (A+, A and A-, as measured by the S&P Earnings and Dividend Quality Rankings).
The Effect at Jensen
From a sector perspective, stock selection contributed positively to the Fund’s relative performance in the Industrials and Information Technology sectors, while detracting from returns in the Consumer Discretionary and Consumer Staples sectors. A relative overweight allocation to the Information Technology sector contributed positively to the Fund’s relative performance, as did a lack of exposure to the Utilities and Real Estate sectors, while underweight allocations detracted from relative returns in the Energy and Financials sectors. Typically, very few companies in the Utilities, Real Estate, Energy and Financials sectors qualify for investment in the Fund due to
| | | |
| 6 | Jensen Global Quality Growth Fund | Semi-Annual Report |
our strict requirement for portfolio companies to deliver high and prolonged profitability, as measured by Return on Equity (ROE). Consequently, our lack of exposure to sectors that do not deliver consistently high business returns will periodically add or detract from the Fund’s relative performance.
Leading contributors to performance during the period were Microsoft (MSFT) and Intuit (INTU). Microsoft benefited from strong performance in its core cloud services in Enterprise, namely Azure services and Office 365. Offsetting this was a slowdown in PC sales and gaming revenue due to challenging comparisons from the prior year that saw robust performance arising from the COVID pandemic. More recently, the market reacted positively to the company’s announcement of its $10 billion investment in OpenAI and the subsequent inclusion of OpenAI’s ChatGPT into its search results. ChatGPT represents a key advancement in generative Artificial Intelligence (“AI”), enabling Microsoft to jump ahead of the current AI leader, Google, which stumbled in its attempt to respond too quickly to Microsoft’s initiative. (Alphabet Inc., Google’s parent and a Fund portfolio holding, has since recovered.) From our perspective, overall enthusiasm for the influence of the AI industry has driven much of the momentum during the last six months.
Intuit is a software company specializing in financial tools and cloud services with products including TurboTax and QuickBooks. The company’s stock experienced a boost as investors responded positively to the announcement that it will integrate AI into its products and services. Furthermore, Intuit’s well-received investor day at the close of the third calendar quarter further reinforced its standing in the eyes of the investment community.
Significant detractors from the Fund’s performance for the period included Diageo (DGE.L) and AstraZeneca (AZN.L). Diageo is a London-based multinational alcoholic beverage company, with a portfolio of a number of the world’s leading spirits brands. The company’s stock has been hampered recently by a material slowing of its business in Latin America due to a worsening regional economic environment. This was in addition to concerns about slowing growth and consumer trade down away from the premium alcohol segment which represents much of Diageo’s competitive strength. As a result, the company reduced its guidance for the next year, resulting in a material stock pullback. We maintain our confidence in the long-term prospects for the company and view recent results as a potential bottoming after exceptional sales that occurred during the pandemic.
AstraZeneca is a multinational biopharmaceutical company with a diverse portfolio of oncology, cardiovascular and rare disease treatments. We believe weakness in AZN shares during the period was attributable to a growth slowdown and potential new competition for Tagrisso, the company’s second-largest drug franchise, and newly approved competition for Ultomiris, a key drug in the Rare Disease portfolio. Longer term, our investment thesis is based on AstraZeneca’s financial strength and its global scale in terms of drug development, regulatory expertise and commercialization. We believe these factors will allow the company to leverage a deep drug pipeline and maintain attractive growth rates into the future. Consequently, the company remains one of the top holdings in the Fund.
| | | |
Semi-Annual Report | Jensen Global Quality Growth Fund | 7 |
We are constantly evaluating all the businesses owned by the Fund as well as other investment candidates to determine whether better opportunities exist in our investable universe. Such determinations ultimately reflect a combination of fundamental considerations, valuation opportunities and overall risk profiles of our companies.
Fund Additions and Eliminations
During the period, the Jensen Investment Team enacted the purchase of three new holdings and sold two holdings. We initiated new positions in KLA (KLAC), ASML (ASML) and Waters Corporation (WAT) due to solid business fundamentals and attractive valuations for those companies. We sold our positions in KONE (KNEBV) and Johnson & Johnson (JNJ) as part of ongoing efforts to upgrade the overall quality of the Fund. A brief synopsis of the changes follows.
KLA Corporation (“KLA”) is, in our assessment, one of the most essential semiconductor production equipment (“SPE”) manufacturers worldwide. The company makes highly differentiated machines needed in the process of manufacturing computer chips. More specifically, KLA is the leader in process control equipment, which ensures that crucial chip production steps are performed with the lowest possible error rate. KLA not only dominates the process control market with more than a 50% market share, but it has also gained market share over time; the process control segment now accounts for up to 90% of the company’s revenues.
The SPE industry benefits from strong secular demand drivers. Computer chips are found in many more devices beyond traditional personal computers, such as mobile phones, data centers, cars, gaming consoles and AI applications. The growing demand for more powerful computing also drives demand for more powerful and complex computer chips. Higher technological complexity opens the possibility for increased errors in chip production, necessitating more process control equipment, which benefited KLA.
As the global semiconductor process control leader, KLA is, in our opinion, protected by a wide economic moat. KLA’s long-tenured company leadership has consistently opted to return capital to investors through dividends and share buybacks. Also, the business of servicing its installed machines, which accounts for more than 20% of revenues, has been the role model for the industry and, we believe, will likely continue to drive KLA’s growth and profitability.
KLA possesses many of the qualitative business aspects that we prize at Jensen. These include high barriers to entry due to decades of accumulated knowledge, larger-than-peers’ R&D budgets in its chosen niche areas of focus, patents, and an established ecosystem of partner companies. Its competitive position is further cemented by high switching costs due to the risk of interrupting well-running chip production processes, the highly customized nature of the tools provided and scale advantages.
Given KLA’s attractive fundamental business characteristics, its long-term history of shareholder value creation, and our valuation work that aims to identify long-term attractive investment opportunities, we are pleased to have added the company to the Fund.
| | | |
| 8 | Jensen Global Quality Growth Fund | Semi-Annual Report |
ASML Holding NV (“ASML”) is a maker of critical equipment and provider of services that enable the manufacturing of leading-edge semiconductors. The company is the undisputed leader in Extreme Ultraviolet (“EUV”) lithography tools, which are a critical technology for making the world’s most advanced computer chips. Demand for advanced computer chips is supported by strong secular growth drivers, including the “digitalization of everything,” demand for consumer goods (such as the latest iPhone) and AI applications. ASML is in a unique position as one of the few listed monopolies with secular growth drivers—it has a 100% market share in EUV lithography tools and is in the process of finalizing its next technology, EUV High-NA, while competitors have failed to master EUV technology.
ASML benefits from decades of accumulated knowledge and highly-focused R&D spending—it consistently has one of the largest R&D budgets among semi equipment makers. In addition, three decades of proven innovation, a well-developed ecosystem of key technology partners, high switching costs and the lack of credible alternatives to its products further solidify its position as one of the most moated quality growth businesses we know. Given its products are without substitute for making the world’s most advanced computer chips, ASML’s tools are vital for chipmakers that want to compete at the leading edge. Price is not a key consideration for the chip makers, as the benefits of having timely access to the best tools outweigh marginal cost considerations. We expect ASML to continue to grow and create business value due to market growth, strong pricing power and an increase in the importance of its high-margin business servicing its advanced machines.
Waters Corporation (“Waters”) is an analytical laboratory instrument and software company headquartered in Milford, Massachusetts. Its scientific tools are used for liquid chromatography, mass spectrometry and thermal analysis. The company serves a variety of end markets, but most of its revenue is derived from new equipment, disposables and service contract sales to life sciences customers for drug discovery, drug development and manufacturing quality control. Waters benefits from a large and stable installed base of equipment, particularly in its liquid chromatography business. The company’s tools are an integral part of the quality assurance process for pharmaceutical drug manufacturing, and it is common for Waters’ products to be used in all phases of a drug’s lifecycle including discovery, development and quality control. We expect Waters to grow and create business value due to end market growth, new product development, and improved attachment rates for consumables and service contracts.
First added to the Fund in December 2020, Kone Oyj (“KONE”), based in Helsinki, Finland, is a leading global manufacturer and maintenance services provider for elevators and escalators. KONE’s competitive advantages include its global scale and a leading market position in China. However, our investment thesis and outlook for KONE became impaired by both a macroeconomic slowdown in the China property market and market share erosion in an increasingly competitive Chinese new equipment market. Given these growth challenges and a decline in the company’s operating performance, we exited the Fund’s stake in KONE in favor of more compelling investment opportunities.
| | | |
Semi-Annual Report | Jensen Global Quality Growth Fund | 9 |
First added to the Fund upon inception of the Fund in April 2020, Johnson & Johnson (“JNJ”) is a global healthcare company focused on medical devices and pharmaceuticals. We chose to sell the stock due to a combination of elevated price valuation and better opportunities with our global investment universe. We maintain a positive view on the company’s competitive advantages including global scale, entrenched relationships with healthcare providers and intellectual property. However, we believe that the business model has recently become less attractive due to the distraction from talcum powder litigation and higher reliance on successful execution of the pharmaceutical segment following the sale of the consumer business. We intend to closely monitor JNJ and may consider reestablishing a position based on improvement in the company’s valuation, fundamentals and/or risk characteristics.
There were no other wholesale changes to the Fund, but the Investment Team remained active in adding to or trimming from existing positions to reflect Jensen’s convictions in the businesses and relative valuation opportunities within the context of the ongoing economic volatility.
The Jensen Outlook
The last two years have provided a roller coaster of returns as the sharp negative returns in calendar 2022 have been largely offset over the course of this year. Despite the positive momentum in 2023, we maintain a cautious outlook for near-term market returns as we head into the coming year.
The economic challenges that have been building in recent years are still very much present today. While there are some signs of improvement, particularly with softening inflation from the generationally high levels reached last year, overall inflation still remains higher than “normal” in much of the world. Likewise, earlier this year, the U.S. Federal Reserve paused its path of increasing interest rates—which was seen as a positive sign by many investors. Despite expectations that U.S. interest rates will be cut aggressively over the course of 2024, current indications indicate that any cuts will likely be limited to 1.00% or less. This will keep interest costs at higher levels relative to a few quarters ago and the impact on highly leveraged businesses will continue to be evidenced in stressed balance sheets and reduced cash flows that might otherwise be available for more productive uses. Elsewhere, other global central banks have not ruled out the potential for higher rates and any pause in their interest rates may not occur for some time. Thus, the effect of higher interest rates may not have fully impacted many global economies and may represent a substantial headwind to many companies’ financial performance. We are also mindful of increased tensions that challenge the geopolitical status quo of the last 40 years. Lastly, 2024 brings a U.S. presidential campaign and election that may well produce volatility in global stock markets.
We continue to have confidence in the high-quality businesses owned in the Fund that favors characteristics such as strong and resilient business models, durable competitive advantages, pricing power, steady operating margins and strong free cash flow generation that is consistently reinvested into future growth opportunities, rewarding shareholders in the shorter term via growing dividends and stock buybacks. Likewise, our disciplined approach to valuation, which utilizes our deep research to construct discounted cash flow models that reflect the opportunities for (and threats to) the companies in which we invest, has provided us confidence to invest in these sound businesses.
| | | |
| 10 | Jensen Global Quality Growth Fund | Semi-Annual Report |
The Jensen Global Investment Team remains confident in the strategy and process guiding our management of the Portfolio. Our goal remains the ownership of a portfolio of companies positioned to grow and accrue business value in a stable manner. We seek to participate in this value creation as investors via the long-term ownership of what we believe are appropriately priced, high-quality stocks. We believe the attributes noted above enable quality companies to generate business returns consistently above their cost of capital, ultimately resulting in shareholder value creation.
We remain steadfast in our belief that paying attention to company fundamentals can help investors manage risk. This should offer a measure of capital protection in more volatile or generally lower-market-return environments and provide the opportunity for long-term capital appreciation.
We are tremendously grateful for the ongoing support of our firm and investment strategies from our shareholders, partners and clients. Thank you.
We invite you to seek additional information about the Jensen Global Quality Growth Fund at www.jenseninvestment.com where additional content, including updated holdings and performance information, is available. We take our investment responsibilities seriously and appreciate the trust you have placed in us. As always, we welcome your feedback.
Sincerely,
The Jensen Global Quality Growth Investment Team
| | | |
Semi-Annual Report | Jensen Global Quality Growth Fund | 11 |
This discussion and analysis of the Fund is as of November 2023 and is subject to change, and any forecasts made cannot be guaranteed.
Past performance is no guarantee of future results. Fund holdings and sector weightings are subject to change and are not recommendations to buy or sell any security.
MSCI All Country World Index (MSCI ACWI): is a market capitalization weighted index designed to provide a broad measure of equity-market performance throughout the world. It is maintained by Morgan Stanley Capital International (MSCI) and is comprised of stocks from 23 Developed Markets (DM) and 24 Emerging Markets (EM) countries.
S&P Earnings and Dividend Quality Rankings: S&P ranks index constituents from A+ through C based on trailing earnings and dividend consistency. We consider stocks rated A- and above as high quality and those rated B+ and below as low quality.
For more complete information regarding performance and holdings, please refer to the financial statements and schedule of investments headings of this report. Current and future portfolio holdings are subject to risk.
The Fund is nondiversified, meaning that it may concentrate its assets in fewer individual holdings than a diversified fund and is therefore more exposed to individual stock volatility than a diversified fund.
Return on Equity: Is equal to a company’s after-tax earnings (excluding non-recurring items) divided by its average stockholder equity for the year.
Free Cash Flow: Is equal to the after-tax net income of a company plus depreciation and amortization less capital expenditures.
For use only when preceded or accompanied by a current prospectus for the Fund.
The Jensen Global Quality Growth Fund is distributed by Quasar Distributors, LLC.
| | | |
| 12 | Jensen Quality Value Fund | Semi-Annual Report |
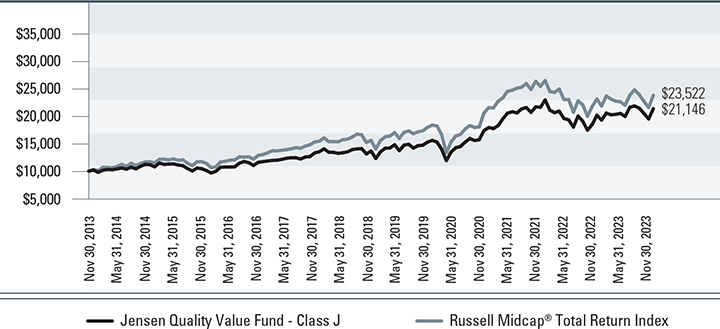
Jensen Quality Value Fund - Class J (Unaudited)
Total Returns vs. Russell Midcap® Total Return Index
Average Annual Total Returns –
For periods ended November 30, 2023 (Unaudited) | 1 year | 3 years | 5 years | 10 years | Since Inception
(3/31/2010) |
| Jensen Quality Value Fund - Class J | 5.91% | 7.05% | 9.26% | 7.78% | 9.35% |
| Russell Midcap® Total Return Index | 2.94% | 4.91% | 8.72% | 8.93% | 10.88% |
The Russell Midcap® Total Return Index is an unmanaged index, which measures the performance of the 800 smallest companies in the Russell 1000® Index.
The chart at the top of the page assumes an initial gross investment of $10,000 made on November 30, 2013. Returns shown include the reinvestment of all Fund distributions. Returns shown do not reflect the deduction of taxes that a shareholder would pay on Fund distributions or the redemption of Fund shares.
Investment performance reflects fee waivers in effect. In the absence of such waivers, total returns would be reduced.
Performance data shown represents past performance. Past performance does not guarantee future results. The investment return and principal value of an investment will fluctuate so that an investor’s shares, when redeemed, may be worth more or less than their original cost. Current performance of the Fund may be lower or higher than the performance shown. Performance data current to the most recent month-end may be obtained by calling 800-992-4144 or by visiting www.jenseninvestment.com.
Gross expense ratio: 1.10%
| | | |
Semi-Annual Report | Jensen Quality Value Fund | 13 |
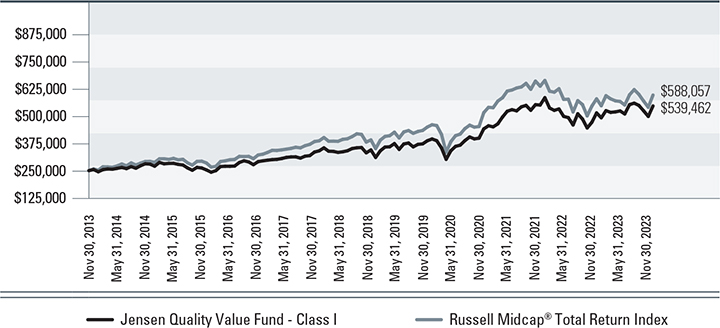
Jensen Quality Value Fund - Class I (Unaudited)
Total Returns vs. Russell Midcap® Total Return Index
Average Annual Total Returns –
For periods ended November 30, 2023 (Unaudited) | 1 year | 3 years | 5 years | 10 years | Since Inception
(3/31/2010) |
| Jensen Quality Value Fund - Class I | 6.16% | 7.29% | 9.52% | 7.99% | 9.56% |
| Russell Midcap® Total Return Index | 2.94% | 4.91% | 8.72% | 8.93% | 10.88% |
The Russell Midcap® Total Return Index is an unmanaged index, which measures the performance of the 800 smallest companies in the Russell 1000® Index.
The chart at the top of the page assumes an initial gross investment of $250,000 made on November 30, 2013. Returns shown include the reinvestment of all Fund distributions. Returns shown do not reflect the deduction of taxes that a shareholder would pay on Fund distributions or the redemption of Fund shares.
Investment performance reflects fee waivers in effect. In the absence of such waivers, total returns would be reduced.
Performance data shown represents past performance. Past performance does not guarantee future results. The investment return and principal value of an investment will fluctuate so that an investor’s shares, when redeemed, may be worth more or less than their original cost. Current performance of the Fund may be lower or higher than the performance shown. Performance data current to the most recent month-end may be obtained by calling 800-992-4144 or by visiting www.jenseninvestment.com.
Gross expense ratio: 0.87%
| | | |
| 14 | Jensen Quality Value Fund | Semi-Annual Report |
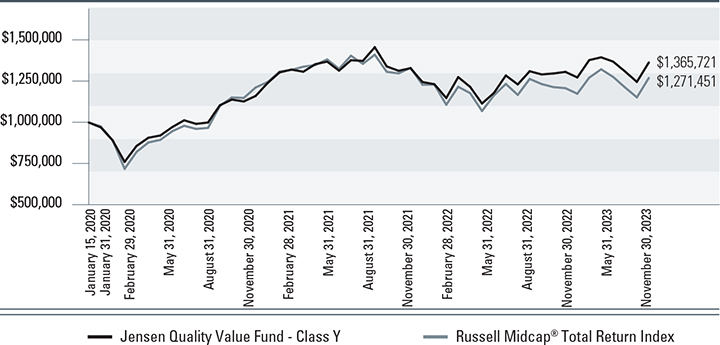
Jensen Quality Value Fund - Class Y (Unaudited)
Total Returns vs. Russell Midcap® Total Return Index
Average Annual Total Returns –
For periods ended November 30, 2023 (Unaudited) | 1 year | 3 year | Since Inception
(1/15/2020) |
| Jensen Quality Value Fund - Class Y | 6.13% | 7.30% | 8.37% |
| Russell Midcap® Total Return Index | 2.94% | 4.91% | 6.39% |
The Russell Midcap® Total Return Index is an unmanaged index, which measures the performance of the 800 smallest companies in the Russell 1000® Index.
The chart at the top of the page assumes an initial gross investment of $1,000,000 made on January 15, 2020, the inception date for Class Y shares. Returns shown include the reinvestment of all Fund distributions. Returns shown do not reflect the deduction of taxes that a shareholder would pay on Fund distributions or the redemption of Fund shares.
Investment performance reflects fee waivers in effect. In the absence of such waivers, total returns would be reduced.
Performance data shown represents past performance. Past performance does not guarantee future results. The investment return and principal value of an investment will fluctuate so that an investor’s shares, when redeemed, may be worth more or less than their original cost. Current performance of the Fund may be lower or higher than the performance shown. Performance data current to the most recent month-end may be obtained by calling 800-992-4144 or by visiting www.jenseninvestment.com.
Gross expense ratio: 0.85%
| | | |
Semi-Annual Report | Jensen Quality Value Fund | 15 |
Jensen Quality Value Fund
Investments by Sector as of November 30, 2023
(As a Percentage of Total Investments) (Unaudited)
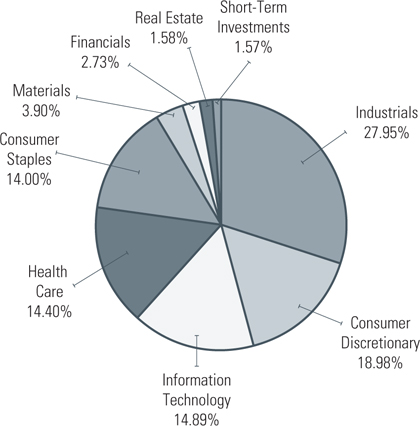
The Global Industry Classification Standard (GICS®) was developed by and/or is the exclusive property of MSCI, Inc. and Standard & Poor’s Financial Services LLC (“S&P”). GICS is a service mark of MSCI and S&P and has been licensed for use by U.S. Bancorp Fund Services, LLC, doing business as U.S. Bank Global Fund Services.
| | | |
| 16 | Jensen Quality Value Fund | Semi-Annual Report |
Jensen Global Quality Growth Fund - Class J (Unaudited)
Total Returns vs. MSCI All Country World Index Net (USD)
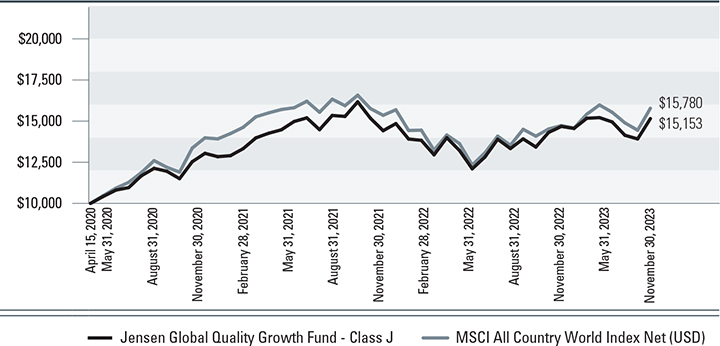
Average Annual Total Returns –
For periods ended November 30, 2023 (Unaudited) | 1 year | 3 year | Since Inception
(4/15/2020) |
| Jensen Global Quality Growth Fund - Class J | 9.01% | 6.53% | 12.14% |
| MSCI All Country World Index Net (USD) | 12.01% | 5.69% | 13.40% |
The MSCI All Country World Index Net (USD) (“MSCI ACWI”) is a free float-adjusted market capitalization weighted index that measures the equity performance of global developed and emerging markets. The MSCI ACWI total return indices reinvest dividends after the deduction of withholding taxes, using (for international indices) a tax rate applicable to non-resident institutional investors who do not benefit from double taxation treaties.
The chart at the top of the page assumes an initial gross investment of $10,000 made on April 15, 2020, the inception date for Class J shares. Returns shown include the reinvestment of all Fund distributions. Returns shown do not reflect the deduction of taxes that a shareholder would pay on Fund distributions or the redemption of Fund shares.
Investment performance reflects fee waivers in effect. In the absence of such waivers, total returns would be reduced.
Performance data shown represents past performance. Past performance does not guarantee future results. The investment return and principal value of an investment will fluctuate so that an investor’s shares, when redeemed, may be worth more or less than their original cost. Current performance of the Fund may be lower or higher than the performance shown. Performance data current to the most recent month-end may be obtained by calling 800-992-4144 or by visiting www.jenseninvestment.com.
Gross expense ratio: 1.61%
| | | |
Semi-Annual Report | Jensen Global Quality Growth Fund | 17 |
Jensen Global Quality Growth Fund - Class I (Unaudited)
Total Returns vs. MSCI All Country World Index Net (USD)
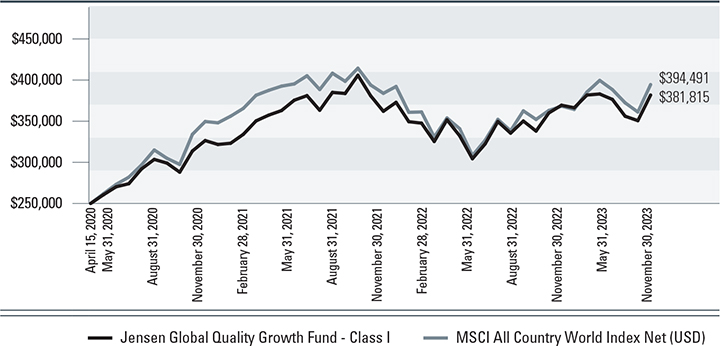
Average Annual Total Returns –
For periods ended November 30, 2023 (Unaudited) | 1 year | 3 year | Since Inception
(4/15/2020) |
| Jensen Global Quality Growth Fund - Class I | 9.23% | 6.76% | 12.38% |
| MSCI All Country World Index Net (USD) | 12.01% | 5.69% | 13.40% |
The MSCI All Country World Index Net (USD) (“MSCI ACWI”) is a free float-adjusted market capitalization weighted index that measures the equity performance of global developed and emerging markets. The MSCI ACWI total return indices reinvest dividends after the deduction of withholding taxes, using (for international indices) a tax rate applicable to non-resident institutional investors who do not benefit from double taxation treaties.
The chart at the top of the page assumes an initial gross investment of $250,000 made on April 15, 2020, the inception date for Class I shares. Returns shown include the reinvestment of all Fund distributions. Returns shown do not reflect the deduction of taxes that a shareholder would pay on Fund distributions or the redemption of Fund shares.
Investment performance reflects fee waivers in effect. In the absence of such waivers, total returns would be reduced.
Performance data shown represents past performance. Past performance does not guarantee future results. The investment return and principal value of an investment will fluctuate so that an investor’s shares, when redeemed, may be worth more or less than their original cost. Current performance of the Fund may be lower or higher than the performance shown. Performance data current to the most recent month-end may be obtained by calling 800-992-4144 or by visiting www.jenseninvestment.com.
Gross expense ratio: 1.36%
| | | |
| 18 | Jensen Global Quality Growth Fund | Semi-Annual Report |
Jensen Global Quality Growth Fund - Class Y (Unaudited)
Total Returns vs. MSCI All Country World Index Net (USD)
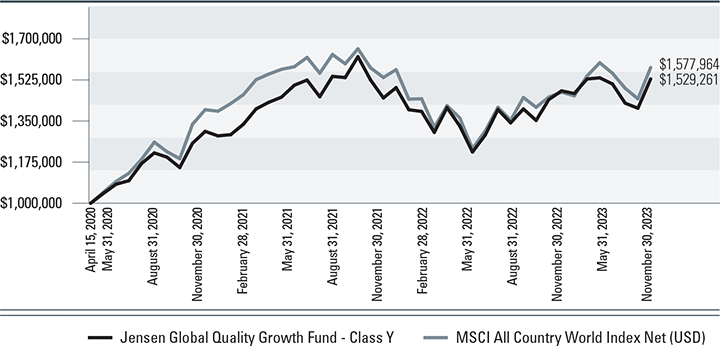
Average Annual Total Returns –
For periods ended November 30, 2023 (Unaudited) | 1 year | 3 year | Since Inception
(4/15/2020) |
| Jensen Global Quality Growth Fund - Class Y | 9.32% | 6.80% | 12.42% |
| MSCI All Country World Index Net (USD) | 12.01% | 5.69% | 13.40% |
The MSCI All Country World Index Net (USD) (“MSCI ACWI”) is a free float-adjusted market capitalization weighted index that measures the equity performance of global developed and emerging markets. The MSCI ACWI total return indices reinvest dividends after the deduction of withholding taxes, using (for international indices) a tax rate applicable to non-resident institutional investors who do not benefit from double taxation treaties.
The chart at the top of the page assumes an initial gross investment of $1,000,000 made on April 15, 2020, the inception date for Class Y shares. Returns shown include the reinvestment of all Fund distributions. Returns shown do not reflect the deduction of taxes that a shareholder would pay on Fund distributions or the redemption of Fund shares.
Investment performance reflects fee waivers in effect. In the absence of such waivers, total returns would be reduced.
Performance data shown represents past performance. Past performance does not guarantee future results. The investment return and principal value of an investment will fluctuate so that an investor’s shares, when redeemed, may be worth more or less than their original cost. Current performance of the Fund may be lower or higher than the performance shown. Performance data current to the most recent month-end may be obtained by calling 800-992-4144 or by visiting www.jenseninvestment.com.
Gross expense ratio: 1.36%
| | | |
Semi-Annual Report | Jensen Global Quality Growth Fund | 19 |
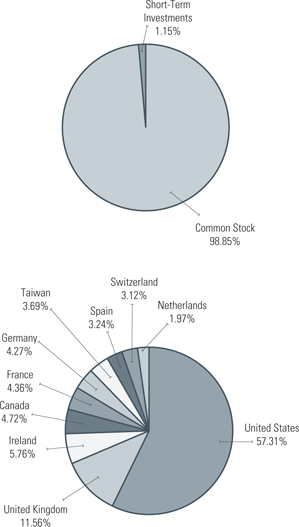
Jensen Global Quality Growth Fund
Allocation of Portfolio Holdings as of November 30, 2023
(As a Percentage of Total Investments) (Unaudited)
| | | |
| 20 | Jensen Global Quality Growth Fund | Semi-Annual Report |
Statements of Assets & Liabilities
November 30, 2023 (Unaudited)
| Assets: | Jensen
Quality
Value Fund | Jensen
Global Quality
Growth Fund |
| Investments, at value (cost $155,435,368 and $39,353,922) | $178,370,547 | $46,812,122 |
| Income receivable | 276,286 | 78,200 |
| Receivable for capital stock issued | 148,645 | – |
| Other Assets | 32,676 | 27,496 |
| Total Assets | 178,828,154 | 46,917,818 |
| | | |
| Liabilities: | | |
| Payable for capital stock redeemed | 72,995 | – |
| Payable for 12b-1 fees - Class J | 9,345 | 2,158 |
| Payable to adviser | 79,069 | 13,434 |
| Payable to affiliates | 27,844 | 20,136 |
| Accrued expenses and other liabilities | 29,181 | 10,319 |
| Total Liabilities | 218,434 | 46,047 |
| NET ASSETS | $178,609,720 | $46,871,771 |
| | | |
| NET ASSETS CONSIST OF: | | |
| Capital stock | $158,940,123 | $40,142,244 |
| Total distributable earnings | 19,669,597 | 6,729,527 |
| Total Net Assets | $178,609,720 | $46,871,771 |
| | | |
| NET ASSETS CONSIST OF: | | |
| Class J Shares: | | |
| Net Assets | $28,849,588 | $2,203,130 |
| Shares of beneficial interest outstanding | 1,700,460 | 147,257 |
| Net Asset Value, Offering Price and Redemption Price Per Share (unlimited number of shares authorized, $.001 par value) | $16.97 | $14.96 |
| Class I Shares: | | |
| Net Assets | $89,977,340 | $2,333,622 |
| Shares of beneficial interest outstanding | 5,314,424 | 155,959 |
| Net Asset Value, Offering Price and Redemption Price Per Share (unlimited number of shares authorized, $.001 par value) | $16.93 | $14.96 |
| Class Y Shares: | | |
| Net Assets | $59,782,792 | $42,335,019 |
| Shares of beneficial interest outstanding | 3,538,969 | 2,827,924 |
| Net Asset Value, Offering Price and Redemption Price Per Share (unlimited number of shares authorized, $.001 par value) | $16.89 | $14.97 |
The accompanying notes are an integral part of these financial statements.
| | | |
Semi-Annual Report | Jensen Quality Value Fund | 21 |
Jensen Quality Value Fund
Schedule of Investments
November 30, 2023 (Unaudited)
Common Stocks - 98.31%
| shares | Air Freight & Logistics - 0.77% | value |
| 11,380 | Expeditors International of Washington, Inc. | $1,369,469 |
| | | |
| shares | Automobile Components - 2.64% | value |
| 154,820 | Gentex Corp. | $4,708,076 |
| | | |
| shares | Building Products - 3.45% | value |
| 15,170 | Lennox International, Inc. | $6,169,032 |
| | | |
| shares | Capital Markets - 2.73% | value |
| 10,750 | FactSet Research Systems, Inc. | $4,874,695 |
| | | |
| shares | Commercial Services & Supplies - 3.87% | value |
| 137,810 | Copart, Inc. (a) | $6,920,818 |
| | | |
| shares | Communications Equipment - 2.18% | value |
| 22,750 | F5, Inc. (a) | $3,894,573 |
| | | |
| shares | Consumer Staples Distribution & Retail - 3.42% | value |
| 137,980 | Kroger Co. | $6,108,375 |
| | | |
| shares | Containers & Packaging - 3.89% | value |
| 80,820 | Crown Holdings, Inc. | $6,951,328 |
| | | |
| shares | Distributors - 4.65% | value |
| 41,040 | Genuine Parts Co. | $5,449,291 |
| 8,240 | Pool Corp. | $2,861,917 |
| | | $8,311,208 |
| | | |
| shares | Electronic Equipment, Instruments & Components - 4.64% | value |
| 48,530 | Amphenol Corp. - Class A | $4,415,744 |
| 28,540 | Keysight Technologies, Inc. | $3,878,301 |
| | | $8,294,045 |
The accompanying notes are an integral part of these financial statements.
| | | |
| 22 | Jensen Quality Value Fund | Semi-Annual Report |
Jensen Quality Value Fund
Schedule of Investments continued
November 30, 2023 (Unaudited)
| shares | Food Products - 7.54% | value |
| 101,670 | Campbell Soup Co. | $4,085,101 |
| 75,940 | General Mills, Inc. | $4,834,340 |
| 86,320 | Kellogg Co. | $4,535,253 |
| | | $13,454,694 |
| | | |
| shares | Health Care Providers & Services - 7.83% | value |
| 105,540 | Encompass Health Corp. | $6,878,042 |
| 32,710 | Laboratory Corp. of America Holdings | $7,095,126 |
| | | $13,973,168 |
| | | |
| shares | Household Products - 3.03% | value |
| 56,010 | Church & Dwight Co., Inc. | $5,412,246 |
| | | |
| shares | Life Sciences Tools & Services - 6.56% | value |
| 52,060 | Bio-Techne Corp. | $3,274,574 |
| 25,530 | Charles River Laboratories International, Inc. (a) | $5,031,452 |
| 12,170 | Waters Corp. (a) | $3,415,024 |
| | | $11,721,050 |
| | | |
| shares | Machinery - 3.23% | value |
| 42,060 | Donaldson Co., Inc. | $2,558,930 |
| 38,740 | Toro Co. | $3,215,420 |
| | | $5,774,350 |
| | | |
| shares | Professional Services - 14.62% | value |
| 16,310 | Booz Allen Hamilton Holding Corp. | $2,040,870 |
| 35,129 | Broadridge Financial Solutions, Inc. | $6,808,703 |
| 34,240 | Equifax, Inc. | $7,454,389 |
| 150,910 | Genpact Ltd. | $5,124,904 |
| 30,330 | Maximus, Inc. | $2,532,252 |
| 8,850 | Verisk Analytics, Inc. | $2,136,656 |
| | | $26,097,774 |
| | | |
| shares | Real Estate Management & Development - 1.58% | value |
| 35,770 | CBRE Group, Inc. - Class A (a) | $2,824,399 |
The accompanying notes are an integral part of these financial statements.
| | | |
Semi-Annual Report | Jensen Quality Value Fund | 23 |
Jensen Quality Value Fund
Schedule of Investments continued
November 30, 2023 (Unaudited)
| shares | Semiconductors & Semiconductor Equipment - 3.40% | value |
| 72,840 | Microchip Technology, Inc. | $6,077,770 |
| | | |
| shares | Software - 4.64% | value |
| 10,730 | Cadence Design Systems, Inc. (a) | $2,932,187 |
| 24,040 | Manhattan Associates, Inc. (a) | $5,362,122 |
| | | $8,294,309 |
| | | |
| shares | Specialty Retail - 9.43% | value |
| 67,290 | Best Buy Co., Inc. | $4,773,553 |
| 26,200 | Tractor Supply Co. | $5,318,862 |
| 7,710 | Ulta Beauty, Inc. (a) | $3,284,383 |
| 18,360 | Williams-Sonoma, Inc. | $3,443,234 |
| | | $16,820,032 |
| | | |
| shares | Textiles, Apparel & Luxury Goods - 2.24% | value |
| 258,640 | Levi Strauss & Co. - Class A | $4,006,334 |
| | | |
| shares | Trading Companies & Distributors - 1.97% | value |
| 7,390 | United Rentals, Inc. | $3,517,788 |
| | | |
| Total Common Stocks | value |
| (Cost $152,640,354) | $175,575,533 |
| | | |
| Money Market Funds - 1.56% | |
| shares | | value |
| 2,795,014 | First American Treasury Obligations Fund - X Class, 5.265% (b) | $2,795,014 |
| | | |
| Total Money Market Funds | value |
| (Cost $2,795,014) | $2,795,014 |
The accompanying notes are an integral part of these financial statements.
| | | |
| 24 | Jensen Quality Value Fund | Semi-Annual Report |
Jensen Quality Value Fund
Schedule of Investments continued
November 30, 2023 (Unaudited)
| Total Investments - 99.87% | value |
| (Cost $155,435,368) | $178,370,547 |
| Other Assets in Excess of Liabilities - 0.13% | $239,173 |
| TOTAL NET ASSETS - 100.00% | $178,609,720 |
Percentages are stated as a percent of net assets.
(a) Non-income producing security.
(b) The rate shown represents the seven-day yield as of November 30, 2023.
The Global Industry Classification Standard (GICS®) was developed by and/or is the exclusive property of MSCI, Inc. (“MSCI”) and Standard & Poor’s Financial Services LLC (“S&P”). GICS is a service mark of MSCI and S&P and has been licensed for use by U.S. Bancorp Fund Services, LLC.
The accompanying notes are an integral part of these financial statements.
| | | |
Semi-Annual Report | Jensen Quality Value Fund | 25 |
Jensen Global Quality Growth Fund
Schedule of Investments
November 30, 2023 (Unaudited)
Common Stocks - 98.72%
| shares | Canada - 4.71% | value |
| 8,970 | Alimentation Couche-Tard, Inc. | $511,646 |
| 14,630 | Canadian National Railway Co. | $1,697,660 |
| | | $2,209,306 |
| | | |
| shares | France - 4.35% | value |
| 22,308 | Dassault Systemes SE | $1,046,253 |
| 480 | Hermes International SCA | $994,802 |
| | | $2,041,055 |
| | | |
| shares | Germany - 4.26% | value |
| 12,560 | SAP SE | $1,997,917 |
| | | |
| shares | Ireland - 5.75% | value |
| 8,090 | Accenture PLC - Class A | $2,695,103 |
| | | |
| shares | Netherlands - 1.96% | value |
| 1,350 | ASML Holding NV | $920,056 |
| | | |
| shares | Spain - 3.23% | value |
| 22,080 | Amadeus IT Group SA | $1,515,933 |
| | | |
| shares | Switzerland - 3.12% | value |
| 12,840 | Nestle SA | $1,461,047 |
| | | |
| shares | Taiwan, Province Of China - 3.69% | value |
| 17,770 | Taiwan Semiconductor Manufacturing Co. Ltd.-ADR | $1,729,199 |
| | | |
| shares | United Kingdom - 11.56% | value |
| 16,200 | AstraZeneca PLC | $2,085,045 |
| 72,520 | Compass Group PLC | $1,835,949 |
| 42,610 | Diageo PLC | $1,491,409 |
| | | $5,412,403 |
The accompanying notes are an integral part of these financial statements.
| | | |
| 26 | Jensen Global Quality Growth Fund | Semi-Annual Report |
Jensen Global Quality Growth Fund
Schedule of Investments continued
November 30, 2023 (Unaudited)
| shares | United States - 56.09% | value |
| 14,410 | Alphabet, Inc. - Class A (a) | $1,909,757 |
| 5,280 | Aon PLC - Class A | $1,734,427 |
| 9,660 | Apple, Inc. - Class A | $1,834,917 |
| 6,070 | Automatic Data Processing, Inc.. | $1,395,615 |
| 3,860 | Broadridge Financial Solutions, Inc. | $748,145 |
| 5,020 | Equifax, Inc. | $1,092,904 |
| 2,900 | Home Depot, Inc. | $909,121 |
| 2,580 | Intuit, Inc. | $1,474,367 |
| 1,470 | KLA Corp. | $800,591 |
| 2,370 | Mastercard, Inc. - Class A | $980,777 |
| 8,330 | Microsoft Corp. | $3,156,319 |
| 9,610 | NIKE, Inc. - Class B | $1,059,695 |
| 12,370 | PepsiCo, Inc. | $2,081,747 |
| 30,050 | Pfizer, Inc. | $915,624 |
| 13,310 | Starbucks Corp. | $1,321,683 |
| 4,980 | Stryker Corp. | $1,475,723 |
| 5,070 | Texas Instruments, Inc. | $774,240 |
| 2,260 | UnitedHealth Group, Inc. | $1,249,712 |
| 3,790 | Verisk Analytics, Inc. | $915,020 |
| 1,650 | Waters Corp. (a) | $463,007 |
| | | $26,293,391 |
| | | |
| Total Common Stocks | value |
| (Cost $38,817,210) | $46,275,410 |
The accompanying notes are an integral part of these financial statements.
| | | |
Semi-Annual Report | Jensen Global Quality Growth Fund | 27 |
Jensen Global Quality Growth Fund
Schedule of Investments continued
November 30, 2023 (Unaudited)
| Money Market Funds - 1.15% | |
| shares | | value |
| 536,712 | First American Treasury Obligations Fund - X Class, 5.265% (b) | $536,712 |
| | | |
| Total Money Market Funds | value |
| (Cost $536,712) | $536,712 |
| | | |
| Total Investments | value |
| (Cost $39,353,922) - 99.87% | $46,812,122 |
| Other Assets in Excess of Liabilities - 0.13% | $59,649 |
| TOTAL NET ASSETS - 100.00% | $46,871,771 |
Percentages are stated as a percent of net assets.
| ADR | American Depositary Receipt |
| NV | Naamloze Vennootschap is a Dutch term for publicly traded companies. |
| PLC | Public Limited Company |
| SA | An abbreviation used by many countries to signify a stock company whereby shareholders have limited liability. |
| SCA | Societe en commandite par actions is a Belgian term for limited partnership with share capital. |
| SE | Societas Europaea is a term for a European Public Liability Company. |
(a) Non-income producing security.
(b) The rate shown represents the seven-day yield as of November 30, 2023.
The accompanying notes are an integral part of these financial statements.
| | | |
| 28 | Jensen Global Quality Growth Fund | Semi-Annual Report |
Statements of Operations
For the Six Months Ended November 30, 2023 (Unaudited)
| Investment Income: | Jensen
Quality
Value Fund | Jensen
Global Quality
Growth Fund |
| Dividend income | $1,308,914 | $326,731(1) |
| Interest income | 68,660 | 7,075 |
| Total Investment Income | 1,377,574 | 333,806 |
| | | |
| Expenses: | | |
| Investment management fees | 591,763 | 169,273 |
| 12b-1 fees - Class J | 36,572 | 3,134 |
| Federal and state registration fees | 14,746 | 14,650 |
| Reports to shareholders | 17,217 | 2,284 |
| Administration fees | 23,367 | 11,265 |
| Transfer agent fees | 23,422 | 22,782 |
| Fund accounting fees | 21,407 | 12,811 |
| Trustees’ fees | 11,100 | 10,916 |
| Legal fees | 12,986 | 8,605 |
| Shareholder servicing fees - Class I | 9,464 | 227 |
| Audit and tax fees | 8,967 | 9,516 |
| Transfer agent expenses | 8,411 | 1,274 |
| Chief Compliance Officer fees | 6,222 | 6,222 |
| Custody fees | 3,559 | 7,048 |
| Insurance expense | 3,284 | 2,555 |
| Other | 6,628 | 4,498 |
| Total expenses | 799,115 | 287,060 |
| Less waivers and reimbursements by Adviser (Note 4) | (22,523) | (58,002) |
| Net expenses | 776,592 | 229,058 |
| | | |
| Net Investment Income | 600,982 | 104,748 |
| | | |
| Realized and Unrealized Gain (Loss) on Investments: | | |
| Net realized gain (loss) on: | | |
| Investments | 1,797,392 | (16,907) |
| Foreign currency translations | – | (4,246) |
| Change in unrealized appreciation on: | | |
| Investments | 9,958,086 | 1,805,474 |
| Foreign currency translations | – | 855 |
| Net realized and unrealized gain on investments | 11,755,478 | 1,785,176 |
| Net Increase in Net Assets Resulting from Operations | $12,356,460 | $1,889,924 |
| (1) | Net of $9,286 in dividend withholding tax. |
The accompanying notes are an integral part of these financial statements.
| | | |
Semi-Annual Report | Jensen Quality Value Fund | 29 |
Statements of Changes in Net Assets
| | Jensen Quality Value Fund |
| Operations: | Six Months
Ended
November 30,
2023 (Unaudited) | Year Ended
May 31, 2023 |
| Net investment income | $600,982 | $1,341,545 |
| Net realized gain (loss) on investment transactions | 1,797,392 | (3,299,475) |
| Change in unrealized appreciation on investments | 9,958,086 | 7,604,792 |
| Net increase in net assets resulting from operations | 12,356,460 | 5,646,862 |
| | | |
| Capital Share Transactions: | | |
| Shares Sold - Class J | 2,026,146 | 3,811,677 |
| Shares Sold - Class I | 10,894,738 | 20,342,482 |
| Shares Sold - Class Y | 1,616,129 | 1,402,074 |
| Shares issued to holders in reinvestment of dividends - Class J | 63,710 | 854,505 |
| Shares issued to holders in reinvestment of dividends - Class I | 315,747 | 2,927,455 |
| Shares issued to holders in reinvestment of dividends - Class Y | 200,138 | 1,621,912 |
| Shares redeemed - Class J | (3,475,433) | (15,322,382) |
| Shares redeemed - Class I | (21,184,534) | (34,488,895) |
| Shares redeemed - Class Y | (928,330) | (5,090,649) |
| Net decrease in net assets from capital share transactions | (10,471,689) | (23,941,821) |
| | | |
| Dividends and Distributions to Shareholders: | | |
| Net dividends and distributions to shareholders - Class J | (63,865) | (854,505) |
| Net dividends and distributions to shareholders - Class I | (315,844) | (2,928,735) |
| Net dividends and distributions to shareholders - Class Y | (200,138) | (1,621,912) |
| Total dividends and distributions | (579,847) | (5,405,152) |
| Increase (Decrease) In Net Assets | 1,304,924 | (23,700,111) |
| | | |
| Net Assets: | | |
| Beginning of period | $177,304,796 | $201,004,907 |
| End of period | $178,609,720 | $177,304,796 |
The accompanying notes are an integral part of these financial statements.
| | | |
| 30 | Jensen Quality Value Fund | Semi-Annual Report |
Statements of Changes in Net Assets
| | Jensen Global Quality Growth Fund |
| Operations: | Six Months
Ended
November 30,
2023 (Unaudited) | Year Ended
May 31, 2023 |
| Net investment income | $104,748 | $252,484 |
| Net realized loss on: | | |
| Investments | (16,907) | (592,160) |
| Foreign currency translations | (4,246) | (24,406) |
| Change in unrealized appreciation on: | | |
| Investments | 1,805,474 | 3,107,771 |
| Foreign currency translations | 855 | 115 |
| Net increase in net assets resulting from operations | 1,889,924 | 2,743,804 |
| | | |
| Capital Share Transactions: | | |
| Shares Sold - Class J | 216,430 | 383,956 |
| Shares Sold - Class I | 5,000 | 2,681,873 |
| Shares Sold - Class Y | 1,274,651 | 5,514,454 |
| Shares issued to holders in reinvestment of dividends - Class J | 5,358 | 7,364 |
| Shares issued to holders in reinvestment of dividends - Class I | 7,166 | 21,477 |
| Shares issued to holders in reinvestment of dividends - Class Y | 131,055 | 222,211 |
| Shares redeemed - Class J | (591,652) | (137,655) |
| Shares redeemed - Class I | (15,678) | (3,278,755) |
| Shares redeemed - Class Y | (217,816) | (1,452,394) |
| Net increase in net assets from capital share transactions | 814,514 | 3,962,531 |
| | | |
| Dividends and Distributions to Shareholders: | | |
| Net dividends and distributions to shareholders - Class J | (5,363) | (7,364) |
| Net dividends and distributions to shareholders - Class I | (7,166) | (21,477) |
| Net dividends and distributions to shareholders - Class Y | (131,055) | (222,211) |
| Total dividends and distributions | (143,584) | (251,052) |
| Increase in Net Assets | 2,560,854 | 6,455,283 |
| | | |
| NET ASSETS: | | |
| Beginning of period | $44,310,917 | $37,855,634 |
| End of period | $46,871,771 | $44,310,917 |
The accompanying notes are an integral part of these financial statements.
| | | |
Semi-Annual Report | Jensen Global Quality Growth Fund | 31 |
Financial Highlights
Jensen Quality Value Fund - Class J
| Per Share Data: | six months
ended
November 30,
2023
(unaudited) | year
ended
May 31,
2023 | year
ended
May 31,
2022 | year
ended
May 31,
2021 | year
ended
May 31,
2020 | year
ended
May 31,
2019 |
| Net asset value, beginning of period | $15.89 | $15.85 | $17.47 | $12.17 | $12.24 | $12.59 |
| Income (loss) from investment operations: | | | | | | |
| Net investment income(1) | 0.04 | 0.08 | 0.05 | 0.06 | 0.08 | 0.1 |
| Net realized and unrealized gain (loss) on investments | 1.08 | 0.40 | (1.21) | 5.43 | 0.41 | 0.22 |
| Total from investment operations | 1.12 | 0.48 | (1.16) | 5.49 | 0.49 | 0.32 |
| Less distributions: | | | | | | |
| Dividends from net investment income | (0.04) | (0.06) | (0.04) | (0.06) | (0.08) | (0.10) |
| Distributions from net realized gain on investments | - | (0.38) | (0.42) | (0.13) | (0.48) | (0.57) |
| Total distributions | (0.04) | (0.44) | (0.46) | (0.19) | (0.56) | (0.67) |
| Net asset value, end of period | $16.97 | $15.89 | $15.85 | $17.47 | $12.17 | $12.24 |
| Total return(2) | 7.03% | 3.12% | (6.98)% | 45.37% | 3.72% | 2.89% |
| Supplemental data and ratios: | | | | | | |
| Net assets, end of period (000’s) | $28,850 | $28,366 | $38,942 | $37,105 | $6,569 | $2,444 |
| Ratio of expenses to average net assets | | | | | | |
| Before waivers and reimbursements of expenses(3) | 1.07% | 1.10% | 1.11% | 1.25% | 1.57% | 1.50% |
| After waivers and reimbursements of expenses(3) | 1.05% | 1.05% | 1.05% | 1.05% | 1.05% | 1.05% |
| Ratio of net investment income to average net assets | | | | | | |
| Before waivers and reimbursements of expenses(3) | 0.44% | 0.47% | 0.25% | 0.18% | 0.16% | 0.39% |
| After waivers and reimbursements of expenses(3) | 0.46% | 0.52% | 0.31% | 0.38% | 0.68% | 0.84% |
| Portfolio turnover rate(2) | 12.20% | 15.57% | 17.78% | 18.15% | 36.19% | 42.51% |
(1) Per share amounts are calculated using the average shares outstanding method.
(2) Not annualized for periods less than one year.
(3) Annualized for periods less than one year.
The accompanying notes are an integral part of these financial statements.
| | | |
| 32 | Jensen Quality Value Fund | Semi-Annual Report |
Financial Highlights
Jensen Quality Value Fund - Class I
| Per Share Data: | six months
ended
November 30,
2023
(unaudited) | year
ended
May 31,
2023 | year
ended
May 31,
2022 | year
ended
May 31,
2021 | year
ended
May 31,
2020 | year
ended
May 31,
2019 |
| Net asset value, beginning of period | $15.86 | $15.81 | $17.43 | $12.13 | $12.18 | $12.52 |
| Income (loss) from investment operations: | | | | | | |
| Net investment income(1) | 0.06 | 0.12 | 0.09 | 0.09 | 0.12 | 0.13 |
| Net realized and unrealized gain (loss) on investments | 1.07 | 0.40 | (1.21) | 5.42 | 0.39 | 0.23 |
| Total from investment operations | 1.13 | 0.52 | (1.12) | 5.51 | 0.51 | 0.36 |
| Less distributions: | | | | | | |
| Dividends from net investment income | (0.06) | (0.09) | (0.08) | (0.08) | (0.08) | (0.13) |
| Distributions from net realized gain on investments | – | (0.38) | (0.42) | (0.13) | (0.48) | (0.57) |
| Total distributions | (0.06) | (0.47) | (0.50) | (0.21) | (0.56) | (0.70) |
| Net asset value, end of period | $16.93 | $15.86 | $15.81 | $17.43 | $12.13 | $12.18 |
| Total return(2) | 7.10% | 3.38% | -6.79% | 45.80% | 3.88% | 3.25% |
| Supplemental data and ratios: | | | | | | |
| Net assets, end of period (000's) | $89,977 | $89,977 | $104,867 | $44,113 | $2,491 | $33,470 |
| Ratio of expenses to average net assets | | | | | | |
| Before waivers and reimbursements of expenses(3) | 0.84% | 0.87% | 0.88% | 1.00% | 1.23% | 1.27% |
| After waivers and reimbursements of expenses(3) | 0.82% | 0.82% | 0.82% | 0.82% | 0.82% | 0.82% |
| Ratio of net investment income to average net assets | | | | | | |
| Before waivers and reimbursements of expenses(3) | 0.66% | 0.70% | 0.50% | 0.42% | 0.51% | 0.62% |
| After waivers and reimbursements of expenses(3) | 0.68% | 0.75% | 0.56% | 0.60% | 0.92% | 1.07% |
| Portfolio turnover rate(2) | 12.20% | 15.57% | 0.18% | 18.15% | 36.19% | 42.51% |
(1) Per share amounts are calculated using the average shares outstanding method.
(2) Not annualized for periods less than one year.
(3) Annualized for periods less than one year.
The accompanying notes are an integral part of these financial statements.
| | | |
Semi-Annual Report | Jensen Quality Value Fund | 33 |
Financial Highlights
Jensen Quality Value Fund - Class Y
| Per Share Data: | six months
ended
November 30,
2023
(unaudited) | year
ended
May 31,
2023 | year
ended
May 31,
2022 | year
ended
May 31,
2021 | period
ended
May 31,
2020 (1) |
| Net asset value, beginning of period | $15.82 | $15.78 | $17.39 | $12.11 | $13.38 |
| Income (loss) from investment operations: | | | | | |
| Net investment income(2) | 0.06 | 0.12 | 0.09 | 0.10 | 0.04 |
| Net realized and unrealized gain (loss) on investments | 1.07 | 0.39 | (1.20) | 5.40 | (1.28) |
| Total from investment operations | 1.13 | 0.51 | (1.11) | 5.50 | (1.24) |
| Less distributions: | | | | | |
| Dividends from net investment income | (0.06) | (0.09) | (0.08) | (0.09) | (0.03) |
| Distributions from net realized gain on investments | – | (0.38) | (0.42) | (0.13) | – |
| Total distributions | (0.06) | (0.47) | (0.50) | (0.22) | (0.03) |
| Net asset value, end of period | $16.89 | $15.82 | $15.78 | $17.39 | $12.11 |
| Total return(3) | 7.13% | 3.34% | -6.73% | 45.72% | -9.24% |
| Supplemental data and ratios: | | | | | |
| Net assets, end of period (000’s) | $59,783 | $59,783 | $57,196 | $50,693 | $35,326 |
| Ratio of expenses to average net assets | | | | | |
| Before waivers and reimbursements of expenses(4) | 0.82% | 0.85% | 0.86% | 1.05% | 1.52% |
| After waivers and reimbursements of expenses(4) | 0.80% | 0.80% | 0.80% | 0.80% | 0.80% |
| Ratio of net investment income to average net assets | | | | | |
| Before waivers and reimbursements of expenses(4) | 0.69% | 0.73% | 0.50% | 0.40% | 0.23% |
| After waivers and reimbursements of expenses(4) | 0.71% | 0.78% | 0.56% | 0.65% | 0.95% |
| Portfolio turnover rate(3) | 12.20% | 15.57% | 17.78% | 18.15% | 36.19% |
(1) Class Y shares commenced operations on January 15, 2020.
(2) Per share amounts are calculated using the average shares outstanding method.
(3) Not annualized for periods less than one year.
(4) Annualized for periods less than one year.
The accompanying notes are an integral part of these financial statements.
| | | |
| 34 | Jensen Quality Value Fund | Semi-Annual Report |
Financial Highlights
Jensen Global Quality Growth Fund - Class J
| Per Share Data: | six months
ended
November 30,
2023
(unaudited) | year
ended
May 31,
2023 | year
ended
May 31,
2022 | year
ended
May 31,
2021 | period
ended
May 31,
2020(1) |
| Net asset value, beginning of period | $14.40 | $13.73 | $14.20 | $10.81 | $10.00 |
| Income (loss) from investment operations: | | | | | |
| Net investment income(2) | 0.02 | 0.05 | 0.05 | 0.06 | 0.02 |
| Net realized and unrealized gain (loss) on investments | 0.57 | 0.66 | (0.48) | 3.38 | 0.79 |
| Total from investment operations | 0.59 | 0.71 | (0.43) | 3.44 | 0.81 |
| Less distributions: | | | | | |
| Dividends from net investment income | (0.03) | (0.04) | (0.04) | (0.05) | – |
| Total distributions | (0.03) | (0.04) | (0.04) | (0.05) | – |
| Net asset value, end of period | $14.96 | $14.40 | $13.73 | $14.20 | $10.81 |
| Total return(3) | 4.10% | 5.23% | -3.02% | 31.94% | 8.10% |
| Supplemental data and ratios: | | | | | |
| Net assets, end of period (000's) | $2,203 | $2,526 | $2,145 | $1,700 | $454 |
| Ratio of expenses to average net assets | | | | | |
| Before waivers and reimbursements of expenses(4) | 1.51% | 1.61% | 1.64% | 2.68% | 33.40% |
| After waivers and reimbursements of expenses(4) | 1.25% | 1.25% | 1.25% | 1.25% | 1.25% |
| Ratio of net investment income to average net assets | | | | | |
| Before waivers and reimbursements of expenses(4) | (0.04)% | 0.02% | (0.06)% | (0.92)% | (30.52)% |
| After waivers and reimbursements of expenses(4) | 0.22% | 0.38% | 0.33% | 0.51% | 1.63% |
| Portfolio turnover rate(3) | 5.68% | 16.82% | 3.04% | 4.05% | 0.00% |
(1) The Fund commenced operations on April 15, 2020.
(2) Per share amounts are calculated using the average shares outstanding method.
(3) Not annualized for periods less than one year.
(4) Annualized for periods less than one year.
The accompanying notes are an integral part of these financial statements.
| | | |
Semi-Annual Report | Jensen Global Quality Growth Fund | 35 |
Financial Highlights
Jensen Global Quality Growth Fund - Class I
| Per Share Data: | six months
ended
November 30,
2023
(unaudited) | year
ended
May 31,
2023 | year
ended
May 31,
2022 | year
ended
May 31,
2021 | period
ended
May 31,
2020(1) |
| Net asset value, beginning of period | $14.40 | $13.75 | $14.21 | $10.81 | $10.00 |
| Income (loss) from investment operations: | | | | | |
| Net investment income(2) | 0.03 | 0.08 | 0.09 | 0.11 | 0.02 |
| Net realized and unrealized gain (loss) on investments | 0.57 | 0.65 | (0.48) | 3.37 | 0.79 |
| Total from investment operations | 0.60 | 0.73 | (0.39) | 3.48 | 0.81 |
| Less distributions: | | | | | |
| Dividends from net investment income | (0.04) | (0.08) | (0.07) | (0.08) | – |
| Total distributions | (0.04) | (0.08) | (0.07) | (0.08) | – |
| Net asset value, end of period | $14.96 | $14.40 | $13.75 | $14.21 | $10.81 |
| Total return(3) | 4.22% | 5.39% | -2.74% | 32.27% | 8.10% |
| Supplemental data and ratios: | | | | | |
| Net assets, end of period (000's) | $2,334 | $2,249 | $2,350 | $1,842 | $227 |
| Ratio of expenses to average net assets | | | | | |
| Before waivers and reimbursements of expenses(4) | 1.28% | 1.36% | 1.42% | 2.11% | 33.49% |
| After waivers and reimbursements of expenses(4) | 1.02% | 1.02% | 1.02% | 1.02% | 1.02% |
| Ratio of net investment income to average net assets | | | | | |
| Before waivers and reimbursements of expenses(4) | 0.20% | 0.28% | 0.17% | (0.28)% | (30.60)% |
| After waivers and reimbursements of expenses(4) | 0.46% | 0.62% | 0.57% | 0.81% | 1.87% |
| Portfolio turnover rate(3) | 5.68% | 16.82% | 3.04% | 4.05% | 0.00% |
(1) The Fund commenced operations on April 15, 2020.
(2) Per share amounts are calculated using the average shares outstanding method.
(3) Not annualized for periods less than one year.
(4) Annualized for periods less than one year.
The accompanying notes are an integral part of these financial statements.
| | | |
| 36 | Jensen Global Quality Growth Fund | Semi-Annual Report |
Financial Highlights
Jensen Global Quality Growth Fund - Class Y
| Per Share Data: | six months
ended
November 30,
2023
(unaudited) | year
ended
May 31,
2023 | year
ended
May 31,
2022 | year
ended
May 31,
2021 | period
ended
May 31,
2020(1) |
| Net asset value, beginning of period | $14.41 | $13.75 | $14.21 | $10.81 | $10.00 |
| Income (loss) from investment operations: | | | | | |
| Net investment income(2) | 0.03 | 0.08 | 0.09 | 0.11 | 0.03 |
| Net realized and unrealized gain (loss) on investments | 0.57 | 0.66 | (0.48) | 3.37 | 0.78 |
| Total from investment operations | 0.60 | 0.74 | (0.39) | 3.48 | 0.81 |
| Less distributions: | | | | | |
| Dividends from net investment income | (0.04) | (0.08) | (0.07) | (0.08) | – |
| Total distributions | (0.04) | (0.08) | (0.07) | (0.08) | – |
| Net asset value, end of period | $14.97 | $14.41 | $13.75 | $14.21 | $10.81 |
| Total return(3) | 4.22% | 5.48% | -2.72% | 32.29% | 8.10% |
| Supplemental data and ratios: | | | | | |
| Net assets, end of period (000's) | $42,335 | $39,536 | $33,361 | $23,555 | $1,206 |
| Ratio of expenses to average net assets | | | | | |
| Before waivers and reimbursements of expenses(4) | 1.26% | 1.36% | 1.40% | 2.15% | 32.29% |
| After waivers and reimbursements of expenses(4) | 1.00% | 1.00% | 1.00% | 1.00% | 1.00% |
| Ratio of net investment income to average net assets | | | | | |
| Before waivers and reimbursements of expenses(4) | 0.22% | 0.27% | 0.18% | (0.32)% | (29.29)% |
| After waivers and reimbursements of expenses(4) | 0.48% | 0.63% | 0.58% | 0.82% | 2.00% |
| Portfolio turnover rate(3) | 5.68% | 16.82% | 3.04% | 4.05% | 0.00% |
(1) The Fund commenced operations on April 15, 2020.
(2) Per share amounts are calculated using the average shares outstanding method.
(3) Not annualized for periods less than one year.
(4) Annualized for periods less than one year.
The accompanying notes are an integral part of these financial statements.
| | | |
Semi-Annual Report | Jensen Global Quality Growth Fund | 37 |
Notes to Financial Statements
November 30, 2023 (Unaudited)
1. Organization
Trust for Professional Managers (the “Trust”) was organized as a Delaware statutory trust under a Declaration of Trust dated May 29, 2001. The Trust is registered under the Investment Company Act of 1940, as amended (the “1940 Act”), as an open-end management investment company. The Jensen Quality Value Fund, formerly known as the Jensen Value Fund, and the Jensen Global Quality Growth Fund (each, a “Fund,” and together, the “Funds”), each represent a distinct series with its own investment objective and policies within the Trust. The investment objective of each of the Jensen Quality Value Fund and the Jensen Global Quality Growth Fund is long-term capital appreciation. The Trust may issue an unlimited number of shares of beneficial interest at $0.001 par value. The assets of the Funds are segregated, and a shareholder’s interest is limited to the Fund in which shares are held. The Class J and Class I shares of the Jensen Quality Value Fund became effective and commenced operations on March 31, 2010. The Class Y shares of the Jensen Quality Value Fund became effective and commenced operations on January 15, 2020. The Jensen Global Quality Growth Fund commenced investment operations on April 15, 2020 for Class J, Class I, and Class Y shares. For both Funds, Class J shares are subject to a 0.25% distribution (Rule 12b-1) and shareholder servicing fee and Class I shares are subject to a shareholder servicing fee of up to 0.10%. Each class of shares has identical rights and privileges except with respect to the distribution (Rule 12b-1) and shareholder servicing fees, and voting rights on matters affecting a single share class. Costs incurred by the Funds in connection with the organization, registration and the initial public offering of shares were paid by Jensen Investment Management, Inc. (the “Adviser”), the Funds’ investment adviser.
The Funds are investment companies and accordingly follow the investment company accounting and reporting guidance of the Financial Accounting Standards Board (“FASB”) Accounting Standards Codification Topic 946, Financial Services–Investment Companies.
2. Significant Accounting Policies
The following is a summary of significant accounting policies consistently followed by the Funds in the preparation of the financial statements. These policies are in conformity with generally accepted accounting principles in the United States of America (“GAAP”).
(a) Investment Valuation – Each equity security owned by the Funds that is listed on a securities exchange, except those listed on the NASDAQ Stock Market LLC (“NASDAQ”), is valued at its last sale price on that exchange on the date as of which assets are valued. If a security is listed on more than one exchange, the Funds will use the price of the exchange that the Funds generally consider to be the principal exchange on which the stock is traded.
Fund securities listed on NASDAQ will be valued at the NASDAQ Official Closing Price, which may not necessarily represent the last sale price. If there has been no sale on such exchange or on NASDAQ on such day, the security is valued at (i) the mean between the most recent quoted bid and asked prices at the close of the exchange or (ii) the latest sales price on the Composite Market
| | | |
| 38 | Jensen Quality Value Fund, Jensen Global Quality Growth Fund | Semi-Annual Report |
for the day such security is being valued. “Composite Market“ means a consolidation of the trade information provided by national securities and foreign exchanges and over-the-counter markets, as published by an approved independent pricing service (“Pricing Service”).
Foreign securities will be priced in their local currencies as of the close of their primary exchange or market or as of the time a Fund calculates its net asset value (“NAV”), whichever is earlier. Foreign securities, currencies and other assets denominated in foreign currencies are then translated into U.S. dollars at the exchange rate of such currencies against the U.S. dollar, as provided by a Pricing Service or reporting agency. All assets denominated in foreign currencies will be converted into U.S. dollars using the applicable currency exchange rates as of the close of the New York Stock Exchange (“NYSE”), generally 4:00 p.m. Eastern Time.
Foreign securities are traded on foreign exchanges which typically close before the close of business on each day on which the NYSE is open. Each security trading on these exchanges may be valued utilizing a systematic fair valuation model provided by a Pricing Service. The valuation of each security that meets certain criteria in relation to the valuation model is systematically adjusted to reflect the impact of movement in the U.S. market after the foreign markets close and are classified as Level 2 securities. Securities that do not meet the criteria, or that are principally traded in other foreign markets, are valued as of the last reported sale price at the time the respective Fund determines its NAV, or when reliable market prices or quotations are not readily available, at the mean between the most recent bid and asked quotations as of the close of the appropriate exchange or other designated time.
Debt securities, including short-term debt instruments having a maturity of 60 days or less, are valued at the mean in accordance with prices supplied by a Pricing Service. Pricing Services may use various valuation methodologies such as the mean between the bid and the asked prices, matrix pricing and other analytical pricing models as well as market transactions and dealer quotations. If a price is not available from a Pricing Service, the most recent quotation obtained from one or more broker-dealers known to follow the issue will be obtained. Quotations will be valued at the mean between the bid and the offer. In the absence of available quotations, the securities will be priced at fair value, as described below. Any discount or premium is accreted or amortized using the constant yield method until maturity.
Redeemable securities issued by open-end, registered investment companies, including money market mutual funds, are valued at the NAV of such companies for purchase and/or redemption orders placed on that day. If, on a particular day, a share of an investment company is not listed on NASDAQ, such security’s fair value will be determined.
When market quotations are not readily available, any security or other asset is valued at its fair value in accordance with Rule 2a-5 of the 1940 Act as determined under the Adviser’s fair value pricing procedures, subject to oversight by the Board of Trustees. These fair value procedures will also be used to price a security when corporate events, events in the securities market or world events cause the Adviser to believe that a security’s last sale price may not reflect its actual fair value. The intended effect of using fair value pricing procedures is to ensure that the Funds are accurately priced. The Adviser will regularly evaluate whether the Funds’ fair value pricing
| | | |
Semi-Annual Report | Jensen Quality Value Fund, Jensen Global Quality Growth Fund | 39 |
procedures continue to be appropriate in light of the specific circumstances of the Funds and the quality of prices obtained through the application of such procedures.
FASB Accounting Standards Codification, Fair Value Measurements and Disclosures (“ASC 820”) Topic 820, establishes an authoritative definition of fair value and sets out a hierarchy for measuring fair value. ASC 820 requires an entity to evaluate certain factors to determine whether there has been a significant decrease in volume and level of activity for the security such that recent transactions and quoted prices may not be determinative of fair value and further analysis and adjustment may be necessary to estimate fair value. ASC 820 also requires enhanced disclosure regarding the inputs and valuation techniques used to measure fair value in those instances as well as expanded disclosure of valuation levels for each class of investments. These inputs are summarized in the three broad levels listed below:
| ● Level 1 – | Quoted prices in active markets for identical securities. |
| ●�� Level 2 – | Other significant observable inputs (including quoted prices for similar securities, interest rates, prepayment speeds, credit risk, etc.). |
| ● Level 3 – | Significant unobservable inputs (including a Fund’s own assumptions in determining the fair value of investments). |
The inputs or methodology used for valuing securities are not necessarily an indication of the risk associated with investing in those securities. The following is a summary of the inputs used to value each Fund’s investments carried at fair value as of November 30, 2023:
| Jensen Quality Value Fund | Level 1 | Level 2 | Level 3 | Total |
| Common Stock(1) | $175,575,533 | $— | $— | $175,575,533 |
| Short-Term Investments | 2,795,014 | — | — | 2,795,014 |
| Total Investments | $178,370,547 | $— | $— | $178,370,547 |
| Jensen Global Quality Growth Fund | Level 1 | Level 2 | Level 3 | Total |
| Common Stock(1) | $32,926,999 | $13,348,411 | $— | $46,275,410 |
| Short-Term Investments | 536,712 | — | — | 536,712 |
| Total Investments | $33,463,711 | $13,348,411 | $— | $46,812,122 |
(1) For further information regarding security characteristics, please see the Schedules of Investments.
The Funds did not hold any investments during the six months ended November 30, 2023, with significant unobservable inputs which would be classified as Level 3. The Funds did not hold financial derivative instruments during the six months ended November 30, 2023.
(b) Foreign Securities and Currency – Investment securities and other assets and liabilities denominated in foreign currencies are translated into U.S. dollar amounts on the date of valuation. Purchases and sales of investment securities and income and expense items denominated in foreign currencies are translated into U.S. dollar amounts on the respective dates of such transactions.
| | | |
| 40 | Jensen Quality Value Fund, Jensen Global Quality Growth Fund | Semi-Annual Report |
The Funds do not isolate the portion of the results of operations from changes in foreign exchange rates on investments from those resulting from the changes in market prices of securities held. Reported net realized foreign exchange gains or losses arise from sales of portfolio securities, sales and maturities of short-term securities, sales of foreign currencies, currency gains or losses realized between trade and settlement dates on securities transactions, and the difference between the amounts of dividends, interest and foreign withholding taxes recorded on the Funds’ books, and the U.S. dollar equivalent of the amounts actually received or paid. Net unrealized foreign exchange gains and losses arise from changes in the values of assets and liabilities, including investments in securities at fiscal period end, resulting from changes in the exchange rate.
Investments in foreign securities entail certain risks. Individual foreign economies of certain countries may differ favorably or unfavorably from the U.S. economy in such respects as growth of gross national product, rate of inflation, capital reinvestment, resource self-sufficiency, diversification and balance of payments position. The internal politics of certain foreign countries may not be as stable as those of the United States. Since foreign securities normally are denominated and traded in foreign currencies, the value of a Fund’s assets may be affected favorably or unfavorably by currency exchange rates, currency exchange control regulations, foreign withholding taxes, and restrictions or prohibitions on the repatriation of foreign currencies. There may be less information publicly available about a foreign issuer than about a U.S. issuer, and foreign issuers are not generally subject to accounting, auditing, and financial reporting standards and practices comparable to those in the United States. The securities of some foreign issuers are less liquid and at times more volatile than securities of comparable U.S. issuers.
(c) Federal Income Taxes – The Funds intend to comply with the requirements of Subchapter M of the Internal Revenue Code necessary to qualify as regulated investment companies and to make the requisite distributions of income and capital gains to their shareholders sufficient to relieve them from all or substantially all federal income taxes. Therefore, no federal income tax provision has been provided.
As of and during the six months ended November 30, 2023, the Funds did not have a liability for any unrecognized tax benefits. The Funds recognize interest and penalties, if any, related to uncertain tax benefits as income tax expense in the Statements of Operations. During the six months ended November 30, 2023, the Funds did not incur any interest or penalties. The Funds’ federal income tax returns are subject to examination by the Internal Revenue Service (the “IRS”) for a period of three fiscal years after they are filed. The Funds have no examinations in progress. The Funds are also not aware of any tax provisions for which it is reasonably possible that the total amounts of unrecognized tax benefits will significantly change in the next twelve months.
(d) Distributions to Shareholders – The Funds will declare and distribute any net investment income quarterly. The Funds will distribute any net realized long- or short-term capital gains at least annually. Distributions from net realized gains for book purposes may include short-term capital gains. All short-term capital gains are included in ordinary income for tax purposes. Distributions to shareholders are recorded on the ex-dividend date. The Funds may also pay a special distribution at the end of the calendar year to comply with federal tax requirements. The Funds may utilize earnings and profits distributed to shareholders on redemption of shares as part of the dividend paid deduction.
| | | |
Semi-Annual Report | Jensen Quality Value Fund, Jensen Global Quality Growth Fund | 41 |
(e) Use of Estimates – The preparation of financial statements in conformity with GAAP requires management to make estimates and assumptions that affect the reported amounts of assets and liabilities and disclosure of contingent assets and liabilities at the date of the financial statements and the reported amounts of revenues and expenses during the reporting period. Actual results could differ from those estimates.
(f) Share Valuation – The NAV per share of each Fund is calculated by dividing the sum of the value of the securities held by each Fund, plus cash or other assets, minus all liabilities (including estimated accrued expenses) by the total number of shares outstanding for each Fund, rounded to the nearest cent. The Funds’ shares will not be priced on the days on which the NYSE is closed for trading.
(g) Allocation of Income, Expenses and Gains/Losses – Income, expenses (other than those deemed attributable to a specific share class), and gains and losses of each Fund are allocated daily to each class of shares based upon the ratio of net assets represented by each class as a percentage of the net assets of the Fund. Expenses deemed directly attributable to a class of shares are recorded by the specific class. Most Fund expenses are allocated by class based on relative net assets. Distribution (12b-1) and shareholder servicing fees are expensed at 0.25% of average daily net assets of Class J shares. Shareholder servicing fees are expensed at up to 0.10% of the average daily net assets of Class I shares. Expenses associated with a specific fund in the Trust are charged to that fund. Common Trust expenses are typically allocated evenly between the funds of the Trust, or by other equitable means.
(h) Other – Investment transactions are recorded on the trade date. The Funds determine the gain or loss from investment transactions using the specific identification method by comparing the original cost of the security lot sold with the net sale proceeds. Dividend income is recognized on the ex-dividend date and interest income is recognized on an accrual basis.
Withholding taxes on foreign dividends, net of any reclaims, have been provided for in accordance with the Funds’ understanding of the applicable country’s tax rules and rates.
3. Federal Tax Matters
The tax character of distributions paid during the fiscal years ended May 31, 2023 and May 31, 2022 was as follows:
| Jensen Quality Value Fund | May 31, 2023 | May 31, 2022 |
| Ordinary Income | $1,050,886 | $2,416,784 |
| Long-Term Capital Gain | $4,354,266 | $2,515,253 |
| Jensen Global Quality Growth Fund | May 31, 2023 | May 31, 2022 |
| Ordinary Income | $251,052 | $170,099 |
| Long-Term Capital Gain | $— | $— |
| | | |
| 42 | Jensen Quality Value Fund, Jensen Global Quality Growth Fund | Semi-Annual Report |
The components of distributable earnings on a tax basis as of May 31, 2023 were as follows:
| | Jensen Quality
Value Fund | Jensen Global
Quality Growth Fund |
| Cost basis of investments for federal income tax purposes | $164,276,069 | $38,632,267 |
| Gross tax unrealized appreciation | $25,129,032 | $6,853,313 |
| Gross tax unrealized depreciation | (12,304,575) | (1,200,573) |
| Net tax unrealized appreciation | 12,824,457 | 5,652,740 |
| Undistributed ordinary income | 290,659 | 41,529 |
| Undistributed long-term capital gain | — | — |
| Distributable earnings | 290,659 | 41,529 |
| Other accumulated losses | (5,222,132) | (711,082) |
| Total distributable earnings | $7,892,984 | $4,983,187 |
The difference between book basis and tax basis of investments is primarily attributable to the deferral of losses on wash sales.
At May 31, 2023, the Jensen Quality Value Fund had short-term capital loss carryovers of $5,222,132.
At May 31, 2023, the Jensen Global Quality Growth Fund had short-term capital loss carryovers of $280,491 and long-term capital loss carryovers of $430,044.
Additionally, GAAP requires that certain components of net assets relating to permanent differences be reclassified between financial and tax reporting. These reclassifications have no effect on net assets or NAV per share. The permanent difference relates to tax equalization.
For the year ended May 31, 2023, no reclassifications were made between total distributable earnings and paid in capital.
4. Investment Adviser
The Trust has an Investment Advisory Agreement (the “Agreement”) with the Adviser to furnish investment advisory services to the Funds. Under the terms of the Agreement, the Funds compensate the Adviser for its management services at the annual rate of 0.65% and 0.75% of each Fund’s average daily net assets for the Jensen Quality Value Fund and Jensen Global Quality Growth Fund, respectively.
The Adviser has contractually agreed to waive its management fee and/or reimburse a Fund’s other expenses at least through the expiration dates listed below to the extent necessary to ensure that each Fund’s Total Annual Operating Expenses (exclusive of front-end or contingent deferred sales loads, Rule 12b-1 plan fees, shareholder servicing plan fees, taxes, leverage (i.e., any expenses incurred in connection with borrowings made by the Fund), interest (including interest incurred in connection with bank and custody overdrafts), brokerage commissions and other transactional expenses, expenses incurred in connection with any merger or reorganization, dividends or interest expenses on short
| | | |
Semi-Annual Report | Jensen Quality Value Fund, Jensen Global Quality Growth Fund | 43 |
positions, acquired fund fees and expenses and extraordinary expenses such as litigation) do not exceed the expense limitation caps listed below of each Fund’s average daily net assets (the “Expense Limitation Cap”).
| | Expiration Date | Expense Limitation Cap |
| Jensen Quality Value Fund | September 30, 2024 | 0.80% |
| Jensen Global Quality Growth Fund | September 30, 2024 | 1.00% |
For the six months ended November 30, 2023, expenses of $3,672, $11,477 and $7,374 were waived or reimbursed by the Adviser for Class J, Class I and Class Y shares, respectively, for the Jensen Quality Value Fund. For the six months ended November 30, 2023, expenses of $3,195, $2,913 and $51,894 were waived or reimbursed by the Adviser for Class J, Class I and Class Y shares, respectively, for the Jensen Global Quality Growth Fund. Any such waiver or reimbursement is subject to later adjustment to allow the Adviser to recoup amounts waived or reimbursed to the extent actual fees and expenses for a fiscal period do not exceed the lesser of: (1) the Expense Limitation Cap in place at the time of waiver or reimbursement or (2) the Expense Limitation Cap in place at the time of the recoupment; provided, however, that the Adviser shall only be entitled to recoup such amounts over the following three-year period from the date of the waiver or reimbursement. During the six months ended November 30, 2023, $103,259 of previously waived expenses subject to recovery for the Jensen Quality Value Fund and $118,588 of previously waived expenses subject to recovery for the Jensen Global Quality Growth Fund expired.
The following table shows the remaining waived or reimbursed expenses subject to potential recovery expiring during the fiscal year/period ending:
| | Jensen Quality
Value Fund | Jensen Global
Quality Growth Fund |
| May 31, 2024 | $75,794 | $73,656 |
| May 31, 2025 | $110,284 | $138,503 |
| May 31, 2026 | $85,638 | $147,282 |
| November 30, 2026 | $22,523 | $58,002 |
5. Distribution and Shareholder Servicing Plan
The Trust adopted a distribution and shareholder servicing plan pursuant to Rule 12b-1 (the “12b-1 Plan”), on behalf of the Funds, which authorizes Class J shares to pay Quasar Distributors, LLC (the “Distributor” or “Quasar”), the Funds’ distributor and principal underwriter, a distribution fee of 0.25% of a Fund’s average daily net assets attributable to Class J shares for services to Class J shareholders and distribution of Class J shares. The Trust adopted a shareholder servicing plan (the “Shareholder Servicing Plan”), on behalf of the Funds, which authorizes Class I shares to pay up to 0.10% of a Fund’s average daily net assets attributable to Class I shares to other financial institutions for shareholder servicing and maintenance of Class I shareholder accounts. The Distributor acts as the Funds’ principal underwriter in a continuous public offering of the Funds’
| | | |
| 44 | Jensen Quality Value Fund, Jensen Global Quality Growth Fund | Semi-Annual Report |
shares. Fees incurred for the six months ended November 30, 2023, and owed as of November 30, 2023 are summarized below. The fees owed to the Distributor are included within accrued expenses and other liabilities on the Statements of Assets and Liabilities.
| 12b-1 Plan | Incurred | Owed |
| Jensen Quality Value Fund | $36,572 | $9,345 |
| Jensen Global Quality Growth Fund | $3,134 | $2,158 |
| Shareholder Servicing | Incurred | Owed |
| Jensen Quality Value Fund | $9,464 | $391 |
| Jensen Global Quality Growth Fund | $227 | $11 |
6. Related Party Transactions
U.S. Bancorp Fund Services, LLC, doing business as U.S. Bank Global Fund Services (“Fund Services” or the “Administrator”), acts as the Funds’ Administrator under an Administration Agreement. The Administrator prepares various federal and state regulatory filings, reports and returns for the Funds; prepares reports and materials to be supplied to the Trustees; monitors the activities of the Funds’ custodian, transfer agent and fund accountant; coordinates the preparation and payment of the Funds’ expenses and reviews the Funds’ expense accruals. Fees incurred for the six months ended November 30, 2023, and owed as of November 30, 2023 are as follows:
| Administration | Incurred | Owed |
| Jensen Quality Value Fund | $23,367 | $6,270 |
| Jensen Global Quality Growth Fund | $11,265 | $2,496 |
Fund Services also serves as the fund accountant and transfer agent to the Funds. U.S. Bank National Association (“US Bank”), an affiliate of Fund Services, serves as the Funds’ custodian. Fees incurred for the six months ended November 30, 2023 and owed as of November 30, 2023 for fund accounting, transfer agency, and custody fees are as follows:
| Fund Accounting | Incurred | Owed |
| Jensen Quality Value Fund | $21,407 | $7,194 |
| Jensen Global Quality Growth Fund | $12,811 | $4,494 |
| Transfer Agency | Incurred | Owed |
| Jensen Quality Value Fund | $31,833 | $11,389 |
| Jensen Global Quality Growth Fund | $24,056 | $8,657 |
| Custody | Incurred | Owed |
| Jensen Quality Value Fund | $3,559 | $934 |
| Jensen Global Quality Growth Fund | $7,048 | $2,432 |
| | | |
Semi-Annual Report | Jensen Quality Value Fund, Jensen Global Quality Growth Fund | 45 |
The Jensen Quality Value Fund and Jensen Global Quality Growth Fund have lines of credit with US Bank (see Note 10).
Certain officers of the Funds are also employees of Fund Services. A Trustee of the Trust is affiliated with Fund Services and US Bank.
The Trust’s Chief Compliance Officer is also an employee of Fund Services. Each Fund’s allocation of the Trust’s Chief Compliance Officer fees incurred for the six months ended November 30, 2023, and owed as of November 30, 2023 were as follows:
| | Incurred | Owed |
| Jensen Quality Value Fund | $6,222 | $2,057 |
| Jensen Global Quality Growth Fund | $6,222 | $2,057 |
7. Capital Share Transactions
Transactions in shares of the Funds were as follows:
Jensen Quality Value Fund
| Class J | six months ended
November 30,
2023 (unaudited) | year ended
May 31, 2023 | |
| Shares sold | | 121,874 | | | 243,351 | | | |
| Shares issued in reinvestment of dividends | | 3,844 | | | 55,506 | | | |
| Shares redeemed | | (210,396 | ) | | (970,277 | ) | | |
| Net decrease | | (84,678 | ) | | (671,420 | ) | | |
| | | | | | | | | |
| Class I | six months ended
November 30,
2023 (unaudited) | year ended
May 31, 2023 | |
| Shares sold | | 658,556 | | | 1,296,916 | | | |
| Shares issued in reinvestment of dividends | | 19,096 | | | 190,701 | | | |
| Shares redeemed | | (1,279,138 | ) | | (2,203,136 | ) | | |
| Net decrease | | (601,486 | ) | | (715,519 | ) | | |
| | | | | | | | | |
| Class Y | six months ended
November 30,
2023 (unaudited) | year ended
May 31, 2023 | |
| Shares sold | | 98,543 | | | | 89,034 | | | |
| Shares issued in reinvestment of dividends | | 12,127 | | | | 105,874 | | | |
| Shares redeemed | | (55,868 | ) | | | (335,593 | ) | | |
| Net increase (decrease) | | 54,802 | | | | (140,685 | ) | | |
| | | |
| 46 | Jensen Quality Value Fund, Jensen Global Quality Growth Fund | Semi-Annual Report |
Jensen Global Quality Growth Fund
| Class J | six months ended
November 30,
2023 (unaudited) | year ended
May 31, 2023 | |
| Shares sold | | 14,702 | | | | 28,826 | | | |
| Shares issued in reinvestment of dividends | | 366 | | | | 564 | | | |
| Shares redeemed | | (43,212 | ) | | | (10,191 | ) | | |
| Net increase (decrease) | | (28,144 | ) | | | 19,199 | | | |
| Class I | six months ended
November 30,
2023 (unaudited) | year ended
May 31, 2023 | |
| Shares sold | | 345 | | | | 223,545 | | | |
| Shares issued in reinvestment of dividends | | 490 | | | | 1,620 | | | |
| Shares redeemed | | (1,060 | ) | | | (239,930 | ) | | |
| Net decrease | | (225 | ) | | | (14,765 | ) | | |
| Class Y | six months ended
November 30,
2023 (unaudited) | year ended
May 31, 2023 | |
| Shares sold | | 89,617 | | | | 404,322 | | | |
| Shares issued in reinvestment of dividends | | 8,962 | | | | 16,945 | | | |
| Shares redeemed | | (14,777 | ) | | | (104,225 | ) | | |
| Net increase | | 83,802 | | | | 317,042 | | | |
8. Investment Transactions
The aggregate purchases and sales of securities, excluding short-term investments, for the Funds for the six months ended November 30, 2023 are summarized below. For the six months ended November 30, 2023, there were no purchases or sales of U.S. government securities for the Funds.
| | Purchases | Sales | |
| Jensen Quality Value Fund | | $21,776,939 | | $33,342,177 | |
| Jensen Global Quality Growth Fund | | $3,490,506 | | $2,534,995 | |
| | | |
Semi-Annual Report | Jensen Quality Value Fund, Jensen Global Quality Growth Fund | 47 |
9. Beneficial Ownership
The beneficial ownership, either directly or indirectly, of more than 25% of the voting securities of a fund creates a presumption of control of the fund under Section 2(a)(9) of the 1940 Act. At November 30, 2023, the following shareholders held over 25% of a Fund’s shares outstanding:
Jensen Quality Value Fund
| Class J | | |
| Charles Schwab & Co. Inc. | | 48.39% | |
| National Financial Services LLC | | 28.21% | |
| Class I | | |
| Raymond James | | 43.65% | |
| Class Y | | |
| Pershing, LLC. | | 79.24% | |
Jensen Global Quality Growth Fund
| Class J | | |
| Wells Fargo Clearing Services LLC | | 69.88% | |
| Class I | | |
| Charles Schwab & Co. Inc | | 86.65% | |
| Class Y | | |
| Pershing, LLC. | | 92.15% | |
10. Line of Credit
At November 30, 2023, the Jensen Quality Value Fund and Jensen Global Quality Growth Fund had lines of credit in the amount of the lesser of $12,000,000 and $5,000,000, respectively, or 33.33% and 20%, respectively, of the fair value of unencumbered assets of each Fund, which both mature August 5, 2024. These secured lines of credit are intended to provide short-term financing, if necessary, subject to certain restrictions, in connection with shareholder redemptions. The credit facility is with the Funds’ custodian, US Bank. Interest was scheduled to be incurred at the bank’s prime rate (8.50% as of November 30, 2023). The following table provides information regarding usage
| | | |
| 48 | Jensen Quality Value Fund, Jensen Global Quality Growth Fund | Semi-Annual Report |
of the line of credit for the six months ended November 30, 2023 for the Funds. The Funds did not have outstanding balances on their line of credits as of November 30, 2023.
| | | Days
Utilized | | | Average
Amount of
Borrowing | | | Weighted
Average
Borrowing
Rate | | | Interest
Expense* | | | Maximum
Amount of
Borrowing | | Date of
Maximum
Borrowing | |
| Jensen Quality Value Fund | | 2 | | | $ | 4,729,000 | | | 8.50% | | | $ | 2,233 | | | $ | 4,829,000 | | 8/29/23 | |
| Jensen Global Quality Growth Fund | | 2 | | | $ | 32,500 | | | 8.50% | | | $ | 15 | | | $ | 36,000 | | 10/30/23 | |
*Interest expense is reported within Other Expenses on the Statements of Operations.
11. Recent Market Events
U.S. and international markets have experienced and may continue to experience significant periods of volatility in recent years and months due to a number of economic, political and global macro factors including uncertainty regarding inflation and central banks’ interest rate increases, the possibility of a national or global recession, trade tensions, political events, the war between Russia and Ukraine, significant conflict between Israel and Hamas in the Middle East, and the impact of the coronavirus (COVID-19) global pandemic. The impact of COVID-19 may last for an extended period of time. As a result of continuing political tensions and armed conflicts, including the war between Ukraine and Russia, the U.S. and the European Union imposed sanctions on certain Russian individuals and companies, including certain financial institutions, and have limited certain exports and imports to and from Russia. The war has contributed to recent market volatility and may continue to do so. These developments, as well as other events, could result in further market volatility and negatively affect financial asset prices, the liquidity of certain securities and the normal operations of securities exchanges and other markets, despite government efforts to address market disruptions. Continuing market volatility as a result of recent market conditions or other events may have adverse effects on your account.
12. Subsequent Events
On December 14, 2023, the following distributions were declared and paid from ordinary income and capital gains to shareholders of record as of December 13, 2023:
Ordinary Income
| | | Class J | | | Class I | | | Class Y | |
| Jensen Quality Value Fund | | | 42,982 | | | | | 196,757 | | | | | 135,200 | | |
| Jensen Global Quality Growth Fund | | | – | | | | | – | | | | | 527 | | |
In preparing these financial statements, the Fund has evaluated events and transactions for potential recognition or disclosure resulting from subsequent events after the Statements of Assets and Liabilities date of November 30, 2023 through the date the financial statements were available for issue.
| | | |
Semi-Annual Report | Jensen Quality Value Fund, Jensen Global Quality Growth Fund | 49 |
Expense Examples – November 30, 2023 (Unaudited)
As a shareholder of the Funds, you incur ongoing costs, including investment management fees, distribution (12b-1) fees (Class J only) and shareholder servicing fees (Class I only), and other Fund expenses, which are indirectly paid by shareholders. These examples are intended to help you understand your ongoing costs (in dollars) of investing in the Funds and to compare these costs with the ongoing costs of investing in other mutual funds.
The Examples are based on an investment of $1,000 invested at the beginning of the period and held for the entire period referenced in each table.
Actual Expenses
The first lines of the tables below for each share class of the Funds provide information about actual account values and actual expenses. However, the tables do not include shareholder specific fees, such as the $15.00 fee charged to IRA accounts, or the $15.00 fee charged for wire redemptions. The tables also do not include portfolio trading commissions and related trading costs. You may use the information in these lines, together with the amount you invested, to estimate the expenses that you paid over the period. Simply divide your account value by $1,000 (for example, an $8,600 account value divided by $1,000 = 8.6), then multiply the result by the number in the first line under the heading titled “Expenses Paid During Period” to estimate the expenses you paid on your account during this period.
Hypothetical Example for Comparison Purposes
The second lines of the tables below for each share class of the Funds provide information about hypothetical account values and hypothetical expenses based on the actual expense ratios for each share class of the Funds and an assumed rate of return of 5% per year before expenses, which is not the Funds’ actual returns. The hypothetical account values and expenses may not be used to estimate the actual ending account balance or expenses you paid for the period. You may use this information to compare the ongoing costs of investing in the Funds and other funds. To do so, compare this 5% hypothetical example with the 5% hypothetical examples that appear in the shareholder reports of the other funds.
Please note that the expenses shown in the table are meant to highlight your ongoing costs only and do not reflect any transactional costs, such as sales charges (loads), redemption fees, or exchange fees which, although not charged by the Funds, may be charged by other funds. Therefore, the second lines of the tables are useful in comparing ongoing costs only and will not help you determine the relative total costs of owning different funds.
| | | |
| 50 | Jensen Quality Value Fund, Jensen Global Quality Growth Fund | Semi-Annual Report |
Expense Example Tables (Unaudited)
| Jensen Quality Value Fund – Class J | | Beginning
Account Value
June 1, 2023 | | | Ending
Account Value
November 30,
2023 | | | Expenses Paid
During Period*
June 1, 2023 –
November 30, 2023 | |
| Actual | | | $1,000.00 | | | | | $1,070.30 | | | | | $5.43 | | |
| Hypothetical (5% return before expenses) | | | 1,000.00 | | | | | 1,019.75 | | | | | 5.30 | | |
| * | Expenses are equal to Class J’s annualized net expense ratio of 1.05%, multiplied by the average account value over the period, multiplied by 183/365 to reflect the one-half year period. |
| Jensen Quality Value Fund – Class I | | Beginning
Account Value
June 1, 2023 | | | Ending
Account Value
November 30,
2023 | | | Expenses Paid
During Period*
June 1, 2023 –
November 30, 2023 | |
| Actual | | | $1,000.00 | | | | | $1,071.00 | | | | | $4.25 | | |
| Hypothetical (5% return before expenses) | | | 1,000.00 | | | | | 1,020.90 | | | | | 4.14 | | |
| * | Expenses are equal to Class I’s annualized net expense ratio of 0.82%, multiplied by the average account value over the period, multiplied by 183/365 to reflect the one-half year period. |
| Jensen Quality Value Fund – Class Y | | Beginning
Account Value
June 1, 2023 | | | Ending
Account Value
November 30,
2023 | | | Expenses Paid
During Period*
June 1, 2023 –
November 30, 2023 | |
| Actual | | | $1,000.00 | | | | | $1,071.30 | | | | | $4.14 | | |
| Hypothetical (5% return before expenses) | | | 1,000.00 | | | | | 1,021.00 | | | | | 4.04 | | |
| * | Expenses are equal to Class Y’s annualized net expense ratio of 0.80%, multiplied by the average account value over the period, multiplied by 183/365 to reflect the one-half year period. |
| Jensen Global Quality Growth Fund – Class J | | Beginning
Account Value
June 1, 2023 | | | Ending
Account Value
November 30,
2023 | | | Expenses Paid
During Period*
June 1, 2023 –
November 30, 2023 | |
| Actual | | | $1,000.00 | | | | | $1,041.00 | | | | | $6.38 | | |
| Hypothetical (5% return before expenses) | | | 1,000.00 | | | | | 1,018.75 | | | | | 6.31 | | |
| * | Expenses are equal to Class J’s annualized net expense ratio of 1.25%, multiplied by the average account value over the period, multiplied by 183/365 to reflect the one-half year period. |
| | | |
Semi-Annual Report | Jensen Quality Value Fund, Jensen Global Quality Growth Fund | 51 |
| Jensen Global Quality Growth Fund – Class I | | Beginning
Account Value
June 1, 2023 | | | Ending
Account Value
November 30,
2023 | | | Expenses Paid
During Period*
June 1, 2023 –
November 30, 2023 | |
| Actual | | | $1,000.00 | | | | | $1,042.20 | | | | | $5.21 | | |
| Hypothetical (5% return before expenses) | | | 1,000.00 | | | | | 1,019.90 | | | | | 5.15 | | |
| * | Expenses are equal to Class I’s annualized net expense ratio of 1.02%, multiplied by the average account value over the period, multiplied by 183/365 to reflect the one-half year period. |
| Jensen Global Quality Growth Fund – Class Y | | Beginning
Account Value
June 1, 2023 | | | Ending
Account Value
November 30,
2023 | | | Expenses Paid
During Period*
June 1, 2023 –
November 30, 2023 | |
| Actual | | | $1,000.00 | | | | | $1,042.20 | | | | | $5.11 | | |
| Hypothetical (5% return before expenses) | | | 1,000.00 | | | | | 1,020.00 | | | | | 5.05 | | |
| * | Expenses are equal to Class Y’s annualized net expense ratio of 1.00%, multiplied by the average account value over the period, multiplied by 183/365 to reflect the one-half year period. |
| | | |
| 52 | Jensen Quality Value Fund, Jensen Global Quality Growth Fund | Semi-Annual Report |
Additional Information (Unaudited)
1. Shareholder Notification of Federal Tax Status
The Jensen Quality Value Fund and Jensen Global Quality Growth Fund each designated 100.00% of dividends declared during the fiscal year ended May 31, 2023 as dividends qualifying for the dividends received deduction available to corporate shareholders.
The Jensen Quality Value Fund and Jensen Global Quality Growth Fund each designated 100.00% of dividends declared from net investment income during the fiscal year ended May 31, 2023 as qualified dividend income under the Jobs and Growth Tax Relief Reconciliation Act of 2003.
The Jensen Quality Value Fund and Jensen Global Quality Growth Fund each designated 100.00%
of taxable ordinary income distributions as short-term capital gain distributions under Internal Revenue Code Section 871(k)(2)(c) for the year ended May 31, 2023.
Additional Information Applicable to Foreign Shareholders Only:
The Jensen Quality Value Fund and Jensen Global Quality Growth Fund each designated 0.00% of ordinary income distributions as interest-related dividends under Internal Revenue Code Section 871(k)(1)(c).
2. Availability of Proxy Voting Information
The Funds have adopted proxy voting policies and procedures that delegate to the Adviser the authority to vote proxies. A description of the Funds’ proxy voting policies and procedures is available without charge, upon request, by calling the Funds toll free at 800-992-4144. A description of these policies and procedures is also included in the Funds’ Statement of Additional Information, which is available on the SEC’s website at http://www.sec.gov.
The Funds’ proxy voting records for the most recent 12-month period ended June 30 is available without charge, upon request, by calling toll free, 800-992-4144, or by accessing the SEC’s website at http://www.sec.gov.
3. Portfolio Holdings
The Funds file complete schedules of portfolio holdings with the SEC for the first and third quarters of each fiscal year on Part F of Form N-PORT. Shareholders may view the Funds’ Form N-PORT reports on the SEC’s website at http://www.sec.gov.
| | | |
Semi-Annual Report | Jensen Quality Value Fund, Jensen Global Quality Growth Fund | 53 |
4. Householding
In an effort to decrease costs, the Funds intend to reduce the number of duplicate prospectuses, supplements and certain other shareholder documents you receive by sending only one copy of each to those addresses shared by two or more accounts and to shareholders the Funds reasonably believe are from the same family or household. Once implemented, if you would like to discontinue householding for your accounts, please call the Funds toll-free at 800-992-4144 to request individual copies of these documents. Once the Funds receive notice to stop householding, the Funds will begin sending individual copies 30 days after receiving your request. This policy does not apply to account statements.
| | | |
| 54 | Jensen Quality Value Fund, Jensen Global Quality Growth Fund | Semi-Annual Report |
Basis for Trustees’ Approval of Investment
Advisory Agreement
The Board of Trustees (the “Trustees”) of Trust for Professional Managers (the “Trust”) met on August 17, 2023 to consider the renewal of the Investment Advisory Agreement (the “Agreement”) between the Trust, on behalf of the Jensen Quality Value Fund and the Jensen Global Quality Growth Fund (each, a “Fund,” and together, the “Funds”), each a series of the Trust, and Jensen Investment Management, Inc. (“Jensen”), the Fund’s investment adviser (the “Adviser”). The Trustees also met at a prior meeting held on June 22, 2023 (the “June 22, 2023 meeting”) to review materials related to the renewal of the Agreement. Prior to these meetings, the Trustees requested and received materials to assist them in considering the renewal of the Agreement. The materials provided contained information with respect to the factors enumerated below, including a copy of the Agreement, a memorandum prepared by the Trust’s outside legal counsel discussing in detail the Trustees’ fiduciary obligations and the factors they should assess in considering the renewal of the Agreement, detailed comparative information relating to the Funds’ performance, as well as the management fees and other expenses of the Funds, due diligence materials relating to the Adviser (including a due diligence questionnaire completed on behalf of the Funds by the Adviser, the Adviser’s Form ADV, select financial statements of the Adviser, bibliographic information of the Adviser’s key management and compliance personnel, comparative fee information for the Funds and the Adviser’s other separately-managed accounts and a summary detailing key provisions of the Adviser’s written compliance program, including its code of ethics) and other pertinent information. The Trustees also received information periodically throughout the year that was relevant to the Agreement renewal process, including performance, management fee and other expense information. Based on their evaluation of the information provided by the Adviser, in conjunction with the Funds’ other service providers, the Trustees, by a unanimous vote (including a separate vote of the Trustees who are not “interested persons,” as that term is defined in the Investment Company Act of 1940, as amended (the “Independent Trustees”)), approved the continuation of the Agreement for an additional one-year term ending August 31, 2024.
Discussion of Factors Considered
In considering the renewal of the Agreement and reaching their conclusions, the Trustees reviewed and analyzed various factors that they determined were relevant, including the factors enumerated below.
1. Nature, Extent and Quality of Services Provided to the Funds
The Trustees considered the nature, extent and quality of services provided by the Adviser to the Funds and the amount of time devoted to the Funds’ operation by the Adviser’s staff. The Trustees considered the Adviser’s specific responsibilities in all aspects of day-to-day management of the Funds, including the investment strategies implemented by the Adviser, as well as the qualifications, experience and responsibilities of Eric H. Schoenstein, Robert D. McIver, Allen T. Bond, Kevin J. Walkush and Jeffrey D. Wilson, the Jensen Global Quality Growth Fund’s portfolio managers, and Eric H. Schoenstein, Kurt M. Havnaer, Adam D. Calamar, and Tyra S. Pratt, the Jensen Quality Value
| | | |
Semi-Annual Report | Jensen Quality Value Fund, Jensen Global Quality Growth Fund | 55 |
Fund’s portfolio managers, and other key personnel at the Adviser involved in the day-to-day activities of the Funds. The Trustees reviewed information provided by the Adviser in a due diligence questionnaire, including the structure of the Adviser’s compliance program and its continuing commitment to the Funds. The Trustees noted that during the course of the prior year the Adviser had participated in a Trust board meeting to discuss the Funds’ performance and outlook, along with the compliance efforts made by the Adviser, including reports provided by the Adviser in its role as the Funds’ valuation designee. The Trustees also noted any services that extended beyond portfolio management, and they considered the brokerage practices of the Adviser. The Trustees discussed the Adviser’s handling of compliance matters, including the reports of the Trust’s chief compliance officer to the Trustees on the effectiveness of the Adviser’s compliance program. The Trustees also considered the Adviser’s overall financial condition, as well as the implementation and operational effectiveness of the Adviser’s business continuity plan. The Trustees concluded that the Adviser had sufficient quality and depth of personnel, resources, investment methods and compliance policies and procedures essential to performing its duties under the Advisory Agreement and that the nature, overall quality and extent of the management services provided to the Funds, as well as the Adviser’s compliance program, were satisfactory and reliable.
2. Investment Performance of the Funds and the Adviser
The Trustees discussed the performance of the Class Y or Class I shares, as applicable, of the Jensen Global Quality Growth Fund and Jensen Quality Value Fund for the quarter, one-year, three-year, five year, ten-year and since inception periods ended March 31, 2023, as applicable. In assessing the quality of the portfolio management services delivered by the Adviser, the Trustees also compared the short-term and longer-term performance of the Class Y or Class I shares, as applicable, of each Fund on both an absolute basis and in comparison to a benchmark index (the MSCI All Country World Index for the Jensen Global Quality Growth Fund and the Russell Midcap Total Return Index for the Jensen Quality Value Fund) and in comparison to a peer group of funds as constructed using publicly-available data provided by Morningstar, Inc. and presented by Barrington Financial Group, LLC d/b/a Barrington Partners, an independent third-party benchmarking firm, through its cohort selection process (a peer group of U.S. open-end global large-cap stock blend, global large-cap stock growth and large-cap growth funds for the Jensen Global Quality Growth Fund and a peer group of U.S. open-end mid-cap blend and mid-cap value funds for the Jensen Quality Value Fund) (each, a “Barrington Cohort”). The Trustees noted that the Adviser did not manage any other accounts with the same or similar investment strategies as either Fund.
The Trustees noted the Jensen Quality Value Fund’s performance for Class Y shares for the one-year period ended March 31, 2023 was above the Barrington Cohort average. The Trustees then noted that the Jensen Quality Value Fund’s performance for Class Y shares for the three-year period ended March 31, 2023 was below the Barrington Cohort average. The Trustees noted that for the quarter, three-year and five-year periods ended March 31, 2023, the Class I shares of the Jensen Quality Value Fund had outperformed the Russell Midcap Total Return Index. The Trustees noted that for the ten-year and since inception periods ended March 31, 2023, the Class I shares of the Jensen Quality Value Fund had underperformed the Russell Midcap Total Return Index.
| | | |
| 56 | Jensen Quality Value Fund, Jensen Global Quality Growth Fund | Semi-Annual Report |
The Trustees noted the Jensen Global Quality Growth Fund’s performance for Class Y shares for the one-year period ended March 31, 2023 was above the Barrington Cohort average. The Trustees noted that for the quarter and one-year period ended March 31, 2023, the Class Y shares of the Jensen Global Quality Growth Fund had outperformed the MSCI All Country World Index.
After considering all of the information, the Trustees concluded that the performance obtained by the Adviser for each Fund was satisfactory under current market conditions. Although past performance is not a guarantee or indication of future results, the Trustees determined that each Fund and its shareholders were likely to benefit from the Adviser’s continued management.
3. Costs of Services Provided and Profits Realized by the Adviser
The Trustees considered the cost of services and the structure of the Adviser’s fees, including a review of the expense analyses and other pertinent material with respect to the Funds. The Trustees reviewed the related statistical information and other materials provided, including the comparative expenses and Barrington Cohort comparisons. The Trustees considered the cost structure of each Fund relative to its Barrington Cohort, as well as any fee waivers and expense reimbursements of the Adviser.
The Trustees also considered the overall profitability of the Adviser and reviewed the Adviser’s financial information and noted that the Adviser has subsidized the Funds’ operations since the Funds’ inception. The Trustees also examined the level of profits that could be expected to accrue to the Adviser from the fees payable under the Advisory Agreement, as well as the Funds’ brokerage practices. These considerations were based on materials requested by the Trustees and the Funds’ administrator specifically for the June 22, 2023 meeting and the August 17, 2023 meeting at which the Advisory Agreement was formally considered, as well as the reports prepared by the Adviser over the course of the year.
The Trustees noted that the Jensen Quality Value Fund’s contractual management fee of 0.65% was below the Barrington Cohort average of 0.69%. The Trustees noted that the Jensen Quality Value Fund was operating above its expense cap of 0.80% for Class Y shares. The Trustees observed that the Jensen Quality Value Fund’s total expense ratio (net of fee waivers and expense reimbursements) of 0.80% was below the Barrington Cohort average of 0.83%.
The Trustees noted that the Jensen Global Quality Growth Fund’s contractual management fee of 0.75% was below the Barrington Cohort average of 0.78%. The Trustees noted that the Jensen Global Quality Growth Fund was operating above its expense cap of 1.00% for Class Y shares. The Trustees observed that the Jensen Quality Growth Fund’s total expense ratio (net of fee waivers and expense reimbursements) of 1.00% was above the Barrington Cohort average of 0.93%.
The Trustees concluded that each Fund’s expenses and the management fees paid to the Adviser were fair and reasonable in light of the comparative performance, expense and management fee information. The Trustees further concluded, based on a profitability analysis prepared by the Adviser, that neither Fund was profitable to the Adviser after reflecting marketing and distribution expenses, but the Adviser maintained adequate profit levels to support the services to each Fund from the revenues of its overall investment advisory business, despite its subsidies to support each Fund’s operations.
| | | |
Semi-Annual Report | Jensen Quality Value Fund, Jensen Global Quality Growth Fund | 57 |
4. Extent of Economies of Scale as the Funds Grow
The Trustees compared each Fund’s expenses relative to its peer group and discussed realized and potential economies of scale. The Trustees also reviewed the structure of each Fund’s management fee and whether each Fund was large enough to generate economies of scale for shareholders or whether economies of scale would be expected to be realized as Fund assets grow (and if so, how those economies of scale were being or would be shared with shareholders). The Trustees reviewed all fee waivers, expense reimbursements and potential recoupments by the Adviser with respect to each Fund. The Trustees noted that each Fund’s management fee structure did not contain any breakpoint reductions as the Fund’s assets grow in size, but that the feasibility of incorporating breakpoints would continue to be reviewed on a regular basis. With respect to the Adviser’s fee structures, the Trustees concluded that the current fee structures were reasonable and reflected a sharing of economies of scale between the Adviser and each Fund at the Fund’s current asset level.
5. Benefits Derived from the Relationship with the Funds
The Trustees considered the direct and indirect benefits that could be received by the Adviser from its association with the Funds. The Trustees examined the brokerage practices of the Adviser with respect to the Funds. The Trustees concluded that the benefits the Adviser may receive, such as greater name recognition and increased ability to attract additional investor assets, appear to be reasonable, and in many cases may benefit the Funds.
Conclusions
The Trustees considered all of the foregoing factors. In considering the renewal of the Advisory Agreement, the Trustees did not identify any one factor as all-important, but rather considered these factors collectively in light of the Funds’ surrounding circumstances. Based on this review, the Trustees, including a majority of the Independent Trustees, approved the continuation of the Advisory Agreement for an additional one-year term ending August 31, 2024 as being in the best interests of each Fund and its shareholders.
| | | |
| 58 | Jensen Quality Value Fund, Jensen Global Quality Growth Fund | Semi-Annual Report |
Notice of Privacy Policy & Practices (Unaudited)
We collect non-public personal information about you from the following sources:
| · | information we receive about you on applications or other forms; |
| · | information you give us orally; and |
| · | information about your transactions with us or others. |
The types of non-public personal information we collect and share can include:
| · | social security numbers; |
| · | wire transfer instructions; and |
| · | checking account information. |
What Information We Disclose
We do not disclose any non-public personal information about our shareholders or former shareholders without the shareholder’s authorization, except as permitted by law or in response to inquiries from governmental authorities. We may share information with affiliated parties and unaffiliated third parties with whom we have contracts for servicing the Funds. We will provide unaffiliated third parties with only the information necessary to carry out their assigned responsibility.
How We Protect Your Information
All shareholder records will be disposed of in accordance with applicable law. We maintain physical, electronic and procedural safeguards to protect your non-public personal information and require third parties to treat your non-public personal information with the same high degree of confidentiality.
In the event that you hold shares of the Funds through a financial intermediary, including, but not limited to, a broker-dealer, bank or trust company, the privacy policy of your financial intermediary would govern how your non-public personal information would be shared with unaffiliated third parties.
Indemnifications
Under the Trust’s organizational documents, its officers and Trustees are indemnified against certain liabilities arising out of the performance of their duties to the Funds. In addition, in the normal course of business, the Funds enter into contracts that provide general indemnifications to other parties. The Funds’ maximum exposure under these arrangements is unknown as this would involve future claims that may be made against the Funds that have not yet occurred. However, the Funds have not had prior claims or losses pursuant to these contracts and expects the risk of loss to be remote.
| | | |
Semi-Annual Report | Jensen Quality Value Fund, Jensen Global Quality Growth Fund | 59 |
Information About Trustees
The business and affairs of the Trust are managed under the direction of the Trust’s Board of Trustees. Information pertaining to the Trustees of the Trust is set forth below. The Statement of Additional Information includes additional information about the Trustees and is available, without charge, upon request by calling 800-992-4144.
| | | |
| 60 | Jensen Quality Value Fund, Jensen Global Quality Growth Fund | Semi-Annual Report |
Independent Trustees (Unaudited)
Name, Address and
Year of Birth | Position(s)
Held with
the Trust | Term of Office
and Length of
Time Served | Number of
Portfolios
in Trust
Overseen
by Trustee | Principal Occupation(s)
During the Past Five Years | Other Directorships
Held by Trustee
During the Past Five
Years |
Michael D. Akers, Ph.D.
615 E. Michigan St. Milwaukee, WI 53202
Year of Birth: 1955 | Trustee | Indefinite Term; Since August 22, 2001 | 27 | Professor Emeritus, Department of Accounting (June 2019-present), Professor, Department of Accounting (2004-2019), Marquette University. | Independent Trustee, USA MUTUALS (an open-end investment company) (2001-2021). |
Gary A. Drska 615 E. Michigan St. Milwaukee, WI 53202 Year of Birth: 1956 | Trustee | Indefinite Term; Since August 22, 2001 | 27 | Retired; Former Pilot, Frontier/ Midwest Airlines, Inc. (airline company) (1986-2021). | Independent Trustee, USA MUTUALS (an open-end investment company) (2001-2021). |
Vincent P. Lyles 615 E. Michigan St. Milwaukee, WI 53202 Year of Birth: 1961 | Trustee | Indefinite Term; Since April 6, 2022 | 27 | Executive Director, Milwaukee Succeeds (education advocacy organization) (2023-present); System Vice President of Community Relations, Advocate Aurora Health Care (health care provider) (2019-2022); President and Chief Executive Officer, Boys & Girls Club of Greater Milwaukee (2012-2018). | Independent Director, BMO Funds, Inc. (an open-end investment company) (2017–2022). |
Erik K. Olstein 615 E. Michigan St. Milwaukee, WI 53202 Year of Birth: 1967 | Trustee | Indefinite Term; Since April 6, 2022 | 27 | Retired; President and Chief Operating Officer (2000-2020), Vice President of Sales and Chief Operating Officer
(1995-2000),
Olstein Capital Management, L.P. (asset management firm); Secretary and Assistant Treasurer, The Olstein Funds (1995-2018). | Trustee, The Olstein Funds (an open-end investment company) (1995–2018). |
Lisa Zúñiga Ramírez 615 E. Michigan St. Milwaukee, WI 53202 Year of Birth: 1969 | Trustee | Indefinite Term; Since April 6, 2022 | 27 | Retired; Principal and Senior Portfolio Manager, Segall, Bryant & Hamill, LLC (asset management firm) (2018-2020); Partner and Senior Portfolio Manager, Denver Investments LLC (asset management firm) (2009-2018). | Director, Peoples Financial Serives Corp. (a publicly-traded bank holding company) (2022-present). |
Gregory M. Wesley 615 E. Michigan St. Milwaukee, WI 53202 Year of Birth: 1969 | Trustee | Indefinite Term; Since April 6, 2022 | 27 | Senior Vice President of Strategic Alliances and Business Development, Medical College of Wisconsin (2016-present). | N/A |
| | | |
Semi-Annual Report | Jensen Quality Value Fund, Jensen Global Quality Growth Fund | 61 |
Interested Trustee and Officers (Unaudited)
Name, Address and
Year of Birth | Position(s)
Held with
the Trust | Term of Office
and Length of
Time Served | Number of
Portfolios
in Trust
Overseen
by Trustee | Principal Occupation(s)
During the Past Five Years | Other Directorships
Held by Trustee
During the Past Five
Years |
John P. Buckel 615 E. Michigan St. Milwaukee, WI 53202 Year of Birth: 1957 | Chairperson, Trustee, President and Principal Executive Officer | Indefinite Term; Chairperson and Trustee (Since January 19, 2023); President and Principal Executive Officer (Since January 14, 2013) | 27 | Vice President, U.S. Bancorp Fund Services, LLC (2004-present). | N/A |
Jennifer A. Lima 615 E. Michigan St. Milwaukee, WI 53202 Year of Birth: 1974 | Vice President, Treasurer and Principal Financial and Accounting Officer | Indefinite Term; Since January 24, 2013 | N/A | Vice President, U.S. Bancorp Fund Services, LLC (2002-present). | N/A |
Deanna B. Marotz 615 E. Michigan St. Milwaukee, WI 53202 Year of Birth: 1965 | Chief Compliance Officer, Vice President and Anti- Money Laundering Officer | Indefinite Term; Since October 21, 2021 | N/A | Senior Vice President, U.S. Bancorp Fund Services, LLC (2021-present); Chief Compliance Officer of Keeley-Teton Advisors, LLC and Teton Advisors, Inc. (2017-2021). | N/A |
Jay S. Fitton 615 E. Michigan St. Milwaukee, WI 53202 Year of Birth: 1970 | Secretary | Indefinite Term; Since July 22, 2019 | N/A | Assistant Vice President, U.S. Bancorp Fund Services, LLC (2019-present); Partner, Practus, LLP (2018- 2019); Counsel, Drinker Biddle & Reath LLP (2016-2018). | N/A |
Kelly A. Strauss 615 E. Michigan St. Milwaukee, WI 53202 Year of Birth: 1987 | Assistant Treasurer | Indefinite Term; Since April 23, 2015 | N/A | Assistant Vice President, U.S. Bancorp Fund Services, LLC (2011-present). | N/A |
Shannon Coyle 615 E. Michigan St. Milwaukee, WI 53202 Year of Birth: 1990 | Assistant Treasurer | Indefinite Term; Since August 26, 2022 | N/A | Officer, U.S. Bancorp Fund Services, LLC (2015-present). | N/A |
Laura A. Carroll 615 E. Michigan St. Milwaukee, WI 53202 Year of Birth: 1985 | Assistant Treasurer | Indefinite Term; Since August 20, 2018 | N/A | Assistant Vice President, U.S. Bancorp Fund Services, LLC (2007-present). | N/A |
| | | |
| 62 | Jensen Quality Value Fund, Jensen Global Quality Growth Fund | Semi-Annual Report |
| | |
| | |
| | Jensen Quality Value Fund Jensen Global Quality Growth Fund |
| | Class I Shares | Class J Shares | Class Y Shares | |
| | | | | |
| | Investment Adviser Jensen Investment Management, Inc. 5500 Meadows Road, Suite 200 Lake Oswego, OR 97035 800.992.4144 Fund Administrator, Transfer Agent and Fund Accountant U.S. Bancorp Fund Services, LLC doing business as U.S. Bank Global Fund Services 615 East Michigan Street Milwaukee, WI 53202 Custodian U.S. Bank, N.A. Custody Operations 1555 N. RiverCenter Drive, Suite 302 Milwaukee, WI 53212 Legal Counsel Godfrey & Kahn, S.C. 833 East Michigan Street, Suite 1800 Milwaukee, WI 53202 Independent Registered Public Accounting Firm Cohen & Company, Ltd. 342 North Water Street, Suite 830 Milwaukee, WI 53202 Distributor Quasar Distributors, LLC 111 East Kilborn Avenue, Suite 2200 Milwaukee, WI 53202 This report has been prepared for shareholders and may be distributed to others only if preceded or accompanied by a current prospectus. |
| | |
| | jenseninvestment.com | |
| | | |
(b) Not applicable.
Item 2. Code of Ethics.
Not applicable for semi-annual reports.
Item 3. Audit Committee Financial Expert.
Not applicable for semi-annual reports.
Item 4. Principal Accountant Fees and Services.
Not applicable for semi-annual reports.
Item 5. Audit Committee of Listed Registrants.
Not applicable to registrants who are not listed issuers (as defined in Rule 10A-3 under the Securities Exchange Act of 1934).
Item 6. Investments.
| (a) | Schedule of Investments is included as part of the report to shareholders filed under Item 1 of this Form. |
Item 7. Disclosure of Proxy Voting Policies and Procedures for Closed-End Management Investment Companies.
Not applicable to open-end investment companies.
Item 8. Portfolio Managers of Closed-End Management Investment Companies.
Not applicable to open-end investment companies.
Item 9. Purchases of Equity Securities by Closed-End Management Investment Company and Affiliated Purchasers.
Not applicable to open-end investment companies.
Item 10. Submission of Matters to a Vote of Security Holders.
There have been no material changes to the procedures by which shareholders may recommend nominees to the registrant’s board of trustees.
Item 11. Controls and Procedures.
| (a) | The Registrant’s President and Treasurer have reviewed the Registrant's disclosure controls and procedures (as defined in Rule 30a-3(c) under the Investment Company Act of 1940 (the “Act”)) as of a date within 90 days of the filing of this report, as required by Rule 30a-3(b) under the Act and Rules 13a-15(b) or 15d-15(b) under the Securities Exchange Act of 1934. Based on their review, such officers have concluded that the disclosure controls and procedures are effective in ensuring that information required to be disclosed in this report is appropriately recorded, processed, summarized and reported and made known to them by others within the Registrant and by the Registrant’s service provider. |
| (b) | There were no changes in the Registrant's internal control over financial reporting (as defined in Rule 30a-3(d) under the Act) that occurred during the period covered by this report that has materially affected, or is reasonably likely to materially affect, the Registrant's internal control over financial reporting. |
Item 12. Disclosure of Securities Lending Activities for Closed-End Management Investment Companies.
Not applicable to open-end investment companies.
Item 13. Exhibits.
| | (3) Any written solicitation to purchase securities under Rule 23c-1 under the Act sent or given during the period covered by the report by or on behalf of the registrant to 10 or more persons. Not applicable to open-end investment companies. |
| | (4) Change in the registrant’s independent public accountant. There was no change in the registrant’s independent public accountant for the period covered by this report. |
SIGNATURES
Pursuant to the requirements of the Securities Exchange Act of 1934 and the Investment Company Act of 1940, the registrant has duly caused this report to be signed on its behalf by the undersigned, thereunto duly authorized.
| | (Registrant) | Trust for Professional Managers | |
| | By (Signature and Title)* | /s/ John Buckel | |
| | | John Buckel, President | |
Pursuant to the requirements of the Securities Exchange Act of 1934 and the Investment Company Act of 1940, this report has been signed below by the following persons on behalf of the registrant and in the capacities and on the dates indicated.
| | By (Signature and Title)* | /s/ John Buckel | |
| | | John Buckel, President | |
| | By (Signature and Title)* | /s/ Jennifer Lima | |
| | | Jennifer Lima, Treasurer | |
* Print the name and title of each signing officer under his or her signature.