Exhibit 99.1
MeriStar Hospitality Corporation
Analyst Meeting – September 20, 2005
[hotel photos]

Company and Industry Overview
[hotel photo]
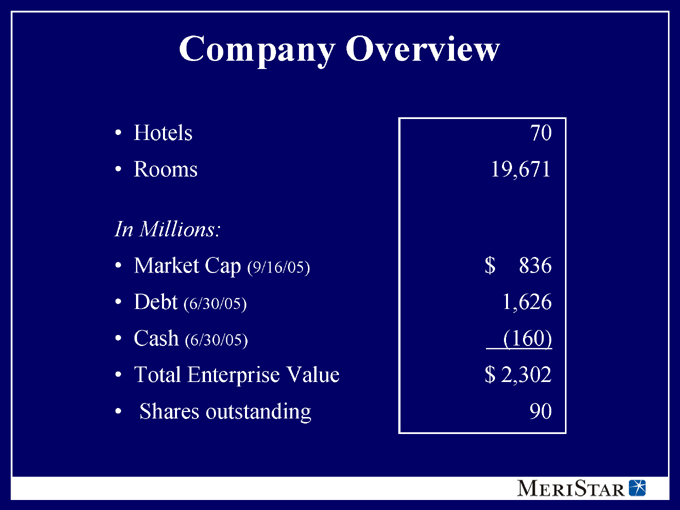
Company Overview
Hotels 70
Rooms 19,671
In Millions:
Market Cap (9/16/05) $836
Debt (6/30/05) 1,626
Cash (6/30/05) (160)
Total Enterprise Value $2,302
Shares outstanding 90
Company Strategy
Maximize internal growth
Upgrade core portfolio
Improve capital structure
Position for growth
[hotel photo]
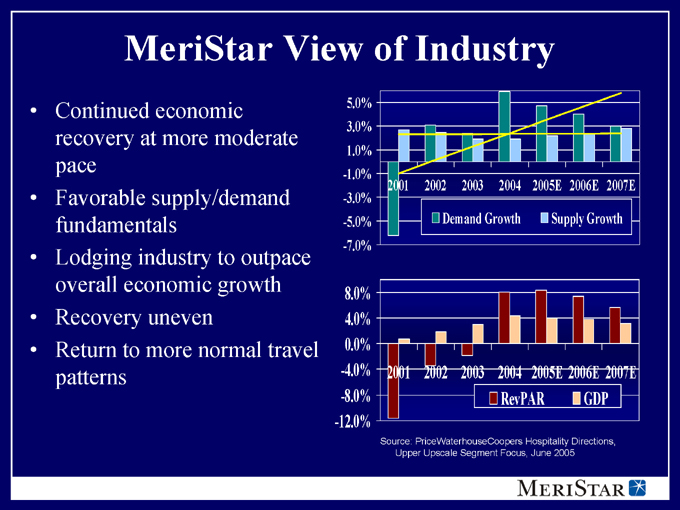
MeriStar View of Industry
Continued economic recovery at more moderate pace
Favorable supply/demand fundamentals
Lodging industry to outpace overall economic growth
Recovery uneven
Return to more normal travel patterns
5.0% 3.0% 1.0% -1.0% -3.0% -5.0% -7.0%
2001 2002 2003 2004 2005E 2006E 2007E
8.0%
4.0%
0.0%
-4.0%
-8.0%
-12.0%
2001 2002 2003 2004 2005E 2006E 2007E
RevPAR
GDP
Demand Growth
Supply Growth
Source: PriceWaterhouseCoopers Hospitality Directions, Upper Upscale Segment Focus, June 2005

Maximize Internal Growth
Higher growth potential with core hotels
Upgraded product through extensive capex program
[hotel photo]
Aggressive ownership programs
Active management oversight
Revenue management function
Cost control programs
Enhanced operating teams
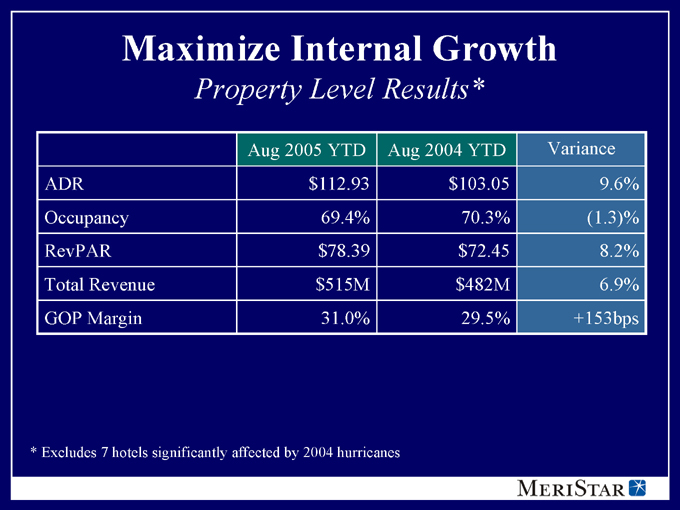
Maximize Internal Growth
Property Level Results*
Aug 2005 YTD Aug 2004 YTD Variance
ADR $112.93 $103.05 9.6%
Occupancy 69.4% 70.3% (1.3)%
RevPAR $78.39 $72.45 8.2%
Total Revenue $515M $482M 6.9%
GOP Margin 31.0% 29.5% +153bps
* Excludes 7 hotels significantly affected by 2004 hurricanes
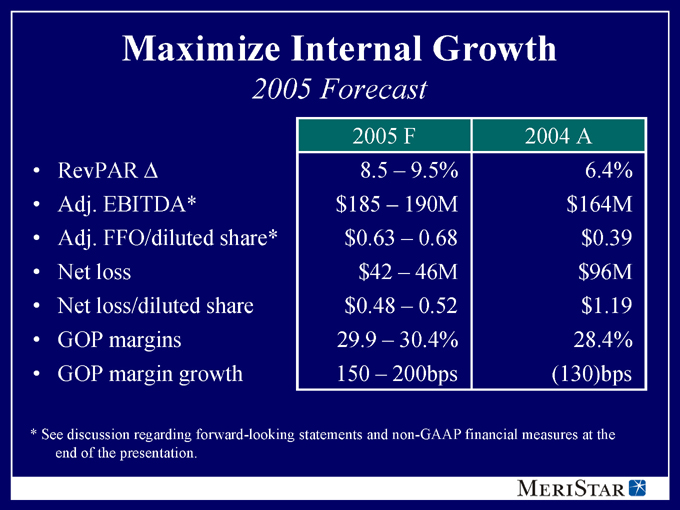
Maximize Internal Growth
2005 Forecast
2005 F 2004 A
RevPAR 8.5 – 9.5% 6.4%
Adj. EBITDA* $185 – 190M $164M
Adj. FFO/diluted share* $0.63 – 0.68 $0.39
Net loss $42 – 46M $96M
Net loss/diluted share $0.48 – 0.52 $1.19
GOP margins 29.9 – 30.4% 28.4%
GOP margin growth 150 – 200bps (130)bps
* See discussion regarding forward-looking statements and non-GAAP financial measures at the end of the presentation.
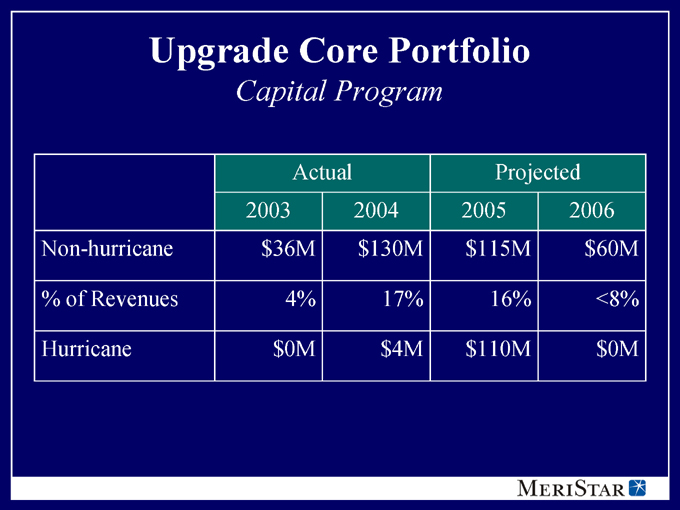
Upgrade Core Portfolio
Capital Program
Actual Projected
2003 2004 2005 2006
Non-hurricane $36M $130M $115M $60M
% of Revenues 4% 17% 16% <8%
Hurricane $0M $4M $110M $0M
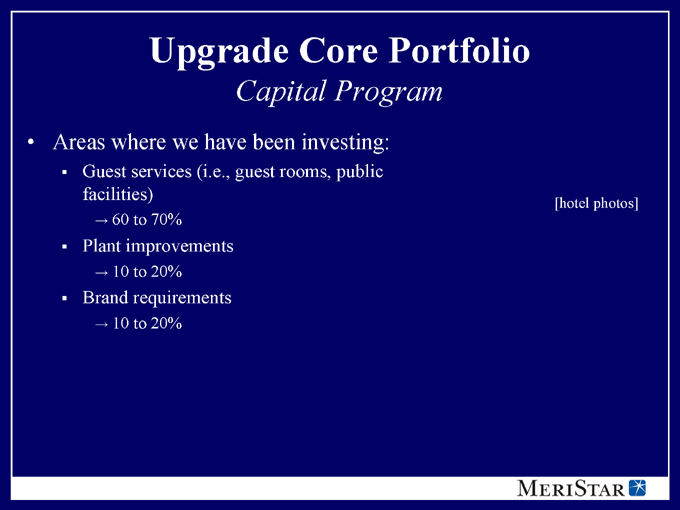
Upgrade Core Portfolio
Capital Program
Areas where we have been investing:
Guest services (i.e., guest rooms, public facilities)
60 to 70%
Plant improvements
10 to 20%
Brand requirements
10 to 20%
[hotel photos]
Upgrade Core Portfolio
Capital Program – Product Improvement
Marriott Downtown LA
Renovated public space
RevPAR up 10.3% YTD
ADR up 9.5% YTD
GOP margins increased by 370bps YTD
GOP up $1 million YTD
[hotel photo]
Upgrade Core Portfolio
Capital Program – Product Improvement
Hilton Arlington, TX
Renovated guestrooms and public space
RevPAR up 9.9% YTD
GOP margin up 155bps YTD
[hotel photo]
Upgrade Core Portfolio
Capital Program – Product Improvement
Hilton Crystal City at National Airport
Completely renovated guestrooms and public areas
ADR up 14.7% YTD
RevPAR up 13.8% YTD
[hotel photo]
Upgrade Core Portfolio
Capital Program – Product Improvement
Radisson Chicago
ADR up 19.9% YTD
RevPAR up 18.4% YTD
GOP margin up 241 bps YTD
[hotel photo]
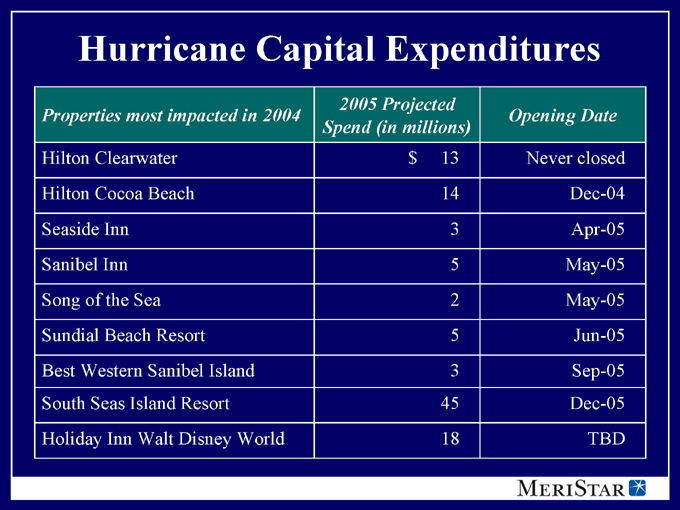
Hurricane Capital Expenditures
Properties most impacted in 2004 2005 Projected
Spend (in millions) Opening Date
Hilton Clearwater $13 Never closed
Hilton Cocoa Beach 14 Dec-04
Seaside Inn 3 Apr-05
Sanibel Inn 5 May-05
Song of the Sea 2 May-05
Sundial Beach Resort 5 Jun-05
Best Western Sanibel Island 3 Sep-05
South Seas Island Resort 45 Dec-05
Holiday Inn Walt Disney World 18 TBD
Hilton Clearwater
[hotel photos]
Hilton Cocoa Beach
[hotel photos]
South Seas Island Resort
Before
[hotel photos]
After
Property Level Results
Hurricane-Affected Properties
Properties emerging in first-rate condition
Hilton Clearwater
ADR up 13% YTD
Hilton Cocoa Beach
ADR up 24% YTD
[hotel photo]
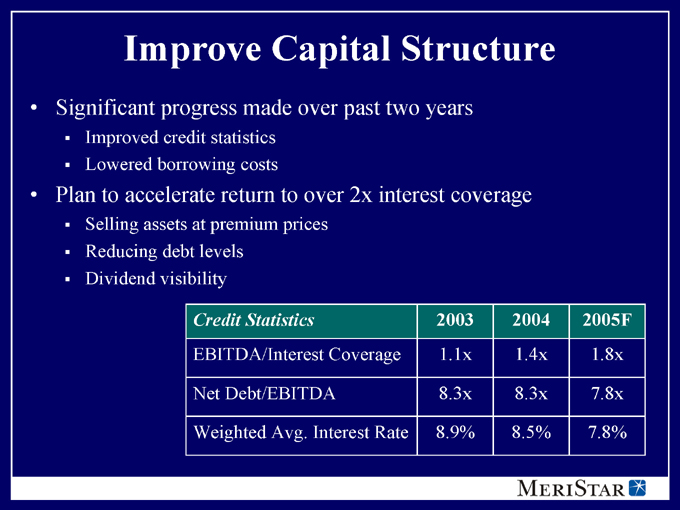
Improve Capital Structure
Significant progress made over past two years
Improved credit statistics
Lowered borrowing costs
Plan to accelerate return to over 2x interest coverage
Selling assets at premium prices
Reducing debt levels
Dividend visibility
Credit Statistics 2003 2004 2005F
EBITDA/Interest Coverage 1.1x 1.4x 1.8x
Net Debt/EBITDA 8.3x 8.3x 7.8x
Weighted Avg. Interest Rate 8.9% 8.5% 7.8%

Improve Capital Structure
2005 Capital Markets Activity To Date
Placed $82 million in long-term (10-yr) low interest-rate (5.7 – 5.8%) mortgages on the Hiltons in Crystal City and Clearwater
Repurchased $41 million in senior notes
Called remaining $33 million senior subordinated notes at par
Expanded secured revolving credit facility by $100 million while lowering the total borrowing rate by 100 bps
Refinanced $300 million CMBS at a rate over 300 bps lower
$9 million annualized interest savings
Increased portfolio flexibility
$45 million in escrows released
Position for Growth
Focus on core hotels
Strategic locations in large urban markets or destination resorts with high barriers to entry
Branded, larger hotels with significant meeting space
Strong current cash returns
Focus on operations
Right-size capital structure
Complete portfolio repositioning
[hotel photo]
Business Plan Modifications
Sell additional assets
Retire debt
ROI capital
Very selective investments
[hotel photo]
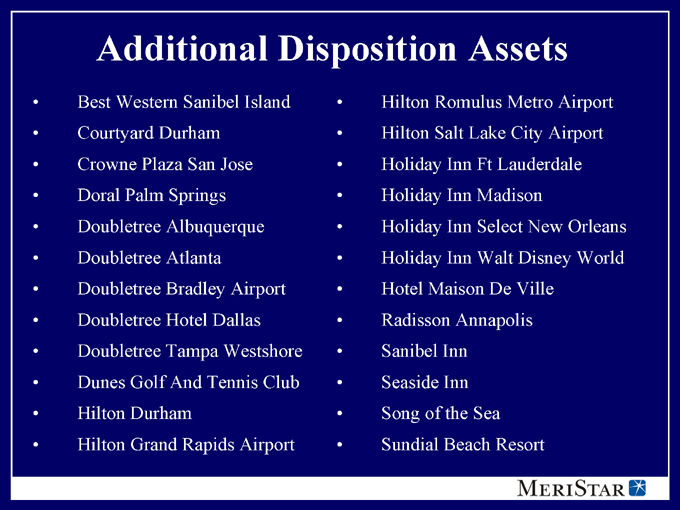
Additional Disposition Assets
Best Western Sanibel Island
Courtyard Durham
Crowne Plaza San Jose
Doral Palm Springs
Doubletree Albuquerque
Doubletree Atlanta
Doubletree Bradley Airport
Doubletree Hotel Dallas
Doubletree Tampa Westshore
Dunes Golf And Tennis Club
Hilton Durham
Hilton Grand Rapids Airport
Hilton Romulus Metro Airport
Hilton Salt Lake City Airport
Holiday Inn Ft Lauderdale
Holiday Inn Madison
Holiday Inn Select New Orleans
Holiday Inn Walt Disney World
Hotel Maison De Ville
Radisson Annapolis
Sanibel Inn
Seaside Inn
Song of the Sea
Sundial Beach Resort
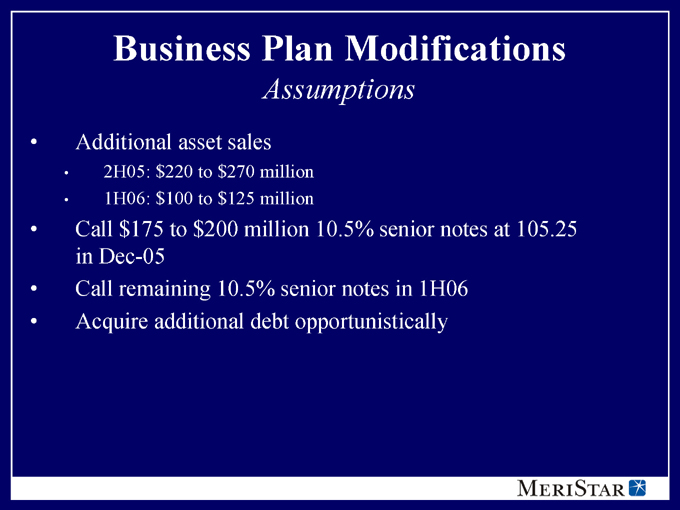
Business Plan Modifications
Assumptions
Additional asset sales
2H05: $220 to $270 million
1H06: $100 to $125 million
Call $175 to $200 million 10.5% senior notes at 105.25 in Dec-05
Call remaining 10.5% senior notes in 1H06
Acquire additional debt opportunistically
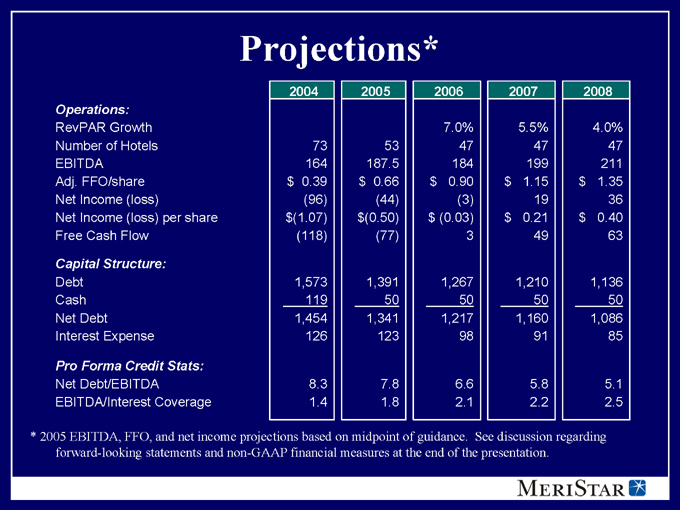
Projections*
2004 2005 2006 2007 2008
Operations:
RevPAR Growth 7.0% 5.5% 4.0%
Number of Hotels 73 53 47 47 47
EBITDA 164 187.5 184 199 211
Adj. FFO/share $0.39 $0.66 $0.90 $1.15 $1.35
Net Income (loss) (96) (44) (3) 19 36
Net Income (loss) per share $(1.07) $(0.50) $(0.03) $0.21 $0.40
Free Cash Flow (118) (77) 3 49 63
Capital Structure:
Debt 1,573 1,391 1,267 1,210 1,136
Cash 119 50 50 50 50
Net Debt 1,454 1,341 1,217 1,160 1,086
Interest Expense 126 123 98 91 85
Pro Forma Credit Stats:
Net Debt/EBITDA 8.3 7.8 6.6 5.8 5.1
EBITDA/Interest Coverage 1.4 1.8 2.1 2.2 2.5
* 2005 EBITDA, FFO, and net income projections based on midpoint of guidance. See discussion regarding forward-looking statements and non-GAAP financial measures at the end of the presentation.
Operations Overview
[hotel photo]
Maximize Internal Growth
Execution of Operating Strategy
Aggressive asset management
Operating company dialogue
Pro-active, on-going revenue management
Focus on operating margins/flow-through
Strategically directed capital expenditures
[hotel photo]
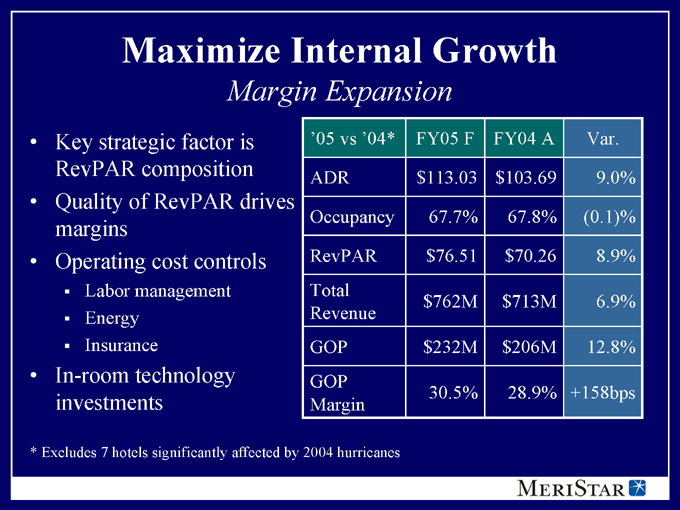
Maximize Internal Growth
Margin Expansion
Key strategic factor is ’05 vs ’04* FY05 F FY04 A Var.
RevPAR composition ADR $113.03 $103.69 9.0%
Quality of RevPAR drives margins Occupancy 67.7% 67.8% (0.1)%
Operating cost controls RevPAR $76.51 $70.26 8.9%
Labor management Total $762M $713M 6.9%
Energy Revenue
Insurance GOP $232M $206M 12.8%
In-room technology investments GOP Margin 30.5% 28.9% +158bps
* Excludes 7 hotels significantly affected by 2004 hurricanes
Maximize Internal Growth
2006 Outlook
Currently expect RevPAR growth of 7 to 8 percent
Margin growth of 75 to 125 basis points
Active cost management
Reduced renovation disruption
[hotel photo]
Upgrade Core Portfolio
Product Improvement
Returns on invested dollars
Improved competitive position
Property level confidence to execute rate-driven strategy
Reduction of repairs and maintenance
Increased energy efficiency
Brand standards
Competitive escalation of standards
Focuses the capital investment decision
[hotel photos]
Position for Growth
MeriStar Outlook on Market
Seller’s market
Abundant investment capital
Historically low interest rates
Positive industry fundamentals
Exploiting market conditions
Reduce debt levels
Exiting secondary markets
[hotel photo]
Position for Growth
Asset Sales
24x LTM EBITDA multiples on non-core asset disposition program in 2003/2004
14 – 15x LTM EBITDA multiples expected on expanded asset sale program in 2005/2006
Typical buyers are regional
24 assets now on the market
8 under contract or letter of intent
Projected completion by end of 1Q06
Assets with alternate uses
[hotel photo]
Position for Growth
Selective Investments
Acquisitions in 2004 continue to exceed expectations
The Ritz-Carlton, Pentagon City
Marriott Irvine
Radisson Lexington Avenue
Purchase/invested amounts are only 9x 2005 projected EBITDA
Actively in touch with the marketplace
[hotel photos]

Financial Overview
[hotel photo]
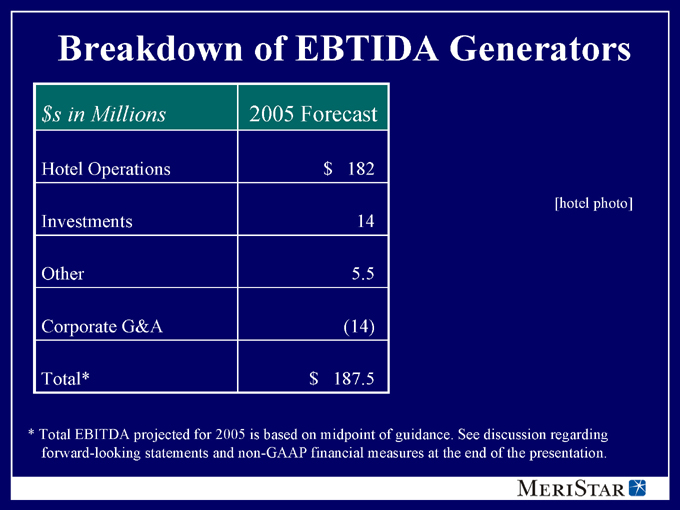
Breakdown of EBTIDA Generators
$s in Millions 2005 Forecast
Hotel Operations $182
Investments 14
Other 5.5
Corporate G&A (14)
Total* $187.5
[hotel photo]
* Total EBITDA projected for 2005 is based on midpoint of guidance. See discussion regarding forward-looking statements and non-GAAP financial measures at the end of the presentation.
Status of Insurance Claims
2004 Hurricanes Charley and Frances
Nearly all hotel operations restored by year end
Continuing to adjust claims
Process requires company to advance money
2005 Hurricane Katrina
3 hotels (566 rooms) had some impact/one re-opened
All in sale category
Short-term operating impact
[hurricane photo]
Improve Capital Structure
Look for opportunities to:
Reduce overall debt
Lower borrowing costs
Improve credit statistics
Made significant progress in past two years
Modifications to business plan accelerate return to over 2x coverage
[hotel photo]
Improve Capital Structure
2005 Capital Markets Activity To Date
Placed $82 million in long-term (10-yr) low interest-rate (5.7 –5.8%) mortgages on the Hiltons in Crystal City and Clearwater
Repurchased $41 million in senior notes
Called remaining $33 million senior subordinated notes at par
Expanded secured revolving credit facility by $100 million while lowering the total borrowing rate by 100 bps
Refinanced $300 million CMBS at a rate over 300 bps lower
$9 million annualized interest savings
Increased portfolio flexibility
$45 million in escrows released
Improve Capital Structure
Planned Capital Markets Activity
Call $175 to 200 million in 10½ percent senior notes in Dec-05
Call remaining 10½ percent senior notes in 1H06
Repay additional debt opportunistically
[hotel photo]
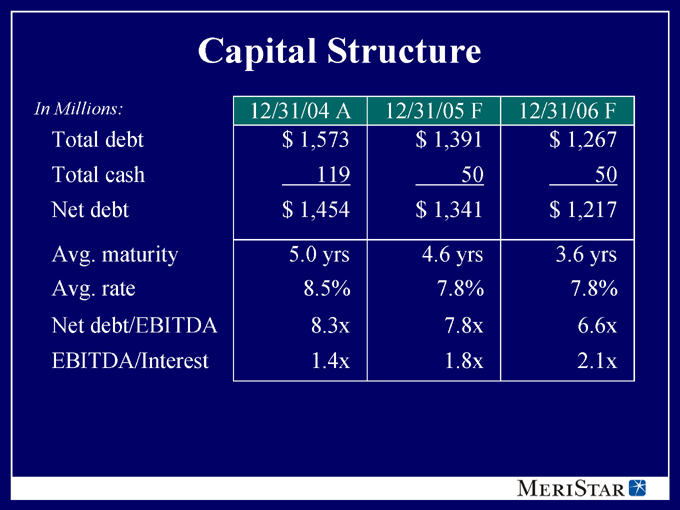
Capital Structure
In Millions: 12/31/04 A 12/31/05 F 12/31/06 F
Total debt $1,573 $1,391 $1,267
Total cash 119 50 50
Net debt $1,454 $1,341 $1,217
Avg. maturity 5.0 yrs 4.6 yrs 3.6 yrs
Avg. rate 8.5% 7.8% 7.8%
Net debt/EBITDA 8.3x 7.8x 6.6x
EBITDA/Interest 1.4x 1.8x 2.1x
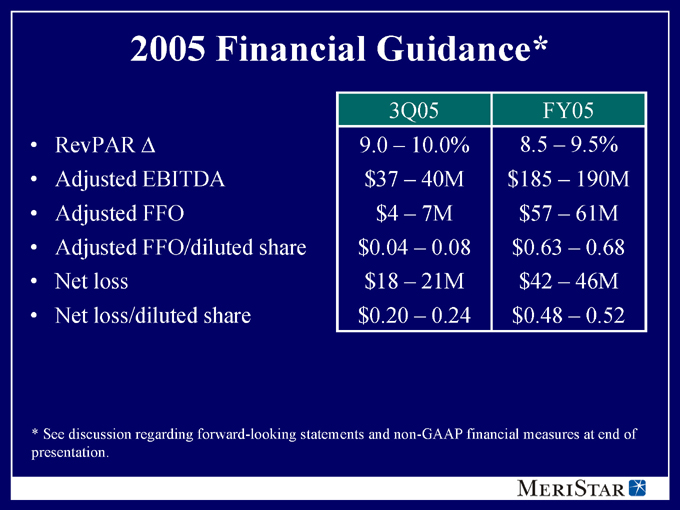
2005 Financial Guidance*
3Q05 FY05
RevPAR 9.0 – 10.0% 8.5 – 9.5%
Adjusted EBITDA $37 – 40M $185 – 190M
Adjusted FFO $4 – 7M $57 – 61M
Adjusted FFO/diluted share $0.04 – 0.08 $0.63 – 0.68
Net loss $18 – 21M $42 – 46M
Net loss/diluted share $0.20 – 0.24 $0.48 – 0.52
* See discussion regarding forward-looking statements and non-GAAP financial measures at end of presentation.

Looking Forward
[hotel photo]
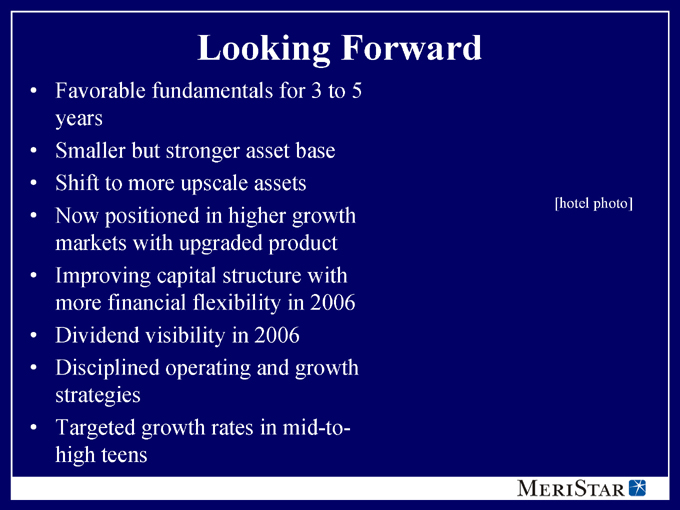
Looking Forward
Favorable fundamentals for 3 to 5 years
Smaller but stronger asset base
Shift to more upscale assets
Now positioned in higher growth markets with upgraded product
Improving capital structure with more financial flexibility in 2006
Dividend visibility in 2006
Disciplined operating and growth strategies
Targeted growth rates in mid-to-high teens
[hotel photo]
CAUTIONARY STATEMENT REGARDING FORWARD-LOOKING STATEMENTS
This presentation contains forward-looking statements within the meaning of Section 27A of the Securities Act of 1933 and Section 21E of the Securities Exchange Act of 1934. Forward-looking statements, which are based on various assumptions and describe our future plans, strategies and expectations, are generally identified by our use of words such as “intend,” “plan,” “may,” “should,” “will,” “project,” “estimate,” “anticipate,” “believe,” “expect,” “continue,” “potential,” “opportunity,” and similar expressions, whether in the negative or affirmative. We cannot guarantee that we actually will achieve these plans, intentions or expectations. All statements regarding our expected financial position, business and financing plans are forward-looking statements. Except for historical information, matters discussed in this presentation are subject to known and unknown risks, uncertainties and other factors which may cause our actual results, performance or achievements to be materially different from future results, performance or achievements expressed or implied by such forward-looking statements. Factors which could have a material adverse effect on our operations and future prospects include, but are not limited to: economic conditions generally and the real estate market specifically; supply and demand for hotel rooms in our current and proposed market areas; other factors that may influence the travel industry, including health, safety and economic factors; competition; cash flow generally, including the availability of capital generally, cash available for capital expenditures, and our ability to refinance debt; the effects of threats of terrorism and increased security precautions on travel patterns and demand for hotels; the threatened or actual outbreak of hostilities and international political instability; governmental actions, including new laws and regulations and particularly changes to laws governing the taxation of real estate investment trusts; weather conditions generally and natural disasters; rising interest rates; and changes in U.S. generally accepted accounting principles, policies and guidelines applicable to real estate investment trusts. These risks and uncertainties should be considered in evaluating any forward-looking statements contained in this presentation or incorporated by reference herein. All forward-looking statements speak only as of the date of this presentation or, in the case of any document incorporated by reference, the date of that document. All subsequent written and oral forward-looking statements attributable to us or any person acting on our behalf are qualified by the cautionary statements in this section. We undertake no obligation to update or publicly release any revisions to forward-looking statements to reflect events, circumstances or changes in expectations after the date of this presentation.
SEC Regulation G requires any non-GAAP financial measure to be reconciled to the most directly comparable GAAP measure. To see the reconciliation of these numbers to the most directly comparable financial measures calculated and presented in accordance with GAAP, see the next slide and our press releases relating to the results of the quarter ended June 30, 2005, and the year ended December 31, 2004, which can be accessed on our website at www.MeriStar.com.
Free Cash Flow is EBITDA less capital expenditures and cash interest payments. It is considered to be an important indicator of the Company’s performance, including its ability to reduce net debt, make strategic investments, pay dividends to common shareholders and repurchase stock. Management believes that the presentation of free cash flow provides useful information to investors regarding our financial condition because it is a measure of cash generated which management evaluates for alternative uses. Free cash flow is not a substitute for any U.S. GAAP financial measure, such as net income.
Net debt is defined as total debt less cash and cash equivalents. Management uses net debt to evaluate the Company’s capital structure. Management believes that the presentation of net debt provides useful information to investors regarding our financial condition because accumulated cash can be used for debt repayment, if appropriate. Net debt is not a substitute for any U.S. GAAP financial measure. In addition, the calculation of net debt contained in this document may not be consistent with that of other companies.
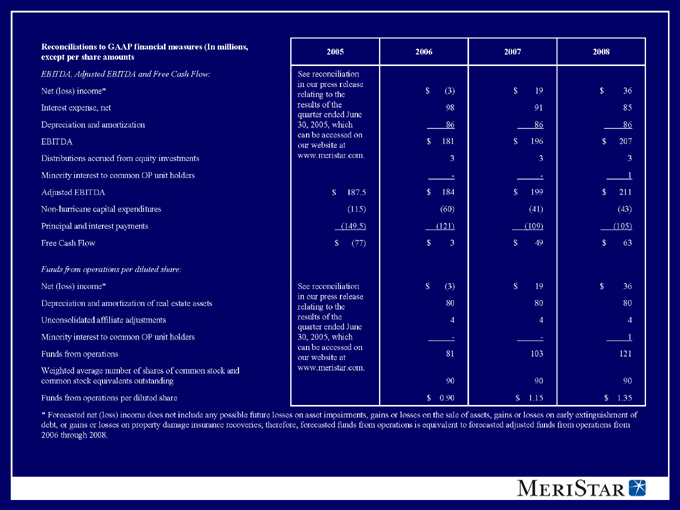
Reconciliations to GAAP financial measures (In millions, 2005 2006 2007 2008
except per share amounts
EBITDA, Adjusted EBITDA and Free Cash Flow: See reconciliation
in our press release
Net (loss) income* relating to the $(3) $19 $36
Interest expense, net results of the 98 91 85
quarter ended June
Depreciation and amortization 30, 2005, which 86 86 86
can be accessed on
EBITDA our website at $181 $196 $207
Distributions accrued from equity investments www.meristar.com. 3 3 3
Minority interest to common OP unit holders - - 1
Adjusted EBITDA $187.5 $184 $199 $211
Non-hurricane capital expenditures (115) (60) (41) (43)
Principal and interest payments (149.5) (121) (109) (105)
Free Cash Flow $(77) $3 $49 $63
Funds from operations per diluted share:
Net (loss) income* See reconciliation $(3) $19 $36
in our press release
Depreciation and amortization of real estate assets relating to the 80 80 80
Unconsolidated affiliate adjustments results of the 4 4 4
quarter ended June
Minority interest to common OP unit holders 30, 2005, which - - 1
can be accessed on
Funds from operations our website at 81 103 121
Weighted average number of shares of common stock and www.meristar.com.
common stock equivalents outstanding 90 90 90
Funds from operations per diluted share $0.90 $1.15 $1.35
* Forecasted net (loss) income does not include any possible future losses on asset impairments, gains or losses on the sale of assets, gains or losses on early extinguishment of debt, or gains or losses on property damage insurance recoveries; therefore, forecasted funds from operations is equivalent to forecasted adjusted funds from operations from 2006 through 2008.

MeriStar Hospitality Corporation (NYSE:MHX)
4501 N. Fairfax Drive, Suite 500
Arlington, VA 22203
(703) 812-7200
(703) 812-7255 fax
www.MeriStar.com