UNITED STATES
SECURITIES AND EXCHANGE COMMISSION
Washington, D.C. 20549
FORM 10-K
| |
☒ | ANNUAL REPORT PURSUANT TO SECTION 13 OR 15(d) OF THE SECURITIES EXCHANGE ACT OF 1934 |
for the fiscal year ended December 31, 2024
OR
| |
☐ | TRANSITION REPORT PURSUANT TO SECTION 13 OR 15(d) OF THE SECURITIES EXCHANGE ACT OF 1934 |
for the transition period from to .
Commission File Number: 000-50478
NEXSTAR MEDIA GROUP, INC.
(Exact Name of Registrant as Specified in Its Charter)
| | |
Delaware |
| 23-3083125 |
(State of Organization or Incorporation) |
| (I.R.S. Employer Identification No.) |
| | |
545 E. John Carpenter Freeway, Suite 700, Irving, Texas |
| 75062 |
(Address of Principal Executive Offices) |
| (Zip Code) |
(972) 373-8800
(Registrant’s Telephone Number, Including Area Code)
Securities registered pursuant to Section 12(b) of the Act:
| | | | |
Title of each class | | Trading Symbol(s) | | Name of each exchange on which registered |
Common Stock | | NXST | | NASDAQ Global Select Market |
Securities registered pursuant to section 12(g) of the Act: None
Indicate by check mark if the Registrant is a well-known seasoned issuer, as defined in Rule 405 of the Securities Act. Yes ☒ No ☐
Indicate by check mark if the Registrant is not required to file reports pursuant to Section 13 or Section 15(d) of the Act. Yes ☐ No ☒
Indicate by check mark whether the Registrant (1) has filed all reports required to be filed by Section 13 or 15(d) of the Securities Exchange Act of 1934 during the preceding 12 months (or for such shorter period that it was required to file such reports), and (2) has been subject to such filing requirements for the past 90 days. Yes ☒ No ☐
Indicate by checkmark whether the Registrant has submitted electronically every Interactive Data File required to be submitted pursuant to Rule 405 of Regulation S-T (§232.405 of this chapter) during the preceding 12 months (or for such shorter period that the Registrant was required to submit such files). Yes ☒ No ☐
Indicate by check mark whether the Registrant is a large accelerated filer, an accelerated filer, a non-accelerated filer, a smaller reporting company or an emerging growth company. See the definitions of “large accelerated filer,” “accelerated filer,” “smaller reporting company” and “emerging growth company” in Rule 12b-2 of the Exchange Act. (check one):
| | | | | | | |
Large accelerated filer | | ☒ |
| Accelerated filer | | ☐ | |
| | | | | | | |
Non-accelerated filer | | ☐ | | Smaller reporting company | | ☐ | |
| | | | | | | |
Emerging growth company | | ☐ | | | | | |
If an emerging growth company, indicate by check mark if the registrant has elected not to use the extended transition period for complying with any new or revised financial accounting standards provided pursuant to Section 13(a) of the Exchange Act. ☐
Indicate by check mark whether the registrant has filed a report on and attestation to its management’s assessment of the effectiveness of its internal control over financial reporting under Section 404(b) of the Sarbanes-Oxley Act (15 U.S.C. 7262(b)) by the registered public accounting firm that prepared or issued its audit report. ☒
If securities are registered pursuant to Section 12(b) of the Act, indicate by check mark whether the financial statements of the registrant included in the filing reflect the correction of an error to previously issued financial statements. ☐
Indicate by check mark whether any of those error corrections are restatements that required a recovery analysis of incentive-based compensation received by any of the registrant’s executive officers during the relevant recovery period pursuant to §240.10D-1(b). ☐
Indicate by check mark whether the Registrant is a shell company (as defined in Rule 12b-2 of the Exchange Act). Yes ☐ No ☒
As of June 30, 2024, the aggregate market value of the voting and non-voting common equity held by non-affiliates of the Registrant was $5,082,992,458.
As of February 27, 2025, the Registrant had 30,509,206 shares of Common Stock outstanding.
Documents Incorporated By Reference
Portions of the Proxy Statement for the Registrant’s 2025 Annual Meeting of Stockholders will be filed with the Commission within 120 days after the close of the Registrant’s fiscal year and incorporated by reference in Part III of this Annual Report on Form 10-K.
TABLE OF CONTENTS
General
As used in this Annual Report on Form 10-K and unless the context indicates otherwise, “Nexstar” refers to Nexstar Media Group, Inc., a Delaware corporation, and its consolidated wholly-owned and majority-owned subsidiaries, “Nexstar Media” refers to Nexstar Media Inc., a Delaware corporation and Nexstar’s wholly-owned subsidiary; the “Company” refers to Nexstar and the variable interest entities (“VIEs”) required to be consolidated in our financial statements; and all references to “we,” “our,” “ours,” and “us” refer to Nexstar.
Nexstar Media has time brokerage agreements (“TBAs”), shared services agreements (“SSAs”), joint sales agreements (“JSAs”), local marketing agreements (“LMAs”) and outsourcing agreements (which we generally and collectively refer to as “local service agreements”) relating to the television stations owned by VIEs but does not own any of the equity interests in these entities. For a description of the relationship between Nexstar and these VIEs, see Item 1, “Business.”
The information in this Annual Report on Form 10-K includes information related to Nexstar and the VIEs with which Nexstar has relationships. In accordance with accounting principles generally accepted in the United States (“U.S. GAAP”) and as discussed in Note 2 to our Consolidated Financial Statements in Part IV, Item 15(a) of this Annual Report on Form 10-K, the financial results of the consolidated VIEs are included in the Consolidated Financial Statements contained herein.
In the context of describing ownership of television stations in a particular market, the term “duopoly” refers to owning or deriving the majority of the economic benefit, through ownership or local service agreements, from two or more stations in a particular market. For more information on how we derive economic benefit from a duopoly, see Item 1, “Business.”
There are 210 generally recognized television markets, known as Designated Market Areas (“DMAs”), in the United States. DMAs are ranked in size according to various factors based upon actual or potential audience. DMA rankings contained in this Annual Report on Form 10-K are from the 2024-2025 Nielsen Local Television Market Universe Estimates as published by The Nielsen Company (“Nielsen”).
Cautionary Note Regarding Forward-Looking Statements
This Annual Report on Form 10-K contains “forward-looking statements” within the meaning of Section 27A of the Securities Act of 1933, as amended, and Section 21E of the Securities Exchange Act of 1934, as amended (“Exchange Act”). All statements other than statements of historical fact are “forward-looking statements” for purposes of federal and state securities laws, including: the risks and uncertainties of current economic factors that are beyond our control, such as inflation, rising interest rates and supply chain disruptions; any projections or expectations of earnings, revenue, financial performance, liquidity and capital resources or other financial items; any assumptions or projections about the television broadcasting industry; any statements of our plans, strategies and objectives for our future operations, performance, liquidity and capital resources or other financial items; any statements concerning proposed new products, services or developments; any statements regarding future economic conditions or performance; any statements of belief; and any statements of assumptions underlying any of the foregoing. Forward-looking statements may include the words “may,” “will,” “should,” “could,” “would,” “predicts,” “potential,” “continue,” “expects,” “anticipates,” “future,” “intends,” “plans,” “believes,” “estimates” and other similar words.
Although we believe that the expectations reflected in any of our forward-looking statements are reasonable, actual results could differ from a projection or assumption in any of our forward-looking statements. Our future financial position and results of operations, as well as any forward-looking statements, are subject to change and inherent risks and uncertainties discussed under Item 1A, “Risk Factors” located elsewhere in this Annual Report on Form 10-K and in our other filings with the United States Securities and Exchange Commission (“SEC”). The forward-looking statements made in this Annual Report on Form 10-K are made only as of the date hereof, and we do not have or undertake any obligation to update any forward-looking statements to reflect subsequent events or circumstances.
PART I
Item 1. Business
Company Overview
We are a leading diversified media company that produces and distributes engaging local and national news, sports and entertainment content across our television and digital platforms, including more than 316,000 hours of programming produced annually by our business units. Nexstar owns America’s largest local television broadcasting group comprised of top network affiliates, with over 200 owned or partner stations in 116 U.S. markets in 40 states and the District of Columbia reaching over 220 million people. Nexstar’s national television properties include a 77.1% interest in The CW Network, LLC (“The CW”), the fifth major broadcast network in the U.S., NewsNation, a national news network providing “News for All Americans”, two popular entertainment multicast networks, Antenna TV and REWIND TV, and a 31.3% ownership stake in Television Food Network, G.P. (“TV Food Network”). The Company’s portfolio of digital assets, including its local TV station websites, The Hill and NewsNationNow.com, is collectively a Top 10 U.S. digital news and information property, attracting nearly 103 million monthly unique users on average during 2024 according to Comscore.
We are a Delaware corporation formed in 1996. Our principal offices are at 545 E. John Carpenter Freeway, Suite 700, Irving, TX 75062. Our telephone number is (972) 373-8800 and our website is http://www.nexstar.tv. The information contained on, or accessible through, our website is not part of this Annual Report on Form 10-K and is not incorporated herein by reference.
Competitive Strengths
Focus on Broadcast Television. The substantial majority of our assets, including our television stations, The CW Network and our multicast networks, are broadcast television assets. Our television stations are affiliates of CBS, FOX, NBC and ABC (together, the “Big 4”), as well as The CW and MyNetworkTV (“MNTV”). We are the first, second or third largest affiliate group for each broadcast network. According to Nielsen, The Big 4 broadcast networks carry the nation’s most-watched programming by a significant margin (including the substantial majority of NFL games). The broadcast television model has several inherent advantages as it: (i) reaches more viewers than any other distribution model, as it reaches all pay television subscribers as well as the 14% of the population that only receives their television programming over the air, (ii) is the preferred distribution platform for most professional sports organizations as it delivers the widest reach to their fanbase thereby enhancing franchise value, and (iii) remains under-monetized as broadcast stations receive a lower percentage of total programming fees paid to content providers by distributors (e.g. cable companies, satellite companies and streaming platform providers) than the aggregate viewership they generate. Our focus on broadcast television has enabled us to achieve record revenue in 2024.
Unique Combination of Scaled Local Audiences and Powerful National Reach. We are the largest local television broadcasting company in the United States, generating $5.4 billion of revenue for the year ended December 31, 2024. Our and our partners’ over 200 broadcast stations in 116 local markets reach approximately 70% of U.S. television households (without applying the Federal Communications Commission’s (“FCC”) ultra-high-frequency (“UHF”) discount), which local reach is augmented by the national reach we have via our broadcast network, The CW, and our national news network, NewsNation. According to Nielsen, The CW Network reaches nearly 126 million television households, equal to the reach of the ABC, CBS, FOX and NBC broadcast networks, and NewsNation reaches approximately 64 million television households, virtually equivalent to the reach of Fox News, CNN and MSNBC. Together, Nexstar can provide both national reach and activation of local audiences at scale, representing a differentiated and attractive value proposition for advertisers and brands in an increasingly fragmented marketplace.
Leading Local Franchises. We are focused on building and maintaining leading local franchises in the 116 local markets we serve. In total, we employ approximately 6,000 journalists and 1,600 salespeople, produce over 316,000 hours of programming, and have relationships with over 40,000 advertisers. Each of the stations that we own, operate, program, or provide sales and other services to creates a highly recognized local brand, primarily attributable to our high quality local news programming, extensive local sports coverage, and community presence. All of our news programming produced by Nexstar stations and rated by a third-party watchdog group, Ad Fontes, is judged to be politically neutral (labeled “middle” in terms of left or right bias). In addition, according to Ad Fontes virtually all of the news programming has a reliability rating of “reliable; analysis/fact reporting.” In 2024, journalists at our stations won 494 awards for their reporting, including 35 Edward R. Murrow awards and 100 Emmy awards. We employ a high-quality local sales force in each of our markets to increase revenue from local advertisers by capitalizing on our investment in local programming, websites and over-the-top (“OTT”) applications. In even-numbered years, when most elections are held, we have historically generated substantial revenue from locally driven political advertising. Given our expansive geographic reach, we have television stations in more than 80% of the markets where there were contested political elections in 2024. In addition, we own or provide services to more than one station in certain markets which can enhance our service to local communities, broaden our audience share, enhance our revenue share and achieve significant operating efficiencies. For the year ended December 31, 2024, excluding our owned network assets, the Company earned approximately 66% of its advertising revenue from non-network programming.
Strong National Brands. We have a portfolio of scaled, strong national brands that enables us to engage with national advertisers in more meaningful ways than we have in the past. Our primary national brands include The CW, NewsNation and The Hill. The CW is America’s fifth national broadcast network. NewsNation is our news network providing fact-based, unbiased “News for All Americans.” The Hill is the nation’s leading, independent political digital media platform.
Diversified Revenue Streams. Our revenue streams are diversified by geography, affiliation and source. In 2024, we generated 54% of our revenue from distribution, 45% from advertising (of which approximately 36% was from local commercial sources and 9% from political sources), and 1% from other sources. No single customer generated more than 13% of our revenue; no single market generated more than 3% of our revenue; and our affiliations are diverse with no network affiliate group representing more than 27% of our 2024 combined core and political advertising net revenue.
Intense Operational Focus. We emphasize strict controls on operating and programming costs in order to increase net income, Adjusted EBITDA and Adjusted Free Cash Flow. We continually seek to identify and implement cost savings at each of our stations, the stations we provide services to and other business units, and our overall size benefits each station or business unit with respect to negotiating favorable terms with programming suppliers and other vendors. By leveraging our size and corporate management expertise, we are able to achieve economies of scale by providing programming, financial, sales and marketing support to our stations, the stations we provide services to and other business units. Our operational execution expertise is the direct result of our talented management team. We seek to attract and retain corporate, business unit and station general managers with proven track records by providing equity incentives.
Attractive Financial Profile. In 2024 and 2023, we generated total net revenue of $5.4 billion and $4.9 billion, respectively, generated net cash flow from operating activities of $1.3 billion and $1 billion, respectively, and returned a significant percentage of that cash flow to shareholders in the form of share repurchases and dividends—$820 million in 2024 and $796 million in 2023—while maintaining a corporate credit rating of Ba3 / BB+ as rated by Moody’s / S&P. We believe we have the financial flexibility to invest in both organic and inorganic growth initiatives while continuing to return capital to our shareholders.
Growth Strategies
We continually seek to generate revenue, net income, Adjusted EBITDA and Adjusted Free Cash Flow growth through the following strategies:
Leverage Our Scale. As the largest local television broadcaster with significant, scaled national media properties, we believe we are an important partner for the major broadcast networks as we are one of the largest affiliate groups for each network, multichannel video programming distributors (“MVPDs”) and virtual multichannel video distributors (“vMVPDs”) who include our programming in their consumer offering, and advertisers. For national advertisers we have a collection of national networks/properties including The CW, NewsNation, Antenna TV and The Hill as well as television stations covering 70% of the country (without applying the FCC UHF discount) including eight of the top 10 and 18 of the top 25 DMAs. Our digital assets attract an audience that makes us a top ten digital news and information property, according to Comscore. Our scale provides us with unique operating advantages in the form of services we can provide to our advertisers, audience and employees, a platform for growth and operating expense synergies and access to capital. As part of this strategy, in 2023, we centralized our national advertising sales in house in order to drive advertising sales across our diversified media portfolio by further emphasizing our client-first approach, combined with a new data-driven, multi-platform focus.
Continue to Grow Distribution and Advertising Revenues. We believe our core business of distribution and advertising revenue has the potential to continue to grow. We believe that the share of audience that our programming generates for MVPDs and vMVPDs is greater than the share of fees those platforms pay us and that broadcast advertising continues to provide commercial and political advertisers with access to the broadest television audience available. In addition, we are focused on better monetizing our digital content and audience and growing our portfolio of digital products, services and content and associated revenue streams, including apps for NewsNation, The Hill and other local television station programming.
Improve and Expand National Broadcast and Cable Networks. We seek to continue to increase the viewership, revenues and profitability of our national television network assets, The CW and NewsNation.
The CW. As the largest affiliate of The CW, we acquired the network in September 2022 (for no consideration) in order to sustain and grow our CW-related revenue streams and to improve this underexploited national broadcast network asset. Our growth strategy for The CW has been to cost efficiently improve and diversify the programming to better align with broadcast audiences with the intention of improving ratings and revenue (both distribution and advertising) while reducing programming and other operating costs. Since we made the acquisition, we have (i) increased the hours of programming provided by the network by over 40%, (ii) introduced sports and sports-related programming through the creation of CW Sports with the acquisition of exclusive broadcast rights to WWE NXT, NASCAR Xfinity Series, and ACC college football and basketball, among other events, and (iii) increased the percentage of total programming hours expected to be offered by the network in 2025 related to sports and sports-related programming to approximately 40% from 0% at acquisition, all while reducing programming costs by more than 50% and improving operating cash flows of the network. In addition, we have been able to grow the CW’s distribution revenue while increasing the number of CW affiliations owned by us and our partners to 54, representing 45.7% of total U.S. TV Households. We and our partners together own the largest group of CW affiliates, larger than any of the Big 4 networks’ ownership of their respective network-affiliated stations. We believe there is potential for The CW to further improve its profitability and, together with Nexstar’s CW station affiliates, the overall net profit contribution to Nexstar.
NewsNation. NewsNation is our national news network providing “News for All Americans” which has been recognized by independent watchdog groups such as Ad Fontes Media, NewsGuard and AllSides for its independent, unbiased reporting of national and local news. In 2024, NewsNation successfully expanded to 24 hours of news programming seven days a week. NewsNation was launched in 2020, when we initiated the conversion of WGN America to NewsNation, leveraging our core competency in news and profitable foundation to build a network focused on providing unbiased, fact-based news. We believe there is significant growth potential for NewsNation as news networks are among the most watched and profitable cable networks.
Develop New Revenue Streams. We seek to generate new revenue streams leveraging the platform and assets of our company. Given our extensive station portfolio and geographic coverage, we have converted the technology used by our stations reaching 50% of U.S. television households to a new standard, ATSC 3.0, which will enable us to provide new high speed data transmission services to businesses and consumers. We anticipate that this conversion will enable us to develop a new business and generate additional revenue in the future.
Acquire and Invest in New and Complementary Businesses. We selectively pursue acquisitions where we believe we can improve revenue, net income, Adjusted EBITDA and cash flow. Historically, we have been able to achieve significant improvements from acquisitions of television broadcasting assets by applying our favorable distribution contracts to newly acquired stations, reducing costs by creating duopolies or operating stations together in selected markets and executing on other overhead and cost-based synergies. We plan to continue to pursue television station acquisitions where permitted by the regulatory framework. In addition, we may selectively pursue acquisitions of businesses that leverage our platform, scale and capabilities and are complementary to our vision of providing local news, entertainment, and sports content through broadcast and digital platforms.
Stations
As of February 27, 2025, we owned, operated, programmed or provided sales and other services to 201 full power television stations in 116 markets in 40 states and the District of Columbia, reaching approximately 39% of all U.S. television households reflecting our owned stations only and after applying the FCC UHF discount and approximately 70% of all U.S. television households reflecting ours and our partners’ stations and excluding the FCC UHF discount. The stations are affiliates of CBS, FOX, NBC, ABC, The CW, MNTV and other broadcast television networks and provide television programming to consumers in our markets, including network programming, content that the stations produce, including local news, and syndicated programs that the stations acquire. In 2025, we acquired WBNX-TV, an independent full power station in Cleveland, OH. These stations are included in the table below and included in our station count. We also own and operate one AM radio station in Chicago, IL.
Of the 201 full power television stations, 37 are 100% independently owned by VIEs. We consolidate 35 of these VIEs (the “consolidated VIEs”) in our financial statements. In compliance with FCC regulations for all the parties, all VIEs maintain complete responsibility for and control over programming, finances, personnel and operations of their stations. For the consolidated VIEs, we are deemed under U.S. GAAP to have controlling financial interests in these entities because of Nexstar’s (i) local service agreements with the consolidated VIEs’ stations, (ii) guarantee (excluding The CW) of the obligations incurred under the senior secured credit facility of Mission Broadcasting, Inc. (“Mission”), a consolidated VIE, (iii) power over significant activities affecting the consolidated VIEs’ economic performance, including budgeting for advertising revenue, certain advertising sales and, in some cases, hiring and firing of sales force personnel and (iv) renewable, exercisable and assignable purchase options granted by each consolidated VIE which permit Nexstar to acquire the assets and assume the liabilities of all of the consolidated VIEs’ stations at any time, subject to FCC consent. For additional information on VIEs, see Note 2 to our Consolidated Financial Statements in Part IV, Item 15(a) of this Annual Report on Form 10-K.
The following table sets forth general information about the television stations (full power, low power and multicast channels) we own, operate, program or provide sales and other services to as of February 2025.
| | | | | | | |
Market Rank(1) | Market | Status(2) | Full Power
Stations | Primary
Affiliation | Low Power Stations /
Multicast Channels | Other Affiliations | FCC License
Expiration Date |
1 | New York, NY | LSA | WPIX | The CW | WPIX-D2, D4 | Antenna TV, REWIND TV | (5) |
2 | Los Angeles, CA | O&O | KTLA | The CW | KTLA-D2, D3, D4, D5 | Antenna TV, GRIT, ShopLC, REWIND TV | (5) |
3 | Chicago, IL | O&O | WGN | The CW | WGN-D2, D3, D4, D5 | Antenna TV, GRIT, REWIND TV, The Nest | 4/1/2030 |
4 | Dallas, TX | O&O | KDAF | The CW | KDAF-D2, D3, D4, D5 | Antenna TV, GRIT, Charge!, REWIND TV | 8/1/2030 |
5 | Philadelphia, PA | O&O | WPHL | The CW | WPHL-D2, D3, D4 | Antenna TV/MNTV, GRIT, Comet | (5) |
6 | Houston, TX | O&O | KIAH | The CW | KIAH-D2, D3, D4, D5 | Antenna TV, The Nest, HSN2, REWIND TV | (5) |
8 | DC/Hagerstown, MD | O&O
O&O | WDCW
WDVM(3) | The CW
Independent | WDCW-D2, D3, D4
WDVM-D2, D3, D4 | Antenna TV, WDVM, Univision
ION Mystery, REWIND TV, ShopLC | 10/1/2028
10/1/2028 |
10 | San Francisco, CA | O&O | KRON | The CW | KRON-D2, D3, D4, D5 | Antenna TV, REWIND TV, TBD, Defy | (5) |
11 | Tampa, FL | O&O
O&O
O&O | WFLA
WTTA(4) | NBC
The CW | WFLA-D2, D3
WTTA-D2
WSNN-LD, D2, D3, D4 | Charge!, Antenna TV
Cozi TV
MNTV, GRIT, Laff, Court TV | 2/1/2029
2/1/2029
2/1/2029 |
12 | Phoenix, AZ | LSA | KAZT | The CW | KAZT-D2, D3, D4, D5 | MeTV, Merit Street, Charge!, REWIND TV | 10/1/2030 |
17 | Denver, CO | O&O
O&O
O&O | KDVR
KFCT
KWGN | FOX
FOX
The CW | KDVR-D2, D3
KWGN-D2, D3, D4 | Antenna TV, TBD
getTV, Comet, HSN2 | (5)
(5)
4/1/2030 |
19 | Cleveland, OH | O&O
O&O | WJW
WBNX | FOX
Independent | WJW-D2, D3, D4
WBNX-D2, D3, D4, D5, D6 | Antenna TV, Comet, Charge!
BUZZR, Movies, H&I, Start, Binge | 10/1/2029
10/1/2029 |
20 | Sacramento, CA | O&O | KTXL | FOX | KTXL-D2, D3, D4 | Antenna TV, GRIT, TBD | (5) |
21 | Charlotte, NC | O&O
O&O | WJZY
WMYT | FOX
MNTV | WJZY-D3, D4, D5, D6,
D7, D8 | Charge!, GRIT, ShopLC, ION,
Antenna TV, REWIND TV | 12/1/2028
12/1/2028 |
22 | Raleigh, NC | O&O | WNCN | CBS | WNCN-D2, D3, D4 | REWIND TV, GRIT, Antenna TV | 12/1/2028 |
23 | Portland, OR | O&O
O&O | KOIN
KRCW | CBS
The CW | KOIN-D2, D3
KRCW-D2, D3, D4 | getTV, REWIND TV
Antenna TV, GRIT, ShopLC | (5) |
24 | St. Louis, MO | O&O
O&O | KTVI
KPLR | FOX
The CW | KTVI-D2, D3, D4
KPLR-D2, D3, D4 | Antenna TV, GRIT, ShopLC
Court TV, Comet, REWIND TV | (5)
2/1/2030 |
25 | Indianapolis, IN | O&O
O&O
O&O | WTTV
WTTK
WXIN | CBS
CBS
FOX | WTTV-D2, D3, D4
WTTK-D2, D3
WXIN-D2, D3, D4 | Independent, Comet, TBD
Independent, Cozi TV
Antenna TV, Defy, Charge! | 8/1/2029
8/1/2029
8/1/2029 |
26 | Nashville, TN | O&O | WKRN | ABC | WKRN-D2, D3, D4 | ION Mystery, Defy, REWIND TV | 8/1/2029 |
28 | Salt Lake City, UT | O&O
O&O | KTVX
KUCW | ABC
The CW | KTVX-D2, D3, D4
KUCW-D2, D3, D4 | MeTV, REWIND TV, Outlaw
ION Mystery, Defy, ShopLC | (5) |
30 | San Diego, CA | O&O
O&O | KSWB
KUSI | FOX
Independent | KSWB-D2, D3, D4
KUSI-D2 | Antenna TV, Court TV, ION
REWIND TV | (5)
12/1/2030 |
32 | New Haven, CT | O&O
O&O | WTNH
WCTX(4) | ABC
MNTV | WTNH-D2
WCTX-D2 | REWIND TV
Charge! | (5) |
33 | Kansas City, MO | O&O | WDAF | FOX | WDAF-D2, D3, D4 | Antenna TV, REWIND TV, TBD | (5) |
34 | Austin, TX | O&O
O&O
LSA | KXAN
KBVO
KNVA | NBC
MNTV
The CW | KXAN-D2, D3, D4, D5
KBVO-D2, D3, D4
KNVA-D2, D3, D4 | Cozi TV, ION, REWIND TV, ION Plus
Bounce, Antenna TV, Defy
GRIT, Laff, Court TV | (5)
(5)
8/1/2030 |
35 | Columbus, OH | O&O | WCMH | NBC | WCMH-D2, D3, D4 | GRIT, ION, Laff | 10/1/2029 |
36 | Spartanburg, SC | O&O
O&O | WSPA
WYCW(4) | CBS
The CW | WSPA-D3
WYCW-D3 | ION
REWIND TV | 12/1/2028
12/1/2028 |
40 | Las Vegas, NV | O&O | KLAS | CBS | KLAS-D2, D3, D4 | Antenna TV, REWIND TV, ShopLC | (5) |
42 | Harrisburg, PA | O&O | WHTM | ABC | WHTM-D2, D3, D4, D5 | ION, GRIT, Laff, WLYH | (5) |
43 | Grand Rapids, MI | O&O
O&O
O&O | WOOD
WOTV | NBC
ABC | WOOD-D2, D3
WOTV-D2, D3, D4
WXSP-CD, D2, D3 | REWIND TV, Defy
The CW, Charge!, DABL
MNTV, The Nest, Comet | 10/1/2029
10/1/2029
10/1/2029 |
44 | Portsmouth, VA | O&O
O&O | WAVY
WVBT | NBC
FOX | WAVY-D2, D3, D4
WVBT-D2, D3, D4 | The Nest, getTV, Defy
The CW, REWIND TV, Cozi TV | 10/1/2028
10/1/2028 |
45 | Birmingham, AL | O&O | WIAT | CBS | WIAT-D2, D3, D4 | ION Mystery, GRIT, ION Plus | 4/1/2029 |
46 | Greensboro, NC | O&O | WGHP | FOX | WGHP-D2, D3, D4 | Antenna TV, GRIT, Defy | 12/1/2028 |
47 | Oklahoma City, OK | O&O
O&O | KFOR
KAUT | NBC
The CW | KFOR-D2, D3, D4
KAUT-D2, D3, D4 | Antenna TV, True Crime, Defy
REWIND TV, ION Mystery, Cozi TV | (5) |
48 | Albuquerque, NM | O&O
O&O
O&O
LSA
LSA
LSA | KRQE
KREZ
KBIM
KRWB
KWBQ
KASY | CBS
CBS
CBS
The CW
The CW
MNTV | KRQE-D2, D3
KREZ-D2
KBIM-D2
KRWB-D2
KWBQ-D2, D3, D4, D5
KASY-D2, D3, D4, D5 | FOX, Bounce
FOX
FOX
MNTV
GRIT, Laff, ION, REWIND TV
ION Mystery, getTV, Court TV, Antenna TV | (5) |
50 | New Orleans, LA | O&O
O&O | WGNO
WNOL | ABC
The CW | WGNO-D2, D3, D4
WNOL-D2, D3, D4 | Antenna TV, REWIND TV, TBD
GRIT, Comet, Charge! | (5)
6/1/2029 |
51 | Memphis, TN | O&O | WREG | CBS | WREG-D2, D3 | News3, Antenna TV | 8/1/2029 |
52 | Providence, RI | O&O
LSA | WPRI
WNAC | CBS
FOX | WPRI-D2, D3, D4
WNAC-D2, D3, D4 | MNTV, True Crime, Defy
The CW, REWIND TV, Antenna TV | (5) |
54 | Buffalo, NY | O&O
O&O | WIVB(4)
WNLO | CBS
The CW | WIVB-D2
WNLO-D2 | QVC
REWIND TV | (5) |
| | | | | | | |
Market Rank(1) | Market | Status(2) | Full Power
Stations | Primary
Affiliation | Low Power Stations /
Multicast Channels | Other Affiliations | FCC License
Expiration Date |
55 | Fresno, CA | O&O
O&O | KSEE
KGPE | NBC
CBS | KSEE-D2, D3, D4
KGPE-D2, D3, D4 | Bounce, GRIT, REWIND TV
ION Mystery, Antenna TV, Court TV | (5) |
56 | Richmond, VA | O&O | WRIC | ABC | WRIC-D2, D3, D4 | REWIND TV, Cozi TV, Laff | 10/1/2028 |
57 | Mobile, AL | O&O
O&O | WKRG
WFNA | CBS
The CW | WKRG-D2, D3, D4
WFNA-D2, D3, D4 | ION, MeTV, Court TV
Bounce, True Crime, GRIT | 4/1/2029
4/1/2029 |
58 | Little Rock, AR | O&O
O&O
LSA
LSA | KARK
KARZ
KLRT
KASN | NBC
MNTV
FOX
The CW | KARK-D2, D3, D4
KARZ-D2
KLRT-D2
KASN-D2, D3, D4, D5 | Laff, GRIT, Antenna TV
Bounce
ION Mystery
REWIND TV, ION, ION Plus, GRIT | 6/1/2029
6/1/2029
6/1/2029
6/1/2029 |
59 | Wilkes Barre, PA | O&O
LSA | WBRE
WYOU | NBC
CBS | WBRE-D2, D3, D4
WYOU-D2, D3, D4 | Laff, REWIND TV, Defy
ION Mystery, getTV, Cozi TV | (5) |
60 | Knoxville, TN | O&O | WATE | ABC | WATE-D2, D3, D4 | Antenna TV, REWIND TV, Cozi TV | 8/1/2029 |
62 | Albany, NY | O&O
LSA | WTEN
WXXA | ABC
FOX | WTEN-D2, D3, D4
WXXA-D2, D3, D4, D5 | Cozi TV, Antenna TV, ION Mystery
OTB-TV, GRIT, REWIND TV, True Crime | (5) |
63 | Lexington, KY | O&O | WDKY | FOX | WDKY-D2, D3, D4 | REWIND TV, Charge!, Comet | 8/1/2029 |
64 | Dayton, OH | O&O
LSA | WDTN
WBDT(4) | NBC
The CW | WDTN-D2, D3
WBDT-D2 | ION Mystery, ION
Bounce | 10/1/2029
10/1/2029 |
67 | Des Moines, IA | O&O | WHO | NBC | WHO-D2, D3, D4 | REWIND TV, Antenna TV/ACC Network, Iowa’s Weather Channel | 2/1/2030 |
68 | Green Bay, WI | O&O | WFRV | CBS | WFRV-D2, D3, D4 | Bounce, True Crime, REWIND TV | 12/1/2029 |
69 | Honolulu, HI | O&O
O&O
O&O
O&O
O&O
O&O | KHON
KHAW
KAII
KGMD
KGMV
KHII | FOX
FOX
FOX
MNTV
MNTV
MNTV | KHON-D2, D3, D4
KHAW-D2, D3, D4
KAII-D2, D3, D4 | The CW, GRIT, REWIND TV
The CW, GRIT, REWIND TV
The CW, GRIT, REWIND TV | (5) |
70 | Roanoke, VA | O&O
O&O | WFXR
WWCW | FOX
The CW | WFXR-D2, D3, D4
WWCW-D2, D3, D4 | The CW, Bounce, Antenna TV
FOX, REWIND TV, GRIT | 10/1/2028
10/1/2028 |
71 | Wichita, KS | O&O
O&O
O&O
O&O
O&O | KSNW
KSNC
KSNG
KSNK | NBC
NBC
NBC
NBC | KSNW-D2, D3, D4
KSNG-D2
KSNL-LD | Telemundo, ION, True Crime
Telemundo
NBC | 6/1/2030
(5)
(5)
(5)
(5) |
74 | Springfield, MO | O&O
O&O
LSA | KRBK
KOZL
KOLR | FOX
MNTV
CBS | KRBK-D2, D3, D4
KOZL-D2, D3, D4
KOLR-D2, D3, D4 | Antenna TV, Dabl, ION
ION Mystery, Bounce, REWIND TV
Laff, GRIT, Defy | (5)
2/1/2030
2/1/2030 |
75 | Huntsville, AL | O&O
O&O | WHNT
WHDF | CBS
The CW | WHNT-D2, D3
WHDF-D2, D3, D4 | The CW, Antenna TV
Court TV, REWIND TV, Charge! | 4/1/2029
4/1/2029 |
79 | Rochester, NY | O&O | WROC | CBS | WROC-D2, D3, D4 | Bounce, GRIT, ION Mystery | (5) |
80 | Brownsville, TX | O&O
O&O | KVEO
KGBT | NBC
MNTV | KVEO-D2
KGBT-D2, D3, D4, D5, D6 | CBS
REWIND TV, Comet, Estrella, ION Mystery, GRIT | 8/1/2030
(5) |
82 | Charleston, WV | O&O | WOWK | CBS | WOWK-D2, D3, D4 | ION Mystery, GRIT, REWIND TV | 10/1/2028 |
83 | Waco-Bryan, TX | O&O
O&O | KWKT
KYLE | FOX
MNTV | KWKT-D2, D3, D4
KYLE-D2, D3, D4 | MNTV, Antenna TV, Bounce
FOX, Antenna TV, Laff | (5) |
84 | Savannah, GA | O&O | WSAV | NBC | WSAV-D2, D3, D4 | The CW, Court TV/MNTV, Laff | (5) |
85 | Charleston, SC | O&O | WCBD | NBC | WCBD-D2, D3, D4 | The CW, ION, Laff | 12/1/2028 |
87 | Colorado Springs, CO | O&O
O&O | KXRM | FOX | KXRM-D2, D3, D4
KXTU-LD, D2, D3, D4 | The CW, ION, ION Mystery
The CW, Bounce, Laff, Antenna TV | (5) |
88 | Syracuse, NY | O&O | WSYR | ABC | WSYR-D2, D3, D4 | Antenna TV, Bounce, Laff | (5) |
89 | El Paso, TX | O&O | KTSM | NBC | KTSM-D2, D3, D4 | Estrella, ION Mystery, Laff | (5) |
91 | Shreveport, LA | O&O
O&O
LSA | KTAL
KSHV
KMSS | NBC
MNTV
FOX | KTAL-D2, D3, D4
KSHV-D2, D3, D4
KMSS-D2 | Laff, Cozi TV, HSN
ION Mystery, ION, Quest
REWIND TV | (5)
6/1/2029
6/1/2029 |
92 | Champaign, IL | O&O
O&O | WCIA
WCIX | CBS
MNTV | WCIA-D2, D3, D4
WCIX-D2, D3, D4 | MNTV, Bounce, GRIT
CBS, ION Mystery, Laff | (5)
12/1/2029 |
93 | Burlington, VT | O&O
LSA | WFFF
WVNY | FOX
ABC | WFFF-D2, D3,D4
WVNY-D2, D3, D4 | ION Mystery, Bounce, Antenna TV
Laff, GRIT, Quest | (5) |
95 | Baton Rouge, LA | O&O
O&O
O&O
LSA | WGMB
WVLA | FOX
NBC | WGMB-D2, D3
WBRL-CD
KZUP-CD
WVLA-D2, D3, D4 | The CW, Cozi TV
The CW
Independent
Laff, ION, Antenna TV | 6/1/2029
(5)
6/1/2029
6/1/2029 |
96 | Fayetteville, AR | O&O
O&O
O&O | KFTA
KNWA
KXNW | FOX
NBC
MNTV | KFTA-D2, D3, D4, D5
KNWA-D2, D3, D4
KXNW-D2, D3, D4 | NBC, ION Mystery, Court TV, MNTV
FOX, Laff, GRIT
REWIND TV, Comet, Bounce | (5)
(5)
6/1/2029 |
97 | Myrtle Beach-Florence, SC | O&O | WBTW | CBS | WBTW-D2, D3, D4 | MNTV/Antenna TV, ION, ION Mystery | 12/1/2028 |
99 | Jackson, MS | O&O | WJTV | CBS | WJTV-D2, D3, D4 | The CW, ION, Court TV | 6/1/2029 |
101 | Tri-Cities, TN-VA | O&O | WJHL | CBS | WJHL-D2, D3 | ABC, Antenna TV | 8/1/2029 |
102 | Greenville, NC | O&O | WNCT | CBS | WNCT-D2, D3, D4 | The CW, REWIND TV, ION Mystery | 12/1/2028 |
| | | | | | | |
Market Rank(1) | Market | Status(2) | Full Power
Stations | Primary
Affiliation | Low Power Stations /
Multicast Channels | Other Affiliations | FCC License
Expiration Date |
104 | Quad Cities, IL | O&O
O&O
LSA | WHBF
KGCW
KLJB | CBS
The CW
FOX | WHBF-D2, D3, D4
KGCW-D2, D3, D4
KLJB-D2, D3, D4 | Court TV, GRIT, ION Mystery
REWIND TV, Laff, CBS
MeTV, Defy, Bounce | 12/1/2029
2/1/2030
(5) |
106 | Tyler-Longview, TX | O&O
O&O
LSA | KETK
KFXK | NBC
FOX | KETK-D2, D3, D4
KTPN-LD
KFXK-D2, D3, D4 | GRIT, ION, Antenna TV
MNTV
MNTV, ION Mystery, Laff | (5)
8/1/2030 |
108 | Augusta, GA | O&O | WJBF | ABC | WJBF-D2, D3, D4 | MeTV, The CW, ION | 4/1/2029 |
109 | Evansville, IN | O&O
LSA | WEHT
WTVW | ABC
The CW | WEHT-D2, D3, D4
WTVW-D2, D3, D4 | Laff, Cozi TV, REWIND TV
Bounce, ION Mystery, ION | 8/1/2029
8/1/2029 |
110 | Ft. Wayne, IN | O&O | WANE | CBS | WANE-D2, D3, D4 | ION, Laff, ION Mystery | 8/1/2029 |
111 | Sioux Falls, SD | O&O
O&O
O&O | KELO
KDLO
KPLO | CBS
CBS
CBS | KELO-D2, D3, D4
KDLO-D2, D4
KPLO-D2 | MNTV, ION, The CW
MNTV, The CW
MNTV | 4/1/2030
(5)
4/1/2030 |
112 | Altoona, PA | O&O | WTAJ | CBS | WTAJ-D2, D3, D4 | ION Mystery, Laff, GRIT | (5) |
115 | Springfield, MA | O&O | WWLP | NBC | WWLP-D2, D3, D4 | The CW, ION, ION Mystery | (5) |
117 | Lansing, MI | O&O
LSA | WLNS(4)
WLAJ | CBS
ABC | WLAJ-D2 | The CW | 10/1/2029
10/1/2029 |
118 | Youngstown, OH | O&O
O&O
LSA | WKBN(4)
WYTV | CBS
ABC | WKBN-D2
WYFX-LD, D2, D3, D4, D5, D6
WYTV- D2 | FOX
FOX, MNTV, ION, Bounce, Laff, Antenna TV
MNTV | 10/1/2029
10/1/2029
10/1/2029 |
122 | Peoria, IL | O&O
LSA | WMBD
WYZZ | CBS
FOX | WMBD-D2, D3, D4 | Bounce, Laff, ION Mystery | 12/1/2029
(5) |
124 | Lafayette, LA | O&O | KLFY | CBS | KLFY-D2, D3, D4 | The CW, ION, ION Mystery | 6/1/2029 |
125 | Bakersfield, CA | O&O
O&O | KGET | NBC | KGET-D2, D3, D4
KKEY-LP | The CW, Telemundo, Laff
Telemundo | (5) |
127 | Columbus, GA | O&O | WRBL | CBS | WRBL-D2, D3, D4 | REWIND TV, ION, Laff | 4/1/2029 |
129 | La Crosse, WI | O&O
O&O | WLAX
WEUX | FOX
FOX | WLAX-D2, D3, D4
WEUX-D2, D3, D4 | Antenna TV, Laff, GRIT
Antenna TV, ION Mystery, Bounce | 12/1/2029
12/1/2029 |
132 | Amarillo, TX | O&O
O&O
LSA | KAMR
KCIT | NBC
FOX | KAMR-D2, D3, D4
KCPN-LP-D2
KCIT-D2, D3, D4 | MNTV, Laff, Antenna TV
MNTV, REWIND TV
GRIT, ION Mystery, Bounce | (5) |
137 | Rockford, IL | O&O
LSA | WQRF
WTVO | FOX
ABC | WQRF-D2, D3, D4
WTVO-D2, D3, D4 | Bounce, ION Mystery, REWIND TV
MNTV, Laff, GRIT | 12/1/2029
12/1/2029 |
140 | Lubbock, TX | O&O
LSA | KLBK
KAMC | CBS
ABC | KLBK-D2, D3, D4
KAMC-D2, D3, D4 | Court TV, Antenna TV, REWIND TV
ION Mystery, Bounce, QVC2 | 8/1/2030
(5) |
141 | Topeka, KS | O&O
O&O
LSA | KSNT
KTKA | NBC
ABC | KSNT-D2, D3, D4
KTMJ-CD, D2, D3, D4
KTKA-D2, D3, D4 | FOX, ION, Bounce
FOX, ION Mystery, GRIT, Laff
REWIND TV, The CW, Antenna TV | 6/1/2030
(5)
6/1/2030 |
142 | Monroe, LA | O&O
LSA | KARD
KTVE | FOX
NBC | KARD-D2, D3, D4
KTVE-D2, D3, D4 | The CW, GRIT, Antenna TV
FOX, Laff, ION Mystery | 6/1/2029
6/1/2029 |
144 | Midland, TX | O&O
LSA | KMID
KPEJ | ABC
FOX | KMID-D2, D3, D4
KPEJ-D2, D3, D4 | Laff, ION Mystery, GRIT
Estrella, REWIND TV, Antenna TV | 8/1/2030
(5) |
147 | Minot-Bismarck, ND | O&O
O&O
O&O
O&O | KXMB
KXMC
KXMD
KXMA | CBS
CBS
CBS
The CW | KXMB-D2, D3, D4
KXMC-D2, D3, D4
KXMD-D2, D3, D4
KXMA-D2, D3, D4 | The CW, Laff, ION Mystery
The CW, Laff, ION Mystery
The CW, Laff, ION Mystery
CBS, Laff, ION Mystery | 4/1/2030
4/1/2030
4/1/2030
(5) |
148 | Panama City, FL | O&O | WMBB | ABC | WMBB-D2, D3, D4 | The CW, Laff, ION Mystery | 2/1/2029 |
149 | Sioux City, IA | O&O | KCAU | ABC | KCAU-D2, D3, D4 | ION Mystery, Laff, Bounce | 2/1/2030 |
150 | Wichita Falls, TX | O&O
O&O
LSA | KFDX
KJTL | NBC
FOX | KFDX-D2, D3, D4
KJBO-LP
KJTL-D2, D3, D4 | MNTV, The CW, Antenna TV
MNTV
GRIT, Bounce, ION Mystery | (5) |
151 | Joplin, MO | O&O
LSA | KSNF
KODE | NBC
ABC | KSNF-D2, D3, D4
KODE-D2, D3, D4 | Laff, ION Mystery, Antenna TV
GRIT, Bounce, ION | 2/1/2030
2/1/2030 |
154 | Erie, PA | O&O
LSA | WJET
WFXP | ABC
FOX | WJET-D2, D3, D4
WFXP-D2, D3, D4 | Laff, ION Mystery, Cozi TV
GRIT, Bounce, Antenna TV | (5) |
159 | Terre Haute, IN | O&O
LSA | WTWO
WAWV | NBC
ABC | WTWO-D2, D3, D4
WAWV-D2, D3, D4 | The CW, Laff, Antenna TV
GRIT, Bounce, REWIND TV | 8/1/2029
8/1/2029 |
162 | Binghamton, NY | O&O
O&O | WIVT | ABC | WIVT-D2, D3, D4
WBGH-CD, D2 | NBC, Laff, ION Mystery
NBC, ABC | (5) |
163 | Wheeling, WV | O&O | WTRF | CBS | WTRF-D2, D3, D4 | MNTV, ABC, ION Mystery | 10/1/2028 |
165 | Billings, MT | O&O
LSA | KSVI
KHMT | ABC
FOX | KSVI-D2, D3, D4
KHMT-D2, D3, D4 | The CW, ION Mystery, Antenna TV
Court TV, Laff, ION | 4/1/2030
(5) |
166 | Abilene, TX | O&O
LSA | KTAB
KRBC | CBS
NBC | KTAB-D2, D3, D4
KRBC-D2, D3, D4 | Telemundo, ION Mystery, ION
GRIT, Laff, Bounce | (5) |
167 | Beckley, WV | O&O | WVNS | CBS | WVNS-D2 | FOX | 10/1/2028 |
168 | Hattiesburg, MS | O&O | WHLT | CBS | WHLT-D2, D3, D4 | The CW, ION, ION Mystery | 6/1/2029 |
169 | Rapid City, SD | O&O | KCLO | CBS | KCLO-D2, D3, D4 | The CW, ION, ION Mystery | (5) |
170 | Dothan, AL | O&O | WDHN | ABC | WDHN-D2, D3, D4 | ION Mystery, Laff, Antenna TV | 4/1/2029 |
| | | | | | | |
Market Rank(1) | Market | Status(2) | Full Power
Stations | Primary
Affiliation | Low Power Stations /
Multicast Channels | Other Affiliations | FCC License
Expiration Date |
171 | Utica, NY | O&O
O&O
LSA | WFXV
WUTR | FOX
ABC | WFXV-D2, D3, D4
WPNY-LP
WUTR-D2, D3, D4 | The CW, ION Mystery, Laff
MNTV
MNTV, GRIT, Bounce | (5) |
172 | Clarksburg, WV | O&O | WBOY | NBC | WBOY-D2, D3, D4 | ABC, ION Mystery, Laff | 10/1/2028 |
174 | Jackson, TN | O&O | WJKT | FOX | WJKT-D2, D3, D4 | ION Mystery, Laff, GRIT | 8/1/2029 |
178 | Elmira, NY | O&O | WETM | NBC | WETM-D2, D3, D4 | Antenna TV, Laff, ION Mystery | (5) |
179 | Watertown, NY | O&O | WWTI | ABC | WWTI-D2, D3, D4 | The CW, Laff, ION Mystery | (5) |
183 | Alexandria, LA | O&O | WNTZ | FOX | WNTZ-D2, D3, D4 | Bounce, ION Mystery, Laff | 6/1/2029 |
187 | Grand Junction, CO | O&O
O&O
O&O
LSA | KREX
KREY
KFQX | CBS
CBS
FOX | KREX-D2, D3, D4
KREY-D2, D3, D4
KGJT-CD
KFQX-D2, D3, D4 | Laff, MNTV, Bounce
FOX, ION Mystery, GRIT
MNTV
CBS, ION Mystery, GRIT | 4/1/2030
4/1/2030
4/1/2030
(5) |
197 | San Angelo, TX | O&O
LSA | KLST
KSAN | CBS
NBC | KLST-D2, D3, D4
KSAN-D2, D3, D4 | ION Mystery, GRIT, Antenna TV
Laff, Bounce, ION | (5)
(5) |
(1)Market rank refers to ranking the size of the DMA in which the station is located in relation to other DMAs. Source: 2024-2025 Nielsen Local Television Market Universe Estimates, as published by The Nielsen Company
(2)O&O refers to stations that we own and operate. LSA, or local service agreement, is the general term we use to refer to a contract under which we provide services utilizing our employees to a station owned and operated by an independent third-party. Local service agreements include TBAs, SSAs, JSAs, LMAs and outsourcing agreements. For further information regarding the LSAs to which we are a party, see Note 2 to our Consolidated Financial Statements in Part IV, Item 15(a) of this Annual Report on Form 10-K.
(3)WDVM serves the Hagerstown, MD, sub-market within the Washington, D.C. DMA.
(4)These stations are operating under channel sharing arrangements with another Company station in the same market.
(5)Application for renewal of license was submitted timely to the FCC. Under the FCC’s rules, the license expiration date is automatically extended pending FCC review of and action on the renewal application.
Network Affiliations
All, except three, of the full power television stations that we own and operate, program or provide sales and other services to are currently affiliated with a network pursuant to an affiliation agreement. The agreements with CBS, FOX, NBC, ABC, and The CW are the most significant to our operations. The current terms of these agreements expire as discussed below:
| | |
Network Affiliation | | Expiration Date |
The CW | | Of the 29 agreements, 28 expire in August 2025 and one(1)expires in December 2026. |
MNTV | | 14 agreements expire in August 2025. |
CBS | | 49 agreements expire in July 2026. |
ABC | | 29 agreements expire in December 2026. |
NBC | | 35 agreements expire in December 2027. |
FOX | | Of the 42 agreements, 41 expire in August 2026 and one(1)expires in December 2027. |
(1)These affiliation agreements are owned by stations to which we provide sales and other services. We do not consolidate these stations in our financial statements due to lack of a deemed controlling financial interest under U.S. GAAP.
Each affiliation agreement provides the affiliated station with the right to broadcast all programs transmitted by the network with which it is affiliated. In exchange, the network receives affiliation fees from us and has the right to sell a substantial majority of the advertising time during these broadcasts. We expect the network affiliation agreements listed above to be renewed upon expiration.
Networks
We own, operate or have an ownership interest in the following:
| | | | | | |
Network / Entity | Network
Type | Description | % Owned by
Nexstar | U.S. TV
Households Reached (1)
(in millions) | % of
U.S. TV Households (1) (Broadcast) | % of
Multi-channel Households (1) (Pay TV) |
The CW Network | Broadcast | Fifth major broadcast network in the U.S. | 77.1% | 126 | 100% | -- |
NewsNation | Pay TV | National cable news network | 100% | 64 | -- | 92% |
Antenna TV | Broadcast | Multicast entertainment network | 100% | 126 | 100% | -- |
REWIND TV | Broadcast | Multicast entertainment network | 100% | 69(2) | 55%(2) | -- |
TV Food Network | Pay TV | Food Network and Cooking Channel | 31.3% | 64 and 28 | -- | 92% and 40% |
(1)Source: Nielsen, December 2024
(2)Source: Internal estimates
The CW. The CW is America’s fifth major broadcast network and is available to 100% of U.S. television households. The CW delivers 15 hours of primetime entertainment programming and three hours of children’s programming per week in addition to almost 400 hours of sports per year as the broadcast home to ACC football and basketball games, WWE NXT and NASCAR Xfinity Series. For its smaller market affiliates, CWPlus supplements The CW programming with additional syndicated content to provide 24 hours of programming, seven days per week. The fully ad-supported CW App, with more than 100 million downloads to date, is available for free to consumers on all major platforms and is home to the latest episodes and seasons of The CW’s primetime programming and a library of entertaining film and television content for on-demand viewing.
NewsNation. NewsNation is a national news network reaching approximately 64 million television households across the United States providing “News for All Americans.” Validated by independent watchdog groups, the network delivers engaging and unbiased news, reflecting the full range of perspectives across the country. NewsNation draws upon on the expertise of approximately 6,000 journalists from 109 newsrooms across the country and its own dedicated national staff. NewsNation is fully distributed on every pay television platform in the United States, online at www.newsnationnow.com, and on the NewsNationNow mobile app.
Antenna TV and REWIND TV. Antenna TV and REWIND TV are multicast networks reaching 100% and over 50% of U.S. television households, respectively. The networks primarily air sitcom hits from the 1950s through the 1990s.
TV Food Network. We hold a 31.3% interest in TV Food Network, which annually distributes significant cash flow to us. TV Food Network operates two 24-hour television networks, Food Network and Cooking Channel, offering quality television, video, internet and mobile entertainment and information focusing on food and entertaining. During 2024, we received cash distributions from TV Food Network totaling $154 million. Our partner in TV Food Network is Warner Bros. Discovery, Inc., which owns a 68.7% interest in TV Food Network and operates the networks on behalf of the partnership.
Digital Assets
Our digital businesses include video and display advertising platforms that are delivered locally or nationally through our own and various third-party websites, mobile and OTT applications, other digital media solutions to media publishers and advertisers and a consumer product reviews platform. Our digital assets include 138 websites and 229 mobile applications across our local stations, NewsNation and The Hill. The portfolio also includes eight connected television applications and three free ad-supported television (“FAST”) channels from The CW and The Hill.
The Hill. The Hill is the nation’s leading digital-first political news brand and the definitive source for non-partisan political news and information. Inside the Beltway is known as an essential, agenda-setting read for lawmakers and influencers. Beyond the Capitol, millions of Americans turn to The Hill to decode how events in Washington will impact their communities and lives.
BestReviews. BestReviews is a leading consumer product recommendations company which simplifies the way consumers buy products and services across thousands of categories by independently researching, analyzing, and testing products and recommending the best picks. BestReviews monetizes its content through a revenue share model with its retail partners against all sales generated by BestReviews.
Operating Model
Our primary sources of revenue include contractual distribution revenue from retransmission consent and carriage agreements with MVPDs, such as cable and satellite providers, and vMVPDs, companies that provide video content through internet streaming either directly or via our network affiliation partners, as well as affiliation fees from local affiliates of The CW; the sale of commercial air time on our owned and operated television stations to local advertisers; the sale of commercial airtime by the stations and by our broadcast and cable networks to national advertisers; the sale of advertising on the stations’ websites, on our other owned or third party websites, and through mobile and OTT applications and other digital advertising solutions.
Our primary operating expenses include third-party programming, news programming, production and promotion, sales, digital cost of goods sold and content creation costs, and other administrative and corporate expenses. The largest contributor to news programming and other expenses are employee-related expenses. A large percentage of the costs involved in our operations is relatively fixed.
We seek to grow our revenue, net income, EBITDA and cash flow by continuing to provide high quality programming that attracts and engages audiences as our reach and consumer engagement are important to our distribution partners and advertisers. We use our industry-leading scale to assist us in securing distribution revenue streams, to provide advertisers with solutions across geographies and media types to engage both local and national audiences at scale and to leverage costs against a broader platform. In addition, we plan to continue to acquire or invest in businesses that can benefit from our scale, asset mix and record of management and cost discipline.
Distribution
We receive compensation from cable, satellite and other MVPDs and vMVPDs (both directly from vMVPDs and indirectly from vMVPDs via our network affiliation partner) in return for our consent to the retransmission of the signals of our television stations and the carriage of NewsNation. Distribution revenues primarily represent payments from the MVPDs and vMVPDs and are typically based on the number of subscribers they have. Our successful negotiations related to these distribution agreements produce meaningful recurring revenue streams. We also generate distribution revenues from programmers who use our spectrum in selected local markets to air their content on our multicast streams.
Advertising
Our advertising revenue is primarily derived from the sale of local and national advertising on our stations, networks, websites, apps and other digital platforms or via third party media.
Advertising revenue is positively affected by a strong economy. Conversely, declines in advertising budgets of advertisers, particularly in recessionary periods, adversely affect the broadcast industry and, as a result, may contribute to a decrease in our advertising revenue. In even-numbered years we generate substantial advertising revenue from the political advertising we sell to candidates, political action committees and political parties. Advertising revenue is also positively affected by certain events such as the Olympic Games or the Super Bowl. Advertising revenue is generally highest in the second and fourth quarters of each year, due in part to increases in consumer advertising in the spring and retail advertising in the period leading up to, and including, the holiday season.
Local advertising is sold by each station’s local sales staff who call upon advertising agencies and local businesses. Compared to revenue from national advertising accounts, revenue from local advertising is generally more stable and predictable. In 2023, national and political advertising was sold through third party national sales representative firms which call upon advertising agencies. Beginning in January 2024, our national advertising is sold through our national sales division. We continue to sell our political advertising inventory through third party national sales representative firms. Digital advertising that is not sold through our local and national sales teams is typically sold via programmatic exchanges.
Competition
Competition in the television industry takes place on several levels: competition for audience, competition for programming and competition for advertising.
Audience. We compete for audience based on program popularity. The popularity of our programming has an effect on the rates we can secure from our distributors and a direct effect on the advertising rates we can charge our advertisers. We compete against other broadcast television programming, cable and satellite television programming as well as the direct-to-consumer programming provided via a variety of streaming services, including some of the broadcast television networks with which our stations are affiliated. Other sources of competition for audience include the internet, gaming devices, home entertainment systems and video-on-demand. The CW, our broadcast television network, competes with other broadcast networks and other video programming for viewers and NewsNation, our national news network, competes with other national news networks such as FOX News, CNN, MSNBC and Newsmax for viewers.
Programming. Our local television stations compete for syndicated programming from national program distributors or syndicators and compete to secure broadcast rights for regional and local sporting events. We compete against in-market broadcast station operators, cable networks and streaming services for exclusive access to this programming in our markets. In a different way, our local stations also compete with other stations in their markets to provide exclusive news stories and unique features such as investigative reporting and coverage of community events to their local audiences. The CW competes against other broadcast television and cable networks as well as other video providers, such as direct-to-consumer streaming platforms for television content. NewsNation competes against other cable news networks for talent and stories.
Advertising. Our stations compete for advertising revenue with other television stations in their respective markets and other advertising media such as streaming video services (e.g. Netflix, Amazon Prime Video, Roku, YouTube, etc.), online media (e.g., Google, Meta, Tiktok, Snapchat, etc.), vMVPDs, MVPDs, radio stations, newspapers, outdoor advertising, and direct mail, among others. Competition for advertising dollars in the broadcasting industry occurs primarily within individual markets. Generally, a television broadcast station in a particular market does not compete with stations in other market areas. The CW also competes for advertising revenue with other broadcast networks and other distribution technologies. NewsNation also competes for advertising revenue with other advertising media and with other national news networks such as FOX News, CNN, MSNBC and Newsmax.
Federal Regulation
Television broadcasting is subject to the jurisdiction of the FCC under the Communications Act of 1934, as amended (the “Communications Act”). The following is a brief discussion of certain provisions of the Communications Act and the FCC’s regulations and policies that affect our operations. These rules are subject to change, which may affect our operations.
FCC Licenses, Renewals and Transfers
License Grant and Renewal. The Communications Act requires broadcast stations to operate under licenses issued by the FCC. Television broadcast licenses are granted for a maximum term of eight years and may be renewed upon application to the FCC. The FCC grants an application for license renewal if the station served the public interest, the licensee did not commit any serious violations of the Communications Act or the FCC’s rules and the licensee committed no other violations which, taken together, would constitute a pattern of abuse. A majority of renewal applications are routinely granted under this standard. We consistently have received license renewal approvals in the past and are permitted to continue operations when renewal is delayed; however, there are no assurances that this will be the case in the future.
Station Transfer. The Communications Act prohibits the assignment or the transfer of control of a broadcast station’s FCC license without prior FCC approval.
Foreign Ownership Restrictions
The Communications Act limits the extent of non-U.S. ownership of companies that own U.S. broadcast stations, generally prohibiting more than 20% non-U.S. ownership (by vote and by equity) in a U.S. broadcast licensee and more than 25% indirect foreign ownership or control of such licensee through a parent company. The FCC will entertain and may authorize, on a case-by-case basis, proposals to exceed the 25% indirect foreign ownership limit in broadcast licensees.
Multiple Ownership Rules
The FCC’s multiple ownership rules restrict the number of television stations in which a single person or entity may have an “attributable interest.”
Ownership Attribution. For purposes of determining compliance with the multiple ownership rules, the FCC considers the “attributable interests” in a broadcast station licensee held by an individual or entity. The following are considered “attributable interests”: (i) for corporations, officer-ship, directorship and voting stock interests of 5% or more (20% or more in the case of certain passive investors), (ii) for partnerships and limited liability companies, any general partnership interest, and any limited partnership interest or limited liability company interest that is not properly “insulated” from involvement in the partnership’s media activities and (iii) more than 33% of a licensee’s total assets (defined as total debt plus total equity), if the holder of such interest also provides over 15% of the station’s total weekly broadcast programming or has an attributable interest in another media entity in the same market which is subject to the FCC’s ownership rules. If a shareholder of Nexstar holds a voting stock interest of 5% or more (20% or more in the case of certain passive investors), we must report that shareholder, its parent entities, and attributable individuals and entities of both, as attributable interest holders in Nexstar.
Local Television Multiple Ownership (Duopoly) Rule. Under the local television multiple ownership, or “duopoly,” rule, a single entity is allowed to own or have attributable interests in two television stations in a DMA if (i) the two stations do not have overlapping service areas, or (ii) at least one of the two stations is not ranked among the top four stations in the DMA in terms of audience share (subject to certain exceptions based on a case-by-case determination). The duopoly rule also allows the FCC to consider waivers to permit the ownership of a second station, where otherwise prohibited, where the second station has failed or is failing or unbuilt.
In certain markets, the Company owns and operates both full-power and low-power television (“LPTV”) broadcast stations. The FCC’s rules and policies regarding ownership of television stations in the same market and nationally generally apply only to full-power television stations. In 2023, the FCC extended the duopoly rule to prohibit, in certain circumstances, the acquisition of a network affiliation that would establish a “top four” combination involving a network-affiliated LPTV station or digital multicast stream.
National Television Multiple Ownership Rule. The FCC’s rules limit the percentage of U.S. television households which a party may reach through its attributable interests in television stations to 39%. When calculating a party’s nationwide aggregate audience coverage, the ownership of a UHF station is counted as 50% of a market’s percentage of total national audience. In December 2017, the FCC initiated a proceeding to broadly reexamine its national television ownership rule and the proceeding remains open.
Local Service Agreements. The FCC applies the local television ownership limits to a non-owned station when the owner of a station in the same market provides more than 15% of the second station’s weekly broadcast programming. However, local marketing agreements entered into prior to November 5, 1996 (“grandfathered LMAs”) are exempt from this attribution rule until the FCC determines otherwise. This “grandfathering” is subject to possible extension or termination in a future FCC review. Nexstar is currently a party to certain grandfathered LMAs.
Under current FCC rules, JSAs and SSAs between independently owned television stations that do not involve the provision of programming exceeding the 15% threshold noted above are non-attributable but must be publicly disclosed, and the FCC may in the future consider regulations with respect to such agreements. Nexstar is currently a party to certain JSA and SSA agreements whereby it provides services to independently owned stations.
Quadrennial Review of Media Ownership Rules. The FCC is required to review its media ownership rules every four years and to eliminate those rules it finds are no longer “necessary in the public interest as a result of competition.” In December 2023, the FCC issued an order concluding its 2018 quadrennial review. The order retained the local television ownership rule without deregulatory changes while extending the rule to prohibit, in certain circumstances, the acquisition of a network affiliation that would establish a “top four” combination involving a network affiliated LPTV station or digital multicast stream. The FCC’s 2018 quadrennial review order is under appeal, and in addition, the 2022 quadrennial review is currently pending. Thus, the media ownership rules may be subject to change in response to current or future quadrennial reviews or other proceedings.
Distribution by MVPDs and vMVPDs
MVPD Carriage of Local Television Signals. Broadcasters may obtain carriage of their television stations’ signals on cable, satellite and other MVPDs through either mandatory carriage or through “retransmission consent.” Every three years all stations must formally elect either mandatory carriage (“must-carry” for cable distributors and “carry one-carry all” for satellite television providers) or retransmission consent. The next election must be made by October 1, 2026 and will be effective January 1, 2027. Mandatory carriage elections require that the MVPD carry one station programming stream and related data in the station’s local market, subject to limited exceptions. MVPDs do not pay a fee to stations that elect mandatory carriage. We and our partners have elected “retransmission consent” for all of our stations.
A broadcaster, like Nexstar, that elects retransmission consent waives its mandatory carriage rights, and the broadcaster and the MVPD must negotiate terms for carriage of the station’s signal. If a broadcaster elects to negotiate retransmission terms, it is possible that the broadcaster and the MVPD will not reach agreement and that the MVPD will not carry the station’s signal. Pursuant to the FCC rules and federal statutory law all broadcasters and MVPDs must conduct retransmission consent negotiations in “good faith,” and a broadcaster may not undertake such negotiations for third parties including VIEs in markets where that broadcaster also owns a television station. MVPDs and broadcasters may file FCC complaints against each other for violations of the good faith negotiation rules, and such complaints have been filed against Nexstar in the past. We cannot predict the impact that any such complaints may have on our operations.
MVPDs have actively sought to change the regulations under which retransmission consent is negotiated before both the U.S. Congress and the FCC in order to increase their bargaining leverage with television stations, and there are still-open FCC proceedings to review these regulations.
Certain vMVPDs stream broadcast programming over the internet. In December 2014, the FCC issued a Notice of Proposed Rulemaking proposing to interpret the term “MVPD” to encompass vMVPDs that make available for purchase multiple streams of video programming distributed at a prescheduled time and seeking comment on the effects of applying MVPD rules to such vMVPDs. The proceeding remains open.
Broadcast Transmission Standard (ATSC 3.0)
In November 2017, the FCC adopted rules to permit television broadcasters to voluntarily broadcast using a new broadcast television transmission standard developed by the Advanced Television Systems Committee, Inc., also referred to as “ATSC 3.0” or “NEXTGEN TV.” The ATSC 3.0 standard provides for a more efficient use of spectrum, which could enable us to provide additional services to consumers and businesses, including additional content, interactive television, signal encryption and data transmission services. We and our partners have adopted the ATSC 3.0 technology in their stations covering over 50% of U.S. television households.
Because ATSC 3.0 is not compatible with existing television equipment, the FCC requires the stations which have adopted the ATSC 3.0 technology to continue broadcasting a substantially similar signal in the existing standard until the FCC phases out the requirement. In June 2023, the FCC issued a Third Report and Order and Fourth Further Notice of Proposed Rulemaking that extends the sunset for certain transition requirements from July 2023 to July 2027. In addition, in June 2020, the FCC adopted a Declaratory Ruling and Notice of Proposed Rulemaking declaring that local and national ownership restrictions do not apply to non-video services provided on a broadcaster’s ATSC 3.0 spectrum.
Other FCC Broadcast Regulations and Enforcement
The FCC continues to enforce its regulations concerning indecency, sponsorship identification, political advertising, good faith retransmission consent negotiation, unauthorized assignments and transfers of control, multiple ownership, children’s television, environmental concerns, emergency alerting and information, equal employment opportunity, technical operating matters, antenna tower maintenance, and other matters. The FCC may impose substantial forfeitures or, in extreme cases, revoke licenses if it determines that its rules have been violated.
Human Capital Management
Values. Our key human capital management objectives are to attract, develop, and retain top industry talent that reflects the communities in which we operate and provide services. We encourage every individual’s contribution and personal growth and foster work environments that provide personal pride through job satisfaction and a balanced life. We embrace the communities in which we operate and promote open communications, innovation and creativity.
Engagement and Opportunities. With markets ranging from small to large to national, we offer a broad range of opportunities for every experience level, including for those who are just starting their broadcasting career or are ready to move to a larger market or onto the national stage. Our varied markets allow us to give our employees room to grow and progress in their careers. Our management team supports a culture of developing future leaders from our existing workforce, enabling us to promote from within for many leadership positions. As of December 31, 2024, our voluntary retention rate for employees was approximately 80%.
Compensation and Benefits. We offer our employees a broad range of company-paid benefits and we believe our compensation package and benefits are competitive with others in our industry. Our employee wages are competitive and consistent with employee positions, experience, knowledge and location. Annual wage increases and incentive payments are based on merit and are communicated to employees as a part of the annual review process.
Equal Employment Opportunity. We believe in equal employment opportunities for all. As such, we are committed to complying with state and federal anti-discrimination laws. We encourage a culture of respect, equal opportunity and non-discrimination.
Training and Mentorship. We are committed to developing the talents of our employees and provide our employees workplace training. Our catalog of courses includes harassment prevention, ethics, supervisor/manager skills, and health-related safety. In addition, we have a mentorship program that matches mentors and mentees across the company and provides the pairs with a 12-topic curriculum covering skills such as communications, networking, work/life balance, and goal setting. Selected Nexstar employees also participate in annual training to ensure understanding of antitrust laws and how they apply to Nexstar and media sales training program provided by a third-party vendor.
Safety and Health. We are committed to providing a safe and healthy workplace for our employees. All employees are required to comply with our safety rules and are expected to actively contribute to making our company a safer place to work. Employees must immediately report accidents, injuries, and unsafe equipment, practices or conditions to a supervisor or other designated person. Threats or acts of violence or physical intimidation are prohibited and subject to disciplinary action up to and including termination of employment.
Employees. As of December 31, 2024, we had a total of 13,005 employees, comprised of 11,773 full-time and 1,232 part-time employees. As of December 31, 2024, 1,870 of our employees were covered by collective bargaining agreements. We believe that our employee relations are satisfactory, and we have not experienced any work stoppages at any of our facilities. However, we cannot assure you that our collective bargaining agreements will be renewed in the future, or that we will not experience a prolonged labor dispute, which could have a material adverse effect on our business, financial condition or results of operations.
Community Outreach. We pride ourselves on the opportunities we provide for our employees to give back to their communities. At the local level, our stations are actively involved in over 2,000 community outreach initiatives in 2024. Nexstar and its partner stations work with local community groups to increase awareness, raise money and otherwise assist these local groups with their missions. Stations run promotions and air content related to the initiative and station employees participate in local events. On a companywide basis, Nexstar engages in a variety of initiatives as well, including, among others, partnering with Feeding America, the nation’s largest domestic hunger relief organization by providing air-time and financial support from 2021 – 2023; Project Roadblock, a national multiplatform program aimed at preventing drunk driving, by donating airtime and news coverage to the issue; and Remarkable Women, Nexstar’s own initiative to celebrate local women to inspire, lead and pave the way for other women to succeed, by airing content and contributing to the winners’ charitable organizations of her choice. In addition, since our 20th anniversary in June 2016 (with the exception of 2020), we organized an annual Founder’s Day of Caring, an employee-driven effort focused on local non-profits and charities. Across the country our employees take the day to contribute thousands of hours of community services. In 2024, our Founder’s Day initiatives provided nearly 17,500 hours of service in one day to the communities served by Nexstar TV stations.
Legal Proceedings
From time to time, we are involved in litigation that arises from the ordinary operations of business, such as contractual or employment disputes or other general actions. In the event of an adverse outcome of these proceedings, we believe the resulting liabilities would not have a material adverse effect on our financial condition or results of operations. See Note 11 to our Consolidated Financial Statements included in Part IV, Item 15(a) of this Annual Report on Form 10-K, which is incorporated herein by reference.
Available Information
We file annual, quarterly and current reports, proxy statements and other information with the SEC. The SEC maintains a website that contains reports, proxy and information statements and other information regarding issuers, including us, that file electronically with the SEC. The address for the SEC’s website is http://www.sec.gov. Due to the availability of our filings on the SEC website, we do not currently make available our filings on our internet website. Upon request, we will provide free copies of our annual reports on Form 10-K, quarterly reports on Form 10-Q and any other filings with the SEC. Requests can be sent to Nexstar Media Group, Inc., Attn: Investor Relations, 545 E. John Carpenter Freeway, Suite 700, Irving, TX 75062.
Item 1A. Risk Factors
You should carefully consider the risks described below and all of the information contained in this document. The risks and uncertainties described below are not the only risks and uncertainties that the Company faces. Additional risks and uncertainties not presently known to the Company or that the Company currently deems immaterial may also impair the Company’s business operations. If any of those risks occur, the Company’s business, financial condition and results of operations could suffer. The risks discussed below also include forward-looking statements, and the Company’s actual results may differ substantially from those discussed in these forward-looking statements. See “Cautionary Note Regarding Forward-Looking Statements” for further information.
Summary Risk Factors
Our business is subject to a number of risks, including risks that may prevent us from achieving our business objectives or may adversely affect our business, financial condition, results of operations, cash flows, and prospects. These risks are discussed more fully below and include, but are not limited to:
Risks Related to Our Operations
•Our distribution revenues and operating results may be adversely affected by, among other factors, declining MVPD subscribers and our inability to renew expiring distribution agreements on favorable terms or at all;
•Our station revenues and operating results may be adversely affected if we are unable to renew our network affiliation agreements on favorable terms, or at all;
•Our revenue and operating results may be adversely affected if we are unable to retain our largest customers, which account for a significant percentage of our total revenue, on favorable terms, or at all;
•Our advertising revenue and operating results may be affected by economic downturns, geopolitical events and other factors outside of our control;
•Because a significant percentage of our operating expenses are fixed, a relatively small decrease in revenue could have a significant negative impact on our operating results;
•Our growth may be limited if we are unable to implement an acquisition strategy and our operating results may be adversely affected if we are unable to successfully integrate any future acquisition;
•Our substantial debt and related interest expense could limit our ability to reinvest in the business, make acquisitions and/or return capital to shareholders;
•We may not be able to generate sufficient cash flow to meet our debt service requirements;
•We may be required to cease certain station operations if the FCC denies renewal of any of our station licenses.
•The financial performance of our equity method investments and the performance of third-party services providers, upon which we rely but do not control, could adversely impact our results of operations;
•The loss of the services of our chief executive officer could disrupt management of our business and impair the execution of our business strategies;
•Our operating results could be adversely affected if the owners of the VIEs make decisions regarding the operation of their respective stations that adversely impact their operating results and reduce payments due to us under our local service agreements;
•Future impairment charges could adversely affect our operating results;
•Changes in deferred tax asset assets or valuation allowances as a result of tax law changes could affect our operating results;
•We may face additional tax liabilities stemming from proposed and ongoing tax audits;
•Our pension and postretirement benefit plan obligations may be increased by a declining stock market and lower interest rates;
•Adverse results from litigation or governmental investigations involving us could impact our business practices and operating results;
•Any decrease in our dividend payments or suspension of our dividend payments or stock repurchases could cause our stock price to decline;
•We may face challenges in protecting our intellectual property and defending against infringement claims; and
•Cybersecurity risks could adversely affect our operating effectiveness and operating results.
Risks Related to Our Industry
•Intense competition in the television industry and alternative forms of media could limit our growth and profitability;
•New or changed federal statutes, legislation and regulations or changes in the application of existing regulations could significantly impact our operations or the television broadcasting industry as a whole; and
•We are subject to foreign ownership limitations which limit foreign investments in us.
Risks Related to Our Operations
Our distribution revenues and operating results may be adversely affected by, among other factors, declining MVPD subscribers and our inability to renew expiring distribution agreements on favorable terms or at all.
A significant portion of our revenue comes from its retransmission consent and carriage agreements with MVPDs (mainly cable and satellite television providers) and vMVPDs. These agreements permit the distributors to retransmit our stations’ and our cable and broadcast networks’ signals to their subscribers in exchange for the payment of compensation to us. If we are unable to renegotiate these agreements on favorable terms, or at all, the failure to do so could have an adverse effect on our business, financial condition, and results of operations. In addition, occasionally these negotiations result in a temporary removal of our stations from the distributor’s service, which disruption could have an adverse effect on our operating results.
Though we are typically able to renegotiate our retransmission consent agreements on favorable terms, the payments due to us under these agreements are customarily based on a price per subscriber of the applicable distributor. In the past several years, the number of subscribers to MVPDs has declined as the growth of direct internet streaming of video programming to televisions and mobile devices has led consumers to discontinue their cable or satellite service subscriptions. As our retransmission consent agreements include payment terms by subscriber numbers, if the rate of reductions in the number of MVPD subscribers increases, this could also have an adverse effect on our business revenues, financial condition and results of operations. Also, refer to “Risks Related to Our Industry—Intense competition in the television industry and alternative forms of media could limit our growth and profitability.”
Our affiliation agreements with the Big 4 broadcast networks (ABC, CBS, NBC and FOX) include terms that limit our ability to grant retransmission consent rights to vMVPDs and other service providers that provide video streaming to consumers. As a result, the Big 4 networks generally negotiate directly with vMVPDs for carriage of their local affiliate stations, including certain of our stations. The terms the networks negotiate may be unfavorable or unacceptable to us, as a result of which we may receive reduced revenue from our stations’ carriage on vMVPDs or may choose not to permit a vMVPD’s carriage of our stations at all, which could materially reduce this revenue source to the Company if we cannot reduce network affiliation fees or generate additional revenue streams from other relationships we have with the Big 4 networks and vMVPDs, and could have an adverse effect on our business, financial condition and results of operations.
Our station revenues and operating results may be adversely affected if we are unable to renew our network affiliation agreements on favorable terms, or at all.
Due to the quality of the programming provided by the networks, stations that are affiliated with a network generally have higher ratings than unaffiliated independent stations in the same market. As a result, it is important for stations to maintain their network affiliations. All but three of the stations that we operate or provide services to have network affiliation agreements which have expiration/renewal dates at various times through December 2027. In order to renew certain of our affiliation agreements, we may be required to make increased payments to the networks and to accept other modifications of existing affiliation agreements. If any of our stations cease to maintain affiliation agreements with their networks for any reason, we would need to find alternative sources of programming, which may be less attractive to our audiences and more expensive to obtain. In addition, a loss of a specific network affiliation for a station may affect our retransmission consent payments, resulting in us receiving less retransmission consent fees. Further, some of our network affiliation agreements are subject to earlier termination by the networks under specified circumstances. For more information regarding these network affiliation agreements, see Item 1, “Business—Network Affiliations.”
Our revenue and operating results may be adversely affected if we are unable to retain our largest customers, which account for a significant percentage of our total revenue, on favorable terms, or at all.
During the years ended December 31, 2024, 2023 and 2022, the Company’s revenues from two customers exceeded 10%. Each of these customers represented approximately 12% for 2024, 12% and 14% for 2023, and 10% and 11% for 2022, of our consolidated net revenues. The loss of or disruption in our relationship with one or more of our major customers could have a material adverse effect on our business, operating results, or financial condition. In addition, any consolidation of our customers could reduce the number of customers to whom our services could be sold and increase our revenue concentration.
Our advertising revenue and operating results may be affected by economic downturns, geopolitical events and other factors outside of our control.
We derive a significant amount of our revenue from the sale of television and digital advertising. Our ability to sell advertising time depends on numerous factors that may be beyond our control, including: the health of the economy; the popularity of our programming, including trust in news organizations; fluctuations in pricing for advertising; the activities of our competitors; and the amount of demand for political advertising in election years. Because businesses generally reduce their advertising budgets during economic recessions or downturns, our reliance upon advertising revenue makes our operating results susceptible to prevailing economic conditions. In addition, our programming may not attract sufficient targeted viewership, and we may not achieve favorable ratings. Our ratings depend partly upon unpredictable and volatile factors beyond our control, such as viewer preferences, competing programming and the availability of other entertainment activities. A shift in viewer preferences could cause our programming not to gain popularity or to decline in popularity, which could cause our advertising revenue to decline. Further, we and the programming providers upon which we rely may not be able to anticipate, and effectively react to, shifts in viewer tastes and interests in our markets.
In addition, we may experience a loss of advertising revenue and incur additional broadcasting expenses due to preemption of our regularly scheduled programming by network coverage of a major global news event such as a war or terrorist attack or by coverage of local disasters such as tornados and hurricanes.
Because a significant percentage of our operating expenses are fixed, a relatively small decrease in revenue could have a significant negative impact on our operating results.
Our business is characterized generally by high fixed costs, primarily for debt service, broadcast rights and personnel. Other than commissions paid to our sales staff and outside sales agencies, our expenses do not vary significantly with an increase or decrease in advertising revenue. Accordingly, a minor shortfall in expected revenue could have a significant negative impact on our financial results.
Our growth may be limited if we are unable to implement an acquisition strategy and our operating results may be adversely affected if we are unable to successfully integrate any future acquisition.
Historically, we achieved much of our growth through acquisitions. We intend to continue our growth by selectively pursuing acquisitions of businesses that leverage our platform, scale and capabilities. Some of our competitors may have greater financial or management resources with which to pursue acquisition targets. Therefore, even if we are successful in identifying attractive acquisition targets, we may face considerable competition and our acquisition strategy may not be successful.
Current and future changes to federal statutes and rules and policies of the FCC and other regulatory authorities which limit the ownership of television stations may also make it more difficult for us to acquire additional television stations. Additionally, our major television station acquisitions over the past years have significantly increased our national audience reach to a level that is at the national television ownership limit imposed by the Communications Act and FCC rules. This may restrict our future television station acquisitions and may require us to divest current stations in connection with any acquisition in order to comply with the national television ownership limit. For more information see “Federal Regulation.”
There are a number of risks associated with growing our business through acquisitions. For example, with any past or future acquisition, there is the possibility that: we may not be able to manage the increased reporting and administrative demands; we may not be able to successfully reduce costs, increase revenue or audience or realize anticipated synergies and economies of scale with respect to any acquired business; we may not be able to generate adequate returns on our acquisitions or investments; we may encounter and fail to address risks or other problems associated with or arising from our reliance on the representations and warranties and related indemnities, if any, provided to us by the sellers of acquired companies; an acquisition may increase our leverage and debt service requirements or may result in our assuming unexpected liabilities; our management may be reassigned from overseeing existing operations by the need to integrate the acquired business; we may experience difficulties integrating operations and systems, as well as company policies and cultures; we may be unable to retain and grow relationships with the acquired company’s key customers; we may fail to retain and assimilate employees of the acquired business; and problems may arise in entering new markets in which we have little or no experience. The occurrence of any of these events could have a material adverse effect on our operating results, particularly during the period immediately following any acquisition.
Our substantial debt and related interest expense could limit our ability to reinvest in the business, make acquisitions and/or return capital to shareholders.
As of December 31, 2024, we had $6.5 billion of debt, which represented 74.3% of total capitalization. Of our $6.5 billion of debt, $3.8 billion is floating rate debt for which we pay interest based on a spread to current Secured Overnight Financing Rate (“SOFR”). An increase in SOFR will increase our interest expense, reducing the amount of cash flow from operations we have available to reinvest in its operations, make acquisitions or return to shareholders. Our high level of debt could have other important consequences for its business, including: limiting our ability to borrow additional funds or obtain additional financing in the future; using cash from operations to reduce indebtedness instead of reinvesting in the business, making acquisitions or returning capital to shareholders; limiting our flexibility to plan for and react to changes in its business and its industry; and impairing our ability to withstand a general downturn in our business and placing us at a disadvantage compared to our competitors that are less leveraged. See Item 7, “Management’s Discussion and Analysis of Financial Condition and Results of Operations—Material Cash Requirements” for disclosure of the approximate aggregate amount of principal indebtedness scheduled to mature.
The terms of our debt instruments contain various maintenance or other restrictive covenants customary for arrangements of these types. The restrictive covenants restrict our ability to, among other things: incur additional debt and issue preferred stock; pay dividends and make other distributions; make investments and other restricted payments; make acquisitions; merge, consolidate or transfer all or substantially all of our assets; enter into sale and leaseback transactions; create liens; sell assets or stock of our subsidiaries; and enter into transactions with affiliates. Our senior secured credit facility requires us to maintain or meet certain financial ratios, including a maximum consolidated first lien net leverage ratio of 4.25 to 1.00. Future financing agreements may contain similar, or even more restrictive, provisions and covenants. Because of these restrictions and covenants, management’s ability to operate our business at its discretion is limited, and we may be unable to compete effectively, pursue acquisitions or take advantage of new business opportunities, any of which could harm our business.
If we fail to comply with the restrictions in present or future financing agreements, a default may occur. A default could allow creditors to accelerate the related debt as well as any other debt to which a cross-acceleration or cross-default provision applies. A default could also allow creditors to foreclose on any collateral securing such debt.
We could also incur additional debt in the future. The terms of our senior secured credit facilities, as well as the indentures governing our senior unsecured notes, limit, but do not prohibit us from incurring substantial amounts of additional debt. To the extent we incur additional debt, it would become even more susceptible to the leverage-related risks described above.
We may not be able to generate sufficient cash flow to meet our debt service requirements.
Our ability to service our debt depends on our ability to generate the necessary cash flow. Generation of the necessary cash flow is partially subject to general economic, financial, competitive, legislative, regulatory and other factors that are beyond our control. We cannot assure you that its business will generate cash flow from operations, that future borrowings will be available to us under our current or any replacement credit facilities, or that we will be able to complete any necessary financings, in amounts sufficient to enable us to fund our operations or pay our debts and other obligations, or to fund our liquidity needs. If we are not able to generate sufficient cash flow to service our debt obligations, we may need to refinance or restructure our debt, sell assets, reduce or delay capital investments, or seek to raise additional capital. Additional financing may not be available in sufficient amounts, at times or on terms acceptable to us, or at all. If we are unable to meet our debt service obligations, our lenders may determine to stop making loans to us, and/or our lenders or other holders of our debt could accelerate and declare due all outstanding obligations under the respective agreements, all of which could have a material adverse effect on us.
We may be required to cease certain station operations if the FCC denies renewal of any of our station licenses.
The FCC generally grants an application for license renewal if, during the preceding term, the station served the public interest, the licensee did not commit any serious violations of the Communications Act or the FCC’s rules, and the licensee committed no other violations of the Communications Act or the FCC’s rules which, taken together, would constitute a pattern of abuse. While a majority of renewal applications are routinely granted under this standard, if we fail to meet this standard the FCC may condition or shorten renewal or, in a worst case, deny a station’s license renewal application, resulting in termination of the station’s authority to broadcast. The Company expects the FCC to grant pending and future renewal applications for its stations in due course but cannot provide any assurances that the FCC will do so. See Item 1, “Business—Federal Regulation.”
The financial performance of our equity method investments and the performance of third-party services providers, upon which we rely but do not control, could adversely impact our results of operations.
We have significant investments in businesses (primarily our 31.3% interest in TV Food Network) that we account for under the equity method of accounting. For the year ended December 31, 2024, our income from equity investments from TV Food Network was $144 million and we received cash distributions of $154 million. As of December 31, 2024, the book value of our ownership interest in TV Food Network was $857 million. If the changes in earnings and distributions from our equity investments are material in any year, those changes may have a material effect on our net income, cash flows, financial condition and liquidity. In addition, if the future prospects for the business change, those changes could have a material impact on the value of our interest. We do not control the day-to-day operations of our equity method investments or have the ability to cause them to pay dividends, make other payments or advances to their stockholders, including us, nor do we have the ability, in the case of TV Food Network, to cause them to provide us with long-term financial projections and thus the management of these businesses could impact our results of operations and cash flows as well as the value of investment recorded on our balance sheet. Additionally, these businesses are subject to laws, regulations, market conditions and other risks inherent in their operations.
In addition, we rely on a number of third-party service providers, including software providers and large technology companies, to enable or perform many core business operations, some of which are specialized services provided by small companies. If these providers are unable to meet our needs or change the way they perform their services, we could be adversely affected.
The loss of the services of our chief executive officer could disrupt management of our business and impair the execution of our business strategies.
We believe that our success depends upon our ability to retain the services of Perry A. Sook, our founder and Chief Executive Officer. Mr. Sook has been instrumental in determining our strategic direction and focus. The loss of Mr. Sook’s services could adversely affect our ability to manage effectively our overall operations and successfully execute current or future business strategies. Pursuant to his executive employment agreement, Mr. Sook continues to serve as our Chief Executive Officer through March 31, 2026, with automatic renewal for successive one-year periods.
Our operating results could be adversely affected if the owners of the VIEs make decisions regarding the operation of their respective stations that adversely impact their operating results and reduce payments due to us under our local service agreements.
The VIEs are each 100% owned by independent third parties. We have entered into local service agreements with the VIEs, pursuant to which we provide services to their stations. In return for the services we provide, we receive substantially all of the consolidated VIEs’ available cash, after satisfaction of their operating costs and any debt obligations. In addition, Nexstar (excluding The CW) guarantees the full payment of all of the obligations incurred under one of our VIEs’ (Mission) senior secured credit facility in the event of default. See Item 1, “Business—Stations.”
In compliance with FCC regulations, the VIEs maintain complete responsibility for and control over programming, finances and personnel for their respective stations. As a result, the VIEs’ boards of directors and officers can make decisions with which we disagree and which could reduce the cash flow generated by these stations and, as a consequence, the amounts we receive under our local service agreements with the VIEs.
Future impairment charges could adversely affect our operating results.
As of December 31, 2024, $7.7 billion, or 67.1%, of our combined total assets consisted of goodwill, indefinite-lived intangible assets (FCC licenses) and definite-lived intangible assets (network affiliation agreements and other). We regularly test our goodwill and other intangible assets for impairment. If the carrying amount of goodwill and intangible assets is revised downward due to impairment, such non-cash charge could materially affect our financial position and results of operations. See Item 7, “Management’s Discussion and Analysis of Financial Condition and Results of Operations—Critical Accounting Estimates.”
Changes in deferred tax assets or valuation allowances as a result of tax law changes could affect our operating results.
We currently have significant net deferred tax assets resulting from tax credit carryforwards, net operating losses and other deductible temporary differences that are available to reduce taxable income in future periods. Based on our assessment of the Company’s deferred tax assets, we determined that as of December 31, 2024, based on projected future income, approximately $154 million of the Company’s deferred tax assets, net of valuation allowance, will more likely than not be realized in the future. Should we determine in the future that these assets will not be realized, the Company will be required to record a valuation allowance in connection with these deferred tax assets and the Company’s operating results would be adversely affected in the period such determination is made. In addition, tax law changes could negatively impact the Company’s deferred tax assets. See Item 7, “Management’s Discussion and Analysis of Financial Condition and Results of Operations—Critical Accounting Estimates.”
We may face additional tax liabilities stemming from proposed and ongoing tax audits.
While we believe our tax positions and reserves are reasonable, the resolutions of certain tax issues related to a past transaction of Tribune are unpredictable and could negatively impact our effective tax rate, net income or cash flows for the period or periods in question. Specifically, we may be faced with additional tax liabilities as a result of our acquisition of Tribune for the transactions contemplated by an agreement, dated August 21, 2009, between Tribune and Chicago Entertainment Ventures, LLC (formerly Chicago Baseball Holdings, LLC) (“CEV LLC”), and its subsidiaries (collectively, “New Cubs LLC”), governing the contribution of certain assets and liabilities related to the business of the Chicago Cubs Major League Baseball franchise then owned by Tribune and its subsidiaries to New Cubs LLC, and related agreements thereto (the “Chicago Cubs Transactions”). We may also be faced with tax liabilities as a result of the federal income tax audits of Tribune for taxable years 2014 and 2015.
On June 28, 2016, the Internal Revenue Service (“IRS”) issued Tribune a Notice of Deficiency which presented the IRS’s position that the gain with respect to the Chicago Cubs Transactions should have been included in Tribune’s 2009 taxable income. Accordingly, the IRS proposed a $182 million tax and a $73 million gross valuation misstatement penalty. During the third quarter of 2016, Tribune filed a petition in U.S. Tax Court to contest the IRS’s determination. After-tax interest on the aforementioned proposed tax and penalty through December 31, 2024 would be approximately $232 million. In addition, if the IRS prevails in its position, under the tax rules for determining tax basis upon emergence from bankruptcy, the Company would be required to reduce its tax basis in certain assets. The reduction in tax basis would be required to reflect the reduction in the amount of the Company’s guarantee of the New Cubs partnership debt which was included in the reported tax basis previously determined upon emergence from bankruptcy and subject to Tribune’s 2014 and 2015 federal income tax audits (described below).
On September 19, 2019, Tribune became a wholly owned subsidiary of Nexstar following Nexstar’s merger with Tribune. Nexstar disagrees with the IRS’s position that the Chicago Cubs Transactions generated taxable gain in 2009, the proposed penalty and the IRS’s calculation of the gain. If the IRS prevails in its position, the gain on the Chicago Cubs Transactions would be deemed to be taxable in 2009. We estimate that the federal and state income taxes would be approximately $225 million before interest and penalties. Any tax, interest and penalty due will be offset by tax payments made relating to this transaction subsequent to 2009. Tribune made approximately $154 million of tax payments prior to its merger with Nexstar.
A bench trial in the U.S. Tax Court took place between October 28, 2019 and November 8, 2019, and closing arguments took place on December 11, 2019. The Tax Court issued a separate opinion on January 6, 2020 holding that the IRS satisfied the procedural requirements for the imposition of the gross valuation misstatement penalty. The judge deferred any litigation of the penalty until a final determination was reached by the Tax Court or Court of Appeals.
On October 26, 2021, the Tax Court issued an opinion related to the Chicago Cubs Transactions, which held that Tribune’s structure was, in substantial part, in compliance with partnership provisions of the Code and, as a result, did not trigger the entire 2009 taxable gain proposed by the IRS. On October 19, 2022, the Tax Court entered the decision that there is no tax deficiency or penalty due in the 2009 tax year. On January 13, 2023, the IRS filed a notice of appeal to the U.S. Court of Appeals for the Seventh Circuit. On February 3, 2023, the Company filed a notice of cross-appeal. On February 15, 2024, the case was argued before the U.S. Court of Appeals for the Seventh Circuit. The Company expects a ruling from the Court of Appeals in 2025.
As of December 31, 2024, we believe the tax impact of applying the Tax Court opinion to 2009 and its impact on subsequent years is not material to the Company’s accounting for uncertain tax positions or to its Consolidated Financial Statements. Although management believes its estimates and judgments are reasonable, the timing and ultimate resolution are unpredictable and could materially change.
Prior to Nexstar’s merger with Tribune in September 2019, Tribune was undergoing a federal income tax audit for taxable years 2014 and 2015. In the third quarter of 2020, the IRS completed its audit of Tribune and issued a Revenue Agent’s Report which disallowed the reporting of certain assets and liabilities related to Tribune’s emergence from Chapter 11 bankruptcy on December 31, 2012. We disagree with the IRS’s proposed adjustments to the tax basis of certain assets and the related taxable income impact, and we are contesting the adjustments through the IRS administrative appeal procedures. If the IRS prevails in its position and after taking into account the impact of the Tax Court opinion, Nexstar would be required to reduce its tax basis in certain assets resulting in a $17 million increase in its federal and state taxes payable and a $69 million increase in deferred income tax liability as of December 31, 2024. In accordance with Accounting Standards Codification (“ASC”) Topic 740, the Company has reflected $11 million for certain contested issues in its liability for uncertain tax positions at December 31, 2024 and December 31, 2023.
Our pension and postretirement benefit plan obligations may be increased by a declining stock market and lower interest rates.
We have various funded, qualified non-contributory defined benefit retirement plans which cover certain employees and former employees. As of December 31, 2024, the pension benefit obligations for these qualified retirement plans were $1.5 billion. The qualified retirement plans also had $1.4 billion in total net assets available, or underfunded by approximately $148 million, to pay benefits to participants enrolled in the plans as of December 31, 2024. There were no significant required contributions to Nexstar’s qualified pension benefit plans in 2024.
We also have non-contributory unfunded supplemental executive retirement and ERISA excess plans which supplement the coverage of the defined benefit retirement plans to certain employees and former employees. During 2024, Nexstar contributed $4 million to these plans. As of December 31, 2024, the total liability was $37 million. We also have various retiree medical savings account plans which reimburse eligible retired employees for certain medical expenses and unfunded plans that provide certain health and life insurance benefits to certain retired employees. Although we have frozen participation and benefits under all plans, two significant elements in determining the pension expense or credit are the expected return on plan assets and the discount rate used in projecting obligations. Large declines in the stock market and lower discount rates increase the expense and may necessitate higher cash contributions to the qualified retirement plans.
Adverse results from litigation or governmental investigations involving us can impact our business practices and operating results.
We are party to various litigation and regulatory, environmental and other proceedings with governmental authorities and administrative agencies. Adverse outcomes in lawsuits or investigations may result in significant monetary damages or injunctive relief that may adversely affect our operating results or financial condition as well as our ability to conduct our businesses as they are presently being conducted.
Any decrease in our dividend payments or suspension of our dividend payments or stock repurchases could cause our stock price to decline.
Our common stockholders are only entitled to receive the dividends declared by our board of directors. Our board of directors declared in 2024 total cash dividends of $6.76 per share to the outstanding shares of our common stock (installments of $1.69 per share were paid each quarter to the applicable record date outstanding shares of common stock). In January 2025, our board of directors approved a 10% increase in the quarterly cash dividend to $1.86 per share beginning with the dividend declared in the first quarter of 2025. We expect to continue to pay quarterly cash dividends at the rate set forth in our current dividend policy. However, future cash dividends, if any, will be at the discretion of our board of directors and can be changed or discontinued at any time. Dividend determinations (including the amount of cash dividend, the record date and date of payment) will depend upon, among other things, our future operations and earnings, targeted future acquisitions, capital requirements and surplus, general financial condition, contractual restrictions and other factors as our board of directors may deem relevant. In addition, the Company’s senior secured credit facilities and the indentures governing our existing notes limit our ability to pay dividends. Given these considerations, our board of directors may increase or decrease the amount of the dividend at any time and may also decide to suspend or discontinue the payment of cash dividends in the future.
We engage in share repurchases of our common stock from time to time in accordance with authorizations from our board of directors. Our repurchase program does not have an expiration date and does not obligate us to repurchase any specific dollar amount or to acquire any specific number of shares. Further, our share repurchases could affect our share trading prices or increase their volatility and may be suspended or terminated at any time, which may result in a decrease in the trading prices of our common stock.
We may face challenges in protecting our intellectual property (IP) and defending against infringement claims.
Our business relies on patents, trademarks, copyrights, and licenses to protect our technology and brand. Any damage to these assets could impact our success and financial performance.
Enforcing IP rights is difficult, especially as technology makes piracy easier. Current protections may not be sufficient, and litigation could be necessary. Changes in laws could also affect our ability to generate revenue or increase costs. Any IP-related litigation or claims—valid or not—could be costly, divert resources, and require us to pay substantial amounts or stop using certain IP. Licensing may not be available on reasonable terms, negatively affecting our business.
Cybersecurity risks could adversely affect our operating effectiveness and operating results.
We use computers in substantially all aspects of our business operations. Such use exposes us to potential cyber incidents resulting from deliberate attacks or unintentional events. While we have not experienced cybersecurity incidents that materially impacted our operating results and financial condition, it is not uncommon for a company such as ours to be subjected to continuous attempted cyber-attacks or other malicious efforts to cause a cyber incident. These incidents can include, but are not limited to, gaining unauthorized access to digital systems for purposes of misappropriating assets or sensitive information, corrupting data or causing operational disruption. Increased remote work and the use of third-party services to enable remote work also impacts the security of our systems, as well as our ability to protect against attacks and detect and respond to them quickly. The results of these incidents could include, but are not limited to, business interruption, disclosure of nonpublic information, decreased advertising revenues, misstated financial data, liability for stolen assets or information, increased cybersecurity protection costs, litigation and reputational damage adversely affecting customer or investor confidence.
Risks Related to Our Industry
Intense competition in the television industry and alternative forms of media could limit our growth and profitability.
As a television broadcasting company, we face a significant level of competition, both directly and indirectly. We compete for our audience against other video services in addition to all the other leisure activities in which one could choose to engage rather than watch television.
Many of our current and potential competitors have greater financial, marketing, programming and distribution resources than we do. The markets in which we operate are also in a constant state of change arising from, among other things, technological improvements and economic and regulatory developments. Technological innovation and the resulting proliferation of television entertainment, such as streaming video, cable television, wireless cable, satellite-to-home distribution services, home video and entertainment systems and the internet have fractionalized television viewing audiences and have subjected television broadcast networks, cable networks and television stations to increased competition and declining viewership. In recent years, demand for television advertising has been declining and demand for advertising in alternative media has been increasing, and we expect this trend to continue. We may not be able to compete effectively or adjust our business plans to meet changing market conditions.
New or changed federal statutes, legislation and regulations or changes in the application of existing regulations could significantly impact our operations or the television broadcasting industry as a whole.
The FCC has open proceedings to determine whether to standardize TV stations’ reporting of programming responsive to local needs and interests; whether to modify its network non-duplication and syndicated exclusivity rules; whether to modify its standards for “good faith” retransmission consent negotiations; whether to broaden the definition of “MVPD” to include online video programming distributors; and the appropriate substance and scope of its indecency enforcement policy; and the FCC has initiated reviews of the broadcast ownership rules. In addition, changes in FCC and Department of Justice / Federal Trade Commission rules and guidelines around owning or providing services to multiple stations in a local market, or other rules, could adversely impact us. The FCC also may decide to initiate other new rule-making proceedings on its own or in response to requests from outside parties, any of which might impact our business or operations. The U.S. Congress may also act to amend the Communications Act in a manner that could impact our stations and the stations we provide services to or the television broadcast industry in general. For more information about the regulations that we are subject to, see Item 1, “Business—Federal Regulation.”
We are subject to foreign ownership limitations which limit foreign investments in us.
The Communications Act limits the extent of non-U.S. ownership of companies that own U.S. broadcast stations. Under these restrictions, the holder of a U.S. broadcast license may have no more than 20% non-U.S. ownership (by vote and by equity). The Communications Act prohibits more than 25% indirect foreign ownership or control of a licensee through a parent company if the FCC determines the public interest will be served by enforcement of such restriction. The FCC has interpreted this provision to require an affirmative public interest showing before indirect foreign ownership of a broadcast licensee may exceed 25%. Therefore, certain investors may be prevented from investing in us if our foreign ownership is at or near the FCC limits.
None.
Item 1C. Cybersecurity
Cybersecurity Governance, Risk Management and Strategy
In the current digital environment, companies like ours may be the target of cyber-attacks or other malicious efforts to cause a cyber incident. These cyber incidents can include, but are not limited to, gaining unauthorized access to digital systems for purposes of misappropriating assets or sensitive information, corrupting data or causing operational disruption. The possible consequences of such an attack include but are not limited to loss of data, damage to our reputation, interruptions to our operations, and/or the need to pay ransom. Historically, we have not experienced cybersecurity incidents that materially impacted our business strategy, operating results and financial condition but we cannot guarantee a future cybersecurity incident would not materially impact us.
We recognize the importance of maintaining the confidence and trust of our customers, suppliers, employees, audience, and communities by maintaining our data and information security. In managing our cyber risk, we utilize the National Institute of Standards and Technology Framework for Improving Critical Infrastructure Cybersecurity (the “NIST Framework”) issued by the U.S. government as a guideline to manage our cybersecurity-related risk. In addition, we have established security control requirements for our third-party vendors based on global standards.
Our day-to-day cybersecurity efforts are led operationally by our Chief Technology and Digital Officer and Senior Vice President, Technology who have over 10 and 25 years, respectively, of networking and information technology management or executive experience, and oversee a team of in-house cybersecurity specialists. Our Cybersecurity Committee, comprised of representatives from key management groups including accounting, finance, legal, internal audit, and information technology, also supports our cybersecurity efforts. The Cybersecurity Committee consults with representatives from senior management and retains third-party contractors as needed. The role of the Cybersecurity Committee is to oversee cyber risk assessments, monitor applicable key risk indicators, review cybersecurity training procedures, establish cybersecurity policies and procedures, and implement enhancements to our cybersecurity infrastructure. The Cybersecurity Committee meets monthly, or more regularly as necessary, and ensures that senior management, and ultimately, the Board, is given the information required to manage and exercise proper oversight over cybersecurity risks and ensure that escalation procedures are followed in the event of a cybersecurity incident.
As part of its role as independent oversight of the key risks facing Nexstar, the Board itself and through its Audit Committee devotes regular and thorough attention to our cybersecurity risk. The Audit Committee receives quarterly (or more frequent as necessary) reports from senior financial executives and Nexstar’s Chief Technology and Digital Officer to evaluate cybersecurity and data risks. Such reporting includes updates on the Company’s cybersecurity program, the external threat environment, and the Company’s programs to address and mitigate the risks associated with the evolving cybersecurity threat landscape. In accordance with our Cyber Incident Response Plan, the Audit Committee is promptly informed of any cybersecurity incidents that could potentially materially adversely affect the Company or its information systems and is regularly updated about incidents with lesser impact potential. The Audit Committee and management regularly brief the full Board on these matters as well.
For additional discussion of certain risks associated with cybersecurity, see Item 1A, “Risk Factors” under the heading “Cybersecurity risks could adversely affect our operating effectiveness and operating results.”
Item 2. Properties
We have office space for our corporate headquarters in Irving, TX, which is leased through 2033. Each of our markets has facilities consisting of offices, studios, sales offices and tower and transmitter sites. We own approximately 55% of our office and studio locations and approximately 55% of our tower and transmitter locations. The remaining properties that we utilize in our operations are leased. We consider all of our properties, together with equipment contained therein, to be adequate for our present needs. We continually evaluate our future needs and from time to time will undertake significant projects to replace or upgrade facilities.
While none of our owned or leased properties is individually material to our operations, if we were required to relocate any towers, the cost could be significant. This is because the number of sites in any geographic area that permit a tower of reasonable height to provide good coverage of the market is limited, and zoning and other land use restrictions, as well as Federal Aviation Administration and FCC regulations, limit the number of alternative locations or increase the cost of acquiring them for tower sites. See Item 1, “Business—The Stations” for a complete list of stations by market.
Item 3. Legal Proceedings
The information set forth under Note 11 to our Consolidated Financial Statements included in Part IV, Item 15(a) of this Annual Report on Form 10-K is incorporated herein by reference. For additional discussion of certain risks associated with legal proceedings, see Item 1A, “Risk Factors” above.
Item 4. Mine Safety Disclosures
None.
PART II
Item 5. Market for Registrant’s Common Equity, Related Stockholder Matters and Issuer Purchases of Equity Securities
Market Prices; Record Holders and Dividends
Our common stock trades on The NASDAQ Global Select Market (“NASDAQ”) under the symbol “NXST.”
As of February 27, 2025, there were approximately 134,000 shareholders of record of our common stock, including shares held in nominee names by brokers and other institutions.
Pursuant to our current dividend policy, our board of directors declared in 2024, 2023 and 2022 total annual cash dividends of $6.76 per share, $5.40 per share and $3.60 per share, respectively, with respect to outstanding shares of our common stock. The dividends were paid in equal quarterly installments.
On January 29, 2025, our board of directors approved a 10% increase in the quarterly cash dividend to $1.86 per share of outstanding common stock beginning with the first quarter of 2025. Dividend determinations will depend upon, among other things, our future operations and earnings, targeted future acquisitions, capital requirements and surplus, general financial condition, contractual restrictions and other factors as our board of directors may deem relevant. Additionally, the Company’s senior secured credit facilities and the indentures governing Nexstar’s existing notes limit our ability to pay dividends. Given these considerations, our board of directors may increase or decrease the amount of dividends at any time and may also decide to suspend or discontinue the payment of cash dividends in the future.
Recent Sales of Unregistered Securities
None.
Issuer Purchases of Equity Securities
The following is a summary of Nexstar’s repurchases of its common stock by month during the fourth quarter of 2024 (in millions, except for share and per share information):
| | | | | | | | | | | | | | | | |
| | | | | | | | Total Number of Shares | | | Approximate Dollar Value | |
| | | | | | | | Purchased as Part of | | | of Shares That May Yet Be | |
| | Total Number | | | Average Price | | | Publicly Announced | | | Purchased Under the | |
| | of Shares Purchased | | | Paid per Share | | | Plans or Programs | | | Plans or Programs | |
October 2 ̶ 31, 2024 | | | 405,473 | | | $ | 168.90 | | | | 405,473 | | | $ | 1,661 | |
November 1 ̶ 29, 2024 | | | 274,461 | | | $ | 168.49 | | | | 274,461 | | | | 1,614 | |
December 2 ̶ 26, 2024 | | | 380,928 | | | $ | 164.73 | | | | 380,928 | | | | 1,552 | |
| | | 1,060,862 | | | $ | 167.30 | | | | 1,060,862 | | | | |
As of December 31, 2024, the remaining available amount under the share repurchase authorization was $1.6 billion, which includes the $1.5 billion increase to the share repurchase program authorized by Nexstar’s Board of Directors on July 26, 2024.
From January 1, 2025 to February 27, 2025, we repurchased 112,582 shares of our common stock for $17 million, funded by cash on hand. As of the date of filing this Annual Report on Form 10-K, the remaining available amount under the share repurchase authorization was $1.5 billion.
Share repurchases are executed from time to time in open market transactions, block trades or in private transactions, including through Rule 10b5-1 and 10b-18 plans. There is no minimum number of shares that Nexstar is required to repurchase. The repurchase program does not have an expiration date and may be suspended or discontinued at any time without prior notice.
Securities Authorized for Issuance Under Equity Compensation Plans as of December 31, 2024
| | | | | | | | | | | | |
| | Number of securities | | | | | | Number of securities | |
| | to be issued upon | | | Weighted average | | | remaining available | |
| | exercise of outstanding | | | exercise price of | | | for future issuance | |
| | options and vesting of | | | outstanding | | | excluding securities | |
Plan Category | | restricted stock units | | | options | | | reflected in column (a) | |
| | (a) | | | (b) | | | (c) | |
Equity compensation plans approved by security holders(1) | | | 1,041,225 | | | $ | - | | | | 1,038,721 | |
Equity compensation plans not approved by security holders | | | - | | | | - | | | | - | |
| | | 1,041,225 | | | | | | | 1,038,721 | |
(1)The 1,041,225 securities to be issued consist of time-based and performance-based restricted stock units. All stock options were fully vested and exercised as of December 31, 2024.
For a more detailed description of our equity plans and grants, we refer you to Note 13 to the Consolidated Financial Statements included in Part IV, Item 15(a) of this Annual Report on Form 10-K.
Comparative Stock Performance Graph
The following graph compares the total return of our common stock based on closing prices for the period from December 31, 2019 through December 31, 2024 with the total return of the NASDAQ Composite Index and our peer index of comparable television companies. Our peer group index consists of the following publicly traded companies: Gray Television Inc., TEGNA Inc., Sinclair, Inc., The E.W. Scripps Company, Fox Corporation and Paramount Global. The graph assumes the investment of $100 in our common stock and in both of the indices on December 31, 2019, with the reinvestment of dividends into shares of our common stock or the indices, as applicable. The performance shown is not necessarily indicative of future performance.
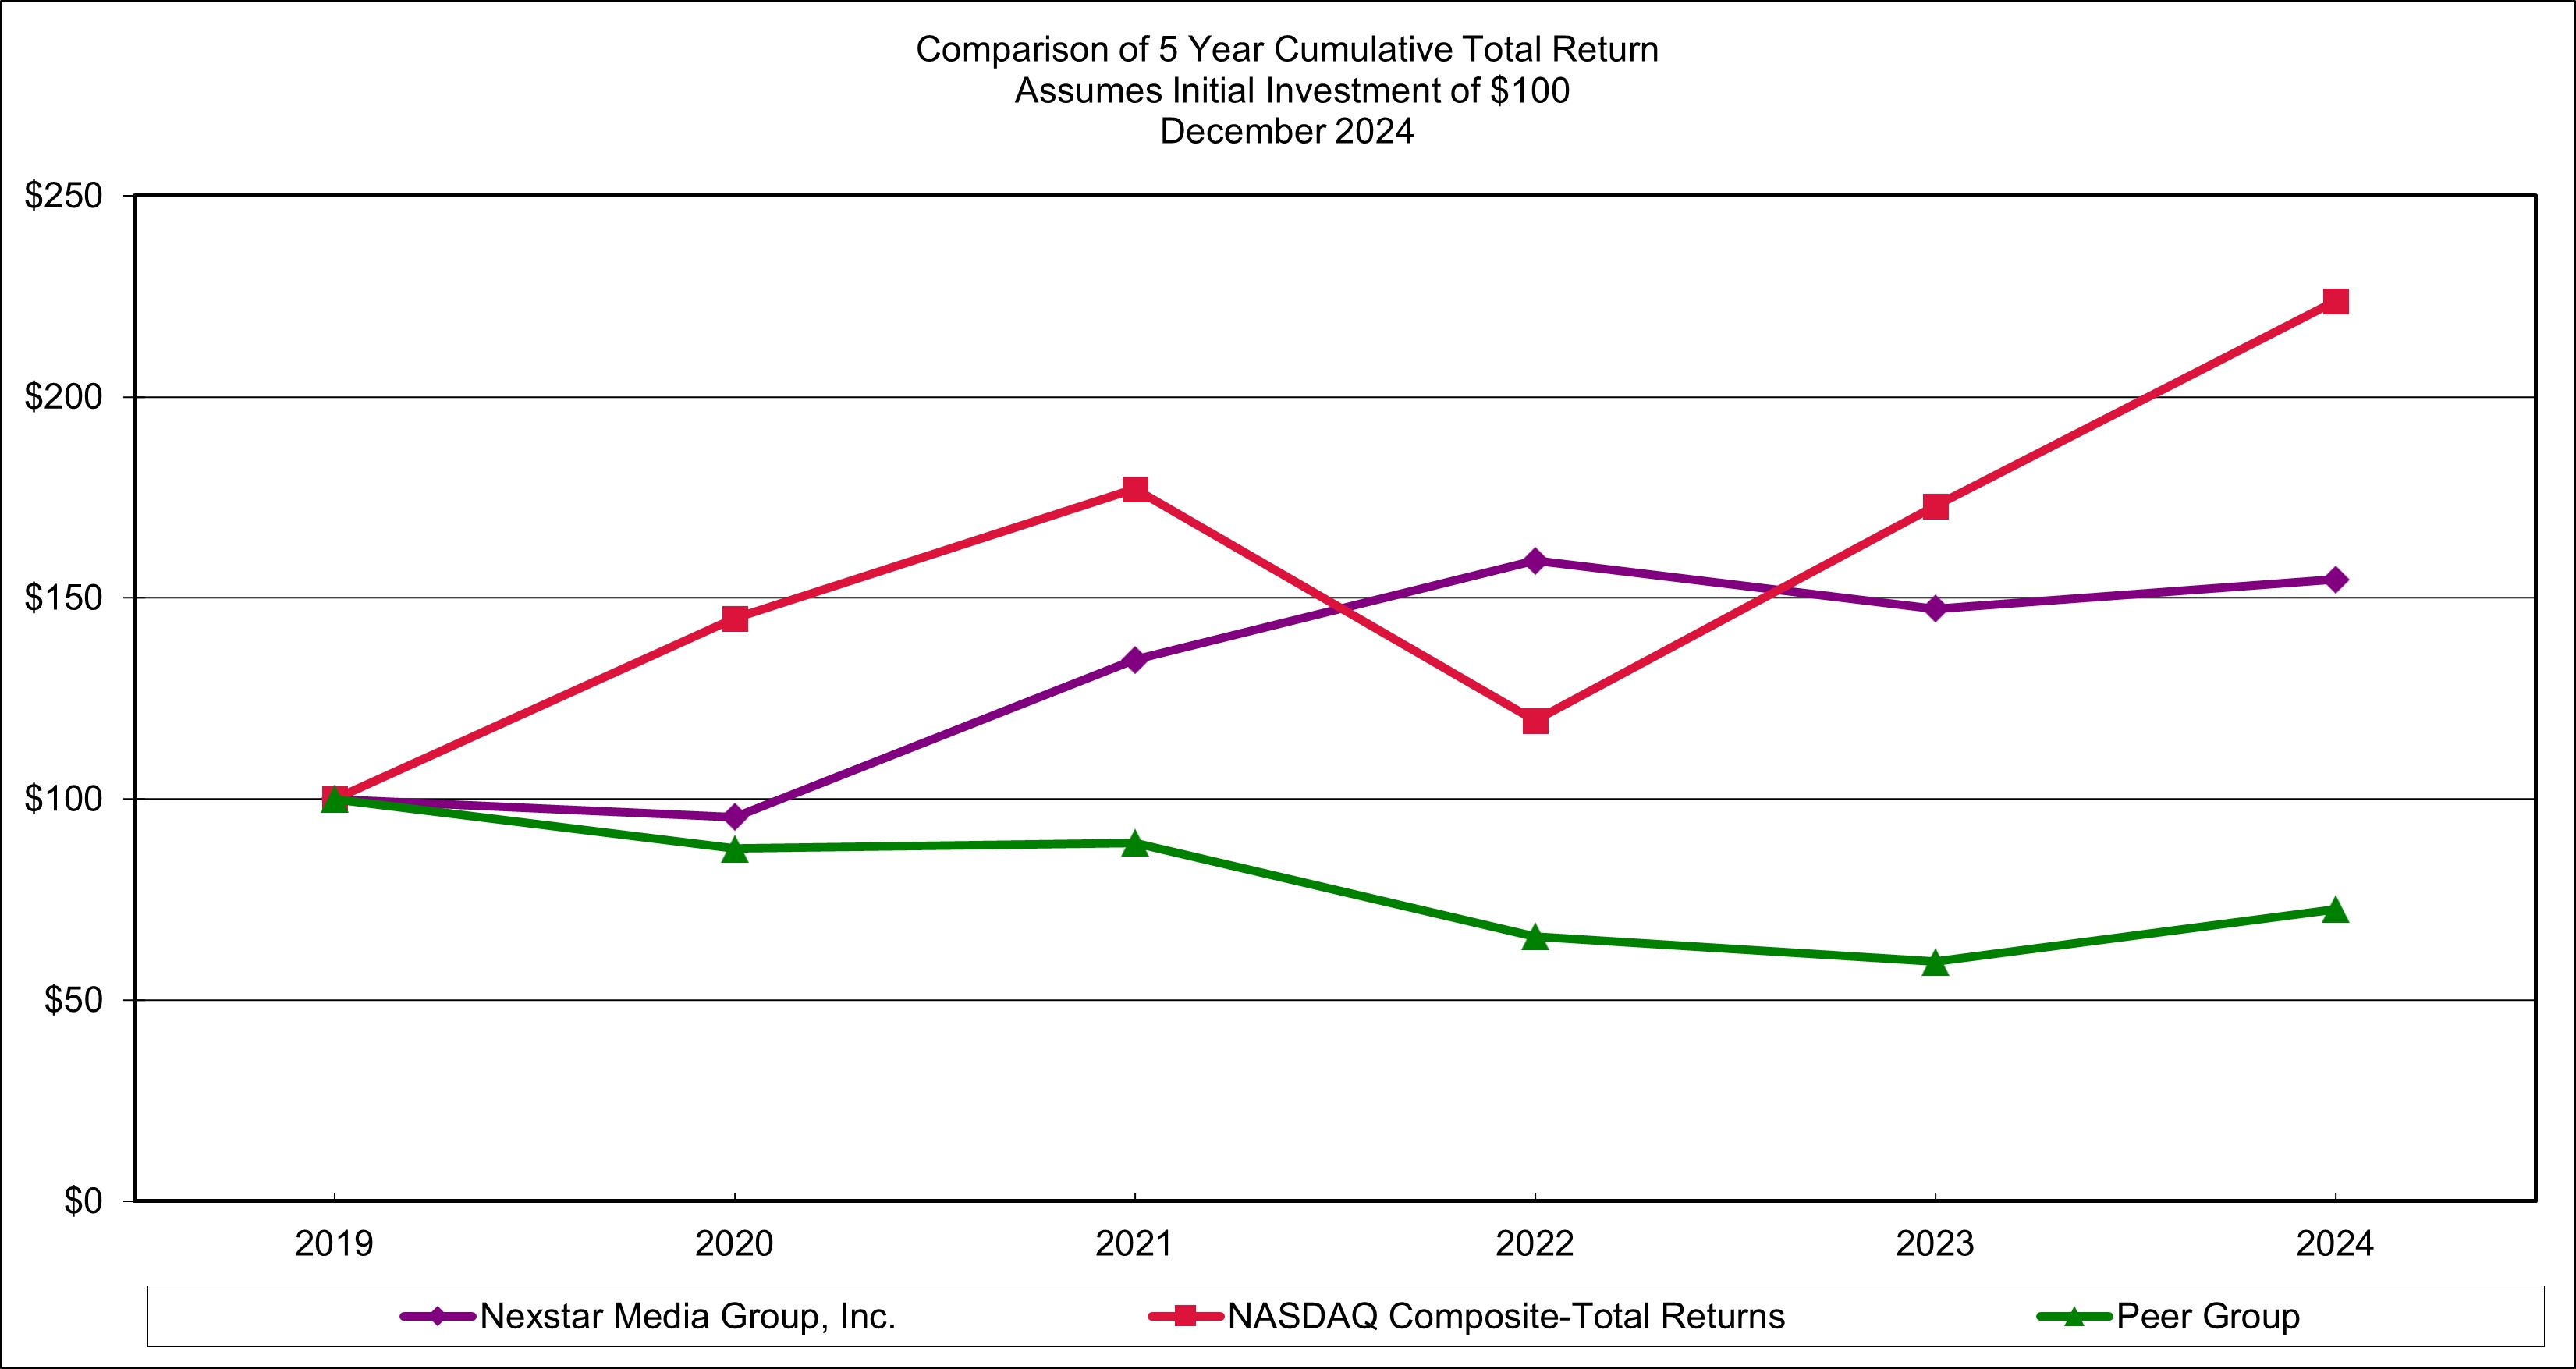
| | | | | | | | | | | | | | | | | | | | | | | | | | | | | |
| 12/31/2019 | | | 12/31/2020 | | | 12/31/2021 | | | 12/31/2022 | | | 12/31/2023 | | | 12/31/2024 | |
Nexstar Media Group, Inc. (NXST) | $ | | 100.00 | | | $ | | 95.48 | | | $ | | 134.56 | | | $ | | 159.19 | | | $ | | 147.30 | | | $ | | 154.63 | |
NASDAQ Composite Index | $ | | 100.00 | | | $ | | 144.92 | | | $ | | 177.06 | | | $ | | 119.45 | | | $ | | 172.77 | | | $ | | 223.87 | |
Peer Group | $ | | 100.00 | | | $ | | 87.62 | | | $ | | 89.11 | | | $ | | 65.82 | | | $ | | 59.51 | | | $ | | 72.67 | |
Item 6. Reserved
Item 7. Management’s Discussion and Analysis of Financial Condition and Results of Operations
The following discussion and analysis should be read in conjunction with our Consolidated Financial Statements and related Notes included in Part IV, Item 15(a) of this Annual Report on Form 10-K.
As a result of our deemed controlling financial interests in the consolidated VIEs in accordance with U.S. GAAP, we consolidate the financial position, results of operations and cash flows of these VIEs as if they were wholly-owned entities. We believe this presentation is meaningful for understanding our financial performance. Refer to Note 2 to our Consolidated Financial Statements for a discussion of our determinations of VIE consolidation under the related authoritative guidance. The following discussion of our financial position and results of operations includes the consolidated VIEs’ financial position and results of operations.
Executive Summary
2024 Highlights
•Achieved a record $5.4 billion net revenue.
•Returned approximately $820 million of capital to shareholders through repurchases of common stock of $601 million and dividends of $219 million, funded by cash on hand, and announced a $1.5 billion increase to our share repurchase authorization.
•Reduced our debt by $327 million, funded by cash on hand.
•Renewed affiliation agreements with CBS and with NBC.
•Expanded NewsNation news programming to 24 hours per day, 7 days per week.
•Achieved our near-term target of reaching over 50% of U.S. television households with an ATSC 3.0, or NextGen TV, signal from a Nexstar or partner owned or operated station.
Overview of Operations
As of January 31, 2025, we owned, operated, programmed or provided sales and other services to 201 full power television stations and one AM radio station, including those owned by VIEs, in 116 markets in 40 states and the District of Columbia. The stations are affiliates of ABC, NBC, FOX, CBS, The CW, MNTV and other broadcast television networks.
Through various local service agreements, we provided sales, programming and other services to 37 full power television stations owned by independent third parties, of which 35 full power television stations are VIEs that are consolidated into our financial statements. See Note 2 to our Consolidated Financial Statements included in Part IV, Item 15(a) of this Annual Report on Form 10-K for a discussion of the local service agreements we have with these independent third parties. We do not own the consolidated VIEs or their television stations. However, we are deemed under U.S. GAAP to have controlling financial interests for financial reporting purposes in these entities because of (i) the local service agreements we have with their stations, (ii) our (excluding The CW) guarantee of the obligations incurred under Mission’s senior secured credit facility, (iii) our power over significant activities affecting the VIEs’ economic performance, including budgeting for advertising revenue, advertising sales and, in some cases, hiring and firing of sales force personnel and (iv) purchase options granted by each consolidated VIE which permit us to acquire the assets and assume the liabilities of each of these VIEs’ stations, subject to FCC consent. In compliance with FCC regulations for all the parties, each of the consolidated VIEs maintains complete responsibility for and control over programming, finances and personnel for its stations.
As of December 31, 2024, we also own a 77.1% ownership interest in The CW, the fifth major broadcast network in the U.S., NewsNation, a national news network, two multicast networks, Antenna TV and REWIND TV, multicast network services provided to third parties, and a 31.3% ownership stake in TV Food Network. Our digital assets include 138 local websites and 229 mobile applications across local stations, NewsNation and The Hill. The portfolio also includes eight connected television applications and three FAST channels from The CW and The Hill.
The largest portion of operating revenue of the Company is derived from distribution revenue, which relates to retransmission of Company stations’ signals and the carriage of our cable and broadcast networks by cable, satellite and other MVPDs and vMVPDs and, in the case of The CW, its local affiliates. For the year ended December 31, 2024, the Company’s distribution revenue represented 54.1% of total net revenue. Distributors generally pay for retransmission rights of local stations and for carriage of our NewsNation on a per subscriber basis. Distribution revenue is affected positively or negatively by the rate of growth or decline of subscribers and the growth in the per subscriber fee due to contract renegotiations or annual escalators in existing contracts. We also generate distribution revenues from the affiliation fees that CW’s third-party local station affiliates pay to the network and from programmers who use our spectrum in selected local markets to air their content on our multicast streams.
We also generate revenue from television advertising. For the year ended December 31, 2024, the Company generated 44.7% of its net revenue from advertising. Advertisers typically pay for advertising on our television and digital assets based on the number of impressions our programming or digital content delivers. As a result, our advertising is affected by a number of factors, including the size and demographics of the audience viewing our programming and digital content, economic conditions, demand for advertising and our sales effort. We also generate digital advertising revenue from the sale of advertising on third-party sites and other local and national services. In addition, digital advertising that is not directly sold to advertisers is sold via programmatic exchanges.
Included in our advertising revenues is the impact of political advertising which, in even years, contributes a substantial amount to our total advertising revenue. For the years ended December 31, 2024 and 2022, the Company generated 20.3% and 19.5%, respectively, of our net advertising revenue from political advertising. Political advertising is affected by the number of competitive races there are and the extent to which the Company’s stations are located in the relevant competitive markets, the amount of funds raised by candidates, political action committees and others, the availability and pricing of television advertising inventory and the availability of alternative media. Because of the scale of Nexstar, we typically have a presence in the substantial majority of markets with competitive political races.
Our primary operating expenses include third-party programming, news programming, production and promotion, sales, digital cost of goods sold and content creation costs, and other administrative and corporate expenses. Third-party programming costs are primarily related to fees paid to networks with which ours and our partners’ stations are affiliated and license fees for original and sports programming, in the case of The CW, and syndicated programming in the case of the stations and our networks. The largest contributor to news programming and other expenses are employee-related expenses. A large percentage of the costs involved in our operations is relatively fixed.
Regulatory Developments
As a television broadcaster, the Company is highly regulated, and its operations require that it retain or renew a variety of government approvals and comply with changing federal regulations. On April 1, 2021, the U.S. Supreme Court issued a decision that reversed a lower court of appeals ruling and upheld the FCC’s elimination or modification of certain of its media ownership rules in the agency’s 2010/2014 quadrennial review of those rules. Among the regulations eliminated in 2021 as a result of the Supreme Court ruling was a rule providing that a television station licensee which sells more than 15 percent of the weekly advertising inventory of a non-owned television station in the same market under a JSA is deemed to have an attributable ownership interest in that station, as well as a requirement that at least eight independently owned television stations remain in a local television market for a party to acquire a second station in that market. While these restrictions are no longer in effect, the FCC’s 2022 quadrennial media ownership review and an FCC proceeding to review the current national limit on television ownership are currently pending. The FCC could reinstitute its earlier restrictions or impose other limitations in these or any future reviews.
Seasonality
In even-numbered years we generate substantial advertising revenue from the political advertising we sell to candidates and non-candidate entities such as political action committees and political parties. Advertising revenue is also positively affected by certain events such as the Olympic Games or the Super Bowl. Advertising revenue is generally highest in the second and fourth quarters of each year, due in part to increases in consumer advertising in the spring and retail advertising in the period leading up to, and including, the holiday season.
Historical Performance
Results of Operations
The following table sets forth a summary of the Company’s operations for the years ended December 31 (dollars in millions), and each component of operating expense as a percentage of net revenue:
| | | | | | | | | | | | | | | | | | | | |
| | Years Ended December 31, | | | % Change | |
| | 2024 | | | 2023 | | | 2022 | | | 2024 vs 2023 | | | 2023 vs 2022 | |
Net revenue: | | | | | | | | | | | | | | | |
Distribution | | $ | 2,928 | | | $ | 2,727 | | | $ | 2,571 | | | | 7.4 | | | | 6.1 | |
Advertising | | | 2,415 | | | | 2,121 | | | | 2,589 | | | | 13.9 | | | | (18.1 | ) |
Other | | | 64 | | | | 85 | | | | 51 | | | | (24.7 | ) | | | 66.7 | |
Net revenue | | | 5,407 | | | | 4,933 | | | | 5,211 | | | | 9.6 | | | | (5.3 | ) |
Operating expenses: | | | | | | | | | | | | | | | |
Direct operating | | | 2,221 | | | | 2,153 | | | | 2,005 | | | | 3.2 | | | | 7.4 | |
Selling, general and administrative | | | 1,088 | | | | 1,098 | | | | 1,098 | | | | (0.9 | ) | | | 0.0 | |
Depreciation and amortization | | | 808 | | | | 941 | | | | 662 | | | | (14.1 | ) | | | 42.1 | |
Goodwill and long-lived asset impairments | | | 24 | | | | 35 | | | | 133 | | | | (31.4 | ) | | | (73.7 | ) |
Other | | | (2 | ) | | | (2 | ) | | | 1 | | | NM | | | NM | |
Total operating expenses | | | 4,139 | | | | 4,225 | | | | 3,899 | | | | (2.0 | ) | | | 8.4 | |
Income from operations | | | 1,268 | | | | 708 | | | | 1,312 | | | | 79.1 | | | | (46.0 | ) |
Gain on bargain purchase | | | - | | | | - | | | | 56 | | | | | | | |
Income from equity method investments, net | | | 70 | | | | 104 | | | | 153 | | | | | | | |
Interest expense, net | | | (444 | ) | | | (447 | ) | | | (337 | ) | | | | | | |
Pension and other postretirement plans credit, net | | | 27 | | | | 36 | | | | 43 | | | | | | | |
Gain on disposal of an investment | | | 40 | | | | - | | | | - | | | | | | | |
Other expenses, net | | | (2 | ) | | | - | | | | (10 | ) | | | | | | |
Income before income taxes | | | 959 | | | | 401 | | | | 1,217 | | | | | | | |
Income tax expense | | | (276 | ) | | | (131 | ) | | | (274 | ) | | | | | | |
Net income | | | 683 | | | | 270 | | | | 943 | | | | | | | |
Net loss attributable to noncontrolling interests | | | 39 | | | | 76 | | | | 28 | | | | | | | |
Net income attributable to Nexstar Media Group, Inc. | | $ | 722 | | | $ | 346 | | | $ | 971 | | | | | | | |
NM = Not Meaningful
Year Ended December 31, 2024 Compared to Year Ended December 31, 2023
The Company’s revenues increased 9.6% for the year ended December 31, 2024, compared to the same period in 2023, primarily due to higher revenues from political advertising and distribution, partially offset by lower revenue from non-political advertising.
Distribution revenue increased by $201 million primarily due to a dispute with an MVPD which caused Nexstar stations to be dark for 76 days during third quarter in 2023, the benefit of distribution contract renewals in 2023 on terms favorable to the Company, annual rate escalators, growth in vMVPDs subscribers, the addition of CW affiliations on certain of our stations, and the return of partner stations on one MVPD in January, which more than offset MVPD subscriber attrition.
Advertising revenue increased by $294 million primarily due to an increase of $426 million in political advertising as 2024 is an election year, offset in part by a decrease in non-political revenue of $132 million due to ongoing advertising market softness and political crowd-out.
Direct operating expenses, consisting primarily of programming, news and technical expenses, and selling, general and administrative expenses increased by $58 million primarily due to increased news expenses related to expansion of news programming, programming expenses primarily due to lower variable programming expenses in 2023 as a result of the period when Nexstar stations were dark, stock-based compensation expense from new restricted stock grants and the timing of restricted stock grants, and direct digital operating expenses, partially offset by lower expense from various administrative expenses.
Depreciation and amortization expense decreased by $133 million, as follows:
•Amortization of broadcast rights was $324 million for the year ended December 31, 2024 compared to $453 million for the same period in 2023, a decrease of $129 million, or 28.5%, primarily due to $117 million lower amortization of broadcast rights at The CW of $259 million in 2024 from $376 million in 2023.
•Amortization of intangible assets was $299 million for the year ended December 31, 2024 compared to $311 million for the same period in 2023, a decrease of $12 million, or 3.9%, primarily due to impairment of certain long-lived intangible assets of a digital reporting unit in 2023.
•No significant change in the depreciation of property and equipment ($185 million in 2024 compared to $176 million in 2023).
In 2024, we recorded $24 million of goodwill impairment of a digital business. In 2023, we recorded $35 million of goodwill and intangible assets impairment of a digital business which resulted no remaining goodwill balance as of December 31, 2023. These charges resulted from our annual impairment review of assets in the fourth quarter of each year.
Income from equity method investments, net decreased by $34 million primarily due to a decrease in net income of TV Food Network, our largest equity method investment. TV Food Network’s net income decreased primarily due to a decrease in its advertising revenue. For additional information on our investment in TV Food Network, refer to Note 6 to Consolidated Financial Statements included in Part IV, Item 15(a) of this Annual Report on Form 10-K.
In February 2024, Nexstar received $40 million in cash proceeds, and recorded a gain on disposal of an investment for the same amount, in connection with BMI’s sale to New Mountain Capital.
The effective tax rates during the years ended December 31, 2024 and 2023 were 28.8% and 32.7%, respectively. Changes in the valuation allowance resulted in a 2.3% decrease to the effective tax rate. Other permanent differences, including a reduction in losses related to the minority interest in The CW, resulted in a 3.1% decrease to the effective tax rate. This is partially offset by provision to return and other reserve adjustments which resulted in a 1.6% increase in the effective tax rate.
Year Ended December 31, 2023 Compared to Year Ended December 31, 2022
The Company’s revenues decreased 5.3% for the year ended December 31, 2023, compared to the same period in 2022, primarily due to lower revenue from political and non-political advertising, partially offset by higher revenues from distribution and incremental revenues from the acquisition of The CW on September 30, 2022.
Distribution revenue increased by $156 million primarily due to renewals of contracts in 2022 providing for higher rates per subscriber, scheduled annual escalation of rates per subscriber and incremental revenue from the acquisition of The CW, partially offset by the temporary disruption of a large MVPD for 76 days in the third quarter of 2023, the impact of the removal of partner stations from certain MVPDs related to continued negotiation and continued MVPD subscriber attrition.
Advertising revenue decreased by $468 million primarily due to a decrease of $440 million in political advertising as 2023 is not an election year and a decrease in non-political revenue of $123 million due to the combined effect of advertising market softness, the absence of first quarter advertising revenue from the Olympics on our NBC affiliate stations and an increase in advertising revenue during the first quarter from the Super Bowl aired on FOX, where we have more FOX-affiliated stations versus NBC-affiliated stations in the prior year, partially offset by incremental revenue from the acquisition of The CW of $95 million.
Direct operating expenses, consisting primarily of programming, news, and technical expenses, and selling, general and administrative expenses increased by $148 million. Excluding the incremental $74 million of operating expenses from our acquisition of The CW, direct operating and selling, general and administrative expenses increased by 2.5% primarily due to an increase in station programming costs from network affiliation renewals and annual increases in network affiliation costs, increased news programming at NewsNation and our local stations as well as increased digital sales and administrative expenses, partially offset by a decrease in commission incurred from national representation due to a decrease in political advertising revenue.
Depreciation and amortization expense increased by $279 million, as follows:
•Amortization of broadcast rights was $453 million for the year ended December 31, 2023 compared to $193 million for the same period in 2022, an increase of $260 million, or 134.7%, primarily due to incremental programming expenses from our acquisition of The CW of $286 million, partially offset by a reduction in the television stations’ broadcast rights costs of $26 million.
•Depreciation of property and equipment was $176 million for the year ended December 31, 2023 compared to $160 million for the same period in 2022, an increase of $16 million, or 10.0%. The increase was primarily due to newly capitalized assets.
•No significant change in the amortization of intangible assets ($311 million in 2023 compared to $309 million in 2022).
In 2023 and 2022, we recorded $35 million and $96 million, respectively, of goodwill and intangible assets impairment on our product review and recommendation platform reporting unit. The Company’s assessment indicated that the reporting unit’s carrying amount exceeded its fair value, and therefore an impairment loss was identified and recorded in the fourth quarter of 2023 and 2022, respectively. As of December 31, 2023, this reporting unit has no remaining goodwill balance.
In 2022 certain real estate properties located in Chicago were sold and written down to their estimated fair value, less cost to sell, resulting in the Company’s recognition of impairment charges of $37 million in the fourth quarter of 2022.
Income from equity method investments, net decreased by $49 million primarily due to a decrease in net income of TV Food Network, our largest equity method investment. TV Food Network’s net income decreased primarily due to a decrease in its advertising revenue driven by a weaker advertising market. For additional information on our investment in TV Food Network, refer to Note 6 to Consolidated Financial Statements included in Part IV, Item 15(a) of this Annual Report on Form 10-K.
Interest expense, net was $447 million for the year ended December 31, 2023 compared to $337 million for the same period in 2022, an increase of $110 million, or 32.6%, primarily due to increases in interest rates in the Company’s outstanding loans under its senior secured credit facilities, partially offset by decreases in interest expense from debt repayments and lower interest rates obtained in connection with the refinancing of certain of our term loans in June 2022. Interest rates on outstanding loans under the Company’s senior secured credit facilities ranged from 6.85% to 7.85% as of December 31, 2023, compared to interest rates ranging from 5.86% to 6.89% as of December 31, 2022. These interest rates were a mixture of SOFR plus Credit Spread Adjustment (“CSA”) used to account for the difference between SOFR and London Interbank Offered Rate (“LIBOR”), plus applicable margin in 2023 compared to a mixture of SOFR plus CSA plus applicable margin and U.S. LIBOR plus applicable margin in 2022.
Income tax expense was $131 million for the year ended December 31, 2023 compared to an income tax expense of $274 million for the same period in 2022, a decrease of $143 million. The effective tax rates during the years ended December 31, 2023 and 2022 were 32.7% and 22.5%, respectively. Nexstar reported permanent differences, including an adjustment for losses related to the minority interest in The CW, resulting in an incremental income tax expense of $44 million or a 7.2% increase to the effective tax rate. Also, changes in the valuation allowance resulted in an incremental income tax expense of $15 million, or a 2.9% increase to the effective tax rate in 2023.
Liquidity and Capital Resources
The Company is leveraged, which makes it vulnerable to changes in general economic conditions. The Company’s ability to repay or refinance its debt will depend on, among other things, financial, business, market, competitive and other conditions, many of which are beyond the Company’s control. The Company’s primary sources of liquidity include cash on hand, borrowing capacity under its revolving credit facilities (with a maturity date of June 2027) and cash generated from operations. The Company believes these sources of liquidity are sufficient to meet its business operating requirements, its capital expenditures and to continue to service its debt for at least the next 12 months as of the filing date of this Annual Report on Form 10-K. As of December 31, 2024, the Company was in compliance with the financial covenants contained in the amended credit agreements governing its senior secured credit facilities.
Any future adverse economic conditions, including those resulting from heightened and sustained inflation and higher interest rates, could adversely affect the Company’s future operating results, cash flows and financial condition.
Cash Flow Summary
The following tables present the Company’s total operating, investing and financing activity cash flows for the three years ended December 31 (in millions):
| | | | | | | | | | | | |
| | 2024 | | | 2023 | | | 2022 | |
Net cash provided by operating activities | | $ | 1,250 | | | $ | 999 | | | $ | 1,403 | |
Net cash provided by (used in) investing activities(1) | | | (102 | ) | | | (173 | ) | | | 125 | |
Net cash used in financing activities | | | (1,151 | ) | | | (899 | ) | | | (1,515 | ) |
Net increase (decrease) in cash, cash equivalents and restricted cash | | $ | (3 | ) | | $ | (73 | ) | | $ | 13 | |
Cash paid for interest | | $ | 431 | | | $ | 437 | | | $ | 330 | |
Income taxes paid, net of refunds(2) | | $ | 254 | | | $ | 169 | | | $ | 370 | |
(1)In 2024, 2023 and 2022, the investing activities included total capital expenditures of $145 million, $149 million and $157 million.
(2)In 2024, income taxes paid, net of refunds, includes $11 million in tax payments related to a gain from disposal of an investment. In 2022, income taxes paid, net of refunds, includes $48 million in tax payments related to various sales of real estate properties.
| | | | | | | | |
| | As of December 31, | |
| | 2024 | | | 2023 | |
Cash, cash equivalents and restricted cash | | $ | 144 | | | $ | 147 | |
Cash Flows—Operating Activities
Net cash provided by operating activities increased by $251 million during the year ended December 31, 2024 compared to the same period in 2023. This was primarily due to an increase in sources of cash from (i) an increase in operating income (excluding non-cash transactions) of $432 million and (ii) a decrease in payments for broadcast rights of $92 million, partially offset by (i) a decrease in distribution from our equity investment in TV Food Network of $116 million, (ii) higher income taxes paid of $85 million and (iii) timing of receipts and payables of $78 million.
Operating income increased primarily due to higher revenue from political advertising and distribution, partially offset by a decrease in non-political advertising revenue. Payments for broadcast rights decreased primarily due to the acquisition of less expensive programming, partially offset by new sports programming, at The CW. Distribution from our equity investment in TV Food Network decreased primarily due to a decrease in the investee’s operating cash flow driven by a weaker advertising revenue market.
Net cash provided by operating activities decreased by $404 million during the year ended December 31, 2023 compared to the same period in 2022. This was primarily due to a decrease in operating income (excluding non-cash transactions) of $417 million, an increase in payments for broadcast rights of $173 million, higher interest payments of $107 million and timing of accounts receivable collections of $42 million. These decreases were partially offset by sources of cash resulting from timing of payments to our vendors of $110 million, lower income tax payments of $201 million and an increase in distribution from our equity investment in TV Food Network of $20 million.
Operating income decreased primarily due to lower revenue from political and non-political advertising, partially offset by higher revenues from distribution. The increase in payments for broadcast rights was due to incremental payments from our acquisition of The CW (acquired on September 30, 2022) of $211 million, partially offset by a decrease in payments for our syndicated programming of $38 million. The increase in interest payments was primarily due to higher interest rates on our floating interest rate loans under our senior secured credit facilities, partially offset by decreases in interest expense from debt repayments and lower interest rates obtained in connection with the refinancing of certain of our term loans in June 2022. The decrease in tax payments was primarily driven by lower operating results and tax payments in 2022 from the sale of certain real estate properties.
Cash Flows—Investing Activities
Net cash used in investing activities was $102 million and $173 million during the years ended December 31, 2024 and 2023, respectively. Net cash provided by investing activities during the year ended December 31, 2022 was $125 million.
Net cash flows used in investing activities decreased by $71 million during the year ended December 31, 2024, compared to the same period in 2023. This was primarily due to the proceeds received from the disposal of an investment in connection with BMI’s sale to New Mountain Capital of $40 million and a decrease in uses of cash from payment of acquisitions of $38 million.
Net cash flows used in investing activities increased by $298 million during the year ended December 31, 2023, compared to the same period in 2022. This was primarily due to a decrease in sources of cash from the proceeds received from the sale of certain real estate properties of $241 million and cash acquired from The CW acquisition of $29 million in 2022. In 2023, we spent $38 million in the acquisitions of KUSI-TV and WSNN-LD.
Cash Flows—Financing Activities
Net cash used in financing activities for the years ended December 31, 2024, 2023 and 2022 was $1,151 million, $899 million and $1,515 million, respectively.
Net cash flows used in financing activities increased by $252 million during the year ended December 31, 2024, compared to the same period in 2023. This was primarily due to the prepayment of Term Loan B of $203 million, a $43 million decrease in contributions from noncontrolling interests and a $28 million increase in common stock dividends paid, offset in part by a lower cash paid for shares withheld for taxes of $16 million.
Net cash flows used in financing activities decreased by $616 million during the year ended December 31, 2023, compared to the same period in 2022. This was primarily due to the lower debt payments of $363 million (in 2022, we prepaid a portion of the outstanding principal balance of our Term Loan B of $333 million, made scheduled principal payments on term loans of $84 million, repurchased and cancelled $71 million of our senior unsecured notes compared to $125 million payment of scheduled principal maturities of our term loans in 2023), a decrease in stock buybacks of $276 million and an increase in contributions from noncontrolling interests of $32 million, offset in part by an increase in common stock dividends paid of $49 million.
Material Cash Requirements
The Company is a party to many contractual obligations involving commitments to make payments to third parties. Certain contractual obligations are recorded on the Consolidated Balance Sheet as of December 31, 2024, while others are considered future commitments. The following summarizes the Company’s contractual obligations as of December 31, 2024, and the effect such obligations are expected to have on the Company’s short-term and long-term liquidity and capital resource needs (in millions):
| | | | | | | | | | | | | | | | | | | | |
| | | | | Payments Due by Period | |
| | Total | | | 2025 | | | 2026 - 2027 | | | 2028 - 2029 | | | Thereafter | |
Recorded contractual obligations: | | | | | | | | | | | | | | | |
Nexstar senior secured credit facility | | $ | 3,479 | | | $ | 121 | | | $ | 3,358 | | | $ | - | | | $ | - | |
Mission senior secured credit facility | | | 352 | | | | 3 | | | | 68 | | | | 281 | | | | - | |
5.625% senior unsecured notes due 2027 | | | 1,714 | | | | - | | | | 1,714 | | | | - | | | | - | |
4.75% senior unsecured notes due 2028 | | | 1,000 | | | | - | | | | - | | | | 1,000 | | | | - | |
Operating lease obligations | | | 359 | | | | 49 | | | | 89 | | | | 76 | | | | 145 | |
Finance lease obligations | | | 20 | | | | 2 | | | | 4 | | | | 4 | | | | 10 | |
Broadcast rights current cash commitments(1) | | | 113 | | | | 97 | | | | 15 | | | | 1 | | | | - | |
Other(2)(3) | | | 15 | | | | 14 | | | | 1 | | | | - | | | | - | |
Unrecorded contractual obligations: | | | | | | | | | | | | | | | |
Network affiliation agreements(4) | | | 1,616 | | | | 950 | | | | 665 | | | | 1 | | | | - | |
Cash interest on debt(5) | | | 1,088 | | | | 424 | | | | 616 | | | | 48 | | | | - | |
Executive employee contracts(6) | | | 105 | | | | 58 | | | | 47 | | | | - | | | | - | |
Broadcast rights future cash commitments(7) | | | 1,127 | | | | 238 | | | | 338 | | | | 293 | | | | 258 | |
Other | | | 174 | | | | 61 | | | | 99 | | | | 8 | | | | 6 | |
| | $ | 11,162 | | | $ | 2,017 | | | $ | 7,014 | | | $ | 1,712 | | | $ | 419 | |
(1)Future minimum payments for license agreements for which the license period has begun and liabilities have been recorded.
(2)As of December 31, 2024, we had $33 million of unrecognized tax benefits, inclusive of interest and certain deduction benefits. This liability represents an estimate of tax positions that the Company has taken in its tax returns, which may ultimately not be sustained upon examination by the tax authorities. The resolution of these tax positions may not require cash settlement due to the existence of federal and state NOLs. As such, our contractual obligations table above excludes this liability.
(3)As of December 31, 2024, we had $186 million and $17 million of funding obligations with respect to our pension benefit plans and other postretirement benefit plans, respectively, which are not included in the table above. See Note 10 to our Consolidated Financial Statements included in Part IV, Item 15(a) of this Annual Report on Form 10-K for further information regarding our funding obligations for these benefit plans.
(4)Future minimum payments for network affiliation agreements during the contract period. Excludes network affiliation agreements between the Company’s stations and The CW as the related fees are eliminated in consolidation.
(5)Estimated interest payments due as if all debt outstanding as of December 31, 2024 remained outstanding until maturity, based on interest rates in effect at December 31, 2024.
(6)Includes the employment contracts for all corporate executive employees and general managers of our stations and entities. We expect our contracts will be renewed or replaced with similar agreements upon their expiration. Amounts included in the table above assume that contracts are not terminated prior to their expiration.
(7)Future minimum payments for license agreements for which the license period has not commenced and no liability has been recorded.
From January 1 to February 27, 2025, we repurchased 112,582 shares of our common stock for $17 million, funded by cash on hand. As of the date of filing this Annual Report on Form 10-K, the remaining available amount under the share repurchase authorization was $1.5 billion.
On January 29, 2025, our board of directors approved a 10% increase in the quarterly cash dividend to $1.86 per share of our common stock beginning with the dividend declared for the first quarter of 2025. The dividend was paid on February 26, 2025 to stockholders of record on February 12, 2025.
Long-term debt
As of December 31, 2024, the Company had total outstanding debt of $6.5 billion, net of unamortized financing costs, discounts and premium, which represented 74.3% of the Company’s combined capitalization. The Company’s high level of debt requires that a substantial portion of cash flow be dedicated to pay principal and interest on debt, which reduces the funds available for working capital, capital expenditures, acquisitions and other general corporate purposes.
| | | | | | | | |
| | As of December 31, | |
(dollars in millions) | | 2024 | | | 2023 | |
Nexstar senior secured credit facility | | $ | 3,479 | | | $ | 3,804 | |
Mission senior secured credit facility | | | 352 | | | | 354 | |
5.625% Notes, due July 2027 | | | 1,714 | | | | 1,714 | |
4.75% Notes, due November 2028 | | | 1,000 | | | | 1,000 | |
Total outstanding principal | | | 6,545 | | | | 6,872 | |
Less: Unamortized financing costs, discounts and premium, net | | | (22 | ) | | | (35 | ) |
Total outstanding debt | | $ | 6,523 | | | $ | 6,837 | |
| | | | | | |
Unused revolving loan commitments under senior secured credit facilities (1) | | $ | 545 | | | $ | 544 | |
(1)Based on the covenant calculations as of December 31, 2024, all of the $531 million (net of outstanding standby letters of credit of $19 million) and $14 million unused revolving loan commitments under the respective Nexstar and Mission senior secured credit facilities were available for borrowing.
We (excluding The CW) guarantee full payment of all obligations incurred under Mission’s senior secured credit facility in the event of its default. Mission is a guarantor of our senior secured credit facility, our 5.625% Notes, due July 2027 and our 4.75% Notes, due November 2028. In consideration of our guarantee of Mission’s senior secured credit facility, Mission has granted us purchase options to acquire the assets and assume the liabilities of each Mission station, subject to FCC consent. These option agreements (which expire on various dates between 2025 and 2034) are freely exercisable or assignable by us without consent or approval by Mission or its shareholders. We expect these option agreements to be renewed upon expiration.
We make semiannual interest payments on the 5.625% Notes, due July 2027 on January 15 and July 15 of each year. We make semiannual interest payments on our 4.75% Notes, due November 2028 on May 1 and November 1 of each year. Interest payments on our and Mission’s senior secured credit facilities are generally paid every one to three months and are payable based on the type of interest rate selected.
The terms of our and Mission’s senior secured credit facilities, as well as the indentures governing our 5.625% Notes, due July 2027 and 4.75% Notes, due November 2028, limit, but do not prohibit us or Mission from incurring substantial amounts of additional debt in the future. Our senior secured credit facilities and the indentures governing our existing notes may limit the amount of dividends we may pay to stockholders and share repurchases we may make over the term of the agreement.
The Company does not have any rating downgrade triggers that would accelerate the maturity dates of its debt. However, a downgrade in the Company’s credit rating could adversely affect its ability to renew the existing credit facilities, obtain access to new credit facilities or otherwise issue debt in the future and could increase the cost of such debt.
The Company’s ability to access funds under its senior secured credit facilities depends, in part, on its compliance with certain financial covenants. Any additional drawings under the senior secured credit facilities will reduce the Company’s future borrowing capacity and the amount of total unused revolving loan commitments. Any future adverse economic conditions, including those resulting from heightened and sustained inflation and higher interest rates, could adversely affect our future operating results and cash flows and may cause us to seek alternative sources of funding, including accessing capital markets, subject to market conditions. Such alternative sources of funding may not be available on commercially reasonable terms or at all.
Our credit agreement contains a covenant which requires us to comply with a maximum consolidated first lien net leverage ratio of 4.25 to 1.00. The financial covenant, which is formally calculated on a quarterly basis, is based on the Company’s combined results. The Mission amended credit agreement does not contain financial covenant ratio requirements but does provide for default in the event we do not comply with all covenants contained in our credit agreement. As of December 31, 2024, we were in compliance with our financial covenants. We believe the Company will be able to maintain compliance with all covenants contained in the credit agreements governing its senior secured facilities and the indentures governing Nexstar’s 5.625% Notes, due July 2027 and Nexstar’s 4.75% Notes, due November 2028 for a period of at least the next 12 months as of the filing date of this Annual Report on Form 10-K.
Off-Balance Sheet Arrangements
As of December 31, 2024, we did not have any relationships with unconsolidated entities or financial partnerships, such as entities often referred to as structured finance or VIEs, which would have been established for the purpose of facilitating off-balance sheet arrangements or other contractually narrow or limited purposes. All of our arrangements with our VIEs in which we are the primary beneficiary are on-balance sheet arrangements. Our variable interests in other entities are obtained through local service agreements, which have valid business purposes and transfer certain station activities from the station owners to us. We are, therefore, not materially exposed to any financing, liquidity, market or credit risk that could arise if we had engaged in such relationships.
As of December 31, 2024, we have outstanding standby letters of credit with various financial institutions amounting to $19 million. The outstanding balance of standby letters of credit is deducted against our unused revolving loan commitment under our senior secured credit facility and would not be available for withdrawal.
Issuer and Guarantor Summarized Financial Information
Nexstar Media Inc. (the “Issuer”) is the issuer of 5.625% Notes, due July 2027 and 4.75% Notes, due November 2028. These notes are fully and unconditionally guaranteed, jointly and severally, by Nexstar Media Group, Inc. (“Parent”), Mission (a consolidated VIE) and the Subsidiary Guarantors (as defined below). The Issuer, Subsidiary Guarantors, Parent and Mission are collectively referred to as the “Obligor Group” for the 5.625% Notes, due July 2027 and 4.75% Notes, due November 2028. “Subsidiary Guarantors” refers to certain of the Issuer’s restricted subsidiaries (excluding The CW) that guarantee these notes. The guarantees of the notes are subject to release in limited circumstances upon the occurrence of certain customary conditions set forth in the indentures governing the 5.625% Notes, due July 2027 and the 4.75% Notes, due November 2028. The 5.625% Notes, due July 2027 and 4.75% Notes, due November 2028 are not registered with the SEC.
The following combined summarized financial information is presented for the Obligor Group after elimination of intercompany transactions between Parent, Issuer, Subsidiary Guarantors and Mission in the Obligor Group and amounts related to investments in any subsidiary that is a non-guarantor. This information is not intended to present the financial position or results of operations of the consolidated group of companies in accordance with U.S. GAAP.
Summarized Balance Sheet Information for the Obligor Group as of December 31 (in millions):
| | | | | | | |
| December 31, 2024 | | | December 31, 2023 | |
Current assets – external(1) | $ | 1,149 | | | $ | 1,246 | |
Current assets – due from consolidated entities outside of Obligor Group | | 11 | | | | 7 | |
Total current assets | $ | 1,160 | | | $ | 1,253 | |
Noncurrent assets – external(1)(2) | | 9,066 | | | | 9,429 | |
Noncurrent assets – due from consolidated entities outside of Obligor Group | | 74 | | | | 75 | |
Total noncurrent assets | $ | 9,140 | | | $ | 9,504 | |
Total current liabilities(1) | $ | 685 | | | $ | 818 | |
Total noncurrent liabilities(1) | $ | 8,387 | | | $ | 8,775 | |
Noncontrolling interests | $ | - | | | $ | - | |
(1)Excludes the assets and liabilities of The CW as it is not a guarantor of the 4.75% Notes, due November 2028 and 5.625% Notes, due July 2027. On September 30, 2022, Nexstar acquired a 75.0% ownership interest in The CW (see Note 3, “Acquisitions” to our Consolidated Financial Statements included in Part IV, Item 15(a) of this Annual Report on Form 10-K for additional information).
(2)Excludes Issuer’s equity investments of $877 million and $958 million as of December 31, 2024 and 2023, respectively, in unconsolidated investees. These unconsolidated investees do not guarantee the 4.75% Notes, due November 2028 and 5.625% Notes, due July 2027. For additional information on equity investments, refer to Note 6 to our Consolidated Financial Statements included in Part IV, Item 15(a) of this Annual Report on Form 10-K for additional information.
Summarized Statements of Operations Information for the Obligor Group (in millions):
| | | |
| Year Ended | |
| December 31, 2024 | |
Net revenue – external | $ | 5,207 | |
Net revenue – from consolidated entities outside of Obligor Group | | 16 | |
Total net revenue | | 5,223 | |
Costs and expenses – external | | 3,746 | |
Costs and expenses – to consolidated entities outside of Obligor Group | | 62 | |
Total costs and expenses | | 3,808 | |
Income from operations | $ | 1,415 | |
Net income | $ | 756 | |
Net income attributable to Obligor Group | $ | 756 | |
Income from equity method investments, net | $ | 70 | |
Critical Accounting Estimates
Our Consolidated Financial Statements have been prepared in accordance with U.S. GAAP, which requires us to make estimates and assumptions that affect the reported amounts of assets and liabilities, revenue and expenses and related disclosures. On an ongoing basis, we base our estimates on historical experience and on various other assumptions that we believe to be reasonable under the circumstances. Actual results may differ from those estimates, and any such differences could be material to our Consolidated Financial Statements.
For a summary of our significant accounting policies, we refer you to Note 2 to our Consolidated Financial Statements in Part IV, Item 15(a) of this Annual Report on Form 10-K.
We believe the following critical accounting estimates are those that are the most important to the presentation of our Consolidated Financial Statements, affect our more significant estimates and assumptions, and require the most subjective or complex judgments by management.
Consolidation of Variable Interest Entities
We regularly evaluate our local service agreements and other arrangements where we may have variable interests to determine whether we are the primary beneficiary of a VIE. Under U.S. GAAP, a company must consolidate an entity when it has a “controlling financial interest” resulting from ownership of a majority of the entity’s voting rights. Accounting rules expanded the definition of controlling financial interest to include factors other than equity ownership and voting rights.
In applying accounting and disclosure requirements, we must base our decision to consolidate an entity on quantitative and qualitative factors that indicate whether or not we have the power to direct the activities of the entity that most significantly affect its economic performance and whether or not we have the obligation to absorb losses of the entity or the right to receive benefits from the entity that could potentially be significant to the VIE. Our evaluation of the “power” and “economics” model must be an ongoing process and may alter as facts and circumstances change.
Mission and the other consolidated VIEs are included in our Consolidated Financial Statements because we are deemed to have controlling financial interests in these entities as VIEs for financial reporting purposes as a result of (i) local service agreements we have with the stations they own, (ii) Nexstar’s (excluding The CW) guarantee of the obligations incurred under Mission’s senior secured credit facility, (iii) our power over significant activities affecting these entities’ economic performance, including budgeting for advertising revenue, advertising sales and, in some cases, hiring and firing of sales force personnel and (iv) purchase options granted by each consolidated VIE which permit Nexstar to acquire the assets and assume the liabilities of all of these VIEs’ stations at any time, subject to FCC consent. These purchase options are freely exercisable or assignable by Nexstar without consent or approval by the VIEs. These option agreements expire on various dates between 2025 and 2034. We expect to renew these option agreements upon expiration. Therefore, these VIEs are consolidated into these financial statements.
Valuation of Goodwill and Intangible Assets
Intangible assets represented $7.7 billion, or 67.1%, of our total assets as of December 31, 2024. Intangible assets consist primarily of goodwill, indefinite-lived intangible assets (such as FCC licenses), and definite-lived intangible assets (such as network affiliation agreements).
The purchase prices of acquired businesses are allocated to the assets and liabilities acquired at estimated fair values at the date of acquisition using various valuation techniques, including discounted projected cash flows, the replacement cost approach and other income, market or cost approaches.
The estimated fair value of an FCC license acquired in a business combination is calculated using a discounted projected cash flow model referred to as the Greenfield Method. The Greenfield Method attempts to isolate the income that is attributable to the license alone. This approach is based upon modeling a hypothetical start-up station and building it up to a normalized operation that, by design, lacks an affiliation with a network (commonly known as an independent station), lacks inherent goodwill and whose other assets have essentially been added as part of the build-up process. The Greenfield Method assumes annual cash flows over a projection period model. Inputs to this model include, but are not limited to, (i) a four-year build-up period for a start-up station to reach a normalized state of operations, (ii) television market long-term revenue growth rate over a projection period, (iii) estimated market revenue share for a typical market participant without a network affiliation, (iv) estimated profit margins based on industry data, (v) capital expenditures based on the size of market and the type of station being constructed, (vi) estimated tax rates in the appropriate jurisdiction, and (vii) an estimated discount rate using a weighted average cost of capital analysis. The Greenfield Method also includes an estimated terminal value by discounting an estimated annual cash flow with an estimated long-term growth rate.
The assumptions used in estimating the fair value of a network affiliation agreement acquired in a business combination are similar to those used in the valuation of an FCC license. The Greenfield Method is also utilized in the valuation of network affiliation agreements except that the estimated market revenue share, estimated profit margins, capital expenditures and other assumptions reflect a market participant premium based on the programming of a network affiliate relative to an independent station. This approach would result in an estimated collective fair value of the FCC license and a network affiliation agreement. The excess of the estimated fair value in this model over the estimated value of an FCC license of an independent station under the Greenfield Method represents the estimated fair value of a network affiliation agreement.
Goodwill represents the excess of the purchase price of a business over the fair value of the net assets acquired.
Subsequent to acquisition, goodwill and FCC licenses are tested for impairment in the fourth quarter each year, or more frequently whenever events or changes in circumstances indicate that such assets might be impaired. For purposes of goodwill impairment tests, the Company has one aggregated television stations reporting unit, because of the stations’ similar economic characteristics, one cable network reporting unit and two digital business reporting units. The Company’s impairment review for FCC licenses is performed at the television station market level.
The Company first assesses the qualitative factors to determine the likelihood of goodwill and FCC licenses being impaired. The qualitative impairment test includes, but is not limited to, assessing the changes in macroeconomic conditions, regulatory environment, industry and market conditions, and the financial performance versus budget of the reporting units, as well as any other events or circumstances specific to the reporting unit or the FCC licenses. If it is more likely than not that the fair value of a reporting unit or an FCC license is greater than its respective carrying amount, no further testing will be required. Otherwise, the quantitative impairment test method is applied.
The quantitative impairment test for goodwill is performed by comparing the fair value of a reporting unit with its carrying amount. If the fair value of the reporting unit exceeds its carrying value, goodwill is not impaired and no further testing is required. If the fair value of the reporting unit is less than the carrying value, an impairment charge is recognized for the amount by which the carrying amount exceeds the reporting unit’s fair value; however, the loss recognized should not exceed the total amount of goodwill allocated to that reporting unit. The quantitative impairment test for FCC licenses consists of a market-by-market comparison of the carrying amounts of FCC licenses with their fair values, using the Greenfield Method of discounted cash flow analysis. An impairment is recorded when the carrying value of an FCC license exceeds its fair value.
We test our definite-lived intangible assets and other long-lived assets to be held and used for impairment whenever events or circumstances indicate that their carrying amount may not be recoverable, relying on certain factors including operating results, business plans, economic projections and anticipated future cash flows. The carrying value of a long-lived asset or asset group is considered impaired when the projected future undiscounted cash flows to be generated from the asset or asset group over its remaining life, or primary asset’s life, plus any proceeds from the eventual disposition are less than its carrying value. The Company measures impairment based on the amount by which the carrying value exceeds the estimated fair value of the long-lived asset or asset group. The fair value is determined primarily by using the projected future cash flows discounted at a rate commensurate with the risk involved as well as market valuations.
In the fourth quarter of 2024, using the qualitative impairment test, the Company performed its annual impairment assessment on goodwill attributable to its aggregated television stations reporting unit. Based on the results of such qualitative impairment tests, the Company concluded that it was more likely than not that the reporting unit’s fair value would sufficiently exceed the related carrying amount.
With respect to goodwill allocated to the cable network reporting unit and a digital reporting unit, the Company elected to perform quantitative impairment tests due to recent performance and uncertain economic conditions.
The Company’s assessment indicated that the cable network reporting unit’s fair value exceeded its carrying amount by approximately 15%, therefore no impairment was recorded. The fair value estimate is management’s estimate based on a valuation report prepared by a third-party valuation firm who used a combination of an income approach, which employs a discounted cash flow model, and a market approach, which considers earnings multiples of comparable publicly traded businesses and comparable market transactions. The income approach was based on a five-year projection model which included assumptions regarding continued growth of viewership at a declining rate of growth over time and monetization thereof, continued growth in distribution revenues and annual increases in operating expenses. The income approach utilized the Company’s income tax rate, an 11% discount rate based on an analysis of comparable companies and a modest terminal growth rate typical of mature cable network businesses. The market approach based the valuation on earnings multiples of comparable publicly traded businesses with cable networks and comparable cable network transactions. The likelihood of a material impairment is mitigated by the maturity of the network and its significant contractual distribution revenue.
With respect to the digital reporting unit, the Company’s assessment indicated that its fair value was less than its carrying amount, therefore the Company recorded a goodwill impairment of $24 million. The remaining goodwill associated with this reporting unit was $45 million as of December 31, 2024. The fair value estimate is management’s estimate based on a valuation report prepared by a third-party valuation firm who used a combination of an income approach, which employs a discounted cash flow model, and a market approach. The income approach was based on a five-year projection model which included assumptions regarding the recovery of the business from a low in 2024 due to market and other factors to a full recovery to 2022 levels between year 3 and year 5 and then growth thereafter. The income approach utilized the Company’s income tax rate, a 12% discount rate based on an analysis of comparable companies and a modest terminal growth rate typical of mature digital businesses. The market approach based the valuation on earnings multiples of comparable publicly traded digital media businesses and market net revenue multiples of comparable digital media transactions. The likelihood of a material impairment is mitigated by the remaining amount of goodwill.
During the years ended December 31, 2023 and 2022, the Company recorded a goodwill impairment of $19 million (and $16 million impairment on definite-lived intangible assets) and a goodwill impairment of $91 million (and $5 million impairment on definite-lived intangible assets), respectively, attributable to another digital unit. As of December 31, 2023, this reporting unit has no remaining book value of goodwill and definite-lived intangible assets.
Our quantitative goodwill impairment tests are sensitive to changes in key assumptions used in our analysis. In our income approach models, if our projections of revenue growth rates and margins are not realized, if market factors outside of our control, such as increases in discount rates, occur, or if management’s expectations or plans change, including changes to a reporting unit’s long-term operating plans, the Company’s goodwill and other key assets could be impaired in the future. With respect to net revenue and earnings multiples, the key uncertainties are determining the reporting unit’s comparable public companies, comparable transactions and the selection of the market multiples.
The Company performed its annual impairment assessment on FCC licenses for each television station market using the qualitative impairment test. Based on the results of such qualitative impairment tests, the Company concluded that it was more likely than not that their fair values would sufficiently exceed the related carrying amount.
The Company also evaluated its definite-lived intangible assets and other long-lived assets whether events or changes in circumstances indicate that such assets may be impaired. Based on our estimate of undiscounted future pre-tax cash flows expected to result from the use and eventual disposition of these assets, the Company determined that the carrying amounts are recoverable. No other events or circumstances were noted in 2024 that would indicate impairment.
Valuation of Investments
We account for investments in which we own at least 20% of an investee’s voting securities or we have significant influence over an investee under the equity method of accounting. We record equity method investments at cost. For investments acquired in a business combination, the cost is the estimated fair value allocated to the investment.
We evaluate our equity method investments for other-than temporary impairment (“OTTI”) on at least a quarterly basis, and more frequently when economic or market conditions warrant such an evaluation. In 2024, the Company evaluated its equity method investments for OTTI and none was identified. The Company will continue to evaluate its equity method investments for OTTI in future periods.
Pension plans and other postretirement benefits
A determination of the liabilities and cost of Nexstar’s pension and other postretirement plans (“OPEB”) requires the use of assumptions. The actuarial assumptions used in the pension and postretirement reporting are reviewed annually with independent actuaries and are compared with external benchmarks, historical trends and Nexstar’s own experience to determine that its assumptions are reasonable. The assumptions used in developing the required estimates include the following key factors:
•expected return on plan assets
As of December 31, 2024, the effective discount rate used for determining pension benefit obligations was 5.45%. During 2024, the assumptions utilized in determining net periodic benefit credit on our pension plans were (i) 5.26% to 6.05% expected rate of return on plan assets and (ii) 4.78% effective discount rates. As of December 31, 2024, our pension plans’ benefit obligations were $1.6 billion. For the year ended December 31, 2024, our pension plans’ net periodic benefit credit was $27 million. As of December 31, 2024, a 1% change in the discount rates would have the following effects (in millions):
| | | | | | | | |
|
| 1% Increase |
|
| 1% Decrease |
|
Projected impact on net periodic benefit credit |
| $ | 2 |
|
| $ | (6) | |
Projected impact on pension benefit obligations |
|
| (114) | |
|
| 131 |
|
For additional information on our pension and OPEB, see Note 10 to our Consolidated Financial Statements included in Part IV, Item 15(a) of this Annual Report on Form 10-K.
Distribution Revenue
We earn revenues from MVPDs and vMVPDs for the retransmission of our broadcasts and the carriage of NewsNation. These revenues are generally earned based on a price per subscriber of the distributor within the retransmission or carriage area. The distributors report their subscriber numbers to us generally on a 30- to 60-day lag, generally upon payment of the fees due to us. Prior to receiving the reports, we record revenue based on management’s estimate of the number of subscribers, utilizing historical levels and trends of subscribers for each distributor. Adjustments associated with the resolution of such estimates have, historically, been inconsequential.
Income Taxes
We account for income taxes under the asset and liability method, which requires the recognition of deferred tax assets and liabilities for the expected future tax consequences of temporary differences between the carrying amounts and tax basis of assets and liabilities. A valuation allowance is applied against net deferred tax assets if, based on the weight of available evidence, it is more likely than not that some or all of the deferred tax assets will not be realized. While we have considered future taxable income in assessing the need for a valuation allowance, in the event that we were to determine that we would not be able to realize all or part of our deferred tax assets in the future, an adjustment to the valuation allowance would be charged to income in the period such a determination was made.
We recognize the tax benefit from an uncertain tax position only if it is more likely than not that the tax position will be sustained on examination by the taxing authorities. The determination is based on the technical merits of the position and presumes that each uncertain tax position will be examined by the relevant taxing authority that has full knowledge of all relevant information. The estimate of the Company’s tax liabilities relating to uncertain tax positions requires management to assess uncertainties and to make judgments about the application of complex tax laws and regulations. We recognize interest and penalties relating to income taxes as components of income tax expense.
Recent Accounting Pronouncements
Refer to Note 2 of our Consolidated Financial Statements in Part IV, Item 15(a) of this Annual Report on Form 10-K for a discussion of recently issued accounting pronouncements, including our expected date of adoption and effects on results of operations and financial position.
Item 7A. Quantitative and Qualitative Disclosures About Market Risk
Interest Rate Risk
The Company’s exposure to market risk for changes in interest rates relates primarily to its long-term debt obligations.
The term loan borrowings under the Company’s senior secured credit facilities bear interest at rates ranging from 5.88% to 6.88% as of December 31, 2024, which represent (i) the base rate, the SOFR plus (ii) a credit spread adjustment, and (iii) the applicable margin, as defined. Interest is payable in accordance with the credit agreements.
Based on the outstanding balances of the Company’s senior secured credit facilities (term loans and revolving loans) as of December 31, 2024, an increase in each of SOFR by 100 basis points would increase our annual interest expense and decrease our cash flow from operations by $38 million (excluding tax effects). A decrease in each of SOFR by 100 basis points would decrease our annual interest expense and increase our cash flow from operations by $38 million (excluding tax effects). Our 5.625% Notes due July 2027 and 4.75% Notes due November 2028 are fixed rate debt obligations and therefore are not exposed to market interest rate changes. As of December 31, 2024, the Company has no financial instruments in place to hedge against changes in the benchmark interest rates on its senior secured credit facilities.
Item 8. Financial Statements and Supplementary Data
Our Consolidated Financial Statements are filed with this report. The Consolidated Financial Statements and Supplementary Data are included in Part IV, Item 15(a) of this Annual Report on Form 10-K.
Item 9. Changes in and Disagreements with Accountants on Accounting and Financial Disclosure
None.
Item 9A. Controls and Procedures
Evaluation of Disclosure Controls and Procedures
Nexstar’s management, with the participation of its Chairman and Chief Executive Officer along with its Chief Financial Officer, conducted an evaluation as of the end of the period covered by this Annual Report of the effectiveness of the design and operation of Nexstar’s disclosure controls and procedures as defined in Rules 13a-15(e) and 15d-15(e) under the Exchange Act.
Based upon that evaluation, Nexstar’s Chairman and Chief Executive Officer and its Chief Financial Officer concluded that as of December 31, 2024, Nexstar’s disclosure controls and procedures were effective in providing reasonable assurance that information required to be disclosed in the reports that it files or submits under the Exchange Act (i) is recorded, processed, summarized and reported within the time periods specified in the SEC’s rules and forms and (ii) is accumulated and communicated to Nexstar’s management, including its Chairman and Chief Executive Officer and its Chief Financial Officer, as appropriate to allow timely decisions regarding required disclosure.
Changes in Internal Control over Financial Reporting
During the quarterly period as of the end of the period covered by this report, there have been no changes in Nexstar’s internal control over financial reporting that have materially affected, or are reasonably likely to materially affect, its internal control over financial reporting.
Management’s Report on Internal Control over Financial Reporting
Nexstar’s management is responsible for establishing and maintaining adequate internal control over financial reporting as defined in Rules 13a-15(f) and 15d-15(f) of the Exchange Act. Our internal control over financial reporting is a process designed to provide reasonable assurance regarding the reliability of financial reporting and the preparation of financial statements for external purposes in accordance with U.S. GAAP. Management assessed the effectiveness of our internal control over financial reporting as of December 31, 2024 based upon the criteria set forth by the Committee of Sponsoring Organizations of the Treadway Commission (COSO) in Internal Control—Integrated Framework (2013).
Based on management’s assessment, we have concluded that our internal control over financial reporting was effective as of December 31, 2024.
PricewaterhouseCoopers LLP, an independent registered public accounting firm, has audited the effectiveness of our internal control over financial reporting as of December 31, 2024 as stated in their report which appears herein.
Item 9B. Other Information
None.
Item 9C. Disclosure Regarding Foreign Jurisdictions that Prevent Inspections
Not applicable.
PART III
Item 10. Directors, Executive Officers and Corporate Governance
Information concerning directors that is required by this Item 10 will be set forth in and is incorporated herein by reference from the Proxy Statement to be provided to stockholders in connection with our 2025 Annual Meeting of Stockholders (the “Proxy Statement”).
Item 11. Executive Compensation
Information required by this Item 11 will be set forth in and is incorporated herein by reference from the Proxy Statement.
Item 12. Security Ownership of Certain Beneficial Owners and Management, and Related Stockholder Matters
Information required by this Item 12 will be set forth in and is incorporated herein by reference from the Proxy Statement.
Item 13. Certain Relationships and Related Transactions, and Director Independence
Information required by this Item 13 will be set forth in and is incorporated herein by reference from the Proxy Statement.
Item 14. Principal Accountant Fees and Services
Information required by this Item 14 will be set forth in and is incorporated herein by reference from the Proxy Statement.
PART IV
Item 15. Exhibits and Financial Statement Schedules
(a) Documents filed as part of this report:
(1)Consolidated Financial Statements. The Consolidated Financial Statements of Nexstar Media Group, Inc. listed on the index on page F-1 have been included beginning on page F-4 of this Annual Report on Form 10-K.
(2)Financial Statement Schedules. The schedule of Valuation and Qualifying Accounts appears in Note 18 to the Consolidated Financial Statements filed as part of this report.
(3)Exhibits. The exhibits listed on the accompanying Index to Exhibits on this Annual Report on Form 10-K are filed, furnished or incorporated into this Annual Report on Form 10-K by reference, as applicable.
Item 16. Form 10-K Summary
Not applicable.
Exhibit Index
| | |
Exhibit Number |
| Exhibit Description |
3.1 |
| Certificate of Amended and Restated Certificate of Incorporation of Nexstar Media Group, Inc. (Incorporated by reference to Exhibit 3.1 to Current Report on Form 8-K (File No. 000-50478) filed by Nexstar Media Group, Inc. on June 21, 2023). |
3.2 | | Second Amended and Restated Bylaws of Nexstar Media Group, Inc. (Incorporated by reference to Exhibit 3.1 to Current Report on Form 8-K (File No. 000-50478) filed by Nexstar Media Group, Inc. on January 30, 2023). |
4.1 |
| Specimen Class A Common Stock Certificate. (Incorporated by reference to Exhibit 4.1 to Amendment No. 6 to Registration Statement on Form S-1 (File No. 333-86994) filed by Nexstar Media Group, Inc.). |
4.2 |
| Indenture, dated as of July 3, 2019, between Nexstar Escrow, Inc., as issuer, and Citibank, N.A., as trustee (Incorporated by reference to Exhibit 4.1 to Current Report on Form 8-K (File No. 000-50478) filed by Nexstar Media Group, Inc. on July 3, 2019). |
4.3 |
| Form of 5.625% Senior Note due 2027 (Incorporated by reference to Exhibit 4.1 to Current Report on Form 8-K (File No. 000-50478) filed by Nexstar Media Group, Inc. on July 3, 2019). |
4.4 |
| First Supplemental Indenture, dated as of September 19, 2019, by and among Nexstar Broadcasting, Inc., as issuer, the guarantors party thereto, and Citibank, N.A. as trustee (Incorporated by reference to Exhibit 4.3 to Current Report on Form 8-K (File No. 000-50478) filed by Nexstar Media Group, Inc. on September 20, 2019). |
4.5 |
| Second Supplemental Indenture, dated as of November 22, 2019, by and among Nexstar Broadcasting, Inc., as issuer, the guarantors party thereto, and Citibank, N.A. as trustee (Incorporated by reference to Exhibit 4.3 to Current Report on Form 8-K (File No. 000-50478) filed by Nexstar Media Group, Inc. on November 22, 2019). |
4.6 | | Indenture, dated as of September 25, 2020, by and among Nexstar Broadcasting, Inc., as issuer, the guarantors party thereto, and Citibank, N.A., as trustee (Incorporated by reference to Exhibit 4.1 to Current Report on Form 8-K (File No. 000-50478) filed by Nexstar Media Group, Inc. on September 25, 2020). |
4.7 | | Form of 4.750% Senior Notes due 2028 (Incorporated by reference to Exhibit 4.1 to Current Report on Form 8-K (File No. 000-50478) filed by Nexstar Media Group, Inc. on September 25, 2020). |
4.8 | | Description of the Registrant’s Securities registered under Section 12 of the Securities Exchange Act of 1934.* |
10.1 | | Stock Option Agreement, dated as of November 29, 2011, by and among Mission Broadcasting, Inc., Nancie J. Smith, Dennis Thatcher and Nexstar Broadcasting, Inc. (Incorporated by reference to Exhibit 10.44 to Annual Report on Form 10-K for the year ended December 31, 2011 (File No. 000-50478) filed by Nexstar Media Group, Inc.). |
10.2 | | Amendment, dated as of November 15, 2019, to Stock Option Agreement, dated as of November 29, 2011, by and between Mission Broadcasting, Inc., Dennis Thatcher, Nancie J. Smith, and Nexstar Broadcasting, Inc. (Incorporated by reference to Exhibit 10.87 to Quarterly Report on Form 10-Q for the quarter ended March 31, 2020 (File No. 000-50478) filed by Nexstar Media Group, Inc.). |
10.3 | | Amendment, dated as of November 30, 2020, to Stock Option Agreement, dated as of November 29, 2011, as amended November 15, 2019, by and between Mission Broadcasting, Inc., Dennis Thatcher, Nancie J. Smith, and Nexstar Broadcasting, Inc.(Incorporated by reference to Exhibit 10.4 to Annual Report on Form 10-K for the year ended December 31, 2020 (File No. 000-50478) filed by Nexstar Media Group, Inc. on March 1, 2021). |
10.4 |
| Credit Agreement, dated as of January 17, 2017, by and among Nexstar Media Group, Inc., as a holding company, Nexstar Broadcasting, Inc., as the borrower, Bank of America, N.A., as the administrative agent, the collateral agent, a letter of credit issuer and a swing line lender and other financial institutions from time to time party thereto (Incorporated by reference to Exhibit 10.2 to Current Report on Form 8-K (File No. 000-50478) filed by Nexstar Media Group, Inc. on January 17, 2017). |
10.5 |
| Amendment No. 1, dated as of July 19, 2018, to Credit Agreement, dated as of January 17, 2017, by and among Nexstar Broadcasting, Inc., Nexstar Media Group, Inc., Bank of America, N.A. and the several lenders party thereto (Incorporated by reference to Exhibit 10.1 to Current Report on Form 8-K (File No. 000-50478) filed by Nexstar Broadcasting Group, Inc. on July 25, 2017). |
10.6 |
| Amendment No. 2, dated as of October 26, 2018, to Credit Agreement, dated as of January 17, 2017, by and among Nexstar Broadcasting, Inc., Nexstar Media Group, Inc., Bank of America, N.A. and the several lenders party thereto (Incorporated by reference to Exhibit 10.1 to Current Report on Form 8-K (File No. 000-50478) filed by Nexstar Media Group, Inc. on November 1, 2018). |
10.7 |
| Amendment No. 3, dated as of September 19, 2019, to Credit Agreement, dated as of January 17, 2017, by and among Nexstar Broadcasting, Inc., Nexstar Media Group, Inc., Bank of America, N.A. and the several lenders party thereto (Incorporated by reference to Exhibit 10.1 to Current Report on Form 8-K (File No. 000-50478) filed by Nexstar Media Group, Inc. on September 20, 2019). |
| | |
10.8 | | Amendment No. 4, dated as of September 3, 2020, to Credit Agreement, dated as of January 17, 2017, by and among Nexstar Broadcasting, Inc., Nexstar Media Group, Inc., Bank of America, N.A. and the several lenders party thereto (Incorporated by reference to Exhibit 10.1 to Current Report on Form 8-K/A (File No. 000-50478) filed by Nexstar Media Group, Inc. on September 9, 2020). |
10.9 | | Amendment No. 5, dated as of June 21, 2022, to Credit Agreement, dated as of January 17, 2017, by and among Nexstar Media Inc. (f/k/a Nexstar Broadcasting, Inc.), Nexstar Media Group, Inc., Bank of America, N.A. and the several lenders party thereto (Incorporated by reference to Exhibit 10.1 to Quarterly Report on Form 10-Q for the quarter ended June 30, 2022 (File No. 000-50478) filed by Nexstar Media Group, Inc.). |
10.10 | | Amendment No. 6 dated as of June 6, 2023, to Credit Agreement, dated as of January 17, 2017, by and among Nexstar Media Inc. (f/k/a Nexstar Broadcasting, Inc.), Nexstar Media Group, Inc., Bank of America, N.A. and the several lenders party thereto (Incorporated by reference to Exhibit 10.1 to Quarterly Report on Form 10-Q for the quarter ended June 30, 2023 (File No. 000-50478) filed by Nexstar Media Group, Inc.). |
10.11 |
| Credit Agreement, dated as of January 17, 2017, by and among Mission Broadcasting, Inc., as the borrower and Bank of America, N.A., as the administrative agent and the collateral agent and other financial institutions from time to time party thereto (Incorporated by reference to Exhibit 10.8 to Annual Report on Form 10-K for the period ended December 31, 2016 (File No. 333-62916-02) filed by Mission Broadcasting, Inc.). |
10.12 |
| Amendment No. 1, dated as of July 19, 2017, to Credit Agreement, dated as of January 17, 2017, by and among Mission Broadcasting, Inc., Bank of America, N.A. and the several lenders party thereto (Incorporated by reference to Exhibit 10.1 to Current Report on Form 8-K (File No. 333-62916-02) filed by Mission Broadcasting, Inc. on July 25, 2017). |
10.13 | | Amendment No. 2, dated as of October 26, 2018, to Credit Agreement, dated as of January 17, 2017, by and among Mission Broadcasting, Inc., Bank of America, N.A. and the several lenders party thereto (Incorporate by reference to Exhibit 10.1 to Current Report on Form 8-K (File No. 333-62916-02) filed by Mission Broadcasting, Inc. on November 1, 2018). |
10.14 | | Amendment No. 3, dated as of September 3, 2020, to Credit Agreement, dated as of January 17, 2017, by and among Mission Broadcasting, Inc., Bank of America, N.A. and the several lenders party thereto (Incorporated by reference to Exhibit 10.2 to Current Report on Form 8-K/A (File No. 000-50478) filed by Nexstar Media Group, Inc. on September 9, 2020). |
10.15 | | Amendment No. 4, dated as of June 3, 2021, to Credit Agreement, dated as of January 17, 2017, by and among Mission Broadcasting, Inc., Bank of America, N.A. and the several lenders party thereto (Incorporated by reference to Exhibit 10.1 to Current Report on Form 8-K (File No. 000-50478) filed by Nexstar Media Group, Inc. on June 4, 2021). |
10.16 | | Amendment No. 5, dated as of June 3, 2021, to Credit Agreement, dated as of January 17, 2017, by and among Mission Broadcasting, Inc., Bank of America, N.A. and the several lenders party thereto (Incorporated by reference to Exhibit 10.2 to Current Report on Form 8-K (File No. 000-50478) filed by Nexstar Media Group, Inc. on June 4, 2021). |
10.17 | | Amendment No. 6, dated as of June 21, 2022, to Credit Agreement, dated as of January 17, 2017, by among Mission Broadcasting, Inc., Bank of America, N.A. and the several lenders party thereto (Incorporated by reference to Exhibit 10.1 to Quarterly Report on Form 10-Q for the quarter ended June 30, 2022 (File No. 000-50478) filed by Nexstar Media Group, Inc.). |
10.18 | | Amendment No. 7 dated as of June 6, 2023, to Credit Agreement, dated as of January 17, 2017, by among Mission Broadcasting, Inc., Bank of America, N.A. and the several lenders party thereto (Incorporated by reference to Exhibit 10.2 to Quarterly Report on Form 10-Q for the quarter ended June 30, 2023 (File No. 000-50478) filed by Nexstar Media Group, Inc.). |
10.19 | | Amended Executive Employment Agreement, dated as of January 15, 2019 between Perry A. Sook and Nexstar Broadcasting, Inc. (Incorporated by reference to Exhibit 10.1 to Current Report on Form 8-K (File No. 000-50478) filed by Nexstar Media Group, Inc. on January 22, 2019). |
10.20 | | Amendment to Executive Employment Agreement, dated as of August 1, 2022 between Perry A. Sook and Nexstar Media Group, Inc. (Incorporated by reference to Exhibit 10.1 to Current Report on Form 8-K (File No. 000-50478) filed by Nexstar Media Group, Inc. on August 4, 2022. |
10.21 | | Executive Employment Agreement, effective as of August 21, 2023, between Michael Biard and Nexstar Media Group, Inc. (Incorporated by reference to Exhibit 10.1 to Current Report on Form 8-K (File No. 000-50478/231119544) filed by Nexstar Media Group, Inc. on July 28, 2023. |
10.22 | | Executive Employment Agreement, dated July 26, 2021 between Lee Ann Gliha and Nexstar Media Group, Inc. (Incorporated by reference to Exhibit 10.3 to Quarterly Report on Form 10-Q for the quarter ended June 30, 2021 (File No. 000-50478) filed by Nexstar Media Group, Inc.). |
10.23 | | Amendment to Executive Employment Agreement, effective January 1, 2024, by and between Lee Ann Gliha and Nexstar Media Group, Inc. (Incorporated by reference to Exhibit 10.1 to Current Report on Form 8-K (File No. 000-50478/231502162) filed by Nexstar Media Group, Inc. on December 20, 2023. |
| | |
10.24 | | Executive Employment Agreement, effective as of September 19, 2023, between Dana Zimmer and Nexstar Media Group, Inc. (Incorporated by reference to Exhibit 10.2 to Current Report on Form 8-K (File No. 000-50478/231092012) filed by Nexstar Media Group, Inc. on July 17, 2023. |
10.25 | | Executive Employment Agreement, effective as of September 19, 2023, between Sean Compton and Nexstar Media Group, Inc. (Incorporated by reference to Exhibit 10.1 to Current Report on Form 8-K (File No. 000-50478/231092012) filed by Nexstar Media Group, Inc. on July 17, 2023. |
10.26 | | Amended and Restated Executive Employment Agreement, effective as of September 19, 2023 between Sean Compton and Nexstar Media Group, Inc. (Incorporated by reference to Exhibit 10.3 to Quarterly Report on Form 10-Q for the quarter ended September 30, 2023 (File No. 000-50478) filed by Nexstar Media Group, Inc.). |
10.27 | | Nexstar Media Group, Inc. 2015 Long-Term Equity Incentive Plan (Incorporated by reference to Definitive Proxy Statement on Schedule 14A (File No. 000-50478) filed by Nexstar Media Group, Inc. on April 24, 2015). |
10.28 |
| Nexstar Media Group, Inc. 2019 Long-Term Equity Incentive Plan (Incorporated by reference to Definitive Proxy Statement on Schedule 14A (File No. 000-50478) filed by Nexstar Media Group, Inc. on April 26, 2019). |
10.29 |
| Nexstar Media Group, Inc.’s Restricted Stock Unit Agreement Form (Incorporated by reference to Exhibit 10.88 to Quarterly Report on Form 10-Q for the quarter ended March 31, 2020 (File No. 000-50478) filed by Nexstar Media Group, Inc.). |
14.1 |
| Nexstar Media Group, Inc. Code of Ethics. (Incorporated by reference to Exhibit 14.1 to the Annual Report on Form 10-K for the year ended December 31, 2003 (File No. 000-50478) filed by Nexstar Media Group, Inc.). |
19.1 | | Nexstar Media Group, Inc. Insider Trading and Anti-Hedging/Pledging Policy.* |
21.1 |
| Subsidiaries of the Registrant.* |
23.1 |
| Consent issued by PricewaterhouseCoopers LLP.* |
31.1 |
| Certification of Perry A. Sook pursuant to Section 302 of the Sarbanes-Oxley Act of 2002.* |
31.2 |
| Certification of Lee Ann Gliha pursuant to Section 302 of the Sarbanes-Oxley Act of 2002.* |
32.1 |
| Certification of Perry A. Sook pursuant to 18 U.S.C. ss. 1350.* |
32.2 |
| Certification of Lee Ann Gliha pursuant to 18 U.S.C. ss. 1350.* |
97.1 | | Clawback Policy, Nexstar Media Group, Inc. (Incorporated by reference to Exhibit 97.1 to the Annual Report on Form 10-K for the year ended December 31, 2023 (File No. 000-50478) filed by Nexstar Media Group, Inc.). |
101.INS | | Inline XBRL Instance Document – the instance document does not appear in the Interactive Data File because its XBRL tags are embedded within the Inline XBRL document. |
101.SCH | | Inline XBRL Taxonomy Extension Schema With Embedded Linkbases Document. |
104 | | Cover Page Interactive Data File (formatted as Inline XBRL and contained in Exhibit 101). |
* Filed herewith.
SIGNATURES
Pursuant to the requirements of Section 13 or 15(d) of the Securities Exchange Act of 1934, the Registrant has duly caused this report to be signed on its behalf by the undersigned thereunto duly authorized.
| | |
NEXSTAR MEDIA GROUP, INC. |
By: |
| /s/ PERRY A. SOOK |
|
| Perry A. Sook |
|
| Chairman and Chief Executive Officer |
By: |
| /s/ LEE ANN GLIHA |
|
| Lee Ann Gliha |
|
| Chief Financial Officer (Principal Accounting and Financial Officer) |
Dated: February 27, 2025
Pursuant to the requirements of the Securities Exchange Act of 1934, this report has been signed by the following persons on behalf of the Registrant and in the capacities indicated on February 27, 2025.
| | | | |
Name | | | | Title |
/s/ PERRY A. SOOK |
|
|
| Chairman and Chief Executive Officer |
Perry A. Sook | |
|
| (Principal Executive Officer) |
/s/ LEE ANN GLIHA | |
|
| Chief Financial Officer |
Lee Ann Gliha | |
|
| (Principal Financial and Accounting Officer) |
/s/ GEOFF ARMSTRONG | |
|
| Director |
Geoff Armstrong | |
|
|
|
/s/ BERNADETTE AULESTIA | |
|
| Director |
Bernadette Aulestia | | | | |
| | | | |
/s/ DENNIS J. FITZSIMONS | | | | Director |
Dennis J. FitzSimons | |
|
|
|
/s/ JAY M. GROSSMAN | |
|
| Director |
Jay M. Grossman | |
|
|
|
/s/ ELLEN JOHNSON | |
|
| Director |
Ellen Johnson | |
|
|
|
/s/ C. THOMAS MCMILLEN | |
|
| Director |
C. Thomas McMillen | |
|
|
|
/s/ LISBETH MCNABB | |
|
| Director |
Lisbeth McNabb |
|
|
|
|
/s/ JOHN R. MUSE | |
|
| Director |
John R. Muse | |
|
|
|
/s/ ROYCE A. WELLS | | | | Director |
Royce A. Wells | | | | |
NEXSTAR MEDIA GROUP, INC.
INDEX TO FINANCIAL STATEMENTS
Report of Independent Registered Public Accounting Firm
To the Board of Directors and Stockholders of Nexstar Media Group, Inc.
Opinions on the Financial Statements and Internal Control over Financial Reporting
We have audited the accompanying consolidated balance sheets of Nexstar Media Group, Inc. and its subsidiaries (the “Company”) as of December 31, 2024 and 2023, and the related consolidated statements of operations and comprehensive income, of changes in stockholders’ equity and redeemable noncontrolling interests and of cash flows for each of the three years in the period ended December 31, 2024, including the related notes (collectively referred to as the “consolidated financial statements”). We also have audited the Company’s internal control over financial reporting as of December 31, 2024, based on criteria established in Internal Control - Integrated Framework (2013) issued by the Committee of Sponsoring Organizations of the Treadway Commission (COSO).
In our opinion, the consolidated financial statements referred to above present fairly, in all material respects, the financial position of the Company as of December 31, 2024 and 2023, and the results of its operations and its cash flows for each of the three years in the period ended December 31, 2024 in conformity with accounting principles generally accepted in the United States of America. Also in our opinion, the Company maintained, in all material respects, effective internal control over financial reporting as of December 31, 2024, based on criteria established in Internal Control - Integrated Framework (2013) issued by the COSO.
Basis for Opinions
The Company’s management is responsible for these consolidated financial statements, for maintaining effective internal control over financial reporting, and for its assessment of the effectiveness of internal control over financial reporting, included in Management’s Report on Internal Control over Financial Reporting appearing under Item 9A. Our responsibility is to express opinions on the Company’s consolidated financial statements and on the Company’s internal control over financial reporting based on our audits. We are a public accounting firm registered with the Public Company Accounting Oversight Board (United States) (PCAOB) and are required to be independent with respect to the Company in accordance with the U.S. federal securities laws and the applicable rules and regulations of the Securities and Exchange Commission and the PCAOB.
We conducted our audits in accordance with the standards of the PCAOB. Those standards require that we plan and perform the audits to obtain reasonable assurance about whether the consolidated financial statements are free of material misstatement, whether due to error or fraud, and whether effective internal control over financial reporting was maintained in all material respects.
Our audits of the consolidated financial statements included performing procedures to assess the risks of material misstatement of the consolidated financial statements, whether due to error or fraud, and performing procedures that respond to those risks. Such procedures included examining, on a test basis, evidence regarding the amounts and disclosures in the consolidated financial statements. Our audits also included evaluating the accounting principles used and significant estimates made by management, as well as evaluating the overall presentation of the consolidated financial statements. Our audit of internal control over financial reporting included obtaining an understanding of internal control over financial reporting, assessing the risk that a material weakness exists, and testing and evaluating the design and operating effectiveness of internal control based on the assessed risk. Our audits also included performing such other procedures as we considered necessary in the circumstances. We believe that our audits provide a reasonable basis for our opinions.
Definition and Limitations of Internal Control over Financial Reporting
A company’s internal control over financial reporting is a process designed to provide reasonable assurance regarding the reliability of financial reporting and the preparation of financial statements for external purposes in accordance with generally accepted accounting principles. A company’s internal control over financial reporting includes those policies and procedures that (i) pertain to the maintenance of records that, in reasonable detail, accurately and fairly reflect the transactions and dispositions of the assets of the company; (ii) provide reasonable assurance that transactions are recorded as necessary to permit preparation of financial statements in accordance with generally accepted accounting principles, and that receipts and expenditures of the company are being made only in accordance with authorizations of management and directors of the company; and (iii) provide reasonable assurance regarding prevention or timely detection of unauthorized acquisition, use, or disposition of the company’s assets that could have a material effect on the financial statements.
Because of its inherent limitations, internal control over financial reporting may not prevent or detect misstatements. Also, projections of any evaluation of effectiveness to future periods are subject to the risk that controls may become inadequate because of changes in conditions, or that the degree of compliance with the policies or procedures may deteriorate.
Critical Audit Matters
The critical audit matter communicated below is a matter arising from the current period audit of the consolidated financial statements that was communicated or required to be communicated to the audit committee and that (i) relates to accounts or disclosures that are material to the consolidated financial statements and (ii) involved our especially challenging, subjective, or complex judgments. The communication of critical audit matters does not alter in any way our opinion on the consolidated financial statements, taken as a whole, and we are not, by communicating the critical audit matter below, providing a separate opinion on the critical audit matter or on the accounts or disclosures to which it relates.
Uncertain Tax Position Related to the Chicago Cubs Transactions
As described in Notes 11 and 14 to the consolidated financial statements, the Company has recorded liabilities for uncertain tax positions of $27.0 million as of December 31, 2024. As disclosed by management, the estimate of the Company’s tax liabilities relating to uncertain tax positions requires management to assess uncertainties and to make judgments about the application of complex tax laws and regulations. On June 28, 2016, the Internal Revenue Service (“IRS”) issued Tribune Media Company (a subsidiary of the Company, “Tribune”) a Notice of Deficiency which presented the IRS’s position that a gain with respect to a contribution of certain assets and liabilities related to the businesses of the Chicago Cubs Major League Baseball franchise (“the Chicago Cubs Transactions”) should have been included in Tribune’s 2009 taxable income. Accordingly, the IRS proposed a $182.0 million tax and a $73.0 million gross valuation misstatement penalty. After-tax interest on the aforementioned proposed tax and penalty through December 31, 2024 would be approximately $232 million. During the third quarter of 2016, Tribune filed a petition in U.S. Tax Court to contest the IRS’s determination. On October 26, 2021, the Tax Court issued an opinion related to the Chicago Cubs Transactions, which held that Tribune’s structure was, in substantial part, in compliance with partnership provisions of the Internal Revenue Code (“IRC”) and, as a result, did not trigger the entire 2009 taxable gain proposed by the IRS. As of December 31, 2024, management believes the tax impact of applying the Tax Court opinion is not material to the Company’s Consolidated Financial Statements.
The principal considerations for our determination that performing procedures relating to the uncertain tax position related to the Chicago Cubs Transactions is a critical audit matter are (i) the significant judgment by management when assessing the measurement of the uncertain tax position related to the Chicago Cubs Transactions; (ii) a high degree of auditor judgment, subjectivity, and effort in performing procedures and evaluating the audit evidence related to the measurement of the uncertain tax position related to the Chicago Cubs Transactions; (iii) the audit effort involved the use of professionals with specialized skill and knowledge.
Addressing the matter involved performing procedures and evaluating audit evidence in connection with forming our overall opinion on the consolidated financial statements. These procedures included testing the effectiveness of controls related to measurement of the uncertain tax position related to the Chicago Cubs Transactions. These procedures also included, among others (i) testing the information used in the calculation of the liability for the uncertain tax position related to the Chicago Cubs Transactions, including federal filing positions and the related final tax returns; (ii) testing the calculation of the liability for the uncertain tax position related to the Chicago Cubs Transactions, including management’s assessment of the technical merits of the tax position; (iii) testing management’s assessment of the possible outcomes of the uncertain tax position related to the Chicago Cubs Transactions; and (iv) evaluating the status and results of income tax audits with the relevant tax authorities. Professionals with specialized skill and knowledge were used to assist in the evaluation of the measurement of the uncertain tax position related to the Chicago Cubs Transactions, including evaluating the reasonableness of management’s assessment of the amount of potential tax benefit to be realized, and the application of relevant tax laws.
/s/ PricewaterhouseCoopers LLP
Dallas, Texas
February 27, 2025
We have served as the Company’s auditor since 1997.
NEXSTAR MEDIA GROUP, INC.
CONSOLIDATED BALANCE SHEETS
(in millions, except for share and per share information)
| | | | | | | |
| December 31, | |
| 2024 | | | 2023 | |
ASSETS |
| | | | |
Current assets: |
| | | | |
Cash and cash equivalents | $ | 144 | | | $ | 135 | |
Restricted cash and cash equivalents | | - | | | | 12 | |
Accounts receivable, net of allowance for credit losses of $16 and $20, respectively | | 1,028 | | | | 1,095 | |
Broadcast rights | | 84 | | | | 136 | |
Prepaid expenses and other current assets | | 41 | | | | 88 | |
Total current assets | | 1,297 | | | | 1,466 | |
Property and equipment, net | | 1,207 | | | | 1,269 | |
Goodwill | | 2,922 | | | | 2,946 | |
FCC licenses | | 2,929 | | | | 2,929 | |
Network affiliation agreements, net | | 1,494 | | | | 1,683 | |
Other intangible assets, net | | 353 | | | | 441 | |
Investments | | 877 | | | | 958 | |
Other noncurrent assets, net | | 389 | | | | 386 | |
Total assets(1) | $ | 11,468 | | | $ | 12,078 | |
LIABILITIES, REDEEMABLE NONCONTROLLING INTERESTS AND STOCKHOLDERSʼ EQUITY |
| | | | |
Current liabilities: |
| | | | |
Current portion of debt | $ | 124 | | | $ | 124 | |
Accounts payable | | 133 | | | | 235 | |
Broadcast rights payable | | 97 | | | | 136 | |
Accrued expenses | | 314 | | | | 350 | |
Other current liabilities | | 115 | | | | 116 | |
Total current liabilities | | 783 | | | | 961 | |
Debt | | 6,399 | | | | 6,713 | |
Deferred tax liabilities | | 1,487 | | | | 1,520 | |
Other noncurrent liabilities | | 531 | | | | 571 | |
Total liabilities(1) | | 9,200 | | | | 9,765 | |
Commitments and contingencies (Note 11) |
| | | | |
Redeemable noncontrolling interests (Note 2) | | 26 | | | | - | |
Stockholders’ equity: |
| | | | |
Preferred stock - $0.01 par value, 200,000 shares authorized; none issued and outstanding at each of December 31, 2024 and December 31, 2023 | | - | | | | - | |
Common stock - $0.01 par value, 100,000,000 shares authorized; 47,282,823 shares issued, 30,621,241 shares outstanding as of December 31, 2024 and 47,282,823 shares issued, 33,600,926 shares outstanding as of December 31, 2023 | | - | | | | - | |
Additional paid-in capital | | 1,304 | | | | 1,283 | |
Accumulated other comprehensive (loss) income | | (1 | ) | | | 1 | |
Retained earnings | | 3,671 | | | | 3,188 | |
Treasury stock - at cost; 16,661,582 and 13,681,897 shares as of December 31, 2024 and December 31, 2023, respectively | | (2,717 | ) | | | (2,173 | ) |
Total Nexstar Media Group, Inc. stockholders’ equity | | 2,257 | | | | 2,299 | |
Noncontrolling interests | | (15 | ) | | | 14 | |
Total stockholders’ equity | | 2,242 | | | | 2,313 | |
Total liabilities, redeemable noncontrolling interests and stockholdersʼ equity | $ | 11,468 | | | $ | 12,078 | |
| | | | | |
The accompanying Notes are an integral part of these Consolidated Financial Statements.
(1)The consolidated total assets as of December 31, 2024 and 2023 include certain assets held by consolidated VIEs of $297 million and $300 million, respectively, which are not available to be used to settle the obligations of Nexstar. The consolidated total liabilities as of December 31, 2024 and 2023 include certain liabilities of consolidated VIEs of $148 million and $152 million, respectively, for which the creditors of the VIEs have no recourse to the general credit of Nexstar. See Note 2 for additional information.
NEXSTAR MEDIA GROUP, INC.
CONSOLIDATED STATEMENTS OF OPERATIONS AND COMPREHENSIVE INCOME
(in millions, except for share and per share information)
| | | | | | | | | | | | |
| | Years Ended December 31, | |
| | 2024 | | | 2023 | | | 2022 | |
Net revenue | | $ | 5,407 | | | $ | 4,933 | | | $ | 5,211 | |
Operating expenses (income): | |
| | |
| | |
| |
Direct operating, excluding depreciation and amortization | | | 2,221 | | | | 2,153 | | | | 2,005 | |
Selling, general and administrative, excluding depreciation and amortization | | | 1,088 | | | | 1,098 | | | | 1,098 | |
Depreciation and amortization | | | 808 | | | | 941 | | | | 662 | |
Goodwill and long-lived asset impairments | | | 24 | | | | 35 | | | | 133 | |
Other | | | (2 | ) | | | (2 | ) | | | 1 | |
Total operating expenses | | | 4,139 | | | | 4,225 | | | | 3,899 | |
Income from operations | | | 1,268 | | | | 708 | | | | 1,312 | |
Gain on bargain purchase | | | - | | | | - | | | | 56 | |
Income from equity method investments, net | | | 70 | | | | 104 | | | | 153 | |
Interest expense, net | | | (444 | ) | | | (447 | ) | | | (337 | ) |
Pension and other postretirement plans credit, net | | | 27 | | | | 36 | | | | 43 | |
Gain on disposal of an investment | | | 40 | | | | - | | | | - | |
Other expenses, net | | | (2 | ) | | | - | | | | (10 | ) |
Income before income taxes | | | 959 | | | | 401 | | | | 1,217 | |
Income tax expense | | | (276 | ) | | | (131 | ) | | | (274 | ) |
Net income | | | 683 | | | | 270 | | | | 943 | |
Net loss attributable to noncontrolling interests | | | 39 | | | | 76 | | | | 28 | |
Net income attributable to Nexstar Media Group, Inc. | | $ | 722 | | | $ | 346 | | | $ | 971 | |
| | | | | | | | | |
Net income per share available to common stockholders: | |
| | |
| | |
| |
Basic | | $ | 21.73 | | | $ | 9.78 | | | $ | 24.68 | |
Diluted | | $ | 21.41 | | | $ | 9.64 | | | $ | 24.16 | |
| | | | | | | | | |
Weighted average number of common shares outstanding: | |
| | |
| | |
| |
Basic (in thousands) | | | 32,311 | | | | 35,317 | | | | 39,349 | |
Diluted (in thousands) | | | 32,796 | | | | 35,834 | | | | 40,187 | |
| | | | | | | | | |
Net income | | $ | 683 | | | $ | 270 | | | $ | 943 | |
Other comprehensive loss: | | | | | | | | | |
Change in unrecognized amounts included in pension and other postretirement benefit obligations, net of tax benefit of $1 in 2024, $9 in 2023 and $39 in 2022 | | | (2 | ) | | | (26 | ) | | | (114 | ) |
Total comprehensive income | | | 681 | | | | 244 | | | | 829 | |
Total comprehensive loss attributable to noncontrolling interests | | | 39 | | | | 76 | | | | 28 | |
Total comprehensive income attributable to Nexstar Media Group, Inc. | | $ | 720 | | | $ | 320 | | | $ | 857 | |
The accompanying Notes are an integral part of these Consolidated Financial Statements.
NEXSTAR MEDIA GROUP, INC.
CONSOLIDATED STATEMENTS OF CHANGES IN STOCKHOLDERS’ EQUITY AND REDEEMABLE NONCONTROLLING INTERESTS
For the Three Years Ended December 31, 2024
(in millions, except for share and per share information)
| | | | | | | | | | | | | | | | | | | | | | | | | | | | | | | | | | | | | | | | | |
| | | | | | | | | | | | | | | | | | Accumulated | | | | | | | | | | | | | |
| | Redeemable | | | | | | | Additional | | | | | | Other | | | | | | | | | | | | Total | |
| | Noncontrolling | | | | Common Stock | | | Paid-In | | | Retained | | | Comprehensive | | | Treasury Stock | | | Noncontrolling | | | Stockholdersʼ | |
| | Interests | | | | Shares | | | Amount | | | Capital | | | Earnings | | | Income (Loss) | | | Shares | | | Amount | | | interests | | | Equity | |
Balances as of December 31, 2021 | | $ | - | | | | | 47,291,463 | | | $ | - | | | $ | 1,311 | | | $ | 2,204 | | | $ | 141 | | | | (6,534,034 | ) | | $ | (807 | ) | | $ | 8 | | | $ | 2,857 | |
Purchase of treasury stock | | | - | | | | | - | | | | - | | | | - | | | | - | | | | - | | | | (5,055,304 | ) | | | (881 | ) | | | - | | | | (881 | ) |
Stock-based compensation expense | | | - | | | | | - | | | | - | | | | 62 | | | | - | | | | - | | | | - | | | | - | | | | - | | | | 62 | |
Vesting of restricted stock units and exercise of stock options | | | - | | | | | - | | | | - | | | | (85 | ) | | | - | | | | - | | | | 1,116,701 | | | | 81 | | | | - | | | | (4 | ) |
Dividends declared on common stock ($3.60 per share) | | | - | | | | | - | | | | - | | | | - | | | | (142 | ) | | | - | | | | - | | | | - | | | | - | | | | (142 | ) |
Contribution from noncontrolling interests | | | - | | | | | - | | | | - | | | | - | | | | - | | | | - | | | | - | | | | - | | | | 30 | | | | 30 | |
Noncontrolling interests from a business combination (see Note 3) | | | - | | | | | - | | | | - | | | | - | | | | - | | | | - | | | | - | | | | - | | | | 24 | | | | 24 | |
Distribution to a noncontrolling interest | | | - | | | | | - | | | | - | | | | - | | | | - | | | | - | | | | - | | | | - | | | | (6 | ) | | | (6 | ) |
Change in pension and other postretirement benefit obligations, net of tax | | | - | | | | | - | | | | - | | | | - | | | | - | | | | (114 | ) | | | - | | | | - | | | | - | | | | (114 | ) |
Other | | | - | | | | | (8,640 | ) | | | - | | | | - | | | | - | | | | - | | | | - | | | | - | | | | - | | | | - | |
Net income (loss) | | | - | | | | | - | | | | - | | | | - | | | | 971 | | | | - | | | | - | | | | - | | | | (28 | ) | | | 943 | |
Balances as of December 31, 2022 | | | - | | | | | 47,282,823 | | | | - | | | | 1,288 | | | | 3,033 | | | | 27 | | | | (10,472,637 | ) | | | (1,607 | ) | | | 28 | | | | 2,769 | |
Purchase of treasury stock | | | - | | | | | - | | | | - | | | | - | | | | - | | | | - | | | | (3,782,104 | ) | | | (611 | ) | | | - | | | | (611 | ) |
Stock-based compensation expense | | | - | | | | | - | | | | - | | | | 60 | | | | - | | | | - | | | | - | | | | - | | | | - | | | | 60 | |
Vesting of restricted stock units and exercise of stock options | | | - | | | | | - | | | | - | | | | (65 | ) | | | - | | | | - | | | | 572,844 | | | | 45 | | | | - | | | | (20 | ) |
Dividends declared on common stock ($5.40 per share) | | | - | | | | | - | | | | - | | | | - | | | | (191 | ) | | | - | | | | - | | | | - | | | | - | | | | (191 | ) |
Contribution from noncontrolling interests | | | - | | | | | - | | | | - | | | | - | | | | - | | | | - | | | | - | | | | - | | | | 62 | | | | 62 | |
Change in pension and other postretirement benefit obligations, net of tax | | | - | | | | | - | | | | - | | | | - | | | | - | | | | (26 | ) | | | - | | | | - | | | | - | | | | (26 | ) |
Net income (loss) | | | - | | | | | - | | | | - | | | | - | | | | 346 | | | | - | | | | - | | | | - | | | | (76 | ) | | | 270 | |
Balances as of December 31, 2023 | | | - | | | | | 47,282,823 | | | | - | | | | 1,283 | | | | 3,188 | | | | 1 | | | | (13,681,897 | ) | | | (2,173 | ) | | | 14 | | | | 2,313 | |
Purchase of treasury stock | | | - | | | | | - | | | | - | | | | - | | | | - | | | | - | | | | (3,637,192 | ) | | | (606 | ) | | | - | | | | (606 | ) |
Stock-based compensation expense | | | - | | | | | - | | | | - | | | | 78 | | | | - | | | | - | | | | - | | | | - | | | | - | | | | 78 | |
Vesting of restricted stock units and exercise of stock options | | | - | | | | | - | | | | - | | | | (60 | ) | | | - | | | | - | | | | 657,507 | | | | 62 | | | | - | | | | 2 | |
Dividends declared on common stock ($6.76 per share) | | | - | | | | | - | | | | - | | | | - | | | | (219 | ) | | | - | | | | - | | | | - | | | | - | | | | (219 | ) |
Adjustment to redeemable noncontrolling interests (Note 2) | | | 27 | | | | | - | | | | - | | | | - | | | | - | | | | - | | | | - | | | | - | | | | (27 | ) | | | (27 | ) |
Contribution from noncontrolling interests | | | - | | | | | - | | | | - | | | | - | | | | - | | | | - | | | | - | | | | - | | | | 19 | | | | 19 | |
Accretion of redeemable noncontrolling interests (Notes 2 and 15) | | | 20 | | | | | - | | | | - | | | | - | | | | (20 | ) | | | - | | | | - | | | | - | | | | - | | | | (20 | ) |
Change in reporting entity resulting from common control transaction | | | (3 | ) | | | | - | | | | - | | | | 3 | | | | - | | | | - | | | | - | | | | - | | | | - | | | | 3 | |
Change in pension and other postretirement benefit obligations, net of tax | | | - | | | | | - | | | | - | | | | - | | | | - | | | | (2 | ) | | | - | | | | - | | | | - | | | | (2 | ) |
Net income (loss) | | | (18 | ) | | | | - | | | | - | | | | - | | | | 722 | | | | - | | | | - | | | | - | | | | (21 | ) | | | 701 | |
Balances as of December 31, 2024 | | $ | 26 | | | | | 47,282,823 | | | $ | - | | | $ | 1,304 | | | $ | 3,671 | | | $ | (1 | ) | | | (16,661,582 | ) | | $ | (2,717 | ) | | $ | (15 | ) | | $ | 2,242 | |
The accompanying Notes are an integral part of these Consolidated Financial Statements.
NEXSTAR MEDIA GROUP, INC.
CONSOLIDATED STATEMENTS OF CASH FLOWS
(in millions)
| | | | | | | | | | | | |
| | Years Ended December 31, | |
| | 2024 | | | 2023 | | | 2022 | |
Cash flows from operating activities: | | | | | | | | | |
Net income | | $ | 683 | | | $ | 270 | | | $ | 943 | |
Adjustments to reconcile net income to net cash provided by operating activities: | |
| | |
| | |
| |
Depreciation and amortization | | | 808 | | | | 941 | | | | 662 | |
Goodwill and other long-lived asset impairments | | | 24 | | | | 35 | | | | 133 | |
Stock-based compensation expense | | | 78 | | | | 60 | | | | 62 | |
Amortization of debt financing costs, debt discounts and premium | | | 12 | | | | 11 | | | | 13 | |
Gain on disposal of an investment | | | (40 | ) | | | - | | | | - | |
Deferred income taxes | | | (33 | ) | | | (77 | ) | | | (103 | ) |
Payments for broadcast rights | | | (325 | ) | | | (417 | ) | | | (244 | ) |
Gain on bargain purchase | | | - | | | | - | | | | (56 | ) |
Income from equity method investments, net | | | (70 | ) | | | (104 | ) | | | (153 | ) |
Distribution from equity method investments—return on capital | | | 154 | | | | 270 | | | | 250 | |
Changes in operating assets and liabilities, net of acquisitions and dispositions: | |
| | |
| | | | |
Accounts receivable | | | 68 | | | | (13 | ) | | | (12 | ) |
Prepaid expenses and other current assets | | | (1 | ) | | | (4 | ) | | | 10 | |
Other noncurrent assets | | | (10 | ) | | | (24 | ) | | | (1 | ) |
Accounts payable | | | (98 | ) | | | 32 | | | | (50 | ) |
Accrued expenses and other current liabilities | | | (26 | ) | | | 29 | | | | (19 | ) |
Income tax payable | | | 52 | | | | 37 | | | | 10 | |
Other noncurrent liabilities | | | (36 | ) | | | (48 | ) | | | (52 | ) |
Other | | | 10 | | | | 1 | | | | 10 | |
Net cash provided by operating activities | | | 1,250 | | | | 999 | | | | 1,403 | |
Cash flows from investing activities: | |
| | |
| | |
| |
Purchases of property and equipment | | | (145 | ) | | | (149 | ) | | | (157 | ) |
Payments for acquisitions, net of cash acquired | | | - | | | | (38 | ) | | | - | |
Deposits received associated with the sale of real estate assets | | | - | | | | 10 | | | | 10 | |
Proceeds from disposal of an investment | | | 40 | | | | - | | | | - | |
Proceeds from disposals of assets | | | 5 | | | | 8 | | | | 241 | |
Cash acquired on business acquisition | | | - | | | | - | | | | 29 | |
Other investing activities, net | | | (2 | ) | | | (4 | ) | | | 2 | |
Net cash provided by (used in) investing activities | | | (102 | ) | | | (173 | ) | | | 125 | |
Cash flows from financing activities: | |
| | |
| | |
| |
Proceeds from debt issuance, net of debt discounts | | | 55 | | | | 20 | | | | 2,480 | |
Repayments of long-term debt | | | (382 | ) | | | (145 | ) | | | (2,960 | ) |
Purchase of treasury stock | | | (601 | ) | | | (605 | ) | | | (881 | ) |
Common stock dividends paid | | | (219 | ) | | | (191 | ) | | | (142 | ) |
Contribution from noncontrolling interests | | | 19 | | | | 62 | | | | 30 | |
Payments for capitalized software obligations | | | (19 | ) | | | (19 | ) | | | (16 | ) |
Cash paid for shares withheld for taxes | | | (8 | ) | | | (24 | ) | | | (12 | ) |
Proceeds from exercise of stock options | | | 10 | | | | 4 | | | | 8 | |
Payments for contingent consideration in connection with a past acquisition | | | - | | | | - | | | | (14 | ) |
Other financing activities, net | | | (6 | ) | | | (1 | ) | | | (8 | ) |
Net cash used in financing activities | | | (1,151 | ) | | | (899 | ) | | | (1,515 | ) |
Net increase (decrease) in cash, cash equivalents and restricted cash | | | (3 | ) | | | (73 | ) | | | 13 | |
Cash, cash equivalents and restricted cash at beginning of period | | | 147 | | | | 220 | | | | 207 | |
Cash, cash equivalents and restricted cash at end of period | | $ | 144 | | | $ | 147 | | | $ | 220 | |
Supplemental information: | | | | | | | | | |
Interest paid | | $ | 431 | | | $ | 437 | | | $ | 330 | |
Income taxes paid, net of refunds | | $ | 254 | | | $ | 169 | | | $ | 370 | |
Non-cash investing and financing activities: | |
| | |
| | |
| |
Accrued and noncash purchases of property and equipment | | $ | 7 | | | $ | 13 | | | $ | 10 | |
Right-of-use assets obtained in exchange for operating lease obligations | | $ | 39 | | | $ | 54 | | | $ | 50 | |
The accompanying Notes are an integral part of these Consolidated Financial Statements.
NEXSTAR MEDIA GROUP, INC.
NOTES TO CONSOLIDATED FINANCIAL STATEMENTS
Note 1: Organization and Business Operations
As used in these Consolidated Financial Statements and unless the context indicates otherwise, “Nexstar” refers to Nexstar Media Group, Inc., a Delaware corporation, and its consolidated wholly-owned and majority-owned subsidiaries; the “Company” refers to Nexstar and the variable interest entities (“VIEs”) required to be consolidated in our financial statements under authoritative guidance related to the consolidation of VIEs; and all references to “we,” “our,” “ours,” and “us” refer to Nexstar.
Nexstar is a leading diversified media company with television broadcasting, television network and digital media assets operating in the United States. As of December 31, 2024, we owned, operated, programmed or provided sales and other services to 200 full power television stations and one AM radio station, including those television stations owned by VIEs, in 116 markets in 40 states and the District of Columbia. The stations are affiliates of CBS, FOX, NBC, ABC, The CW, MyNetworkTV (“MNTV”), and other broadcast television networks. As of December 31, 2024, Nexstar’s stations reached approximately 39% of all U.S. television households (after applying the Federal Communications Commission’s (“FCC”) ultra-high frequency discount). Through various local service agreements, we provided sales, programming, and other services to 35 television stations owned by consolidated VIEs and two television stations owned by unconsolidated VIEs. As of December 31, 2024, Nexstar also owns a 77.1% ownership interest in The CW Network, LLC, the fifth major broadcast network in the U.S. (“The CW”), NewsNation, a national cable news network, two digital multicast networks, Antenna TV and REWIND TV, multicast network services provided to third parties, and a 31.3% ownership stake in Television Food Network, G.P. (“TV Food Network”). Our digital assets include 138 local websites and 229 mobile applications across local stations, NewsNation and The Hill. The portfolio also includes eight connected television applications and three free ad-supported television channels from The CW and The Hill.
Note 2: Summary of Significant Accounting Policies
Principles of Consolidation
The Consolidated Financial Statements include the accounts of Nexstar, subsidiaries consolidated through voting interests and VIEs for which we are the primary beneficiary (See “Variable Interest Entities” section below). All intercompany account balances and transactions have been eliminated in consolidation. Nexstar management evaluates each arrangement that may include variable interests and determines the need to consolidate an entity where it determines Nexstar is the primary beneficiary of a VIE in accordance with related authoritative literature and interpretive guidance.
Variable Interest Entities
Nexstar may determine that an entity is a VIE as a result of local service agreements entered into with that entity. The term local service agreement generally refers to a contract whereby the owner-operator of a television station contracts with a third party (typically another television station owner-operator) to provide it with administrative, sales and other services required for the operation of its station. Nevertheless, the owner-operator of each station retains control of and responsibility for the operation of its station, including ultimate responsibility over all programming broadcast on its station. A local service agreement can be (i) a time brokerage agreement (“TBA”) or a local marketing agreement (“LMA”) which allows Nexstar to program most of a station’s broadcast time, sell the station’s advertising time and retain the advertising revenue generated in exchange for monthly payments, frequently based on the station’s monthly operating expenses, (ii) a shared services agreement (“SSA”) which allows Nexstar to provide services to a station including news production, technical maintenance and security, in exchange for Nexstar’s right to receive certain payments as described in the SSA, or (iii) a joint sales agreement (“JSA”) which permits Nexstar to sell certain of the station’s advertising time and retain a percentage of the related revenue, as described in the JSA.
Consolidated VIEs
Nexstar consolidates entities in which it is deemed under accounting principles generally accepted in the United States (“U.S. GAAP”) to have controlling financial interests for financial reporting purposes as a result of (i) local service agreements Nexstar has with the stations owned by these entities, (ii) Nexstar’s (excluding The CW) guarantee of the obligations incurred under Mission Broadcasting, Inc.’s (“Mission”) senior secured credit facility (see Note 8), (iii) Nexstar having power over significant activities affecting these VIEs’ economic performance, including budgeting for advertising revenue, certain advertising sales and, in some cases, hiring and firing of sales force personnel and (iv) purchase options granted by each consolidated VIE which permit Nexstar to acquire the assets and assume the liabilities of each of these VIEs’ stations, subject to FCC consent.
The following table summarizes the various local service agreements Nexstar had in effect as of December 31, 2024 with its consolidated VIEs:
| | | | |
Owner | | Service Agreements | | Full Power Stations |
Mission | | TBA | | WFXP, KHMT and KFQX |
| | SSA & JSA | | KJTL, KLRT, KASN, KOLR, KCIT, KAMC, KRBC, KSAN, WUTR, WAWV, WYOU, KODE, WTVO, KTVE, WTVW, WVNY, WXXA, WLAJ, KMSS, KPEJ, KLJB, KASY, KWBQ and KRWB |
| | LMA | | WNAC and WPIX |
White Knight Broadcasting (“White Knight”) | | SSA & JSA | | WVLA and KFXK |
Vaughan Media, LLC (“Vaughan”) | | SSA & JSA | | WBDT, WYTV and KTKA |
| | LMA | | KNVA |
Nexstar’s ability to receive cash from the consolidated VIEs is governed by the local service agreements. Under these agreements, Nexstar has received substantially all of the consolidated VIEs’ available cash, after satisfaction of operating costs and debt obligations. Nexstar anticipates it will continue to receive substantially all of the consolidated VIEs’ available cash, after satisfaction of operating costs and debt obligations. In compliance with FCC regulations for all the parties, each VIE maintains complete responsibility for and control over programming, finances, personnel and operations of its stations.
As of December 31, the carrying amounts and classification of the assets and liabilities, excluding intercompany amounts, of the VIEs which have been included in the Consolidated Balance Sheets were as follows (in millions):
| | | | | | | | |
| | 2024 | | | 2023 | |
Current assets: | | | | | | |
Cash and cash equivalents | | $ | 7 | | | $ | 6 | |
Accounts receivable, net | | | 26 | | | | 17 | |
Prepaid expenses and other current assets | | | 4 | | | | 5 | |
Total current assets | | | 37 | | | | 28 | |
Property and equipment, net | | | 52 | | | | 58 | |
Goodwill | | | 151 | | | | 151 | |
FCC licenses | | | 200 | | | | 200 | |
Network affiliation agreements, net | | | 59 | | | | 68 | |
Other noncurrent assets, net | | | 63 | | | | 67 | |
Total assets | | $ | 562 | | | $ | 572 | |
| | | | | | |
Current liabilities: | | | | | | |
Current portion of debt | | $ | 3 | | | $ | 2 | |
Other current liabilities | | | 37 | | | | 38 | |
Total current liabilities | | | 40 | | | | 40 | |
Debt | | | 348 | | | | 350 | |
Deferred tax liabilities | | | 41 | | | | 36 | |
Other noncurrent liabilities | | | 72 | | | | 78 | |
Total liabilities | | $ | 501 | | | $ | 504 | |
As of December 31, the following are assets of consolidated VIEs, excluding intercompany amounts, that are not available to settle the obligations of Nexstar and the liabilities of consolidated VIEs, excluding intercompany amounts, for which their creditors do not have recourse to the general credit of Nexstar (in millions):
| | | | | | | | |
| | 2024 | | | 2023 | |
Current assets | | $ | 3 | | | $ | 3 | |
Property and equipment, net | | | 10 | | | | 11 | |
Goodwill | | | 62 | | | | 62 | |
FCC licenses | | | 200 | | | | 200 | |
Network affiliation agreements, net | | | 19 | | | | 22 | |
Other noncurrent assets, net | | | 3 | | | | 2 | |
Total assets | | $ | 297 | | | $ | 300 | |
| | | | | | |
Current liabilities | | $ | 35 | | | $ | 38 | |
Noncurrent liabilities | | | 113 | | | | 114 | |
Total liabilities | | $ | 148 | | | $ | 152 | |
Non-Consolidated VIEs
Nexstar has an outsourcing agreement with Cunningham Broadcasting Corporation (“Cunningham”) which continues through December 31, 2025. Under the outsourcing agreement, Nexstar provides certain engineering, production, sales and administrative services for WYZZ, the FOX affiliate in the Peoria, Illinois market, through WMBD, the Nexstar television station in that market. During the term of the outsourcing agreement, Nexstar retains the broadcasting revenue and related expenses of WYZZ and is obligated to pay a monthly fee to Cunningham based on the combined operating cash flow of WMBD and WYZZ, as defined in the agreement.
In January 2024, we entered into a multi-year TBA with KAZT, L.L.C., the owner of television station KAZT-TV in Phoenix, Arizona, and acquired the station’s non-license assets for a nominal cash payment. We were also granted an option to purchase the station from KAZT, L.L.C., subject to FCC consent. On February 1, 2024, KAZT-TV became an affiliate of The CW.
Nexstar has determined that it has variable interests in WYZZ and KAZT-TV. Nexstar has also evaluated its arrangements with Cunningham and KAZT, L.L.C. and has determined that it is not the primary beneficiary of the variable interests because it does not have the ultimate power to direct the activities that most significantly impact the stations’ economic performance. Therefore, Nexstar has not consolidated WYZZ and KAZT-TV under authoritative guidance related to the consolidation of VIEs. There were no significant transactions arising from Nexstar’s outsourcing agreement with Cunningham or TBA with KAZT, L.L.C. Neither Cunningham nor KAZT, L.L.C. guarantees Nexstar’s debt.
Basis of Presentation
Certain prior year financial statement amounts have been reclassified to conform to the current year presentation. These reclassifications had no effect on net income or stockholders’ equity as previously reported.
Use of Estimates
The preparation of financial statements in conformity with U.S. GAAP requires management to make estimates and use assumptions that affect the reported amounts of assets and liabilities and the disclosure for contingent assets and liabilities at the date of the financial statements and the reported amounts of revenue and expenses during the reporting period. The more significant estimates made by management include, but are not limited to, those relating to valuation of assets acquired and liabilities assumed in business combinations, distribution revenue recognized, income taxes, the recoverability of goodwill, indefinite-lived intangible assets (FCC licenses), long-lived assets (property and equipment and definite-lived intangible assets), investments and broadcast rights, the useful lives of long-lived assets, valuation of pension and postretirement obligations, fair value of stock-based compensation, accretion of redeemable noncontrolling interests and allowance for credit losses. As of December 31, 2024, the Company is not aware of any specific event or circumstance that would require an update to its estimates or judgments or revision of the carrying value of its assets or liabilities. However, these estimates and judgments may change as new events occur and additional information is obtained, which may result in changes being recognized in the Company’s consolidated financial statements in future periods. Such judgments and assumptions could result in a meaningful impact on the Company’s consolidated financial statements in future periods. Actual results could differ from those estimates and any such differences may have a material impact on the Company’s consolidated financial statements.
Cash and Cash Equivalents
The Company considers all highly liquid investments purchased with an original maturity of 90 days or less to be cash equivalents.
Accounts Receivable and Allowance for Credit Losses
The Company’s accounts receivable consist primarily of billings to its customers for advertising broadcast on its stations or placed on its websites, for retransmission consent or network carriage by cable or satellite operators, and for digital publishing and content management, digital video advertising, social media advertising and related services. Trade receivables normally have terms of 30 days and the Company has no interest provision for customer accounts that are past due. The Company maintains an allowance for estimated losses resulting from the inability of customers to make required payments. Management periodically evaluates the collectability of accounts receivable based on a combination of factors, including customer payment history, known customer circumstances, the overall aging of customer balances and trends. In circumstances where management is aware of a specific customer’s inability to meet its financial obligations, an allowance is recorded to reduce the receivable amount to an amount estimated to be collectable.
Concentration of Credit Risk
Financial instruments which potentially expose the Company to a concentration of credit risk consist principally of cash and cash equivalents and accounts receivable. Cash deposits are maintained with several financial institutions. Deposits held with banks may exceed the amount of insurance provided on such deposits; however, the Company believes these deposits are maintained with financial institutions of reputable credit and are not subject to any unusual credit risk. A significant portion of the Company’s accounts receivable is due from multichannel video programming distributors and local and national advertising agencies. The Company does not require collateral from its customers but maintains reserves for potential credit losses. Management believes that the allowance for credit losses is adequate, but if the financial condition of the Company’s customers were to deteriorate, additional allowances may be required. The Company has not experienced significant losses related to receivables from individual customers or by geographical area.
Property and Equipment, Net
Property and equipment is stated at cost or at estimated fair value if acquired through a business combination. The cost and related accumulated depreciation applicable to assets sold or retired are removed from the accounts and the gain or loss on disposition is recognized. Major renewals and betterments are capitalized, and ordinary repairs and maintenance are charged to expense in the period incurred. Depreciation is computed on a straight-line basis over the estimated useful lives of the assets (see Note 4).
Intangible Assets, Net
Intangible assets consist primarily of goodwill, FCC licenses, network affiliation agreements, developed technology, brand value and customer relationships arising from acquisitions.
The Company accounts for acquired businesses using the acquisition method of accounting, which requires that purchase prices, including any contingent consideration, are measured at acquisition date fair values. These purchase prices are allocated to the assets acquired and liabilities assumed at estimated fair values at the date of acquisition using various valuation techniques, including the income approach, such as discounted projected cash flows, and other income, market or cost approaches.
The estimated fair value of an FCC license acquired in a business combination is calculated using a discounted projected cash flow model referred to as the Greenfield Method. The Greenfield Method attempts to isolate the income that is attributable to the license alone. This approach is based upon modeling a hypothetical start-up station and building it up to a normalized operation that, by design, lacks an affiliation with a network (commonly known as an independent station), lacks inherent goodwill and whose other assets have essentially been added as part of the build-up process. The Greenfield Method assumes annual cash flows over a projection period model. Inputs to this model include, but are not limited to, (i) a four-year build-up period for a start-up station to reach a normalized state of operations, (ii) television market long-term growth rate over a projection period, (iii) estimated market revenue share for a typical market participant without a network affiliation, (iv) estimated profit margins based on industry data, (v) capital expenditures based on the size of market and the type of station being constructed, (vi) estimated tax rates in the appropriate jurisdiction, and (vii) an estimated discount rate using a weighted average cost of capital analysis. The Greenfield Method also includes an estimated terminal value by discounting an estimated annual cash flow with an estimated long-term growth rate.
The assumptions used in estimating the fair value of a network affiliation agreement acquired in a business combination are similar to those used in the valuation of an FCC license. The Greenfield Method is also utilized in the valuation of network affiliation agreements except that the estimated market revenue share, estimated profit margins, capital expenditures and other assumptions reflect a market participant premium based on the programming of a network affiliate relative to an independent station. This approach would result in an estimated collective fair value of the FCC license and a network affiliation agreement. The excess of the estimated fair value in this model over the estimated value of an FCC license of an independent station under the Greenfield Method represents the estimated fair value of a network affiliation agreement.
Goodwill represents the excess of the purchase price over the fair value of the identifiable net assets acquired. During the measurement period, which may be up to one year from the acquisition date of a business, the Company records adjustments related to the assets acquired and liabilities assumed with the corresponding offset to goodwill. Upon the conclusion of the measurement period or final determination of the values of assets acquired and liabilities assumed, whichever comes first, any subsequent adjustments are recognized in the Company’s Consolidated Statements of Operations and Comprehensive Income.
The Company’s goodwill and FCC licenses are considered to be indefinite-lived intangible assets. Subsequent to acquisition, these assets are not amortized but are tested for impairment annually in the Company’s fourth quarter, or more frequently if events or changes in circumstances indicate that such assets might be impaired. The use of an indefinite life for FCC licenses contemplates the Company’s historical ability to renew its licenses such that renewals generally may be obtained indefinitely and at little cost. Therefore, cash flows derived from the FCC licenses are expected to continue indefinitely. Network affiliation agreements are subject to amortization computed on a straight-line basis over the estimated useful life of 15 years. The 15-year life assumes affiliation contracts will be renewed upon expiration. Changes in the likelihood of renewal could require a change in the useful life of such assets and cause an acceleration of amortization. The Company evaluates the remaining lives of its network affiliations whenever changes occur in the likelihood of affiliation contract renewals, and at least on an annual basis.
For purposes of goodwill impairment tests, the Company has one aggregated television stations reporting unit because of the stations’ similar economic characteristics, one cable network reporting unit, and two digital business reporting units. The Company’s impairment review for FCC licenses is performed at the television station market level.
The Company first assesses the qualitative factors to determine the likelihood of the goodwill and FCC licenses being impaired. The qualitative analysis includes, but is not limited to, assessing the changes in macroeconomic conditions, regulatory environment, industry and market conditions, and the financial performance versus budget of the reporting units, as well as any other events or circumstances specific to the reporting units or the FCC licenses. If it is more likely than not that the fair value of a reporting unit’s goodwill or a station’s FCC license is greater than its carrying amount, no further testing will be required. Otherwise, the Company will apply the quantitative impairment test method.
The quantitative impairment test for goodwill is performed by comparing the fair value of a reporting unit with its carrying amount. If the fair value of the reporting unit exceeds its carrying value, goodwill is not impaired and no further testing is required. If the fair value of the reporting unit is less than the carrying value, an impairment charge is recognized for the amount by which the carrying amount exceeds the reporting unit’s fair value; however, the loss recognized should not exceed the total amount of goodwill allocated to that reporting unit. The quantitative impairment test for FCC licenses consists of a market-by-market comparison of the carrying amounts of FCC licenses with their fair values, using the Greenfield Method of discounted cash flow analysis. An impairment is recorded when the carrying value of an FCC license exceeds its fair value.
Determining the fair value of reporting units and FCC licenses requires management to make judgments about assumptions and estimates that are highly subjective and that are based on unobservable inputs. The actual results may differ from these assumptions and estimates, and it is possible that such differences could have a material impact on the Company’s Consolidated Financial Statements. In addition to the various inputs (e.g. revenue growth, operating profit margins, capital expenditures, discount rates) used to calculate the fair value of reporting units, the Company evaluates the reasonableness of its assumptions by comparing the total fair value of all its reporting units to its total market capitalization and by comparing the fair values of its reporting units to recent market sale transactions.
The Company tests definite-lived intangible assets and other long-lived assets to be held and used for impairment whenever events or changes in circumstances indicate that their carrying amount may not be recoverable, relying on certain factors, including operating results, business plans, economic projections and anticipated future cash flows. The carrying value of a long-lived asset or asset group is considered impaired when the projected future undiscounted cash flows to be generated from the asset or asset group over its remaining life, or primary asset’s life, plus any proceeds from the eventual disposition are less than its carrying value. The Company measures impairment based on the amount by which the carrying value exceeds the estimated fair value of the long-lived asset or asset group. The fair value is determined primarily by using the projected future cash flows discounted at a rate commensurate with the risk involved as well as market valuations.
Investments
The Company accounts for investments in which it owns at least 20% of an investee’s voting securities or has significant influence over an investee under the equity method of accounting.
The Company records equity method investments at cost. For investments acquired in a business combination, the cost is the estimated fair value allocated to the investment. At acquisition date, the Company measures its estimated share of the differences between the estimated fair values and carrying values (the “basis difference”) of the investees’ tangible assets, amortizable intangible assets and goodwill had the fair value of the investments been allocated to the identifiable assets of the investees in accordance with ASC Topic 805, “Business Combinations.” The Company amortizes its share of the basis differences attributable to the investee’s tangible assets and amortizable intangible assets over the estimated useful life of each asset.
The amounts initially recognized as investment are increased by cash contributions made to and decreased by cash distributions from the investee. The investment is also adjusted for the Company’s appropriate share of the net earnings or losses of the investee and its share in the amortization of basis differences attributable to the investee’s tangible assets and amortizable intangible assets. The Company’s share in earnings and losses of the investee and its share in the amortization of basis differences are reported as “Income from equity method investments, net” in the accompanying Consolidated Statements of Operations and Comprehensive Income. Cash distributions received from investments are classified in the Consolidated Statements of Cash Flows based on the nature of the investee activities that generated the distribution. Returns on capital distributions are presented as cash flow from operating activities whereas returns of capital distributions are presented as cash flow from investing activities.
The Company evaluates equity method investments for impairment whenever events or changes in circumstances indicate that the carrying amounts of such investments may be impaired. The Company evaluates equity method investments for other-than temporary impairment (“OTTI”) on at least a quarterly basis, and more frequently when economic or market conditions warrant such an evaluation.
See Note 6 for additional information on the Company’s investments.
Broadcast Rights and Broadcast Rights Payable
The Company acquires licenses to broadcast programs from national program syndicators and from certain production companies. The Company records these contracts as an asset and a liability when the following criteria are met: (i) the license period has begun, (ii) the cost of each program is known or reasonably determinable, (iii) the program material has been accepted in accordance with the license agreement, and (iv) the program is produced and available for broadcast. Broadcast rights are initially recorded at the contract cost and are amortized on a straight-line basis over the period the programming airs. The current portion of broadcast rights represents those rights available for broadcast which will be amortized in the succeeding year. The Company periodically evaluates the net realizable value, calculated using the average historical rates for the programs or the time periods the programming will air, of broadcast rights and adjusts the amortization for any deficiency calculated. As of December 31, 2024 and 2023, programming costs included $33 million and $64 million, respectively, that were contractually due related to episodes that had been completed by certain production companies but not yet delivered to the Company. Such episodes are typically delivered within a few weeks of completion.
The Company also acquired exclusive rights to broadcast various live sports games in exchange for rights fees paid over the season associated with the live sports games. The Company amortizes these programming rights as an expense over each season based upon contractually stated rates which align with the projected revenue over the contractual term. Amortization is evaluated periodically, based on revenue projections, and adjusted as necessary.
For the years ended December 31, 2024, 2023 and 2022, amortization of broadcast rights of $324 million, $453 million and $193 million, respectively, were included in Depreciation and amortization expense in the accompanying Consolidated Statements of Operations and Comprehensive Income.
Leases
The Company determines if a contract is a lease at inception. We determine that a contract contains a lease if we obtain substantially all of the economic benefits of, and the right to direct the use of, an asset identified in the contract. For leases with terms greater than 12 months, we record right-of-use (“ROU”) asset and lease liability which are both measured at the present value of the future lease payments over the lease term. The lease payments exclude any executory costs as they are not significant. The lease term may include options to extend or terminate the lease when it is reasonably certain that the Company will exercise that option. When determining if a renewal option is reasonably certain of being exercised, the Company considers several factors, including but not limited to the significance of leasehold improvements incurred on the property, whether the asset is difficult to replace, and specific characteristics unique to the particular lease that would make it reasonably certain that the Company would exercise such option. As most of the Company’s leases do not provide an implicit rate, the incremental borrowing rate was used in determining the present value of future lease payments. The discount rate represents a risk-adjusted rate on a secured basis and is the rate at which the Company would borrow funds to satisfy the scheduled lease liability payment streams commensurate with the lease term. ROU assets and lease liabilities arising from operating leases are included in other noncurrent assets, other current liabilities and other noncurrent liabilities in the accompanying Consolidated Balance Sheets. Lease expense for lease payments is recognized on a straight-line basis over the lease term. See Note 9 for additional disclosures on the Company’s leases.
Pension plans and postretirement benefits
A determination of the liabilities and cost of Nexstar’s pension and other postretirement plans requires the use of assumptions. The actuarial assumptions used in the pension and postretirement reporting are reviewed annually with independent actuaries and are compared with external benchmarks, historical trends and Nexstar’s own experience to determine that its assumptions are reasonable. The assumptions used in developing the required estimates include the following key factors: discount rates, expected return on plan assets, mortality rates, retirement rates and expected contributions. The amount by which the projected benefit obligation exceeds the fair value of the pension plan assets is recorded in other noncurrent liabilities in the accompanying Consolidated Balance Sheets.
The net periodic benefit credit, which consists of expected return on plan assets and interest costs, is disclosed on a separate line item below income from operations in the accompanying Consolidated Statements of Operations and Comprehensive Income.
Redeemable Noncontrolling Interests
On September 30, 2022, Nexstar acquired a 75.0% ownership interest in The CW. In December 2024, Nexstar acquired additional ownership interest in The CW which increased its ownership interest to 77.1%. Pursuant to the operating agreement governing The CW, Nexstar has a call right to acquire the noncontrolling ownership interests in The CW beginning in August 2024 and each noncontrolling owner has a put right to sell its ownership interest in The CW to Nexstar beginning in June 2026, subject to Nexstar’s one year deferral right, for cash. The amount at which the noncontrolling interests can be redeemed under either the call right or the put rights is the greater of the capital contributed by the minority owners or a multiple of The CW’s earnings.
Redeemable noncontrolling interests are presented as mezzanine equity (outside of liability and stockholders’ equity) in the accompanying Consolidated Balance Sheets as they are redeemable by the holders through their put rights and the redemption is outside our control. We accrete the changes in the redemption value of redeemable noncontrolling interests over the period from issuance to the earliest redemption date using the effective interest method. The accretion is recognized as an adjustment to retained earnings, or in the absence of retained earnings, additional paid-in capital. The balance of redeemable noncontrolling interests is measured at the greater of accreted redemption value at the end of each reporting period or the carrying value adjusted for the noncontrolling interests’ contributions and share in income and losses.
During the third quarter of 2024, Nexstar recorded an adjustment to establish a $27 million carrying amount of noncontrolling interests to redeemable noncontrolling interests and reduced retained earnings by $20 million to accrete redeemable noncontrolling interests, of which $7 million was the impact of out-of-period accretion adjustment. The noncontrolling interests were previously accounted for as a component of stockholders’ equity when it should have been mezzanine equity since acquisition of The CW as described above. The inclusion of accretion in the calculation of earnings per share and the impact of out-of-period accretion adjustment to earnings per share are disclosed in Note 15.
We evaluated the impact of the out-of-period adjustment under the United States Securities and Exchange Commission (the “SEC”) Staff Accounting Bulletin No. 99, “Materiality,” and the SEC Staff Accounting Bulletin No. 108, “Considering the Effects of Prior Year Misstatements when Quantifying Misstatements in Current Year Financial Statements,” from both quantitative and qualitative perspectives and determined that it was not material to the previously reported annual and interim financial statements for the years ended December 31, 2023 and 2022 and to the current annual consolidated financial statements for the year ended December 31, 2024.
Revenue Recognition
The Company recognizes revenue when control of a promised service is transferred to a customer in exchange for an amount that reflects the consideration the Company expects to be entitled to receive. Total revenue includes distribution, advertising and other. The Company’s contracts with customers may include multiple performance obligations. For such arrangements, the Company allocates revenue to each performance obligation based on its relative standalone selling price, which is generally determined based on the price charged to customers. The Company also determines whether gross or net presentation is appropriate based on its relationship in the applicable transaction with its ultimate customer. Amounts paid by customers in advance are recorded as deferred revenue until the performance obligations are satisfied. Costs to obtain customer contracts (e.g. sales commissions) are expensed as incurred due to the short-term nature of such contracts.
Distribution Revenues—The Company receives compensation from cable, satellite and other multichannel video distributors (“MVPDs”) as well as virtual multichannel video distributors (“vMVPDs”) in return for the Company’s consent to the retransmission of the signals of its television stations or the carriage of NewsNation’s cable network. The arrangements are multi-year contracts and provide revenue based on a monthly amount the Company is entitled to receive per subscriber the MVPDs and vMVPDs have. These revenues are considered licenses of functional intellectual property and are recognized at the point in time the broadcast signal or cable network feed is delivered to the customers. The distributors report their subscriber numbers to the Company on a 30- to 60-day lag, which coincides with their payment of the fees due to the Company. Prior to receiving the report, the Company records revenue based on an estimated number of subscribers and the monthly amount the Company is entitled to receive per subscriber. Adjustments associated with the resolution of such estimates have, historically, been inconsequential. We also generate distribution revenues from fees paid by affiliates of The CW and from programmers who use our spectrum in selected local markets to air their content on our multicast streams, which are recognized as network programming and spectrum capacity, respectively, are delivered to customers.
Advertising Revenues—Advertising revenue primarily results from (i) the sale of commercial airtime to local, regional and national businesses, political candidates and other political advertisers by our stations and networks and (ii) digital advertising through the sale of advertising spots on our owned or third-party websites, and through mobile and over-the-top (“OTT”) applications and other digital advertising solutions. For the sale of commercial airtime, the contracts are short-term in nature and the performance obligation is identified at the contract level as it represents a promise to deliver an agreed number of spots, an agreed price per spot and other specifications. Each performance obligation is satisfied over time as the advertiser receives and consumes benefits when its commercial is aired. For digital advertising, the contracts are short-term and the performance obligation is a promise to place an advertisement on our owned or third-party platforms over an agreed period of time or based on impressions. Advertising revenue is recognized for the amount the Company is entitled to receive, when the performance obligation is satisfied over time. Revenue from other digital businesses includes a consumer product reviews platform, which is recognized upon performance of services and applies the right to invoice practical expedient where the invoice amount corresponds directly with the value to its customers.
See Note 17 for disaggregated revenue information.
The Company does not disclose the value of unsatisfied performance obligations on its contracts with customers because they are either (i) contracts with an original expected term of one year or less, (ii) contracts for which the sales- or usage-based royalty exception was applied, or (iii) contracts for which revenue is recognized in proportion to the amount the Company has the right to invoice for services performed.
Stock-Based Compensation
Nexstar grants time-based restricted stock units (“RSUs”), performance-based restricted stock units (“PSUs”) and stock options which are described more fully in Note 13. The fair value of RSUs is based on the number of shares awarded and market price on the date of the award and is expensed over the vesting period, which is generally a one- to four-year service period. The fair value of PSUs with a market condition is determined using a Monte Carlo simulation model and is expensed over the required employee service period. Compensation expense for these PSUs is not adjusted for the actual number of shares issued based on the outcome of the market condition for completed performance periods. The fair value of PSUs with internal performance conditions is based on the market price of the shares on the date of grant and is expensed based on the probable outcome of internal performance metrics and subsequently adjusted to reflect the actual shares issued based on the outcome of the performance metrics for completed performance periods. There were no stock options granted in 2024, 2023 and 2022. Stock-based compensation is included in selling, general and administrative expense in the accompanying Consolidated Statements of Operations and Comprehensive Income. The excess or shortage of tax deductions over the compensation cost of stock-based payments is recognized as income tax benefit or income tax expense, respectively.
Advertising costs, including costs to promote our brands, are expensed as incurred. During the years ended December 31, 2024, 2023 and 2022, the Company’s advertising and promotion costs were $48 million, $71 million, and $61 million, respectively.
Debt Financing Costs
Debt financing costs represent direct costs incurred to obtain long-term financing and are amortized to interest expense over the term of the related debt using the effective interest method. Previously capitalized debt financing costs are expensed and included in loss on extinguishment of debt if the Company determines that there has been a substantial modification of the related debt. Debt financing costs related to term loans and senior unsecured notes are combined with debt discounts and presented as a direct deduction from the carrying amount of debt. Debt financing costs related to revolving credit facilities are included in other noncurrent assets.
Income Taxes
The Company accounts for income taxes under the asset and liability method, which requires the recognition of deferred tax assets and liabilities for the expected future tax consequences of temporary differences between the carrying amounts and tax basis of assets and liabilities. A valuation allowance is applied against net deferred tax assets if, based on the weight of available evidence, it is more likely than not that some or all of the deferred tax assets will not be realized. Nexstar files a consolidated federal income tax return. Mission, White Knight and 54 Broadcasting, Inc. (a subsidiary of Vaughan and owner of station KNVA) file their own separate federal income tax returns. The CW and Vaughan are disregarded entities for tax purposes and do not incur tax within the consolidated financial statements.
The Company recognizes the tax benefit from an uncertain tax position only if it is more likely than not that the tax position will be sustained on examination by the taxing authorities. The determination is based on the technical merits of the position and presumes that each uncertain tax position will be examined by the relevant taxing authority that has full knowledge of all relevant information. The Company recognizes interest and penalties relating to income taxes within income tax expense.
Comprehensive Income
The Company’s comprehensive income consists of net income and unrecognized actuarial gains and losses on its pension and postretirement liabilities, net of income tax adjustments.
Income Per Share
Net income attributable to Nexstar Media Group, Inc. less accretion of redeemable noncontrolling interests equal to net income available to Nexstar’s common stockholders. Basic income per share is computed by dividing the net income available to Nexstar’s common stockholders by the weighted-average number of common shares outstanding during the period. Diluted income per share is computed using the weighted-average number of common shares and potentially dilutive common shares outstanding during the period. Potentially dilutive common shares are calculated using the treasury stock method. They consist of stock options and restricted stock units outstanding during the period and reflect the potential dilution that could occur if common shares were issued upon exercise of stock options and vesting of restricted stock units. See Note 15 for additional information.
Segment Presentation
The Company assesses its operating segments in accordance with Accounting Standards Codification (“ASC”) Topic 280, “Segment Reporting.” Nexstar operates in one reportable broadcast segment. The other activities of the Company include (i) The CW, (ii) digital businesses focused on the national marketplace, (iii) the management of certain real estate assets, including revenues from leasing certain owned office and production facilities, (iv) corporate functions, and (v) eliminations. See Notes 5 and 17 for additional segment information.
Recent Accounting Pronouncements
New Accounting Standards Adopted
In November 2023, the Financial Accounting Standards Board (“FASB”) issued Accounting Standards Update (“ASU”) No. 2023-07, “Segment Reporting (Topic 280): Improvements to Reportable Segment Disclosures” (“ASU 2023-07”), which expands the annual and interim disclosure requirements for reportable segments by adding disclosures of significant expenses for reportable segments as well as certain other disclosures. The standard update did not change the existing disclosure requirements, such as segment revenue and profit (loss) among others, and how an entity identifies its operating segments and reportable segments. The Company adopted the annual disclosure requirements under ASU 2023-07 on October 1, 2024, and applied the amendments retrospectively to all prior periods presented in its consolidated financial statements (see Note 17 for our updated segment information). The Company will adopt the interim requirements under ASU 2023-07 on January 1, 2025.
New Accounting Standards Not Yet Adopted
In November 2024, the FASB issued ASU No. 2024-03, “Income Statement–Reporting Comprehensive Income–Expense Disaggregation Disclosures (Subtopic 220-40): Disaggregation of Income Statement Expenses” (“ASU 2024-03”). ASU 2024-03 requires a public entity to disclose additional information about specific expense categories in the notes to financial statements on an annual and interim basis. The amendments in ASU 2024-03 are effective for annual periods beginning after December 15, 2026, and interim periods beginning after December 15, 2027. In January 2025, the FASB issued ASU 2025-01, “Income Statement–Reporting Comprehensive Income–Expense Disaggregation Disclosures (Subtopic 220-40): Clarifying the Effective date” (“ASU 2025-01”), clarifying the effective date of ASU 2024-03 to be effective for annual periods beginning after December 15, 2026, and interim periods within annual reporting periods beginning after December 15, 2027. Early adoption is permitted in both ASUs. A public entity should apply the amendments either prospectively to financial statements issued for reporting periods after the effective date of these ASUs or retrospectively to any or all prior periods presented in the financial statements. The Company is currently evaluating the potential impacts of ASU 2024-03 and ASU 2025-01 on its Consolidated Financial Statements and related disclosures.
In December 2023, the FASB issued ASU No. 2023-09, “Income Taxes (Topic 740): Improvements to Income Tax Disclosures” (“ASU 2023-09”). ASU 2023-09 applies to all entities that are subject to Topic 740, Income Taxes and is intended to enhance the transparency and decision usefulness of income tax disclosures. The amendments in ASU 2023-09 address investor requests for enhanced income tax information primarily through changes to the rate reconciliation and income taxes paid information. The amendments in ASU 2023-09 will be effective for annual periods beginning after December 15, 2024. Early adoption is permitted. The Company is currently evaluating the potential impacts ASU 2023-09 may have on its Consolidated Financial Statements upon its adoption on the effective date as it relates to future income tax disclosures.
Note 3: Acquisitions
2023 Acquisitions
On July 20, 2023, Nexstar acquired certain assets of WSNN-LD, a MNTV affiliated low power television station serving the Tampa, Florida market, from Citadel Communications, LLC. On August 31, 2023, Nexstar acquired certain assets of KUSI-TV, an independent full power television station serving the San Diego, CA market, from McKinnon Broadcasting Company and Channel 51 of San Diego, Inc. The total purchase price of these acquisitions was $38 million, including working capital adjustments. The acquired assets and assumed liabilities were recorded at fair value as of the closing dates of the transactions and consisted primarily of $13 million in property and equipment and $19 million in FCC licenses.
2022 Acquisition of The CW
On September 30, 2022, Nexstar acquired a 75.0% ownership interest in The CW from affiliates of Paramount Global and Warner Bros. Discovery (collectively the “Sellers”) for no purchase consideration. Each of the Sellers retained a 12.5% ownership interest. The Sellers have granted Nexstar a call right and Nexstar has granted each of the Sellers a put right for such Seller’s ownership interests beginning in August 2024 and June 2026, respectively (see Note 2—Redeemable Noncontrolling Interests for the accounting of put rights).
The transaction was accounted for under the acquisition method of accounting. As a result of the acquisition, Nexstar recognized a gain on bargain purchase of $56 million representing the excess of the fair value of the net assets acquired over the $0 purchase consideration paid and the fair value of the noncontrolling interests. This gain is presented as a separate line item in the accompanying Consolidated Statements of Operations and Comprehensive Income during the year ended December 31, 2022. Nexstar believes it was able to acquire The CW for $0 purchase consideration due to the recurring losses of The CW and Nexstar’s position as the largest owner of The CW-affiliated television stations, which it believes limited the number of interested acquirers, Nexstar’s agreement to commit The CW to acquire additional programming from the Sellers for the 2022/2023 broadcast season, and Nexstar’s agreement to allow the Sellers to distribute certain short and long-term accounts receivable related to previously-aired programming to the Sellers prior to closing.
The CW’s net revenue of $66 million and operating loss of $95 million from the acquisition date to December 31, 2022 have been included in the accompanying Consolidated Statements of Operations and Comprehensive Income.
Transaction costs related to this acquisition, including severance costs, retention bonuses and legal and professional fees totaling $13 million and $33 million for the years ended December 31, 2023 and 2022, respectively, were included in selling, general and administrative expense, excluding depreciation and amortization in the accompanying Consolidated Statements of Operations and Comprehensive Income.
Unaudited Pro Forma Financial Information
The following table sets forth unaudited pro forma financial information assuming the acquisition of The CW had occurred at the beginning of the year preceding the year of acquisition (in millions):
| | | | |
| | Year Ended | |
| | December 31, 2022 | |
Net revenue | | $ | 5,514 | |
Income before income taxes | | | 917 | |
Net income | | | 689 | |
Net income attributable to Nexstar | | | 781 | |
Note 4: Property and Equipment
Property and equipment consisted of the following, as of December 31 (dollars in millions):
| | | | | | | | | | |
| | Estimated | | | | | | |
| | useful life, | | | | | | |
| | in years | | 2024 | | | 2023 | |
Buildings and improvements | | 39 | | $ | 430 | | | $ | 409 | |
Land | | N/A | | | 249 | | | | 249 | |
Leasehold improvements | | term of lease | | | 140 | | | | 119 | |
Studio and transmission equipment | | 5-15 | | | 1,115 | | | | 1,095 | |
Computer equipment | | 3-5 | | | 154 | | | | 151 | |
Furniture and fixtures | | 7 | | | 33 | | | | 32 | |
Vehicles | | 5 | | | 67 | | | | 64 | |
Construction in progress | | N/A | | | 37 | | | | 60 | |
| | | | | 2,225 | | | | 2,179 | |
Less: accumulated depreciation and amortization | | | | | (1,018 | ) | | | (910 | ) |
Property and equipment, net | | | | $ | 1,207 | | | $ | 1,269 | |
For the years ended December 31, 2024, 2023 and 2022, depreciation expense of $185 million, $176 million and $160 million, respectively, was included in Depreciation and amortization expense in the accompanying Consolidated Statements of Operations and Comprehensive Income.
Note 5: Intangible Assets and Goodwill
The Company’s goodwill by segment, indefinite-lived intangible assets and definite-lived intangible assets consisted of the following, as of December 31 (dollars in millions):
| | | | | | | | | | | | | | | | | | | | | | | | | | | | | | | | | | | | |
| | Reportable Broadcast Segment | | | Other Segments | | | Total | |
| | | | | Accumulated | | | | | | | | | Accumulated | | | | | | | | | Accumulated | | | | |
Goodwill | | Gross | | | Impairment | | | Net | | | Gross | | | Impairment | | | Net | | | Gross | | | Impairment | | | Net | |
Balances as of December 31, 2023 | | $ | 2,920 | | | $ | (43 | ) | | $ | 2,877 | | | $ | 225 | | | $ | (156 | ) | | $ | 69 | | | $ | 3,145 | | | $ | (199 | ) | | $ | 2,946 | |
Impairment loss | | | - | | | | - | | | | - | | | | - | | | | (24 | ) | | | (24 | ) | | | - | | | | (24 | ) | | | (24 | ) |
Balances as of December 31, 2024 | | $ | 2,920 | | | $ | (43 | ) | | $ | 2,877 | | | $ | 225 | | | $ | (180 | ) | | $ | 45 | | | $ | 3,145 | | | $ | (223 | ) | | $ | 2,922 | |
| | | | | | | | | | | | |
| | FCC Licenses | |
| | | | | Accumulated | | | | |
Indefinite-lived Intangible Assets | | Gross | | | Impairment | | | Net | |
Balances as of December 31, 2023 | | $ | 2,977 | | | $ | (48 | ) | | $ | 2,929 | |
Balances as of December 31, 2024 | | $ | 2,977 | | | $ | (48 | ) | | $ | 2,929 | |
| | | | | | | | | | | | | | | | | | | | | | | | | | | | | | | | | | | | |
| | Network Affiliation Agreements | | | Other Definite-Lived Intangible Assets | | | Total | |
| | | | | Accumulated | | | | | | | | | Accumulated | | | | | | | | | Accumulated | | | | |
| | | | | Amortization | | | | | | | | | Amortization | | | | | | | | | Amortization | | | | |
Definite-Lived Intangible Assets | | Gross | | | and Impairment | | | Net | | | Gross | | | and Impairment | | | Net | | | Gross | | | and Impairment | | | Net | |
Balances as of December 31, 2023 | | $ | 3,125 | | | $ | (1,442 | ) | | $ | 1,683 | | | $ | 1,093 | | | $ | (652 | ) | | $ | 441 | | | $ | 4,218 | | | $ | (2,094 | ) | | $ | 2,124 | |
Balances as of December 31, 2024 | | $ | 3,125 | | | $ | (1,631 | ) | | $ | 1,494 | | | $ | 1,115 | | | $ | (762 | ) | | $ | 353 | | | $ | 4,240 | | | $ | (2,393 | ) | | $ | 1,847 | |
The estimated useful lives of Network affiliation agreements and other definite-lived intangible assets are 15 years and one to 20 years, respectively. The decrease in definite-lived intangible assets was primarily due to amortization.
For the years ended December 31, 2024, 2023 and 2022, amortization expense of $299 million, $311 million and $309 million, respectively, was included in Depreciation and amortization expense in the accompanying Consolidated Statements of Operations and Comprehensive Income.
The following table presents the Company’s estimate of amortization expense for each of the five succeeding fiscal years and thereafter for definite-lived intangible assets as of December 31, 2024 (in millions):
| | | | |
2025 | | $ | 290 | |
2026 | | | 270 | |
2027 | | | 254 | |
2028 | | | 238 | |
2029 | | | 222 | |
Thereafter | | | 573 | |
| | $ | 1,847 | |
In the fourth quarter of 2024, using the qualitative impairment test, the Company performed its annual impairment assessment on goodwill attributable to its aggregated television stations reporting unit. Based on the results of such qualitative impairment tests, the Company concluded that it was more likely than not that each reporting unit’s fair value would sufficiently exceed the related carrying amount.
With respect to goodwill allocated to a cable network reporting unit and a digital reporting unit, the Company elected to perform quantitative impairment tests due to recent performance and uncertain economic conditions.
The Company’s assessment indicated that the cable network reporting unit’s fair value exceeded its carrying amount by approximately 15%, therefore no impairment was recorded. Goodwill allocated to this reporting unit was $400 million as of December 31, 2024. The fair value estimate is management’s estimate based on a valuation report prepared by a third-party valuation firm who used a combination of an income approach, which employs a discounted cash flow model, and a market approach, which considers earnings multiples of comparable publicly traded businesses and comparable market transactions. The income approach was based on a five-year projection model which included assumptions regarding continued growth of viewership at a declining rate of growth over time and monetization thereof, continued growth in distribution revenues and annual increases in operating expenses. The income approach utilized the Company’s income tax rate, an 11% discount rate based on an analysis of comparable companies and a modest terminal growth rate typical of mature cable network businesses. The market approach based the valuation on earnings multiples of comparable publicly traded businesses with cable networks and comparable cable network transactions. The likelihood of a material impairment is mitigated by the maturity of the network and its significant contractual distribution revenue.
With respect to the digital reporting unit, the Company’s assessment indicated that its fair value was less than its carrying amount, therefore the Company recorded a goodwill impairment of 24 million. The remaining goodwill associated with this reporting unit was $45 million as of December 31, 2024. The fair value estimate is management’s estimate based on a valuation report prepared by a third-party valuation firm who used a combination of an income approach, which employs a discounted cash flow model, and a market approach. The income approach was based on a five-year projection model which included assumptions regarding the recovery of the business from a low in 2024 due to market and other factors to a full recovery to 2022 levels between year 2 and year 3 and then growth thereafter. The income approach utilized the Company’s income tax rate, a 12% discount rate based on an analysis of comparable companies and a modest terminal growth rate typical of mature digital businesses. The market approach based the valuation on earnings multiples of comparable publicly traded digital media businesses and market net revenue multiples of comparable digital media transactions. The likelihood of a material impairment is mitigated by the remaining amount of goodwill.
The Company’s quantitative goodwill impairment tests are sensitive to changes in key assumptions used in our analysis, such as expected future cash flows and market trends. If the assumptions used in our analysis are not realized, it is possible that an impairment charge may need to be recorded in the future. The Company cannot accurately predict the amount and timing of any impairment of goodwill or other intangible assets.
The Company performed its annual impairment assessment on FCC licenses for each television station market using the qualitative impairment test. Based on the results of such qualitative impairment tests, the Company concluded that it was more likely than not that their fair values would sufficiently exceed the related carrying amount.
The Company also evaluated its definite-lived intangible assets and other long-lived assets whether events or changes in circumstances indicate that such assets may be impaired. Based on the estimate of undiscounted future pre-tax cash flows expected to result from the use and eventual disposition of such assets, the Company determined that the carrying amounts are recoverable. No other events or circumstances were noted in 2024 that would indicate impairment.
During the years ended December 31, 2023 and 2022, the Company recorded a goodwill impairment of $19 million (and $16 million impairment on definite-lived intangible assets) and a goodwill impairment of $91 million (and $5 million impairment on definite-lived intangible assets), respectively, attributable to another digital unit. As of December 31, 2023, this reporting unit has no remaining book value of goodwill and definite-lived intangible assets.
Note 6: Investments
Investments in the Company’s Consolidated Balance Sheets as of December 31 consisted of the following (in millions):
| | | | | | | | |
| | 2024 | | | 2023 | |
Equity method investments | | $ | 873 | | | $ | 953 | |
Other equity investments | | | 4 | | | | 5 | |
Total investments | | $ | 877 | | | $ | 958 | |
There were no other-than-temporary impairments (“OTTI”) during the years ended December 31, 2024, 2023 and 2022.
Equity Method Investments — Investment in TV Food Network
Nexstar’s equity method investments primarily include its 31.3% ownership stake in TV Food Network which was acquired upon Nexstar’s acquisition of Tribune Media Company (“Tribune”) on September 19, 2019. Nexstar’s partner in TV Food Network is Warner Bros. Discovery, Inc. (“WBD”), which owns a 68.7% interest in TV Food Network and operates the network on behalf of the partnership.
TV Food Network operates two 24-hour television networks, Food Network and Cooking Channel, offering quality television, video, internet and mobile entertainment and information focusing on food and entertaining.
The partnership agreement governing TV Food Network provides that the partnership shall, unless certain actions are taken by the partners, dissolve and commence winding up and liquidating TV Food Network upon the first to occur of certain enumerated liquidating events, one of which is a specified date of December 31, 2025. Nexstar intends to renew its partnership agreement with WBD for TV Food Network before expiration. In the event of a liquidation, Nexstar would be entitled to its proportionate share of distributions to partners, which the partnership agreement provides would occur as promptly as is consistent with obtaining fair market value for the assets of TV Food Network. The partnership agreement also provides that the partnership may be continued or reconstituted in certain circumstances.
As of December 31, 2024, Nexstar’s investment in TV Food Network had a book value of $857 million, compared to $936 million as of December 31, 2023.
As of December 31, 2024 and 2023, Nexstar had a remaining share in amortizable basis difference of $328 million and $397 million, respectively, related to its investment in TV Food Network. The remaining amortizable basis difference as of December 31, 2024 had a remaining useful life of approximately 4.7 years. As of December 31, 2024, Nexstar’s share in the basis difference related to the investee’s goodwill was $500 million (no change in 2024).
Nexstar had the following transactions related to its investment in TV Food Network (in millions):
| | | | | | | | | | | | |
| | Years Ended December 31, | |
| | 2024 | | | 2023 | | | 2022 | |
Cash distributions received | | $ | 154 | | | $ | 270 | | | $ | 249 | |
Recognized share in TV Food Networkʼs net income | | | 144 | | | | 177 | | | | 227 | |
Recorded amortization of basis difference (expense) | | | (69 | ) | | | (69 | ) | | | (70 | ) |
Summarized financial information for TV Food Network is as follows (in millions):
| | | | | | | | | | | | |
| | Years Ended December 31, | |
| | 2024 | | | 2023 | | | 2022 | |
Net revenue | | $ | 1,017 | | | $ | 1,124 | | | $ | 1,298 | |
Costs and expenses | | | 553 | | | | 571 | | | | 583 | |
Income from operations | | | 464 | | | | 554 | | | | 716 | |
Net income | | | 465 | | | | 565 | | | | 724 | |
Net income attributable to Nexstar Media Group, Inc. | | | 144 | | | | 177 | | | | 227 | |
| | | | | | | | |
| | As of December 31 | |
| | 2024 | | | 2023 | |
Current assets | | $ | 365 | | | $ | 383 | |
Noncurrent assets | | | 472 | | | | 484 | |
Current liabilities | | | 96 | | | | 102 | |
Noncurrent liabilities | | | - | | | | - | |
Other Equity Investments
In February 2024, Nexstar received $40 million in cash proceeds, and recorded a gain on disposal of an investment for the same amount, in connection with Broadcast Music Inc.’s (“BMI”) sale to New Mountain Capital.
Note 7: Accrued Expenses
Accrued expenses consisted of the following, as of December 31 (in millions):
| | | | | | | | |
| | 2024 | | | 2023 | |
Compensation and related taxes | | $ | 91 | | | $ | 113 | |
Interest payable | | | 56 | | | | 55 | |
Network affiliation fees | | | 77 | | | | 85 | |
Other | | | 90 | | | | 97 | |
| | $ | 314 | | | $ | 350 | |
Note 8: Debt
Long-term debt consisted of the following, as of December 31 (dollars in millions):
| | | | | | | | |
| | 2024 | | | 2023 | |
Nexstar | | | | | | |
Term Loan A, due June 2027 | | $ | 2,121 | | | $ | 2,243 | |
Term Loan B, due September 2026 | | | 1,358 | | | | 1,561 | |
5.625% Notes, due July 2027 | | | 1,714 | | | | 1,714 | |
4.75% Notes, due November 2028 | | | 1,000 | | | | 1,000 | |
Mission | | | | | | |
Term Loan B, due June 2028 | | | 290 | | | | 292 | |
Revolving loans, due June 2027 | | | 62 | | | | 62 | |
Total outstanding principal | | | 6,545 | | | | 6,872 | |
Less: unamortized financing costs and discount - Nexstar Term Loan A, due June 2027 | | | (4 | ) | | | (6 | ) |
Less: unamortized financing costs and discount - Nexstar Term Loan B, due September 2026 | | | (14 | ) | | | (24 | ) |
Add: unamortized premium, net of financing costs - Nexstar 5.625% Notes, due July 2027 | | | 2 | | | | 3 | |
Less: unamortized financing costs and discount - Nexstar 4.75% Notes, due November 2028 | | | (5 | ) | | | (6 | ) |
Less: unamortized financing costs and discount - Mission Term Loan B, due June 2028 | | | (1 | ) | | | (2 | ) |
Total outstanding debt | | | 6,523 | | | | 6,837 | |
Less: current portion | | | (124 | ) | | | (124 | ) |
Long-term debt, net of current portion | | $ | 6,399 | | | $ | 6,713 | |
Senior Secured Credit Facilities
2024 Activities
During the year ended December 31, 2024, the Company repaid scheduled principal maturities of $124 million and prepaid $203 million of Term Loan B, funded by cash on hand. Also, Nexstar borrowed $55 million under its revolving credit facility for working capital purposes, which it repaid in full during the same period.
Interest rates are selected at Nexstar’s or Mission’s option, as applicable, and the applicable margin is adjusted quarterly as defined in the applicable amended credit agreement. Interest is payable periodically based on the type of interest rate selected. As of December 31, the interest rates of the outstanding loans under the senior secured credit facilities were:
•5.88% and 6.85% in 2024 and 2023, respectively, for Nexstar’s Term Loan A, due June 2027 (based on an applicable margin of 1.50% in both years)
•6.88% and 7.85% in 2024 and 2023, respectively, for Nexstar’s Term Loan B, due September 2026 (based on an applicable margin of 2.50% in both years)
•6.88% and 7.85% in 2024 and 2023, respectively, for Mission’s Term Loan B, due June 2028 (based on an applicable margin of 2.50% in both years)
•5.88% and 6.85% in 2024 and 2023, respectively, for Mission’s outstanding revolving loans, due June 2027 (based on an applicable margin of 1.50% in both years)
5.625% Notes, due July 2027
On July 3, 2019, Nexstar completed the sale and issuance of $1.120 billion 5.625% senior unsecured notes due 2027 (the “5.625% Notes, due July 2027”) at par. On November 22, 2019, Nexstar completed the issuance and sale of $665 million aggregate principal amount of additional 5.625% Notes, due July 2027. These additional notes were issued at a price of 104.875%. These additional notes are treated as a single series with the 5.625% Notes, due July 2027 issued on July 3, 2019. The 5.625% Notes, due July 2027 were issued pursuant to an indenture dated July 3, 2019 (the “5.625% Indenture due 2027”).
Interest on the 5.625% Notes, due July 2027 is payable semiannually in arrears on January 15 and July 15 of each year.
The 5.625% Notes, due July 2027 are guaranteed by Nexstar, Mission and certain of Nexstar’s and Mission’s existing and future restricted subsidiaries, subject to certain customary release provisions. The 5.65% Notes, due July 2027 are senior unsecured obligations of Nexstar and the guarantors, rank equal in right of payment with our and the guarantors’ existing and future senior indebtedness, including Nexstar’s 4.75% Notes, due November 2028, its term loans and its revolving credit facilities, but are effectively junior to our and the guarantors’ secured debt, including the term loans and revolving credit facilities, to the extent of the value of the assets securing such debt.
At any time on or after July 15, 2022, Nexstar may redeem the 5.625% Notes, due July 2027, in whole or in part, at the redemption prices set forth in the 5.625% Indenture due 2027 plus accrued and unpaid interest to the redemption date. Upon the occurrence of a change of control (as defined in the 5.625% Indenture due 2027), each holder of the 5.625% Notes, due July 2027 may require Nexstar to repurchase all or a portion of the notes in cash at a price equal to 101.0% of the aggregate principal amount to be repurchased, plus accrued and unpaid interest, if any, thereon to the date of repurchase.
The 5.625% Notes, due July 2027 contain covenants that limit, among other things, Nexstar’s ability to (1) incur additional debt, (2) pay dividends or make other distributions or repurchases or redeem its capital stock, (3) make certain investments, (4) create liens, (5) merge or consolidate with another person or transfer or sell assets, (6) enter into restrictions affecting the ability of Nexstar’s restricted subsidiaries to make distributions, loans or advances to it or other restricted subsidiaries, (7) prepay, redeem or repurchase certain indebtedness and (8) engage in transactions with affiliates.
The 5.625% Indenture due 2027 provides for customary events of default (subject in certain cases to customary grace and cure periods), which include nonpayment, breach of covenants, payment defaults or acceleration of other indebtedness, a failure to pay certain judgments and certain events of bankruptcy and insolvency. Generally, if an event of default occurs, the trustee or holders of at least 25% in principal amount of the then outstanding 5.625% Notes, due July 2027 may declare the principal of and accrued but unpaid interest, including additional interest, on all the 5.625% Notes, due July 2027 to be due and payable.
4.75% Notes, due November 2028
On September 25, 2020, Nexstar completed the sale and issuance of $1.0 billion 4.75% senior unsecured notes due 2028 (“4.75% Notes, due November 2028”) at par. The 4.75% Notes, due November 2028 were issued under an indenture dated as of September 25, 2020 (“4.75% Notes, due November 2028 Indenture”).
Interest on the 4.75% Notes, due November 2028 is payable semiannually in arrears on May 1 and November 1 of each year.
The 4.75% Notes, due November 2028 are guaranteed by Nexstar, Mission and certain of Nexstar’s and Mission’s existing and future restricted subsidiaries, subject to certain customary release provisions. The 4.75% Notes, due November 2028 are senior unsecured obligations of Nexstar and the guarantors, rank equal in right of payment with our and the guarantors’ existing and future senior indebtedness, including Nexstar’s 5.625% Notes, due July 2027, its term loans and its revolving credit facilities, but are effectively junior to our and the guarantors’ secured debt, including the term loans and revolving credit facilities, to the extent of the value of the assets securing such debt.
At any time on or after November 1, 2023, Nexstar may redeem the 4.75% Notes, due November 2028, in whole or in part, at the redemption prices set forth in the 4.75% Notes, due November 2028 Indenture. Upon the occurrence of a change in control (as defined in the 4.75% Notes, due November 2028 Indenture), each holder of the 4.75% Notes, due November 2028 may require Nexstar to repurchase all or a portion of the notes in cash at a price equal to 101.0% of the aggregate principal amount to be repurchased, plus accrued and unpaid interest, if any, thereon to, but excluding, the date of repurchase.
The 4.75% Notes, due November 2028 Indenture contains covenants that limit, among other things, Nexstar’s and the guarantors’ ability to (1) incur additional debt, (2) pay dividends or make other distributions or repurchases or redeem its capital stock, (3) make certain investments, (4) transfer or sell assets, (5) create liens, (6) enter into restrictions affecting the ability of Nexstar’s restricted subsidiaries to make distributions, loans or advances to it or other restricted subsidiaries, (7) guarantee certain indebtedness and (8) engage in transactions with affiliates.
The 4.75% Notes, due November 2028 Indenture provides for customary events of default (subject in certain cases to customary grace and cure periods), which include nonpayment, breach of covenants, payment defaults or acceleration of other indebtedness, a failure to pay certain judgments and certain events of bankruptcy and insolvency. Generally, if an event of default occurs and is continuing, the trustee or holders of at least 25% in principal amount of the then outstanding 4.75% Notes, due November 2028 may declare the principal of, premium, and accrued but unpaid interest, including additional interest, on all the 4.75% Notes, due November 2028 to be due and payable. Upon such a declaration, such principal, premium and accrued and unpaid interest will be due and payable immediately.
Unused Commitments and Borrowing Availability
Nexstar and Mission had $531 million (net of outstanding standby letters of credit of $19 million) and $14 million, respectively, of unused revolving loan commitments under each of their senior secured credit facility, all of which were available for borrowing, based on the covenant calculations as of December 31, 2024. The Company’s ability to access funds under the senior secured credit facilities depends, in part, on its compliance with certain financial covenants. As of December 31, 2024, the Company was in compliance with its financial covenants.
Collateralization and Guarantees of Debt
The Company’s credit facilities described above are collateralized by a security interest in substantially all the combined assets, excluding FCC licenses, the other assets of consolidated VIEs unavailable to creditors of Nexstar (see Note 2) and the assets of The CW. Nexstar (excluding The CW) guarantees full payment of all obligations incurred under the Mission senior secured credit facility in the event of Mission’s default. Mission is a guarantor of Nexstar’s senior secured credit facility, Nexstar’s 5.625% Notes, due July 2027 and Nexstar’s 4.75% Notes, due November 2028.
In consideration of Nexstar’s guarantee of the Mission senior secured credit facility, Mission has granted Nexstar purchase options to acquire the assets and assume the liabilities of each Mission station, subject to FCC consent. These option agreements, which expire on various dates between 2025 and 2034, are freely exercisable or assignable by Nexstar without consent or approval by Mission. The Company expects these option agreements to be renewed upon expiration.
Debt Covenants
The Nexstar credit agreement (senior secured credit facility) contains a covenant which requires Nexstar to comply with a maximum consolidated first lien net leverage ratio of 4.25 to 1.00. The financial covenant, which is formally calculated on a quarterly basis, is based on the combined results of the Company. The Mission amended credit agreement does not contain financial covenant ratio requirements but does provide for default in the event Nexstar does not comply with all covenants contained in its credit agreement. As of December 31, 2024, the Company was in compliance with its financial covenants.
Debt Maturities
The scheduled principal maturities of the Company’s debt as of December 31, 2024 are summarized as follows (in millions):
| | | |
2025 | $ | 124 | |
2026 | | 1,482 | |
2027 | | 3,658 | |
2028 | | 1,281 | |
2029 | | - | |
Thereafter | | - | |
| $ | 6,545 | |
Note 9: Leases
The Company as a Lessee
The Company has operating leases for office spaces, tower facilities, antenna sites, studios and other real estate properties and equipment. The operating leases have remaining lease terms of one month to 90 years, some of which may include options to extend the leases from two years to 99 years, and some of which may include options to terminate the leases within one year. Lease contracts that the Company has executed but which have not yet commenced as of December 31, 2024 were not material.
Supplemental balance sheet information related to operating leases as of December 31 was as follows (in millions, except lease term and discount rates):
| | | | | | | | | | |
| | Balance Sheet Classification | | 2024 | | | 2023 | |
Operating leases | | | | | | | | |
Operating lease right-of-use assets, net | | Other noncurrent assets, net | | $ | 276 | | | $ | 290 | |
Current operating lease liabilities | | Other current liabilities | | $ | 37 | | | $ | 47 | |
Noncurrent operating lease liabilities | | Other noncurrent liabilities | | $ | 253 | | | $ | 246 | |
| | | | | | | | |
Weighted Average Remaining Lease Term of Operating leases | | 8 years | | | 8 years | |
Weighted Average Discount Rate of Operating leases | | | 4.9 | % | | | 5.0 | % |
Operating lease expenses for the year ended December 31, 2024 were $66 million, of which $29 million and $37 million were included in Direct operating and Selling, general and administrative expenses, respectively, excluding depreciation and amortization, in the accompanying Consolidated Statements of Operations and Comprehensive Income.
Operating lease expenses for the year ended December 31, 2023 were $65 million, of which $28 million and $37 million were included in Direct operating and Selling, general and administrative expenses, respectively, excluding depreciation and amortization, in the accompanying Consolidated Statements of Operations and Comprehensive Income.
Operating lease expenses for the year ended December 31, 2022 were $62 million, of which $28 million and $34 million were included in Direct operating and Selling, general and administrative expenses, respectively, excluding depreciation and amortization, in the accompanying Consolidated Statements of Operations and Comprehensive Income.
Cash paid for operating leases included in the operating cash flows was $63 million, $64 million and $60 million for the years ended December 31, 2024, 2023 and 2022, respectively.
Future minimum lease payments under non-cancellable leases as of December 31, 2024 were as follows (in millions):
| | | | |
| | Operating Leases | |
2025 | | $ | 49 | |
2026 | | | 46 | |
2027 | | | 43 | |
2028 | | | 39 | |
2029 | | | 37 | |
Thereafter | | | 145 | |
Total future minimum lease payments | | | 359 | |
Less: imputed interest | | | (69 | ) |
Total | | $ | 290 | |
Note 10: Retirement and Postretirement Plans
Nexstar has various funded, qualified non-contributory defined benefit retirement plans which cover certain employees and former employees. As of December 31, 2024, the combined pension benefit obligations for these qualified retirement plans were $1.5 billion. Combined plan assets were $1.4 billion at December 31, 2024 which represents funding of approximately 90% (resulting in a combined plans being underfunded by $148 million). All these retirement plans are frozen in terms of pay and service, except for a plan with immaterial pension benefit obligations.
The remaining pension obligations of $38 million relate to non-contributory unfunded supplemental executive retirement and ERISA Excess plans for which Nexstar’s policy is to fund the benefits as claims and premiums are paid. Nexstar also has various retiree medical savings account plans which reimburse eligible retired employees for certain medical expenses and unfunded plans that provide certain health and life insurance benefits to certain retired employees.
Nexstar uses a December 31 measurement date for its pension and other postretirement benefit plans (“OPEB”). The overfunded or underfunded status of these pension and other postretirement plans is recognized as an asset or liability in the accompanying Consolidated Balance Sheets. The changes in the funded status are recorded in the year in which changes occur through comprehensive income (loss). The funded status of a plan represents the difference between the fair value of plan assets and the related plan projected benefit obligation.
As of and for the years ended December 31, the following table provides a reconciliation of the plans’ benefit obligations, plan assets and funded status, along with the related amounts that are recognized in the Consolidated Balance Sheets (in millions):
| | | | | | | | | | | | | | | | |
| | Pension Benefits | | | OPEB | |
| | 2024 | | | 2023 | | | 2024 | | | 2023 | |
Change in benefit obligations | | | | | | | | | | | | |
Benefit obligations at beginning of period | | $ | 1,708 | | | $ | 1,780 | | | $ | 20 | | | $ | 21 | |
Service cost | | | 1 | | | | 1 | | | | - | | | | - | |
Interest cost | | | 77 | | | | 83 | | | | 1 | | | | 1 | |
Actuarial (gain) loss | | | (70 | ) | | | 32 | | | | (3 | ) | | | - | |
ESOP transfer | | | 4 | | | | 3 | | | | - | | | | - | |
Benefit payments | | | (134 | ) | | | (191 | ) | | | (1 | ) | | | (2 | ) |
Benefit obligations at end of period | | $ | 1,586 | | | $ | 1,708 | | | $ | 17 | | | $ | 20 | |
Change in plan assets | | | | | | | | | | | | |
Fair value of plan assets at beginning of period | | $ | 1,496 | | | $ | 1,563 | | | $ | - | | | $ | - | |
Actual return on plan assets | | | 29 | | | | 117 | | | | - | | | | - | |
Employer contributions | | | 5 | | | | 4 | | | | 1 | | | | 2 | |
ESOP transfer | | | 4 | | | | 3 | | | | - | | | | - | |
Benefit payments | | | (134 | ) | | | (191 | ) | | | (1 | ) | | | (2 | ) |
Fair value of plan assets at end of period | | $ | 1,400 | | | $ | 1,496 | | | $ | - | | | $ | - | |
Amounts recognized in Consolidated Balance Sheets | | | | | | | | | | | | |
Current liabilities | | $ | (4 | ) | | $ | (3 | ) | | $ | (2 | ) | | $ | (2 | ) |
Noncurrent liabilities | | | (182 | ) | | | (209 | ) | | | (15 | ) | | | (18 | ) |
Funded status | | $ | (186 | ) | | $ | (212 | ) | | $ | (17 | ) | | $ | (20 | ) |
Nexstar’s pension benefit plans were underfunded as of December 31 with accumulated benefit obligations exceeding the fair value of plan assets. Information for the underfunded pension benefit plans is as follows (in millions):
| | | | | | | | |
| | 2024 | | | 2023 | |
Benefit obligations | | $ | 1,586 | | | $ | 1,708 | |
Accumulated benefit obligations | | | 1,586 | | | | 1,708 | |
Fair value of plan assets | | | 1,400 | | | | 1,496 | |
The plans’ benefit obligations were determined using the following assumptions:
| | | | | | | | | | | | | | | | | | | | |
| | Pension Benefits | | | OPEB |
| | 2024 | | | 2023 | | | 2022 | | | 2024 | | | 2023 | | 2022 |
Discount rate | | | 5.45 | % | | 4.78% - 4.79% | | | 4.98% - 4.99% | | | 5.11% - 5.38% | | | 4.59% - 4.75% | | 4.79% - 4.94% |
Compensation increase rate | | | - | | | | - | | | | - | | | | 3.00 | % | | 2.00% | | 2.00% |
The increase in the discount rates from December 31, 2023 to December 31, 2024 decreased the projected benefit obligations of qualified defined benefit pension plans by approximately $83 million at December 31, 2024. The decrease was partially offset by an approximately $13 million increase in pension obligation due to the updated census information and cash balance crediting rate assumption.
The decrease in the discount rates from December 31, 2022 to December 31, 2023 increased the projected benefit obligations of qualified defined benefit pension plans by approximately $31 million at December 31, 2023.
Net Periodic Benefit Cost (Credit)
The following tables provide the components of net periodic benefit cost (credit) for the plans for the years ended December 31 (in millions):
| | | | | | | | | | | | | | | | | | | | | | | | |
| | Pension Benefits | | | OPEB | |
| | 2024 | | | 2023 | | | 2022 | | | 2024 | | | 2023 | | | 2022 | |
Service cost | | $ | 1 | | | $ | 1 | | | $ | 1 | | | $ | - | | | $ | - | | | $ | - | |
Interest cost | | | 77 | | | | 83 | | | | 47 | | | | 1 | | | | 1 | | | | 1 | |
Expected return on plan assets | | | (100 | ) | | | (112 | ) | | | (91 | ) | | | - | | | | - | | | | - | |
Amortization of net gain | | | (5 | ) | | | (8 | ) | | | - | | | | (1 | ) | | | - | | | | - | |
Net periodic benefit cost (credit) | | $ | (27 | ) | | $ | (36 | ) | | $ | (43 | ) | | $ | - | | | $ | 1 | | | $ | 1 | |
Nexstar anticipates recording an aggregate net periodic benefit credit of $30 million for its pension and other postretirement benefits in 2025, as the expected return on plan assets exceeds estimated interest cost.
The net periodic costs for Nexstar’s pension and other benefit plans were determined using the following assumptions:
| | | | | | | | | | | | |
| | Pension Benefits | | OPEB |
| | 2024 | | 2023 | | 2022 | | 2024 | | 2023 | | 2022 |
Discount rate | | 4.78% | | 4.98% - 4.99% | | 2.69% - 2.70% | | 4.59% - 4.72% | | 4.79% - 4.92% | | 1.96% - 2.49% |
Expected return on plan assets | | 5.26% - 6.05% | | 5.53% - 6.38% | | 4.01% - 5.01% | | - | | - | | - |
Compensation increase rate | | - | | - | | - | | 3.00% | | 2.00% | | 2.00% |
Cash balance interest crediting rate | | 4.00% - 4.25% | | 3.50% - 3.75% | | 1.75% - 2.00% | | - | | - | | - |
The reasonableness of the expected return on the funded retirement plan assets was assessed with the assistance of an investment consultant, but all assumptions were reviewed by management. Their proprietary model simulates possible capital market scenarios based on the current economic environment and their capital market assumptions to come up with expected returns for the portfolio based on the current asset allocation.
For purposes of measuring the related postretirement health care costs for 2024, we assumed a 6.2% - 10.0% annual rate of increase in the per capita cost of covered health care benefits. The rate was assumed to decrease gradually to 4.5% for 2032 and remain at that level thereafter. For purposes of measuring the related postretirement health care obligations at December 31, 2024, we assumed a 6.2% - 11.25% annual rate of increase in the per capita cost of covered health care benefits. The rate was assumed to decrease gradually to 4.5% for 2034 and remain at that level thereafter.
The following table provides a summary of Nexstar’s accumulated other comprehensive income (loss) related to pension and other postretirement benefit plans prior to any deferred tax effects (in millions):
| | | | | | | | |
| | Pension Benefits | | | OPEB | |
December 31, 2021 | | $ | 191 | | | $ | (1 | ) |
Prior service cost | | | (1 | ) | | | - | |
Actuarial gain (loss) | | | (158 | ) | | | 5 | |
December 31, 2022 | | $ | 32 | | | $ | 4 | |
Actuarial loss | | | (35 | ) | | | - | |
December 31, 2023 | | $ | (3 | ) | | $ | 4 | |
Actuarial gain (loss) | | | (5 | ) | | | 3 | |
December 31, 2024 | | $ | (8 | ) | | $ | 7 | |
The asset allocation for Nexstar’s funded retirement plans at the end of 2024, and the asset allocation range for 2025, by asset category, are as follows:
| | | | |
| | Asset Allocation | | Percentage of Plan Assets at Year End |
Asset category: | | 2025 | | 2024 |
Equity securities | | 20% - 40% | | 31% |
Fixed income securities | | 60% - 80% | | 63% |
Opportunistic | | - | | 6% |
Total | | | | 100% |
As the plan sponsor of the funded retirement plans, Nexstar’s investment strategy is to achieve a rate of return on the plans’ assets that, over the long term, will fund the plans’ benefit payments and will provide for other required amounts in a manner that satisfies all fiduciary responsibilities. A determinant of the plans’ returns is the asset allocation policy. The investment policies for plan assets provide ranges for the plans’ long-term asset mix, as follows:
•For plan assets with a total fair value of $1.1 billion as of December 31, 2024, the investment policy ranges are 8%-28% U.S. equity, 0%-16% non-U.S. equity, 0%-13% emerging market equity, 0%-17% global equity, 0%-17% opportunistic sub-asset classes, 50%-70% fixed income and 0%-5% cash.
•For plan assets with a total fair value of $267 million as of December 31, 2024, the investment policy ranges are 0%-18% U.S. equity, 0%-12% non-U.S. equity, 0%-11% emerging market equity, 0%-15% global low volatility equity, 0%-14% opportunistic sub-asset classes, 70%-90% fixed income and 0%-10% cash.
Nexstar also reviews the plans’ overall asset allocation to determine the proper balance of securities by market capitalization, value or growth, U.S., international or global or the addition of other asset classes.
The investment policies are reviewed frequently and administered by an investment consultant. Periodically, Nexstar evaluates each investment with the investment consultant to determine if the overall portfolio has performed satisfactorily when compared to the defined objectives, similarly invested portfolios and specific market indices.
Investments in Common Collective Trust Funds do not have any unfunded commitments and do not have any applicable liquidation periods or defined terms and periods to be held. The portfolios offer daily liquidity; however, they request 5 business days’ notice for both withdrawals and redemptions. Strategies of the Common Collective Trust Funds by major category are as follows:
•Equity Common Collective Trusts are primarily invested in funds seeking investment results that correspond to the total return performance of their respective benchmarks in both the U.S. and international markets. Equity securities are invested broadly in U.S. and non-U.S. companies and are diversified across countries, currencies, market capitalizations and investment styles. These securities use the S&P 500 (U.S. large cap), Russell 2000 (U.S. small cap), Russell 2500 (U.S. mid cap) and MSCI All Country World Index ex-U.S. (non-U.S.) as their benchmarks.
•Fixed Income Common Collective Trusts are primarily invested in funds with an investment objective to provide investment returns through fixed-income and commingled investment vehicles that seek to outperform their respective benchmarks. Fixed income securities are invested in diversified portfolios that invest across the maturity spectrum and include primarily investment-grade securities with a minimum average quality rating of A and insurance annuity contracts. These securities use the Barclays Capital Aggregate (intermediate term bonds), Barclays Capital Long Corporate and Barclays Capital Long Government/Credit (long bonds) U.S. Bond Indexes as their benchmarks.
•Real Estate and Real Asset Common Collective Trusts seek to achieve high current return and long-term capital growth by investing in equity securities of real estate investment trusts that seek to outperform their respective benchmarks.
Other investments include investments in real estate funds, emerging market debt, high yield bonds, commodity index funds, floating rate debt, and inflation-protected bonds. These investments use the National Council of Real Estate Investment Fiduciaries Property Index or the FTSE NAREIT All Equity REIT Index (real estate), JPM EMBI Global Core Index (emerging market debt), Barclays U.S. High Yield Ba/B 1% Issuer Capped Bond Index (high yield bonds), BBG Commodity Index (commodity index fund), Morningstar LSTA US Loan (floating rate debt) and BBG 1-10 TIPS (inflation-protected bond) as their benchmarks.
The following table sets forth, by asset category, Nexstar’s pension plan assets as of December 31, 2024 and 2023, using the fair value hierarchy established under ASC Topic 820 as described in Note 16. The fair value hierarchy in the tables excludes certain investments which are valued using net asset value (“NAV”) as a practical expedient (in millions):
| | | | | | | | | | | | | | | | |
| | Pension Plan Assets as of December 31, 2024 | |
| | Level 1 | | | Level 2 | | | Level 3 | | | Total | |
Pension plan assets measured at fair value: | | | | | | | | | | | | |
Registered investment companies | | $ | 218 | | | $ | - | | | $ | - | | | $ | 218 | |
Common collective trusts | | | - | | | | 7 | | | | - | | | | 7 | |
Other | | | 2 | | | | - | | | | - | | | | 2 | |
Pooled separate account | | | - | | | | 6 | | | | - | | | | 6 | |
Total pension plan assets measured at fair value | | $ | 220 | | | $ | 13 | | | $ | - | | | | 233 | |
Pension plan assets measured at NAV as a practical expedient | | | | | | | | | | | | 1,161 | |
Pension plan assets measured at contract value: | | | | | | | | | | | | |
Insurance contracts | | | | | | | | | | | | 6 | |
Total pension plan assets | | | | | | | | | | | $ | 1,400 | |
| | | | | | | | | | | | | | | | |
| | Pension Plan Assets as of December 31, 2023 | |
| | Level 1 | | | Level 2 | | | Level 3 | | | Total | |
Pension plan assets measured at fair value: | | | | | | | | | | | | |
Registered investment companies | | $ | 52 | | | $ | - | | | $ | - | | | $ | 52 | |
Common collective trusts | | | - | | | | 18 | | | | - | | | | 18 | |
Other | | | 2 | | | | - | | | | - | | | | 2 | |
Pooled separate account | | | - | | | | 6 | | | | - | | | | 6 | |
Total pension plan assets measured at fair value | | $ | 54 | | | $ | 24 | | | $ | - | | | | 78 | |
Pension plan assets measured at NAV as a practical expedient | | | | | | | | | | | | 1,412 | |
Pension plan assets measured at contract value: | | | | | | | | | | | | |
Insurance contracts | | | | | | | | | | | | 6 | |
Total pension plan assets | | | | | | | | | | | $ | 1,496 | |
Registered investment companies are valued at exchange listed prices for exchange traded registered investment companies, which are classified in Level 1 of the fair value hierarchy.
Common/collective trusts are valued on the basis of the relative interest of each participating investor in the fair value of the underlying assets of each of the respective common/collective trusts. Common/collective trusts contain underlying assets valued based on pricing from observable market information in a non-active market and are classified in Level 2 of the fair value hierarchy.
Certain common/collective trusts, investment companies and real estate that are measured at fair value using the NAV per share practical expedient have not been categorized in the fair value hierarchy. The fair value amounts presented in the table above are intended to permit reconciliation of the fair value hierarchy to the total value of plan assets.
The pooled separate account represents an insurance contract under which plan assets are administered through pooled funds.
The PSA portfolio includes investments in money market instruments, government and corporate bonds and notes. The PSA is valued daily based on the market value of the underlying net assets in the separate account. The majority of the underlying net assets have observable Level 1 and/or 2 quoted pricing inputs which are used to determine the unit value of the PSA, which is not publicly quoted and therefore classified as Level 2 of the fair value hierarchy.
Expected Cash Flows
The following table includes amounts that are expected to be contributed to the plans by Nexstar (in millions). It additionally reflects benefit payments that are made from the plans’ assets as well as those made directly from Nexstar’s assets, and it includes the participants’ share of the costs, which is funded by participant contributions. The amounts in the table are actuarially determined and reflect Nexstar’s best estimate given its current knowledge including the impact of recent pension funding relief legislation. Actual amounts could be materially different.
| | | | | | | | |
| | Pension Benefits | | | OPEB | |
Employer Contributions | | | | | | |
2025 to participant benefits | | $ | 18 | | | $ | 2 | |
Expected Benefit Payments | | | | | | |
2025 | | $ | 147 | | | $ | 2 | |
2026 | | | 145 | | | | 2 | |
2027 | | | 143 | | | | 2 | |
2028 | | | 141 | | | | 2 | |
2029 | | | 138 | | | | 2 | |
2030-2034 | | | 629 | | | | 7 | |
Defined Contribution Plans
The Company has established retirement savings plans under Section 401(k) of the Internal Revenue Code (the “401(k) Plans”). The 401(k) Plans cover substantially all Company employees who meet the minimum age and service requirements and allow participants to defer a portion of their annual compensation on a pre-tax basis. Employer contributions to the 401(k) Plans may be made at the discretion of management of the Company. During the years ended December 31, 2024, 2023 and 2022, Nexstar contributed $20 million, $18 million and $14 million, respectively, to the 401(k) Plans.
Note 11: Commitments and Contingencies
Programming Commitments
The Company has contractual programming commitments for which no asset or liability has been recorded. Future minimum payments from these contracts, excluding intercompany transactions, are as follows as of December 31, 2024 (in millions):
| | | | |
2025 | | $ | 1,188 | |
2026 | | | 847 | |
2027 | | | 156 | |
2028 | | | 150 | |
2029 | | | 144 | |
Thereafter | | | 258 | |
| | $ | 2,743 | |
Guarantee of Mission Debt
Nexstar (excluding The CW) guarantees full payment of all obligations incurred under the Mission senior secured credit facility. In the event that Mission is unable to repay amounts due, Nexstar will be obligated to repay such amounts. The maximum potential amount of future payments that Nexstar would be required to make under this guarantee would be generally limited to the outstanding principal amounts. As of December 31, 2024, Mission had a maximum commitment of $365 million under its amended credit agreement, of which $352 million principal balance of debt was outstanding.
Indemnification Obligations
In connection with certain agreements that the Company enters into in the normal course of its business, including local service agreements, business acquisitions and borrowing arrangements, the Company enters into contractual arrangements under which the Company agrees to indemnify the third party to such arrangement from losses, claims and damages incurred by the indemnified party for certain events as defined within the particular contract. Such indemnification obligations may not be subject to maximum loss clauses and the maximum potential amount of future payments the Company could be required to make under these indemnification arrangements may be unlimited. Historically, payments made related to these indemnifications have been insignificant and the Company has not incurred significant costs to defend lawsuits or settle claims related to these indemnification agreements.
Collective Bargaining Agreements
As of December 31, 2024, certain technical, production and news employees at 21 of the Company’s stations are covered by collective bargaining agreements. The Company believes that employee relations are satisfactory and has not experienced any work stoppages at any of its stations. However, there can be no assurance that the collective bargaining agreements will be renewed in the future or that the Company will not experience a prolonged labor dispute, which could have a material adverse effect on its business, financial condition, or results of operations.
Litigation
From time to time, the Company is involved in litigation that arises from the ordinary operations of business, such as contractual or employment disputes or other general actions. In the event of an adverse outcome of these proceedings, the Company believes the resulting liabilities would not have a material adverse effect on its financial condition or results of operations.
Local TV Advertising Antitrust Litigation—On March 16, 2018, a group of companies including Nexstar and Tribune (the “Defendants”) received a Civil Investigative Demand from the Antitrust Division of the Department of Justice (“DOJ”) regarding an investigation into the exchange of certain information related to the pacing of sales related to the same period in the prior year among broadcast stations in some local markets in alleged violation of federal antitrust law. Without admitting any wrongdoing, some Defendants, including Tribune, entered into a proposed consent decree (referred to herein as the “consent decree”) with the DOJ on November 6, 2018. Without admitting any wrongdoing, Nexstar agreed to settle the matter with the DOJ on December 5, 2018. The consent decree was entered in final form by the U.S. District Court for the District of Columbia on May 22, 2019. The consent decree, which settles claims by the government of alleged violations of federal antitrust laws in connection with the alleged information sharing, does not include any financial penalty. Pursuant to the consent decree, Nexstar and Tribune agreed not to exchange certain non-public information with other stations operating in the same market except in certain cases, and to implement certain antitrust compliance measures and monitor and report on compliance with the consent decree.
Starting in July 2018, a series of plaintiffs filed putative class action lawsuits against the Defendants and others alleging that they coordinated their pricing of television advertising, thereby harming a proposed class of all buyers of television advertising time from one or more of the Defendants since at least January 1, 2014. The plaintiff in each lawsuit seeks injunctive relief and money damages caused by the alleged antitrust violations. On October 9, 2018, these cases were consolidated in a multi-district litigation in the District Court for the Northern District of Illinois captioned In Re: Local TV Advertising Antitrust Litigation, No. 1:18-cv-06785 (“MDL Litigation”). On January 23, 2019, the Court in the MDL Litigation appointed plaintiffs’ lead and liaison counsel.
The MDL Litigation is ongoing. The Plaintiffs’ Consolidated Complaint was filed on April 3, 2019; Defendants filed a Motion to Dismiss on September 5, 2019. Before the Court ruled on that motion, the Plaintiffs filed their Second Amended Consolidated Complaint on September 9, 2019. This complaint added additional defendants and allegations. The Defendants filed a Motion to Dismiss and Strike on October 8, 2019. The Court denied that motion on November 6, 2020. On March 16, 2022, the Plaintiffs filed their Third Amended Complaint. The Third Amended Complaint adds two additional plaintiffs and an additional defendant, but does not make material changes to the allegations.
The parties are in the discovery phase of litigation. The Court has not yet set a trial date. Nexstar and Tribune deny all allegations against them and will defend their advertising practices.
In connection with Nexstar’s acquisition of Tribune on September 19, 2019, Nexstar assumed contingencies from certain legal proceedings, as follows:
Chicago Cubs Transactions—On August 21, 2009, Tribune and Chicago Entertainment Ventures, LLC (formerly Chicago Baseball Holdings, LLC) (“CEV LLC”), and its subsidiaries (collectively, “New Cubs LLC”), among other parties, entered into an agreement (the “Cubs Formation Agreement”) governing the contribution of certain assets and liabilities related to the businesses of the Chicago Cubs Major League Baseball franchise then owned by Tribune and its subsidiaries to New Cubs LLC. The transactions contemplated by the Cubs Formation Agreement and the related agreements thereto (the “Chicago Cubs Transactions”) closed on October 27, 2009. As a result of these transactions, Northside Entertainment Holdings LLC (f/k/a Ricketts Acquisition LLC) (“NEH”) owned 95% and Tribune owned 5% of the membership interests in CEV LLC. The fair market value of the contributed assets exceeded the tax basis and did not result in an immediate taxable gain as the transaction was structured to comply with the partnership provisions of the Internal Revenue Code (“IRC”) and related regulations.
On June 28, 2016, the Internal Revenue Service (“IRS”) issued Tribune a Notice of Deficiency which presented the IRS’s position that the gain with respect to the Chicago Cubs Transactions should have been included in Tribune’s 2009 taxable income. Accordingly, the IRS proposed a $182 million tax and a $73 million gross valuation misstatement penalty. During the third quarter of 2016, Tribune filed a petition in U.S. Tax Court to contest the IRS’s determination. After-tax interest on the aforementioned proposed tax and penalty through December 31, 2024 would be approximately $232 million. In addition, if the IRS prevails in its position, under the tax rules for determining tax basis upon emergence from bankruptcy, the Company would be required to reduce its tax basis in certain assets. The reduction in tax basis would be required to reflect the reduction in the amount of the Company’s guarantee of the New Cubs partnership debt which was included in the reported tax basis previously determined upon emergence from bankruptcy and subject to Tribune’s 2014 and 2015 Federal Income Tax Audits (described below).
On September 19, 2019, Tribune became a wholly owned subsidiary of Nexstar following Nexstar’s merger with Tribune. Nexstar disagrees with the IRS’s position that the Chicago Cubs Transactions generated taxable gain in 2009, the proposed penalty and the IRS’s calculation of the gain. If the IRS prevails in its position, the gain on the Chicago Cubs Transactions would be deemed to be taxable in 2009. Nexstar estimates that the federal and state income taxes would be approximately $225 million before interest and penalties. Any tax, interest and penalty due will be offset by tax payments made relating to this transaction subsequent to 2009. Tribune made approximately $154 million of tax payments prior to its merger with Nexstar.
A bench trial in the U.S. Tax Court took place between October 28, 2019 and November 8, 2019, and closing arguments took place on December 11, 2019. The Tax Court issued a separate opinion on January 6, 2020 holding that the IRS satisfied the procedural requirements for the imposition of the gross valuation misstatement penalty. The judge deferred any litigation of the penalty until a final determination was reached by the Tax Court or Court of Appeals.
On October 26, 2021, the Tax Court issued an opinion related to the Chicago Cubs Transactions, which held that Tribune’s structure was, in substantial part, in compliance with partnership provisions of the Code and, as a result, did not trigger the entire 2009 taxable gain proposed by the IRS. On October 19, 2022, the Tax Court entered the decision that there is no tax deficiency or penalty due in the 2009 tax year. On January 13, 2023, the IRS filed a notice of appeal to the U.S. Court of Appeals for the Seventh Circuit. On February 3, 2023, the Company filed a notice of cross-appeal. On February 15, 2024, the case was argued before the U.S. Court of Appeals for the Seventh Circuit. The Company expects a ruling from the Court of Appeals in the first half of 2025.
As of December 31, 2024, Nexstar believes the tax impact of applying the Tax Court opinion to 2009 and its impact on subsequent tax years is not material to the Company’s accounting for uncertain tax positions or to its Consolidated Financial Statements. Although management believes its estimates and judgments are reasonable, the timing and ultimate resolution are unpredictable and could materially change.
Revenue Agent’s Report on Tribune’s 2014 to 2015 Federal Income Tax Audits— Prior to Nexstar’s merger with Tribune in September 2019, Tribune was undergoing federal income tax audits for taxable years 2014 and 2015. In the third quarter of 2020, the IRS completed its audits of Tribune and issued a Revenue Agent’s Report which disallows the reporting of certain assets and liabilities related to Tribune’s emergence from Chapter 11 bankruptcy on December 31, 2012. Nexstar disagrees with the IRS’s proposed adjustments to the tax basis of certain assets and the related taxable income impact, and Nexstar is contesting the adjustments through the IRS administrative appeal procedures. If the IRS prevails in its position and after taking into account the impact of the Tax Court opinion, Nexstar would be required to reduce its tax basis in certain assets resulting in a $17 million increase in its federal and state taxes payable and a $69 million increase in deferred income tax liability as of December 31, 2024. In accordance with ASC Topic 740, the Company has reflected $11 million for certain contested issues in its liability for uncertain tax positions at December 31, 2024 and December 31, 2023.
Regulatory Matters
On March 21, 2024, the FCC issued a Notice of Apparent Liability for Forfeiture (“NAL”) to Nexstar and to Mission, a consolidated VIE, for alleged violations of the Communications Act and FCC rules relating to Mission television station WPIX, New York, New York. The NAL alleges that Nexstar and Mission engaged in an unauthorized transfer of control of WPIX and that Nexstar violated the national television ownership limit by acquiring undisclosed attributable interests in the station. The NAL proposes forfeitures to Nexstar and Mission for the alleged violations and additionally requires that within 12 months of a forfeiture order or payment of the forfeitures, either (i) Mission divest WPIX to an “unrelated third party” or (ii) Mission sell WPIX to Nexstar, with Nexstar divesting a sufficient number of other stations to reduce its national reach below the FCC national ownership limit. Nexstar and Mission have filed responses vigorously disputing the NAL. Nexstar is unable to reasonably estimate the possible financial statement impact, if any, relating to the NAL.
WADL-TV
On May 22, 2024, Mission terminated its proposed acquisition of WADL-TV serving the Detroit, Michigan market from Adell Broadcasting Corporation. There were no fees that resulted from the termination.
Note 12: Equity
The holders of common stock are entitled to one vote per share. The common stockholders are entitled to receive cash dividends, subject to the rights of holders of any series of preferred stock, on an equal per share basis. Nexstar’s senior secured credit facility provides limits on the amount of dividends the Company may pay to stockholders during the term of Nexstar’s credit agreement.
During 2024, Nexstar repurchased a total of 3,637,192 shares of common stock for $601 million. During 2023, Nexstar repurchased a total of 3,782,104 shares of common stock for $605 million. During 2022, Nexstar repurchased a total of 5,055,304 shares of common stock for $881 million. All stock repurchases were funded by cash on hand.
The total remaining authorization for future common stock repurchases under Nexstar’s share repurchase program was $1.6 billion as of December 31, 2024, which includes the $1.5 billion increase to the share repurchase program authorized by Nexstar’s Board of Directors on July 26, 2024. Share repurchases are executed from time to time in open market transactions, block trades or in private transactions, including through Rules 10b5-1 and 10b-18 plans. There is no minimum number of shares that Nexstar is required to repurchase. The repurchase program does not have an expiration date and may be suspended or discontinued at any time without prior notice.
Nexstar utilizes available treasury stock when options are exercised or restricted stock units (RSUs and PSUs) vest. During the years ended December 31, 2024, 2023 and 2022, 657,507 shares, 572,844 shares and 1,116,701 shares, respectively, of common stock were reissued from treasury to fulfill stock option exercises and vesting of restricted stock units, net of any shares withheld to cover participant taxes.
During the years ended December 31, 2024, 2023 and 2022, total dividend payments to common stockholders were $219 million, $191 million, and $142 million, respectively.
On June 13, 2022, Nexstar’s shareholders approved certain amendments to Nexstar’s certificate of incorporation (the “Original Certificate of Incorporation”) to eliminate Nexstar’s Class B common stock, par value $0.01 per share (the “Class B Common Stock”), and Class C common stock, par value $0.01 per share (the “Class C Common Stock”), which classes of common stock had no shares issued and outstanding prior to the date of shareholder approval of their elimination. The common stock (f/k/a Class A common stock) has been the only class of shares outstanding since 2013. On June 27, 2022, Nexstar filed a Certificate of Amendment No. 2 (the “Amendment”) to the Original Certificate of Incorporation with the Secretary of State of the State of Delaware to reflect the elimination of Nexstar’s Class B Common Stock and Class C Common Stock and make related changes. The Amendment became effective upon its filing with the Secretary of State of the State of Delaware on June 27, 2022.
For transactions and events involving the Company’s common stock after December 31, 2024, refer to Note 19.
Note 13: Stock-Based Compensation
Stock-Based Compensation Expense
The Company recognized stock-based compensation expense of $78 million, $60 million and $62 million for the years ended December 31, 2024, 2023 and 2022, respectively, all attributable to RSUs and PSUs. In 2024, 2023 and 2022, there was no stock-based compensation attributable to stock options. As of December 31, 2024, there was $105 million of total unrecognized compensation cost related to RSUs and PSUs, which is expected to be recognized over a weighted-average period of 2.4 years. There is no remaining unrecognized compensation cost related to stock options.
Stock-Based Compensation Plans
As of December 31, 2024, Nexstar has two stock-based compensation plans that provide for the granting of stock options, stock appreciation rights, RSUs and PSUs to directors, employees or consultants of Nexstar: the 2019 Long-Term Equity Incentive Plan, approved by Nexstar’s majority stockholders on June 5, 2019 (the “2019 Plan”) and the 2015 Long-Term Equity Incentive Plan, approved by Nexstar’s majority stockholders on June 11, 2015 (the “2015 Plan”). A maximum of 3,100,000 shares and 2,500,000 shares of Nexstar’s common stock can be issued under the 2019 Plan and 2015 Plan, respectively.
At December 31, 2024, 1,038,651 shares remained available for future grants under the 2019 Plan. The remaining shares available for future grants under the 2015 Plan were nominal.
Stock Options
Options are granted with an exercise price at least equal to the fair market value of the underlying shares of common stock on the date of the grant. The following table summarizes activity and information related to stock options for the year ended December 31, 2024:
| | | | | | | | | | | | | | | | | | | | | | | | |
| | Outstanding Options | | | Non-Vested Options | |
| | | | | | | | Weighted- | | | | | | | | | | |
| | | | | Weighted- | | | Average | | | Aggregate | | | | | | Weighted- | |
| | | | | Average | | | Remaining | | | Intrinsic | | | | | | Average | |
| | | | | Exercise | | | Contractual | | | Value | | | | | | Grant-Date | |
| | Shares | | | Price | | | Term (Years) | | | (thousands) | | | Shares | | | Fair Value | |
Balances as of December 31, 2023 | | | 244,068 | | | $ | 47.17 | | | | 0.88 | | | $ | 26,744 | | | | - | | | $ | - | |
Granted | | | - | | | $ | - | | | | - | | | | - | | | | - | | | $ | - | |
Exercised | | | (244,068 | ) | | $ | 47.17 | | | | - | | | | - | | | | - | | | $ | - | |
Vested | | | - | | | $ | - | | | | - | | | | - | | | | - | | | $ | - | |
Forfeited/cancelled | | | - | | | $ | - | | | | - | | | | - | | | | - | | | $ | - | |
Balances as of December 31, 2024 | | | - | | | $ | - | | | | - | | | $ | - | | | | - | | | $ | - | |
Exercisable as of December 31, 2024 | | | - | | | $ | - | | | | - | | | $ | - | | | | | | | |
Fully vested and expected to vest as of December 31, 2024 | | | - | | | $ | - | | | | - | | | $ | - | | | | | | | |
For the years ended December 31, 2024, 2023 and 2022, the aggregate intrinsic value of options exercised, on their respective exercise dates, was $28 million, $10 million and $110 million, respectively.
Time-Based Restricted Stock Units
The RSUs vest over a range of one to four years from the date of the award subject to the continued employment of the grantee as of each vesting date. Unvested RSUs are generally forfeited immediately upon the employee’s termination for any reason other than change of control. The following table summarizes activity and information related to RSUs for the year ended December 31, 2024:
| | | | | | | | |
| | | | | Weighted-Average | |
| | Unvested | | | Grant-Date | |
| | Shares | | | Fair Value | |
Unvested as of December 31, 2023 | | | 815,324 | | | $ | 144.62 | |
Awarded | | | 447,516 | | | $ | 144.53 | |
Vested | | | (337,096 | ) | | $ | 131.20 | |
Forfeited/cancelled | | | (86,005 | ) | | $ | 149.30 | |
Unvested as of December 31, 2024 | | | 839,739 | | | $ | 149.48 | |
Performance-Based Restricted Stock Units
The PSUs vest over a range of two to four years from the date of the award subject to the continued service of the grantee as of each vesting date and the achievement of specific performance metrics. For PSU awards with a market condition, the number of shares to be issued upon vesting is based on the total shareholder return of Nexstar’s class A common stock measured against a defined peer group over a designated measurement period. Certain other PSU awards are based on the achievement of established internal operating goals. Unvested PSUs are generally forfeited immediately upon the employee’s termination for any reason other than change of control or when the required metric was not achieved. The following table summarizes activity and information related to PSUs for the year ended December 31, 2024:
| | | | | | | | |
| | | | | Weighted-Average | |
| | Unvested | | | Grant-Date | |
| | Shares | | | Fair Value | |
Unvested as of December 31, 2023 | | | 173,567 | | | $ | 182.43 | |
Awarded | | | 176,424 | | | $ | 192.73 | |
Vested | | | (134,296 | ) | | $ | 193.84 | |
Forfeited/cancelled | | | (14,209 | ) | | $ | 118.42 | |
Unvested as of December 31, 2024 | | | 201,486 | | | $ | 188.36 | |
Note 14: Income Taxes
The income tax expense (benefit) consisted of the following components for the years ended December 31 (in millions):
| | | | | | | | | | | | |
| | 2024 | | | 2023 | | | 2022 | |
Current tax expense: | | | | | | | | | |
Federal | | $ | 246 | | | $ | 170 | | | $ | 294 | |
State | | | 63 | | | | 37 | | | | 82 | |
| | | 309 | | | | 207 | | | | 376 | |
Deferred tax benefit: | | | | | | | | | |
Federal | | | (28 | ) | | | (60 | ) | | | (84 | ) |
State | | | (5 | ) | | | (16 | ) | | | (18 | ) |
| | | (33 | ) | | | (76 | ) | | | (102 | ) |
Income tax expense | | $ | 276 | | | $ | 131 | | | $ | 274 | |
The following is a reconciliation of the federal statutory income tax rate to income tax expense for the years ended December 31 (in millions):
| | | | | | | | | | | | |
| | 2024 | | | 2023 | | | 2022 | |
Federal income tax at the statutory rate | | $ | 201 | | | $ | 84 | | | $ | 256 | |
State and local taxes, net of federal benefit | | | 43 | | | | 18 | | | | 47 | |
Nondeductible compensation | | | 12 | | | | 8 | | | | 8 | |
Nondeductible meals and entertainment | | | 3 | | | | 3 | | | | 2 | |
Excess tax benefit on stock-based compensation | | | (6 | ) | | | (4 | ) | | | (26 | ) |
Change in beginning of year valuation allowance | | | 1 | | | | 10 | | | | (4 | ) |
Uncertain tax positions | | | 3 | | | | - | | | | (4 | ) |
Bargain purchase gain | | | - | | | | - | | | | (12 | ) |
Minority interest | | | 7 | | | | 14 | | | | 5 | |
Write-off of non-deductible goodwill | | | 5 | | | | - | | | | - | |
Other | | | 7 | | | | (2 | ) | | | 2 | |
Income tax expense | | $ | 276 | | | $ | 131 | | | $ | 274 | |
On December 22, 2017, the Tax Cuts and Jobs Act of 2017 (the “Act”) was signed into law making significant changes to the Internal Revenue Code. The Act reduced the federal corporate income tax rate from 35% to 21% effective for tax years beginning after December 31, 2017. Although the federal corporate income tax rate reduction is only effective for tax periods beginning after December 31, 2017, ASC 740 requires the Company to remeasure the existing net deferred tax liability in the period of enactment. The Act also provides for immediate expensing of 100% of the costs of qualified property that are incurred and placed in service during the period from September 27, 2017 to December 31, 2022. Beginning January 1, 2023, the immediate expensing provision is phased down by 20% per year until it is completely phased out as of January 1, 2027. Additionally, effective January 1, 2018, the Act modifies the executive compensation deduction limitation and imposes possible limitations on the deductibility of interest expense. As a result of these provisions of the Act, the Company’s deduction related to executive compensation and interest expense could be limited in future years.
The components of the net deferred tax asset (liability) were as follows, as of December 31 (in millions):
| | | | | | | | |
| | 2024 | | | 2023 | |
Deferred tax assets: | | | | | | |
Net operating loss carryforwards | | $ | 34 | | | $ | 43 | |
Compensation | | | 6 | | | | 8 | |
Rent | | | 69 | | | | 70 | |
Pension | | | 53 | | | | 61 | |
Other | | | 44 | | | | 51 | |
Total deferred tax assets | | | 206 | | | | 233 | |
Valuation allowance for deferred tax assets | | | (52 | ) | | | (48 | ) |
Total deferred tax assets | | | 154 | | | | 185 | |
Deferred tax liabilities: | | | | | | |
Property and equipment | | | (178 | ) | | | (199 | ) |
Other intangible assets | | | (357 | ) | | | (409 | ) |
Goodwill | | | (158 | ) | | | (138 | ) |
FCC licenses | | | (678 | ) | | | (666 | ) |
Rent | | | (68 | ) | | | (73 | ) |
Investments | | | (160 | ) | | | (177 | ) |
Other | | | (42 | ) | | | (43 | ) |
Total deferred tax liabilities | | | (1,641 | ) | | | (1,705 | ) |
Net deferred tax liabilities | | $ | (1,487 | ) | | $ | (1,520 | ) |
As of December 31, 2024, the Company’s reserve for uncertain tax positions totaled approximately $27 million. For the years ended December 31, 2024, 2023 and 2022 there were $27 million, $27 million and $28 million of gross unrecognized tax benefits, respectively, that would reduce the effective tax rate if the underlying tax positions were sustained or settled favorably. The Company has not recorded any tax reserves related to the Chicago Cubs Transactions as further described in Note 11.
A reconciliation of the beginning and ending balances of the gross liability for uncertain tax positions is as follows (in millions):
| | | | | | | | | | | | |
| | 2024 | | | 2023 | | | 2022 | |
Uncertain tax position liability at the beginning of the year | | $ | 27 | | | $ | 28 | | | $ | 33 | |
Increases related to current year positions | | | 1 | | | | - | | | | - | |
Decreases related to settlements with taxing authorities | | | - | | | | - | | | | (2 | ) |
Decreases related to expiration of statute of limitations | | | (1 | ) | | | (1 | ) | | | (3 | ) |
Uncertain tax position liability at the end of the year | | $ | 27 | | | $ | 27 | | | $ | 28 | |
The Company’s liability for unrecognized tax benefits totaled $27 million and $27 million at December 31, 2024 and 2023, respectively. If all of the unrecognized tax benefits at those dates had been recognized, there would have been a favorable $27 million and $27 million impact on the Company’s reported income tax expense in 2024 and 2023, respectively.
As allowed by ASC Topic 740, the Company recognizes accrued interest and penalties related to uncertain tax positions in income tax expense in the accompanying Consolidated Statements of Operations and Comprehensive Income. The Company’s accrued interest and penalties related to uncertain tax positions were $12 million, $9 million and $7 million for the years ended December 31, 2024, 2023 and 2022, respectively.
Although management believes its estimates and judgments are reasonable, the resolutions of the Company’s tax issues are unpredictable and could result in tax liabilities that are significantly higher or lower than those which have been provided by the Company. The Company believes it is reasonably possible that the total amount of unrecognized tax benefits could decrease by approximately $15 million within the next twelve months due to the resolution of tax examination issues and statute of limitations expirations.
There can be no assurance that the outcomes from any tax examinations will not have a significant impact on the amount of such liabilities, which could have an impact on the operating results or financial position of the Company.
The Company files income tax returns in the U.S. federal jurisdiction and various state jurisdictions. The Tribune acquired entities are currently undergoing federal audits for tax periods including 2014–2015 and 2018–2019. Protective claims for refund have been filed for 2013, 2016 and 2017 to keep the periods open for specific issues relating to the potential Cubs resolution. Nexstar is subject to U.S. federal tax examinations for years after 2020. The Company currently has various state income tax returns in the process of examination or administrative appeal. Additionally, any net operating loss carry-forwards (“NOLs”) that were generated in prior years and utilized in the current year or future years may also be subject to examination by the Internal Revenue Service. Generally, the Company is subject to state tax examination for years after 2018 and any NOLs that were generated in prior years and utilized in the current year or future years may also be subject to examination.
The Company has gross federal and state income tax NOL carryforwards of $130 million and $137 million, respectively, which are available to reduce future taxable income if utilized before their expiration. A valuation allowance has been recorded against $118 million of federal NOLs and $72 million of state NOLs attributable to one of the consolidated VIEs. Federal NOLs generated prior to 2018 will expire through 2037 if not utilized. Federal NOLs generated after 2017 carry forward indefinitely. State NOLs will expire through 2044 if not utilized. Section 382 of the Internal Revenue Code of 1986, as amended, generally imposes an annual limitation on the amount of NOLs that may be used to offset taxable income when a corporation has undergone significant changes in stock ownership. Ownership changes are evaluated as they occur and could limit the ability to use NOLs. As of December 31, 2024, the Company does not expect any NOLs to expire as a result of Section 382 limitations.
The ability to use NOLs is also dependent upon the Company’s ability to generate taxable income. The NOLs could expire before the Company generates sufficient taxable income. To the extent the Company’s use of NOLs is significantly limited, the Company’s income could be subject to corporate income tax earlier than it would if it were able to use NOLs, which could have a negative effect on the Company’s financial results and operations.
Note 15: Income Per Share
Income per share (basic and diluted) available to common stockholders for the years ended December 31 are presented below (dollars in millions, except per share amounts, and shares in thousands):
| | | | | | | | | | | | |
| | 2024 | | | 2023 | | | 2022 | |
Net income attributable to Nexstar Media Group, Inc. | | $ | 722 | | | $ | 346 | | | $ | 971 | |
Accretion of redeemable noncontrolling interests(1) | | | (20 | ) | | | - | | | | - | |
Net income available to common stockholders | | $ | 702 | | | $ | 346 | | | $ | 971 | |
| | | | | | | | | |
Weighted average shares outstanding – basic | | | 32,311 | | | | 35,317 | | | | 39,349 | |
Dilutive effect of equity incentive plan instruments | | | 485 | | | | 517 | | | | 838 | |
Weighted average shares outstanding – diluted | | | 32,796 | | | | 35,834 | | | | 40,187 | |
| | | | | | | | | |
Net income per share available to common stockholders – basic | | $ | 21.73 | | | $ | 9.78 | | | $ | 24.68 | |
Net income per share available to common stockholders – diluted | | $ | 21.41 | | | $ | 9.64 | | | $ | 24.16 | |
(1)As discussed in Note 2, we adjusted our accounting for redeemable noncontrolling interests. The accretion for the year ended December 31, 2024 included an out-of-period adjustment of $7 million which reduced each of basic and diluted earnings per share by $0.20.
The Company has outstanding restricted stock units to acquire 20,000, 69,000 and 26,000 weighted average shares of common stock for the years ended December 31, 2024, 2023 and 2022, respectively, the effects of which are excluded from the calculation of dilutive income per share, as their inclusion would have been anti-dilutive for the periods presented.
Note 16: Fair Value Measurements
The Company measures and records in its Consolidated Financial Statements certain assets and liabilities at fair value. ASC Topic 820, “Fair Value Measurement and Disclosures,” establishes a fair value hierarchy for instruments measured at fair value that distinguishes between assumptions based on market data (observable inputs) and the Company’s own assumptions (unobservable inputs). This hierarchy consists of the following three levels:
•Level 1 – Assets and liabilities whose values are based on unadjusted quoted prices for identical assets or liabilities in an active market.
•Level 2 – Assets and liabilities whose values are based on inputs other than those included in Level 1, including quoted market prices in markets that are not active; quoted prices of assets or liabilities with similar attributes in active markets; or valuation models whose inputs are observable or unobservable but corroborated by market data.
•Level 3 – Assets and liabilities whose values are based on valuation models or pricing techniques that utilize unobservable inputs that are significant to the overall fair value measurement.
The carrying values of cash and cash equivalents, restricted cash and cash equivalents, accounts receivable, accounts payable, broadcast rights payable, and accrued expenses approximate fair value due to their short term nature.
As of December 31, the estimated fair values and carrying amounts of the Company’s long-term debt which are not measured at fair value on a recurring basis were as follows (dollars in millions):
| | | | | | | | | | | | | | | | |
| | 2024 | | | 2023 | |
| | Carrying | | | Fair | | | Carrying | | | Fair | |
| | Amount | | | Value | | | Amount | | | Value | |
Nexstar | | | | | | | | | | | | |
Term Loan A, due June 2027(1) | | $ | 2,117 | | | $ | 2,093 | | | $ | 2,237 | | | $ | 2,217 | |
Term Loan B, due September 2026(1) | | | 1,344 | | | | 1,362 | | | | 1,537 | | | | 1,545 | |
5.625% Notes, due July 2027(2) | | | 1,716 | | | | 1,667 | | | | 1,717 | | | | 1,654 | |
4.75% Notes, due November 2028(2) | | | 995 | | | | 930 | | | | 994 | | | | 915 | |
Mission | | | | | | | | | | | | |
Term Loan B, due June 2028(1) | | | 289 | | | | 290 | | | | 290 | | | | 288 | |
Revolving loans due June 2027(1) | | | 62 | | | | 61 | | | | 62 | | | | 60 | |
(1)The fair value of senior secured and revolving credit facilities is computed based on borrowing rates currently available to the Company for bank loans with similar terms and average maturities. These fair value measurements are considered Level 3, as significant inputs to the fair value calculation are unobservable in the market.
(2)The fair value of the Company’s fixed rate debt is estimated based on bid prices obtained from an investment banking firm and are considered Level 2.
During the year ended December 31, 2024, there were no events or changes in circumstance that triggered an impairment to the Company’s significant assets, including equity method investments, indefinite-lived intangible assets, long-lived assets and goodwill, other than those disclosed. See Notes 5 and 6 for additional information.
Certain investments held in the pension and other post retirement plans have been valued using NAV as a practical expedient for fair value. In accordance with ASC 820, investments measured at NAV are excluded from the fair value hierarchy. See Note 10 for fair value disclosures related to retirement and postretirement plans.
Note 17: Segment Data
The Company’s reportable broadcast segment includes (i) television stations and related local websites that Nexstar owns, operates, programs or provides sales and other services to in various markets across the United States, (ii) NewsNation, a national cable news network, (iii) two owned and operated multicast networks and other multicast network services, and (iv) WGN-AM, a Chicago radio station. The other operating segments are nonreportable and include (i) The CW and (ii) digital businesses focused on the national marketplace. Intersegment transactions are eliminated in consolidation. The remaining activities of the Company are corporate functions and the management of certain real estate assets.
The Company’s segment structure reflects the financial information and reports used by its Chief Operating Decision Maker (“CODM”) to assess operating performance, allocate resources and make decisions regarding current operating and financial focus. The Company’s CODM is the Chairman and Chief Executive Officer.
The CODM evaluates the performance of its operating segments based on net revenue and segment profit (loss). Segment profit includes net revenue, programming and related expenses, selling, general and administrative expenses attributable to the segments, and amortization of broadcast rights. Segment profit (loss) excludes unallocated corporate revenue and expenses, depreciation of property and equipment and amortization of intangible assets, impairment charges, transaction and other one-time expenses, reimbursement from the FCC related to station repack, gain on disposal of assets and business divestitures and non-operating income statement items.
The following table set forth a breakdown of selected financial information for our reportable Broadcast segment and a reconciliation of that segment’s profit to income from operations (in millions):
| | | | | | | | | | | | |
| | Years Ended December 31, | |
| | 2024 | | | 2023 | | | 2022 | |
Reportable Broadcast Segment: | | | | | | | | | |
Net revenue | | $ | 5,134 | | | $ | 4,611 | | | $ | 5,033 | |
Programming and related expenses (1) | | | (2,182 | ) | | | (2,086 | ) | | | (1,927 | ) |
Selling, general and administrative expenses (1) | | | (775 | ) | | | (771 | ) | | | (815 | ) |
Amortization of broadcast rights (1) | | | (64 | ) | | | (77 | ) | | | (103 | ) |
Reportable Broadcast segment's profit | | | 2,113 | | | | 1,677 | | | | 2,188 | |
Other segmentsʼ loss, net | | | (130 | ) | | | (253 | ) | | | (53 | ) |
Corporate (unallocated) | | | (197 | ) | | | (180 | ) | | | (183 | ) |
Depreciation and amortization expense (2) | | | (484 | ) | | | (488 | ) | | | (469 | ) |
Goodwill and other long-lived assets impairment | | | (24 | ) | | | (35 | ) | | | (133 | ) |
Transaction and other one-time expenses | | | - | | | | - | | | | (37 | ) |
Restructuring costs | | | (12 | ) | | | (15 | ) | | | - | |
Miscellaneous | | | 2 | | | | 2 | | | | (1 | ) |
Income from operations | | $ | 1,268 | | | $ | 708 | | | $ | 1,312 | |
(1) The expenses included in the measure of our reportable Broadcast segment’s profit are as follows:
•Programming and related expenses – primarily include fees incurred under network affiliation agreements and operating costs to produce and air local news.
•Selling, general and administrative expenses – primarily include (i) salaries, benefits and payroll taxes, commission, rating agencies’ fees, travel, and software license fees incurred by sales teams and (ii) salaries, benefits and payroll taxes, group insurance and office rental costs incurred in managing the segment’s business units.
•Amortization of broadcast rights – the amortization of license fees for acquired programs from national program syndicators and certain production companies.
(2) Includes depreciation of property and equipment and amortization of intangible assets. Excludes amortization of broadcast rights.
The following table presents disaggregation of net revenue by source (in millions).
| | | | | | | | | | | | | | | | | | | | |
Year Ended December 31, 2024 | | Reportable
Broadcast
Segment | | | Other
Segments | | | Corporate (unallocated) | | | Eliminations(1) | | | Consolidated | |
Distribution | | $ | 2,869 | | | $ | 106 | | | $ | - | | | $ | (47 | ) | | $ | 2,928 | |
Advertising | | | 2,223 | | | | 192 | | | | - | | | | - | | | | 2,415 | |
Other | | | 42 | | | | 19 | | | | 10 | | | | (7 | ) | | | 64 | |
Total net revenue | | $ | 5,134 | | | $ | 317 | | | $ | 10 | | | $ | (54 | ) | | $ | 5,407 | |
| | | | | | | | | | | | | | | | | | | | |
Year Ended December 31, 2023 | | Reportable
Broadcast
Segment | | | Other
Segments | | | Corporate (unallocated) | | | Eliminations(1) | | | Consolidated | |
Distribution | | $ | 2,674 | | | $ | 73 | | | $ | 1 | | | $ | (21 | ) | | $ | 2,727 | |
Advertising | | | 1,894 | | | | 227 | | | | - | | | | - | | | | 2,121 | |
Other | | | 43 | | | | 39 | | | | 9 | | | | (6 | ) | | | 85 | |
Total net revenue | | $ | 4,611 | | | $ | 339 | | | $ | 10 | | | $ | (27 | ) | | $ | 4,933 | |
| | | | | | | | | | | | | | | | | | | | |
Year Ended December 31, 2022 | | Reportable
Broadcast
Segment | | | Other
Segments | | | Corporate (unallocated) | | | Eliminations(1) | | | Consolidated | |
Distribution | | $ | 2,553 | | | $ | 20 | | | $ | 1 | | | $ | (3 | ) | | $ | 2,571 | |
Advertising | | | 2,438 | | | | 151 | | | | - | | | | - | | | | 2,589 | |
Other | | | 42 | | | | 2 | | | | 8 | | | | (1 | ) | | | 51 | |
Total net revenue | | $ | 5,033 | | | $ | 173 | | | $ | 9 | | | $ | (4 | ) | | $ | 5,211 | |
(1)The elimination of distribution revenue represents intersegment revenue generated by Other segments for services provided to the Broadcast segment.
Our primary sources of revenue include: (i) distribution, comprised primarily of retransmission revenue, carriage fees, affiliation fees and spectrum leasing revenue and (ii) advertising, comprised of non-political and political advertising.
Distribution revenue, our largest category of revenue, primarily results from compensation from cable, satellite and other MVPDs and vMVPDs in return for our consent to the retransmission of the signals of our television stations and the carriage of NewsNation, typically based on the number of subscribers the MVPDs and vMVPDs have. We also generate distribution revenues from affiliation fees paid by affiliates of The CW and from programmers who use our spectrum in selected local markets to air their content on our multicast streams. Distribution revenue is recognized at the point in time the broadcast signal or cable network feed is delivered to the distributors in the case of retransmission and carriage fee revenue or, in the case of affiliation fees and spectrum leasing revenue, as network programming and spectrum capacity are delivered to our affiliates and customers.
Advertising revenue primarily results from the sale to local, regional and national businesses, political candidates and other political advertisers of commercial airtime by our stations and networks and the sale of advertising on our owned or third-party websites, and through mobile and OTT applications and other digital advertising solutions. Advertising revenue is generally highest in the second and fourth quarters of each year, due in part to increases in consumer advertising in the spring and retail advertising in the period leading up to, and including, the holiday season. Advertising revenue is generally higher during even-numbered years when congressional and/or presidential elections occur and advertising is aired during the Olympic Games. Advertising revenue is recognized at the time the advertisement airs or is delivered on our websites or mobile or OTT applications or the advertising solution is delivered.
The Company primarily derives its revenues from advertising and from distribution of its stations’ signals and networks. During the years ended December 31, 2024, 2023 and 2022, revenues from two of the Company’s customers from these sources exceeded 10% of the Company’s consolidated net revenues. The first customer represented approximately 12%, 12% and 10% of the Company’s consolidated net revenues in 2024, 2023 and 2022, respectively. The second customer represented 12%, 14% and 11% of the Company’s consolidated net revenues in 2024, 2023 and 2022, respectively.
Assets by reportable segment are not reported because it is not used by the CODM to allocate resources or evaluate segment performance. For disclosure of goodwill by segment, see Note 5.
Note 18: Valuation and Qualifying Accounts
Allowance for Credit Losses Rollforward (in millions):
| | | | | | | | | | | | | | | | |
| | | | | Additions | | | | | | | |
| | Balance at | | | Charged to | | | | | | Balance at | |
| | Beginning | | | Costs and | | | | | | End of | |
| | of Period | | | Expenses | | | Deductions(1) | | | Period | |
Year Ended December 31, 2024 | | $ | 20 | | | $ | 8 | | | $ | (12 | ) | | | 16 | |
Year Ended December 31, 2023 | | | 18 | | | | 12 | | | | (10 | ) | | | 20 | |
Year Ended December 31, 2022 | | | 23 | | | | 5 | | | | (10 | ) | | | 18 | |
(1)Uncollectible accounts written off, net of recoveries.
Note 19: Subsequent Events
On January 29, 2025, Nexstar’s board of directors declared a quarterly cash dividend of $1.86 per share on its outstanding common stock. The dividend was paid on February 26, 2025 to stockholders of record on February 12, 2025.
On January 31, 2025, Nexstar acquired the assets of WBNX-TV, an independent full power television station serving the Cleveland, OH market for a $22 million cash purchase price.
From January 1 to February 27, 2025, we repurchased 112,582 shares of our common stock for $17 million, funded by cash on hand. As of the date of filing this Annual Report on Form 10-K, the remaining available amount under the share repurchase authorization was $1.5 billion.