Exhibit 15.1
EVALUATION OF THE INTERESTS OF
ALBERTA STAR DEVELOPMENT CORP.
IN THE LLOYDMINSTER AREA OF
ALBERTA & SASKATCHEWAN
(Constant Prices and Costs)
Prepared For
Alberta Star Development Corp.
By
Petrotech Engineering Ltd.
Effective Date
November 30, 2012
2
3
Table of Contents
Letter of Transmittal
Table 1 - Summary of Proved Reserves and Net Present Values Constant Case
Table 2 - Summary of Proved + Probable Reserves and Net Present Values Constant Case
Definitions of Reserves
Constant Oil Prices
Certificates of Qualification
| I | Lloydminster, Alberta |
| II | Landrose and Maidstone, Saskatchewan |
Figures
| |
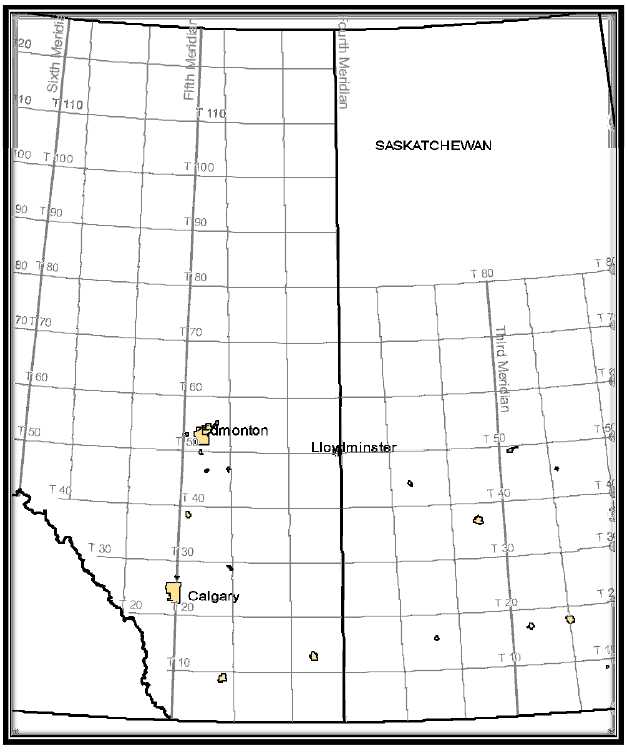
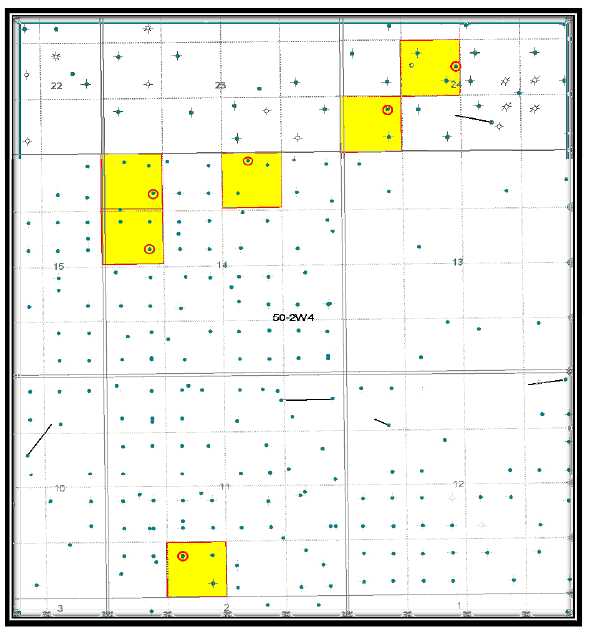
| I -1 | Location Map of the Company’s Wells in the Lloydminster Field, Alberta |
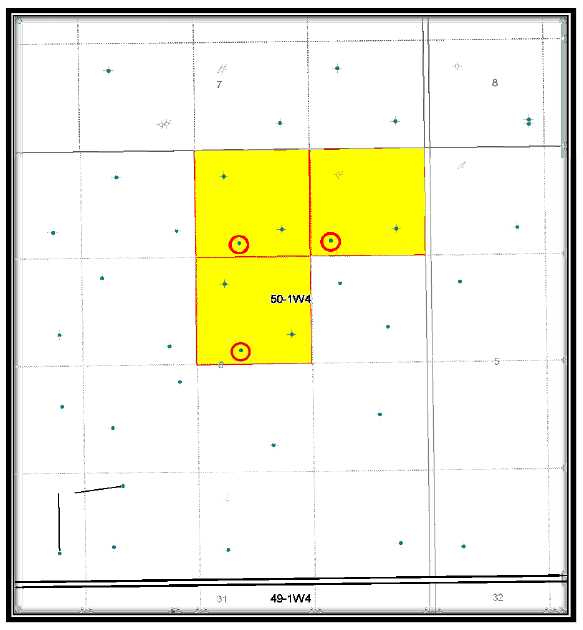
| I -2 | Land and Well Location Map of Section 06 TWP 50, RGE 01 W4M |
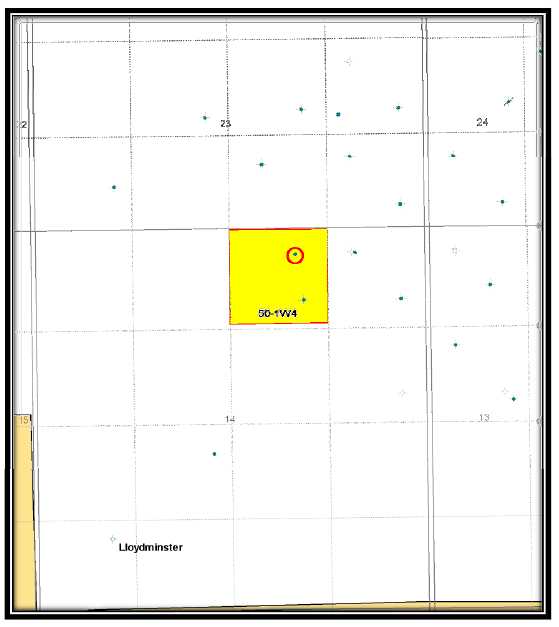
| I -3 | Land and Well Location Map of Section 14-TWP 50, RGE 01 W4M |
| I -4 | Land and Well Location Map in Township 50 Range 02 W4M |
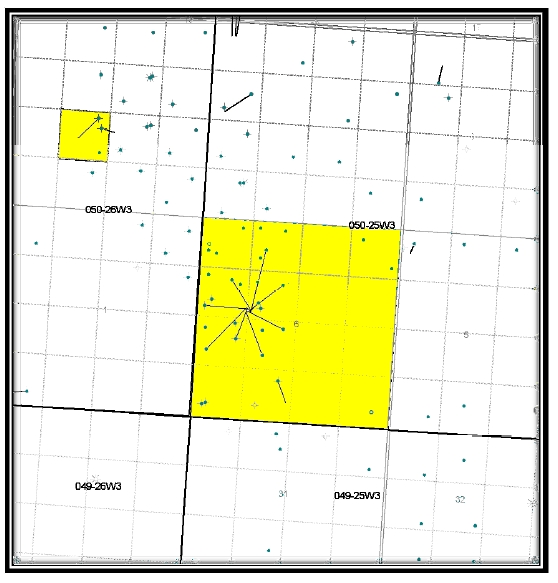
| II -1 | Location Map of the Landrose Field in Saskatchewan |
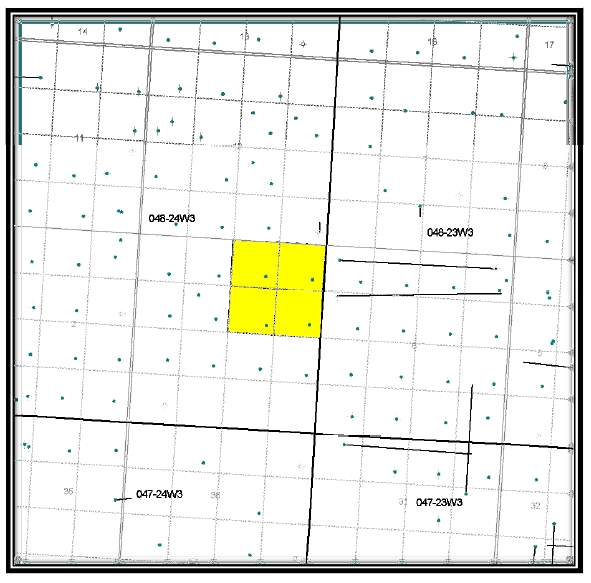
| II -2 | Location Map of the Maidstone Field in Saskatchewan |
Tables
| |
| I -1 | Proved Producing Reserves and Net Present Values of the 16A-22-49-01 W4M Well Constant Case |
| I -2 | Proved Producing Reserves and Net Present Values of the 10B-06-50-01 W4M Well Constant Case |
| I -3 | Proved Producing Reserves and Net Present Values of the 12-14-50-02 W4M Well Constant Case |
| I -4 | Proved + Probable Additonal Reserves and Net Present Values of the 16A-22-49-01 W4M Well Constant Case |
| I -5 | Proved + Probable Additonal Reserves and Net Present Values of the 10B-06-50-01 W4M Well Constant Case |
| I -6 | Proved + Probable Additonal Reserves and Net Present Values of the 12-14-50-02 W4M Well Constant Case |
| I -7 | Proved + Probable Additional Reserves and Net Present Values of the 06D-24-50-02 W4M Well Constant Case |
| II -1 | Proved Producing Reserves and Net Present Values of 4 Wells in Section 11/01-48-24 W3M Well Constant Case |
| II -2 | Proved Producing Reserves and Net Present Values of the 31/12-06-50-25 W3M Well Constant Case |
| II -3 | Proved Producing Reserves and Net Present Values of the 22/13-06-50-25 W3M Well Constant Case |
4
| |
| II -4 | Proved Producing Reserves and Net Present Values of the 31/13-06-50-25 W3M Well Constant Case |
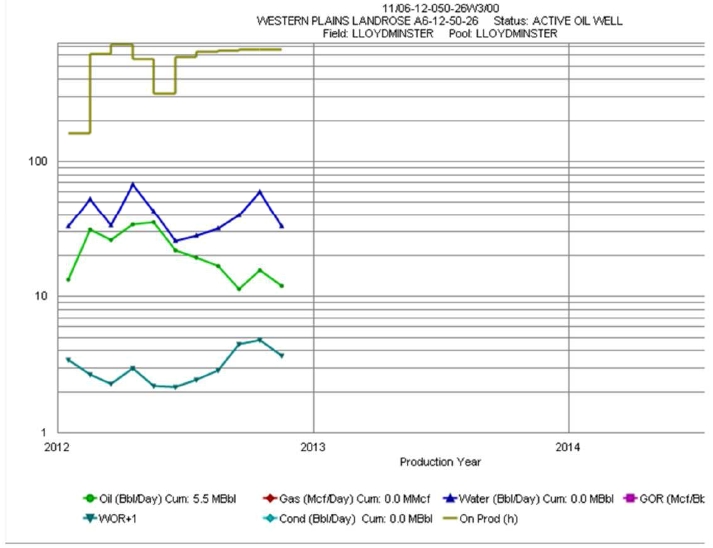
| II -5 | Proved Producing Reserves and Net Present Values of the 11/06-12-50-26 W3M Well Constant Case |
| II -6 | Proved Producing Reserves and Net Present Values of the 31/14-06-50-25 W3M Well Constant Case |
| II -7 | Proved + Probable Additional Reserves and Net Present Values of 4 Wells in Section 11/01-48-24 W3M Well Constant Case |
| II -8 | Proved + Probable Additional Reserves and Net Present Values of the 31/12-06-50-25 W3M Well Constant Case |
| II -9 | Proved + Probable Additional Reserves and Net Present Values of the 22/13-06-50-25 W3M Well Constant Case |
| II -10 | Proved + Probable Additional Reserves and Net Present Values of the 31/13-06-50-25 W3M Well |
| II -11 | Proved + Probable Additional Reserves and Net Present Values of the 31/14-06-50-25 W3M Well Constant Case |
| II -12 | Proved + Probable Additional Reserves and Net Present Values of the 11/06-12-50-26 W3M Well Constant Case |
Appendices
| |
| A | Conversion Factors and Abbreviations |
| B | Production Data of the Company’s Wells in the Lloydminster Field |
| C | Production Data of the Company’s Wells in the Maidstone Field |
| D | Production Data of the Company’s Wells in the Landrose Field |
5
PETROTECH ENGINEERING LTD.
7536 Manzanita Place, Burnaby, B. C., Canada V3N 4X1 Phone: (604) 525 6896
Email: johnyu@axion.net
March 19, 2013
Ref: 12 – 39
Alberta Star Development Corp.
506 - 675 West Hastings Street
Vancouver, B. C.
V6B 1N2
Attention: Mr. Stuart Rogers, President
Dear Sir:
Re:Evaluation of the Interests of Alberta Star Development Corp. in Alberta and Saskatchewan
Pursuant to the request of Alberta Star Development Corp. (here-in-after referred to as the “Company”), we have conducted an independent reserve evaluation of the Company’s oil and gas properties located in the general area of Lloydminster, Alberta and Saskatchewan. The effective date of this evaluation is November 30, 2012. The purpose of this evaluation is for annual filing of the 20F with the United States Securities and Exchange Commission (SEC). The Company has indicated that these properties represent 100% of the oil and gas reserves.
This evaluation uses the definitions of reserves of the Society of Petroleum Engineers in 2007 (see Definitions of Reserves). The net cash flow is calculatedat constant prices and costsfor SEC in the assigned proved and probable reserves, to all future times and after deduction of the capital and operating costs, royalties and well abandonment liabilities net of salvage value. The remaining recoverable proved and probable reserves are estimated using production decline methods, volumetric data, well performance, well spacing, past completion data of offset leases and analogy to other wells in the immediate area of each entity (see Appendices B to D for production plots). All cash flow data is in Canadian currency. A summary of the Company’s gross and net share of proved and probable reserves and net share of the future net revenue before tax, discounted at 0, 5, 10, 15, and 20% is presented as follows:
| | | | | | | |
| Constant Prices and Costs | | | | | | | |
| | | | NPV of Future Net Revenue |
| Reserve Category | Heavy Crude Oil | Before Tax Discounted (in M$) @ |
| | Gross | Net | 0% | 5% | 10% | 15% | 20% |
| Proved | (Mbbl) | (Mbbl) | (M$) | (M$) | (M$) | (M$) | (M$) |
| Producing | 35.5 | 33.0 | 812.2 | 751.7 | 698.4 | 651.3 | 609.5 |
| Total Proved | 35.5 | 33.0 | 812.2 | 751.7 | 698.4 | 651.3 | 609.5 |
6
| | | | | | | |
| Probable | 21.9 | 19.7 | 756.9 | 662.9 | 585.7 | 521.6 | 467.7 |
| Proved + Probable | 57.4 | 52.7 | 1,569.1 | 1,414.6 | 1,284.1 | 1,172.9 | 1,077.2 |
The evaluation was conducted on the basis of the GLJ Petroleum Consultants Ltd’s January 1, 2013 Price Forecast of “Heavy Crude Oil (12oAPI) at Hardisty” (www.gljpc.com – see page 12). Estimates of reserves and projections of production were generally prepared using well information and production data available from public sources to approximately November 30, 2012. The Company provided land, certain accounting data and other technical and product sales information not available in the public domain to approximately November 30, 2012. The Company has confirmed that to the best of its knowledge, all information provided is correct and complete as of the effective date.
A summary of the Company’s total and individual properties and their net present values and production data is presented in Table 1. The individual property summary reports provided under sections I and II include additional property specific evaluation details.
Provisions for the abandonment and reclamation costs (net of salvage values) of all of the Company’s wells to which reserves were assigned have been included. Abandonment costs of facilities and for non-producing wells with no assigned reserves were not included.
The estimated net present values do not represent a fair market value. In reviewing the reserves estimates provided, it should be understood that there are inherent uncertainties and limitations with both the database available for analysis and the interpretation of such engineering and geological data. The judgments used in assessing the reserves are considered reasonable given the knowledge of the property reviewed. Our estimates are prepared using standard geological and engineering methods generally accepted by the petroleum industry, and the reserves definitions and standards required by the United States SEC. The method or combination of methods used is based on our professional judgment and experience. Estimates may change substantially as additional data from ongoing development activities and production performance becomes available and as economic conditions impacting oil and gas prices and costs change. Field inspections of the properties were not conducted and not considered necessary in view of information available from public information and records and data provided by the Company. All procedures and methods have been considered under the circumstances to prepare this report.
Respectfully Submitted,
Petrotech Engineering Ltd.
/s/ John Yu, P. Eng.
John Yu, P. Eng.
7
Table 1 - Summary of Proved Reserves and Net Present Values Constant Case
| |
| Reserve Category: | | Proven Producing |
| Province: | |
| |
| | | CORPORATE YEAR END |
| | | | | | | | | | | | |
| Evaluation Interest Summary |
| | | Oil Production | | Total | Operating | | | B Tax | Tax | A Tax |
| | | Rate | Volume | Price | Revenue | Expense | Burden | Capital | Cash Flow | | Cash Flow |
| Year | Mo | BBL/D | MSTB | $/BBL | M$ | M$ | $/BBL | M$ | M$ | M$ | M$ | M$ |
| 2012 | 1 | 72.1 | 2.2 | 64.47 | 141.3 | 32.7 | 14.92 | 27.1 | 0.0 | 81.5 | 20.7 | 60.7 |
| 2013 | 12 | 43.9 | 16.0 | 64.73 | 1,038.0 | 346.7 | 21.62 | 131.6 | 0.0 | 559.7 | 145.6 | 414.1 |
| 2014 | 12 | 23.6 | 8.6 | 65.15 | 562.0 | 314.3 | 36.43 | 57.8 | 26.3 | 163.7 | 49.9 | 113.8 |
| 2015 | 12 | 16.2 | 5.9 | 65.38 | 386.1 | 253.3 | 42.89 | 39.5 | 84.6 | 8.8 | 22.2 | -13.5 |
| 2016 | 12 | 5.3 | 1.9 | 65.45 | 126.2 | 86.2 | 44.70 | 2.5 | 17.5 | 20.0 | 8.9 | 11.1 |
| 2017 | 12 | 2.3 | 0.8 | 66.71 | 54.9 | 48.2 | 58.65 | 1.8 | 26.3 | -21.4 | 0.2 | -21.6 |
| SubTotal | | 35.5 | | 2,308.4 | 1,081.3 | | 260.3 | 154.6 | 812.2 | 247.6 | 564.6 |
| Remainder | | 0.0 | | 0.0 | 0.0 | | 0.0 | 0.0 | 0.0 | 0.0 | 0.0 |
| Total | | | 35.5 | | 2,308.4 | 1,081.3 | 30.45 | 260.3 | 154.6 | 812.2 | 247.6 | 564.6 |
| | | | | | | | | | | |
| | | | Before Tax | After Tax | | | | Gross | W.I. | Royalty | Net |
| | | | | | | Oil | MSTB | 88.8 | 35.5 | 2.5 | 33.0 |
| Discount | Operating | Capital | Cash Flow | Cash Flow | | Gas Raw | MMCF | 0.0 | | | |
| Rate | Income | Invest | | | | | | | | | |
| (%) | M$ | M$ | M$ | M$ | | Gas Sales | MMCF | 0.0 | 0.0 | 0.0 | 0.0 |
| | | | | | | NGL | MSTB | 0.0 | 0.0 | 0.0 | 0.0 |
| 0.0 | 966.8 | 154.6 | 812.2 | 564.6 | | Pentane | MSTB | 0.0 | 0.0 | 0.0 | 0.0 |
| 5.0 | 880.3 | 128.7 | 751.7 | 525.9 | | Butane | MSTB | 0.0 | 0.0 | 0.0 | 0.0 |
| 10.0 | 806.6 | 108.2 | 698.4 | 491.3 | | Propane | MSTB | 0.0 | 0.0 | 0.0 | 0.0 |
| | | | | | | Ethane | MSTB | 0.0 | 0.0 | 0.0 | 0.0 |
| 15.0 | 743.2 | 91.9 | 651.3 | 460.3 | | Sulphur | MLT | 0.0 | 0.0 | 0.0 | 0.0 |
| 20.0 | 688.1 | 78.7 | 609.5 | 432.4 | | BOE | MSTB | 88.8 | 35.5 | 2.5 | 33.0 |
8
Table 2 - Summary of Proved + Probable Reserves and Net Present Values Constant Case
| | |
| Reserve Category: | | Total Proved + Probable Additional |
| Province: | | |
| | |
| | | CORPORATE YEAR END |
| | | | | | | | | | | | |
| Evaluation Interest Summary |
| | | Oil Production | Total | Operating | | | B Tax | Tax | A Tax |
| | | Rate | Volume | Price | Revenue | Expense | Burden | Capital Cash Flow | | Cash Flow |
| Year | Mo | BBL/D | MSTB | $/BBL | M$ | M$ | $/BBL | M$ | M$ | M$ | M$ | M$ |
| 2012 | 1 | 80.3 | 2.4 | 64.57 | 157.8 | 33.8 | 13.83 | 30.8 | 0.0 | 93.1 | 23.7 | 69.5 |
| 2013 | 12 | 57.9 | 21.1 | 64.72 | 1,367.3 | 369.4 | 17.49 | 214.3 | 0.0 | 783.6 | 201.8 | 581.7 |
| 2014 | 12 | 35.0 | 12.8 | 65.00 | 831.5 | 333.3 | 26.05 | 89.9 | 20.4 | 387.9 | 105.9 | 282.0 |
| 2015 | 12 | 23.7 | 8.6 | 65.16 | 562.8 | 288.6 | 33.42 | 58.6 | 18.6 | 197.0 | 55.5 | 141.6 |
| 2016 | 12 | 17.6 | 6.4 | 65.34 | 420.4 | 249.4 | 38.75 | 44.1 | 64.2 | 62.8 | 30.1 | 32.7 |
| 2017 | 12 | 7.9 | 2.9 | 65.46 | 188.7 | 113.3 | 39.31 | 6.4 | 20.4 | 48.6 | 17.1 | 31.5 |
| 2018 | 12 | 4.8 | 1.8 | 65.44 | 115.5 | 81.0 | 45.87 | 2.3 | 0.0 | 32.3 | 8.5 | 23.8 |
| 2019 | 12 | 3.7 | 1.3 | 65.55 | 88.5 | 79.1 | 58.61 | 1.8 | 43.8 | -36.2 | 0.4 | -36.6 |
| SubTotal | | 57.4 | | 3,732.7 | 1,547.9 | | 448.3 | 167.3 | 1,569.1 | 443.0 | 1,126.1 |
| Remainder | | 0.0 | | 0.0 | 0.0 | | 0.0 | 0.0 | 0.0 | 0.0 | 0.0 |
| Total | | | 57.4 | | 3,732.7 | 1,547.9 | 26.95 | 448.3 | 167.3 | 1,569.1 | 443.0 | 1,126.1 |
| | | | | | | | | | | |
| | | | Before Tax | After Tax | | | | Gross | W.I. | Royalty | Net |
| | | | | | | Oil | MSTB | 143.3 | 57.4 | 4.8 | 52.7 |
| Discount | Operating | Capital | Cash Flow | Cash Flow | | Gas Raw | MMCF | 0.0 | | | |
| Rate | Income | Invest | | | | | | | | | |
| (%) | M$ | M$ | M$ | M$ | | Gas Sales | MMCF | 0.0 | 0.0 | 0.0 | 0.0 |
| | | | | | | NGL | MSTB | 0.0 | 0.0 | 0.0 | 0.0 |
| 0.0 | 1,736.4 | 167.3 | 1,569.1 | 1,126.1 | | Pentane | MSTB | 0.0 | 0.0 | 0.0 | 0.0 |
| 5.0 | 1,545.8 | 131.2 | 1,414.6 | 1,019.7 | | Butane | MSTB | 0.0 | 0.0 | 0.0 | 0.0 |
| 10.0 | 1,388.8 | 104.7 | 1,284.1 | 928.9 | | Propane | MSTB | 0.0 | 0.0 | 0.0 | 0.0 |
| | | | | | | Ethane | MSTB | 0.0 | 0.0 | 0.0 | 0.0 |
| 15.0 | 1,257.7 | 84.8 | 1,172.9 | 850.9 | | Sulphur | MLT | 0.0 | 0.0 | 0.0 | 0.0 |
| 20.0 | 1,146.8 | 69.6 | 1,077.2 | 783.4 | | BOE | MSTB | 143.3 | 57.4 | 4.8 | 52.7 |
9
DEFINITIONS OF RESERVES
Taken from Petroleum Resources Management System as prepared by the Oil and Gas Reserves Committee (2007) of the Society of Petroleum Engineers (SPE); reviewed and jointly sponsored by the World Petroleum Council (WPC), the American Association of Petroleum Geologists (AAPG); and the Society of Petroleum Evaluation Engineers (SPEE).
Crude Oil: Crude oil is the portion of petroleum that exists in the liquid phase in natural underground reservoirs and remains liquid at atmospheric conditions of pressure and temperature. Crude oil may include small amounts of non-hydrocarbons produced with the liquids but does not include liquids obtained from the processing of natural gas. Classes of crude oil are often reported on the basis of density, sometimes with different meanings. Acceptable ranges are as follows:
| |
| Light: | less than 870 kg/m3(greater than 31.1oAPI) |
| Medium: | 870 to 920 kg/m3(31.1oAPI to 22.3oAPI) |
| Heavy: | 920 to 1000 kg/m3(22.3oAPI to 10oAPI) |
| Extra-heavy: | greater than 1000 kg/m3(less than 10oAPI) |
Natural Gas: Natural Gas is the portion of petroleum that exists either in the gaseous phase or is in solution in crude oil in natural underground reservoirs, and which is gaseous at atmospheric conditions of pressure and temperature. Natural Gas may include some amount of non-hydrocarbons.
Natural Gas Liquids: Natural Gas Liquids (NGL) are a mixture of light hydrocarbons that exist in the gaseous phase and are recovered as liquids in gas processing plants. NGL differs from condensate in two principal respects: (1) NGL is extracted and recovered in gas plants rather than lease separators or other lease facilities, and (2) NGL includes very light hydrocarbons (ethane, propane, butanes) as well as the pentanes-plus that are the main constituents of condensates.
Reserves Categories
Developed Reserves are defined as the expected quantities to be recovered from existing wells and facilities. The guidelines for this type of reserve are considered developed only after the necessary equipment has been installed, or when the costs to do so are relatively minor compared to the cost of a well. Where required facilities become unavailable, it may be necessary to reclassify Developed Reserves as Undeveloped. Developed Reserves may be further sub-classified as producing or Non-Producing.
Developed Producing Reserves are defined as the expected quantities to be recovered from existing wells and facilities. The guidelines for this type of reserve are expected to be recovered from completion intervals that are open and producing at the time of the estimate. Improved recovery reserves are considered producing only after the improved recovery project is in operation.
Developed Non-Producing Reserves are defined as the expected quantities including shut-in and behind-pipe reserves. The guidelines for shut-in reserves are expected to be recovered from (1)
10
completion intervals which are open at the time of the estimate but which have not yet started producing, (2) wells which were shut-in for market conditions or pipeline connections, or (3) wells not capable of production for mechanical reasons. Behind-pipe reserves are expected to be recovered from zones in existing wells which will require additional completion work or future recompletion prior to start of production. In all cases, production can be initiated or restored with relatively low expenditure compared to the cost of drilling a new well.
Undeveloped Reserves are quantities expected to be recovered through future investments:
(1) from new wells on undrilled acreage in known accumulations,
(2) from deepening existing wells to a different (but known) reservoir,
(3) from infill wells that will increase recovery, or
(4) where a relatively large expenditure (e.g. when compared to the cost of drilling a new well) is required to (a) recomplete an existing well or (b) install production or transportation facilities for primary or improved recovery projects.
Proved Reservesare those quantities of petroleum, which by analysis of geoscience and engineering data, can be estimated with reasonable certainty to be commercially recoverable, from a given date forward, from known reservoirs and under defined economic conditions, operating methods, and government regulations. If deterministic methods are used, the term reasonable certainty is intended to express a high degree of confidence that the quantities will be recovered. If probabilistic methods are used, there should be at least a 90% probability that the quantities actually recovered will equal or exceed the estimate. The area of the reservoir considered as Proved includes (1) the area delineated by drilling and defined by fluid contacts, if any, and (2) adjacent undrilled portions of the reservoir that can reasonably be judged as continuous with it and commercially productive on the basis of available geoscience and engineering data. In the absence of data on fluid contacts, Proved quantities in a reservoir are limited by the lowest known hydrocarbon (LKH) as seen in a well penetration unless otherwise indicated by definitive geoscience, engineering, or performance data. Such definitive information may include pressure gradient analysis and seismic indicators. Seismic data alone may not be sufficient to define fluid contacts for Proved reserves (see “2001 Supplemental Guidelines,” Chapter 8). Reserves in undeveloped locations may be classified as Proved provided that the locations are in undrilled areas of the reservoir that can be judged with reasonable certainty to be commercially productive and the interpretations of available geoscience and engineering data indicate with reasonable certainty that the objective formation is laterally continuous with drilled proved locations.
For Proved Reserves, the recovery efficiency applied to these reservoirs should be defined based on a range of possibilities supported by analogs and sound engineering judgment considering the characteristics of the Proved area and the applied development program.
Probable Reservesare those additional Reserves which analysis of geoscience and engineering data indicate are less likely to be recovered than Proved Reserves but more certain to be recovered than Possible Reserves. It is equally likely that actual remaining quantities recovered will be greater than or less than the sum of the estimated Proved plus Probable Reserves (2P). In this context, when probabilistic methods are used, there should be at least a 50% probability that the actual quantities recovered will equal or exceed the 2P estimate. Probable Reserves may be assigned to
11
areas of a reservoir adjacent to the Proved where data control or interpretations of available data are less certain. The interpreted reservoir continuity may not meet the reasonable certainty criteria. Probable estimates also include incremental recoveries associated with project recovery efficiencies beyond that assumed for Proved.
Possible Reservesare those additional reserves which analysis of geoscience and engineering data indicate are less likely to be recoverable than Probable Reserves. The total quantities ultimately recovered from the project have a low probability to exceed the sum of Proved plus Probable plus Possible (3P), which is equivalent to the high estimate scenario. When probabilistic methods are used, there should be at least a 10% probability that the actual quantities recovered will equal or exceed the 3P estimate. Possible Reserves may be assigned to areas of a reservoir adjacent to Probable where data control and interpretations of available data are progressively less certain.Frequently, this may be in areas where geoscience and engineering data are unable to clearly define the area and vertical reservoir limits of commercial production from the reservoir by a defined project. Possible estimates also include incremental quantities associated with project recovery efficiencies beyond that assumed for Probable.
Probable and Possible ReservesThe 2P and 3P estimates may be based on reasonable alternative technical and commercial interpretations within the reservoir and/or subject project that are clearly documented, including comparisons to results in successful similar projects. In conventional accumulations, Probable and/or Possible Reserves may be assigned where geoscience and engineering data identify directly adjacent portions of a reservoir within the same accumulation that may be separated from Proved areas by minor faulting or other geological discontinuities and have not been penetrated by a wellbore but are interpreted to be in communication with the known (Proved) reservoir. Probable or Possible Reserves may be assigned to areas that are structurally higher than the Proved area. Possible (and in some cases, Probable) Reserves may be assigned to areas that are structurally lower than the adjacent Proved or 2P area. Caution should be exercised in assigning Reserves to adjacent reservoirs isolated by major, potentially sealing, faults until this reservoir is penetrated and evaluated as commercially productive. Justification for assigning Reserves in such cases should be clearly documented. Reserves should not be assigned to areas that are clearly separated from a known accumulation by non-productive reservoir (i.e., absence of reservoir, structurally low reservoir, or negative test results); such areas may contain Prospective Resources.
In conventional accumulations, where drilling has defined a highest known oil (HKO) elevation and there exists the potential for an associated gas cap, Proved oil Reserves should only be assigned in the structurally higher portions of the reservoir if there is reasonable certainty that such portions are initially above bubble point pressure based on documented engineering analyses. Reservoir portions that do not meet this certainty may be assigned as Probable and Possible oil and/or gas based on reservoir fluid properties and pressure gradient interpretations.
12
Constant Oil Prices
The following table sets out the Cromer reference, heavy crude oil price posting for the past five years and the GLJ Petroleum Consultants (www.gljpc.com) “Heavy Crude Oil (12oAPI)” January 1, 2013 price forecast and the adjusted price forecast as applied to the Alberta and Saskatchewan properties:
| | | |
| | | Heavy Crude Oil | Heavy Crude Oil |
| | | Proxy (12oAPI) | Proxy (12oAPI) |
| | | at Hardisty | at Hardisty |
| | Inflation | Then Current | Then Current |
| Year | % | CAD$/bbl | CAD$/bbl |
| 2008 | 2.4 | 74.94 | 74.94 |
| 2009 | 0.4 | 54.46 | 54.46 |
| 2010 | 1.8 | 60.76 | 60.76 |
| 2011 | 2.9 | 67.64 | 67.64 |
| 2012 | 1.6 | 63.87 | 63.87 |
| | | Lloydminster | Maidstone |
| 2013 Q1 | 0.0 | 68.26 | 64.94 |
| 2013 Q2 | 0.0 | 68.26 | 64.94 |
| 2013 Q3 | 0.0 | 68.26 | 64.94 |
| 2013 Q4 | 0.0 | 68.26 | 64.94 |
| 2013 Full Year | 0.0 | 68.26 | 64.94 |
| 2014 | 0.0 | 68.26 | 64.94 |
| 2015 | 0.0 | 68.26 | 64.94 |
| 2016 | 0.0 | 68.26 | 64.94 |
| 2017 | 0.0 | 68.26 | 64.94 |
| 2018 | 0.0 | 68.26 | 64.94 |
| 2019 | 0.0 | 68.26 | 64.94 |
| 2020 | 0.0 | 68.26 | 64.94 |
| 2021 | 0.0 | 68.26 | 64.94 |
| 2022 | 0.0 | 68.26 | 64.94 |
| 2023+ | 0.0 | 68.26 | 64.94 |
13
CERTIFICATE OF QUALIFICATION
I, JOHN YU, P. Eng., with an office at 7536 Manzanita Place, Burnaby, British Columbia hereby certify
| 1. | That I am a Consulting Petroleum Engineer employed by Petrotech Engineering Ltd., which company has prepared a detailed analysis of the Canadian oil and gas properties of Alberta Star Development Corp. during the months from January to March, 2013. |
| |
| 2. | That Petrotech Engineering Ltd.'s officers or its employees have no direct or indirect interests, nor do they expect to receive any direct or indirect interest, in the properties or in any securities of Alberta Star Development Corp. |
| |
| 3. | That I attended the University of Alberta and that I graduated with a Bachelor of Science in Metallurgical Engineering in 1974. That I am a registered Professional Engineer in the Province of British Columbia and a member of the Society of Petroleum Engineers, and that I have in excess of thirty-eight years of experience in engineering studies, evaluation of oil and gas properties, drilling, completion, production and process engineering of oil and gas operations and evaluation of mineral properties in Canada, U. S. A., Guatemala, Nicaragua, Colombia, Argentina, Peru, Australia, New Zealand, China, Kazakhstan, United Arab Emirates, North Sea, Cameroon, and Indonesia. |
| |
| 4. | That I am a qualified evaluator and auditor as defined in National Instrument 51-101. |
| |
| 5. | That a personal field inspection of the Company's property was not conducted and not considered necessary in view of information available from public information and records and data provided by the Company. |
| |
| |  |
| | John Yu, Professional Engineer |
| | Reg. No. B. C. - 12068 |
14
CERTIFICATE OF QUALIFICATION
David B. Finn, A. Sc. T. Petroleum Technologist, of 328, 5647 – 16thAvenue, Delta, British Columbia hereby certify
| 1. | That I am a Consulting Petroleum Technologist employed by Petrotech Engineering Ltd., which company has prepared a detailed analysis of the Canadian oil and gas properties of Alberta Star Development Corp. during the months of January and March, 2013. |
| |
| 2. | That I have attended the British Columbia Institute of Technology and graduated with a Diploma of Engineering Technology in Natural Gas and Petroleum Technology in 1969. I am a Registered Applied Science Technologist in the Province of British Columbia and have in excess of forty years of experience in oil and gas reservoir studies of Canadian and United States oil and gas fields, and during the last twenty eight years have been directly involved in the preparation of independent oil and gas property evaluations. |
| |
| 3. | That a personal field inspection of the Company's property was not conducted and not considered necessary in view of information available from public information and records and data provided by the Company. |
| |
| |  |
| | David B. Finn, A.Sc.T. |
15
The Company holds various working interests in producing and non-producing wells and leases throughout Townships 49 to 50, Ranges 1 to 2 W4M of the Lloydminster area of Alberta. For the purposes of this evaluation, only producing entities were evaluated, resulting in the assignment of heavy oil reserves and value to three active wells.
The wells produce heavy oil from the Sparky and Lloydminster clastic units of Lower Cretaceous age, Upper Mannville Group. Remaining recoverable reserves have been estimated based upon well performance, well spacing, past completion data of offset leases and analogy to other wells in the immediate area of each entity. The individual well production rate-time and rate versus cumulative production plots include the forecast proved and proved plus probable decline parameters used in the cash flow analysis.
The remaining recoverable proved and probable reserves are estimated using production decline methods and the production plots are available in Appendix B. The evaluation parameters used in the cash flow forecasts were estimated based on individual well operating statements from the previous year or by analogy to those data when necessary.
Evaluation Parameters:
| | | | | | |
| | Working | Lessor | Royalty | Operating Costs |
| Well Location | Interest | Royalty | Burden | $/well/month | Variable |
| 00/16A-22-049-01W4/0 | 50.00% | Crown | 4.0% | $4,700 | $4.20 |
| 00/10B-06-050-01W4/0 | 33.33% | Crown | 12.0% | $4,100 | $2.30 |
| 00/06D-24-050-02W4/0 | 33.33% | Crown | 11.9% | $3,100 | $2.00 |
Price Forecast (see Section on Constant Oil Price)
Reference: Heavy Crude at Hardisty (12oAPI)
Abandonment costs (2013 Dollars)$
35,000 per producing well
After Tax Net Present Values
According to the Company, it has a sufficient tax pool to offset corporate income tax for the life of the reserves of the evaluated properties.
Following are the Proved and Proved plus Probable additional reserves Entity Summary Tables and Consolidation cash flow forecasts for the Alberta properties.
16
Figure I-1 Location Maps of the Company’s Wells in the Lloydminster Field, Alberta

17
Figure I-2 Land and Well Location Map of Section 06 TWP 50, RGE 01 W4M
18
Figure I-3 Land and Well Location Map of Section 14 TWP 50, RGE 01 W4M
19
Figure I-4 Land and Well Location Map in 50 RANGE 02 W4M
20
Table I-1 Proved Producing Reserves and Net Present Values of the 16A-22-49-01 W4M
Well Constant Case
| | | | | | |
| 00/16A-22-049-01W4/0 | | Economic Indicators | Before Tax | After-tax |
| Sparky Zone | | | | | | |
| Constant Price | | | Internal Rate of Return (%) | 800.0 | 800.0 |
| | | | Mod Int Rate of Return (%) | 214.0 | 161.0 |
| Reserve Category: | Proven Producing | Pay Out | Yr | 0.0 | 0.0 |
| Province: | Alberta | Field: Lloydminster | ROI Undisc | $/$ | 7.77 | 5.62 |
| Reversion Pt | No Reversion | ROI Disc @10% | $/$ | 6.39 | 4.67 |
| | CORPORATE YEAR END | NPI Disc @10% | $/BOE | 23.10 | 16.90 |
| | | | | | | | | | | | | |
| Evaluation Interest Summary |
| | | | Oil Production | Total | Operating | | | B Tax | Tax | A Tax |
| | | | Rate | Volume | Price | Revenue | Expense | Burden | Capital | Cash Flow | | Cash Flow |
| Year | Mo | Wells | BBL/D | MSTB | $/BBL | M$ | M$ | $/BBL | M$ | M$ | M$ | M$ | M$ |
| 2012 | 1 | 1 | 4.6 | 0.1 | 68.26 | 9.6 | 2.9 | 20.99 | 0.5 | 0.0 | 6.2 | 1.5 | 4.6 |
| 2013 | 12 | 1 | 4.0 | 1.5 | 68.26 | 100.0 | 34.4 | 23.45 | 4.0 | 0.0 | 61.6 | 15.4 | 46.2 |
| 2014 | 12 | 1 | 3.1 | 1.1 | 68.26 | 77.8 | 33.0 | 28.94 | 3.1 | 0.0 | 41.7 | 10.4 | 31.3 |
| 2015 | 12 | 1 | 2.4 | 0.9 | 68.26 | 60.1 | 31.9 | 36.25 | 2.4 | 0.0 | 25.8 | 6.4 | 19.3 |
| 2016 | 12 | 1 | 1.9 | 0.7 | 68.26 | 46.8 | 31.1 | 45.37 | 1.9 | 0.0 | 13.8 | 3.5 | 10.4 |
| 2017 | 12 | 1 | 1.5 | 0.5 | 68.26 | 36.2 | 30.4 | 57.41 | 1.4 | 17.5 | -13.2 | 0.2 | -13.4 |
| SubTotal | | | 4.8 | | 330.4 | 163.7 | | 13.3 | 17.5 | 135.9 | 37.5 | 98.4 |
| Remainder | | | 0.0 | | 0.0 | 0.0 | | 0.0 | 0.0 | 0.0 | 0.0 | 0.0 |
| Total | | | | 4.8 | | 330.4 | 163.7 | 33.82 | 13.3 | 17.5 | 135.9 | 37.5 | 98.4 |
| | | | | | | | | | | |
| | | Before Tax | | After Tax | | | | Gross | W.I. | Royalty | Net |
| | | | | | | Oil | MSTB | 9.7 | 4.8 | 0.0 | 4.8 |
| Discount | Operating | Capital | Cash Flow | Cash Flow | | Gas Raw | MMCF | 0.0 | 0.0 | | |
| Rate | Income | Invest | | | | | | | | | |
| (%) | M$ | M$ | M$ | M$ | | Gas Sales | MMCF | 0.0 | 0.0 | 0.0 | 0.0 |
| | | | | | | NGL | MSTB | 0.0 | 0.0 | 0.0 | 0.0 |
| 0.0 | 153.4 | 17.5 | 135.9 | 98.4 | | Pentane | MSTB | 0.0 | 0.0 | 0.0 | 0.0 |
| 5.0 | 136.3 | 13.4 | 123.0 | 89.5 | | Butane | MSTB | 0.0 | 0.0 | 0.0 | 0.0 |
| 10.0 | 122.2 | 10.4 | 111.8 | 81.8 | | Propane | MSTB | 0.0 | 0.0 | 0.0 | 0.0 |
| | | | | | | Ethane | MSTB | 0.0 | 0.0 | 0.0 | 0.0 |
| 15.0 | 110.3 | 8.1 | 102.2 | 75.0 | | Sulphur | MLT | 0.0 | 0.0 | 0.0 | 0.0 |
| 20.0 | 100.2 | 6.4 | 93.8 | 69.1 | | BOE | MSTB | 9.7 | 4.8 | 0.0 | 4.8 |
21
Table I-2 Proved Producing Reserves and Net Present Values of the 10B-06-50-01 W4M Well
Constant Case
| | |
| EANexus | File | |
| C:\EANexus\Case\ALBERTA STA | | |
| ALBERTA STAR DEVELOPMENT LTD. | Time | 06/03/2013 12:20:52 |
| PM | | |
| | Version | EANexus Ver 2.7.2.0 |
| | | | | | |
| 00/10B-06-050-01W4/0 | | Economic Indicators | Before Tax | After-tax |
| Sparky Zone | | | | | | |
| CONSTANT PRICE | | | Internal Rate of Return (%) | 800.0 | 800.0 |
| | | | Mod Int Rate of Return (%) | 35.0 | 14.4 |
| Reserve Category: | Proven Producing | Pay Out | Yr | 0.0 | 0.0 |
| Province: | Alberta | Field: Lloydminster | ROI Undisc | $/$ | 0.67 | 0.27 |
| Reversion Pt | No Reversion | ROI Disc @10% | $/$ | 0.70 | 0.35 |
| | CORPORATE YEAR END | NPI Disc @10% | $/BOE | 6.73 | 3.40 |
| | | | | | | | | | | | | |
| Evaluation Interest Summary |
| | | | Oil Production | Total | Operating | | | B Tax | Tax | A Tax |
| | | | Rate | Volume | Price | Revenue | Expense | Burden | Capital | Cash Flow | | Cash Flow |
| Year | Mo | Wells | BBL/D | MSTB | $/BBL | M$ | M$ | $/BBL | M$ | M$ | M$ | M$ | M$ |
| 2012 | 1 | 1 | 1.5 | 0.0 | 68.26 | 3.2 | 1.5 | 31.59 | 0.4 | 0.0 | 1.3 | 0.3 | 1.0 |
| 2013 | 12 | 1 | 1.4 | 0.5 | 68.26 | 33.7 | 17.5 | 35.54 | 4.0 | 0.0 | 12.1 | 3.0 | 9.1 |
| 2014 | 12 | 1 | 1.0 | 0.4 | 68.26 | 25.9 | 17.3 | 45.46 | 3.1 | 0.0 | 5.6 | 1.4 | 4.2 |
| 2015 | 12 | 1 | 0.8 | 0.3 | 68.26 | 20.0 | 17.1 | 58.21 | 2.4 | 11.7 | -11.1 | 0.0 | -11.1 |
| SubTotal | | | 1.2 | | 82.8 | 53.4 | | 9.9 | 11.7 | 7.9 | 4.7 | 3.1 |
| Remainder | | | 0.0 | | 0.0 | 0.0 | | 0.0 | 0.0 | 0.0 | 0.0 | 0.0 |
| Total | | | | 1.2 | | 82.8 | 53.4 | 43.98 | 9.9 | 11.7 | 7.9 | 4.7 | 3.1 |
| | | | | | | | | | | |
| | | Before Tax | | After Tax | | | | Gross | W.I. | Royalty | Net |
| | | | | | | Oil | MSTB | 3.6 | 1.2 | 0.0 | 1.2 |
| Discount | Operating | Capital | Cash Flow | Cash Flow | | Gas Raw | MMCF | 0.0 | 0.0 | | |
| Rate | Income | Invest | | | | | | | | | |
| (%) | M$ | M$ | M$ | M$ | | Gas Sales | MMCF | 0.0 | 0.0 | 0.0 | 0.0 |
| | | | | | | NGL | MSTB | 0.0 | 0.0 | 0.0 | 0.0 |
| 0.0 | 19.5 | 11.7 | 7.9 | 3.1 | | Pentane | MSTB | 0.0 | 0.0 | 0.0 | 0.0 |
| 5.0 | 17.9 | 9.8 | 8.1 | 3.7 | | Butane | MSTB | 0.0 | 0.0 | 0.0 | 0.0 |
| 10.0 | 16.5 | 8.4 | 8.2 | 4.1 | | Propane | MSTB | 0.0 | 0.0 | 0.0 | 0.0 |
| | | | | | | Ethane | MSTB | 0.0 | 0.0 | 0.0 | 0.0 |
| 15.0 | 15.3 | 7.2 | 8.1 | 4.4 | | Sulphur | MLT | 0.0 | 0.0 | 0.0 | 0.0 |
| 20.0 | 14.2 | 6.2 | 8.1 | 4.6 | | BOE | MSTB | 3.6 | 1.2 | 0.0 | 1.2 |
22
Table I-3 Proved Producing Reserves and Net Present Values of the 12-14-50-02 W4M
Well Constant Case
| | |
| EANexus | File | |
| C:\EANexus\Case\ALBERTA STA | | |
| ALBERTA STAR DEVELOPMENT LTD. | Time | 06/03/2013 12:20:52 |
| PM | | |
| | Version | EANexus Ver 2.7.2.0 |
| | | | | | |
| 00/12-14-050-02W4/0 | | | Economic Indicators | Before Tax | After-tax |
| Sparky Zone | | | | | | |
| CONSTANT PRICE | | | Internal Rate of Return (%) | 800.0 | 800.0 |
| | | | Mod Int Rate of Return (%) | 48.9 | 29.3 |
| Reserve Category: | Proven Producing | Pay Out | Yr | 0.0 | 0.0 |
| Province: | Alberta | Field: Lloydminster | ROI Undisc | $/$ | 1.19 | 0.70 |
| Reversion Pt | No Reversion | ROI Disc @10% | $/$ | 1.08 | 0.67 |
| | CORPORATE YEAR END | NPI Disc @10% | $/BOE | 11.10 | 6.86 |
| | | | | | | | | | | | | |
| Evaluation Interest Summary |
| | | | Oil Production | | Total | Operating | | | B Tax | Tax | A Tax |
| | | | Rate | Volume | Price | Revenue | Expense | Burden | Capital | Cash Flow | | Cash Flow |
| Year | Mo | Wells | BBL/D | MSTB | $/BBL | M$ | M$ | $/BBL | M$ | M$ | M$ | M$ | M$ |
| 2012 | 1 | 1 | 1.3 | 0.0 | 68.26 | 2.7 | 1.2 | 29.67 | 0.3 | 0.0 | 1.2 | 0.3 | 0.9 |
| 2013 | 12 | 1 | 1.2 | 0.4 | 68.26 | 29.8 | 14.1 | 32.31 | 3.6 | 0.0 | 12.1 | 3.0 | 9.1 |
| 2014 | 12 | 1 | 1.0 | 0.4 | 68.26 | 24.8 | 13.9 | 38.23 | 3.0 | 0.0 | 7.9 | 2.0 | 6.0 |
| 2015 | 12 | 1 | 0.8 | 0.3 | 68.26 | 20.5 | 13.7 | 45.67 | 2.5 | 11.7 | -7.3 | 0.5 | -7.8 |
| SubTotal | | | 1.1 | | 77.8 | 42.9 | | 9.3 | 11.7 | 13.9 | 5.8 | 8.1 |
| Remainder | | | 0.0 | | 0.0 | 0.0 | | 0.0 | 0.0 | 0.0 | 0.0 | 0.0 |
| Total | | | | 1.1 | | 77.8 | 42.9 | 37.62 | 9.3 | 11.7 | 13.9 | 5.8 | 8.1 |
| | | | | | | | | | | |
| | | Before Tax | | After Tax | | | | Gross | W.I. | Royalty | Net |
| | | | | | | Oil | MSTB | 3.4 | 1.1 | 0.0 | 1.1 |
| Discount | Operating | Capital | Cash Flow | Cash Flow | | Gas Raw | MMCF | 0.0 | 0.0 | | |
| Rate | Income | Invest | | | | | | | | | |
| (%) | M$ | M$ | M$ | M$ | | Gas Sales | MMCF | 0.0 | 0.0 | 0.0 | 0.0 |
| | | | | | | NGL | MSTB | 0.0 | 0.0 | 0.0 | 0.0 |
| 0.0 | 25.6 | 11.7 | 13.9 | 8.1 | | Pentane | MSTB | 0.0 | 0.0 | 0.0 | 0.0 |
| 5.0 | 23.1 | 9.8 | 13.3 | 8.0 | | Butane | MSTB | 0.0 | 0.0 | 0.0 | 0.0 |
| 10.0 | 21.0 | 8.4 | 12.7 | 7.8 | | Propane | MSTB | 0.0 | 0.0 | 0.0 | 0.0 |
| | | | | | | Ethane | MSTB | 0.0 | 0.0 | 0.0 | 0.0 |
| 15.0 | 19.2 | 7.2 | 12.1 | 7.6 | | Sulphur | MLT | 0.0 | 0.0 | 0.0 | 0.0 |
| 20.0 | 17.6 | 6.2 | 11.5 | 7.4 | | BOE | MSTB | 3.4 | 1.1 | 0.0 | 1.1 |
23
Table I-4 Proved + Probable Additonal Reserves annd Net Present Values of the 16A-22-49-01
W4M Well Constant Case
| | |
| EANexus | File | |
| C:\EANexus\Case\ALBERTA STA | | |
| ALBERTA STAR DEVELOPMENT LTD. | Time | 06/03/2013 12:41:05 |
| PM | | |
| | Version | EANexus Ver 2.7.2.0 |
| | | | | | |
| 00/16A-22-049-01W4/0 | | | Economic Indicators | Before Tax | After-tax |
| Sparky Zone | | | | | | |
| CONSTANT PRICE | | | Internal Rate of Return (%) | 800.0 | 800.0 |
| | | | Mod Int Rate of Return (%) | 256.5 | 196.0 |
| Reserve Category: | Total Proven Plus Probable Additional | Pay Out | Yr | 0.0 | 0.0 |
| Province: | Alberta | Field: Lloydminster | ROI Undisc | $/$ | 12.50 | 9.17 |
| Reversion Pt | No Reversion | ROI Disc @10% | $/$ | 9.76 | 7.22 |
| | CORPORATE YEAR END | NPI Disc @10% | $/BOE | 23.98 | 17.73 |
| | | | | | | | | | | | | |
| Evaluation Interest Summary |
| | | | Oil Production | | Total | Operating | | | B Tax | Tax | A Tax |
| | | | Rate | Volume | Price | Revenue | Expense | Burden | Capital | Cash Flow | | Cash Flow |
| Year | Mo | Wells | BBL/D | MSTB | $/BBL | M$ | M$ | $/BBL | M$ | M$ | M$ | M$ | M$ |
| 2012 | 1 | 1 | 5.1 | 0.2 | 68.26 | 10.6 | 3.0 | 19.36 | 0.6 | 0.0 | 6.9 | 1.7 | 5.2 |
| 2013 | 12 | 1 | 4.5 | 1.7 | 68.26 | 113.3 | 35.2 | 21.19 | 4.5 | 0.0 | 73.6 | 18.4 | 55.2 |
| 2014 | 12 | 1 | 3.7 | 1.4 | 68.26 | 93.2 | 33.9 | 24.86 | 4.2 | 0.0 | 55.1 | 13.8 | 41.3 |
| 2015 | 12 | 1 | 3.1 | 1.1 | 68.26 | 76.8 | 32.9 | 29.27 | 3.1 | 0.0 | 40.8 | 10.2 | 30.6 |
| 2016 | 12 | 1 | 2.5 | 0.9 | 68.26 | 62.8 | 32.1 | 34.85 | 2.5 | 0.0 | 28.2 | 7.1 | 21.2 |
| 2017 | 12 | 1 | 2.1 | 0.8 | 68.26 | 51.9 | 31.4 | 41.31 | 2.1 | 0.0 | 18.4 | 4.6 | 13.8 |
| 2018 | 12 | 1 | 1.7 | 0.6 | 68.26 | 42.7 | 30.8 | 49.32 | 1.7 | 0.0 | 10.1 | 2.5 | 7.6 |
| 2019 | 12 | 1 | 1.4 | 0.5 | 68.26 | 34.8 | 30.3 | 59.49 | 1.4 | 17.5 | -14.4 | 0.0 | -14.4 |
| SubTotal | | | 7.1 | | 486.0 | 229.7 | | 20.1 | 17.5 | 218.8 | 58.3 | 160.5 |
| Remainder | | | 0.0 | | 0.0 | 0.0 | | 0.0 | 0.0 | 0.0 | 0.0 | 0.0 |
| Total | | | | 7.1 | | 486.0 | 229.7 | 32.25 | 20.1 | 17.5 | 218.8 | 58.3 | 160.5 |
| | | | | | | | | | | |
| | | Before Tax | | After Tax | | | | Gross | W.I. | Royalty | Net |
| | | | | | | Oil | MSTB | 14.2 | 7.1 | 0.0 | 7.1 |
| Discount | Operating | Capital | Cash Flow | Cash Flow | | Gas Raw | MMCF | 0.0 | 0.0 | | |
| Rate | Income | Invest | | | | | | | | | |
| (%) | M$ | M$ | M$ | M$ | | Gas Sales | MMCF | 0.0 | 0.0 | 0.0 | 0.0 |
| | | | | | | NGL | MSTB | 0.0 | 0.0 | 0.0 | 0.0 |
| 0.0 | 236.3 | 17.5 | 218.8 | 160.5 | | Pentane | MSTB | 0.0 | 0.0 | 0.0 | 0.0 |
| 5.0 | 204.6 | 12.1 | 192.4 | 141.8 | | Butane | MSTB | 0.0 | 0.0 | 0.0 | 0.0 |
| 10.0 | 179.3 | 8.6 | 170.7 | 126.3 | | Propane | MSTB | 0.0 | 0.0 | 0.0 | 0.0 |
| | | | | | | Ethane | MSTB | 0.0 | 0.0 | 0.0 | 0.0 |
| 15.0 | 158.7 | 6.1 | 152.6 | 113.2 | | Sulphur | MLT | 0.0 | 0.0 | 0.0 | 0.0 |
| 20.0 | 141.9 | 4.5 | 137.4 | 102.1 | | BOE | MSTB | 14.2 | 7.1 | 0.0 | 7.1 |
24
Table I-4 Proved + Probable Additonal Reserves annd Net Present Values of the 10B-06-50-01
W4M Well Constant Case
| | |
| EANexus | File | |
| C:\EANexus\Case\ALBERTA STA | | |
| ALBERTA STAR DEVELOPMENT LTD. | Time | 06/03/2013 12:41:05 |
| PM | | |
| | Version | EANexus Ver 2.7.2.0 |
| | | | | | |
| 00/10B-06-050-01W4/0 | | | Economic Indicators | Before Tax | After-tax |
| Sparky Zone | | | | | | |
| CONSTANT PRICE | | | Internal Rate of Return (%) | 800.0 | 800.0 |
| | | | Mod Int Rate of Return (%) | 68.7 | 44.9 |
| Reserve Category: | Total Proven Plus Probable Additional | Pay Out | Yr | 0.0 | 0.0 |
| Province: | Alberta | Field: Lloydminster | ROI Undisc | $/$ | 1.83 | 1.15 |
| Reversion Pt | No Reversion | ROI Disc @10% | $/$ | 1.65 | 1.10 |
| | CORPORATE YEAR END | NPI Disc @10% | $/BOE | 11.13 | 7.39 |
| | | | | | | | | | | | | |
| Evaluation Interest Summary |
| | | | Oil Production | | Total | Operating | | | B Tax | Tax | A Tax |
| | | | Rate | Volume | Price | Revenue | Expense | Burden | Capital | Cash Flow | | Cash Flow |
| Year | Mo | Wells | BBL/D | MSTB | $/BBL | M$ | M$ | $/BBL | M$ | M$ | M$ | M$ | M$ |
| 2012 | 1 | 1 | 1.6 | 0.0 | 68.26 | 3.4 | 1.5 | 29.63 | 0.4 | 0.0 | 1.5 | 0.4 | 1.1 |
| 2013 | 12 | 1 | 1.5 | 0.5 | 68.26 | 37.3 | 17.7 | 32.30 | 4.5 | 0.0 | 15.2 | 3.8 | 11.4 |
| 2014 | 12 | 1 | 1.2 | 0.4 | 68.26 | 30.7 | 17.4 | 38.74 | 3.7 | 0.0 | 9.6 | 2.4 | 7.2 |
| 2015 | 12 | 1 | 1.0 | 0.4 | 68.26 | 25.5 | 17.3 | 46.23 | 3.1 | 0.0 | 5.2 | 1.3 | 3.9 |
| 2016 | 12 | 1 | 0.8 | 0.3 | 68.26 | 21.2 | 17.1 | 55.20 | 2.5 | 11.7 | -10.2 | 0.0 | -10.2 |
| SubTotal | | | 1.7 | | 118.1 | 70.9 | | 14.2 | 11.7 | 21.3 | 7.9 | 13.4 |
| Remainder | | | 0.0 | | 0.0 | 0.0 | | 0.0 | 0.0 | 0.0 | 0.0 | 0.0 |
| Total | | | | 1.7 | | 118.1 | 70.9 | 41.01 | 14.2 | 11.7 | 21.3 | 7.9 | 13.4 |
| | | | | | | | | | | |
| | | Before Tax | | After Tax | | | | Gross | W.I. | Royalty | Net |
| | | | | | | Oil | MSTB | 5.2 | 1.7 | 0.0 | 1.7 |
| Discount | Operating | Capital | Cash Flow | Cash Flow | | Gas Raw | MMCF | 0.0 | 0.0 | | |
| Rate | Income | Invest | | | | | | | | | |
| (%) | M$ | M$ | M$ | M$ | | Gas Sales | MMCF | 0.0 | 0.0 | 0.0 | 0.0 |
| | | | | | | NGL | MSTB | 0.0 | 0.0 | 0.0 | 0.0 |
| 0.0 | 33.0 | 11.7 | 21.3 | 13.4 | | Pentane | MSTB | 0.0 | 0.0 | 0.0 | 0.0 |
| 5.0 | 29.7 | 9.4 | 20.3 | 13.2 | | Butane | MSTB | 0.0 | 0.0 | 0.0 | 0.0 |
| 10.0 | 26.9 | 7.6 | 19.3 | 12.8 | | Propane | MSTB | 0.0 | 0.0 | 0.0 | 0.0 |
| | | | | | | Ethane | MSTB | 0.0 | 0.0 | 0.0 | 0.0 |
| 15.0 | 24.5 | 6.2 | 18.2 | 12.3 | | Sulphur | MLT | 0.0 | 0.0 | 0.0 | 0.0 |
| 20.0 | 22.4 | 5.1 | 17.3 | 11.8 | | BOE | MSTB | 5.2 | 1.7 | 0.0 | 1.7 |
25
Table I-6 Proved + Probable Additonal Reserves annd Net Present Values of the 12-14-50-02
W4M Well Constant Case
| | |
| EANexus | File | |
| C:\EANexus\Case\ALBERTA STA | | |
| ALBERTA STAR DEVELOPMENT LTD. | Time | 06/03/2013 12:41:06 |
| PM | | |
| | Version | EANexus Ver 2.7.2.0 |
| | | | | | |
| 00/12-14-050-02W4/0 | | | Economic Indicators | Before Tax | After-tax |
| Sparky Zone | | | | | | |
| CONSTANT PRICE | | | Internal Rate of Return (%) | 800.0 | 800.0 |
| | | | Mod Int Rate of Return (%) | 97.5 | 70.1 |
| Reserve Category: | Total Proven Plus Probable Additional | Pay Out | Yr | 0.0 | 0.0 |
| Province: | Alberta | Field: Lloydminster | ROI Undisc | $/$ | 3.47 | 2.40 |
| Reversion Pt | No Reversion | ROI Disc @10% | $/$ | 2.90 | 2.06 |
| | CORPORATE YEAR END | NPI Disc @10% | $/BOE | 16.50 | 11.70 |
| | | | | | | | | | | | | |
| Evaluation Interest Summary |
| | | | Oil Production | | Total | Operating | | | B Tax | Tax | A Tax |
| | | | Rate | Volume | Price | Revenue | Expense | Burden | Capital | Cash Flow | | Cash Flow |
| Year | Mo | Wells | BBL/D | MSTB | $/BBL | M$ | M$ | $/BBL | M$ | M$ | M$ | M$ | M$ |
| 2012 | 1 | 1 | 1.6 | 0.0 | 68.26 | 3.4 | 1.2 | 24.33 | 0.4 | 0.0 | 1.8 | 0.4 | 1.3 |
| 2013 | 12 | 1 | 1.5 | 0.5 | 68.26 | 37.5 | 14.4 | 26.27 | 4.5 | 0.0 | 18.6 | 4.6 | 13.9 |
| 2014 | 12 | 1 | 1.3 | 0.5 | 68.26 | 31.6 | 14.2 | 30.63 | 3.8 | 0.0 | 13.6 | 3.4 | 10.2 |
| 2015 | 12 | 1 | 1.1 | 0.4 | 68.26 | 26.4 | 14.0 | 36.10 | 3.2 | 0.0 | 9.3 | 2.3 | 6.9 |
| 2016 | 12 | 1 | 0.9 | 0.3 | 68.26 | 22.5 | 13.8 | 41.79 | 2.7 | 0.0 | 6.0 | 1.5 | 4.5 |
| 2017 | 12 | 1 | 0.7 | 0.3 | 68.26 | 18.7 | 13.6 | 49.83 | 2.2 | 11.7 | -8.9 | 0.1 | -9.0 |
| SubTotal | | | 2.1 | | 140.1 | 71.2 | | 16.8 | 11.7 | 40.4 | 12.4 | 28.0 |
| Remainder | | | 0.0 | | 0.0 | 0.0 | | 0.0 | 0.0 | 0.0 | 0.0 | 0.0 |
| Total | | | | 2.1 | | 140.1 | 71.2 | 34.69 | 16.8 | 11.7 | 40.4 | 12.4 | 28.0 |
| | | | | | | | | | | |
| | | Before Tax | | After Tax | | | | Gross | W.I. | Royalty | Net |
| | | | | | | Oil | MSTB | 6.2 | 2.1 | 0.0 | 2.1 |
| Discount | Operating | Capital | Cash Flow | Cash Flow | | Gas Raw | MMCF | 0.0 | 0.0 | | |
| Rate | Income | Invest | | | | | | | | | |
| (%) | M$ | M$ | M$ | M$ | | Gas Sales | MMCF | 0.0 | 0.0 | 0.0 | 0.0 |
| | | | | | | NGL | MSTB | 0.0 | 0.0 | 0.0 | 0.0 |
| 0.0 | 52.1 | 11.7 | 40.4 | 28.0 | | Pentane | MSTB | 0.0 | 0.0 | 0.0 | 0.0 |
| 5.0 | 45.9 | 8.9 | 37.0 | 25.9 | | Butane | MSTB | 0.0 | 0.0 | 0.0 | 0.0 |
| 10.0 | 40.8 | 6.9 | 33.9 | 24.0 | | Propane | MSTB | 0.0 | 0.0 | 0.0 | 0.0 |
| | | | | | | Ethane | MSTB | 0.0 | 0.0 | 0.0 | 0.0 |
| 15.0 | 36.5 | 5.4 | 31.1 | 22.3 | | Sulphur | MLT | 0.0 | 0.0 | 0.0 | 0.0 |
| 20.0 | 33.0 | 4.3 | 28.7 | 20.7 | | BOE | MSTB | 6.2 | 2.1 | 0.0 | 2.1 |
26
Table I-7 Proved + Probable Additonal Reserves annd Net Present Values of the 06D-24-50-02
W4M Well Constant Case
| | |
| | EANexus | File |
| C:\EANexus\Case\ALBERTA STA | | |
| ALBERTA STAR DEVELOPMENT LTD. | Time | 06/03/2013 12:41:07 |
| PM | | |
| | Version | EANexus Ver 2.7.2.0 |
| | | | | | |
| 00/06D-24-050-02W4/0 | | | Economic Indicators | Before Tax | After-tax |
| Sparky | | | | | | |
| CONSTANT PRICE | | | Internal Rate of Return (%) | 800.0 | 800.0 |
| | | | Mod Int Rate of Return (%) | 42.2 | 19.5 |
| Reserve Category: | Total Proven Plus Probable Additional | Pay Out | Yr | 0.0 | 0.0 |
| Province: | Alberta | Field: Lloydminster | ROI Undisc | $/$ | 0.69 | 0.32 |
| Reversion Pt | No Reversion | ROI Disc @10% | $/$ | 0.67 | 0.35 |
| | CORPORATE YEAR END | NPI Disc @10% | $/BOE | 10.03 | 5.17 |
| | | | | | | | | | | | | |
| Evaluation Interest Summary |
| | | | Oil Production | | Total | Operating | | | B Tax | Tax | A Tax |
| | | | Rate | Volume | Price | Revenue | Expense | Burden | Capital | Cash Flow | | Cash Flow |
| Year | Mo | Wells | BBL/D | MSTB | $/BBL | M$ | M$ | $/BBL | M$ | M$ | M$ | M$ | M$ |
| 2012 | 1 | 1 | 1.8 | 0.1 | 68.26 | 3.6 | 1.1 | 21.38 | 0.4 | 0.0 | 2.1 | 0.5 | 1.6 |
| 2013 | 12 | 1 | 1.3 | 0.5 | 68.26 | 32.1 | 13.3 | 28.38 | 3.8 | 0.0 | 14.9 | 3.7 | 11.2 |
| 2014 | 12 | 1 | 0.7 | 0.3 | 68.26 | 17.7 | 12.9 | 49.69 | 2.1 | 11.7 | -9.0 | 0.1 | -9.0 |
| SubTotal | | | 0.8 | | 53.5 | 27.4 | | 6.4 | 11.7 | 8.0 | 4.3 | 3.7 |
| Remainder | | | 0.0 | | 0.0 | 0.0 | | 0.0 | 0.0 | 0.0 | 0.0 | 0.0 |
| Total | | | | 0.8 | | 53.5 | 27.4 | 34.98 | 6.4 | 11.7 | 8.0 | 4.3 | 3.7 |
| | | | | | | | | | | |
| | | Before Tax | | After Tax | | | | Gross | W.I. | Royalty | Net |
| | | | | | | Oil | MSTB | 2.4 | 0.8 | 0.0 | 0.8 |
| Discount | Operating | Capital | Cash Flow | Cash Flow | | Gas Raw | MMCF | 0.0 | 0.0 | | |
| Rate | Income | Invest | | | | | | | | | |
| (%) | M$ | M$ | M$ | M$ | | Gas Sales | MMCF | 0.0 | 0.0 | 0.0 | 0.0 |
| | | | | | | NGL | MSTB | 0.0 | 0.0 | 0.0 | 0.0 |
| 0.0 | 19.7 | 11.7 | 8.0 | 3.7 | | Pentane | MSTB | 0.0 | 0.0 | 0.0 | 0.0 |
| 5.0 | 18.3 | 10.3 | 8.0 | 3.9 | | Butane | MSTB | 0.0 | 0.0 | 0.0 | 0.0 |
| 10.0 | 17.0 | 9.2 | 7.9 | 4.1 | | Propane | MSTB | 0.0 | 0.0 | 0.0 | 0.0 |
| | | | | | | Ethane | MSTB | 0.0 | 0.0 | 0.0 | 0.0 |
| 15.0 | 15.9 | 8.2 | 7.7 | 4.1 | | Sulphur | MLT | 0.0 | 0.0 | 0.0 | 0.0 |
| 20.0 | 15.0 | 7.4 | 7.6 | 4.2 | | BOE | MSTB | 2.4 | 0.8 | 0.0 | 0.8 |
27
| |
| II | Landrose and Maidstone, Saskatchewan |
The Company holds various working interests in producing and non-producing wells and leases throughout Townships 48 to 52, Ranges 22 to 27 W3M of the Lloydminster area of Saskatchewan. Proved and proved plus probable reserves were assigned to 11 currently producing wells and two undeveloped wells/location. The groups of wells which are considered a major property for the Company are located in the Landrose area, Township 50, Range 25 W3M. The Company has an interest in six recently drilled wells in Section 6-50-25 W3M and has plans to drill a proved undeveloped location in the section. The Landrose wells produce heavy oil from the McLaren Member of the Upper Mannville Formation. One well in the section was drilled prior to the effective date which has been classified as undeveloped as it was not completed by the effective date. It was completed and began producing in December 2011. There are currently seven wells producing heavy oil from the McLaren Formation, within the Saskatchewan properties which are contributing to the majority of the reserves in this evaluation. For this evaluation, only producing entities were evaluated, resulting in the assignment of heavy oil reserves to 12 active wells.
The Maidstone property has four active wells located in Section 01-048-24 W3M. The wells produce heavy oil from the McLaren Formation. The wells were drilled and began producing in the early 1980’s and have produced for varying periods since then.
Remaining recoverable reserves have been estimated based on volumetric data, well performance, well spacing, past completion data of offset leases and analogy to other wells in the immediate area of each entity. The production plots are shown in Appendices C and D. The individual well production rate-time and rate versus cumulative production plots include the forecast proved and proved plus probable decline parameters used in the cash flow analysis.
The evaluation parameters used in the cash flow forecasts were estimated based on individual well operating statements from the previous year or by analogy to those data when necessary.
Evaluation Parameters:
| | | | | | |
| | | Lessor | Royalty | Operating Costs |
| Well Location | Interest | Royalty | Burden | $/well/month | Variable |
| Maidstone | | | | | |
| 11/10-01-048-24W3/0 | 50.00% | 15%FH | 3.0% | $3,000 | $ 3.00 |
| Landrose | | | | | |
| 31/12-06-050-25W3/0 | 25.00% | Cr. T4 | | $5,500 | $ 4.50 |
| 22/13-06-050-25W3/0 | 50.00% | Cr. New | | $5,500 | $ 4.50 |
| 31/13-06-050-25W3/0 | 50.00% | Cr, T4 | 15.0%BPO | $5,500 | $ 4.50 |
| 31/14-06-050-25W3/0 | 25.00% | Cr. T4 | | $5,500 | $ 4.50 |
| 11/06-12-050-36W3/0 | 50.00% | Cr. T4 | | $5,500 | $ 4.50 |
Price Forecast (see Section on Constant Oil Price)- Reference: Heavy Crude at Hardisty (12oAPI)
Abandonment costs (2013 Dollars)- $35,000 per producing well
28
Figure II-1 Location Map of the Landrose Field in Saskatchewan
29
Figure II-2 Location Map of the Maidstone Field in Saskatchewan
30
Table II-1 Proved Producing Reserves and Net Present Values of 4 Wells in Section 11/01-48-24
W3M Constant Case
| | |
| EANexus | File | |
| C:\EANexus\Case\ALBERTA STA | | |
| ALBERTA STAR DEVELOPMENT LTD. | Time | 06/03/2013 12:20:48 |
| PM | | |
| | Version | EANexus Ver 2.7.2.0 |
| | | | | | |
| MAIDSTONE PROPERTY SASKATCHEWAN | Economic Indicators | Before Tax | After-tax |
| 4 Wells in Sec 01-048-24W3/0 | | | | | |
| McLaren | | | Internal Rate of Return (%) | 800.0 | Non-Con |
| CONSTANT PICE | | | | | | |
| | | | Mod Int Rate of Return (%) | 4.2 | -10.5 |
| Reserve Category: | Proven Producing | Pay Out | Yr | 0.0 | 0.0 |
| Province: | Sask | Field: Maidstone | ROI Undisc | $/$ | 0.08 | -0.19 |
| Reversion Pt | No Reversion | ROI Disc @10% | $/$ | 0.19 | -0.04 |
| | CORPORATE YEAR END | NPI Disc @10% | $/BOE | 1.28 | -0.28 |
| | | | | | | | | | | | | |
| Evaluation Interest Summary |
| | | | Oil Production | Total | Operating | | | B Tax | Tax | A Tax |
| | | | Rate | Volume | Price | Revenue | Expense | Burden | Capital | Cash Flow | | Cash Flow |
| Year | Mo | Wells | BBL/D | MSTB | $/BBL | M$ | M$ | $/BBL | M$ | M$ | M$ | M$ | M$ |
| 2012 | 1 | 3 | 8.2 | 0.2 | 64.94 | 16.2 | 9.8 | 39.00 | 2.9 | 0.0 | 3.6 | 1.0 | 2.6 |
| 2013 | 12 | 3 | 7.7 | 2.8 | 64.94 | 181.5 | 116.4 | 41.64 | 32.7 | 0.0 | 32.5 | 8.8 | 23.7 |
| 2014 | 12 | 3 | 6.8 | 2.5 | 64.94 | 161.7 | 115.5 | 46.37 | 29.1 | 0.0 | 17.1 | 4.6 | 12.5 |
| 2015 | 12 | 3 | 6.1 | 2.2 | 64.94 | 144.2 | 114.7 | 51.65 | 26.0 | 52.5 | -48.9 | 0.0 | -48.9 |
| SubTotal | | | 7.8 | | 503.6 | 356.3 | | 90.6 | 52.5 | 4.2 | 14.3 | -10.2 |
| Remainder | | | 0.0 | | 0.0 | 0.0 | | 0.0 | 0.0 | 0.0 | 0.0 | 0.0 |
| Total | | | | 7.8 | | 503.6 | 356.3 | 45.94 | 90.6 | 52.5 | 4.2 | 14.3 | -10.2 |
| | | | | | | | | | | |
| | | Before Tax | | After Tax | | | | Gross | W.I. | Royalty | Net |
| | | | | | | Oil | MSTB | 15.5 | 7.8 | 0.4 | 7.4 |
| Discount Operating | Capital | Cash Flow | Cash Flow | | Gas Raw | MMCF | 0.0 | 0.0 | | |
| Rate | Income | Invest | | | | | | | | | |
| (%) | M$ | M$ | M$ | M$ | | Gas Sales | MMCF | 0.0 | 0.0 | 0.0 | 0.0 |
| | | | | | | NGL | MSTB | 0.0 | 0.0 | 0.0 | 0.0 |
| 0.0 | 56.7 | 52.5 | 4.2 | -10.2 | | Pentane | MSTB | 0.0 | 0.0 | 0.0 | 0.0 |
| 5.0 | 51.8 | 44.3 | 7.5 | -5.6 | | Butane | MSTB | 0.0 | 0.0 | 0.0 | 0.0 |
| 10.0 | 47.6 | 37.6 | 10.0 | -2.2 | | Propane | MSTB | 0.0 | 0.0 | 0.0 | 0.0 |
| | | | | | | Ethane | MSTB | 0.0 | 0.0 | 0.0 | 0.0 |
| 15.0 | 43.9 | 32.2 | 11.7 | 0.4 | | Sulphur | MLT | 0.0 | 0.0 | 0.0 | 0.0 |
| 20.0 | 40.7 | 27.7 | 12.9 | 2.5 | | BOE | MSTB | 15.5 | 7.8 | 0.4 | 7.4 |
31
Table II-2 Proved Producing Reserves and Net Present Values of the 31/12-06-50-25 W3M Well
Constant Case
| | |
| EANexus | File | |
| C:\EANexus\Case\ALBERTA STA | | |
| ALBERTA STAR DEVELOPMENT LTD. | Time | 06/03/2013 12:20:49 |
| PM | | |
| | Version | EANexus Ver 2.7.2.0 |
| | | | | | |
| 31/12-06-050-25W3/0 | | | Economic Indicators | Before Tax | After-tax |
| McLaren Zone | | | | | | |
| CONSTANT PRICE | | | Internal Rate of Return (%) | 800.0 | 800.0 |
| | | | Mod Int Rate of Return (%) | 580.4 | 427.1 |
| Reserve Category: | Proven Producing | Pay Out | Yr | 0.0 | 0.0 |
| Province: | Sask | Field: Landrose | ROI Undisc | $/$ | 20.05 | 14.43 |
| Reversion Pt | No Reversion | ROI Disc @10% | $/$ | 16.53 | 11.96 |
| | CORPORATE YEAR END | NPI Disc @10% | $/BOE | 29.14 | 21.08 |
| | | | | | | | | | | | | |
| Evaluation Interest Summary |
| | | | Oil Production | | Total | Operating | | | B Tax | Tax | A Tax |
| | | | Rate | Volume | Price | Revenue | Expense | Burden | Capital | Cash Flow | | Cash Flow |
| Year | Mo | Wells | BBL/D | MSTB | $/BBL | M$ | M$ | $/BBL | M$ | M$ | M$ | M$ | M$ |
| 2012 | 1 | 1 | 7.0 | 0.2 | 63.90 | 13.6 | 2.3 | 10.97 | 2.2 | 0.0 | 9.0 | 2.4 | 6.6 |
| 2013 | 12 | 1 | 5.5 | 2.0 | 63.90 | 127.2 | 25.5 | 12.79 | 15.9 | 0.0 | 85.8 | 22.8 | 63.0 |
| 2014 | 12 | 1 | 3.4 | 1.2 | 63.90 | 78.9 | 22.1 | 17.86 | 5.8 | 0.0 | 51.0 | 13.8 | 37.3 |
| 2015 | 12 | 1 | 2.1 | 0.8 | 63.90 | 48.7 | 19.9 | 26.14 | 2.0 | 0.0 | 26.8 | 7.2 | 19.6 |
| 2016 | 12 | 1 | 1.3 | 0.5 | 63.90 | 30.2 | 18.6 | 39.42 | 0.6 | 0.0 | 11.0 | 3.0 | 8.0 |
| 2017 | 12 | 1 | 0.8 | 0.3 | 63.90 | 18.7 | 17.8 | 60.91 | 0.4 | 8.8 | -8.2 | 0.0 | -8.2 |
| SubTotal | | | 5.0 | | 317.3 | 106.2 | | 26.9 | 8.8 | 175.4 | 49.1 | 126.3 |
| Remainder | | | 0.0 | | 0.0 | 0.0 | | 0.0 | 0.0 | 0.0 | 0.0 | 0.0 |
| Total | | | | 5.0 | | 317.3 | 106.2 | 21.39 | 26.9 | 8.8 | 175.4 | 49.1 | 126.3 |
| | | | | | | | | | | |
| | | Before Tax | | After Tax | | | | Gross | W.I. | Royalty | Net |
| | | | | | | Oil | MSTB | 19.9 | 5.0 | 0.3 | 4.6 |
| Discount | Operating | Capital | Cash Flow | Cash Flow | | Gas Raw | MMCF | 0.0 | 0.0 | | |
| Rate | Income | Invest | | | | | | | | | |
| (%) | M$ | M$ | M$ | M$ | | Gas Sales | MMCF | 0.0 | 0.0 | 0.0 | 0.0 |
| | | | | | | NGL | MSTB | 0.0 | 0.0 | 0.0 | 0.0 |
| 0.0 | 184.1 | 8.8 | 175.4 | 126.3 | | Pentane | MSTB | 0.0 | 0.0 | 0.0 | 0.0 |
| 5.0 | 165.5 | 6.7 | 158.8 | 114.7 | | Butane | MSTB | 0.0 | 0.0 | 0.0 | 0.0 |
| 10.0 | 149.8 | 5.2 | 144.7 | 104.7 | | Propane | MSTB | 0.0 | 0.0 | 0.0 | 0.0 |
| | | | | | | Ethane | MSTB | 0.0 | 0.0 | 0.0 | 0.0 |
| 15.0 | 136.5 | 4.1 | 132.4 | 96.0 | | Sulphur | MLT | 0.0 | 0.0 | 0.0 | 0.0 |
| 20.0 | 125.0 | 3.2 | 121.8 | 88.5 | | BOE | MSTB | 19.9 | 5.0 | 0.3 | 4.6 |
32
Table II-3 Proved Producing Reserves and Net Present Values of the 22/13-06-50-25 W3M Well
Constant Case
| | |
| | EANexus | File |
| C:\EANexus\Case\ALBERTA STA | | |
| ALBERTA STAR DEVELOPMENT LTD. | Time | 06/03/2013 12:20:49 |
| PM | | |
| | Version | EANexus Ver 2.7.2.0 |
| | | | | | |
| 22/13-06-050-25W3/0 | | | Economic Indicators | Before Tax | After-tax |
| McLaren Zone | | | | | | |
| CONSTANT PRICE | | | Internal Rate of Return (%) | 800.0 | 800.0 |
| | | | Mod Int Rate of Return (%) | 302.7 | 226.2 |
| Reserve Category: | Proven Producing | Pay Out | Yr | 0.0 | 0.0 |
| Province: | Sask | Field: Landrose | ROI Undisc | $/$ | 10.11 | 7.29 |
| Reversion Pt | No Reversion | ROI Disc @10% | $/$ | 8.36 | 6.07 |
| | CORPORATE YEAR END | NPI Disc @10% | $/BOE | 23.21 | 16.85 |
| | | | | | | | | | | | | |
| Evaluation Interest Summary |
| | | | Oil Production | | Total | Operating | | | B Tax | Tax | A Tax |
| | | | Rate | Volume | Price | Revenue | Expense | Burden | Capital | Cash Flow | | Cash Flow |
| Year | Mo | Wells | BBL/D | MSTB | $/BBL | M$ | M$ | $/BBL | M$ | M$ | M$ | M$ | M$ |
| 2012 | 1 | 1 | 8.4 | 0.3 | 63.90 | 16.3 | 3.9 | 15.28 | 3.0 | 0.0 | 9.4 | 2.4 | 7.0 |
| 2013 | 12 | 1 | 6.8 | 2.5 | 63.90 | 157.8 | 44.1 | 17.86 | 25.7 | 0.0 | 88.0 | 22.5 | 65.5 |
| 2014 | 12 | 1 | 4.6 | 1.7 | 63.90 | 107.0 | 40.5 | 24.20 | 12.9 | 0.0 | 53.6 | 13.8 | 39.8 |
| 2015 | 12 | 1 | 3.1 | 1.1 | 63.90 | 72.5 | 38.1 | 33.57 | 3.9 | 0.0 | 30.5 | 8.1 | 22.5 |
| 2016 | 12 | 1 | 2.1 | 0.8 | 63.90 | 49.2 | 36.5 | 47.36 | 0.0 | 17.5 | -4.8 | 2.5 | -7.3 |
| SubTotal | | | 6.3 | | 402.9 | 163.1 | | 45.4 | 17.5 | 176.9 | 49.3 | 127.6 |
| Remainder | | | 0.0 | | 0.0 | 0.0 | | 0.0 | 0.0 | 0.0 | 0.0 | 0.0 |
| Total | | | | 6.3 | | 402.9 | 163.1 | 25.87 | 45.4 | 17.5 | 176.9 | 49.3 | 127.6 |
| | | | | | | | | | | |
| | | Before Tax | | After Tax | | | | Gross | W.I. | Royalty | Net |
| | | | | | | Oil | MSTB | 12.6 | 6.3 | 0.7 | 5.6 |
| Discount | Operating | Capital | Cash Flow | Cash Flow | | Gas Raw | MMCF | 0.0 | 0.0 | | |
| Rate | Income | Invest | | | | | | | | | |
| (%) | M$ | M$ | M$ | M$ | | Gas Sales | MMCF | 0.0 | 0.0 | 0.0 | 0.0 |
| | | | | | | NGL | MSTB | 0.0 | 0.0 | 0.0 | 0.0 |
| 0.0 | 194.4 | 17.5 | 176.9 | 127.6 | | Pentane | MSTB | 0.0 | 0.0 | 0.0 | 0.0 |
| 5.0 | 174.5 | 14.1 | 160.4 | 116.1 | | Butane | MSTB | 0.0 | 0.0 | 0.0 | 0.0 |
| 10.0 | 157.7 | 11.4 | 146.3 | 106.3 | | Propane | MSTB | 0.0 | 0.0 | 0.0 | 0.0 |
| | | | | | | Ethane | MSTB | 0.0 | 0.0 | 0.0 | 0.0 |
| 15.0 | 143.5 | 9.3 | 134.2 | 97.7 | | Sulphur | MLT | 0.0 | 0.0 | 0.0 | 0.0 |
| 20.0 | 131.3 | 7.7 | 123.6 | 90.2 | | BOE | MSTB | 12.6 | 6.3 | 0.7 | 5.6 |
33
Table II-4 Proved Producing Reserves and Net Present Values of the 31/13-06-50-25 W3M Well Constant Case
| | |
| | EANexus | File |
| C:\EANexus\Case\ALBERTA STA | | |
| ALBERTA STAR DEVELOPMENT LTD. | Time | 06/03/2013 12:20:50 |
| PM | | |
| | Version | EANexus Ver 2.7.2.0 |
| | | | | | |
| 31/13-06-050-25W3/0 | | | Economic Indicators | Before Tax | After-tax |
| Waseca | | | | | | |
| CONSTANT PRICE | | | Internal Rate of Return (%) | 800.0 | 800.0 |
| | | | Mod Int Rate of Return (%) | 800.0 | 753.8 |
| Reserve Category: | Proven Producing | Pay Out | Yr | 0.0 | 0.0 |
| Province: | Sask | Field: Landrose | ROI Undisc | $/$ | 13.89 | 10.08 |
| Reversion Pt | No Reversion | ROI Disc @10% | $/$ | 12.32 | 8.96 |
| | CORPORATE YEAR END | NPI Disc @10% | $/BOE | 32.92 | 23.95 |
| | | | | | | | | | | | | |
| Evaluation Interest Summary |
| | | | Oil Production | | Total | Operating | | | B Tax | Tax | A Tax |
| | | | Rate | Volume | Price | Revenue | Expense | Burden | Capital | Cash Flow | | Cash Flow |
| Year | Mo | Wells | BBL/D | MSTB | $/BBL | M$ | M$ | $/BBL | M$ | M$ | M$ | M$ | M$ |
| 2012 | 1 | 1 | 35.0 | 1.1 | 63.90 | 68.1 | 7.5 | 7.08 | 17.2 | 0.0 | 43.3 | 10.8 | 32.5 |
| 2013 | 12 | 1 | 13.4 | 4.9 | 63.90 | 312.5 | 55.0 | 11.25 | 42.6 | 0.0 | 214.9 | 55.9 | 159.0 |
| 2014 | 12 | 1 | 1.6 | 0.6 | 63.90 | 38.0 | 35.7 | 59.96 | 0.0 | 17.5 | -15.2 | 0.0 | -15.2 |
| SubTotal | | | 6.6 | | 418.5 | 98.2 | | 59.8 | 17.5 | 243.1 | 66.7 | 176.3 |
| Remainder | | | 0.0 | | 0.0 | 0.0 | | 0.0 | 0.0 | 0.0 | 0.0 | 0.0 |
| Total | | | | 6.6 | | 418.5 | 98.2 | 15.00 | 59.8 | 17.5 | 243.1 | 66.7 | 176.3 |
| | | | | | | | | | | |
| | Before Tax | After Tax | | | | Gross | W.I. | Royalty | Net |
| | | | | | | Oil | MSTB | 13.1 | 6.6 | 0.9 | 5.6 |
| Discount | Operating | Capital | Cash Flow | Cash Flow | | Gas Raw | MMCF | 0.0 | 0.0 | | |
| Rate | Income | Invest | | | | | | | | | |
| (%) | M$ | M$ | M$ | M$ | | Gas Sales | MMCF | 0.0 | 0.0 | 0.0 | 0.0 |
| | | | | | | NGL | MSTB | 0.0 | 0.0 | 0.0 | 0.0 |
| 0.0 | 260.6 | 17.5 | 243.1 | 176.3 | | Pentane | MSTB | 0.0 | 0.0 | 0.0 | 0.0 |
| 5.0 | 244.1 | 15.5 | 228.6 | 166.1 | | Butane | MSTB | 0.0 | 0.0 | 0.0 | 0.0 |
| 10.0 | 229.4 | 13.8 | 215.6 | 156.9 | | Propane | MSTB | 0.0 | 0.0 | 0.0 | 0.0 |
| | | | | | | Ethane | MSTB | 0.0 | 0.0 | 0.0 | 0.0 |
| 15.0 | 216.3 | 12.3 | 204.0 | 148.5 | | Sulphur | MLT | 0.0 | 0.0 | 0.0 | 0.0 |
| 20.0 | 204.5 | 11.1 | 193.4 | 141.0 | | BOE | MSTB | 13.1 | 6.6 | 0.9 | 5.6 |
34
Table II-5 Proved Producing Reserves and Net Present Values of the 11/06-12-50-26 W3M Well Constant Case
| | |
| EANexus | File | |
| C:\EANexus\Case\ALBERTA STA | | |
| ALBERTA STAR DEVELOPMENT LTD. | Time | 06/03/2013 12:20:50 |
| PM | | |
| | Version | EANexus Ver 2.7.2.0 |
| | | | | | |
| 11/06-12-050-26W3/0 | | | Economic Indicators | Before Tax | After-tax |
| Lloydminster | | | | | | |
| On Stream: January 2012 | Internal Rate of Return (%) | 800.0 | 800.0 |
| CONSTANT PRICE | | | | | | |
| | | | Mod Int Rate of Return (%) | 89.8 | 38.2 |
| Reserve Category: | Proven Producing | Pay Out | Yr | 0.0 | 0.0 |
| Province: | Sask | Field: Landrose | ROI Undisc | $/$ | 1.07 | 0.40 |
| Reversion Pt | No Reversion | ROI Disc @10% | $/$ | 1.07 | 0.48 |
| | CORPORATE YEAR END | NPI Disc @10% | $/BOE | 10.53 | 4.74 |
| | | | | | | | | | | | | |
| Evaluation Interest Summary |
| | | | Oil Production | | Total | Operating | | | B Tax | Tax | A Tax |
| | | | Rate | Volume | Price | Revenue | Expense | Burden | Capital | Cash Flow | | Cash Flow |
| Year | Mo | Wells | BBL/D | MSTB | $/BBL | M$ | M$ | $/BBL | M$ | M$ | M$ | M$ | M$ |
| 2012 | 1 | 1 | 2.7 | 0.1 | 63.90 | 5.3 | 1.7 | 21.17 | 0.2 | 0.0 | 3.3 | 0.9 | 2.4 |
| 2013 | 12 | 1 | 1.6 | 0.6 | 63.90 | 38.0 | 19.2 | 32.23 | 0.3 | 0.0 | 18.5 | 5.0 | 13.5 |
| 2014 | 12 | 1 | 0.6 | 0.2 | 63.90 | 13.7 | 17.5 | 81.24 | 0.0 | 8.8 | -12.5 | 0.0 | -12.5 |
| SubTotal | | | 0.9 | | 57.0 | 38.4 | | 0.5 | 8.8 | 9.4 | 5.9 | 3.5 |
| Remainder | | | 0.0 | | 0.0 | 0.0 | | 0.0 | 0.0 | 0.0 | 0.0 | 0.0 |
| Total | | | | 0.9 | | 57.0 | 38.4 | 43.02 | 0.5 | 8.8 | 9.4 | 5.9 | 3.5 |
| | | | | | | | | | | |
| | Before Tax | After Tax | | | | Gross | W.I. | Royalty | Net |
| | | | | | | Oil | MSTB | 3.6 | 0.9 | 0.0 | 0.9 |
| Discount | Operating | Capital | Cash Flow | Cash Flow | | Gas Raw | MMCF | 0.0 | 0.0 | | |
| Rate | Income | Invest | | | | | | | | | |
| (%) | M$ | M$ | M$ | M$ | | Gas Sales | MMCF | 0.0 | 0.0 | 0.0 | 0.0 |
| | | | | | | NGL | MSTB | 0.0 | 0.0 | 0.0 | 0.0 |
| 0.0 | 18.1 | 8.8 | 9.4 | 3.5 | | Pentane | MSTB | 0.0 | 0.0 | 0.0 | 0.0 |
| 5.0 | 17.2 | 7.7 | 9.4 | 3.9 | | Butane | MSTB | 0.0 | 0.0 | 0.0 | 0.0 |
| 10.0 | 16.3 | 6.9 | 9.4 | 4.2 | | Propane | MSTB | 0.0 | 0.0 | 0.0 | 0.0 |
| | | | | | | Ethane | MSTB | 0.0 | 0.0 | 0.0 | 0.0 |
| 15.0 | 15.5 | 6.2 | 9.3 | 4.5 | | Sulphur | MLT | 0.0 | 0.0 | 0.0 | 0.0 |
| 20.0 | 14.8 | 5.5 | 9.2 | 4.6 | | BOE | MSTB | 3.6 | 0.9 | 0.0 | 0.9 |
35
Table II-6 Proved Producing Reserves and Net Present Values of the 31/14-06-50-25 W3M Well Constant Case
| | |
| EANexus | File | |
| C:\EANexus\Case\ALBERTA STA | | |
| ALBERTA STAR DEVELOPMENT LTD. | Time | 06/03/2013 12:20:50 |
| PM | | |
| | Version | EANexus Ver 2.7.2.0 |
| | | | | | |
| 31/14-06-050-25W3/0 | | | Economic Indicators | Before Tax | After-tax |
| McLaren Zone | | | | | | |
| CONSTANT PRICE | | | Internal Rate of Return (%) | 800.0 | 800.0 |
| | | | Mod Int Rate of Return (%) | 228.7 | 161.5 |
| Reserve Category: | Proven Producing | Pay Out | Yr | 0.0 | 0.0 |
| Province: | Sask | Field: Landrose | ROI Undisc | $/$ | 5.21 | 3.59 |
| Reversion Pt | No Reversion | ROI Disc @10% | $/$ | 4.55 | 3.16 |
| | CORPORATE YEAR END | NPI Disc @10% | $/BOE | 21.54 | 14.99 |
| | | | | | | | | | | | | |
| Evaluation Interest Summary |
| | | | Oil Production | | Total | Operating | | | B Tax | Tax | A Tax |
| | | | Rate | Volume | Price | Revenue | Expense | Burden | Capital | Cash Flow | | Cash Flow |
| Year | Mo | Wells | BBL/D | MSTB | $/BBL | M$ | M$ | $/BBL | M$ | M$ | M$ | M$ | M$ |
| 2012 | 1 | 1 | 3.3 | 0.1 | 63.90 | 6.4 | 1.8 | 18.25 | 0.5 | 0.0 | 4.1 | 1.1 | 3.0 |
| 2013 | 12 | 1 | 2.5 | 0.9 | 63.90 | 57.5 | 20.6 | 22.83 | 2.9 | 0.0 | 34.1 | 9.2 | 24.9 |
| 2014 | 12 | 1 | 1.5 | 0.5 | 63.90 | 34.0 | 18.9 | 35.49 | 0.8 | 0.0 | 14.3 | 3.9 | 10.4 |
| 2015 | 12 | 1 | 0.9 | 0.3 | 63.90 | 20.1 | 17.9 | 56.88 | 0.4 | 8.8 | -6.9 | 0.0 | -7.0 |
| SubTotal | | | 1.8 | | 118.1 | 59.2 | | 4.5 | 8.8 | 45.6 | 14.2 | 31.4 |
| Remainder | | | 0.0 | | 0.0 | 0.0 | | 0.0 | 0.0 | 0.0 | 0.0 | 0.0 |
| Total | | | | 1.8 | | 118.1 | 59.2 | 32.04 | 4.5 | 8.8 | 45.6 | 14.2 | 31.4 |
| | | | | | | | | | | |
| | Before Tax | After Tax | | | | Gross | W.I. | Royalty | Net |
| | | | | | | Oil | MSTB | 7.4 | 1.8 | 0.0 | 1.8 |
| Discount | Operating | Capital | Cash Flow | Cash Flow | | Gas Raw | MMCF | 0.0 | 0.0 | | |
| Rate | Income | Invest | | | | | | | | | |
| (%) | M$ | M$ | M$ | M$ | | Gas Sales | MMCF | 0.0 | 0.0 | 0.0 | 0.0 |
| | | | | | | NGL | MSTB | 0.0 | 0.0 | 0.0 | 0.0 |
| 0.0 | 54.3 | 8.8 | 45.6 | 31.4 | | Pentane | MSTB | 0.0 | 0.0 | 0.0 | 0.0 |
| 5.0 | 49.9 | 7.4 | 42.5 | 29.5 | | Butane | MSTB | 0.0 | 0.0 | 0.0 | 0.0 |
| 10.0 | 46.1 | 6.3 | 39.8 | 27.7 | | Propane | MSTB | 0.0 | 0.0 | 0.0 | 0.0 |
| | | | | | | Ethane | MSTB | 0.0 | 0.0 | 0.0 | 0.0 |
| 15.0 | 42.7 | 5.4 | 37.3 | 26.1 | | Sulphur | MLT | 0.0 | 0.0 | 0.0 | 0.0 |
| 20.0 | 39.7 | 4.6 | 35.1 | 24.6 | | BOE | MSTB | 7.4 | 1.8 | 0.0 | 1.8 |
36
Table II-7 Proved + Probable Additional Reserves and Net Present Values 4 Wells in Section 11/01-48-24 W3M Constant Case
| | |
| EANexus | File | |
| C:\EANexus\Case\ALBERTA STA | | |
| ALBERTA STAR DEVELOPMENT LTD. | Time | 06/03/2013 12:41:02 |
| PM | | |
| | Version | EANexus Ver 2.7.2.0 |
| | | | | | |
| MAIDSTONE PROPERTY SASKATCHEWAN | Economic Indicators | Before Tax | After-tax |
| 4 Wells in Sec 01-048-24W3/0 | | | | | |
| McLaren | | | Internal Rate of Return (%) | 800.0 | 800.0 |
| CONSTANT PRICE | | | | | | |
| | | | Mod Int Rate of Return (%) | 48.5 | 28.5 |
| Reserve Category: | Total Proven Plus Probable Additional | Pay Out | Yr | 0.0 | 0.0 |
| Province: | Sask | Field: Maidstone | ROI Undisc | $/$ | 1.36 | 0.77 |
| Reversion Pt | No Reversion | ROI Disc @10% | $/$ | 1.24 | 0.76 |
| | CORPORATE YEAR END | NPI Disc @10% | $/BOE | 5.80 | 3.57 |
| | | | | | | | | | | | | |
| Evaluation Interest Summary |
| | | | Oil Production | | Total | Operating | | | B Tax | Tax | A Tax |
| | | | Rate | Volume | Price | Revenue | Expense | Burden | Capital | Cash Flow | | Cash Flow |
| Year | Mo Wells | BBL/D | MSTB | $/BBL | M$ | M$ | $/BBL | M$ | M$ | M$ | M$ | M$ |
| 2012 | 1 | 3 | 9.0 | 0.3 | 64.94 | 17.9 | 9.8 | 35.73 | 3.2 | 0.0 | 4.8 | 1.3 | 3.5 |
| 2013 | 12 | 3 | 8.6 | 3.2 | 64.94 | 204.9 | 117.5 | 37.23 | 36.9 | 0.0 | 50.5 | 13.6 | 36.9 |
| 2014 | 12 | 3 | 7.8 | 2.9 | 64.94 | 185.7 | 116.6 | 40.76 | 33.4 | 0.0 | 35.7 | 9.6 | 26.1 |
| 2015 | 12 | 3 | 7.1 | 2.6 | 64.94 | 168.5 | 115.8 | 44.62 | 30.3 | 0.0 | 22.4 | 6.0 | 16.4 |
| 2016 | 12 | 3 | 6.5 | 2.4 | 64.94 | 152.9 | 115.1 | 48.86 | 27.5 | 52.5 | -42.2 | 0.0 | -42.2 |
| SubTotal | | | 11.2 | | 729.9 | 474.7 | | 131.4 | 52.5 | 71.3 | 30.6 | 40.7 |
| Remainder | | | 0.0 | | 0.0 | 0.0 | | 0.0 | 0.0 | 0.0 | 0.0 | 0.0 |
| Total | | | | 11.2 | | 729.9 | 474.7 | 42.23 | 131.4 | 52.5 | 71.3 | 30.6 | 40.7 |
| | | | | | | | | | | |
| | Before Tax | After Tax | | | | Gross | W.I. | Royalty | Net |
| | | | | | | Oil | MSTB | 22.5 | 11.2 | 0.7 | 10.5 |
| Discount | Operating | Capital | Cash Flow | Cash Flow | | Gas Raw | MMCF | 0.0 | 0.0 | | |
| Rate | Income | Invest | | | | | | | | | |
| (%) | M$ | M$ | M$ | M$ | | Gas Sales | MMCF | 0.0 | 0.0 | 0.0 | 0.0 |
| | | | | | | NGL | MSTB | 0.0 | 0.0 | 0.0 | 0.0 |
| 0.0 | 123.8 | 52.5 | 71.3 | 40.7 | | Pentane | MSTB | 0.0 | 0.0 | 0.0 | 0.0 |
| 5.0 | 110.5 | 42.2 | 68.3 | 40.7 | | Butane | MSTB | 0.0 | 0.0 | 0.0 | 0.0 |
| 10.0 | 99.3 | 34.2 | 65.1 | 40.1 | | Propane | MSTB | 0.0 | 0.0 | 0.0 | 0.0 |
| | | | | | | Ethane | MSTB | 0.0 | 0.0 | 0.0 | 0.0 |
| 15.0 | 89.9 | 28.0 | 61.9 | 39.1 | | Sulphur | MLT | 0.0 | 0.0 | 0.0 | 0.0 |
| 20.0 | 81.9 | 23.1 | 58.8 | 37.9 | | BOE | MSTB | 22.5 | 11.2 | 0.7 | 10.5 |
37
Table II-8 Proved + Probable Additional Reserves and Net Present Values of the 31/12-06-50-25 W3M Well Constant Case
| | |
| EANexus | File | |
| C:\EANexus\Case\ALBERTA STA | | |
| ALBERTA STAR DEVELOPMENT LTD. | Time | 06/03/2013 |
| 12:41:02 PM | | |
| | Version | EANexus Ver |
| 2.7.2.0 | | |
| | | | | | |
| 31/12-06-050-25W3/0 | | | Economic Indicators | Before Tax | After-tax |
| McLaren Zone | | | | | | |
| CONSTANT PRICE | | | Internal Rate of Return (%) | 800.0 | 800.0 |
| | | | Mod Int Rate of Return (%) | 647.5 | 480.5 |
| Reserve Category: | Total Proven Plus Probable Additional | Pay Out | Yr | 0.0 | 0.0 |
| Province: | Sask | Field: Landrose | ROI Undisc | $/$ | 32.34 | 23.48 |
| Reversion Pt | No Reversion | ROI Disc @10% | $/$ | 25.08 | 18.28 |
| | CORPORATE YEAR END | NPI Disc @10% | $/BOE | 29.59 | 21.56 |
| | | | | | | | | | | | | |
| Evaluation Interest Summary |
| | | | Oil Production | | Total | Operating | | | B Tax | Tax | A Tax |
| | | | Rate | Volume | Price | Revenue | Expense | Burden | Capital Cash Flow | | Cash Flow |
| Year | Mo Wells | BBL/D | MSTB | $/BBL | M$ | M$ | $/BBL | M$ | M$ | M$ | M$ | M$ |
| 2012 | 1 | 1 | 7.3 | 0.2 | 63.90 | 14.2 | 2.3 | 10.12 | 2.5 | 0.0 | 9.5 | 2.5 | 7.0 |
| 2013 | 12 | 1 | 6.1 | 2.2 | 63.90 | 142.5 | 25.0 | 11.23 | 20.1 | 0.0 | 97.3 | 25.8 | 71.6 |
| 2014 | 12 | 1 | 4.4 | 1.6 | 63.90 | 103.0 | 22.3 | 13.80 | 10.4 | 0.0 | 70.4 | 18.8 | 51.6 |
| 2015 | 12 | 1 | 3.2 | 1.2 | 63.90 | 74.3 | 20.2 | 17.40 | 5.1 | 0.0 | 48.9 | 13.2 | 35.7 |
| 2016 | 12 | 1 | 2.3 | 0.8 | 63.90 | 53.5 | 18.8 | 22.41 | 2.5 | 0.0 | 32.3 | 8.7 | 23.6 |
| 2017 | 12 | 1 | 1.7 | 0.6 | 63.90 | 38.5 | 17.7 | 29.40 | 1.1 | 0.0 | 19.7 | 5.3 | 14.4 |
| 2018 | 12 | 1 | 1.2 | 0.4 | 63.90 | 27.8 | 17.0 | 38.98 | 0.6 | 0.0 | 10.3 | 2.8 | 7.5 |
| 2019 | 12 | 1 | 0.9 | 0.3 | 63.90 | 20.1 | 16.4 | 52.12 | 0.4 | 8.8 | -5.4 | 0.4 | -5.9 |
| SubTotal | | | 7.4 | | 474.0 | 139.6 | | 42.7 | 8.8 | 282.9 | 77.5 | 205.4 |
| Remainder | | | 0.0 | | 0.0 | 0.0 | | 0.0 | 0.0 | 0.0 | 0.0 | 0.0 |
| Total | | | | 7.4 | | 474.0 | 139.6 | 18.82 | 42.7 | 8.8 | 282.9 | 77.5 | 205.4 |
| | | | | | | | | | | |
| | Before Tax | After Tax | | | | Gross | W.I. | Royalty | Net |
| | | | | | | Oil | MSTB | 29.7 | 7.4 | 0.5 | 6.9 |
| Discount | Operating | Capital | Cash Flow | Cash Flow | | Gas Raw | MMCF | 0.0 | 0.0 | | |
| Rate | Income | Invest | | | | | | | | | |
| (%) | M$ | M$ | M$ | M$ | | Gas Sales | MMCF | 0.0 | 0.0 | 0.0 | 0.0 |
| | | | | | | NGL | MSTB | 0.0 | 0.0 | 0.0 | 0.0 |
| 0.0 | 291.7 | 8.8 | 282.9 | 205.4 | | Pentane | MSTB | 0.0 | 0.0 | 0.0 | 0.0 |
| 5.0 | 254.0 | 6.1 | 248.0 | 180.4 | | Butane | MSTB | 0.0 | 0.0 | 0.0 | 0.0 |
| 10.0 | 223.8 | 4.3 | 219.5 | 160.0 | | Propane | MSTB | 0.0 | 0.0 | 0.0 | 0.0 |
| | | | | | | Ethane | MSTB | 0.0 | 0.0 | 0.0 | 0.0 |
| 15.0 | 199.1 | 3.1 | 196.0 | 143.0 | | Sulphur | MLT | 0.0 | 0.0 | 0.0 | 0.0 |
| 20.0 | 178.6 | 2.2 | 176.4 | 128.8 | | BOE | MSTB | 29.7 | 7.4 | 0.5 | 6.9 |
38
Table II-9 Proved + Probable Additional Reserves and Net Present Values of the 22/13-06-50-25 W3M Well Constant Case
| | |
| EANexus | File | |
| C:\EANexus\Case\ALBERTA STA | | |
| ALBERTA STAR DEVELOPMENT LTD. | Time | 06/03/2013 |
| 12:41:03 PM | | |
| | Version | EANexus Ver |
| 2.7.2.0 | | |
| | | | | | |
| 22/13-06-050-25W3/0 | | | Economic Indicators | Before Tax | After-tax |
| McLaren Zone | | | | | | |
| CONSTANT PRICE | | | Internal Rate of Return (%) | 800.0 | 800.0 |
| | | | Mod Int Rate of Return (%) | 383.0 | 290.1 |
| Reserve Category: | Total Proven Plus Probable Additional | Pay Out | Yr | 0.0 | 0.0 |
| Province: | Sask | Field: Landrose | ROI Undisc | $/$ | 18.23 | 13.28 |
| Reversion Pt | No Reversion | ROI Disc @10% | $/$ | 14.27 | 10.48 |
| | CORPORATE YEAR END | NPI Disc @10% | $/BOE | 23.64 | 17.35 |
| | | | | | | | | | | | | |
| Evaluation Interest Summary |
| | | | Oil Production | | Total | Operating | | | B Tax | Tax | A Tax |
| | | | Rate | Volume | Price | Revenue | Expense | Burden | Capital Cash Flow | | Cash Flow |
| Year | Mo Wells | BBL/D | MSTB | $/BBL | M$ | M$ | $/BBL | M$ | M$ | M$ | M$ | M$ |
| 2012 | 1 | 1 | 9.5 | 0.3 | 63.90 | 18.5 | 3.8 | 13.12 | 3.5 | 0.0 | 11.2 | 2.8 | 8.3 |
| 2013 | 12 | 1 | 8.1 | 3.0 | 63.90 | 189.5 | 43.3 | 14.62 | 33.8 | 0.0 | 112.3 | 28.6 | 83.7 |
| 2014 | 12 | 1 | 6.1 | 2.2 | 63.90 | 142.5 | 40.0 | 17.95 | 22.1 | 0.0 | 80.3 | 20.6 | 59.8 |
| 2015 | 12 | 1 | 4.6 | 1.7 | 63.90 | 106.4 | 37.5 | 22.52 | 12.8 | 0.0 | 56.1 | 14.5 | 41.6 |
| 2016 | 12 | 1 | 3.4 | 1.2 | 63.90 | 79.9 | 35.6 | 28.50 | 5.8 | 0.0 | 38.4 | 10.1 | 28.3 |
| 2017 | 12 | 1 | 2.6 | 0.9 | 63.90 | 59.7 | 34.2 | 36.58 | 0.5 | 0.0 | 25.0 | 6.7 | 18.3 |
| 2018 | 12 | 1 | 1.9 | 0.7 | 63.90 | 45.0 | 33.2 | 47.05 | 0.0 | 0.0 | 11.9 | 3.2 | 8.7 |
| 2019 | 12 | 1 | 1.4 | 0.5 | 63.90 | 33.5 | 32.4 | 61.64 | 0.0 | 17.5 | -16.3 | 0.0 | -16.3 |
| SubTotal | | | 10.6 | | 675.1 | 260.0 | | 78.6 | 17.5 | 319.0 | 86.6 | 232.4 |
| Remainder | | | 0.0 | | 0.0 | 0.0 | | 0.0 | 0.0 | 0.0 | 0.0 | 0.0 |
| Total | | | | 10.6 | | 675.1 | 260.0 | 24.61 | 78.6 | 17.5 | 319.0 | 86.6 | 232.4 |
| | | | | | | | | | | |
| | | Before Tax | | After Tax | | | | Gross | W.I. | Royalty | Net |
| | | | | | | Oil | MSTB | 21.1 | 10.6 | 1.2 | 9.3 |
| Discount | Operating | Capital | Cash Flow | Cash Flow | | Gas Raw | MMCF | 0.0 | 0.0 | | |
| Rate | Income | Invest | | | | | | | | | |
| (%) | M$ | M$ | M$ | M$ | | Gas Sales | MMCF | 0.0 | 0.0 | 0.0 | 0.0 |
| | | | | | | NGL | MSTB | 0.0 | 0.0 | 0.0 | 0.0 |
| 0.0 | 336.5 | 17.5 | 319.0 | 232.4 | | Pentane | MSTB | 0.0 | 0.0 | 0.0 | 0.0 |
| 5.0 | 293.2 | 12.1 | 281.0 | 205.6 | | Butane | MSTB | 0.0 | 0.0 | 0.0 | 0.0 |
| 10.0 | 258.3 | 8.6 | 249.8 | 183.3 | | Propane | MSTB | 0.0 | 0.0 | 0.0 | 0.0 |
| | | | | | | Ethane | MSTB | 0.0 | 0.0 | 0.0 | 0.0 |
| 15.0 | 229.8 | 6.1 | 223.7 | 164.6 | | Sulphur | MLT | 0.0 | 0.0 | 0.0 | 0.0 |
| 20.0 | 206.2 | 4.5 | 201.8 | 148.8 | | BOE | MSTB | 21.1 | 10.6 | 1.2 | 9.3 |
39
Table II-10 Proved + Probable Additional Reserves and Net Present Values of the 31/13-06-50-25 W3M Well Constant Case
| | |
| EANexus | File | |
| C:\EANexus\Case\ALBERTA STA | | |
| ALBERTA STAR DEVELOPMENT LTD. | Time | 06/03/2013 |
| 12:41:03 PM | | |
| | Version | EANexus Ver |
| 2.7.2.0 | | |
| | | | | | |
| 31/13-06-050-25W3/0 | | | Economic Indicators | Before Tax | After-tax |
| Waseca Zone | | | | | | |
| CONSTANT PRICE | | | Internal Rate of Return (%) | 800.0 | 800.0 |
| | | | Mod Int Rate of Return (%) | 800.0 | 800.0 |
| Reserve Category: | Total Proven Plus Probable Additional | Pay Out | Yr | 0.0 | 0.0 |
| Province: | Sask | Field: Landrose | ROI Undisc | $/$ | 25.59 | 18.81 |
| Reversion Pt | No Reversion | ROI Disc @10% | $/$ | 21.99 | 16.20 |
| | CORPORATE YEAR END | NPI Disc @10% | $/BOE | 33.98 | 25.03 |
| | | | | | | | | | | | | |
| Evaluation Interest Summary |
| | | | Oil Production | | Total | Operating | | | B Tax | Tax | A Tax |
| | | | Rate | Volume | Price | Revenue | Expense | Burden | Capital | Cash Flow | | Cash Flow |
| Year | Mo Wells | BBL/D | MSTB | $/BBL | M$ | M$ | $/BBL | M$ | M$ | M$ | M$ | M$ |
| 2012 | 1 | 1 | 37.8 | 1.2 | 63.90 | 73.5 | 7.7 | 6.67 | 19.0 | 0.0 | 46.8 | 11.7 | 35.1 |
| 2013 | 12 | 1 | 21.2 | 7.7 | 63.90 | 493.6 | 64.8 | 8.38 | 100.8 | 0.0 | 328.1 | 83.5 | 244.5 |
| 2014 | 12 | 1 | 6.6 | 2.4 | 63.90 | 153.7 | 40.8 | 16.97 | 7.9 | 0.0 | 104.9 | 27.9 | 77.0 |
| 2015 | 12 | 1 | 2.0 | 0.7 | 63.90 | 47.3 | 33.3 | 45.04 | 0.0 | 18.6 | -4.6 | 2.8 | -7.4 |
| SubTotal | | | 12.0 | | 768.1 | 146.6 | | 127.7 | 18.6 | 475.2 | 125.9 | 349.3 |
| Remainder | | | 0.0 | | 0.0 | 0.0 | | 0.0 | 0.0 | 0.0 | 0.0 | 0.0 |
| Total | | | | 12.0 | | 768.1 | 146.6 | 12.19 | 127.7 | 18.6 | 475.2 | 125.9 | 349.3 |
| | | | | | | | | | | |
| | Before Tax | After Tax | | | | Gross | W.I. | Royalty | Net |
| | | | | | | Oil | MSTB | 24.0 | 12.0 | 2.0 | 10.0 |
| Discount | Operating | Capital | Cash Flow | Cash Flow | | Gas Raw | MMCF | 0.0 | 0.0 | | |
| Rate | Income | Invest | | | | | | | | | |
| (%) | M$ | M$ | M$ | M$ | | Gas Sales | MMCF | 0.0 | 0.0 | 0.0 | 0.0 |
| | | | | | | NGL | MSTB | 0.0 | 0.0 | 0.0 | 0.0 |
| 0.0 | 493.8 | 18.6 | 475.2 | 349.3 | | Pentane | MSTB | 0.0 | 0.0 | 0.0 | 0.0 |
| 5.0 | 455.3 | 15.7 | 439.6 | 323.5 | | Butane | MSTB | 0.0 | 0.0 | 0.0 | 0.0 |
| 10.0 | 421.7 | 13.3 | 408.4 | 300.8 | | Propane | MSTB | 0.0 | 0.0 | 0.0 | 0.0 |
| | | | | | | Ethane | MSTB | 0.0 | 0.0 | 0.0 | 0.0 |
| 15.0 | 392.2 | 11.4 | 380.9 | 280.8 | | Sulphur | MLT | 0.0 | 0.0 | 0.0 | 0.0 |
| 20.0 | 366.2 | 9.8 | 356.4 | 263.0 | | BOE | MSTB | 24.0 | 12.0 | 2.0 | 10.0 |
40
Table II-11 Proved + Probable Additional Reserves and Net Present Values of the 11/06-12-50-26 W3M Well Constant Case
| | |
| EANexus | File | |
| C:\EANexus\Case\ALBERTA STA | | |
| ALBERTA STAR DEVELOPMENT LTD. | Time | 06/03/2013 |
| 12:41:04 PM | | |
| | Version | EANexus Ver |
| 2.7.2.0 | | |
| | | | | | |
| 11/06-12-050-26W3/0 | | | Economic Indicators | Before Tax | After-tax |
| Lloydminster | | | | | | |
| On Stream: January 2012 | | Internal Rate of Return (%) | 800.0 | 800.0 |
| CONSTANT PRICE | | | | | | |
| | | | Mod Int Rate of Return (%) | 166.1 | 111.2 |
| Reserve Category: | Total Proven Plus Probable Additional | Pay Out | Yr | 0.0 | 0.0 |
| Province: | Sask | Field: Landrose | ROI Undisc | $/$ | 2.97 | 1.96 |
| Reversion Pt | No Reversion | ROI Disc @10% | $/$ | 2.65 | 1.77 |
| | CORPORATE YEAR END | NPI Disc @10% | $/BOE | 20.56 | 13.73 |
| | | | | | | | | | | | | |
| Evaluation Interest Summary |
| | | | Oil Production | | Total | Operating | | | B Tax | Tax | A Tax |
| | | | Rate | Volume | Price | Revenue | Expense | Burden | Capital | Cash Flow | | Cash Flow |
| Year | Mo | Wells | BBL/D | MSTB | $/BBL | M$ | M$ | $/BBL | M$ | M$ | M$ | M$ | M$ |
| 2012 | 1 | 1 | 2.9 | 0.1 | 63.90 | 5.6 | 1.6 | 18.79 | 0.2 | 0.0 | 3.7 | 1.0 | 2.7 |
| 2013 | 12 | 1 | 1.9 | 0.7 | 63.90 | 45.2 | 18.2 | 25.70 | 0.7 | 0.0 | 26.3 | 7.1 | 19.2 |
| 2014 | 12 | 1 | 0.9 | 0.3 | 63.90 | 21.2 | 16.5 | 49.61 | 0.0 | 8.8 | -4.0 | 0.8 | -4.8 |
| SubTotal | | | 1.1 | | 72.0 | 36.3 | | 1.0 | 8.8 | 26.0 | 8.9 | 17.1 |
| Remainder | | | 0.0 | | 0.0 | 0.0 | | 0.0 | 0.0 | 0.0 | 0.0 | 0.0 |
| Total | | | | 1.1 | | 72.0 | 36.3 | 32.22 | 1.0 | 8.8 | 26.0 | 8.9 | 17.1 |
| | | | | | | | | | | |
| | Before Tax | After Tax | | | | Gross | W.I. | Royalty | Net |
| | | | | | | Oil | MSTB | 4.5 | 1.1 | 0.0 | 1.1 |
| Discount | Operating | Capital | Cash Flow | Cash Flow | | Gas Raw | MMCF | 0.0 | 0.0 | | |
| Rate | Income | Invest | | | | | | | | | |
| (%) | M$ | M$ | M$ | M$ | | Gas Sales | MMCF | 0.0 | 0.0 | 0.0 | 0.0 |
| | | | | | | NGL | MSTB | 0.0 | 0.0 | 0.0 | 0.0 |
| 0.0 | 34.8 | 8.8 | 26.0 | 17.1 | | Pentane | MSTB | 0.0 | 0.0 | 0.0 | 0.0 |
| 5.0 | 32.3 | 7.7 | 24.5 | 16.3 | | Butane | MSTB | 0.0 | 0.0 | 0.0 | 0.0 |
| 10.0 | 30.1 | 6.9 | 23.2 | 15.5 | | Propane | MSTB | 0.0 | 0.0 | 0.0 | 0.0 |
| | | | | | | Ethane | MSTB | 0.0 | 0.0 | 0.0 | 0.0 |
| 15.0 | 28.1 | 6.2 | 22.0 | 14.7 | | Sulphur | MLT | 0.0 | 0.0 | 0.0 | 0.0 |
| 20.0 | 26.4 | 5.5 | 20.9 | 14.1 | | BOE | MSTB | 4.5 | 1.1 | 0.0 | 1.1 |
41
Table II-12 Proved + Probable Additional Reserves and Net Present Values of the 31/14-06-50-25 W3M Well Constant Case
| | |
| EANexus | File | |
| C:\EANexus\Case\ALBERTA STA | | |
| ALBERTA STAR DEVELOPMENT LTD. | Time | 06/03/2013 |
| 12:41:04 PM | | |
| | Version | EANexus Ver |
| 2.7.2.0 | | |
| | | | | | |
| 31/14-06-050-25W3/0 | | | Economic Indicators | Before Tax | After-tax |
| McLaren Zone | | | | | | |
| CONSTANT PRICE | | | Internal Rate of Return (%) | 800.0 | 800.0 |
| | | | Mod Int Rate of Return (%) | 319.8 | 236.3 |
| Reserve Category: | Total Proven Plus Probable Additional | Pay Out | Yr | 0.0 | 0.0 |
| Province: | Sask | Field: Landrose | ROI Undisc | $/$ | 12.13 | 8.64 |
| Reversion Pt | No Reversion | ROI Disc @10% | $/$ | 9.88 | 7.08 |
| | CORPORATE YEAR END | NPI Disc @10% | $/BOE | 25.59 | 18.35 |
| | | | | | | | | | | | | |
| Evaluation Interest Summary |
| | | | Oil Production | | Total | Operating | | | B Tax | Tax | A Tax |
| | | | Rate | Volume | Price | Revenue | Expense | Burden | Capital | Cash Flow | | Cash Flow |
| Year | Mo Wells | BBL/D | MSTB | $/BBL | M$ | M$ | $/BBL | M$ | M$ | M$ | M$ | M$ |
| 2012 | 1 | 1 | 3.6 | 0.1 | 63.90 | 7.0 | 1.7 | 15.86 | 0.6 | 0.0 | 4.7 | 1.3 | 3.5 |
| 2013 | 12 | 1 | 3.1 | 1.1 | 63.90 | 71.4 | 20.0 | 17.92 | 4.6 | 0.0 | 46.8 | 12.6 | 34.1 |
| 2014 | 12 | 1 | 2.2 | 0.8 | 63.90 | 52.1 | 18.7 | 22.90 | 2.3 | 0.0 | 31.1 | 8.4 | 22.7 |
| 2015 | 12 | 1 | 1.6 | 0.6 | 63.90 | 37.7 | 17.7 | 29.92 | 1.1 | 0.0 | 19.0 | 5.1 | 13.9 |
| 2016 | 12 | 1 | 1.2 | 0.4 | 63.90 | 27.6 | 16.9 | 39.18 | 0.6 | 0.0 | 10.1 | 2.7 | 7.4 |
| 2017 | 12 | 1 | 0.9 | 0.3 | 63.90 | 20.0 | 16.4 | 52.50 | 0.4 | 8.8 | -5.6 | 0.4 | -6.0 |
| SubTotal | | | 3.4 | | 215.8 | 91.4 | | 9.5 | 8.8 | 106.1 | 30.5 | 75.6 |
| Remainder | | | 0.0 | | 0.0 | 0.0 | | 0.0 | 0.0 | 0.0 | 0.0 | 0.0 |
| Total | | | | 3.4 | | 215.8 | 91.4 | 27.08 | 9.5 | 8.8 | 106.1 | 30.5 | 75.6 |
| | | | | | | | | | | |
| | Before Tax | After Tax | | | | Gross | W.I. | Royalty | Net |
| | | | | | | Oil | MSTB | 13.5 | 3.4 | 0.1 | 3.3 |
| Discount | Operating | Capital | Cash Flow | Cash Flow | | Gas Raw | MMCF | 0.0 | 0.0 | | |
| Rate | Income | Invest | | | | | | | | | |
| (%) | M$ | M$ | M$ | M$ | | Gas Sales | MMCF | 0.0 | 0.0 | 0.0 | 0.0 |
| | | | | | | NGL | MSTB | 0.0 | 0.0 | 0.0 | 0.0 |
| 0.0 | 114.9 | 8.8 | 106.1 | 75.6 | | Pentane | MSTB | 0.0 | 0.0 | 0.0 | 0.0 |
| 5.0 | 102.2 | 6.7 | 95.5 | 68.3 | | Butane | MSTB | 0.0 | 0.0 | 0.0 | 0.0 |
| 10.0 | 91.6 | 5.2 | 86.4 | 62.0 | | Propane | MSTB | 0.0 | 0.0 | 0.0 | 0.0 |
| | | | | | | Ethane | MSTB | 0.0 | 0.0 | 0.0 | 0.0 |
| 15.0 | 82.8 | 4.1 | 78.7 | 56.6 | | Sulphur | MLT | 0.0 | 0.0 | 0.0 | 0.0 |
| 20.0 | 75.3 | 3.2 | 72.1 | 51.9 | | BOE | MSTB | 13.5 | 3.4 | 0.1 | 3.3 |
42
Appendix A – Conversion Factors and Abbreviations
Conversion Factors
| |
| 1 metre | 3.28 feet |
| 1 cubic metre of gas | 35.31467 cubic feet of gas |
| 1 cubic metre of liquid | 6.28981 barrels |
| 1 kg/sq. cm. | 14.22334 psi |
| 1 hectare (10,000 square metres) | 2.471054 acres |
Abbreviations
| |
| ac | acre |
| AOF | absolute open flow |
| API | American Petroleum Institute |
| bbl | barrel |
| bopd | barrels of oil per day |
| BTU | British Thermal Unit |
| cp | centipose |
| oF | degrees, Fahrenheit |
| oR | degrees, Rankin |
| ft | feet |
| GOR | gas oil ratio |
| KB | Kelly bushing |
| LT | long tonne |
| m | metre |
| Mbbl | thousands of barrels |
| MMbbl | millions of barrels |
| $M | thousand dollars |
| Mcf | thousand cubic feet |
| mD | milli-Darcy |
| MD | measured depth |
| MMcf | million cubic feet |
| ppm | parts per million |
| PVT | pressure-volume-temperature |
| psia | pounds per square inch absolute |
| psig | pounds per square inch gauge |
| rb | reservoir barrel |
| RFT | Repeat formation test |
| scf | standard cubic feet |
| ss | subsea |
| stb | stock tank barrel |
| STOOIP | stock tank original oil-in-place |
| TVD | true vertical depth |
| WI | working interest |
43
AppendixB –ProductionData of theCompany’sWells in theLloydminsterField
5-20-49-1 W4M Well Production Plots
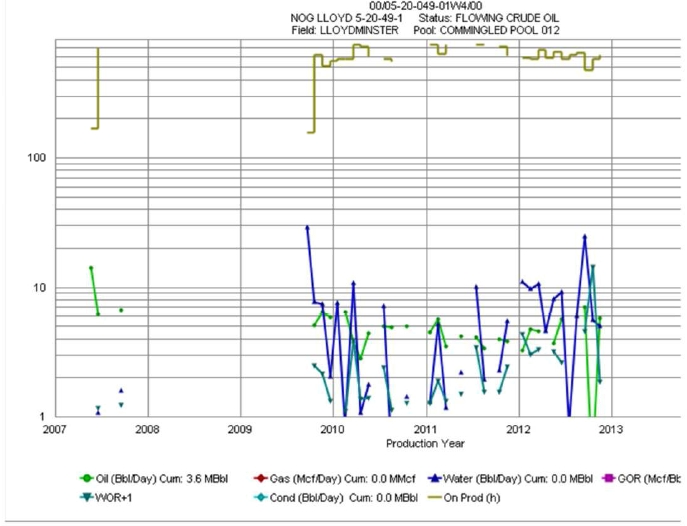
44
12-20-49-1 W4M Well Production Plots
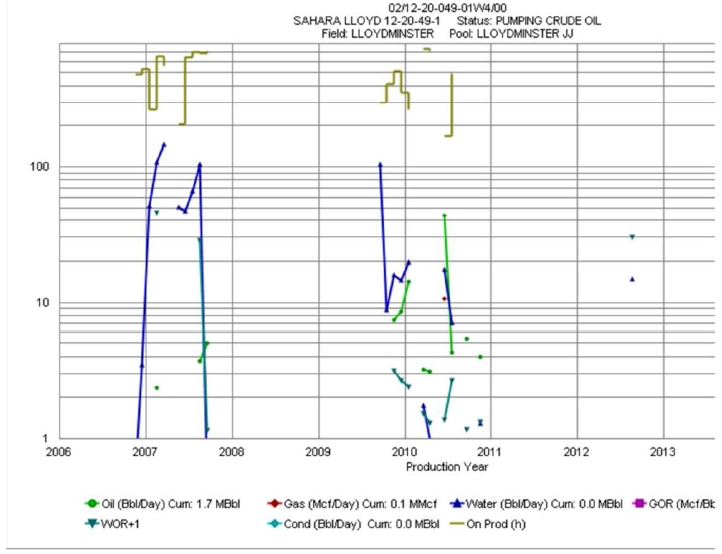
45
12-22-49-1 W4M Well Production Plots
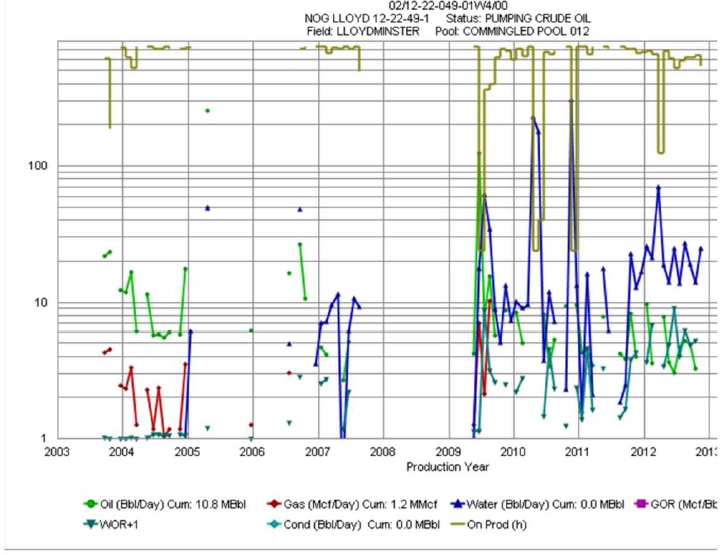
46
16-22-49-1 W4M Well Production Plots
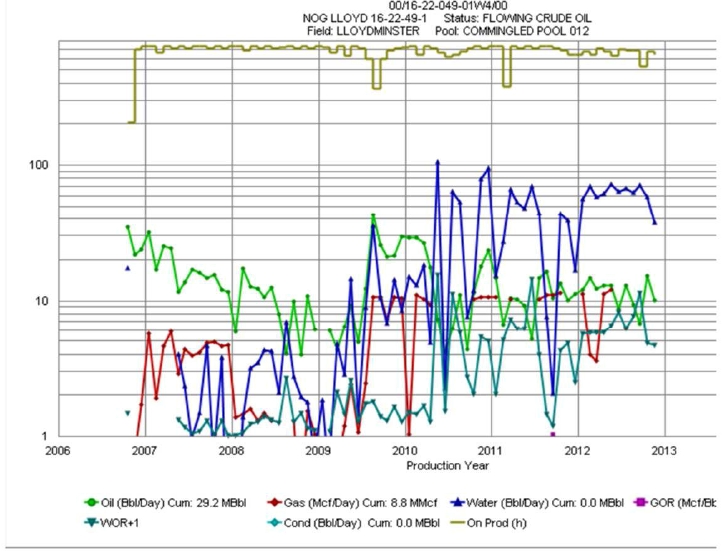
47
10-6-50-1 W4M Well Production Plots

48
15-6-50-1 W4M Well Production Plots
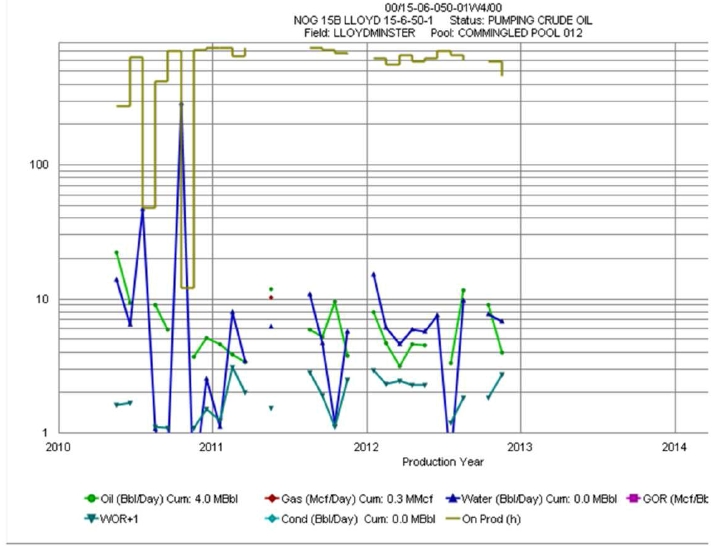
49
16-6-50-1 W4M Well Production Plots
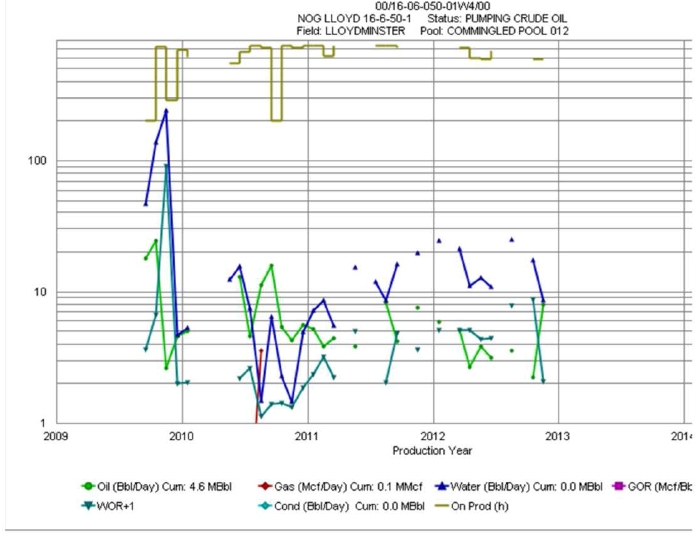
50
3-11-50-2 W4M Well Production Plots
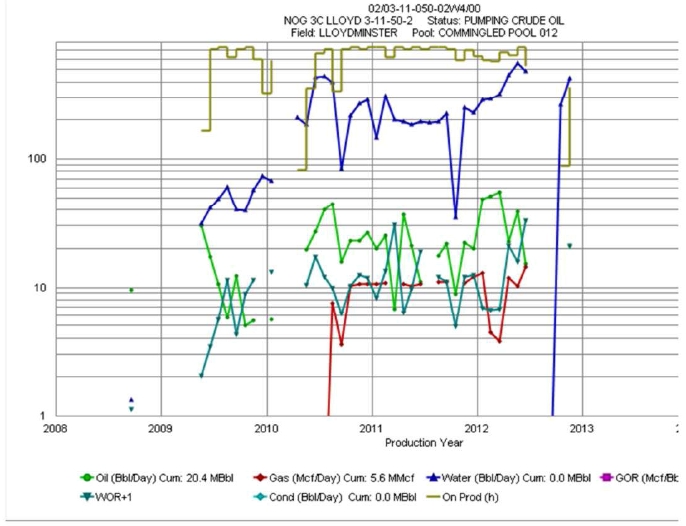
51
3-11-50-2 W4M Well Production Plots
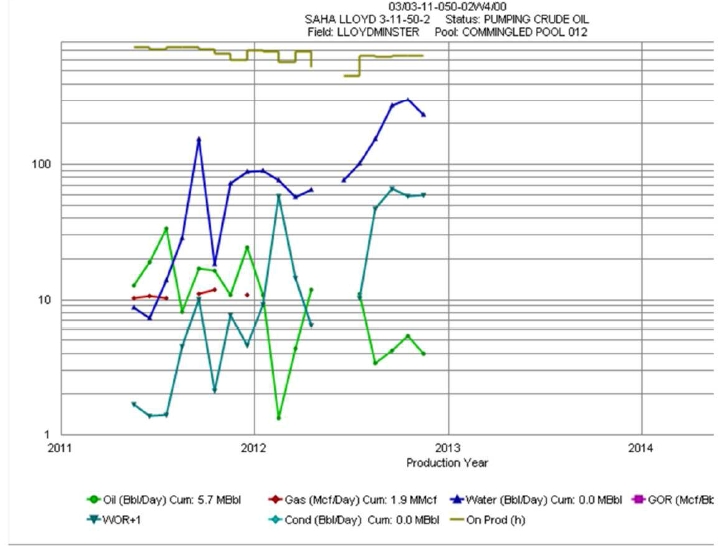
52
12-14-50-2 W4M Well Production Plots
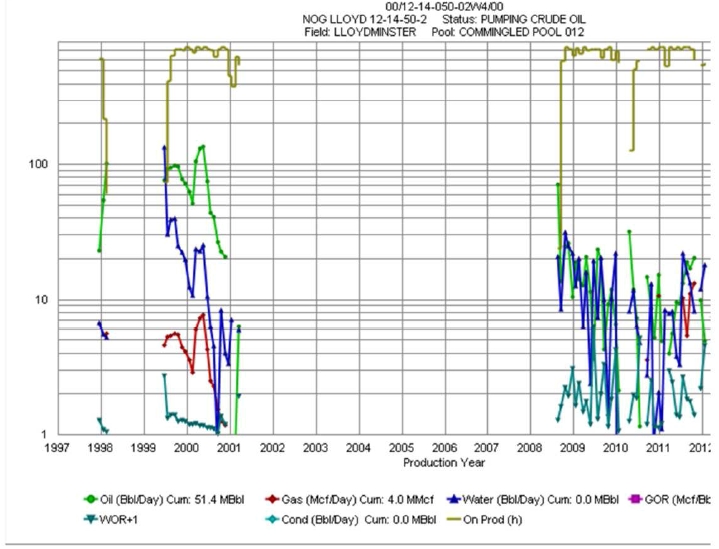
53
12-14-50-2 W4M Well Production Plots
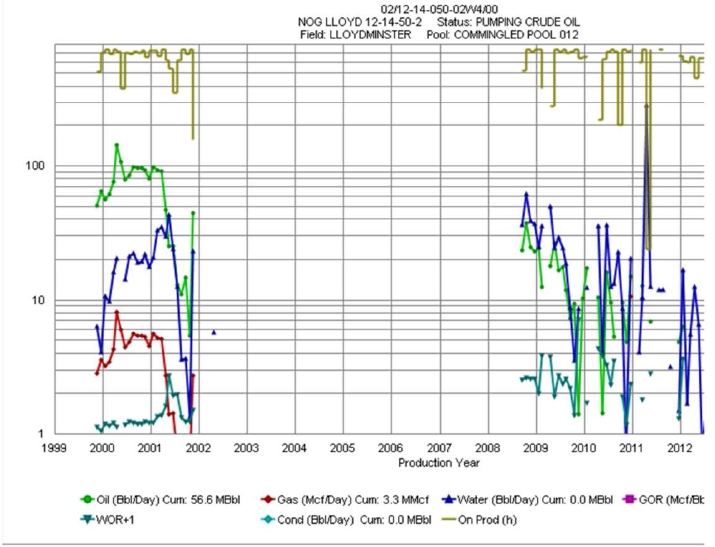
54
13-14-50-2 W4M Well Production Plots
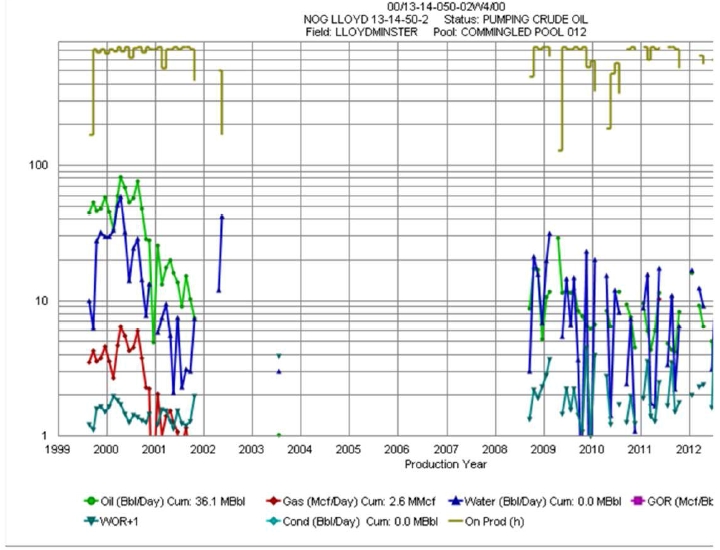
55
15-14-50-2 W4M Well Production Plots
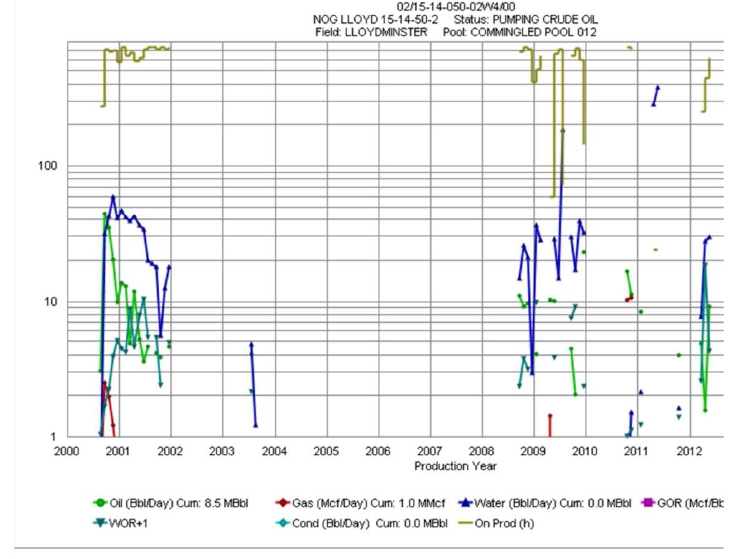
56
9-22-50-2 W4M Well Production Plots
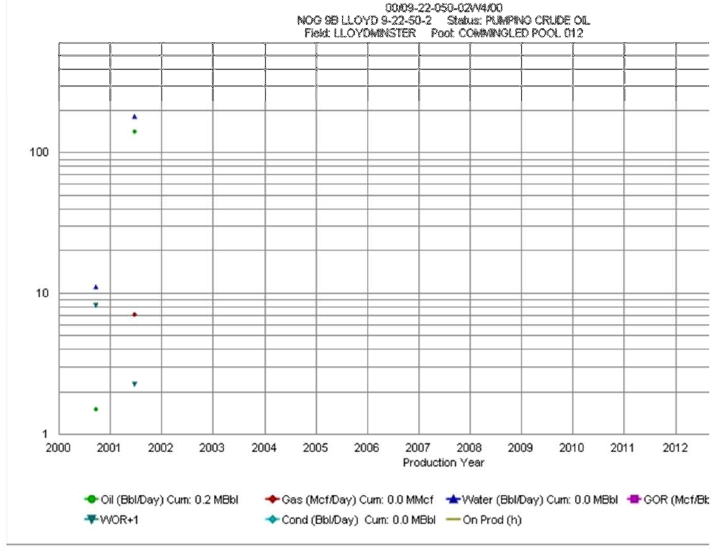
57
9-22-50-2 W4M Well Production Plots
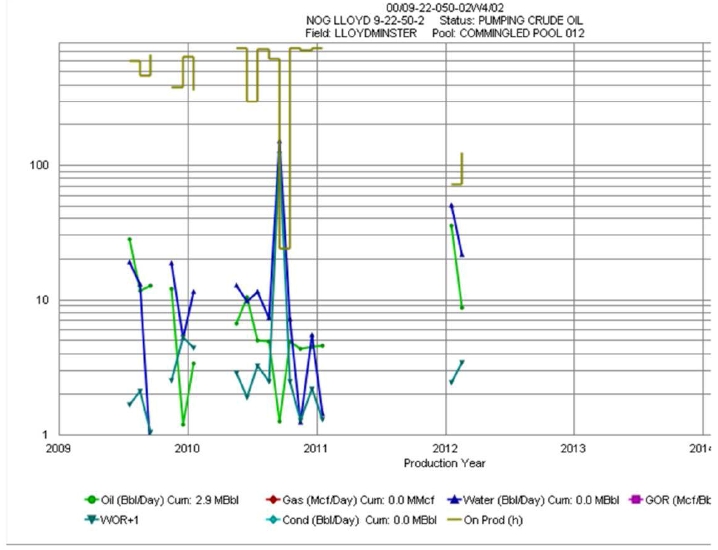
58
10-22-50-2 W4M Well Production Plots
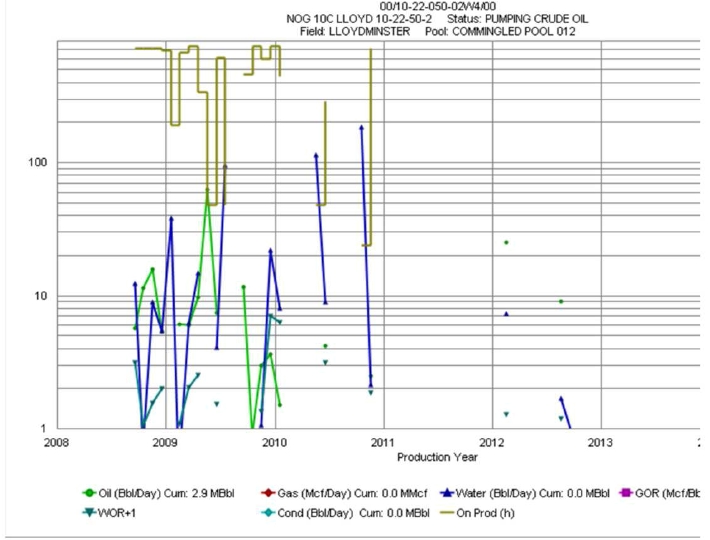
59
10-22-50-2 W4M Well Production Plots
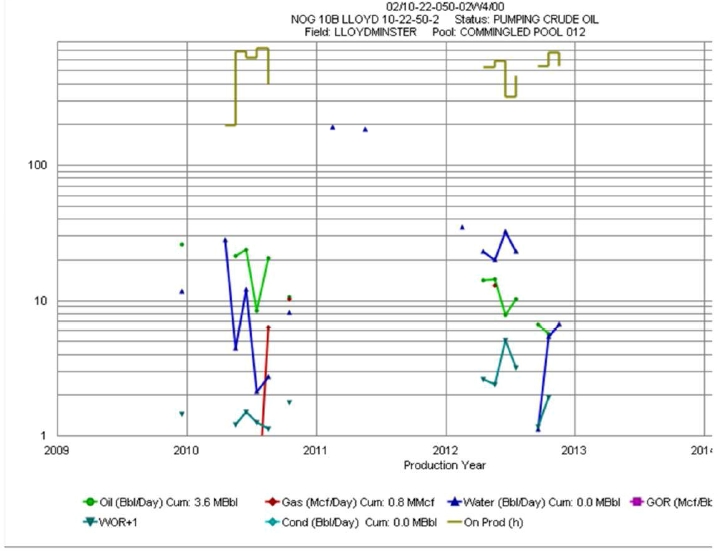
60
4-24-50-2 W4M Well Production Plots
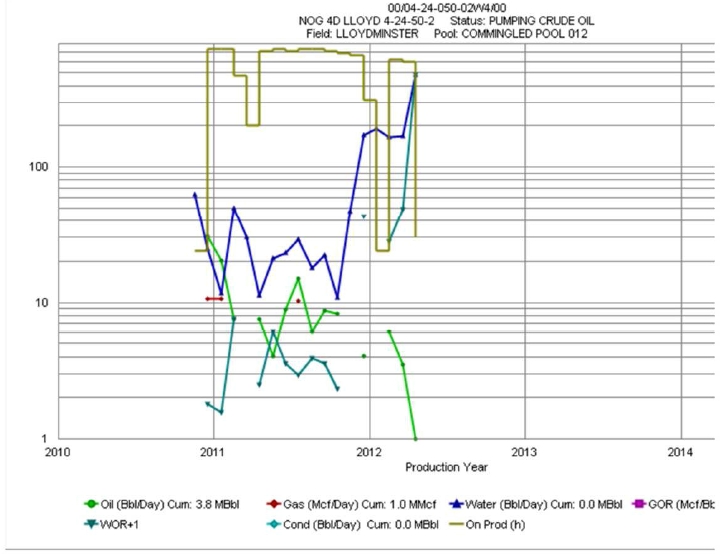
61
6-24-50-2 W4M Well Production Plots
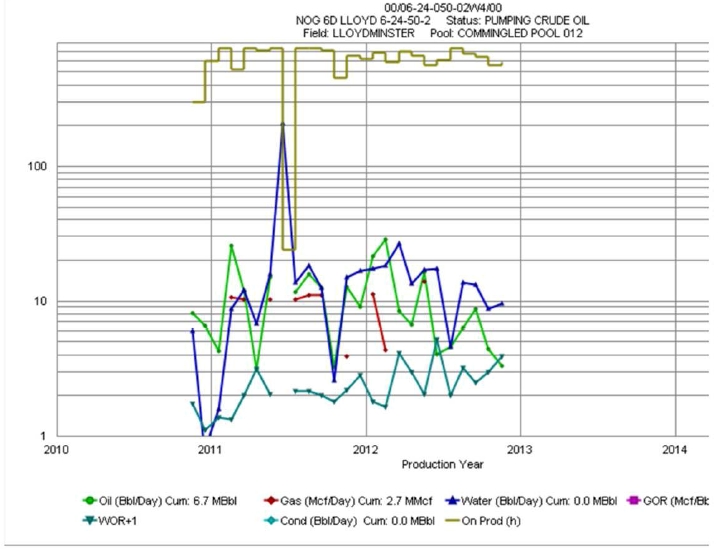
62
AppendixC –ProductionData of theCompany’sWells in theMaidstoneField
9-1-48-24 W3M Well Production Plots

63
10-1-48-24 W3M Well Production Plots
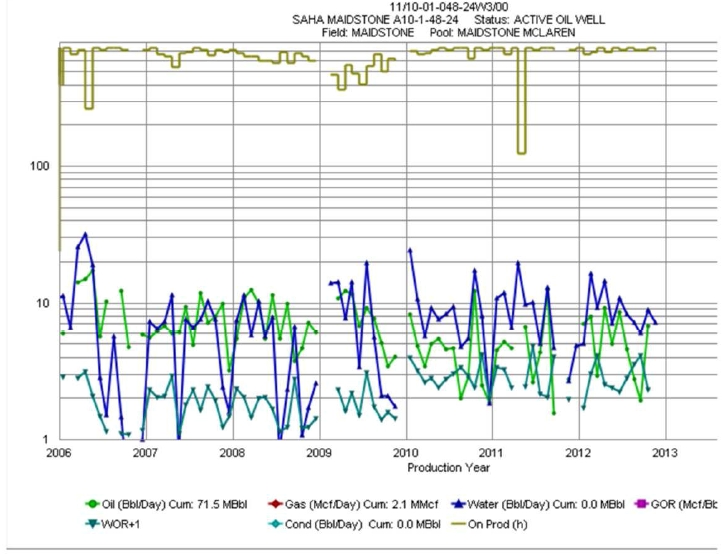
64
15-1-48-24 W3M Well Production Plots
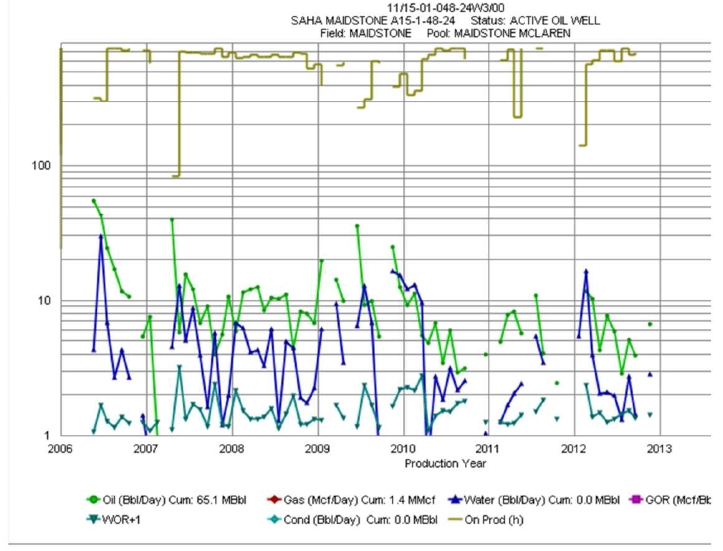
65
16-1-48-24 W3M Well Production Plots
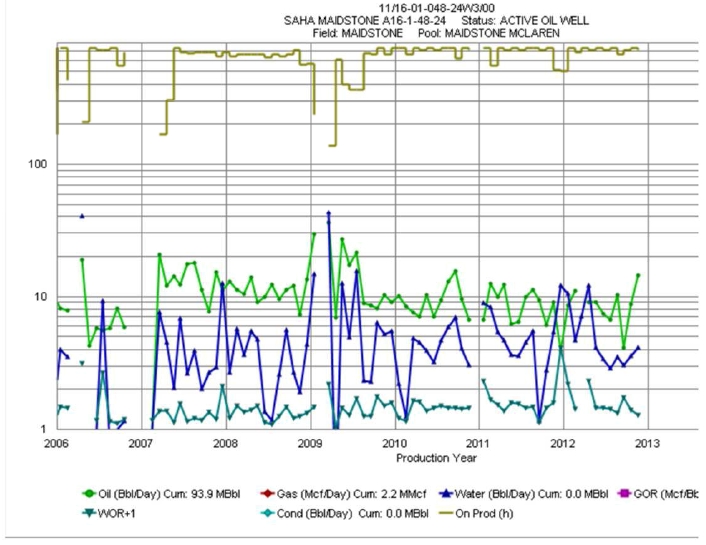
66
AppendixD –ProductionData of theCompany’sWells in theLandroseField
5-6-50-25 W3M Well Production Plots
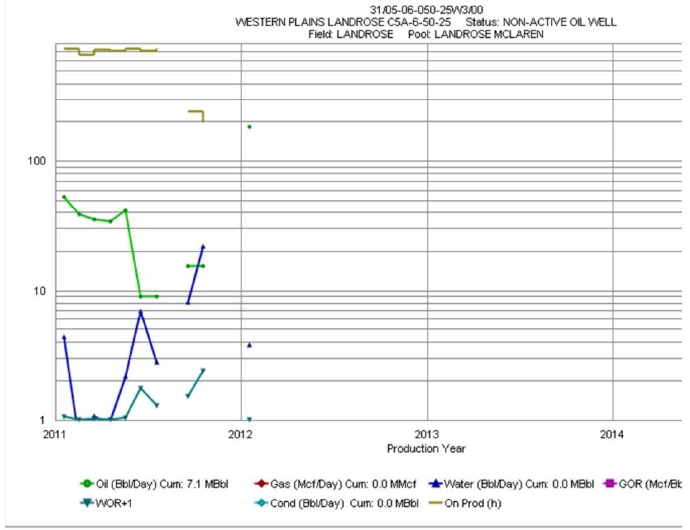
67
6-6-50-25 W3M Well Production Plots
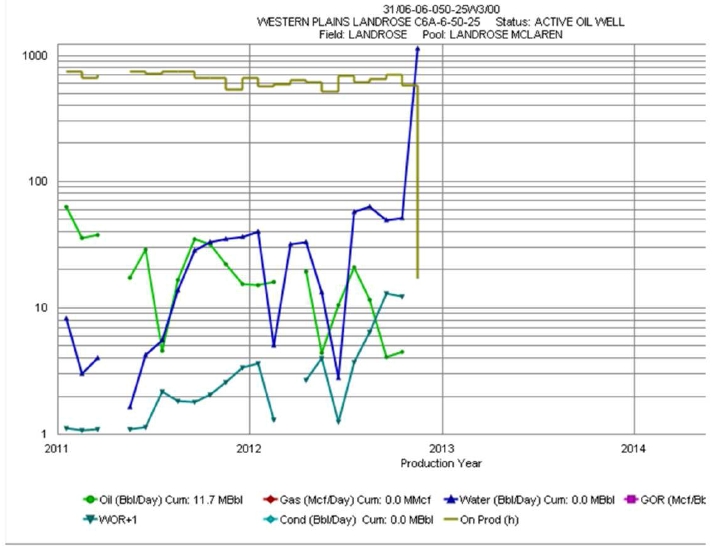
68
11-6-50-25 W3M Well Production Plots
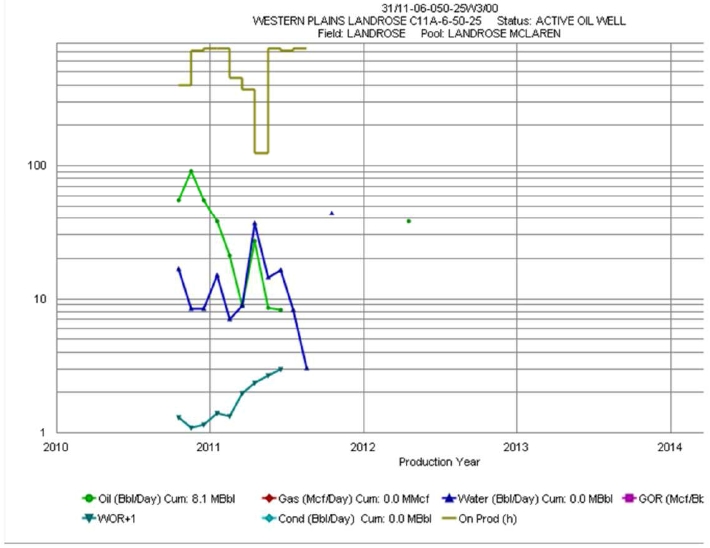
69
12-6-50-25 W3M Well Production Plots

70
13-6-50-25 W3M Well Production Plots
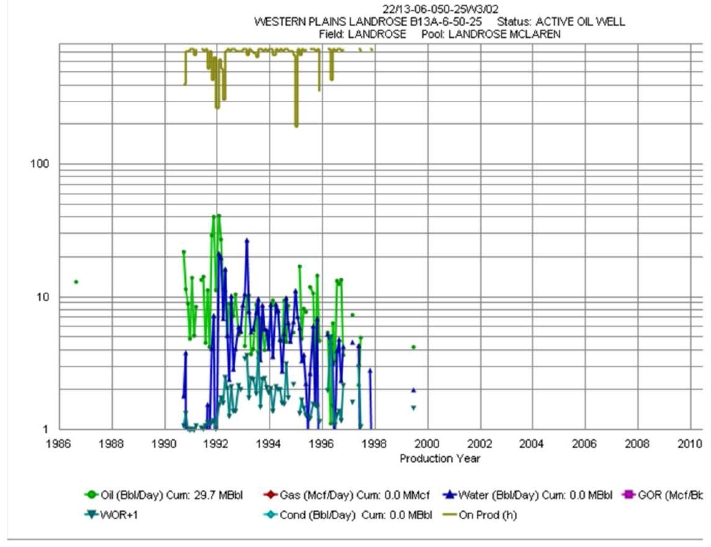
71
13-6-50-25 W3M Well Production Plots
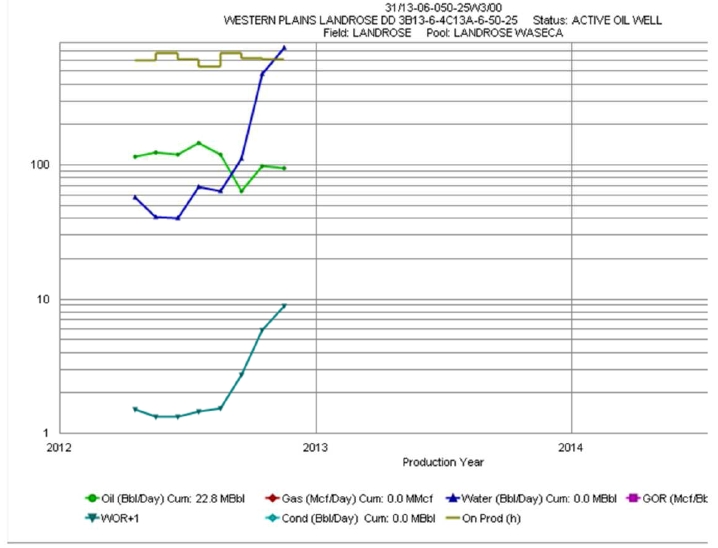
72
14-6-50-25 W3M Well Production Plots
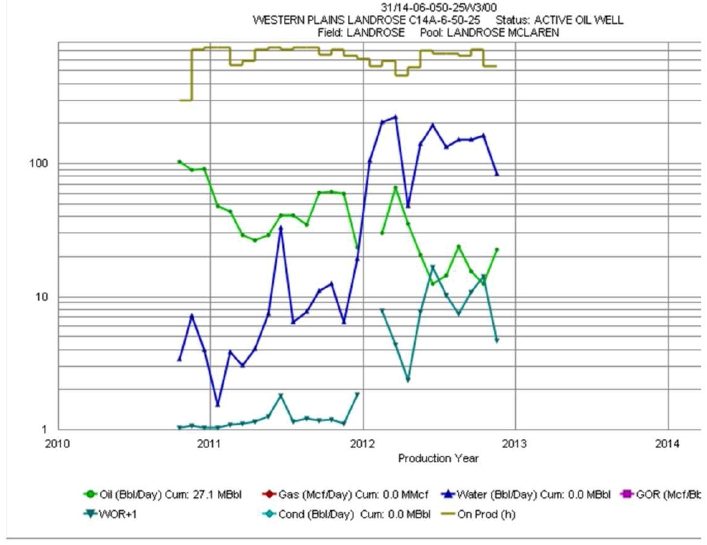
73
16-6-50-25 W3M Well Production Plots
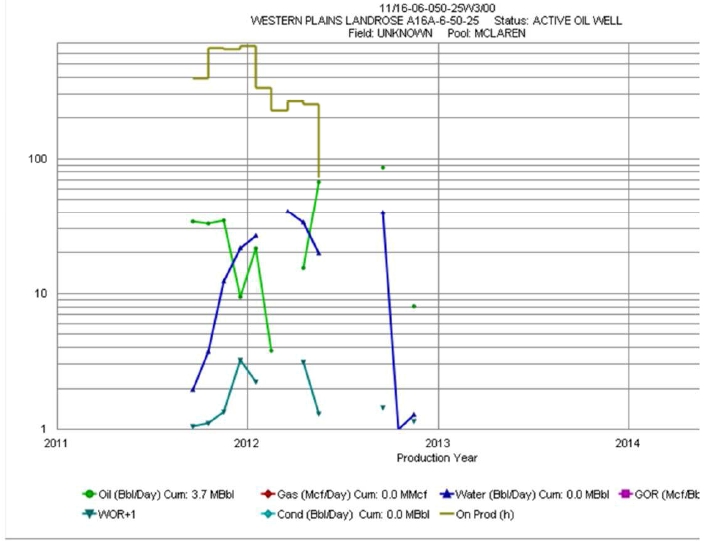
74
6-12-50-26 W3M Well Production Plots