![]() NuVasive, Inc. Second Quarter 2016 Results Supplemental Presentation to Earnings Press Release July 26, 2016 Exhibit 99.2 |
![]() ©2016 NuVasive®, Inc. ©2016 NuVasive®, Inc. Forward-Looking Statements NuVasive cautions you that statements included in this presentation that are not a description of historical facts are forward-looking statements that involve risks, uncertainties, assumptions and other factors which, if they do not materialize or prove correct, could cause NuVasive’s results to differ materially from historical results or those expressed or implied by such forward-looking statements. In addition, this presentation contains selected financial results from the second quarter 2016, as well as projections for 2016 financial guidance and longer-term financial performance goals. The numbers for the second quarter 2016 are prior to the completion of review procedures by the Company’s external auditors and are subject to adjustment. In addition, the Company’s projections for 2016 financial guidance and longer-term financial performance goals represent current estimates, including initial estimates of the potential benefits, synergies and cost savings associated with acquisitions, which are subject to the risk of being inaccurate because of the preliminary nature of the forecasts, the risk of further adjustment, or unanticipated difficulty in selling products or generating expected profitability. The potential risks and uncertainties that could cause actual growth and results to differ materially include, but are not limited to: the risk that NuVasive’s revenue or earnings projections may turn out to be inaccurate because of the preliminary nature of the forecasts; the risk of further adjustment to financial results or future financial expectations; unanticipated difficulty in selling products, generating revenue or producing expected profitability; the risk that acquisitions will not be integrated successfully or that the benefits and synergies from the acquisition may not be fully realized or may take longer to realize than expected; and those other risks and uncertainties more fully described in the Company’s news releases and periodic filings with the Securities and Exchange Commission. NuVasive’s public filings with the Securities and Exchange Commission are available at www.sec.gov. The forward- looking statements contained herein are based on the current expectations and assumptions of NuVasive and not on historical facts. NuVasive assumes no obligation to update any forward-looking statement to reflect events or circumstances arising after the date on which it was made. 2 |
![]() ©2016 NuVasive®, Inc. ©2016 NuVasive®, Inc. Non-GAAP Financial Measures Management uses certain non-GAAP financial measures such as non-GAAP earnings per share, non-GAAP net income, non-GAAP operating expenses and non-GAAP operating profit margin, which exclude amortization of intangible assets, purchase accounting related charges, leasehold related charges, integration related expenses associated with acquired businesses, one-time restructuring and acquisition related items, CEO transition related costs, certain litigation charges, non-cash interest expense and/or losses on convertible notes, and the impact from taxes related to these items, including those taxes that would have occurred in lieu of these items. Management also uses certain non-GAAP measures which are intended to exclude the impact of foreign exchange currency fluctuations. The measure constant currency is the use of an exchange rate that eliminates fluctuations when calculating financial performance numbers. The Company also uses measures such as free cash flow, which represents cash flow from operations less cash used in the acquisition and disposition of capital. Additionally, the Company uses an adjusted EBITDA measure which represents earnings before interest, taxes, depreciation and amortization and excludes the impact of stock-based compensation, purchase accounting related changes, leasehold related charges, integration related expenses associated with acquired businesses, CEO transition related costs, certain litigation liabilities, acquisition related items and other significant one-time items. Management calculates the non-GAAP financial measures provided in this earnings release excluding these costs and uses these non-GAAP financial measures to enable it to further and more consistently analyze the period-to-period financial performance of its core business operations. Management believes that providing investors with these non-GAAP measures gives them additional information to enable them to assess, in the same way management assesses, the Company’s current and future continuing operations. These non-GAAP measures are not in accordance with, or an alternative for, GAAP, and may be different from non-GAAP measures used by other companies. This presentation is intended to accompany the Company’s second quarter 2016 earnings announcement, which includes financial results reported on a GAAP and non-GAAP basis. For reconciliations of non-GAAP financial measures to the comparable GAAP financial measure, please refer to the earnings announcement, as well as supplemental financial information posted on the Investor Relations section of the Company’s corporate website at www.nuvasive.com. 3 |
![]() ©2016 NuVasive®, Inc. ©2016 NuVasive®, Inc. Double-digit revenue growth and increase in full year 2016 guidance Second Quarter 2016 Performance Highlights* Reported double-digit revenue growth of 16.4% to $236.2M, or 16.1% constant currency; excluding NuVasive Specialized Orthopedics, Inc (NSO), core revenue grew 9.0%, or 8.6% constant currency Delivered ongoing profitability improvement with GAAP operating profit margin of 25.4%; non-GAAP operating profit margin expansion to 15.9% or 60 bps; excluding NSO impact, non-GAAP operating profit margin was 16.2% Drove GAAP diluted earnings per share of $0.57; non-GAAP diluted earnings per share up 28% to $0.40 Increased full year 2016 guidance: revenue growth of 18.6% to $962.0M, or ~18.5% constant currency; non-GAAP operating profit margin to ~16.0%; adjusted EBITDA margin to ~25.4%; and non-GAAP diluted earnings per share of $1.64, a 25.0% increase 4 Another strong quarter, outperforming the spine market and delivering double- digit revenue growth while expanding our operating profitability year over year *Performance growth reflects comparison to prior year period; for additional details regarding full year 2016 guidance, see slide 14. |
![]() ©2016 NuVasive®, Inc. Operational excellence delivering significant margin expansion Driving organic growth with numerous inorganic opportunities available Industry disruptor adding value and addressing unmet needs NuVasive’s Formula for Success Fueling 2016 strategic agenda with proven approach to win ©2016 NuVasive®, Inc. 5 |
![]() ©2016 NuVasive®, Inc. Second Quarter 2016 Revenue Highlights U.S. SPINAL HARDWARE Includes All Implants, Fixation, MAGEC® & PRECICE® Up 18.3% in 2Q16 Key Performance Factors: Continued Adoption of Core Product Areas within iGA Platform, Strength Across All Procedural Categories, and Addition of NSO Portfolio U.S. SURGICAL SUPPORT Up 3.5% in 2Q16 Key Performance Factors: Driven By Growth in M5 Neuromonitoring Disposables INTERNATIONAL Up 33.3% * in 2Q16 Includes Puerto Rico Key Performance Factors: Strong Growth In EMEA and AsiaPac Regions Strong revenue performance in key growth areas *Constant currency basis Includes Biologics, IOM Services & Disposables ©2016 NuVasive®, Inc. 6 |
![]() ©2016 NuVasive®, Inc. Non-GAAP Measures 2Q16 Actuals 2Q16 YoY Performance Factors Gross Margin 77.8% 170 bps driven by med device tax repeal & favorable contribution from NSO Sales, Marketing & Admin. 56.9% 40 bps driven by addition of NSO Results included ~70 bps headwind from non-cash share-based compensation Research & Development 5.0% 70 bps driven by investments in core NUVA platform, NSO technology & procedural offerings Operating Profit Margin 15.9% 60 bps improvement from prior year while increasing investment in R&D by ~70 bps. Results included ~70 bps headwind from non-cash share-based compensation EPS $0.40 $0.09; ~28% YoY growth Adjusted EBITDA Margin 25.3% 40 bps Operating leverage story continues to play out Second Quarter 2016 P&L Performance ©2016 NuVasive®, Inc. 7 |
![]() Driving Improved Financial Profile Disciplined approach to driving profitability resulting in meaningful improvements in Adjusted EBITDA profile Future initiatives • Significantly reducing inventory days on hand • Reducing CapEx burn from ~9% to ~6% of revenue over time through better set configuration and utilization Incremental focus on improving the working capital profile and CapEx spending will drive incremental gains in the free cash profile of the company *NuVasive financial performance guidance as of July 26, 2016 * Improving Adjusted EBITDA profile ©2016 NuVasive®, Inc. 8 $144 $167 $204 ~$236 ~$244 $125 $145 $165 $185 $205 $225 $245 $265 2013 2014 2015 2016E Adjusted EBITDA (In Millions) |
![]() ©2016 NuVasive®, Inc. Improving Non-GAAP Operating Profit Margin Driving Improved Financial Profile FY13-16: 680 bps improvement • Long term commitment to drive at least 100 bps of improvement annually in the core business • Longer term goal of 25% with key levers identified – Sales force efficiencies – International scalability – In-house manufacturing – Asset efficiencies *Includes 100 bps of headwinds due to NSO acquisition Increased focus on driving improved profitability through disciplined spending and improved efficiencies in core business while adding acquired businesses that complement the overall financial goals 9.2% 11.4% 15.4% 15.8% ~16% ©2016 NuVasive®, Inc. 9 0% 5% 10% 15% 20% 2013 2014 2015 2016E Non-GAAP Operating Profit Margin * |
![]() ©2016 NuVasive®, Inc. ©2016 NuVasive®, Inc. Driving Improved Tax Rate 10 Increased focus on driving improved tax rate through international scale and domestic tax planning *NuVasive financial performance guidance as of July 26, 2016 42% 37% 34% 32% 30% 28% 25% 27% 29% 31% 33% 35% 37% 39% 41% 43% 2015 2016E 2017E 2018E 2019E 2020E Long Term Tax Rate Goals Operational Improvements Taking Hold • Global tax planning initiatives are playing through • International scale being realized • IP migration plans being deployed • Building localized capabilities in country • In addition, adoption of Accounting Policy Changes benefiting rate in near term Opportunity to drive non-GAAP effective tax rate lower by ~1,400 bps over 5 years * |
![]() ©2016 NuVasive®, Inc. ©2016 NuVasive®, Inc. Accelerates NuVasive’s transition from a spine implant company to a spine solutions company offering a broad range of integrated capabilities to deliver robust improved clinical and economic outcomes for patients and hospitals. • Delivers Clinical Fulfillment: Enhances NuVasive’s spine service line partnership offering for health system customers, by supporting clinical fulfillment through enhanced surgical monitoring and oversight capabilities • Doubles U.S. Service Footprint: Grows coverage and capabilities in key, complementary market. Moves from 45,000+ cases to 75,000 cases annually • Creates the Standard of Care: Able to further deliver high standard of care and increase the breadth of differentiated products and services offered to health systems as they seek to build out their spine service line, improving the clinical and economic value of our procedurally-integrated offerings • Attractive financial profile: Expected to be immediately accretive to non-GAAP earnings per share (EPS) in 2016 and significantly accretive in 2017 and beyond Strategic Milestone: Completed Biotronic NeuroNetwork Acquisition 11 Biotronic, combined with IMI, creates NuVasive Clinical Services – the nation’s leading intraoperative neuromonitoring services provider |
![]() ©2016 NuVasive®, Inc. ©2016 NuVasive®, Inc. Strategic Milestone: Medtronic Settlement General • Reached a definitive agreement with Medtronic to settle over 8 years of ongoing patent litigation between the two companies • Removes associated expense of the legal proceedings and provides a clear protocol for resolution of potential patent disputes in the future • Removes the overhang of the litigation, allowing NuVasive to operate freely in the marketplace, covering our current portfolio and providing for a standstill for future potential products, such as imaging and navigation Financial • NuVasive agreed to pay Medtronic $45 million, which is significantly lower than the Company’s reserve of $88.3 million (as of last quarter); sufficient liquidity to cover payment • Settlement payment to be made in Q3 • Reduces the risk of on-going litigation as well as the incurred costs of this type of patent litigation 12 |
![]() The remaining ~$0.08/share impact on non- GAAP EPS will be recorded in the second half of 2016 (~$0.04 each in Q3/Q4) ASU 2016-09 – Share-Based Compensation Background: New FASB guidance issued in March 2016 that requires mandatory adoption in 2017, with early adoption permitted. The Company chose to adopt in the second quarter of 2016, which requires adoption effective as of January 1, 2016. The adoption resulted in a recast of previously reported first quarter 2016 results and will have an impact on full-year 2016 results. The primary impact is on the incremental tax benefit/expense from share-based compensation, which historically would be booked to equity and now impacts the income tax rate. The Company’s GAAP and non-GAAP financial results are impacted by the adoption. Q1 $5.5m $0.11/share $1.1m $0.02/share Q2 $2.7m $0.05/share $2.5m $0.05/share Financial Impact For the three months ended March 31, 2016 As Previously Reported As Recast GAAP diluted loss per share $(0.18) $(0.07) Non-GAAP diluted earnings per share $0.31 $0.34 GAAP * * Per share amounts reflect impact of rounding ©2016 NuVasive®, Inc. 13 Non-GAAP |
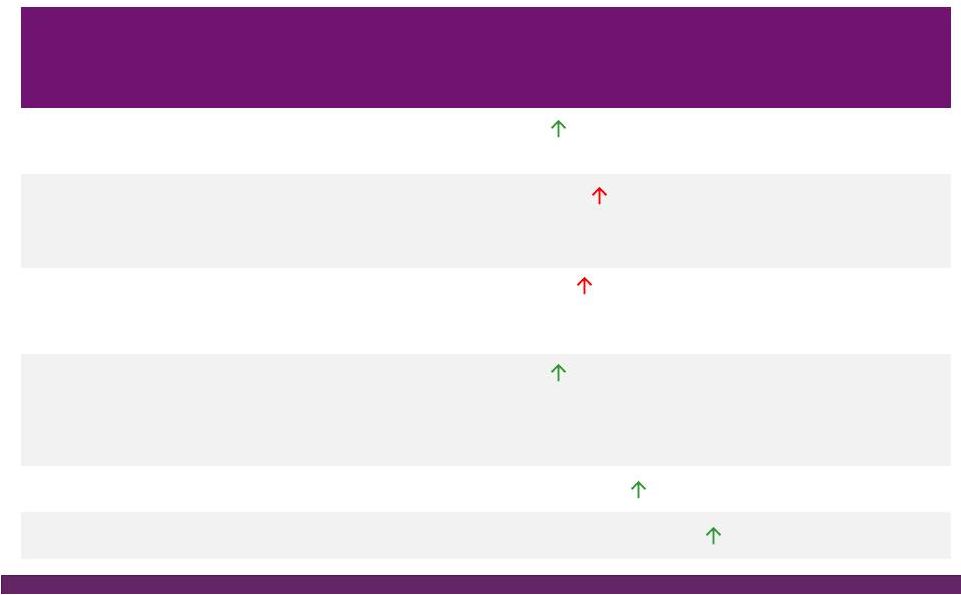
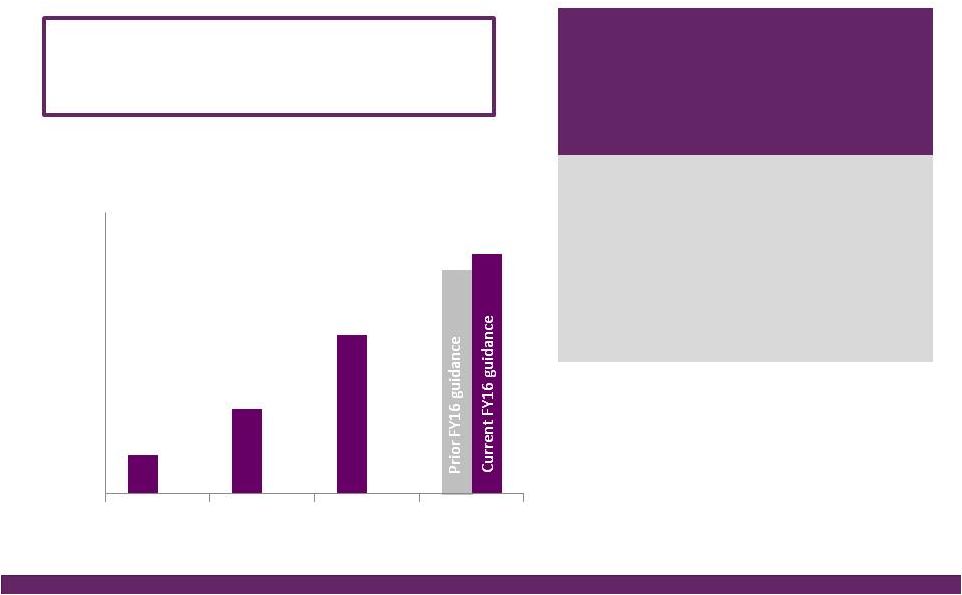
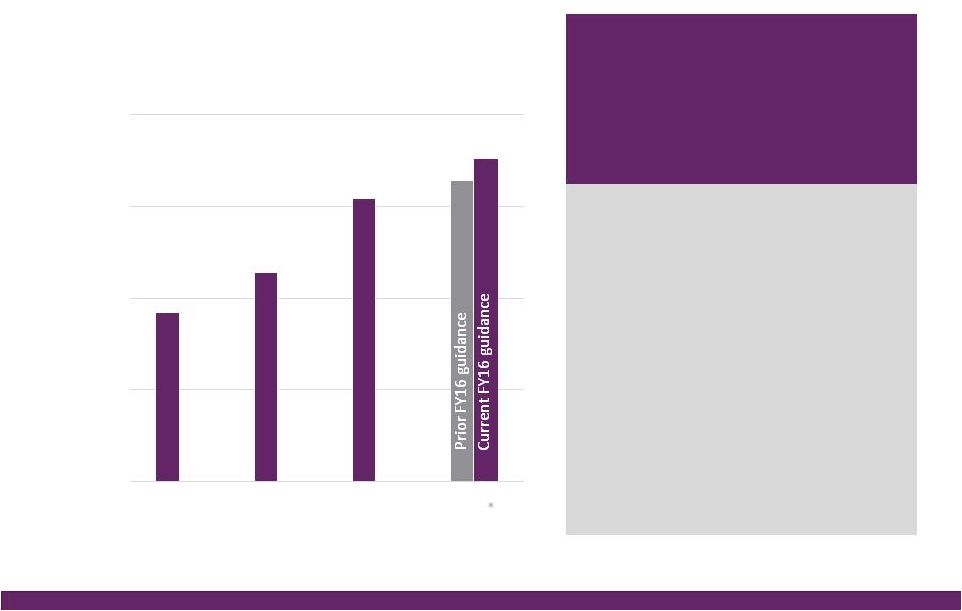
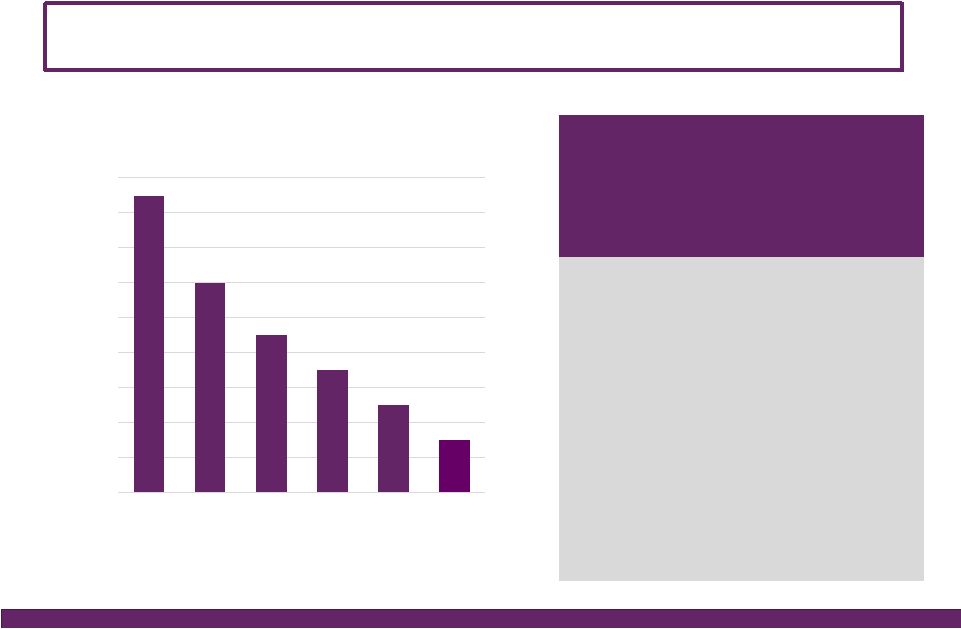
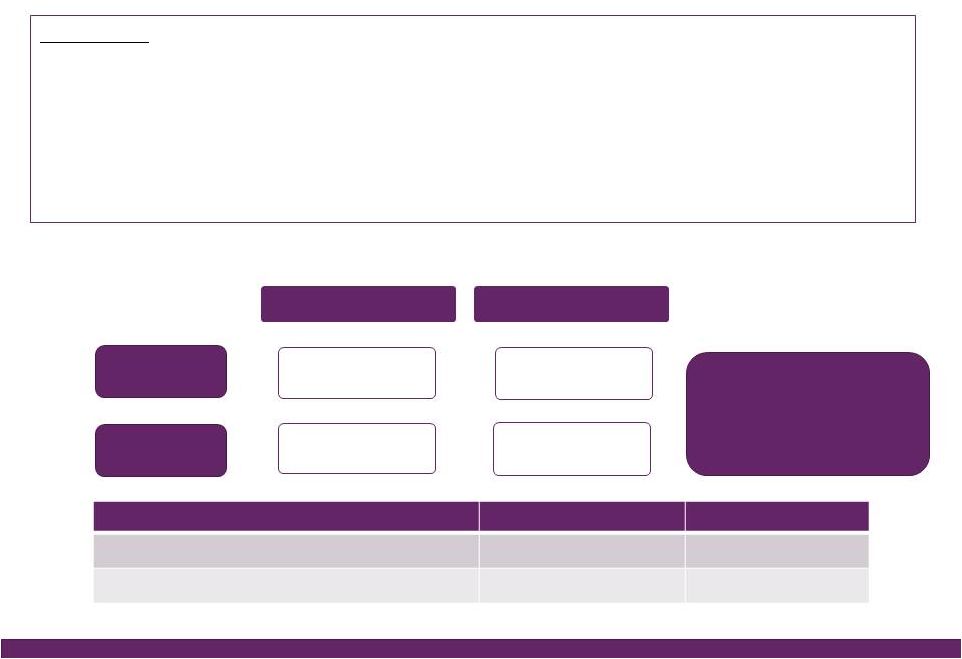
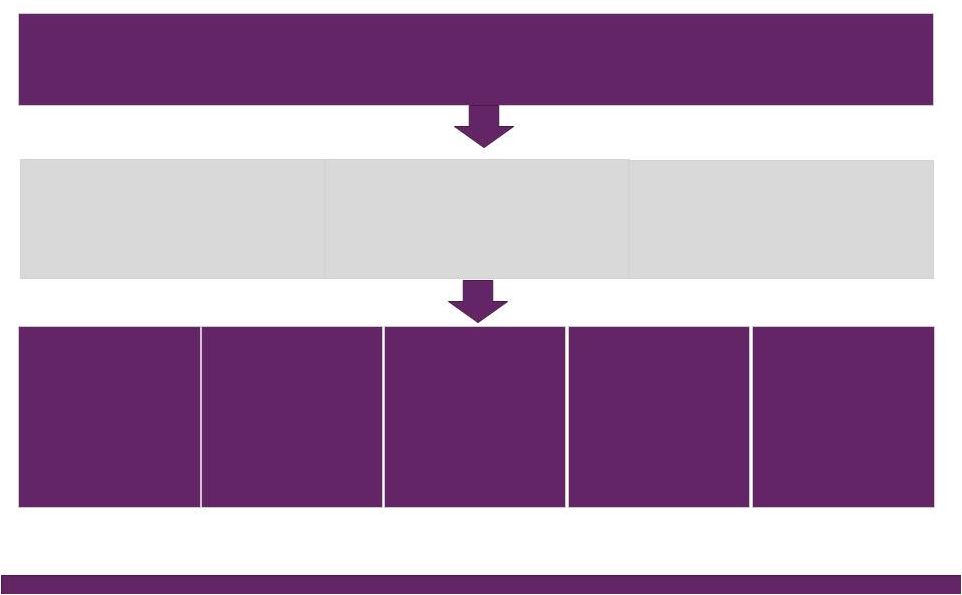
![]() ©2016 NuVasive®, Inc. ©2016 NuVasive®, Inc. FY16 Guidance Performance Drivers Revenues • As reported ~$962.0M, ~18.5% YoY growth^ ~$53M NSO contribution, ~$27M Biotronic; ~$1M currency impact • U.S. Spinal Hardware • U.S. Surgical Support • International ~16.6% YoY growth ~14.2% YoY growth ~37.7% YoY growth Strong expected lumbar, cervical and NSO product performance Biotronic contribution as of July 1, 2016 ~36% constant currency impact; comprised of core NuVasive growth of ~20%, NSO product growth of ~17% Non-GAAP Gross Margin ~76.4% ~40 bps increase due to 2-year suspension of med device tax, partially offset by the lower gross margin profile of Biotronic Non-GAAP Sales, Marketing & Admin. ~55.4% ~100 bps improvement driven by core NuVasive asset and sales force efficiencies, support function management, International scale; partial improvement related to SM&A profile of Biotronic Non-GAAP Research & Development ~5.1% ~80 bps increase in organic and inorganic investment in innovation Non-GAAP Operating Profit Margin ~16.0% ~150 bps of core NuVasive margin improvement, primarily offset by NSO investment Non-GAAP Earnings Per Share ~$1.64 ~25% YoY growth Adjusted EBITDA Margin ~25.4% ~20 bps increase Non-GAAP Effective Tax Rate ~37.0% ~500 bps improvement from 42% in 2015; ASU adoption 2016-09 Non-GAAP diluted WASO ~52.0M shares Increased from ~51.3M shares due to higher share price impact on remaining 2017 convertible note dilution; ASU adoption 2016-09 Reflects impact of acquisitions, convertible note issuance, note repurchases, expected currency rates & adoption of the ASU Full Year 2016 Financial Performance Guidance* 14 *NuVasive financial performance guidance as of July 26, 2016; ^Constant currency as reported |
![]() ©2016 NuVasive®, Inc. ©2016 NuVasive®, Inc. Relentless focus on driving shareholder value Why Invest in NuVasive Industry-leading innovation and integrated procedural solutions enables share-taking and premium pricing Drive surgeon conversion, increase service line partnerships and expand services integration Double International revenue contribution in coming years Competitively positioned in large and growing global spine market with favorable transformative dynamics playing to NuVasive strengths Grow revenues at multiples of market in high single-digit range* Achieve ~25% long-term non- GAAP operating profit margin and ~32% adjusted EBITDA goals* Optimize tax structure to help drive EPS growth 2x the rate of revenue growth* Disciplined capital deployment for strategic M&A and partnerships Set to generate significant increases in free cash flow *NuVasive financial performance guidance as of July 26, 2016 ©2016 NuVasive®, Inc. 15 |