UNITED STATES SECURITIES AND EXCHANGE COMMISSION
Washington, D.C. 20549
____________________
FORM 10-K
____________________
(Mark One) | | | | | |
| ☒ | ANNUAL REPORT PURSUANT TO SECTION 13 OR 15(d) OF THE SECURITIES EXCHANGE ACT OF 1934 |
For the fiscal year ended December 31, 2024 | | | | | |
| ☐ | TRANSITION REPORT PURSUANT TO SECTION 13 OR 15(d) OF THE SECURITIES EXCHANGE ACT OF 1934 |
| | | | | |
| | For the transition period from to |
Commission File No.: 001-16753
AMN HEALTHCARE SERVICES, INC.
(Exact Name of Registrant as Specified in Its Charter) | | | | | | | | |
| Delaware | | 06-1500476 |
(State or Other Jurisdiction of
Incorporation or Organization) | | (I.R.S. Employer
Identification No.) |
| |
| 2999 Olympus Boulevard | Suite 500 | |
| Dallas | Texas | 75019 |
| (Address of principal executive offices) | | (Zip Code) |
Registrant’s Telephone Number, Including Area Code: (866) 871-8519
____________________
Securities registered pursuant to Section 12(b) of the Act: | | | | | | | | |
| Title of Each Class | Trading Symbol | Name of each exchange on which registered |
| Common Stock, $0.01 par value | AMN | New York Stock Exchange |
Securities registered pursuant to Section 12(g) of the Act:
None.
Indicate by check mark if the registrant is a well-known seasoned issuer, as defined in Rule 405 of the Securities Act. Yes x No ¨
Indicate by check mark if the registrant is not required to file reports pursuant to Section 13 or Section 15(d) of the Exchange Act. Yes ¨ No x
Indicate by check mark whether the registrant: (1) has filed all reports required to be filed by Section 13 or 15(d) of the Securities Exchange Act of 1934 during the preceding 12 months (or for such shorter period that the registrant was required to file such reports), and (2) has been subject to such filing requirements for the past 90 days. Yes x No ¨
Indicate by check mark whether the registrant has submitted electronically every Interactive Data File required to be submitted pursuant to Rule 405 of Regulation S-T during the preceding 12 months (or for such shorter period that the registrant was required to submit and post such files). Yes x No ¨
Indicate by check mark whether the registrant is a large accelerated filer, an accelerated filer, a non-accelerated filer, or a smaller reporting company. See the definitions of “large accelerated filer,” “accelerated filer” and “smaller reporting company” in Rule 12b-2 of the Exchange Act. (Check one): | | | | | | | | | | | | | | | | | | | | | | | | | | |
| Large Accelerated Filer | ☒ | | Accelerated filer | ☐ | | Non-accelerated filer | ☐ | |
| Smaller reporting company | ☐ | | Emerging growth company | ☐ | | | ☐ | |
If an emerging growth company, indicate by check mark if the registrant has elected not to use the extended transition period for complying with any new or revised financial accounting standards provided pursuant to Section 13(a) of the Exchange Act. o
Indicate by check mark whether the registrant has filed a report on and attestation to its management’s assessment of the effectiveness of its internal control over financial reporting under Section 404(b) of the Sarbanes-Oxley Act (15 U.S.C. 7262(b)) by the registered public accounting firm that prepared or issued its audit report. Yes ☒ No ☐
If securities are registered pursuant to Section 12(b) of the Act, indicate by check mark whether the financial statements of the registrant included in the filing reflect the correction of an error to previously issued financial statements. o
Indicate by check mark whether any of those error corrections are restatements that required a recovery analysis of incentive-based compensation received by any of the registrant’s executive officers during the relevant recovery period pursuant to §240.10D-1(b). o
Indicate by check mark whether the registrant is a shell company (as defined in Rule 12b-2 of the Exchange Act). Yes ☐ No x
The aggregate market value of the voting and non-voting common equity held by non-affiliates computed by reference to the price at which the common equity was last sold, or the average bid and asked price of such common equity, as of June 30, 2024, was $1,934,078,967 based on a closing sale price of $51.23 per share.
As of February 18, 2025, there were 38,189,048 shares of common stock, $0.01 par value, outstanding.
Documents Incorporated By Reference: Portions of the registrant’s definitive proxy statement for the annual meeting of stockholders scheduled to be held on May 2, 2025 have been incorporated by reference into Part III of this Form 10-K.
Auditor Name: KPMG LLP Auditor Location: San Diego, California Auditor Firm ID: 185
TABLE OF CONTENTS
| | | | | | | | |
| Item | | Page |
| | |
| PART I | |
| | |
| 1. | | |
| 1A. | | |
| 1B. | | |
| 1C. | | |
| 2. | | |
| 3. | | |
| 4. | | |
| | |
| PART II | |
| | |
| 5. | | |
| 6. | | |
| 7. | | |
| 7A. | | |
| 8. | | |
| 9. | | |
| 9A. | | |
| 9B. | | |
| 9C. | | |
| | |
| PART III | |
| | |
| 10. | | |
| 11. | | |
| 12. | | |
| 13. | | |
| 14. | | |
| | |
| PART IV | |
| | |
| 15. | | |
| 16. | | |
| | |
References in this Annual Report on Form 10-K to “AMN Healthcare,” “AMN,” the “Company,” “we,” “us” and “our” refer to AMN Healthcare Services, Inc. and its wholly owned subsidiaries. This Annual Report contains references to our trademarks and service marks. For convenience, trademarks, service marks and trade names referred to in this Annual Report do not appear with the ®, TM, or SM symbols, but the lack of references is not intended to indicate that we will not assert our right to these trademarks, service marks and trade names.
PART I
10-K Introduction
This section provides an overview of AMN Healthcare Services, Inc. It does not contain all of the information you should consider. Please read the entire Annual Report on Form 10-K carefully before voting or making an investment decision.
| | | | | | | | |
| In Particular, Please See the Following Sections |
| Forward-Looking Statements | | Risk
Factors |
| | |
| Management’s Discussion & Analysis | | Financial
Statements |
| | |
Index of frequently requested 10-K information
| | | | | |
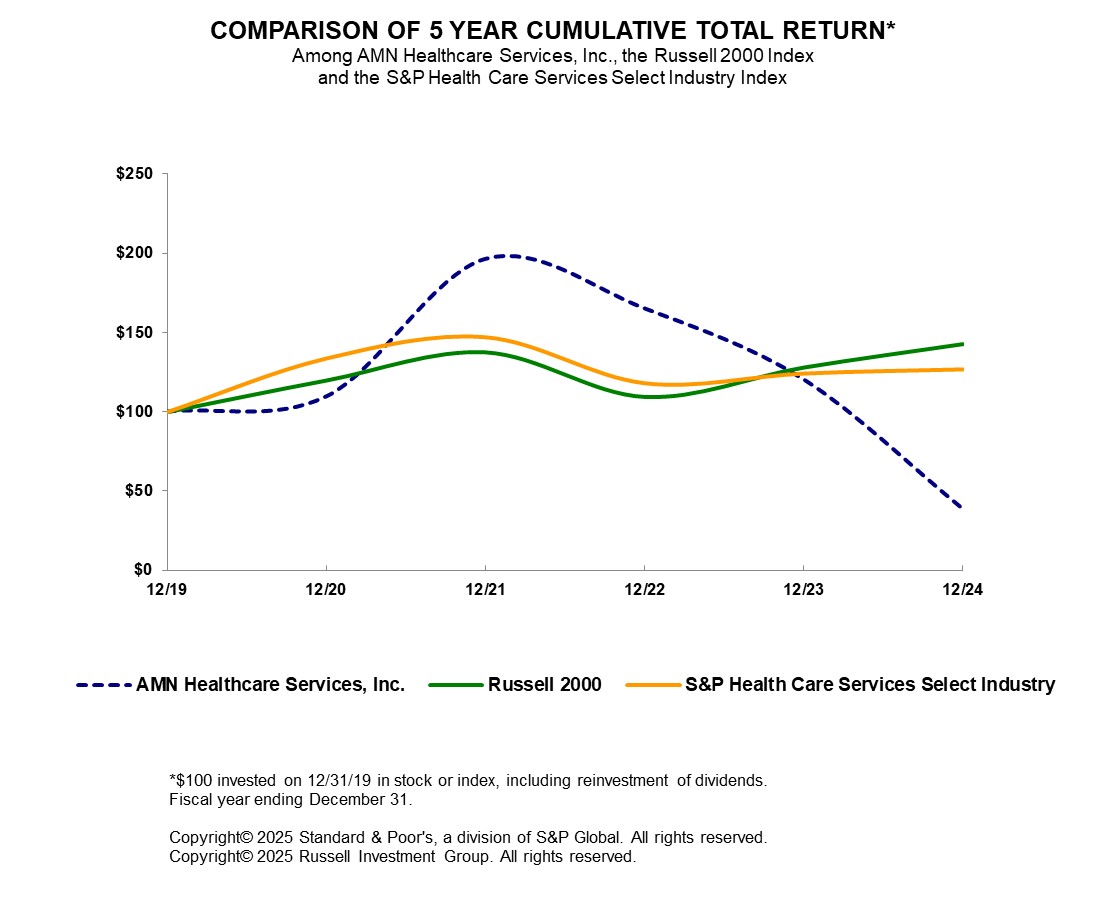
| Five-Year Performance Graph | |
| Results of Operations | |
| Liquidity and Capital Resources | |
| Financial Statement Footnotes | |
Item 1. Business
Overview of Our Company and Business Strategy
AMN Healthcare empowers the future of care through one of the nation’s broadest network of highly-qualified healthcare professionals. As the leader and innovator in total talent solutions for the healthcare sector in the United States, we tailor our solutions to our clients’ workforce challenges and goals, and provide staffing, talent optimization strategies, and technology solutions to support caregivers and patient care. We are passionate about all aspects of our mission to:
•Deliver the right talent and insights to help healthcare organizations optimize their workforce.
•Provide healthcare professionals opportunities to do their best work toward high-quality patient care.
•Create an innovative and values-based culture in which our team members can achieve their goals.
Our solutions enable our clients to build a quality, cost effective workforce, increase efficiency, and elevate the patient experience. Our comprehensive suite of talent solutions provides management, staffing, recruitment, language services, technology, predictive and market analytics, and related services to build and manage all or part of our clients’ healthcare workforce needs. We offer temporary and permanent career opportunities to our healthcare professionals, from nurses, physicians, and allied health professionals to healthcare leaders and executives in a variety of settings across the nation.
Our strategy is designed to support growth in the number and size of customer relationships and expansion of the markets we serve as care delivery settings continue to evolve and expand. Driving increased adoption of our numerous talent solutions through cross-selling will deepen and broaden our customer relationships. We will continue to innovate, develop and invest in new, complementary service and technology solutions that optimize and manage our clients’ workforce, enhance the patient experience, better engage our talent network and expand into different healthcare delivery settings. We expect this will enable us to expand our strategic customer relationships, while driving more recurring revenue, improve margin mix, and be less sensitive to economic cycles.
Over the past decade, our business has evolved beyond traditional healthcare staffing and recruitment services; we have become a strategic total talent solutions partner with our clients. We expanded our portfolio to serve a diverse and growing set of healthcare talent-related needs. In addition to our traditional staffing services, our suite of healthcare workforce solutions includes managed services programs (“MSP”), vendor management systems (“VMS”), medical language interpretation services, predictive labor analytics, workforce optimization technology and consulting, clinical labor scheduling, recruitment process outsourcing (“RPO”), and revenue cycle solutions. We enable clients to build, manage and optimize their healthcare talent to deliver great patient outcomes and experiences. Our talent network includes thousands of highly skilled, experienced professionals who trust us to place them in environments that expand and leverage their qualifications and expertise.
When developing and acquiring talent solutions, both services and technology, we consider many important criteria: (1) identifying and addressing the most pressing current and future needs of our clients and talent network; (2) alignment with our core operations, expertise, and access to healthcare professionals; (3) ways to deepen and broaden our client and healthcare professional relationships; (4) talent and technology solutions that expand the markets we serve; and (5) businesses that reduce our sensitivity to economic cycles and enhance our profitability.
Continuous improvement of our operations and business technology is a core component of our growth strategy and profitability goals. We have accelerated the integration of technology-based solutions in our core recruitment processes through investment in digital capabilities, mobile applications, brand consolidation and data analytics. These technology investments provide a more seamless and efficient workflow for our team members, our healthcare professionals and our clients. For example, during 2024, we launched WorkWise, a healthcare technology solution that quantifies staffing demand with predictive scheduling, automates workforce and vendor management in one solution, and seeks to improve the clinician experience. We added capabilities and functionalities for ShiftWise Flex, AMN Healthcare’s next-generation VMS that leverages the power of automation to increase efficiency of talent matching, credentialing, and candidate self-service, enabling our clients to develop sustainable workforces to deliver better outcomes for patients and caregivers alike. ShiftWise Flex is also integrated with AMN Passport, our top clinician-rated mobile application with more than 270,000 registered users as of January 2025. AMN Passport provides a centralized experience for nurses and allied professionals to find, book and manage assignments, access time and pay details, and receive instantaneous alerts and updates, while also creating operational efficiencies through the ability to customize job preferences, store and manage credentials, electronically sign important documents and contact our dedicated recruiters. We believe our investments in technology systems will help us realize greater scale, agility, speed, and cost efficiencies and will improve the experience for our healthcare professionals and clients.
Human Capital Management
Our human capital management strategy is a foundation of our business strategy as we strive to address the short- and long-term talent needs of our clients. Development of a broad base of healthcare professionals and corporate team members who feel valued, respected and supported is essential to driving shareholder value and achieving our long-term growth objectives. To support these objectives, our human capital management strategy focuses on talent acquisition, engagement, retention, employee well-being and belonging.
Employee Well-being
Our commitment to supporting the mental, physical, and economic well-being of our team members and healthcare professionals continued throughout 2024. The care, support and safety of our frontline healthcare professionals remains at the forefront for us. We have provided our healthcare professionals with additional support through access to employee assistance programs, on demand mental health resources through nonprofit partners and third-party vendors, wellness products and services to care for them while they are caring for our communities. We have also updated AMN Passport, our top clinician-rated mobile application, to allow users to see their impact on the patients they support. The app now includes an impact tracker in user profiles that shows the amount of patient care hours they provide and how many communities they serve over their career with us.
We also continued our AMN Healthcare Hardship Fund and our AMN Caring for Caregivers Fund, through which corporate team members and healthcare professionals, respectively, can receive financial support for qualifying events such as life-threatening or serious illnesses, natural disasters, funeral costs, or other events causing financial strain. This support is in addition to the insurance and other benefits and employee assistance programs available to support our team members and healthcare professionals.
To reward our employees for their efforts and dedication to advancing AMN Healthcare and supporting our clients and healthcare professionals and to further align their interests with that of our shareholders, we continued to offer an employee stock purchase plan (“ESPP”) to attract, motivate and retain employees and to provide a way for our employees to acquire an equity interest in our company.
For our corporate team members, we provide comprehensive benefit options, including health insurance, a prescription drug benefit, life and disability insurance, and paid time off. We also provide a variety of other voluntary programs to support
the health and well-being of our team members and their families, such as health and flexible spending accounts, family leave, adoption assistance, education assistance, retirement plans, employee assistance programs, and financial wellness programs.
We embrace a flexible work environment, with team members working a combination of in office and virtually to fully support our clients and healthcare professionals with the highest level of service, regardless of location and without disruption to our business operations. We believe it is important to bring our teams together to instill and reinforce our values-based culture, provide an opportunity to build meaningful connections with each other and the communities we serve as well as provide ongoing professional development and advancement opportunities. Our team members are located across the country, and we have offices in Dallas, TX; San Diego, CA; Boca Raton, FL; Florham Park, NJ; and Atlanta, GA.
As of December 31, 2024, we had 2,968 corporate team members, which includes both full-time and part-time employees. During the fourth quarter of 2024, we had an average of (1) 9,206 nurses, allied and other healthcare professionals, (2) 257 executive and clinical leadership interim staff, and (3) 2,819 medically qualified interpreters working for us. This does not include independent contractors, such as our locum tenens and contract interpreters, who were not our employees in 2024. In addition to our team members and independent contractors, we also leverage global partners to support our 24/7 client service model.
Learning and Professional Development
To help our team members and healthcare professionals achieve their personal and professional goals, we continue to make significant investments in our multi-faceted professional development programs.
We serve the clinical education needs of our healthcare professionals through a multi-pronged approach: pre-hire skills checklists to self-assess current clinical expertise, skills, and knowledge; pre-assignment knowledge assessments to test knowledge in a specialty practice area; pre-assignment required training; access to free continuing education courses while on assignment; and opportunities to transition into practice in specialty settings.
Throughout 2024, nearly 500 team members were promoted or transferred internally into new positions, representing approximately 17% of our corporate team members. Our professional development education assistance program provides reimbursement to our corporate team members to advance their knowledge and skills through certificate and degree programs. We offer leadership development curriculums led by our team of learning and talent development professionals for newly hired and promoted leaders, called LEAD at AMN, as well as a leadership curriculum for our individual contributors who are seeking leadership positions, which we call our emerging leaders program. Additionally, our mentorship program allows team members the opportunity to connect with colleagues across the company to support their development, strengthen their skills, and deepen relationships. Approximately 10% of our team members were enrolled in the mentoring program during 2024, which resulted in approximately 100 mentoring connections. These programs are supplemented with resources from our corporate memberships in large industry associations, to which every team member has access.
Our training and development programs include curriculum that promotes our values-based culture and commitment to ethics and compliance. In 2024, we had a 98% completion rate for our ethics and compliance training program, which includes, but is not limited to, training on our Code of Conduct, harassment prevention and cybersecurity.
Team Member Communication and Engagement
Team member engagement is of critical importance to our success. In 2024, we continued to prioritize engaging with our team members through quarterly town halls and an enterprise-wide company meeting with our chief executive officer and other senior executives. To assess the engagement of our team members and take action to mitigate risks associated with workforce engagement, development and retention, we conducted our annual survey to assess team member engagement, with 79% enterprise participation.
In 2024, we continued our focus on creating opportunities for team members to build connections with colleagues through our ten employee resource groups (“ERG”). Best practice research indicates that team member engagement and retention is positively impacted if team members are connected to peers who share their viewpoints and backgrounds and leaders who are invested in their success. These resource groups continue to foster engagement through their close alignment with the interests and backgrounds of our team members. As of December 31, 2024, more than 45% of our corporate team members participate in one or more ERG. Each ERG is sponsored by one or more members of our executive team, and in 2024, AMN’s collective ERGs hosted more than 150 member events and meetings.
While our team members’ backgrounds and experiences are broad, here is a snapshot of the demographics of our corporate team members as of December 31, 2024: 68% of our team members are women; 73% of our supervisor through senior manager roles are held by women; 44% of our board of directors are women; 37% of our team members identify as black, indigenous, or people of color (“BIPOC”); our team is 57% Millennials, 32% Generation X, 6% Baby Boomers, and 5% Generation Z; and team members self-identified as veterans, disabled, and LGBTQ+, each representing approximately 3% of our team.
Board Oversight
Our Board of Directors plays an active role in overseeing our human capital management strategy and programs. Our Talent and Compensation Committee provides oversight of our human capital management programs, including talent strategies, compensation plans and policies, and talent acquisition, development, engagement and retention.
Our Services
In 2024, we conducted our business through three reportable segments: (1) nurse and allied solutions, (2) physician and leadership solutions, and (3) technology and workforce solutions. We describe each segment’s revenue and operating results under “Management’s Discussion and Analysis of Financial Condition and Results of Operations—Results of Operations.” Our go-to-market strategy blends solutions from all three reportable segments, combining staffing, talent planning and acquisition, and technology-enabled solutions.
Workforce Staffing
(1) Nurse Staffing. We offer a range of specialty recruitment and temporary assignment lengths for nursing. A rigorous quality process ensures that each nursing candidate possesses the necessary training, licensure, and clinical competencies needed for a client facility. Nurse staffing solutions that we offer include (a) travel nurse staffing which are typically for a 13-week assignment but can support a wide range of assignment lengths, (b) international nurse staffing for which we recruit registered nurses from outside of the United States on long-term contracts ranging from 24 to 36 months, (c) international nurse permanent placement which provides our clients with direct placement of nurses from outside of the United States, (d) crisis nurse staffing (commonly referred to as critical staffing and rapid response nursing) for which we quickly deploy registered nurses on assignment during critical periods such as unexpected specialty gaps and urgent needs, including pandemic surges, natural disasters and other emergency situations, (e) labor disruption staffing for which we provide crucial support for clients involved in strikes of nurses and allied professional staff, and (f) local staffing of all nursing specialties, covering short-term assignments with same-day shifts that potentially last for several weeks.
(2) Allied Staffing. We provide allied health professionals to acute-care hospitals and other healthcare facilities such as skilled nursing facilities, rehabilitation clinics, schools, and pharmacies. Allied health professionals include such disciplines as physical therapists, respiratory therapists, occupational therapists, medical and radiology technologists, lab technicians, speech pathologists, rehabilitation assistants and pharmacists. Our solutions for schools feature an advanced teletherapy platform, Televate, and qualified school speech-language pathologists, psychologists, nurses, social workers, and other care providers who provide customized care and interactive learning plans to engage students.
(3) Revenue Cycle Solutions. We provide skilled labor solutions for remote medical coding, clinical documentation improvement, case management, and clinical data registry, and also provide auditing and advisory services.
(4) Physician and Advanced Practice Staffing. We provide locum tenens staffing services through which we offer clients thousands of physicians of all specialties and advanced practice and other clinicians. Typically on an independent contractor basis, locum tenens professionals are placed on temporary assignments with all types of healthcare organizations throughout the United States, including hospitals, health systems, medical groups, occupational medical clinics, psychiatric facilities, government institutions and insurance companies. We also offer full-service, permanent physician search (also referred to as physician permanent placement) across many specialties and modalities, specializing in recruiting and placing top physicians and advanced practitioner talent in jobs across the country.
(5) Interim Leadership Staffing. We provide executive and clinical leadership interim staffing. Practice areas include senior healthcare executives, physician executives, chief nursing officers and other clinical and operational leaders. Interim leaders provide strategic guidance and assist in setting short and long-term goals to offer immediate support, maintain momentum, and contribute leading practices and perspectives. Our interim leaders enjoy the flexibility of a consulting role with the stability of full-time employment.
(6) Executive Search and Academic Leadership. Augmenting our permanent placement service offerings, we provide executive leadership search services across the healthcare industry with areas of focus including academic medical centers and children’s hospitals nationwide. This business line provides us greater access to the “C-suite” of our clients and prospective clients, which we believe helps improve our visibility as a strategic partner to them and helps provide us with cross-selling opportunities.
Talent Planning & Acquisition
(7) Managed Services Programs. Many of our clients and prospective clients use a number of healthcare staffing agencies to fulfill their healthcare professional needs. We offer a comprehensive managed services program, in which we manage all or a portion of a client’s contingent staffing needs. Through our MSPs, we place our own healthcare professionals and utilize other staffing agencies to fulfill the client’s needs. We believe an MSP increases efficiencies and often provides cost savings while enhancing provider experiences. We often use our own VMS technology as part of our staffing-led and vendor-neutral MSPs, which we believe further enhances the value of our service offering. In 2024, we had approximately $2.0 billion in spend under management through our MSPs and approximately 45% of our consolidated revenue flowed through MSP relationships. Together with the vendor-neutral spend through our VMS programs (as discussed below), we had approximately $4.0 billion of spend under management during 2024.
(8) Recruitment Solutions. We partner with clients to streamline their permanent workforce planning and recruitment process through one efficient, agile solution. Our recruitment solutions, which many refer to as RPO, are customized to the client’s particular needs, in which we recruit, hire and/or onboard permanent clinical and nonclinical positions on their behalf. We provide technology and data intelligence that enable sustainable, long-term improvement and offer flexible solution options and agile, scalable processes in our pay-for-performance model.
Technology
(9) Language Interpretation. AMN Language Services provides healthcare interpretation services via proprietary platforms that enable video remote interpretation, over the phone interpretation, onsite interpretation, and telehealth interoperability, with more than 375 health systems, more than 2,600 hospitals, and thousands of clinics using our solutions. These services are all supported by proprietary technology platforms which enable real-time routing of video and audio calls, drive client efficiency with an in-person scheduling mobile application, and power interoperability with multiple telehealth platforms and EMRs.
(10) Vendor Management Systems. In addition to our MSP capabilities, we are also a leading provider for vendor-neutral VMS technology and support services for clients that prefer to self-manage the procurement of contingent clinical labor and their internal float pool. If clients use other staffing companies (associate vendors), our software as a service (“SaaS”)-based VMS technologies help them track and efficiently organize their staffing process. Our leading VMS products, which collectively serve clients of all sizes and complexity, are ShiftWise Flex, Medefis and b4health. Our VMS technologies provide, among other things, control over a wide variety of tasks via a single system and consolidated reporting. In 2024, we had approximately $2.0 billion in spend flow through our VMS programs, for which we typically earn a fee as a percentage of spend.
(11) Scheduling and Staff Planning. We offer Smart Square, healthcare scheduling software that combines demand forecasting (predictive analytics) with robust scheduling functionality, enterprise transparency, patented open shift management, and business intelligence tools all-in-one application. The SaaS platform provides fast implementations and is utilized in acute care, clinics, ancillary, long-term care and senior care settings. We also provide consulting services to our clients to evaluate their staffing spend and offer recommendations for savings by optimizing workforce and scheduling capabilities.
We typically experience modest seasonal fluctuations during our fiscal year, and they tend to vary among our businesses and reportable segments. These fluctuations can vary slightly in intensity from year to year.
Our Healthcare Professionals
The recruitment of a sufficient number of qualified healthcare professionals to work on temporary assignments and for placement at healthcare organizations is critical to the success of our business. Healthcare professionals choose temporary assignments for a variety of reasons that include seeking flexible work opportunities, exploring diverse practice settings, building skills and experience by working at prestigious healthcare facilities, working through life and career transitions, and as a means of access into a permanent staff position.
We recruit our healthcare professionals, depending on the particular service line, under the following brands: AMN Healthcare, Nursefinders, O’Grady Peyton International, Connetics, Medical Search International, DRW Healthcare Staffing, and B.E. Smith. Our recruiting strategy is supported by innovative and effective digital-first marketing programs that focus on lead management, including our digital presence on websites, social media, and mobile applications. Word-of-mouth referrals from the thousands of current and former healthcare professionals we have placed enhance our effectiveness at reaching healthcare professionals.
Our process to attract and retain healthcare professionals for temporary assignments and permanent placement depends on (1) offering a large selection of assignments and placements in a variety of geographies and settings with opportunities for career development, (2) creating competitive compensation packages, (3) developing passionate, knowledgeable recruiters and service professionals who understand the needs of our healthcare professionals and provide a personalized approach, and (4) maintaining a reputation for service excellence. The attractive compensation, benefits and reimbursement package that we provide our temporary healthcare professionals includes a competitive wage, professional development opportunities, professional liability insurance, 401(k) plan, ESPP, health insurance and reimbursements for housing, meals and travel expenses.
Our Geographic Markets and Client Base
During each of the past three years, (1) we generated substantially all our revenue in the United States and (2) substantially all our long-lived assets were located in the United States. We typically generate revenue in all 50 states. During 2024, the largest percentages of our revenue were concentrated in California, New York and Texas.
More than half of our temporary and contract healthcare professional assignments occur at acute-care hospitals. In addition to acute-care hospitals, we provide services to sub-acute healthcare facilities, physician groups, rehabilitation centers, schools, home health service providers and ambulatory surgery centers. Our clients include many of the largest and most prestigious and progressive health care systems in the country. Kaiser Foundation Hospitals (and its affiliates), to whom we provide clinical managed services, comprised approximately 16% of our consolidated revenue and 23% of our nurse and allied solutions segment revenue for the fiscal year ended December 31, 2024. No other client healthcare system or single client facility comprised more than 5% of our consolidated revenue for the fiscal year ended December 31, 2024.
Our Industry
The primary healthcare service markets in which we compete are U.S. temporary and contract healthcare staffing, workforce vendor neutral (i.e., VMS) and managed service programs, locum tenens, and language services. We also operate within the interim leadership, executive search, physician permanent placement, RPO, and workforce optimization and consulting services markets.
Industry Demand Drivers
Many factors affect the demand for contingent and permanent healthcare talent, which, accordingly, affects the size of the markets in which we primarily operate. Of these many factors, we believe the following serve as some of the most significant drivers of demand.
•Economic Environment and Employment Rate. Demand for our services is affected by growth of the U.S. economy and the employment rate. Growth in real U.S. gross domestic product generally drives rising employment rates. Favorable macro drivers typically result in increased demand for our services. Generally, we believe a positive economic environment and low unemployment lead to increasing demand for healthcare services. As employment levels rise, healthcare facilities, like employers in many industries, experience higher levels of employee attrition and find it increasingly difficult to obtain and retain permanent staff.
•Supply of Healthcare Professionals. While reports differ on the existence and extent of current and future healthcare professional shortages, many regions of the United States are experiencing a shortage of physicians and nurses that we believe will persist in the future. The Association of American Medical Colleges estimates a nationwide physician shortage up to 86,000 by 2036. In nursing, the World Health Organization estimates a worldwide shortage of 4.5 million by 2030. According to the National Council of State Boards of Nursing, approximately 900,000 registered nurses are anticipated to leave the workforce by the end of 2027. Demand for our services is positively correlated with activity in the permanent labor market. When nurse vacancy rates increase, temporary nurse staffing orders typically increase as well.
•General Demand for Healthcare Services. Changes in demand for healthcare services, particularly at acute healthcare hospitals and other inpatient facilities, like skilled nursing facilities, affect the demand for our services. According to the U.S. Department of Health and Human Services, with the passage of the Affordable Care Act, the uninsured population declined by more than 18 million people between 2010 and 2018. Growth of the insured population contributed to a relatively sharp increase in national healthcare expenditures beginning in 2014. Additionally, the U.S. population continues to age, and medical technology advances are contributing to longer life expectancy. A pronounced shift in U.S. age demographics is expected to boost growth of national health spending, projected by the Centers for Medicare & Medicaid Services to grow at average annual rates of 4.9% and 5.6% from 2025-2026 and 2027-2032, respectively, while Medicare spending growth is projected to increase to average annual rates of 7.1% and 7.6% for the same time periods, respectively. According to the U.S. Census Bureau, the number of adults age 65 or older grew by 9.4% from
2020 to 2023 and is projected to grow an estimated 31% between 2022 and 2035. People over 65 are three times more likely to have a hospital stay and twice as likely to visit a physician office compared with the rest of the population. These dynamics could place upward pressure on demand for the services we provide in the coming years. Not only does the age-demographic shift affect healthcare services demand, it also complicates the supply of skilled labor, as an increasing number of clinicians are aging out of the workforce.
•Adoption of Workforce Solutions. We believe healthcare organizations increasingly seek sophisticated, innovative and economically beneficial total talent solutions that improve patient experience and outcomes. We believe the prevalence of workforce solutions, such as MSP, VMS, RPO and workforce optimization tools, in the healthcare industry is still underpenetrated in comparison with non-healthcare sectors. During 2024, approximately 45% of our consolidated revenues were generated through MSP relationships.
Industry Competition
The healthcare staffing and workforce solutions industry is highly competitive. We compete in national, regional and local markets for healthcare organization clients and healthcare professionals. We believe that our comprehensive suite of total talent solutions, our commitment to quality and service excellence, our execution capabilities, and our national footprint create a compelling value proposition for our existing and prospective clients that give us distinct, scalable advantages over smaller, local and regional competitors and companies whose solution offerings, sales and execution capabilities are not as robust. The breadth of our talent solutions allows us to provide even greater value through a more strategic and consultative approach to our clients. In addition, we believe that our size, scale and sophisticated candidate acquisition processes give us access to a larger pool of available, highly-qualified candidates than most of our competitors, while substantial word-of-mouth referral networks enable us to attract, engage, and grow a diverse, high-quality network of healthcare professionals.
Larger firms, such as us, also generally have a deeper, more comprehensive infrastructure with a more established operating model and processes that provide the long-term stability and foundation for quality standards recognition, such as the Joint Commission staffing agency certification. As compared to many private firms, we also offer transparency and financial and operational controls, which we believe further enhance the value of our service offering. In its 2024 ratings for MSPs, HRO Today recognized AMN Healthcare in the Baker’s Dozen for overall quality of services, breadth of services and size of deals.
We are a leading provider of nurse, allied and locum tenens staffing in the United States. With the historic levels of demand as a result of the COVID-19 pandemic, the healthcare staffing industry grew significantly and has been further fragmented. In nurse and allied staffing, we compete with several national competitors together with numerous smaller, regional and local companies. The locum tenens staffing market consists of many small- to mid-sized companies with only a small number of national competitors of which we are one. The healthcare interim leadership staffing, healthcare executive search services, and physician permanent placement services markets, where we believe we hold leading positions, are also highly fragmented and consist of many small- to mid-sized companies that do not have a national footprint. We also believe we have a market-leading share in vendor neutral and managed services solutions, including VMS and MSP, and healthcare language interpretation services. With the stronger competitive market, we believe AMN Healthcare is well-positioned as a tech-centric total talent solutions partner to capitalize on the larger, addressable market through our comprehensive set of workforce and tech-enabled solutions. Our leading competitors vary by segment and include Amergis, Aya Healthcare, CHG Healthcare Services, Cross Country Healthcare, HealthTrust Workforce Solutions, Ingenovis Health, Jackson Healthcare, LanguageLine Solutions, and Medical Solutions. When recruiting for healthcare professionals, in addition to other executive search and staffing firms, we also compete with hospital systems that have developed their own recruitment departments and internal travel agencies.
Licensure For Our Business
Some states require state licensure for businesses that employ, assign and/or place healthcare professionals. We believe we are currently licensed in all states that require such licenses and take measures to ensure compliance with all state licensure requirements. In addition, the healthcare professionals who we employ or independently contract with are required to be individually licensed or certified under applicable state laws. We believe we take appropriate and reasonable steps to validate that our healthcare professionals possess all necessary licenses and certifications. We design our internal processes to ensure that the healthcare professionals that we directly place with clients have the appropriate experience, credentials and skills. Our nurse, allied healthcare and locum tenens staffing divisions have received Joint Commission certification. We have also obtained our Credentials Verification Organization certification from the National Committee for Quality Assurance.
Government Regulation
We are subject to the laws of the United States and certain foreign jurisdictions in which we operate and the rules and regulations of various governing bodies, which may differ among jurisdictions. Additionally, individual states often have regulations governing healthcare staffing agencies and technology platforms, requiring registration and various types of certifications and reporting. Compliance with these laws, rules and regulations has not had, and is not expected to have, a material effect on our capital expenditures, results of operations, or competitive position.
Additional Information
We maintain a corporate website at www.amnhealthcare.com. We make available our annual reports on Form 10-K, quarterly reports on Form 10-Q, current reports on Form 8-K and amendments to these reports, as well as proxy statements and other information free of charge through our website as soon as reasonably practicable after being filed with or furnished to the Securities and Exchange Commission (“SEC”). Such reports, proxy statements and other information are also available on the SEC’s website, http://www.sec.gov. The information found on our website and the SEC’s website is not part of this Annual Report on Form 10-K or any other report we file with or furnish to the SEC.
Special Note Regarding Forward-Looking Statements
This Annual Report on Form 10-K, including the section entitled “Management’s Discussion and Analysis of Financial Condition and Results of Operations,” contains, and certain oral statements made by management from time to time, may contain, “forward-looking statements” within the meaning of Section 27A of the Securities Act of 1933, as amended (the “Securities Act”), and Section 21E of the Securities Exchange Act of 1934, as amended (the “Exchange Act”), that are subject to safe harbors under the Securities Act and the Exchange Act. We base these forward-looking statements on our current expectations, estimates, forecasts and projections about future events and the industry in which we operate. Forward-looking statements are identified by words such as “believe,” “anticipate,” “expect,” “intend,” “plan,” “will,” “should,” “would,” “project,” “may,” “could,” variations of such words and other similar expressions. In addition, statements that refer to projections of financial items; anticipated growth; future growth and revenue; future economic conditions and performance; plans, objectives and strategies for future operations; and other characterizations of future events or circumstances, are forward-looking statements. Our actual results could differ materially from those discussed in, or implied by, these forward-looking statements. Factors that could cause actual results to differ from those implied by the forward-looking statements in this Annual Report on Form 10-K are described under the caption “Risk Factors” below, elsewhere in this Annual Report on Form 10-K and in our other filings with the SEC. Stockholders, potential investors, and other readers are urged to consider these factors in evaluating the forward-looking statements and cautioned not to place undue reliance on such forward-looking statements. The Company disclaims any obligation to publicly update such forward-looking statements to reflect subsequent events or circumstances.
Item 1A. Risk Factors
You should carefully read the following risk factors in connection with evaluating us and the forward-looking statements contained in this Annual Report on Form 10-K. Any of the following risks could materially adversely affect our business or our consolidated operating results, financial condition or cash flows, which, in turn, could cause the price of our common stock to decline. The risk factors described below and elsewhere in this Annual Report on Form 10-K are not the only risks we face. Factors we currently do not know, factors that we currently consider immaterial or factors that are not specific to us, such as general economic conditions, may also materially adversely affect our business or our consolidated operating results, financial condition or cash flows. The risk factors described below qualify all forward-looking statements we make, including forward-looking statements within this section entitled “Risk Factors.”
To develop and prioritize the following risk factors, we review risks to our business that are informed by our formal Enterprise Risk Management program, industry trends, the external market and financial environment as well as dialogue with leaders throughout our organization. Our risk factor descriptions are intended to convey our assessment of each applicable risk and such assessments are integrated into our strategic and operational planning.
Risk Factors that May Affect the Demand for Our Services
The ability of our clients to increase the efficiency and effectiveness of their staffing management and recruiting efforts may affect the demand for our services that could negatively affect our business.
If our clients are able to increase the effectiveness of their staffing and recruitment functions through analytics, automation, machine learning, artificial intelligence (“AI”) or other advanced technologies or otherwise increase the effectiveness of their permanent hiring or retention of permanent employees, their need for our services may decline. With the
advent of technology and more sophisticated staffing management and recruitment processes, including internal “travel,” other healthcare staffing models, and the increasing adoption of AI technologies, clients may be able to successfully increase the efficiency and effectiveness of their internal staffing management and recruiting efforts, through more effective planning and analytic tools, internet- or social media-based recruiting or otherwise. Such new technologies and processes could reduce the demand for our services, which could negatively affect our business.
The widespread outbreak of illness or other public health crisis could have an adverse effect on our business, financial condition and results of operations.
We could be negatively affected by the widespread outbreak of an illness or any other public health crisis. The COVID-19 pandemic negatively impacted the global economy and created significant volatility and disruption of financial markets.
Demand for our staffing services and workforce technology solutions fluctuated over the course of the COVID-19 pandemic. Initially, in 2020, demand for some temporary healthcare professionals and services decreased as the demand for non-essential and elective healthcare was initially negatively impacted by the COVID-19 pandemic. As the pandemic subsided, demand and bill rates, especially in our nurse and allied solutions businesses, decreased from the levels seen during the pandemic. This decrease in demand has had a negative impact on our revenue, financial condition, and results of operations. However, we are unable to predict the duration and extent to which demand for our services or bill rates will be negatively impacted.
The COVID-19 pandemic disrupted, and any other future outbreak of illness or other public health crises or reemergence or future strain of COVID-19 may also disrupt, our operations due to the unavailability of our corporate team members or healthcare professionals due to illness, risk of illness, quarantines, travel restrictions, vaccine mandates or other factors that limit our existing or potential workforce and pool of candidates. In addition, we have and may in the future experience negative financial effects related a pandemic or other future outbreaks of illness due to higher workers’ compensation and health insurance costs, for which we are largely self-insured, and payroll costs associated with quarantine of our healthcare professionals. We may also be subject to claims regarding the health and safety of our healthcare professionals and our corporate team members.
The economic impact of the COVID-19 pandemic negatively impacted the financial condition of many hospitals and healthcare systems, and our clients continue to face cost pressures and in turn are looking to decrease expenses, including for contingent labor and other services. Demand for our services may be impacted by these cost pressures and we may be subject to claims from these clients relating to the ability to provide services under terms and conditions that they believe are fair and reasonable.
Additionally, outbreaks of illness, public health crises or reemergence or future strain of COVID-19 could occur and may have similar or even more significant impact on our business.
Economic downturns, inflation and slow recoveries could result in less demand from clients and pricing pressure that could negatively impact our financial condition.
Demand for staffing services is sensitive to changes in economic activity. Many healthcare facilities utilize temporary healthcare professionals to accommodate an increase in hospital admissions. Conversely, when hospital admissions decrease in economic downturns or periods of high inflation, due to reduced consumer spending, the demand for our temporary healthcare professionals typically declines.
As economic activity slows, hospitals and other healthcare entities typically experience decreased attrition and reduce their use of temporary employees before undertaking layoffs of their regular employees, which results in decreased demand for many of our service offerings. In times of economic downturn and inflation, permanent full-time and part-time healthcare facility staff are generally inclined to work more hours and overtime, resulting in fewer available vacancies and less demand for our services. Fewer placement opportunities for our temporary clinicians, physicians and leaders also impairs our ability to recruit and place them both on a temporary and permanent basis. This may have an even greater negative effect on demand for physicians in certain specialties such as surgery, radiology and anesthesiology. In addition, we may experience pricing pressure during periods of decreased patient occupancy and hospital admissions, negatively affecting our revenue and profitability.
During challenging economic times or in the event of a reduction or elimination of government assistance, our clients, in particular those that rely on government funding, may face reduced demand for their services, reduced revenue, and issues gaining access to sufficient credit, which has resulted in and could in the future result in an impairment or further impairment of their ability to make payments to us, timely or otherwise, for services rendered. If that were to occur, we may further increase our allowance for expected credit losses and our days sales outstanding would be negatively affected.
If we are unable to anticipate and quickly respond to changing marketplace conditions, such as alternative modes of healthcare delivery, reimbursement and client needs, we may not remain competitive.
Patient delivery settings continue to evolve, giving rise to alternative modes of healthcare delivery, such as retail medicine, telemedicine and home health. In addition, changes in reimbursement models and government mandates are also impacting healthcare environments.
Our success depends upon our ability to develop innovative workforce solutions, quickly adapt to changing marketplace conditions, such as reimbursement changes, and evolving client needs, comply with new federal or state regulations and differentiate our services and abilities from those of our competitors. The markets in which we compete are highly competitive, and our competitors may respond more quickly to new or emerging client needs and marketplace conditions. The development of new service lines and business models requires close attention to emerging trends and proposed federal and state legislation related to the healthcare industry. If we are unable to anticipate changing marketplace conditions, adapt our current business model to adequately meet changing conditions in the healthcare industry and develop and successfully implement innovative services, we may not remain competitive.
Consolidation of healthcare delivery organizations could negatively affect pricing of our services and increase our concentration risk.
Consolidation of healthcare delivery organizations provides them with greater leverage in negotiating pricing for services. Consolidations may also result in us losing our ability to work with certain clients because the party acquiring or consolidating with our client may have a previously established service provider they elect to maintain. In addition, our clients may increase their use of intermediaries such as vendor management service companies and group purchasing organizations that may enhance their bargaining power or clients with a larger network of healthcare professionals may develop their own temporary staffing models. These dynamics each separately or together could negatively affect pricing for our services and our ability to maintain certain clients.
Hospital concentration coupled with our managed services contracts means our revenues from some larger health systems have grown and may continue to grow substantially relative to our other revenue sources. For example, Kaiser Foundation Hospitals (and its affiliates) (collectively, “Kaiser”) comprised approximately 16% of our consolidated revenue in 2024. If we were to lose Kaiser as a client or were unable to provide a significant amount of services to Kaiser, whether directly or as a subcontractor, such loss may have a material adverse effect on our revenue, results of operations and cash flows.
Intermediary organizations may impede our ability to secure new and profitable contracts with our clients.
Our business depends upon our ability to maintain our existing contracts and secure new, profitable contracts. Outside of our managed services contracts, our client contracts are not typically exclusive and our clients are generally free to offer temporary staffing assignments to our competitors. Additionally, our clients may choose to purchase these services through intermediaries such as group purchasing organizations or competitors offering MSP services, with whom we establish relationships in order to continue to provide our staffing services to certain healthcare facilities. These intermediaries may negatively affect our ability to obtain new clients and maintain our existing client relationships by impeding our ability to access and contract directly with clients and may also negatively affect the profitability of these client relationships. In addition, our inability to establish relationships with these intermediaries may result in us losing our ability to work with certain healthcare facilities.
The repeal or significant erosion of the Patient Protection and Affordable Care Act (“ACA”) without a corresponding replacement may negatively affect the demand for our services.
In 2010, the adoption of the ACA brought significant reforms to the health care system that included, among other things, a requirement that all individuals have health insurance (with limited exceptions). As a result of the ACA, the uninsured population has declined significantly. If there is a rollback of aspects of the ACA, such as Medicaid expansion, it may lead to a reduction in demand for healthcare services and the demand for our services may decline.
Regulatory and Legal Risk Factors
Investigations, claims and legal proceedings alleging medical malpractice, anti-competitive conduct, violations of employment, privacy and wage regulations and other theories of liability asserted against us could subject us to substantial liabilities.
Like all employers, we must also comply with various laws and regulations relating to employment and pay practices and from time to time may be subject to individual, representative and class action lawsuits related to alleged wage and hour violations under California and Federal law. We are subject to possible claims alleging discrimination, sexual harassment and other similar activities in which we or our hospital and healthcare facility clients and their agents have allegedly engaged. We are also subject to examination of our payroll practices from various federal and state taxation authorities from time to time. While we believe that our employment and pay practices materially comply with relevant laws and regulations, interpretations of these laws change. Because of the nature of our business, the impact of these employment and payroll laws and regulations may have a more pronounced effect on our business. There is a risk that we could be subject to payment of significant additional wages, insurance and employment, and payroll-related taxes and sizeable statutory penalties negatively impacting our financial position, results of operations and cash flows. These laws and regulations may also impede our ability to grow the size and profitability of our operations. In addition, our involvement in these matters and any related adverse rulings may result in increased costs and expenses, cause us from time to time to significantly increase our legal accruals and/or modify our pay practices, all of which would likely have an adverse impact on our financial performance and profitability.
We, along with our clients and healthcare professionals, are subject to investigations, claims and legal actions alleging malpractice or related legal theories. At times, plaintiffs name us in these lawsuits and actions regardless of our contractual obligations, the competency of the healthcare professionals, the standard of care provided by the healthcare professionals, the quality of service that we provided or our actions. In certain instances, we are contractually required to indemnify our clients against some or all of these potential legal actions.
The size and nature of our business requires us to collect substantial personal information of healthcare professionals and other team members that is subject to a myriad of privacy-related laws from multiple jurisdictions that regulate the use and disclosure of such information. In addition, many of our healthcare professionals have access to client proprietary information systems and patient confidential information. We may be required to incur significant costs to comply with mandatory privacy and security standards and protocols imposed by law, regulation, industry standards or contractual obligations with our clients. In addition, an inherent risk of the collection and access to such information includes possible claims from unintentional or intentional misuse, disclosure or use of this information. Such claims may result in negative publicity, injunctive relief, criminal investigations or charges, civil litigation, payment by us of monetary damages or fines, or other adverse effects on our business, which may be material.
We are also subject to certain laws and regulations applicable to recruitment and employment placement agencies with which we must comply in order to continue to conduct business in that specific state.
As we grow and increase our leadership position, we are at greater risk for anti-competitive conduct claims and investigations, such as violation of federal and state antitrust laws and unfair business practices. An environment of high-demand for healthcare staffing support coupled with the healthcare labor shortage, especially with respect to nurse and allied healthcare professionals, has led and may continue to lead to higher wages for healthcare professionals and higher costs to our clients for healthcare staffing. This may lead to claims and investigations into pricing and competitive conduct in the healthcare staffing industry. While we believe that our business practices, including pricing and competitive conduct, comply with all applicable laws and regulations, we may nonetheless be subject to inquiries, claims or investigations which could negatively impact our reputation and business.
As we incorporate AI and machine learning into our business there are uncertainties in the legal regulatory regime relating to AI that may require significant resources to modify and maintain our business practices to comply with U.S. and non-U.S. laws, the nature of which cannot be determined at this time. If the jurisdictions in which we operate decide to adopt laws governing AI, such legislation may render the use of such technologies challenging, impossible or financially prohibitive.
We maintain various types of insurance coverage for many types of claims, including professional liability, errors and omissions, employment practices and cyber, through commercial insurance carriers and a wholly-owned captive insurance
company and for other claims such as wage and hour practices and competition actions, we are uninsured. The cost of defending such claims, even if groundless, could be substantial and the associated negative publicity could adversely affect our ability to attract, retain and place qualified employees and healthcare professionals in the future. We may also experience increased insurance premiums and retention and deductible accruals that we may not be able to pass on to our clients, thereby reducing our profitability. Moreover, our insurance coverage and reserve accruals may not be sufficient to cover all claims against us.
We are subject to federal and state healthcare industry regulation including conduct of operations, costs and payment for services and payment for referrals as well as laws regarding immigration and government contracting.
The healthcare industry is subject to extensive and complex federal and state laws and regulations related to conduct of operations, costs and payment for services and payment for referrals. We provide talent solutions and technologies on a contract basis to our clients, who pay us directly. Accordingly, Medicare, Medicaid and insurance reimbursement policy changes generally do not directly impact us. Nevertheless, reimbursement changes in government programs, particularly Medicare and Medicaid, can and do indirectly affect the demand and the prices paid for our services. For example, our clients could receive reduced or no reimbursements because of a change in the rates or conditions set by federal or state governments that would negatively affect the demand and the prices for our services. Moreover, our hospital, healthcare facility and physician practice group clients could suffer civil and criminal penalties, and be excluded from participating in Medicare, Medicaid and other healthcare programs for failure to comply with applicable laws and regulations that may negatively affect our profitability.
In our international nurse business, we recruit registered nurses from outside of the United States who rely on visas to be eligible to be placed or hired directly with healthcare facilities. Visa retrogression, where the date(s) that determine availability for applying for a visa are moved to a later date, has had and may in the future have a negative impact on our international nursing volumes. Additionally, other changes in immigration policy, laws and processes could negatively impact our financial performance.
A portion of our hospital and healthcare facility clients are state and federal government agencies, where our ability to compete for new contracts and orders, and the profitability of these contracts and orders, may be affected by government legislation, regulation or policy. Additionally, in providing services to state and federal government clients and to clients who participate in state and federal programs, we are also subject to specific laws and regulations, which government agencies have broad latitude to enforce. If we were to be excluded from participation in these programs or should there be regulatory or policy changes or modification of application of existing regulations adverse to us, it would likely materially adversely affect our brand, business, results of operations and cash flows.
We are also subject to certain state laws and regulations applicable to healthcare staffing and “nursing pools” with which we must comply in order to continue to conduct business in that particular state. Regulation relating to healthcare staffing agencies has increased the operational and administrative requirements and increased the cost to provide various of our services in certain states. If regulation of our services continues to increase it could have a negative impact on our ability to profitably provide services in some states. We may also be subject to state laws that impose caps or other limitations on amounts that may be charged to clients for certain types of healthcare staffing, which in turn impacts the wages paid to healthcare professionals and may impact our ability to attract healthcare professionals to assignments in these states. In addition, it is generally our practice to pass along the increased costs associated with higher wages for healthcare professionals on to our clients. If new or additional caps or other price limitations were imposed that prevented us from passing these increased costs on or if the amount that we were able to pass on to our clients is limited, it would likely have an adverse impact on our financial performance and profitability.
The challenge to the classification of certain of our healthcare professionals as independent contractors could adversely affect our profitability.
Historically, we have treated our locum tenens, which include physicians and certain advanced practitioners, such as certified nurse anesthetists, nurse practitioners and physician assistants, as independent contractors. Certain state laws regarding classification of independent contractors have been modified in the past few years and as a result, we have altered our classification of certain locum tenens providers in certain instances. Other states and/or the Federal government may choose to adopt similar restrictions that may require us to expand our employee classifications for locum tenens. If this occurs, it could increase our employee costs and expenses and could negatively impact our profitability.
In addition, Federal or state taxing authorities may take the position that locum tenens are employees exposing us to additional wage and insurance claims and employment and payroll-related taxes. A reclassification of our locum tenens to employees from independent contractors could result in liability that would have a significant negative impact on our profitability for the period in which such reclassification was implemented, and would require changes to our payroll and
related business processes, which could be costly. In addition, many states have laws that prohibit non-physician owned companies from employing physicians, referred to as the “corporate practice of medicine.” If our independent contractor physicians were classified as employees in states that prohibit the corporate practice of medicine, we may be prohibited from conducting our locum tenens staffing business in those states under our current business model, which may have a substantial negative effect on our revenue, results of operations and profitability.
Risk Factors Related to Our Operations, Personnel and Information Systems
If we do not continue to recruit and retain sufficient quality healthcare professionals at reasonable costs, it could increase our operating costs and negatively affect our business and our profitability.
We rely significantly on our ability to recruit and retain a sufficient number of healthcare professionals who possess the skills, experience and licenses necessary to meet the requirements of our clients. With continuing clinician burnout rates, an ongoing shortage of certain qualified nurses and physicians in many areas of the United States and low unemployment rates for nurses and physicians, competition for the hiring of these professionals remains intense. Our ability to recruit temporary and permanent healthcare professionals may be exacerbated by continued low levels of unemployment.
We compete with healthcare staffing companies, recruitment and placement agencies, including online staffing and recruitment agencies, and with hospitals, healthcare facilities and physician practice groups to attract healthcare professionals based on the quantity, diversity and quality of assignments offered, compensation packages, the benefits that we provide and speed and quality of our service. We rely on our tech-enabled, relationship-oriented approach and national infrastructure to enable us to compete in all aspects of our business. We must continually evaluate and expand our healthcare professional network to serve the needs of our clients.
The costs of recruitment of quality healthcare professionals and providing them with competitive compensation packages may be higher than we anticipate, or we may be unable to pass these costs on to our hospital and healthcare facility clients, which may reduce our profitability. Moreover, if we are unable to recruit temporary and permanent healthcare professionals, our service execution may deteriorate and, as a result, we could lose clients or not meet our service level agreements with these clients that have negative financial repercussions.
Our inability to implement new infrastructure and technology systems and technology disruptions may adversely affect our operating results and ability to manage our business effectively.
We have technology, operations and human capital infrastructures to support our existing business. Our ability to deliver services to our clients and to manage our commercial technologies, internal systems and data depends largely upon our access to and the performance of our management information and communications systems, including our SaaS-based solutions, client relationship management systems and client/healthcare professional-facing self-service websites and applications. These technology systems also maintain accounting and financial information upon which we depend to fulfill our financial reporting obligations. We must continue to invest in this infrastructure to support our growth, enhance our management and utilization of data and improve our efficiency.
Upgrading current systems and implementing new systems is costly and involves inherent risks, including loss of information, disruption to our normal operations, changes in accounting procedures and internal control over financial reporting, as well as problems achieving accuracy in the conversion of electronic data. Failure to properly or adequately address these issues could result in increased costs, loss of clients, healthcare professionals and talent, the diversion of management’s and employees’ attention and resources and could materially adversely affect our growth, financial and operating results, internal controls over financial reporting and ability to manage our business effectively.
Additionally, the current legacy systems are subject to other non-environmental risks, including technological obsolescence for which there may not be sufficient redundancy or backup. These systems, and our access to these systems, are not impervious to floods, fire, storms, or other natural disasters, or service interruptions. There also is a potential for intentional and deliberate attacks to our systems, including ransomware, that may lead to service interruptions, data corruption, data theft or data unavailability. If our current or planned systems do not adequately support our operations, are damaged or disrupted or if we are unable to replace, repair, maintain or expand them, it may adversely affect our business operations and our profitability.
Our business could be harmed if we fail to further develop and evolve our current talent solutions technology offerings and capabilities.
To achieve our strategic objectives and to remain competitive, we must continue to develop and enhance our talent solutions technology offerings and capabilities. This may require the acquisition of equipment and software and the development of new proprietary software and capabilities, either internally or through independent consultants, which may require significant investment of capital. If we are unable to design, develop, acquire, implement and utilize, in a cost-effective manner, technology and information systems that provide the capabilities necessary for us to compete effectively, or for any reason any interruption or loss of our information processing capabilities occurs, this could harm our business, results of operations and financial condition.
In addition, as technology continues to evolve, more tasks currently performed by people may continue to be replaced by automation, robotics, machine learning, AI and other technological advances that may be outside of our control. These technological changes may reduce demand for our services, enable the development of competitive products or services or enable our customers to reduce or bypass the use of our services.
Disruption to or failures of our SaaS-based or technology-enabled services, or our inability to adequately protect our intellectual property rights with respect to such technologies, could reduce client satisfaction, harm our reputation and negatively affect our business.
The performance, reliability and security of our technology-enabled services, including our language interpretation services and SaaS-based technologies, such as AMN Language Services, ShiftWise Flex, Medefis, b4health, and Avantas Smart Square are critical to such offerings’ operations, reputation and ability to attract new clients. Some of our clients rely on our SaaS-based technologies to perform certain of their operational functions. Accordingly, any degradation, errors, defects, disruptions or other performance problems with our SaaS-based technologies could damage our or our clients’ operations and reputations and negatively affect our business. If any of these problems occur, our clients may, among other things, terminate their agreements with us or make indemnification or other claims against us, which may also negatively affect us.
Additionally, if we fail to protect our intellectual property rights adequately with respect to our SaaS-based technologies, our competitors might gain access to it, and our business might be harmed. Moreover, if any of our intellectual property rights associated with our SaaS-based technologies are challenged by others or invalidated through litigation, defending our intellectual property rights might also entail significant expense. Accordingly, despite our efforts, we may be unable to prevent third parties from using or infringing upon or misappropriating our intellectual property with respect to our SaaS-based technologies, which may negatively affect our business as it relates to our SaaS-based and technology-enabled service offerings.
Security breaches and cybersecurity incidents could compromise our information and systems adversely affecting our business operations and reputation subject us to substantial liabilities.
Security breaches, including cyber incidents can result from deliberate attacks or unintentional events. These incidents can include, but are not limited to, gaining unauthorized access to digital systems for purposes of misappropriating assets or sensitive information, ransomware attacks, corrupting data, or causing operational disruption. In the ordinary course of our business, we collect and store sensitive data, such as our proprietary business information and that of our clients as well as personally identifiable information of our healthcare professionals and team members, including full names, social security numbers, addresses, birth dates and payroll-related information, in our data centers, on our networks and in hosted SaaS-based solutions provided by third parties. Our employees and third-party vendors may also have access to, receive and use personal health information in the ordinary course of our business. The secure access to, processing, maintenance and transmission of this information is critical to our operations.
Despite our security measures and business controls, our information technology and infrastructure, including the third party SaaS-based technology in which we store personally identifiable information and other sensitive information of our healthcare professionals may be vulnerable to attacks by hackers, breached due to third-party vendor and/or employee error, malfeasance or other disruptions such as ransomware or subject to the inadvertent or intentional unauthorized release of information. The Company has experienced cyber threats resulting in immaterial cyber incidents and expects cyber threats to continue with varying levels of sophistication. Because the techniques used to obtain unauthorized access, disable or degrade service, or sabotage systems change frequently and may not immediately produce signs of intrusion, we may be unable to anticipate these incidents or techniques, timely discover them, or implement adequate preventative measures. Our information technology and other security protocols may not provide sufficient protection, and as a result a security breach could compromise our networks and significant information about us, our employees, healthcare professionals, patients or clients may be accessed, disclosed, lost or stolen. In a situation such as ransomware attack, our access to critical business information and ability to conduct business may be interrupted or impaired. Further, unauthorized use or misuse of AI by the Company’s employees, vendors or others may result in disclosure of confidential Company and customer data. The Company’s use of AI may also lead to novel and urgent cybersecurity risks, including access to or the misuse of personal data.
Any such access, disclosure or other loss of information could (1) result in legal claims or proceedings, liability under laws that protect the privacy of personal information and regulatory penalties, (2) disrupt our operations and the services we provide to our clients and (3) damage our reputation, any of which could adversely affect our profitability, revenue and competitive position.
Use of AI may result in operational challenges or issues, liability, and reputational concerns.
Our business uses and intends to further rely on AI technology, which introduces certain risks including dependency on accurate AI performance, potential data privacy and security breaches, challenges in regulatory compliance, ethical considerations, potential workforce disruption, the risk of intellectual property infringement, and emerging technology risks. While we have established policies governing the use of AI technology, we cannot ensure that our employees, contractors or other agents will adhere to those policies. Failure to address these risks adequately may negatively impact our operations, reputation and financial performance. Additionally, other unforeseen risks stemming from our use and development of AI tools and technology may arise in the future that could adversely affect our business, financial condition and results of operations.
The inability to quickly and properly credential and match quality healthcare professionals with suitable placements may negatively affect demand for our services.
Our success depends on the quality of our healthcare professionals and our ability to quickly and efficiently assist in obtaining licenses and privileges for our healthcare professionals. The speed with which our healthcare professionals can obtain the appropriate licenses, and we can credential them depends in part, on state licensing laws. Roughly 35 states are part of the Enhanced Nurse Compact and over 20 states are part of the Physical Therapy Licensure Compact and Interstate Medical Compact Acts. A decline or change in interstate compact laws can impact our business.
Our ability to ensure the quality of our healthcare professionals also relies heavily on the effectiveness of our data and communication systems as well as properly trained and competent team members and third-party vendors that credential and match healthcare professionals in suitable placements. We also rely on the accuracy and credibility of information provided by licensing bodies and educational institutions. An inability to properly credential, match, and monitor healthcare professionals for acceptable credentials, experience and performance may cause clients to lose confidence in our services that may damage our brand and reputation and result in clients opting to utilize competitors’ services or rely on their own internal resources. The costs and speed with which we provide these credentialing services, which in part is dependent on the availability of our third-party vendors, impact the revenue and profitability of our business.
Our operations may deteriorate if we are unable to continue to attract, develop and retain our sales and operations team members.
Our success depends heavily upon the recruitment, performance and retention of diverse sales and operations team members who share our values, passion and commitment to customer focus. The number of individuals who meet our qualifications for these positions is limited, and we may experience difficulty in attracting qualified candidates, especially as we diversify our offerings and our business becomes more complex. In addition, we commit substantial resources to the training, development and support of our team members. Competition for qualified sales and operational team members in the line of business in which we operate is strong, and we may not be able to retain a sufficient number of team members after we have expended the time and expense to recruit and train them. In addition, these team members may leave to establish competing businesses.
We are increasingly dependent on third parties for the execution of certain critical functions.
We have outsourced and offshored certain critical applications or business processes to external providers, including cloud-based, credentialing and data processing services. We exercise care in the selection and oversight of these providers. However, the failure or inability to perform on the part of one or more of these critical partners has caused and could in the future cause disruptions and increased costs. We are also dependent on security measures that some of our third-party vendors and customers are taking to protect their own systems and infrastructures. If our third-party vendors do not maintain adequate security measures, do not require their sub-contractors to maintain adequate security measures, do not perform as anticipated and in accordance with contractual requirements, or become targets of cyber-attacks, we may experience operational difficulties and increased costs, as well as reputational damage, which could materially and adversely affect our business.
The loss of key officers and management personnel could adversely affect our business and operating results.
We believe that the success of our business strategy and our ability to maintain our recent levels of profitability depends on the continued employment of our senior executive team. All of our executive officers are employees at will with standard
severance agreements. If members of our executive team become unable or unwilling to continue in their present positions, our business and financial results could be adversely affected.
Our inability to maintain our positive brand awareness and identity may adversely affect our results of operations.
We have invested substantial amounts in acquiring, developing and maintaining our brands, and our success depends on our ability to maintain positive brand awareness across business lines and effectively build up or consolidate our brand awareness and image for new services. Many of our brands have strong recognition within their applicable markets. We cannot assure that additional expenditures, our continuing commitment to marketing and improving our brands and executing on our brand and marketing strategies, including changes in brand names, consolidation of brands, or other rebranding efforts to improve the association of our brands with one another, will have the desired effect on our brands’ value and may adversely affect our results of operations and also result in an impairment of the fair market value of intangible assets associated with acquired tradenames. In addition, our brands may suffer reputational damage that could negatively affect our short- and long-term financial results. The poor performance, reputation or negative conduct of competitors may have a spillover effect adversely affecting the industry and our brand.
Our inability to consummate and effectively incorporate acquisitions into our business operations may adversely affect our long-term growth and our results of operations.
We invest time and resources in carefully assessing opportunities for acquisitions, and acquisitions are a key component of our growth strategy. We have made acquisitions in the past several years to broaden the scope and depth of our talent solutions. If we are unable to consummate additional acquisitions, we may not achieve our long-term growth goals.
Despite diligence and integration planning, acquisitions still present certain risks, including the time and economic costs of integrating an acquisition’s technology, control and financial systems, unforeseen liabilities, and the difficulties in bringing together different work cultures and personnel. Difficulties in integrating our acquisitions, including attracting and retaining talent to grow and manage these acquired businesses, may adversely affect our results of operations.
Businesses we acquire may have liabilities or adverse operating issues which could harm our operating results.
Businesses we acquire may have liabilities or adverse operating issues, or both, that we either fail to discover through due diligence or underestimate prior to the consummation of the acquisition. These liabilities and/or issues may include the acquired business’ failure to comply with, or other violations of, applicable laws, rules, or regulations or contractual or other obligations or liabilities. As the successor owner, we may be financially responsible for, and may suffer harm to our reputation or otherwise be adversely affected by, such liabilities and/or issues. These and any other costs, liabilities, issues, and/or disruptions associated with any past or future acquisitions could harm our reputation and operating results.
In addition, future acquisitions are accompanied by the risk that the obligations and liabilities of an acquired company may not be adequately reflected in the historical financial statements of that company and the risk that those historical financial statements may be based on assumptions that are incorrect or inconsistent with our assumptions or approach to accounting policies. Any of these material obligations, liabilities or incorrect or inconsistent assumptions could adversely impact our results of operations and financial condition.
As we develop new services and clients, enter new lines of business, and focus more of our business on providing a full range of talent solutions, the demands on our business and our operating risks may increase.
As part of our strategy, we plan to extend our services to new healthcare settings, clients, and new lines of business. As we focus on developing new services, capabilities, clients, practice areas and lines of business, and engage in business in new geographic locations, our operations may be exposed to additional as well as enhanced risks.
In particular, our growth efforts place substantial additional demands on our management and other team members, as well as on our information, financial, administrative, compliance and operational systems. We may not be able to manage these demands successfully. Growth may require increased recruiting efforts, increased regulatory and compliance efforts, increased business development, selling, marketing and other actions that are expensive and entail increased risk. We may need to invest more in our people and systems, controls, compliance efforts, policies and procedures than we anticipate. As our business continues to evolve and we provide a wider range of services, we will become increasingly dependent upon our employees, particularly those operating in business environments less familiar to us. Failure to identify, hire, train and retain talented employees who share our values could have a negative effect on our reputation and our business.
The demands that our current and future growth place on our people and systems, controls, compliance efforts, policies and procedures may exceed the benefits of such growth, and our operating results may suffer, at least in the short-term, and perhaps in the long-term.
The use of social media platforms presents risks and challenges that can cause damage to our brand and reputation.
The extensive use of social media platforms, including blogs, social media websites and other forms of internet-communication in our industry allows access to a broad audience of interested parties. The inappropriate and/or unauthorized use of certain media vehicles by our clients, vendors, employees and contractors could increase costs, cause damage to our brand, or result in information leakage that could lead to legal implications, including improper collection and/or dissemination of personally identifiable information of candidates and clients. In addition, negative or inaccurate posts or comments about us on any social networking website could damage our reputation, brand image and goodwill.
We maintain a substantial amount of goodwill and intangible assets on our balance sheet that may decrease our earnings or increase our losses if we recognize an impairment to goodwill or intangible assets.
We maintain goodwill on our balance sheet, which represents the excess of the total purchase price of our acquisitions over the fair value of the net assets and intangible assets we acquired. We evaluate goodwill and intangible assets for impairment annually or when evidence of potential impairment exists, respectively. If we identify an impairment, we record a non-cash charge to earnings. During the year ended December 31, 2024, we recognized goodwill impairment losses totaling $222.5 million. See additional information in “Item 8. Financial Statements and Supplementary Data—Notes to Consolidated Financial Statements—Note (4), Goodwill and Identifiable Intangible Assets.” We may have additional impairment losses in connection with our periodic evaluation of our goodwill and intangible assets. In the event of further impairment, a non-cash impairment charge could have a material adverse effect on our results of operations and balance sheet.
Risk Factors Related to Our Indebtedness and Other Liabilities
Our indebtedness could adversely affect our ability to raise additional capital to fund our operations, limit our ability to react to changes in the economy or our industry, and expose us to interest rate risk to the extent of any variable rate debt.
As of December 31, 2024, our total indebtedness, net of unamortized fees and premium, equaled $1,055.9 million. Our amount of indebtedness could increase our vulnerability to adverse economic, industry or competitive developments, including:
•requiring a portion of our cash flows from operations to be dedicated to the payment of our indebtedness, therefore reducing our ability to use our cash flows to fund operations, capital expenditures and future business opportunities,
•making it more difficult for us to satisfy our obligations with respect to our indebtedness,
•restricting us from making strategic acquisitions or causing us to make non-strategic divestitures,
•limiting our ability to obtain additional financing for working capital, capital expenditures, product and service development, debt service requirements, acquisitions, and general corporate or other purposes, and
•limiting our flexibility in planning for, or reacting to, changes in our business or market conditions and placing us at a competitive disadvantage compared to our competitors who are less leveraged and who, therefore, may be able to take advantage of opportunities that our indebtedness may prevent us from pursuing.
Our ability to service our indebtedness will depend on our ability to generate cash in the future. We cannot provide assurance that our business will generate sufficient cash flow from operations or that future borrowings will be available in an amount sufficient to enable us to service our indebtedness or to fund other liquidity needs. Additionally, if we are not in compliance with the covenants and obligations under our debt instruments, we would be in default, and the lenders could call the debt, which would have a material adverse effect on our business. And in certain instances, our debt instruments may limit our ability to redeem or prepay some or all of the outstanding principal amount prior to maturity, or in other instances, require the payment of premium in excess of the principal amount.
The terms of our debt instruments impose restrictions on us that may affect our ability to successfully operate our business.
Our debt instruments contain various covenants that could adversely affect our ability to finance our future operations or capital needs and to engage in other business activities that may be in our best interest. These covenants limit our ability to, among other things:
•incur or guarantee additional indebtedness or issue certain preferred equity,
•pay dividends on, redeem, repurchase, or make distributions in respect of our capital stock, prepay, redeem, or repurchase certain debt or make other restricted payments,
•make certain investments,
•create, or permit to exist, certain liens,
•sell assets,
•enter into sale/leaseback transactions,
•enter into agreements restricting restricted subsidiaries’ ability to pay dividends or make other payments,
•consolidate, merge, sell, or otherwise dispose of all or substantially all of our assets,
•enter into certain transactions with affiliates, and
•designate restricted subsidiaries as unrestricted subsidiaries.
Our ability to comply with these covenants may be affected by events beyond our control, such as prevailing economic conditions and changes in regulations, and if such events occur, we cannot be sure that we will be able to comply. A breach of these covenants could result in a default under our debt instruments and, in the case of our senior credit facility under our credit agreement, permit the lenders thereunder to cease making loans to us. If there were an event of default under any of our debt instruments, holders of such defaulted debt could cause all amounts borrowed under the applicable instrument to be due and payable immediately. Our assets or cash flow may not be sufficient to repay borrowings under our outstanding debt instruments in the event of a default thereunder.
In addition, the restrictive covenants in our credit agreement require us to maintain specified financial ratios and satisfy other financial condition tests. Although we were in compliance with the financial ratios and financial condition tests set forth in our credit agreement on December 31, 2024, we cannot provide assurance that we will continue to be. Our ability to meet those financial ratios and tests will depend on our ongoing financial and operating performance, which, in turn, will be subject to economic conditions and to financial, market, and competitive factors, many of which are beyond our control. A breach of any of these covenants could result in a default under our credit agreement (and our other debt instruments to the extent the default triggers a cross default provision) and, in the case of the revolver under our credit agreement, permit the lenders thereunder to cease making loans to us. Upon the occurrence of an event of default under the credit agreement, the lenders could elect to declare all amounts outstanding thereunder to be immediately due and payable and terminate all commitments to extend further credit. Such action by the lenders could cause cross-defaults under our other debt instruments.
Variable rate indebtedness subjects us to interest rate risk, which could cause our debt service obligations to increase significantly.
Borrowings under our credit agreement are at variable rates of interest and expose us to interest rate risk. As interest rates increase, our debt service obligations on certain of our variable rate indebtedness will increase even though the amount borrowed remains the same.
We have substantial insurance-related accruals and legal accruals on our balance sheet, and any significant adverse adjustments may decrease our earnings or increase our losses and negatively impact our cash flows.
We maintain accruals related to legal matters, our captive insurance company and self-insured retentions for various lines of insurance coverage, including professional liability, employment practices, health insurance and workers’ compensation on our balance sheet. We determine the adequacy of our accruals by evaluating legal matters, our historical experience and trends, related to both insurance claims and payments, information provided to us by our insurance brokers, attorneys, third-party administrators and actuarial firms as well as industry experience and trends. If such information collectively indicates that our accruals are understated, we provide for additional accruals; a significant increase to these accruals would decrease our earnings.
Item 1B. Unresolved Staff Comments
None.
Item 1C. Cybersecurity
AMN Healthcare’s board of directors (the “Board”) is responsible for overseeing our enterprise-wide risk management program. The audit committee of the Board (the “Audit Committee”) has primary oversight responsibility for information and cybersecurity, including internal controls designed to mitigate risks related to these topics. This includes regular, and at least quarterly, review by the Audit Committee of reports on topics including, among others, significant cybersecurity risks, results from third-party assessments, training and vulnerability testing, and our incident response plan. Material breaches, if any, and any disclosure obligations arising from any such breach are also discussed separately with the Audit Committee as part of the Board’s risk oversight generally.
AMN’s information and cybersecurity program reports up to our Chief Information & Digital Officer (“CIO”) and is managed by our Vice President, Information & Cyber Security, whose team is responsible for leading our enterprise-wide cybersecurity strategy. Through ongoing communications with the team, the CIO and the Vice President, Information & Cyber Security, are informed about and monitor the prevention, detection, mitigation and remediation of cybersecurity incidents and progress on cybersecurity infrastructure initiatives. In the event of a material cybersecurity incident, the CIO, in coordination with AMN’s Chief Legal Officer, will escalate to the Audit Committee and the Board is made aware as appropriate and in accordance with AMN’s incident response plan. Our CIO and Vice President, Information & Cyber Security have proven experience as technology leaders establishing and overseeing enterprise information security programs in the healthcare industry. Our CIO has over 25 years of experience serving as Chief Information Officer, Senior Vice President of IT, and Director of IT at various healthcare services and technology companies. AMN’s Vice President, Information & Cyber Security has over 20 years of experience in various roles in information technology and information security. He holds a M.Sc. in Computer Information Systems and holds several relevant certifications, including Certified Information Security Manager and Zero Trust Certified Architect.
AMN’s Privacy function, which reports up through our Chief Legal Officer, works collaboratively with the Information Security function to create and review policies, standards and processes. In addition to updating the Audit Committee, the CIO and Vice President, Information & Security, and Privacy team provide regular updates to the Corporate Governance and Compliance Committee, as well as our Chief Executive Officer and other members of our senior management as appropriate.
AMN’s information and cybersecurity program has adopted policies, standards, processes, and practices that follow recognized frameworks established by the National Institute of Standards and Technology (“NIST”), the International Organization for Standardization, and other relevant standards. AMN Healthcare has also implemented certain controls and procedures that allow its management to assess, identify, and manage material risks from cybersecurity threats. Our processes are integrated into the overall enterprise risk management program, which includes financial risk, compliance risk and other strategic and operational risks that affect the Company. These processes complement our enterprise-wide risk assessment architecture, as implemented by the Company’s management and as overseen by the Board through its Audit Committee.
To identify and assess material risks from cybersecurity threats, we engage in regular network and endpoint monitoring, vulnerability assessments, penetration testing, and periodic tabletop exercises. We have developed an incident response plan to manage identified vulnerabilities and further improve our cybersecurity preparedness and response infrastructure. The incident response plan sets forth the actions to be taken in responding to and recovering from cybersecurity incidents, which include triage, assessing the severity of incidents, escalation protocols, containment of incidents, investigation of incidents, and remediation.
In addition to our in-house capabilities, we engage with key security and technology vendors, industry participants and intelligence communities to assess our program and test our technical capabilities and enhance the effectiveness of our information and cybersecurity policies and procedures. We use a combination of tools and technologies to protect AMN Healthcare’s assets and information. We maintain and operate a proactive threat intelligence program to identify and assess risk. We have implemented processes to identify, monitor and address material risks from cybersecurity threats associated with our use of third-party vendors, including those in our supply chain or who have access to our systems, data or facilities that house such systems or data.
Our team members receive annual training to understand the behaviors necessary to protect company and personal information and receive annual training on privacy laws and requirements. We also offer ongoing practice and education for team members to recognize and report suspicious activity, including phishing campaigns.
The Company has experienced cyber threats resulting in immaterial cyber incidents and expects cyber threats to continue with varying levels of sophistication.
Item 2. Properties
We lease all of our properties, which consist of office-type facilities. We believe that our leased space is adequate for our current needs and that we can obtain adequate space to meet our foreseeable business needs. We have pledged substantially all of our leasehold interests to our lenders under our credit agreement to secure our obligations thereunder. We set forth below our principal leased office spaces as of December 31, 2024 together with our business segments that utilize them: | | | | | |
| Location | Square Feet |
| Dallas, Texas (all segments) | 92,420 | |
| San Diego, California (all segments) | 50,519 | |
See additional information in “Item 8. Financial Statements and Supplementary Data—Notes to Consolidated Financial Statements—Note (5), Leases.”
Item 3. Legal Proceedings
Information with respect to this item may be found in “Item 8. Financial Statements and Supplementary Data—Notes to Consolidated Financial Statements—Note (12), Commitments and Contingencies,” which is incorporated herein by reference. Item 4. Mine Safety Disclosures
Not applicable.
PART II
Item 5. Market For Registrant’s Common Equity, Related Stockholder Matters and Issuer Purchases of Equity Securities
Our common stock trades on the New York Stock Exchange under the symbol “AMN.” As of February 18, 2025, there were 17 stockholders of record of our common stock, one of which was Cede & Co., a nominee for The Depository Trust Company. All of our common stock held by brokerage firms, banks and other financial institutions as nominees for beneficial owners are considered to be held of record by Cede & Co., which is considered to be one stockholder of record. A substantially greater number of holders of our common stock are “street name” or beneficial holders, whose shares are held of record by banks, brokers and other financial institutions. Because such shares are held on behalf of stockholders, and not by the stockholders directly, and because a stockholder can have multiple positions with different brokerage firms, banks and other financial institutions, we are unable to determine the total number of stockholders we have without undue burden and expense.
During the fiscal year ended December 31, 2024, we did not sell any equity securities that were not registered under the Securities Act.
From time to time, we may repurchase our common stock in the open market pursuant to programs approved by our board of directors (the “Board”). We may repurchase our common stock for a variety of reasons, such as acquiring shares to offset dilution related to equity-based incentives and optimizing our capital structure. On November 1, 2016, the Board authorized us to repurchase up to $150.0 million of our outstanding common stock in the open market. On November 10, 2021, February 17, 2022, June 15, 2022, and February 16, 2023, we announced increases to the repurchase program totaling $1,200.0 million. These increases brought the total authorization of the repurchase program to $1,350.0 million, of which $226.7 million remained as of December 31, 2024. Under the repurchase program announced on November 1, 2016 and the aforementioned increases (collectively, the “Company Repurchase Program”), share repurchases may be made from time to time, depending on prevailing market conditions and other considerations. The Company Repurchase Program has no expiration date and may be discontinued or suspended at any time. Additionally, we or our affiliates may, at any time and from time to time, seek to retire or purchase our outstanding debt through cash purchases and/or exchanges for equity or debt, in open-market purchases, privately negotiated transactions or otherwise. Such repurchases or exchanges, if any, will be upon such terms and at such prices as we may determine, and will depend on prevailing market conditions, our liquidity requirements, contractual restrictions and other factors. The amounts involved may be material.
During 2024, we did not repurchase any shares of our common stock. As of December 31, 2024, we have repurchased 12.6 million shares of our common stock at an average price of $89.04 per share excluding broker’s fees under the Company Repurchase Program, resulting in an aggregate purchase price of $1,123.3 million, excluding the effect of excise taxes, since 2016. See “Item 8. Financial Statements and Supplementary Data—Notes to Consolidated Financial Statements—Note (10)(b), Capital Stock—Treasury Stock.” All share repurchases to date were made under the Company Repurchase Program, which is the only repurchase program of the Company currently in effect.
We have not paid any dividends on our common stock in the past and currently do not expect to pay cash dividends or make any other distributions on common stock in the future. We expect to retain our future earnings, if any, for use in the operation and expansion of our business, to pay down debt and potentially for share repurchases. Any future determination to pay dividends on common stock will be at the discretion of the Board and will depend upon our financial condition, results of operations, capital requirements and such other factors as the Board deems relevant. In addition, our ability to declare and pay dividends on our common stock is subject to covenants restricting such actions in the instruments governing our debt. See “Item 7. Management’s Discussion and Analysis of Financial Condition and Results of Operations—Liquidity and Capital Resources” and “Item 8. Financial Statements and Supplementary Data—Notes to Consolidated Financial Statements—Note (8), Notes Payable and Credit Agreement.”
The information required by Item 201(d) of Regulation S-K is incorporated by reference to the table set forth in Item 12 of this Annual Report on Form 10-K.
Performance Graph
This performance graph shall not be deemed “filed” with the SEC or subject to Section 18 of the Exchange Act, nor shall it be deemed incorporated by reference in any of our filings under the Exchange Act or the Securities Act.
The graph below compares the total return on our common stock with the total return of (i) the Russell 2000 Index, and (ii) the S&P Healthcare Services Select Industry Index (“SPSIHP”), assuming an investment of $100 on December 31, 2019 in our common stock and the stocks comprising the Russell 2000 Index and the SPSIHP, respectively.
| | | | | | | | | | | | | | | | | | | | | | | | | | | | | | | | | | | |
| 12/31/19 | | 12/31/20 | | 12/31/21 | | 12/31/22 | | 12/31/23 | | 12/31/24 |
| AMN Healthcare Services, Inc. | 100.00 | | | 109.53 | | | 196.32 | | | 165.01 | | | 120.17 | | | 38.39 | |
| Russell 2000 | 100.00 | | | 119.96 | | | 137.74 | | | 109.59 | | | 128.14 | | | 142.93 | |
| SPSIHP | 100.00 | | | 133.81 | | | 147.19 | | | 118.22 | | | 124.34 | | | 126.92 | |
Item 6. [Reserved]
Item 7. Management’s Discussion and Analysis of Financial Condition and Results of Operations
You should read the following discussion in conjunction with our consolidated financial statements and the notes thereto and other financial information included elsewhere in this Annual Report on Form 10-K. Certain statements in this “Management’s Discussion and Analysis (“MD&A”) of Financial Condition and Results of Operations” are “forward-looking statements.” See “Special Note Regarding Forward-Looking Statements” under Item 1, “Business.” We intend this MD&A section to provide you with a narrative from the perspective of our management on our financial condition, results of operations, liquidity and certain other factors that may affect our future results. The following sections comprise this MD&A:
•Overview of Our Business
•Operating Metrics
•Recent Trends
•Results of Operations
•Liquidity and Capital Resources
•Critical Accounting Policies and Estimates
•Recent Accounting Pronouncements
Overview of Our Business
We provide technology-enabled healthcare workforce solutions and staffing services to healthcare organizations across the nation. The Company provides access to a comprehensive network of healthcare professionals through its recruitment strategies and breadth of career opportunities. We help providers optimize their workforce to reduce complexity and increase efficiency. Our total talent solutions include vendor neutral and managed services programs (“MSP”), clinical and interim healthcare leaders, temporary staffing, permanent placement, executive search, vendor management systems (“VMS”), recruitment process outsourcing, predictive modeling, language services, revenue cycle solutions, and other services. Clients include acute-care hospitals, community health centers and clinics, physician practice groups, retail and urgent care centers, home health facilities, schools and many other healthcare settings.
Through our nurse and allied solutions segment, we provide hospitals, other healthcare facilities, and schools with a comprehensive set of staffing solutions, including direct, vendor neutral, and managed services solutions in which we manage and staff all the temporary and permanent nursing and allied staffing needs, as well as the revenue cycle management needs, of a client. A majority of our placements in this segment are under our managed services solution.
Through our physician and leadership solutions segment, we place physicians of all specialties, as well as dentists and advanced practice providers, with clients on a temporary basis, generally as independent contractors. We also recruit physicians and healthcare leaders for permanent placement and place interim leaders and executives across all healthcare settings. The interim healthcare leaders and executives we place are typically placed on contracts with assignment lengths ranging from a few days to one year.
Through our technology and workforce solutions segment, we provide hospitals and other healthcare facilities with a range of workforce solutions, including: (1) language services, (2) software-as-a-service (“SaaS”)-based VMS technologies through which our clients can self-manage the procurement of contingent clinical labor and their internal float pool, (3) workforce optimization services that include consulting, data analytics, predictive modeling, and SaaS-based scheduling technology, and (4) recruitment process outsourcing services in which we recruit, hire and/or onboard permanent clinical and nonclinical positions on behalf of our clients.
For the year ended December 31, 2024, we recorded revenue of $2,983.8 million, as compared to $3,789.3 million for 2023. We recorded net income (loss) of $(147.0) million for 2024, as compared to $210.7 million for 2023. Nurse and allied solutions segment revenue comprised 61% and 69% of total consolidated revenue for the years ended December 31, 2024 and 2023, respectively. Physician and leadership solutions segment revenue comprised 24% and 18% of total consolidated revenue for the years ended December 31, 2024 and 2023, respectively. Technology and workforce solutions segment revenue comprised 15% and 13% of total consolidated revenue for the years ended December 31, 2024 and 2023, respectively. For a description of the services we provide under each of our business segments, please see, “Item 1. Business—Our Services.”
We believe we are recognized as a market-leading innovator in providing healthcare talent solutions in the United States. We seek to advance our position through a number of strategies that focus on market penetration, expansion of our talent solutions, increasing operational efficiency and scalability and increasing our supply of qualified healthcare professionals. Our
market growth strategy continues to focus on broadening and investing, both organically and through strategic acquisitions, in service and technology offerings beyond our traditional temporary staffing and permanent placement services, to include more strategic and recurring revenue sources from innovative talent solutions offerings such as MSP, VMS, workforce optimization service, and other technology-enabled services. We also seek strategic opportunities to expand into complementary service offerings to our staffing businesses that leverage our core capabilities of recruiting and credentialing healthcare professionals.
Operationally, our strategic initiatives focus on investing in digitizing and further developing our processes and systems to achieve market leading efficiency and scalability, which we believe will provide operating leverage as our revenue grows. From a healthcare professional supply perspective, we continue to invest in new candidate recruitment and engagement initiatives and technologies to retain and grow our network of qualified healthcare professionals.
Over the last several years, we have worked to execute on our management strategies and intend to continue to do so in the future. As part of our long-term growth strategy to add value for our clients, healthcare professionals, and stockholders, we acquired MSI Systems Corp. and DrWanted.com LLC (together “MSDR”) on November 30, 2023 and Connetics on May 13, 2022. See additional information in “Item 8. Financial Statements and Supplementary Data—Notes to Consolidated Financial Statements—Note (2), Acquisitions.” We typically experience modest seasonal fluctuations during our fiscal year and they tend to vary among our business segments. These fluctuations can vary slightly in intensity from year to year. Over the past five years, these quarterly fluctuations have been muted in our consolidated results.
Operating Metrics
In addition to our consolidated and segment financial results, we monitor the following key metrics to help us evaluate our results of operations and financial condition and make strategic decisions. We believe this information is useful in understanding our operational performance and trends affecting our businesses.
•Average travelers on assignment represents the average number of nurse and allied healthcare professionals on assignment during the period, which is used by management as a measure of volume in our nurse and allied solutions segment;
•Bill rates represent the hourly straight-time rates that we bill to clients, which are an indicator of labor market trends and costs within our nurse and allied solutions segment;
•Billable hours represent the number of hours worked by our healthcare professionals that we are able to bill on client engagements, which are used by management as a measure of volume in our nurse and allied solutions segment;
•Days filled is calculated by dividing total locum tenens hours filled during the period by eight hours, which is used by management as a measure of volume in our locum tenens business within our physician and leadership solutions segment;
•Revenue per day filled is calculated by dividing revenue of our locum tenens business by days filled for the period, which is an indicator of labor market trends and costs in our locum tenens business within our physician and leadership solutions segment; and
•Minutes represent the time-based utilization of interpretation services that we are able to bill our clients, which are used by management as a measure of volume in our language services business within our technology and workforce solutions segment.
Recent Trends
Since the COVID-19 pandemic subsided, healthcare organizations have aggressively hired permanent staff and focused on cost containment and alternative staffing models that enabled them to reduce utilization of contingent labor. As a result, overall demand for our nurse and allied solutions segment declined significantly and remains below pre-pandemic levels. Within the segment, travel nurse demand has experienced the most significant decline, but has seen an increase in demand as measured by open orders from the second quarter through the fourth quarter. Demand for our allied staffing business has remained steady and continues to be above pre-pandemic levels with high demand in therapy and imaging.
Staffing volumes for our nurse and allied solutions segment during the fourth quarter were flat to the prior quarter after sequential declines throughout 2023 and 2024. Visa retrogression has negatively impacted international nurse volumes, which we expect to continue into next year. Additionally, we supported a significant labor disruption event in the fourth quarter, which favorably impacted the segment’s revenue. Bill rates in the fourth quarter were flat to the prior quarter after a modest sequential decline, which we believe indicates stabilization of market rates.
In our physician and leadership solutions segment, demand for our locum tenens staffing business in the fourth quarter declined from the prior year though it was higher compared with the prior quarter. Certified registered nurse anesthetists (CRNAs) continue to be the largest specialty for our locum tenens staffing business. Revenue per day filled increased in the
fourth quarter as compared to both the prior year and prior quarter. Demand for our interim leadership and search businesses in the fourth quarter was below prior year, but demand in our interim leadership business was up sequentially. Demand for these businesses has been impacted by healthcare organizations deferring hiring decisions or increasing insourcing.
In our technology and workforce solutions segment, our language services business continued to experience an increase in minutes from our existing clients and growth from new clients. Volumes in our VMS business followed similar trends as our travel nurse business as compared to the prior year and prior quarter. VMS bill rates in the fourth quarter were down sequentially and year over year.
Results of Operations
The following table sets forth, for the periods indicated, certain statements of operations data as a percentage of revenue. Our results of operations include three reportable segments: (1) nurse and allied solutions, (2) physician and leadership solutions, and (3) technology and workforce solutions. The acquisitions during the three years ended December 31, 2024 impact the comparability of the results between the years presented. See additional information in “Item 8. Financial Statements and Supplementary Data—Notes to Consolidated Financial Statements—Note (2), Acquisitions.” Our historical results are not necessarily indicative of our results of operations to be expected in the future. | | | | | | | | | | | | | | | | | | | | |
| | Years Ended December 31, | |
| | 2024 | | 2023 | | 2022 | |
| Consolidated Statements of Operations: | | | | | | |
| Revenue | 100.0 | | % | 100.0 | | % | 100.0 | | % |
| Cost of revenue | 69.2 | | | 67.0 | | | 67.3 | | |
| Gross profit | 30.8 | | | 33.0 | | | 32.7 | | |
| Selling, general and administrative | 21.2 | | | 20.0 | | | 17.9 | | |
| Depreciation and amortization | 5.5 | | | 4.1 | | | 2.5 | | |
| Goodwill impairment losses | 7.5 | | | — | | | — | | |
| Income (loss) from operations | (3.4) | | | 8.9 | | | 12.3 | | |
| Interest expense, net, and other | 2.4 | | | 1.4 | | | 0.7 | | |
| Income (loss) before income taxes | (5.8) | | | 7.5 | | | 11.6 | | |
| Income tax expense (benefit) | (0.9) | | | 1.9 | | | 3.1 | | |
| Net income (loss) | (4.9) | | % | 5.6 | | % | 8.5 | | % |
Comparison of Results for the Year Ended December 31, 2024 to the Year Ended December 31, 2023
Revenue. Revenue decreased 21% to $2,983.8 million for 2024 from $3,789.3 million for 2023, attributable to a decline in organic revenue across our segments with the greatest decline in our nurse and allied solutions segment.
Nurse and allied solutions segment revenue decreased 31% to $1,815.7 million for 2024 from $2,624.5 million for 2023. The $808.8 million decrease was primarily attributable to a $592.1 million decline driven by a 24% decrease in the average number of travelers on assignment, a $257.0 million decline driven by an approximately 10% decrease in the average bill rate, and a $41.1 million decline driven by a 2% decrease in average billable hours during the year ended December 31, 2024. The overall decrease was partially offset by a $50.0 million increase in labor disruption revenue.
Physician and leadership solutions segment revenue increased 9% to $728.6 million for 2024 from $669.7 million for 2023. The $58.9 million increase was attributable to higher revenue in our locum tenens business, which was partially offset by lower revenue in our interim leadership, physician permanent placement and executive search businesses. Revenue in our locum tenens business grew $101.6 million (or 22%) during 2024 primarily due to the favorable impact of $23.9 million as a result of a 6% increase in the revenue per day filled on an organic basis and additional revenue of $121.2 million in connection with the MSDR acquisition, partially offset by a $43.5 million decline driven by a 10% decrease in the number of days filled on an organic basis. As a result of a decline in demand, revenue in our interim leadership business experienced a decline of $21.3 million (or 16%), while our physician permanent placement and executive search businesses declined $21.4 million (or 31%) during 2024.
Technology and workforce solutions segment revenue decreased 11% to $439.5 million for 2024 from $495.0 million for 2023. The $55.6 million decrease was primarily attributable to declines within our VMS business and outsourced solutions businesses, partially offset by growth within our language services business. Revenue for our VMS business declined $65.1 million (or 38%) for similar reasons as nurse and allied solutions segment revenue and our outsourced solutions business
declined $25.5 million (or 62%) primarily due to a decline in demand, while our language services business grew $38.1 million (or 15%) primarily due to growth of $43.2 million as a result of a 17% increase in minutes during 2024.
For 2024 and 2023, revenue under our MSP arrangements comprised approximately 45% and 54% of our consolidated revenue, 67% and 72% for nurse and allied solutions segment revenue, 15% and 20% for physician and leadership solutions segment revenue, and 3% and 2% of our technology and workforce solutions segment revenue, respectively.
Cost of Revenue. Cost of revenue, which consists predominantly of compensation, benefits, housing, travel and allowance costs for healthcare professionals and medically qualified interpreters, decreased 19% to $2,064.4 million for 2024 from $2,539.7 million for 2023. The $475.3 million decrease was attributable to a decline in our nurse and allied solutions segment, partially offset by increases in our physician and leadership solutions and technology and workforce solutions segments. The decrease in our nurse and allied solutions segment was primarily attributable to a $555.1 million decrease in provider pay package costs, including housing, travel and allowances, primarily due to the aforementioned decrease in the average number of travelers on assignment. The increase in our physician and leadership solutions segment was driven by a $71.8 million increase in provider pay package costs, primarily due to the MSDR acquisition. The increase in our technology and workforce solutions segment was primarily attributable to $13.1 million of higher compensation and benefits mainly from the aforementioned increase in minutes in our language services business. Cost of revenue broken down among the reportable segments is as follows:
| | | | | | | | | | | |
| | (In Thousands)
Years Ended
December 31, |
| | 2024 | | 2023 |
| Nurse and allied solutions | $ | 1,371,660 | | | $ | 1,932,099 | |
| Physician and leadership solutions | 511,959 | | | 440,230 | |
| Technology and workforce solutions | 180,786 | | | 167,344 | |
| $ | 2,064,405 | | | $ | 2,539,673 | |
Gross Profit. Gross profit decreased 26% to $919.4 million for 2024 from $1,249.6 million for 2023, representing gross margins of 30.8% and 33.0%, respectively. The decline in consolidated gross margin for the year ended December 31, 2024 was primarily due to (1) lower margins in our nurse and allied solutions and physician and leadership solutions segments driven by higher provider pay packages, including housing, travel and allowances and (2) a lower margin in our technology and workforce solution segment primarily due to a change in sales mix resulting from lower revenue in our higher-margin VMS business and higher revenue in our lower-margin language services business. The overall decline was partially offset by a change in sales mix resulting from lower revenue in our nurse and allied solutions segment. Gross margin by reportable segment for 2024 and 2023 was 24.5% and 26.4% for nurse and allied solutions, 29.7% and 34.3% for physician and leadership solutions, and 58.9% and 66.2% for technology and workforce solutions, respectively.
Selling, General and Administrative Expenses. Selling, general and administrative (“SG&A”) expenses consist predominantly of compensation and benefits costs for corporate employees, in addition to professional service fees, legal matter accruals and other overhead costs. SG&A expenses were $632.5 million, representing 21.2% of revenue, for 2024, as compared to $756.2 million, representing 20.0% of revenue, for 2023. The decrease in SG&A expenses was primarily due to $60.4 million of lower employee compensation and benefits (inclusive of share-based compensation) in response to the lower revenue, a $34.1 million decrease in professional services, legal and other expenses driven by a $21.0 million increase in the legal settlement accrual for the Clarke matter recognized in the prior year and prudent expense management, an approximately $22.1 million decrease in other expenses associated with our revenue decline, and a $2.4 million decrease related to changes in the fair value of contingent consideration liabilities from acquisitions recognized in the prior year. The year-over-year increase in SG&A expenses in our physician and leadership solutions segment was driven by $22.9 million of additional SG&A expenses from the MSDR acquisition, partially offset by $18.6 million of lower segment expenses amid the decline in organic revenue. SG&A expenses broken down among the reportable segments, unallocated corporate overhead, and share-based
compensation are as follows: | | | | | | | | | | | |
| | (In Thousands)
Years Ended
December 31, |
| | 2024 | | 2023 |
| Nurse and allied solutions | $ | 270,467 | | | $ | 330,252 | |
| Physician and leadership solutions | 137,600 | | | 134,505 | |
| Technology and workforce solutions | 91,590 | | | 118,977 | |
| Unallocated corporate overhead | 109,515 | | | 154,484 | |
| Share-based compensation | 23,317 | | | 18,020 | |
| $ | 632,489 | | | $ | 756,238 | |
Depreciation and Amortization Expenses. Amortization expense increased 3% to $92.8 million for 2024 from $89.8 million for 2023, primarily attributable to additional amortization expense related to the intangible assets acquired in the MSDR acquisition, partially offset by having more intangible assets fully amortized during the year ended December 31, 2024. Depreciation expense (exclusive of depreciation included in cost of revenue) increased 14% to $74.3 million for 2024 from $65.2 million for 2023, primarily attributable to an increase in purchased and developed hardware and software placed in service for our ongoing technology investments to support our tech-centric total talent solutions initiatives and to optimize our internal front and back-office systems. Additionally, $6.7 million and $6.0 million of depreciation expense for our language services business is included in cost of revenue for 2024 and 2023, respectively.
Goodwill Impairment Losses. Goodwill impairment losses of $123.3 million and $99.2 million were recognized in the nurse and allied solutions segment and physician and leadership solutions segment, respectively, during the year ended December 31, 2024. See additional information in “Item 8. Financial Statements and Supplementary Data—Notes to Consolidated Financial Statements—Note (4), Goodwill and Identifiable Intangible Assets.”
Interest Expense, Net, and Other. Interest expense, net, and other, was $69.9 million for 2024 as compared to $54.1 million for 2023. The increase was primarily due to a higher average debt outstanding balance during 2024.
Income Tax Expense. Income tax benefit was $25.6 million for 2024 as compared to income tax expense of $73.6 million for 2023, reflecting effective income tax rates of 15% and 26% for these periods, respectively. Although the amount of annual non discrete items has remained relatively similar year over year, income (loss) before income taxes has declined year over year mostly related to impairment losses. This resulted in an $18.0 million tax expense which, due to loss before income taxes, contributed to the decline in the year over year effective income tax rates. See additional information in “Item 8. Financial Statements and Supplementary Data—Notes to Consolidated Financial Statements—Note (7), Income Taxes, and Note (4), Goodwill and Identifiable Assets.”
Comparison of Results for the Year Ended December 31, 2023 to the Year Ended December 31, 2022
We describe in detail the comparison of results for the years ended December 31, 2023 and 2022 in “Item 7. Management’s Discussion and Analysis of Financial Condition and Results of Operations—Results of Operations—Comparison of Results for the Year Ended December 31, 2023 to the Year Ended December 31, 2022” of our 2023 Annual Report on Form 10-K.
Liquidity and Capital Resources
In summary, our cash flows were:
| | | | | | | | | | | | | | | | | |
| (In Thousands) |
| | Years Ended December 31, |
| | 2024 | | 2023 | | 2022 |
| Net cash provided by operating activities | $ | 320,418 | | | $ | 372,165 | | | $ | 653,733 | |
| Net cash used in investing activities | (79,938) | | | (412,493) | | | (170,710) | |
| Net cash provided by (used in) financing activities | (259,448) | | | 10,729 | | | (591,865) | |
| Net decrease in cash, cash equivalents and restricted cash | (18,968) | | | $ | (29,599) | | | $ | (108,842) | |
Historically, our primary liquidity requirements have been for acquisitions, working capital requirements, and debt service under our credit facilities and senior notes. We have funded these requirements through internally generated cash flow and funds borrowed under our credit facilities and senior notes.
As of December 31, 2024, (1) $210.0 million was drawn with $519.6 million of available credit under the Senior Credit Facility (as defined below), (2) the aggregate principal amount of our 2027 Notes (as defined below) outstanding was $500.0 million, and (3) the aggregate principal amount of our 2029 Notes (as defined below) outstanding was $350.0 million. As of December 31, 2024, we were in compliance with the various covenants under our debt instruments. We describe in further detail our Amended Credit Agreement (as defined below), under which our Senior Credit Facility is governed, the 2027 Notes, and the 2029 Notes in “Item 8. Financial Statements and Supplementary Data—Notes to Consolidated Financial Statements—Note (8), Notes Payable and Credit Agreement.” As of December 31, 2024, the total of our contractual obligations under operating leases with initial terms in excess of one year was $50.2 million. We describe in further detail our operating lease arrangements in “Item 8. Financial Statements and Supplementary Data—Notes to Consolidated Financial Statements—Note (5), Leases.” We also have various obligations and working capital requirements, such as certain tax and legal matters, contingent consideration and other liabilities, that are recorded on our consolidated balance sheets. See additional information in “Item 8. Financial Statements and Supplementary Data—Notes to Consolidated Financial Statements—Note (3), Fair Value Measurement, Note (6), Balance Sheet Details, Note (7), Income Taxes, and Note (12), Commitments and Contingencies.” In addition to our cash requirements, we have a share repurchase program authorized by our board of directors, which does not require the purchase of any minimum number of shares and may be suspended or discontinued at any time. See additional information in “Item 5. Market For Registrant’s Common Equity, Related Stockholder Matters and Issuer Purchases of Equity Securities.”
We believe that cash generated from operations and available borrowings under our Senior Credit Facility will be sufficient to fund our operations and liquidity requirements, including expected capital expenditures, for the next 12 months and beyond. We intend to finance potential future acquisitions with cash provided from operations, borrowings under our Senior Credit Facility, or other borrowings under our Amended Credit Agreement, bank loans, debt or equity offerings, or some combination of the foregoing. The following discussion provides further details of our liquidity and capital resources.
Operating Activities
Net cash provided by operating activities for 2024, 2023 and 2022 was $320.4 million, $372.2 million and $653.7 million, respectively. The decrease in net cash provided by operating activities for 2024 from 2023 was primarily attributable to (1) a decrease in net income (loss) excluding non-cash expenses of $187.8 million primarily due to a decline in segment operating income in each of our segments, (2) an increase in other current assets between periods of $12.7 million primarily due to subcontractor deposits related to labor disruption services in the current year, and (3) an increase in income taxes receivable between periods of $7.8 million primarily due to a larger overpayment of estimated taxes during the current year as compared to 2023. The overall decrease in net cash provided by operating activities was partially offset by (1) an increase in accrued compensation and benefits between periods of $68.8 million primarily due to bonuses and commissions that were paid during the first quarter of 2023, (2) an increase in other liabilities between periods of $54.7 million primarily due to client deposits related to labor disruption services in the current year, and (3) an increase in accounts payable and accrued expenses between periods of $28.6 million primarily due to (a) a larger decrease in the subcontractor payable balance in the prior year as compared to the current year primarily attributable to declines in associate vendor usage and (b) a decrease in the accrued expenses balance in the current year as a result of a decrease in operating expenses associated with our revenue decline and timing of payments, partially offset by a payment of the legal settlement amount for the Clarke matter in the current year. Our Days Sales Outstanding (“DSO”) was 55 and 70 days at December 31, 2024 and December 31, 2023, respectively. Our consolidated results for the year ended December 31, 2023 included only one month of MSDR’s revenue, but our consolidated balance sheet included the full amount of MSDR’s accounts receivable. Excluding the acquisition of MSDR, our DSO was 66 days at December 31, 2023.
Investing Activities
Net cash used in investing activities for 2024, 2023 and 2022 was $79.9 million, $412.5 million and $170.7 million, respectively. The year-over-year decrease from 2023 to 2024 in net cash used in investing activities was primarily attributable to (1) no cash paid for acquisitions in 2024 as compared to $292.2 million in 2023 and (2) $8.4 million of payments to fund the deferred compensation plan in 2024 as compared to $24.9 million in 2023. In addition, capital expenditures were $80.9 million, $103.7 million and $75.8 million for the years ended December 31, 2024, 2023 and 2022, respectively. Our capital expenditures in recent years were primarily related to ongoing technology investments to support our tech-centric total talent solutions initiatives and to optimize our internal front and back-office systems.
Financing Activities
Net cash provided by (used in) financing activities for 2024, 2023 and 2022 was $(259.4) million, $10.7 million and $(591.9) million, respectively. Net cash used in financing activities for 2024 was primarily due to (1) repayments of $375.0 million under the Senior Credit Facility (as defined below), (2) $4.8 million in cash paid for shares withheld for payroll taxes resulting from the vesting of employee equity awards, and (3) $3.7 million in cash paid for excise tax on prior year share repurchases, partially offset by borrowings of $125.0 million under the Senior Credit Facility. Net cash provided by financing activities for 2023 was primarily due to borrowings of $815.0 million under the Senior Credit Facility, partially offset by (1) $424.7 million paid in connection with the repurchase of our common stock, (2) repayments of $355.0 million under the Senior Credit Facility, and (3) $13.1 million in cash paid for shares withheld for payroll taxes resulting from the vesting of employee equity awards.
Amended Credit Agreement
On February 10, 2023, we entered into the third amendment to our credit agreement (the “Third Amendment”). The Third Amendment (together with the credit agreement, the first amendment and the second amendment, collectively, the “Amended Credit Agreement”) provides for, among other things, an increase to the secured revolving credit facility (the “Senior Credit Facility”) from $400.0 million to $750.0 million. The Senior Credit Facility includes a $125.0 million sublimit for the issuance of letters of credit and a $75.0 million sublimit for swingline loans. On November 5, 2024, we entered into the fourth amendment to our credit agreement (the “Fourth Amendment”) which increased our consolidated net leverage ratio covenant for the year ending December 31, 2025. Our obligations under the Amended Credit Agreement are secured by substantially all of our assets. The terms of the Amended Credit Agreement, including maturity dates, payment and interest terms, are described in further detail in “Item 8. Financial Statements and Supplementary Data—Notes to Consolidated Financial Statements—Note (8), Notes Payable and Credit Agreement.”
4.625% Senior Notes Due 2027
On August 13, 2020, AMN Healthcare, Inc., a wholly owned subsidiary of the Company, completed the issuance of an additional $200.0 million aggregate principal amount of 4.625% senior notes due 2027 (the “New 2027 Notes”), which were issued at a price of 101.000% of the aggregate principal amount. The New 2027 Notes were issued pursuant to the existing indenture, dated as of October 1, 2019, under which we previously issued $300.0 million aggregate principal amount of 4.625% senior notes due 2027 (the “Existing 2027 Notes” and together with the New 2027 Notes, the “2027 Notes”). The New 2027 Notes will be treated as a single series with the Existing 2027 Notes and will have the same terms (other than issue price, issue date and the date from which interest accrues) as those of the Existing 2027 Notes. The 2027 Notes will mature on October 1, 2027. Interest on the 2027 Notes is payable semi-annually in arrears on April 1 and October 1 of each year, commencing October 1, 2020 with respect to the New 2027 Notes. The 2027 Notes are fully and unconditionally and jointly guaranteed on a senior unsecured basis by us and all of our subsidiaries that guarantee the Amended Credit Agreement.
On and after October 1, 2022, we may redeem all or a portion of the 2027 Notes upon not less than 30 nor more than 60 days’ notice, at the redemption prices (expressed in percentages of principal amount on the redemption date) set forth below, plus accrued and unpaid interest, if any, to (but excluding) the redemption date, if redeemed during the twelve month period commencing on October 1 of the years set forth below:
| | | | | | | | |
| Period | Redemption
Price |
| 2022 | | 102.313 | % |
| 2023 | | 101.156 | % |
| 2024 and thereafter | | 100.000 | % |
Upon the occurrence of specified change of control events as defined in the indenture governing the 2027 Notes, we must offer to repurchase the 2027 Notes at 101% of the principal amount, plus accrued and unpaid interest, if any, to (but excluding) the purchase date.
The indenture governing the 2027 Notes contains covenants that, among other things, restrict our ability to:
•sell assets,
•pay dividends or make other distributions on capital stock, make payments in respect of subordinated indebtedness or make other restricted payments,
•make certain investments,
•incur or guarantee additional indebtedness or issue preferred stock,
•create certain liens,
•enter into agreements that restrict dividends or other payments from our restricted subsidiaries,
•consolidate, merge or transfer all or substantially all of our assets,
•engage in transactions with affiliates, and
•create unrestricted subsidiaries.
These covenants are subject to a number of important exceptions and qualifications. The indenture governing the 2027 Notes contains affirmative covenants and events of default that are customary for indentures governing high yield securities. The 2027 Notes and the guarantees are not subject to any registration rights agreement.
4.000% Senior Notes Due 2029
On October 20, 2020, AMN Healthcare, Inc., a wholly owned subsidiary of the Company, completed the issuance of $350.0 million aggregate principal amount of 4.000% Senior Notes due 2029 (the “2029 Notes”). The 2029 Notes will mature on April 15, 2029. Interest on the 2029 Notes will be payable semi-annually in arrears on April 15 and October 15 of each year, commencing April 15, 2021.
At any time and from time to time on and after April 15, 2024, we will be entitled at our option to redeem all or a portion of the 2029 Notes upon not less than 10 nor more than 60 days’ notice, at the redemption prices (expressed in percentages of principal amount on the redemption date) set forth below, plus accrued and unpaid interest, if any, to (but excluding) the redemption date (subject to the right of holders of record of the 2029 Notes on the relevant record date to receive interest due on the relevant interest payment date), if redeemed during the twelve month period commencing on April 15 of the years set forth below:
| | | | | | | | |
| Period | Redemption
Price |
| 2024 | | 102.000 | % |
| 2025 | | 101.000 | % |
| 2026 and thereafter | | 100.000 | % |
Upon the occurrence of specified change of control events as defined in the indenture governing the 2029 Notes, we must offer to repurchase the 2029 Notes at 101% of the principal amount, plus accrued and unpaid interest, if any, to (but excluding) the purchase date.
The indenture governing the 2029 Notes contains covenants that, among other things, restricts our ability to:
•sell assets;
•pay dividends or make other distributions on capital stock, make payments in respect of subordinated indebtedness or make other restricted payments;
•make certain investments;
•incur or guarantee additional indebtedness or issue preferred stock;
•create certain liens;
•enter into agreements that restrict dividends or other payments from our restricted subsidiaries to us;
•consolidate, merge or transfer all or substantially all of their assets;
•enter into transactions with affiliates; and
•create unrestricted subsidiaries.
These covenants are subject to a number of important exceptions and qualifications. The indenture governing the 2029 Notes contains affirmative covenants and events of default that are customary for indentures governing high yield securities. The 2029 Notes and the guarantees are not subject to any registration rights agreement.
Letters of Credit
As of December 31, 2024, we maintained outstanding standby letters of credit totaling $20.9 million as collateral in relation to our workers’ compensation insurance agreements and a corporate office lease agreement. Of the $20.9 million of outstanding letters of credit, we have collateralized approximately $0.6 million in cash and cash equivalents and the remaining approximately $20.4 million is collateralized by the Senior Credit Facility. Outstanding standby letters of credit at December 31, 2023 totaled $21.3 million.
Critical Accounting Policies and Estimates
Our critical accounting policies are those that we believe are both important to the portrayal of our financial condition and results and require our most difficult, subjective or complex judgments, often as a result of the need to make estimates about the effect of matters that are inherently uncertain. The preparation of our consolidated financial statements in conformity with United States generally accepted accounting principles requires us to make estimates and judgments that affect our reported amounts of assets and liabilities, revenue and expenses, and related disclosures of contingent assets and liabilities. On an ongoing basis, we evaluate our estimates and base them on the information that is currently available to us and on various other assumptions that we believe are reasonable under the circumstances. Actual results could vary from these estimates under different assumptions or conditions. We believe that the following critical accounting policies affect the more significant judgments and estimates used in the preparation of our consolidated financial statements:
Goodwill and Indefinite-lived Intangible Assets
Our business acquisitions typically result in the recording of goodwill and other intangible assets. The determination of the fair value of such intangible assets involves the use of appropriate valuation techniques and requires management to make estimates and assumptions that affect our consolidated financial statements. Significant judgments required to estimate the fair values include estimated future cash flows, growth rates, customer attrition rates, brand awareness and discount rates. Changes in these estimates and assumptions could materially affect the determination of fair value for each intangible asset. Management may engage independent third-party specialists to assist in determining the fair values. For intangible assets purchased in a business acquisition, the estimated fair values of the assets received are used to establish their recorded values, which may become impaired in the future.
In accordance with accounting guidance on goodwill and other intangible assets, we perform annual impairment analysis to assess the recoverability of goodwill and indefinite-lived intangible assets. We assess the impairment of goodwill of our reporting units and indefinite-lived intangible assets annually, or more often if events or changes in circumstances indicate that the carrying amount may not be recoverable. We may first assess qualitative factors to determine whether it is more likely than not that the fair value of a reporting unit is less than its carrying amount. If, after assessing the totality of events and circumstances, we determine that it is more likely than not that the fair value of the reporting unit is greater than its carrying amount, the quantitative impairment test is unnecessary. If the reporting unit does not pass the qualitative assessment, then the reporting unit’s carrying amount is compared to its fair value. The fair values of the reporting units are estimated using market and income approaches. Goodwill is considered impaired if the carrying amount of the reporting unit exceeds its fair value. Application of the goodwill impairment test requires judgment, including the identification of reporting units, assignment of assets and liabilities to reporting units, assignment of goodwill to reporting units, and determination of the fair value of each reporting unit. Valuation techniques consistent with the market approach and income approach are used to measure the fair value of each reporting unit. Significant judgments are required to estimate the fair value of reporting units including estimating future cash flows, and determining appropriate discount rates, growth rates, and other assumptions. Changes in these estimates and assumptions could materially affect the determination of fair value for each reporting unit. We perform our annual impairment test on October 31 of each year. As of December 31, 2024, we do not have any indefinite-lived intangible assets.
We performed a quantitative impairment test of our goodwill as of October 31, 2024 and determined that the estimated fair values of the nurse and allied solutions and physician and leadership solutions reporting units were below their respective carrying amounts. The estimated fair value of the technology and workforce solutions reporting unit exceeded its carrying amount by more than 100 percent. As a result, we recognized goodwill impairment losses of $222.5 million in the consolidated financial statements as of and for the year ended December 31, 2024.
We consider the following assumptions used in the income and market approaches to be significant assumptions in estimating the fair value of our reporting units: revenue growth rates, long-term growth rates, weighted average cost of capital, and selection of market multiples.
Under the income approach, the discounted cash flow method uses estimated future cash flows, including revenue growth rates, based on our internal forecasts, which are estimated considering our historical experience, expectations of future business performance, and assessment of current and future market conditions. Keeping all other assumptions constant and excluding the effect of deferred income taxes, a change in the revenue growth rates over the entire forecast period of 25 basis points would have increased or reduced the goodwill impairment losses by approximately $37.0 million.
A long-term growth rate is used to calculate the terminal value of our reporting units in the discounted cash flow method and is based on estimated economic and industry growth. According to the U.S. Inflation Calculator, healthcare inflation has ranged from 0.5% to 5.2% (average of 3.3%) over the last 25 years. And according to the U.S. Census Bureau, the number of
adults age 65 or older is projected to grow an estimated 31% between 2022 and 2035. Based on the expectations of an increasingly aging population requiring additional healthcare services and the historical levels of inflation in the healthcare industry, we used an estimated long-term growth rate of 4.0% in the annual impairment test as of October 31, 2024. Keeping all other assumptions constant and excluding the effect of deferred income taxes, a change in the estimated long-term growth rates of 25 basis points would have increased or reduced the goodwill impairment losses by approximately $7.0 million.
In the discounted cash flow method, each reporting unit’s estimated future cash flows are discounted at a rate that is consistent with a weighted-average cost of capital (WACC), which represents the after-tax rate of return required by a market participant, which is based on observed market return data and company-specific risk factors. The Company engaged a third-party valuation specialist to assist in the determination of the WACC, which ranged from 13.5% to 14.0% for our reporting units in the most recent impairment test. Keeping all other assumptions constant and excluding the effect of deferred income taxes, a change in the WACC of 50 basis points would have increased or reduced the goodwill impairment losses by approximately $30.0 million.
Under the market approach, we utilize the guideline company method, which involves the selection of valuation multiples based on the market capitalization of similar publicly traded companies. Multiples derived from these companies provide an indication of how much a market participant would be willing to pay for a company. These multiples are applied to the forecasted financial metrics for our reporting units to arrive at an indication of value. The market multiples used are revenue and earnings before interest, taxes, depreciation, and amortization (EBITDA). Keeping all other assumptions constant and excluding the effect of deferred income taxes, a change in the market multiples of 10% would have increased or reduced the goodwill impairment losses by approximately $53.0 million.
Intangible assets with estimable useful lives are required to be amortized over their respective estimated useful lives and reviewed for impairment whenever events or changes in circumstances indicate that the carrying amount may not be recoverable. An impairment evaluation is based on an undiscounted cash flow analysis of the asset group, which is the lowest level at which cash flows of the long-lived assets are largely independent of other groups of assets and liabilities. If the asset group’s undiscounted cash flows are less than its carrying amount, the asset group’s fair value is measured. An impairment is recognized if the carrying amount of the asset group exceeds the fair value of the asset group.
We assess potential impairments to long-lived assets when there is evidence that events or changes in circumstances indicate that the carrying amount of an asset or asset group may not be recovered. Our judgments regarding the existence of impairment indicators and future cash flows related to long-lived assets are based on operational performance of our businesses, market conditions and other factors. Although there are inherent uncertainties in this assessment process, the estimates and assumptions we use, including estimates of future cash flows, volumes, market penetration and discount rates, are consistent with our internal planning.
Although the accounting guidance does not require impairment testing of long-lived assets in a reporting unit that is tested for goodwill impairment, we assess whether the related circumstances result in evidence that the carrying amounts of our long-lived assets may not be recoverable. As such, prior to the quantitative impairment test of our goodwill as of October 31, 2024, we evaluated the recoverability of the carrying amounts of asset groups within the nurse and allied solutions and physician and leadership solutions reporting units and determined that the undiscounted cash flows for all the asset groups tested were above their respective carrying amounts. Therefore, no impairment loss on our long-lived assets was recognized.
If these estimates or their related assumptions change in the future, we may be required to record an impairment loss on all or a portion of our long-lived assets. Furthermore, we cannot predict the occurrence of future impairment-triggering events nor the impact such events might have on our reported asset values. Future events could cause us to conclude that impairment indicators exist and that long-lived assets are impaired.
Professional Liability Reserve
We determine the adequacy of our accrual for professional liability by evaluating our historical experience and trends, loss reserves established by our insurance carriers, management and third-party administrators, and our independent actuarial studies. We obtain actuarial studies on a semi-annual basis to assist us in determining the adequacy of our accrual. For periods between the actuarial studies, we record accruals based on loss rates provided in the most recent actuarial study and management’s review of loss history. Expense recognized for accruals (inclusive of actuarial-based adjustments) was $7.8 million, $5.5 million and $7.2 million for the years ended December 31, 2024, 2023 and 2022, respectively.
Our accrual for professional liability includes provisions for estimated incurred but not yet reported (“IBNR”) losses and known claims (“case reserves”), as well as losses covered by excess insurance carriers (“excess liability”). The following table
presents the case reserves, IBNR losses and excess liability as estimated by the most recently obtained actuarial study that make up our accrual for professional liability as of December 31, 2024 and 2023:
| | | | | | | | | | | |
| (In Thousands) |
| December 31, |
| | 2024 | | 2023 |
Case reserves (1) | $ | 11,590 | | | $ | 8,503 | |
IBNR losses (1) | 21,823 | | | 24,893 | |
Excess liability (2) | 13,289 | | | 11,256 | |
| Total accrual | $ | 46,702 | | | $ | 44,652 | |
(1) The provisions for case reserves and estimated IBNR losses are presented net of excess liability.
(2) The accrual for losses recoverable from excess insurance carriers is recorded on the consolidated balance sheets with a corresponding recoverable asset.
We determine estimated IBNR losses by developing our historical loss data to its ultimate level (“ultimate losses”) and subtracting incurred losses to date; the remainder is IBNR losses. We determine ultimate losses through the use of several actuarial methods, including (but not limited to) loss development methods and Bornhuetter-Ferguson method. These methods use our specific historical claims data related to paid losses and loss adjustment expenses, historical and current case reserves, reported and closed claim counts, and industry and other data. The actuarial assumptions used in the aforementioned methods include paid and incurred loss development patterns, our growth and mix of business, inflation, law changes, and claim frequency and severity trends.
We consider the frequency and severity of claims to be significant assumptions in estimating our accrual for professional liability. A 10% change in the expected frequency is within a reasonable range of possibilities and would increase or reduce the accrual estimate by approximately $2.0 million. A 10% change in the expected claim severity is within a reasonable range of possibilities and would increase or reduce the accrual estimate by approximately $5.0 million. Additionally, the average time period between the occurrence and final resolution of our professional liability claims is approximately 5 years; however, the facts and circumstances of individual claims could result in a timeframe that significantly varies from this average. The ultimate settlements of our professional liability claims may vary significantly from our estimates if future changes in claim frequency or severity differ from historical trends and actuarial assumptions, which could have a material effect on our consolidated financial condition or results of operations.
Contingent Liabilities
We are involved in various lawsuits, claims, investigations, and proceedings that arise in the ordinary course of business. These matters typically relate to professional liability, tax, compensation, contract, competitor disputes and employee-related matters and include individual and class action lawsuits, as well as inquiries and investigations by governmental agencies regarding the Company’s employment and compensation practices. Additionally, some of our clients may also become subject to claims, governmental inquiries and investigations and legal actions relating to services provided by our healthcare professionals. From time to time, and depending upon the particular facts and circumstances, we may be subject to indemnification obligations under our contracts with such clients relating to these matters.
We cannot predict with assurance the outcome of claims brought against us. Certain of the above-referenced matters may include speculative claims for substantial or indeterminate amounts of damages. We record a liability when we believe that it is both probable that a loss has been incurred and the amount can be reasonably estimated. In assessing the probability of loss and the estimated amount, we consider the following factors, among others: (a) the nature of the matter and any related facts, circumstances and data; (b) the progress of the case; (c) the opinions or views of legal counsel and other advisers; (d) our experience, and the experience of other entities, in similar cases; (e) how we intend to respond to the matter; and (f) reasonable settlement values based on the foregoing factors. Significant judgment is required to determine both probability and the estimated amount and the final outcome may ultimately be materially different. Where a range of loss can be reasonably estimated with no best estimate in the range, we record the minimum estimated liability. We review these provisions at least quarterly and adjust these provisions accordingly to reflect the impact of negotiations, settlements, rulings, advice of legal counsel, and updated information. We generally record changes in accruals related to legal matters in selling, general and administrative expenses in the consolidated statements of comprehensive income (loss). The most significant matters for which the Company has established accruals in connection with loss contingencies are class and representative actions related to wage and hour claims under California and Federal law.
We believe that the amount or estimable range of reasonably possible loss beyond the accruals that we have established, will not, either individually or in the aggregate, have a material adverse effect on our business, consolidated financial position,
results of operations, or cash flows with respect to loss contingencies for legal and other contingencies as of December 31, 2024. However, the outcome of litigation is inherently uncertain. Therefore, if one or more of these legal matters were resolved against us for amounts in excess of management’s expectations, our results of operations and financial condition, including in a particular reporting period, could be materially adversely affected.
Recent Accounting Pronouncements
In December 2023, the FASB issued ASU 2023-09, “Income Taxes (Topic 740): Improvements to Income Tax Disclosures,” which is intended to enhance the transparency and decision-usefulness of income tax disclosures. The new guidance addresses investor requests for enhanced income tax information primarily through requiring disclosure of additional information about and further disaggregation of the rate reconciliation and income taxes paid. This standard is effective on a prospective basis for fiscal years beginning after December 15, 2024, with early adoption permitted. We are currently evaluating the impact of adopting this standard on our disclosures.
In November 2024, the FASB issued ASU 2024-03, “Income Statement—Reporting Comprehensive Income—Expense Disaggregation Disclosures (Subtopic 220-40): Disaggregation of Income Statement Expenses,” which is intended to improve disclosures about the expenses of public entities. The new guidance requires more detailed information about the types of expenses in commonly presented expense captions (such as cost of sales and selling, general, and administrative expenses) and requires public entities to disclose, on an annual and interim basis, the amounts of expenses included in each relevant expense caption presented on the face of the income statement within continuing operations, in a tabular format. Additionally, public entities will be required to disclose a qualitative description of the amounts remaining in relevant expense captions that are not separately disaggregated quantitatively, the total amount of selling expenses and, in annual reporting periods, the definition of selling expenses. This standard is effective on either a prospective or retrospective basis for fiscal years beginning after December 15, 2026 and interim periods within fiscal years beginning after December 15, 2027, with early adoption permitted. We are currently evaluating the impact of adopting this standard on our disclosures.
There have been no other new accounting pronouncements issued but not yet adopted that are expected to materially affect our consolidated financial condition or results of operations.
Item 7A. Quantitative and Qualitative Disclosures about Market Risk
Market risk is the risk of loss arising from adverse changes in market rates and prices, such as interest rates, foreign currency exchange rates and commodity prices. During 2024, our primary exposure to market risk was interest rate risk associated with our variable interest debt instruments and our investment portfolio. A 100 basis point increase in interest rates on our variable rate debt would not have resulted in a material effect on our consolidated financial statements for 2024. A 100 basis point change in interest rates as of December 31, 2024 would not have resulted in a material effect on the fair value of our investment portfolio. For our investments that are classified as available-for-sale, unrealized gains or losses related to fluctuations in market volatility and interest rates are reflected within stockholders’ equity in accumulated other comprehensive income (loss) in the consolidated balance sheets. Such unrealized gains or losses would be realized only if we sell the investments prior to maturity.
During 2024, we generated substantially all of our revenue in the United States. Accordingly, we believe that our foreign currency risk is immaterial.
Item 8. Financial Statements and Supplementary Data
INDEX TO CONSOLIDATED FINANCIAL STATEMENTS
Report of Independent Registered Public Accounting Firm
To the Stockholders and Board of Directors
AMN Healthcare Services, Inc.:
Opinion on the Consolidated Financial Statements
We have audited the accompanying consolidated balance sheets of AMN Healthcare Services, Inc. and subsidiaries (the Company) as of December 31, 2024 and 2023, the related consolidated statements of comprehensive income (loss), stockholders’ equity, and cash flows for each of the years in the three‑year period ended December 31, 2024, and the related notes (collectively, the consolidated financial statements). In our opinion, the consolidated financial statements present fairly, in all material respects, the financial position of the Company as of December 31, 2024 and 2023, and the results of its operations and its cash flows for each of the years in the three‑year period ended December 31, 2024, in conformity with U.S. generally accepted accounting principles.
We also have audited, in accordance with the standards of the Public Company Accounting Oversight Board (United States) (PCAOB), the Company’s internal control over financial reporting as of December 31, 2024, based on criteria established in Internal Control – Integrated Framework (2013) issued by the Committee of Sponsoring Organizations of the Treadway Commission, and our report dated February 20, 2025 expressed an unqualified opinion on the effectiveness of the Company’s internal control over financial reporting.
Basis for Opinion
These consolidated financial statements are the responsibility of the Company’s management. Our responsibility is to express an opinion on these consolidated financial statements based on our audits. We are a public accounting firm registered with the PCAOB and are required to be independent with respect to the Company in accordance with the U.S. federal securities laws and the applicable rules and regulations of the Securities and Exchange Commission and the PCAOB.
We conducted our audits in accordance with the standards of the PCAOB. Those standards require that we plan and perform the audit to obtain reasonable assurance about whether the consolidated financial statements are free of material misstatement, whether due to error or fraud. Our audits included performing procedures to assess the risks of material misstatement of the consolidated financial statements, whether due to error or fraud, and performing procedures that respond to those risks. Such procedures included examining, on a test basis, evidence regarding the amounts and disclosures in the consolidated financial statements. Our audits also included evaluating the accounting principles used and significant estimates made by management, as well as evaluating the overall presentation of the consolidated financial statements. We believe that our audits provide a reasonable basis for our opinion.
Critical Audit Matters
The critical audit matters communicated below are matters arising from the current period audit of the consolidated financial statements that were communicated or required to be communicated to the audit committee and that: (1) relate to accounts or disclosures that are material to the consolidated financial statements and (2) involved our especially challenging, subjective, or complex judgments. The communication of critical audit matters does not alter in any way our opinion on the consolidated financial statements, taken as a whole, and we are not, by communicating the critical audit matters below, providing separate opinions on the critical audit matters or on the accounts or disclosures to which they relate.
Professional liability reserve
As discussed in Notes 1(l) and 6 to the consolidated financial statements, the Company determines their professional liability accrual by evaluating historical experience, trends, loss reserves, and actuarial studies. As of December 31, 2024, the Company recorded professional liability reserves totaling $46,702 thousand. We identified the evaluation of the professional liability reserve as a critical audit matter. A high degree of complex and subjective auditor judgement, including the involvement of actuarial professionals with specialized skills and knowledge, was required in evaluating the Company’s actuarial estimates and assumptions, specifically estimates for incurred but not reported claims. Changes in the actuarial estimates or assumptions could have a significant impact on the liability recognized.
The following are the primary procedures we performed to address this critical audit matter. We evaluated the design and tested the operating effectiveness of certain internal controls related to the process to estimate the professional liability reserve. This included a control related to the selection of ultimate losses used in the estimates for incurred but not reported claims. We tested the key inputs to determine the incurred but not reported estimate. This included testing
data used by the Company’s actuarial specialist to determine the expected loss rates, specifically claims history used in the actuarial models, for consistency with the actual claims incurred and paid by the Company. We also involved actuarial professionals with specialized skills and knowledge, who assisted in evaluating the Company’s actuarial estimates and assumptions, specifically loss rates, by comparing them to the Company’s historical data, and industry and regulatory trends.
Goodwill impairment assessment of the nurse and allied solutions and physician and leadership solutions reporting units
As discussed in Note 4 to the consolidated financial statements, the goodwill balance as of December 31, 2024 was $897,456 thousand. As discussed in Note 1(j) to the consolidated financial statements, the Company assesses the impairment of goodwill of its reporting units on an annual basis as of October 31, or more frequently if events or change in circumstances indicate that the carrying value may not be recoverable. If the carrying amount exceeds the fair value, an impairment loss is recorded. The Company sustained a decline in market capitalization and lower than expected financial performance. The Company performed its annual goodwill impairment test and estimated the fair value of its reporting units using the income and market approaches. The Company recorded a goodwill impairment of $123,283 thousand for the nurse and allied solutions reporting unit and $99,174 thousand for the physician and leadership solutions reporting unit for the year ended December 31, 2024. We identified the assessment of the recoverability of the carrying value of goodwill for the Company’s nurse and allied solutions and physician and leadership solutions reporting units as a critical audit matter. A high degree of subjective auditor judgment was required to evaluate the assumptions used in the Company’s estimate of the fair value of the nurse and allied solutions and physician and leadership solutions reporting units. Specifically, the evaluation of the forecasted revenue growth rates and discount rate assumptions utilized in the income approach to determine the fair value of the nurse and allied solutions and physician and leadership solutions reporting units and the selection of the market multiples assumption utilized in the market approach to determine the fair value of the nurse and allied solutions and physician and leadership solutions reporting units required a high degree of subjective auditor judgement. Changes to these assumptions could have a significant effect on the Company’s assessment of the carrying value of the goodwill. Additionally, the audit effort associated with the evaluation of the discount rate and market multiples required specialized skills and knowledge.
The following are the primary procedures we performed to address this critical audit matter. We evaluated the design and tested the operating effectiveness of certain internal controls related to the goodwill impairment process. This included controls related to the selection of forecasted revenue growth rates, the discount rate, and market multiples used to determine the fair value of the nurse and allied solutions and physician and leadership solutions reporting units. To assess the reasonableness of the forecasted revenue growth rates utilized in the income approach for the nurse and allied solutions and physician and leadership solutions reporting units, we evaluated the forecasted revenue growth rates against historical results of the reporting units and industry analyst projections. We involved valuation professionals with specialized skills and knowledge, who assisted in (1) evaluating the reasonableness of the Company’s discount rate by comparing management’s inputs to the discount rate to publicly available market data for comparable entities and assessed the resulting discount rate; and (2) assessing the appropriateness of the market multiples selected by management by comparing them to publicly available market data for comparable entities.
We have served as the Company’s auditor since 2000.
San Diego, California
February 20, 2025
AMN HEALTHCARE SERVICES, INC.
CONSOLIDATED BALANCE SHEETS
(in thousands, except par value)
| | | | | | | | | | | |
| December 31, |
| 2024 | | 2023 |
| ASSETS | | | |
| Current assets: | | | |
| Cash and cash equivalents | $ | 10,649 | | | $ | 32,935 | |
| Accounts receivable, net of allowances of $32,421 and $32,233 at December 31, 2024 and 2023, respectively | 437,817 | | | 623,488 | |
| Accounts receivable, subcontractor | 70,481 | | | 117,703 | |
| Prepaid expenses | 22,510 | | | 21,889 | |
| Other current assets | 53,458 | | | 45,670 | |
| Total current assets | 594,915 | | | 841,685 | |
| Restricted cash, cash equivalents and investments | 71,840 | | | 68,845 | |
| Fixed assets, net of accumulated depreciation of $360,795 and $285,081 at December 31, 2024 and 2023, respectively | 186,270 | | | 191,385 | |
| | | |
| Other assets | 258,053 | | | 236,796 | |
| Deferred income taxes, net | 25,829 | | | — | |
| Goodwill | 897,456 | | | 1,111,549 | |
| Intangible assets, net of accumulated amortization of $534,822 and $442,052 at December 31, 2024 and 2023, respectively | 381,364 | | | 474,134 | |
| Total assets | $ | 2,415,727 | | | $ | 2,924,394 | |
| LIABILITIES AND STOCKHOLDERS’ EQUITY | | | |
| Current liabilities: | | | |
| Accounts payable and accrued expenses | $ | 184,311 | | | $ | 343,847 | |
| Accrued compensation and benefits | 287,544 | | | 278,536 | |
| | | |
| | | |
| | | |
| Other current liabilities | 73,930 | | | 33,738 | |
| Total current liabilities | 545,785 | | | 656,121 | |
| Revolving credit facility | 210,000 | | | 460,000 | |
| Notes payable, net of unamortized fees and premium | 845,872 | | | 844,688 | |
| Deferred income taxes, net | — | | | 23,350 | |
| | | |
| Other long-term liabilities | 107,450 | | | 108,979 | |
| Total liabilities | 1,709,107 | | | 2,093,138 | |
| Commitments and contingencies | | | |
| Stockholders’ equity: | | | |
| Preferred stock, $0.01 par value; 10,000 shares authorized; none issued and outstanding at December 31, 2024 and 2023 | — | | | — | |
| Common stock, $0.01 par value; 200,000 shares authorized; 50,692 issued and 38,079 outstanding at December 31, 2024 and 50,423 issued and 37,810 outstanding at December 31, 2023 | 507 | | | 504 | |
| Additional paid-in capital | 528,471 | | | 506,543 | |
| Treasury stock, at cost; 12,613 shares at December 31, 2024 and 2023 | (1,127,043) | | | (1,127,043) | |
| Retained earnings | 1,304,696 | | | 1,451,675 | |
| Accumulated other comprehensive loss | (11) | | | (423) | |
| Total stockholders’ equity | 706,620 | | | 831,256 | |
| Total liabilities and stockholders’ equity | $ | 2,415,727 | | | $ | 2,924,394 | |
See accompanying notes to consolidated financial statements.
AMN HEALTHCARE SERVICES, INC.
CONSOLIDATED STATEMENTS OF COMPREHENSIVE INCOME (LOSS)
(in thousands, except per share amounts)
| | | | | | | | | | | | | | | | | |
| | Years Ended December 31, |
| | 2024 | | 2023 | | 2022 |
| Revenue | $ | 2,983,781 | | | $ | 3,789,254 | | | $ | 5,243,242 | |
| Cost of revenue | 2,064,405 | | | 2,539,673 | | | 3,526,558 | |
| Gross profit | 919,376 | | | 1,249,581 | | | 1,716,684 | |
| Operating expenses: | | | | | |
| Selling, general and administrative | 632,489 | | | 756,238 | | | 936,576 | |
| Depreciation and amortization (exclusive of depreciation included in cost of revenue) | 167,103 | | | 154,914 | | | 133,007 | |
| Goodwill impairment losses | 222,457 | | | — | | | — | |
| Total operating expenses | 1,022,049 | | | 911,152 | | | 1,069,583 | |
| Income (loss) from operations | (102,673) | | | 338,429 | | | 647,101 | |
| Interest expense, net, and other | 69,901 | | | 54,140 | | | 40,398 | |
| Income (loss) before income taxes | (172,574) | | | 284,289 | | | 606,703 | |
| Income tax expense (benefit) | (25,595) | | | 73,610 | | | 162,653 | |
| Net income (loss) | $ | (146,979) | | | $ | 210,679 | | | $ | 444,050 | |
| | | | | |
| Other comprehensive income (loss): | | | | | |
| Unrealized gains (losses) on available-for-sale securities, net, and other | 412 | | | 516 | | | (644) | |
| Other comprehensive income (loss) | 412 | | | 516 | | | (644) | |
| | | | | |
| Comprehensive income (loss) | $ | (146,567) | | | $ | 211,195 | | | $ | 443,406 | |
| | | | | |
| Net income (loss) per common share: | | | | | |
| Basic | $ | (3.85) | | | $ | 5.38 | | | $ | 9.96 | |
| Diluted | $ | (3.85) | | | $ | 5.36 | | | $ | 9.90 | |
| Weighted average common shares outstanding: | | | | | |
| Basic | 38,188 | | | 39,173 | | | 44,591 | |
| Diluted | 38,188 | | | 39,341 | | | 44,870 | |
| | | | | |
See accompanying notes to consolidated financial statements.
AMN HEALTHCARE SERVICES, INC.
CONSOLIDATED STATEMENTS OF STOCKHOLDERS’ EQUITY
Years Ended December 31, 2024, 2023 and 2022
(in thousands)
| | | | | | | | | | | | | | | | | | | | | | | | | | | | | | | | | | | | | | | | | | | | | | | |
| | Common Stock | | Additional
Paid-in
Capital | | Treasury Stock | | Retained Earnings | | Accumulated Other Comprehensive Loss | | Total |
| | Shares | | Amount | | Shares | | Amount | |
| Balance, December 31, 2021 | 49,849 | | | $ | 498 | | | $ | 486,709 | | | (2,586) | | | $ | (121,831) | | | $ | 796,946 | | | $ | (295) | | | $ | 1,162,027 | |
| Repurchase of common stock | — | | | — | | | — | | | (5,644) | | | (576,767) | | | — | | | — | | | (576,767) | |
| Equity awards vested, net of shares withheld for taxes | 260 | | | 3 | | | (15,101) | | | — | | | — | | | — | | | — | | | (15,098) | |
| | | | | | | | | | | | | | | |
| Share-based compensation | — | | | — | | | 30,066 | | | — | | | — | | | — | | | — | | | 30,066 | |
| Comprehensive income (loss) | — | | | — | | | — | | | — | | | — | | | 444,050 | | | (644) | | | 443,406 | |
| Balance, December 31, 2022 | 50,109 | | | $ | 501 | | | $ | 501,674 | | | (8,230) | | | $ | (698,598) | | | $ | 1,240,996 | | | $ | (939) | | | $ | 1,043,634 | |
| Repurchase of common stock | — | | | — | | | — | | | (4,383) | | | (428,445) | | | — | | | — | | | (428,445) | |
| Equity awards vested, net of shares withheld for taxes | 314 | | | 3 | | | (13,151) | | | — | | | — | | | — | | | — | | | (13,148) | |
| | | | | | | | | | | | | | | |
| Share-based compensation | — | | | — | | | 18,020 | | | — | | | — | | | — | | | — | | | 18,020 | |
| Comprehensive income | — | | | — | | | — | | | — | | | — | | | 210,679 | | | 516 | | | 211,195 | |
| Balance, December 31, 2023 | 50,423 | | | $ | 504 | | | $ | 506,543 | | | (12,613) | | | $ | (1,127,043) | | | $ | 1,451,675 | | | $ | (423) | | | $ | 831,256 | |
| | | | | | | | | | | | | | | |
| Equity awards vested, net of shares withheld for taxes | 191 | | | 2 | | | (4,776) | | | — | | | — | | | — | | | — | | | (4,774) | |
| Shares purchased and issued under employee stock purchase plan | 78 | | | 1 | | | 3,387 | | | — | | | — | | | — | | | — | | | 3,388 | |
| | | | | | | | | | | | | | | |
| Share-based compensation | — | | | — | | | 23,317 | | | — | | | — | | | — | | | — | | | 23,317 | |
| Comprehensive income (loss) | — | | | — | | | — | | | — | | | — | | | (146,979) | | | 412 | | | (146,567) | |
| Balance, December 31, 2024 | 50,692 | | | $ | 507 | | | $ | 528,471 | | | (12,613) | | | $ | (1,127,043) | | | $ | 1,304,696 | | | $ | (11) | | | $ | 706,620 | |
See accompanying notes to consolidated financial statements.
AMN HEALTHCARE SERVICES, INC.
CONSOLIDATED STATEMENTS OF CASH FLOWS
(in thousands)
| | | | | | | | | | | | | | | | | |
| | Years Ended December 31, |
| | 2024 | | 2023 | | 2022 |
| Cash flows from operating activities: | | | | | |
| Net income (loss) | $ | (146,979) | | | $ | 210,679 | | | $ | 444,050 | |
| Adjustments to reconcile net income (loss) to net cash provided by operating activities: | | | | | |
| Depreciation and amortization (inclusive of depreciation included in cost of revenue) | 173,779 | | | 160,927 | | | 137,111 | |
| Non-cash interest expense and other | 11,910 | | | 8,821 | | | 5,330 | |
| | | | | |
| Change in fair value of contingent consideration liabilities | — | | | 2,430 | | | (2,930) | |
| Increase in allowance for credit losses and sales credits | 3,296 | | | 23,913 | | | 57,999 | |
| Provision for deferred income taxes | (51,067) | | | (12,933) | | | (24,615) | |
| Share-based compensation | 23,317 | | | 18,020 | | | 30,066 | |
| Net loss (gain) on deferred compensation balances | (1,225) | | | 465 | | | (526) | |
| Goodwill impairment losses | 222,457 | | | — | | | — | |
| Loss on disposal or impairment of long-lived assets | 65 | | | 8,053 | | | 1,560 | |
| Net loss on investments in available-for-sale securities | 200 | | | 302 | | | 749 | |
| Non-cash lease expense | (1,244) | | | 1,619 | | | 5,497 | |
| Changes in assets and liabilities, net of effects from acquisitions: | | | | | |
| Accounts receivable | 176,227 | | | 70,033 | | | 57,921 | |
| Accounts receivable, subcontractor | 47,222 | | | 151,023 | | | (29,007) | |
| Income taxes receivable | (4,012) | | | 3,793 | | | (8,875) | |
| Prepaid expenses | (1,976) | | | (1,542) | | | 53,806 | |
| Other current assets | (8,530) | | | 4,197 | | | 17,775 | |
| Other assets | 87 | | | (3,177) | | | 210 | |
| Accounts payable and accrued expenses | (154,890) | | | (183,517) | | | 48,782 | |
| Accrued compensation and benefits | (11,310) | | | (80,135) | | | (10,506) | |
| Other liabilities | 44,431 | | | (10,248) | | | (126,566) | |
| Deferred revenue | (1,340) | | | (558) | | | (4,098) | |
| | | | | |
| Net cash provided by operating activities | 320,418 | | | 372,165 | | | 653,733 | |
| Cash flows from investing activities: | | | | | |
| Purchase and development of fixed assets | (80,891) | | | (103,687) | | | (75,831) | |
| Purchase of investments | (1,383) | | | — | | | (13,152) | |
| Proceeds from sale and maturity of investments | 9,099 | | | 9,894 | | | 14,384 | |
| | | | | |
| | | | | |
| Proceeds from sale of equity investment | — | | | 77 | | | 68 | |
| | | | | |
| Payments to fund deferred compensation plan | (8,412) | | | (24,902) | | | (21,518) | |
| | | | | |
| Cash paid for acquisitions, net of cash and restricted cash received | — | | | (292,175) | | | (69,570) | |
| Cash paid for other intangibles | — | | | (1,700) | | | (5,091) | |
| Cash received for working capital settlement of prior year acquisition | 1,649 | | | — | | | — | |
| Net cash used in investing activities | (79,938) | | | (412,493) | | | (170,710) | |
| | | | | | | | | | | | | | | | | |
| | Years Ended December 31, |
| | 2024 | | 2023 | | 2022 |
| Cash flows from financing activities: | | | | | |
| | | | | |
| | | | | |
| | | | | |
| Payments on revolving credit facility | (375,000) | | | (355,000) | | | — | |
| Proceeds from revolving credit facility | 125,000 | | | 815,000 | | | — | |
| | | | | |
| | | | | |
| Payments on loans payable | — | | | (300) | | | — | |
Repurchase of common stock (1) | — | | | (424,744) | | | (576,767) | |
| Payment of excise tax on share repurchases | (3,701) | | | — | | | — | |
| Payment of financing costs | (973) | | | (3,579) | | | — | |
| Earn-out payments to settle contingent consideration liabilities for prior acquisitions | — | | | (7,500) | | | — | |
| | | | | |
| | | | | |
| Cash paid for shares withheld for taxes | (4,774) | | | (13,148) | | | (15,098) | |
| | | | | |
| Net cash provided by (used in) financing activities | (259,448) | | | 10,729 | | | (591,865) | |
| | | | | |
| Net decrease in cash, cash equivalents and restricted cash | (18,968) | | | (29,599) | | | (108,842) | |
| Cash, cash equivalents and restricted cash at beginning of year | 108,273 | | | 137,872 | | | 246,714 | |
| Cash, cash equivalents and restricted cash at end of year | $ | 89,305 | | | $ | 108,273 | | | $ | 137,872 | |
| | | | | |
| Supplemental disclosures of cash flow information: | | | | | |
| Cash paid for amounts included in the measurement of operating lease liabilities | $ | 10,354 | | | $ | 9,311 | | | $ | 13,337 | |
| Cash paid for interest (net of $606, $1,229 and $703 capitalized in 2024, 2023 and 2022, respectively) | $ | 61,034 | | | $ | 48,101 | | | $ | 37,518 | |
| Cash paid for income taxes | $ | 28,152 | | | $ | 78,256 | | | $ | 213,807 | |
| Acquisitions: | | | | | |
| Fair value of tangible assets acquired in acquisitions, net of cash and restricted cash received | $ | — | | | $ | 48,941 | | | $ | 2,604 | |
| Goodwill | — | | | 175,770 | | | 42,990 | |
| Intangible assets | — | | | 92,000 | | | 40,200 | |
| Liabilities assumed | — | | | (24,536) | | | (8,224) | |
| | | | | |
| Contingent consideration liabilities | — | | | — | | | (8,000) | |
| Net cash paid for acquisitions | $ | — | | | $ | 292,175 | | | $ | 69,570 | |
| Supplemental disclosures of non-cash investing and financing activities: | | | | | |
| Purchase of fixed assets recorded in accounts payable and accrued expenses | $ | 3,198 | | | $ | 8,130 | | | $ | 5,643 | |
| Excise tax payable on share repurchases | $ | — | | | $ | 3,701 | | | $ | — | |
| Right-of-use assets obtained in exchange for operating lease liabilities | $ | 5,043 | | | $ | 36,560 | | | $ | 5,680 | |
(1) The difference between the amount reported for the year ended December 31, 2023 and the corresponding amount presented in the consolidated statements of stockholders’ equity is due to accrued excise tax payable on share repurchases which was recorded within treasury stock. The excise tax was paid during the year ended December 31, 2024.
See accompanying notes to consolidated financial statements.
AMN HEALTHCARE SERVICES, INC.
NOTES TO CONSOLIDATED FINANCIAL STATEMENTS
December 31, 2024, 2023 and 2022
(in thousands, except per share amounts)
(1) Summary of Significant Accounting Policies
(a) General
AMN Healthcare Services, Inc. was incorporated in Delaware on November 10, 1997. AMN Healthcare Services, Inc. and its subsidiaries (collectively, the “Company”) provide healthcare workforce solutions and staffing services at acute and sub-acute care hospitals and other healthcare facilities throughout the United States.
(b) Principles of Consolidation
The accompanying consolidated financial statements include the accounts of AMN Healthcare Services, Inc. and its wholly-owned subsidiaries. All significant intercompany balances and transactions have been eliminated in consolidation.
(c) Use of Estimates
The preparation of financial statements in conformity with accounting principles generally accepted in the United States of America requires management to make a number of estimates and assumptions relating to the reporting of assets and liabilities and the disclosure of contingent assets and liabilities at the dates of the consolidated financial statements and the reported amounts of revenue and expenses during the reporting periods. On an ongoing basis, the Company evaluates its estimates, including those related to goodwill and indefinite-lived intangible assets, professional liability reserve, contingent liabilities such as legal accruals, and income taxes. The Company bases these estimates on the information that is currently available and on various other assumptions that it believes are reasonable under the circumstances. Actual results could differ from those estimates under different assumptions or conditions.
(d) Cost of Revenue
Cost of revenue represents costs directly associated with the earnings of revenue and are comprised primarily of compensation, benefits, housing, travel and allowance costs for healthcare professionals and medically qualified interpreters.
(e) Selling, General and Administrative Expenses
Selling, general and administrative expenses consist predominantly of compensation and benefits costs for corporate employees, in additional to professional service fees, legal matter accruals, and other overhead costs. Unallocated corporate overhead is a subset of selling, general and administrative expenses and is comprised of indirect costs related to certain corporate functions that are not allocated to the Company’s reportable segments.
(f) Cash and Cash Equivalents
The Company considers all highly liquid investments with an original maturity of three months or less to be cash equivalents. Cash and cash equivalents include currency on hand, deposits with financial institutions, money market funds, and other highly liquid investments. See Note (3), “Fair Value Measurement” for additional information.
(g) Restricted Cash, Cash Equivalents and Investments
Restricted cash, cash equivalents and investments primarily include cash, corporate bonds and commercial paper that serve as collateral for the Company’s captive insurance subsidiary claim payments. See Note (3), “Fair Value Measurement” for additional information. The following table provides a reconciliation of cash, cash equivalents and restricted cash reported within the accompanying consolidated balance sheets and related notes to the amounts presented in the accompanying consolidated
statements of cash flows. | | | | | | | | | | | |
| | December 31, 2024 | | December 31, 2023 |
| Cash and cash equivalents | $ | 10,649 | | | $ | 32,935 | |
| Restricted cash and cash equivalents (included in other current assets) | 14,984 | | | 22,056 | |
| Restricted cash, cash equivalents and investments | 71,840 | | | 68,845 | |
| Total cash, cash equivalents and restricted cash and investments | 97,473 | | | 123,836 | |
| Less restricted investments | (8,168) | | | (15,563) | |
| Total cash, cash equivalents and restricted cash | $ | 89,305 | | | $ | 108,273 | |
The Company released $25,000 of restricted cash held at its captive insurance subsidiary in January 2025, which was used to repay a portion of the outstanding borrowings under the Senior Credit Facility (as defined in Note (2) below). As the restriction was in effect as of December 31, 2024 and the entire outstanding debt balance is classified as a noncurrent liability in the consolidated balance sheet, the noncurrent classification of the restricted cash was maintained as of December 31, 2024. (h) Fixed Assets
The Company records furniture, equipment, leasehold improvements and capitalized software at cost less accumulated amortization and depreciation. The Company records equipment acquired under finance leases at the present value of the future minimum lease payments. The Company capitalizes major additions and improvements, and it expenses maintenance and repairs when incurred. The Company calculates depreciation on furniture, equipment and software using the straight-line method based on the estimated useful lives of the related assets (typically three to ten years). The Company depreciates leasehold improvements and equipment obtained under finance leases over the shorter of the term of the lease or their estimated useful lives. The Company includes depreciation of equipment obtained under finance leases with depreciation expense in the accompanying consolidated financial statements.
The Company capitalizes costs it incurs to develop software during the application development stage. Application development stage costs generally include costs associated with software configuration, coding, installation and testing. The Company also capitalizes costs of significant upgrades and enhancements that result in additional functionality, whereas it expenses as incurred costs for maintenance and minor upgrades and enhancements. The Company amortizes capitalized costs using the straight-line method over three to ten years once the software is ready for its intended use.
The Company assesses long-lived assets for impairment whenever events or changes in circumstances indicate that the carrying amount of an asset may not be recoverable. Recoverability of assets to be held and used is measured by a comparison of the carrying amount of an asset group to the future undiscounted net cash flows that are expected to be generated by the asset group. If such asset group is considered to be impaired, the impairment to be recognized is measured by the amount by which the carrying amount of the asset group exceeds the fair value of the asset group. The Company reports assets to be disposed of at the lower of the carrying amount or fair value less costs to sell.
(i) Leases
The Company recognizes operating lease right-of-use assets and liabilities at commencement date based on the present value of the future minimum lease payments over the lease term. Leases with an initial term of 12 months or less are not recorded on the balance sheet in accordance with the short-term lease recognition exemption. The Company applies the practical expedient to not separate lease and non-lease components for all leases that qualify. The rates implicit in the Company’s lease arrangements are generally not readily determinable and as such, the Company uses its incremental borrowing rate as the discount rate to measure its lease liabilities. The incremental borrowing rate is determined for each operating lease based on the Company’s borrowing capabilities over a similar term of the lease arrangement, which is estimated by utilizing the Company’s credit rating and the effects of full collateralization. Lease expense is recognized on a straight-line basis over the lease term.
Operating lease right-of-use assets are included in other assets, and operating lease liabilities are included in other current liabilities and other long-term liabilities in the consolidated balance sheets.
(j) Goodwill
The Company records as goodwill the portion of the purchase price that exceeds the fair value of net assets of entities acquired. The Company evaluates goodwill annually for impairment at the reporting unit level and whenever circumstances occur indicating that goodwill may be impaired. The Company may first perform an optional qualitative assessment to
determine whether it is more likely than not that the fair value of a reporting unit is less than its carrying amount. If, after assessing the totality of events and circumstances, the Company determines that it is more likely than not that the fair value of the reporting unit is greater than its carrying amount, the quantitative impairment test is unnecessary. If a reporting unit does not pass the qualitative assessment, then the Company performs a quantitative test in which the reporting unit’s carrying amount is compared to its fair value. The amount by which the carrying amount of the goodwill exceeds its fair value is recognized as an impairment loss. See Note (3), “Fair Value Measurement” for additional information.
(k) Intangible Assets
Intangible assets consist of identifiable intangible assets acquired through acquisitions, which include tradenames and trademarks, customer relationships, staffing databases, developed technology and non-compete agreements. The Company amortizes intangible assets, other than those with an indefinite life, using the straight-line method over their useful lives. The Company amortizes non-compete agreements using the straight-line method over the lives of the related agreements. The Company reviews for impairment intangible assets with estimable useful lives whenever events or changes in circumstances indicate that the carrying amount may not be recoverable.
The Company does not amortize indefinite-lived intangible assets and instead reviews them for impairment annually. The Company may first perform a qualitative assessment to determine whether it is more likely than not that an indefinite-lived intangible asset is impaired. If, after assessing the totality of events and circumstances, the Company determines that it is more likely than not that the indefinite-lived intangible asset is not impaired, no quantitative fair value measurement is necessary. If a quantitative fair value measurement calculation is required for an indefinite-lived intangible asset, the Company compares its fair value with its carrying amount. If the carrying amount exceeds the fair value, the Company records the excess as an impairment loss.
(l) Insurance Reserves
The Company maintains an accrual for professional liability that is included in accounts payable and accrued expenses and other long-term liabilities in the consolidated balance sheets. The expense is included in the selling, general and administrative expenses in the consolidated statements of comprehensive income (loss). The Company determines the adequacy of this accrual by evaluating its historical experience and trends, loss reserves established by the Company’s insurance carriers, management and third-party administrators, and independent actuarial studies. The Company obtains actuarial studies on a semi-annual basis that use the Company’s actual claims data and industry data to assist the Company in determining the adequacy of its reserves each year. For periods between the actuarial studies, the Company records its accruals based on loss rates provided in the most recent actuarial study and management’s review of loss history and trends. Liabilities include provisions for estimated incurred but not yet reported (“IBNR”) losses, as well as provisions for known claims. IBNR reserve estimates involve the use of assumptions that are primarily based upon historical loss experience, industry data and other actuarial assumptions. The Company maintains insurance programs through its wholly-owned captive insurance subsidiary, which primarily provides coverage, on an occurrence basis, for professional liability within its nurse and allied solutions segment. In addition, the Company maintains excess insurance coverage through a commercial carrier for losses above the per occurrence retention. Losses covered by excess insurance are included in the accrual for professional liability, as the Company remains liable to the extent commercial carriers do not meet their obligations.
The Company maintains an accrual for workers’ compensation, which is included in accrued compensation and benefits and other long-term liabilities in the consolidated balance sheets. The expense relating to healthcare professionals is included in cost of revenue, while the expense relating to corporate employees is included in the selling, general and administrative expenses in the consolidated statements of comprehensive income (loss). The Company determines the adequacy of this accrual by evaluating its historical experience and trends, loss reserves established by the Company’s insurance carriers and third-party administrators, and independent actuarial studies. The Company obtains actuarial studies on a semi-annual basis that use the Company’s payroll and historical claims data, as well as industry data, to determine the appropriate reserve for both reported claims and IBNR claims for each policy year. For periods between the actuarial studies, the Company records its accruals based on loss rates provided in the most recent actuarial study.
(m) Revenue Recognition
Revenue primarily consists of fees earned from the temporary staffing and permanent placement of healthcare professionals, executives, and leaders (clinical and operational). The Company also generates revenue from technology-enabled services, including language interpretation and vendor management systems, and talent planning and acquisition services, including recruitment process outsourcing. The Company recognizes revenue when control of its services is transferred to its customers, in an amount that reflects the consideration the Company expects to be entitled to receive in exchange for those services. Revenue from temporary staffing services is recognized as the services are rendered by clinical and non-clinical
healthcare professionals. Under the Company’s managed services program (“MSP”) arrangements, the Company manages all or a part of a customer’s supplemental workforce needs utilizing its own network of healthcare professionals along with those of third-party subcontractors. Revenue and the related direct costs are recorded in accordance with the accounting guidance on reporting revenue gross as a principal versus net as an agent. Revenue is recorded on a gross basis when the Company utilizes its own network of healthcare professionals (including nurses, allied healthcare professionals, locum tenens, and executive and leadership interim staff). Conversely, when the Company uses subcontractors under an MSP arrangement and acts as an agent, revenue is recorded net of the related subcontractor’s expense. Revenue from permanent placement and recruitment process outsourcing services is recognized as the services are rendered. Depending on the arrangement, the Company’s technology-enabled service revenue is recognized either as the services are rendered or ratably over the applicable arrangement’s service period. Revenue for the language services business is recorded on a gross basis. Under vendor management systems arrangements, revenue is recorded on a net basis as an agent because other companies are primarily responsible for providing the staffing services, for which the Company is entitled a percentage fee. See additional information below regarding the Company’s revenue disaggregated by service type.
The Company’s customers are primarily billed as services are rendered. Any fees billed in advance of being earned are recorded as deferred revenue. While payment terms vary by the type of customer and the services rendered, the term between invoicing and when payment is due is not significant.
The Company recognizes assets from incremental costs to obtain a contract with a customer and costs incurred to fulfill a contract with a customer, which are deferred and amortized using the portfolio approach on a straight line basis over the average period of benefit consistent with the timing of transfer of services to the customer.
The Company has elected to apply the following practical expedients and optional exemptions related to contract costs and revenue recognition:
•Recognize incremental costs of obtaining a contract with amortization periods of one year or less as expense when incurred. These costs are recorded within selling, general and administrative expenses.
•Recognize revenue in the amount of consideration that the Company has a right to invoice the customer if that amount corresponds directly with the value to the customer of the Company’s services completed to date.
•Exemptions from disclosing the value of unsatisfied performance obligations for (i) contracts with an original expected length of one year or less, (ii) contracts for which revenue is recognized in the amount of consideration that the Company has a right to invoice for services performed and (iii) contracts for which variable consideration is allocated entirely to a wholly unsatisfied performance obligation or to a wholly unsatisfied promise to transfer a distinct service that forms part of a single performance obligation.
(n) Accounts Receivable
The Company records accounts receivable at the invoiced amount. Accounts receivable are non-interest bearing. The Company maintains an allowance for expected credit losses based on the Company’s historical write-off experience, an assessment of its customers’ financial conditions and available information that is relevant to assessing the collectability of cash flows.
The following table provides a reconciliation of activity in the allowance for expected credit losses for accounts receivable: | | | | | | | | | | | |
| 2024 | | 2023 |
| Balance as of January 1, | $ | 32,233 | | | $ | 31,910 | |
| | | |
| Provision for expected credit losses | 6,549 | | | 5,544 | |
| Amounts written off charged against the allowance | (6,361) | | | (5,221) | |
| | | |
| Balance as of December 31, | $ | 32,421 | | | $ | 32,233 | |
(o) Concentration of Credit Risk
The majority of the Company’s business activity is with hospitals located throughout the United States. Credit is extended based on the evaluation of each entity’s financial condition. One customer primarily within the Company’s nurse and allied solutions segment comprised approximately 16%, 17% and 18% of the consolidated revenue of the Company for the years ended December 31, 2024, 2023 and 2022, respectively.
The Company’s cash and cash equivalents and restricted cash, cash equivalents and investments accounts are financial instruments that are exposed to concentration of credit risk. The Company maintains most of its cash, cash equivalents and
investment balances (both unrestricted and restricted) with high-credit quality and federally insured institutions. However, cash equivalents and restricted cash equivalents and investment balances may be invested in non-federally insured money market funds, commercial paper and corporate bonds. As of December 31, 2024 and 2023, there were $97,473 and $123,836, respectively, of cash, cash equivalents and restricted cash, cash equivalents and investments, a portion of which was invested in non-federally insured commercial paper and corporate bonds. See Note (3), “Fair Value Measurement,” for additional information.
(p) Income Taxes
The Company records income taxes using the asset and liability method. Deferred tax assets and liabilities are recognized for the future tax consequences attributable to differences between the financial statement carrying amounts of existing assets and liabilities and their respective tax basis. Deferred tax assets and liabilities are measured using enacted tax rates expected to apply to taxable income in the years in which those temporary differences are expected to be recovered or settled. The effect on deferred tax assets and liabilities of a change in tax rates is recognized in the period the changes are enacted. In assessing the realizability of deferred tax assets, the Company considers whether it is more likely than not that some portion or all of the deferred tax assets will not be realized. The ultimate realization of deferred tax assets is dependent upon the generation of future taxable income during the periods in which those temporary differences become deductible. The Company considers the scheduled reversal of deferred tax liabilities (including the impact of available carryback and carryforward periods), projected future taxable income, and tax-planning strategies in making this assessment. The Company recognizes the effect of income tax positions only if it is more likely than not that such positions will be sustained. Recognized income tax positions are measured at the largest amount that is greater than 50% likely of being realized. Changes in recognition or measurement are reflected in the period in which the change in judgment occurs. The Company records interest and penalties related to unrecognized tax benefits in income tax expense.
(q) Fair Value of Financial Instruments
The carrying amounts of the Company’s cash equivalents and restricted cash equivalents and investments approximate their respective fair values due to the short-term nature and liquidity of these financial instruments. The fair value of the Company’s equity investment is measured using observable prices for identical or similar investments of the same issuer when such transactions are identified, which is more fully described in Note (3), “Fair Value Measurement.” As it relates to the Company’s 2027 Notes and 2029 Notes (as defined in Note (8) and Note (3), respectively, below), fair value disclosure is detailed in Note (3), “Fair Value Measurement.” See Note (8), “Notes Payable and Credit Agreement,” for additional information. The fair value of the Company’s long-term self-insurance accruals cannot be estimated because the Company cannot reasonably determine the timing of future payments.
(r) Share-Based Compensation
The Company accounts for its share-based employee compensation plans by expensing the estimated fair value of share-based awards on a straight-line basis over the requisite employee service period, which typically is the vesting period, except for awards granted to retirement-eligible employees, which are expensed on an accelerated basis. Restricted stock units (“RSUs”) typically vest over a three-year period. Share-based compensation cost of RSUs is measured by the market value of the Company’s common stock on the date of grant, and the Company records share-based compensation expense only for those awards that are expected to vest. Performance restricted stock units (“PRSUs”) primarily consist of PRSUs that contain performance conditions dependent on defined targets of the Company’s adjusted EBITDA, with a range of 0% to 200% of the target amount granted to be issued under the award. Share-based compensation cost for these PRSUs is measured by the market value of the Company’s common stock on the date of grant, and the amount recognized is adjusted for estimated achievement of the performance conditions. A limited amount of PRSUs contain a market condition dependent upon the Company’s relative and absolute total stockholder return over a three-year period, typically with a range of 0% to 175% (and certain awards with a range of 0% to 200%) of the target amount granted to be issued under the award. Share-based compensation cost for these PRSUs is measured using the Monte-Carlo simulation valuation model and is not adjusted for the achievement, or lack thereof, of the market conditions. Share-based compensation cost for purchase rights granted under the Company’s employee stock purchase plan is measured using the Black-Scholes model and the related employee contributions are included in accrued compensation and benefits in the consolidated balance sheets. See Note (11), “Share-Based Compensation,” for additional information.
(s) Net Income (Loss) per Common Share
The following table sets forth the computation of basic and diluted net income (loss) per common share for the years ended December 31, 2024, 2023 and 2022, respectively:
| | | | | | | | | | | | | | | | | |
| | Years Ended December 31, |
| | 2024 | | 2023 | | 2022 |
| Net income (loss) | $ | (146,979) | | | $ | 210,679 | | | $ | 444,050 | |
| | | | | |
| Net income (loss) per common share - basic | $ | (3.85) | | | $ | 5.38 | | | $ | 9.96 | |
| Net income (loss) per common share - diluted | $ | (3.85) | | | $ | 5.36 | | | $ | 9.90 | |
| | | | | |
| Weighted average common shares outstanding - basic | 38,188 | | | 39,173 | | | 44,591 | |
| Plus dilutive effect of potential common shares | — | | | 168 | | | 279 | |
| Weighted average common shares outstanding - diluted | 38,188 | | | 39,341 | | | 44,870 | |
| | | | | |
| Anti-dilutive potential common shares excluded from diluted weighted average common shares outstanding | 85 | | | 88 | | | 19 | |
The dilutive effect of potential shares and anti-dilutive potential common shares primarily include outstanding share-based awards, which consists of restricted stock units, performance restricted stock units, and obligations under the Company’s employee stock purchase plan.
(t) Segment Information
The Company’s operating segments are identified in the same manner as they are reported internally and used by the Company’s chief operating decision maker (“CODM”) for the purpose of evaluating performance and allocating resources. The Company’s Chief Executive Officer and its Chief Financial Officer and Chief Operating Officer serve as the Company’s CODM. The Company has three reportable segments: (1) nurse and allied solutions, (2) physician and leadership solutions, and (3) technology and workforce solutions. The nurse and allied solutions segment includes the Company’s travel nurse staffing (including international nurse staffing and rapid response nurse staffing), labor disruption staffing, local staffing, international nurse permanent placement, and allied staffing (including revenue cycle solutions) businesses. The physician and leadership solutions segment includes the Company’s locum tenens staffing, healthcare interim leadership staffing, executive search, and physician permanent placement businesses. The technology and workforce solutions segment includes the Company’s language services, vendor management systems (“VMS”), workforce optimization, and outsourced solutions businesses.
The Company’s CODM relies on internal management reporting processes that provide revenue, gross profit and operating income by reportable segment. These financial measures are used by the CODM to evaluate segment performance, monitor variances between periods and against projections, make key operating decisions, and allocate resources such as capital and personnel to each segment. The CODM does not evaluate or measure performance of segments using asset information; accordingly, asset information by segment is not prepared or disclosed.
The following tables provide reconciliations of revenue, gross profit and operating income by reportable segment to consolidated results and were derived from each segment’s internal financial information as used for corporate management purposes. Segment operating income represents income (loss) before income taxes plus depreciation, amortization of intangible assets, share-based compensation, goodwill impairment losses, interest expense, net, and other, and unallocated corporate overhead.
| | | | | | | | | | | | | | | | | | | | | | | |
| Year Ended December 31, 2024 |
| Nurse and Allied Solutions | | Physician and Leadership Solutions | | Technology and Workforce Solutions | | Total |
| Revenue | $ | 1,815,718 | | | $ | 728,608 | | | $ | 439,455 | | | $ | 2,983,781 | |
| Cost of revenue | 1,371,660 | | | 511,959 | | | 180,786 | | | 2,064,405 | |
| Gross profit | 444,058 | | | 216,649 | | | 258,669 | | | 919,376 | |
| Segment selling, general and administrative expenses | 270,467 | | | 137,600 | | | 91,590 | | | 499,657 | |
| Depreciation (included in cost of revenue) | — | | | — | | | (6,676) | | | (6,676) | |
| Segment operating income | $ | 173,591 | | | $ | 79,049 | | | $ | 173,755 | | | 426,395 | |
| Unallocated corporate overhead | | | | | | | 109,515 | |
| Depreciation and amortization | | | | | | | 167,103 | |
| Depreciation (included in cost of revenue) | | | | | | | 6,676 | |
| Share-based compensation | | | | | | | 23,317 | |
| Goodwill impairment losses | | | | | | | 222,457 | |
| Interest expense, net, and other | | | | | | | 69,901 | |
| Loss before income taxes | | | | | | | $ | (172,574) | |
| | | | | | | | | | | | | | | | | | | | | | | |
| Year Ended December 31, 2023 |
| Nurse and Allied Solutions | | Physician and Leadership Solutions | | Technology and Workforce Solutions | | Total |
| Revenue | $ | 2,624,509 | | | $ | 669,701 | | | $ | 495,044 | | | $ | 3,789,254 | |
| Cost of revenue | 1,932,099 | | | 440,230 | | | 167,344 | | | 2,539,673 | |
| Gross profit | 692,410 | | | 229,471 | | | 327,700 | | | 1,249,581 | |
| Segment selling, general and administrative expenses | 330,252 | | | 134,505 | | | 118,977 | | | 583,734 | |
| Depreciation (included in cost of revenue) | — | | | — | | | (6,013) | | | (6,013) | |
| Segment operating income | $ | 362,158 | | | $ | 94,966 | | | $ | 214,736 | | | 671,860 | |
| Unallocated corporate overhead | | | | | | | 154,484 | |
| Depreciation and amortization | | | | | | | 154,914 | |
| Depreciation (included in cost of revenue) | | | | | | | 6,013 | |
| Share-based compensation | | | | | | | 18,020 | |
| Interest expense, net, and other | | | | | | | 54,140 | |
| Income before income taxes | | | | | | | $ | 284,289 | |
| | | | | | | | | | | | | | | | | | | | | | | |
| Year Ended December 31, 2022 |
| Nurse and Allied Solutions | | Physician and Leadership Solutions | | Technology and Workforce Solutions | | Total |
| Revenue | $ | 3,982,453 | | | $ | 697,946 | | | $ | 562,843 | | | $ | 5,243,242 | |
| Cost of revenue | 2,934,738 | | | 456,996 | | | 134,824 | | | 3,526,558 | |
| Gross profit | 1,047,715 | | | 240,950 | | | 428,019 | | | 1,716,684 | |
| Segment selling, general and administrative expenses | 471,489 | | | 148,619 | | | 132,733 | | | 752,841 | |
| Depreciation (included in cost of revenue) | — | | | — | | | (4,104) | | | (4,104) | |
| Segment operating income | $ | 576,226 | | | $ | 92,331 | | | $ | 299,390 | | | 967,947 | |
| Unallocated corporate overhead | | | | | | | 153,669 | |
| Depreciation and amortization | | | | | | | 133,007 | |
| Depreciation (included in cost of revenue) | | | | | | | 4,104 | |
| Share-based compensation | | | | | | | 30,066 | |
| Interest expense, net, and other | | | | | | | 40,398 | |
| Income before income taxes | | | | | | | $ | 606,703 | |
The following tables present the Company’s revenue disaggregated by service type: | | | | | | | | | | | | | | | | | | | | | | | | | | |
| | Year Ended December 31, 2024 |
| | Nurse and Allied Solutions | | Physician and Leadership Solutions | | Technology and Workforce Solutions | | Total |
| Travel nurse staffing | $ | 1,084,398 | | | $ | — | | | $ | — | | | $ | 1,084,398 | |
| Labor disruption services | 63,316 | | | — | | | — | | | 63,316 | |
| Local staffing | 45,517 | | | — | | | — | | | 45,517 | |
| Allied staffing | 610,661 | | | — | | | — | | | 610,661 | |
| Locum tenens staffing | — | | | 566,351 | | | — | | | 566,351 | |
| Interim leadership staffing | — | | | 115,672 | | | — | | | 115,672 | |
| Temporary staffing | 1,803,892 | | | 682,023 | | | — | | | 2,485,915 | |
Permanent placement (1) | 11,826 | | | 46,585 | | | — | | | 58,411 | |
| Language services | — | | | — | | | 298,241 | | | 298,241 | |
| Vendor management systems | — | | | — | | | 104,277 | | | 104,277 | |
| Other technologies | — | | | — | | | 21,195 | | | 21,195 | |
| Technology-enabled services | — | | | — | | | 423,713 | | | 423,713 | |
| Talent planning and acquisition | — | | | — | | | 15,742 | | | 15,742 | |
| Total revenue | $ | 1,815,718 | | | $ | 728,608 | | | $ | 439,455 | | | $ | 2,983,781 | |
| | | | | | | | | | | | | | | | | | | | | | | | | | |
| | Year Ended December 31, 2023 |
| | Nurse and Allied Solutions | | Physician and Leadership Solutions | | Technology and Workforce Solutions | | Total |
| Travel nurse staffing | $ | 1,806,653 | | | $ | — | | | $ | — | | | $ | 1,806,653 | |
| Labor disruption services | 13,303 | | | — | | | — | | | 13,303 | |
| Local staffing | 76,553 | | | — | | | — | | | 76,553 | |
| Allied staffing | 709,632 | | | — | | | — | | | 709,632 | |
| Locum tenens staffing | — | | | 464,797 | | | — | | | 464,797 | |
| Interim leadership staffing | — | | | 136,953 | | | — | | | 136,953 | |
| Temporary staffing | 2,606,141 | | | 601,750 | | | — | | | 3,207,891 | |
Permanent placement (1) | 18,368 | | | 67,951 | | | — | | | 86,319 | |
| Language services | — | | | — | | | 260,121 | | | 260,121 | |
| Vendor management systems | — | | | — | | | 169,370 | | | 169,370 | |
| Other technologies | — | | | — | | | 24,222 | | | 24,222 | |
| Technology-enabled services | — | | | — | | | 453,713 | | | 453,713 | |
| Talent planning and acquisition | — | | | — | | | 41,331 | | | 41,331 | |
| Total revenue | $ | 2,624,509 | | | $ | 669,701 | | | $ | 495,044 | | | $ | 3,789,254 | |
| | | | | | | | | | | | | | | | | | | | | | | | | | |
| | Year Ended December 31, 2022 |
| | Nurse and Allied Solutions | | Physician and Leadership Solutions | | Technology and Workforce Solutions | | Total |
| Travel nurse staffing | $ | 2,912,677 | | | $ | — | | | $ | — | | | $ | 2,912,677 | |
| Labor disruption services | 112,160 | | | — | | | — | | | 112,160 | |
| Local staffing | 142,724 | | | — | | | — | | | 142,724 | |
| Allied staffing | 806,491 | | | — | | | — | | | 806,491 | |
| Locum tenens staffing | — | | | 428,133 | | | — | | | 428,133 | |
| Interim leadership staffing | — | | | 184,819 | | | — | | | 184,819 | |
| Temporary staffing | 3,974,052 | | | 612,952 | | | — | | | 4,587,004 | |
Permanent placement (1) | 8,401 | | | 84,994 | | | — | | | 93,395 | |
| Language services | — | | | — | | | 216,120 | | | 216,120 | |
| Vendor management systems | — | | | — | | | 265,525 | | | 265,525 | |
| Other technologies | — | | | — | | | 29,553 | | | 29,553 | |
| Technology-enabled services | — | | | — | | | 511,198 | | | 511,198 | |
| Talent planning and acquisition | — | | | — | | | 51,645 | | | 51,645 | |
| Total revenue | $ | 3,982,453 | | | $ | 697,946 | | | $ | 562,843 | | | $ | 5,243,242 | |
(1) Includes revenue from international nurse permanent placement, physician permanent placement, and executive search.
The following table presents the Company’s international nurse revenue by service type:
| | | | | | | | | | | | | | | | | |
| | Years Ended December 31, |
| | 2024 | | 2023 | | 2022 |
International nurse staffing (1) | $ | 165,875 | | | $ | 208,132 | | | $ | 161,992 | |
International nurse permanent placement (2) | 11,826 | | | 18,368 | | | 8,401 | |
| Total international nurse revenue | $ | 177,701 | | | $ | 226,500 | | | $ | 170,393 | |
(1) Included in “Travel nurse staffing” as presented in the preceding tables.
(2) Included in “Permanent placement” as presented in the preceding tables.
(u) Recently Adopted Accounting Pronouncements
In November 2023, the FASB issued Accounting Standards Update (“ASU”) 2023-07, “Segment Reporting (Topic 280): Improvements to Reportable Segment Disclosures,” which expands the breadth and frequency of reportable segment disclosure requirements, primarily through enhanced disclosures about significant segment expenses. The new guidance requires public entities to disclose, on an annual and interim basis, significant segment expenses that are regularly provided to the chief operating decision maker (“CODM”), the amount and composition of other segment items by reportable segment, any additional measures of a segment’s profit or loss used by the CODM when assessing performance and deciding how to allocate resources, and the CODM’s title and position. Additionally, public entities will be required to provide in interim periods all disclosures about a reportable segment’s profit or loss that are currently required annually by Topic 280. This standard is effective on a retrospective basis for fiscal years beginning after December 15, 2023 and interim periods within fiscal years beginning after December 15, 2024, with early adoption permitted. The Company adopted this standard for the year ending December 31, 2024. See Note (1)(t), “Summary of Significant Accounting Policies—Segment Information” for additional information. (2) Acquisitions
The Company accounted for each acquisition set forth below using the acquisition method of accounting. Accordingly, the Company recorded the tangible and intangible assets acquired and liabilities assumed at their estimated fair values as of the applicable date of acquisition. Since the applicable date of acquisition, the Company has revised the allocation of the purchase price to the tangible and intangible assets acquired and liabilities assumed based on analysis of information that has been made available through December 31, 2024 or the end of the one-year measurement period, whichever is earlier. Allocations continue to be updated through the measurement period, if necessary. The goodwill recognized for these acquisitions is attributable to expected growth as the Company leverages its brand and diversifies its services offered to clients, including potential revenue growth and margin expansion. The Company recognizes acquisition-related costs in selling, general and administrative expenses in the consolidated statements of comprehensive income (loss). For each acquisition, the Company did not incur any material acquisition-related costs.
MSDR Acquisition
On November 30, 2023, the Company completed its acquisition of MSI Systems Corp. and DrWanted.com LLC (together, “MSDR”), two healthcare staffing companies that specialize in locum tenens and advanced practice. The initial purchase price of $292,818 consisted entirely of cash consideration paid upon acquisition. The acquisition was funded through borrowings under the Company’s $750,000 secured revolving credit facility (the “Senior Credit Facility”), provided for under the Amended Credit Agreement (as defined in Note (8) below). The results of MSDR have been included in the Company’s physician and leadership solutions segment since the date of acquisition. During the second quarter of 2024, $1,649 was returned to the Company in respect of the final working capital settlement. The allocation of the $291,169 purchase price, which was reduced by the final working capital settlement and was finalized during the fourth quarter of 2024, consisted of (1) $41,406 of fair value of tangible assets acquired, which included $562 cash received, (2) $26,371 of liabilities assumed, (3) $92,000 of identified intangible assets, and (4) $184,134 of goodwill, of which $94,762 is deductible for tax purposes. The intangible assets acquired have a weighted average useful life of approximately seven years. The following table summarizes the fair value and useful life of each intangible asset acquired as of the acquisition date:
| | | | | | | | | | | | | | | | | |
| | | Fair Value | | Useful Life |
| | | | | (in years) |
| Identifiable intangible assets | | | | |
| Customer relationships | | $ | 54,300 | | | 7 - 10 |
| Tradenames and trademarks | | 26,400 | | | 3 |
| Staffing databases | | 11,300 | | | 5 |
| | | $ | 92,000 | | | |
Connetics Acquisition
On May 13, 2022, the Company completed its acquisition of Connetics Communications, LLC (“Connetics”), which specializes in the direct hire recruitment and permanent placement of international nurse and allied health professionals with healthcare facilities in the United States. The initial purchase price of $78,764 included (1) $70,764 cash consideration paid upon acquisition, funded through cash on hand, and (2) contingent consideration (earn-out payment) of up to $12,500 with an estimated fair value of $8,000 as of the acquisition date. The contingent earn-out payment is based on the operating results of Connetics for the twelve months ending May 31, 2023, which resulted in a payment of $7,500 in the third quarter of 2023. The results of Connetics have been included in the Company’s nurse and allied solutions segment since the date of acquisition. During the fourth quarter of 2022, $231 was returned to the Company in respect of the final working capital settlement.
The allocation of the $78,533 purchase price, which was reduced by the final working capital settlement and was finalized during the second quarter of 2023, consisted of (1) $3,172 of fair value of tangible assets acquired, which included $963 cash received, (2) $8,244 of liabilities assumed, (3) $40,200 of identified intangible assets, and (4) $43,405 of goodwill, of which $42,905 is deductible for tax purposes. The intangible assets acquired have a weighted average useful life of approximately thirteen years. The following table summarizes the fair value and useful life of each intangible asset acquired as of the acquisition date:
| | | | | | | | | | | | | | | | | |
| | | Fair Value | | Useful Life |
| | | | | (in years) |
| Identifiable intangible assets | | | | |
| Customer relationships | | $ | 32,800 | | | 15 |
| Staffing database | | 4,200 | | | 5 |
| Tradenames and trademarks | | 3,200 | | | 5 |
| | | $ | 40,200 | | | |
(3) Fair Value Measurement
Fair value represents the price that would be received for an asset or paid to transfer a liability (an exit price) in the principal or most advantageous market for the asset or liability in an orderly transaction between market participants on the measurement date. When determining fair value, the Company considers the principal or most advantageous market in which the Company would conduct a transaction, in addition to the assumptions that market participants would use when pricing the related assets or liabilities, including non-performance risk.
A three-level hierarchy prioritizes the inputs to valuation techniques used to measure fair value and requires an entity to maximize the use of observable inputs and minimize the use of unobservable inputs when measuring fair value. The three levels of the fair value hierarchy are as follows:
Level 1—Quoted prices in active markets for identical assets or liabilities.
Level 2—Observable inputs other than Level 1 prices such as quoted prices for similar assets or liabilities; quoted prices in markets that are not active; or other inputs that are observable or can be corroborated by observable market data for substantially the full term of the assets or liabilities.
Level 3—Unobservable inputs that are supported by little or no market activity and that are significant to the fair value of the assets or liabilities.
There were no transfers between the three levels of the fair value hierarchy during the years ended December 31, 2024, 2023 and 2022.
Assets and Liabilities Measured on a Recurring Basis
From time to time, the Company invests a portion of its cash and cash equivalents in non-federally insured money market funds that are measured at fair value based on quoted prices, which are Level 1 inputs.
The Company’s obligation under its deferred compensation plan is measured at fair value based on quoted market prices of the participants’ elected investments, which are Level 1 inputs. The deferred compensation plan is more fully described in Note (9), “Retirement Plans.”
The Company’s restricted cash equivalents and investments that serve as collateral for the Company’s captive insurance company include commercial paper and corporate bonds. The commercial paper is measured at observable market prices for identical securities that are traded in less active markets, which are Level 2 inputs. The corporate bonds are measured using readily available pricing sources that utilize observable market data, including the current interest rate for comparable instruments, which are Level 2 inputs. The following table presents the fair value of commercial paper and corporate bonds issued and outstanding:
| | | | | | | | | | | |
| | As of December 31, 2024 | | As of December 31, 2023 |
| Commercial paper | $ | 64,580 | | | $ | 48,206 | |
| | | |
| Total classified as restricted cash equivalents | $ | 64,580 | | | $ | 48,206 | |
| Commercial paper | $ | 1,399 | | | $ | — | |
| Corporate bonds | 6,769 | | | 15,563 | |
| Total classified as restricted investments | $ | 8,168 | | | $ | 15,563 | |
The fair value of our available-for-sale securities as of December 31, 2024, by remaining contractual maturities, are presented in the following table:
| | | | | |
| | Fair Value |
| Due in one year or less | $ | 5,770 | |
| Due after one year through five years | 2,398 | |
| $ | 8,168 | |
Expected maturities may differ from stated due dates because borrowers may have the ability to call or prepay obligations with or without call or prepayment penalties.
The Company’s contingent consideration liabilities are measured at fair value using probability-weighted discounted cash flow analysis or a simulation-based methodology for the acquired companies, which are Level 3 inputs. The Company recognizes changes to the fair value of its contingent consideration liabilities in selling, general and administrative expenses in the consolidated statements of comprehensive income (loss). There were no contingent consideration liabilities outstanding as of December 31, 2024 and 2023.
The following tables present information about the above-referenced assets and liabilities and indicate the fair value hierarchy of the valuation techniques utilized to determine such fair value: | | | | | | | | | | | | | | | | | | | | | | | | | | | | | | | | | | | | | | | | | | | | | | | |
| | Fair Value Measurements as of December 31, 2024 | | Fair Value Measurements as of December 31, 2023 |
| Assets (Liabilities) |
Level 1 | |
Level 2 | | Level 3 | | Total | | Level 1 | | Level 2 | | Level 3 | | Total |
| | | | | | | | | | | | | | | |
| Deferred compensation | $ | (191,006) | | | $ | — | | | $ | — | | | $ | (191,006) | | | $ | (165,574) | | | $ | — | | | $ | — | | | $ | (165,574) | |
| Corporate bonds | — | | | 6,769 | | | — | | | 6,769 | | | — | | | 15,563 | | | — | | | 15,563 | |
| Commercial paper | — | | | 65,979 | | | — | | | 65,979 | | | — | | | 48,206 | | | — | | | 48,206 | |
| | | | | | | | | | | | | | | |
Assets Measured on a Non-Recurring Basis
The Company applies fair value techniques on a non-recurring basis associated with valuing identifiable intangible assets acquired through acquisitions and potential impairment losses related to its goodwill, indefinite-lived intangible assets, long-lived assets, and equity investments.
The fair value of identifiable intangible assets are determined using either the income approach (the relief-from-royalty method, multi-period excess earnings method or with-and-without method) or the cost approach (replacement cost method). These valuation approaches use a combination of assumptions, including Level 3 inputs, such as (i) forecasted revenue, growth rates and customer attrition rates, (ii) forecasted operating expenses and profit margins, and (iii) royalty rates and discount rates used to present value the forecasted cash flows.
The Company evaluates goodwill and indefinite-lived intangible assets annually for impairment and whenever events or changes in circumstances indicate that it is more likely than not that an impairment exists. The Company determines the fair value of its reporting units based on a combination of inputs, including the market capitalization of the Company, as well as Level 3 inputs such as discounted cash flows, which are not observable from the market, directly or indirectly. The Company
determines the fair value of indefinite-lived intangible assets using the income approach (relief-from-royalty method) based on Level 3 inputs. Refer to Note (4) “Goodwill and Identifiable Intangible Assets” for additional details. The Company’s equity investment represents an investment in a non-controlled corporation without a readily determinable market value. The Company has elected to measure the investment at cost minus impairment, if any, plus or minus changes resulting from observable price changes. When the Company identifies price changes in orderly transactions for identical or similar investments of the same issuer, the investment is measured at fair value. To determine whether a security of the same issuer is similar to the Company’s equity investment, the Company considers other information available such as the rights and obligations of the securities. The Company recognizes changes to the fair value of its equity investment in interest expense, net, and other in the consolidated statements of comprehensive income (loss). As of December 31, 2024, the Company has recognized cumulative upward adjustments and cumulative downward adjustments (including impairments) of $14,033 and $19,860, respectively. The balance of the equity investment was $2,773 and $12,503 as of December 31, 2024 and 2023, respectively.
Fair Value of Financial Instruments
The Company is required to disclose the fair value of financial instruments for which it is practicable to estimate the value, even though these instruments are not recognized at fair value in the consolidated balance sheets. The fair value of the Company’s 2027 Notes (as defined in Note (8) below) and 4.000% senior notes due 2029 (the “2029 Notes”) was estimated using quoted market prices in active markets for identical liabilities, which are Level 1 inputs. The carrying amounts and estimated fair value of the 2027 Notes and the 2029 Notes, which are more fully described in Note (8), “Notes Payable and Credit Agreement,” are presented in the following table: | | | | | | | | | | | | | | | | | | | | | | | |
| As of December 31, 2024 | | As of December 31, 2023 |
| Carrying
Amount | | Estimated
Fair Value | | Carrying
Amount | | Estimated
Fair Value |
| 2027 Notes | $ | 500,000 | | | $ | 473,750 | | | $ | 500,000 | | | $ | 468,750 | |
| 2029 Notes | 350,000 | | | 312,375 | | | 350,000 | | | 314,125 | |
The fair value of the Company’s long-term self-insurance accruals cannot be estimated as the Company cannot reasonably determine the timing of future payments.
(4) Goodwill and Identifiable Intangible Assets
As of December 31, 2024 and 2023, the Company had the following acquired intangible assets:
| | | | | | | | | | | | | | | | | | | | | | | | | | | | | | | | | | | |
| | As of December 31, 2024 | | As of December 31, 2023 |
| | Gross
Carrying
Amount | | Accumulated
Amortization | | Net
Carrying
Amount | | Gross
Carrying
Amount | | Accumulated
Amortization | | Net
Carrying
Amount |
| Intangible assets subject to amortization: | | | | | | | | | | | |
| Staffing databases | $ | 52,336 | | | $ | (39,879) | | | $ | 12,457 | | | $ | 52,336 | | | $ | (33,398) | | | $ | 18,938 | |
| Customer relationships | 532,048 | | | (247,550) | | | 284,498 | | | 532,048 | | | (210,606) | | | 321,442 | |
| Tradenames and trademarks | 284,488 | | | (204,159) | | | 80,329 | | | 284,488 | | | (161,656) | | | 122,832 | |
| Non-compete agreements | 9,399 | | | (7,783) | | | 1,616 | | | 9,399 | | | (6,727) | | | 2,672 | |
| Acquired technology | 37,915 | | | (35,451) | | | 2,464 | | | 37,915 | | | (29,665) | | | 8,250 | |
| $ | 916,186 | | | $ | (534,822) | | | $ | 381,364 | | | $ | 916,186 | | | $ | (442,052) | | | $ | 474,134 | |
| | | | | | | | | | | |
| | | | | | | | | | | |
| | | | | | | | | | | |
Aggregate amortization expense for intangible assets was $92,770 and $89,756 for the years ended December 31, 2024 and 2023, respectively. Based on the net carrying amount of intangible assets subject to amortization, the estimated future amortization expense as of December 31, 2024 is as follows:
| | | | | |
| | Amount |
| Year ending December 31, 2025 | $ | 75,633 | |
| Year ending December 31, 2026 | 67,108 | |
| Year ending December 31, 2027 | 56,069 | |
| Year ending December 31, 2028 | 35,889 | |
| Year ending December 31, 2029 | 27,166 | |
| Thereafter | 119,499 | |
| $ | 381,364 | |
The Company performed its annual goodwill impairment test as of October 31, 2024. Due to a sustained decline in market capitalization in the fourth quarter, the Company performed a quantitative impairment test for its three reporting units: nurse and allied solutions, physician and leadership solutions, and technology and workforce solutions. The Company engaged a third-party valuation specialist to assist in determining the fair value of each reporting unit, which was estimated using an equal weighting of the income and market approaches. The discounted cash flow method (within the income approach) requires the use of Level 3 inputs, including (i) estimated future cash flows based on internally-developed forecasts of revenue, expenses and profit margins, (ii) estimated long-term growth rates, and (iii) determination of the Company’s weighted average cost of capital that reflects the relative risk of the cash flows for each reporting unit. The guideline public company method (within the market approach) derives valuation multiples based on the market capitalization of similar publicly traded companies to apply to the forecasted financial metrics of each reporting unit. The market multiples used are revenue and earnings before interest, taxes, depreciation, and amortization (EBITDA). In addition, as the fair values determined under the guideline public company method represent a noncontrolling interest, a control premium was applied to arrive at the estimated fair value of each reporting unit on a controlling basis.
The annual test resulted in goodwill impairment losses for the nurse and allied solutions and physician and leadership solutions reporting units. Consideration was first given to Company’s long-lived assets, and no impairment was recognized on such assets as the future undiscounted cash flows were in excess of the carrying amount of each asset group tested for impairment. The decline in the fair value of the nurse and allied solutions reporting unit below its carrying amount resulted from changes in estimated future cash flows due to a continued decline in demand (primarily in the travel nurse staffing business) and gross margin pressures driven by higher provider pay packages. As a result, an impairment loss of $104,777 was recorded to goodwill of the nurse and allied solutions reporting unit. The decline in the fair value of the physician and leadership solutions reporting unit below its carrying amount resulted from changes in estimated future cash flows due to gross margin pressures in the locum tenens staffing business driven by higher provider pay packages and a continued decline in demand for the healthcare interim leadership staffing, executive search, and physician permanent placement businesses. As a result, an impairment loss of $81,946 was recorded to goodwill of the physician and leadership solutions reporting unit.
Recognition of the non-cash goodwill impairment losses resulted in income tax benefits which generated additional deferred tax assets of $18,506 and $17,228 that increased the carrying amount of the nurse and allied solutions and physician and leadership solutions reporting units, respectively. Incremental impairment losses of the same amounts were required to reduce the carrying amounts of the reporting units to their previously determined fair values. After recognition of these incremental charges, the goodwill impairment losses were $222,457 in total.
Following the annual goodwill impairment test as of October 31, 2024, the Company did not identify any events or circumstances during the final two months of the year ended December 31, 2024 that indicated it may be more likely than not that the fair value of its reporting units were reduced below their respective carrying amounts.
The following table summarizes the activity related to the carrying value of goodwill by reportable segment: | | | | | | | | | | | | | | | | | | | | | | | |
| Nurse and Allied
Solutions | | Physician and Leadership
Solutions | | Technology and Workforce Solutions | | Total |
| Balance, January 1, 2023 | $ | 382,005 | | | $ | 152,800 | | | $ | 400,559 | | | $ | 935,364 | |
| | | | | | | |
| Goodwill adjustment for Connetics acquisition | 415 | | | — | | | — | | | 415 | |
| Goodwill from MSDR acquisition | — | | | 175,770 | | | — | | | 175,770 | |
| Balance, December 31, 2023 | 382,420 | | | 328,570 | | | 400,559 | | | 1,111,549 | |
| Goodwill adjustment for MSDR acquisition | — | | | 8,364 | | | — | | | 8,364 | |
| Goodwill impairment losses | (123,283) | | | (99,174) | | | — | | | (222,457) | |
| Balance, December 31, 2024 | $ | 259,137 | | | $ | 237,760 | | | $ | 400,559 | | | $ | 897,456 | |
| Accumulated impairment loss as of December 31, 2023 | $ | 154,444 | | | $ | 60,495 | | | $ | — | | | $ | 214,939 | |
| Accumulated impairment loss as of December 31, 2024 | $ | 277,727 | | | $ | 159,669 | | | $ | — | | | $ | 437,396 | |
(5) Leases
The Company leases certain office facilities, data centers, and equipment under various operating leases. The Company’s short-term leases (with initial lease terms of 12 months or less) are primarily related to housing arrangements for healthcare professionals on assignment. Certain leases include one or more options to renew, with renewal terms that can extend the lease term up to 10 years. Additionally, certain leases also include options to terminate the leases within 2 years.
In the first quarter of 2022, the Company entered into a lease agreement for an office building located in Dallas, Texas, with future undiscounted lease payments of approximately $29,514, excluding lease incentives. The lease commenced upon substantial completion of the construction of the office building in June 2023. The initial term of the lease is approximately eleven years with options to renew during the lease term. The Company recognized a right-of-use asset and operating lease liability of $15,782 and $22,713, respectively, at lease commencement, which reflects the utilization of a tenant improvement allowance of $6,931 accounted for as a lease incentive.
The components of lease expense were as follows: | | | | | | | | | | | | | | | | | |
| Years Ended December 31, |
| 2024 | | 2023 | | 2022 |
| Operating lease cost | $ | 9,204 | | | $ | 9,610 | | | $ | 16,439 | |
| Short-term lease cost | 2,437 | | | 3,738 | | | 5,787 | |
| Variable and other lease cost | 2,469 | | | 2,789 | | | 3,129 | |
| Net lease cost | $ | 14,110 | | | $ | 16,137 | | | $ | 25,355 | |
The maturities of lease liabilities as of December 31, 2024 were as follows:
| | | | | |
| Operating Leases |
| Year ending December 31, 2025 | $ | 8,715 | |
| Year ending December 31, 2026 | 7,580 | |
| Year ending December 31, 2027 | 7,672 | |
| Year ending December 31, 2028 | 7,866 | |
| Year ending December 31, 2029 | 5,861 | |
| Thereafter | 12,486 | |
| Total lease payments | 50,180 | |
| Less imputed interest | (8,255) | |
| Present value of lease liabilities | $ | 41,925 | |
The weighted average remaining lease term and discount rate as of December 31, 2024 and 2023 were as follows: | | | | | | | | | | | |
| December 31, |
| 2024 | | 2023 |
| Weighted average remaining lease term | 7 years | | 7 years |
| Weighted average discount rate | 5.6 | % | | 5.3 | % |
(6) Balance Sheet Details
The consolidated balance sheets detail is as follows:
| | | | | | | | | | | |
| | December 31, |
| | 2024 | | 2023 |
| Other current assets: | | | |
| Restricted cash and cash equivalents | $ | 14,984 | | | $ | 22,056 | |
| Income taxes receivable | 11,683 | | | 5,350 | |
| Other | 26,791 | | | 18,264 | |
| Other current assets | $ | 53,458 | | | $ | 45,670 | |
| | | |
| | | |
| | | |
| | | |
| | | |
| | | |
| Fixed assets: | | | |
| Furniture and equipment | $ | 90,970 | | | $ | 71,815 | |
| Software | 440,034 | | | 388,812 | |
| Leasehold improvements | 16,061 | | | 15,839 | |
| 547,065 | | | 476,466 | |
| Accumulated depreciation | (360,795) | | | (285,081) | |
| Fixed assets, net | $ | 186,270 | | | $ | 191,385 | |
| | | |
| Other assets: | | | |
| Life insurance cash surrender value | $ | 194,350 | | | $ | 162,780 | |
| Operating lease right-of-use assets | 32,115 | | | 34,543 | |
| Other | 31,588 | | | 39,473 | |
| Other assets | $ | 258,053 | | | $ | 236,796 | |
| | | |
| Accounts payable and accrued expenses: | | | |
| Trade accounts payable | $ | 31,356 | | | $ | 54,128 | |
| Subcontractor payable | 69,563 | | | 122,983 | |
| Accrued expenses | 57,263 | | | 82,257 | |
| Loss contingencies | 2,999 | | | 69,837 | |
| Professional liability reserve | 8,395 | | | 7,761 | |
| Other | 14,735 | | | 6,881 | |
| Accounts payable and accrued expenses | $ | 184,311 | | | $ | 343,847 | |
| | | |
| Accrued compensation and benefits: | | | |
| Accrued payroll | $ | 46,896 | | | $ | 53,633 | |
| Accrued bonuses and commissions | 25,988 | | | 31,236 | |
| | | |
| ESPP contributions | 812 | | | 950 | |
| Workers compensation reserve | 9,954 | | | 12,130 | |
| Deferred compensation | 191,006 | | | 165,574 | |
| Other | 12,888 | | | 15,013 | |
| Accrued compensation and benefits | $ | 287,544 | | | $ | 278,536 | |
| | | |
| Other current liabilities: | | | |
| Deferred revenue | $ | 10,014 | | | $ | 11,303 | |
| | | |
| | | |
| Client deposits | 56,341 | | | 8,707 | |
Operating lease liabilities | 6,200 | | | 7,993 | |
| Other | 1,375 | | | 5,735 | |
| Other current liabilities | $ | 73,930 | | | $ | 33,738 | |
| | | |
| | | | | | | | | | | |
| | December 31, |
| | 2024 | | 2023 |
| Other long-term liabilities: | | | |
| Workers compensation reserve | $ | 18,445 | | | $ | 21,169 | |
| Professional liability reserve | 38,307 | | | 36,891 | |
| | | |
| | | |
Operating lease liabilities | 35,725 | | | 37,603 | |
| Other | 14,973 | | | 13,316 | |
| Other long-term liabilities | $ | 107,450 | | | $ | 108,979 | |
(7) Income Taxes
The provision for income taxes from operations for the years ended December 31, 2024, 2023 and 2022 consists of the following:
| | | | | | | | | | | | | | | | | |
| | Years Ended December 31, |
| | 2024 | | 2023 | | 2022 |
| Current income taxes: | | | | | |
| Federal | $ | 20,430 | | | $ | 65,877 | | | $ | 145,217 | |
| State | 5,042 | | | 20,666 | | | 42,051 | |
| Total | 25,472 | | | 86,543 | | | 187,268 | |
| Deferred income taxes: | | | | | |
| Federal | (36,685) | | | (10,203) | | | (20,173) | |
| State | (14,382) | | | (2,730) | | | (4,442) | |
| Total | (51,067) | | | (12,933) | | | (24,615) | |
| Provision (benefit) for income taxes from operations | $ | (25,595) | | | $ | 73,610 | | | $ | 162,653 | |
The Company’s income tax expense differs from the amount that would have resulted from applying the federal statutory rate of 21% for 2024, 2023 and 2022 to pretax income (loss) from operations because of the effect of the following items during the years ended December 31, 2024, 2023 and 2022:
| | | | | | | | | | | | | | | | | |
| | Years Ended December 31, |
| | 2024 | | 2023 | | 2022 |
| Tax expense at federal statutory rate | $ | (36,241) | | | $ | 59,701 | | | $ | 127,390 | |
| State taxes, net of federal benefit | (7,379) | | | 14,170 | | | 29,711 | |
| Non-deductible expenses | 2,110 | | | 3,010 | | | — | |
| Share-based compensation | 513 | | | (944) | | | (2,383) | |
| | | | | |
| Unrecognized tax benefit | 1,328 | | | 1,957 | | | 3,245 | |
| Company-owned life insurance policies | (4,855) | | | (4,428) | | | 4,094 | |
| Tax credits | (1,289) | | | (3,172) | | | (2,741) | |
| Goodwill impairment losses | 18,054 | | | — | | | — | |
| Other, net | 2,164 | | | 3,316 | | | 3,337 | |
| Income tax expense (benefit) from operations | $ | (25,595) | | | $ | 73,610 | | | $ | 162,653 | |
The tax effects of temporary differences that give rise to significant portions of deferred tax assets and liabilities are presented below as of December 31, 2024 and 2023:
| | | | | | | | | | | |
| | December 31, |
| 2024 | | 2023 |
| Deferred tax assets: | | | |
| Share-based compensation | $ | 6,394 | | | $ | 5,461 | |
| Deferred compensation | 48,821 | | | 41,976 | |
| Accrued bonus | 5,546 | | | 2,585 | |
| | | |
| Accrued expenses | 10,783 | | | 11,426 | |
| | | |
| Operating lease liabilities | 10,954 | | | 11,296 | |
| Net operating losses | 5,314 | | | 4,809 | |
| Loss contingencies | 563 | | | 813 | |
| Workers compensation insurance | 5,273 | | | 5,997 | |
| Professional services expenses | 179 | | | 16,242 | |
| Provision for expected credit losses | 8,415 | | | 9,161 | |
| Sales credits | 5,960 | | | 6,896 | |
| Other | 3,995 | | | 1,516 | |
| Total deferred tax assets | $ | 112,197 | | | $ | 118,178 | |
| Deferred tax liabilities: | | | |
| Intangible assets | $ | (65,251) | | | $ | (111,590) | |
| Fixed assets | (8,662) | | | (14,947) | |
| Operating lease right-of-use assets | (8,395) | | | (8,539) | |
| Other | (4,060) | | | (6,452) | |
| Total deferred tax liabilities | $ | (86,368) | | | $ | (141,528) | |
| | | |
| Net deferred tax asset (liability) | $ | 25,829 | | | $ | (23,350) | |
In assessing the realizability of deferred tax assets, management considers whether it is more likely than not that some portion or all of the deferred tax assets will not be realized. Management believes it is more likely than not that the Company will realize the benefits of its deferred tax assets.
The amount of federal net operating losses (“NOL”) carryforward that is available for use in years subsequent to December 31, 2024 is $18,700, which begins to expire by 2030. The amount of state NOL carryforward that is available for use in years subsequent to December 31, 2024 is $27,000, which begins to expire by 2036.
A summary of the changes in the amount of unrecognized tax benefits (excluding interest and penalties) for 2024, 2023 and 2022 is as follows:
| | | | | | | | | | | | | | | | | |
| 2024 | | 2023 | | 2022 |
| Beginning balance of unrecognized tax benefits | $ | 8,689 | | | $ | 6,980 | | | $ | 4,067 | |
| Additions based on tax positions related to the current year | 978 | | | 1,873 | | | 1,464 | |
| Additions based on tax positions of prior years | 266 | | | 491 | | | 1,966 | |
| | | | | |
| Reductions due to lapse of applicable statute of limitation | (484) | | | (655) | | | (517) | |
| | | | | |
| Ending balance of unrecognized tax benefits | $ | 9,449 | | | $ | 8,689 | | | $ | 6,980 | |
At December 31, 2024, if recognized, approximately $10,467 net of $1,848 of temporary differences would affect the effective tax rate (including interest and penalties).
The Company recognizes interest related to unrecognized tax benefits in income tax expense. The Company had approximately $2,861, $1,942 and $1,390 of accrued interest related to unrecognized tax benefits at December 31, 2024, 2023 and 2022, respectively. The amount of interest expense recognized in 2024, 2023 and 2022 was $920, $552 and $826, respectively.
The Company is subject to taxation in the U.S. and various states and foreign jurisdictions. With few exceptions, as of December 31, 2024, the Company is no longer subject to state, local or foreign examinations by tax authorities for tax years before 2011, and the Company is no longer subject to U.S. federal income or payroll tax examinations for tax years before 2021.
The Company believes its liability for unrecognized tax benefits and contingent tax issues is adequate with respect to all open years. Notwithstanding the foregoing, the Company could adjust its provision for income taxes and contingent tax liability based on future developments.
CARES Act
Pursuant to the business tax provisions in the Coronavirus Aid, Relief, and Economic Security Act (the “CARES Act”), the Company deferred payment of the employer’s share of payroll taxes of $48,452. Approximately half of such taxes was paid during the fourth quarter of 2021 and the remaining balance was paid during the fourth quarter of 2022.
(8) Notes Payable and Credit Agreement
(a) The Company’s Credit Agreement and Revolving Credit Facility
On February 10, 2023, the Company entered into the third amendment to its credit agreement (the “Third Amendment”). The Third Amendment (together with the credit agreement, the first amendment and the second amendment, collectively, the “Amended Credit Agreement”) provides for, among other things, the following: (i) an extension of the maturity date of the Senior Credit Facility to February 10, 2028, (ii) an increase to the Senior Credit Facility from $400,000 to $750,000, and (iii) a transition from LIBOR to a Secured Overnight Financing Rate (“SOFR”)-based interest rate. On November 5, 2024, the Company entered into the fourth amendment to its credit agreement which increased the consolidated net leverage ratio covenant for the year ending December 31, 2025. The obligations of the Company under the Amended Credit Agreement are secured by substantially all of the assets of the Company.
Borrowings under the Senior Credit Facility bear interest at floating rates, at the Company’s option, based upon either SOFR plus a spread of 1.00% to 1.75% or a base rate plus a spread of 0.00% to 0.75%. The applicable spread is determined quarterly based upon the Company’s consolidated net leverage ratio (as calculated per the Amended Credit Agreement). The Senior Credit Facility, which includes a $125,000 sublimit for the issuance of letters of credit and a $75,000 sublimit for swingline loans, is available for working capital, capital expenditures, permitted acquisitions and general corporate purposes.
(b) The Company’s 4.625% Senior Notes Due 2027
On August 13, 2020, the Company completed the issuance of an additional $200,000 aggregate principal amount of 4.625% senior notes due 2027 (the “New 2027 Notes”), which were issued at a price of 101.000% of the aggregate principal amount. The New 2027 Notes were issued pursuant to the existing indenture, dated as of October 1, 2019, under which the Company previously issued $300,000 aggregate principal amount of 4.625% senior notes due 2027 (the “Existing 2027 Notes” and together with the New 2027 Notes, the “2027 Notes”). The New 2027 Notes are being treated as a single series with the Existing 2027 Notes and have the same terms (other than issue price, issue date and the date from which interest accrues) as those of the Existing 2027 Notes. The 2027 Notes are unsecured obligations of the Company and the interest is fixed at 4.625% and payable semi-annually in arrears on April 1 and October 1 of each year, commencing October 1, 2020 with respect to the New 2027 Notes. The aggregate principal amount of the 2027 Notes matures on October 1, 2027.
(c) The Company’s 4.000% Senior Notes Due 2029
On October 20, 2020, the Company completed the issuance of $350,000 aggregate principal amount of the 2029 Notes, which mature on April 15, 2029. The 2029 Notes are unsecured obligations of the Company and the interest is fixed at 4.000% and payable semi-annually in arrears on April 15 and October 15 of each year, commencing April 15, 2021.
(d) Debt Balances
Outstanding debt balances as of December 31, 2024 and 2023 consisted of the following: | | | | | | | | | | | |
| As of December 31, |
| 2024 | | 2023 |
| | | |
| Senior Credit Facility | $ | 210,000 | | | $ | 460,000 | |
| | | |
| 2027 Notes | 500,000 | | | 500,000 | |
| 2029 Notes | 350,000 | | | 350,000 | |
| Total debt outstanding | 1,060,000 | | | 1,310,000 | |
| Less unamortized fees and premium | (4,128) | | | (5,312) | |
| | | |
| Long-term portion of notes payable | $ | 1,055,872 | | | $ | 1,304,688 | |
At December 31, 2024, with $20,358 of outstanding letters of credit collateralized by the Senior Credit Facility, there was $519,642 of available credit under the Senior Credit Facility. The interest rate for the outstanding borrowings under the Senior Credit Facility was 6.0% on a SOFR basis as of December 31, 2024. The repayment of a portion of the outstanding borrowings under the Senior Credit Facility subsequent to December 31, 2024 is detailed in Note (1)(g), “Summary of Significant Accounting Policies—Restricted Cash, Cash Equivalents and Investments.” (e) Letters of Credit
At December 31, 2024, the Company maintained outstanding standby letters of credit totaling $20,912 as collateral in relation to its workers’ compensation insurance agreements and a corporate office lease agreement. Of the $20,912 outstanding letters of credit, the Company has collateralized $554 in cash and cash equivalents and the remaining $20,358 is collateralized by the Senior Credit Facility. Outstanding standby letters of credit at December 31, 2023 totaled $21,312.
(9) Retirement Plans
The Company maintains the AMN Services 401(k) Retirement Savings Plan (the “AMN Plan”), which the Company believes complies with the IRC Section 401(k) provisions. The AMN Plan covers all employees that meet certain age and other eligibility requirements. A discretionary matching contribution is determined by the Company each year. Employer contribution expenses incurred under the AMN Plan were $4,004, $5,673 and $31,409 for the years ended December 31, 2024, 2023 and 2022, respectively. Employer contribution expenses for the year ended December 31, 2022 included one-time contributions and a temporary increase to the discretionary matching contribution for a portion of the year.
The Company has a deferred compensation plan for certain executives and employees (the “Plan”). The Plan is not intended to be tax qualified and is an unfunded plan. The Plan is composed of deferred compensation and all related income and losses attributable thereto. Discretionary matching contributions to the Plan are made that vest incrementally so that the employee is fully vested in the match following five years of employment with the Company. Under the Plan, participants can defer up to 80% of their base salary, 90% of their variable compensation and 100% of their vested RSUs or vested PRSUs. A discretionary matching contribution is determined by the Company each year. Employer contributions under the Plan were $6,849, $10,822 and $18,023 for the years ended December 31, 2024, 2023 and 2022, respectively. Employer contribution expenses for the year ended December 31, 2022 included one-time contributions and a temporary increase to the discretionary matching contribution for a portion of the year. In connection with the administration of the Plan, the Company has purchased company-owned life insurance policies insuring the lives of certain officers and employees. The cash surrender value of these policies was $194,350 and $162,780 at December 31, 2024 and 2023, respectively. The cash surrender value of these insurance policies is included in other assets in the consolidated balance sheets.
(10) Capital Stock
(a) Preferred Stock
The Company has 10,000 shares of preferred stock authorized for issuance in one or more series (including preferred stock designated as Series A Conditional Convertible Preferred Stock), at a par value of $0.01 per share. At December 31, 2024 and 2023, no shares of preferred stock were outstanding.
(b) Treasury Stock
On November 1, 2016, the Company’s board of directors approved a share repurchase program under which the Company may repurchase up to $150,000 of its outstanding common stock. On November 10, 2021, February 17, 2022, June 15, 2022,
and February 16, 2023, the Company announced increases to the share repurchase program totaling $1,200,000 for a total of $1,350,000 of repurchase authorization, of which $226,658 remained on the repurchase program as of December 31, 2024. The amount and timing of the purchases will depend on a number of factors including the price of the Company’s shares, trading volume, Company performance, Company liquidity, general economic and market conditions and other factors that the Company’s management believes are relevant. The share repurchase program does not require the purchase of any minimum number of shares and may be suspended or discontinued at any time.
The Company intends to make all repurchases and to administer the plan in accordance with applicable laws and regulatory guidelines, including Rule 10b-18 of the Exchange Act, and in compliance with its debt instruments. Repurchases may be made from cash on hand, free cash flow generated from the Company’s business or from the Company’s Senior Credit Facility. Repurchases may be made from time to time through open market purchases or privately negotiated transactions. Repurchases may also be made pursuant to one or more plans established pursuant to Rule 10b5-1 under the Exchange Act that would permit shares to be repurchased when the Company might otherwise be precluded from doing so under the Company’s securities trading policy.
During the year ended December 31, 2024, the Company did not repurchase any shares of its common stock. The total number of shares repurchased, average price per share (excluding broker’s fees), and total cost (excluding the effect of excise taxes) for the years ended December 31, 2023 and 2022 were as follows:
| | | | | | | | | | | | | |
| | | | Years Ended December 31, |
| | | | 2023 | | 2022 |
| Number of shares repurchased | | | 4,383 | | | 5,644 | |
| Average price per share | | | $ | 96.90 | | | $ | 102.16 | |
| Total cost of share repurchases | | | $ | 424,744 | | | $ | 576,767 | |
During the year ended December 31, 2023, the Company repurchased 2,362 shares of its common stock through the open market at an average price of $95.13 per share (excluding broker’s fees) for an aggregate purchase price of $224,744 (excluding the effect of excise taxes). Additionally, on May 8, 2023, the Company entered into an accelerated share repurchase (“ASR”) agreement with a counterparty whereupon the Company prepaid $200,000 and received an initial delivery of 1,760 shares of its common stock, which was 80% of the prepayment amount based on a price of $90.89 per share. On August 10, 2023, the Company received a final delivery of approximately 261 additional shares of its common stock, representing the remaining 20% of the prepayment and the final settlement of the ASR agreement. The total number of shares received and average price per share of $98.97 was based on the volume-weighted average price over the term of the ASR agreement, less an agreed upon discount. The Company recognized the shares delivered pursuant to the ASR as increases to treasury stock in the consolidated statements of stockholders’ equity during the year ended December 31, 2023.
The shares repurchased during the year ended December 31, 2022 were all through the open market.
(11) Share-Based Compensation
(a) Equity Award Plans
Equity Plan
The Company established the AMN Healthcare Equity Plan (as amended or amended and restated from time to time, the “Equity Plan”), which has been approved by the Company’s stockholders. Any shares to be issued under the Equity Plan will be issued by the Company from authorized but unissued common stock or shares of common stock reacquired by the Company. As of December 31, 2024 and 2023, 1,668 and 2,264 shares of common stock were reserved for future grants under the Equity Plan, respectively.
Employee Stock Purchase Plan
During 2023, the Company established the AMN Healthcare Services, Inc. Employee Stock Purchase Plan (the “ESPP”) which authorizes the issuance of up to 1,000 shares of the Company’s common stock. The ESPP provides eligible employees with the opportunity to purchase shares of the Company’s common stock at a discount through payroll deductions during a six-month purchase period. Shares are purchased at 85% of the fair market value of the Company’s common stock on the offering date or the purchase date of the applicable purchase period, whichever is lower. Employee contributions were $3,250 and $950 for the years ended December 31, 2024 and 2023, respectively. There were 78 shares issued under the ESPP during the year ended December 31, 2024 and the number of shares remaining available for future issuance was 922 as of December 31, 2024. No purchases were made and no shares were issued under the ESPP during the year ended December 31, 2023.
Other Plans
From time to time, the Company grants, and has granted, key employees inducement awards outside of the Equity Plan (collectively, “Other Plans”), which have recently consisted of RSUs. Although these awards are not made under the Equity Plan, the key terms and conditions of the grant are typically the same as equity awards made under the Equity Plan.
(b) Share-Based Compensation
Restricted Stock Units
RSUs and PRSUs (subject to performance conditions being achieved) granted under the Equity Plan generally entitle the holder to receive, at the end of a vesting period, a specified number of shares of the Company’s common stock. The following table summarizes RSU and PRSU activity for the years ended December 31, 2024, 2023 and 2022: | | | | | | | | | | | |
| Number of Shares | | Weighted Average
Grant Date
Fair Value per
Share |
| Unvested at January 1, 2022 | 755 | | | $ | 78.13 | |
| Granted—RSUs | 200 | | | $ | 109.66 | |
Granted—PRSUs (1) | 190 | | | $ | 92.65 | |
| Vested | (405) | | | $ | 72.43 | |
| Canceled/forfeited | (75) | | | $ | 82.13 | |
| Unvested at December 31, 2022 | 665 | | | $ | 94.79 | |
| Granted—RSUs | 196 | | | $ | 95.67 | |
Granted—PRSUs (1) | 176 | | | $ | 109.74 | |
| Vested | (349) | | | $ | 89.76 | |
| Canceled/forfeited | (87) | | | $ | 104.14 | |
| Unvested at December 31, 2023 | 601 | | | $ | 101.01 | |
| Granted—RSUs | 443 | | | $ | 61.30 | |
Granted—PRSUs (1) | 259 | | | $ | 70.73 | |
| Vested | (234) | | | $ | 89.64 | |
| Canceled/forfeited | (156) | | | $ | 90.66 | |
| Unvested at December 31, 2024 | 913 | | | $ | 77.81 | |
(1) PRSUs granted included both the PRSUs granted during the year at the target amount and the additional shares of prior period granted PRSUs vested during the year in excess of the target shares.
As of December 31, 2024, there was $32,003 unrecognized compensation cost related to unvested RSUs and PRSUs. The Company expects to recognize such cost over a period of 1.9 years. As of December 31, 2024 and 2023, the aggregate intrinsic value of the RSUs and PRSUs outstanding was $21,834 and $44,979, respectively.
Share-Based Compensation
Total share-based compensation expense for the years ended December 31, 2024, 2023 and 2022 was as follows:
| | | | | | | | | | | | | | | | | |
| | Years Ended December 31, |
| | 2024 | | 2023 | | 2022 |
| Share-based employee compensation, before tax | $ | 23,317 | | | $ | 18,020 | | | $ | 30,066 | |
| Related income tax benefits | (6,062) | | | (4,685) | | | (7,817) | |
| Share-based employee compensation, net of tax | $ | 17,255 | | | $ | 13,335 | | | $ | 22,249 | |
(12) Commitments and Contingencies
From time to time, the Company is involved in various lawsuits, claims, investigations, and proceedings that arise in the ordinary course of business. These matters typically relate to professional liability, tax, compensation, contract, competitor
disputes and employee-related matters and include individual, representative and class action lawsuits, as well as inquiries and investigations by governmental agencies regarding the Company’s employment and compensation practices. Additionally, some of the Company’s clients may also become subject to claims, governmental inquiries and investigations, and legal actions relating to services provided by the Company’s healthcare professionals. Depending upon the particular facts and circumstances, the Company may also be subject to indemnification obligations under its contracts with such clients relating to these matters. The Company accrues for contingencies and records a liability when management believes an adverse outcome from a loss contingency is both probable and the amount, or a range, can be reasonably estimated. Significant judgment is required to determine both probability of loss and the estimated amount. The Company reviews its loss contingencies at least quarterly and adjusts its accruals and/or disclosures to reflect the impact of negotiations, settlements, rulings, advice of legal counsel, or other new information, as deemed necessary. The most significant matters for which the Company has established loss contingencies are class and representative actions related to wage and hour claims under California and Federal law. Specifically, among other claims in these lawsuits, it is alleged that certain expense reimbursements should be considered wages and included in the regular rate of pay for purposes of calculating overtime rates.
On May 26, 2016, former travel nurse Verna Maxwell Clarke filed a complaint against AMN Services, LLC, in California Superior Court in Los Angeles County. The Company removed the case to the United States District Court for the Central District of California (Case No. 2:16-cv-04132-DSF-KS) (the “Clarke Matter”). The complaint asserts that, due to the Company’s per diem adjustment practices, traveling nurses’ per diem benefits should be included in their regular rate of pay for the purposes of calculating their overtime compensation. The Company reached an agreement to settle this matter in its entirety and accordingly recorded an accrual amounting to $62,000. Final approval of the settlement was granted in the second quarter of 2024, and the Company disbursed the settlement amount in the third quarter of 2024.
Item 9. Changes In and Disagreements With Accountants on Accounting and Financial Disclosure
None.
Item 9A. Controls and Procedures
(1) Evaluation of Disclosure Controls and Procedures
We carried out an evaluation, under the supervision and with the participation of our management, including our principal executive officer and principal financial officer, of the effectiveness of our disclosure controls and procedures, as defined in Rules 13a-15(e) and 15d-15(e) of the Exchange Act. Based on that evaluation, our Chief Executive Officer and our Chief Financial Officer and Chief Operating Officer have concluded that our disclosure controls and procedures as of December 31, 2024 were effective to ensure that information required to be disclosed by us in reports that we file or submit under the Exchange Act is recorded, processed, summarized and reported within the time periods specified in the SEC’s rules and forms.
(2) Management’s Annual Report on Internal Control over Financial Reporting
Our management is responsible for establishing and maintaining adequate internal control over financial reporting, as such term is defined in Rule 13a-15(f) of the Exchange Act. Under the supervision and with the participation of our management, including our Chief Executive Officer and our Chief Financial Officer and Chief Operating Officer, we conducted an evaluation of the effectiveness of our internal control over financial reporting based on the framework in Internal Control—Integrated Framework (2013) issued by the Committee of Sponsoring Organizations of the Treadway Commission (COSO). Because of its inherent limitations, internal control over financial reporting may not prevent or detect misstatements. Also, projections of any evaluation of effectiveness to future periods are subject to the risk that controls may become inadequate because of changes in conditions, or that the degree of compliance with the policies or procedures may deteriorate. Based on the framework set forth in Internal Control—Integrated Framework (2013), management concluded that our internal control over financial reporting was effective as of December 31, 2024.
The effectiveness of our internal control over financial reporting as of December 31, 2024 has been audited by KPMG LLP, an independent registered public accounting firm, as stated in its report, which we include herein.
(3) Changes in Internal Control Over Financial Reporting
There were no changes in our internal control over financial reporting that occurred during the quarter ended December 31, 2024 that have materially affected, or are reasonably likely to materially affect, our internal control over financial reporting.
(4) Report of Independent Registered Public Accounting Firm
To the Stockholders and Board of Directors
AMN Healthcare Services, Inc.:
Opinion on Internal Control Over Financial Reporting
We have audited AMN Healthcare Services, Inc. and subsidiaries’ (the Company) internal control over financial reporting as of December 31, 2024, based on criteria established in Internal Control – Integrated Framework (2013) issued by the Committee of Sponsoring Organizations of the Treadway Commission. In our opinion, the Company maintained, in all material respects, effective internal control over financial reporting as of December 31, 2024, based on criteria established in Internal Control – Integrated Framework (2013) issued by the Committee of Sponsoring Organizations of the Treadway Commission.
We also have audited, in accordance with the standards of the Public Company Accounting Oversight Board (United States) (PCAOB), the consolidated balance sheets of the Company as of December 31, 2024 and 2023, the related consolidated statements of comprehensive income (loss), stockholders’ equity, and cash flows for each of the years in the three-year period ended December 31, 2024, and the related notes (collectively, the consolidated financial statements), and our report dated February 20, 2025 expressed an unqualified opinion on those consolidated financial statements.
Basis for Opinion
The Company’s management is responsible for maintaining effective internal control over financial reporting and for its assessment of the effectiveness of internal control over financial reporting, included in the accompanying Management’s Annual Report on Internal Control over Financial Reporting. Our responsibility is to express an opinion on the Company’s internal control over financial reporting based on our audit. We are a public accounting firm registered with the PCAOB and are required to be independent with respect to the Company in accordance with the U.S. federal securities laws and the applicable rules and regulations of the Securities and Exchange Commission and the PCAOB.
We conducted our audit in accordance with the standards of the PCAOB. Those standards require that we plan and perform the audit to obtain reasonable assurance about whether effective internal control over financial reporting was maintained in all material respects. Our audit of internal control over financial reporting included obtaining an understanding of internal control over financial reporting, assessing the risk that a material weakness exists, and testing and evaluating the design and operating effectiveness of internal control based on the assessed risk. Our audit also included performing such other procedures as we considered necessary in the circumstances. We believe that our audit provides a reasonable basis for our opinion.
Definition and Limitations of Internal Control Over Financial Reporting
A company’s internal control over financial reporting is a process designed to provide reasonable assurance regarding the reliability of financial reporting and the preparation of financial statements for external purposes in accordance with generally accepted accounting principles. A company’s internal control over financial reporting includes those policies and procedures that (1) pertain to the maintenance of records that, in reasonable detail, accurately and fairly reflect the transactions and dispositions of the assets of the company; (2) provide reasonable assurance that transactions are recorded as necessary to permit preparation of financial statements in accordance with generally accepted accounting principles, and that receipts and expenditures of the company are being made only in accordance with authorizations of management and directors of the company; and (3) provide reasonable assurance regarding prevention or timely detection of unauthorized acquisition, use, or disposition of the company’s assets that could have a material effect on the financial statements.
Because of its inherent limitations, internal control over financial reporting may not prevent or detect misstatements. Also, projections of any evaluation of effectiveness to future periods are subject to the risk that controls may become inadequate because of changes in conditions, or that the degree of compliance with the policies or procedures may deteriorate.
/s/ KPMG LLP
San Diego, California
February 20, 2025
Item 9B. Other Information
During the three months ended December 31, 2024, none of the Company’s directors or officers adopted, modified or terminated a “Rule 10b5-1 trading arrangement” or a “non-Rule 10b5-1 trading arrangement” as such terms are defined under Item 408 of Regulation S-K.
Item 9C. Disclosure Regarding Foreign Jurisdictions that Prevent Inspections
Not applicable.
PART III
Item 10. Directors, Executive Officers and Corporate Governance
Information required by this item, other than the information below concerning our Code of Ethics for Senior Financial Officers and stockholder recommended nominations, is incorporated by reference to the Proxy Statement to be distributed in connection with our Annual Meeting of Stockholders currently scheduled to be held on May 2, 2025 (the “2025 Annual Meeting Proxy Statement”) under the headings “Corporate Governance—Election of Our Directors—AMN Healthcare Board of Directors,” “Compensation Discussion and Analysis—Equity Ownership—Securities Trading Policy,” “Compensation Discussion and Analysis—Equity Ownership—Policies and Practices Related to the Granting of Equity Awards,” “Executive Compensation—Executive Compensation Disclosure,” “Security Ownership and Other Matters—Delinquent Section 16(a) Reports,” the table set forth in “Corporate Governance—Board and Committee Structure—Committees of the Board” identifying, among other things, members of our Board committees, and “Corporate Governance—Board and Committee Structure—Committees of the Board.”
We have adopted a Code of Ethics for Senior Financial Officers that applies to our principal executive officer, principal financial officer, and principal accounting officer or any person performing similar functions, which we post on our website in the “Governance Documents” link located at ir.amnhealthcare.com. We intend to publish any amendment to, or waiver from, the Code of Ethics for Senior Financial Officers on our website. We will provide any person, without charge, a copy of such Code of Ethics upon written request, which may be mailed to 2999 Olympus Boulevard Suite 500, Dallas, Texas 75019, Attn: Corporate Secretary.
There have been no material changes to the procedures by which stockholders may recommend nominees to our Board since we last disclosed information related to such procedures.
Item 11. Executive Compensation
Information required by this item is incorporated by reference to the 2025 Annual Meeting Proxy Statement under the headings “Executive Compensation—Compensation Discussion and Analysis,” “Compensation Discussion and Analysis—Equity Ownership—Policies and Practices Related to the Granting of Equity Awards,” “Executive Compensation—Executive Compensation Disclosure,” “Corporate Governance—Director Compensation and Ownership Guidelines,” “Corporate Governance—Our Corporate Governance Program—Enterprise Risk Oversight,” “Corporate Governance—Board and Committee Structure—Compensation Committee Interlocks and Insider Participation,” and “Executive Compensation—Compensation Committee Report.”
Item 12. Security Ownership of Certain Beneficial Owners and Management and Related Stockholder Matters
Information required by this item, other than the information below concerning our equity compensation plans, is incorporated by reference to the 2025 Annual Meeting Proxy Statement under the headings “Security Ownership and Other Matters—Security Ownership of Certain Beneficial Owners and Management.”
The following table sets forth information as of December 31, 2024 regarding compensation plans under which our equity securities are authorized for issuance.
| | | | | | | | | | | | | | | | | |
| (a) | | (b) | | (c) |
| Number of Securities to be Issued upon Exercise of Outstanding Options, Warrants and Rights(1) | | Weighted-Average Exercise Price of Outstanding Options, Warrants, and Rights ($)(2) | | Numbers of Securities Remaining Available for Future Issuance Under Equity Compensation Plans (Excluding Securities Reflected in Column(a))(3)
|
| Plan Category | | | | | |
Equity compensation plans approved by security holders (4) | 1,033,352 | | | $— | | 2,590,038 | |
Equity compensation plans not approved by security holders (5) | — | | | $— | | — | |
| | | | | | |
| Total | 1,033,352 | | | $— | | 2,590,038 | |
(1) Includes (i) unvested RSUs and PRSUs and (ii) vested RSUs and PRSUs deferred for future issuance. Excludes purchase rights under the AMN Healthcare Services, Inc. Employee Stock Purchase Plan (the “ESPP”). As of December 31, 2024, there were no stock options or SARs outstanding.
(2) The weighted-average exercise price set forth in this table excludes the effect of RSUs and PRSUs, which have no exercise price.
(3) Includes the following:
(i) Shares available under the AMN Healthcare Equity Plan (as amended or amended and restated from time to time, the “Equity Plan”). Each share tendered or held back upon settlement of an award to cover the tax withholding with respect to an award is made available to be re-awarded. For PRSUs, we consider the maximum number of shares that may be issued under the award to be outstanding upon grant. When the number of PRSUs that have been earned are determined, we true-up the actual number of shares that were awarded and return the unearned shares into shares available for issuance. This figure does not include awards that are forfeited, canceled or terminated after December 31, 2024.
(ii) Shares remaining available for future issuance under the ESPP.
(4) Consists of the Equity Plan and the ESPP. See additional information in “Item 8. Financial Statements and Supplementary Data—Notes to Consolidated Financial Statements—Note (11), Share-Based Compensation.” (5) On occasion, we have made employee award inducement equity grants to key employees outside of the Equity Plan. Although these awards were made outside of the Equity Plan, the key terms and conditions of each grant are the same in all material respects as equity awards made under the Equity Plan. See additional information in “Item 8. Financial Statements and Supplementary Data—Notes to Consolidated Financial Statements—Note (11), Share-Based Compensation.”
Item 13. Certain Relationships and Related Transactions, and Director Independence
Information required by this item is incorporated by reference to the 2025 Annual Meeting Proxy Statement under the headings “Corporate Governance—Policies and Procedures Governing Conflicts of Interest and Related Party Transactions,” “Corporate Governance—Director Nomination Process—Director Independence,” and “Corporate Governance—Board and Committee Structure—Committees of the Board.”
Item 14. Principal Accounting Fees and Services
Information required by this item is incorporated by reference to the 2025 Annual Meeting Proxy Statement under the heading “Audit Committee Matters—Ratification of the Appointment of Our Independent Registered Public Accounting Firm.”
PART IV
Item 15. Exhibits and Financial Statement Schedules
(a) Documents filed as part of the report.
(1) Consolidated Financial Statements
Report of Independent Registered Public Accounting Firm
Consolidated Balance Sheets as of December 31, 2024 and 2023
Consolidated Statements of Comprehensive Income (Loss) for the years ended December 31, 2024, 2023 and 2022
Consolidated Statements of Stockholders’ Equity for the years ended December 31, 2024, 2023 and 2022
Consolidated Statements of Cash Flows for the years ended December 31, 2024, 2023 and 2022
Notes to Consolidated Financial Statements
(2) Financial Statement Schedules
All schedules have been omitted because the required information is presented in the financial statements or notes thereto, the amounts involved are not significant or the schedules are not applicable.
(3) Exhibits
| | | | | | | | |
Exhibit Number | | Description |
| | |
| | |
| | |
| 3.1 | | | |
| | |
| 3.2 | | | |
| | |
| 3.3 | | | |
| | |
| 4.1 | | | |
| | |
| 4.2 | | | |
| | |
| 4.3 | | | |
| | |
| 4.4 | | | |
| | |
| 10.1 | | | Credit Agreement, dated as of February 9, 2018, by and among AMN Healthcare, Inc., as borrower, the guarantors party thereto, the lenders identified on the signature pages thereto, as lenders, and SunTrust Bank, as administrative agent (Incorporated by reference to Exhibit 4.1 to the Registrant’s Quarterly Report on Form 10-Q for the quarter ended March 31, 2018, filed with the SEC on May 4, 2018). |
| | |
| 10.2 | | | First Amendment to Credit Agreement, dated as of June 14, 2019, by and among AMN Healthcare, Inc., as borrower, the guarantors party thereto, the lenders identified on the signature pages thereto, as lenders, and SunTrust Bank, as administrative agent (Incorporated by reference to Exhibit 4.1 to the Registrant’s Quarterly Report on Form 10-Q for the quarter ended June 30, 2019, filed with the SEC on August 7, 2019). |
| | |
| 10.3 | | | Second Amendment to Credit Agreement, dated as of February 14, 2020, by and among AMN Healthcare, Inc., as borrower, the guarantors party thereto, the lenders identified on the signature pages thereto, as lenders, and SunTrust Bank, as administrative agent (Incorporated by reference to Exhibit 4.1 to the Registrant’s Quarterly Report on Form 10-Q for the quarter ended March 31, 2020, filed with the SEC on May 11, 2020). |
| | |
| 10.4 | | | Third Amendment to Credit Agreement, dated as of February 10th, 2023, by and among AMN Healthcare, Inc., as borrower, the guarantors party thereto, the lenders identified on the signature pages thereto, as lenders, and Truist Bank, as administrative agent (Incorporated by reference to Exhibit 4.1 to the Registrant’s Quarterly Report on Form 10-Q for the quarter ended March 31, 2023, filed with the SEC on May 5, 2023). |
| | |
| 10.5 | | | Fourth Amendment to Credit Agreement, dated as of November 5th, 2024, by and among AMN Healthcare, Inc., as borrower, the guarantors party thereto, the lenders identified on the signature pages thereto, as lenders, and Truist Bank, as administrative agent (Incorporated by reference to Exhibit 4.1 to the Registrant’s Quarterly Report on Form 10-Q for the quarter ended September 30, 2024, filed with the SEC on November 7, 2024). |
| | |
| 10.6 | | | |
| | |
| 10.7 | | | |
| | |
| 10.8 | | | |
| | |
| 10.9 | | | |
| | |
| 10.10 | | | |
| | |
| | | | | | | | |
Exhibit Number | | Description |
| 10.11 | | | |
| | |
| 10.12 | | | |
| | |
| 10.13 | | | |
| | |
| 10.14 | | | |
| | |
| 10.15 | | | |
| | |
| 10.16 | | | |
| | |
| 10.17 | | | |
| | |
| 10.18 | | | |
| | |
| 10.19 | | | |
| | |
| 10.20 | | | |
| | |
| 10.21 | | | |
| | |
| 10.22 | | | |
| | |
| 10.23 | | | |
| | |
| 10.24 | | | |
| | |
| 10.25 | | | |
| | |
| 10.26 | | | |
| | |
| | | | | | | | |
Exhibit Number | | Description |
| 10.27 | | | |
| | |
| 10.28 | | | |
| | |
| 10.29 | | | |
| | |
| 10.30 | | | |
| | |
| 10.31 | | | |
| | |
| 10.32 | | | |
| | |
| 10.33 | | | |
| | |
| 10.34 | | | |
| | |
| 10.35 | | | |
| | |
| 10.36 | | | |
| | |
| 10.37 | | | |
| | |
| 10.38 | | | |
| | |
| 10.39 | | | |
| | |
| 10.40 | | | |
| | |
| 10.41 | | | |
| | |
| 10.42 | | | |
| | |
| | | | | | | | |
Exhibit Number | | Description |
| 10.43 | | | |
| | |
| 10.44 | | | |
| | |
| 10.45 | | | |
| | |
| 10.46 | | | |
| | |
| 10.47 | | | |
| | |
| 10.48 | | | |
| | |
| 10.49 | | | |
| | |
| 19.1 | | | |
| | |
| 21.1 | | | |
| | |
| 23.1 | | | |
| | |
| 31.1 | | | |
| | |
| 31.2 | | | |
| | |
| 32.1 | | | |
| | |
| 32.2 | | | |
| | |
| 97.1 | | | |
| | |
| 101.INS | | XBRL Instance Document.* |
| | |
| 101.SCH | | XBRL Taxonomy Extension Schema Document.* |
| | |
| 101.CAL | | XBRL Taxonomy Extension Calculation Linkbase Document.* |
| | |
| 101.DEF | | XBRL Taxonomy Extension Definition Linkbase Document.* |
| | |
| 101.LAB | | XBRL Taxonomy Extension Label Linkbase Document.* |
| | |
| 101.PRE | | XBRL Taxonomy Extension Presentation Linkbase Document.* |
Item 16. Form 10-K Summary
None.
SIGNATURES
Pursuant to the requirements of Section 13 or 15(d) of the Securities Exchange Act of 1934, the registrant has duly caused this report to be signed on its behalf by the undersigned, thereunto duly authorized.
| | | | | | | | |
| AMN HEALTHCARE SERVICES, INC. |
|
/S/ CAROLINE S. GRACE |
Caroline S. Grace
President and Chief Executive Officer |
Date: February 20, 2025
Pursuant to the requirements of the Securities Exchange Act of 1934, this report has been signed below by the following persons on behalf of the registrant and in the capacities indicated and on February 20, 2025.
| | |
/S/ CAROLINE S. GRACE |
Caroline S. Grace
Director, President and Chief Executive Officer
(Principal Executive Officer) |
|
/S/ BRIAN M. SCOTT |
Brian M. Scott Chief Financial Officer and Chief Operating Officer (Principal Financial and Accounting Officer) |
|
/S/ MARK G. FOLETTA |
Mark G. Foletta Director and Chairman of the Board |
|
/S/ JORGE A. CABALLERO |
Jorge A. Caballero
Director |
|
|
|
|
/S/ TERI G. FONTENOT |
Teri G. Fontenot
Director |
|
/S/ R. JEFFREY HARRIS |
R. Jeffrey Harris
Director |
|
/S/ JAMES H. HINTON |
James H. Hinton Director |
|
/S/ DAPHNE E. JONES |
Daphne E. Jones
Director |
|
/S/ SYLVIA TRENT-ADAMS |
Sylvia Trent-Adams
Director |