Exhibit 13.1


| | |
| TABLE OF CONTENTS |
| |
President’s Message | | 1 |
| |
Selected Financial Data | | 4 |
| |
Management’s Discussion and Analysis of Financial Condition and Results of Operations | | 5 |
| |
Management’s Report on Internal Control Over Financial Reporting | | 20 |
| |
Report of Independent Registered Public Accounting Firm | | 21 |
| |
Consolidated Balance Sheets | | 22 |
| |
Consolidated Statements of Income | | 23 |
| |
Consolidated Statements of Changes in Shareholders’ Equity | | 24 |
| |
Consolidated Statements of Cash Flows | | 25 |
| |
Notes to Consolidated Financial Statements | | 26 |
| |
Regional Board Members | | 44 |
| |
| Shareholder Information | | Inside Back Cover |
PRESIDENT’S MESSAGE
DEAR SHAREHOLDER
It’s hard to believe that twenty years have passed since we first opened our doors and embarked on this journey together. From the beginning, we resolved to operate by a simple philosophy: “Treat others like you want to be treated yourself.” I realize that this philosophy may sound a bit trite in the growing complexity of the financial services industry and I know some are tired of hearing me repeat the phrase. However, I have always been a proponent of and continue to believe strongly that community banking is a good and important business. By adhering to our operating philosophy and consistently delivering outstanding customer service, Bank of Hampton Roads has succeeded over the past twenty years in becoming one of the most successful and well-respected banks in the Commonwealth of Virginia. We have done so while returning a great percentage of our earnings and otherwise delivering enhanced value to our shareholders, perhaps our most important measure of success. The growth of our business and strong financial performance in 2007 suggests that our business philosophy is working well. We are determined to continue to build on this foundation.
Last year at this time, I advised that I was looking forward to a banner year in keeping with our twenty year milestone. I am pleased to say that we achieved and realized the expected success. For the twentieth consecutive year, I have the distinct pleasure of reporting record earnings on behalf of our Company. Net income for 2007 was $6,810,613, an increase of 13% or $775,074 over 2006. The fact that we were able to achieve this despite the changing market conditions in the financial services industry that began in earnest during the fourth quarter of the year is a testament to our credit quality and focus on customer-oriented relationship banking.
This customer service-oriented approach to banking as well as our increased legal lending limit which resulted from our growth in 2007 and our 2006 stock offering helped to produce over $102 million in net new loans in 2007. Total loans outstanding at year-end were $477,149,232 compared to $375,044,161 a year ago. As a result of this strong loan growth, total assets ended 2007 at a record high of $563,828,128. Competition is especially acute in our market but we enjoy strong loyalty and commitment from our customers.
Our return on average assets ended the year very strong at 1.31%. This was the fifteenth year in a row that this ratio exceeded 1.20%. For 2007, the return on average assets for our Federal Financial Institutions Examination Council (“FFIEC”) peer group was 1.11% so we remain a leader by this measure.
Loan demand throughout 2007 was consistently high and peaked in the last four months of the year when the Federal Reserve initiated four interest rate cuts totaling 150 basis points. Since year-end, interest rates have decreased another 125 basis points and at the time of this letter, at least one more rate cut is predicted to help bolster the economy. While these actions are designed to benefit consumers and the macro economy, they pose a specific challenge for our industry. Because of these rate cuts and the increased cost of funding loans, net interest margins are facing pressure throughout the industry. At December 31, 2007, our net interest margin was 4.95%, down 25 basis points from year-end 2006. Managing this ratio will be among our greatest priorities in 2008.

| | |
| 2 0 0 7 A N N U A L R E P O R T | | 1 |
Despite the slowing national economy, many commentators report that the Hampton Roads economy is fundamentally stable and projected to hold its own or perhaps even outperform the national economy this year. According to a recently released economic development study, the local port now contributes $12.3 billion to Hampton Roads’ economy and employs directly or indirectly 100,000 people with a $4.1 billion payroll. With the strong presence of the U.S. Navy and other branches of the armed forces, military spending makes up more than 25% of our region’s economy. Consequently, we believe that port activity and local defense spending will help to moderate and stabilize economic conditions in Hampton Roads.
As many of you know, Bank of Hampton Roads enjoys a long established reputation as Hampton Roads’ premier construction lender. Because of our history in this regard, you may be concerned about how the challenging housing market of late has affected this segment of our business, namely construction loans. I am proud to say that we provide construction financing to some of the best and most experienced custom home builders in our market. Many of these builders had the foresight to reduce their inventories of speculative homes and have started fewer contract homes over the last year. As a result, our construction loans as a percent of our total loans outstanding actually decreased from 2006 to 2007.
Demonstrating that Bank of Hampton Roads is the top choice for construction financing by our area’s top builders was the presence of our “Financing By” signs at Tidewater Builders Association’s 2007 Homearama. Bank of Hampton Roads financed seven of the seventeen castle-themed homes on display in Chesapeake’s prestigious Edinburgh neighborhood. Because of the beauty and overall appeal of the Edinburgh development, six of the seven homes we financed were already pre-sold or under contract prior to the event.
As visitors entered the site of this year’s Homearama, they all passed by the site of Bank of Hampton Roads’ new Edinburgh Office. It is located in the Edinburgh Commons North Shopping Center, which is anchored by Target and fronts the highly traveled Chesapeake Expressway. Our friendly staff is currently serving customers out of a temporary facility located on our property there while the office is under construction. We are very optimistic about the potential of this office with Edinburgh being the largest retail center between the Greenbrier area of Chesapeake and the Outer Banks of North Carolina. Edinburgh features a variety of national and specialty retailers, restaurants and services as well as a beautiful planned community.
With the addition of the Edinburgh location, Bank of Hampton Roads now has eighteen convenient branch offices, including nine in Chesapeake, four in Virginia Beach, four in Norfolk and one Suffolk. The Bank also has ATMs located in two of Norfolk’s most prominent entertainment venues: Scope and Chrysler Hall. Thanks to the efforts of all of our employees, but most especially those in our branches, our deposits increased 19% in 2007 to end the year at a record $431 million. We remain diligent in exploring opportunities for additional branches throughout Hampton Roads and, as we have evidenced historically, we will do that which is necessary to provide convenient personal service to our customers.
The safety and soundness of our Bank is something we pay attention to every day but the issue always draws more scrutiny in challenging times. Giving our depositors even more peace of mind beyond FDIC insurance are the numerous acknowledgements Bank of Hampton Roads has received throughout the years for its commitment to safety and soundness. The Bank has been awarded a 5-Star rating by BauerFinancial for fifty-three consecutive quarters, or just over thirteen years. In addition, the Bank was recently awarded a financial safety rating of “A” by TheStreet.com Ratings. Both ratings signify excellent financial stability for our customers, vendors and employees.
Hampton Roads Bankshares also received its own share of accolades in 2007. In September, we were notified by NASDAQ that our shares qualified for listing on the elite NASDAQ Global Select Market. Only about 1,200 companies are listed on the Global Select Market, having met NASDAQ’s most stringent financial, liquidity and corporate governance requirements. In 2007, our stock was also selected by the Russell Investment Group for inclusion in their Microcap Index. Our affiliation with NASDAQ has resulted in many new ways for us to introduce Hampton Roads Bankshares and our achievements to new investors.
Our Company has enjoyed much prosperity during its two decades of operations and it has a rich history of sharing its success with its shareholders and the community in general.
In consideration of our strong financial performance in 2007 and the tax-advantaged status of dividend payments, our Board of Directors increased the cash dividend 10% to an annualized rate of $0.44 per share. Since 1992, our Company has paid dividends to shareholders totaling $26,912,035 or 53% of our total net income for that period.
In 2007, our 11th Annual Charitable Golf Classic raised a record-breaking $170,000 for local charities, non-profit organizations and worthwhile causes. Since the tournament’s inception, the Bank has raised nearly $900,000 for the community. Every year, we match the proceeds from the golf tournament dollar for dollar and use that money to help as many different charities as we can. Recipients include local colleges and universities, CHKD, St. Jude Children’s Research Hospital, CHIP of Virginia, Cerebral Palsy of Virginia, Norfolk Botanical Garden and the Virginia Aquarium.
Bank of Hampton Roads also developed a very special partnership with the Foodbank of Southeastern Virginia in 2007. If you’ve visited our Deep Creek, Great Bridge or Great Neck Offices lately, you may have noticed some rather unusual looking employees – Cash Cows that stand about six feet tall. Our Cash Cows are coin counters similar to the machines you see in grocery stores where you can take in your loose coins, dump them in, and get bills in exchange for your coin. Our Cash Cows charge $0.05 for every $1.00 of change they count. All of the proceeds from the machines are donated to the Foodbank’s Kids Café, which can feed four children with every $1.00 that we contribute.
| | |
| 2 | | H A M P T O N R O A D S B A N K S H A R E S , I N C . |
We were so humbled and proud of all that the Foodbank does for our community that we couldn’t help but want to do more for the organization. We recently started selling special edition Bank of Hampton Roads piggy banks to benefit the Foodbank’s Kids Café and couldn’t be more pleased with the results of this fundraiser. In less than a month, our kind-hearted customers purchased nearly $3,000 worth of the piggy banks at a cost of just $5.00 each. Local television station WTKR gave the Bank airtime during a recent evening newscast to present the first of what we hope is many more donations. Our donation of $3,000 enabled the Foodbank to provide 12,000 meals for people in our area who may have otherwise gone hungry.
2008 is likely going to be one of the busiest, most challenging and, by far, one of the most exciting years in the history of our company. Pending shareholder and regulatory approval, Shore Financial Corporation, the parent company of Shore Bank, will merge into Hampton Roads Bankshares. Shore Bank has an excellent reputation, a similar performance-driven culture, and operating strengths that are highly complimentary to ours. Shore Bank serves the Eastern Shore of Maryland and Virginia through eight full-service banking facilities and twenty-two ATMs. Through its affiliates, Shore also offers title insurance and investment products. As of December 31, 2007, Shore Financial Corporation had total assets of $267 million, total deposits of $197 million, total loans of $222 million, and total stockholders’ equity of $28 million. We believe that both of our organizations share a vision to grow and be the market leader without compromising profitability. By joining together, our two banks can execute a strategy through the Delmarva Peninsula which will result in a vibrant and visible bank franchise that serves both the divergent needs of our customers and provides rewarding opportunities for our employees. Most importantly and what always motivates our decision making, we believe that you, our shareholders, will enjoy the enhanced value and related benefits of our mutual vision.
I would be remiss if I did not take a moment to thank our people for all of the hard work and effort they put forth to ensure that our twentieth anniversary year was our best yet. Our staff is professional, knowledgeable and friendly and I could not ask for a better group of people working on behalf of our organization. As a testament to how we value our people, of the original ten Bank employees, myself included, four remain with the Bank and three have retired from the Bank. I would be surprised if such loyalty is not unique in community banking today. The Bank also enjoys the benefit of stable and talented executive management and I would expect that Shore Bank’s senior management will do nothing less than add depth and perspective to our Company as a whole. I feel the same way about our Board and thank them for their leadership and their confidence in our future potential. Again, Shore Bank’s Board members will only add to the value of our Company and I look forward to working with them in the future.
I will go on record stating that 2008 will be one of the most challenging years that we have ever faced. The 75 basis point cut in the federal funds rate on January 22, 2008 was the most the Federal Reserve had cut rates in a single action since 1991. Eight days later, the rate dropped another 50 basis points and is predicted to continue to decline, at least for the short-term. These actions have already affected our margins and further rate cuts will only add to our challenges in 2008. Rest assured that our management team will work diligently to protect our earnings.
One of the best measures of our ability to perform under any economic circumstances is to look at a chronicle of our past year-end net interest margins. For the last ten years, our net interest margin has consistently been at least 50 basis points higher than that reported by our FFIEC peer group.
N E T I N T E R E S T M A R G I N
| | | | |
| | | Hampton Roads
Bankshares | | FFIEC Peer
Group Average |
| | |
1998 | | 5.75% | | 4.46% |
1999 | | 5.49% | | 4.48% |
2000 | | 5.75% | | 4.53% |
2001 | | 5.24% | | 4.29% |
2002 | | 4.83% | | 4.31% |
2003 | | 4.65% | | 4.12% |
2004 | | 4.71% | | 4.11% |
2005 | | 5.26% | | 4.19% |
2006 | | 5.20% | | 4.21% |
2007 | | 4.95% | | 4.02% |
You can help us overcome the challenges we will face this year by always giving us the opportunity to meet your banking needs as well as referring your friends and business associates to us. The prime rate is at its lowest level in two years making it an attractive time to borrow. Bank of Hampton Roads is also implementing remote deposit capture, a new state-of-the-art product designed for commercial customers who would like to virtually eliminate their trips to the bank. Remote deposit capture uses a desktop scanner that connects to your PC and the Internet. With it, businesses can scan their customers’ checks and transmit their deposits electronically to us, anytime day or night.
Again, I express my thanks to our Board of Directors, Regional Board Members, employees, shareholders and customers for the contributions each of you has made to our extraordinary success over the last twenty years. We look forward to serving you with innovative products, delivered with exceptional service for many more years to come.
Very truly yours,

Jack W. Gibson
President & Chief Executive Officer
| | |
| 2 0 0 7 A N N U A L R E P O R T | | 3 |
SELECTED FINANCIAL DATA
Years Ended December 31,
The financial information presented below for the years ended December 31, 2003, 2004, 2005, 2006 and 2007 has been derived from our audited consolidated financial statements. Our consolidated financial statements as of and for the years ended December 31, 2003, 2004, 2005 and 2006 have been audited by KPMG LLP, our former independent auditors. Our consolidated financial statements as of and for the year ended December 31, 2007 have been audited by Yount, Hyde & Barbour, P.C., our current independent auditors. This information is only a summary and should be read together with our consolidated historical financial statements and management’s discussion and analysis appearing elsewhere in this annual report.
| | | | | | | | | | | | | | | | | | | | |
| (Dollars in thousands except per share data) | | 2007 | | | 2006 | | | 2005 | | | 2004 | | | 2003 | |
Operating Results: | | | | | | | | | | | | | | | | | | | | |
Interest income | | $ | 38,203 | | | $ | 30,021 | | | $ | 24,558 | | | $ | 18,068 | | | $ | 17,469 | |
Interest expense | | | 14,016 | | | | 9,123 | | | | 5,869 | | | | 3,911 | | | | 4,417 | |
Net interest income | | | 24,187 | | | | 20,898 | | | | 18,689 | | | | 14,157 | | | | 13,052 | |
Provision for loan losses | | | 1,232 | | | | 180 | | | | 486 | | | | 926 | | | | 370 | |
Noninterest income | | | 3,440 | | | | 3,398 | | | | 3,214 | | | | 3,791 | | | | 3,410 | |
Noninterest expense | | | 15,994 | | | | 14,946 | | | | 13,040 | | | | 10,794 | | | | 9,983 | |
Income taxes | | | 3,590 | | | | 3,134 | | | | 2,870 | | | | 2,140 | | | | 2,086 | |
Income before cumulative effect of change in accounting principle | | | 6,811 | | | | 6,036 | | | | 5,507 | | | | 4,088 | | | | 4,023 | |
Cumulative effect of change in accounting principle, net | | | — | | | | — | | | | — | | | | 46 | | | | — | |
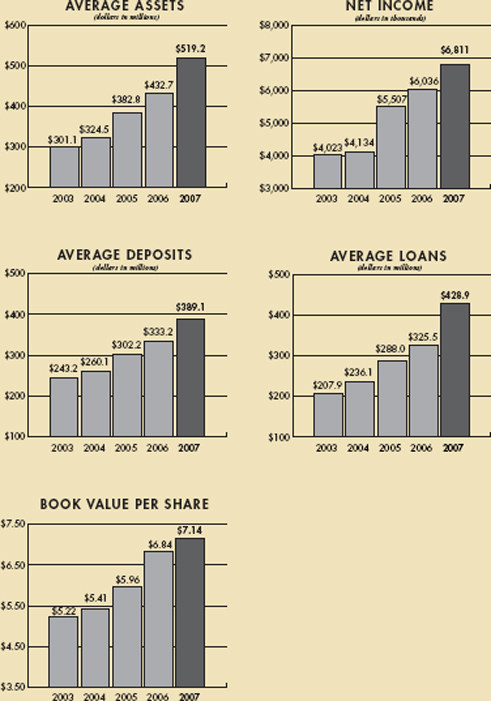
Net income | | $ | 6,811 | | | $ | 6,036 | | | $ | 5,507 | | | $ | 4,134 | | | $ | 4,023 | |
| | | | | |
Per Share Data: | | | | | | | | | | | | | | | | | | | | |
Basic earnings after change in accounting principle | | $ | 0.67 | | | $ | 0.66 | | | $ | 0.68 | | | $ | 0.52 | | | $ | 0.52 | |
Diluted earnings after change in accounting principle | | | 0.65 | | | | 0.65 | | | | 0.66 | | | | 0.50 | | | | 0.50 | |
Book value | | | 7.14 | | | | 6.84 | | | | 5.96 | | | | 5.41 | | | | 5.22 | |
Basic weighted average shares outstanding | | | 10,228,638 | | | | 9,092,980 | | | | 8,137,244 | | | | 7,973,844 | | | | 7,805,231 | |
Diluted weighted average shares outstanding | | | 10,431,554 | | | | 9,275,788 | | | | 8,407,821 | | | | 8,236,169 | | | | 7,994,251 | |
Shares outstanding at year-end | | | 10,314,899 | | | | 10,251,336 | | | | 8,242,822 | | | | 8,059,528 | | | | 7,908,708 | |
| | | | | |
Year-End Balances: | | | | | | | | | | | | | | | | | | | | |
Assets | | $ | 563,828 | | | $ | 476,299 | | | $ | 409,517 | | | $ | 344,969 | | | $ | 316,473 | |
Overnight funds sold | | | 183 | | | | 9,524 | | | | 18,294 | | | | 7,294 | | | | 10,038 | |
Loans | | | 477,149 | | | | 375,044 | | | | 285,330 | | | | 275,190 | | | | 210,775 | |
Investment securities | | | 47,081 | | | | 59,545 | | | | 73,826 | | | | 38,995 | | | | 72,046 | |
Deposits | | | 431,457 | | | | 363,261 | | | | 327,447 | | | | 275,115 | | | | 257,433 | |
Shareholders’ equity | | | 73,660 | | | | 70,163 | | | | 49,131 | | | | 43,626 | | | | 41,314 | |
| | | | | |
Average Balances: | | | | | | | | | | | | | | | | | | | | |
Assets | | $ | 519,175 | | | $ | 432,716 | | | $ | 382,821 | | | $ | 324,485 | | | $ | 301,073 | |
Overnight funds sold | | | 691 | | | | 4,558 | | | | 7,132 | | | | 6,509 | | | | 10,179 | |
Loans | | | 428,874 | | | | 325,506 | | | | 287,979 | | | | 236,082 | | | | 207,853 | |
Investment securities | | | 53,946 | | | | 67,130 | | | | 52,706 | | | | 57,455 | | | | 61,705 | |
Deposits | | | 389,055 | | | | 333,242 | | | | 302,167 | | | | 260,110 | | | | 243,177 | |
Shareholders’ equity | | | 71,545 | | | | 57,640 | | | | 44,855 | | | | 41,960 | | | | 39,311 | |
Ratios: | | | | | | | | | | | | | | | | | | | | |
Return on average assets | | | 1.31 | % | | | 1.39 | % | | | 1.44 | % | | | 1.27 | % | | | 1.34 | % |
Return on average equity | | | 9.52 | | | | 10.47 | | | | 12.28 | | | | 9.85 | | | | 10.23 | |
Average equity to average assets | | | 13.78 | | | | 13.32 | | | | 11.72 | | | | 12.93 | | | | 13.06 | |
Allowance for loan losses to year-end loans | | | 1.06 | | | | 1.04 | | | | 1.26 | | | | 1.12 | | | | 1.40 | |
Net interest margin | | | 4.95 | | | | 5.20 | | | | 5.26 | | | | 4.71 | | | | 4.65 | |
Dividend payout ratio | | | 64.18 | | | | 75.76 | | | | 52.94 | | | | 63.46 | | | | 80.77 | |
Efficiency ratio | | | 57.89 | | | | 61.52 | | | | 59.54 | | | | 60.14 | | | | 60.64 | |
| | |
| 4 | | H A M P T O N R O A D S B A N K S H A R E S , I N C . |
MANAGEMENT’S DISCUSSION AND ANALYSIS
of Financial Condition and Results of Operations
Introduction
Hampton Roads Bankshares, Inc. (the “Company”) is headquartered in Norfolk, Virginia and conducts its primary operations through its wholly owned subsidiary, Bank of Hampton Roads (the “Bank”). Unless the context otherwise requires, the term the “Company” is also used to refer to Hampton Roads Bankshares, Inc. and its consolidated subsidiaries on a combined basis. The Company is a financial services holding company with $564 million in total assets providing a variety of community banking and investment services in the Southeastern portion of Virginia known as South Hampton Roads. In addition to the Bank, the Company owns Hampton Roads Investments, Inc. (“HRI”). This non-bank subsidiary provides clients with a variety of securities and insurance products.
The following commentary provides information about the major components of our results of operations and financial condition, liquidity, and capital resources. This discussion and analysis should be read in conjunction with the Consolidated Financial Statements and Notes to Consolidated Financial Statements presented elsewhere in this Annual Report. It should also be read in conjunction with the “Caution About Forward-Looking Statements” section at the end of this discussion.
Financial Overview
The Company’s primary source of revenue is net interest income earned by the Bank. Net interest income represents interest and fees earned from lending and investment activities less the interest paid to fund these activities. In addition to net interest income, noninterest income is another important source of revenue for the Company. Noninterest income is derived primarily from service charges on deposits and fees earned from bank services. Other factors that impact net income are the provision for loan losses and noninterest expense.
Net income for 2007 increased 12.84% to $6.81 million from $6.04 million for 2006. Diluted earnings per share remained constant at $0.65 for both 2007 and 2006 due to an increased average number of shares outstanding during 2007. In the third quarter of 2006, the Company raised approximately $19 million in capital through a rights offering to existing shareholders and a public offering, resulting in the issuance of 1,849,200 new shares of common stock. Book value per share increased to $7.14 for 2007 compared to $6.84 for 2006. Net income for 2005 was $5.51 million with diluted earnings per share of $0.66 and book value per share of $5.96.
The increase in equity from the stock offerings also explains the decrease in return on average equity experienced during 2007 to 9.52% from 10.47% in 2006 and 12.28% in 2005. Return on average assets was 1.31% for 2007, 1.39% for 2006, and 1.44% for 2005. This profitability indicator was influenced by a decreasing net interest margin.
During 2007, the Company’s net interest margin declined to 4.95% from 5.20% in 2006 and 5.26% in 2005. The Federal Reserve Bank kept short term interest rates steady during the first eight months of 2007, but then began to decrease the targeted federal funds rate, first by 50 basis points in September 2007 and again by 25 basis points in each of October and December of 2007. Due to the asset sensitive nature of the Bank’s balance sheet, with assets such as variable rate loans repricing more quickly than liabilities such as certificates of deposit, a decreasing interest rate environment tends to cause a decline in net interest margin. The Company manages interest rate risk associated with assets and liabilities repricing on different bases in several ways including using floors and caps on variable interest rate loans and keeping the terms on both assets and liabilities short with most maturing or repricing within five years.
Despite the declining net interest margin, net interest income rose during 2007 to $24.19 million, a 15.74% increase over 2006. This increase in net interest income was the primary factor involved in the increase in net income for 2007 and resulted from the strong growth in loans experienced during the year.
In 2007, the Company continued to benefit from high growth rates in assets, loans, and deposits. Total assets increased to $563.83 million at year-end 2007, up 18.38% from $476.30 million at year-end 2006. The majority of this growth occurred in the loan portfolio with total loans increasing to $477.15 million at year-end 2007, up 27.22% from $375.04 million at year-end 2006. The funding for this loan growth came in the form of increased borrowings from the Federal Home Loan Bank, increased deposits, and proceeds from investment maturities. Deposits accounted for the largest portion of the funding with total deposits rising to $431.46 million at year-end 2007, up 18.77% from $363.26 million at year-end 2006.
In order to maintain its liquidity position during 2007, the Company expanded its sources of funding to include brokered and national market certificates of deposit. Competition for local market deposits has caused the pricing for local deposits to rise making brokered and national market certificates of deposit a cost efficient source of funds. The Company monitors its portfolio of brokered and national market certificates closely and has set limits on the types and amounts of funding that will be obtained in this manner.
The higher net interest income was offset partially by an increase in the provision for loan losses. The provision increased to $1.23 million in 2007 compared to $180 thousand in 2006 and $486 thousand in 2005. The increase in the loan loss provision
| | |
| 2 0 0 7 A N N U A L R E P O R T | | 5 |
reflected the growth in the loan portfolio during 2007 as well as the nature of the economic environment. As seen by the Company’s asset quality ratios, the loan portfolio quality remains high. Nonperforming assets to total assets were 0.47% at year-end 2007 compared to 0.34% at year-end 2006. Allowance for loan losses to nonperforming assets was 190.67% at year-end 2007 compared to 239.94% at year-end 2006.
Results of Operations
Net Interest Income
Net interest income is the difference between interest income and interest expense and represents the gross profit margin. The following influences may significantly impact net interest income and net interest margin:
| | • | | Variations in the volume and mix of interest earning assets and interest bearing liabilities; |
| | • | | Changes in the yields earned and rates paid; and |
| | • | | The level of noninterest bearing liabilities available to support earning assets. |
Table 1presents the average interest earning assets and average interest bearing liabilities, the average yields earned on such assets and rates paid on such liabilities, and the net interest margin for the indicated periods. The variance in interest income and expense caused by differences in average balances and rates is shown inTable 2.
2007 Compared to 2006
Net interest income increased 15.74% in 2007 to $24.19 million, or $3.29 million over the 2006 total. The increase in net interest income during 2007 was attained by strong increases in the average balance of interest earning assets, most notably in average loans. Interest rates also were a factor in net interest income and the net interest margin in 2007. The average yield on interest earning assets increased from 7.47% in 2006 to 7.82% in 2007 and the average rate paid on interest bearing liabilities increased from 3.37% in 2006 to 4.11% in 2007. These changes in average yield and rate produced a net interest spread which compressed from 4.10% in 2006 to 3.71% in 2007.
Net interest margin, which is calculated by expressing net interest income as a percentage of average interest earning assets, is an indicator of effectiveness in generating income from earning assets. The Company’s net interest margin was 4.95% in 2007, as compared to 5.20% in 2006 and 5.26% in 2005. The net interest margin decreased in 2007 as a result of a declining rate environment. Based on economic forecasts and initial interest rate movements in 2008, the declining trend in interest rates is likely to continue, in which case further compression of the net interest margin can be expected.
Interest income from loans, including loan fees, rose to $35.60 million for the year 2007, an increase of $8.78 million over 2006. During 2007, average loans increased $103.37 million, or 31.76%, while the average interest yield increased 6 basis points. New loan production was strong throughout 2007. At December 31, 2007, approximately 54.43% of the loan portfolio consisted of variable rate loans, compared with 49.73% and 49.88% at December 31, 2006 and 2005, respectively.
Interest income from investment securities decreased $405 thousand from 2006 to 2007. This decrease is related to a decrease in average investment securities of $13.18 million partially offset by an increase in the average interest yield of 24 basis points. As investments matured during 2007, the proceeds were used to fund loan growth.
A shift in the mix of funding sources was a factor in the Company’s net interest margin in 2007. Average noninterest bearing demand deposits made up only 25.53% of the average deposit portfolio in 2007 compared to 29.97% in 2006 and 32.98% in 2005. Time deposits, a higher cost funding source, made up 43.41% of the average deposit portfolio in 2007 compared to 35.09% in 2006 and 32.37% in 2005. Savings deposits, including the premium savings account product, made up 20.56% of the average deposit portfolio in 2007 compared to 21.10% in 2006 and 17.35% in 2005. The Company also increased rates on deposit accounts in order to attract deposits to fund loan growth. Interest expense on deposits increased $4.03 million from 2006 to 2007 as average interest bearing deposits increased $56.38 million or 24.06% and the average rate paid on interest bearing deposits increased 75 basis points. Interest on other borrowings increased $865 thousand from 2006 to 2007 resulting from an increase in average other borrowings of $14.37 million and a 56 basis point increase in the average rate paid on other borrowings.
2006 Compared to 2005
Net interest income in 2006 increased $2.21 million, or 11.82%, over the 2005 amount. The increase in net interest income during 2006 was attributable to growth in average interest earning assets and higher rates on those assets netted against higher rates paid on interest bearing liabilities. The average yield on interest earning assets increased from 6.92% in 2005 to 7.47% in 2006 and the average rate paid on interest bearing liabilities increased from 2.51% in 2005 to 3.37% in 2006. These changes in average yield and rate produced a net interest spread which compressed from 4.41% in 2005 to 4.10% in 2006.
Interest income from loans, including loan fees, increased $4.49 million to $26.83 million in 2006 over the 2005 amount due to an increase of 48 basis points in the average interest yield and an increase of $37.53 million in the average loan balance. Interest income on investment securities increased $1.00 million from 2005 to 2006. This increase was caused by an increase in the average yield on investment securities of 79 basis points, along with an increase in average investment securities of $14.42 million. Interest expense increased $3.25 million from 2005 to 2006 due to a $36.88 million increase in average interest bearing liabilities and an 86 basis point increase in the average rate paid on interest bearing liabilities.
| | |
| 6 | | H A M P T O N R O A D S B A N K S H A R E S , I N C . |
Table 1: Average Balance Sheet and Net Interest Margin Analysis
| | | | | | | | | | | | | | | | | | | | | | | | | | | | | | |
| (In thousands) | | Average
Balance | | | 2007
Interest
Income/
Expense | | Average
Yield/
Rate | | | Average
Balance | | | 2006
Interest
Income/
Expense | | Average
Yield/
Rate | | | Average
Balance | | | 2005
Interest
Income/
Expense | | Average
Yield/
Rate | |
Assets: | | | | | | | | | | | | | | | | | | | | | | | | | | | | | | |
Interest earning assets | | | | | | | | | | | | | | | | | | | | | | | | | | | | | | |
Loans | | $ | 428,874 | | | $ | 35,604 | | 8.30 | % | | $ | 325,506 | | | $ | 26,827 | | 8.24 | % | | $ | 287,979 | | | $ | 22,342 | | 7.76 | % |
Investment securities | | | 53,946 | | | | 2,316 | | 4.29 | | | | 67,130 | | | | 2,721 | | 4.05 | | | | 52,706 | | | | 1,720 | | 3.26 | |
Interest-bearing deposits in other banks | | | 4,870 | | | | 248 | | 5.09 | | | | 4,761 | | | | 244 | | 5.12 | | | | 7,184 | | | | 246 | | 3.42 | |
Overnight funds sold | | | 691 | | | | 35 | | 5.07 | | | | 4,558 | | | | 229 | | 5.02 | | | | 7,132 | | | | 250 | | 3.51 | |
Total interest earning assets | | | 488,381 | | | | 38,203 | | 7.82 | | | | 401,955 | | | | 30,021 | | 7.47 | | | | 355,001 | | | | 24,558 | | 6.92 | |
Noninterest earning assets | | | | | | | | | | | | | | | | | | | | | | | | | | | | | | |
Cash and due from banks | | | 15,907 | | | | | | | | | | 16,194 | | | | | | | | | | 15,801 | | | | | | | |
Premises and equipment | | | 11,961 | | | | | | | | | | 11,808 | | | | | | | | | | 10,432 | | | | | | | |
Other assets | | | 7,354 | | | | | | | | | | 6,527 | | | | | | | | | | 4,986 | | | | | | | |
Less: Allowance for loan losses | | | (4,428 | ) | | | | | | | | | (3,768 | ) | | | | | | | | | (3,399 | ) | | | | | | |
Total assets | | $ | 519,175 | | | | | | | | | $ | 432,716 | | | | | | | | | $ | 382,821 | | | | | | | |
|
Liabilities and Shareholders’ Equity: | |
Interest bearing liabilities | | | | | | | | | | | | | | | | | | | | | | | | | | | | | | |
Interest bearing demand | | $ | 40,863 | | | $ | 678 | | 1.66 | % | | $ | 46,132 | | | $ | 522 | | 1.13 | % | | $ | 52,268 | | | $ | 319 | | 0.61 | % |
Savings deposits | | | 79,994 | | | | 2,866 | | 3.58 | | | | 70,315 | | | | 2,180 | | 3.10 | | | | 52,415 | | | | 1,156 | | 2.21 | |
Time deposits | | | 168,886 | | | | 8,113 | | 4.80 | | | | 116,918 | | | | 4,927 | | 4.21 | | | | 97,823 | | | | 3,391 | | 3.47 | |
Other borrowings | | | 51,336 | | | | 2,359 | | 4.60 | | | | 36,968 | | | | 1,494 | | 4.04 | | | | 30,944 | | | | 1,003 | | 3.24 | |
Total interest bearing liabilities | | | 341,079 | | | | 14,016 | | 4.11 | | | | 270,333 | | | | 9,123 | | 3.37 | | | | 233,450 | | | | 5,869 | | 2.51 | |
Noninterest bearing liabilities | | | | | | | | | | | | | | | | | | | | | | | | | | | | | | |
Demand deposits | | | 99,312 | | | | | | | | | | 99,877 | | | | | | | | | | 99,661 | | | | | | | |
Other liabilities | | | 7,239 | | | | | | | | | | 4,866 | | | | | | | | | | 4,855 | | | | | | | |
Shareholders’ equity | | | 71,545 | | | | | | | | | | 57,640 | | | | | | | | | | 44,855 | | | | | | | |
Total liabilities and shareholders’ equity | | $ | 519,175 | | | | | | | | | $ | 432,716 | | | | | | | | | $ | 382,821 | | | | | | | |
Net interest income | | | | | | $ | 24,187 | | | | | | | | | $ | 20,898 | | | | | | | | | $ | 18,689 | | | |
Net interest spread | | | | | | | | | 3.71 | % | | | | | | | | | 4.10 | % | | | | | | | | | 4.41 | % |
Net interest margin | | | | | | | | | 4.95 | % | | | | | | | | | 5.20 | % | | | | | | | | | 5.26 | % |
Note: Interest income from loans included fees of $1,414,086 in 2007, $1,359,262 in 2006, and $2,408,180 in 2005. Nonaccrual loans are not material and are included in loans above.
Table 2: Effect of Changes in Rate and Volume on Net Interest Income
| | | | | | | | | | | | | | | | | | | | | | | | | | | | | | | | | |
| | | 2007 Compared to 2006 | | | 2006 Compared to 2005 | | | 2005 Compared to 2004 | |
| | | Interest | | | | | | | | | Interest | | | | | | | | Interest | | | | | |
| | | Income/ | | | Variance | | | Income/ | | | Variance | | | Income/ | | Variance | |
| | | Expense | | | Attributable to | | | Expense | | | Attributable to | | | Expense | | Attributable to | |
| (In thousands) | | Variance | | | Rate | | | Volume | | | Variance | | | Rate | | Volume | | | Variance | | Rate | | Volume | |
Interest Earning Assets: | | | | | | | | | | | | | | | | | | | | | | | | | | | | | | | | | |
Loans | | $ | 8,777 | | | $ | 197 | | | $ | 8,580 | | | $ | 4,485 | | | $ | 1,451 | | $ | 3,034 | | | $ | 5,967 | | $ | 2,090 | | $ | 3,877 | |
Investment securities | | | (405 | ) | | | 175 | | | | (580 | ) | | | 1,001 | | | | 470 | | | 531 | | | | 104 | | | 215 | | | (111 | ) |
Interest-bearing deposits in other banks | | | 4 | | | | (2 | ) | | | 6 | | | | (2 | ) | | | 4 | | | (6 | ) | | | 241 | | | 36 | | | 205 | |
Overnight funds sold | | | (194 | ) | | | 4 | | | | (198 | ) | | | (21 | ) | | | 102 | | | (123 | ) | | | 178 | | | 171 | | | 7 | |
Total interest earning assets | | $ | 8,182 | | | $ | 374 | | | $ | 7,808 | | | $ | 5,463 | | | $ | 2,027 | | $ | 3,436 | | | $ | 6,490 | | $ | 2,512 | | $ | 3,978 | |
|
Interest Bearing Liabilities: | |
Deposits | | $ | 4,028 | | | $ | 1,967 | | | $ | 2,061 | | | $ | 2,763 | | | $ | 1,708 | | $ | 1,055 | | | $ | 1,516 | | $ | 957 | | $ | 559 | |
Other borrowings | | | 865 | | | | 226 | | | | 639 | | | | 491 | | | | 275 | | | 216 | | | | 441 | | | 49 | | | 392 | |
Total interest bearing liabilities | | | 4,893 | | | | 2,193 | | | | 2,700 | | | | 3,254 | | | | 1,983 | | | 1,271 | | | | 1,957 | | | 1,006 | | | 951 | |
Net interest income | | $ | 3,289 | | | $ | (1,819 | ) | | $ | 5,108 | | | $ | 2,209 | | | $ | 44 | | $ | 2,165 | | | $ | 4,533 | | $ | 1,506 | | $ | 3,027 | |
Note: The change in interest due to both rate and volume has been allocated to variance attributable to rate and variance attributable to volume in proportion to the relationship for the absolute amounts of the change in each.
| | |
| 2 0 0 7 A N N U A L R E P O R T | | 7 |
Noninterest Income
2007 Compared to 2006
As shown inTable 3, the Company reported an increase in total noninterest income of $42 thousand, or 1.24%, in 2007 over 2006. Noninterest income comprised 8.26% of total revenue in 2007, 10.17% in 2006 and 11.57% in 2005.
Service charges on deposit accounts, the Company’s primary source of noninterest income, increased 6.51% from 2006 to 2007. This increase was due to an increase in non sufficient funds (“NSF”) fees and service charges on commercial checking accounts.
Other service charges and fees decreased $80 thousand or 5.25% from 2006 to 2007 due primarily to equity method losses on the Company’s investment in a financial services equity fund and decreases in the commission income earned by the Company’s investment services subsidiary, HRI.
2006 Compared to 2005
Noninterest income increased $184 thousand or 5.72% from 2005 to 2006. From 2005 to 2006, service charges on deposit accounts decreased 3.65% due to a decline in NSF fees and stop payment fees. Other bank service charges and fees increased $255 thousand, or 20.09%, from 2005 to 2006 due primarily to an increase in commission income earned by the Company’s investment services subsidiary, HRI.
Table 3: Noninterest Income
| | | | | | | | | | | | | | | | | | | | | | | |
| December 31, | | | | | | | | 2007 Compared
to 2006 | | | 2006 Compared
to 2005 | |
| (In thousands) | | 2007 | | 2006 | | 2005 | | Amount | | | % | | | Amount | | | % | |
Service charges on deposit accounts | | $ | 1,996 | | $ | 1,874 | | $ | 1,945 | | $ | 122 | | | 6.51 | % | | $ | (71 | ) | | (3.65 | )% |
Other service charges and fees | | | 1,444 | | | 1,524 | | | 1,269 | | | (80 | ) | | (5.25 | ) | | | 255 | | | 20.09 | |
Total noninterest income | | $ | 3,440 | | $ | 3,398 | | $ | 3,214 | | $ | 42 | | | 1.24 | % | | $ | 184 | | | 5.72 | % |
Noninterest Expense
2007 Compared to 2006
Noninterest expense represents the overhead expenses of the Company. One of the core operating principles of management continues to be the careful monitoring and control of these expenses. The efficiency ratio, calculated by dividing noninterest expense by the sum of net interest income and noninterest income, improved to 57.89% in 2007 compared to 61.52% in 2006 and 59.54% in 2005. As shown inTable 4, total noninterest expense increased $1.05 million, or 7.01%, for the year ended December 31, 2007 to $15.99 million, compared to $14.95 million in 2006.
Table 4: Noninterest Expense
| | | | | | | | | | | | | | | | | | | | | | | |
December 31, | | | | | | 2007 Compared
to 2006 | | | 2006 Compared
to 2005 | |
| (In thousands) | | 2007 | | 2006 | | 2005 | | Amount | | | % | | | Amount | | | % | |
Salaries and employee benefits | | $ | 9,954 | | $ | 9,106 | | $ | 7,962 | | $ | 848 | | | 9.31 | % | | $ | 1,144 | | | 14.37 | % |
Occupancy | | | 1,668 | | | 1,677 | | | 1,109 | | | (9 | ) | | (0.54 | ) | | | 568 | | | 51.22 | |
Data processing | | | 612 | | | 598 | | | 560 | | | 14 | | | 2.34 | | | | 38 | | | 6.79 | |
Directors’ and regional board fees | | | 307 | | | 284 | | | 313 | | | 23 | | | 8.10 | | | | (29 | ) | | (9.27 | ) |
Bank franchise tax | | | 464 | | | 280 | | | 251 | | | 184 | | | 65.71 | | | | 29 | | | 11.55 | |
Equipment | | | 343 | | | 304 | | | 205 | | | 39 | | | 12.83 | | | | 99 | | | 48.29 | |
Professional fees | | | 279 | | | 367 | | | 380 | | | (88 | ) | | (23.98 | ) | | | (13 | ) | | (3.42 | ) |
Telephone and postage | | | 305 | | | 294 | | | 282 | | | 11 | | | 3.74 | | | | 12 | | | 4.26 | |
ATM and VISA Check Card expense | | | 500 | | | 423 | | | 467 | | | 77 | | | 18.20 | | | | (44 | ) | | (9.42 | ) |
Advertising and marketing | | | 326 | | | 481 | | | 304 | | | (155 | ) | | (32.22 | ) | | | 177 | | | 58.22 | |
Other | | | 1,236 | | | 1,132 | | | 1,207 | | | 104 | | | 9.19 | | | | (75 | ) | | (6.21 | ) |
Total noninterest expense | | $ | 15,994 | | $ | 14,946 | | $ | 13,040 | | $ | 1,048 | | | 7.01 | % | | $ | 1,906 | | | 14.62 | % |
Salaries and employee benefits accounted for the largest portion of noninterest expense during each of the years in the three-year period ended December 31, 2007. During 2007, salaries and benefits were $9.95 million, an increase of $848 thousand over 2006. This increase was driven by annual incentive increases and an increase in the number of full-time equivalent employees, including one executive officer.
| | |
| 8 | | H A M P T O N R O A D S B A N K S H A R E S , I N C . |
Occupancy expense decreased $9 thousand for the year ended December 31, 2007 to $1.67 million. This decrease was primarily due to a decrease in building maintenance expense netted against an increase in rent expense.
Data processing expense increased $14 thousand, or 2.34%, to $612 thousand from 2006 to 2007. This increase is due to costs associated with improvements made to the online banking product and implementation of deposit capture in the branches.
All other expenses combined to cause an increase of $195 thousand from 2006 to 2007. The largest change occurred in the bank franchise tax category which increased $184 thousand from 2006 to 2007 as a result of higher Bank equity after the rights and public offerings in 2006.
2006 Compared to 2005
From 2005 to 2006, the increase in noninterest expense was $1.91 million, or 14.62%. Salaries and employee benefits accounted for $1.14 million of that increase due to annual incentive increases, an increase in the number of full time equivalent employees, and increases in certain employee benefit costs designed to reward employees for generating new business. From 2005 to 2006, occupancy expense increased $568 thousand due to the addition of the Great Bridge branch on January 31, 2005 and the Dominion Tower branch on August 16, 2005 as well as moving the Company’s headquarters to downtown Norfolk in November 2005. From 2005 to 2006, data processing expense increased $38 thousand related to the cost of upgrading branch networking equipment including the purchase of new network servers and computer equipment. In 2006, other expenses combined to cause an increase of $155 thousand over the amount recorded in 2005. The largest of these increases occurred in the advertising and marketing category which was $177 thousand higher in 2006 over 2005 due to a television campaign running from December 2005 through May 2006.
Provision for Income Taxes
Income tax expense for 2007, 2006, and 2005 was $3.59 million, $3.13 million, and $2.87 million, respectively. The Company’s effective tax rate for the years ended December 31, 2007, 2006, and 2005 was 34.52%, 34.18%, and 34.26%, respectively, and differed from the statutory rate of 34.18% on 2007 and 34.00% in 2006 and 2005 due primarily to nondeductible expenses.
Financial Condition
Loans
As a community bank, the Company has a primary objective of meeting the business and consumer credit needs within its market where standards of profitability, client relationships and credit quality can be met. As shown inTable 5, the overall loan portfolio grew $102.11 million, or 27.22%, from year-end 2006 to year-end 2007.
Table 5: Loans by Classification
| | | | | | | | | | | | | | | | | | | | | | | | | | | | | | | | | | |
| December 31, | | 2007 | | | 2006 | | | 2005 | | | 2004 | | | 2003 | |
| (In thousands) | | Balance | | | % | | | Balance | | | % | | | Balance | | | % | | | Balance | | | % | | | Balance | | % | |
Loan Classification: | | | | | | | | | | | | | | | | | | | | | | | | | | | | | | | | | | |
Commercial | | $ | 109,783 | | | 23.01 | % | | $ | 72,133 | | | 19.23 | % | | $ | 60,972 | | | 21.37 | % | | $ | 58,501 | | | 21.26 | % | | $ | 59,334 | | 28.15 | % |
Construction | | | 165,469 | | | 34.68 | | | | 116,812 | | | 31.15 | | | | 85,205 | | | 29.86 | | | | 73,508 | | | 26.71 | | | | 44,465 | | 21.10 | |
Real estate -commercial mortgage | | | 151,601 | | | 31.77 | | | | 140,260 | | | 37.40 | | | | 104,313 | | | 36.56 | | | | 108,314 | | | 39.36 | | | | 74,865 | | 35.52 | |
Real estate -residential mortgage | | | 38,523 | | | 8.07 | | | | 25,523 | | | 6.81 | | | | 20,011 | | | 7.01 | | | | 17,900 | | | 6.50 | | | | 15,595 | | 7.40 | |
Installment loans to individuals | | | 11,976 | | | 2.51 | | | | 20,599 | | | 5.49 | | | | 15,107 | | | 5.30 | | | | 17,251 | | | 6.27 | | | | 16,493 | | 7.82 | |
Deferred loan fees and related costs | | | (203 | ) | | (0.04 | ) | | | (283 | ) | | (0.08 | ) | | | (278 | ) | | (0.10 | ) | | | (284 | ) | | (0.10 | ) | | | 23 | | 0.01 | |
Total loans | | $ | 477,149 | | | 100.00 | % | | $ | 375,044 | | | 100.00 | % | | $ | 285,330 | | | 100.00 | % | | $ | 275,190 | | | 100.00 | % | | $ | 210,775 | | 100.00 | % |
Commercial loans are loans to businesses which typically are not collateralized by real estate. Generally the purpose of commercial loans is for the financing of accounts receivable, inventory, or the purchase of equipment and machinery. The commercial loan portfolio increased $37.65 million from the 2006 year-end balance of $72.13 million to the 2007 year-end balance of $109.78 million. The commercial loan category grew 18.31% from year-end 2005 to year-end 2006.
Construction loans increased $48.66 million from the year-end 2006 balance of $116.81 million to the year-end 2007 balance of $165.47 million. Construction and development loans are made to individuals and businesses for the purpose of construction of single family residential properties, multi-family properties and commercial projects, as well as the development of residential neighborhoods and commercial office parks. The Company has been, and continues to be, a leader in Hampton Roads in the construction and development market. The Company’s success is partially attributable to the years of experience held by senior management and the construction and development lending team at the Company. The construction loan category grew 37.10% from year-end 2005 to year-end 2006.
| | |
| 2 0 0 7 A N N U A L R E P O R T | | 9 |
The Company makes real estate-commercial mortgage loans for the purchase and re-financing of owner occupied commercial properties as well as non-owner occupied income producing properties. These loans are secured by various types of commercial real estate including office, retail, warehouse, industrial, storage facilities and other non-residential types of properties. The real estate-commercial mortgage loan portfolio increased $11.34 million from the 2006 year-end balance of $140.26 million to the 2007 year-end balance of $151.60 million. The real estate-commercial mortgage loan category increased 34.46% from year-end 2005 to year-end 2006.
The real estate-residential mortgage portfolio includes first and second mortgage loans, home equity lines of credit and other term loans secured by first and second mortgages. First mortgage loans are generally for the purchase of permanent residences, second homes or residential investment property. Second mortgages and home equity loans are generally for personal, family and household purposes such as home improvements, major purchases, education and other personal needs. The Company refers a substantial portion of its residential real estate business to its affiliate, THF. The Company owns 19% of THF and accounts for its ownership using the equity method. Through its affiliation with THF, the Company is able to provide its customers with enhanced mortgage products. The real estate-residential mortgage loan portfolio increased $13.00 million from the 2006 year-end balance of $25.52 million to the 2007 year-end balance of $38.52 million. The real estate-residential mortgage loan category increased 27.54% from year-end 2005 to year-end 2006.
Installment loans to individuals are made on a regular basis for personal, family, and general household purposes. More specifically, the Company makes automobile loans, home improvement loans, loans for vacations, and debt consolidation loans with the majority of the portfolio made up of automobile loans. Due to low interest rates offered by auto dealership financial programs, this segment of our loan portfolio has remained a small portion of the overall loan portfolio. The installment loan portfolio decreased $8.62 million from the 2006 year-end balance of $20.60 million to the 2007 year-end balance of $11.98 million. The installment loan category increased 36.35% from year-end 2005 to year-end 2006.
The Company’s specialization in construction and development lending has resulted in a loan concentration, defined as 10.00% of the total loan portfolio, in loans to real estate developers. As of year-end 2007, the Company had $165.47 million, or 34.68% of total loans, in loans outstanding to finance construction and development. These loans are collateralized by the underlying real estate. No other loan concentrations existed as of December 31, 2007.
Loan growth will continue to be one of the Company’s primary goals for 2008 and beyond. The long-range objective for growth in the loan portfolio will be achieved through continued community involvement, relationships with existing customers, enhancement of the Company’s image as a community asset, and management’s strengthened efforts to offer competitively-priced products, while offering high quality, personalized service. Furthermore, to balance the emphasis on loan growth, prudent business practices and internal guidelines and underwriting standards will continue to be followed in making lending decisions in order to manage exposure to loan losses.
Table 6sets forth the maturity periods of the Company’s loan portfolio as of December 31, 2007. Demand loans are reported as due within one year. Loans are included in the period in which they contractually mature. Since the majority of the Company’s loan portfolio is short-term, and 54.43% of the loan portfolio as of December 31, 2007 had adjustable or floating rates, the Company can re-price its portfolio frequently to adjust the portfolio to current market rates.
Table 6: Loan Maturities Schedule
| | | | | | | | | | | | | | | | | | |
| December 31, 2007 | | | | | | | | | | | | |
| (In thousands) | | Commercial | | Construction | | R/E Commercial | | R/E Residential | | Installment | | Total |
Variable Rate: | | | | | | | | | | | | | | | | | | |
Within 1 year | | $ | 34,531 | | $ | 149,660 | | $ | 42,679 | | $ | 14,244 | | $ | 2,758 | | $ | 243,872 |
1 to 5 years | | | 3,284 | | | 1,128 | | | — | | | 10,689 | | | 746 | | | 15,847 |
After 5 years | | | — | | | — | | | — | | | — | | | 126 | | | 126 |
Total variable rate | | $ | 37,815 | | $ | 150,788 | | $ | 42,679 | | $ | 24,933 | | $ | 3,630 | | $ | 259,845 |
| | | | | | |
Fixed Rate: | | | | | | | | | | | | | | | | | | |
Within 1 year | | $ | 9,232 | | $ | 11,704 | | $ | 20,927 | | $ | 2,138 | | $ | 3,731 | | $ | 47,732 |
1 to 5 years | | | 61,019 | | | 2,977 | | | 87,977 | | | 11,435 | | | 4,577 | | | 167,985 |
After 5 years | | | 1,717 | | | — | | | 18 | | | 17 | | | 38 | | | 1,790 |
Total fixed rate | | $ | 71,968 | | $ | 14,681 | | $ | 108,922 | | $ | 13,590 | | $ | 8,346 | | $ | 217,507 |
Total maturities | | $ | 109,783 | | $ | 165,469 | | $ | 151,601 | | $ | 38,523 | | $ | 11,976 | | $ | 477,352 |
| | |
| 10 | | H A M P T O N R O A D S B A N K S H A R E S , I N C . |
Non-Performing Assets
Total non-performing assets were $2.64 million, or 0.47% of total assets at year-end 2007, as compared to $1.63 million, or 0.34% of total assets at year-end 2006 and $1.82 million, or 0.44% of total assets at year-end 2005. Management classifies non-performing assets as those loans in nonaccrual status, those loans on which payment has been delinquent 90 days or more, but are still accruing interest, and real estate acquired in settlement of loans. Management closely reviews the composition of non-performing assets and related collateral values.
Loans categorized as 90 days or more past due were $852 thousand at December 31, 2007. The Company did not have any loans categorized as 90 days or more past due at December 31, 2006, but did have $30 thousand at December 31, 2005.
Nonaccrual loans were $1.79 million at December 31, 2007 compared to $1.63 million and $1.79 million at December 31, 2006 and 2005, respectively. Nonaccrual loans at year-end 2007 consisted of one commercial loan and one construction loan. The commercial loan is being treated as an impaired loan and, accordingly, the balance has been written down to the present value of expected future payments. As a general rule, loans are placed in nonaccrual status when principal or interest is 90 days or more past due, or when management deems collection of all principal and interest doubtful. Had income on nonaccrual loans been recorded under original terms, $164,006, $153,128, and $136,878 of additional interest income would have been recorded in 2007, 2006 and 2005, respectively. There were no interest payments recorded in 2007 as interest income for nonaccrual loans.
The Company did not have any real estate acquired in settlement of loans at December 31, 2007, 2006 or 2005.
Allowance for Loan Losses and Provision for Loan Losses
The Company continuously reviews its loan portfolio and maintains an allowance for loan losses sufficient to absorb incurred losses inherent in the portfolio. In addition to the review of credit quality through ongoing credit review processes, the Company constructs a comprehensive allowance analysis for its loan portfolio at least quarterly. This analysis includes two basic elements: specific allowances for individual loans, and general allowances for loan pools which factor in historical loan loss experience for the Company, loan portfolio growth and trends, and economic conditions.
As part of the loan loss reserve methodology, loans are categorized into one of six pools: commercial, construction, commercial real estate, residential real estate, consumer installment, and credit cards. These categories are further subdivided by assigned asset quality. Loss factors are calculated using the above mentioned qualitative data and then are applied to each of the loan pools to determine a reserve level for each of the six pools of loans. In addition, special allocations may be assigned to nonaccrual or other problem credits.
After considering these factors, the allowance for loan losses was $5.04 million, or 1.06% of outstanding loans at year-end 2007. This compares to an allowance of $3.91 million, or 1.04% of total loans and $3.60 million, or 1.26% of total loans at year-end 2006 and 2005, respectively, as seen inTable 7. At present, management believes that the allowance for loan losses is adequate. However, the allowance is subject to regulatory examinations and determination as to adequacy, which may take into account such factors as the methodology used to calculate the allowance and the size of the allowance in comparison to peer banks identified by regulatory agencies. Such agencies may require the Company to recognize additions to the allowance for loan losses based on their judgments about information available at the time of their examinations.
The Company’s provision for loan losses in 2007 was $1.23 million compared to $180 thousand in 2006 and $486 thousand in 2005. The increased provision for loan losses during 2007 was attributable to the growth in the loan portfolio and the current economic environment. Additionally, during 2006, recoveries on loans exceeded charge-offs, which resulted in a lower provision for loan losses that year.
| | |
| 2 0 0 7 A N N U A L R E P O R T | | 11 |
Table 7: Allowance for Loan Losses Analysis
| | | | | | | | | | | | | | | | | | | | |
| December 31, | | | | | | | | | | | | | | | |
| (In thousands) | | 2007 | | | 2006 | | | 2005 | | | 2004 | | | 2003 | |
Allowance for Loan Losses: | | | | | | | | | | | | | | | | | | | | |
Balance at beginning of year | | $ | 3,911 | | | $ | 3,597 | | | $ | 3,071 | | | $ | 2,948 | | | $ | 2,843 | |
Charge-offs: | | | | | | | | | | | | | | | | | | | | |
Commercial | | | — | | | | — | | | | (24 | ) | | | (845 | ) | | | (142 | ) |
Construction | | | (91 | ) | | | — | | | | — | | | | — | | | | — | |
Real estate - commercial mortgage | | | — | | | | — | | | | — | | | | — | | | | — | |
Real estate - residential mortgage | | | — | | | | — | | | | — | | | | — | | | | — | |
Installment loans to individuals | | | (18 | ) | | | (59 | ) | | | (75 | ) | | | (95 | ) | | | (157 | ) |
Total charge-offs | | | (109 | ) | | | (59 | ) | | | (99 | ) | | | (940 | ) | | | (299 | ) |
Recoveries: | | | | | | | | | | | | | | | | | | | | |
Commercial | | | — | | | | 166 | | | | 119 | | | | 110 | | | | 16 | |
Construction | | | — | | | | — | | | | — | | | | — | | | | — | |
Real estate - commercial mortgage | | | — | | | | — | | | | — | | | | — | | | | — | |
Real estate - residential mortgage | | | — | | | | — | | | | — | | | | — | | | | — | |
Installment loans to individuals | | | 9 | | | | 27 | | | | 20 | | | | 27 | | | | 18 | |
Total recoveries | | | 9 | | | | 193 | | | | 139 | | | | 137 | | | | 34 | |
Net (charge-offs) recoveries | | | (100 | ) | | | 134 | | | | 40 | | | | (803 | ) | | | (265 | ) |
Provision for loan losses | | | 1,232 | | | | 180 | | | | 486 | | | | 926 | | | | 370 | |
Balance at end of year | | $ | 5,043 | | | $ | 3,911 | | | $ | 3,597 | | | $ | 3,071 | | | $ | 2,948 | |
Allowance for loan losses to year-end loans | | | 1.06 | % | | | 1.04 | % | | | 1.26 | % | | | 1.12 | % | | | 1.40 | % |
Ratio of net (charge-offs) recoveries to average loans | | | (0.02 | )% | | | 0.04 | % | | | 0.01 | % | | | (0.34 | )% | | | (0.13 | )% |
The Company has allocated the allowance for loan losses to the categories as shown inTable 8. Notwithstanding these allocations, the entire allowance for loan losses is available to absorb charge-offs in any category of loan.
Table 8: Allocation of Allowance for Loan Losses
| | | | | | | | | | | | | | | |
| December 31, | | | | | | | | | | |
| (In thousands) | | 2007 | | 2006 | | 2005 | | 2004 | | 2003 |
Commercial | | $ | 1,447 | | $ | 1,058 | | $ | 1,068 | | $ | 1,040 | | $ | 1,003 |
Construction | | | 1,522 | | | 993 | | | 767 | | | 588 | | | 358 |
Real estate - commercial mortgage | | | 1,395 | | | 1,192 | | | 978 | | | 961 | | | 734 |
Real estate - residential mortgage | | | 264 | | | 160 | | | 130 | | | 118 | | | 174 |
Installment loans to individuals | | | 166 | | | 290 | | | 307 | | | 310 | | | 364 |
Unallocated | | | 249 | | | 218 | | | 347 | | | 54 | | | 315 |
Total allowance for loan losses | | $ | 5,043 | | $ | 3,911 | | $ | 3,597 | | $ | 3,071 | | $ | 2,948 |
Investment Securities and Overnight Funds Sold
The Company’s investment portfolio primarily consists of available-for-sale U.S. Agency securities. At year-end 2007, the estimated market value of available-for-sale investment securities held by the Company was $42.38 million, down 23.74% from $55.57 million at year-end 2006. This decrease was the result of the maturity of investment securities with proceeds of $15.17 million, netted against the purchase of investment securities with a cost of $1.24 million, the change in unrealized gains and losses, and unamortized premiums/unaccreted discounts on the remaining securities. As securities matured during 2007, the proceeds were used to fund loan growth to the extent that they were not replaced to fulfill pledging requirements. At year-end 2006, investment securities available-for-sale decreased 21.86% to $55.57 million from $71.11 million at year-end 2005. This decrease was the result of the maturity of investment securities with proceeds of $18.13 million, netted against the purchase of investment securities with a cost of $2.31 million, the change in unrealized gains and losses, and unamortized premiums/unaccreted discounts on the remaining securities.
| | |
| 12 | | H A M P T O N R O A D S B A N K S H A R E S , I N C . |
Table 9displays the contractual maturities and weighted average yields from investment securities at year-end 2007. Actual maturities may differ from contractual maturities because certain issuers may have the right to call or prepay obligations with or without call or prepayment penalties.
Table 9: Investment Maturities and Yields
| | | | | | | | | |
| December 31, 2007 | | Amortized
Cost | | Market
Value | | Average
Yield | |
| (In thousands) | | | |
Maturities: | | | | | | | | | |
U.S. Agency securities: | | | | | | | | | |
Within 1 year | | $ | 15,013 | | $ | 14,994 | | 3.92 | % |
After 1 year, but within 5 years | | | 25,931 | | | 26,279 | | 4.41 | |
Total U.S. Agency securities | | | 40,944 | | | 41,273 | | 4.23 | |
State and Municipal securities | | | | | | | | | |
After 5 years, but within 10 years | | | 244 | | | 250 | | 5.34 | |
Mortgage-backed securities | | | 642 | | | 641 | | 4.74 | |
Equity securities | | | 472 | | | 213 | | — | |
Total investment securities available-for-sale | | $ | 42,302 | | $ | 42,377 | | 4.25 | % |
The Company’s investment portfolio serves as a source of liquidity to fund future loan growth and to meet the necessary collateral requirements of the State Treasury Department, Federal Reserve Bank (“FRB”) and Federal Home Loan Bank (“FHLB”). As part of the Company’s asset/liability management policy, management has invested in high quality securities with varying maturity dates which provides for a natural hedge against changes in interest rates.
The Company does not use derivatives or other off-balance sheet transactions, such as futures contracts, forward obligations, interest rate swaps, or options.
Overnight funds sold are temporary investments used for daily cash management purposes, as well as management of short-term interest rate opportunities and interest rate risk, and as a result, daily balances vary. As of year-end 2007, overnight funds sold were $183 thousand compared to $9.52 million as of year-end 2006. This decrease was caused by the loan growth experienced during 2007. Overnight funds are comprised of federal funds sold and high quality money market instruments consisting of short-term debt securities that are U.S. Government issued or guaranteed.
Deposits
Deposits are the most significant source of the Company’s funds for use in lending and general business purposes. The Company’s balance sheet growth is largely determined by the availability of deposits in its markets, the cost of attracting the deposits, and the prospects of profitably utilizing the available deposits by increasing the loan or investment portfolios. In 2007, average deposits increased $55.81 million, or 16.75%, to a new high of $389.06 million. This increase was a continuation of the growth experienced in 2006 of $31.08 million, or 10.28%, to $333.24 million.
SeeTable 10for a comparison of year-end deposits by classification for the previous three years. Total deposits at December 31, 2007 increased $68.20 million, or 18.77%, to $431.46 million as compared to year-end 2006 total deposits of $363.26 million. Year-end 2006 total deposits grew $35.81 million from the year-end 2005 total deposits of $327.45 million, an increase of 10.94%.
In 2007 the Company experienced a shift in the classification of deposits resulting from the strong competition for deposit accounts within the local market. Noninterest bearing demand deposits increased $2.99 million to $100.55 million while interest bearing demand deposits decreased $2.19 million to $40.30 million. Savings accounts increased $8.26 million to $82.09 million with a large portion of the increase coming from the premium savings accounts, a high interest rate bearing savings account with some characteristics of a money market account. The increase in total deposits was heavily concentrated in rate sensitive certificates of deposits. Time deposits with balances less than $100,000 increased $38.08 million, or 49.61%, during 2007 over the 2006 balance of $76.76 million. Time deposits with balances of $100,000 or more increased $21.05 million, or 28.98%, during 2007 over the 2006 balance of $72.63 million. The increase in total time deposits was the result of efforts by the Company to remain competitive by increasing rates offered on time deposits within its local market. During 2007, the Company also tapped into the national certificate of deposit market by posting certificate of deposit rates on a rate board viewed on-line by registered depositors nation-wide. The Company can control the type and amount of deposits generated in this manner as well as the rates posted. Due to strong local competition for deposits, the deposits generated via the national rate board are frequently obtained at lower interest rates than local deposits of similar terms. The national rate board certificates of deposit are not brokered funds as the Company communicates directly with the depositors and does not pay a fee to a broker to obtain these funds, however, the Company does have $5 million in brokered funds as of December 31, 2007.
| | |
| 2 0 0 7 A N N U A L R E P O R T | | 13 |
Table 10: Deposits by Classification
| | | | | | | | | | | | | | | | | | |
| December 31, | | 2007 | | | 2006 | | | 2005 | |
| (In thousands) | | Balance | | % | | | Balance | | % | | | Balance | | % | |
Deposit Classifications: | | | | | | | | | | | | | | | | | | |
Noninterest bearing demand | | $ | 100,553 | | 23.30 | % | | $ | 97,559 | | 26.86 | % | | $ | 104,930 | | 32.05 | % |
Interest bearing demand | | | 40,299 | | 9.34 | | | | 42,486 | | 11.70 | | | | 47,492 | | 14.50 | |
Savings | | | 82,093 | | 19.03 | | | | 73,831 | | 20.32 | | | | 79,514 | | 24.28 | |
Time deposits less than $ 100,000 | | | 114,833 | | 26.62 | | | | 76,757 | | 21.13 | | | | 61,117 | | 18.67 | |
Time deposits $ 100,000 or more | | | 93,679 | | 21.71 | | | | 72,628 | | 19.99 | | | | 34,394 | | 10.50 | |
Total deposits | | $ | 431,457 | | 100.00 | % | | $ | 363,261 | | 100.00 | % | | $ | 327,447 | | 100.00 | % |
The Company will continue funding assets with deposit liability accounts and focus on core deposit growth as its primary source of liquidity and stability. Core deposits consist of noninterest bearing demand accounts, interest checking accounts, money market accounts, savings accounts and time deposits of less than $100,000. Core deposits totaled $337.78 million, or 78.29% of total deposits at year-end 2007 compared to $290.63 million, or 80.01% of total deposits at year-end 2006, and $293.05 million, or 89.50% of total deposits at year-end 2005.
Capital
Total shareholders’ equity increased $3.50 million, or 4.98%, to $73.66 million at December 31, 2007. This increase was due to current year net income, stock option exercises, dividends reinvested, change in unrealized gains and losses on securities available-for-sale and stock issued as a part of the employee benefit plans, net of dividends paid and common stock repurchased.
The Company and the Bank are subject to regulatory risk-based capital guidelines that measure capital relative to risk-weighted assets and off-balance sheet financial instruments. Tier I capital is comprised of shareholders’ equity, net of unrealized gains or losses on available-for-sale securities, less intangible assets, while total risk-based capital adds certain debt instruments and qualifying allowances for loan losses.
Under FRB rules, the Company and the Bank were considered “well-capitalized,” the highest category of capitalization defined by the regulators, as of December 31, 2007. For more information on the Company’s regulatory capital requirements, see Note No. 16 in the accompanying Notes to Consolidated Financial Statements. The Company continually monitors current and projected capital adequacy positions of both the Company and the Bank. Maintaining adequate capital levels is integral to providing stability to the Company, resources to achieve the Company’s growth objectives, and returns to the shareholders in the form of dividends.
During 2007, the Company repurchased 232,490 shares of its common stock in open market and privately negotiated transactions at prices ranging from $12.14 to $14.62. During 2006, the Company repurchased 380,613 shares of its common stock in open market and privately negotiated transactions at prices ranging from $10.50 to $12.18. During 2005, the Company repurchased 104,649 shares of its common stock in open market and privately negotiated transactions at prices ranging from $10.00 to $11.75.
Liquidity
Liquidity represents an institution’s ability to meet present and future financial obligations through either the sale or maturity of existing assets or the acquisition of additional funds through liability management. At December 31, 2007, cash and due from banks, overnight funds sold, interest-bearing deposits in other banks, and investment securities and loans maturing within one year were $332.18 million, or 58.92% of total assets. As a result of the Company’s management of liquid assets and the ability to generate liquidity through liability funding, management believes the Company maintains overall liquidity sufficient to satisfy its depositors’ requirements and meet its customers’ credit needs.
The Company also maintains additional sources of liquidity through a variety of borrowing arrangements. The Bank maintains federal funds lines with large regional and national banking institutions. These available lines total approximately $13 million, none of which were outstanding at December 31, 2007. Federal funds purchased during 2007 averaged $609 thousand compared to an average of $119 thousand during 2006.
The Bank has a credit line in the amount of $156.1 million at the FHLB. This line may be utilized for short and/or long term borrowing. The Bank has utilized the credit line for overnight funding throughout 2007 and 2006 with average balances of $1.06 million and $2.12 million, respectively, with none outstanding at year-end 2007 or 2006. Long-term FHLB borrowings were $53.00 million at year-end 2007 and $38.00 million at year-end 2006.
Off-Balance Sheet Arrangements
The Company is a party to financial instruments with off-balance sheet risk in the normal course of business to meet the financing needs of its customers. For more information on the Company’s off-balance sheet arrangements, see Note No. 8 in the accompanying Notes to Consolidated Financial Statements.
| | |
| 14 | | H A M P T O N R O A D S B A N K S H A R E S , I N C . |
Interest Rate Sensitivity
The Company’s primary market risk is exposure to interest rate volatility. Fluctuations in interest rates will impact both the level of interest income and interest expense and the market value of the Company’s interest earning assets and interest bearing liabilities.
The primary goal of the Company’s asset/liability management strategy is to optimize net interest income while limiting exposure to fluctuations caused by changes in the interest rate environment. The Company’s ability to manage its interest rate risk depends generally on the Company’s ability to match the maturities and re-pricing characteristics of its assets and liabilities while taking into account the separate goals of maintaining asset quality and liquidity and achieving the desired level of net interest income.
The Company’s management, guided by the Asset/Liability Committee (“ALCO”), determines the overall magnitude of interest sensitivity risk and then formulates policies governing asset generation and pricing, funding sources and pricing, and off-balance sheet commitments. These decisions are based on management’s expectations regarding future interest rate movements, the state of the national and regional economy, and other financial and business risk factors.
The primary method that the Company uses to quantify and manage interest rate risk is simulation analysis, which is used to model net interest income from assets and liabilities over a specified time period under various interest rate scenarios and balance sheet structures. This analysis measures the sensitivity of net interest income over a relatively short time horizon. Key assumptions in the simulation analysis relate to the behavior of interest rates and spreads, the changes in product balances and the behavior of loan and deposit customers in different rate environments.
Table 11illustrates the expected effect on net interest income for the twelve months following each of the two year-ends 2007 and 2006 due to a shock in interest rates. Estimated changes set forth below are dependent on material assumptions, such as those previously discussed.
Table 11: Effect on Net Interest Income
| | | | | | | | | | | | | | |
| | | 2007 | | | 2006 | |
| December 31, | | Change in Net Interest Income | | | Change in Net Interest Income | |
| (in thousands) | | Amount | | | % | | | Amount | | | % | |
Change in Interest Rates: | | | | | | | | | | | | | | |
+200 basis points | | $ | 4,494 | | | 19.39 | % | | $ | 3,130 | | | 14.12 | % |
+ 100 basis points | | | 2,249 | | | 9.70 | | | | 1,561 | | | 7.04 | |
- 100 basis points | | | (2,230 | ) | | (9.62 | ) | | | (1,567 | ) | | (7.06 | ) |
- 200 basis points | | | (4,333 | ) | | (18.69 | ) | | | (3,141 | ) | | (14.17 | ) |
As indicated inTable 11, a decrease in interest rates would tend to reduce net interest income, while an increase would tend to enhance net interest income. Thus, the Company’s interest rate sensitivity position is asset-sensitive. In the current declining interest rate environment and absent any mitigating factors, the Company could experience a substantial reduction in net interest income. It should be noted, however, that the simulation analysis is based upon equivalent changes in interest rates for all categories of assets and liabilities. In normal operating conditions, interest rate changes rarely occur in such a uniform manner. Many factors affect the timing and magnitude of interest rate changes on financial instruments. In addition, management may deploy strategies that offset some of the impact of changes in interest rates. Consequently, variations should be expected from the projections resulting from the controlled conditions of the simulation analysis.
The interest sensitivity gap is defined as the difference between the amount of interest earning assets anticipated, based upon certain assumptions, to mature or re-price within a specific time period and the amount of interest bearing liabilities anticipated, based upon certain assumptions, to mature or re-price within that time period. At December 31, 2007, the Company’s one year “positive gap” (interest earning assets maturing or re-pricing within a defined period exceed interest bearing liabilities maturing or re-pricing within the same period) was approximately $67.77 million, or 12.02% of total assets. Thus, during periods of rising interest rates, this implies that the Company’s net interest income would be positively affected because the yield of the Company’s interest earning assets is likely to rise more quickly than the cost of its interest bearing liabilities. In periods of falling interest rates, the opposite effect on net interest income is likely to occur. At December 31, 2006, the Company’s one year “positive gap” was $30.85 million, or 6.48% of total assets.
Table 12sets forth the amounts of interest earning assets and interest bearing liabilities outstanding at December 31, 2007 that are subject to re-pricing or that mature in each of the future time periods shown. Loans and securities with call or balloon provisions are included in the period in which they balloon or may first be called. Except as stated above, the amount of assets and liabilities shown that re-price or mature during a particular period were determined in accordance with the contractual terms of the asset or liability.
| | |
| 2 0 0 7 A N N U A L R E P O R T | | 15 |
Table 12: Interest Rate Sensitivity
| | | | | | | | | | | | | | | | | | | | | | | |
December 31, 2007 (In thousands) | | 1 - 90 Days | | | 91 Days -
1 Year | | | 1 - 3 Years | | | 3 - 5 Years | | | Over
5 Years | | | Total |
| | | | | | |
Interest Earning Assets: | | | | | | | | | | | | | | | | | | | | | | | |
Loans | | $ | 274,741 | | | $ | 34,110 | | | $ | 81,339 | | | $ | 86,646 | | | $ | 313 | | | $ | 477,149 |
Investments | | | 3,996 | | | | 10,998 | | | | 25,876 | | | | 1,037 | | | | 5,174 | | | | 47,081 |
Interest-bearing deposits in other banks | | | 5,623 | | | | — | | | | — | | | | — | | | | — | | | | 5,623 |
Overnight funds sold | | | 183 | | | | — | | | | — | | | | — | | | | — | | | | 183 |
Total | | $ | 284,543 | | | $ | 45,108 | | | $ | 107,215 | | | $ | 87,683 | | | $ | 5,487 | | | $ | 530,036 |
Cumulative total | | $ | 284,543 | | | $ | 329,651 | | | $ | 436,866 | | | $ | 524,549 | | | $ | 530,036 | | | | |
Interest Bearing Liabilities: | | | | | | | | | | | | | | | | | | | | | | | |
Interest checking | | $ | 17,930 | | | $ | — | | | $ | — | | | $ | — | | | $ | — | | | $ | 17,930 |
Money market | | | 22,368 | | | | — | | | | — | | | | — | | | | — | | | | 22,368 |
Savings | | | 82,093 | | | | — | | | | — | | | | — | | | | — | | | | 82,093 |
Time deposits | | | 34,447 | | | | 95,039 | | | | 58,554 | | | | 20,472 | | | | — | | | | 208,512 |
FHLB borrowings | | | 5,000 | | | | 5,000 | | | | 15,000 | | | | 28,000 | | | | — | | | | 53,000 |
Total | | $ | 161,838 | | | $ | 100,039 | | | $ | 73,554 | | | $ | 48,472 | | | $ | — | | | $ | 383,903 |
Cumulative total | | $ | 161,838 | | | $ | 261,877 | | | $ | 335,431 | | | $ | 383,903 | | | $ | 383,903 | | | | |
Interest sensitivity gap | | $ | 122,705 | | | $ | (54,931 | ) | | $ | 33,661 | | | $ | 39,211 | | | $ | 5,487 | | | $ | 146,133 |
Cumulative interest sensitivity gap | | $ | 122,705 | | | $ | 67,774 | | | $ | 101,435 | | | $ | 140,646 | | | $ | 146,133 | | | | |
Cumulative interest sensitivity gap as a percentage of total assets | | | 21.76 | % | | | 12.02 | % | | | 17.99 | % | | | 24.94 | % | | | 25.92 | % | | | |
Contractual Obligations
The Company’s contractual obligations consist of time deposits, borrowings from the FHLB, and operating lease obligations.Table 13shows payment detail for these contractual obligations as of December 31, 2007.
Table 13: Contractual Obligations
| | | | | | | | | | | | | | | |
December 31, 2007 (In thousands) | | Less than
1 Year | | 1 - 3 Years | | 3 - 5 Years | | Over
5 Years | | Total |
| | | | | |
Time deposits | | $ | 129,486 | | $ | 58,554 | | $ | 20,472 | | $ | — | | $ | 208,512 |
Long-term debt obligations | | | 10,000 | | | 15,000 | | | 28,000 | | | — | | | 53,000 |
Operating lease obligations | | | 867 | | | 1,655 | | | 1,565 | | | 2,509 | | | 6,596 |
Total contractual obligations | | $ | 140,342 | | $ | 75,220 | | $ | 50,037 | | $ | 2,509 | | $ | 268,108 |
Critical Accounting Policies
U.S. generally accepted accounting principles are complex and require management to apply significant judgment to various accounting, reporting, and disclosure matters. Management must use assumptions, judgments, and estimates when applying these principles where precise measurements are not possible or practical. These policies are critical because they are highly dependent upon subjective or complex judgments, assumptions and estimates. Changes in such judgments, assumptions and estimates may have a significant impact on the consolidated financial statements. Actual results, in fact, could differ from those estimates.
Our only critical accounting policy relates to our allowance for loan losses, which reflects the estimated losses resulting from the inability of our borrowers to make required loan payments. The allowance for loan losses is established through a provision for loan losses charged to expense. Loans are charged against the allowance for loan losses when management believes that collectibility of the principal is unlikely. Subsequent recoveries, if any, are credited to the allowance.
The allowance is an amount that management believes will be adequate to absorb estimated losses relating to specifically identified loans, as well as probable credit losses inherent in the balance of the loan portfolio, based on an evaluation of the collectibility of existing loans and prior loss experience. This evaluation also takes into consideration such factors as changes in the nature and volume of the loan portfolio, overall portfolio quality, credit concentrations, trends in historical loss experience, review of specific problem loans, and current economic conditions.
| | |
| 16 | | H A M P T O N R O A D S B A N K S H A R E S , I N C . |
The allowance consists of specific, general, and unallocated components. The specific component relates to loans that are classified as impaired, doubtful, substandard or special mention. The general component covers non-classified loans and is based on historical loss experience adjusted for qualitative factors. An unallocated component is maintained to cover uncertainties that could affect management’s estimate of probable losses. The unallocated component of the allowance reflects the margin of imprecision inherent in the underlying assumptions used in the methodologies for estimating specific and general losses in the portfolio.
A loan is impaired when it is probable the creditor will be unable to collect all contractual principal and interest payments due in accordance with the terms of the loan agreement. Impaired loans are measured based on the present value of payments expected to be received, using the historical effective loan rate as the discount rate. Alternatively, measurement also may be based on observable market prices or, for loans that are solely dependent on the collateral for repayment, measurement may be based on the fair value of the collateral. The Company does not aggregate loans for risk classification. Loans that are to be foreclosed are measured based on the fair value of the collateral. If the recorded investment in the impaired loan exceeds the measure of fair value, a valuation allowance is established as a component of the allowance for loan losses. Changes in the allowance for loan losses relating to impaired loans are charged or credited to the provision for loan losses.
Future Accounting Pronouncements
In September 2006, the Financial Accounting Standards Board (“FASB”) issued Statement of Financial Accounting Standards No. 157,Fair Value Measurements(“SFAS 157”). SFAS 157 defines fair value, establishes a framework for measuring fair value in generally accepted accounting principles, and expands disclosures about fair value measurements. SFAS 157 does not require new fair value measurements, but rather, provides enhanced guidance to other pronouncements that require or permit assets or liabilities to be measured at fair value. This Statement is effective for financial statements issued for fiscal years beginning after November 15, 2007 and interim periods within those years. The Company does not expect the implementation of SFAS 157 to have a material impact on its consolidated financial statements.
In September 2006, the FASB issued Statement of Financial Accounting Standards No. 158,Employers’ Accounting for Defined Benefit Pension and Other Postretirement Plans – an amendment of FASB Statements No. 87, 88, 106, and 132(R)(“SFAS 158”). This Statement requires that employers measure plan assets and obligations as of the balance sheet date. This requirement is effective for fiscal years ending after December 15, 2008. The other provisions of SFAS 158 were implemented by the Company as of December 31, 2006. The Company does not expect the implementation of the measurement date provisions of SFAS 158 to have a material impact on its consolidated financial statements.
In February 2007, the FASB issued Statement of Financial Accounting Standards No. 159,The Fair Value Option for Financial Assets and Financial Liabilities(“SFAS 159”). This Statement permits entities to choose to measure many financial instruments and certain other items at fair value. The objective of this Statement is to improve financial reporting by providing entities with the opportunity to mitigate volatility in reported earnings caused by measuring related assets and liabilities differently without having to apply complex hedge accounting provisions. The fair value option established by this Statement permits all entities to choose to measure eligible items at fair value at specified election dates. A business entity shall report unrealized gains and losses on items for which the fair value option has been elected in earnings at each subsequent reporting date. The fair value option may be applied instrument by instrument and is irrevocable. SFAS 159 is effective as of the beginning of an entity’s first fiscal year that begins after November 15, 2007, with early adoption available in certain circumstances. The Company does not expect the implementation of SFAS 159 to have a material impact on its consolidated financial statements.
In December 2007, the FASB issued Statement of Financial Accounting Standards No. 141(R),Business Combinations(“SFAS 141(R)”). The Standard will significantly change the financial accounting and reporting of business combination transactions. SFAS 141(R) establishes principles for how an acquirer recognizes and measures the identifiable assets acquired, liabilities assumed, and any noncontrolling interest in the acquiree; recognizes and measures the goodwill acquired in the business combination or a gain from a bargain purchase; and determines what information to disclose to enable users of the financial statements to evaluate the nature and financial effects of the business combination. SFAS 141(R) is effective for acquisition dates on or after the beginning of an entity’s first year that begins after December 15, 2008. The Company does not expect the implementation of SFAS 141(R) to have a material impact on its consolidated financial statements.
In December 2007, the FASB issued Statement of Financial Accounting Standards No. 160,Noncontrolling Interests in Consolidated Financial Statements an Amendment of ARB No. 51(“SFAS 160”). The Standard will significantly change the financial accounting and reporting of noncontrolling (or minority) interests in consolidated financial statements. SFAS 160 is effective as of the beginning of an entity’s first fiscal year that begins after December 15, 2008, with early adoption prohibited. The Company does not expect the implementation of SFAS 160 to have a material impact on its consolidated financial statements.
In September 2006, the Emerging Issues Task Force (“EITF”) issued EITF 06-4,Accounting for Deferred Compensation and Postretirement Benefit Aspects of Endorsement Split-Dollar Life Insurance Arrangements(“EITF 06-4”). This consensus concludes that for a split-dollar life insurance arrangement within the scope of this Issue, an employer should recognize a liability for future benefits in accordance with SFAS 106 (if, in substance, a postretirement benefit plan exists) or APB Opinion No. 12 (if the arrangement is,
| | |
| 2 0 0 7 A N N U A L R E P O R T | | 17 |
in substance, an individual deferred compensation contract) based on the substantive agreement with the employee. The consensus is effective for fiscal years beginning after December 15, 2007, with early application permitted. The Company does not expect the implementation of EITF 06-4 to have a material impact on its consolidated financial statements.
In November 2006, the EITF issuedAccounting for Collateral Assignment Split-Dollar Life Insurance Arrangements(“EITF 06-10”). In this Issue, a consensus was reached that an employer should recognize a liability for the postretirement benefit related to a collateral assignment split-dollar life insurance arrangement in accordance with either SFAS 106 or APB Opinion No. 12, as appropriate, if the employer has agreed to maintain a life insurance policy during the employee’s retirement or provide the employee with a death benefit based on the substantive agreement with the employee. A consensus also was reached that an employer should recognize and measure an asset based on the nature and substance of the collateral assignment split-dollar life insurance arrangement. The consensuses are effective for fiscal years beginning after December 15, 2007, including interim periods within those fiscal years, with early application permitted. The Company does not expect the implementation of EITF 06-10 to have a material impact on its consolidated financial statements.
In February 2007, the FASB issued FSP No. FAS 158-1,Conforming Amendments to the Illustrations in FASB Statements No. 87, No. 88 and No. 106 and to the Related Staff Implementation Guides(“FSP No. FAS 158-1”). This FSP provides conforming amendments to the illustrations in SFAS 87, 88, and 106 and to related staff implementation guides as a result of the issuance of SFAS 158. The conforming amendments made by this FSP are effective as of the effective dates of SFAS 158. The unaffected guidance that this FSP codifies into SFAS 87, 88, and 106 does not contain new requirements and therefore does not require a separate effective date or transition method. The Company does not expect the implementation of FSP No. FAS 158-1 to have a material impact on its consolidated financial statements.
In November 2007, the Securities and Exchange Commission (“SEC”) issued Staff Accounting Bulletin No. 109,Written Loan Commitments Recorded at Fair Value Through Earnings(“SAB 109”). SAB 109 expresses the current view of the staff that the expected net future cash flows related to the associated servicing of the loan should be included in the measurement of all written loan commitments that are accounted for at fair value through earnings. SEC registrants are expected to apply the views in Question 1 of SAB 109 on a prospective basis to derivative loan commitments issued or modified in fiscal quarters beginning after December 15, 2007. The Company does not expect the implementation of SAB 109 to have a material impact on its consolidated financial statements.
In December 2007, the SEC issued Staff Accounting Bulletin No. 110,Use of a Simplified Method in Developing Expected Term of Share Options(“SAB 110”). SAB 110 expresses the current view of the staff that it will accept a company’s election to use the simplified method discussed in SAB 107 for estimating the expected term of “plain vanilla” share options regardless of whether the company has sufficient information to make more refined estimates. The staff noted that it understands that detailed information about employee exercise patterns may not be widely available by December 31, 2007. Accordingly, the staff will continue to accept, under certain circumstances, the use of the simplified method beyond December 31, 2007. The Company does not expect the implementation of SAB 110 to have a material impact on its consolidated financial statements.
Other Accounting Matters
In the fourth quarter of 2005, management in consultation with its external auditors, KPMG LLP (“KPMG”) determined that the Company had misapplied Accounting Principles Board Opinion No. 25,Accounting for Stock Issued to Employees(“APB No. 25”). The Company determined that Consolidated Financial Statements for the years 2003 and 2004 were impacted. The analysis concluded that the amount of the differences was not material to the Consolidated Financial Statements in either year, nor was it material on a cumulative basis in 2005. As a result, the Company in further consultation with KPMG, made adjustments to its Consolidated Financial Statements in the year ended December 31, 2005 to correct the previous misapplication. The adjustment related to 2003 and 2004 Consolidated Financial Statements had the effect of increasing stock-based compensation expense $318 thousand and, thus, decreasing net income $210 thousand after the related tax effect.
In addition to the above matter, management in consultation with KPMG determined that the Company misclassified the accrued compensation expense for unexercised stock options as a liability rather than as a component of shareholders’ equity in prior audited Consolidated Financial Statements. The misclassification, which was not material to the Company’s Consolidated Financial Statements, does not affect the reporting of total assets or the Company’s earnings in any period. An adjustment was made in the Company’s 2005 Consolidated Financial Statements in the amount of $1.20 million, which had the effect of reducing liabilities and increasing shareholders’ equity by that amount. The net effect of the reclassification adjustment and the change in methodology for measuring compensation expense for stock options was an increase in shareholders’ equity of $1.52 million, or $0.18 in book value per share.
Caution About Forward-Looking Statements
Where appropriate, statements in this report may contain the insights of management into known events and trends that have or may be expected to have a material effect on our operations and financial condition. The information presented may also contain certain forward-looking statements regarding future financial performance, which are not historical facts and which involve various risks and uncertainties.
| | |
| 18 | | H A M P T O N R O A D S B A N K S H A R E S , I N C . |
When or if used in any Securities and Exchange Commission filings, or other public or shareholder communications, or in oral statements made with the approval of an authorized executive officer, the words or phrases: “anticipate”, “would be”, “will allow”, “intends to”, “will likely result”, “are expected to”, “will continue”, “is anticipated”, “is estimated”, “is projected”, or similar expressions are intended to identify “forward-looking statements.”
For a discussion of the risks, uncertainties and assumptions that could affect our future events, developments or results, you should carefully review the risk factors summarized below and the more detailed discussions in the “Risk Factors” and “Business” sections in the 2007 Form 10-K. Our risks include, without limitation, the following:
| | • | | Our dependence on key personnel; |
| | • | | The high level of competition within the banking industry; |
| | • | | Our dependence on construction and land development loans that could be negatively affected by a downturn in the real estate market; |
| | • | | We serve a limited market area, and an economic downturn in our market area could adversely affect our business; |
| | • | | The adequacy of our estimate for known and inherent losses in our loan portfolio; |
| | • | | Changes in interest rate; |
| | • | | Our ability to manage our growth; |
| | • | | Governmental and regulatory changes that may adversely affect our expenses and cost structure; |
| | • | | The threat from technology based frauds and scams; |
| | • | | If we need capital in the future to continue our growth, we may not be able to obtain it on terms that are favorable and capital transactions may be dilutive to existing shareholders; |
| | • | | Banking regulators have broad enforcement power, but regulations are meant to protect depositors, and not investors; |
| | • | | Trading in our common stock has been sporadic and volume has been light so shareholders may not be able to quickly and easily sell their common stock; |
| | • | | Virginia law and the provisions of our articles of incorporation and bylaws could deter or prevent takeover attempts by a potential purchaser of our common stock that would be willing to pay you a premium for your shares of our common stock; |
| | • | | Our directors and officers have significant voting power; |
| | • | | Merger expenses have been incurred even if the Merger is not completed; |
| | • | | The Merger may distract our management from its other responsibilities; |
| | • | | The Merger might be delayed or changed by regulatory agencies; and |
| | • | | We may not be able to realize all of the anticipated benefits of the Merger. |
Our forward-looking statements could be wrong in light of these and other risks, uncertainties and assumptions. The future events, developments or results described in this report could turn out to be materially different. We have no obligation to publicly update or revise our forward-looking statements after the date of this report and you should not expect us to do so.
| | |
| 2 0 0 7 A N N U A L R E P O R T | | 19 |
MANAGEMENT’S REPORT
On Internal Control Over Financial Reporting
Management of Hampton Roads Bankshares, Inc. and its subsidiaries (the “Company”) is responsible for establishing and maintaining adequate internal control over financial reporting. As of the end of the Company’s 2007 fiscal year, management, including the chief executive and chief financial officers, conducted an assessment of the effectiveness of the Company’s internal control over financial reporting based on the framework established inInternal Control – Integrated Frameworkissued by the Committee of Sponsoring Organizations of the Treadway Commission (“COSO”). Based on this assessment, management has determined that the Company’s internal control over financial reporting as of December 31, 2007 is effective.
Internal control over financial reporting includes policies and procedures that pertain to the maintenance of records that, in reasonable detail, accurately and fairly reflect transactions and dispositions of assets; provide reasonable assurances that transactions are recorded as necessary to permit preparation of financial statements in accordance with generally accepted accounting principles and that receipts and expenditures are being made only in accordance with authorizations of management and the directors of the Company; and provide reasonable assurance regarding prevention or timely detection of unauthorized acquisition, use, or disposition of the firm’s assets that could have a material effect on the Company’s financial statements.
The effectiveness of the Company’s internal control over financial reporting as of December 31, 2007 has been audited by Yount, Hyde & Barbour, P.C., the independent registered public accounting firm who also audited the Company’s consolidated financial statements included in this Annual Report on Form 10-K. Yount, Hyde & Barbour, P.C.’s attestation report on the Company’s internal control over financial reporting appears herein.
| | |
| 20 | | H A M P T O N R O A D S B A N K S H A R E S , �� I N C . |
REPORT OF INDEPENDENT
Registered Public Accounting Firm
| | | | |

| | | | |
Certified Public Accountants and Consultants | | | | |
To the Board of Directors and Shareholders
Hampton Roads Bankshares, Inc.
We have audited the accompanying consolidated balance sheet of Hampton Roads Bankshares, Inc. and subsidiaries (the Company) as of December 31, 2007, and the related consolidated statements of income, changes in shareholders’ equity and cash flows for the year ended December 31, 2007. We also have audited the Company’s internal control over financial reporting as of December 31, 2007, based on criteria established inInternal Control—Integrated Frameworkissued by the Committee of Sponsoring Organizations of the Treadway Commission (COSO). The Company’s management is responsible for these financial statements, for maintaining effective internal control over financial reporting, and for its assessment of the effectiveness of internal control over financial reporting included in the accompanying Management’s Report on Internal Control over Financial Reporting. Our responsibility is to express an opinion on these financial statements and an opinion on the Company’s internal control over financial reporting based on our audit. The financial statements of the Company for the years ended December 31, 2006 and 2005 were audited by other auditors whose report, dated March 1, 2007, expressed an unqualified opinion on those statements.
We conducted our audit in accordance with the standards of the Public Company Accounting Oversight Board (United States). Those standards require that we plan and perform the audit to obtain reasonable assurance about whether the financial statements are free of material misstatement and whether effective internal control over financial reporting was maintained in all material respects. Our audit of the financial statements included examining, on a test basis, evidence supporting the amounts and disclosures in the financial statements, assessing the accounting principles used and significant estimates made by management, and evaluating the overall financial statement presentation. Our audit of internal control over financial reporting included obtaining an understanding of internal control over financial reporting, assessing the risk that a material weakness exists, and testing and evaluating the design and operating effectiveness of internal control based on the assessed risk. Our audit also included performing such other procedures as we considered necessary in the circumstances. We believe that our audit provides a reasonable basis for our opinion.
A company’s internal control over financial reporting is a process designed to provide reasonable assurance regarding the reliability of financial reporting and the preparation of financial statements for external purposes in accordance with generally accepted accounting principles. A company’s internal control over financial reporting includes those policies and procedures that (1) pertain to the maintenance of records that, in reasonable detail, accurately and fairly reflect the transactions and dispositions of the assets of the company; (2) provide reasonable assurance that transactions are recorded as necessary to permit preparation of financial statements in accordance with generally accepted accounting principles, and that receipts and expenditures of the company are being made only in accordance with authorizations of management and directors of the company; and (3) provide reasonable assurance regarding prevention or timely detection of unauthorized acquisition, use, or disposition of the company’s assets that could have a material effect on the financial statements.
Because of its inherent limitations, internal control over financial reporting may not prevent or detect misstatements. Also, projections of any evaluation of effectiveness to future periods are subject to the risk that controls may become inadequate because of changes in conditions, or that the degree of compliance with the policies or procedures may deteriorate.
In our opinion, the 2007 consolidated financial statements referred to above present fairly, in all material respects, the financial position of Hampton Roads Bankshares, Inc. and subsidiaries as of December 31, 2007, and the results of their operations and their cash flows for the year ended December 31, 2007, in conformity with accounting principles generally accepted in the United States of America. Also in our opinion, Hampton Roads Bankshares, Inc. and subsidiaries maintained, in all material respects, effective internal control over financial reporting as of December 31, 2007, based on criteria established inInternal Control—Integrated Frameworkissued by the Committee of Sponsoring Organizations of the Treadway Commission (COSO).

Winchester, Virginia
March 5, 2008
| | |
| 2 0 0 7 A N N U A L R E P O R T | | 21 |
CONSOLIDATED BALANCE SHEETS
December 31, 2007 and 2006
| | | | | | | | |
| | | 2007 | | | 2006 | |
Assets: | | | | | | | | |
Cash and due from banks | | $ | 19,757,428 | | | $ | 17,112,616 | |
Overnight funds sold | | | 182,906 | | | | 9,524,445 | |
Interest-bearing deposits in other banks | | | 5,623,271 | | | | 161,490 | |
Investment securities available-for-sale, at fair value | | | 42,377,325 | | | | 55,569,440 | |
Federal Home Loan Bank stock | | | 3,330,000 | | | | 2,597,900 | |
Federal Reserve Bank stock | | | 1,374,000 | | | | 1,377,350 | |
Loans | | | 477,149,232 | | | | 375,044,161 | |
Allowance for loan losses | | | (5,042,583 | ) | | | (3,910,943 | ) |
Net loans | | | 472,106,649 | | | | 371,133,218 | |
Premises and equipment, net | | | 11,967,151 | | | | 12,183,884 | |
Interest receivable | | | 2,431,347 | | | | 2,281,945 | |
Deferred tax asset, net | | | 2,658,404 | | | | 2,209,117 | |
Other assets | | | 2,019,647 | | | | 2,148,063 | |
Total assets | | $ | 563,828,128 | | | $ | 476,299,468 | |
Liabilities and Shareholders’ Equity: | | | | | | | | |
Deposits: | | | | | | | | |
Noninterest bearing demand | | $ | 100,553,404 | | | $ | 97,559,421 | |
Interest bearing: | | | | | | | | |
Demand | | | 40,298,614 | | | | 42,486,451 | |
Savings | | | 82,092,848 | | | | 73,830,518 | |
Time deposits: | | | | | | | | |
Less than $ 100,000 | | | 114,832,724 | | | | 76,756,540 | |
$100,000 or more | | | 93,679,157 | | | | 72,628,399 | |
Total deposits | | | 431,456,747 | | | | 363,261,329 | |
Federal Home Loan Bank borrowings | | | 53,000,000 | | | | 38,000,000 | |
Interest payable | | | 1,636,231 | | | | 1,472,889 | |
Other liabilities | | | 4,075,136 | | | | 3,402,707 | |
Total liabilities | | | 490,168,114 | | | | 406,136,925 | |
Shareholders’ equity: | | | | | | | | |
Preferred stock, no par value. Authorized 1,000,000 shares: none issued and outstanding | | | — | | | | — | |
Common stock, $0.625 par value. Authorized 40,000,000 shares; issued and outstanding 10,314,899 shares in 2007 and 10,251,336 shares in 2006 | | | 6,446,812 | | | | 6,407,085 | |
Capital surplus | | | 42,677,083 | | | | 42,105,666 | |
Retained earnings | | | 24,486,335 | | | | 22,091,191 | |
Accumulated other comprehensive income (loss), net of tax | | | 49,784 | | | | (441,399 | ) |
Total shareholders’ equity | | | 73,660,014 | | | | 70,162,543 | |
Total liabilities and shareholders’ equity | | $ | 563,828,128 | | | $ | 476,299,468 | |
See accompanying notes to consolidated financial statements.
| | |
| 22 | | H A M P T O N R O A D S B A N K S H A R E S , I N C . |
CONSOLIDATED STATEMENTS OF INCOME
Years ended December 31, 2007, 2006 and 2005
| | | | | | | | | |
| | | 2007 | | 2006 | | 2005 |
Interest Income: | | | | | | | | | |
Loans, including fees | | $ | 35,603,701 | | $ | 26,827,215 | | $ | 22,342,047 |
Investment securities | | | 2,315,951 | | | 2,721,046 | | | 1,720,177 |
Overnight funds sold | | | 35,312 | | | 228,712 | | | 249,507 |
Interest-bearing deposits in other banks | | | 248,131 | | | 244,298 | | | 246,380 |
Total interest income | | | 38,203,095 | | | 30,021,271 | | | 24,558,111 |
Interest Expense: | | | | | | | | | |
Deposits: | | | | | | | | | |
Demand | | | 677,660 | | | 522,235 | | | 319,376 |
Savings | | | 2,865,842 | | | 2,180,372 | | | 1,155,739 |
Time deposits: | | | | | | | | | |
Less than $ 100,000 | | | 4,061,089 | | | 2,618,461 | | | 2,169,358 |
$100,000 or more | | | 4,052,193 | | | 2,308,374 | | | 1,221,610 |
Interest on deposits | | | 11,656,784 | | | 7,629,442 | | | 4,866,083 |
Federal Home Loan Bank borrowings | | | 2,273,736 | | | 1,377,241 | | | 992,569 |
Overnight funds purchased | | | 85,173 | | | 116,602 | | | 10,235 |
Total interest expense | | | 14,015,693 | | | 9,123,285 | | | 5,868,887 |
Net interest income | | | 24,187,402 | | | 20,897,986 | | | 18,689,224 |
Provision for loan losses | | | 1,232,000 | | | 180,000 | | | 486,000 |
Net interest income after provision for loan losses | | | 22,955,402 | | | 20,717,986 | | | 18,203,224 |
Noninterest Income: | | | | | | | | | |
Service charges on deposit accounts | | | 1,995,842 | | | 1,873,525 | | | 1,945,319 |
Other service charges and fees | | | 1,444,379 | | | 1,524,354 | | | 1,269,148 |
Total noninterest income | | | 3,440,221 | | | 3,397,879 | | | 3,214,467 |
Noninterest Expense: | | | | | | | | | |
Salaries and employee benefits | | | 9,954,349 | | | 9,105,901 | | | 7,962,216 |
Occupancy | | | 1,668,477 | | | 1,677,308 | | | 1,108,712 |
Data processing | | | 611,523 | | | 598,276 | | | 560,298 |
Other | | | 3,760,094 | | | 3,564,256 | | | 3,409,145 |
Total noninterest expense | | | 15,994,443 | | | 14,945,741 | | | 13,040,371 |
Income before provision for income taxes | | | 10,401,180 | | | 9,170,124 | | | 8,377,320 |
Provision for income taxes | | | 3,590,567 | | | 3,134,585 | | | 2,869,991 |
Net Income | | $ | 6,810,613 | | $ | 6,035,539 | | $ | 5,507,329 |
Basic earnings per share | | $ | 0.67 | | $ | 0.66 | | $ | 0.68 |
Diluted earnings per share | | $ | 0.65 | | $ | 0.65 | | $ | 0.66 |
Basic weighted average shares outstanding | | | 10,228,638 | | | 9,092,980 | | | 8,137,244 |
Effect of dilutive stock options and non-vested stock | | | 202,916 | | | 182,808 | | | 270,577 |
Diluted weighted average shares outstanding | | | 10,431,554 | | | 9,275,788 | | | 8,407,821 |
See accompanying notes to consolidated financial statements.
| | |
| 2 0 0 7 A N N U A L R E P O R T | | 23 |
CONSOLIDATED STATEMENTS OF CHANGES IN SHAREHOLDERS’ EQUITY
Years ended December 31, 2007, 2006 and 2005
| | | | | | | | | | | | | | | | | | | | | | | |
| | | Common Stock | | | Capital
Surplus | | | Retained
Earnings | | | Accumulated Other
Comprehensive
Income (Loss) | | | Total | |
| | | Shares | | | Amount | | | | | |
Balance at December 31, 2004 | | 8,059,528 | | | $ | 5,037,205 | | | $ | 20,626,500 | | | $ | 18,170,928 | | | $ | (209,073 | ) | | $ | 43,625,560 | |
Comprehensive income: | | | | | | | | | | | | | | | | | | | | | | | |
Net income | | — | | | | — | | | | — | | | | 5,507,329 | | | | — | | | | 5,507,329 | |
Change in unrealized gain (loss) on securities available-for-sale, net of taxes of $ 223,911 | | — | | | | — | | | | — | | | | — | | | | (434,650 | ) | | | (434,650 | ) |
Total comprehensive income | | | | | | | | | | | | | | | | | | | | | | 5,072,679 | |
Shares issued related to: | | | | | | | | | | | | | | | | | | | | | | | |
401(k) plan | | 8,952 | | | | 5,595 | | | | 81,689 | | | | — | | | | — | | | | 87,284 | |
Exercise of stock options | | 85,421 | | | | 53,388 | | | | 510,480 | | | | — | | | | — | | | | 563,868 | |
Dividend reinvestment | | 160,628 | | | | 100,392 | | | | 1,699,139 | | | | — | | | | — | | | | 1,799,531 | |
Non-vested stock | | 33,045 | | | | 20,653 | | | | 333,098 | | | | — | | | | — | | | | 353,751 | |
Payout of fractional shares | | (103 | ) | | | (64 | ) | | | (1,075 | ) | | | — | | | | — | | | | (1,139 | ) |
Common stock repurchased | | (104,649 | ) | | | (65,405 | ) | | | (1,026,750 | ) | | | (223 | ) | | | — | | | | (1,092,378 | ) |
Change in stock-based compensation, net | | — | | | | — | | | | 1,507,638 | | | | — | | | | — | | | | 1,507,638 | |
Tax benefit of stock option exercises | | — | | | | — | | | | 121,321 | | | | — | | | | — | | | | 121,321 | |
Cash dividends ($0.36 per share) | | — | | | | — | | | | — | | | | (2,907,586 | ) | | | — | | | | (2,907,586 | ) |
Balance at December 31, 2005 | | 8,242,822 | | | | 5,151,764 | | | | 23,852,040 | | | | 20,770,448 | | | | (643,723 | ) | | | 49,130,529 | |
Comprehensive income: | | | | | | | | | | | | | | | | | | | | | | | |
Net income | | — | | | | — | | | | — | | | | 6,035,539 | | | | — | | | | 6,035,539 | |
Change in unrealized gain (loss) on securities available- for-sale, net of taxes of $ 104,228 | | — | | | | — | | | | — | | | | — | | | | 202,324 | | | | 202,324 | |
Total comprehensive income | | | | | | | | | | | | | | | | | | | | | | 6,237,863 | |
Shares issued related to: | | | | | | | | | | | | | | | | | | | | | | | |
401(k) plan | | 11,333 | | | | 7,083 | | | | 115,312 | | | | — | | | | — | | | | 122,395 | |
Regional board fees | | 2,332 | | | | 1,457 | | | | 23,843 | | | | — | | | | — | | | | 25,300 | |
Exercise of stock options | | 277,041 | | | | 173,151 | | | | 1,432,735 | | | | — | | | | — | | | | 1,605,886 | |
Dividend reinvestment | | 229,090 | | | | 143,181 | | | | 2,512,766 | | | | — | | | | — | | | | 2,655,947 | |
Stock-based compensation expense | | 20,131 | | | | 12,582 | | | | 167,229 | | | | — | | | | — | | | | 179,811 | |
Stock offering, net of issuance costs of $1,109,824 | | 1,849,200 | | | | 1,155,750 | | | | 17,890,706 | | | | — | | | | — | | | | 19,046,456 | |
Common stock repurchased | | (380,613 | ) | | | (237,883 | ) | | | (4,035,983 | ) | | | — | | | | — | | | | (4,273,866 | ) |
Tax benefit of stock option exercises | | — | | | | — | | | | 147,018 | | | | — | | | | — | | | | 147,018 | |
Cash dividends ($0.50 per share) | | — | | | | — | | | | — | | | | (4,714,796 | ) | | | — | | | | (4,714,796 | ) |
Balance at December 31, 2006 | | 10,251,336 | | | | 6,407,085 | | | | 42,105,666 | | | | 22,091,191 | | | | (441,399 | ) | | | 70,162,543 | |
Comprehensive income: | | | | | | | | | | | | | | | | | | | | | | | |
Net income | | — | | | | — | | | | — | | | | 6,810,613 | | | | — | | | | 6,810,613 | |
Change in unrealized gain (loss) on securities available- for-sale, net of taxes of $ 253,033 | | — | | | | — | | | | — | | | | — | | | | 491,183 | | | | 491,183 | |
Total comprehensive income | | | | | | | | | | | | | | | | | | | | | | 7,301,796 | |
Shares issued related to: | | | | | | | | | | | | | | | | | | | | | | | |
401(k) plan | | 11,020 | | | | 6,888 | | | | 130,311 | | | | — | | | | — | | | | 137,199 | |
Executive savings plan | | 11,686 | | | | 7,304 | | | | 138,187 | | | | — | | | | — | | | | 145,491 | |
Regional board fees | | 1,893 | | | | 1,183 | | | | 22,807 | | | | — | | | | — | | | | 23,990 | |
Exercise of stock options | | 93,599 | | | | 58,499 | | | | 648,108 | | | | — | | | | — | | | | 706,607 | |
Dividend reinvestment | | 165,991 | | | | 103,744 | | | | 2,145,935 | | | | — | | | | — | | | | 2,249,679 | |
Stock-based compensation expense | | 11,864 | | | | 7,415 | | | | 329,835 | | | | — | | | | — | | | | 337,250 | |
Common stock repurchased | | (232,490 | ) | | | (145,306 | ) | | | (2,961,937 | ) | | | — | | | | — | | | | (3,107,243 | ) |
Tax benefit of stock option exercises | | — | | | | — | | | | 118,171 | | | | — | | | | — | | | | 118,171 | |
Cash dividends ($0.43 per share) | | — | | | | — | | | | — | | | | (4,415,469 | ) | | | — | | | | (4,415,469 | ) |
Balance at December 31, 2007 | | 10,314,899 | | | $ | 6,446,812 | | | $ | 42,677,083 | | | $ | 24,486,335 | | | $ | 49,784 | | | $ | 73,660,014 | |
See accompanying notes to consolidated financial statements.
| | |
| 24 | | H A M P T O N R O A D S B A N K S H A R E S , I N C . |
CONSOLIDATED STATEMENTS OF CASH FLOWS
Years ended December 31, 2007, 2006 and 2005
| | | | | | | | | | | | |
| | | 2007 | | | 2006 | | | 2005 | |
Operating Activities: | | | | | | | | | | | | |
Net income | | $ | 6,810,613 | | | $ | 6,035,539 | | | $ | 5,507,329 | |
Adjustments to reconcile net income to net cash provided by operating activities: | | | | | | | | | | | | |
Depreciation and amortization | | | 885,616 | | | | 876,625 | | | | 637,576 | |
Provision for loan losses | | | 1,232,000 | | | | 180,000 | | | | 486,000 | |
Regional board fees | | | 23,990 | | | | 25,300 | | | | — | |
Stock-based compensation expense | | | 337,250 | | | | 179,811 | | | | 704,300 | |
Net amortization of premiums and accretion of discounts on investment securities | | | 7,087 | | | | 31,853 | | | | 477,583 | |
(Gain) loss on sale of premises and equipment | | | (11,025 | ) | | | — | | | | 129,839 | |
Deferred income tax benefit | | | (702,320 | ) | | | (362,302 | ) | | | (432,982 | ) |
Changes in: | | | | | | | | | | | | |
Interest receivable | | | (149,402 | ) | | | (520,375 | ) | | | (507,896 | ) |
Other assets | | | 128,416 | | | | (98,646 | ) | | | (309,358 | ) |
Interest payable | | | 163,342 | | | | 982,707 | | | | 80,283 | |
Other liabilities | | | 672,429 | | | | 1,452,652 | | | | 564,629 | |
Net cash provided by operating activities | | | 9,397,996 | | | | 8,783,164 | | | | 7,337,303 | |
Investing Activities: | | | | | | | | | | | | |
Proceeds from maturities and calls of debt securities available-for-sale | | | 15,171,352 | | | | 18,130,775 | | | | 11,428,732 | |
Purchase of debt securities available-for-sale | | | (1,242,108 | ) | | | (1,839,057 | ) | | | (47,000,000 | ) |
Purchase of equity securities available-for-sale | | | — | | | | (472,500 | ) | | | — | |
Proceeds from sales of Federal Home Loan Bank stock | | | 1,035,000 | | | | 2,227,500 | | | | 112,500 | |
Purchase of Federal Home Loan Bank stock | | | (1,767,100 | ) | | | (2,768,300 | ) | | | (502,200 | ) |
Proceeds from sales of Federal Reserve Bank stock | | | 5,150 | | | | — | | | | — | |
Purchase of Federal Reserve Bank stock | | | (1,800 | ) | | | (722,750 | ) | | | (6,250 | ) |
Net increase in total loans | | | (102,195,431 | ) | | | (90,316,530 | ) | | | (10,098,844 | ) |
Purchase of premises and equipment | | | (719,573 | ) | | | (868,258 | ) | | | (2,430,533 | ) |
Proceeds from the sale of other real estate owned | | | 15,000 | | | | — | | | | — | |
Proceeds from sales of premises and equipment | | | 36,715 | | | | — | | | | — | |
Net cash used in investing activities | | | (89,662,795 | ) | | | (76,629,120 | ) | | | (48,496,595 | ) |
Financing Activities: | | | | | | | | | | | | |
Net increase in deposits | | | 68,195,418 | | | | 35,814,812 | | | | 52,331,159 | |
Proceeds from Federal Home Loan Bank borrowings | | | 23,000,000 | | | | 10,000,000 | | | | 10,000,000 | |
Repayments of Federal Home Loan Bank borrowings | | | (8,000,000 | ) | | | (2,500,000 | ) | | | (2,500,000 | ) |
Stock issuance costs | | | — | | | | (1,109,824 | ) | | | — | |
Common stock repurchased | | | (2,876,702 | ) | | | (3,424,628 | ) | | | (1,092,378 | ) |
Issuance of shares to 401(k) plan | | | 137,199 | | | | 122,395 | | | | 87,284 | |
Issuance of shares to executive savings plan | | | 145,491 | | | | — | | | | — | |
Issuance of shares in rights and public offerings | | | — | | | | 20,156,280 | | | | — | |
Proceeds from exercise of stock options | | | 476,066 | | | | 756,648 | | | | 408,452 | |
Excess tax benefit realized from stock options exercised | | | 118,171 | | | | 147,018 | | | | — | |
Dividends paid, net | | | (2,165,790 | ) | | | (2,058,849 | ) | | | (1,108,055 | ) |
Net cash provided by financing activities | | | 79,029,853 | | | | 57,903,852 | | | | 58,126,462 | |
Increase (decrease) in cash and cash equivalents | | | (1,234,946 | ) | | | (9,942,104 | ) | | | 16,967,170 | |
Cash and cash equivalents at beginning of year | | | 26,798,551 | | | | 36,740,655 | | | | 19,773,485 | |
Cash and cash equivalents at end of year | | $ | 25,563,605 | | | $ | 26,798,551 | | | $ | 36,740,655 | |
Supplemental cash flow information: | | | | | | | | | | | | |
Cash paid during the year for interest | | $ | 13,852,351 | | | $ | 8,140,578 | | | $ | 5,788,604 | |
Cash paid during the year for income taxes | | | 4,085,000 | | | | 3,370,000 | | | | 2,862,000 | |
Supplemental non-cash information: | | | | | | | | | | | | |
Dividends reinvested | | $ | 2,249,679 | | | $ | 2,655,947 | | | $ | 1,799,531 | |
Value of shares exchanged in exercise of stock options | | | 230,541 | | | | 849,238 | | | | 132,886 | |
Receipt of land in payment of loan | | | — | | | | 735,750 | | | | — | |
Transfer between loans and other real estate owned | | | 50,000 | | | | — | | | | — | |
Transfer between premises and equipment and loans | | | 25,000 | | | | — | | | | — | |
Unrealized gain (loss) on securities | | | 744,216 | | | | 306,552 | | | | (658,561 | ) |
See accompanying notes to consolidated financial statements.
| | |
| 2 0 0 7 A N N U A L R E P O R T | | 25 |
NOTES TO CONSOLIDATED FINANCIAL STATEMENTS
December 31, 2007, 2006 and 2005
| (1) | Summary of Significant Accounting Policies |
Hampton Roads Bankshares, Inc., a Virginia Corporation (the “Company”), is a financial holding company that was formed in February 2001 and is headquartered in Norfolk, Virginia. The Company’s primary subsidiary is Bank of Hampton Roads (the “Bank”), which opened for business in December 1987. Currently, the Bank operates 17 banking offices in the Hampton Roads region of southeastern Virginia, including eight offices in the city of Chesapeake, four offices each in the cities of Norfolk and Virginia Beach, and one office in the city of Suffolk.
In January 2004, the Company formed Hampton Roads Investments, Inc., a wholly owned subsidiary, to provide securities, brokerage, and investment advisory services.
The consolidated financial statements of the Company are prepared in conformity with U.S. generally accepted accounting principles and prevailing practices of the banking industry. The following is a summary of the significant accounting and reporting policies used in preparing the consolidated financial statements.
| (a) | Basis of Consolidation |
The consolidated financial statements include the accounts of the Company and its wholly owned subsidiaries, Bank of Hampton Roads and Hampton Roads Investments, Inc. All significant intercompany balances and transactions have been eliminated in consolidation.
| (b) | Restrictions on Cash and Due from Bank Accounts |
The Company is required to maintain average reserve balances in cash with the Federal Reserve Bank (“FRB”). The amounts of daily average required reserves for the final weekly reporting period were $3,067,000 and $2,126,000 at December 31, 2007 and 2006, respectively.
Debt securities that the Company has the positive intent and ability to hold to maturity are classified as held-to-maturity and reported at amortized cost. The Company has no securities in this category.
Securities classified as available-for-sale are those debt and equity securities that management intends to hold for an indefinite period of time, including securities used as part of the Company’s asset/liability strategy, and that may be sold in response to changes in interest rates, liquidity needs, or other similar factors. Securities in this classification are reported at fair value, with unrealized gains and losses excluded from earnings and reported as other comprehensive income, a separate component of shareholders’ equity.
Securities classified as held for trading are those debt and equity securities that are bought and held principally for the purpose of selling them in the near term and reported at fair value, with unrealized gains and losses included in earnings. The Company has no securities in this category.
Gains and losses on sales of securities are computed based on specific identification of the adjusted cost of each security and included in noninterest income. Amortization of premiums and accretion of discounts are computed by the effective yield method and included in interest income. Declines in the fair value of held-to-maturity and available-for-sale securities below their cost that are deemed to be other than temporary are reflected in earnings as realized losses. In estimating other than temporary impairment losses, management considers (1) the length of time and the extent to which the fair value has been less than cost, (2) the financial condition and near term prospects for the issuer, and (3) the intent and ability of the Company to retain its investment in the issuer for a period of time sufficient to allow for any anticipated recovery in fair value.
| (d) | Federal Reserve Bank Stock and Federal Home Loan Bank Stock |
The Company, as a member of the Federal Home Loan Bank (“FHLB”) of Atlanta, is required to hold shares of capital stock in the FHLB in an amount equal to 0.20% of total assets plus 4.50% of borrowings from the FHLB.
As a member of the FRB, the Company is required to hold shares of FRB capital stock, $100 par value, in an amount equal to 6% of the Bank’s total common stock and capital surplus.
FRB stock and FHLB stock are carried at cost.
| | |
| 26 | | H A M P T O N R O A D S B A N K S H A R E S , I N C . |
Loans are reported at their outstanding unpaid principal balances adjusted for charge-offs, the allowance for loan losses, and any deferred fees or costs on originated loans. Interest income is accrued on the unpaid principal balance. Loan origination fees, net of certain direct origination costs, are deferred over the life of the loan and recognized as an adjustment of the related loan yield using the interest method. Net fees related to standby letters of credit are recognized over the commitment period. In those instances when a loan prepays, the remaining deferred fee is recognized in the income statement. As a general rule, loans are placed in nonaccrual status when principal or interest is 90 days or more past due, or when management deems collection of all principal and interest doubtful after an evaluation of the collateral pledged and the financial strength of the borrower. The delinquency status of the loan is determined by the contractual terms of the loan.
All interest accrued but not collected for loans that are placed on nonaccrual status or charged-off is reversed against interest income. Cash payments received on loans in nonaccrual status are generally applied to reduce the outstanding principal balance. Loans are returned to accrual status when all the principal and interest amounts contractually due are brought current and future payments are reasonably assured.
A loan is deemed impaired when it is probable that the Company will be unable to collect all amounts due according to the contractual terms of the loan agreement. Impaired loans are measured at the present value of their expected future cash flows by discounting those cash flows at the loan’s effective interest rate, or at the loan’s observable market price or the fair value of collateral if the loan is collateral dependent. The difference between this discounted amount and the loan balance is recorded as an allowance for loan losses. Impairment is measured on a loan by loan basis. Interest on impaired loans is accrued and recorded as income based upon the principal amount outstanding, except for nonaccrual loans, for which interest is not accrued.
| (f) | Allowance for Loan Losses |
The allowance for loan losses is a valuation allowance consisting of the cumulative effect of the provision for loan losses, minus loans charged off, plus any amounts recovered on loans previously charged off. The provision for loan losses is the amount necessary in management’s judgment to maintain the allowance for loan losses at a level it believes sufficient to cover incurred losses in the collection of the Company’s loans. Loans are charged against the allowance when, in management’s opinion, they are deemed uncollectible, although the Company continues to aggressively pursue collection.
The allowance for loan losses is evaluated on a regular basis by management and is based upon management’s periodic review of the collectibility of the loans in light of historical loss experience, risk characteristics of the various categories of loans, adverse situations affecting individual credits, estimated value of any underlying collateral, and prevailing economic conditions. This evaluation is inherently subjective as it requires estimates that are susceptible to significant revision as more information becomes available.
The allowance consists of specific, general, and unallocated components. The specific component relates to loans that are classified as impaired, doubtful, substandard, or special mention. The general component covers all other loans and is based on historical loss experience adjusted for qualitative factors such as current economic conditions. An unallocated component is maintained to cover uncertainties that could affect management’s estimate of probable losses. The unallocated component of the allowance reflects the margin of imprecision inherent in the underlying assumptions used in the methodologies for estimating specific and general losses in the portfolio.
| (g) | Premises and Equipment |
Premises and equipment are stated at cost, less accumulated depreciation and amortization. Depreciation of buildings and improvements and equipment, furniture and fixtures is computed by the straight-line method over the estimated useful lives of the assets. Amortization of leasehold improvements is computed using the straight-line method over the estimated useful lives of the improvements or the lease term, whichever is shorter. Useful lives range from 9 to 15 years for leasehold improvements, from 10 to 50 years for buildings and improvements, and from 3 to 15 years for substantially all equipment, furniture and fixtures.
The Company accounts for long-lived assets in accordance with the provisions of SFAS No. 144,Accounting for the Impairment or Disposal of Long-Lived Assets, which requires that long-lived assets be reviewed for impairment whenever events or changes in circumstances indicate that the carrying amount of an asset may not be recoverable. During 2007, Bankers Investment Group, LLP (“BI”) agreed to be sold to Infinex Investments, Inc. (“Infinex”). The Company has a 4% ownership in BI which it accounts for as a cost method investment. The sale transaction is expected to be completed in 2008 and result in a reduction in the value of the asset held by the Company. Therefore, the investment in BI was written down $103,774 during 2007 to the estimated value after the sale. The loss was included as part of other noninterest expense. No long-lived assets were deemed to be impaired during 2006. During 2005, the Company exchanged certain ATM’s and data processing equipment with
| | |
| 2 0 0 7 A N N U A L R E P O R T | | 27 |
carrying amounts greater than their fair value, as determined by prices for similar assets. In addition, the Company identified a building and a trailer whose carrying amounts were not expected to be recoverable. These assets were written down as a result of this determination during 2005. Losses on the exchanges and impairments amounted to $129,839 and were recognized as part of other noninterest income.
| (i) | Other Real Estate Owned |
Real estate acquired in settlement of loans is stated at the lower of the recorded loan balance or fair market value less estimated disposal costs. At foreclosure any excess of the loan balance over the fair value of the property is charged to the allowance for loan losses. Such carrying value is periodically reevaluated and written down if there is an indicated decline in fair value. Costs to bring a property to salable condition are capitalized up to the fair value of the property while costs to maintain a property in salable condition are expensed as incurred. The Company did not have any other real estate owned as of December 31, 2007 or 2006.
The Company files a consolidated tax return. The provision for income taxes reflects tax expense incurred as a consolidated group. The expense is allocated among the members of the consolidated group in accordance with an intercompany agreement for tax expense.
Deferred income tax assets and liabilities are determined using the balance sheet method. Under this method, the net deferred tax asset or liability is determined based on the tax effects of the temporary differences between the book and tax bases of the various balance sheet assets and liabilities and gives current recognition to changes in tax rates and laws.
When tax returns are filed, it is highly certain that some positions taken would be sustained upon examination by the taxing authorities, while others are subject to uncertainty about the merits of the position taken or the amount of the position that would be ultimately sustained. The benefit of a tax position is recognized in the financial statements in the period during which, based on all available evidence, management believes it is more likely than not that the position will be sustained upon examination, including the resolution of appeals or litigation processes, if any. Tax positions taken are not offset or aggregated with other positions. Tax positions that meet the more-likely-than-not recognition threshold are measured as the largest amount of tax benefit that is more than 50 percent likely of being realized upon settlement with the applicable taxing authority. The portion of the benefits associated with tax positions taken that exceeds the amount measured as described above is reflected as a liability for unrecognized tax benefits in the accompanying balance sheet along with any associated interest and penalties that would be payable to the taxing authorities upon examination.
Interest and penalties associated with unrecognized tax benefits are classified as additional income taxes in the statement of income.
Basic earnings per share is computed by dividing income available to common shareholders by the weighted average number of common shares outstanding for the period. Diluted earnings per share reflects the dilutive effect of stock options and non-vested stock using the treasury stock method.
Advertising costs are expensed as incurred.
| (m) | Stock-Based Compensation |
The Company adopted SFAS No. 123R, Share-Based Payment, on January 1, 2006, using the modified prospective method which applies SFAS No. 123R to new awards and to the portion of existing awards that have not completely vested as of January 1, 2006. The Company had no existing stock options that remained unvested as of January 1, 2006; therefore, no additional stock-based compensation expense for existing awards of stock options was recognized after adopting SFAS No. 123R. Previously, the Company had followed Accounting Principles Board (“APB”) Opinion No. 25, Accounting for Stock Issued to Employees, and had accounted for employee share options at intrinsic value. During 2006 and 2007, the Company used the fair-value method to account for stock-based compensation and the fair value of stock options was estimated at the date of grant using a lattice option pricing model. Stock options granted with pro rata vesting schedules are expensed over the vesting period on a straight line basis.
Stock-based compensation expense recognized in the consolidated statements of income for the years ended December 31, 2007, 2006 and 2005 was $337,250, $179,811, and $704,300, respectively, with a related tax benefit of $115,276, $61,136, and $239,462, respectively. During 2007, 2006 and 2005, stock-based compensation expense was comprised of $160,229, $13,372, and $554,100, respectively, related to stock options which vested during the period. During 2007, 2006 and 2005, the remaining stock-based compensation expense of $177,021, $166,439 and $150,200, respectively, related to share awards.
| | |
| 28 | | H A M P T O N R O A D S B A N K S H A R E S , I N C . |
Reported and pro forma results and a summary of the assumptions used to value stock options granted during 2007, 2006 and 2005 were as follows:
| | | | | | | | | | | | |
| Years Ended December 31, | | 2007 | | | 2006 | | | 2005 | |
Reported net income | | $ | 6,810,613 | | | $ | 6,035,539 | | | $ | 5,507,329 | |
Stock option expense (net of tax): | | | | | | | | | | | | |
As reported | | | 105,461 | | | | 8,826 | | | | 365,706 | |
Pro forma | | | (105,461 | ) | | | (8,826 | ) | | | (378,359 | ) |
Pro forma net income | | $ | 6,810,613 | | | $ | 6,035,539 | | | $ | 5,494,676 | |
| | | |
Net income per share: | | | | | | | | | | | | |
Basic-as reported | | $ | 0.67 | | | $ | 0.66 | | | $ | 0.68 | |
Basic-pro forma | | | 0.67 | | | | 0.66 | | | | 0.68 | |
Diluted-as reported | | | 0.65 | | | | 0.65 | | | | 0.66 | |
Diluted-pro forma | | | 0.65 | | | | 0.65 | | | | 0.65 | |
| | | |
Assumptions: | | | | | | | | | | | | |
Risk-free interest rate | | | 4.36% - 4.68 | % | | | 4.68 | % | | | 4.32 | % |
Volatility | | | 18.40% - 27.27 | % | | | 18.40 | % | | | 10.08 | % |
Dividend yield | | | 3.33% - 3.43 | % | | | 3.33 | % | | | 3.38 | % |
Weighted average expected term (in years) | | | 1.90 - 9.50 | | | | 8.72 | | | | 8.60 | |
The table above excludes stock-based compensation related to share awards and includes the effect of a 2005 fourth quarter adjustment to stock-based compensation expense. For more information on this adjustment, please see Note No. 21 contained in this annual report. The information in the table above for 2007 and 2006 reflects the adoption of SFAS No. 123R as of January 1, 2006; therefore, there is no difference between the stock option expense (net of tax) amounts as reported and the pro forma amounts.
Option valuation models require the input of highly subjective assumptions. Because the Company’s employee stock options have characteristics significantly different from those of traded options, and because changes in the subjective input assumptions can materially affect the fair value estimate, in management’s opinion, the existing models do not necessarily provide a representative single measure of the fair value at which transactions may occur. Expected volatility is based on historical volatility of the Company’s traded shares. The expected term is calculated by the lattice option pricing model using assumptions regarding the contractual term of the stock options, vesting periods, the exercise price to market stock price multiple experienced by the Company, and the historical employee exit rate.
The preparation of consolidated financial statements in conformity with U.S. generally accepted accounting principles requires management to make estimates and assumptions that affect the reported amounts of assets and liabilities and disclosures of contingent assets and liabilities at the date of the consolidated financial statements and the reported amounts of revenues and expenses during the periods presented. Actual results could differ from those estimates. Material estimates that are particularly susceptible to changes in the near term are the allowance for loan losses, the valuation of deferred tax assets, the fair value of stock options, and the estimated fair value of financial instruments.
| (o) | Cash and Cash Equivalents |
For the purpose of presentation in the consolidated statements of cash flows, the Company considers cash and due from banks, overnight funds sold, and interest-bearing deposits in other banks as cash and cash equivalents. Generally, overnight funds sold include federal funds sold and high quality money market instruments, which hold short-term debt securities that are U.S. Government issued or guaranteed.
| (p) | Comprehensive Income (Loss) |
Comprehensive income (loss) represents all changes in equity that result from recognized transactions and other economic events of the period. Other comprehensive income (loss) refers to revenues, expenses, gains and losses that under U.S. generally accepted accounting principles are included in comprehensive income but excluded from net income, such as unrealized gains and losses on investment securities available-for-sale.
| | |
| 2 0 0 7 A N N U A L R E P O R T | | 29 |
| (q) | Concentrations of Credit Risk |
Construction and mortgage loans represented $355.6 million and $282.6 million of the total loan portfolio at December 31, 2007 and 2006, respectively. Substantially all such loans are collateralized by real property or other assets. Loans in these categories and their collateral values are continuously monitored by management.
At times the Company may have cash and cash equivalents at a financial institution in excess of insured limits. The Company places its cash and cash equivalents with high credit quality financial institutions whose credit rating is monitored by management to minimize credit risk.
Certain 2006 and 2005 amounts have been reclassified to conform to the 2007 presentation.
The amortized cost and estimated fair values of investment securities available-for-sale at December 31, 2007 and 2006 were as follows:
| | | | | | | | | | | | |
| | | 2007 |
| | | Amortized
Cost | | Gross
Unrealized
Gains | | Gross
Unrealized
Losses | | Estimated
Fair
Value |
Investment Securities Available-for-Sale: | | | | | | | | | | | | |
State and municipal securities | | $ | 244,001 | | $ | 5,994 | | $ | — | | $ | 249,995 |
U.S. Agency securities | | | 40,943,608 | | | 355,747 | | | 26,699 | | | 41,272,656 |
Mortgage backed securities | | | 641,785 | | | 9 | | | 620 | | | 641,174 |
Equity securities | | | 472,500 | | | — | | | 259,000 | | | 213,500 |
Total investment securities available-for-sale | | $ | 42,301,894 | | $ | 361,750 | | $ | 286,319 | | $ | 42,377,325 |
| | | | | | | | | | | | |
| | | 2006 |
| | | Amortized
Cost | | Gross
Unrealized
Gains | | Gross
Unrealized
Losses | | Estimated
Fair
Value |
Investment Securities Available-for-Sale: | | | | | | | | | | | | |
U.S. Treasury securities | | $ | 100,000 | | $ | — | | $ | 1,461 | | $ | 98,539 |
U.S. Agency securities | | | 54,954,164 | | | 20,404 | | | 665,349 | | | 54,309,219 |
Mortgage backed securities | | | 711,561 | | | — | | | 4,879 | | | 706,682 |
Equity securities | | | 472,500 | | | — | | | 17,500 | | | 455,000 |
Total investment securities available-for-sale | | $ | 56,238,225 | | $ | 20,404 | | $ | 689,189 | | $ | 55,569,440 |
Information pertaining to securities with gross unrealized losses at December 31, 2007 and 2006, aggregated by investment category and length of time that the individual securities have been in a continuous loss position is as follows:
| | | | | | | | | | | | | | | | | | |
| | | 2007 |
| | | Less than 12 Months | | 12 Months or More | | Total |
| | | Estimated
Fair Value | | Unrealized
Loss | | Estimated
Fair Value | | Unrealized
Loss | | Estimated
Fair Value | | Unrealized
Loss |
U.S. Agency securities | | $ | — | | $ | — | | $ | 13,460,781 | | $ | 26,699 | | $ | 13,460,781 | | $ | 26,699 |
Mortgage backed securities | | | — | | | — | | | 634,574 | | | 620 | | | 634,574 | | | 620 |
Equity securities | | | — | | | — | | | 213,500 | | | 259,000 | | | 213,500 | | | 259,000 |
| | $ | — | | $ | — �� | | $ | 14,308,855 | | $ | 286,319 | | $ | 14,308,855 | | $ | 286,319 |
| | | | | | | | | | | | | | | | | | |
| | | 2006 |
| | | Less than 12 Months | | 12 Months or More | | Total |
| | | Estimated
Fair Value | | Unrealized
Loss | | Estimated
Fair Value | | Unrealized
Loss | | Estimated
Fair Value | | Unrealized
Loss |
U.S. Treasury securities | | $ | — | | $ | — | | $ | 98,539 | | $ | 1,461 | | $ | 98,539 | | $ | 1,461 |
U.S. Agency securities | | | 6,995,625 | | | 53,564 | | | 45,311,406 | | | 611,785 | | | 52,307,031 | | | 665,349 |
Mortgage backed securities | | | 706,682 | | | 4,879 | | | — | | | — | | | 706,682 | | | 4,879 |
Equity securities | | | 455,000 | | | 17,500 | | | — | | | — | | | 455,000 | | | 17,500 |
| | $ | 8,157,307 | | $ | 75,943 | | $ | 45,409,945 | | $ | 613,246 | | $ | 53,567,252 | | $ | 689,189 |
| | |
| 30 | | H A M P T O N R O A D S B A N K S H A R E S , I N C . |
The unrealized loss positions on debt securities at December 31, 2007 were directly related to interest rate movements as there is minimal credit risk exposure in these investments. Investment securities with unrealized losses have interest rates that are less than the current interest rate environment and not a result of credit impairment. All debt securities are AAA rated investments. Bonds with unrealized loss positions at 2007 year-end included, 1 mortgage backed security and 9 U.S. Agency securities. The unrealized loss on equity securities at December 31, 2007 is considered by management to be temporary given the duration of the unrealized loss and the thinly traded nature of the stock.
There were no sales of securities in 2007, 2006 or 2005.
The amortized cost and estimated fair value of investment securities available-for-sale at December 31, 2007 by contractual maturity were as follows:
| | | | | | |
| | | Amortized
Cost | | Estimated
Fair Value |
Due in one year or less | | $ | 15,013,223 | | $ | 14,993,750 |
Due after one year through five years | | | 26,565,579 | | | 26,913,481 |
Due after five years through ten years | | | 250,591 | | | 256,594 |
Equity securities | | | 472,500 | | | 213,500 |
| | $ | 42,301,893 | | $ | 42,377,325 |
Investment securities that were pledged to secure deposits, outstanding borrowings, or available to secure future borrowings at December 31, 2007 and 2006 were as follows:
| | | | | | |
| | | 2007 | | 2006 |
Public deposits | | $ | 12,156,866 | | $ | 11,873,879 |
Treasury, tax and loan deposits | | | 1,489,219 | | | 1,453,125 |
FHLB borrowings | | | 21,577,500 | | | 26,170,469 |
FRB borrowings | | | 2,019,063 | | | 2,969,063 |
Debtor in possession deposit | | | — | | | 98,539 |
| | $ | 37,242,648 | | $ | 42,565,075 |
| (3) | Loans and Allowance for Loan Losses |
The Company grants commercial, construction, real estate, and consumer loans to customers throughout its lending area. A substantial portion of debtors’ abilities to honor their contracts is dependent upon the real estate and general economic environment of the lending area.
Major classifications of loans at December 31, 2007 and 2006 were as follows:
| | | | | | | | |
| | | 2007 | | | 2006 | |
Commercial | | $ | 109,782,739 | | | $ | 72,132,578 | |
Construction | | | 165,468,776 | | | | 116,812,110 | |
Real estate—commercial mortgage | | | 151,600,649 | | | | 140,259,912 | |
Real estate—residential mortgage | | | 38,523,593 | | | | 25,522,729 | |
Installment loans to individuals | | | 11,976,075 | | | | 20,599,390 | |
Deferred loan fees and related costs | | | (202,600 | ) | | | (282,558 | ) |
| | $ | 477,149,232 | | | $ | 375,044,161 | |
Non-performing assets at December 31, 2007 and 2006 were as follows:
| | | | | | |
| | | 2007 | | 2006 |
Loans 90 days past due and still accruing interest | | $ | 851,846 | | $ | — |
Nonaccrual loans, including nonaccrual impaired loans | | | 1,792,758 | | | 1,629,990 |
Real estate acquired in settlement of loans | | | — | | | — |
| | $ | 2,644,604 | | $ | 1,629,990 |
If interest on nonaccrual loans had been accrued, such income would have amounted to $164,006, $153,128 and $136,878 in 2007, 2006 and 2005, respectively, none of which was recognized in income.
| | |
| 2 0 0 7 A N N U A L R E P O R T | | 31 |
Information on impaired loans at December 31, 2007, 2006 and 2005 was:
| | | | | | | | | |
| | | 2007 | | 2006 | | 2005 |
Impaired loans for which an allowance has been provided | | $ | 1,697,758 | | $ | 1,854,990 | | $ | 1,770,656 |
Impaired loans for which no allowance has been provided | | | — | | | — | | | — |
Total impaired loans | | $ | 1,697,758 | | $ | 1,854,990 | | $ | 1,770,656 |
Allowance provided for impaired loans, included in the allowance for loan losses | | $ | 405,552 | | $ | 438,998 | | $ | 354,131 |
Average balance in impaired loans | | $ | 1,782,143 | | $ | 1,936,082 | | $ | 1,777,615 |
Interest income recognized from impaired loans | | $ | 19,952 | | $ | 1,026 | | $ | — |
Transactions affecting the allowance for loan losses for the years ended December 31, 2007, 2006 and 2005 were as follows:
| | | | | | | | | | | | |
| | | 2007 | | | 2006 | | | 2005 | |
Balance at beginning of year | | $ | 3,910,943 | | | $ | 3,597,497 | | | $ | 3,070,600 | |
Provision for loan losses | | | 1,232,000 | | | | 180,000 | | | | 486,000 | |
Loans charged off | | | (109,748 | ) | | | (59,118 | ) | | | (98,737 | ) |
Recoveries | | | 9,388 | | | | 192,564 | | | | 139,634 | |
Balance at end of year | | $ | 5,042,583 | | | $ | 3,910,943 | | | $ | 3,597,497 | |
| (4) | Premises, Equipment and Leases |
Premises and equipment at December 31, 2007 and 2006 are summarized as follows:
| | | | | | | | |
| | | 2007 | | | 2006 | |
Land | | $ | 4,321,467 | | | $ | 4,321,467 | |
Buildings and improvements | | | 6,145,170 | | | | 6,008,298 | |
Leasehold improvements | | | 847,453 | | | | 820,694 | |
Equipment, furniture and fixtures | | | 5,619,191 | | | | 5,178,374 | |
| | | 16,933,281 | | | | 16,328,833 | |
Less accumulated depreciation and amortization | | | (4,966,130 | ) | | | (4,144,949 | ) |
| | $ | 11,967,151 | | | $ | 12,183,884 | |
The Company leases the land upon which one of its branch offices is located. In addition, the Company also leases the buildings in which six branch offices are located. The lease terms range from one to eleven years and most include renewal options.
Total rent expense was $906,944 in 2007, $845,744 in 2006 and $428,500 in 2005. On May 26, 2005, the Company entered into a lease agreement for a portion of the first floor and the entire second floor of the Dominion Tower building located in downtown Norfolk, Virginia. The Company opened a branch office in the leased space on the first floor and relocated the executive offices to the second floor during the fourth quarter of 2005. Rent payments began during the fourth quarter of 2006.
Future minimum lease payments, by year and in the aggregate, under noncancelable operating leases with initial or remaining terms of one year or more at December 31, 2007 were as follows:
| | | |
2008 | | $ | 867,383 |
2009 | | | 839,830 |
2010 | | | 814,579 |
2011 | | | 813,770 |
2012 | | | 751,138 |
2013 - 2016 | | | 2,509,493 |
| | $ | 6,596,193 |
The Company has entered into a contract as lessor for excess office space. Future minimum lease payments receivable under noncancelable leasing arrangements at December 31, 2007 were as follows:
| | | |
2008 | | $ | 84,443 |
2009 | | | 28,148 |
| | $ | 112,591 |
| | |
| 32 | | H A M P T O N R O A D S B A N K S H A R E S , I N C . |
The maturities of time deposits at December 31, 2007 and 2006 were as follows:
| | | | | | | | | | | | |
| | | 2007 | | 2006 |
| | | Time Deposits
Less than $ 100,000 | | Time Deposits
$100,000 or More | | Time Deposits
Less than $ 100,000 | | Time Deposits
$100,000 or More |
Maturity of: | | | | | | | | | | | | |
3 months or less | | $ | 18,240,001 | | $ | 16,207,497 | | $ | 11,506,473 | | $ | 20,801,560 |
Over 3 months—6 months | | | 18,808,784 | | | 29,460,296 | | | 15,831,990 | | | 24,426,473 |
Over 6 months—12 months | | | 29,353,343 | | | 17,405,373 | | | 15,969,016 | | | 9,074,891 |
1 year—2 years | | | 12,539,501 | | | 6,777,291 | | | 11,290,285 | | | 6,300,140 |
2 years—3 years | | | 24,358,559 | | | 14,889,483 | | | 7,491,413 | | | 3,594,608 |
3 years—4 years | | | 9,892,866 | | | 7,070,159 | | | 10,270,500 | | | 4,899,477 |
4 years—5 years | | | 1,639,670 | | | 1,869,058 | | | 4,396,863 | | | 3,531,250 |
| | $ | 114,832,724 | | $ | 93,679,157 | | $ | 76,756,540 | | $ | 72,628,399 |
Brokered deposits totaled $5,000,000 at December 31, 2007. There were no brokered deposits at December 31, 2006.
| (6) | Federal Home Loan Bank Borrowings |
At December 31, 2007 and 2006, the Company had borrowings from the FHLB system totaling $53,000,000 and $38,000,000, respectively. Interest only is payable on a monthly basis until maturity. Maturities of FHLB borrowings at December 31, 2007 were as follows:
| | | | | | | | |
| | | Type | | Interest Rate | | | Balance |
Maturity Date: | | | | | | | | |
January 2008 | | Fixed | | 3.92 | % | | $ | 5,000,000 |
May 2008 | | Fixed | | 2.83 | | | | 5,000,000 |
January 2009 | | Fixed | | 4.18 | | | | 5,000,000 |
May 2009 | | Fixed | | 5.53 | | | | 5,000,000 |
June 2009 | | Fixed | | 5.68 | | | | 5,000,000 |
April 2011 | | Fixed | | 5.46 | | | | 5,000,000 |
May 2011 | | Fixed | | 5.00 | | | | 5,000,000 |
March 2012 | | Fixed | | 4.95 | | | | 12,500,000 |
September 2012 | | Convertible | | 4.29 | | | | 5,500,000 |
| | | | | | | $ | 53,000,000 |
The convertible advance is at a fixed interest rate until September 11, 2010 at which time the FHLB has the option to convert to the variable interest rate and spread being offered at that time. The borrowings were collateralized by a blanket lien on the Company’s 1-4 family residential real estate loans, with carrying values of $24,880,576 and $20,299,138 as of December 31, 2007 and 2006, respectively, commercial real estate loans with carrying values of $49,983,230 and $10,202,536 as of December 31, 2007 and 2006, respectively, and investment securities with carrying values of $21,577,500 and $26,170,469 as of December 31, 2007 and 2006, respectively.
The Company files income tax returns in the U.S. federal jurisdiction and the state of Virginia. With few exceptions, the Company is no longer subject to U.S. federal, state and local income tax examinations by tax authorities for years prior to 2004. The Company adopted the provisions of FIN 48,Accounting for Uncertainty in Income Taxes, on January 1, 2007 with no impact on the financial statements.
The current and deferred components of income tax expense for the years ended December 31, 2007, 2006 and 2005 were as follows:
| | | | | | | | | | | | |
| | | 2007 | | | 2006 | | | 2005 | |
Current | | $ | 4,158,769 | | | $ | 3,496,887 | | | $ | 3,302,973 | |
Deferred | | | (568,202 | ) | | | (362,302 | ) | | | (432,982 | ) |
Provision for income taxes | | $ | 3,590,567 | | | $ | 3,134,585 | | | $ | 2,869,991 | |
| | |
| 2 0 0 7 A N N U A L R E P O R T | | 33 |
The provisions for income taxes for the years ended December 31, 2007, 2006 and 2005 differ from the amount computed by applying the statutory federal income tax rate to income before taxes due to the following:
| | | | | | | | | | | |
| | | 2007 | | | 2006 | | | 2005 |
Income taxes at statutory rates | | $ | 3,555,248 | | | $ | 3,117,842 | | | $ | 2,848,289 |
Increase (decrease) resulting from: | | | | | | | | | | | |
Nondeductible expenses | | | 40,910 | | | | 17,268 | | | | 20,382 |
Other | | | (5,591 | ) | | | (525 | ) | | | 1,320 |
Provision for income taxes | | $ | 3,590,567 | | | $ | 3,134,585 | | | $ | 2,869,991 |
Significant components of the Company’s deferred tax assets and liabilities as of December 31, 2007 and 2006 were as follows:
| | | | | | |
| | | 2007 | | 2006 |
Deferred tax assets: | | | | | | |
Allowance for loan losses | | $ | 1,437,909 | | $ | 1,089,508 |
Unrealized loss on securities available-for-sale | | | 108,472 | | | 227,387 |
Nonaccrual loan interest | | | 153,826 | | | 122,533 |
Rent payable | | | 185,674 | | | 179,408 |
Deferred directors’ fees | | | 161,260 | | | 107,834 |
Nonqualified deferred compensation | | | 1,439,681 | | | 1,248,619 |
Total deferred tax assets | | | 3,486,822 | | | 2,975,289 |
| | |
Defered tax liabilities: | | | | | | |
Depreciation | | | 766,321 | | | 679,898 |
Affiliate income | | | 62,097 | | | 86,274 |
Total deferred tax liabilities | | | 828,418 | | | 766,172 |
Net deferred tax asset | | $ | 2,658,404 | | $ | 2,209,117 |
| (8) | Financial Instruments with Off-Balance-Sheet Risk |
The Company is a party to financial instruments with off-balance-sheet risk in the normal course of business to meet the financing needs of its customers. These financial instruments include commitments to extend credit and standby letters of credit. These instruments involve, to varying degrees, elements of credit risk which have not been recognized in the consolidated balance sheets. The contract amount of these instruments reflects the extent of the Company’s involvement or “credit risk.”
The Company uses the same credit policies in making commitments and conditional obligations as it does for on-balance-sheet instruments. Contractual amounts at December 31, 2007 and 2006 were:
| | | | | | |
| | | 2007 | | 2006 |
Financial instruments whose contract amounts represent credit risk: | | | | | | |
Commitments to extend credit | | $ | 115,473,393 | | $ | 90,598,124 |
Standby letters of credit | | | 17,424,530 | | | 10,039,282 |
| | $ | 132,897,923 | | $ | 100,637,406 |
Commitments to extend credit are agreements to lend to a customer as long as there is no violation of any condition established in the contract. Commitments generally have fixed expiration dates or other termination clauses and may require payment of a fee. Since many of the commitments are expected to expire without being drawn upon, the total commitment amounts do not necessarily represent future cash requirements. The Company evaluates each customer’s creditworthiness on a case-by-case basis. The amount of collateral obtained, if deemed necessary by the Company upon extension of credit, is based on management’s credit evaluation of the counter party. Collateral held varies but may include accounts receivable, inventory, property, plant and equipment, income-producing commercial properties, and real estate.
Standby letters of credit are conditional commitments issued by the Company to guarantee the performance of the contractual obligation by a customer to a third party. The majority of these guarantees extend until satisfactory completion of the customer’s contractual obligation. Management does not anticipate any material losses will arise from additional funding of the aforementioned commitments or letters of credit.
| | |
| 34 | | H A M P T O N R O A D S B A N K S H A R E S , I N C . |
The Company has a defined contribution 401(k) plan. All employees who are 21 years of age and have completed one year of service are eligible to participate. Under the plan, participants may contribute up to 20% of their compensation, subject to statutory limitations. The Company matches 100% of the employees’ contributions up to 4% of salary. The Company may also make an additional discretionary contribution. Participants are fully vested in their contributions and the Company’s match immediately and become fully vested in the Company’s discretionary contributions after 3 years of service. The Company made discretionary contributions of $119,000, $119,000 and $196,000 for the years ended December 31, 2007, 2006 and 2005, respectively. The Company also made matching contributions of $202,307, $185,031 and $53,430 for the years ended December 31, 2007, 2006 and 2005, respectively. The Company offers its stock as an investment option under the 401(k) plan. The plan purchased 11,020, 11,333, and 8,952 shares at average prices of $12.45, $10.80, and $9.75 per share in 2007, 2006 and 2005, respectively.
| (10) | Supplemental Retirement Agreements and Executive Savings Plan |
The Company has entered into supplemental retirement agreements with several key officers. Under these agreements, all but one of the officers are each eligible to receive an annual benefit payable in fifteen installments each equal to $50,000 following the attainment of their Plan Retirement Date. The other officer is eligible to receive an annual benefit payable in fifteen installments each equal to 50% of his Benefit Computation Base following the attainment of his Plan Retirement Date. The Benefit Computation Base is calculated as the average compensation including bonuses from the Company over the three consecutive completed calendar years just prior to the year of retirement or termination. In connection with these agreements, the Company has purchased life insurance policies which name the Company as beneficiary. The total cash surrender value for these life insurance policies at December 31, 2007 and 2006 was $773,082 and $661,640, respectively, which is included in other assets. The Company recognizes expense each year related to these agreements based on the present value of the benefits expected to be provided to the employees and any beneficiaries. The change in benefit obligation and funded status for the years ended December 31, 2007, 2006 and 2005 was as follows:
| | | | | | | | | | | | |
| | | 2007 | | | 2006 | | | 2005 | |
Benefit obligation at beginning of year | | $ | 1,650,317 | | | $ | 1,124,635 | | | $ | 857,867 | |
Service cost | | | 387,239 | | | | 423,065 | | | | 224,495 | |
Interest cost | | | 115,023 | | | | 102,617 | | | | 42,273 | |
Benefit obligation at end of year | | | 2,152,579 | | | | 1,650,317 | | | | 1,124,635 | |
Fair value of plan assets | | | — | | | | — | | | | — | |
Funded status | | $ | (2,152,579 | ) | | $ | (1,650,317 | ) | | $ | (1,124,635 | ) |
The amounts recognized in the consolidated balance sheets as of December 31, 2007 and 2006 consisted of:
| | | | | | | | |
| | | 2007 | | | 2006 | |
Accrued benefit cost included in other liabilities | | $ | (2,152,579 | ) | | $ | (1,650,317 | ) |
The components of net periodic benefit cost for the years ended December 31, 2007, 2006 and 2005 consisted of:
| | | | | | | | | |
| | | 2007 | | 2006 | | 2005 |
Service cost | | $ | 387,239 | | $ | 423,065 | | $ | 224,495 |
Interest cost | | | 115,023 | | | 102,617 | | | 42,273 |
Net periodic benefit cost | | $ | 502,262 | | $ | 525,682 | | $ | 266,768 |
The weighted-average assumptions used to determine benefit obligations at December 31, 2007, 2006 and 2005, and to determine net periodic benefit cost for the years ended December 31, 2007, 2006 and 2005 were as follows:
| | | | | | | | | |
| | | 2007 | | | 2006 | | | 2005 | |
Discount rate | | 7.00 | % | | 7.00 | % | | 7.00 | % |
Rate of compensation increase | | 3.00 | % | | 3.00 | % | | 3.00 | % |
| | |
| 2 0 0 7 A N N U A L R E P O R T | | 35 |
The rate of compensation increase only applies to the one officer agreement with a Benefit Computation Base.
The Company does not expect to make contributions to fund the supplemental retirement agreements in 2008. As of December 31, 2007, the following benefit payments are expected to be paid over the next ten years:
| | | |
2008 | | $ | — |
2009 | | | — |
2010 | | | 330,569 |
2011 | | | 330,569 |
2012 | | | 330,569 |
2013 - 2017 | | | 1,652,845 |
| | $ | 2,644,552 |
In November 2006, the Company entered into retirement agreements with the Board of Directors. Directors are eligible for compensation under the plan upon the sixth anniversary of the participant’s first board meeting. Benefits are to be paid in monthly installments commencing at retirement and ending upon the death, disability, or upon mutual consent of both parties to the agreement. Under the plan, the participant’s continue to serve the Company after retirement by performing certain duties as outlined in the plan document. During 2007, the Company expensed $63,228 related to this plan.
The Company has implemented an Executive Savings Plan with certain officers whereby an initial contribution made by the officers will be matched each year by the Company as long as the officers’ employment continues. During 2006, participants were offered the election to use funds in the plan to purchase employer stock and become 100% vested in the plan. The employer stock purchased by the plan is held in a Rabbi Trust for the benefit of each individual participant. Contributions into the plan subsequent to this election may be used to purchase employer stock or may be placed in savings accounts for the benefit of each individual participant and earn interest at the highest rate currently being paid on a Company certificate of deposit. Company contributions to the Executive Savings Plan during 2007, 2006 and 2005 were $268,300, $217,000, and $123,771, respectively.
| (11) | Dividend Reinvestment and Optional Cash Purchase Plan |
The Company has a Dividend Reinvestment and Optional Cash Purchase Plan. The plan enables shareholders to receive cash payment or reinvest their dividends. The stock purchased through the plan directly from the Company, is valued at the weighted average sales price of the Company’s common stock in transactions occurring during the 60 calendar days immediately prior to the purchase date. The purchase price of shares purchased on the open market is the actual current market price of the shares purchased on the applicable purchase dates.
| | |
| 36 | | H A M P T O N R O A D S B A N K S H A R E S , I N C . |
| (12) | Director and Employee Stock Compensation Plans |
During 2007, 2006 and 2005 the Company authorized the grant of options to employees and directors for 34,968, 210,131 and 135,096 shares, respectively, of the Company’s common stock under stock compensation plans that have been approved by the Company’s shareholders. All outstanding options granted previous to December 31, 2006 have 10-year terms and are fully vested and exercisable at the date of grant. The options granted on December 31, 2006 have 10-year terms and vest ratably over periods that range from 1 year to 5 years. Of the stock options granted during 2007, 14,968 have terms that range from 1 to 8 years and are fully vested and exercisable at the date of grant and 20,000 have 10-year terms and vest after 6 to 10 years of service. A summary of the Company’s stock option activity and related information is as follows:
| | | | | | |
| | | Options
Outstanding | | | Weighted Average
Exercise Price |
Balance at December 31, 2004 | | 994,786 | | | $ | 7.15 |
Granted | | 135,096 | | | | 10.47 |
Exercised | | (97,828 | ) | | | 5.63 |
Expired | | (7,495 | ) | | | 11.23 |
Balance at December 31, 2005 | | 1,024,559 | | | | 7.70 |
Granted | | 210,131 | | | | 11.93 |
Exercised | | (277,041 | ) | | | 5.80 |
Expired | | (27,679 | ) | | | 8.94 |
Balance at December 31, 2006 | | 929,970 | | | | 9.19 |
Granted | | 34,968 | | | | 12.91 |
Exercised | | (93,599 | ) | | | 7.55 |
Forfeited | | (10,992 | ) | | | 12.00 |
Expired | | (2,191 | ) | | | 10.85 |
Balance at December 31, 2007 | | 858,156 | | | $ | 9.48 |
In 2007 and 2006, 93,599 and 277,041 options were exercised, respectively; however, only 76,700 and 198,158 new shares, respectively, were issued since 16,899 and 78,883 shares, respectively, of previously acquired stock were used to exercise some of the options.
Information pertaining to fully vested options outstanding and exercisable as of December 31, 2007 was as follows:
| | | | | | | | | | |
Range of Exercise Prices | | Aggregate
Intrinsic Value | | Number of
Options | | Remaining
Contractual
Life (in years) | | Weighted Average
Exercise Price |
$ 3.750 - $ 4.000 | | $ | 398,877 | | 46,516 | | 3.81 | | $ | 3.98 |
4.375 - 5.900 | | | 302,117 | | 40,221 | | 2.88 | | | 5.05 |
6.530 - 8.770 | | | 1,273,646 | | 273,600 | | 4.23 | | | 7.90 |
9.750 - 11.800 | | | 575,451 | | 276,851 | | 5.95 | | | 10.48 |
12.000 - 14.030 | | | 13,095 | | 71,318 | | 8.16 | | | 12.38 |
$ 3.750 - $11.800 | | $ | 2,563,186 | | 708,506 | | 5.19 | | $ | 8.94 |
The weighted-average grant-date fair value of stock options granted during 2007, 2006 and 2005 was $2.34, $1.96, and $1.41, respectively. The total intrinsic value at grant date of stock options exercised during 2007, 2006 and 2005 was $141,284, $506,699, and $155,416, respectively. The Company has 2,288,741 shares available under shareholder approved stock incentive plans. As of December 31, 2007, there was $329,401 of unrecognized compensation cost related to non-vested stock options. That cost is expected to be recognized over a weighted average period of 4.06 years.
| | |
| 2 0 0 7 A N N U A L R E P O R T | | 37 |
As of December 31, 2007, the Company had granted non-vested shares to certain directors and employees as part of incentive programs and to those directors who elected to use deferred directors’ fees to purchase non-vested shares. Non-vested shares awarded to employees and directors as part of incentive programs have vesting schedules that range from four to nine years and are expensed over the same schedules. Non-vested shares issued to directors as a method of deferring their directors’ fees are expensed at the time the fees are earned by the director. A summary of the Company’s non-vested share activity and related information is as follows:
| | | | | |
| | | Number of
Shares | | Weighted Average
Grant Date
Fair Value |
Balance at December 31, 2004 | | — | | $ | — |
Granted | | 33,045 | | | 10.71 |
Vested | | 3,000 | | | 10.65 |
Balance at December 31, 2005 | | 30,045 | | | 10.71 |
Granted | | 20,131 | | | 10.81 |
Vested | | 3,000 | | | 10.65 |
Balance at December 31, 2006 | | 47,176 | | | 10.76 |
Granted | | 20,364 | | | 12.12 |
Vested | | 4,500 | | | 10.76 |
Forfeited | | 8,500 | | | 10.98 |
Balance at December 31, 2007 | | 54,540 | | $ | 11.23 |
As of December 31, 2007, there was $231,330 of total unrecognized compensation cost related to non-vested share awards. That cost is expected to be recognized over a weighted average period of 4.51 years. The total fair value of shares vested during the years ended December 31, 2007, 2006 and 2005 was $57,045, $36,000 and $31,950, respectively.
| (13) | Employment Agreements |
The Company has employment agreements with eleven officers. Two of the agreements expire in 2008, one expires in 2009, five expire in 2011, two expire in 2012, and one expires in 2013. The agreements will automatically renew at the end of their terms unless the officer is notified in writing. Among other things, the agreements provide for severance benefits payable to the officers upon termination of employment following a change of control in the Company.
A summary of other expenses for the years ended December 31, 2007, 2006 and 2005 is as follows:
| | | | | | | | | |
| | | 2007 | | 2006 | | 2005 |
Advertising and marketing | | $ | 325,792 | | $ | 481,398 | | $ | 304,089 |
Telephone and postage | | | 305,022 | | | 294,407 | | | 281,548 |
Professional | | | 278,717 | | | 366,683 | | | 379,853 |
Bank franchise tax | | | 463,900 | | | 279,754 | | | 251,332 |
Equipment | | | 343,010 | | | 304,140 | | | 205,437 |
ATM and VISA Check Card expense | | | 500,218 | | | 422,840 | | | 466,605 |
Director and regional board fees | | | 306,850 | | | 284,450 | | | 313,299 |
Other | | | 1,236,585 | | | 1,130,584 | | | 1,206,982 |
| | $ | 3,760,094 | | $ | 3,564,256 | | $ | 3,409,145 |
| (15) | Restrictions on Loans and Dividends from Subsidiaries |
Regulatory agencies place certain restrictions on dividends paid and loans or advances made by the Bank to the Company. The amount of dividends the Bank may pay to the Company, without prior approval, is limited to current year earnings plus retained net profits for the two preceding years. At December 31, 2007, the amount available was approximately $7.4 million. Loans and advances are limited to 10% of the Bank’s common stock and capital surplus. As of December 31, 2007, funds available for loans or advances by the Bank to the Company were approximately $7.1 million.
| (16) | Regulatory Capital Requirements |
Under capital adequacy guidelines and the regulatory framework for prompt corrective action, the Company and the Bank must meet specific capital guidelines that involve quantitative measures of their assets, liabilities, and certain off-balance-sheet items as
| | |
| 38 | | H A M P T O N R O A D S B A N K S H A R E S , I N C . |
calculated under regulatory accounting practices. Failure to meet minimum capital requirements can initiate certain mandatory, and possibly additional discretionary, actions by regulators that, if undertaken, could have a direct material effect on the Company’s financial statements. The Company’s and the Bank’s capital amounts and classification are subject to qualitative judgments by the regulators about components, risk weightings, and other factors. Prompt corrective action provisions are not applicable to bank holding companies. Management believes that, as of December 31, 2007, the Company and the Bank meet all capital adequacy requirements to which they are subject.
As of December 31, 2007, the most recent notification from the FRB categorized the Company and the Bank as well-capitalized under the regulatory framework for prompt corrective action. To be categorized as well-capitalized, minimum amounts and ratios, as set forth in the table that follows, must be maintained. There are no conditions or events since that notification that management believes have changed the Company’s or Bank’s category.
A summary of the Company’s and the Bank’s required and actual capital components follows:
| | | | | | | | | | | | | | | | | | |
| | | Actual | | | For Capital
Adequacy Purposes | | | To Be Well-Capitalized
Under Prompt Action
Provisions | |
| (in thousands) | | Amount | | Ratio | | | Amount | | Ratio | | | Amount | | Ratio | |
As of December 31, 2007 | | | | | | | | | | | | | | | | | | |
Tier 1 Capital: | | | | | | | | | | | | | | | | | | |
Consolidated Company | | $ | 73,610 | | 14.58 | % | | $ | 20,195 | | 4.00 | % | | | N/A | | N/A | |
Bank | | | 71,349 | | 14.17 | | | | 20,147 | | 4.00 | | | $ | 30,220 | | 6.00 | % |
Total Risk-Based Capital: | | | | | | | | | | | | | | | | | | |
Consolidated Company | | | 78,653 | | 15.58 | | | | 40,389 | | 8.00 | | | | N/A | | N/A | |
Bank | | | 76,392 | | 15.17 | | | | 40,293 | | 8.00 | | | | 50,367 | | 10.00 | |
Leverage Ratio: | | | | | | | | | | | | | | | | | | |
Consolidated Company | | | 73,610 | | 13.44 | | | | 21,908 | | 4.00 | | | | N/A | | N/A | |
Bank | | | 71,349 | | 13.05 | | | | 21,863 | | 4.00 | | | | 27,329 | | 5.00 | |
| | | | | | |
As of December 31, 2006 | | | | | | | | | | | | | | | | | | |
Tier 1 Capital: | | | | | | | | | | | | | | | | | | |
Consolidated Company | | $ | 70,604 | | 17.47 | % | | $ | 16,166 | | 4.00 | % | | | N/A | | N/A | |
Bank | | | 68,639 | | 17.04 | | | | 16,114 | | 4.00 | | | $ | 24,171 | | 6.00 | % |
Total Risk-Based Capital: | | | | | | | | | | | | | | | | | | |
Consolidated Company | | | 74,515 | | 18.44 | | | | 32,332 | | 8.00 | | | | N/A | | N/A | |
Bank | | | 72,550 | | 18.01 | | | | 32,228 | | 8.00 | | | | 40,285 | | 10.00 | |
Leverage Ratio: | | | | | | | | | | | | | | | | | | |
Consolidated Company | | | 70,604 | | 15.11 | | | | 18,693 | | 4.00 | | | | N/A | | N/A | |
Bank | | | 68,639 | | 14.69 | | | | 18,693 | | 4.00 | | | | 23,366 | | 5.00 | |
| (17) | Disclosures About Fair Value of Financial Instruments |
SFAS No. 107,Disclosures About Fair Value of Financial Instruments, requires disclosure of fair value information about financial instruments, whether or not recognized in the balance sheet, for which it is practical to estimate that value. Fair value is best determined based upon quoted market prices, however, in many instances, there are no quoted market prices for the Company’s various financial instruments. In cases where quoted market prices are not available, fair values are based on estimates using present value or other valuation techniques. Those techniques are significantly affected by the assumptions used, including the discount rate and estimates of future cash flows. The derived fair value estimates cannot be substantiated by comparison to independent markets and, in many cases, could not be realized in immediate settlement of the instrument. SFAS No. 107 excludes certain financial instruments and all nonfinancial instruments from its disclosure requirements. Accordingly, the aggregate fair value amounts presented do not represent the underlying fair value of the Company.
The following methods and assumptions were used by the Company in estimating fair value for its financial instruments, as defined by SFAS No. 107:
| (a) | Cash and Cash Equivalents |
The carrying amount approximates fair value.
| | |
| 2 0 0 7 A N N U A L R E P O R T | | 39 |
| (b) | Investment Securities Available-for-Sale |
Fair values are based on published market prices or dealer quotes. Investment securities available-for-sale are carried at their aggregate fair value.
| (c) | Federal Home Loan Bank Stock and Federal Reserve Bank Stock |
The carrying amount approximates fair value.
For credit card and other loan receivables with short-term and/or variable characteristics, the carrying value approximates fair value. The fair value of other loans is estimated by discounting the future cash flows using interest rates currently being offered for loans with similar terms to borrowers of similar credit quality.
| (e) | Interest Receivable and Interest Payable |
The carrying amount approximates fair value.
The fair value of noninterest bearing deposits and deposits with no defined maturity, by SFAS No. 107 definition, is the amount payable on demand at the reporting date. The fair value of time deposits is estimated by discounting the future cash flows using the current rates at which similar deposits would be made.
The fair value of FHLB borrowings is estimated using discounted cash flow analysis based on the rates currently offered for borrowings of similar remaining maturities.
| (h) | Commitments to Extend Credit and Standby Letters of Credit |
The only amounts recorded for commitments to extend credit and standby letters of credit are the deferred fees arising from these unrecognized financial instruments. These deferred fees are not deemed significant at December 31, 2007 and 2006, and as such, the related fair values have not been estimated.
The estimated fair value of the Company’s financial instruments required to be disclosed under SFAS No. 107 at December 31, 2007 and 2006 were:
| | | | | | | | | | | | |
| | | 2007 | | 2006 |
| | | Carrying
Value | | Estimated
Fair Value | | Carrying
Value | | Estimated
Fair Value |
Assets: | | | | | | | | | | | | |
Cash and due from banks | | $ | 19,757,428 | | $ | 19,757,428 | | $ | 17,112,616 | | $ | 17,112,616 |
Overnight funds sold | | | 182,906 | | | 182,906 | | | 9,524,445 | | | 9,524,445 |
Interest-bearing deposits in other banks | | | 5,623,271 | | | 5,623,271 | | | 161,490 | | | 161,490 |
Federal Home Loan Bank stock | | | 3,330,000 | | | 3,330,000 | | | 2,597,900 | | | 2,597,900 |
Federal Reserve Bank stock | | | 1,374,000 | | | 1,374,000 | | | 1,377,350 | | | 1,377,350 |
Investment securities available-for-sale | | | 42,377,325 | | | 42,377,325 | | | 55,569,440 | | | 55,569,440 |
Loans | | | 477,149,232 | | | 474,507,569 | | | 375,044,161 | | | 370,790,572 |
Interest receivable | | | 2,431,347 | | | 2,431,347 | | | 2,281,945 | | | 2,281,945 |
| | | | |
Liabilities: | | | | | | | | | | | | |
Deposits | | | 431,456,747 | | | 431,326,893 | | | 363,261,329 | | | 365,171,331 |
Interest payable | | | 1,636,231 | | | 1,636,231 | | | 1,472,889 | | | 1,472,889 |
FHLB borrowings | | | 53,000,000 | | | 53,974,529 | | | 38,000,000 | | | 37,679,316 |
On January 22, 2008, the Company declared a cash dividend of $0.11 per share payable March 15, 2008, to shareholders of record on February 15, 2008.
On January 8, 2008, the Company entered into an Agreement with Shore Financial Corporation (“SFC”). The Agreement sets forth the terms and conditions of the Company’s acquisition of SFC through the merger of SFC with and into the Company (the “Merger”).
| | |
| 40 | | H A M P T O N R O A D S B A N K S H A R E S , I N C . |
Under the terms of the Agreement, the Company will issue to the shareholders of SFC, for each share of SFC’s stock that they own, 1.8 shares of the Company’s common stock or $22.00 in cash, subject to the limitation that no less than 55% and no more than 75% of the total consideration will be in the form of stock. Shareholders of SFC may elect to receive the Company’s common stock, cash, or a combination of common stock and cash for their shares of SFC’s common stock, subject to pro ration in the event that the aggregate stock elections are less than the 55% minimum or exceed the 75% maximum.
In addition, at the effective time of the Merger, each outstanding option to purchase shares of SFC’s common stock under any stock plans shall vest pursuant to its terms and shall be converted into an option to acquire the number of shares of the Company’s common stock equal to the number of shares of SFC’s common stock underlying the option multiplied by 1.8. The exercise price of each option will be adjusted accordingly.
Consummation of the Merger is subject to a number of customary conditions including the approval of the Merger by the Company’s and SFC’s shareholders and the receipt of all required regulatory approvals. The Merger is expected to be completed in the second quarter of 2008.
Pursuant to the Merger Agreement, either party may terminate the Merger in the event the Merger is not consummated by September 30, 2008. In addition, SFC may terminate the Merger in the event the average price of Company common stock (as defined in the Merger Agreement) is less than $9.50 per share and the Company may terminate the Merger in the event such average price is greater than $14.94 per share. The termination of the Merger Agreement will, in certain circumstances, obligate SFC to pay the Company a termination fee of $1.0 million to $2.4 million or the Company to pay SFC a termination fee of $1.0 million, depending on the triggering event.
| (19) | Condensed Parent Company Only Financial Statements |
The condensed financial position as of December 31, 2007 and 2006 and the condensed results of operations and cash flows for each of the years in the three-year period ended December 31, 2007, of Hampton Roads Bankshares, Inc., parent company only, are presented below.
Condensed Balance Sheets
| | | | | | | | |
| December 31, | | | | 2007 | | 2006 |
Assets: | | | | | | | | |
Cash on deposit with Bank | | | | $ | 1,048,155 | | $ | 548,133 |
Equity securities available-for-sale | | | | | 213,500 | | | 455,000 |
Investment in subsidiaries | | | | | 71,675,823 | | | 68,312,951 |
Investment in affiliates | | | | | 636,875 | | | 846,608 |
Other assets | | | | | 90,977 | | | 5,950 |
Total assets | | | | $ | 73,665,330 | | $ | 70,168,642 |
| | | |
Liabilities and Shareholders’ Equity: | | | | | | | | |
Other liabilities | | | | $ | 5,316 | | $ | 6,099 |
Shareholders’ equity | | | | | 73,660,014 | | | 70,162,543 |
Total liabilities and shareholders’ equity | | | | $ | 73,665,330 | | $ | 70,168,642 |
Condensed Statements of Income
| | | | | | | | | | | | |
| Years Ended December 31, | | 2007 | | | 2006 | | | 2005 | |
Income: | | | | | | | | | | | | |
Dividends from Bank | | $ | 4,420,287 | | | $ | 3,564,334 | | | $ | 2,907,586 | |
Income from affiliates | | | (8,630 | ) | | | 141,723 | | | | 77,906 | |
Interest income | | | — | | | | 16,849 | | | | 241,457 | |
Total income | | | 4,411,657 | | | | 3,722,906 | | | | 3,226,949 | |
| | | |
Expenses: | | | | | | | | | | | | |
Interest expense | | | — | | | | — | | | | 139,325 | |
Other expense | | | 271,458 | | | | 86,132 | | | | 40,890 | |
Total expense | | | 271,458 | | | | 86,132 | | | | 180,215 | |
Income before income taxes and equity in undistributed earnings of subsidiaries | | | 4,140,199 | | | | 3,636,774 | | | | 3,046,734 | |
Provision for income tax benefit (expense) | | | 95,230 | | | | (24,105 | ) | | | (49,312 | ) |
Equity in undistributed earnings of subsidiaries | | | 2,575,184 | | | | 2,422,870 | | | | 2,509,907 | |
Net income | | $ | 6,810,613 | | | $ | 6,035,539 | | | $ | 5,507,329 | |
| | |
| 2 0 0 7 A N N U A L R E P O R T | | 41 |
Condensed Statements of Cash Flows
| | | | | | | | | | | | |
| Years Ended December 31, | | 2007 | | | 2006 | | | 2005 | |
Operating Activities: | | | | | | | | | | | | |
Net income | | $ | 6,810,613 | | | $ | 6,035,539 | | | $ | 5,507,329 | |
Adjustments: | | | | | | | | | | | | |
Equity in undistributed earnings of subsidiaries | | | (2,575,184 | ) | | | (2,422,870 | ) | | | (2,509,907 | ) |
Stock-based compensation expense | | | 337,250 | | | | 179,811 | | | | 704,300 | |
Regional board fees | | | 23,990 | | | | 25,300 | | | | — | |
Change in other assets | | | 647,656 | | | | 216,581 | | | | (514,943 | ) |
Change in other liabilities | | | (783 | ) | | | (11,575 | ) | | | 95,595 | |
Net cash provided by operating activities | | | 5,243,542 | | | | 4,022,786 | | | | 3,282,374 | |
Investing Activities: | | | | | | | | | | | | |
Purchase of equity securities available-for-sale | | | — | | | | (472,500 | ) | | | — | |
Net (increase) decrease in loans | | | — | | | | 800,000 | | | | 4,999,375 | |
Investment in subsidiaries | | | (787,688 | ) | | | (22,365,797 | ) | | | — | |
Investment in affiliates | | | 209,733 | | | | (63,860 | ) | | | (96,059 | ) |
Net cash provided by (used in) investing activities | | | (577,955 | ) | | | (22,102,157 | ) | | | 4,903,316 | |
Financing Activities: | | | | | | | | | | | | |
Net increase (decrease) in borrowings | | | — | | | | — | | | | (3,800,000 | ) |
Issuance of shares in rights and public offering | | | — | | | | 20,156,280 | | | | — | |
Stock issuance costs | | | — | | | | (1,109,824 | ) | | | — | |
Common stock repurchased | | | (2,876,702 | ) | | | (3,424,628 | ) | | | (1,092,378 | ) |
Dividends paid, net | | | (2,165,790 | ) | | | (2,058,849 | ) | | | (1,108,055 | ) |
Excess tax benefit realized from stock options exercised | | | 118,171 | | | | 147,018 | | | | — | |
Proceeds from exercise of stock options | | | 476,066 | | | | 756,648 | | | | 408,452 | |
Issuance of shares to 401(k) plan | | | 137,199 | | | | 122,395 | | | | 87,284 | |
Issuance of shares to executive savings plan | | | 145,491 | | | | — | | | | — | |
Net cash provided by (used in) financing activities | | | (4,165,565 | ) | | | 14,589,040 | | | | (5,504,697 | ) |
Increase (decrease) in cash and cash equivalents | | | 500,022 | | | | (3,490,331 | ) | | | 2,680,993 | |
Cash and cash equivalents at beginning of year | | | 548,133 | | | | 4,038,464 | | | | 1,357,471 | |
Cash and cash equivalents at end of year | | $ | 1,048,155 | | | $ | 548,133 | | | $ | 4,038,464 | |
| (20) | Related Party Transactions |
The Company has a 19% interest in Tidewater Home Funding, LLC (“THF”). The Company accounts for this investment under the equity method. The Bank has established a warehouse credit facility for THF for up to $10,000,000. As of December 31, 2007 and 2006, THF had drawn $1,338,165 and $2,347,249 on this warehouse line of credit, at a variable rate of 7.25% and 8.25%, respectively.
The Company has an 11% ownership in Davenport Financial Fund, LLC. This investment is accounted for under the equity method.
The Company has a 4% ownership in BI in order to facilitate the sale of securities-related products and services to its customers and the general public. The Company accounts for this investment under the cost method. During 2007, BI agreed to be sold to Infinex. The sale transaction is expected to be completed in 2008.
Loans are made to the Company’s executive officers and directors and their associates during the ordinary course of business. In management’s opinion, these loans are made on substantially the same terms, including interest rates and collateral, as those prevailing at the time for comparable loans with other persons and do not involve more than normal risk of collectibility or present other unfavorable features. At December 31, 2007 and 2006, loans to executive officers, directors and their associates amounted to $26,671,391 and $22,547,499, respectively. During 2007, additional loans and repayments of loans by executive officers, directors and their associates were $13,121,763 and $8,997,872, respectively.
Deposits are taken from the Company’s executive officers and directors and their associates during the ordinary course of business. In management’s opinion, these deposits are taken on substantially the same terms, including interest rates, as those prevailing at the time for comparable deposits from other persons. At December 31, 2007, deposits from executive officers, directors and their associates amounted to $6,298,583.
| | |
| 42 | | H A M P T O N R O A D S B A N K S H A R E S , I N C . |
| (21) | Significant 2005 Adjustments |
In the fourth quarter of 2005, management in consultation with its external auditors, KPMG LLP (“KPMG”) determined that the Company had misapplied Accounting Principles Board Opinion No. 25,Accounting for Stock Issued to Employees(“APB No. 25”). The Company determined that Consolidated Financial Statements for the years 2003 and 2004 were impacted. The analysis concluded that the amount of the differences was not material to the Consolidated Financial Statements in either year, nor was it material on a cumulative basis in 2005. As a result, the Company in further consultation with KPMG, made adjustments to its Consolidated Financial Statements in the year ended December 31, 2005 to correct the previous misapplication. The adjustment related to 2003 and 2004 Consolidated Financial Statements had the effect of increasing stock-based compensation expense $318 thousand and, thus, decreasing net income $210 thousand after the related tax effect.
In addition to the above matter, management in consultation with KPMG determined that the Company misclassified the accrued compensation expense for unexercised stock options as a liability rather than as a component of shareholders’ equity in prior audited Consolidated Financial Statements. The misclassification, which was not material to the Company’s Consolidated Financial Statements, does not affect the reporting of total assets or the Company’s earnings in any period. An adjustment was made in the Company’s 2005 Consolidated Financial Statements in the amount of $1.20 million, which had the effect of reducing liabilities and increasing shareholders’ equity by that amount. The net effect of the reclassification adjustment and the change in methodology for measuring compensation expense for stock options was an increase in shareholders’ equity of $1.52 million, or $0.18 in book value per share.
| (22) | Quarterly Financial Data (Unaudited) |
Summarized unaudited quarterly financial data for the years ended December 31, 2007 and 2006 is as follows:
| | | | | | | | | | | | |
| | | 2007 |
| | | Fourth | | Third | | Second | | First |
Interest income | | $ | 9,999,398 | | $ | 9,941,054 | | $ | 9,519,092 | | $ | 8,743,551 |
Interest expense | | | 3,891,284 | | | 3,635,371 | | | 3,399,088 | | | 3,089,950 |
Net interest income | | | 6,108,114 | | | 6,305,683 | | | 6,120,004 | | | 5,653,601 |
Provision for loan losses | | | 494,000 | | | 270,000 | | | 246,000 | | | 222,000 |
Noninterest income | | | 862,584 | | | 824,045 | | | 829,616 | | | 923,976 |
Noninterest expense | | | 3,824,553 | | | 4,053,021 | | | 4,082,991 | | | 4,033,878 |
Income before provision for income taxes | | | 2,652,145 | | | 2,806,707 | | | 2,620,629 | | | 2,321,699 |
Provision for income taxes | | | 939,038 | | | 970,214 | | | 891,938 | | | 789,377 |
Net income | | $ | 1,713,107 | | $ | 1,836,493 | | $ | 1,728,691 | | $ | 1,532,322 |
Basic earnings per share | | $ | 0.17 | | $ | 0.18 | | $ | 0.17 | | $ | 0.15 |
Diluted earnings per share | | $ | 0.16 | | $ | 0.17 | | $ | 0.17 | | $ | 0.15 |
| | | | | | | | | | | | |
| | | 2006 |
| | | Fourth | | Third | | Second | | First |
Interest income | | $ | 8,448,531 | | $ | 7,906,899 | | $ | 7,149,441 | | $ | 6,516,400 |
Interest expense | | | 2,896,191 | | | 2,560,813 | | | 1,951,543 | | | 1,714,738 |
Net interest income | | | 5,552,340 | | | 5,346,086 | | | 5,197,898 | | | 4,801,662 |
Provision for loan losses | | | 90,000 | | | 90,000 | | | — | | | — |
Noninterest income | | | 830,016 | | | 853,808 | | | 799,597 | | | 914,458 |
Noninterest expense | | | 3,830,364 | | | 3,800,453 | | | 3,604,487 | | | 3,710,437 |
Income before provision for income taxes | | | 2,461,992 | | | 2,309,441 | | | 2,393,008 | | | 2,005,683 |
Provision for income taxes | | | 840,019 | | | 789,886 | | | 818,898 | | | 685,782 |
Net income | | $ | 1,621,973 | | $ | 1,519,555 | | $ | 1,574,110 | | $ | 1,319,901 |
Basic earnings per share | | $ | 0.16 | | $ | 0.16 | | $ | 0.18 | | $ | 0.16 |
Diluted earnings per share | | $ | 0.16 | | $ | 0.16 | | $ | 0.17 | | $ | 0.16 |
| | |
| 2 0 0 7 A N N U A L R E P O R T | | 43 |
REGIONAL BOARD MEMBERS
| | |
Chesapeake/Suffolk Robert G. Bagley Retired, Bank of Hampton Roads Joseph P. Barreca, MD Retired Vascular Surgeon Phil L. Black Century 21 First Colony Realty The Honorable Harry B. Blevins State Senator James S. Creekmore Creekmore Hardware William B. Cross Ashdon Builders, Inc. Durwood S. Curling Retired Executive Director Southeastern Public Service Authority Christopher H. Falk Attorney at Law Rodney L. Foster Rodney Foster Construction Jack W. Gibson Hampton Roads Bankshares, Inc. Erik P. Gordon Attorney at Law Charles G. Hackworth Sr. Hackworth Reprographics, Inc. Martin W. Holton Forrest Septic Tank Contractors, Inc. H. Lynn Keffer Crossroads Fuel, Inc. Robert R. Kinser Basnight, Kinser, Telfeyan, Leftwich & Nuckolls, P.C. Garnett W. Lane Cutting Edge Watersports, Inc. Patricia S. Lawrence Lawrence Pharmacy, Inc. Robert G. MacDonald MacDonald, Plumlee & Overton Richard H. Matthews Pender & Coward, P.C. Thomas F. May Vexon Chemicals, Inc. Rev. James W. McNeil McNeil Bus Service Davis R. Mellott Southeastern Equipment Corporation Philip V. Miller Virginia Door, Inc. Herbert Mitchell Jr. Mitchell’s Complete Upholstery, Inc. JoAnn H. Nesson John C. Holland Enterprises John R. Newhart Sheriff, City of Chesapeake | | Hugo A. Owens Jr. The Nia Corp. Roderick L. Pierce Retired, Bank of Hampton Roads Jeffrey P. Powell MD, DDS Chesapeake Ear, Nose & Throat Associates, P.C. Richard G. Pretlow Pretlow & Sons Funeral Home Bobby L. Ralph Former Director of Social Services, City of Suffolk Robert C. Rhoads Hoffman Industries, Inc. Adrian T. Robertson Allied Concrete Products, LLC Clay Robertson Robertson Insurance Agency / WBR Insurance Agency Willard F. Robins III Willard F. Robins, III, CPA, PC Judson H. Rodman Rodman’s Bar-B-Que James R. Rountree Rountree Construction Co., Inc. James F. Russell Sr. Supreme Petroleum, Inc./ Holiday Foods/Holiday Ice, Inc. R. Curtis Saunders Jr. Vico Construction Corporation David L. Schloff Great Bridge Servicenter, LLC J. Wayne Scott Frank E. Sheffer & Co. Clifton D. Sipe Atlantic Coastal Clearing & Grading, Inc. Roland Carroll Smith Sr. Hearndon Construction Corp. Robert B. Speight Greenway Farms, Ltd. Elizabeth F. St. John First District Court Service Unit, City of Chesapeake Gayle F. Upchurch Civic Leader Jeffrey A. Valentine Valentine & Bruns, Inc. Emil A. Viola Vico Construction Corporation Pat E. Viola Vico Construction Corporation Patricia C. Whitehurst Civic Leader Gilbert J. Wirth Jr. Prentis, LLC Constantine L. Zinovis Restauranteur |
| | |
Virginia Beach Eric C. Anderson Lakeside Construction Corporation E. Lee Boyce III Boyce-Widener, Ltd. B. G. Campbell Community Group, Inc. William N. Dozier Dozier Tire and Auto Center Jack W. Gibson Hampton Roads Bankshares, Inc. Izaak D. Glasser Glasser & Macon, P.C. Douglas J. Glenn Hampton Roads Bankshares, Inc. Stephen M. Gunther Attorney & Counselor at Law Herman A. Hall III Hallmark Development, LLC John Katsias Katsias Company David E. Kellam Kellam & Eaton, Inc. Pete O. Kotarides The Kotarides Companies James W. Lam Attorney & Counselor at Law Michael A. Leanzo Mid-Atlantic Coatings, Inc. James D. Marx Broadbay Cotton Gary L. Minson 1-800 SKILLED.COM Townsend Oast Retired Past President of Virginia Bankers Association Robert L. Samuel Jr. Williams Mullen Norris W. Shirley Retired Farmer Kenneth R. Sims Custom Stone Company, Inc. Kevin R. Sims Custom Stone Company, Inc. Cynthia W. Snyman Slip-Free Systems of Virginia Leo Thomas Ron Zoby Tours Jeffrey M. Tourault Atlantic Foundations, Inc. Robert A. Widener Ainslie-Widener, Inc. Benjamin J. Willis III Willis Furniture Company, Inc. Patricia M. Windsor Retired, Lakeside Construction Corporation | | Norfolk Warren L. Aleck Retired President, Great Bridge Foods, Inc. t/a Earle’s Markets G. Ray Bunch Jr. Budget Rent A Car Stuart H. Buxbaum S&E Builders Elaine Czohara Adams Outdoor Advertising Edward A. Fiorella Norfolk Sheriff’s Office Leigh Anne Folkes Hassell & Folkes, P.C. Jack W. Gibson Hampton Roads Bankshares, Inc. Robert A. Goldwasser Sysco Foods of Hampton Roads L. Steve Gossett Virginia Auto Rental, Inc. Donald M. Koble Virginia Auto Rental, Inc. Robert J. McCabe Sheriff, City of Norfolk Yale Nesson AARD Screenprinters & Embroidery Robert H. Powell III Kaufman & Canoles, P.C. Robert F. Sharak Hampton Roads Partnership Jordan E. Slone Harbor Group International Donald Stakes Discount Plumbing, Inc. George Stenke Investor Jonathon L. Thornton Pierce & Thornton, PLC Neal S. Windley Habitat for Humanity W. Lewis Witt Inner-View, Ltd. W. Randy Wright Randy Wright’s Printing Robert L. Young Ryan Enterprises, Inc. Michael P. Zarpas Global Real Estate Investment |
| | |
| 44 | | H A M P T O N R O A D S B A N K S H A R E S , I N C . |
SHAREHOLDER INFORMATION
Board of Directors
Emil A. Viola
Chairman of the Board
Treasurer, Vico Construction
Corporation
Jack W. Gibson
President and Chief Executive
Officer, Hampton Roads
Bankshares, Inc.
Douglas J. Glenn
Executive Vice President and
General Counsel, Hampton Roads
Bankshares, Inc.
Herman A. Hall, III
Managing Member,
Hallmark Development, LLC
Robert R. Kinser
Attorney at Law,
Basnight, Kinser, Telfeyan,
Leftwich & Nuckolls, P.C.
Bobby L. Ralph
Former Director of Social Services,
City of Suffolk
Jordan E. Slone
Chairman and Chief Executive Officer,
Harbor Group International
Roland Carroll Smith, Sr.
President and Chief Executive Officer,
Hearndon Construction Corporation
Patricia M. Windsor
Retired, Secretary-Treasurer,
Lakeside Construction
Corporation
W. Lewis Witt
Owner,
Inner-View, Ltd.
Executive Officers
Jack W. Gibson
President and
Chief Executive Officer
Julie R. Anderson
Executive Vice President and
Chief Credit Officer
Donald W. Fulton, Jr.
Senior Vice President and
Chief Financial Officer
Douglas J. Glenn
Executive Vice President and
General Counsel
Tiffany K. Glenn
Senior Vice President,
Marketing Officer and
Corporate Secretary
Gregory P. Marshall
Executive Vice President and
Commercial Loan Officer
Reneé R. McKinney
Senior Vice President and
Branch Administrator
FINANCIAL INFORMATION
Shareholders, analysts and investors seeking financial information about the Company, including copies of Form 10-K filed with the Securities and Exchange Commission, may contact:
Donald W. Fulton, Jr.
Senior Vice President and Chief Financial Officer
Hampton Roads Bankshares, Inc.
999 Waterside Drive, Suite 200
Norfolk, VA 23510
(757) 217-1000
STOCK INFORMATION
The Company’s common stock trades under the symbol “HMPR” on the NASDAQ Global Select Market. Stock inquiries should be directed to:
Transfer Agent
Registrar and Transfer Company
10 Commerce Drive
Cranford, NJ 07016
1-800-368-5948
MARKET MAKERS
Archipelago Stock Exchange
Automated Trading Desk Financial
Services, LLC
Carr Securities Corp.
Citadel Derivatives Group LLC Citigroup Global Markets Inc.
Domestic Securities, Inc.
E* Trade Capital Markets LLC
Ferris, Baker Watts Inc.
Fig Partners, LLC
Hudson Securities, Inc.
Keefe, Bruyette & Woods, Inc.
Knight Equity Markets, L.P.
McAdams Wright Ragen Inc.
McKinnon & Company, Inc.
Monroe Securities Inc.
Morgan, Keegan & Company, Inc.
Nasdaq Execution Services
National Stock Exchange
Scott & Stringfellow, Inc.
Seaboard Securities, Inc.
Stifel, Nicolaus & Company, Inc.
UBS Securities LLC
Wedbush Morgan Securities Inc.

WEB SITE ADDRESS www.bankofhamptonroads.com

999 Waterside Drive, Suite 200 • Norfolk, Virginia 23510 • 757.217.1000
www.bankofhamptonroads.com