UNITED STATES
SECURITIES AND EXCHANGE COMMISSION
Washington, D.C. 20549
Form 10-K
(Mark One)
| þ | ANNUAL REPORT PURSUANT TO SECTION 13 OR 15(d) OF THE SECURITIES EXCHANGE ACT OF 1934 |
For the fiscal year ended December 31, 2008
or
| ¨ | TRANSITION REPORT PURSUANT TO SECTION 13 OR 15(d) OF THE SECURITIES EXCHANGE ACT OF 1934 |
(No Fee Required)
Commission file number 000-32915
EvergreenBancorp, Inc.
(Exact name of Registrant as specified in its Charter)
| | |
| Washington | | 91-2097262 |
(State or Other Jurisdiction of Incorporation or Organization) | | (I.R.S. Employer Identification Number) |
| |
1111 Third Avenue, Suite 2100 Seattle, Washington | | 98101 |
| (Address of Principal Executive Offices) | | (ZIP Code) |
Registrant’s telephone number, including area code:
(206) 628-4250
Securities registered pursuant to Section 12(b) of the Act:
None
Securities registered pursuant to Section 12(g) of the Act:
Common Stock, no par value per share
Indicate by checkmark if the Registrant is a well-known seasoned issuer, as defined in Rule 405 of the Securities Act. Yes ¨ No þ
Indicate by checkmark if the Registrant is not required to file reports pursuant to Section 13 or Section 15(d) of the Act. Yes ¨ No þ
Indicate by checkmark whether the Registrant: (1) has filed all reports required to be filed by Section 13 or 15(d) of the Securities Exchange Act of 1934 during the preceding twelve months (or for such shorter period that the Registrant was required to file such reports), and (2) has been subject to such requirements for the past 90 days. Yes þ No ¨
Indicate by checkmark if disclosure of delinquent filers pursuant to Item 405 of Regulation S-K (§229.405) is not contained herein, and will not be contained, to the best of Registrant’s knowledge, in definitive proxy or information statements incorporated by reference in Part III of this Form 10-K or any amendment to this Form 10-K. ¨
Indicate by checkmark whether the registrant is a large accelerated filer, an accelerated filer, or a non-accelerated filer.
Large accelerated filer ¨ Accelerated filer ¨ Non-accelerated filer ¨ Smaller reporting company þ
Indicate by checkmark whether the Registrant is a shell company (as defined in Rule 12b-2 of the Act). Yes ¨ No þ
The aggregate market value of the voting common equity held by non-affiliates, based on the closing price as quoted on the OTC Bulletin Board at June 30, 2008 (the last business day of the most recent second fiscal quarter), was $24,544,658.
The number of shares outstanding of the registrant’s no par value common stock as of March 30, 2009 was 2,544,819 shares.
DOCUMENTS INCORPORATED BY REFERENCE
Designated portions of the Proxy Statement for the 2009 Annual Meeting of Shareholders (Part III, Items 10-14).
EVERGREENBANCORP, INC.
FORM 10-K
ANNUAL REPORT
TABLE OF CONTENTS
2
Forward Looking Statements
This Annual Report and Form 10-K may contain forward-looking statements within the meaning of the Private Securities Litigation Reform Act of 1995. These forward-looking statements include, but are not limited to, statements about management’s plans, objectives, expectations and intentions that are not historical facts, and other statements identified by words such as “expects,” “anticipates,” “intends,” “plans,” “believes,” “should,” “projects,” “seeks,” “estimates” or words of similar meaning. These forward-looking statements are based on current beliefs and expectations of management and are inherently subject to significant business, economic and competitive uncertainties and contingencies, many of which are beyond Bancorp’s control. In addition, these forward-looking statements are subject to assumptions with respect to future business strategies and decisions that are subject to change. The following factors, among others, could cause actual results to differ materially from the anticipated results or other expectations in the forward-looking statements, including those set forth in this Annual Report and Form 10-K, or the documents incorporated by reference:
| | • | | the risks associated with lending and potential adverse changes in credit quality; |
| | • | | increased loan delinquency rates; |
| | • | | the risks presented by a continued economic slowdown, which could adversely affect credit quality, loan collateral values, investment values, liquidity levels, and loan originations; |
| | • | | changes in market interest rates, which could adversely affect our net interest income and profitability; |
| | • | | legislative or regulatory changes that adversely affect our business or our ability to complete pending or prospective future acquisitions; |
| | • | | reduced demand for banking products and services; |
| | • | | competition from other financial services companies in our markets; and |
| | • | | Bancorp’s success in managing risks involved in the foregoing. |
Additional factors that could cause actual results to differ materially from those expressed in the forward-looking statements are discussed in Risk Factors in Item 1A. Please take into account that forward-looking statements speak only as of the date of this Annual Report and Form 10K or documents incorporated by reference. Bancorp does not undertake any obligation to publicly correct or update any forward-looking statement if we later become aware that it is not likely to be achieved.
Further information concerning the Company and its business, including additional factors that could materially affect its financial results, is included in the Company’s filings with the Securities and Exchange Commission. Reports and additional information, including Company press releases, can be found on the Bancorp’s website at www.EvergreenBancorp.com.
3
PART I
EvergreenBancorp, Inc.
EvergreenBancorp, Inc. (“Bancorp” or the “Company”) is a bank holding company organized under the laws of the State of Washington. Bancorp was formed in 2001 pursuant to the reorganization of EvergreenBank (“the Bank”), whereby the Bank became a wholly owned subsidiary of Bancorp. This tax-free reorganization resulted in a share-for-share exchange of stock whereby stockholders of the Bank became stockholders of Bancorp. The bank holding company structure provides flexibility for financing and growth, as well as for acquiring or establishing other banking operations or businesses related to banking. For example, in November 2006 and April 2007, Bancorp formed EvergreenBancorp Statutory Trust II (“Trust II”) and EvergreenBancorp Statutory Trust III (“Trust III”), respectively, to raise capital through trust preferred securities offerings. This could not have been accomplished without the bank holding company structure. Bancorp and Bank are collectively referred to herein as “the Company.” The terms “we,” “us,” and “our” refer to Bancorp, Bank, Trust II, or Trust III where applicable.
The Company remains committed to community banking and intends to remain community-focused. In 2008,the Bank continued to conduct its banking business in substantially the same manner as in prior years. The Board’s philosophies and overall structure remain unchanged.
The Company’s consolidated net loss for 2008 was $4,211,000, or $(1.67) per basic share, and its consolidated equity at December 31, 2008 was $21,050,000, with 2,544,819 common shares outstanding and a book value of $8.27 per share. At December 31, 2008, the Company had total consolidated assets of approximately $461,618,000, loans of approximately $422,671,000, and deposits of approximately $358,890,000. For more information regarding the Company’s financial results, see “Management’s Discussion and Analysis of Financial Condition and Results of Operations” and “Financial Statements and Supplementary Data” of this 10-K report.
EvergreenBank
EvergreenBank is a Washington chartered commercial bank organized in 1971 under the name Teachers State Bank. Initially, the primary business focus of the Bank was offering products and services to credit unions and their members. Over the years, the focus of the Bank gradually evolved to offering products and services more typical of those offered by a traditional community bank—consumer and commercial lending and deposits. To reflect this, and to clarify for potential customers that the Bank’s products and services were not limited to “teachers,” the Bank changed its name in 1980 to “EvergreenBank.” Since 1993, the Bank has opened six additional offices located in Lynnwood, Bellevue, Federal Way, Kent and Seattle. The Bank now focuses on general commercial banking business, offering commercial banking services to small and medium-sized businesses, professionals, and retail customers in its market area.
Market
The Bank’s primary market area consists of King, Pierce, and Snohomish counties in western Washington. The Bank began its operations in 1971 from its Eastlake office location in Seattle and has since expanded its market with the addition of six offices since 1993 within a 25-mile radius of Seattle.
Deposit accounts include certificates of deposit, individual retirement accounts and other time deposits, checking and other demand deposit accounts, interest-bearing checking accounts, savings accounts, health savings accounts, and money market accounts. Loans include commercial, real estate construction and development, installment and consumer loans, and residential real estate. Other products and services include merchant credit card processing, cash management services, remote deposit capture, electronic funds transfers,
4
and electronic tax payment. The Bank also offers Internet banking and bill paying services, an ATM network, as well as 24-hour telephone banking.
Competition
Commercial banking in the state of Washington is highly competitive with respect to providing banking services, including making loans and attracting deposits. The Bank competes with other banks, as well as with savings and loan associations, savings banks, credit unions, mortgage companies, investment banks, insurance companies, securities brokerages, and other financial institutions. Banking in Washington is dominated by several large banking institutions, including U.S. Bank, Wells Fargo Bank, Key Bank, JP Morgan Chase Bank, and Bank of America, which together account for more than half of the total commercial and savings bank deposits in Washington. Certain of these competitors may not be subject to the same regulations as the Bank and may have significantly greater financial resources, a greater number of branch locations (with statewide branch networks), higher lending limits, and a variety of services not offered by the Bank. In addition, the Bank has experienced competition for both deposits and loans from “non-bank” financial service providers, such as brokerage firms, captive automobile financing and equipment leasing companies.
In general, the financial services industry has experienced widespread consolidation in recent years. The Company anticipates that consolidation among financial institutions in its market area will continue. Other financial institutions, many with substantially greater resources, compete in the acquisition market against the Company. Some of these institutions, among other items, have greater access to capital markets, larger cash reserves, and shares with greater liquidity than those of the Company. Additionally, the rapid adoption of financial services through the Internet has reduced the barrier to entry by financial services providers physically located outside our market area. Although the Company has been able to compete effectively in the financial services business in its markets to date, there can be no assurance that it will be able to continue to do so in the future.
Employees
On December 31, 2008, the Bank employed 85 full-time employees and 5 part time employees. Employees are not represented by any collective bargaining agreement. Management considers its relations with employees to be good.
EvergreenBancorp Statutory Trusts
Trust II. In November 2006, Bancorp completed an issuance of $7 million in trust preferred securities through a newly formed special purpose business trust, EvergreenBancorp Statutory Trust II (“Trust II”) formed under the laws of the State of Connecticut. The securities were sold in a private placement pursuant to an exemption from registration under the Securities Act of 1933, as amended.
Under the terms of the transaction, the trust preferred securities have a maturity of 30 years and the holders are entitled to receive cumulative cash distributions on a quarterly basis at a variable annual rate, reset quarterly, equal to the three month LIBOR plus 1.70 percent. The dividends may be deferred for up to 20 consecutive quarters. The securities are not redeemable until 2011 except in the event of certain special redemption events. The proceeds from the sale of the securities were contributed to the Bank as Tier 1 capital to support lending and other operations.
Trust III. In April 2007, Bancorp completed an issuance of $5 million in trust preferred securities through a newly formed special purpose business trust, EvergreenBancorp Statutory Trust III (“Trust III”), a statutory trust formed under the laws of the State of Delaware. The securities were sold in a private placement pursuant to an exemption from registration under the Securities Act of 1933, as amended.
5
Under the terms of the transaction, the trust preferred securities have a maturity of 30 years and the holders are entitled to receive cumulative cash distributions on a quarterly basis at a variable annual rate, reset quarterly, equal to the three month LIBOR plus 1.65 percent. The dividends may be deferred for up to 20 consecutive quarters. The securities are not redeemable until 2012 except in the event of certain special redemption events. In July of 2007, the Company used the net proceeds from the trust preferred issuance to call $5 million of trust preferred securities issued in May 2002 and concurrently redeemed related trust preferred securities issued to the public.
On December 22, 2008, the Bank entered into a Supervisory Directive (“Directive”) with the Washington State Department of Financial Institutions (“DFI”), and on January 22, 2009, Bancorp entered into a Memorandum of Understanding (“MOU”) with the Federal Reserve Bank (“FRB”). The Directive and the MOU restrict the payment of dividends to the holders of the trust preferred securities under the statutory trusts (Trust II and Trust III) as required under the respective agreements. Bancorp has given the requisite notice to the holders of the trust preferred securities that it must defer any future interest payments until such time as it is in compliance with regulatory requirements and no longer subject to the restrictions of the regulatory agreements.
SUPERVISION AND REGULATION
General
The following discussion describes elements of the extensive regulatory framework applicable to the Company and the Bank. This regulatory framework is primarily designed for the protection of depositors, federal deposit insurance funds and the banking system as a whole, rather than specifically for the protection of shareholders. Due to the breadth of this regulatory framework, our costs of compliance continue to increase in order to monitor and satisfy these requirements.
To the extent that this section describes statutory and regulatory provisions, it is qualified in its entirety by reference to those provisions. These statutes and regulations, as well as related policies, are subject to change by Congress, state legislatures and federal and state regulators. Changes in statutes, regulations or regulatory policies applicable to us, including interpretation or implementation thereof, could have a material effect on our business or operations.
Federal Bank Holding Company Regulation
General. The Company is a bank holding company as defined in the Bank Holding Company Act of 1956, as amended (“BHCA”), and is therefore subject to regulation, supervision and examination by the FRB. In general, the BHCA limits the business of bank holding companies to owning or controlling banks and engaging in other activities closely related to banking. The Company must also file reports with and provide the Federal Reserve with such additional information as it may require. Under the Financial Services Modernization Act of 1999, a bank holding company may apply to the Federal Reserve to become a financial holding company, and thereby engage (directly or through a subsidiary) in certain expanded activities deemed financial in nature, such as securities brokerage and insurance underwriting.
Holding Company Bank Ownership. The BHCA requires every bank holding company to obtain the prior approval of the Federal Reserve before (i) acquiring, directly or indirectly, ownership or control of any voting shares of another bank or bank holding company if, after such acquisition, it would own or control more than 5 percent of such shares; (ii) acquiring all or substantially all of the assets of another bank or bank holding company; or (iii) merging or consolidating with another bank holding company.
Holding Company Control of Nonbanks. With some exceptions, the BHCA also prohibits a bank holding company from acquiring or retaining direct or indirect ownership or control of more than 5 percent of the voting shares of any company which is not a bank or bank holding company, or from engaging directly or indirectly in
6
activities other than those of banking, managing or controlling banks or providing services for its subsidiaries. The principal exceptions to these prohibitions involve certain non-bank activities which, by statute or by Federal Reserve regulation or order, have been identified as activities closely related to the business of banking or of managing or controlling banks.
Transactions with Affiliates. Subsidiary banks of a bank holding company are subject to restrictions imposed by the Federal Reserve Act on extensions of credit to the holding company or its subsidiaries, on investments in their securities, and on the use of their securities as collateral for loans to any borrower. These regulations and restrictions may limit the Company’s ability to obtain funds from the Bank for its cash needs, including funds for payment of dividends, interest and operational expenses.
Tying Arrangements. We are prohibited from engaging in certain tie-in arrangements in connection with any extension of credit, sale or lease of property or furnishing of services. For example, with certain exceptions, neither the Company nor the Bank may condition an extension of credit to a customer on either (i) a requirement that the customer obtain additional services provided by us; or (ii) an agreement by the customer to refrain from obtaining other services from a competitor.
Support of Subsidiary Banks. Under Federal Reserve policy, the Company is expected to act as a source of financial and managerial strength to the Bank. This means that the Company is required to commit, as necessary, resources to support the Bank. Any capital loans a bank holding company makes to its subsidiary banks are subordinate to deposits and to certain other indebtedness of those subsidiary banks.
State Law Restrictions. As a Washington corporation, the Company is subject to certain limitations and restrictions under applicable Washington corporate law. For example, state law in Washington includes limitations and restrictions relating to indemnification of directors, distributions to shareholders, transactions involving directors, officers or interested shareholders, maintenance of books, records and minutes, and observance of certain corporate formalities.
Federal and State Regulation of EvergreenBank
General. The Bank is a Washington state-chartered commercial bank with deposits insured by the Federal Deposit Insurance Corporation (“FDIC”). As a result, the Bank is subject to supervision and regulation by the Washington Department of Financial Institutions, Division of Banks (“DFI”) and the FDIC. These agencies have the authority to prohibit banks from engaging in what they believe constitute unsafe or unsound banking practices.
Community Reinvestment. The Community Reinvestment Act of 1977 requires that, in connection with examinations of financial institutions within their jurisdiction, the Federal Reserve or the FDIC evaluate the record of the financial institution in meeting the credit needs of its local communities, including low and moderate-income neighborhoods, consistent with the safe and sound operation of the institution. A bank’s community reinvestment record is also considered by the applicable banking agencies in evaluating mergers, acquisitions and applications to open a branch or facility.
Insider Credit Transactions. Banks are also subject to certain restrictions imposed by the Federal Reserve Act on extensions of credit to executive officers, directors, principal shareholders or any related interests of such persons. Extensions of credit (i) must be made on substantially the same terms, including interest rates and collateral, and follow credit underwriting procedures that are at least as stringent as those prevailing at the time for comparable transactions with persons not covered above; and (ii) must not involve more than the normal risk of repayment or present other unfavorable features. Banks are also subject to certain lending limits and restrictions on overdrafts to insiders. A violation of these restrictions may result in the assessment of substantial civil monetary penalties, the imposition of a cease and desist order, and other regulatory sanctions.
7
Regulation of Management. Federal law (i) sets forth circumstances under which officers or directors of a bank may be removed by the institution’s federal supervisory agency; (ii) places restraints on lending by a bank to its executive officers, directors, principal shareholders and their related interests; and (iii) prohibits management personnel of a bank from serving as a director or in a management position of another financial institution whose assets exceed a specified amount or which has an office within a specified geographic area.
Safety and Soundness Standards. Federal law imposes certain non-capital safety and soundness standards upon banks. These standards cover, among other things, internal controls, information systems, internal audit systems, loan documentation, credit underwriting, interest rate exposure, asset growth, compensation and benefits. Additional standards apply to asset quality, earnings and stock valuation. An institution that fails to meet these standards must develop a plan acceptable to its regulators, specifying the steps that the institution will take to meet the standards. Failure to submit or implement such a plan may subject the institution to regulatory sanctions.
State Assessments. Washington state banks that hold public funds are considered public depositories and are subject to pro rata assessments for the loss of public deposits held at a failed Washington bank that exceed federal deposit insurance limits and other coverage. Due to the current economic climate it is anticipated that there will be bank failures nationwide, and we may face increased costs if a Washington state public depository bank fails and we are assessed for the net losses of such public deposits held at the failed institution.
Interstate Banking And Branching
The Riegle-Neal Interstate Banking and Branching Efficiency Act of 1994 (“Interstate Act”) relaxed prior interstate branching restrictions under federal law by permitting nationwide interstate banking and branching under certain circumstances. Generally, bank holding companies may purchase banks in any state, and states may not prohibit these purchases. Additionally, banks are permitted to merge with banks in other states, as long as the home state of neither merging bank has opted out under the legislation. The Interstate Act requires regulators to consult with community organizations before permitting an interstate institution to close a branch in a low-income area. Federal banking agency regulations prohibit banks from using their interstate branches primarily for deposit production and the federal banking agencies have implemented a loan-to-deposit ratio screen to ensure compliance with this prohibition.
Washington enacted “opting in” legislation in accordance with the Interstate Act, allowing banks to engage in interstate merger transactions, subject to certain “aging” requirements. Under Washington law, an out-of-state bank may, subject to Department of Financial Institutions’ approval, open de novo branches in Washington or acquire an in-state branch so long as the home state of the out-of-state bank has reciprocal laws with respect to de novo branching or branch acquisitions. Once an out-of-state bank has acquired a bank within Washington, either through merger or acquisition of all or substantially all of the bank’s assets or through authorized de novo branching, the out-of-state bank may open additional branches within the state.
Dividends
The principal source of the Company’s cash is from dividends received from the Bank, which are subject to government regulation and limitations. Regulatory authorities may prohibit banks and bank holding companies from paying dividends in a manner that would constitute an unsafe or unsound banking practice or would reduce the amount of its capital below that necessary to meet minimum applicable regulatory capital requirements. Washington law also limits a bank’s ability to pay dividends that are greater than the bank’s retained earnings without approval of the Department of Financial Institutions.
Capital Adequacy
Regulatory Capital Guidelines. Federal bank regulatory agencies use capital adequacy guidelines in the examination and regulation of bank holding companies and banks. The guidelines are “risk-based,” meaning that
8
they are designed to make capital requirements more sensitive to differences in risk profiles among banks and bank holding companies.
Tier I and Tier II Capital. Under the guidelines, an institution’s capital is divided into two broad categories, Tier I capital and Tier II capital. Tier I capital generally consists of common stockholders’ equity, surplus and undivided profits. Tier II capital generally consists of the allowance for loan losses, hybrid capital instruments, and subordinated debt. The sum of Tier I capital and Tier II capital represents an institution’s total capital. The guidelines require that at least 50 percent of an institution’s total capital consist of Tier I capital.
Risk-based Capital Ratios. The adequacy of an institution’s capital is gauged primarily with reference to the institution’s risk-weighted assets. The guidelines assign risk weightings to an institution’s assets in an effort to quantify the relative risk of each asset and to determine the minimum capital required to support that risk. An institution’s risk-weighted assets are then compared with its Tier I capital and total capital to arrive at a Tier I risk-based ratio and a total risk-based ratio, respectively. The guidelines provide that an institution must have a minimum Tier I risk-based ratio of 4 percent and a minimum total risk-based ratio of 8 percent.
Leverage Ratio. The guidelines also employ a leverage ratio, which is Tier I capital as a percentage of average total assets, less intangibles. The principal objective of the leverage ratio is to constrain the maximum degree to which a bank holding company may leverage its equity capital base. The minimum leverage ratio is 3 percent; however, for all but the most highly rated bank holding companies and for bank holding companies seeking to expand, regulators expect an additional cushion of at least 1 to 2 percent.
Prompt Corrective Action. Under the guidelines, an institution is assigned to one of five capital categories depending on its total risk-based capital ratio, Tier I risk-based capital ratio, and leverage ratio, together with certain subjective factors. The categories range from “well capitalized” to “critically undercapitalized.” Institutions that are “undercapitalized” or lower are subject to certain mandatory supervisory corrective actions. At December 31, 2008, the Company was no longer categorized as “well capitalized.” For further discussion of this and its impact on operations please see Note 2: Regulatory Actions, Business Plan, and Going Concern Considerations and Note 20: Regulatory Capital Requirements to the consolidated financial statements.
In 2007, the federal banking agencies, including the FDIC and the Federal Reserve, approved final rules to implement new risk-based capital requirements. Presently, this new advanced capital adequacy framework, called Basel II, is applicable only to large and internationally active banking organizations. Basel II changes the existing risk-based capital framework by enhancing its risk sensitivity. Whether Basel II will be expanded to apply to banking organizations that are the size of the Company or the Bank is unclear at this time, and what effect such regulations would have on us cannot be predicted, but we do not expect our operations would be significantly impacted.
Regulatory Oversight and Examination
The Federal Reserve conducts periodic inspections of bank holding companies, which are performed both onsite and offsite. The supervisory objectives of the inspection program are to ascertain whether the financial strength of the bank holding company is being maintained on an ongoing basis and to determine the effects or consequences of transactions between a holding company or its non-banking subsidiaries and its subsidiary banks. For holding companies under $10 billion in assets, the inspection type and frequency varies depending on asset size, complexity of the organization, and the holding company’s rating at its last inspection.
Banks are subject to periodic examinations by their primary regulators. Bank examinations have evolved from reliance on transaction testing in assessing a bank’s condition to a risk-focused approach. These examinations are extensive and cover the entire breadth of operations of the bank. Generally, safety and soundness examinations occur on an 18-month cycle for banks under $500 million in total assets that are well capitalized and without regulatory issues, and 12-months otherwise. Examinations alternate between the federal
9
and state bank regulatory agency or may occur on a combined schedule. The frequency of consumer compliance and CRA examinations is linked to the size of the institution and its compliance and CRA ratings at its most recent examinations. However, the examination authority of the Federal Reserve and the FDIC allows them to examine supervised banks as frequently as deemed necessary based on the condition of the bank or as a result of certain triggering events.
Recent Legislation
Emergency Economic Stabilization Act of 2008
In response to the recent financial crisis, the United States government passed the Emergency Economic Stabilization Act of 2008 (the “EESA”) on October 3, 2008, which provides the United States Department of the Treasury (the “Treasury”) with broad authority to implement certain actions intended to help restore stability and liquidity to the U.S. financial markets.
Insurance of Deposit Accounts.
The EESA included a provision for a temporary increase from $100,000 to $250,000 per depositor in deposit insurance effective October 3, 2008 through December 31, 2009. Deposit accounts are insured by the FDIC, generally up to a maximum of $100,000 per separately insured depositor and up to a maximum of $250,000 for self-directed retirement accounts.
The FDIC imposes an assessment against institutions for deposit insurance. This assessment is based on the risk category of the institution and ranges from 5 to 43 basis points of the institution’s deposits. In December, 2008, the FDIC adopted a rule that raises the current deposit insurance assessment rates uniformly for all institutions by 7 basis points (to a range from 12 to 50 basis points) for the first quarter of 2009. The rule also gives the FDIC the authority to alter the way it calculates federal deposit insurance assessment rates to adjust for an institutions’ risk beginning in the second quarter of 2009 and thereafter and as necessary to implement emergency special assessments to maintain the deposit insurance fund.
In 2006, federal deposit insurance reform legislation was enacted that (i) required the FDIC to merge the Bank Insurance Fund and the Savings Association Insurance Fund into a newly created Deposit Insurance Fund; (ii) increases the amount of deposit insurance coverage for retirement accounts; (iii) allows for deposit insurance coverage on individual accounts to be indexed for inflation starting in 2010; (iv) provides the FDIC more flexibility in setting and imposing deposit insurance assessments; and (v) provides eligible institutions credits on future assessments.
Troubled Asset Relief Program
Pursuant to the EESA, the Treasury has the ability to purchase or insure up to $700 billion in troubled assets held by financial institutions under the Troubled Asset Relief Program (“TARP”). On October 14, 2008, the Treasury announced it would initially purchase equity stakes in financial institutions under a Capital Purchase Program (the “CPP”) of up to $350 billion of the $700 billion authorized under the TARP legislation. The CPP provides direct equity investment of perpetual preferred stock by the Treasury in qualified financial institutions. The program is voluntary and requires an institution to comply with a number of restrictions and provisions, including limits on executive compensation, stock redemptions and declaration of dividends. For publicly traded companies, the CPP also requires the Treasury to receive warrants for common stock equal to 15% of the capital invested by the Treasury. The Company did not participate in the CPP.
Temporary Liquidity Guarantee Program
In October 2008, the FDIC announced the Temporary Liquidity Guarantee Program, which has two components—the Debt Guarantee Program and the Transaction Account Guarantee Program. Under the
10
Transaction Account Guarantee Program any participating depository institution is able to provide full deposit insurance coverage for non-interest bearing transaction accounts, regardless of the dollar amount. Under the program, effective November 14, 2008, insured depository institutions that have not opted out of the FDIC Temporary Liquidity Guarantee Program will be subject to a 0.10% surcharge applied to non-interest bearing transaction deposit account balances in excess of $250,000, which surcharge will be added to the institution’s existing risk-based deposit insurance assessments. Under the Debt Guarantee Program, qualifying unsecured senior debt issued by a participating institution can be guaranteed by the FDIC. The Company and the Bank are participating in both components of the FDIC Temporary Liquidity Guarantee Program.
American Recovery and Reinvestment Act of 2009
On February 17, 2009, the American Recovery and Reinvestment Act of 2009 (“ARRA”) was signed into law. ARRA is intended to help stimulate the economy and is a combination of tax cuts and spending provisions applicable to a broad range of areas with an estimated cost of $787 billion. The impact that ARRA may have on the U.S. economy, the Company and the Bank cannot be predicted with certainty.
Public-Private Investment Program
Treasury recently announced the Public-Private Investment Program as part of its efforts to repair bank balance sheets and ensure that credit is available. Using $75 to $100 billion in TARP capital and capital from private investors, the Public-Private Investment Program will generate $500 billion in purchasing power to buy “legacy” assets—with the potential to expand to $1 trillion over time. The program will use government financing in partnership with the FDIC and Federal Reserve and co-investment with private sector investors. To deal with difficulties in pricing such assets, private sector investors will compete with one another to establish the price of the loans and securities purchased under the program. It is too early to determine if this program will have a positive effect on the Company.
Proposed Legislation
As of early 2009, additional legislation has been promulgated or is pending under the EESA, which is intended to provide, among other things, an injection of more capital from Treasury into financial institutions through the Capital Assistance Program, establishment of a public-private investment fund for the purchase of troubled assets, and expansion of the Term Asset-Backed Securities Loan Facility to include commercial mortgage backed-securities.
Proposed legislation is introduced in almost every legislative session that would dramatically affect the regulation of the banking industry. In light of the 2008 financial crisis and a new administration in the White House, it is anticipated that legislation reshaping the regulatory landscape could be proposed in 2009. We cannot predict if any such legislation will be adopted or if it is adopted how it would affect the business of the Company or the Bank. Past history has demonstrated that new legislation or changes to existing laws or regulations usually results in a greater compliance burden and therefore generally increases the cost of doing business.
Other Relevant Legislation
Corporate Governance and Accounting Legislation
Sarbanes-Oxley Act of 2002. The Sarbanes-Oxley Act of 2002 (the “Act”) addresses, among other things, corporate governance, auditing and accounting, enhanced and timely disclosure of corporate information, and penalties for non-compliance. Generally, the Act (i) requires chief executive officers and chief financial officers to certify to the accuracy of periodic reports filed with the Securities and Exchange Commission (the “SEC”); (ii) imposes specific and enhanced corporate disclosure requirements; (iii) accelerates the time frame for reporting of insider transactions and periodic disclosures by public companies; (iv) requires companies to adopt and disclose information about corporate governance practices, including whether or not they have adopted a
11
code of ethics for senior financial officers and whether the audit committee includes at least one “audit committee financial expert;” and (v) requires the SEC, based on certain enumerated factors, to regularly and systematically review corporate filings.
To deter wrongdoing, the Act (i) subjects bonuses issued to top executives to disgorgement if a restatement of a company’s financial statements was due to corporate misconduct; (ii) prohibits an officer or director misleading or coercing an auditor; (iii) prohibits insider trades during pension fund “blackout periods”; (iv) imposes new criminal penalties for fraud and other wrongful acts; and (v) extends the period during which certain securities fraud lawsuits can be brought against a company or its officers.
As a publicly reporting company, we are subject to the requirements of the Act and related rules and regulations issued by the SEC and NASDAQ. After enactment, we updated our policies and procedures to comply with the Act’s requirements and have found that such compliance, including compliance with Section 404 of the Act relating to management control over financial reporting, has resulted in significant additional expense for the Company. We anticipate that we will continue to incur such additional expense in our ongoing compliance.
Anti-terrorism Legislation
USA Patriot Act of 2001. The Uniting and Strengthening America by Providing Appropriate Tools Required to Intercept and Obstruct Terrorism Act of 2001, intended to combat terrorism, was renewed with certain amendments in 2006 (the “Patriot Act”). Certain provisions of the Patriot Act were made permanent and other sections were made subject to extended “sunset” provisions. The Patriot Act, in relevant part, (i) prohibits banks from providing correspondent accounts directly to foreign shell banks; (ii) imposes due diligence requirements on banks opening or holding accounts for foreign financial institutions or wealthy foreign individuals; (iii) requires financial institutions to establish an anti-money-laundering compliance program; and (iv) eliminates civil liability for persons who file suspicious activity reports. The Act also includes provisions providing the government with power to investigate terrorism, including expanded government access to bank account records. While the Patriot Act has had minimal affect on our record keeping and reporting expenses, we do not believe that the renewal and amendment will have a material adverse effect on our business or operations.
Financial Services Modernization
Gramm-Leach-Bliley Act of 1999. The Gramm-Leach-Bliley Financial Services Modernization Act of 1999 brought about significant changes to the laws affecting banks and bank holding companies. Generally, the Act (i) repeals historical restrictions on preventing banks from affiliating with securities firms; (ii) provides a uniform framework for the activities of banks, savings institutions and their holding companies; (iii) broadens the activities that may be conducted by national banks and banking subsidiaries of bank holding companies; (iv) provides an enhanced framework for protecting the privacy of consumer information and requires notification to consumers of bank privacy policies; and (v) addresses a variety of other legal and regulatory issues affecting both day-to-day operations and long-term activities of financial institutions. Bank holding companies that qualify and elect to become financial holding companies can engage in a wider variety of financial activities than permitted under previous law, particularly with respect to insurance and securities underwriting activities.
Financial Services Regulatory Relief Act of 2006. In 2006, the President signed the Financial Services Regulatory Relief Act of 2006 into law (the “Relief Act”). The Relief Act amends several existing banking laws and regulations, eliminates some unnecessary and overly burdensome regulations of depository institutions and clarifies several existing regulations. The Relief Act, among other things, (i) authorizes the Federal Reserve Board to set reserve ratios; (ii) amends regulations of national banks relating to shareholder voting and granting of dividends; (iii) amends several provisions relating to loans to insiders, regulatory applications, privacy notices, and golden parachute payments; and (iv) expands and clarifies the enforcement authority of federal banking regulators. Our business, expenses, and operations have not been significantly impacted by this legislation.
12
Effects Of Government Monetary Policy
Our earnings and growth are affected not only by general economic conditions, but also by the fiscal and monetary policies of the federal government, particularly the Federal Reserve. The Federal Reserve implements national monetary policy for such purposes as curbing inflation and combating recession, and its open market operations in U.S. government securities, control of the discount rate applicable to borrowings from the Federal Reserve, and establishment of reserve requirements against certain deposits, influence the growth of bank loans, investments and deposits, and also affect interest rates charged on loans or paid on deposits. The nature and impact of future changes in monetary policies such as the lowering of the Federal Reserve’s discount rate, and their impact on us cannot be predicted with certainty.
Our business exposes us to certain risks. The following is a discussion of the most significant risks and uncertainties that may affect our business, financial condition, and future results.
| | • | | Our loan portfolio contains a high percentage of commercial and commercial real estate loans, including construction loans, in relation to our total loans and total assets. |
Commercial and commercial real estate loans generally are viewed as having more risk of default than residential real estate loans or certain other types of loans or investments. These types of loans also typically are larger than residential real estate loans. Further deterioration in the local economy could adversely affect cash flows for both commercial and individual borrowers, thus causing the Company to experience increases in problem assets, delinquencies, and losses on loans. Because the loan portfolio contains a significant number of commercial and commercial real estate loans, including construction loans, with relatively large balances, the deterioration of one or a few of these loans may cause a significant increase in nonperforming loans. An increase in nonperforming loans could result in: a loss of earnings from these loans; an increase in the provision for loan losses; or an increase in loan charge-offs, which could have an adverse impact on our results of operations and financial condition.
| | • | | We have a high level of nonperforming assets which has required us to significantly increase our loan loss provision. |
We have experienced a substantial increase in nonperforming assets during the fiscal year 2008, resulting in an increased loan loss provision of $11,961,000 compared to $1,926,000 for the prior year. This increase was a result of the declining real estate market, which directly affects us due to our concentration in commercial real estate, and construction lending. If the economy continues to decline, there can be no assurance that there may not be a further increase in nonperforming assets in the future.
| | • | | Our allowance for loan losses may not be adequate to cover actual loan losses, which could adversely affect our earnings and capital. |
We maintain an allowance for loan losses in an amount that we believe is adequate to provide for probable incurred losses in the portfolio. While we strive to carefully monitor credit quality and to identify loans that may become nonperforming, at any time there are loans included in the portfolio that have not been identified as nonperforming or potential problem loans, but that may result in losses nontheless. We cannot be sure that we will be able to identify deteriorating loans before they become nonperforming assets, or that we will be able to limit losses on those loans that are identified. As a result, future additions to the allowance may be necessary. Additionally, future additions to the allowance may be required based on changes in the loans comprising the portfolio and changes in the financial condition of borrowers, such as may result from changes in economic conditions or as a result of incorrect assumptions by management in determining the allowance. Furthermore, federal banking regulators, as an integral part of their supervisory function, periodically review our allowance for loan losses. These regulatory agencies may require us to recognize further loan charge-offs based upon their
13
judgments, which may be different from ours. Any increase in the allowance for loan losses could have a negative effect on our financial condition and results of operation.
| | • | | The Bank is heavily dependent on brokered deposits as a funding source. |
The inability to accept, renew, or roll over brokered deposits will put a sever strain on the Bank’s liquidity. In that regard, because the Bank has fallen below the 10% well-capitalized requirement, we are prohibited under FDIC regulations from renewing, accepting or replacing brokered certificates of deposit without receiving a waiver from the FDIC which is highly problematic at this time. At December 31, 2008, the Bank had deposits of approximately $358,900,000, of which $130,700,000 or 36% were comprised of brokered deposits. As of March 26, 2009, the Bank had $130,875,000 in brokered deposits, of which $92,500,000 mature during the remainder of 2009. The maturities of these brokered deposits over the next four quarters are as follows: $31,500,000 in the second quarter of 2009; $31,200,000 in third quarter of 2009; $29,800,000 in fourth quarter of 2009 and $20,700,000 during the first quarter of 2010. Although the Bank intends to apply for a waiver from the FDIC to renew brokered deposits, it is uncertain if the waiver will be granted. Because of this uncertainty and its impact on liquidity, there is substantial doubt regarding the Company’s ability to continue as a going concern.
| | • | | Bancorp has entered into agreements with the DFI and the FRB that restrict the Bank’s operations and may adversely affect our ability to pay dividends. |
The ability of Bancorp to pay regular quarterly dividends to its shareholders depends to a large extent upon the dividends it receives from the Bank. The DFI Directive and the FRB Agreement prohibit the Bank from paying dividends to Bancorp without the prior approval of the DFI, the FDIC and the FRB. We cannot predict whether these agencies will approve payments of dividends by the Bank to Bancorp, or will object to the payment of future Bancorp dividends, or how long these restrictions will remain in effect.
In addition, these agreements restrict the payment of dividends to the holders of the trust preferred securities of Bancorp’s statutory trusts (Trust II and Trust III) as required under the respective agreements. Bancorp has given the requisite notice to the holders of the preferred securities that it must defer any future interest payments until such time as it is in compliance with regulatory requirements. There can be no assurance when or if Bancorp will be in a position to resume these payments, which can be deferred for up to five years.
| | • | | The Company’s independent registered public accounting firm discovered material weaknesses in the Company’s internal controls over financial reporting. |
During its audit for fiscal year December 31, 2008, the Company’s accountants identified adjustments and corrections primarily during the fourth quarter of 2008 that were identified as material weaknesses in the Company’s internal control over financial reporting. Management recognizes these material weaknesses identified and intends to implement policies and procedures to identify and evaluate problem credits, troubled debt restructuring and impaired loans at least on a quarterly basis; strengthen internal audit and external loan review to monitor problem credits and impaired loans; expand quarterly calculation for loan losses; and regular reporting of results to the Board. There is no assurance that the implementation of such actions will be successful in the remediation of such material weaknesses.
| | • | | Further economic downturn in the market area we serve may cause us to have lower earnings and could increase our credit risk associated with our loan portfolio. |
The inability of borrowers to repay loans can erode our earnings. Substantially all of our loans are to businesses and individuals in the Seattle, Bellevue, Lynnwood, Federal Way, and Kent communities, and any further decline in the economy of this market area could impact us adversely. As a lender, we are exposed to the risk that our customers will be unable to repay their loans in accordance with their terms, and that any collateral securing the payment of their loans may not be sufficient to assure repayment. Because the loan portfolio has a high concentration of commercial real estate and commercial loans, the further deterioration of such loans may
14
cause a further increase in nonperforming loans, requiring additional increases to the loan loss allowance. Additionally, future additions to the allowance may be required based on changes in the loans comprising the portfolio and changes in the financial condition of borrowers, such as may result from deterioration in economic conditions or as a result of incorrect assumptions by management in determining the allowance.
| | • | | Further tightening of the credit market may make it difficult to obtain available money to fund loan growth, which could adversely affect our earnings. |
A tightening of the credit market and the inability to obtain adequate money to fund continued loan growth may negatively affect our asset growth and liquidity position and, therefore, our earnings capability. In addition to core deposit growth, maturity of investment securities and loan payments, the Bank also relies on alternative funding sources through correspondent banking, brokered certificates of deposit, and a borrowing line with the Federal Home Loan Bank of Seattle (“FHLB”) to fund loans. A further downturn in the economy, particularly in the housing market, could negatively affect these resources, which would limit the funds available to the Bank.
| | • | | We cannot predict the effect of recent and pending federal legislation. |
On October 3, 2008, Congress enacted the Emergency Economic Stabilization Act of 2008 (“EESA”), which provides the United States Treasury Department (“Treasury”) with broad authority to implement action intended to help restore stability and liquidity to the U.S. financial markets. The EESA also increases the amount of deposit account insurance coverage from $100,000 to $250,000 effective until December 31, 2009.
As of early 2009, additional legislation has been promulgated or is pending under EESA which is intended to provide, among other things, an injection of capital from the Treasury into financial institutions through the Capital Assistance Program, establishment of a public-private investment fund for the purchase of troubled assets, and the expansion of the Term Asset-Backed Securities Loan Facility to include commercial mortgage backed-securities.
The full effect of the broad legislation already enacted and related legislation expected to be enacted in the near future on the national economy and financial institutions, particularly on smaller institutions like us, cannot now be predicted.
| | • | | Our ability to access markets for funding and acquire and retain customers could be adversely affected to the extent the financial service industry and our reputation is damaged. |
Reputation risk is the risk to liquidity, earnings and capital arising from negative publicity regarding the financial services industry. The financial services industry continues to be featured in negative headlines about the global and national credit crisis and the resulting stabilization legislation enacted by the U.S. federal government. These reports can be damaging to the industry’s image and potentially erode consumer confidence in insured financial institutions, such as the banking subsidiary. Further, the DFI Directive and MOU with the FRB could be damaging to our reputation. See Note 2 to the consolidated financial statements for further discussion of the Directive and MOU.
| | • | | Fluctuating interest rates can adversely affect our profitability. |
Our profitability is dependent to a large extent upon net interest income, which is the difference (or “spread”) between the interest earned on loans, securities and other interest-earning assets, and interest paid on deposits, borrowings, and other interest-bearing liabilities. Because of the differences in maturities and repricing characteristics of our interest-earning assets and interest-bearing liabilities, changes in interest rates do not produce equivalent changes in interest income earned on interest-earning assets and interest paid on interest-bearing liabilities. Accordingly, fluctuations in interest rates could adversely affect our interest rate spread, and, in turn, our profitability. We cannot make assurances that we can minimize our interest rate risk. In addition, interest rates also affect the amount of money we can lend. When interest rates rise, the cost of borrowing also increases. Accordingly, changes in levels of market interest rates could materially and adversely affect our net
15
interest spread, asset quality, loan origination volume, business and prospects. We assess rate risk by various means including analysis of financial data and by modeling the impact of rate changes on financial performance. Current information suggests that the Company is slightly “asset-sensitive,” suggesting that rising interest rates may tend to increase net interest income and improve profits, and that falling interest rates would have the opposite effect.
| | • | | There is not significant trading activity of our shares, which could result in price volatility. |
Our shares are traded on the OTC Bulletin Board under the symbol “EVGG.” There is not what would be characterized as an active trading market for the shares, and trading volume is not substantial. Accordingly, the trading price of our shares may be more susceptible to fluctuation, for example in the event of a transaction involving a significant block of shares, than a stock that was more actively traded. There can be no assurance that an active and liquid market for our common stock will develop. Accordingly, shareholders may find it difficult to sell a significant number of shares at the prevailing market price.
| | • | | There are restrictions on changes in control of the Company that could decrease our shareholders’ chance to realize a premium on their shares. |
As a Washington corporation, we are subject to various provisions of the Washington Business Corporation Act that impose restrictions on certain takeover offers and business combinations, such as combinations with interested shareholders and share repurchases from certain shareholders. Provisions in our Articles of Incorporation requiring a staggered Board and/or containing fairness provisions could have the effect of hindering, delaying or preventing a takeover bid. These provisions may inhibit takeover bids and could decrease the chance of shareholders realizing a premium over market price for their shares as a result of the takeover bid.
| | • | | The FDIC has increased insurance premiums to rebuild and maintain the federal deposit insurance fund and we may separately incur state statutory assessments in the future. |
Based on recent events and the state of the economy, the FDIC has increased regular federal deposit insurance premiums by 7 basis points for the first quarter of 2009. The increase of these premiums will add to our cost of operations and could have a significant impact on the Bank. New rules governing deposit insurance premiums are expected to go into effect on April 1, 2009. These new rules are intended to make assessments more balanced by requiring riskier institutions to pay a larger share. In addition, the FDIC recently adopted rules charging even higher premiums to those institutions, like the Bank, which have a high proportion of brokered deposits.
On February 27, 2009, the FDIC adopted an interim rule imposing an emergency special assessment of 20 basis points on insured institutions, and granting the FDIC the authority to impose an additional emergency special assessment after June 30, 2009 of up to 10 basis points if necessary. Subsequently, the FDIC announced it was considering reducing the special assessment to 10 basis points if it could get a significant loan from Treasury. The assessment will be calculated on June 30, 2009 deposit balances and collected on September 30, 2009. Based on the Bank’s December 31, 2008 deposits subject to FDIC insurance assessments, the special assessment could be approximately $727,000. Depending on any future losses that the FDIC insurance fund may suffer due to failed institutions, there can be no assurance that there will not be additional significant premium increases or special assessments in order to replenish the fund.
Further, under Washington state laws, the Bank may incur additional costs if one or more Washington state banks that hold public deposits fail, since, as a public depositary, we are subject to Washington statutory pro-rata assessments to cover any net losses in public deposits not otherwise covered by federal deposit insurance or other means. One Washington state bank has failed to-date in 2009 and there can be no assurances that future failures may not occur that would require further assessments.
16
| | • | | We operate in a highly regulated environment and may be adversely affected by changes in federal state and local laws and regulations. |
We are subject to extensive regulation, supervision and examination by federal and state banking authorities. Any change in applicable regulations or federal, state or local legislation could have a substantial impact on us and our operations. Additional legislation and regulations that could significantly affect our powers, authority and operations may be enacted or adopted in the future, which could have a material adverse effect on our financial condition and results of operations. Further, regulators have significant discretion and authority to prevent or remedy unsafe or unsound practices or violations of laws or regulations by financial institutions and holding companies in the performance of their supervisory and enforcement duties. These powers recently have been utilized more frequently due to the serious national, regional and local economic conditions we are facing. The exercise of regulatory authority may have a negative impact on our financial condition and results of operations.
| Item 1B. | Unresolved Staff Comments |
There were no unresolved staff comments from the Securities and Exchange Commission as of December 31, 2008.
The Bank conducts business from seven leased office locations: the Eastlake office at 301 Eastlake Avenue East, northeast of downtown Seattle; the downtown Seattle office at 1111 Third Avenue, Seattle; the Lynnwood office currently located at 2502 196th Street Southwest, Lynnwood; the Bellevue office located at 110 110th Avenue Northeast, Bellevue; the Federal Way office currently located at 1300 South 320th Street, Federal Way; the South Lake Union office at 307 Westlake Avenue North, northwest of downtown Seattle; and the Kent office at 20038 68th Avenue, Kent.
The Company leases premises and parking facilities for the Eastlake and Lynnwood offices from PEMCO Mutual Insurance Company (“PMIC”). The Eastlake office lease expires March 31, 2012. In December 2008, the Company received notice from PMIC that the Lynnwood office lease would be terminated in April 2009. The Company subsequently signed a lease to open the Lynnwood office in a new location. The new lease expires January 31, 2014. Also in December 2008, the Company gave notice to the landlord of the Federal Way premises that it had signed a new lease for the Federal Way office commencing in April 2009. The new lease expires April 15, 2019. The Company leases the current and new Federal Way premises; the South Lake Union, Bellevue, downtown Seattle, and Kent premises; and the new Lynnwood premises from parties other than PMIC. The South Lake Union, Bellevue, downtown Seattle, and Kent leases expire August 31, 2009, May 31, 2011, April 30, 2015, and March 31, 2018, respectively. See Note 16: Leases to the consolidated financial statements.
Items of furniture, fixtures, and equipment are purchased as needed by the Bank. The Bank is responsible for maintenance, repairs, operating expenses, and insurance.
Bancorp and the Bank from time to time may be parties to various legal actions arising in the normal course of business. Management believes that there is no proceeding threatened or pending against Bancorp or the Bank which, if determined adversely, would have a material adverse effect on the consolidated financial condition or results of operations of the Company, except for matters associated with the Visa indemnification charges.
| Item 4. | Submission of Matters to a Vote of Security Holders |
No matters were submitted to a vote of security holders in the fourth quarter of 2008.
17
PART II
| Item 5. | Market for Registrant’s Common Equity, Related Stockholder Matters, and Issuer Purchases of Equity Securities |
Bancorp’s common stock is traded on the OTC Bulletin Board under the symbol “EVGG.” As of March 12, 2009, there were 647 holders of record of Bancorp’s common stock, and an estimated 488 holders of its stock in “street name” by brokerage firms.
The table below shows, for the periods indicated, the reported high and low closing sale prices and cash dividends paid (adjusted to reflect the 5% stock dividend in December 2008).
| | | | | | | | | | | | | | | | | | |
| | | 2008 | | 2007 |
| | | Cash
Dividend | | High | | Low | | Cash
Dividend | | High | | Low |
First Quarter | | $ | 0.07 | | $ | 13.87 | | $ | 11.04 | | $ | 0.07 | | $ | 15.89 | | $ | 13.85 |
Second Quarter | | | 0.07 | | | 12.91 | | | 9.59 | | | 0.07 | | | 15.00 | | | 14.10 |
Third Quarter | | | 0.07 | | | 9.46 | | | 8.15 | | | 0.07 | | | 15.03 | | | 14.05 |
Fourth Quarter | | | 0.03 | | | 9.71 | | | 4.25 | | | 0.07 | | | 14.55 | | | 13.33 |
Holders of common stock are entitled to receive such dividends as may be declared by the Board of Directors from time to time and paid out of funds legally available. Because the Company’s consolidated net income consists largely of the net income of the Bank, Bancorp’s ability to pay dividends depends upon its receipt of dividends from the Bank. The Bank’s ability to pay dividends is regulated by banking statutes. See “Supervision and Regulation—Dividends” in Part I. The declaration of dividends by Bancorp is discretionary and depends on the Bank’s and Bancorp’s earnings and financial condition, regulatory limitations, tax considerations, and other factors. As such, there can be no assurance that dividends will be paid in the future.
Investor information, including Bancorp filings with the Securities and Exchange Commission and press releases, are available on Bancorp’s website at www.EvergreenBancorp.com, or by written request to EvergreenBancorp, Inc., 1111 Third Avenue, Suite 100, Seattle, Washington, 98101, Attention: Investor Relations.
Inquiries regarding stock transfers should be directed to Registrar and Transfer Company, 10 Commerce Drive, Cranford, New Jersey, 07016, (800) 368-5948.
No shares of common stock were repurchased by Bancorp during the fourth quarter of 2008.
Equity Compensation Plan Information
The Company’s Stock Option and Equity Compensation Plan (the “Amended Plan”) was approved by the shareholders in April 2008 and provides for the issuance of the Company’s common stock to officers, certain employees, directors and consultants. The following table sets forth information regarding outstanding stock options and restricted stock awards and shares reserved for future issuance under the plan as of December 31, 2008:
| | | | | | | |
Plan Category | | Number of Shares to be
Issued upon Exercise of
Outstanding Options,
Restricted Stock Awards and
Rights
(a) | | Weighted-Average
Exercise Price of
Outstanding Options,
Restricted Stock
Awards and Rights
(b) | | Number of Shares Remaining
Available for Future Issuance
Under Equity Compensation
Plans (Excluding Shares
Reflected in Column (a))
(c) |
Equity compensation plans approved by shareholders (1) | | 200,278 | | $ | 10.95 | | 152,118 |
Equity compensation plans not approved by shareholders | | N/A | | | N/A | | N/A |
Total | | 200,278 | | $ | 10.95 | | 152,118 |
| | | | | | | |
18
| (1) | Amounts have been adjusted to reflect all applicable stock splits and dividends paid on the Company’s common stock. |
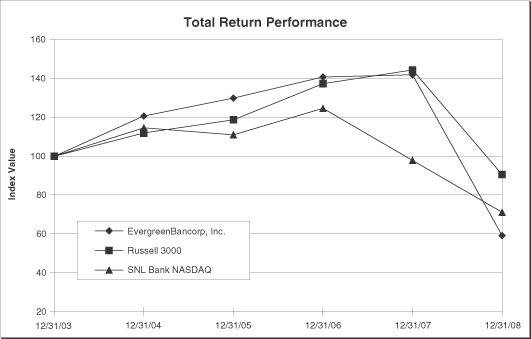
The following line graph compares the total cumulative shareholder return on the Company’s common stock based on quarterly reinvestment of all dividends, to the cumulative total returns of the Russell 3000 Index and the NASDAQ Banking Index.
EvergreenBancorp, Inc.
| | | | | | | | | | | | |
| | | Period Ending |
Index | | 12/31/03 | | 12/31/04 | | 12/31/05 | | 12/31/06 | | 12/31/07 | | 12/31/08 |
EvergreenBancorp, Inc. | | 100.00 | | 120.69 | | 129.97 | | 140.80 | | 141.99 | | 59.17 |
Russell 3000 | | 100.00 | | 111.95 | | 118.80 | | 137.47 | | 144.54 | | 90.61 |
SNL Bank NASDAQ | | 100.00 | | 114.61 | | 111.12 | | 124.75 | | 97.94 | | 71.13 |
19
| Item 6. | Selected Consolidated Financial Data |
| | | | | | | | | | | | | | | | | | | | |
| | | 2008 | | | 2007 | | | 2006 | | | 2005 | | | 2004 | |
| | | (in thousands, except per share and ratio data) | |
INCOME STATEMENT DATA | | | | | | | | | | | | | | | | | | | | |
Net interest income | | $ | 15,692 | | | $ | 15,954 | | | $ | 12,535 | | | $ | 10,263 | | | $ | 9,102 | |
Provision for loan losses | | | 11,961 | | | | 1,926 | | | | 810 | | | | 423 | | | | 321 | |
Noninterest income | | | 7,795 | | | | 1,547 | | | | 1,828 | | | | 1,693 | | | | 1,709 | |
Noninterest expense | | | 14,761 | | | | 13,666 | | | | 10,950 | | | | 10,150 | | | | 8,602 | |
Net income | | | (4,211 | ) | | | 1,181 | | | | 1,819 | | | | 966 | | | | 1,282 | |
| | | | | | | | | | | | | | | | | | | | |
PER SHARE DATA (1) | | | | | | | | | | | | | | | | | | | | |
Earnings (loss) per common share | | $ | (1.67 | ) | | $ | 0.48 | | | $ | 0.85 | | | $ | 0.46 | | | $ | 0.61 | |
Diluted earnings (loss) per common share | | | (1.67 | ) | | | 0.47 | | | | 0.84 | | | | 0.45 | | | | 0.60 | |
Dividends declared per common share | | | 0.233 | | | | 0.266 | | | | 0.238 | | | | 0.217 | | | | 0.183 | |
| | | | | | | | | | | | | | | | | | | | |
BALANCE SHEET DATA | | | | | | | | | | | | | | | | | | | | |
Total loans | | $ | 422,671 | | | $ | 375,428 | | | $ | 292,449 | | | $ | 189,188 | | | $ | 159,656 | |
Allowance for loan losses | | | 10,498 | | | | 4,166 | | | | 2,784 | | | | 2,056 | | | | 1,887 | |
Real estate owned | | | 4,901 | | | | — | | | | — | | | | — | | | | — | |
Total assets | | | 461,618 | | | | 422,787 | | | | 343,520 | | | | 249,192 | | | | 209,630 | |
Total deposits | | | 358,890 | | | | 309,471 | | | | 256,435 | | | | 199,890 | | | | 173,801 | |
Total long-term debt | | | 77,197 | | | | 82,282 | | | | 59,022 | | | | 28,849 | | | | 16,067 | |
Stockholders’ equity | | | 21,050 | | | | 25,436 | | | | 23,819 | | | | 17,736 | | | | 17,485 | |
| | | | | | | | | | | | | | | | | | | | |
SELECTED FINANCIAL RATIOS | | | | | | | | | | | | | | | | | | | | |
Return on average assets | | | (0.95 | )% | | | 0.31 | % | | | 0.64 | % | | | 0.45 | % | | | 0.66 | % |
Return on average equity | | | (15.03 | ) | | | 4.73 | | | | 9.55 | | | | 5.51 | | | | 7.58 | |
Dividend payout ratio | | | N/A | | | | 56.05 | | | | 27.60 | | | | 47.31 | | | | 29.80 | |
Average equity to average assets | | | 6.29 | | | | 6.52 | | | | 6.67 | | | | 8.16 | | | | 8.71 | |
Net interest margin (tax equivalent) (3) | | | 3.66 | | | | 4.37 | | | | 4.67 | | | | 5.14 | | | | 5.02 | |
Allowance for loan losses to total loans
at the end of year | | | 2.48 | | | | 1.11 | | | | 0.95 | | | | 1.09 | | | | 1.18 | |
Nonperforming loans to total loans
at the end of year (2) | | | 5.67 | | | | 0.22 | | | | 0.17 | | | | 0.61 | | | | 0.14 | |
Net loans charged off to average total loans | | | 1.38 | | | | 0.16 | | | | 0.03 | | | | 0.16 | | | | 0.05 | |
| | | | | | | | | | | | | | | | | | | | |
| (1) | All per share amounts have been adjusted to reflect all applicable stock splits and dividends paid on the Company’s common stock. |
| (2) | Nonperforming loans include nonaccrual loans, and other loans 90 days or more past due. |
| (3) | Net interest margin (tax-equivalent) is a non-GAAP disclosure. Please see page 28 for further discussion. |
20
| Item 7. | Management’s Discussion and Analysis of Financial Condition and Results of Operations |
General
Bancorp is a Washington chartered bank holding company formed in 2001 and headquartered in Seattle, Washington. Bancorp has as its primary business activity ownership of EvergreenBank (“the Bank”). The Bank’s principal business is personal and business banking. Services offered include commercial, real estate and consumer lending; savings, checking and certificate of deposit accounts; health savings accounts; ATM network, Internet banking, cash management services, and merchant credit card processing services. EvergreenBank currently operates seven offices in Washington located in Seattle, Bellevue, Lynnwood, Federal Way, and Kent.
The Bank’s results of operations primarily depend on net interest income after provision for loan losses, which is the difference between interest income on loans and investments, interest expense on deposits and borrowed funds and taking into account credit quality and the amount of provision for loan losses. The Bank’s operating results are also affected by loan fees, service charges on deposit accounts, net merchant credit card processing fees, gains from sales of loans and investments, and other noninterest income. Operating expenses of the Bank include employee compensation and benefits, occupancy and equipment costs, data processing, professional fees, marketing, state and local taxes, federal deposit insurance premiums, and other administrative expenses.
The Bank’s results of operations are further affected by economic and competitive conditions, particularly changes in market interest rates. Results are also affected by monetary and fiscal policies of federal agencies, and actions of regulatory authorities.
The following discussion should be read along with the accompanying financial statements and notes. All share and per-share information in this annual report has been restated to give retroactive effect to all applicable stock splits and dividends paid on the Company’s stock. In the following discussion, unless otherwise noted, references to increases or decreases in balances for a particular period or date refer to the comparison with corresponding amounts for the period or date one year earlier.
Critical Accounting Policies
The preparation of financial statements in conformity with U.S. generally accepted accounting principles requires management to make judgments, estimates, and assumptions that affect the reported amounts of assets and liabilities, including contingent amounts, at the date of the financial statements and the reported amounts of revenues and expenses during the reporting period. Actual results could differ from those estimates. Management has identified certain policies as being particularly sensitive in terms of judgments and the extent to which estimates are used. The policies relate to the determination of the allowance for loan losses, income taxes, and status of contingencies, as described in further detail below, and in the accompanying consolidated financial statements and footnotes thereto contained in this Form 10-K. Management believes that the judgments, estimates and assumptions used in the preparation of the financial statements are appropriate given the factual circumstances at the time, however, given the sensitivity of the financial statements to these critical accounting policies, estimates, and assumptions, material differences in the results of operations or financial condition could result.
Allowance for loan losses. The allowance for loan losses is a valuation allowance for probable incurred credit losses. Loan losses are charged against the allowance when management believes the uncollectibility of a loan balance is confirmed. Subsequent recoveries, if any, are credited to the allowance. Management estimates the allowance balance required using past loan loss experience, the nature and volume of the portfolio, information about specific borrower situations and estimated collateral values, economic conditions, and other factors. Allocations of the allowance may be made for specific loans, but the entire allowance is available for any loan that, in management’s judgment, should be charged off.
21
The allowance consists of specific and general components. The specific component relates to loans that are individually classified as impaired. The general component covers non-impaired loans and is based on historical loss experience adjusted for current factors.
A loan is impaired when full payment under the loan terms is not expected. Commercial and commercial real estate loans are individually evaluated for impairment. If a loan is impaired, a portion of the allowance is allocated so that the loan is reported, net, at the present value of estimated future cash flows using the loan’s existing rate or at the fair value of collateral if repayment is expected solely from the collateral. Large groups of smaller balance homogeneous loans, such as consumer and residential real estate loans, are collectively evaluated for impairment, and accordingly, they are not separately identified for impairment disclosures.
Management recognizes a certain level of imprecision exists in the manner in which the allowance for loan losses is calculated, owing to intangible factors.
Finally, management regularly monitors the performance of the loan portfolio with regard to levels of criticized and classified loans, as well as assessing regional economic factors which may impact the loan portfolio. This provides additional information for management’s regular evaluation of the allowance.
Income taxes.Deferred income taxes are computed using the asset and liability method, which recognizes a liability or asset representing the tax effects, based on current tax law, of future deductible or taxable amounts attributable to events that have been recognized in our consolidated financial statements. A valuation allowance is established to reduce the deferred tax asset to the level at which it is “more likely than not” that the tax asset or benefits will be realized. Realization of tax benefits of deductible temporary differences and operating loss carryforwards depend on having sufficient taxable income of an appropriate character within the carryforward periods. We recognize interest and penalties relating to income tax matters in income tax expense.
We adopted FASB Interpretation 48,“Accounting for Uncertainty in Income Taxes”, as of January 1, 2007. A tax position is recognized as a benefit only if it is “more likely than not” that the tax position would be sustained in a tax examination, with a tax examination being presumed to occur. The amount recognized is the largest amount of tax benefit that is greater than 50% likely of being realized on examination. For tax positions not meeting the “more likely than not” test, no tax benefit is recorded. The adoption had no affect on our financial statements.
Contingencies and guarantees.Loss contingencies, including claims and legal actions arising in the ordinary course of business are recorded as liabilities under Statement of Financial Accounting Standard (“SFAS”) No. 5, when the likelihood of loss is probable and an amount or range of loss can be reasonably estimated. For guarantees where the outcome is not probable and an amount or range of loss cannot be estimated in accordance with SFAS No. 5, the liability for the fair value of the guarantee (if there is one) is recognized in accordance with FIN45. Management has made certain assumptions in determining the amount of the Visa indemnification charges recorded. As new information is made available to the Company, we anticipate that our assumptions may change and that such changes may increase or decrease the amount of our indemnification liability recorded. Such changes may be significant.
Overview
The profitability of the Company’s operations depends primarily on the net interest income from its banking operations and investment activities, the provision for losses on loans, noninterest income, noninterest expense, and income tax expense. Net interest income is the difference between the income the Company receives on its loan and investment portfolios and its cost of funds, which consists of interest paid on deposits and borrowings. The provision for loan losses reflects the cost of credit risk in the Company’s loan portfolio. Noninterest income includes service charges on deposit accounts, net merchant credit card processing fees, gains from sales of loans and investment securities, and earnings on bank owned life insurance. Noninterest expense includes operating costs such as salaries and employee benefits, occupancy and equipment, data processing, professional fees, marketing, state and local taxes, and other administrative expense.
22
Net interest income is dependent on the amounts and yields on interest-earning assets as compared to the amounts and rates on interest-bearing liabilities. Net interest income is sensitive to changes in market rates of interest and the Company’s asset/liability management procedures in dealing with such changes.
The provision for loan losses is dependent on management’s assessment of the collectibility of the loan portfolio under current economic conditions. Other expenses are influenced by the growth of operations, with additional employees necessary to staff and operate new banking offices and marketing expenses necessary to promote them. Growth in the number of account relationships directly affects expenses such as technology costs, supplies, postage, and miscellaneous expenses.
The strength of the Puget Sound region’s economy has a significant impact on the Company’s profitability. In 2008, economic activity slowed and the slowdown accelerated in the last three months of the year. In particular, residential real estate sales activity declined at an unprecedented rate. The overall quality of loans directly and indirectly dependent upon the sale of real estate declined very rapidly in the fourth quarter of 2008, and the trend continued into the first quarter of 2009. As borrowers struggled to adjust to substantially lower cash flows, delinquencies rose. Lack of demand forced prices for houses, developed lots and raw land lower, impacting the value of the collateral securing many loans. As a result, the Company provisioned heavily for loan losses in the fourth quarter of 2008, and gave considerable weight to first quarter 2009 credit quality trends in determining the appropriate level of its allowance for loans losses at year-end.
At the end of 2008, loan totals had reached $422,671,000, up $47,243,000 or 13 percent over the prior year-end. Deposit totals increased $49,419,000, up 16 percent, and ending 2008 at $358,890,000. Deposit totals at December 31, 2008 included brokered deposits of $130,700,000 or 36 percent of total deposits. The higher interest rate paid on brokered deposits contributed to compression in the Company’s net interest margin, which decreased to 3.66 percent in 2008 compared to 4.37 percent in 2007. For 2008, the Company had a net loss of $4,211,000 or ($1.67) per basic share, compared to net income of $1,181,000 or $0.48 per basic share in 2007.
Capital activities in 2008 included quarterly cash dividends paid in February, May, August, and December.
Results of Operations 2008 Compared to 2007
The Company’s 2008 net loss was $4,211,000 compared to net income of $1,181,000 in 2007, a decrease of $5,392,000 or 457 percent. Basic and diluted losses per share for 2008 were ($1.67), compared to basic earnings of $0.48 per basic share and $0.47 per diluted share for 2007. Return on average assets was (0.95) percent for 2008 and 0.31 percent for 2007. Returns on average common equity were (15.03) percent and 4.73 percent, respectively. The net interest margin (net interest income on a taxable-equivalent basis divided by average earning assets) was 3.66 percent compared to 4.37 percent in 2007. Excluding the $5,587,000 net gain recorded in 2008 relating to Visa, Inc, the Company’s pre-tax net loss would have been $8,822,000.
The largest item that affected the Company’s 2008 results was the provision for loan losses. The provision recorded in 2008 totaled $11,961,000 compared with $1,926,000 in 2007. The cause for the increase was primarily due to significant increases in net charge-offs, nonperforming loans and also higher general provision due to the recent deterioration of the economy and its effect on the Company’s loan portfolio. The increase in the provision for loan losses was partially offset by pre-tax net gains of $5,587,000 recorded on the consolidated statement of operations as a result of Visa, Inc.’s initial public offering (“IPO”) in March 2008. For further discussion of the Company’s indemnification obligation to Visa, Inc., see Note 18: Commitments and Contingencies to the consolidated financial statements.
The results of operations in 2008 reflected little change in net interest income before provision for loan losses, down 2 percent in 2008 as compared to 2007. Noninterest income increased 404 percent, primarily due to the gains resulting from the Company’s ownership in Visa, Inc. common stock. These gains were slightly offset by decreased earnings from service charges on deposit accounts and merchant credit card processing. Noninterest expense rose $1,095,000 or 8 percent in 2008 compared with 2007. The majority of the increase was attributable to increased salaries and employee benefits as well as increased FDIC premium expense. These increases were
23
mostly offset by the decrease in indemnification charges recognized by the Company in 2008 as compared with 2007 and from a one time gain of $1,002,000 recorded in 2007 as a result of the termination of the Company’s post retirement benefit plan.
The table of selected consolidated financial data, which appears on page 20, summarizes the Company’s financial performance for each of the past five years. Additional analysis of financial components is contained in the discussion that follows.
Results of Operations 2007 Compared to 2006
The Company’s 2007 net income was $1,181,000 compared to $1,819,000 in 2006, a decrease of $638,000 or 35 percent. Basic and diluted earnings per share for 2007 were $0.48 and $0.47, respectively, compared to $0.85 and $0.84 for 2006. Return on average assets was 0.31 percent for 2007 and 0.64 percent for 2006. Returns on average common equity were 4.73 percent and 9.55 percent, respectively. The net interest margin (net interest income on a taxable-equivalent basis divided by average earning assets) was 4.37 percent compared to 4.67 percent in 2006.
Three significant items impacted the Company’s 2007 results. Cumulatively, these items lowered reported earnings per share by $0.47 for the year. The first item represented a non-cash charge totaling $2.1 million pretax, or $0.56 per share after-tax, and relates to the Company’s estimate of its proportionate share of obligations to indemnify Visa Inc. for certain litigation matters. Visa was preparing for an initial public offering (“IPO”) of its common stock in 2008. Upon the completion of the IPO, the fair value of the Company’s proportionate Visa interest was realized, based upon the value of shares utilized to establish the escrow account (limited to the amount of the obligation recorded) and shares redeemed for cash. The Company anticipates that its expected proceeds from Visa’s IPO would offset any liabilities related to any Visa litigation. See page 38 Contractual Obligations and Commitments and Note 18: Commitments and Contingencies to the consolidated financial statements for further discussion of the Company’s indemnification obligation to Visa, Inc. The second item relates to a gain of $1.0 million pretax, or $0.27 per share on an after-tax basis, related to the settlement of the Company’s post-retirement plan. This action not only positively impacted the Company’s results in 2007, but will also reduce compensation and benefit expense in future years. The last item was a cash loss of $444,000, or $0.18 per share after tax, resulting from the sale of a significant investment held by the Bank. The Bank had owned the investment, a mutual fund investing in highly-rated short-term mortgage backed securities, for approximately five years. There were two primary reasons behind the Company’s decision to sell the investment. First, the Company continues to experience strong loan growth and the sale of the investment provided an opportunity to reinvest the proceeds in loans with a substantially higher yield. Second, market turmoil and lack of liquidity affecting even high-quality mortgage-related investments increased the risk of holding the investment.
In addition to the significant items discussed above, the 2007 results were negatively impacted by the increased provision for loan losses in 2007 as compared to 2006. The provision for loan losses made in 2007 was $1,926,000 as compared to $810,000 in 2006. See page 28 for further discussion about the provision for loan losses and the allowance for loan losses.
The results of operations in 2007 reflected higher net interest income, primarily attributable to the increase in average loan balances of the loan portfolio. The increase was centered particularly in real estate loans, which grew $77,692,000, or 55 percent year-over-year.
For the year, noninterest income decreased 15 percent, primarily due to a loss on the sale of a security available for sale of $444,000. This decrease was offset by increased earnings from service charges on deposit accounts and merchant credit card processing.
Noninterest expense rose $2,716,000 or 25 percent in 2007 compared with 2006. The majority of the increase was due to $2,122,000 of indemnification charges recognized by the Company in the fourth quarter of 2007. Noninterest expense also increased as a result of recent growth and restructuring of the Company’s support functions designed to better support future growth. These increases in noninterest expense were offset by a gain of approximately $1,002,000 recognized on the settlement of the post-retirement plan.
24
Net Interest Income
The Company’s principal source of earnings is net interest income, which is the difference between interest income, including loan-related fee income, and interest expense. The individual components of net interest income and net interest margin are presented on pages 26 and 27.
2008 Compared to 2007
Net interest income before the provision for loan losses for 2008 was $15,692,000 compared to $15,954,000 in 2007. Average interest-earning assets grew $62,948,000 from 2007 to 2008; however, this increase was offset by a decrease in the average yield of 158 basis points (“bp”). Average interest-bearing liabilities grew $61,790,000 from 2007 to 2008. This increase was offset by a decrease in the average rates paid on those liabilities of 116 bp.
Total interest income was $28,430,000 in 2008, compared to $30,004,000 in 2007. This decrease of $1,574,000, or 5 percent, was primarily attributable to a decrease of 175 bp on average yields on loans from 2007 to 2008. Also contributing to the decrease was a drop in average investment securities balances of $11,983,000 as well as falling yields on those assets of 66 bp. The decrease in average balances is due to the sale of an investment security in late 2007. For further discussion of the sale see Note 4: Securities to the consolidated financial statements.
Total interest expense was $12,738,000 in 2008 compared to $14,050,000 in 2007, a decrease of $1,312,000 or 9 percent. This decrease was due primarily to a decrease of 103 bp in the average rates paid on interest bearing deposits. In addition, rates paid on Federal Home Loan Bank advances fell 135 bp from 5.06 percent at the end of 2007 to 3.71 at the end of 2008. Further reducing interest expense, the average rates paid on junior subordinated debt fell 245 bp from 2007 to 2008. For further discussion of junior subordinated debt see Note 10: Borrowings and Junior Subordinated Debt to the consolidated financial statements.
2007 Compared to 2006
Net interest income before the provision for loan losses for 2007 was $15,954,000 compared to $12,535,000 in 2006. The 27 percent increase was principally due to a $99,810,000 increase in the average balance of the loan portfolio from 2006 to 2007. This increase was partially offset by an increase in average interest-bearing deposits, which increased $76,095,000 or 47 percent from 2006 to 2007, and an increase of $8,567,000 in the average balance of Federal Home Loan Bank advances outstanding.
Total interest income was $30,004,000 in 2007, compared to $20,786,000 in 2006. This increase of $9,218,000, or 44 percent, was primarily attributable to a 43 percent increase in average loan balances and a 0.28 percent higher average yield for 2007 as compared with 2006. Also contributing to the increase was a rise in income from federal funds sold. The average balance of federal funds sold increased $239,000 year over year and the average yield earned on those balances rose 0.05 percent.
Total interest expense was $14,050,000 in 2007 compared to $8,251,000 in 2006, an increase of $5,799,000 or 70 percent. This increase was due primarily to an increase in average interest bearing liabilities of $92,091,000 or 44 percent. The majority of this increase was due to an increase in brokered deposits and advances from the FHLB. Brokered deposits totaled $85,467,000 at December 31, 2007 and $52,755,000 at December 31, 2006. Average rates paid for brokered funds are often higher than rates paid on retail deposits, and that contributed to an increase in the average yield on interest-bearing deposits. In addition, competition among local financial institutions for deposits to provide funding for strong loan demand drove up the cost of retail deposits. As a result, the average yield paid on interest-bearing deposits increased from 3.49 percent in 2006 to 4.41 percent in 2007. Average total advances from FHLB increased $8,567,000 or 22 percent from 2006 to 2007; the average rate paid on advances in 2007 was 5.06 percent as compared with 5.04 percent in 2006. Also contributing to the increase in interest expense was a rise in interest paid on trust preferred securities related to the formation of Trust II in November 2006. Interest paid on trust preferred securities rose from $491,000 in 2006 to $986,000 in 2007, an increase of 101 percent.
25
Analysis of Average Balances, Net Interest Income, and Net Interest Margin
| | | | | | | | | | | | | | | | | | | | | | | | | | | | |
| | | Years Ended December 31, | |
| | | 2008 | | | 2007 | | | 2008 Over 2007 | |
| | | | | | | | | Change in income
due to | |
| | | Average
Balance | | | Interest | | Yield/
Rate | | | Average
Balance | | | Interest | | Yield/
Rate | | | Volume | | | Rate | |
| | | (In thousands) | |
ASSETS | | | | | | | | | | | | | | | | | | | | | | | | | | | | |
Loans: | | | | | | | | | | | | | | | | | | | | | | | | | | | | |
Commercial and financial | | $ | 100,998 | | | $ | 6,636 | | 6.55 | % | | $ | 95,444 | | | $ | 8,758 | | 9.18 | % | | $ | 485 | | | $ | (2,607 | ) |
Real estate | | | 282,444 | | | | 19,022 | | 6.72 | | | | 218,157 | | | | 17,738 | | 8.13 | | | | 4,660 | | | | (3,376 | ) |
Consumer and other | | | 23,876 | | | | 2,092 | | 8.74 | | | | 20,740 | | | | 2,043 | | 9.85 | | | | 289 | | | | (240 | ) |
| | | | | | | | | | | | | | | | | | | | | | | | | | | | |
Total loans | | | 407,318 | | | | 27,750 | | 6.79 | | | | 334,341 | | | | 28,539 | | 8.54 | | | | 5,434 | | | | (6,223 | ) |
Federal funds sold | | | 1,925 | | | | 29 | | 1.49 | | | | 1,379 | | | | 71 | | 5.14 | | | | 21 | | | | (63 | ) |
Interest-bearing deposits in financial institutions | | | 6,083 | | | | 126 | | 2.08 | | | | 4,675 | | | | 225 | | 4.81 | | | | 56 | | | | (154 | ) |
Investment securities | | | 14,665 | | | | 590 | | 4.01 | | | | 26,648 | | | | 1,243 | | 4.67 | | | | (500 | ) | | | (153 | ) |
| | | | | | | | | | | | | | | | | | | | | | | | | | | | |
Total earning assets | | | 429,991 | | | | 28,495 | | 6.61 | | | | 367,043 | | | | 30,078 | | 8.19 | | | | 5,011 | | | | (6,593 | ) |
Cash and due from banks | | | 6,319 | | | | | | | | | | 6,643 | | | | | | | | | | | | | | | |
Premises and equipment | | | 3,432 | | | | | | | | | | 3,116 | | | | | | | | | | | | | | | |
Accrued interest and other assets | | | 10,965 | | | | | | | | | | 9,997 | | | | | | | | | | | | | | | |
Allowance for loan losses | | | (5,145 | ) | | | | | | | | | (3,289 | ) | | | | | | | | | | | | | | |
| | | | | | | | | | | | | | | | | | | | | | | | | | | | |
Total assets | | $ | 445,562 | | | | | | | | | $ | 383,510 | | | | | | | | | | | | | | | |
| | | | | | | | | | | | | | | | | | | | | | | | | | | | |
LIABILITIES | | | | | | | | | | | | | | | | | | | | | | | | | | | | |
Interest-bearing deposits: | | | | | | | | | | | | | | | | | | | | | | | | | | | | |
Demand deposits | | | 20,079 | | | | 325 | | 1.62 | | | | 14,579 | | | | 323 | | 2.22 | | | | 103 | | | | (101 | ) |
Savings deposits | | | 63,509 | | | | 1,270 | | 1.99 | | | | 69,647 | | | | 2,283 | | 3.28 | | | | (187 | ) | | | (826 | ) |
Time deposits | | | 200,079 | | | | 8,019 | | 4.00 | | | | 155,160 | | | | 7,953 | | 5.13 | | | | 2,015 | | | | (1,949 | ) |
| | | | | | | | | | | | | | | | | | | | | | | | | | | | |
Total interest-bearing deposits | | | 283,667 | | | | 9,614 | | 3.38 | | | | 239,386 | | | | 10,559 | | 4.41 | | | | 1,931 | | | | (2,876 | ) |
Federal funds purchased | | | 322 | | | | 9 | | 2.90 | | | | 1,404 | | | | 83 | | 5.90 | | | | (44 | ) | | | (30 | ) |
Federal Home Loan Bank advances | | | 67,654 | | | | 2,518 | | 3.71 | | | | 47,855 | | | | 2,422 | | 5.06 | | | | 840 | | | | (744 | ) |
Junior subordinated debt | | | 12,372 | | | | 597 | | 4.81 | | | | 13,580 | | | | 986 | | 7.26 | | | | (82 | ) | | | (307 | ) |
| | | | | | | | | | | | | | | | | | | | | | | | | | | | |
Total interest-bearing liabilities | | | 364,015 | | | | 12,738 | | 3.49 | | | | 302,225 | | | | 14,050 | | 4.65 | | | | 2,645 | | | | (3,957 | ) |
Noninterest-bearing deposits | | | 50,029 | | | | | | | | | | 52,876 | | | | | | | | | | | | | | | |
Accrued interest and other liabilities | | | 3,492 | | | | | | | | | | 3,417 | | | | | | | | | | | | | | | |
| | | | | | | | | | | | | | | | | | | | | | | | | | | | |
Total liabilities | | | 417,536 | | | | | | | | | | 358,518 | | | | | | | | | | | | | | | |
Stockholders’ equity | | | 28,026 | | | | | | | | | | 24,992 | | | | | | | | | | | | | | | |
| | | | | | | | | | | | | | | | | | | | | | | | | | | | |
Total liabilities and stockholders’ equity | | $ | 445,562 | | | | | | | | | $ | 383,510 | | | | | | | | | | | | | | | |
| | | | | | | | | | | | | | | | | | | | | | | | | | | | |
Interest revenue as a percentage of average earning assets | | | | | | | | | 6.61 | % | | | | | | | | | 8.19 | % | | | | | | | | |
Interest expense as a percentage of average earning assets | | | | | | | | | 2.95 | % | | | | | | | | | 3.82 | % | | | | | | | | |
Net interest income on a taxable- equivalent basis and net interest margin | | | | | | $ | 15,757 | | 3.66 | % | | | | | | $ | 16,028 | | 4.37 | % | | | | | | | | |
| | | | | | | | | | | | | | | | | | | | | | | | | | | | |
Changes in income and expense which are not due solely to rate or volume have been allocated proportionately. Average loan balances include nonaccrual loans. Taxable-equivalent adjustments relate to tax-exempt investment securities and loans.
26
Analysis of Average Balances, Net Interest Income, and Net Interest Margin
| | | | | | | | | | | | | | | | | | | | | | | | | | | | |
| | | Years Ended December 31, | |
| | | 2007 | | | 2006 | | | 2007 Over 2006 | |
| | | | | | | | | | | | | | | | | | | Change in income
due to | |
| | | Average
Balance | | | Interest | | Yield/
Rate | | | Average
Balance | | | Interest | | Yield/
Rate | | | Volume | | | Rate | |
| | | (In thousands) | |
ASSETS | | | | | | | | | | | | | | | | | | | | | | | | | | | | |
Loans: | | | | | | | | | | | | | | | | | | | | | | | | | | | | |
Commercial and financial | | $ | 95,444 | | | $ | 8,758 | | 9.18 | % | | $ | 77,446 | | | $ | 7,341 | | 9.48 | % | | $ | 1,642 | | | $ | (225 | ) |
Real estate | | | 218,157 | | | | 17,738 | | 8.13 | | | | 140,465 | | | | 10,340 | | 7.36 | | | | 6,222 | | | | 1,176 | |
Consumer and other | | | 20,740 | | | | 2,043 | | 9.85 | | | | 16,620 | | | | 1,683 | | 10.13 | | | | 405 | | | | (45 | ) |
| | | | | | | | | | | | | | | | | | | | | | | | | | | | |
Total loans | | | 334,341 | | | | 28,539 | | 8.54 | | | | 234,531 | | | | 19,364 | | 8.26 | | | | 8,269 | | | | 906 | |
Federal funds sold | | | 1,379 | | | | 71 | | 5.14 | | | | 1,140 | | | | 58 | | 5.09 | | | | 12 | | | | 1 | |
Interest-bearing deposits in financial institutions | | | 4,675 | | | | 225 | | 4.81 | | | | 1,782 | | | �� | 72 | | 4.04 | | | | 137 | | | | 17 | |
Investment securities | | | 26,648 | | | | 1,243 | | 4.67 | | | | 32,504 | | | | 1,375 | | 4.23 | | | | (307 | ) | | | 175 | |
| | | | | | | | | | | | | | | | | | | | | | | | | | | | |
Total earning assets | | | 367,043 | | | | 30,078 | | 8.19 | | | | 269,957 | | | | 20,869 | | 7.73 | | | | 8,111 | | | | 1,099 | |
Cash and due from banks | | | 6,643 | | | | | | | | | | 6,805 | | | | | | | | | | | | | | | |
Premises and equipment | | | 3,116 | | | | | | | | | | 2,948 | | | | | | | | | | | | | | | |
Accrued interest and other assets | | | 9,997 | | | | | | | | | | 8,301 | | | | | | | | | | | | | | | |
Allowance for loan losses | | | (3,289 | ) | | | | | | | | | (2,408 | ) | | | | | | | | | | | | | | |
| | | | | | | | | | | | | | | | | | | | | | | | | | | | |
Total assets | | $ | 383,510 | | | | | | | | | $ | 285,603 | | | | | | | | | | | | | | | |
| | | | | | | | | | | | | | | | | | | | | | | | | | | | |
LIABILITIES | | | | | | | | | | | | | | | | | | | | | | | | | | | | |
Interest-bearing deposits: | | | | | | | | | | | | | | | | | | | | | | | | | | | | |
Demand deposits | | | 14,579 | | | | 323 | | 2.22 | | | | 12,427 | | | | 172 | | 1.38 | | | | 33 | | | | 118 | |
Savings deposits | | | 69,647 | | | | 2,283 | | 3.28 | | | | 60,392 | | | | 1,433 | | 2.37 | | | | 244 | | | | 606 | |
Time deposits | | | 155,160 | | | | 7,953 | | 5.13 | | | | 90,471 | | | | 4,101 | | 4.53 | | | | 3,254 | | | | 598 | |
| | | | | | | | | | | | | | | | | | | | | | | | | | | | |
Total interest-bearing deposits | | | 239,386 | | | | 10,559 | | 4.41 | | | | 163,290 | | | | 5,706 | | 3.49 | | | | 3,531 | | | | 1,322 | |
Federal funds purchased | | | 1,404 | | | | 83 | | 5.90 | | | | 1,368 | | | | 75 | | 5.48 | | | | 2 | | | | 6 | |
Federal Home Loan Bank advances | | | 47,855 | | | | 2,422 | | 5.06 | | | | 39,288 | | | | 1,979 | | 5.04 | | | | 434 | | | | 9 | |
Junior subordinated debt | | | 13,580 | | | | 986 | | 7.26 | | | | 6,188 | | | | 491 | | 7.93 | | | | 533 | | | | (38 | ) |
| | | | | | | | | | | | | | | | | | | | | | | | | | | | |
Total interest-bearing liabilities | | | 302,225 | | | | 14,050 | | 4.65 | | | | 210,134 | | | | 8,251 | | 3.93 | | | | 4,500 | | | | 1,299 | |
Noninterest-bearing deposits | | | 52,876 | | | | | | | | | | 55,000 | | | | | | | | | | | | | | | |
Accrued interest and other liabilities | | | 3,417 | | | | | | | | | | 1,423 | | | | | | | | | | | | | | | |
| | | | | | | | | | | | | | | | | | | | | | | | | | | | |
Total liabilities | | | 358,518 | | | | | | | | | | 266,557 | | | | | | | | | | | | | | | |
Stockholders’ equity | | | 24,992 | | | | | | | | | | 19,046 | | | | | | | | | | | | | | | |
| | | | | | | | | | | | | | | | | | | | | | | | | | | | |
Total liabilities and stockholders’ equity | | $ | 383,510 | | | | | | | | | $ | 285,603 | | | | | | | | | | | | | | | |
| | | | | | | | | | | | | | | | | | | | | | | | | | | | |
Interest revenue as a percentage of average earning assets | | | | | | | | | 8.19 | % | | | | | | | | | 7.73 | % | | | | | | | | |
Interest expense as a percentage of average earning assets | | | | | | | | | 3.82 | % | | | | | | | | | 3.06 | % | | | | | | | | |
Net interest income on a taxable- equivalent basis and net interest margin | | | | | | $ | 16,028 | | 4.37 | % | | | | | | $ | 12,618 | | 4.67 | % | | | | | | | | |
| | | | | | | | | | | | | | | | | | | | | | | | | | | | |
Changes in income and expense which are not due solely to rate or volume have been allocated proportionately. Average loan balances include nonaccrual loans. Taxable-equivalent adjustments relate to tax-exempt investment securities and loans.
27
Yields on certain asset categories and the net interest margin of the Company and its banking subsidiaries are reviewed on a fully taxable-equivalent basis (“FTE”). In this non-GAAP presentation, net interest income is adjusted to reflect tax-exempt interest income on an equivalent before-tax basis. This measure ensures comparability of net interest income arising from both taxable and tax-exempt sources. The following table shows the reconciliation between net interest income and the taxable-equivalent net interest income as of December 31, 2008, December 31, 2007, and December 31, 2006:
| | | | | | | | | | | | |
| | | December 31, | |
| | | 2008 | | | 2007 | | | 2006 | |
| | | (in thousands) | |
Net Interest Margin | | | | | | | | | | | | |
Interest income (GAAP) | | $ | 28,430 | | | $ | 30,004 | | | $ | 20,786 | |
Taxable-equivalent adjustment: | | | | | | | | | | | | |
Loans | | | 13 | | | | 11 | | | | 12 | |
Investments | | | 52 | | | | 63 | | | | 71 | |
| | | | | | | | | | | | |
Interest income—FTE | | | 28,495 | | | | 30,078 | | | | 20,869 | |
Interest expense (GAAP) | | | 12,738 | | | | 14,050 | | | | 8,251 | |
| | | | | | | | | | | | |
Net interest income—FTE | | $ | 15,757 | | | $ | 16,028 | | | $ | 12,618 | |
| | | | | | | | | | | | |
Net interest income—(GAAP) | | $ | 15,692 | | | $ | 15,954 | | | $ | 12,535 | |
| | | | | | | | | | | | |
Average interest earning assets | | $ | 429,991 | | | $ | 367,043 | | | $ | 269,957 | |
Net interest margin (GAAP) | | | 3.65 | % | | | 4.35 | % | | | 4.64 | % |
Net interest margin—FTE | | | 3.66 | % | | | 4.37 | % | | | 4.67 | % |
Provision and Allowance for Loan Losses
The provision for loan losses was $11,961,000 in 2008 compared to $1,926,000 and $810,000 for 2007 and 2006, respectively. At December 31, 2008, the allowance for loan losses was $10,498,000 or 2.48 percent of total loans, compared with $4,166,000 or 1.11 percent of total loans December 31, 2007, and $2,784,000, or 0.95 percent of total loans at December 31, 2006. Nonperforming loans (nonaccrual loans and loans over 90 days past due) to total loans at the end of 2008 were 5.67 percent compared to 0.22 percent at December 31, 2007 and 0.17 percent at December 31, 2006.
The increase in the provision for loan losses in 2008 as compared with 2007 resulted from increase in net charge-offs, higher levels of impaired loans at year-end and increases in the overall level of risk in the loan portfolio resulting from the weakening economy.
During the fourth quarter of 2008, the Company experienced significant credit quality deterioration in the loan portfolio, which resulted in the need for significant provision for loan losses to be made for the quarter. At December 31, 2008, impaired loans were $25,616,000 as compared to $9,356,000 at September 30, 2008 and $1,677,000 at December 31, 2007. As a result of the significant increase in the impaired loans, net charge-offs for the fourth quarter of 2008 were $4,706,000 as compared to $923,000 for the combined first three quarters of 2008 and $544,000 for 2007.
In addition to the increase in impaired loans and net charge-offs, the Company saw a significant increase in non-impaired classified loans during the fourth quarter. Although the Company has evaluated these loans and determined that these loans are not impaired as of December 31, 2008, the deterioration of these credits has significantly increased the risk inherent in the non-impaired loan portfolio. As a result, additional provision for loan losses was made during the fourth quarter for the general component of the allowance for loan losses, increasing it to 1.80% as of December 31, 2008 of total loans as compared to 0.94% of total loans as of December 31, 2007.
28
The increase in the impaired loans during the fourth quarter was largely a result of deterioration in the Company’s construction real estate portfolio. The specific allowance allocated to impaired loans at December 31, 2008 was $2,882,000 as compared to $630,000 at December 31, 2007.
For each impaired loan, management determines the need for a specific allowance by calculating the fair value of the underlying collateral. The underlying collateral typically consists of real estate or business assets. The Company typically obtains updated independent appraisals, financial statements or other source documents to determine the gross collateral value. If necessary, adjustments are made to the collateral value to calculate what management deems as fair value of the collateral. This fair value is then compared to the unpaid principal balance to determine if a specific allowance allocation is necessary. Management periodically assesses the fair value to determine if further adjustments are necessary. If the real estate market deterioration continues in future periods, further adjustments to the fair value may be necessary which could increase the specific allocation on these impaired loans in future periods.
The increase in the provision for loan losses in 2007 as compared to 2006 resulted largely from an increase in the absolute level of credit risk inherent in the loan portfolio resulting from loan growth, an increase in loan charge-offs in 2007 compared with 2006, an increase in specific allocations on loans deemed to be impaired at year-end, and changes in loan portfolio composition.
The ratio of the allowance for loan losses to total loans at December 31, 2007 was 1.11 percent as compared with 0.95 percent at year-end 2006. The increase in ratio resulted largely from an increase in specific allocations on loans deemed to be impaired at December 31, 2007 as compared to December 31, 2006, as well as changes in the composition of the loan portfolio.
Management evaluates the adequacy of the allowance on a quarterly basis after consideration of a number of factors, including the volume and composition of the loan portfolio, potential impairment of individual loans, concentrations of credit, past loss experience, current delinquencies, information about specific borrowers, current economic conditions, and other factors.
The Company considers the allowance for loan losses adequate to cover probable incurred losses, however, no assurance can be given that actual losses will not exceed estimated amounts. In addition, changes in factors such as regional economic conditions and the financial strength of commercial and individual borrowers may require changes in the level of the allowance, cause increases in problem assets, delinquencies and losses on loans, and result in fluctuations in reported earnings.
An analysis of the changes in the allowance for loan losses, including provisions, recoveries, and loans charged off is presented in Note 6: Allowance for Loan Losses to the consolidated financial statements.
Noninterest Income
Noninterest income in 2008, 2007, and 2006 totaled $7,795,000, $1,547,000, and $1,828,000, respectively.
The $6,248,000, or 404 percent, increase in 2008 compared with 2007 was the result of a $6,159,000 gain on redemption and interest in escrow fund resulting from the bank’s ownership of Visa shares.
The decrease of 15 percent in 2007 as compared to 2006 was primarily due to a $444,000 loss recognized on the sale of the AMF Ultra Short Mortgage Fund. Among other things, a reason for the sale of the investment was to provide liquidity to the Company to fund loan growth. In addition, management considered the uncertainty relating to residential mortgage investments from the recent turmoil in the residential mortgage market. The decrease was offset by increased income from service charges on deposits. These service charges, which were primarily overdraft and account analysis fees, rose $246,000 year over year and was partially offset by a decline in income from commissions and fees. This decline in income from commissions and fees resulted from the
29
Company no longer offering the financial planning and investment services in 2007 that were previously offered in 2006.
Noninterest Expense
The Company’s total noninterest expense for 2008, 2007, and 2006 was $14,761,000, $13,666,000, $10,950,000, respectively.
Noninterest expense rose $1,095,000, or 8 percent in 2008 compared with 2007. Salaries and employee benefits rose from $6,086,000 to $6,597,000, an increase of $511,000 or 8 percent, in part due to the opening of our Kent branch early in the year. Occupancy and equipment expense rose $295,000, or 15 percent, reflecting the opening of the Kent branch and also expenses related to the expansion of the Bank’s loan administration function. Other non-interest expense rose $761,000, or 47% in 2008 compared with 2007, due primarily to a $376,000 increase in FDIC insurance premiums and due to the general growth of the Company. The Company anticipates further increases in FDIC insurance premiums in 2009. The increase in professional fees of $167,000 was primarily loan related. The year over year increase in total noninterest expense was also impacted by the reduction of $1,002,000 of 2007’s noninterest expense resulting from the Company’s termination of its post-retirement benefit plan.
Noninterest expense increased $2,716,000 or 25 percent in 2007 compared with 2006. The increase is primarily attributable to a $2,122,000 charge recognized for the Company’s indemnification obligation to Visa Inc. See page 38 Contractual Obligations and Commitments and Note 18: Commitments and Contingencies to the consolidated financial statements for further discussion of Visa, Inc and the Company’s indemnification obligation as a Visa member bank. The increase in noninterest expense is also attributable to a rise in salaries and employee benefits expense of $670,000. The rise in salaries and benefits expense of 12 percent was primarily due to the addition of approximately 5 full-time equivalent staff (“FTE’s”) during 2007. The Company’s objective in the addition of the new FTE’s was to reduce expense related to the outsourcing of certain functions and to increase support in strategic areas to facilitate growth in the Company. The increase in salaries and benefits was also due to an increase in stock compensation expense resulting from the award of stock grants in the second half of the year. Offsetting the increase in salaries and employee benefits was a gain recognized on the settlement of the Company’s post-retirement plan which occurred in November 2007. At the time of plan settlement, payments consisting of a combination of annuities and cash were given to plan participants in exchange for their rights to receive future postretirement benefits as defined under the plan. The payments, which totaled approximately $900,000, as compared to the Company’s accrued post-retirement benefit obligation of $1,900,000, resulted in a gain of approximately $1,000,000. Occupancy and equipment expense rose $159,000 primarily due to the increase in depreciation expense related to a remodel completed in the fourth quarter of 2006. The Company also accelerated depreciation expense on leasehold improvements relating to one of its branches as a result of a change in estimated useful life. The increase in data processing expense is mainly due to one time charges and ongoing monthly costs related to a change in the Company’s core data processor completed in the second quarter of 2007. Professional fees were $280,000 in 2007 compared with $318,000. This decrease resulted from the reduction of outsourced services previously provided to the Company prior to 2007. Marketing expense grew $70,000 or 14 percent year over year, as the Company continued its focus to grow core deposits. State and local taxes grew $185,000 or 52 percent due to increased revenues in 2007. The year over year rise in other noninterest expense of $347,000 was due to an increase in charitable contributions, staff recruitment expense, and liability insurance. Other noninterest expense was partially offset by a reimbursement of legal fees of $72,000 made to the Company when it received full repayment of a loan on which no interest had been accrued since 2005. The repayment included all principal and interest that would have been earned by the Company over that time period and reimbursement for legal and other expenses incurred by the Company from its collection efforts.
Income tax Expense
The Company had a net loss of $4,211,000 in 2008, however, recorded an income tax expense of $976,000 for 2008. This was due to the conclusion as of December 31, 2008 that it is more likely than not that the deferred
30
tax asset of $2,305,000 will not be realized and thus an additional valuation allowance of $2,154,000 was recorded. The effective tax rate in 2008 was 30 percent, compared with an effective tax rate of 38 percent in 2007.
Income tax expense for 2007 was $728,000 compared to $784,000 for 2006, a decrease of $56,000 or 7 percent. The effective tax rate for 2007 was 38 percent as compared to 30 percent for 2006. The increase in the effective tax rate was as result of the Company’s conclusion that as of December 31, 2007 it was more likely than not that the deferred tax asset relating to the capital loss carryforward from the sale of the AMF Ultra Short Mortgage Fund in the fourth quarter of 2007 would not be realized and thus a valuation allowance for the capital loss was recorded.
Review of Financial Condition
Total assets increased 9 percent in 2008 to $461,618,000, securities decreased 23 percent to $9,586,000, loans increased 13 percent to $422,671,000, and deposits increased 16 percent to $358,890,000.
Analysis of Securities
The components of the investment portfolio were as follows at December 31:
| | | | | | | | | |
| | | 2008
Carrying
Value | | 2007
Carrying
Value | | 2006
Carrying
Value |
| | | (In thousands) |
U.S. agencies | | $ | 3,999 | | $ | 5,500 | | $ | 4,504 |
State and political subdivisions | | | 2,530 | | | 3,383 | | | 4,187 |
AMF Ultra Short Mortgage Fund | | | — | | | — | | | 15,206 |
Mortgage-backed securities and collateralized mortgage obligations | | | 2,933 | | | 3,643 | | | 4,699 |
| | | | | | | | | |
Total | | $ | 9,462 | | $ | 12,526 | | $ | 28,596 |
| | | | | | | | | |
The securities portfolio carrying value decreased $3,064,000 from December 31, 2007 to December 31, 2008. The decrease resulted primarily from maturities, and principal payments on securities.
The securities portfolio carrying value decreased $16,070,000 from December 31, 2006 to December 31, 2007. The decrease resulted primarily from the sale of the AMF Ultra Short Mortgage Fund of $14,762,000. For further discussion of the sale, see Note 4: Securities to the consolidated financial statements.
31
The following table sets forth the maturities of securities at December 31, 2008. Taxable equivalent values are used in calculating yields assuming a tax rate of 34 percent.
| | | | | | | | | | | | | | | | | | | | |
| | | Within 1 Year/
Yield | | | After 1 Year
But Within
5 Years/
Yield | | | After 5 Years
But Within
10 Years/
Yield | | | After
10 Years/
Yield | | | Total and
Weighted
Average
Yield | |
| | | (In thousands, carrying value) | |
U.S. agencies | | $ | — | | | $ | 3,999 | | | $ | — | | | $ | — | | | $ | 3,999 | |
| | | — | | | | 4.30 | % | | | — | | | | — | | | | 4.30 | % |
State and political subdivisions | | | 751 | | | | 1,779 | | | | — | | | | — | | | | 2,530 | |
| | | 4.36 | % | | | 4.99 | % | | | — | | | | — | | | | 4.80 | % |
Mortgage-backed securities and collateralized mortgage obligations | | | — | | | | 84 | | | | 2,500 | | | | 349 | | | | 2,933 | |
| | | — | | | | 5.73 | % | | | 4.50 | % | | | 4.16 | % | | | 4.49 | % |
| | | | | | | | | | | | | | | | | | | | |
Total | | $ | 751 | | | $ | 5,862 | | | $ | 2,500 | | | $ | 349 | | | $ | 9,462 | |
| | | | | | | | | | | | | | | | | | | | |
For more information and analysis regarding securities see Note 4: Securities to the consolidated financial statements.
Loans
At December 31, 2008, loans totaled $422,671,000, compared to $375,428,000 at December 31, 2007, an increase of $47,243,000 or 13 percent over December 31, 2007. At December 31, 2008, the Bank had $303,199,000 in loans secured by real estate, compared to $262,733,000 at December 31, 2007 representing 72 and 70 percent of the total portfolio at year-end 2008 and 2007, respectively.
The following tables set out the composition of the types of loans, the allocation of the allowance for loan losses, and the analysis of the allowance for loan losses for the years ended December 31:
Types of Loans
| | | | | | | | | | | | | | | |
| | | 2008 | | 2007 | | 2006 | | 2005 | | 2004 |
| | | (In thousands) |
Commercial | | $ | 94,190 | | $ | 89,146 | | $ | 85,067 | | $ | 61,921 | | $ | 55,563 |
Real estate: | | | | | | | | | | | | | | | |
Commercial | | | 169,754 | | | 159,167 | | | 118,070 | | | 76,902 | | | 67,165 |
Construction | | | 99,484 | | | 58,968 | | | 34,813 | | | 6,953 | | | 11,538 |
Residential 1-4 family * | | | 33,961 | | | 44,598 | | | 36,875 | | | 28,195 | | | 11,508 |
Consumer and other | | | 25,282 | | | 23,549 | | | 17,624 | | | 15,217 | | | 13,882 |
| | | | | | | | | | | | | | | |
Total | | $ | 422,671 | | $ | 375,428 | | $ | 292,449 | | $ | 189,188 | | $ | 159,656 |
| | | | | | | | | | | | | | | |
| * | Residential 1-4 family includes $5,753,000 and $13,882,000 of loans purchased from a mortgage broker in 2006 and 2005, respectively. |
Origination of Loans The lending activities of the Bank are subject to the written underwriting standards and loan origination procedures established by the Board of Directors and management. Loan originations are obtained primarily through referrals from customers, along with direct marketing efforts of the loan officers. Written loan applications and credit analysis is performed by the loan officers and credit analysts. The loan officers also supervise the procurement of credit reports, appraisals, and other documentation involved with a loan. Property valuations are performed by independent outside appraisers.
32
The Bank’s loan approval process is intended to assess the borrower’s ability to repay the loan, the viability of the loan and adequacy of the value of any collateral that will secure the loan. The Bank’s loan policy authorizes certain senior vice presidents to approve aggregate extensions of credit up to $200,000. The Chief Lending Officer is authorized to approve aggregate extensions of credit up to $1,000,000. The Chief Credit Officer is authorized to extend credit of up to $2,500,000. Staff Credit Committee, consisting of the Chief Lending Officer, the Chief Credit Officer and the Chief Executive Officer is authorized collectively to extend credit up to $3,750,000. Loans to borrowers with aggregate borrowings above $3,750,000 are approved by the Board Credit Committee.
Commercial Loans At December 31, 2008, commercial loans amounted to $94,190,000, or 22 percent of the loan portfolio. Commercial loans generally have a term of up to five years and may have either floating rates tied to the Bank’s internal base rate or fixed rates of interest. Commercial loans are made to small and medium-sized businesses within the Bank’s market area. A majority of the Bank’s commercial loans are secured by real estate, equipment and other corporate assets. The Bank also generally obtains personal guarantees from the principals of the borrower. In addition, the Bank may extend loans for a commercial business purpose which are secured by a mortgage on the proprietor’s home or business property.
Commercial Real Estate Loans The commercial real estate loan portfolio generally consists of loans secured by office buildings, warehouses, production facilities, and retail stores generally located within the Seattle metropolitan area. In addition, the Bank has purchased participation interests in commercial real estate loans from various financial institutions in the region. Commercial real estate loans amounted to $169,754,000, or 40 percent of the total loan portfolio at December 31, 2008. Participation interest in commercial real estate loans purchased amounted to $5,999,000, or 4 percent of the commercial real estate portfolio at December 31, 2008. Before purchasing such loans, the Bank utilizes the same underwriting standard and criteria as it would if it had originated the loans.
The Bank’s commercial real estate loans typically have a loan-to-value ratio of 80 percent or less and generally have shorter maturities than one-to-four family residential loans. The maximum term of the Bank’s commercial real estate loans is from 5 to 10 years based on up to a 25-year amortization schedule. Most have adjustable rates tied to the Seattle Federal Home Loan Bank rates, but some have fixed rates. For each real estate loan, the Bank requires a title insurance policy, fire and extended coverage casualty insurance, and a flood insurance policy when the property is in a flood hazard area.
Commercial real estate lending is generally considered to have a higher degree of risk than one-to-four family residential lending. Such lending typically involves large loan balances concentrated in single borrower or groups of related borrowers for rental or business properties. In addition, the payment experience on loans secured by income-producing properties is typically dependent on the success of the operation of the related project and thus is typically affected by adverse conditions in the real estate market and in the economy. The Bank typically attempts to mitigate the risk associated with its real estate lending by, among other things, lending primarily in its market area and using conforming loan-to-value ratios in the underwriting process.
The Bank also offers multi-family (over four units) residential loans. The multi-family residential mortgage loans are underwritten on substantially the same basis as its commercial real estate loans, with loan-to-value ratios of up to 80 percent. At December 31, 2008, the Bank had $31,984,000 in multi-family residential mortgage loans which amounted to 19 percent of the commercial real estate portfolio.
Construction Loans Construction loans amounted to $99,484,000, or 24 percent of the total loan portfolio at December 31, 2008. The Bank provides construction financing for single family home builders, condominium conversions and for commercial construction projects. To mitigate the higher risk factors associated with construction financing, the Bank typically underwrites loans with conservative loan-to-value ratios, with maximum loan-to-value ratios of 80 percent and maximum loan-to-construction cost ratios of 90 percent. All construction loan advances are subject to inspection requirements of a third party construction monitoring expert. Construction lending is limited to experienced developers and contractors, and all loans have recourse to the
33
ownership group. Construction loans are typically variable rate loans, with short 12-18 month maturities, with identified take-out financing. Due to the recent economic downturn and the impact of this downturn on the real estate values, the Company has seen deterioration its construction loan portfolio, which has resulted in a significant increase in impaired loans and non-impaired classified credits. The Company is taking the necessary steps to review it loan portfolio to ensure that all potential problem loans have been identified,
One-to-Four Family Residential Real Estate Loans The Bank originates a limited number of loans secured by one-to-four family residences to commercial clients of the bank. As of December 31, 2008, $33,961,000, or 8 percent of the total portfolio, before net items, consisted of one-to-four family residential loans.
For residential real estate lending, loan-to-value ratio, maturity, and other provisions of the loans made by the Bank generally have reflected the policy of making less than the maximum loan permissible under applicable regulations, in accordance with sound lending practices, market conditions, and underwriting standards established by the Bank. The Bank’s present lending policies on one-to-four family residential mortgage loans generally limit the maximum loan-to-value ratio to 80 percent of the lesser of the appraised value or purchase price of the property. Residential mortgage loans are amortized on a monthly basis with principal and interest due each month. The loans generally include “due-on-sale” clauses.
Under the lending policy of the Bank, a title insurance policy must be obtained for each real estate loan. The Bank also requires fire and extended coverage casualty insurance, in order to protect the properties securing its real estate loans. Borrowers must also obtain flood insurance policies when the property is in a flood hazard area as designated by the Department of Housing and Urban Development.
Consumer Loans The Bank originates consumer loans in order to provide a full range of financial services to its customers and because such loans generally have shorter terms and higher interest rates than residential mortgage loans. At December 31, 2008, the Bank had $25,282,000 in consumer loan debt, or 6 percent of the Bank’s total loan portfolio. The consumer loans offered by the Bank include home equity loans, automobile loans, and a small aggregate amount of unsecured lines of credit.
Collections The Bank mails delinquency notices to borrowers when a borrower fails to make a required payment within 15 days of the date due. Additional notices are sent out when a loan becomes 30 days or 60 days past due. If a loan becomes 90 days past due, the Bank generally mails a notice indicating that the Bank may refer it to an attorney within 30 days to commence foreclosure. In most cases, deficiencies are cured promptly. While the Bank generally prefers to work with borrowers to resolve such problems, the Bank will institute foreclosure or other collection proceedings when necessary to minimize any potential loss.
Nonaccrual Loans Loans are placed on nonaccrual status when management believes the probability of collection of interest is insufficient to warrant further accrual. When a loan is placed on nonaccrual status, previously accrued but unpaid interest is deducted from interest income. As a matter of policy, the Bank generally discontinues the accrual of interest income when the loan becomes 90 days past due as to principal or interest.
The following table shows the amounts maturing or repricing as of December 31, 2008:
| | | | | | | | | | | | |
| | | Within
1 Year | | 1-5
Years | | After
5 Years | | Total |
| | | (In thousands) |
Commercial | | $ | 66,593 | | $ | 23,796 | | $ | 3,801 | | $ | 94,190 |
Real estate: | | | | | | | | | | | | |
Commercial | | | 56,319 | | | 97,484 | | | 15,951 | | | 169,754 |
Construction | | | 93,895 | | | 5,199 | | | 390 | | | 99,484 |
Residential 1-4 family | | | 13,543 | | | 9,057 | | | 11,361 | | | 33,961 |
Consumer and other | | | 18,800 | | | 4,849 | | | 1,633 | | | 25,282 |
| | | | | | | | | | | | |
Total | | $ | 249,150 | | $ | 140,385 | | $ | 33,136 | | $ | 422,671 |
| | | | | | | | | | | | |
34
Loans maturing by fixed or variable rates after one year:
| | | | | | |
| | | 1-5
Years | | After
5 Years |
| | | (In thousands) |
Fixed rates | | $ | 43,663 | | $ | 35,803 |
Variable rates | | | 21,998 | | | 97,476 |
| | | | | | |
Total | | $ | 65,661 | | $ | 133,279 |
| | | | | | |
Allocation of the Allowance for Loan Losses
In the following table, the allowance for loan losses has been allocated among major loan categories based on a number of factors including quality, volume, current economic outlook and other business considerations for the years ended December 31:
| | | | | | | | | | | | | | | | | | | | | | | | | | | | | | |
| | | 2008
Allocated
Amount | | | % of
Loans
in Each
Category
to Total
Loans | | 2007
Allocated
Amount | | | % of
Loans
in Each
Category
to Total
Loans | | 2006
Allocated
Amount | | | % of
Loans
in Each
Category
to Total
Loans | | 2005
Allocated
Amount | | | % of
Loans
in Each
Category
to Total
Loans | | 2004
Allocated
Amount | | | % of
Loans
in Each
Category
to Total
Loans |
| | | (In thousands) |
Commercial | | $ | 3,272 | | | 22 | | $ | 1,644 | | | 24 | | $ | 919 | | | 29 | | $ | 987 | | | 33 | | $ | 1,000 | | | 35 |
Real estate: | | | | | | | | | | | | | | | | | | | | | | | | | | | | | | |
Commercial | | | 3,104 | | | 40 | | | 1,526 | | | 42 | | | 1,120 | | | 40 | | | 651 | | | 40 | | | 568 | | | 42 |
Construction | | | 3,042 | | | 24 | | | 663 | | | 16 | | | 440 | | | 12 | | | 72 | | | 4 | | | 117 | | | 7 |
Residential 1-4 family | | | 600 | | | 8 | | | 42 | | | 12 | | | 36 | | | 13 | | | 106 | | | 15 | | | 11 | | | 7 |
Consumer and other | | | 480 | | | 6 | | | 291 | | | 6 | | | 269 | | | 6 | | | 240 | | | 8 | | | 191 | | | 9 |
| | | | | | | | | | | | | | | | | | | | | | | | | | | | | | |
Total | | $ | 10,498 | | | 100 | | $ | 4,166 | | | 100 | | $ | 2,784 | | | 100 | | $ | 2,056 | | | 100 | | $ | 1,887 | | | 100 |
| | | | | | | | | | | | | | | | | | | | | | | | | | | | | | |
% of loan portfolio | | | 2.48 | % | | | | | 1.11 | % | | | | | 0.95 | % | | | | | 1.09 | % | | | | | 1.18 | % | | |
| | | | | | | | | | | | | | | | | | | | | | | | | | | | | | |
This allocation of the allowance for loan losses should not be interpreted as an indication that charge-offs will occur in these amounts or proportions, or that the allocation indicates future charge-off trends. Furthermore, the portion allocated to each category is not the total amount available for losses that might occur within each category.
35
Analysis of the Allowance for Loan Losses
The following table summarizes transactions in the allowance for loan losses and details the charge-offs, recoveries, and net loan losses by loan category for the years ended December 31:
| | | | | | | | | | | | | | | | | | | | |
| | | 2008 | | | 2007 | | | 2006 | | | 2005 | | | 2004 | |
| | | (In thousands) | |
Beginning balance | | $ | 4,166 | | | $ | 2,784 | | | $ | 2,056 | | | $ | 1,887 | | | $ | 1,636 | |
Charge-offs: | | | | | | | | | | | | | | | | | | | | |
Commercial | | | 1,869 | | | | 473 | | | | 88 | | | | 252 | | | | 24 | |
Real estate: | | | | | | | | | | | | | | | | | | | | |
Commercial | | | — | | | | — | | | | — | | | | 1 | | | | — | |
Construction | | | 2,517 | | | | — | | | | — | | | | — | | | | — | |
Residential 1-4 family | | | 938 | | | | — | | | | — | | | | — | | | | — | |
Consumer and other | | | 393 | | | | 149 | | | | 30 | | | | 41 | | | | 146 | |
| | | | | | | | | | | | | | | | | | | | |
Total charge-offs | | | 5,717 | | | | 622 | | | | 118 | | | | 294 | | | | 170 | |
Recoveries: | | | | | | | | | | | | | | | | | | | | |
Commercial | | | 6 | | | | 62 | | | | 28 | | | | 26 | | | | 87 | |
Real estate: | | | | | | | | | | | | | | | | | | | | |
Commercial | | | — | | | | — | | | | — | | | | — | | | | — | |
Construction | | | — | | | | — | | | | — | | | | — | | | | — | |
Residential 1-4 family | | | 46 | | | | — | | | | — | | | | — | | | | — | |
Consumer and other | | | 36 | | | | 16 | | | | 8 | | | | 14 | | | | 13 | |
| | | | | | | | | | | | | | | | | | | | |
Total recoveries | | | 88 | | | | 78 | | | | 36 | | | | 40 | | | | 100 | |
| | | | | | | | | | | | | | | | | | | | |
Net charge-offs/(recoveries) | | | 5,629 | | | | 544 | | | | 82 | | | | 254 | | | | 70 | |
Provision | | | 11,961 | | | | 1,926 | | | | 810 | | | | 423 | | | | 321 | |
| | | | | | | | | | | | | | | | | | | | |
Ending balance | | $ | 10,498 | | | $ | 4,166 | | | $ | 2,784 | | | $ | 2,056 | | | $ | 1,887 | |
| | | | | | | | | | | | | | | | | | | | |
Ratio of net charge-offs to average loans outstanding | | | 1.38 | % | | | 0.16 | % | | | 0.03 | % | | | 0.16 | % | | | 0.05 | % |
| | | | | | | | | | | | | | | | | | | | |
Nonperforming Loans and Assets
The following table sets forth the amounts and categories of nonperforming loans and assets for the years ended December 31:
| | | | | | | | | | | | | | | | | | | | |
| | | 2008 | | | 2007 | | | 2006 | | | 2005 | | | 2004 | |
| | | (In thousands) | |
Nonaccruing loans: | | | | | | | | | | | | | | | | | | | | |
Commercial | | $ | 1,283 | | | $ | 760 | | | $ | 44 | | | $ | 37 | | | $ | 182 | |
Real Estate | | | 21,447 | | | | — | | | | 343 | | | | 661 | | | | — | |
Consumer | | | 52 | | | | 19 | | | | 79 | | | | 37 | | | | 31 | |
| | | | | | | | | | | | | | | | | | | | |
Total (1) | | | 22,782 | | | | 779 | | | | 466 | | | | 735 | | | | 213 | |
Accruing loans delinquent 90 days or more: | | | | | | | | | | | | | | | | | | | | |
Commercial | | | 22 | | | | — | | | | — | | | | 401 | | | | 5 | |
Real Estate | | | 997 | | | | — | | | | — | | | | — | | | | — | |
Consumer | | | 166 | | | | 36 | | | | 31 | | | | 13 | | | | — | |
| | | | | | | | | | | | | | | | | | | | |
Total | | | 1,185 | | | | 36 | | | | 31 | | | | 414 | | | | 5 | |
| | | | | | | | | | | | | | | | | | | | |
Total nonperforming loans | | | 23,966 | | | | 815 | | | | 497 | | | | 1,149 | | | | 218 | |
Other real estate owned | | | 4,901 | | | | — | | | | — | | | | — | | | | — | |
| | | | | | | | | | | | | | | | | | | | |
Total nonperforming assets | | $ | 28,867 | | | $ | 815 | | | $ | 497 | | | $ | 1,149 | | | $ | 218 | |
| | | | | | | | | | | | | | | | | | | | |
Total nonperforming loans as a percentage of loans | | | 5.67 | % | | | 0.22 | % | | | 0.17 | % | | | 0.61 | % | | | 0.14 | % |
| | | | | | | | | | | | | | | | | | | | |
Total nonperforming assets as a percentage of assets | | | 6.25 | % | | | 0.19 | % | | | 0.14 | % | | | 0.46 | % | | | 0.10 | % |
| | | | | | | | | | | | | | | | | | | | |
| (1) | If interest on these nonaccruing loans had been recognized, such income would have been $426,000, $35,000, $50,000, $29,000, and $9,000 for 2008, 2007, 2006, 2005, and 2004. |
36
Impaired loans as of December 31, 2008 were $25,616,000 as compared to $1,677,000 at December 31, 2007. Specific allowance allocated to impaired loans increased to $2,882,000 at December 31, 2008 as compared to $630,000 at December 31, 2007.
Included in the impaired loans as of December 31, 2007 was a loan relationship totaling $898,000 in outstanding balances. Although, a collateral liquidation analysis on the underlying collateral showed a collateral shortfall of approximately $400,000, the Company, based on its analysis of the discounted cash flows, believed the operations under the anticipated restructured loans terms would meet the original value of the loans, thus no specific allocation was provided on this credit in 2007. Although the loan relationship was designated as impaired, the loans were not on non-accrual status or past due over 90 days and thus were not considered nonperforming loans as of December 31, 2007. The Company continued to monitor the performance of the loan relationship, including the borrower’s cash flow position. In 2008, the borrower’s cash flow deteriorated such that it became apparent that the loan would not be repaid under the restructured terms and the portion of the loan relationship deemed to be uncollectible was charged off in December 2008.
Nonperforming loans include nonaccrual loans and accruing loans delinquent 90 days or more. Loans are generally placed on nonaccrual status when the loan is 90 days or more past due as to principal and interest, unless the loan is well-secured and in the process of collection. If management believes that collection is doubtful after considering relevant conditions, accrual of interest is discontinued immediately.
Deposits
The average daily amount of deposits and rates paid on interest bearing deposits is summarized for the periods indicated in the following table:
| | | | | | | | | | | | | | | | | | |
| | | 2008 | | | 2007 | | | 2006 | |
| | | Amount | | Rate | | | Amount | | Rate | | | Amount | | Rate | |
| | | (In thousands) | |
DEPOSITS | | | | | | | | | | | | | | | | | | |
Noninterest bearing demand | | $ | 50,029 | | 0.00 | % | | $ | 52,876 | | 0.00 | % | | $ | 55,000 | | 0.00 | % |
Interest bearing demand | | | 20,079 | | 1.62 | | | | 14,579 | | 2.22 | | | | 12,427 | | 1.38 | |
Savings deposits | | | 63,509 | | 1.99 | | | | 69,647 | | 3.28 | | | | 60,392 | | 2.37 | |
Time deposits: | | | | | | | | | | | | | | | | | | |
Certificate of deposit, under $100,000 | | | 37,269 | | 5.53 | | | | 38,671 | | 5.76 | | | | 24,996 | | 4.48 | |
Certificate of deposit, over $100,000 * | | | 143,671 | | 3.77 | | | | 97,689 | | 4.89 | | | | 45,957 | | 4.32 | |
Public Funds | | | 19,139 | | 2.76 | | | | 18,800 | | 5.08 | | | | 19,518 | | 5.09 | |
| | | | | | | | | | | | | | | | | | |
Total time deposits | | | 200,079 | | 4.00 | % | | | 155,160 | | 5.13 | % | | | 90,471 | | 4.53 | % |
| | | | | | | | | | | | | | | | | | |
Total | | $ | 333,696 | | | | | $ | 292,262 | | | | | $ | 218,290 | | | |
| | | | | | | | | | | | | | | | | | |
| * | includes brokered certificates of deposit |
Maturities of time certificates of deposits of $100,000 or more outstanding as of December 31, 2008 are summarized as follows:
| | | |
| | | Amount |
| | | (In thousands) |
3 months or less | | $ | 81,265 |
Over 3 months through 6 months | | | 28,108 |
Over 6 months through 12 months | | | 46,262 |
Over 12 months | | | 30,303 |
| | | |
Total | | $ | 185,938 |
| | | |
37
Borrowings
The following tables set forth certain information with respect to federal funds purchased and FHLB advances for the periods indicated:
| | | | | | | | | | | | |
Federal Funds Purchased | | December 31,
2008 | | | December 31,
2007 | | | December 31,
2006 | |
| | | (In thousands) | |
Balance at end of year | | $ | — | | | $ | — | | | $ | — | |
Weighted average interest rate at end of year | | | — | | | | — | | | | — | |
Maximum amount outstanding | | | 1,332 | | | | 3,399 | | | | 2,370 | |
Average amount outstanding (1) | | | 322 | | | | 1,404 | | | | 1,368 | |
Weighted average interest rate during the year | | | 2.90 | % | | | 5.90 | % | | | 5.48 | % |
| (1) | Based on average amount outstanding at month end during each year. |
| | | | | | | | | | | | |
FHLB Advances | | December 31,
2008 | | | December 31,
2007 | | | December 31,
2006 | |
| | | (In thousands) | |
Balance at end of year | | $ | 64,825 | | | $ | 69,910 | | | $ | 46,805 | |
Weighted average interest rate at end of year | | | 2.59 | % | | | 4.65 | % | | | 5.21 | % |
Maximum amount outstanding | | | 100,925 | | | | 69,910 | | | | 49,644 | |
Average amount outstanding (1) | | | 67,654 | | | | 47,855 | | | | 39,288 | |
Weighted average interest rate during the year | | | 3.71 | % | | | 5.06 | % | | | 5.04 | % |
| (1) | Based on average amount outstanding for the month during each year. |
Junior Subordinated Debt (Trust Preferred Securities)
For discussion of junior subordinated debentures, please see Note 10: Borrowings and Junior Subordinated Debt to the consolidated financial statements.
As discussed in Note 2 to the consolidated financial statements, the Company, in accordance with the MOU, has suspended dividends and deferred payments on all junior subordinated debentures, effective with the March 15, 2009 payments. The terms of the debentures and trust indentures allow for the Company to defer interest payments for up to 20 consecutive quarters. As such, the deferral of interest does not constitute a default. During the period that the interest deferrals have been elected, the Company will continue to record the expense associated with the debentures. Upon the expiration of the deferral period, all accrued and unpaid interest is due and payable.
Contractual Obligations and Commitments
In the normal course of business, to meet the financing needs of its customers, the Company is a party to financial instruments with off-balance-sheet risk. These financial instruments include commitments to extend credit, lines of credit, and standby letters of credit. Such off-balance-sheet items are recognized in the financial statements when they are funded or related fees are received. The Company uses the same credit policies in making commitments and conditional obligations as it does for on-balance sheet instruments. The off-balance-sheet items do not represent unusual elements of credit risk in excess of the amounts recognized in the balance sheets.
At December 31, 2008, the Company had commitments to extend credit and contingent liabilities under lines of credit, standby letters of credit, and similar arrangements totaling $68,311,000. Since many lines of credit do not fully disburse, or expire without being drawn upon, the total amount does not necessarily reflect future cash requirements.
38
The Company, as a Visa member bank, is obligated to indemnify Visa for certain litigation losses. In the fourth quarter of 2007, the Company recognized indemnification charges of $2,122,000 related to this obligation. A receivable was recorded to offset the litigation reserve in March 2008 when, upon completion of its IPO, Visa, Inc. established an escrow account to be used to settle certain litigation judgments and settlements. In October 2008, the Company received notice from Visa, Inc. that it had reached a settlement in principle with Discover Financial Services, and as a result of the settlement recorded additional indemnification charges and an increase in its litigation liability totaling $572,000. In addition, the Company recorded a reduction of $1,113,000 in the receivable it booked in March 2008 due to payments made by Visa to American Express that reduced its litigation liability. In the fourth quarter of 2008, the Company recorded a gain that fully offset the $572,000 indemnification charges recorded in the third quarter as a result of Visa’s adjustment to the conversion rate between Class A and Class B Visa, Inc. shares of common stock. The Company currently owns approximately 129,000 shares of Visa, Inc. Class B common stock, which will convert into approximately 81,000 shares of Class A common stock using the current conversion rate. The Company expects that the shares it owns of Visa Inc., which are currently restricted, will be sufficient to cover any future possible litigation against Visa, Inc.
For additional information regarding off-balance-sheet items and the Visa, Inc. indemnification, refer to Note 18: Commitments and Contingencies to the consolidated financial statements.
The following table summarizes the Company’s significant contractual obligations and commitments at December 31, 2008:
| | | | | | | | | | | | | | | |
| | | Within
1 Year | | 1-3
Years | | 3-5
Years | | After
5 Years | | Total |
| | | (In thousands) |
Federal Home Loan Bank advances | | $ | 34,100 | | $ | 5,675 | | $ | 16,050 | | $ | 9,000 | | $ | 64,825 |
Junior subordinated debt | | | — | | | — | | | — | | | 12,372 | | | 12,372 |
Time deposits | | | 188,375 | | | 37,032 | | | 738 | | | — | | | 226,145 |
Operating leases | | | 885 | | | 1,680 | | | 1,029 | | | 1,075 | | | 4,669 |
| | | | | | | | | | | | | | | |
Total | | $ | 223,360 | | $ | 44,387 | | $ | 17,817 | | $ | 22,447 | | $ | 308,011 |
| | | | | | | | | | | | | | | |
For additional discussion of FHLB advances and junior subordinated debt, see Note 10: Borrowings and Junior Subordinated Debt to the consolidated financial statements.
Asset/Liability Management
The principal objectives of asset/liability management are to manage changes in net interest income and earnings due to changes in interest rates, maintain adequate liquidity, and manage capital adequacy. Asset/liability management encompasses structuring the mix of assets, deposits, and borrowings to limit exposure to interest rate risk and enhance long-term profitability.
The following discussion and analysis addresses managing liquidity, interest rate risk, and capital resources. These elements provide the framework for the Company’s asset/liability management policy. The asset/liability committee consists of the senior management of the Bank and meets at least quarterly to implement policy guidelines.
Liquidity
Liquidity is defined as the ability to provide sufficient cash to fund operations and meet obligations and commitments on a timely basis.
Liquidity is provided in part by cash flows from operations. As indicated on the Consolidated Statement of Cash Flows, net cash from operating activities for the year ended December 31, 2008, contributed $2,088,000 to
39
liquidity compared to $3,778,000 for the year ended December 31, 2007. In addition to cash and cash equivalents, asset liquidity is provided by the available-for-sale securities portfolio. Approximately 8 percent of the investment balances within this portfolio mature within one year. Funding needs are met through existing liquidity balances, deposit growth, FHLB advances and other borrowings, as well as the repayment of existing loans and the sale of loans.
In 2008, the Bank had a credit line through the FHLB for properly collateralized borrowings up to 30 percent of the Bank’s total assets. Borrowings from the FHLB totaled $64,825,000 at December 31, 2008 compared to $69,910,000 at December 31, 2007. Based on the collateral pledged and the Company’s holdings of FHLB stock, the Company was eligible to borrow up to $111,363,000 at year-end 2008. In January 2009, the Company reduced the amount of collateral it pledged to FHLB to the extent that only its current borrowings were collateralized; the Company is not eligible for further borrowings until additional collateral is pledged.
In addition to its line with FHLB, at December 31, 2008, the Bank had approved credit lines with correspondent banks for overnight funds credit facilities aggregating $20,500,000. In the first quarter of 2009, the Company was notified that all of its overnight funds credit lines were either reduced or eliminated leaving its credit lines at $100,000 at the end of March 2009.
In January 2009, the Company pledged loans eligible as collateral to the FRB to support additional borrowings under the discount window of up to $50,000,000 as needed.
The Company depends on its ability to receive dividends from the Bank for liquidity purposes. Dividends from the Bank are subject to certain regulatory limitations. The formal agreements among the Company and the DFI and the FRB prohibit the Bank from paying cash dividends to the Company except with the prior consent of the regulatory agencies. The Company is permitted to defer payments on its junior subordinated debentures for up to 20 quarterly periods under certain circumstances. The Company has suspended dividends and deferred payments on the junior subordinated debentures, effective with the March 15, 2009 payments in order to increase liquidity. For further discussion of junior subordinated debentures, see Note 10: Borrowings and Junior Subordinated Debt to the consolidated financial statements.
Through asset and liability management, the Company controls its liquidity position to ensure that sufficient funds are available to meet the needs of depositors, borrowers, and creditors. Management utilizes various tools to manage its liquidity position including pro forma cash flow statements to identify any potential funding shortfalls or gaps. In addition, the Company has established a Contingency Funding Plan, which identifies potential liquidity risks and details managements’ roles and responsibilities in the event of a liquidity stress situation.
The Bank has historically relied on brokered CDs as one of many sources of liquidity. Because the Bank is now considered “adequately capitalized” as opposed to “well-capitalized” under FDIC regulations, as of the end of March 2009, we are no longer able to accept brokered deposits without prior approval from the FDIC. The inability to replace the approximately $92,500,000 in brokered CDs maturing between March 31 and December 31, 2009 will severely impact the Bank’s liquidity, since adequate alternate sources of liquidity are not available to the Bank in the current economic environment.
Interest Rate Risk
The Company’s profitability depends largely upon its net interest income, which is the difference between interest earned on assets, primarily loans and investments, and the interest expense incurred on its liabilities, largely deposits and borrowings. Interest rate risk is the variation in bank performance introduced by changes in interest rates over time. The Company’s objective in managing interest rate risk is to minimize the impact on net income due to significant changes in interest rates.
40
The Company monitors interest rate risk by monthly reports that highlight the level, trend, and composition of net interest income and net interest margin, by quarterly reports matching rate-sensitive assets to rate-sensitive liabilities, and by reports of interest rate sensitivity through net interest income analysis.
Net interest income analysis is the primary tool used by management to assess the direction and magnitude of changes in net interest income resulting from changes in interest rates. This method of analysis assesses overall interest rate sensitivity by modeling the impact on net interest income from sudden and sustained increases and decreases in market interest rates. The following table presents a summary of the potential changes in net interest income over a one year time horizon resulting from immediate and sustained changes in market interest rates.
Net Interest Income Analysis(in thousands; rate changes in basis points (bp) = 1/100 of 1 percent):
| | | | | | | | | | | | | | | | |
December 31, 2008 | | | December 31, 2007 | |
Immediate Rate Change | | Dollar
Change | | | Percent
Change | | | Immediate Rate Change | | Dollar
Change | | | Percent
Change | |
+200bp | | $ | (305 | ) | | (2.18 | )% | | +200bp | | $ | 410 | | | 2.62 | % |
+100bp | | | (151 | ) | | (1.08 | ) | | +100bp | | | 216 | | | 1.38 | |
+50bp | | | (69 | ) | | (0.49 | ) | | +50bp | | | 113 | | | 0.72 | |
-50bp | | | 313 | | | 2.24 | | | -50bp | | | (26 | ) | | (0.16 | ) |
-100bp | | | 409 | | | 2.93 | | | -100bp | | | (77 | ) | | (0.49 | ) |
-200bp | | | 830 | | | 5.94 | | | -200bp | | | (166 | ) | | (1.06 | ) |
The tables above reflect the effect of interest rate changes on the Company’s net interest income. At December 31, 2008, the table indicates that the effect of an immediate 100 basis point increase in interest rates would decrease the Company’s net interest income by 1.08 percent or approximately $151,000. An immediate 100 basis point decrease in rates indicates a potential increase in net interest income by 2.93 percent or approximately $409,000. For comparison purposes, the table presents the rate risk profile as of December 31, 2007.
While net interest income or “rate shock” analysis is a useful tool to assess interest rate risk, the methodology has inherent limitations. For example, certain assets and liabilities may have similar maturities or periods to repricing, but may react in different degrees to changes in market interest rates. Prepayment and early withdrawal levels could vary significantly from assumptions made in calculating the tables. In addition, the ability of borrowers to service their debt may decrease in the event of significant interest rate increases. Finally, actual results may vary as management may not adjust rates equally as general levels of interest rates rise or fall.
The Company does not use interest rate risk management products, such as interest rate swaps, hedges, or derivatives.
Capital Resources
Stockholders’ equity on December 31, 2008 was $21,050,000 compared to $25,436,000 at December 31, 2007, a decrease of $4,386,000 or 17 percent. Current losses were $4,211,000 and the four quarterly dividends paid totaled $588,000. The change in unrealized losses on securities available-for-sale, net of deferred taxes, also increased the total stockholders’ equity by $85,000 during 2008.
The Company declares dividends solely at the discretion of the Company’s Board of Directors, subject to compliance with regulatory requirements. In order to pay any cash dividends, the Company must receive payments of dividends from the Bank. There are certain regulatory limitations on the payment of cash dividends by banks. Banking regulators have restricted the Company’s and the Bank’s payment of dividends without their approval. Without dividends from the Bank the Company will be limited in its ability to pay cash dividends to its shareholders or scheduled payments on the junior subordinated debentures.
41
At December 31, 2008, the Bank had total “risk-based capital” of $38,055,000 as compared to $41,200,000 at December 31, 2007. See Note 20: Regulatory Capital Requirements to the consolidated financial statements for additional information on risk-based capital and other regulated capital ratios. The Bank’s risk-based capital ratio has fallen below the 10% well-capitalized requirement and the Bank is precluded by the FDIC regulations from accepting, renewing, or rolling over any brokered deposits until it returns to a well-capitalized status, unless the Bank obtains a waiver from the FDIC.
| Item 7A. | Quantitative and Qualitative Disclosures About Market Risk |
The discussion relating to quantitative and qualitative disclosures about market risk is included in Item 7 above, specifically in the sections titled “Interest Rate Risk” and “Net Interest Income Analysis.”
42
| Item 8. | Financial Statements and Supplementary Data |
The following audited consolidated financial statements and related documents are set forth below on the pages indicated:
43

REPORT OF INDEPENDENT REGISTERED PUBLIC ACCOUNTING FIRM
To the Board of Directors and
Stockholders of EvergreenBancorp, Inc.
We have audited the accompanying consolidated balance sheets of EvergreenBancorp, Inc. as of December 31, 2008 and 2007, and the related consolidated statements of operations, stockholders’ equity, comprehensive income (loss), and cash flows for each of the three years in the period ended December 31, 2008. These financial statements are the responsibility of the Company’s management. Our responsibility is to express an opinion on these financial statements based on our audits.
We conducted our audits in accordance with standards of the Public Company Accounting Oversight Board (United States). Those standards require that we plan and perform the audit to obtain reasonable assurance about whether the financial statements are free of material misstatement. The Company is not required to have, nor were we engaged to perform, an audit of its internal control over financial reporting. Our audit included consideration of internal controls over financial reporting as a basis of designing audit procedures that are appropriate in the circumstances, but not for the purpose of expressing an opinion on the effectiveness of the Company’s internal control over financial reporting. Accordingly, we express no such opinion. An audit includes examining, on a test basis, evidence supporting the amounts and disclosures in the financial statements. An audit also includes assessing the accounting principles used and significant estimates made by management, as well as evaluating the overall financial statement presentation. We believe that our audits provide a reasonable basis for our opinion.
In our opinion, the consolidated financial statements referred to above present fairly, in all material respects, the financial position of EvergreenBancorp, Inc. at December 31, 2008 and 2007, and the results of its operations and its cash flows for each of the three years in the period ended December 31, 2008 in conformity with U.S. generally accepted accounting principles.
The accompanying financial statements have been prepared assuming that the Company will continue as a going concern. As discussed in Note 2 to the consolidated financial statements, the Company has incurred significant loan losses resulting in a regulatory capital deficiency. The Company also has liquidity concerns as a result of regulatory restrictions on its use of brokered deposits going forward. These matters raise substantial doubt about the Company’s ability to continue as a going concern. Management’s plans in regard to these matters are also described in Note 2. The financial statements do not include any adjustments that might result from the outcome of this uncertainty.
/s/ Crowe Horwath LLP
Oak Brook, Illinois
March 30, 2009
44
EVERGREENBANCORP, INC.
CONSOLIDATED BALANCE SHEETS
| | | | | | | | |
| | | December 31, | |
| | | 2008 | | | 2007 | |
| | | (In thousands, except
share data) | |
Assets | | | | | | | | |
Cash and due from banks | | $ | 8,042 | | | $ | 14,076 | |
Federal funds sold | | | 5 | | | | 2,383 | |
Interest-bearing deposits in financial institutions | | | 5,962 | | | | 5,923 | |
| | | | | | | | |
Total cash and cash equivalents | | | 14,009 | | | | 22,382 | |
Federal Home Loan Bank certificate of deposit | | | 325 | | | | — | |
Securities available-for-sale | | | 9,586 | | | | 12,521 | |
Federal Home Loan Bank stock | | | 3,073 | | | | 1,925 | |
| | | | | | | | |
Total investments | | | 12,984 | | | | 14,446 | |
Loans | | | 422,671 | | | | 375,428 | |
Allowance for loan losses | | | (10,498 | ) | | | (4,166 | ) |
| | | | | | | | |
Net loans | | | 412,173 | | | | 371,262 | |
Premises and equipment | | | 3,447 | | | | 2,886 | |
Other real estate owned | | | 4,901 | | | | — | |
Bank owned life insurance | | | 5,761 | | | | 5,537 | |
Interest in escrow of Visa stock | | | 1,581 | | | | — | |
Accrued interest and other assets | | | 6,762 | | | | 6,274 | |
| | | | | | | | |
Total assets | | $ | 461,618 | | | $ | 422,787 | |
| | | | | | | | |
Liabilities | | | | | | | | |
Deposits | | | | | | | | |
Noninterest-bearing | | $ | 50,044 | | | $ | 59,458 | |
Interest-bearing | | | 308,846 | | | | 250,013 | |
| | | | | | | | |
Total deposits | | | 358,890 | | | | 309,471 | |
Federal Home Loan Bank advances | | | 64,825 | | | | 69,910 | |
Junior subordinated debt | | | 12,372 | | | | 12,372 | |
Indemnification liabilities | | | 1,581 | | | | 2,122 | |
Accrued expenses and other liabilities | | | 2,900 | | | | 3,476 | |
| | | | | | | | |
Total liabilities | | | 440,568 | | | | 397,351 | |
| | |
Commitments and Contingencies (Note 18) | | | | | | | | |
| | |
Stockholders’ equity | | | | | | | | |
Preferred stock; no par value; 100,000 shares authorized; none issued | | | — | | | | — | |
Common stock and surplus; no par value; 15,000,000 shares authorized; 2,544,819 shares issued at 2008 (includes 31,126 nonvested restricted stock awards); 2,508,244 shares issued at 2007 (includes 19,425 nonvested restricted stock awards) | | | 22,720 | | | | 21,467 | |
Retained earnings (deficit) | | | (1,752 | ) | | | 3,972 | |
Accumulated other comprehensive income (loss) | | | 82 | | | | (3 | ) |
| | | | | | | | |
Total stockholders’ equity | | | 21,050 | | | | 25,436 | |
| | | | | | | | |
Total liabilities and stockholders’ equity | | $ | 461,618 | | | $ | 422,787 | |
| | | | | | | | |
See accompanying notes to consolidated financial statements.
45
EVERGREENBANCORP, INC.
CONSOLIDATED STATEMENTS OF OPERATIONS
| | | | | | | | | | | |
| | | Years Ended December 31, |
| | | 2008 | | | 2007 | | | 2006 |
| | | (In thousands, except per share data) |
Interest income | | | | | | | | | | | |
Loans, including fees | | $ | 27,737 | | | $ | 28,528 | | | $ | 19,352 |
Taxable securities | | | 437 | | | | 1,057 | | | | 1,167 |
Tax exempt securities | | | 101 | | | | 123 | | | | 137 |
Federal funds sold and other | | | 155 | | | | 296 | | | | 130 |
| | | | | | | | | | | |
Total interest income | | | 28,430 | | | | 30,004 | | | | 20,786 |
| | | |
Interest expense | | | | | | | | | | | |
Deposits | | | 9,614 | | | | 10,559 | | | | 5,706 |
Federal funds purchased | | | 9 | | | | 83 | | | | 75 |
Federal Home Loan Bank advances | | | 2,518 | | | | 2,422 | | | | 1,979 |
Junior subordinated debt | | | 597 | | | | 986 | | | | 491 |
| | | | | | | | | | | |
Total interest expense | | | 12,738 | | | | 14,050 | | | | 8,251 |
| | | | | | | | | | | |
Net interest income | | | 15,692 | | | | 15,954 | | | | 12,535 |
| | | |
Provision for loan losses | | | 11,961 | | | | 1,926 | | | | 810 |
| | | | | | | | | | | |
Net interest income after provision for loan losses | | | 3,731 | | | | 14,028 | | | | 11,725 |
| | | |
Noninterest income | | | | | | | | | | | |
Service charges on deposit accounts | | | 1,159 | | | | 1,411 | | | | 1,165 |
Merchant credit card processing | | | 89 | | | | 174 | | | | 157 |
Loss on sales of securities available-for-sale | | | — | | | | (444 | ) | | | — |
Other commissions and fees | | | 52 | | | | 60 | | | | 141 |
Gain on redemption and interest in escrow fund of Visa stock | | | 6,159 | | | | — | | | | — |
Net earnings on bank owned life insurance | | | 224 | | | | 221 | | | | 226 |
Other noninterest income | | | 112 | | | | 125 | | | | 139 |
| | | | | | | | | | | |
Total noninterest income | | | 7,795 | | | | 1,547 | | | | 1,828 |
Noninterest expense | | | | | | | | | | | |
Salaries and employee benefits | | | 6,597 | | | | 6,086 | | | | 5,416 |
Gain on settlement of post-retirement plan | | | — | | | | (1,002 | ) | | | — |
Occupancy and equipment | | | 2,265 | | | | 1,970 | | | | 1,811 |
Indemnification charges | | | 572 | | | | 2,122 | | | | — |
Data processing | | | 967 | | | | 948 | | | | 832 |
Professional fees | | | 447 | | | | 280 | | | | 318 |
Marketing | | | 643 | | | | 555 | | | | 485 |
Other outside service fees | | | 323 | | | | 543 | | | | 428 |
State revenue and sales tax expense | | | 565 | | | | 543 | | | | 358 |
Loss on disposal of equipment | | | — | | | | — | | | | 28 |
FDIC insurance premiums | | | 417 | | | | 41 | | | | 28 |
Other noninterest expense | | | 1,965 | | | | 1,580 | | | | 1,246 |
| | | | | | | | | | | |
Total noninterest expense | | | 14,761 | | | | 13,666 | | | | 10,950 |
| | | | | | | | | | | |
Income (loss) before income taxes | | | (3,235 | ) | | | 1,909 | | | | 2,603 |
| | | |
Income tax expense | | | 976 | | | | 728 | | | | 784 |
| | | | | | | | | | | |
Net income (loss) | | $ | (4,211 | ) | | $ | 1,181 | | | $ | 1,819 |
| | | | | | | | | | | |
Basic earnings (loss) per share | | $ | (1.67 | ) | | $ | 0.48 | | | $ | 0.85 |
| | | | | | | | | | | |
Diluted earnings (loss) per share | | $ | (1.67 | ) | | $ | 0.47 | | | $ | 0.84 |
| | | | | | | | | | | |
See accompanying notes to consolidated financial statements.
46
EVERGREENBANCORP, INC.
CONSOLIDATED STATEMENTS OF STOCKHOLDERS’ EQUITY
Years Ended December 31, 2008, 2007, and 2006
| | | | | | | | | | | | | | | | | | |
| | | Common
Stock
Shares | | | Common
Stock
and
Surplus | | Retained
Earnings
(Deficit) | | | Accumulated
Other
Comprehensive
Income (Loss) | | | Total
Stockholders’
Equity | |
| | | | | | |
| | | (In thousands, except per share data) | |
Balance at January 1, 2006 | | 2,000,467 | | | $ | 16,005 | | $ | 2,187 | | | $ | (456 | ) | | $ | 17,736 | |
Adjustment to apply SAB No. 108, net of tax | | — | | | | — | | | (51 | ) | | | — | | | | (51 | ) |
Comprehensive income | | | | | | | | | | | | | | | | | | |
Net income | | — | | | | — | | | 1,819 | | | | — | | | | 1,819 | |
Change in net unrealized gain (loss) on securities available for sale, net of reclassification and tax effects | | — | | | | — | | | — | | | | 50 | | | | 50 | |
| | | | | | | | | | | | | | | | | | |
Total comprehensive income | | — | | | | — | | | — | | | | — | | | | 1,869 | |
Adjustment to initially apply SFAS No. 158, net of tax | | — | | | | — | | | — | | | | (357 | ) | | | (357 | ) |
Cash dividends ($.238 per share) | | — | | | | — | | | (502 | ) | | | — | | | | (502 | ) |
Equity offering subscriptions | | 310,547 | | | | 4,547 | | | — | | | | — | | | | 4,547 | |
Exercise of stock options | | 42,248 | | | | 381 | | | — | | | | — | | | | 381 | |
Tax benefit from stock related compensation | | | | | | 73 | | | — | | | | — | | | | 73 | |
Stock options earned | | — | | | | 123 | | | — | | | | — | | | | 123 | |
| | | | | | | | | | | | | | | | | | |
Balance at December 31, 2006 | | 2,353,262 | | | | 21,129 | | | 3,453 | | | | (763 | ) | | | 23,819 | |
| | | | | | | | | | | | | | | | | | |
Comprehensive income | | | | | | | | | | | | | | | | | | |
Net income | | — | | | | — | | | 1,181 | | | | — | | | | 1,181 | |
Change in net unrealized gain (loss) on securities available for sale, net of reclassification and tax effects | | — | | | | — | | | — | | | | 403 | | | | 403 | |
Change in post-retirement benefit obligation, net of tax effects | | — | | | | — | | | — | | | | 357 | | | | 357 | |
| | | | | | | | | | | | | | | | | | |
Total comprehensive income | | — | | | | — | | | — | | | | — | | | | 1,941 | |
Cash dividends ($.266 per share) | | — | | | | — | | | (662 | ) | | | — | | | | (662 | ) |
Exercise of stock options | | 13,442 | | | | 154 | | | — | | | | — | | | | 154 | |
Stock awards granted, net of forfeitures | | 22,100 | | | | — | | | — | | | | — | | | | — | |
Tax benefit from stock related compensation | | | | | | 12 | | | — | | | | — | | | | 12 | |
Stock options earned | | — | | | | 172 | | | — | | | | — | | | | 172 | |
| | | | | | | | | | | | | | | | | | |
Balance at December 31, 2007 | | 2,388,804 | | | | 21,467 | | | 3,972 | | | | (3 | ) | | | 25,436 | |
| | | | | | | | | | | | | | | | | | |
Comprehensive income (loss) | | | | | | | | | | | | | | | | | | |
Net loss | | — | | | | — | | | (4,211 | ) | | | — | | | | (4,211 | ) |
Change in net unrealized gain (loss) on securities available for sale, net of reclassification and tax effects | | — | | | | — | | | — | | | | 85 | | | | 85 | |
| | | | | | | | | | | | | | | | | | |
Total comprehensive loss | | — | | | | — | | | — | | | | — | | | | (4,126 | ) |
Cash dividends ($.233 per share) | | — | | | | — | | | (588 | ) | | | — | | | | (588 | ) |
Stock dividend (5%) | | 121,150 | | | | 925 | | | (925 | ) | | | — | | | | — | |
Exercise of stock options | | 21,805 | | | | 158 | | | — | | | | — | | | | 158 | |
Stock awards granted, net of forfeitures | | 11,350 | | | | — | | | — | | | | — | | | | — | |
Dividend reinvestment plan | | 1,977 | | | | 15 | | | — | | | | — | | | | 15 | |
Repurchase of fractional shares | | (267 | ) | | | — | | | — | | | | — | | | | — | |
Tax benefit from stock related compensation | | — | | | | 35 | | | — | | | | — | | | | 35 | |
Stock options earned | | — | | | | 120 | | | — | | | | — | | | | 120 | |
| | | | | | | | | | | | | | | | | | |
Balance at December 31, 2008 | | 2,544,819 | | | $ | 22,720 | | $ | (1,752 | ) | | $ | 82 | | | $ | 21,050 | |
| | | | | | | | | | | | | | | | | | |
See accompanying notes to consolidated financial statements.
47
EVERGREENBANCORP, INC.
CONSOLIDATED STATEMENTS OF COMPREHENSIVE INCOME (LOSS)
| | | | | | | | | | | | |
| | | Years Ended December 31, | |
| | | 2008 | | | 2007 | | | 2006 | |
| | | (In thousands) | |
Net income (loss) | | $ | (4,211 | ) | | $ | 1,181 | | | $ | 1,819 | |
Other comprehensive income: | | | | | | | | | | | | |
Change in unrealized gain (loss) on securities available for sale | | | 129 | | | | 1,055 | | | | 75 | |
Reclassification adjustment for loss included in net income | | | — | | | | (444 | ) | | | — | |
| | | | | | | | | | | | |
Net unrealized gains | | | 129 | | | | 611 | | | | 75 | |
Tax effect | | | (44 | ) | | | (208 | ) | | | (25 | ) |
| | | | | | | | | | | | |
Net change in unrealized gain on securities, available for sale | | | 85 | | | | 403 | | | | 50 | |
Change in post-retirement obligation | | | — | | | | 541 | | | | — | |
Tax effect | | | — | | | | (184 | ) | | | — | |
| | | | | | | | | | | | |
Net change in post-retirement obligation | | | — | | | | 357 | | | | — | |
| | | | | | | | | | | | |
Total other comprehensive income | | $ | 85 | | | $ | 760 | | | $ | 50 | |
| | | | | | | | | | | | |
Total comprehensive income (loss) | | $ | (4,126 | ) | | $ | 1,941 | | | $ | 1,869 | |
| | | | | | | | | | | | |
See accompanying notes to consolidated financial statements.
48
EVERGREENBANCORP, INC.
CONSOLIDATED STATEMENTS OF CASH FLOWS
| | | | | | | | | | | | |
| | | Years Ended December 31, | |
| | | 2008 | | | 2007 | | | 2006 | |
| | | (In thousands) | |
Cash flows from operating activities | | | | | | | | | | | | |
Net income (loss) | | $ | (4,211 | ) | | $ | 1,181 | | | $ | 1,819 | |
Adjustments to reconcile net income (loss) to net cash provided by operating activities: | | | | | | | | | | | | |
Depreciation | | | 1,066 | | | | 973 | | | | 854 | |
Provision for loan losses | | | 11,961 | | | | 1,926 | | | | 810 | |
Gain on redemption of Visa stock | | | (6,159 | ) | | | — | | | | — | |
Indemnification charges | | | 572 | | | | 2,122 | | | | — | |
Gain on settlement of post-retirement plan | | | — | | | | (1,002 | ) | | | — | |
Loss on sales of securities | | | — | | | | 444 | | | | — | |
Loss on disposal of equipment | | | — | | | | — | | | | 28 | |
Amortization of premiums and discounts on securities | | | 19 | | | | 35 | | | | 41 | |
Net earnings on bank owned life insurance | | | (224 | ) | | | (221 | ) | | | (226 | ) |
Stock options earned | | | 120 | | | | 172 | | | | 123 | |
Other changes, net | | | (1,056 | ) | | | (1,852 | ) | | | 79 | |
| | | | | | | | | | | | |
Net cash provided by operating activities | | | 2,088 | | | | 3,778 | | | | 3,528 | |
Cash flows from investing activities | | | | | | | | | | | | |
Proceeds from maturities and principal payments on securities
available for sale | | | 6,043 | | | | 3,830 | | | | 4,186 | |
Purchases of securities available for sale | | | (2,999 | ) | | | (3,000 | ) | | | — | |
Purchase of Federal Home Loan Bank certificate of deposit | | | (325 | ) | | | — | | | | — | |
Proceeds from redemption of Visa stock | | | 3,465 | | | | — | | | | — | |
Purchases of Federal Home Loan Bank stock | | | (3,724 | ) | | | (375 | ) | | | (133 | ) |
Redemptions of Federal Home Loan Bank stock | | | 2,575 | | | | — | | | | — | |
Proceeds from sales of securities AFS | | | — | | | | 14,762 | | | | — | |
Purchases of loans | | | — | | | | — | | | | (5,753 | ) |
Net loan originations | | | (57,773 | ) | | | (83,523 | ) | | | (97,590 | ) |
Purchases of premises and equipment | | | (1,627 | ) | | | (781 | ) | | | (781 | ) |
| | | | | | | | | | | | |
Net cash used in investing activities | | | (54,365 | ) | | | (69,087 | ) | | | (100,071 | ) |
| | | | | | | | | | | | |
Cash flows from financing activities | | | | | | | | | | | | |
Net increase in deposits | | | 49,419 | | | | 53,036 | | | | 56,545 | |
Proceeds from Federal Home Loan Bank advances | | | 388,750 | | | | 382,558 | | | | 36,900 | |
Repayments of Federal Home Loan Bank advances | | | (393,835 | ) | | | (359,453 | ) | | | (13,944 | ) |
Proceeds from the issuance of junior subordinated debentures | | | — | | | | 5,155 | | | | 7,217 | |
Repayment on redemption of junior subordinated debentures | | | — | | | | (5,000 | ) | | | — | |
Proceeds from equity offering, net of offering costs | | | — | | | | — | | | | 4,547 | |
Proceeds from exercise of stock options | | | 158 | | | | 154 | | | | 381 | |
Dividends paid | | | (588 | ) | | | (662 | ) | | | (502 | ) |
| | | | | | | | | | | | |
Net cash provided by financing activities | | | 43,904 | | | | 75,788 | | | | 91,144 | |
| | | | | | | | | | | | |
Net increase (decrease) in cash and cash equivalents | | | (8,373 | ) | | | 10,479 | | | | (5,399 | ) |
Cash and cash equivalents at beginning of year | | | 22,382 | | | | 11,903 | | | | 17,302 | |
| | | | | | | | | | | | |
Cash and cash equivalents at end of year | | $ | 14,009 | | | $ | 22,382 | | | $ | 11,903 | |
| | | | | | | | | | | | |
Supplemental disclosures of cash flow information | | | | | | | | | | | | |
Interest paid | | $ | 13,315 | | | $ | 13,155 | | | $ | 7,678 | |
Income taxes paid | | | 1,285 | | | | 2,382 | | | | 1,110 | |
Loans transferred to other real estate owned | | | 4,901 | | | | — | | | | — | |
See accompanying notes to consolidated financial statements.
49
EVERGREENBANCORP, INC.
NOTES TO CONSOLIDATED FINANCIAL STATEMENTS
Note 1: Summary of Significant Accounting Policies
Organization. EvergreenBancorp, Inc. (“Bancorp”) was formed February 9, 2001 and is a Washington corporation chartered as a bank holding company. Bancorp holds all of the issued and outstanding shares of EvergreenBank (“the Bank”). The consolidated entities are collectively referred to as the “Company.” The Bank is a Washington state chartered financial institution established in 1971 that engages in general commercial and consumer banking operations. Deposits in the Bank are insured to a maximum of $250,000 per depositor (in some instances insurance is unlimited depending on the type of the account) by the Federal Deposit Insurance Corporation (“the FDIC”) through December 31, 2009.
EvergreenBancorp Statutory Trust II (“Trust II”) and EvergreenBancorp Capital Trust III (“Trust III”) are special purpose business trusts formed by Bancorp in November 2006, and April 2007, respectively, to raise capital through trust preferred securities offerings. Under current accounting guidance, Financial Accounting Standards Board (“FASB”) Interpretation No. 46, as revised in December 2003, the trusts are not consolidated with the Company.
The Bank offers a broad spectrum of personal and business banking services, including commercial, consumer, and real estate lending. The Bank’s offices are centered in the Puget Sound region in the Seattle, Lynnwood, Bellevue, Federal Way, and Kent communities, therefore the Bank’s exposure to credit risk is significantly affected by changes in the economy in these communities.
Operating Segments. While the Company’s management monitors the revenue streams of the various products and services, operations are managed and financial performance is evaluated on a Company-wide basis. Accordingly, all of the Company’s banking operations are considered by management to be aggregated in one reportable segment.
Principles of Consolidation and Use of Estimates. The accompanying consolidated financial statements include the combined accounts of the Bancorp and the Bank. Significant intercompany balances and transactions have been eliminated.
The accompanying financial statements have been prepared in conformity with U.S. generally accepted accounting principles and with the general practices in the banking industry. The preparation of financial statements in conformity with these principles requires management to make estimates and assumptions that affect the reported amounts of assets and liabilities, including contingent amounts, at the date of the financial statements and the reported amounts of revenues and expenses during the reporting period. Actual results could differ from those estimates. The allowance for loan losses, income taxes, and the status of contingencies are particularly subject to change.
Cash and Cash Equivalents. Cash and cash equivalents include cash on hand, cash items, clearings and exchanges, amounts due from correspondent banks, interest-bearing deposits in other financial institutions, and federal funds sold. Federal funds sold generally mature within one to four days from the transaction date. Net cash flows are reported for customer loan and deposit transactions, and federal funds purchased. Interest bearing deposits in other financial institutions are carried at cost.
Securities. Securities classified as available-for-sale are reported at fair value, with the net unrealized gains or losses, net of tax, reported in accumulated other comprehensive income (loss), as a separate component of stockholders’ equity. Realized gains or losses on securities sold are based on the net proceeds and adjusted book values of the securities sold, using the specific identification method.
50
Interest income includes amortization of purchase premium or discount. Premiums and discounts on securities are amortized on the level-yield method without anticipating prepayments.
Declines in the fair value of securities below their cost that are other than temporary are reflected as realized losses. In estimating other-than-temporary losses, management considers: (1) the length of time and extent that fair value has been less than cost, (2) the financial condition and near term prospects of the issuer, and (3) the Company’s ability and intent to hold the security for a period sufficient to allow for any anticipated recovery in fair value.
Loans. Loans that management has the intent and ability to hold for the foreseeable future or until maturity or payoff are reported at the principal balance outstanding, net of unearned interest, deferred loan fees and costs, and allowance for loan losses. Interest income is accrued on the unpaid principal balance. Loan origination fees, net of certain direct origination costs, are deferred and recognized in interest income using the level-yield method without anticipating prepayments.
Interest income on mortgage and commercial loans is discontinued at the time the loan is 90 days delinquent unless the loan is well-secured and in the process of collection. Consumer and credit card loans are typically charged off no later than 120 days past due. Past due status is based on the contractual terms of the loan. Loans are placed on nonaccrual or charged off at an earlier date if collection of principal or interest is considered doubtful.
All interest accrued but not received for loans placed on nonaccrual is reversed against interest income. Interest received on such loans is accounted for on the cash-basis or cost-recovery method, until qualifying for return to accrual. Loans are returned to accrual status when all principal and interest amounts contractually due are brought current and future payments are reasonably assured.
Allowance for Loan Losses. The allowance for loan losses is a valuation allowance for probable incurred credit losses. Loan losses are charged against the allowance when management believes the uncollectibility of a loan balance is confirmed. Subsequent recoveries, if any, are credited to the allowance. Management estimates the allowance balance required using past loan loss experience, the nature and volume of the portfolio, information about specific borrower situations and estimated collateral values, economic and market conditions, and other factors. Allocations of the allowance may be made for specific loans, but the entire allowance is available for any loan that, in management’s judgment, should be charged off.
The allowance consists of specific and general components. The specific component relates to loans that are individually classified as impaired. The general component covers non-impaired loans and is based on historical loss experience adjusted for current factors.
A loan is impaired when full payment under the loan terms is not expected. Commercial and commercial real estate loans are individually evaluated for impairment. If a loan is impaired, a portion of the allowance is allocated so that the loan is reported, net, at the present value of estimated future cash flows using the loan’s existing rate or at the fair value of collateral if repayment is expected solely from the collateral. Large groups of smaller balance homogeneous loans, such as consumer and residential real estate loans, are collectively evaluated for impairment, and accordingly, they are not separately identified for impairment disclosures.
Premises and Equipment. Premises and equipment include leasehold improvements and are stated at cost, less accumulated depreciation and amortization on the straight-line method over the shorter of the estimated useful lives of the assets ranging from 3 to 10 years or the terms of the related leases. The Company leases the premises upon which it conducts business. Furniture, fixtures, and equipment are depreciated using the straight-line (or accelerated) method with useful lives ranging from 5 to 7 years. Maintenance, repairs, taxes, and insurance are charged to noninterest expense.
51
Long-Term Assets: Leasehold improvements and equipment, and other long-term assets are reviewed for impairment when events indicate their carrying amount may not be recoverable from future undiscounted cash flows. If impaired, the assets are recorded at fair value.
Bank Owned Life Insurance. The Company has purchased life insurance policies on certain key officers. In accordance with EITF 06-5, Bank owned life insurance is recorded at the amount that can be realized under the insurance contract at the balance sheet date, which is the cash surrender value adjusted for other charges or other amounts due that are probable at settlement.
Other Real Estate. Assets acquired through or instead of loan foreclosure are initially recorded at the fair value less costs to sell, establishing a new cost basis. If fair value declines subsequent to foreclosure, a valuation allowance is recorded through expense. Costs after acquisition are expensed. Losses arising from the acquisition of property, in full or partial satisfaction of loans, are charged to the allowance for loan losses.
Federal Home Loan Bank (“FHLB”) stock. The Bank is a member of the FHLB system. Members are required to own a certain amount of stock based on the level of borrowings and other factors, and may invest in additional amounts. FHLB stock is carried at cost, classified as a restricted security, and periodically evaluated for impairment based on ultimate recovery of par value. Both cash and stock dividends are reported as income.
Income Taxes. Income tax expense is the total of the current year income tax due or refundable and the change in deferred tax assets and liabilities. Deferred tax assets and liabilities are the expected future tax amounts for the temporary differences between carrying amounts and tax bases of assets and liabilities, computed using enacted tax rates. A valuation allowance, if needed, reduces deferred tax assets to the amount expected to be realized.
The Company adopted FASB Interpretation 48, Accounting for Uncertainty in Income Taxes (“FIN 48”), as of January 1, 2007. A tax position is recognized as a benefit only if it is “more likely than not” that the tax position would be sustained in a tax examination, with a tax examination being presumed to occur. The amount recognized is the largest amount of tax benefit that is greater than 50 percent likely of being realized on examination. For tax positions not meeting the “more likely than not” test, no tax benefit is recorded. The adoption had no affect on the Company’s financial statements.
The Company recognizes interest and/or penalties related to income tax matters in income tax expense.
Comprehensive Income (Loss). Comprehensive income (loss) consists of net income and other comprehensive income (loss). Other comprehensive income (loss) includes the reclassification and tax effects of the change in unrealized gains and losses on available for sale securities and the change in post-retirement obligation, net of tax effects, which are recognized as a separate component of equity.
Fair Values of Financial Instruments. Fair values of financial instruments are estimated using relevant market information and other assumptions as more fully disclosed in Note 19: Fair Values of Financial Instruments to the consolidated financial statements. Fair value estimates involve uncertainties and matters of significant judgment regarding interest rates, credit risk, prepayments, and other factors, especially in the absence of broad markets for particular items. Changes in assumptions or in market conditions could significantly affect the estimates.
Loan Commitments and Related Financial Instruments. Financial instruments include off-balance-sheet credit instruments, such as commitments to make loans and commercial letters of credit, issued to meet customer financing needs. The face amount for these items represents the exposure to loss, before considering customer collateral or ability to repay. Such financial instruments are recorded when they are funded.
Loss Contingencies. Loss contingencies, including claims and legal actions arising in the ordinary course of business, are recorded as liabilities when the likelihood of loss is probable and an amount or range of loss can be reasonably estimated.
52
Beginning on June 22, 2005, a series of antitrust class action lawsuits were filed against Visa. The plaintiffs, merchants operating commercial businesses throughout the U.S. and trade associations, claim that the interchange fees charged by card-issuing banks are unreasonable and seek injunctive relief and unspecified damages. The cases have been consolidated for pretrial proceedings in the United States District Court for the Eastern District of New York. The Company, as a member of the Visa network and pursuant to the bylaws of Visa USA and the Loss Sharing Agreement discussed in Note 18: Commitments and Contingencies to the consolidated financial statements, is obligated to indemnify Visa for certain losses related to these litigations.
Stock-Based Compensation. Compensation cost is recognized for stock options and restricted stock awards issued to employees and directors, based on the fair value of these awards at the date of grant. A Black-Scholes model is utilized to estimate the fair value of stock options, while the market price of the Corporation’s common stock at the date of grant is used for restricted stock awards. Compensation cost is recognized over the required service period, generally defined as the vesting period. For awards with graded vesting, compensation cost is recognized on a straight-line basis over the requisite service period for the entire award.
Earnings (Loss) Per Share. Basic earnings (loss) per common share is net income divided by the weighted average number of common shares outstanding during the period. Diluted earnings per common share includes the dilutive effect of additional potential common shares issuable under stock options and unvested stock awards. Earnings and dividends per share are restated for all stock splits and stock dividends through the date of issuance of the financial statements.
Dividend Restriction. Banking regulations require the maintenance of certain capital levels and may limit the amount of dividends that may be paid by the Bank to the Bancorp or by the Bancorp to the stockholders.
Adoption of new accounting standards. In September 2006, the FASB issued Statement No. 157,Fair Value Measurements(“FAS 157”). This Statement defines fair value, establishes a framework for measuring fair value and expands disclosures about fair value measurements. This Statement establishes a fair value hierarchy about the assumptions used to measure fair value and clarifies assumptions about risk and the effect of a restriction on the sale or use of an asset. The standard was effective for fiscal years beginning after November 15, 2007. In February 2008, the FASB issued Staff Position (“FSP”) 157-2, Effective Date of FASB Statement No. 157.This FSP delays the effective date of FAS 157 for all nonfinancial assets and nonfinancial liabilities, except those that are recognized or disclosed at fair value on a recurring basis (at least annually) to fiscal years beginning after November 15, 2008, and interim periods within those fiscal years. The impact of adoption was not material. In October 2008, the FASB issued Staff Position (“FSP”) 157-3,Determining the Fair Value of a Financial Asset when the Market for That Asset Is Not Active. This FSP clarifies the application of FAS 157 in a market that is not active. The impact of adoption was not material.
In February 2007, the FASB issued Statement No. 159,The Fair Value Option for Financial Assets and Financial Liabilities. The standard provides companies with an option to report selected financial assets and liabilities at fair value and establishes presentation and disclosure requirements designed to facilitate comparisons between companies that choose different measurement attributes for similar types of assets and liabilities. The new standard was effective for the Company on January 1, 2008. The Company did not elect the fair value option for any financial assets or financial liabilities as of January 1, 2008 or subsequently.
In September 2006, the FASB Emerging Issues Task Force finalized Issue No. 06-4,Accounting for Deferred Compensation and Postretirement Benefit Aspects of Endorsement Split-Dollar Life Insurance Arrangements. This issue requires that a liability be recorded during the service period when a split-dollar life insurance agreement continues after participants’ employment or retirement. The required accrued liability will be based on either the post-employment benefit cost for the continuing life insurance or based on the future death benefit depending on the contractual terms of the underlying agreement. This issue was effective for fiscal years beginning after December 15, 2007. The impact of adoption was not material.
53
On November 5, 2007, the SEC issued Staff Accounting Bulletin No. 109,Written Loan Commitments Recorded at Fair Value through Earnings(“SAB 109”). Previously, SAB 105,Application of Accounting Principles to Loan Commitments, stated that in measuring the fair value of a derivative loan commitment, a company should not incorporate the expected net future cash flows related to the associated servicing of the loan. SAB 109 supersedes SAB 105 and indicates that the expected net future cash flows related to the associated servicing of the loan should be included in measuring fair value for all written loan commitments that are accounted for at fair value through earnings. SAB 105 also indicated that internally-developed intangible assets should not be recorded as part of the fair value of a derivative loan commitment, and SAB 109 retains that view. SAB 109 was effective for derivative loan commitments issued or modified in fiscal quarters beginning after December 15, 2007. The impact of adoption was not material.
Effect of Newly Issued but Not Yet Effective Accounting Standards: In December 2007, the FASB issued FAS No. 141 (revised 2007), Business Combinations (“FAS 141(R)”), which establishes principles and requirements for how an acquirer recognizes and measures in its financial statements the identifiable assets acquired, the liabilities assumed, and any noncontrolling interest in an acquiree, including the recognition and measurement of goodwill acquired in a business combination. FAS No. 141(R) is effective for fiscal years beginning on or after December 15, 2008. Earlier adoption is prohibited. The adoption of this standard did not have a material effect on the Corporation’s results of operations or financial position as no business combinations are presently anticipated.
In December 2007, the FASB issued SFAS No. 160,“Noncontrolling Interest in Consolidated Financial Statements, an amendment of ARB No. 51” (“FAS No. 160”), which will change the accounting and reporting for minority interests, which will be recharacterized as noncontrolling interests and classified as a component of equity within the consolidated balance sheets. FAS No. 160 is effective as of the beginning of the first fiscal year beginning on or after December 15, 2008. The adoption of this standard on January 1, 2009 did not have a material impact on its results of operations or financial position.
In March 2008, the FASB issued SFAS No. 161, “Disclosures about Derivative Instruments and Hedging Activities, an amendment of SFAS No. 133”. FAS No. 161 amends and expands the disclosure requirements of SFAS No. 133 for derivative instruments and hedging activities. FAS No. 161 requires qualitative disclosure about objectives and strategies for using derivative and hedging instruments, quantitative disclosures about fair value amounts of the instruments and gains and losses on such instruments, as well as disclosures about credit-risk features in derivative agreements. FAS No. 161 is effective for financial statements issued for fiscal years and interim periods beginning after November 15, 2008, with early application encouraged. The adoption of this standard on January 1, 2009 did not have a material effect on the Company’s results of operations or financial position.
Note 2: Regulatory Actions, Business Plan and Going Concern Considerations
In connection with continuing turmoil in the economy, and more specifically, with the Seattle-area real estate market, we recorded a net loss of $4.2 million for the year ended December 31, 2008. This loss was primarily the result of considerable increases required to be made in provision for loan losses during the year and was compounded by a tightening interest margin caused by recent interest rate reductions and increased amounts of non-accrual loans. Furthermore, a valuation allowance provided against our deferred tax assets during the fourth quarter of 2008 also negatively impacted our earnings. The net loss caused the Bank to be less than “well capitalized” as further described in Note 20: Regulatory Capital Requirements to the consolidated financial statements. The significant provision for loan losses and increasing nonperforming loans have had a negative impact on our operations, liquidity and capital adequacy and resulted in actions by our regulators to restrict our operations as noted below.
Regulatory Actions:
On December 22, 2008, the Bank entered into a Supervisory Directive (“Directive”), effective as of the same date, with the Washington State Department of Financial Institutions (“DFI”). The Directive requires the
54
Bank to, among other things: (1) improve asset quality, reduce classified assets, maintain an adequate allowance for loan losses and improve credit administration; (2) submit a strategic plan that outlines strategies for improving earnings, achieving certain levels of liquidity, returning to a “well-capitalized” status, and identifying additional sources of capital; (3) furnish quarterly progress reports regarding the Bank’s compliance with all provisions of the Directive; (4) receive prior consent of the DFI and the Federal Deposit Insurance Corporation (“FDIC”) before declaring or paying cash dividends; and (5) notify the DFI and FDIC in writing of any proposal of certain changes to directors or senior officers. The first quarterly progress report was submitted on January 31, 2009. The next progress report is due on April 30, 2009. The Directive will remain in effect until stayed, modified, terminated, or suspended by the DFI and FDIC.
On January 22, 2009, the Company entered into a Memorandum of Understanding (“MOU”) with the Federal Reserve Bank of San Francisco (“FRB”). Under the MOU, the Company must, among other things: (1) obtain written approval from the FRB prior to declaring or paying any dividends between the Bank and the Holding Company; (2) not declare or pay any dividends, make any payments on trust preferred securities, or any other capital distributions, without the prior written approval of the FRB; (3) cease any distribution of interest, principal, or other sums on junior subordinated debentures; (4) receive consent from the FRB prior to incurring, increasing, renewing, or guaranteeing any debt; (5) receive consent from the FRB prior to issuing trust preferred securities; and (6) receive consent from the FRB prior to purchasing or redeeming any Company stock. The Company must furnish quarterly progress reports to the FRB regarding its compliance with the MOU. The first quarterly progress report was submitted on January 31, 2009. The next progress report is due on April 30, 2009. The MOU will remain in effect until modified or terminated by the FRB.
Business Plan and Going Concern Considerations:
Management has developed and is in the process of implementing the required plans that will incorporate the following components: increase the Bank’s risk-weighted capital to over 10%, reduce the level of classified assets, reduce reliance on brokered deposits and improve its liquidity position.
In order to achieve compliance with the plans required by the regulators, we will need to raise capital, obtain additional liquidity sources, sell assets to deleverage, or consider other strategic alternatives. Our ability to accomplish these goals is significantly constrained in the current economic environment. Access to capital markets and liquidity is extremely limited, and we can give no assurances that we will be able to acquire additional capital, liquidity or to sell assets. Our ability to decrease our levels of nonperforming assets is also vulnerable to market conditions, as many borrowers rely on an active real estate market as a source of repayment, particularly our construction loan borrowers. If the real estate market does not improve, our level of nonperforming assets may continue to increase and this will further put strain on liquidity and capital positions.
As a result of the asset quality deterioration and the significant provision for loan losses made during the fourth quarter of 2008, the Bank is no longer considered “well-capitalized”, as defined in FDIC regulations, as of December 31, 2008. As a result, we are prohibited from using brokered deposits to meet our funding/liquidity needs as other deposits and brokered deposits mature, unless we first obtain a waiver from the FDIC. This has added significant strain on our liquidity position. As of March 26, 2009, the Bank had $130,875,000 in brokered deposits, of which $92,500,000 mature during the remainder of 2009. The maturities of these brokered deposits over the next four quarters are as follows: $31,500,000 in the second quarter of 2009; $31,200,000 in third quarter of 2009; $29,800,000 in fourth quarter of 2009 and $20,700,000 during the first quarter of 2010. Although the Bank intends to apply for a waiver from the FDIC to renew brokered deposits, it is uncertain if the waiver will be granted.
We have been aggressively researching alternative resources to meet our liquidity needs and to maintain an adequate cash flow position to sustain operations of the Company. During the first quarter of 2009, the Bank pledged loan collateral to secure its existing line of credit with the FRB. As of March 2009, the Company is eligible to borrow up to $50,000,000 from the FRB discount window.
55
Due to the conditions and events discussed herein, substantial doubt exists as to our ability to continue as a going concern. We have determined that significant additional sources of liquidity and capital will be required for us to continue operations through 2009 and beyond. We have engaged financial advisors to assist the Company in its efforts to raise additional capital, sell assets and explore other strategic alternatives to address our current and expected liquidity and capital deficiencies. To date, those efforts have not yielded any definitive options. As a result of our financial condition, our regulators are continually monitoring our liquidity and capital adequacy. In addition, our regulators have various enforcement tools available to them including the issuance of capital directives, orders to cease engaging in certain business activities and the issuance of modified or additional orders or agreements.
Notwithstanding the above, accompanying consolidated financial statements have been prepared on a going concern basis, which contemplates the realization of assets and the discharge of liabilities in the normal course of business for the foreseeable future, and do not include any adjustments to reflect the possible future effects on the recoverability and classification of assets, or the amounts and classification of liabilities that may result should we be unable to continue as a going concern.
Note 3: Restrictions on Cash and Due from Banks
Cash on hand or on deposit with the Federal Reserve Bank of $25,000 was required to meet regulatory reserve and clearing requirements at both year end 2008 and 2007.
Note 4: Securities
The fair value of securities available-for-sale and the related gross unrealized gains and losses recognized in accumulated other comprehensive income (loss) were as follows (in thousands):
| | | | | | | | | | |
| | | Fair
Value | | Gross
Unrealized
Gains | | Gross
Unrealized
Losses | |
December 31, 2008 | | | | | | | | | | |
U.S. agencies | | $ | 4,087 | | | 88 | | | — | |
States and political subdivisions | | | 2,564 | | | 34 | | | — | |
Mortgage-backed securities and collateralized mortgage obligations | | | 2,935 | | | 7 | | | (5 | ) |
| | | | | | | | | | |
Total securities available-for-sale | | $ | 9,586 | | $ | 129 | | $ | (5 | ) |
| | | | | | | | | | |
| | | |
December 31, 2007 | | | | | | | | | | |
U.S. agencies | | $ | 5,548 | | | 48 | | | — | |
States and political subdivisions | | | 3,380 | | | 7 | | | (10 | ) |
Mortgage-backed securities and collateralized mortgage obligations | | | 3,593 | | | 3 | | | (53 | ) |
| | | | | | | | | | |
Total securities available-for-sale | | $ | 12,521 | | $ | 58 | | $ | (63 | ) |
| | | | | | | | | | |
56
The scheduled maturities of securities available-for-sale at December 31, 2008 were as follows. Securities not due at a single maturity date are shown separately (in thousands):
| | | |
| | | Fair Value |
Due in one year or less | | $ | 755 |
Due after one year through five years | | | 5,896 |
Due after five years through ten years | | | — |
| | | |
Total | | | 6,651 |
Mortgage-backed securities and collateralized mortgage obligations | | | 2,935 |
| | | |
Total | | $ | 9,586 |
| | | |
Sales of securities available-for-sale were as follows (in thousands):
| | | | | | | | | | |
| | | 2008 | | 2007 | | | 2006 |
Proceeds | | $ | — | | $ | 14,762 | | | $ | — |
Gross gains | | | — | | | — | | | | — |
Gross losses | | | — | | | (444 | ) | | | — |
On November 30, 2007, the Company sold its entire investment in the AMF Ultra Short Mortgage Fund. Among other things, a reason for the sale of the investment was to provide liquidity to the Company to fund loan growth. In addition, management considered the uncertainty relating to residential mortgage investments from the recent turmoil in the residential mortgage market. A tax benefit of $151,000 and a corresponding valuation allowance of $151,000 was recorded as a result of the sale of the AMF Ultra Short Mortgage Fund. During the first quarter of 2008, the valuation allowance was reversed.
Securities with an estimated fair value of $8,915,000 and $8,704,000 at December 31, 2008 and 2007, respectively, were pledged to secure public deposits and for other purposes required or permitted by law.
Securities with unrealized losses at year-end 2008, aggregated by investment category and length of time that individual securities have been in a continuous unrealized loss position, are as follows (in thousands):
| | | | | | | | | | | | | | | | | | | | |
| | | Less than 12 Months | | 12 Months or More | | | Fair
Value | | Total | |
Description of Securities | | Fair
Value | | Unrealized
Loss | | Fair
Value | | Unrealized
Loss | | | | Unrealized
Loss | |
Mortgage-backed securities and collateralized mortgage obligations | | $ | — | | $ | — | | $ | 1,334 | | $ | (5 | ) | | $ | 1,334 | | $ | (5 | ) |
| | | | | | | | | | | | | | | | | | | | |
Total temporarily impaired | | $ | — | | $ | — | | $ | 1,334 | | $ | (5 | ) | | $ | 1,334 | | $ | (5 | ) |
| | | | | | | | | | | | | | | | | | | | |
At December 31, 2008, securities with unrealized losses have an aggregate depreciation of 0.4 percent from the Company’s amortized cost basis. The unrealized losses are predominately the result of changing market values due to interest rate fluctuations, accordingly, are considered as temporary. No credit issues have been identified that cause management to believe the declines in market value are other than temporary. The Company has the ability to hold these securities until recovery, which may be maturity.
57
Securities with unrealized losses at year-end 2007, aggregated by investment category and length of time that individual securities have been in a continuous unrealized loss position, are as follows (in thousands):
| | | | | | | | | | | | | | | | | | | | | |
| | | Less than 12 Months | | | 12 Months or More | | | Fair
Value | | Total | |
Description of Securities | | Fair
Value | | Unrealized
Loss | | | Fair
Value | | Unrealized
Loss | | | | Unrealized
Loss | |
State and political subdivisions | | $ | — | | $ | — | | | $ | 2,450 | | $ | (10 | ) | | $ | 2,450 | | $ | (10 | ) |
Mortgage-backed securities and collateralized mortgage obligations | | | 95 | | | (1 | ) | | | 3,173 | | | (52 | ) | | | 3,268 | | | (53 | ) |
| | | | | | | | | | | | | | | | | | | | | |
Total temporarily impaired | | $ | 95 | | $ | (1 | ) | | $ | 5,623 | | $ | (62 | ) | | $ | 5,718 | | $ | (63 | ) |
| | | | | | | | | | | | | | | | | | | | | |
At December 31, 2007, securities with unrealized losses have an aggregate depreciation of 1.1 percent from the Company’s amortized cost basis. The unrealized losses are predominately the result of changing market values due to increasing short-term (less than two years) market interest rates, are expected to regain the lost value with stable or declining interest rates in keeping with the pattern of past economic cycles, and, accordingly, are considered as temporary. No credit issues have been identified that cause management to believe the declines in market value are other than temporary. The Company has the ability to hold these securities until recovery, which may be maturity.
Note 5: Loans
The Company originates loans primarily in King, Snohomish, and Pierce Counties. Although the Company has a diversified loan portfolio, local economic conditions may affect the borrower’s ability to meet stated repayment terms. Collateral may, depending on the loan, include accounts receivable, inventory, equipment, and real estate. Loans are originated at both fixed and variable rates.
Loans at December 31 consisted of the following (in thousands):
| | | | | | |
| | | 2008 | | 2007 |
Commercial | | $ | 94,190 | | $ | 89,146 |
Real estate mortgage | | | 203,715 | | | 203,765 |
Real estate construction | | | 99,484 | | | 58,968 |
Consumer | | | 25,169 | | | 23,282 |
Other including overdrafts | | | 113 | | | 267 |
| | | | | | |
Total | | $ | 422,671 | | $ | 375,428 |
| | | | | | |
Unamortized deferred loan fees, net of unamortized origination costs, were $1,190,000 and $1,263,000 at December 31, 2008 and 2007, respectively.
At December 31, 2008 and 2007, loans aggregating $111,363,000 and $106,799,000, respectively, were reported as available as collateral for the advances from the FHLB of Seattle, as described in Note 10: Borrowings and Junior Subordinated Debt to the consolidated financial statements.
Loans to principal officers, directors, and their affiliates in 2008 were as follows (in thousands):
| | | | |
Beginning balance | | $ | 1,526 | |
Repayments | | | (1,150 | ) |
Additions | | | 72 | |
| | | | |
Ending balance | | $ | 448 | |
| | | | |
58
Note 6: Allowance for Loan Losses
Changes in the allowance for loan losses were as follows (in thousands):
| | | | | | | | | | | | |
| | | 2008 | | | 2007 | | | 2006 | |
Balance at January 1 | | $ | 4,166 | | | $ | 2,784 | | | $ | 2,056 | |
Recoveries credited to the allowance | | | 88 | | | | 78 | | | | 36 | |
Provision for loan losses | | | 11,961 | | | | 1,926 | | | | 810 | |
Loans charged off | | | (5,717 | ) | | | (622 | ) | | | (118 | ) |
| | | | | | | | | | | | |
Balance at December 31 | | $ | 10,498 | | | $ | 4,166 | | | $ | 2,784 | |
| | | | | | | | | | | | |
A portion of the allowance for loan losses is allocated to impaired loans. Information with respect to impaired loans and the related allowance for loan losses is as follows (in thousands):
| | | | | | | | | |
| | | 2008 | | 2007 | | 2006 |
Impaired loans for which no allowance for loan losses was allocated | | $ | 6,537 | | $ | 898 | | $ | — |
Impaired loans with an allocation of the allowance for loan losses | | | 19,079 | | | 779 | | | 123 |
| | | | | | | | | |
Total | | $ | 25,616 | | $ | 1,677 | | $ | 123 |
| | | | | | | | | |
Amount of the allowance for loan losses allocated | | $ | 2,882 | | $ | 630 | | $ | 51 |
| | | | | | | | | |
| | | |
| | | 2008 | | 2007 | | 2006 |
Average of impaired loans during the year | | $ | 7,012 | | $ | 505 | | $ | 70 |
Interest income on impaired loans was not material during the years 2008, 2007 and 2006.
Included in the impaired loans as of December 31, 2007 was a loan relationship totaling $898,000 in outstanding balances. Although, a collateral liquidation analysis on the underlying collateral showed a collateral shortfall of approximately $400,000, the Company, based on its analysis of the discounted cash flows, believed the operations under the anticipated restructured loans terms would meet the original value of the loans, thus no specific allocation was provided on this credit in 2007. Although the loan relationship was designated as impaired, the loans were not on non-accrual status or past due over 90 days and thus were not considered nonperforming loans as of December 31, 2007. The Company continued to monitor the performance of the loan relationship, including the borrower’s cash flow position. In 2008, the borrower’s cash flow deteriorated such that it became apparent that the loan would not be repaid under the restructured terms. The portion of the loan relationship deemed to be uncollectible was charged off in December 2008.
Nonperforming loans at December 31 were as follows (in thousands):
| | | | | | |
| | | 2008 | | 2007 |
Loans past due 90 days or more and still accruing | | $ | 1,185 | | $ | 36 |
Loans accounted for on a nonaccrual basis | | | 22,782 | | | 779 |
If interest on these nonaccrual loans had been recognized, such income would have been | | | 426 | | | 35 |
Nonperforming loans and impaired loans are defined differently. Some loans may be included in both categories, whereas other loans may only be included in one category.
59
Note 7: Real Estate Owned
The following table summarizes changes in the Real Estate Owned (“REO”) for 2008 (in thousands):
| | | |
| | | 2008 |
Balance at beginning of period | | $ | — |
Additions to REO | | | 4,901 |
Valuation adjustments | | | — |
| | | |
Balance at end of period | | $ | 4,901 |
| | | |
There were no sales or write downs of REO in 2008. Operating expenses relating to REO were considered immaterial for 2008. There was no REO activity in 2007 or 2006.
Note 8: Premises and Equipment
Premises and equipment at December 31 consisted of the following (in thousands):
| | | | | | | | |
| | | 2008 | | | 2007 | |
Equipment and furniture | | $ | 6,208 | | | $ | 5,314 | |
Leasehold improvements | | | 4,460 | | | | 3,763 | |
Accumulated depreciation and amortization | | | (7,221 | ) | | | (6,191 | ) |
| | | | | | | | |
Total | | $ | 3,447 | | | $ | 2,886 | |
| | | | | | | | |
Depreciation expense amounted to $1,066,000, $973,000, and $854,000 for 2008, 2007, and 2006, respectively.
Note 9: Deposits
The average rate paid on deposits was 3.38 percent for 2008 and 4.41 percent for 2007. Time certificates of deposit in denominations of $100,000 or more aggregated $185,938,000 and $127,238,000, including $19,061,000 and $19,993,000 of public funds from the State of Washington at December 31, 2008 and 2007, respectively. As of year-end 2008 and 2007, certificates of deposits include $130,700,000 and $85,467,000 of brokered certificates of deposits.
The scheduled maturities of certificates of deposits at December 31, 2008 were as follows (in thousands):
| | | |
2009 | | $ | 188,376 |
2010 | | | 34,632 |
2011 | | | 2,400 |
2012 | | | 478 |
2013 | | | 259 |
| | | |
Total | | $ | 226,145 |
| | | |
60
Note 10: Borrowings and Junior Subordinated Debt
Advances from the FHLB are summarized as follows (in thousands):
| | | | | | | | | | | | |
| | | December 31, |
| | | 2008 | | 2007 |
| | | Weighted
Average Rate | | | Amount | | Weighted
Average Rate | | | Amount |
Advances from the FHLB due | | | | | | | | | | | | |
2008 | | — | % | | $ | — | | 4.62 | % | | $ | 41,185 |
2009 | | 1.00 | | | | 34,100 | | 4.77 | | | | 3,000 |
2010 | | 5.06 | | | | 2,675 | | 5.06 | | | | 2,675 |
2011 | | 5.14 | | | | 3,000 | | 5.14 | | | | 3,000 |
2012 | | 4.45 | | | | 9,050 | | 4.45 | | | | 9,050 |
2013 | | 3.48 | | | | 7,000 | | 5.25 | | | | 2,000 |
2014 | | 5.36 | | | | 2,500 | | 5.36 | | | | 2,500 |
2015 | | 5.67 | | | | 1,500 | | 5.67 | | | | 1,500 |
2017 | | 3.74 | | | | 5,000 | | 3.74 | | | | 5,000 |
| | | | | | | | | | | | |
Total | | 2.59 | % | | | 64,825 | | 4.65 | % | | $ | 69,910 |
| | | | | | | | | | | | |
These advances were collateralized in aggregate, as provided for in the Advance Security and Deposit Agreement with the FHLB, by FHLB stock owned, deposits with the FHLB, qualifying first mortgage loans, and certain U.S. government agency securities. At December 31, 2008, none of the advances have adjustable rates. Although the Company does not anticipate replacement of FHLB advances, if repayments were to occur prior to the contractual maturities, prepayment fees could be assessed.
In 2008, the Bank had a credit line through the FHLB for properly collateralized borrowings up to 30 percent of the Bank’s total assets. Borrowings from the FHLB totaled $64,825,000 at December 31, 2008 compared to $69,910,000 at December 31, 2007. Based on the collateral pledged and the Company’s holdings of FHLB stock, the Company was eligible to borrow up to $111,363,000 at year-end 2008. In January 2009, the Company reduced the amount of collateral it pledged to FHLB to the extent that only its current borrowings were collateralized; the Company is not eligible for further borrowings until additional collateral is pledged.
In addition to its line with FHLB, at December 31, 2008, the Bank had approved credit lines with correspondent banks for overnight fund credit facilities aggregating $20,500,000. In the first quarter of 2009, the Company was notified that all of its overnight funds credit lines were either reduced or eliminated leaving its credit lines at $100,000 at the end of March 2009.
In January 2009, the Company pledged loans eligible as collateral to the Federal Reserve Bank (“FRB”) to support additional borrowings under the discount window. The allowable balance on the line was $50,000,000 in March 2009.
In April 2007, the Company formed EvergreenBancorp Statutory Trust III (“Trust III”) a statutory trust formed under the laws of the State of Delaware. Trust III issued $5 million in trust preferred securities in a private placement offering. Simultaneously with the issuance of the trust preferred securities by Trust III, the Company issued junior subordinated debentures to Trust III. The junior subordinated debentures are the sole assets of Trust III. The junior subordinated debentures and the trust preferred securities pay distributions and dividends, respectively, on a quarterly basis, which are included in interest expense. The interest rate payable on the debentures and the trust preferred securities resets quarterly and is equal to the three-month LIBOR plus 1.65 percent (3.65 percent at December 31, 2008). The junior subordinated debentures are redeemable at par beginning in December 2012; the debentures will mature in June 2037, at which time the preferred securities must be redeemed. The Company has the option to defer interest payments on these subordinated debentures from time to time for a period not to exceed twenty consecutive quarterly periods. In July of 2007, the Company
61
used the net proceeds from the trust preferred issuance to call $5 million of trust preferred securities issued in May 2002 and concurrently redeemed related trust preferred securities issued to the public.
In November 2006, Bancorp formed EvergreenBancorp Statutory Trust II (“Trust II”) a statutory trust formed under the laws of the State of Connecticut. In November 2006, Trust II issued $7 million in trust preferred securities in a private placement offering. Simultaneously with the issuance of the trust preferred securities by Trust II, Bancorp issued junior subordinated debentures to Trust II. The junior subordinated debentures are the sole assets of Trust II. The junior subordinated debentures and the trust preferred securities pay distributions and dividends, respectively, on a quarterly basis, which are included in interest expense. The interest rate payable on the debentures and the trust preferred securities resets quarterly and is equal to the three-month LIBOR plus 1.70 percent (3.70 percent at December 31, 2008). The junior subordinated debentures are redeemable at par beginning in December 2011; the debentures will mature in December 2036, at which time the preferred securities must be redeemed. The Company has the option to defer interest payments on these subordinated debentures from time to time for a period not to exceed twenty consecutive quarterly periods. Bancorp has provided a full, irrevocable, and unconditional guarantee on a subordinated basis of the obligations of Trust II under the preferred securities as set forth in such guarantee agreement.
Under current accounting guidance, FASB Interpretation No. 46, as revised in December 2003, Trust II and Trust III are not consolidated with the Company. Accordingly, the Company does not report the securities issued by Trust II and Trust III as liabilities, and instead reports as liabilities the subordinated debentures issued by the Company and held by Trust II and Trust III, as these are not eliminated in consolidation. The Company’s investment in the common stock of Trust II and Trust III was $217,000 and $155,000, respectively, and is included in accrued interest and other assets on the Consolidated Balance Sheets.
As required by the MOU discussed in Note 2 to the consolidated financial statements, the Company has deferred payments on all junior subordinated debentures, effective with the March 15, 2009 payments. The terms of the debentures and trust indentures allow for the Company to defer interest payments for up to 20 consecutive quarters. As such, the deferral of interest does not constitute a default. During the period that the interest deferrals have been elected, the Company will continue to record the expense associated with the debentures. Upon the expiration of the deferral period, all accrued and unpaid interest is due and payable.
Note 11: Stockholders’ Equity
In September 2006, the Company commenced an equity offering of its common stock, which ended December 14, 2006. A total of $4,547,000, net of offering costs, in capital was raised through the offering, totaling 310,547 shares.
In the fourth quarter of 2008, the Bancorp’s Board of Directors approved a 5% stock dividend to be issued on December 3, 2008 to shareholders of record as of November 19, 2008. The stock dividend also affected previously granted stock options and stock awards under the amended plan.
Note 12: Income Taxes
Income tax expense for the years ended December 31 consisted of the following (in thousands):
| | | | | | | | | | | | |
| | | 2008 | | | 2007 | | | 2006 | |
Currently payable | | $ | (195 | ) | | $ | 1,263 | | | $ | 1,471 | |
Deferred | | | (983 | ) | | | (686 | ) | | | (687 | ) |
Change in valuation allowance | | | 2,154 | | | | 151 | | | | — | |
| | | | | | | | | | | | |
Total | | $ | 976 | | | $ | 728 | | | $ | 784 | |
| | | | | | | | | | | | |
62
A reconciliation between the statutory federal income tax rates (maximum of 34 percent) and the effective income tax rate was as follows (in thousands):
| | | | | | | | | | | | |
| | | 2008 | | | 2007 | | | 2006 | |
Federal income tax at statutory rates | | $ | (1,100 | ) | | $ | 649 | | | $ | 877 | |
Decrease in taxes resulting from tax-exempt interest income | | | (37 | ) | | | (34 | ) | | | (31 | ) |
Bank owned life insurance | | | (76 | ) | | | (75 | ) | | | (77 | ) |
Change in valuation allowance | | | 2,154 | | | | 151 | | | | — | |
Nondeductible expenses and other | | | 35 | | | | 37 | | | | 15 | |
| | | | | | | | | | | | |
Total | | $ | 976 | | | $ | 728 | | | $ | 784 | |
| | | | | | | | | | | | |
Effective tax rate | | | (30 | )% | | | 38 | % | | | 30 | % |
| | | | | | | | | | | | |
The components of the deferred income tax asset included in other assets were as follows (in thousands):
| | | | | | | | |
| | | 2008 | | | 2007 | |
Deferred tax asset | | | | | | | | |
Provision for loan losses | | $ | 2,957 | | | $ | 1,283 | |
Unamortized loan fees, net of loan costs | | | 405 | | | | 427 | |
Accrued vacation pay | | | 30 | | | | 123 | |
Unrealized losses on securities available-for-sale, net | | | — | | | | 1 | |
Indemnification charges | | | — | | | | 721 | |
Capital loss carryforward | | | — | | | | 151 | |
Depreciation | | | 298 | | | | 140 | |
Non-accrual loan interest | | | 145 | | | | 29 | |
Other | | | 137 | | | | 85 | |
| | | | | | | | |
| | | 3,972 | | | | 2,960 | |
| | | | | | | | |
Deferred tax liability | | | | | | | | |
Federal Home Loan Bank stock dividends | | $ | (262 | ) | | $ | (262 | ) |
Unrealized gains on securities available-for-sale, net | | | (43 | ) | | | — | |
Other | | | (60 | ) | | | (30 | ) |
| | | | | | | | |
| | | (365 | ) | | | (292 | ) |
| | | | | | | | |
Valuation allowance | | | (2,305 | ) | | | (151 | ) |
| | | | | | | | |
Net deferred income tax asset | | $ | 1,302 | | | $ | 2,517 | |
| | | | | | | | |
The valuation allowance on the deferred tax asset was $2,305,000 at December 31, 2008. Based upon the level of carry-back to prior available taxable years, the Company believes it is more likely than not that the remaining net deferred tax asset, net of the valuation allowance, of $1,302,000 at December 31, 2008 will be realized. The valuation allowance at December 31, 2007 and 2006 was $151,000 and $0.
As of December 31, 2008, the Company did not have any unrecognized tax benefits under FIN 48. The Company does not expect the total amount of unrecognized tax benefits to significantly increase/decrease in the next twelve months. The Company did not have any accrued interest and/or penalties at December 31, 2008 and 2007. The Company and its subsidiaries are subject to U.S. federal income tax. The Company is no longer subject to examination by taxing authorities for years before 2004.
Note 13: Stock Option and Equity Compensation Plan
Stock option and equity compensation plan. In April of 2000, the shareholders of the Bank adopted the 2000 Stock Option Plan that was subsequently adopted by Bancorp as a result of the holding company formation.
63
In April of 2003, the shareholders of Bancorp approved an amendment to the 2000 Stock Option Plan to increase the number of shares available under the plan by 66,000. In April of 2006, the shareholders adopted the Second Amended 2000 Stock Option and Equity Compensation Plan (the “Second Amended 2000 Plan”) which allows greater flexibility in the type of equity compensation to be awarded and to the terms of such awards. In April 2008, the shareholders adopted the Stock Option and Equity Compensation Plan (“Amended Plan”) which increased the number of shares available under the plan by 120,000. Up to 472,210 shares of common stock may be awarded under the Amended Plan. Awards available under the Amended Plan are subject to adjustment for all stock dividends and stock splits paid by the Company. As of December 31, 2008, approximately 152,118 shares of common stock were available for future grant under the Second Amended 2000 Plan.
In addition to stock options, the Amended Plan provides for the granting of restricted stock, stock appreciation rights, and restricted stock units. All employees, officers, and directors of the Company or a related corporation, and independent contractors who perform services for the Company or a related corporation, are eligible to be granted awards. The terms of each award are set forth in individual award agreements. To date, nonqualified stock options and restricted stock have been awarded to employees and directors.
Stock options. All outstanding nonqualified stock options awarded to date to employees vest over a five-year period and expire after ten years from the date of grant. All outstanding nonqualified stock options awarded to date to directors vest over a three-year period and expire after three years, three months from the date of grant.
The fair value of each option award is estimated on the date of grant using a closed form option valuation (Black-Scholes) model that uses the assumptions noted in the table below. Expected volatilities are based on historical volatilities of the Company’s common stock. The Company uses historical data to estimate option exercise and post-vesting termination behavior. Employee and management options are tracked separately. The expected term of options granted is based on historical data and represents the period of time that options granted are expected to be outstanding. The risk-free interest rate for the expected term of the option is based on the U.S. Treasury yield curve in effect at the time of the grant.
The fair value of options granted was determined using the following weighted-average assumptions as of grant date. There were no options granted in 2008.
| | | | | | |
| | | 2007 | | | 2006 | |
Risk-free interest rate | | 4.47 | % | | 4.94 | % |
Expected option life | | 6.5 years | | | 7.5 years | |
Expected stock price volatility | | 20 | % | | 24 | % |
Dividend yield | | 1.8 | % | | 1.7 | % |
A summary of activity in the stock option plan for 2008 is as follows:
| | | | | | | | | | |
| | | Shares | | | Weighted-
Average
Exercise
Price | | Weighted
Average
Remaining
Contractual
Term | | Aggregate
Intrinsic
Value |
Outstanding at the beginning of the year | | 208,559 | | | $ | 9.93 | | | | |
Granted | | — | | | | — | | | | |
Exercised | | (22,895 | ) | | | 7.01 | | | | |
Forfeited | | (16,512 | ) | | | 10.98 | | | | |
| | | | | | | | | | |
Outstanding at the end of the year | | 169,152 | | | $ | 10.25 | | 4.46 years | | N/A |
| | | | | | | | | | |
Exercisable at the end of the year | | 131,378 | | | $ | 8.84 | | 3.75 years | | N/A |
| | | | | | | | | | |
Vested or expected to vest | | 160,694 | | | $ | 10.25 | | 4.46 years | | N/A |
| | | | | | | | | | |
64
Information related to the stock option plan during each year follows:
| | | | | | | | | |
| | | 2008 | | 2007 | | 2006 |
| | | (in thousands, except fair
value of options granted) |
Intrinsic value of options exercised | | $ | 104 | | $ | 49 | | $ | 243 |
Cash received from option exercises | | | 158 | | | 154 | | | 381 |
Tax benefit realized from option exercises | | | 35 | | | 12 | | | 82 |
Weighted average fair value of options granted | | | — | | | 3.78 | | | 4.49 |
As of December 31, 2008, there was $89,000 of total unrecognized compensation cost related to outstanding stock options granted under the Plan. The cost is expected to be recognized over a weighted average period of 0.68 years.
Stock Awards. Restricted stock awards provide for the immediate issuance of shares of Company common stock to the recipient. In the event the shares are granted subject to certain conditions or vesting schedules, such shares are held in escrow until those conditions are met, or until such shares have vested. Recipients of restricted shares do not pay any cash consideration to the Company for the shares, have the right to vote all shares subject to such grant, and receive all dividends with respect to such shares, whether or not the shares have vested. The fair value of share awards is equal to the fair market value of the Company’s common stock on the date of grant.
During 2008, restricted stock awards for 13,276 shares were granted to employees of the Company. The awards become fully vested after the employees’ completion of five years of employment. In the event the employee resigns or is terminated during the five year vesting period, all shares subject to the award are forfeited. Compensation expense is recognized over the vesting period of the award based upon the fair market value of the Company’s common stock at the date of grant.
A summary of the status of the Company’s nonvested awards as of December 31, 2008 is as follows:
| | | | | | |
Nonvested Shares | | Shares | | | Weighted-Average
Grant-Date Fair
Value |
Nonvested at January 1, 2008 | | 19,425 | | | $ | 15.54 |
Granted | | 13,276 | | | | 9.00 |
Vested | | (210 | ) | | | 14.05 |
Forfeited | | (1,365 | ) | | | 14.05 |
| | | | | | |
Nonvested at December 31, 2008 | | 31,126 | | | | 14.75 |
| | | | | | |
Vested or expected to vest | | 29,570 | | | $ | 14.75 |
| | | | | | |
As of December 31, 2008, there was $284,000 of total unrecognized compensation cost related to nonvested stock awards granted under the Plan. The cost is expected to be recognized over a weighted average period of 4.1 years. The fair value of vested awards for the year ended December 31, 2008 was approximately $1,200.
Note 14: Earnings (Loss) Per Share of Common Stock
Basic earnings (loss) per share of common stock are computed on the basis of the weighted average number of common stock shares outstanding. Diluted earnings per share of common stock is computed on the basis of the weighted average number of common shares outstanding plus the effect of the assumed conversion of outstanding stock options and nonvested stock awards. All computations of basic and diluted earnings per share are adjusted for all applicable stock splits and dividends paid on the Company’s common stock.
65
A reconciliation of the numerator and denominator used in the calculation of basic and diluted earnings per share of common stock is as follows (in thousands, except share and per share data):
| | | | | | | | | | |
| | | 2008 | | | 2007 | | 2006 |
Income (numerator): | | | | | | | | | | |
Net Income(loss) | | $ | (4,211 | ) | | $ | 1,181 | | $ | 1,819 |
| | | | | | | | | | |
Shares (denominator): | | | | | | | | | | |
Weighted average number of common stock shares outstanding—basic | | | 2,523,375 | | | | 2,476,628 | | | 2,145,544 |
Dilutive effect of outstanding employee and director stock options and nonvested stock awards | | | — | | | | 39,288 | | | 28,550 |
| | | | | | | | | | |
Weighted average number of common stock shares outstanding and assumed conversions—diluted | | | 2,523,375 | | | | 2,515,916 | | | 2,174,094 |
| | | | | | | | | | |
Basic earnings (loss) per share of common stock | | $ | (1.67 | ) | | $ | 0.48 | | $ | 0.85 |
| | | | | | | | | | |
Diluted earnings (loss) per share of common stock | | $ | (1.67 | ) | | $ | 0.47 | | $ | 0.84 |
| | | | | | | | | | |
All outstanding stock options and unvested stock awards at December 31, 2008 were considered anti-dilutive. For 2007 and 2006 diluted earnings per share calculations, 72,000 and 38,000 options and restricted stock awards (only for 2007) were considered anti-dilutive.
Note 15: Retirement Benefits
The Company participates in a defined contribution retirement plan. The 401(k) plan permits all salaried employees to contribute up to a maximum of 15 percent of gross salary per month. During 2008, for the first 6 percent, the Company contributed two dollars for each dollar the employee contributes. Partial vesting of Company contributions to the plan begins at 20 percent after two years of employment, and such contributions are 100 percent vested with five years of employment. The Company recognized expense of $455,000, $439,000, and $355,000, related to contributions to the plan for 2008, 2007, and 2006, respectively.
Prior to 2008, the Company also participated in multiple-employer defined benefit postretirement health care plans that provided medical and dental coverage to directors and surviving spouses and to employees who retired after age 62 and 15 years of full-time service and their dependents.
In November 2007, the plan was terminated and payments consisting of a combination of annuities and cash were given to plan participants in exchange for their rights to receive future postretirement benefits as defined under the plan. The payments that were given upon settlement of the plan were approximately $900,000 based upon employees’ future service years as it related to their eligibility to receive benefits under the plan. The accumulated post-retirement benefit obligation was $1,900,000 at the plan settlement date. A gain of approximately $1,000,000 was recorded for the gain on the settlement of the plan.
66
The Company used a September 30 measurement date for its plans, except for 2007 where the information is disclosed in the following tables through the plan termination date of November, 30, 2007. Net periodic postretirement benefit cost for 2007 and 2006 included the following components (in thousands):
| | | | | | | | |
| | | 2007 | | | 2006 | |
Service cost | | $ | 151 | | | $ | 163 | |
Interest cost | | | 121 | | | | 114 | |
Amortization of transition obligation | | | — | | | | — | |
Amortization of prior service cost | | | (25 | ) | | | (5 | ) |
Recognized actuarial (gain) loss | | | 14 | | | | 31 | |
Gain on settlement of the post-retirement plan | | | (1,002 | ) | | | — | |
| | | | | | | | |
Net periodic benefit cost (income) | | $ | (741 | ) | | $ | 303 | |
| | | | | | | | |
A reconciliation of the benefit obligation at the beginning and end of the year and the effects attributable to each cost component for 2007 and 2006 are as follows (in thousands):
| | | | | | | | |
| | | 2007 | | | 2006 | |
Benefit obligation at beginning of year | | $ | 2,219 | | | $ | 1,928 | |
Service cost | | | 151 | | | | 163 | |
Interest cost | | | 121 | | | | 114 | |
Plan participants’ contributions | | | 7 | | | | 3 | |
Amendments | | | (247 | ) | | | — | |
Actuarial loss | | | (314 | ) | | | 55 | |
Benefits paid | | | (45 | ) | | | (44 | ) |
| | | | | | | | |
Benefit obligation at 11/30/2007 and 12/31/2006 | | $ | 1,892 | | | $ | 2,219 | |
| | | | | | | | |
Settlement of post-retirement plan | | | | | | | | |
Balance prior to termination | | | (1,892 | ) | | | | |
Payments made at settlement date | | | 890 | | | | | |
Gain on settlement of post-retirement plan | | | 1,002 | | | | | |
| | | | | | | | |
Benefit obligation at end of year | | $ | — | | | | | |
The fair value of plan assets at the beginning and end of the year and the changes during 2007 and 2006 are as follows (in thousands):
| | | | | | | | |
| | | 2007 | | | 2006 | |
Fair value of plan assets at beginning of year | | $ | — | | | $ | — | |
Employer contribution | | | 38 | | | | 41 | |
Plan participants’ contributions | | | 7 | | | | 3 | |
Benefits paid | | | (45 | ) | | | (44 | ) |
| | | | | | | | |
Fair value of plan assets at end of year | | $ | — | | | $ | — | |
| | | | | | | | |
The accumulated benefit obligation was $2,219,000 at year-end 2006 and there was no accumulated benefit obligation at year-end 2007.
The weighted-average discount rate used in determining the benefit obligation was 6.25 percent for 2007 and 5.75 percent for 2006. The weighted average discount rate used in determining the net periodic benefit cost was 5.75 percent in 2007 and 5.50 percent in 2006.
67
Note 16: Leases
The Company leases premises and parking facilities for the Eastlake and Lynnwood offices from PEMCO Mutual Insurance Company. The Eastlake lease expires March 31, 2012. In December of 2008, PEMCO Mutual Insurance Company notified the Company that it would be selling the premises in which the Lynnwood office is operated. The Company will relocate this office to a nearby location in April 2009. The Company leases the Federal Way, South Lake Union, Bellevue, and Kent premises from other parties. The Federal Way lease ends in April 2009 and the office will move to a new location. The new lease expires January 31, 2019. The South Lake Union, Bellevue, and Kent leases expire August 31, 2009, May 31, 2011, and March 31, 2018, respectively. The Company also leases various office spaces within the Third and Seneca Building. These leases expire from March 31, 2012 to April 30, 2015. Generally, the operating leases include renewal options, which are at the Company’s discretion. Total rental expense, including amounts paid under month-to-month cancelable leases, amounted to $925,000, $797,000, and $753,000 for 2008, 2007, and 2006, respectively.
The future minimum rental commitments as of December 31, 2008 for all noncancelable leases are as follows (in thousands):
| | | |
2009 | | $ | 885 |
2010 | | | 862 |
2011 | | | 818 |
2012 | | | 586 |
2013 | | | 443 |
Thereafter | | | 1,075 |
| | | |
Total | | $ | 4,669 |
| | | |
Note 17: Agreements with Related Parties
Prior to 2008, the Company shared common services and support activities with other companies located at PEMCO Financial Center (“PFS”). Those companies include PEMCO Insurance Company, PEMCO Mutual Insurance Company, PEMCO Life Insurance Company, PEMCO Foundation, Inc., PEMCO Corporation, PCCS, Inc., PEMCO Technology Services, Inc., Public Employees Insurance Agency, Inc., and School Employees Credit Union of Washington. Such shared functions included human resources, employee benefits, legal services, and purchasing. Total costs associated with these shared services amounted to $2,000, $137,000, and $224,000 for 2008, 2007, and 2006, respectively. At the end of 2007 and early 2008, the Company moved away from the majority of PFS’ shared services programs and either outsourced the functions or brought them in house.
Some data processing services continue to be provided by PCCS, Inc., PEMCO Corporation, PEMCO Mutual Insurance Company, and PEMCO Technology Services, Inc. Data processing fees paid to PFS in 2008, 2007, and 2006 totaled $336,000, $434,000, and $430,000, respectively.
At December 31, 2008, approximately 4 percent of the Company’s deposits are from other companies located at PEMCO Financial Center.
At December 31, 2008, approximately 1 percent of the Company’s total deposits are from senior officers, executives, directors, or other related parties of the Company.
In 2008, two of the members of the Boards of Directors of the Bancorp and the Bank were also directors of one or more of the other companies located at PEMCO Financial Center, except for the School Employees Credit Union of Washington.
68
Note 18: Commitments and Contingencies
In the normal course of business, there are various commitments and contingent liabilities (such as guarantees, commitments to extend credit, letters of credit, and lines of credit) that are not presented in the financial statements. Such off-balance-sheet items are recognized in the financial statements when they are funded or related fees are received. The Company uses the same credit policies in making commitments and conditional obligations as it does for on-balance-sheet instruments. The off-balance-sheet items do not represent unusual elements of credit risk in excess of the amounts recognized in the balance sheets.
The distribution of commitments to extend credit approximates the distribution of loans outstanding as set forth in Note 5: Loans to the consolidated financial statements. Commercial and standby letters of credit and similar arrangements are granted primarily to commercial borrowers.
The Company’s significant commitments and contingent liabilities at December 31 were as follows (in thousands):
| | | | | | | | | | | | |
| | | 2008 | | 2007 |
| | | Fixed | | Variable | | Fixed | | Variable |
Lines of credit | | $ | 8,079 | | $ | 59,258 | | $ | 12,872 | | $ | 70,759 |
Commitments to extend credit | | | — | | | — | | | — | | | 794 |
Standby letters of credit and similar arrangements | | | — | | | 974 | | | — | | | 1,100 |
Commitments to make loans are generally made for periods of 30 days or less. As of December 31, 2008, the Company had no fixed rate loan commitments.
The Company is not aware of any claims or lawsuits that would have a materially adverse effect on the financial position of the Company, other than the Visa matter discussed below.
The Company, as a Visa member bank, is obligated to indemnify Visa for certain litigation losses. In the fourth quarter of 2007, the Company recognized indemnification charges of $2,122,000 related to this obligation. A receivable was recorded to offset the litigation reserve in March 2008 when, upon completion of its IPO, Visa, Inc. established an escrow account to be used to settle certain litigation judgments and settlements. In October 2008, the Company received notice from Visa, Inc. that it had reached a settlement in principle with Discover Financial Services, and as a result of the settlement recorded additional indemnification charges and an increase in its litigation liability totaling $572,000. In addition, the Company recorded a reduction of $1,113,000 in the receivable it booked in March 2008 due to payments made by Visa to American Express that reduced its litigation liability. In the fourth quarter of 2008, the Company recorded a gain that fully offset the $572,000 indemnification charges recorded in the third quarter as a result of Visa’s adjustment of the conversion rate between Class A and Class B Visa, Inc. shares of common stock. The Company currently owns approximately 129,000 shares of Visa, Inc. Class B common stock, which will convert into approximately 81,000 shares of Class A common stock using the current conversion rate. The Company believes that the shares it owns of Visa Inc., which are currently restricted, will be sufficient to cover any future possible litigation against Visa, Inc.
The Company’s indemnification charges recorded in 2007 and 2008 had a more significant impact on its results of operations as compared to similarly sized financial institutions due to the Company, during the years 1993 to 2003, using its membership with Visa, Inc. to issue Visa cards for a significant number of financial institutions.
Note 19: Fair Values of Financial Instruments
FASB Statement No. 157 establishes a fair value hierarchy which requires an entity to maximize the use of observable inputs and minimize the use of unobservable inputs when measuring fair value. The standard describes three levels of inputs that may be used to measure fair value:
Level 1: Quoted prices (unadjusted) for identical assets or liabilities in active markets that the entity has the ability to access as of the measurement date.
69
Level 2: Significant other observable inputs other than Level 1 prices such as quoted prices for similar assets or liabilities; quoted prices in markets that are not active; or other inputs that are observable or can be corroborated by observable market data.
Level 3: Significant unobservable inputs that reflect a reporting entity’s own assumptions about the assumptions that market participants would use in pricing an asset or liability.
The fair values of securities available for sale are determined by matrix pricing, which is a mathematical technique widely used to in the industry to value debt securities without relying exclusively on quoted prices for the specific securities but rather by relying on the securities’ relationship to other benchmark quoted securities (Level 2 inputs).
The fair value of impaired loans with specific allocations of the allowance for loan losses is generally based on recent real estate appraisals. These appraisals may utilize a single valuation approach or a combination of approaches including comparable sales and the income approach. Adjustments are routinely made in the appraisal process by the appraisers to adjust for differences between the comparable sales and income data available. Such adjustments are typically significant and result in a Level 3 classification of the inputs for determining fair value.
Assets and Liabilities Measured on a Recurring Basis
Assets and liabilities measured at fair value on a recurring basis are summarized below (in thousands):
| | | | | | | | | | |
| | | | | Fair Value Measurements at December 31,
2008 Using |
| | | | | Quoted Prices in
Active Markets
for Identical
Assets
(Level 1) | | Significant
Other
Observable
Inputs
(Level 2) | | Significant
Unobservable
Inputs
(Level 3) |
Assets at December 31, 2008: | | | | | | | | | | |
Available for sale securities | | $ | 9,586 | | — | | $ | 9,586 | | — |
The following assets and liabilities were measured at fair value on a non-recurring basis (in thousands):
| | | | | | | | | | |
| | | | | Fair Value Measurements at December 31,
2008 Using |
| | | | | Quoted Prices in
Active Markets
for Identical
Assets
(Level 1) | | Significant
Other
Observable
Inputs
(Level 2) | | Significant
Unobservable
Inputs
(Level 3) |
Assets at December 31, 2008: | | | | | | | | | | |
Impaired loans | | $ | 16,197 | | — | | — | | $ | 16,197 |
Impaired loans, which are measured for impairment using the fair value of the collateral for collateral dependent loans, had a carrying amount of $19,079,000, with a valuation allowance of $2,882,000 at December 31, 2008 resulting in provision for loan losses of $4,318,000 during 2008.
70
The estimated fair values of the Company’s financial instruments, not previously presented, at December 31 were as follows (in thousands):
| | | | | | | | | | | | |
| | | 2008 | | 2007 |
| | | Carrying
Value | | Fair
Value | | Carrying
Value | | Fair
Value |
Financial assets | | | | | | | | | | | | |
Cash and cash equivalents | | $ | 14,009 | | $ | 14,009 | | $ | 22,382 | | $ | 22,382 |
Federal Home Loan Bank certificate of deposits | | | 325 | | | 325 | | | — | | | — |
Federal Home Loan Bank Stock | | | 3,073 | | | N/A | | | 1,925 | | | N/A |
Net loans, excluding loans disclosed above | | | 393,094 | | | 404,849 | | | 371,262 | | | 374,632 |
Accrued interest receivable | | | 1,782 | | | 1,782 | | | 1,965 | | | 1,965 |
Financial liabilities | | | | | | | | | | | | |
Deposits | | $ | 358,890 | | $ | 360,942 | | $ | 309,471 | | $ | 309,527 |
Advances from Federal Home Loan Bank | | | 64,825 | | | 69,189 | | | 69,910 | | | 70,763 |
Junior subordinated debt | | | 12,372 | | | 6,746 | | | 12,372 | | | 12,372 |
Accrued interest payable | | | 1,278 | | | 1,278 | | | 1,855 | | | 1,855 |
The methods and assumptions used to estimate fair value are described as follows.
Carrying amount is the estimated fair value for cash and cash equivalents, Federal Home Loan Bank certificate of deposit, short-term borrowings, accrued interest receivable and payable, demand deposits, and variable rate loans or deposits that reprice frequently and fully. For fixed rate loans or deposits and for variable rate loans or deposits with infrequent repricing or repricing limits, fair value is based on discounted cash flows using current market rates applied to the estimated life and credit risk (including consideration of widening credit spreads). It was not practicable to determine the fair value of Federal Home Loan Bank Stock due to restrictions placed on its transferability. Fair value of debt is based on current rates for similar financing. The fair value of off-balance-sheet items is not considered material.
Note 20: Regulatory Capital Requirements
The Company is subject to various regulatory capital requirements administered by the federal banking agencies. Failure to meet the minimum capital requirements can initiate certain mandatory and possible additional discretionary actions by regulators that, if undertaken, could have a direct material effect on the Company’s financial statements. Under the capital adequacy guidelines and the regulatory framework for prompt corrective action, the Company must meet specific capital adequacy guidelines that involve quantitative measures of each entity’s assets, liabilities, and certain off-balance-sheet items as calculated under regulatory accounting practices. Capital amounts and classifications also are subject to qualitative judgments by the regulators about components, risk weightings, and other factors.
Quantitative measures established by regulation to ensure capital adequacy require banks and bank holding companies to maintain the minimum amounts and ratios of total capital to risk-weighted assets, Tier 1 capital to risk-weighted assets, and Tier 1 capital to average assets as set forth in the table below. Under the regulatory framework for prompt corrective action, the Company must maintain other minimum risk-based ratios as set forth in the table.
As discussed in Note 2 to the consolidated financial statements, as a result of the losses incurred during 2008, the Bank at December 31, 2008 is no longer categorized as well-capitalized under the regulatory framework for prompt corrective action. To be categorized as well-capitalized, the Bank must maintain the minimum total risk-based, Tier 1 risk-based, and Tier 1 leverage ratios set forth in the table. At December 31, 2008, the Bank’s total risk-based capital ratio was below the required 10% ratio needed to be categorized as well-capitalized.
71
The actual capital amounts (in thousands) and ratios of the Company and the Bank are presented in the table below.
| | | | | | | | | | | | | | | | | | |
| | | Actual | | | Minimum for
Capital Adequacy
Purposes | | | Minimum to Be
Well Capitalized
Under the Prompt
Corrective Action
Provisions | |
| | | Amount | | Ratio | | | Amount | | Ratio | | | Amount | | Ratio | |
December 31, 2008 | | | | | | | | | | | | | | | | | | |
Total capital (to risk-weighted assets) | | | | | | | | | | | | | | | | | | |
Consolidated | | $ | 38,720 | | 9.10 | % | | $ | 34,023 | | 8.00 | % | | | N/A | | N/A | |
Bank | | | 38,055 | | 8.96 | | | | 33,994 | | 8.00 | | | $ | 42,492 | | 10.00 | % |
Tier 1 capital (to risk-weighted assets) | | | | | | | | | | | | | | | | | | |
Consolidated | | | 27,957 | | 6.57 | | | | 17,011 | | 4.00 | | | | N/A | | N/A | |
Bank | | | 32,679 | | 7.69 | | | | 16,997 | | 4.00 | | | | 25,495 | | 6.00 | |
Tier 1 capital (to average assets) (1) | | | | | | | | | | | | | | | | | | |
Consolidated | | | 27,957 | | 6.03 | | | | 18,536 | | 4.00 | | | | N/A | | N/A | |
Bank | | | 32,679 | | 7.05 | | | | 18,548 | | 4.00 | | | | 23,185 | | 5.00 | |
| | | | | | |
December 31, 2007 | | | | | | | | | | | | | | | | | | |
Total capital (to risk-weighted assets) | | | | | | | | | | | | | | | | | | |
Consolidated | | $ | 41,977 | | 11.24 | % | | $ | 29,877 | | 8.00 | % | | | N/A | | N/A | |
Bank | | | 41,200 | | 11.28 | | | | 29,212 | | 8.00 | | | $ | 36,515 | | 10.00 | % |
Tier 1 capital (to risk-weighted assets) | | | | | | | | | | | | | | | | | | |
Consolidated | | | 33,951 | | 9.09 | | | | 14,938 | | 4.00 | | | | N/A | | N/A | |
Bank | | | 37,034 | | 10.14 | | | | 14,606 | | 4.00 | | | | 21,909 | | 6.00 | |
Tier 1 capital (to average assets) (1) | | | | | | | | | | | | | | | | | | |
Consolidated | | | 33,951 | | 8.19 | | | | 16,585 | | 4.00 | | | | N/A | | N/A | |
Bank | | | 37,034 | | 8.97 | | | | 16,518 | | 4.00 | | | | 20,647 | | 5.00 | |
Dividend Restrictions—The Company’s principal source of funds for dividend payments is dividends received from the Bank. Banking regulations limit the amount of dividends that may be paid without prior approval of regulatory agencies. Under these regulations, the amount of dividends that may be paid in any calendar year is limited to the current year’s net profits, combined with the retained net profits of the preceding two years, subject to the capital requirements described above. Refer to Note 2 to the consolidated financial statements for the Company’s requirement of prior regulatory approval related to the payment of dividends.
Note 21: Condensed Financial Statements of Bancorp
The following are condensed balance sheets at December 31, 2008 and 2007 and the related condensed statements of operation and cash flows for the years ended December 31, 2008, 2007, and 2006.
CONDENSED BALANCE SHEETS (in thousands):
| | | | | | |
| | | 2008 | | 2007 |
Assets | | | | | | |
Due from EvergreenBank | | $ | 31 | | $ | 333 |
Investment in EvergreenBank | | | 32,761 | | | 37,031 |
Other assets | | | 735 | | | 456 |
| | | | | | |
Total assets | | $ | 33,527 | | $ | 37,820 |
| | | | | | |
Liabilities and stockholders’ equity | | | | | | |
Stockholders’ equity | | $ | 21,050 | | $ | 25,436 |
Junior subordinated debt | | | 12,372 | | | 12,372 |
Other liabilities | | | 105 | | | 12 |
| | | | | | |
Total liabilities and stockholders’ equity | | $ | 33,527 | | $ | 37,820 |
| | | | | | |
72
CONDENSED STATEMENTS OF OPERATIONS (in thousands):
| | | | | | | | | | | | |
| | | 2008 | | | 2007 | | | 2006 | |
Dividend income from EvergreenBank | | $ | 915 | | | $ | 1,075 | | | $ | 845 | |
Gain on settlement of post-retirement plan | | | — | | | | 277 | | | | — | |
Interest expense | | | 597 | | | | 986 | | | | 491 | |
Other expense | | | 573 | | | | 707 | | | | 577 | |
| | | | | | | | | | | | |
Income (loss) before income taxes and equity in undistributed income of subsidiary | | | (255 | ) | | | (341 | ) | | | (223 | ) |
Income tax benefit | | | 397 | | | | 481 | | | | 366 | |
Equity in undistributed income (loss) of EvergreenBank | | | (4,353 | ) | | | 1,041 | | | | 1,676 | |
| | | | | | | | | | | | |
Net income (loss) | | $ | (4,211 | ) | | $ | 1,181 | | | $ | 1,819 | |
| | | | | | | | | | | | |
CONDENSED STATEMENTS OF CASH FLOWS (in thousands):
| | | | | | | | | | | | |
| | | 2008 | | | 2007 | | | 2006 | |
Cash flows from operating activities | | | | | | | | | | | | |
Net income (loss) | | $ | (4,211 | ) | | $ | 1,181 | | | $ | 1,819 | |
Adjustments to reconcile net income to net cash provided by operating activities | | | | | | | | | | | | |
Equity in undistributed income (loss) of EvergreenBank | | | 4,353 | | | | (1,041 | ) | | | (1,676 | ) |
Gain on settlement of post-retirement plan | | | — | | | | (277 | ) | | | — | |
Stock option compensation expense | | | 120 | | | | 172 | | | | 123 | |
Other changes, net | | | (134 | ) | | | 143 | | | | 233 | |
| | | | | | | | | | | | |
Net cash provided by operating activities | | | 128 | | | | 178 | | | | 499 | |
| | | |
Cash flows from investing activities | | | | | | | | | | | | |
Capital contributed to EvergreenBank | | | — | | | | — | | | | (11,547 | ) |
Investment in EvergreenBancorp Capital Trust | | | — | | | | (155 | ) | | | (217 | ) |
| | | | | | | | | | | | |
Cash flows used in investing activities | | | — | | | | (155 | ) | | | (11,764 | ) |
| | | |
Cash flows from financing activities | | | | | | | | | | | | |
Payment of dividends | | | (588 | ) | | | (662 | ) | | | (502 | ) |
Repurchase of fractional shares | | | — | | | | — | | | | — | |
Proceeds from issuance of subordinated debt | | | — | | | | 5,155 | | | | 7,217 | |
Repayment of subordinated debt | | | — | | | | (5,000 | ) | | | — | |
Proceeds from equity offering, net of offering costs | | | — | | | | — | | | | 4,547 | |
Proceeds from the exercise of stock options | | | 158 | | | | 154 | | | | 381 | |
| | | | | | | | | | | | |
Net cash provided by (used in) financing activities | | | (430 | ) | | | (353 | ) | | | 11,643 | |
| | | | | | | | | | | | |
Net increase (decrease) in cash | | | (302 | ) | | | (330 | ) | | | 378 | |
Cash on deposit with EvergreenBank at beginning of year | | | 333 | | | | 663 | | | | 285 | |
| | | | | | | | | | | | |
Cash on deposit with EvergreenBank at end of year | | $ | 31 | | | $ | 333 | | | $ | 663 | |
| | | | | | | | | | | | |
73
Note 22: Selected Quarterly Data (Unaudited)
| | | | | | | | | | | | | | |
| | | Quarter Ended | |
| | | March 31 | | June 30 | | September 30 | | | December 31 | |
| | | (In thousands, except per share data) | |
2008 | | | | | | | | | | | | | | |
Interest income | | $ | 7,471 | | $ | 7,003 | | $ | 7,258 | | | $ | 6,698 | |
Net interest income | | | 3,964 | | | 3,911 | | | 4,141 | | | | 3,676 | |
Net income (loss) | | | 3,407 | | | 152 | | | (47 | ) | | | (7,723 | ) |
Basic earnings (loss) per share | | $ | 1.34 | | $ | 0.06 | | $ | (0.02 | ) | | $ | (3.05 | ) |
Diluted earnings (loss) per share | | $ | 1.34 | | $ | 0.06 | | $ | (0.02 | ) | | $ | (3.05 | ) |
| | | | |
2007 | | | | | | | | | | | | | | |
Interest income | | $ | 6,751 | | $ | 7,247 | | $ | 8,033 | | | $ | 7,973 | |
Net interest income | | | 3,639 | | | 3,863 | | | 4,298 | | | | 4,154 | |
Net income (loss) | | | 656 | | | 747 | | | 802 | | | | (1,024 | ) |
Basic earnings (loss) per share | | $ | 0.27 | | $ | 0.30 | | $ | 0.32 | | | $ | (0.41 | ) |
Diluted earnings (loss) per share | | $ | 0.26 | | $ | 0.30 | | $ | 0.31 | | | $ | (0.41 | ) |
1). During the end of the fourth quarter of 2008, the Company experienced deterioration in the loan portfolio which resulted in a large provision for loan losses made during the quarter for the significant increase in nonperforming assets, the level of charge-offs and for the overall economic conditions and its impact on the Company’s loan portfolio. In addition, a $2,305,000 valuation allowance on the deferred tax assets was recorded as of December 31, 2008, which further increased the net loss for the fourth quarter of 2008.
2). In October 2008, the Company received notice from Visa, Inc. that it had reached a settlement in principle with Discover Financial Services, and as a result of the settlement recorded additional indemnification charges and an increase in its litigation liability totaling $572,000. Since the settlement was subsequent to the end of the third quarter, but before the filing of the Form 10-Q, the $572,000 was recorded as of September 30, 2008.
3). The significant increase in net income during the first quarter of 2008 was primarily due to a gain of $5,587,000 resulting from Visa, Inc’s IPO that occurred in March 2008. This amount included a cash gain of $3,465,000 recorded from the mandatory redemption of a portion of the Company’s Visa shares. An additional non-cash gain of $2,122,000 was recorded as a result of Visa establishing an escrow account to cover certain litigation judgments and settlements that the Company had recorded in the fourth quarter of 2007.
4). The fluctuation in net income when comparing quarter ended December 31, 2007 to September 30, 2007 was primarily due to $2,122,000 indemnification charges (pre-tax) recorded for the Visa litigations, and $444,000 loss on sale of securities available for sale. These charges were offset by a pre-tax gain of $1,002,000 recorded upon the settlement of the post-retirement plan.
| Item 9. | Changes in and Disagreements with Accountants on Accounting and Financial Disclosure |
None.
| Item 9A. | Controls and Procedures |
| | (1) | Evaluation of Disclosure Controls and Procedures |
As of December 31, 2008, we carried out an evaluation under the supervision and with the participation of our management, including our company’s chief executive officer and our company’s chief financial officer of the effectiveness and design of our “disclosure controls and procedures,” pursuant to Rule 13a-15(e) and
74
15d-15(e) of the Securities Exchange Act of 1934, as amended. Based upon that evaluation, as further discussed below in“Management’s Annual Report On Internal Control Over Financial Reporting”our chief executive officer and chief financial officer concluded that our disclosure controls and procedures were not effective as of December 31, 2008.
| | (2) | Management’s Report on Internal Control Over Financial Reporting |
Management is responsible for establishing and maintaining adequate internal control over financial reporting for the Company.
The Company’s internal control over financial reporting is a process designed to provide reasonable assurance regarding the reliability of financial reporting and the preparation of the financial statements for external purposes in accordance with accounting principles generally accepted in the United States of America. The Company’s internal control over financial reporting includes those policies and procedures that (i) pertain to the maintenance of records that, in reasonable detail, accurately and fairly reflect transactions and dispositions of the assets of the Company; (ii) provide reasonable assurance that transactions are recorded as necessary to permit preparation of financial statements in accordance with the accounting principles generally accepted in the United States, and that receipts and expenditures of the Company are being made only in accordance with authorizations of management and directors of the Company; and (iii) provide reasonable assurance regarding prevention or timely detection of unauthorized acquisition, use, or disposition of the Company’s assets that could have a material effect on the financial statements.
Because of its inherent limitations, internal control over financial reporting may not prevent or detect misstatements. Also, projections of any evaluation of effectiveness to future periods are subject to the risk that controls may become inadequate because of changes in conditions, or that the degree of compliance with the policies and procedures may deteriorate.
Management performed an assessment of the effectiveness of our internal control over financial reporting as of December 31, 2008 based upon criteria in Internal Control—Integrated Framework issued by the Committee of Sponsoring Organizations of the Treadway Commission (“COSO”). Based on this assessment, management believes that our company’s internal control over financial reporting was not effective as of December 31, 2008 because of the material weakness disclosed below.
In connection with its audit of the Company’s consolidated financial statements for the year ended December 31, 2008, Crowe Horwath LLP (“Crowe Horwath”), the Company’s independent registered public accounting firm, advised the Board of Directors, the Audit Committee and Management of certain significant internal control deficiencies that they consider to be, individually and in the aggregate, a material weakness. A material weakness is a deficiency, or a combination of deficiencies, in internal control over financial reporting, such that there is a reasonable possibility that a material misstatement of the company’s annual or interim financial statements will not be prevented or detected on a timely basis. The following material weakness has been identified.
Our independent registered public accounting firm and an third party loan review firm identified several large loan relationships that warranted loan classification downgrades, including some that were identified as impaired. As a result, our fourth quarter provision for loan losses and related allowance for loan losses was significantly increased. The significant increase in our provision for loan losses resulted in a net loss for the year, and therefore, a deferred tax valuation allowance was also required. As a result of these adjustments and corrections, it was determined by our management that our company did not maintain effective internal control over financial reporting for accounting for these significant estimates as our controls and processes in place were not designed and implemented to ensure that entries were recorded in accordance with United States generally accepted accounting principles and that there were departures from United States generally accepted accounting principles.
75
This annual report on Form 10-K does not include an attestation report of our independent registered public accounting firm regarding internal control over financial reporting. Additionally, management’s report was not subject to attestation by our registered public accounting firm pursuant to temporary rules of the Securities and Exchange Commission that permits us to provide only management’s report in this annual report.
| Item 9B. | Other Information |
None.
76
PART III
| Item 10. | Directors, Executive Officers of the Registrant, and Corporate Governance |
Information regarding directors and executive officers is included in Bancorp’s Proxy Statement for its 2009 Annual Meeting of Shareholders (“the Proxy Statement”) under the heading “Proposal No. 1 Election of Directors,” “Management,” and “Compliance with Section 16(a) Filing Requirements” and is incorporated herein by reference. References within the Proxy Statement to “the Company” refer only to Bancorp.
Information regarding the Company’s Audit Committee financial expert appears under the section “Meetings and Committees of the Board of Directors—Certain Committees of the Board of Directors” in the Company’s Proxy Statement and is incorporated herein by reference.
Bancorp has adopted a code of ethics that applies to its principal executive officer, principal financial officer, principal accounting officer or controller, and any persons performing similar functions. A copy of Bancorp’s Code of Ethics for Senior Financial Officers can be found as an exhibit to Bancorp’s Annual Report on Form 10-K for the year ended December 31, 2003.
| Item 11. | Executive Compensation |
Information concerning compensation of executive officers and directors appears under the section “Compensation of Directors” and “Executive Compensation” of the Proxy Statement and is incorporated herein by reference.
| Item 12. | Security Ownership of Certain Beneficial Owners and Management and Related Shareholder Matters |
Information regarding security ownership of certain beneficial owners and management appears under the section “Security Ownership of Certain Beneficial Owners and Management” of the Proxy Statement and is incorporated herein by reference.
| Item 13. | Certain Relationships and Related Transactions |
Information regarding certain relationships and related transactions appears under the section “Transactions with Management” of the Proxy Statement and is incorporated herein by reference.
| Item 14. | Principal Accountant Fees and Services |
Information regarding the fees Bancorp paid to its independent accountants, Crowe Horwath LLP, during 2008 appears under the section “Auditors” of the Proxy Statement and the information included therein is incorporated herein by reference.
77
PART IV
| Item 15. | Exhibits and Financial Statement Schedules |
(a)(1) Financial Statements
The financial statements required by Item 8 of this report are filed as part of this report.
(a)(2) Financial Statement Schedules
All financial statement schedules are omitted because they are not applicable or not required, or because the required information is included in the consolidated financial statements or the notes thereto.
| | |
Exhibit
No. | | Exhibit |
| 3.1 | | Second Amended and Restated Articles of Incorporation of Registrant dated April 24, 2008 (incorporated by reference to Registrant’s Form 10-Q for the quarter ended June 30, 2008) |
| |
| 3.2 | | Amended and Restated Bylaws of Registrant dated July 17, 2008 (incorporated by reference to Registrant’s Form 8-K July 23, 2008) |
| |
| 10.1* | | Stock Option and Equity Compensation Plan effective January 17, 2008 (incorporated by reference to Registrant’s Form S-8 Filed August 1, 2008; Reg. No. 333-152703) |
| |
| 10.2* | | Restricted Stock Agreement (incorporated by reference to Registrant’s Form S-8 Filed August 1, 2008; Reg. No. 333-152703) |
| |
| 10.3* | | Stock Option Agreement (incorporated by reference to Registrant’s Form S-8 Filed August 1, 2008; Reg. No. 333-152703) |
| |
| 10.4* | | Stock Appreciation Rights Agreement (incorporated by reference to Registrant’s Form S-8 Filed August 1, 2008; Reg. No. 333-152703) |
| |
| 10.5* | | Restricted Stock Unit Agreement (incorporated by reference to Registrant’s Form S-8 Filed August 1, 2008; Reg. No. 333-152703) |
| |
| 10.6* | | Form of Change of Control Severance Agreement effective May 24, 2005 between the Bank and Gerald O. Hatler (incorporated by reference to Registrant’s Form 8-K filed May 27, 2005) |
| |
| 10.7* | | Form of Change of Control Severance Agreement effective February 2, 2006 between the Bank and each of Michelle P. Worden and Valerie K. Blake (incorporated by reference to Registrant’s Form 8-K filed February 8, 2006) |
| |
| 10.8* | | Form of Change of Control Severance Agreement effective September 21, 2006 between the Bank and Gordon D. Browning (incorporated by reference to the Registrant’s Form 8-K filed September 27, 2006) |
| |
| 10.9* | | Form of Change of Control Severance Agreement effective October 24, 2006 between the Bank and Michael H. Tibbits (incorporated by reference to the Registrant’s Form 8-K filed October 26, 2006) |
| |
| 10.10* | | Form of Change of Control Severance Agreement effective July 17, 2008 between the Bank and Barrie M. Macdonald (incorporated by reference to Registrant’s Form 8-K July 22, 2008) |
| |
| 10.11* | | Lease Agreement dated January 18, 2005 between Registrant and EOP-Northwest properties, L.L.C. (incorporated by reference to Registrant’s Form 10-Q for the quarter ended March 31, 2005) |
| |
| 10.12* | | EvergreenBank Deferred Compensation Plan (incorporated by reference to Registrant’s Form 10-K for the year ended December 31, 2007) |
78
| | |
Exhibit
No. | | Exhibit |
| 14 | | Code of Ethics for Senior Financial Officers (incorporated by reference to Registrant’s Form 10-K for the year ended December 31, 2003) |
| |
| 21 | | Subsidiaries of the Registrant |
| |
| 23.1 | | Consent of Independent Registered Public Accounting Firm—Crowe Horwath LLP |
| |
| 31.1 | | Certification of Chief Executive Officer of Registrant required by Rule 13a-14(a)/15d-14(a), adopted pursuant to Section 302 of the Sarbanes-Oxley Act of 2002 |
| |
| 31.2 | | Certification of Chief Financial Officer of Registrant required by Rule 13a-14(a)/15d-14(a), adopted pursuant to Section 302 of the Sarbanes-Oxley Act of 2002 |
| |
| 32.1 | | Certification of Chief Executive Officer of Registrant required by 18 U.S.C. Section 1350, adopted pursuant to Section 906 of the Sarbanes-Oxley Act of 2002 |
| |
32.2
| | Certification of the Chief Financial Officer of Registrant required by 18 U.S.C. Section 1350, adopted pursuant to Section 906 of the Sarbanes-Oxley Act of 2002 |
| * | Denotes management compensation arrangement |
79
SIGNATURES
Pursuant to the requirements of Section 13 or 15(d) of the Securities Exchange Act of 1934, the registrant has duly caused this report to be signed on its behalf by the undersigned, thereunto duly authorized on this 27th day of March, 2009.
| | |
| EVERGREENBANCORP, INC. |
| |
| By: | | /s/ GERALD O. HATLER |
| | Gerald O. Hatler |
| | President and Chief Executive Officer |
Pursuant to the requirements of the Securities Exchange Act of 1934, this report has been signed below by the following persons on behalf of the registrant in the capacities indicated and on the 27th day of March, 2009.
| | |
Signature | | Title |
| |
/s/ GERALD O. HATLER Gerald O. Hatler | | President, Chief Executive Officer and Director (Principal Executive Officer) |
| |
/s/ GORDON D. BROWNING Gordon D. Browning | | Executive Vice President and Chief Financial Officer (Principal Financial and Principal Accounting Officer) |
| |
/s/ RICHARD W. BALDWIN Richard W. Baldwin | | Director |
| |
/s/ CRAIG O. DAWSON Craig O. Dawson | | Director |
| |
/s/ CAROLE J. GRISHAM Carole J. Grisham | | Director |
| |
/s/ ROBERT J. GROSSMAN Robert J. Grossman | | Director |
| |
/s/ STAN W. MCNAUGHTON Stan W. McNaughton | | Director |
| |
/s/ RUSSEL E. OLSON Russel E. Olson | | Director |
| |
/s/ JOSEPH M. PHILLIPS Joseph M. Phillips | | Director |
80