Table of Contents
UNITED STATES
SECURITIES AND EXCHANGE COMMISSION
SECURITIES AND EXCHANGE COMMISSION
Washington, D.C. 20549
Form 6-K
REPORT OF FOREIGN PRIVATE ISSUER
PURSUANT TO RULE 13a-16 OR 15d-16
OF THE SECURITIES EXCHANGE ACT OF 1934
PURSUANT TO RULE 13a-16 OR 15d-16
OF THE SECURITIES EXCHANGE ACT OF 1934
For the month of May 2007
Commission File Number: 001-16829
Bayer Aktiengesellschaft
Bayer Corporation*
Bayer Corporation*
(Translation of registrant’s name into English)
Bayerwerk, Gebaeude W11
Kaiser-Wilhelm-Allee
51368 Leverkusen
Germany
(Address of principal executive offices)
Kaiser-Wilhelm-Allee
51368 Leverkusen
Germany
(Address of principal executive offices)
Indicate by check mark whether the registrant files or will file annual reports under cover of Form 20-F or Form 40-F.
Form 20-Fþ Form 40-Fo
Indicate by check mark if the registrant is submitting the Form 6-K in paper as permitted by Regulation S-T Rule 101 (b)(1):N/A
Indicate by check mark if the registrant is submitting the Form 6-K in paper as permitted by Regulation S-T Rule 101 (b)(7):N/A
Indicate by check mark whether, by furnishing the information contained in this form, the registrant is also thereby furnishing the information to the Commission pursuant to Rule 12g3-2(b) under the Securities Exchange Act of 1934.
Yeso Noþ
If “Yes” is marked, indicate below the file number assigned to the registrant in connection with Rule 12g3-2(b):N/A
| * | Bayer Corporation is also the name of a wholly-owned subsidiary of the registrant in the United States. |
Table of Contents

Table of Contents
Bayer Group Key Data
| 1st Quarter | 1st Quarter | Full Year | ||||||||||||||||
| € million | 2006 | 2007 | Change | 2006 | ||||||||||||||
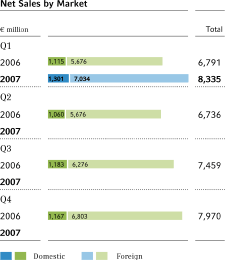
Net sales | 6,791 | 8,335 | + 22.7 | % | 28,956 | |||||||||||||
Change in sales | ||||||||||||||||||
| Volume | + 4 | % | + 8 | % | + 5 | % | ||||||||||||
| Price | + 1 | % | 0 | % | 0 | % | ||||||||||||
| Currency | + 5 | % | – 5 | % | 0 | % | ||||||||||||
| Portfolio | + 1 | % | + 20 | % | + 12 | % | ||||||||||||
EBITDA1 | 1,436 | 1,774 | + 23.5 | % | 4,675 | |||||||||||||
Special items | (128 | ) | (216 | ) | (909 | ) | ||||||||||||
EBITDA before special items | 1,564 | 1,990 | + 27.2 | % | 5,584 | |||||||||||||
| EBITDA margin before special items | 23.0 | % | 23.9 | % | 19.3 | % | ||||||||||||
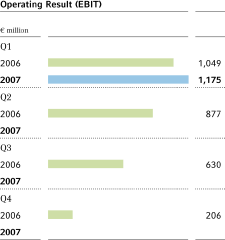
EBIT2 | 1,049 | 1,175 | + 12.0 | % | 2,762 | |||||||||||||
Special items | (128 | ) | (200 | ) | (717 | ) | ||||||||||||
EBIT before special items | 1,177 | 1,375 | + 16.8 | % | 3,479 | |||||||||||||
| EBIT margin before special items | 17.3 | % | 16.5 | % | 12.0 | % | ||||||||||||
Non-operating result | (210 | ) | (218 | ) | – 3.8 | % | (782 | ) | ||||||||||
Net income | 600 | 2,809 | • | 1,683 | ||||||||||||||
Earnings per share (€)3 | 0.82 | 3.44 | 2.22 | |||||||||||||||
Core earnings per share (€)4 | 1.01 | 1.26 | 3.24 | |||||||||||||||
Gross cash flow5 | 1,089 | 1,411 | +29.6 | % | 3,913 | |||||||||||||
Net cash flow6 | 38 | 375 | • | 3,928 | ||||||||||||||
Cash outflows for capital expenditures | 419 | 201 | – 52.0 | % | 1,876 | |||||||||||||
Research and development expenses | 414 | 625 | + 51.0 | % | 2,297 | |||||||||||||
Depreciation and amortization | 387 | 599 | + 54.8 | % | 1,913 | |||||||||||||
Number of employees at end of period7 | 82,400 | 105,100 | 106,000 | |||||||||||||||
| Personnel expenses | 1,486 | 1,898 | + 27.7 | % | 6,630 | |||||||||||||
| 2006 figures restated | ||
| 1 | ebitda = ebit plus amortization of intangible assets and depreciation of property, plant and equipment.ebitda, ebitda before special items andebitda margin are not defined in the International Financial Reporting Standards and should therefore be regarded only as supplementary information. The company considers underlyingebitda to be a more suitable indicator of operating performance since it is not affected by depreciation, amortization, write-downs/write-backs or special items. The company also believes that this indicator gives readers a clearer picture of the results of operations and ensures greater comparability of data over time. The underlyingebitda margin is calculated by dividing underlyingebitda by sales. | |
| 2 | ebit as shown in the income statement | |
| 3 | Earnings per share as defined in IAS 33 = net income divided by the average number of shares. For details see page 37. | |
| 4 | Core earnings per share is not defined in the International Financial Reporting Standards and should therefore be regarded only as supplementary information. The company believes that this indicator gives readers a clearer picture of the results of operations and ensures greater comparability of data over time. The calculation of core earnings per share is explained on page 30. | |
| 5 | Gross cash flow = income after taxes from continuing operations plus income taxes, plus/minus non-operating result, minus income taxes paid, plus depreciation, amortization and write-downs, minus write-backs, plus/minus changes in pension provisions, minus gains/plus losses on retirements of noncurrent assets, plus non-cash effects of the remeasurement of acquired assets. The change in pension provisions includes the elimination of non-cash components of the operating result. It also contains benefit payments during the year. For details see page 21f. | |
| 6 | Net cash flow = cash flow from operating activities according to IAS 7 | |
| 7 | Number of employees in full-time equivalents |
2
Contents
Group Management Report as of March 31, 2007 | ||||
| 4 | ||||
| 6 | ||||
| 6 | ||||
| 8 | ||||
| 14 | ||||
| 18 | ||||
| 20 | ||||
| 21 | ||||
| 23 | ||||
| 24 | ||||
| 27 | ||||
| 28 | ||||
| 29 | ||||
Consolidated Financial Statements as of March 31, 2007 | ||||
| 31 | ||||
| 32 | ||||
| 33 | ||||
| 34 | ||||
| 35 | ||||
| 37 | ||||
Financial Calendar, Masthead | 40 |
3
Table of Contents
Interim Report as of March 31, 2007
Jump in HealthCare sales and earnings
Bayer: excellent start to 2007
| • | All subgroups on course for growth — sales up 22.7 percent to€8.3 billion | |
| • | EBITDA before special items climbs 27.2 percent to€2.0 billion | |
| • | EBIT before special items moves ahead 16.8 percent to€1.4 billion | |
| • | Group net income improves from€0.6 billion to€2.8 billion | |
| • | Net debt reduced by€4.8 billion |
Overview of Sales, Earnings and Financial Position
Bayer got off to an excellent start in 2007, substantially improving on its strong performance in the prior-year quarter.Salesrose by 22.7 percent to€8,335 million (Q1 2006:€6,791 million). Revenues for the first three months of 2007 include€1,410 million in sales of the acquired products of Schering, Berlin, Germany. When adjusted for the effects of exchange rate shifts and portfolio changes, sales rose by 7.5 percent, with HealthCare (+7.9 percent), CropScience (+5.9 percent) and MaterialScience (+9.4 percent) all contributing to the increase.
The Group’sebitda before special items advanced by 27.2 percent to€1,990 million (Q1 2006:€1,564 million). The figure for HealthCare jumped by 103.9 percent to€948 million (Q1 2006:€465 million), mainly in light of the Schering AG acquisition and a solid performance by Consumer Health. At CropScience there was a 6.0 percent improvement to€584 million (Q1 2006:€551 million), particularly as a result of higher volumes and improved cost structures.ebitdabefore special items of MaterialScience fell by 24.1 percent from the high level of the prior-year quarter, to€409 million (Q1 2006:€539 million), largely due to increased raw material costs.
4
Table of Contents
Interim Report as of March 31, 2007
ebit before special items advanced by 16.8 percent in the first quarter of 2007, to€1,375 million (Q1 2006:€1,177 million). Earnings were diminished by special charges of€200 million (Q1 2006:€128 million). The acquisition and integration of Schering, Berlin, Germany, led to special charges of€139 million. Special charges of€61 million were incurred for restructuring at CropScience, MaterialScience and Bayer Industry Services. After special items,ebitof the Bayer Group moved ahead by 12.0 percent to€1,175 million (Q1 2006:€1,049 million).
After a non-operating result of minus€218 million (Q1 2006: minus€210 million), pre-tax income came in at€957 million (Q1 2006:€839 million). The non-operating result contained net interest expense of€156 million (Q1 2006:€143 million). Here it should be noted that interest charges for the same period of the previous year were boosted by one-time effects, while financing costs in the first quarter of 2007 rose due to acquisitions. After tax expense of€301 million (Q1 2006:€277 million), income after taxes from continuing operations rose to€656 million (Q1 2006:€562 million).
Income after taxes from discontinued operations was€2.2 billion, including divestment gains of€2.1 billion for the Diagnostics business and€0.1 billion for H.C. Starck.
After minority stockholders’ interest, net income of the Bayer Group amounted to€2,809 million (Q1 2006:€600 million). Earnings per share came to€3.44 (Q1 2006:€0.82).
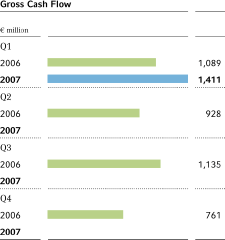
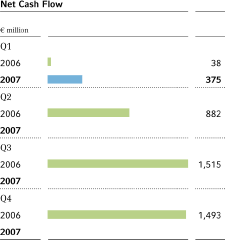
Gross cash flow improved by 29.6 percent from the prior-year quarter, to€1,411 million(Q12006:€1,089 million), due to the strong growth in business and the inclusion of Schering, Berlin, Germany. Net cash flow rose by€337 million to€375 million (Q1 2006:€38 million). The total net cash flow including discontinued operations was€413 million.
Net debt declined by€4.8 billion to€12.8 billion in the first quarter of 2007, due particularly to the proceeds from the divestments of the Diagnostics business and H.C. Starck.
Provisions for pensions and other post-employment benefits declined by€0.4 billion compared with December 31, 2006, to€6.2 billion, mainly because of higher capital market interest.
5
Table of Contents
Interim Report as of March 31, 2007
Future Perspectives
Economic outlook
For 2007 we continue to expect the global economy to grow at a rate that is considerably faster than the long-term average. In our opinion, the economic slowdown in the United States will only have a moderate effect on the global economy. Robust growth in Europe and also in the emerging economies of Asia and Latin America is expected to compensate for the weakness in the United States. Although we anticipate that the global economy will maintain its current momentum, risks could result from continuing imbalances in the world economy. It is also very difficult to predict the development of oil prices. We therefore expect a positive trend across the MaterialScience market sectors, although the extent of this trend will vary from region to region. The global crop protection market is expected to expand compared to the previous year. We do not expect a major change in the performance of the pharmaceuticals market compared to the prior year.
Bayer Group sales and earnings forecast
In light of the very successful start to 2007, we confirm our positive outlook for the year. At the present time we are not altering the guidance we issued in March. For the full year we therefore continue to target more than 10 percent growth in both Group sales and underlyingebitda, along with a slight increase in the underlyingebitdamargin.
We remain confident of the trend in our HealthCare business. For the year as a whole we intend to grow with or faster than the market in all divisions and improve the underlyingebidtamargin toward 24 percent.
The market environment for our CropScience business in the first quarter was positive as expected. Provided market conditions do not significantly deteriorate, we continue to expect that we will grow slightly faster than the market and improve the underlyingebitdamargin toward 22 percent.
Following the anticipated strong start to the year, MaterialScience plans to achieve further volume growth in 2007 and expects to sustain a good, value-creating earnings level. Underlyingebitdain the second quarter is expected to be roughly on par with the first quarter.
Performance by Subgroup and Segment
Changes in corporate structure
Our business activities are grouped into the HealthCare, CropScience and MaterialScience subgroups.
As of March 31, 2007, our interest in the voting capital of Bayer Schering Pharma AG, Berlin, Germany, amounted to 96.3 percent. The acquired business of Schering, Berlin, Germany, is included in the Pharmaceuticals segment of the HealthCare subgroup as of June 23, 2006. This business is not included in the figures for the first quarter of 2006.
6
Table of Contents
Interim Report as of March 31, 2007
The names “Bayer Schering Pharma” or “Schering” as used in this report always refer to Bayer Schering Pharma AG, Berlin, Germany, or its predecessor, Schering AG, Berlin, Germany, respectively. The reference to Bayer Schering Pharma AG or Schering AG also includes business conducted by affiliated entities in countries outside Germany. Bayer Schering Pharma AG and Schering-Plough Corporation, New Jersey, United States, are unaffiliated companies that have been totally independent of each other for many years.
The commentaries in this report relate exclusively to continuing operations, except where specific reference is made to discontinued operations or to a total value (total). The Diagnostics Division and H.C. Starck, both now divested, and the Wolff Walsrode activities, divestment of which is pending, are reported as discontinued operations. The prior-year data are restated accordingly.
Key Data by Subgroup and Segment
| EBIT | EBITDA | EBITDA margin | |||||||||||||||||||||||||||||||||
| Sales | before special items* | before special items* | before special items* | ||||||||||||||||||||||||||||||||
| 1st Quarter | 1st Quarter | 1st Quarter | 1st Quarter | 1st Quarter | 1st Quarter | 1st Quarter | 1st Quarter | ||||||||||||||||||||||||||||
| € million | 2006 | 2007 | 2006 | 2007 | 2006 | 2007 | 2006 | 2007 | |||||||||||||||||||||||||||
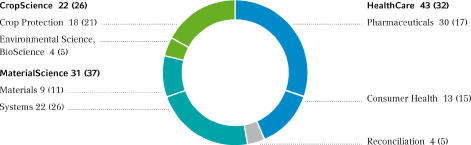
HealthCare | 2,203 | 3,610 | 385 | 624 | 465 | 948 | 21.1 | % | 26.3 | % | |||||||||||||||||||||||||
| Pharmaceuticals | 1,148 | 2,495 | 207 | 420 | 246 | 711 | 21.4 | % | 28.5 | % | |||||||||||||||||||||||||
| Consumer Health | 1,055 | 1,115 | 178 | 204 | 219 | 237 | 20.8 | % | 21.3 | % | |||||||||||||||||||||||||
CropScience | 1,771 | 1,786 | 408 | 447 | 551 | 584 | 31.1 | % | 32.7 | % | |||||||||||||||||||||||||
| Crop Protection | 1,413 | 1,434 | 285 | 343 | 406 | 461 | 28.7 | % | 32.1 | % | |||||||||||||||||||||||||
| Environmental Science, BioScience | 358 | 352 | 123 | 104 | 145 | 123 | 40.5 | % | 34.9 | % | |||||||||||||||||||||||||
MaterialScience | 2,486 | 2,608 | 423 | 291 | 539 | 409 | 21.7 | % | 15.7 | % | |||||||||||||||||||||||||
| Materials | 710 | 739 | 132 | 38 | 170 | 80 | 23.9 | % | 10.8 | % | |||||||||||||||||||||||||
| Systems | 1,776 | 1,869 | 291 | 253 | 369 | 329 | 20.8 | % | 17.6 | % | |||||||||||||||||||||||||
Reconciliation | 331 | 331 | (39 | ) | 13 | 9 | 49 | 2.7 | % | 14.8 | % | ||||||||||||||||||||||||
Continuing operations | 6,791 | 8,335 | 1,177 | 1,375 | 1,564 | 1,990 | 23.0 | % | 23.9 | % | |||||||||||||||||||||||||
2006 figures restated
| * | for definition see Bayer Group Key Data on page 2, also page 28. |
Sales by Segment in Percent, 1st Quarter 2007 (Q1 2006 in parentheses)
7
Table of Contents
Interim Report as of March 31, 2007
Bayer HealthCare
Sales of theBayer HealthCaresubgroup rose in the first quarter by 63.9 percent, or€1,407 million, to€3,610 million. The acquired business of Schering, Berlin, Germany, contributed€1,410 million to this figure. Currency- and portfolio-adjusted sales improved by 7.9 percent, due particularly to the gratifying trend in our Consumer Health segment.
ebitdabefore special items for this subgroup climbed by 103.9 percent to€948 million (Q1 2006:€465 million). Underlyingebitadvanced by€239 million to€624 million (Q1 2006:€385 million). The special items totaling minus€139 million in our HealthCare business resulted from charges connected with the integration of Schering, Berlin, Germany.ebitof Bayer HealthCare moved ahead by€106 million, or 28.0 percent, to€485 million.
Pharmaceuticals
Sales ofourPharmaceuticalssegment rose by€1,347 in the first quarter of 2007, to a total of€2,495 million (Q1 2006:€1,148 million), with the acquired business of Schering, Berlin, Germany, accounting for€1,410 million. Adjusted for currency and portfolio changes, sales expanded by 4.6 percent. Sharply higher sales of Nexavar® and Levitra® more than offset the expected decline for Cipro®/Ciprobay®.
The figures for the first quarter of 2006 do not contain the business of Schering, Berlin, Germany, acquired in June 2006. The commentaries given below on business developments related to the acquired products include comparisons with data for the first quarter of 2006 that were prepared by Schering AG, Berlin, Germany, and do not form part of the Bayer Group financial statements. We refer to those figures as “pro forma.” The acquired Schering business posted dynamic currency- and portfolio-adjusted sales growth of more than 5 percent.
Sales of the Primary Care business unit in the first three months of 2007 dipped by 1.8 percent to€773 million, but rose by 1.5 percent on a currency- and portfolio-adjusted basis. On a currency-adjusted basis, business with Levitra® developed particularly well, expanding by 14.7 percent, while sales of Avalox®/Avelox® also improved slightly in the first quarter, advancing by 3.8 percent. Increasing competition from generic products led to a marked decline for Cipro®/Ciprobay®, with sales dropping by 15.0 percent when adjusted for shifts in currency parities.
In our Women’s Healthcare business unit, we achieved sales of€627 million in the first quarter. The main growth drivers were the oral contraceptives of the Yasmin®/yaz®/ Yasminelle® product line, sales of which rose by 41.1 percent (pro forma) when adjusted for currency changes. This positive performance was due particularly to the launch of Yasminelle® in Europe and ofyaz®in the United States and Latin America. In January, the u.s. Food and Drug Administration(fda)expanded the registration foryaz®,which can now be used in the United States to treat moderately severe acne in women. Currency-adjusted sales of our intra-uterine system Mirena® also advanced by a pleasing 25.0 percent (pro forma) thanks mainly to strong growth in the United States.
8
Table of Contents
Interim Report as of March 31, 2007
| Bayer HealthCare | 1st Quarter | 1st Quarter | Change | ||||||||||
| € million | 2006 | 2007 | % | ||||||||||
Net sales | 2,203 | 3,610 | + 63.9 | ||||||||||
EBITDA1 | 459 | 783 | + 70.6 | ||||||||||
Special items | (6 | ) | (165 | ) | |||||||||
EBITDA before special items2 | 465 | 948 | + 103.9 | ||||||||||
| EBITDA margin before special items | 21.1 | % | 26.3 | % | |||||||||
EBIT1 | 379 | 485 | + 28.0 | ||||||||||
Special items | (6 | ) | (139 | ) | |||||||||
EBIT before special items2 | 385 | 624 | + 62.1 | ||||||||||
Gross cash flow1 | 292 | 557 | + 90.8 | ||||||||||
Net cash flow1 | 43 | 383 | • | ||||||||||
2006 figures restated
| 1 | for definition see Bayer Group Key Data on page 2 | |
| 2 | for definition see also page 28 |
| Pharmaceuticals | 1st Quarter | 1st Quarter | Change | ||||||||||
| € million | 2006 | 2007 | % | ||||||||||
Sales | 1,148 | 2,495 | + 117.3 | ||||||||||
Primary Care1 | 787 | 773 | -1.8 | ||||||||||
| Women’s Healthcare | • | 627 | • | ||||||||||
| Diagnostic Imaging (including Medrad) | • | 307 | • | ||||||||||
| Specialized Therapeutics | • | 303 | • | ||||||||||
| Hematology/Cardiology | 327 | 268 | -18.0 | ||||||||||
Oncology2 | 34 | 159 | • | ||||||||||
| Dermatology (Intendis) | • | 58 | • | ||||||||||
EBITDA3 | 241 | 546 | + 126.6 | ||||||||||
Special items | (5 | ) | (165 | ) | |||||||||
EBITDA before special items4 | 246 | 711 | + 189.0 | ||||||||||
| EBITDA margin before special items | 21.4 | % | 28.5 | % | |||||||||
EBIT3 | 202 | 281 | + 39.1 | ||||||||||
Special items | (5 | ) | (139 | ) | |||||||||
EBIT before special items4 | 207 | 420 | + 102.9 | ||||||||||
Gross cash flow3 | 162 | 390 | + 140.7 | ||||||||||
Net cash flow3 | (11 | ) | 279 | • | |||||||||
2006 figures restated
| 1 | Schering andrology business not included in Q1 2006 | |
| 2 | Schering oncology business not included in Q1 2006 | |
| 3 | for definition see Bayer Group Key Data on page 2 | |
| 4 | for definition see also page 28 |
9
Table of Contents
Interim Report as of March 31, 2007
Sales of the Diagnostic Imaging business unit came to€307 million. Currency-adjusted sales of Magnevist® rose by 11.8 percent (pro forma), while those of Ultravist® fell by 20.8 percent (pro forma) from the prior-year quarter. Having voluntarily withdrawn the 370 mgI/ml formulation of Ultravist® in the summer of 2006, we resumed sales of this product in numerous countries in the first quarter of 2007. We expect to quickly proceed with distribution of this product in the remaining countries as well.
Sales of the Specialized Therapeutics business unit amounted to€303 million. Currency-adjusted sales of our top product Betaferon®/Betaseron® to treat multiple sclerosis(ms)expanded by 9.9 percent (pro forma) in the first quarter. To safeguard our Betaseron® business, we signed an agreement with Novartis in March 2007 to acquire the biologics manufacturing facility in Emeryville, California, currently used to produce Betaseron®. The acquisition is subject to the approval of the antitrust authorities. According to the terms of the agreement, Bayer will make a one-time payment to Novartis of approximatelyus$ 110 million for the production facility, including the Biologics License Application(bla).Bayer Schering Pharma will continue to pay Novartis royalties equivalent to those being paid currently on net sales of Betaseron® manufactured by Bayer at the Emeryville facilities until the original agreement with Novartis expires in October 2008. After this date, no more royalties will be due to Novartis on the sales of Betaseron®. Bayer Schering Pharma will also acquire the existing inventories. In return, Novartis will receive a license to establish its own brand based on interferon beta-1b starting in 2009. When it is approved by the health authorities, Bayer Schering Pharma will manufacture the product for Novartis from 2009 forward and receive in return a low double-digit percentage royalty from Novartis.
Sales of the Hematology/Cardiology business unit fell by 18.0 percent to€268 million, mainly due to termination of the plasma distribution agreements for Canada and Germany. Adjusted for currency and portfolio changes, business was up by 3.7 percent. Currency-adjusted sales of Kogenate® advanced by 3.2 percent in the first quarter. At the end of January 2007, the European Commission granted an additional registration authorizing the use of Kogenate® for continuous infusion in hemophiliaapatients undergoing major surgery. Currency-adjusted sales of Trasylol® declined by 4.4 percent. Two separate observational studies reported on a possible correlation between the administration of Trasylol® (aprotinin), our product for use during open-heart surgery, and severe renal dysfunction and vasoconstriction (myocardial infarction and stroke). A follow-up study to one of them reported on a possible correlation between administration of this product and increased long-term mortality. Based on our study data and many years of experience with Trasylol®, Bayer believes that this product is a safe and effective medicine when used correctly. We are currently cooperating closely with the relevant regulatory authorities to resolve the questions that have arisen.
10
Table of Contents
Interim Report as of March 31, 2007
| Currency- | ||||||||||||||||||
| adjusted | ||||||||||||||||||
| Best-Selling Pharmaceutical Products | 1st Quarter | 1st Quarter | Change | change | ||||||||||||||
| € million | 2006 | 2007 | % | % | ||||||||||||||
Betaferon®/Betaseron®* (Specialized Therapeutics) | • | 244 | • | • | ||||||||||||||
Yasmin®/YAZ®/Yasminelle®* (Women’s Healthcare) | • | 240 | • | • | ||||||||||||||
Kogenate® (Hematology/Cardiology) | 204 | 201 | -1.5 | + 3.2 | ||||||||||||||
Adalat® (Primary Care) | 157 | 145 | -7.6 | -0.9 | ||||||||||||||
Avalox®/Avelox® (Primary Care) | 130 | 128 | -1.5 | + 3.8 | ||||||||||||||
Cipro®/Ciprobay® (Primary Care) | 132 | 108 | -18.2 | -15.0 | ||||||||||||||
Levitra® (Primary Care) | 78 | 84 | + 7.7 | + 14.7 | ||||||||||||||
Mirena®* (Women’s Healthcare) | • | 81 | • | • | ||||||||||||||
Magnevist®* (Diagnostic Imaging) | • | 80 | • | • | ||||||||||||||
Glucobay® (Primary Care) | 77 | 72 | -6.5 | -1.2 | ||||||||||||||
Total | 778 | 1,383 | + 77.8 | + 87.1 | ||||||||||||||
| Proportion of Pharmaceuticals sales | 68 | % | 55 | % | ||||||||||||||
Products ranked by Q1 2007 sales
* acquired Schering AG product
| Currency- | |||||||||||||||||
| adjusted | |||||||||||||||||
| Best-Selling Schering Products (pro forma) | 1st Quarter | 1st Quarter | Change | change | |||||||||||||
| € million | 2006 | 2007 | % | % | |||||||||||||
Betaferon®/Betaseron® (Specialized Therapeutics) | 232 | 244 | + 5.2 | + 9.9 | |||||||||||||
Yasmin®/YAZ®/Yasminelle® (Women’s Healthcare) | 180 | 240 | + 33.3 | + 41.1 | |||||||||||||
Mirena® (Women’s Healthcare) | 68 | 81 | + 19.1 | + 25.0 | |||||||||||||
Magnevist® (Diagnostic Imaging) | 76 | 80 | + 5.3 | + 11.8 | |||||||||||||
11
Table of Contents
Interim Report as of March 31, 2007
Our Oncology business unit lifted sales by€125 million to€159 million. Included in this figure is€98 million in sales of the acquired oncology business of Schering AG, Berlin, Germany, which mainly comprises the key products Fludara® and Campath®. Currency- and portfolio-adjusted sales rose by 83.6 percent. Our new cancer drug, Nexavar®, first launched in December 2005, performed very well in the market, with sales of€47 million (Q1 2006:€20 million). Study results for Nexavar® in liver cancer are also very promising. The phaseiii study involving patients with advanced hepatocellular carcinoma reached its primary endpoint. Overall survival was significantly extended in patients treated with Nexavar®. Furthermore, Bayer plans to expand the registration of Campath®, developed jointly by Bayer and Genzyme, to include first-line treatment ofb-cell chronic lymphocytic leukemia(b-cll).Genzyme submitted the required supplemental license application to thefdaon March 19, 2007 and to the European Medicines Agency(emea)on April 4, 2007.
The Dermatology (Intendis) business unit had sales of€58 million. Currency-adjusted sales of the principal products Skinoren® and Advantan® rose by 16.5 percent and 1.8 percent (pro forma), respectively.
ebitdaof thePharmaceuticalssegment before special items advanced to€711 million in the first quarter of 2007, from€246 million in the same period of last year. This sharp increase is mainly due to the earnings contribution from the acquired business of Schering, Berlin, Germany, and to improved cost structures, including synergies already realized.ebitbefore special items rose by€213 million, or 102.9 percent, to€420 million. The special charges of€139 million in the Pharmaceuticals segment resulted from expenses for the acquisition and integration of Schering.ebitmoved ahead by€79 million, or 39.1 percent, to€281 million.
Consumer Health
All divisions contributed to the gratifying performance of ourConsumer Healthsegment, wheresalesimproved by 5.7 percent to€1,115 million (Q1 2006:€1,055 million). On a currency-adjusted basis, business expanded by a substantial 11.4 percent.
Sales in the Consumer Care Division rose by 2.6 percent to€659 million (Q1 2006:€642 million), or by 8.1 percent on a currency-adjusted basis. Among our top products, Aleve® performed particularly well, with sales up 40.9 percent when adjusted for changes in currency parities, thanks mainly to the launch of Aleve® Liquid Gels in the United States.
There was a significant increase in sales of the Diabetes Care Division, where business improved by 17.1 percent to€226 million (Q1 2006:€193 million), due primarily to a strong performance by our blood glucose monitoring systems Ascensia® Contour® and Ascensia® Breeze®, which replace the older Elite® systems in the Ascensia® product family. Currency-adjusted sales of the division improved by an even more gratifying 23.0 percent.
Sales of the Animal Health Division rose by 4.5 percent to€230 million (Q1 2006:€220 million), or by 11.2 percent when adjusted for currency changes. The increase was primarily due to the encouraging performance of our Advantage® product line, especially in North America, sales of which rose 35.5 percent on a currency-adjusted basis.
12
Table of Contents
Interim Report as of March 31, 2007
ebitdaof theConsumer Healthsegment before special items grew by€18 million, or 8.2 percent, in the first quarter of 2007, to€237 million. Higher earnings resulting from the growth in sales more than offset an increase in marketing expenses to support the new product launches planned for 2007.ebitbefore special items advanced by 14.6 percent to€204 million (Q1 2006:€178 million). After special items,ebitimproved by 15.3 percent to€204 million (Q1 2006:€177 million).
| Consumer Health | 1st Quarter | 1st Quarter | Change | ||||||||||
| € million | 2006 | 2007 | % | ||||||||||
Net sales | 1,055 | 1,115 | + 5.7 | ||||||||||
| Consumer Care | 642 | 659 | + 2.6 | ||||||||||
| Diabetes Care | 193 | 226 | +17.1 | ||||||||||
| Animal Health | 220 | 230 | + 4.5 | ||||||||||
EBITDA* | 218 | 237 | + 8.7 | ||||||||||
Special items | (1 | ) | 0 | ||||||||||
EBITDA before special items | 219 | 237 | + 8.2 | ||||||||||
| EBITDA margin before special items | 20.8 | % | 21.3 | % | |||||||||
EBIT* | 177 | 204 | + 15.3 | ||||||||||
Special items | (1 | ) | 0 | ||||||||||
EBIT before special items | 178 | 204 | + 14.6 | ||||||||||
Gross cash flow* | 130 | 167 | + 28.5 | ||||||||||
Net cash flow* | 54 | 104 | + 92.6 | ||||||||||
2006 figures restated
* for definition see Bayer Group Key Data on page 2
| Change | |||||||||||||||||
| currency- | |||||||||||||||||
| Best-Selling Consumer Health Products | 1st Quarter | 1st Quarter | Change | adjusted | |||||||||||||
| € million | 2006 | 2007 | % | % | |||||||||||||
Ascensia® product line (Diabetes Care) | 190 | 223 | +17.4 | +23.8 | |||||||||||||
Aspirin®* (Consumer Care) | 116 | 113 | -2.6 | +2.3 | |||||||||||||
Advantage® product line (Animal Health) | 59 | 75 | +27.1 | +35.5 | |||||||||||||
Aleve®/naproxen (Consumer Care) | 53 | 69 | +30.2 | +40.9 | |||||||||||||
Canesten® (Consumer Care) | 41 | 43 | + 4.9 | + 7.3 | |||||||||||||
Baytril® (Animal Health) | 40 | 40 | 0.0 | + 2.8 | |||||||||||||
Bepanthen®/Bepanthol® (Consumer Care) | 35 | 36 | + 2.9 | + 5.1 | |||||||||||||
Supradyn® (Consumer Care) | 35 | 33 | -5.7 | -3.2 | |||||||||||||
One-A-Day® (Consumer Care) | 30 | 31 | +3.3 | +12.1 | |||||||||||||
Rennie® (Consumer Care) | 26 | 27 | + 3.8 | + 5.4 | |||||||||||||
Total | 625 | 690 | + 10.4 | + 16.1 | |||||||||||||
| Proportion of Consumer Health sales | 59 | % | 62 | % | |||||||||||||
| * | Total Aspirin® sales =€167 million (Q1 2006:€164 million), including Aspirin® Cardio, which is reflected in sales of the Pharmaceuticals segment |
13
Table of Contents
Interim Report as of March 31, 2007
Bayer CropScience
Sales of ourCropSciencesubgroup, at€1,786 million, showed a slight year-on-year increase (Q1 2006:€1,771 million). Adjusted for currency and portfolio changes, business expanded by a gratifying 5.9 percent.
ebitdabefore special items advanced by€33 million, or 6.0 percent, to€584 million. The combined effect of higher volumes and cost savings more than offset the pressure on margins from adverse shifts in currency parities.ebitbefore special items improved by€39 million, or 9.6 percent, to€447 million. Earnings were held back by special charges related to the restructuring project initiated in 2006. First-quarterebitwas steady at€408 million.
Crop Protection
First-quarter sales in the Crop Protection segment grew to€1,434 million (Q1 2006:€1,413 million). When adjusted for currency and portfolio changes, sales moved ahead 6.5 percent. The early start to the season in Europe, the increased cultivation of plants for the production of biofuels and internationally high prices for crop commodities led to growth in business, particularly in the Seed Treatment, Herbicides and Fungicides business units.
Sales of the Insecticides business unit fell by€37 million to€311 million. When adjusted for currency and portfolio changes, sales decreased by 4.2 percent. The decline should be viewed in light of the impact on our North American business of factors including a shift from soil- and foliar-applied insecticides to seed treatment products in the first quarter of this year. Sales in Europe increased, thanks mainly to a strong performance by our new insecticide Biscaya®.
Sales of the Fungicides business unit grew by 1.6 percent in the first quarter of 2007, to€384 million. On a currency-adjusted basis, the increase amounted to 4.2 percent. Buoyed by the trend in Europe, sales of our new cereal fungicides Proline® and Fandango®, in particular, made good gains. Business with our Flint® line of fungicide products benefited from a recovery in the Latin American market. The downward sales trend for our Folicur® product line was largely the result of a drop in business in the United States. Sales were hampered by the fact that our customers had built up substantial precautionary inventories in 2005/2006 for the prevention of Asian rust in soybeans. Another factor was the planned switch to the active ingredient prothioconazole, which received marketing authorization in the United States at the end of the first quarter of 2007.
Sales of the Herbicides business unit advanced by 3.3 percent to€568 million, with currency-adjusted growth amounting to 7.2 percent. The main reason for the improvement was the strong performance of our young cereal herbicides Atlantis®, Hussar® and Sekator®, particularly in Europe.
14
Table of Contents
Interim Report as of March 31, 2007
| Bayer CropScience | 1st Quarter | 1st Quarter | Change | ||||||||||
| € million | 2006 | 2007 | % | ||||||||||
Net sales | 1,771 | 1,786 | + 0.8 | ||||||||||
EBITDA* | 551 | 548 | – 0.5 | ||||||||||
Special items | 0 | (36 | ) | ||||||||||
EBITDA before special items | 551 | 584 | + 6.0 | ||||||||||
| EBITDA margin before special items | 31.1 | % | 32.7 | % | |||||||||
EBIT* | 408 | 408 | 0.0 | ||||||||||
Special items | 0 | (39 | ) | ||||||||||
EBIT before special items | 408 | 447 | + 9.6 | ||||||||||
Gross cash flow* | 387 | 369 | – 4.7 | ||||||||||
Net cash flow* | (350 | ) | (238 | ) | + 32.0 | ||||||||
* for definition see Bayer Group Key Data on page 2
| Currency- | |||||||||||||||||
| adjusted | |||||||||||||||||
| Best-Selling Bayer CropScience Products* | 1st Quarter | 1st Quarter | Change | change | |||||||||||||
| € million | 2006 | 2007 | % | % | |||||||||||||
Confidor®/Gaucho®/Admire®/Merit® (Insecticides/Seed Treatment/Environmental Science) | 165 | 163 | – 1.2 | + 3.1 | |||||||||||||
Folicur®/Raxil® (Fungicides/Seed Treatment) | 95 | 77 | – 18.9 | – 16.1 | |||||||||||||
Atlantis® (Herbicides) | 49 | 76 | + 55.1 | + 57.1 | |||||||||||||
Proline® (Fungicides) | 58 | 72 | + 24.1 | + 24.7 | |||||||||||||
Basta®/Liberty® (Herbicides) | 72 | 72 | 0.0 | + 8.0 | |||||||||||||
Puma® (Herbicides) | 68 | 69 | + 1.5 | + 7.5 | |||||||||||||
Flint®/Stratego®/Sphere® (Fungicides) | 49 | 60 | + 22.4 | + 29.1 | |||||||||||||
Poncho® (Seed Treatment) | 31 | 59 | + 90.3 | + 106.1 | |||||||||||||
Hussar® (Herbicides) | 32 | 47 | + 46.9 | + 44.6 | |||||||||||||
Betanal® (Herbicides) | 45 | 45 | 0.0 | + 2.2 | |||||||||||||
Total | 664 | 740 | + 11.4 | + 15.8 | |||||||||||||
| Proportion of Bayer CropScience sales | 37 | % | 41 | % | |||||||||||||
* Figures are based on active ingredient class. For the sake of clarity, only the principal brands and business units are listed.
| Crop Protection | 1st Quarter | 1st Quarter | Change | ||||||||||
| € million | 2006 | 2007 | % | ||||||||||
Net sales | 1,413 | 1,434 | + 1.5 | ||||||||||
| Insecticides | 348 | 311 | – 10.6 | ||||||||||
| Fungicides | 378 | 384 | +1.6 | ||||||||||
| Herbicides | 550 | 568 | +3.3 | ||||||||||
| Seed Treatment | 137 | 171 | + 24.8 | ||||||||||
EBITDA* | 406 | 425 | + 4.7 | ||||||||||
Special items | 0 | (36 | ) | ||||||||||
EBITDA before special items | 406 | 461 | + 13.5 | ||||||||||
| EBITDA margin before special items | 28.7 | % | 32.1 | % | |||||||||
EBIT* | 285 | 304 | + 6.7 | ||||||||||
Special items | 0 | (39 | ) | ||||||||||
EBIT before special items | 285 | 343 | + 20.4 | ||||||||||
Gross cash flow* | 285 | 282 | – 1.1 | ||||||||||
Net cash flow* | (289 | ) | (113 | ) | + 60.9 | ||||||||
* for definition see Bayer Group Key Data on page 2
15
Table of Contents
Interim Report as of March 31, 2007
Sales of the Seed Treatment business unit advanced by a substantial€34 million, or 24.8 percent, to€171 million. The currency-adjusted increase was 31.1 percent. Our new insecticidal seed treatment Poncho®, in particular, performed very well in the market in light of an early start to the season in Europe and especially because of the planned increase in corn acreages in the United States to meet heightened demand for biofuels.
First-quarterebitda before special items of our Crop Protection segment climbed by 13.5 percent year on year to€461 million, the positive overall sales trend and the savings achieved through our cost structure and efficiency improvement programs offsetting the currency-related squeeze on margins.ebit before special items in the first quarter came in at€343 million (Q1 2006:€285 million). After special items,ebitamounted to€304 million (Q1 2006:€285 million).
Environmental Science, BioScience
Salesof theEnvironmental Science, BioSciencesegment edged down 1.7 percent to€352 million, but rose by 3.7 percent on a currency-adjusted basis.
The Environmental Science unit recorded sales of€188 million, which was 2.6 percent below the prior-year figure. Currency-adjusted sales moved ahead 2.4 percent thanks to good business with home and garden products for consumers.
Sales of the BioScience unit held steady year on year at€164 million, though on a currency-adjusted basis they increased by 5.3 percent. The improvement was due particularly to the good development of our vegetable seed business.
ebitda before special items of the Environmental Science, BioScience segment fell by€22 million year on year to€123 million(Q12006:€145 million), due primarily to negative currency effects and increased research and development spending at BioScience.ebitfell by€19 million to€104 million (Q1 2006:€123 million).
16
Table of Contents
Interim Report as of March 31, 2007
| Environmental Science, BioScience | 1st Quarter | 1st Quarter | Change | ||||||||||
| € million | 2006 | 2007 | % | ||||||||||
Net sales | 358 | 352 | – 1.7 | ||||||||||
| Environmental Science | 193 | 188 | – 2.6 | ||||||||||
| BioScience | 165 | 164 | – 0.6 | ||||||||||
EBITDA* | 145 | 123 | – 15.2 | ||||||||||
Special items | 0 | 0 | |||||||||||
EBITDA before special items | 145 | 123 | – 15.2 | ||||||||||
| EBITDA margin before special items | 40.5 | % | 34.9 | % | |||||||||
EBIT* | 123 | 104 | – 15.4 | ||||||||||
Special items | 0 | 0 | |||||||||||
EBIT before special items | 123 | 104 | – 15.4 | ||||||||||
Gross cash flow* | 102 | 87 | – 14.7 | ||||||||||
Net cash flow* | (61 | ) | (125 | ) | – 104.9 | ||||||||
| * | for definition see Bayer Group Key Data on page 2 |
17
Table of Contents
Interim Report as of March 31, 2007
Bayer MaterialScience
TheMaterialSciencesubgroup got off to a good start in 2007, expanding its business once again.Salesrose by 4.9 percent to€2,608 million (Q1 2006:€2,486 million), or by 9.4 percent on a currency-adjusted basis. Growth was mainly the result of higher volumes in all segments and regions. We also succeeded in holding selling prices steady overall in the face of continuing strong price pressure.
ebitda before special items did not reach the high level of the previous year, coming in at€409 million (Q1 2006:€539 million). We did not succeed in compensating for the approximately€140 million increase in raw material and energy costs through higher volumes.ebit before special items fell by€132 million, or 31.2 percent, to€291 million. After special items, first-quarterebitdeclined by€26 million, or 8.4 percent, to€285 million. Earnings of the Systems segment in the prior-year quarter were diminished by one-time expenses of€112 million arising from an arbitration proceeding in the United States concerning the production of propylene oxide.
Materials
Salesin theMaterialssegment advanced by 4.1 percent to€739 million, or by 9.0 percent on a currency-adjusted basis. The Polycarbonates business unit, with sales of€683 million, saw a currency-adjusted 9.1 percent increase in business despite lower selling prices. Volumes advanced in all regions. Sales of the Thermoplastic Polyurethanes business unit moved ahead 8.0 percent when adjusted for currency changes, thanks largely to higher volumes in Europe.
First-quarterebitdabefore special items dropped by€90 million, or 52.9 percent, to€80 million, with higher volumes not fully offsetting selling price erosion and raw material cost increases.ebitfell by 71.2 percent to€38 million.
Systems
Sales ofourSystemssegment in the first quarter gained 5.2 percent from the prior-year period, to€1,869 million. Currency-adjusted sales improved by a substantial 9.6 percent.
Thanks to price increases and volume gains, our Polyurethanes business unit improved sales by 5.0 percent to€1,332 million. Adjusted for shifts in currency parities, growth came to 9.7 percent. The Coatings, Adhesives, Sealants business unit saw sales advance by 6.5 percent. The currency-adjusted increase amounted to 10.3 percent. Here, too, price increases and higher volumes were contributory factors.
ebitdabefore special items of our Systems segment was down by€40 million, or 10.8 percent, from the excellent level of the prior-year period, to€329 million. Although we almost completely absorbed the increase in raw material costs by raising prices and boosting volume sales, earnings were weighed down by other factors, including the problems experienced by our supplier of rawmdiin Shanghai.ebitbefore special items fell by€38 million, or 13.1 percent, to€253 million. The closure of ourmdiplant at New Martinsville, West Virginia, United States, led to€6 million in special charges for the first quarter. After special items,ebitrose by€68 million, or 38.0 percent, to€247 million.
18
Table of Contents
Interim Report as of March 31, 2007
| Bayer MaterialScience | 1st Quarter | 1st Quarter | Change | ||||||||||
| € million | 2006 | 2007 | % | ||||||||||
Net sales | 2,486 | 2,608 | + 4.9 | ||||||||||
EBITDA* | 427 | 409 | – 4.2 | ||||||||||
Special items | (112 | ) | 0 | ||||||||||
EBITDA before special items | 539 | 409 | – 24.1 | ||||||||||
| EBITDA margin before special items | 21.7 | % | 15.7 | % | |||||||||
EBIT* | 311 | 285 | – 8.4 | ||||||||||
Special items | (112 | ) | (6 | ) | |||||||||
EBIT before special items | 423 | 291 | – 31.2 | ||||||||||
Gross cash flow* | 317 | 304 | – 4.1 | ||||||||||
Net cash flow* | 273 | 37 | – 86.4 | ||||||||||
2006 figures restated
* for definition see Bayer Group Key Data on page 2
| Materials | 1st Quarter | 1st Quarter | Change | ||||||||||
| € million | 2006 | 2007 | % | ||||||||||
Net sales | 710 | 739 | + 4.1 | ||||||||||
| Polycarbonates | 656 | 683 | + 4.1 | ||||||||||
| Thermoplastic Polyurethanes | 54 | 56 | + 3.7 | ||||||||||
EBITDA* | 170 | 80 | – 52.9 | ||||||||||
Special items | 0 | 0 | |||||||||||
EBITDA before special items | 170 | 80 | – 52.9 | ||||||||||
| EBITDA margin before special items | 23.9 | % | 10.8 | % | |||||||||
EBIT* | 132 | 38 | – 71.2 | ||||||||||
Special items | 0 | 0 | |||||||||||
EBIT before special items | 132 | 38 | – 71.2 | ||||||||||
Gross cash flow* | 126 | 69 | – 45.2 | ||||||||||
Net cash flow* | 35 | (25 | ) | • | |||||||||
2006 figures restated
* for definition see Bayer Group Key Data on page 2
| Systems | 1st Quarter | 1st Quarter | Change | ||||||||||
| € million | 2006 | 2007 | % | ||||||||||
Net sales | 1,776 | 1,869 | + 5.2 | ||||||||||
| Polyurethanes | 1,269 | 1,332 | + 5.0 | ||||||||||
| Coatings, Adhesives, Sealants | 369 | 393 | + 6.5 | ||||||||||
| Inorganic Basic Chemicals | 106 | 106 | 0.0 | ||||||||||
| Others | 32 | 38 | + 18.8 | ||||||||||
EBITDA* | 257 | 329 | + 28.0 | ||||||||||
Special items | (112 | ) | 0 | ||||||||||
EBITDA before special items | 369 | 329 | – 10.8 | ||||||||||
| EBITDA margin before special items | 20.8 | % | 17.6 | % | |||||||||
EBIT* | 179 | 247 | + 38.0 | ||||||||||
Special items | (112 | ) | (6 | ) | |||||||||
EBIT before special items | 291 | 253 | – 13.1 | ||||||||||
Gross cash flow* | 191 | 235 | + 23.0 | ||||||||||
Net cash flow* | 238 | 62 | – 73.9 | ||||||||||
* for definition see Bayer Group Key Data on page 2
19
Table of Contents
Interim Report as of March 31, 2007
Performance by Region
Bayer’s global business expanded in the first quarter of 2007 by€1,544 million, or 22.7 percent, to€8,335 million. Adjusted for shifts in exchange rates, sales rose by 27.3 percent. The increase in sales was mainly due to the inclusion of Schering, Berlin, Germany. The strongest percentage gains were recorded in the Europe and Latin America/Africa/Middle East regions. Adjusted for both currency and portfolio effects, business expanded by 7.5 percent.
The largest increases in absolute terms were achieved inEurope,were sales rose by€830 million, or 27.5 percent, to 3,848 million. Europe thus accounted for 46 percent of Group sales in the first quarter, with all subgroups posting a year-on-year improvement. Adjusted for currency and portfolio changes, business grew by 8.4 percent, mainly as a result of substantial increases in the Crop Protection and Systems segments. Sales in Germany climbed by 16.7 percent to€1,301 million, or by 5.0 percent when adjusted for portfolio changes.
Sales inNorth Americaadvanced by 15.0 percent to€2,226 million in the first quarter of 2007, or by 2.7 percent when adjusted for currency and portfolio changes. The Consumer Health segment in North America developed particularly well. The CropScience and MaterialScience subgroups, however, saw sales decline in this region.
InAsia/Pacificwe expanded business by 19.3 percent, or by 10.1 percent when adjusted for currency and portfolio changes. Sales growth at Bayer HealthCare on a currency- and portfolio-adjusted basis was particularly due to gains in the Consumer Health segment. Sales of CropScience remained nearly steady in this region, dipping by 0.9 percent on a currency-adjusted basis, while MaterialScience posted substantial growth, with currency-adjusted sales up 20.4 percent.
Sales in theLatin America/Africa/Middle Eastregion climbed by 27.7 percent, or by 12.9 on a currency- and portfolio-adjusted basis. CropScience sales in this region improved considerably, with a currency-adjusted 20.6 percent gain due primarily to a very pleasing uptrend in the crop protection business. We also generated higher sales in the HealthCare and MaterialScience subgroups.
| Europe | North America | |||||||||||||||||||||||||||||||||
| Sales by Region and Segment | 1st Quarter | 1st Quarter | 1st Quarter | 1st Quarter | ||||||||||||||||||||||||||||||
| (by Market) | 2006 | 2007 | % | adj. % | 2006 | 2007 | % | adj. % | ||||||||||||||||||||||||||
| € million | ||||||||||||||||||||||||||||||||||
HealthCare | 883 | 1,495 | + 69.3 | +69.1 | 696 | 1,145 | +64.5 | +79.3 | ||||||||||||||||||||||||||
| Pharmaceuticals | 449 | 1,039 | + 131.4 | + 130.8 | 356 | 754 | + 111.8 | + 130.7 | ||||||||||||||||||||||||||
| Consumer Health | 434 | 456 | + 5.1 | + 5.1 | 340 | 391 | + 15.0 | + 25.4 | ||||||||||||||||||||||||||
CropScience | 766 | 862 | +12.5 | +12.3 | 538 | 447 | – 16.9 | – 9.2 | ||||||||||||||||||||||||||
| Crop Protection | 623 | 723 | + 16.1 | + 16.0 | 380 | 292 | – 23.2 | – 16.1 | ||||||||||||||||||||||||||
| Environmental Science, BioScience | 143 | 139 | – 2.8 | – 3.3 | 158 | 155 | – 1.9 | + 7.4 | ||||||||||||||||||||||||||
MaterialScience | 1,065 | 1,185 | +11.3 | +11.3 | 700 | 631 | – 9.9 | – 1.6 | ||||||||||||||||||||||||||
| Materials | 274 | 283 | + 3.3 | + 3.6 | 151 | 149 | – 1.3 | + 7.9 | ||||||||||||||||||||||||||
| Systems | 791 | 902 | + 14.0 | + 14.0 | 549 | 482 | – 12.2 | – 4.2 | ||||||||||||||||||||||||||
Continuing operations (incl. reconciliation) | 3,018 | 3,848 | +27.5 | +27.5 | 1,936 | 2,226 | +15.0 | +25.4 | ||||||||||||||||||||||||||
| Asia/Pacific | Latin America/Africa/Middle East | |||||||||||||||||||||||||||||||||
| Sales by Region and Segment | 1st Quarter | 1st Quarter | 1st Quarter | 1st Quarter | ||||||||||||||||||||||||||||||
| (by Market) | 2006 | 2007 | % | adj. % | 2006 | 2007 | % | adj. % | ||||||||||||||||||||||||||
| € million | ||||||||||||||||||||||||||||||||||
HealthCare | 308 | 466 | + 51.3 | + 62.5 | 316 | 504 | + 59.5 | + 75.7 | ||||||||||||||||||||||||||
| Pharmaceuticals | 224 | 379 | + 69.2 | + 82.7 | 119 | 323 | + 171.4 | + 196.7 | ||||||||||||||||||||||||||
| Consumer Health | 84 | 87 | + 3.6 | + 8.6 | 197 | 181 | – 8.1 | + 2.6 | ||||||||||||||||||||||||||
CropScience | 236 | 219 | – 7.2 | – 0.9 | 231 | 258 | + 11.7 | + 20.6 | ||||||||||||||||||||||||||
| Crop Protection | 207 | 189 | – 8.7 | – 2.4 | 203 | 230 | + 13.3 | + 21.7 | ||||||||||||||||||||||||||
| Environmental Science, BioScience | 29 | 30 | + 3.4 | + 10.4 | 28 | 28 | 0.0 | + 12.5 | ||||||||||||||||||||||||||
MaterialScience | 450 | 506 | + 12.4 | + 20.4 | 271 | 286 | + 5.5 | + 12.2 | ||||||||||||||||||||||||||
| Materials | 219 | 240 | + 9.6 | + 17.5 | 66 | 67 | + 1.5 | + 5.9 | ||||||||||||||||||||||||||
| Systems | 231 | 266 | + 15.2 | + 23.1 | 205 | 219 | + 6.8 | + 14.2 | ||||||||||||||||||||||||||
Continuing operations (incl. reconciliation) | 1,006 | 1,200 | + 19.3 | + 27.8 | 831 | 1,061 | + 27.7 | + 38.7 | ||||||||||||||||||||||||||
| Continuing Operations | |||||||||||||||||
| Sales by Region and Segment | 1st Quarter | 1st Quarter | |||||||||||||||
| (by Market) | 2006 | 2007 | % | adj. % | |||||||||||||
| € million | |||||||||||||||||
HealthCare | 2,203 | 3,610 | +63.9 | + 69.2 | |||||||||||||
| Pharmaceuticals | 1,148 | 2,495 | +117.3 | + 122.2 | |||||||||||||
| Consumer Health | 1,055 | 1,115 | +5.7 | + 11.4 | |||||||||||||
CropScience | 1,771 | 1,786 | +0.8 | + 5.1 | |||||||||||||
| Crop Protection | 1,413 | 1,434 | +1.5 | + 5.5 | |||||||||||||
| Environmental Science, BioScience | 358 | 352 | – 1.7 | + 3.7 | |||||||||||||
MaterialScience | 2,486 | 2,608 | +4.9 | + 9.4 | |||||||||||||
| Materials | 710 | 739 | +4.1 | + 9.0 | |||||||||||||
| Systems | 1,776 | 1,869 | +5.2 | + 9.6 | |||||||||||||
Continuing operations (incl. reconciliation) | 6,791 | 8,335 | +22.7 | + 27.3 | |||||||||||||
2006 figures restated; adj. = currency-adjusted
20
Table of Contents
Interim Report as of March 31, 2007
Liquidity and Capital Resources
Operating cash flow
Gross cash flow in the first quarter of 2007 amounted to€1,411 million, up 29.6 percent from the prior-year quarter (€1,089 million). The increase was mainly due to the inclusion of Schering, Berlin, Germany, and the strong performance of the business. Net cash flow improved by€337 million to€375 million Q1 2006:€38 million). The change in working capital improved slightly compared with the first quarter of 2006 despite the growth in business.
| Bayer Group Summary Cash Flow Statements | 1st Quarter | 1st Quarter | |||||||
| € million | 2006 | 2007 | |||||||
Gross cash flow* | 1,089 | 1,411 | |||||||
| Changes in working capital/other non-cash items | (1,051 | ) | (1,036 | ) | |||||
Net cash provided by (used in) operating activities (net cash flow), continuing operations | 38 | 375 | |||||||
| Net cash provided by (used in) operating activities (net cash flow), discontinued operations | 90 | 38 | |||||||
Net cash provided by (used in) operating activities (net cash flow) (total) | 128 | 413 | |||||||
Net cash provided by (used in) investing activities (total) | (192 | ) | 4,589 | ||||||
Net cash provided by (used in) financing activities (total) | (187 | ) | (1,764 | ) | |||||
Change in cash and cash equivalents due to business activities (total) | (251 | ) | 3,238 | ||||||
Cash and cash equivalents, January 1 | 3,290 | 2,915 | |||||||
Change due to exchange rate movements and to changes in scope of consolidation | (13 | ) | (10 | ) | |||||
Cash and cash equivalents, March 31 | 3,026 | 6,143 | |||||||
| 2006 figures restated | ||
| * | for definition see Bayer Group Key Data on page 2 |
Investing cash flow
There was a net cash inflow of€4,589 for investing activities in the first three months of 2007, compared with a€192 million outflow in the prior-year quarter. The main items here are net proceeds totaling€4.7 billion from the divestments of our Diagnostics business and H.C. Starck. In January 2007 we sold the Diagnostics business to Siemens for€4.3 billion. Following an initial receipt of€0.4 billion in December 2006, there was a further inflow of€3.7 billion (after deducting divested cash of approximately€0.2 billion) from this transaction at the beginning of 2007. In subsequent quarters we will pay approximately€0.6 billion in taxes on the divestment gain. We sold H.C. Starck to Advent International and The Carlyle Group for approximately€1.2 billion. The transaction volume is comprised mainly of a cash component — including compensation for financial liabilities — of more than€0.9 billion, along with the assumption of€0.2 billion in pension obligations. This sale was closed at the beginning of February 2007.
21
Table of Contents
Interim Report as of March 31, 2007
Cash outflows for property, plant and equipment (€193 million) and intangible assets (€8 million) totaled€201 million(Q12006:€419 million). The prior-year figure included in particular the purchase of the European marketing rights for the blood pressure treatments Pritor® and PritorPlus® and expenditures for the expansion of our polymers production facilities in Caojing, China.
Financing cash flow
The€1,764 million(Q12006:€187 million) cash outflow for financing activities comprised€245 million in interest payments,€1,510 million in net repayments of loans and€9 million for dividend payments to minority stockholders of consolidated companies. The item “Bayer AG dividend” in the prior-year period contained an inflow of€176 million from the reimbursement of advance capital gains tax payments made on intragroup dividends in 2004.
As of March 31, 2007 the Bayer Group had cash and cash equivalents of€6,143 million, including€784 million held in escrow accounts. The latter amount comprises€699 million deposited in a guarantee account following the decision by the Extraordinary Stockholders’ Meeting of Bayer Schering Pharma AG on January 17, 2007 to squeeze out Bayer Schering Pharma AG’s remaining minority stockholders. The decisions means the shares still held by minority stockholders will be transferred to the main stockholder, Bayer Schering GmbH, a wholly owned subsidiary of Bayer AG, in return for cash compensation of€98.98 per share. Dissenting stockholders are seeking to have the stockholder resolution set aside or to have it declared null and void. An additional€85 million is earmarked for payments relating to civil law settlements in antitrust proceedings.
In view of the restriction on its use, the liquidity held in escrow accounts was not deducted when calculating net debt. The high level of cash and cash equivalents will return to normal in subsequent quarters, particularly following the redemption of bonds.
Liquid assets and net debt
Net debt (total) declined by€4.8 billion compared with December 31, 2006, to€12.8 billion. This was due particularly to cash inflows from the divestitures and to the improvement in operating cash flow. We intend to use the proceeds of the planned sale of Wolff Walsrode to The Dow Chemical Company to further reduce net debt.
| Net Debt | |||||||||
| € million | Dec. 31, 2006 | March 31, 2007 | |||||||
| Noncurrent financial liabilities as per balance sheets (including derivatives) | 14,723 | 14,626 | |||||||
| of which mandatory convertible bond | 2,276 | 2,278 | |||||||
| of which hybrid bond | 1,247 | 1,245 | |||||||
| Current financial liabilities as per balance sheets (including derivatives) | 5,078 | 3,673 | |||||||
| Derivative receivables | (185 | ) | (165 | ) | |||||
Financial liabilities | 19,616 | 18,134 | |||||||
| Cash and cash equivalents* | (2,116 | ) | (5,359 | ) | |||||
| Current financial assets | (27 | ) | (5 | ) | |||||
Net debt from continuing operations | 17,473 | 12,770 | |||||||
| Net debt from discontinued operations | 66 | 7 | |||||||
Net debt (total) | 17,539 | 12,777 | |||||||
| * | In view of the restriction on its use, the€784 million liquidity in escrow accounts in the first quarter of 2007 (Q1 2006:€299 million) was not deducted when calculating net debt. March 31, 2007:€5,359 million =€6,143 million –€784 million (Dec. 31, 2006:€2,116 million =€2,915 million –€799 million). |
22
Table of Contents
Interim Report as of March 31, 2007
As of March 31, 2007 we had noncurrent financial liabilities of€14.6 billion, including the€1.2 billion hybrid bond issued in July 2005 and the€2.3 billion mandatory convertible bond issued in April 2006. Moody’s and Standard & Poor’s treat 75 percent and 50 percent, respectively, of the hybrid bond as equity. Both rating agencies consider the mandatory convertible bond wholly as equity. Unlike conventional borrowings, the hybrid bond thus has only a limited effect on the Group’s rating-specific debt indicators, while the mandatory convertible bond has no effect.
Standard & Poor’s gives Bayer AG a long-term issuer rating ofbbb+with positive outlook, while Moody’s gives the company a rating of A3 with negative outlook. The short-term ratings are A-2 (Standard & Poor’s) and P-2 (Moody’s). These investment-grade ratings evidence a continuing high level of creditworthiness.
Employees
The number of employees is shown as full-time equivalents, which means part-time employees are included in proportion to their contractual working hours. We believe this presentation improves the comparability of personnel expenses and employee numbers. The previous year’s data have been restated accordingly.
On March 31, 2007 the Bayer Group had 105,100 employees, a decline of 1.0 percent compared to December 31, 2006. The number of employees thus remained virtually steady. Personnel expenses increased by 27.7 percent to€1,898 million(Q12006:€1,486 million), mainly due to the inclusion of personnel expenses for the employees of the former Schering group.
In the individual regions, too, the number of employees was practically unchanged against December 31, 2006. Compared to the previous year, the size of the workforce increased significantly, primarily due to the inclusion of the employees of the former Schering group. We currently employ 16,700 people in North America, 17,800 in Asia/Pacific, 13,800 in Latin America/Africa/Middle East and 56,800 in Europe. Our 40,000 employees in Germany account for 38.1 percent of the Group total.
23
Table of Contents
Interim Report as of March 31, 2007
Legal Risks
As a global company with a diverse business portfolio, the Bayer Group is exposed to various legal risks.
Legal proceedings currently considered to involve material risks are outlined below. The litigation referred to does not necessarily represent an exhaustive list.
Lipobay/Baycol:
As of April 20, 2007, the number of Lipobay/Baycol cases pending against Bayer worldwide was approximately 1,230 (approximately 1,175 of them in the United States, including several class actions). At the same date, Bayer had settled 3,160 Lipobay/Baycol cases worldwide without acknowledging any liability and resulting in settlement payments of approximatelyus$ 1,162 million. In the United States five cases have been tried to date, all of which were found in Bayer’s favor.
After more than five years of litigation we are currently aware of fewer than 20 pending cases in the United States that in our opinion hold a potential for settlement, although we cannot rule out the possibility that additional cases involving serious side effects from Lipobay/Baycol may come to our attention. In addition, there could be further settlements of cases outside of the United States.
Since the existing insurance coverage with respect to the Lipobay/Baycol cases is exhausted, it is possible — depending on the future progress of the litigation — that Bayer could face further payments that are not covered by the accounting measures already taken. We will regularly review the possibility of further accounting measures depending on the progress of the litigation.
Cipro®:
39 putative class action lawsuits and one individual lawsuit against Bayer involving the medication Cipro® have been pending since July 2000 in the United States. The plaintiffs are suing Bayer and other companies also named as defendants, alleging that a settlement reached in 1997 to end litigation between Bayer and Barr Laboratories, Inc. concerning the validity of a Cipro® patent violated antitrust regulations. The plaintiffs claim the alleged violation prevented the marketing of generic ciprofloxacin since 1997. Plaintiffs also are seeking triple damages underu.s. law. After the settlement with Barr, the Cipro® patent was the subject of a successful re-examination by theu.s. Patent and Trademark Office and of successful defenses inu.s. federal courts. The patent has since expired.
In March 2005, a federal district court in New York granted summary judgment in favor of Bayer in all actions pending in federal court. The plaintiffs are appealing this decision. Further cases are pending before various state courts. Bayer believes that it has meritorious defenses and intends to defend these cases vigorously.
24
Table of Contents
Interim Report as of March 31, 2007
Medrad:
As reported in the past, Liebel-Flarsheim Company and its parents, Mallinckrodt, Inc. and Tyco Healthcare Grouplp,filed suit against Bayer’su.s. subsidiary Medrad alleging that some of Medrad’s front load syringe injectors infringe patents held by Liebel-Flarsheim. In March 2007, theu.s. Court of Appeals decided that the Liebel-Flarsheim patents are invalid. Bayer believes that the legal risks involved in these proceedings are no longer material for the Bayer Group.
Yasmin®/yaz®:
In April 2005, Schering AG (now Bayer Schering Pharma AG), Berlin, Germany, filed ananda iv suit against Barr Pharmaceuticals, Inc. and Barr Laboratories, Inc. inu.s. federal court alleging patent infringement by Barr for its generic version of Bayer Schering Pharma’s Yasmin® oral contraceptive product in the United States. In June, 2005, Barr filed its counterclaims seeking to invalidate Bayer Schering Pharma’s patent.
In January 2007, Schering received notice from Barr Laboratories, Inc. that it has filed ananda iv application with theu.s. fdaseeking approval of a generic version of Schering’syaz®oral contraceptive product. Barr will be prohibited from marketing its generic version until after expiry in March 2009 of the three-year exclusivity period for marketing granted by thefda.
The Company highly values its Yasmin® andyaz®oral contraceptive products and is deeply committed to continuing its leadership position in oral contraception.
llrice:
Since August 2006 numerous lawsuits, including putative class actions, have been filed by rice farmers, distributors and rice mills against Bayer CropSciencelpin the United States. The plaintiffs are suing the company, alleging that they have suffered economic losses after traces of the genetically modified rice event from the Liberty Link rice lines(llrice)were identified in samples of conventional long-grain rice grown in theu.s. This is alleged to have led in particular to a decline in the commodity price for long-grain rice due to import restrictions imposed by the European Commission and certain other countries. After development,llrice601 was further tested in cooperation with third parties, including a breeding institute in theu.s. However, it was never selected for commercialization.
In March 2007 traces ofllrice62 andllrice604 were found in Clearfield 131 conventional hybrid rice marketed bybasf.Subsequently theusdaissued an order temporarily prohibiting the sale or planting of Clearfield 131.
25
Table of Contents
Interim Report as of March 31, 2007
Theusdaand thefdahave stated thatllrice62, 601 and 604 do not constitute a health risk and are safe for use in food and feed and for the environment. Theusdaderegulatedllrice62 in 1999 and, upon Bayer CropScience’s application, deregulatedll rice601 in November 2006.
Bayer believes it has meritorious defenses and intends to defend these cases vigorously.
Rubber, polyester polyols, urethane: Proceedings involving the former rubber-related lines of business
A number of investigations and proceedings by the respective authorities in thee.u.and Canada for alleged anticompetitive conduct involving certain products in the rubber field have been resolved, while others remain pending. As previously reported, in the United States the investigations of theu.s. Department of Justice into Bayer’s conduct have been concluded. In November 2006, thee.u.Commission closed the proceedings related tobr/esbrby imposing fines against several companies and granting full amnesty to Bayer.
Numerous civil claims for damages including class actions are pending in the United States and Canada against Bayer AG and certain of its subsidiaries as well as other companies. The lawsuits involve rubber chemicals,epdm, nbrand polychloroprene rubber(cr).As previously reported, Bayer has settled the actions which management believes to be material.
Proceedings involving polyester polyols, urethanes and urethane chemicals
As previously reported, Bayer has resolved theu.s. Department of Justice investigation previously pending in the United States. In Canada an investigation is pending against Bayer for alleged anticompetitive conduct relating to adipic-based polyester polyols.
A number of civil claims for damages, including class actions, have been filed against Bayer in the United States involving allegations of unlawful collusion on prices for certain polyester polyols, urethanes and urethane chemicals product lines. Similar actions are pending in Canada with respect to polyester polyols. Bayer has settled several actions pending in the United States. These settlements do not resolve all of the pending civil litigation nor do they preclude the bringing of additional claims.
Proceedings involving polyether polyols and other precursors for urethane end-use products
Bayer has been named as a defendant in multiple putative class action lawsuits in the United States and Canada involving allegations of price fixing for, inter alia, polyether polyols and certain other precursors for urethane end-use products. In the United States, Bayer has settled with a class of direct purchasers of polyether polyols,mdiandtdi(and related systems) representing approximately 75 percent of the purchases, which settlement has been approved by the court. The remaining direct purchasers opted out of the settlement and have the right to bring their own actions. To date no such actions have been brought. In Canada, the class action lawsuit on behalf of direct and indirect purchasers of polyether polyols,mdiandtdi(and related systems) continues. In February 2006 Bayer was served with a subpoena from theu.s. Department of Justice seeking information relating to the manufacture and sale of these products.
26
Table of Contents
Interim Report as of March 31, 2007
Impact of antitrust proceedings on Bayer
Excluding the portion allocated to Lanxess, the provision with respect to the described civil proceedings were reduced from€285 million in 2005 to€124 million as of March 31, 2007, due to settlement payments.
Bayer will continue to pursue settlements that in its view are warranted. In cases where settlement is not achievable, Bayer will continue to defend itself vigorously.
The financial risk associated with the proceedings described above beyond the amounts already paid and the financial provisions already established is currently not quantifiable due to the considerable uncertainty associated with these proceedings. Consequently, no provisions other than those described above have been established. The Company expects that, in the course of the regulatory proceedings and civil damages suits, additional charges will become necessary.
Arbitration proceeding concerning propylene oxide
As previously reported, an arbitration panel in May 2006 issued a final award in favor of Lyondell Chemical Co. in respect of a dispute with Bayer over interpretation of their joint venture agreements for the manufacture of propylene oxide. Bayer was seeking to vacate the final award, while Lyondell was seeking to confirm the award as well as obtain pre-award interest. On March 20, 2007, the Texas District Court denied Bayer’s motion to vacate, confirmed in part the final award and ordered additional discovery relevant to one issue on which confirmation was not granted. Bayer has established appropriate provisions for the entire matter. In January 2007, Bayer filed a suit against Lyondell in the Delaware State Court of Chancery, seeking equitable reformation of one of the license agreements relating to the joint venture and restitution of certain monies paid or allegedly owing by Bayer to Lyondell.
Subsequent Events
In April 2007 the Japanese Ministry of Health, Labor and Welfare(mhlw)approved the novel cholesterol-lowering agentzetia® (ezetimibe).zetia® will be co-marketed by Bayer Yakuhin Ltd. and Schering-Plough K.K. Japan. The drug is approved for use either as mono-therapy or co-administered with a statin, for further reduction ofldl(“bad”) cholesterol.
The co-marketing agreement regardingzetia®in Japan is part of Bayer’s strategic pharmaceuticals alliance with Schering-Plough, which was announced in 2004. Bayer’s primary care pharmaceutical products, such as the antibiotics Avelox® and Cipro®, the cardiovascular product Adalat® and also Levitra® are today marketed and distributed by Schering-Plough in the United States and Puerto Rico.
Please note that Bayer Schering Pharma AG is not legally related to Schering-Plough Corporation, New Jersey, United States. The two companies have been totally independent of each other for many years.
27
Table of Contents
Interim Report as of March 31, 2007
Calculation ofebit(da)Before Special Items
ebitda, ebitdabefore special items andebitbefore special items are not defined in the International Financial Reporting Standards and should therefore be regarded only as supplementary information. The company considers the underlying earnings figures to be more suitable indicators of operating performance since they are not affected by special items, andebitdabefore special items is not affected by depreciation, amortization or write-downs/write-backs. The company also believes that these indicators give readers a clearer picture of the results of operations and ensure greater comparability of data over time.
| EBIT | EBIT | EBITDA | EBITDA | |||||||||||||||
| Special Items Reconciliation | 1st Quarter | 1st Quarter | 1st Quarter | 1st Quarter | ||||||||||||||
| € million | 2006 | 2007 | 2006 | 2007 | ||||||||||||||
After special items | 1,049 | 1,175 | 1,436 | 1,774 | ||||||||||||||
HealthCare | 6 | 139 | 6 | 165 | ||||||||||||||
| Schering PPA effects* | 0 | 20 | 0 | 64 | ||||||||||||||
| Schering integration costs | 0 | 119 | 0 | 101 | ||||||||||||||
| Litigation | 5 | 0 | 5 | 0 | ||||||||||||||
| Other | 1 | 0 | 1 | 0 | ||||||||||||||
CropScience | 0 | 39 | 0 | 36 | ||||||||||||||
| Restructuring | 0 | 39 | 0 | 36 | ||||||||||||||
MaterialScience | 112 | 6 | 112 | 0 | ||||||||||||||
| Restructuring | 0 | 6 | 0 | 0 | ||||||||||||||
| Litigation | 112 | 0 | 112 | 0 | ||||||||||||||
Reconciliation | 10 | 16 | 10 | 15 | ||||||||||||||
| Restructuring Industry Services | 0 | 16 | 0 | 15 | ||||||||||||||
| Litigation | 10 | 0 | 10 | 0 | ||||||||||||||
Total special items | 128 | 200 | 128 | 216 | ||||||||||||||
Before special items | 1,177 | 1,375 | 1,564 | 1,990 | ||||||||||||||
| * | The purchase price paid for Schering AG, Germany, was allocated among the acquired assets and assumed liabilities in accordance with the International Financial Reporting Standards (IFRS). The purchase price allocation, which is not yet complete, resulted in total charges toebit of€224 million in the first quarter of 2007. To ensure comparability with future earnings data, the expected long-term effects of the step-up are reflected inebit andebitda before special items, whereas temporary, non-cash effects of the purchase price allocation are eliminated. When calculating EBIT before special items, we deducted a€20 million special charge recorded in this connection.ebit before special items therefore reflects€204 million in charges resulting from the purchase price allocation.ebitda before special items remains unaffected by the purchase price allocation. |
28
Table of Contents
Investor Information
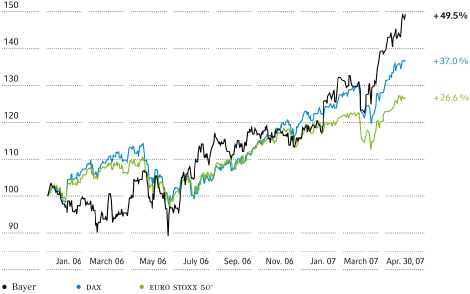
Bayer stock performed very well in the first quarter of 2007, ending the quarter at€47.84, up 17.7 percent from the closing price on December 31, 2006. This was the highest closing price for Bayer stock in the past five years. Over the same period thedaxrose 4.9 percent to 6,917.
Supported by a favorable market environment, this outstanding performance was due to the good results for fiscal 2006 and our positive business outlook, which in turn led to a number of upgrades by financial analysts.
| 1st Quarter | 1st Quarter | Full Year | |||||||||||||||
| Bayer Stock Key Data | 2006 | 2007 | 2006 | ||||||||||||||
High for the period (€) | 36.37 | 47.84 | 40.92 | ||||||||||||||
Low for the period (€) | 31.70 | 40.20 | 30.56 | ||||||||||||||
| Average daily share turnover on German stock exchanges (million) | 5.6 | 5.5 | 5.6 | ||||||||||||||
| Change | ||||||||||||||||||
| March 31, 2007/ | ||||||||||||||||||
| March 31, | March 31, | Dec. 31, | Dec. 31, 2006 | |||||||||||||||
| 2006 | 2007 | 2006 | % | |||||||||||||||
Share price (€) | 33.06 | 47.84 | 40.66 | 17.7 | ||||||||||||||
Market capitalization (€ million) | 24,145 | 36,566 | 31,078 | 17.7 | ||||||||||||||
Stockholders’ equity (€ million) | 12,105 | 15,906 | 12,851 | 23.8 | ||||||||||||||
| Number of shares entitled to the dividend (million) | 730.34 | 764.34 | 764.34 | 0.0 | ||||||||||||||
| DAX | 5,970 | 6,917 | 6,597 | 4.9 | ||||||||||||||
XETRA closing price; source: Bloomberg
Performance of Bayer Stock
Index (100 =xetraclosing price on December 31, 2005)
Index (100 =xetraclosing price on December 31, 2005)
29
Table of Contents
Interim Report as of March 31, 2007
Calculation of core earnings per share
Earnings per share according toifrsare affected by the purchase price allocation and other special factors. To enhance comparability, we also determine core net income from continuing operations after elimination of the amortization of intangible assets, asset write-downs (including any impairment losses), special items inebitdaand extraordinary factors affecting income from investments in affiliated companies (such as divestment gains or write-downs), including the related tax effects.
The calculation of earnings per share in accordance withifrsis explained in the notes to this interim report on page 37. Adjusted core net income, core earnings per share and coreebitare not defined in the International Financial Reporting Standards. Therefore they should be regarded as supplementary information rather than stand-alone indicators.
| 1st Quarter | 1st Quarter | ||||||||
| Calculation of Core EBIT and Core Earnings per Share | 2006 | 2007 | |||||||
€ million | |||||||||
EBIT as per income statement | 1,049 | 1,175 | |||||||
| Amortization and write-downs of intangible assets | 131 | 293 | |||||||
| Write-downs of property, plant and equipment | 6 | 24 | |||||||
| Special items (other than write-downs) | 128 | 216 | |||||||
Core EBIT | 1,314 | 1,708 | |||||||
| Non-operating result (as per income statement) | (210 | ) | (218 | ) | |||||
| Extraordinary income/loss from investments in affiliated companies | — | — | |||||||
| Income taxes (as per income statement) | (277 | ) | (301 | ) | |||||
| Tax adjustment | (93 | ) | (177 | ) | |||||
| Income after taxes attributable to minority interest (as per income statement) | 3 | (1 | ) | ||||||
Core net income from continuing operations | 737 | 1,011 | |||||||
| Financing expenses for the mandatory convertible bond, net of tax effects | — | 24 | |||||||
Adjusted core net income | 737 | 1,035 | |||||||
| Shares | |||||||||
Weighted average number of issued ordinary shares | 730,341,920 | 764,341,920 | |||||||
| Potential shares to be issued upon conversion of the mandatory convertible bond | — | 59,523,810 | |||||||
Adjusted weighted average total number of issued and potential ordinary shares | 730,341,920 | 823,865,730 | |||||||
Core earnings per share from continuing operations (€) | 1.01 | 1.26 | |||||||
30
Table of Contents
Interim Report as of March 31, 2007
Bayer Group Consolidated Statements of Income
| 1st Quarter | 1st Quarter | ||||||||
| € million | 2006 | 2007 | |||||||
Net sales | 6,791 | 8,335 | |||||||
| Cost of goods sold | (3,438 | ) | (4,134 | ) | |||||
Gross profit | 3,353 | 4,201 | |||||||
| Selling expenses | (1,365 | ) | (1,807 | ) | |||||
| Research and development expenses | (414 | ) | (625 | ) | |||||
| General administration expenses | (353 | ) | (436 | ) | |||||
| Other operating income | 208 | 143 | |||||||
| Other operating expenses | (380 | ) | (301 | ) | |||||
Operating result (EBIT) | 1,049 | 1,175 | |||||||
| Equity-method loss | (8 | ) | (14 | ) | |||||
| Non-operating income | 350 | 242 | |||||||
| Non-operating expenses | (552 | ) | (446 | ) | |||||
Non-operating result | (210 | ) | (218 | ) | |||||
Income before income taxes | 839 | 957 | |||||||
| Income taxes | (277 | ) | (301 | ) | |||||
Income from continuing operations after taxes | 562 | 656 | |||||||
Income from discontinued operations after taxes | 35 | 2,154 | |||||||
Income after taxes | 597 | 2,810 | |||||||
of which attributable to minority interest | (3 | ) | 1 | ||||||
of which attributable to Bayer AG stockholders (net income) | 600 | 2,809 | |||||||
Earnings per share (€) | |||||||||
From continuing operations | |||||||||
| Basic* | 0.77 | 0.82 | |||||||
| Diluted* | 0.77 | 0.82 | |||||||
From continuing and discontinued operations | |||||||||
| Basic* | 0.82 | 3.44 | |||||||
| Diluted* | 0.82 | 3.44 | |||||||
| 2006 figures restated | ||
| * | The ordinary shares to be issued upon conversion of the mandatory convertible bond are treated as already issued shares. |
31
Table of Contents
Interim Report as of March 31, 2007
Bayer Group Consolidated Balance Sheets
| € million | March 31, 2006 | March 31, 2007 | Dec. 31, 2006 | ||||||||||
Noncurrent assets | |||||||||||||
| Goodwill | 2,546 | 8,183 | 8,227 | ||||||||||
| Other intangible assets | 4,656 | 15,448 | 15,807 | ||||||||||
| Property, plant and equipment | 7,339 | 8,740 | 8,867 | ||||||||||
| Investments in associates | 776 | 517 | 532 | ||||||||||
| Other financial assets | 1,227 | 1,177 | 1,094 | ||||||||||
| Other receivables | 140 | 184 | 165 | ||||||||||
| Deferred taxes | 1,301 | 1,005 | 1,205 | ||||||||||
| 17,985 | 35,254 | 35,897 | |||||||||||
Current assets | |||||||||||||
| Inventories | 4,774 | 6,327 | 6,153 | ||||||||||
| Trade accounts receivable | 5,436 | 6,759 | 5,802 | ||||||||||
| Other financial assets | 526 | 238 | 401 | ||||||||||
| Other receivables | 1,403 | 1,356 | 1,217 | ||||||||||
| Claims for tax refunds | 446 | 550 | 581 | ||||||||||
| Cash and cash equivalents | 3,026 | 6,143 | 2,915 | ||||||||||
| Assets held for sale and discontinued operations | 2,832 | 346 | 2,925 | ||||||||||
| 18,443 | 21,719 | 19,994 | |||||||||||
Total assets | 36,428 | 56,973 | 55,891 | ||||||||||
Stockholders’ equity | |||||||||||||
| Capital stock of Bayer AG | 1,870 | 1,957 | 1,957 | ||||||||||
| Capital reserves of Bayer AG | 2,942 | 4,028 | 4,028 | ||||||||||
| Other reserves | 7,222 | 9,855 | 6,782 | ||||||||||
| 12,034 | 15,840 | 12,767 | |||||||||||
| Equity attributable to minority interest | 71 | 66 | 84 | ||||||||||
| 12,105 | 15,906 | 12,851 | |||||||||||
Noncurrent liabilities | |||||||||||||
| Provisions for pensions and other post-employment benefits | 5,961 | 6,156 | 6,543 | ||||||||||
| Other provisions | 1,670 | 1,506 | 1,464 | ||||||||||
| Financial liabilities | 7,418 | 14,626 | 14,723 | ||||||||||
| Other liabilities | 469 | 402 | 449 | ||||||||||
| Deferred taxes | 293 | 4,397 | 4,346 | ||||||||||
| 15,811 | 27,087 | 27,525 | |||||||||||
Current liabilities | |||||||||||||
| Other provisions | 2,809 | 4,571 | 3,765 | ||||||||||
| Financial liabilities | 1,309 | 3,673 | 5,078 | ||||||||||
| Trade accounts payable | 1,610 | 2,289 | 2,369 | ||||||||||
| Tax liabilities | 283 | 463 | 400 | ||||||||||
| Other liabilities | 1,608 | 2,826 | 3,055 | ||||||||||
| Liabilities directly related to assets held for sale and discontinued operations | 893 | 158 | 848 | ||||||||||
| 8,512 | 13,980 | 15,515 | |||||||||||
Total stockholders’ equity and liabilities | 36,428 | 56,973 | 55,891 | ||||||||||
2006 figures restated
32
Table of Contents
Interim Report as of March 31, 2007
Bayer Group
Consolidated Statements of Cash Flows
Consolidated Statements of Cash Flows
| 1st Quarter | 1st Quarter | ||||||||
| € million | 2006 | 2007 | |||||||
| Income from continuing operations after taxes | 562 | 656 | |||||||
| Income taxes | 277 | 301 | |||||||
| Non-operating result | 210 | 218 | |||||||
| Income taxes paid | (216 | ) | (343 | ) | |||||
| Depreciation and amortization | 387 | 599 | |||||||
| Change in pension provisions | (130 | ) | (96 | ) | |||||
| (Gains) losses on retirements of noncurrent assets | (1 | ) | 12 | ||||||
| Non-cash effects of the remeasurement of acquired assets (inventory work-down) | — | 64 | |||||||
Gross cash flow | 1,089 | 1,411 | |||||||
| Decrease (increase) in inventories | (114 | ) | (213 | ) | |||||
| Decrease (increase) in trade accounts receivable | (889 | ) | (1,011 | ) | |||||
| (Decrease) increase in trade accounts payable | (231 | ) | (114 | ) | |||||
| Changes in other working capital, other non-cash items | 183 | 302 | |||||||
Net cash provided by (used in) operating activities (net cash flow), continuing operations | 38 | 375 | |||||||
| Net cash provided by (used in) operating activities (net cash flow), discontinued operations | 90 | 38 | |||||||
Net cash provided by (used in) operating activities (net cash flow), total | 128 | 413 | |||||||
| Cash outflows for property, plant, equipment and intangible assets | (419 | ) | (201 | ) | |||||
| Cash inflows from sales of property, plant, equipment and other assets | 20 | 18 | |||||||
| Cash inflows from divestitures less divested cash | 0 | 4,673 | |||||||
| Cash outflows for acquisitions less acquired cash | (20 | ) | (22 | ) | |||||
| Cash inflows from noncurrent financial assets | 26 | 5 | |||||||
| Interest and dividends received | 107 | 93 | |||||||
| Cash inflows (outflows) from current financial assets | 94 | 23 | |||||||
Net cash provided by (used in) investing activities (total) | (192 | ) | 4,589 | ||||||
| Capital contributions | 0 | 0 | |||||||
| Bayer AG dividend, dividend payments to minority stockholders, reimbursements of advance capital gains tax payments | 165 | (9 | ) | ||||||
| Issuances of debt | 269 | 444 | |||||||
| Retirements of debt | (393 | ) | (1,954 | ) | |||||
| Interest paid | (228 | ) | (245 | ) | |||||
Net cash provided by (used in) financing activities (total) | (187 | ) | (1,764 | ) | |||||
Change in cash and cash equivalents due to business activities (total) | (251 | ) | 3,238 | ||||||
Cash and cash equivalents, January 1 | 3,290 | 2,915 | |||||||
| Change in cash and cash equivalents due to changes in scope of consolidation | (2 | ) | (1 | ) | |||||
| Change in cash and cash equivalents due to exchange rate movements | (11 | ) | (9 | ) | |||||
Cash and cash equivalents, March 31 | 3,026 | 6,143 | |||||||
| 2006 figures restated | ||
33
Table of Contents
Interim Report as of March 31, 2007
Bayer Group Consolidated Statements of Recognized Income and Expense
| 1st Quarter | 1st Quarter | ||||||||
| € million | 2006 | 2007 | |||||||
| Changes in fair values of derivatives designated as hedges and available-for-sale financial assets, recognized in stockholders’ equity | 9 | 1 | |||||||
| Changes in actuarial gains/losses on denned benefit obligations for pensions and other post-employment benefits, recognized in stockholders’ equity | 805 | 331 | |||||||
| Exchange differences on translation of operations outside the euro zone, recognized in stockholders’ equity | (144 | ) | 36 | ||||||
| Deferred taxes on valuation adjustments offset directly against stockholders’ equity | (315 | ) | (134 | ) | |||||
| Changes due to changes in scope of consolidation | — | 31 | |||||||
Valuation adjustments recognized directly in stockholders’ equity | 355 | 265 | |||||||
Income after taxes | 597 | 2,810 | |||||||
Total income and expense recognized in the financial statements | 952 | 3,075 | |||||||
of which attributable to minority interest | (5 | ) | 2 | ||||||
of which attributable to Bayer AG stockholders | 957 | 3,073 | |||||||
34
Table of Contents
Interim Report as of March 31, 2007
Key Data by Segment
| HealthCare | ||||||||||||||||||
| Pharmaceuticals | Consumer Health | |||||||||||||||||
| 1st Quarter | 1st Quarter | 1st Quarter | 1st Quarter | |||||||||||||||
| € million | 2006 | 2007 | 2006 | 2007 | ||||||||||||||
| Net sales (external) | 1,148 | 2,495 | 1,055 | 1,115 | ||||||||||||||
| Change | +20.6 | % | +117.3 | % | +22.0 | % | +5.7 | % | ||||||||||
| Currency-adjusted change | +15.2 | % | +122.2 | % | +15.8 | % | +11.4 | % | ||||||||||
| Intersegment sales | 13 | 12 | 2 | 3 | ||||||||||||||
| Operating result (EBIT) | 202 | 281 | 177 | 204 | ||||||||||||||
| Depreciation, amortization and write-downs/write-backs | 39 | 265 | 41 | 33 | ||||||||||||||
| Gross cash flow* | 162 | 390 | 130 | 167 | ||||||||||||||
| Net cash flow* | (11 | ) | 279 | 54 | 104 | |||||||||||||
| Number of employees at end of period | 16,700 | 39,400 | 11,700 | 11,500 | ||||||||||||||
| Crop Science | ||||||||||||||||||
| Environmental | ||||||||||||||||||
| Crop Protection | Science, BioScience | |||||||||||||||||
| 1st Quarter | 1st Quarter | 1st Quarter | 1st Quarter | |||||||||||||||
| 2006 | 2007 | 2006 | 2007 | |||||||||||||||
| Net sales (external) | 1,413 | 1,434 | 358 | 352 | ||||||||||||||
| Change | -0.3 | % | +1.5 | % | +9.5 | % | -1.7 | % | ||||||||||
| Currency-adjusted change | -5.8 | % | +5.5 | % | +3.4 | % | +3.7 | % | ||||||||||
| Intersegment sales | 18 | 18 | 2 | 2 | ||||||||||||||
| Operating result (EBIT) | 285 | 304 | 123 | 104 | ||||||||||||||
| Depreciation, amortization and write-downs/write-backs | 121 | 121 | 22 | 19 | ||||||||||||||
| Gross cash flow* | 285 | 282 | 102 | 87 | ||||||||||||||
| Net cash flow* | (289 | ) | (113 | ) | (61 | ) | (125 | ) | ||||||||||
| Number of employees at end of period | 15,500 | 14,900 | 2,800 | 2,900 | ||||||||||||||
| Material Science | ||||||||||||||||||
| Materials | Systems | |||||||||||||||||
| 1st Quarter | 1st Quarter | 1st Quarter | 1st Quarter | |||||||||||||||
| 2006 | 2007 | 2006 | 2007 | |||||||||||||||
| Net sales (external) | 710 | 739 | 1,776 | 1,869 | ||||||||||||||
| Change | +12.0 | % | +4.1 | % | +9.6 | % | +5.2 | % | ||||||||||
| Currency-adjusted change | +6.6 | % | +9.0 | % | +4.8 | % | +9.6 | % | ||||||||||
| Intersegment sales | 6 | 4 | 39 | 38 | ||||||||||||||
| Operating result (EBIT) | 132 | 38 | 179 | 247 | ||||||||||||||
| Depreciation, amortization and write-downs/write-backs | 38 | 42 | 78 | 82 | ||||||||||||||
| Gross cash flow* | 126 | 69 | 191 | 235 | ||||||||||||||
| Net cash flow* | 35 | (25 | ) | 238 | 62 | |||||||||||||
| Number of employees at end of period | 4,800 | 4,900 | 9,800 | 10,200 | ||||||||||||||
| Reconciliation | Continuing Operations | |||||||||||||||||
| 1st Quarter | 1st Quarter | 1st Quarter | 1st Quarter | |||||||||||||||
| 2006 | 2007 | 2006 | 2007 | |||||||||||||||
| Net sales (external) | 331 | 331 | 6,791 | 8,335 | ||||||||||||||
| Change | +11.4 | % | +22.7 | % | ||||||||||||||
| Currency-adjusted change | +6.2 | % | +27.3 | % | ||||||||||||||
| Intersegment sales | (80 | ) | (77 | ) | ||||||||||||||
| Operating result (EBIT) | (49 | ) | (3 | ) | 1,049 | 1,175 | ||||||||||||
| Depreciation, amortization and write-downs/write-backs | 48 | 37 | 387 | 599 | ||||||||||||||
| Gross cash flow* | 93 | 181 | 1,089 | 1,411 | ||||||||||||||
| Net cash flow* | 72 | 193 | 38 | 375 | ||||||||||||||
| Number of employees at end of period | 21,100 | 21,300 | 82,400 | 105,100 | ||||||||||||||
| 2006 figures restated | ||
| * | for definition see Bayer Group Key Data on page 2 |
35
Table of Contents
Interim Report as of March 31, 2007
Key Data by Region
| Europe | North America | |||||||||||||||||
| 1st Quarter | 1st Quarter | 1st Quarter | 1st Quarter | |||||||||||||||
| € million | 2006 | 2007 | 2006 | 2007 | ||||||||||||||
| Net sales (external) — by market | 3,018 | 3,848 | 1,936 | 2,226 | ||||||||||||||
| Change | +6.8 | % | +27.5 | % | +20.8 | +15.0 | % | |||||||||||
| Currency-adjusted change | +6.6 | % | +27.5 | % | +9.8 | +25.4 | % | |||||||||||
| Net sales (external) — by point of origin | 3,226 | 4,153 | 1,952 | 2,220 | ||||||||||||||
| Change | +6.9 | % | +28.7 | % | +21.2 | +13.7 | % | |||||||||||
| Currency-adjusted change | +6.8 | % | +28.7 | % | +10.0 | +24.2 | % | |||||||||||
| Interregional sales | 1,045 | 1,374 | 477 | 516 | ||||||||||||||
| Operating result (EBIT) | 663 | 724 | 262 | 357 | ||||||||||||||
| Gross cash flow* | 689 | 1,302 | 259 | (52 | ) | |||||||||||||
| Number of employees at end of period | 45,200 | 56,800 | 13,000 | 16,700 | ||||||||||||||
| Latin America | ||||||||||||||||||
| Asia/Pacific | Africa/Middle East | |||||||||||||||||
| 1st Quarter | 1st Quarter | 1st Quarter | 1st Quarter | |||||||||||||||
| 2006 | 2007 | 2006 | 2007 | |||||||||||||||
| Net sales (external) — by market | 1,006 | 1,200 | 831 | 1,061 | ||||||||||||||
| Change | +7.7 | % | +19.3 | % | +13.2 | % | +27.7 | % | ||||||||||
| Currency-adjusted change | +2.2 | % | +27.8 | % | +1.6 | % | +38.7 | % | ||||||||||
| Net sales (external) — by point of origin | 964 | 1,137 | 649 | 825 | ||||||||||||||
| Change | +7.1 | % | +17.9 | % | +14.1 | % | +27.1 | % | ||||||||||
| Currency-adjusted change | +1.4 | % | +26.9 | % | -0.4 | % | +40.8 | % | ||||||||||
| Interregional sales | 59 | 53 | 42 | 57 | ||||||||||||||
| Operating result (EBIT) | 123 | 73 | 44 | 63 | ||||||||||||||
| Gross cash flow* | 128 | 98 | 38 | 71 | ||||||||||||||
| Number of employees at end of period | 13,600 | 17,800 | 10,600 | 13,800 | ||||||||||||||
| Continuing | ||||||||||||||||||
| Reconciliation | Operations | |||||||||||||||||
| 1st Quarter | 1st Quarter | 1st Quarter | 1st Quarter | |||||||||||||||
| 2006 | 2007 | 2006 | 2007 | |||||||||||||||
| Net sales (external) — by market | 6,791 | 8,335 | ||||||||||||||||
| Change | +11.4 | % | +22.7 | % | ||||||||||||||
| Currency-adjusted change | +6.2 | % | +27.3 | % | ||||||||||||||
| Net sales (external) — by point of origin | 6,791 | 8,335 | ||||||||||||||||
| Change | +11.4 | % | +22.7 | % | ||||||||||||||
| Currency-adjusted change | +6.2 | % | +27.3 | % | ||||||||||||||
| Interregional sales | (1,623 | ) | (2,000 | ) | ||||||||||||||
| Operating result (EBIT) | (43 | ) | (42 | ) | 1,049 | 1,175 | ||||||||||||
| Gross cash flow* | (25 | ) | (8 | ) | 1,089 | 1,411 | ||||||||||||
| Number of employees at end of period | 82,400 | 105,100 | ||||||||||||||||
| 2006 figures restated | ||
| * | for definition see Bayer Group Key Data on page 2 |
36
Table of Contents
Interim Report as of March 31, 2007
Notes to the Interim Report as of March 31, 2007
Accounting policies
Pursuant to Section 315a of the German Commercial Code, the unaudited consolidated interim financial statements as of March 31, 2007 have been prepared according to the International Financial Reporting Standards (ifrs) — includingias 34 — of the International Accounting Standards Board (iasb), London, which are endorsed by the European Union, and the Interpretations of the International Financial Reporting Interpretations Committee (ifric), in effect at the closing date.
Reference should be made as appropriate to the notes to the 2006 financial statements, particularly with regard to recognition and valuation principles.
Information on earnings per share
The ordinary shares to be issued upon conversion of the mandatory convertible bond are treated as already issued shares. Diluted earnings per share are therefore equal to basic earnings per share.
Calculation of Earnings per Share
| 1st Quarter | 1st Quarter | ||||||||
| €million | 2006 | 2007 | |||||||
| Income after taxes | 597 | 2,810 | |||||||
| Income attributable to minority interest | (3 | ) | 1 | ||||||
| Income attributable to Bayer AG stockholders | 600 | 2,809 | |||||||
| Income from discontinued operations | 35 | 2,154 | |||||||
| Financing expenses for the mandatory convertible bond, net of tax effects | — | 24 | |||||||
| Adjusted income after taxes from continuing operations | 565 | 679 | |||||||
| Adjusted net income | 600 | 2,833 | |||||||
| Weighted average number of issued ordinary shares | 730,341,920 | 764,341,920 | |||||||
| Potential shares to be issued upon conversion of the mandatory convertible bond | — | 59,523,810 | |||||||
| Adjusted weighted average total number of issued and potential ordinary shares | 730,341,920 | 823,865,730 | |||||||
Basic earnings per share (€) | |||||||||
| from continuing operations | 0.77 | 0.82 | |||||||
| from continuing and discontinued operations | 0.82 | 3.44 | |||||||
Diluted earnings per share (€) | |||||||||
| from continuing operations | 0.77 | 0.82 | |||||||
| from continuing and discontinued operations | 0.82 | 3.44 | |||||||
| 2006 figures restated |
Changes in the Bayer Group
Scope of consolidation
As of March 31, 2007, the Bayer Group comprised 386 fully or proportionately consolidated companies, compared with 432 companies as of December 31, 2006. This decrease is primarily the result of companies leaving the group through the Diagnostics and H.C. Starck divestitures and of intragroup mergers of companies as part of the integration of Schering, Berlin, Germany.
37
Table of Contents
Interim Report as of March 31, 2007
Discontinued operations
In mid-2006 Bayer AG and Siemens AG signed an agreement concerning the sale of the Diagnostics business, which was transferred to the new owner on January 2, 2007.
On November 23, 2006 an agreement was concluded to divest the activities of the H.C. Starck group, formerly assigned to the Materials segment, to a consortium of two financial investors, Advent International and The Carlyle Group. This business was transferred to the new owners on February 1, 2007.
The agreement to sell the companies of the Wolff Walsrode group, which operates principally in the field of cellulose chemistry, to The Dow Chemical Company, United States, was signed in December 2006. Wolff Walsrode also was formerly assigned to the Materials segment. Pending the approval of the antitrust authorities, the transfer of this business is expected to take place in the summer of 2007.
The Diagnostics activities, H.C. Starck and Wolff Walsrode are recognized as discontinued operations. The prior-period data have been restated accordingly.
This information, which is provided from the standpoint of the Bayer Group, is to be regarded as part of the reporting for the entire Bayer Group by analogy with our segment reporting and is not intended to portray either the discontinued operations or the remaining operations of Bayer as separate entities. This presentation is thus in line with the principles for reporting discontinued operations.
Discontinued Operations
| Diagnostics | H.C. Starck | Wolff Walsrode | Total | |||||||||||||||||||||||||||||||||
| 1st Quarter | 1st Quarter | 1st Quarter | 1st Quarter | 1st Quarter | 1st Quarter | 1st Quarter | 1st Quarter | |||||||||||||||||||||||||||||
| € million | 2006 | 2007 | 2006 | 2007 | 2006 | 2007 | 2006 | 2007 | ||||||||||||||||||||||||||||
| Net sales | 378 | 0 | 247 | 74 | 78 | 85 | 703 | 159 | ||||||||||||||||||||||||||||
| Operating result (EBIT)* | 31 | 2,778 | 22 | 109 | 6 | 13 | 59 | 2,900 | ||||||||||||||||||||||||||||
| Income after taxes | 21 | 2,044 | 12 | 103 | 2 | 7 | 35 | 2,154 | ||||||||||||||||||||||||||||
| Gross cash flow* | 64 | (10 | ) | 27 | 14 | 10 | 10 | 101 | 14 | |||||||||||||||||||||||||||
| Net cash flow* | 64 | 7 | 26 | 26 | 0 | 5 | 90 | 38 | ||||||||||||||||||||||||||||
| Net investing cash flow | (29 | ) | 3,748 | (10 | ) | 922 | (2 | ) | (2 | ) | (41 | ) | 4,668 | |||||||||||||||||||||||
| Net financing cash flow | (35 | ) | (3,755 | ) | (16 | ) | (948 | ) | 2 | (3 | ) | (49 | ) | (4,706 | ) | |||||||||||||||||||||
| * | for definition see Bayer Group Key Data on page 2 |
Related parties
In the course of the operating business, materials, inventories and services are sourced from a large number of business partners around the world. These include companies in which an interest is held, and companies with which members of the Supervisory Board of Bayer AG are associated. Transactions with these companies are carried out on an arm’s-length basis. Business with such companies was not material from the viewpoint of the Bayer Group. The Bayer Group was not a party to any transaction of an unusual nature or structure that was material to it or to companies or persons closely associated with it, nor does it intend to be party to such transactions in the future.
38
Table of Contents
Interim Report as of March 31, 2007
Business transactions with companies included in the consolidated financial statements at equity, or at cost less impairment charges, mainly comprised trade in goods and services. The value of these transactions was, however, immaterial from the point of view of the Bayer Group. The same applies to financial receivables and payables vis-à-vis related parties.
Other information
The Annual Stockholders’ Meeting on April 27, 2007 approved the dividend proposed by the Board of Management and Supervisory Board of€1.00 per share for fiscal 2006.
The stockholders also ratified the actions of the members of the Board of Management and the Supervisory Board.
The terms of office of all Supervisory Board members ended at the close of the 2007 Annual Stockholders’ Meeting. In addition to the previous Supervisory Board members Dr. Paul Achleitner, Prof. Dr.-Ing. h.c. Hans-Olaf Henkel, Dr. Klaus Kleinfeld, Dr. Manfred Schneider, Dr. Ekkehard D. Schulz, Dr.-Ing. h.c. Jürgen Weber and Prof. Dr. Dr. h.c. Ernst-Ludwig Winnacker, the Annual Stockholders’ Meeting elected Dr. Clemens Börsig, Chairman of the Supervisory Board of Deutsche Bank Aktiengesellschaft, Dr. Helmut Panke, former Chairman of the Board of Management of BMW Aktiengesellschaft, and Dr. Klaus Sturany, member of the Board of Management of RWE Aktiengesellschaft, as stockholders’ representatives on the Supervisory Board. They will hold office until the conclusion of the Annual Stockholders’ Meeting that resolves on the ratification of the actions of the members of the Supervisory Board for the 2011 fiscal year. In addition to the previous Supervisory Board members Willy Beumann, Karl-Josef Ellrich, Dr.-Ing. Thomas Fischer, Peter Hausmann, Rainer Hoffmann, Petra Kronen, Hubertus Schmoldt and Thomas de Win, the employee delegates’ assembly elected Oliver Zühlke and André Krejcik as employees’ representatives on the Supervisory Board.
The existing Authorized Capitalii was revoked and new Authorized Capitalii created with the option of excluding subscription rights; Section 4, Paragraph 3 of the Articles of Incorporation (Capital Stock) was amended accordingly.
Due to the expiration of the authorization given by the previous Annual Stockholders’ Meeting, the Board of Management was again authorized to purchase and sell company shares subject to exclusion of subscription rights.
The Annual Stockholders’ Meeting approved the Control Agreement between Bayer AG and Bayer Schering GmbH.
PricewaterhouseCoopers Aktiengesellschaft, Wirtschaftsprüfungsgesellschaft, Essen, Germany, was appointed as auditor for the 2007 fiscal year as well as for the audit review of the semi-annual financial report for the 2007 fiscal year.
Leverkusen, May 2, 2007
Bayer Aktiengesellschaft
Bayer Aktiengesellschaft
The Board of Management
39
Table of Contents
Masthead
Published by
Bayer AG, 51368 Leverkusen, Germany
Bayer AG, 51368 Leverkusen, Germany
Editor
Ute Bode, phone ++49 214 30 58992, email: ute.bode.ub@bayer-ag.de
Ute Bode, phone ++49 214 30 58992, email: ute.bode.ub@bayer-ag.de
English edition
Bayer Industry Services GmbH & Co. OHG, Central Language Service
Bayer Industry Services GmbH & Co. OHG, Central Language Service
Investor Relations
Peter Dahlhoff, phone ++49 214 30 33022, email: peter.dahlhoff@bayer-ag.de
Peter Dahlhoff, phone ++49 214 30 33022, email: peter.dahlhoff@bayer-ag.de
Orders/Distribution
Michael Heinrich, phone ++49 214 30 57546, email: serviceline@bayer-ag.de
Michael Heinrich, phone ++49 214 30 57546, email: serviceline@bayer-ag.de
Date of publication
May 8, 2007
May 8, 2007
Many business and financial terms are explained on the Bayer Investor Relations website at
www.investor.bayer.com>Stock>Glossary
www.investor.bayer.com>Stock>Glossary
Bayer on the Internet
www.bayer.com
www.bayer.com
If you would like to receive the Bayer Stockholders’ Newsletter in electronic rather than print
form in future, please email the editor.
form in future, please email the editor.
Forward-Looking Statements
This Annual Report contains forward-looking statements. These statements use words like “believes,” “assumes,” “expects” or similar formulations. Various known and unknown risks, uncertainties and other factors could lead to material differences between the actual future results, financial situation, assets, development or performance of our company and those either expressed or implied by these statements. These factors include, among other things:
| • | downturns in the business cycle of the industries in which we compete; | |
| • | new regulations, or changes to existing regulations, that increase our operating costs or otherwise reduce our profitability; | |
| • | increases in the price of our raw materials, especially if we are unable to pass these costs along to customers; | |
| • | loss or reduction of patent protection for our products; | |
| • | liabilities, especially those incurred as a result of environmental laws or product liability litigation; | |
| • | fluctuation in international currency exchange rates as well as changes in the general economic climate; and | |
| • | other factors identified in this Annual Report. |
These factors include those discussed in our public reports filed with the Frankfurt Stock Exchange and with the U.S. Securities and Exchange Commission (including our Form 20-F). In view of these uncertainties, we caution readers not to place undue reliance on these forward-looking statements. We assume no liability whatsoever to update these forward-looking statements or to conform them to future events or developments.
Important Information from Bayer AG:
This is neither an offer to purchase nor a solicitation of an offer to sell shares or American depositary shares of Bayer Schering Pharma AG (formerly Schering AG). Bayer Schering GmbH (formerly Dritte BV GmbH) filed a tender offer statement with the U.S. Securities and Exchange Commission (SEC) with respect to the mandatory compensation offer on November 30, 2006, the time of commencement of the mandatory compensation offer. Simultaneously Bayer Schering Pharma AG (formerly Schering AG) filed a solicitation/recommendation statement on Schedule 14D-9 with the SEC with respect to the mandatory compensation offer. Investors and holders of shares and American depositary shares of Bayer Schering Pharma AG (formerly Schering AG) are strongly advised to read the tender offer statement and other relevant documents regarding the mandatory compensation offer that have been filed or will be filed with the SEC because they contain important information. Investors and holders of shares and American depositary shares of Bayer Schering Pharma AG (formerly Schering AG) will be able to receive these documents free of charge at the SEC’s website (www.sec.gov), or at the website www.bayer.com.
These documents and information contain forward-looking statements based on assumptions and forecasts made by Bayer Group management as of the respective dates of such documents. Various known and unknown risks, uncertainties and other factors could lead to material differences between the actual future results, financial situation, development or performance of the Bayer Group and/or Bayer Schering Pharma AG (formerly Schering AG) and the estimates contained in these documents and to differences between actions taken by the Bayer Group with respect to its investment in Bayer Schering Pharma AG (formerly Schering AG) and the intentions described in these documents. These factors include those discussed in reports filed with the Frankfurt Stock Exchange and in our reports filed with the U.S. Securities and Exchange Commission (including on Form 20-F). All forward-looking statements in these documents are made as of the dates thereof, based on information available to us as of the dates thereof. Except as otherwise required by law, we assume no obligation to update or revise any forward-looking statement to reflect new information, events or circumstances after the applicable dates thereof.
The names “Bayer Schering Pharma” or “Schering” as used in this publication always refer to Bayer Schering Pharma AG, Berlin, Germany, or its predecessor, Schering AG, Berlin, Germany, respectively.
Please note that Bayer Schering Pharma AG is not legally related to Schering-Plough Corporation, New Jersey, United States. The two companies have been totally independent of each other for many years.
40
Table of Contents
SIGNATURE
Pursuant to the requirements of the Securities Exchange Act of 1934, the registrant has duly caused this report to be signed on its behalf by the undersigned, thereunto duly authorized.
| BAYER AKTIENGESELLSCHAFT (Registrant) | ||||
| By: | /s/ Dr. Roland Hartwig | |||
| Name: | Dr. Roland Hartwig | |||
| Title: | General Counsel | |||
| By: | /s/ ppa. DR. ARMIN BUCHMEIER | |||
| Name: | Dr. Armin Buchmeier | |||
| Title: | Senior Counsel | |||
Date: May 10, 2007
41