QuickLinks -- Click here to rapidly navigate through this documentAs filed with the Securities and Exchange Commission on April 17, 2003
SECURITIES AND EXCHANGE COMMISSION
Washington, D.C. 20549
FORM 20-F
ANNUAL REPORT PURSUANT TO SECTION 13 OR 15(d)
OF THE SECURITIES EXCHANGE ACT OF 1934
For the fiscal year ended: December 31, 2002
Commission file number: 333-13690
ALFA LAVAL SPECIAL FINANCE AB
(Exact name of Registrant as specified in its charter)
The Kingdom of Sweden
(Jurisdiction of incorporation or organisation)
Rudeboksvägen 3
Lund, Sweden
+(46 46) 36 7000
(Address of principal executive office)
SECURITIES REGISTERED OR TO BE REGISTERED PURSUANT TO SECTION 12(b)
OF THE ACT:
None
SECURITIES REGISTERED OR TO BE REGISTERED PURSUANT TO SECTION 12(g)
OF THE ACT:
None
SECURITIES FOR WHICH THERE IS A REPORTING OBLIGATION PURSUANT
TO SECTION 15(d) OF THE ACT:
121/8% Senior Notes due 2010
The number of outstanding shares of Alfa Laval Special Finance AB's classes of
capital or common stock as of December 31, 2002:
8,191,000 Ordinary Shares, nominal value SEK 100 per share
Indicate by check mark whether the registrant (1) has filed all reports required to be filed by Section 13
or 15(d) of the Securities Exchange Act of 1934 during the preceding 12 months (or for such
shorter period that the Registrant was required to file such reports), and (2) has
been subject to such filing requirements for the past 90 days:
Yes o No ý
Indicate by check mark which financial statement item the Registrant has elected to follow:
Item 17 ý Item 18 o
TABLE OF CONTENTS
| INTRODUCTION | | i |
FORWARD-LOOKING STATEMENTS |
|
i |
MARKET SHARE AND INDUSTRY DATA |
|
ii |
CERTAIN DEFINITIONS |
|
ii |
PART I |
ITEM 1: IDENTITY OF DIRECTORS, SENIOR MANAGEMENT AND ADVISERS |
|
I-1 |
ITEM 2: OFFER STATISTICS AND EXPECTED TIMETABLE |
|
I-2 |
ITEM 3: KEY INFORMATION |
|
I-3 |
ITEM 4: INFORMATION ABOUT THE COMPANY |
|
I-26 |
ITEM 5: OPERATING AND FINANCIAL REVIEW AND PROSPECTS |
|
I-47 |
ITEM 6: DIRECTORS, SENIOR MANAGEMENT AND EMPLOYEES |
|
I-75 |
ITEM 7: MAJOR SHAREHOLDERS AND RELATED PARTY TRANSACTIONS |
|
I-80 |
ITEM 8: FINANCIAL INFORMATION |
|
I-84 |
ITEM 9: THE OFFER AND LISTING |
|
I-86 |
ITEM 10: ADDITIONAL INFORMATION |
|
I-87 |
ITEM 11: QUANTITATIVE AND QUALITATIVE DISCLOSURES ABOUT MARKET RISK |
|
I-92 |
ITEM 12: DESCRIPTION OF SECURITIES OTHER THAN EQUITY SECURITIES |
|
I-96 |
PART II |
ITEM 13: DEFAULTS, DIVIDEND ARREARAGES AND DELINQUENCIES |
|
II-1 |
ITEM 14: MATERIAL MODIFICATIONS TO THE RIGHTS OF SECURITY HOLDERS
AND USE OF PROCEEDS |
|
II-2 |
ITEM 15: CONTROLS AND PROCEDURES |
|
II-3 |
ITEM 16: [RESERVED.] |
|
II-4 |
PART III |
ITEM 17: FINANCIAL STATEMENTS |
|
III-1 |
ITEM 18: FINANCIAL STATEMENTS |
|
III-2 |
ITEM 19: EXHIBITS AND CERTIFICATIONS |
|
III-2 |
INTRODUCTION
The discussion under the caption "Item 5: Operating and Financial Review and Prospects" in this annual report contains references to Swedish kronor amounts on a constant exchange rate basis. These Swedish kronor amounts, which also include the impact of Alfa Laval's hedging activities, have been converted from a variety of foreign currencies, including the euro at a rate of €1.00 = SEK 9.2415, the average rate calculated on monthly closing rates issued by Reuters.
Certain amounts and percentages included in this annual report have been rounded and accordingly may not total.
FORWARD-LOOKING STATEMENTS
This annual report includes various forward-looking statements and includes assumptions about future market conditions, operations and results. These statements appear in a number of places, including "Item 3.D: Key Information—Risk Factors", "Item 4.B: Information about the Company—Business Overview" and "Item 5: Operating and Financial Review and Prospects", and include statements regarding our intentions, beliefs or current expectations. The words "believe", "expect", "anticipate", "intend" or "plan" and similar expressions identify certain of such forward-looking statements. Others can be identified from the context in which the statements are made. Actual events or results may differ materially as a result of risks and uncertainties that we face. Important factors that could cause these differences include:
- •
- worldwide economic and business conditions and regulatory, legislative and judicial developments;
- •
- business conditions of our customers;
- •
- increased competition from other companies in our industry;
- •
- emergence of new or substitute technologies;
- •
- availability and price fluctuations of raw materials;
- •
- changes in our business strategy or development plans;
- •
- success with our product development;
- •
- implementation of our corporate and operational restructuring;
- •
- the significant amount of debt we and our subsidiaries have incurred and our obligations to service such debt; and
- •
- contractual restrictions on our ability to receive loans and dividends from certain of our subsidiaries.
We caution you that any such forward-looking statements are not guarantees of future performance and involve risks and uncertainties. We also caution you that actual results may differ materially from those made in or suggested by the forward-looking statements as a result of various factors. The information contained in this annual report, including, without limitation, the information under "Item 3.D: Key Information—Risk Factors", "Item 4.B: Information about the Company—Business Overview" and "Item 5: Operating and Financial Review and Prospects" identify important factors that could cause such differences. We undertake no obligation to publicly update or revise any forward-looking statements, whether as a result of new information, future events or otherwise.
i
MARKET SHARE AND INDUSTRY DATA
This annual report contains historical market data and industry forecasts, which have been obtained from industry publications, market research and publicly available information. The industry publications state that the historical information they provide has been obtained from sources, and through methods, believed to be reliable, but that they do not guarantee the accuracy and completeness of this information. Similarly, industry forecasts and market research, while believed to be reliable, have not been independently verified by us. We make no representation that this historical information is accurate. Industry forecasts are, by their nature, subject to significant uncertainty. There can be no assurance that any of the forecasts will be achieved.
We define the compact heat exchanger market to include brazed, welded and gasketed plate heat exchangers. We define the centrifugal separation market as decanter centrifuges and high speed separators. We define the sanitary flow market as sanitary liquid handling equipment, including pumps, valves and fittings.
CERTAIN DEFINITIONS
Unless otherwise noted, reference in this annual report to:
- •
- "Acquisition" refers to the acquisition by Industri Kapital and others, as described herein, of all of the outstanding capital stock of Alfa Laval Holding AB from Zarus Holding B.V., now operating under the name of Tetra Laval B.V.;
- •
- "Adjusted EBITA" is calculated by excluding from EBITA the effect of certain comparison distortion items (or non-recurring items), as further described under "Item 3.A: Key Information—Selected Consolidated Financial Data—Definitions of Operating Data and Key Ratios" and in our financial statements;
The following table shows how EBITA and Adjusted EBITA are calculated for 2000, 2001 and 2002:
| | Year Ended December 31,
|
|---|
| | Unaudited
Pro Forma Combined
2000
| | 2001
| | 2002
|
|---|
| | (SEK millions)
|
|---|
| Operating Income | | 810 | | 1,233 | | 1,224 |
| Amortisation of goodwill | | 164 | | 178 | | 188 |
| Step-Up Depreciation | | 316 | | 334 | | 319 |
| | |
| |
| |
|
| EBITA | | 1,290 | | 1,745 | | 1,731 |
| Comparison distortion items | | (130 | ) | (5 | ) | 29 |
| | |
| |
| |
|
| Adjusted EBITA | | 1,160 | | 1,740 | | 1,760 |
| | |
| |
| |
|
- •
- "Adjusted EBITDA" is calculated by excluding from EBITDA the effect of certain comparison distortion items (or non-recurring items), as further described under "Item 3.A: Key Information—Selected Consolidated Financial Data—Definitions of Operating Data and Key Ratios" and in our financial statements;
ii
| | Year Ended December 31,
|
|---|
| | Unaudited
Pro Forma Combined
2000
| | 2001
| | 2002
|
|---|
| | (SEK millions)
|
|---|
| Operating Income | | 810 | | 1,233 | | 1,224 |
| Depreciation | | 466 | | 400 | | 331 |
| Amortisation of goodwill | | 164 | | 178 | | 188 |
| Step-Up Depreciation | | 316 | | 334 | | 319 |
| | |
| |
| |
|
| EBITDA | | 1,756 | | 2,145 | | 2,062 |
| Comparison distortion items | | (130 | ) | (5 | ) | 29 |
| | |
| |
| |
|
| Adjusted EBITDA | | 1,626 | | 2,140 | | 2,091 |
| | |
| |
| |
|
- •
- "Alfa Laval AB" means Alfa Laval AB, our parent holding company;
- •
- "Alfa Laval Special Finance", "Company", "we", "our" and "us" mean Alfa Laval Special Finance AB, a limited liability company registered under the laws of Sweden, and, where the context requires, its consolidated subsidiaries, which include the Guarantor;
- •
- "Bond Loan" or, where the context so requires "Senior Notes" means the €220 million 121/8% senior notes due 2010 issued by us on November 9, 2000 and guaranteed on a senior subordinated basis by Alfa Laval Credit Finance AB, the Guarantor;
- •
- "EBITA" means Earnings Before Interest, Tax and Amortisation and is calculated as operating income or loss (including share of earnings from associated companies), before interest, taxes and goodwill Amortisation. In addition, we have added back to EBITA depreciation expense recorded on the additional basis recognised on certain tangible and intangible assets in connection with the Acquisition ("Step-Up Depreciation") when calculating EBITA because we view the step-up in asset values as equivalent to goodwill and the Step-Up Depreciation as equivalent to goodwill Amortisation;
- ���
- "EBITDA" means Earnings Before Interest, Tax, Depreciation and Amortisation and is calculated as operating income or loss (including share of earnings from associated companies), before interest, taxes, depreciation and goodwill Amortisation. In addition, we have added back to EBITDA depreciation expense recorded on the additional basis recognised on certain tangible and intangible assets in connection with the Acquisition ("Step-Up Depreciation") when calculating EBITDA because we view the step-up in asset values as equivalent to goodwill and the Step-Up Depreciation as equivalent to goodwill Amortisation;
- •
- "Existing Senior Credit Facility" means the senior facilities agreement dated April 29, 2002 as amended and restated on July 11, 2002 entered into by Alfa Laval Treasury International AB and Alfa Laval US Treasury Inc., as borrowers, and Alfa Laval Special Finance AB and others as guarantors for a maximum principal amount of €575 million, being €425 million term loan facilities and €150 million revolving loan facilities;
- •
- "Guarantor" and "Alfa Laval Credit Finance" means Alfa Laval Credit Finance AB (formerly known as Alfa Laval Bostadsförvaltning AB), a limited company being a subsidiary of Alfa Laval Special Finance AB, registered under the laws of Sweden;
iii
- •
- "Industri Kapital" means Industri Kapital Ltd., a private equity firm, together with, and, where the context requires, certain investment funds advised by Industri Kapital Ltd. and certain of its affiliates;
- •
- "Industri Kapital 2000" means a number of limited partnerships, commonly referred to as the Industri Kapital 2000 Fund, the general partner of each of which is Industri Kapital 2000 Ltd. Industri Kapital 2000 Ltd. is advised by Industri Kapital. Pursuant to contractual arrangements, Industri Kapital 2000 Ltd. exercises control of a majority of the shares of Alfa Laval AB, our parent holding company;
- •
- "Intercreditor Agreement" has the meaning given under the caption "Item 5.B: Liquidity and Capital Resources—Intercreditor Agreement";
- •
- "Management Warrants" means warrants to subscribe for 3,721,310 ordinary shares held by executive officers of Alfa Laval AB and having an exercise price of approximately SEK 59.5 per share. These warrants were exercised on April 23, 2002;
- •
- "Offering" means the offering by Alfa Laval AB, Industri Kapital 2000, Tetra Laval B.V. and certain of Alfa Laval AB's officers and directors of 56,515,022 ordinary shares in Alfa Laval AB. The ordinary shares in Alfa Laval AB were offered pursuant to an institutional offering, a public offering to investors in Sweden and an employee offering to employees in Denmark, Finland, Norway and Sweden. The ordinary shares offered were delivered to purchasers on May 23, 2002. Alfa Laval AB listed its ordinary shares on the O-list of the Stockholm Exchange at that time. The ordinary shares of Alfa Laval AB were offered in the United States only to qualified institutional buyers in reliance on Rule 144A under the Securities Act of 1933, as amended (the "Securities Act") and outside the United States in compliance with Regulation S under the Securities Act;
- •
- "Predecessor" or "Alfa Laval Holding" means Alfa Laval Holding AB, including its consolidated subsidiaries. Alfa Laval Holding AB is an indirect wholly owned subsidiary of Alfa Laval AB;
- •
- "Previous Senior Credit Facility" means the senior facilities agreement dated August 22, 2000 entered into by Alfa Laval AB, Alfa Laval Credit Finance AB as borrower and other group companies for a maximum principal amount of €651.8 equivalent term loan facilities and €475 million equivalent revolving loan facilities. This facility was refinanced with the proceeds of the Existing Senior Credit Facility on May 28, 2002;
- •
- "Senior Notes". See "Bond Loan" above.
- •
- "Share Sale and Purchase Agreement" means the agreement dated June 16, 2000, as amended on August 24, 2000, relating to the Acquisition;
- •
- "Subordinated Loan" means the €200.0 million subordinated vendor loan, extended by Tetra Laval Finance Limited. Alfa Laval AB used the proceeds from the Offering and the exercise of the Management Warrants and drawings under the Existing Senior Credit Facility to repay the Subordinated Loan, together with accrued and unpaid interest thereon, on May 23, 2002;
- •
- "Tetra Laval" and "Tetra Laval Group" means Tetra Laval and its affiliated entities as of the date of this annual report;
- •
- "Tetra Pak" and "Tetra Pak Group" means Tetra Pak International S.A. and all affiliated companies which are under the management control of Tetra Pak International S.A.;
- •
- "Tetra Laval B.V." means Zarus Holding B.V., a member of the Tetra Laval Group, now operating under the name Tetra Laval B.V.;
- •
- "Vendor" means Tetra Laval B.V.; and
iv
- •
- "Vendor Warrant" means the warrant to subscribe for shares up to a net amount of €40 million to be issued by Alfa Laval AB to Tetra Laval in the event that Industri Kapital 2000's internal rate of return on investments exceeds certain specified levels upon a trade sale or public offering of shares in Alfa Laval AB. Pursuant to the terms of an agreement dated April 23, 2002, the parties agreed to settle his obligation in cash, amounting to €40 million upon consummation of the Offering. The Vendor Warrant was assigned to Tetra Laval Finance Ltd. Prior to the execution of this agreement.
For definitions of operating data and key ratios used throughout this annual report, see "Item 3.A—Key Information—Definitions of Operating Data and Key Ratios".
v
PART I
ITEM 1: IDENTITY OF DIRECTORS, SENIOR MANAGEMENT AND ADVISERS
Not applicable.
I-1
ITEM 2: OFFER STATISTICS AND EXPECTED TIMETABLE
Not applicable.
I-2
ITEM 3: KEY INFORMATION
3.A. Selected Financial Data
Alfa Laval Special Finance AB
The table below sets forth (a) selected audited consolidated financial data of Alfa Laval Holding and its subsidiaries, Alfa Laval's predecessor, for the years ended December 31, 1998 and 1999, (b) selected unaudited pro forma combined financial data for Alfa Laval Special Finance AB for the year ended December 31, 2000, and (c) selected audited consolidated financial data for Alfa Laval Special Finance AB for the years ended December 31, 2001 and 2002. We acquired Alfa Laval Holding on August 24, 2000. The selected consolidated financial data set forth below as of and for the financial years ended December 31, 1998, 1999, 2000, 2001 and 2002 have been derived from, and are qualified by reference to, Alfa Laval Special Finance AB's consolidated financial statements and those of its predecessor, which have been audited by Ernst & Young, independent public accountants. The consolidated financial statements have been prepared in accordance with Swedish GAAP, which differs in certain material respects from US GAAP. The principal differences between Swedish GAAP and US GAAP, as applicable to Alfa Laval Special Finance AB and the Predecessor, are summarised in note 34 to our audited consolidated financial statements included elsewhere in this annual report.
The following information should be read in conjunction with (i) "Item 3.A: Key Information—Unaudited Pro Forma Consolidated Financial Information", (ii) "Item 5: Operating and Financial Review and Prospects" and (iii) the audited consolidated financial statements of Alfa Special Finance AB and its Predecessor included elsewhere in this annual report.
I-3
Selected Consolidated Historical Financial Data for
Alfa Laval Special Finance AB
| | Predecessor
| | Successor
| |
|---|
| | Year
Ended
December 31,
1998
| | Year
Ended
December 31
1999
| | Period
ended
August 23,
2000
| | Period
Ended
December 31,
2000
| | Pro
Forma(1)
Combined
2000
| | Year
Ended
December 31,
2001
| | Year
Ended
December 31,
2002
| |
|---|
| | (SEK millions, unless otherwise stated)
| |
|---|
| Consolidated Statement of Operations Data: | | | | | | | | | | | | | | | |
| Swedish GAAP: | | | | | | | | | | | | | | | |
| Net sales | | 14,734 | | 14,405 | | 9,295 | | 5,717 | | 15,012 | | 15,830 | | 14,595 | |
| Cost of goods sold | | (9,297 | ) | (9,355 | ) | (5,963 | ) | (3,951 | ) | (10,124 | ) | (10,348 | ) | (9,262 | ) |
| | |
| |
| |
| |
| |
| |
| |
| |
| Gross profit | | 5,437 | | 5,051 | | 3,333 | | 1,766 | | 4,888 | | 5,482 | | 5,333 | |
Other operating expenses: |
|
|
|
|
|
|
|
|
|
|
|
|
|
|
|
| Sales costs | | (2,803 | ) | (2,695 | ) | (1,748 | ) | (835 | ) | (2,584 | ) | (2,443 | ) | (2,115 | ) |
| Administrative costs | | (995 | ) | (976 | ) | (643 | ) | (218 | ) | (862 | ) | (787 | ) | (1,027 | ) |
| Research and development costs | | (514 | ) | (435 | ) | (279 | ) | (162 | ) | (441 | ) | (341 | ) | (355 | ) |
| Other operating income/(costs) | | (160 | ) | (11 | ) | (69 | ) | (88 | ) | (157 | ) | (504 | ) | (395 | ) |
| Goodwill amortisation | | (690 | ) | (715 | ) | (485 | ) | (55 | ) | (164 | ) | (178 | ) | (188 | ) |
| Comparison distortion items | | 497 | | 30 | | 523 | | (394 | ) | 130 | | 5 | | (29 | ) |
| | |
| |
| |
| |
| |
| |
| |
| |
| Operating income/(loss) | | 772 | | 249 | | 631 | | 14 | | 810 | | 1,233 | | 1,224 | |
| Interest and other financial income/(costs) | | (204 | ) | (133 | ) | (125 | ) | (329 | ) | (802 | ) | (861 | ) | (764 | ) |
| | |
| |
| |
| |
| |
| |
| |
| |
| Income/(loss) before taxes and minority interests | | 568 | | 116 | | 506 | | (315 | ) | 8 | | 373 | | 460 | |
| Income tax benefit/(expense) | | 40 | | (333 | ) | (245 | ) | (56 | ) | (105 | ) | 26 | | (218 | ) |
| Minority interests | | (16 | ) | (27 | ) | (36 | ) | (12 | ) | (48 | ) | (32 | ) | (34 | ) |
| | |
| |
| |
| |
| |
| |
| |
| |
| Net income/(loss) | | 592 | | (244 | ) | 225 | | (383 | ) | (145 | ) | 367 | | 208 | |
| | |
| |
| |
| |
| |
| |
| |
| |
US GAAP: |
|
|
|
|
|
|
|
|
|
|
|
|
|
|
|
| Net income/(loss) | | 294 | | 223 | | 447 | | (443 | ) | (316 | ) | 294 | | 633 | |
| Income/(loss) from continuing operations before cumulative effect of change in accounting principle | | 371 | | 201 | | 447 | | (443 | ) | (316 | ) | 356 | | 633 | |
| Depreciation and Amortisation | | 928 | | 757 | | 516 | | 346 | | N/A | | 883 | | 704 | |
| Ratio of earnings to fixed charges, times(3) | | 2.4 | x | 2.9 | x | 4.0 | x | — | | N/A | | 1.3 | x | 2.2 | x |
Operating Data and Key Ratios(2): |
|
|
|
|
|
|
|
|
|
|
|
|
|
|
|
| Swedish GAAP: | | | | | | | | | | | | | | | |
| Orders received | | 13,866 | | 13,897 | | 10,301 | | 5,073 | | 15,374 | | 15,894 | | 14,675 | |
| Order backlog | | 3,907 | | 3,532 | | N/A | | N/A | | 4,063 | | 4,314 | | 4,340 | |
| Gross margin, % | | 36.9 | % | 35.1 | % | 35.9 | % | 30.9 | % | 32.6 | % | 34.6 | % | 36.5 | % |
| Operating income | | 772 | | 249 | | 631 | | 14 | | 810 | | 1,233 | | 1,224 | |
| Operating margin % | | 5.2 | % | 1.7 | % | 6.8 | % | 0.2 | % | 5.4 | % | 7.8 | % | 8.4 | % |
| EBITDA | | 1,958 | | 1,440 | | 1,427 | | 329 | | 1,756 | | 2,145 | | 2,062 | |
| Adjusted EBITDA | | 1,461 | | 1,410 | | 903 | | 723 | | 1,626 | | 2,140 | | 2,091 | |
| EBITA | | 1,462 | | 964 | | 1,116 | | 174 | | 1,290 | | 1,745 | | 1,730 | |
| Adjusted EBITA | | 965 | | 934 | | 592 | | 568 | | 1,160 | | 1,740 | | 1,760 | |
| EBITDA margin, % | | 13.3 | % | 10.0 | % | 15.4 | % | 5.8 | % | 11.7 | % | 13.6 | % | 14.1 | % |
| Adjusted EBITDA margin, % | | 9.9 | % | 9.8 | % | 9.7 | % | 12.6 | % | 10.8 | % | 13.5 | % | 14.3 | % |
| EBITA margin, % | | 9.9 | % | 6.7 | % | 12.0 | % | 3.0 | % | 8.6 | % | 11.0 | % | 11.9 | % |
| Adjusted EBITA margin, % | | 6.5 | % | 6.5 | % | 6.4 | % | 9.9 | % | 7.7 | % | 11.0 | % | 12.1 | % |
I-4
| Depreciation and amortisation | | 1,185 | | 1,191 | | 796 | | 315 | | 946 | | 912 | | 838 | |
| Investment in fixed assets | | 438 | | 431 | | 133 | | 179 | | 312 | | 275 | | 277 | |
| Return on capital employed, % | | 21.6 | % | 15.2 | % | N/A | | N/A | | 16.1 | % | 18.5 | % | 20.3 | % |
| Capital employed | | 6,781 | | 6,357 | | N/A | | N/A | | 8,013 | | 9,415 | | 8,527 | |
| Capital turnover rate, times | | 2.2 | x | 2.3 | x | N/A | | N/A | | 1.9 | x | 1.7 | x | 1.7 | x |
| Return on equity, % | | 16.2 | % | N/M | | N/A | | N/M | | N/M | | 10.1 | % | 4.7 | % |
| Equity/assets ratio, % | | 26.8 | % | 26.3 | % | N/A | | 16.8 | % | 16.8 | % | 20.6 | % | 28.6 | % |
| Net debt/equity ratio, times | | 0.8 | x | 0.9 | x | N/A | | N/A | | 2.1 | x | 1.6 | x | 0.8 | x |
| Average number of employees | | 12,613 | | 11,696 | | N/A | | N/A | | 11,001 | | 9,693 | | 9,292 | |
| Interest coverage ratio, times | | 6.2 | x | 5.9 | x | 5.4 | x | 0.75 | x | 2.0 | x | 2.5 | x | 3.4 | x |
| Ratio of earnings to fixed charges, times(3) | | 2.4 | x | 1.3 | x | 3.2 | x | — | | N/A | | 1.4 | x | 1.6 | x |
Consolidated Cash Flow Statement Data: |
|
|
|
|
|
|
|
|
|
|
|
|
|
|
|
| Swedish GAAP: | | | | | | | | | | | | | | | |
| Cash flows from operating activities | | 559 | | 1,324 | | 587 | | 583 | | 1,630 | | 1,977 | | 2,047 | |
| Cash flows from investing activities | | (189 | ) | (600 | ) | 278 | | (8,563 | ) | (8,284 | ) | 112 | | (548 | ) |
| Cash flows from financing activities | | (325 | ) | (586 | ) | (997 | ) | 8,381 | | 6,618 | | (2,069 | ) | (1,443 | ) |
Consolidated Balance Sheet Data: |
|
|
|
|
|
|
|
|
|
|
|
|
|
|
|
| Swedish GAAP: | | | | | | | | | | | | | | | |
| Cash and bank and other current deposits | | 646 | | 960 | | N/A | | 1,230 | | 1,230 | | 960 | | 1,020 | |
| Net working capital, excluding financial items | | 2,105 | | 3,346 | | N/A | | 3,458 | | 3,458 | | 3,323 | | 2,151 | |
| Total assets | | 13,647 | | 12,704 | | N/A | | 18,791 | | 18,791 | | 17,637 | | 15,427 | |
| Total interest bearing debt | | 3,383 | | 3,750 | | N/A | | 7,880 | | 7,880 | | 6,652 | | 4,519 | |
| Total shareholders' equity | | 3,652 | | 3,343 | | N/A | | 3,165 | | 3,165 | | 3,629 | | 4,413 | |
US GAAP: |
|
|
|
|
|
|
|
|
|
|
|
|
|
|
|
| Total assets | | 13,833 | | 13,544 | | N/A | | 19,530 | | 19,530 | | 18,731 | | 16,477 | |
| Total interest bearing debt | | 3,383 | | 3,750 | | N/A | | 7,880 | | 7,880 | | 6,847 | | 4,519 | |
| Total shareholders' equity | | 4,823 | | 4,963 | | N/A | | 3,537 | | 3,537 | | 4,099 | | 5,168 | |
- (1)
- Adjusted to give effect to the Acquisition and related financing, including the issue of the Senior Notes, as if they had occurred on January 1, 2000. See "Unaudited Pro Forma Consolidated Financial Information" appearing on page I-10 of this annual report for a description of the pro forma adjustments made to the 2000 accounts.
- (2)
- For definitions, see "Definitions of Operating Data and Key Ratios" below.
- (3)
- For purposes of determining the ratio of earnings to fixed charges, earnings are defined as income before taxes plus fixed charges. Fixed charges include interest expense and one-third of rental expense on operating leases (representing that portion of rental expense deemed to be attributable to interest). Earnings in accordance with Swedish GAAP and US GAAP were insufficient to cover fixed charges by SEK 327 million and SEK 292 million respectively, during the period ended December 31, 2000.
I-5
Definitions of Operating Data and Key Ratios
The key ratios and certain other operating and per share data are provided in accordance with recommended Swedish market practice and are defined as follows:
| Orders received | | — | | Represents the total of orders received from customers during the year. Management believes that orders received represents a measure of current demand a for the group's products and services. Orders received cannot be directly related to future annual revenues due to the nature of certain orders (long-term contracts), which may be recognised in earnings over several periods. |
Order backlog |
|
— |
|
Represents total orders received which have not yet been recognised as revenues. Management believes that order backlog provides a general indication of the trend a of future net sales as the group's order backlog represents orders for products and services which management expect to complete and recognise as revenue in future periods. |
Gross margin (%) |
|
— |
|
The ratio of gross profits to net sales, expressed as a percentage. |
EBITDA |
|
— |
|
EBITDA is not a measure of operating performance calculated in accordance with Swedish GAAP or US GAAP. EBITDA should not be considered a substitute for a operating income, net income, cash flow from operating activities or other statement of operations data as determined in accordance with Swedish GAAP, or as a measure of profitability or liquidity. EBITDA does not necessarily indicate whether cash flow will be sufficient or available for cash requirements. EBITDA is included as supplemental disclosure because we believe that it, when considered in connection with cash flows from operating, investing and financing activities, provides useful information to investors and because management considers this a key measure used to evaluate financial operating performance. EBITDA, as it is generally defined, is calculated as operating income or loss (including share of earnings from associated companies), before interest, taxes, depreciation and amortisation. EBITDA may not be indicative of our historical operating results, nor is it indicative of potential future results. Since all companies do not calculate EBITDA identically, the presentation of EBITDA may not be comparable to similarly entitled measures of other companies. |
Adjusted EBITDA |
|
— |
|
Adjusted EBITDA is not a measure of operating performance calculated in accordance with Swedish GAAP or US GAAP. Adjusted EBITDA should not be considered a substitute for operating income, net income, cash flow from operating activities or other statement of operations data as determined in accordance with Swedish GAAP, or as a measure of profitability or liquidity. Adjusted EBITDA does not necessarily indicate whether cash flow will be sufficient or available for cash requirements. Adjusted EBITDA is included as supplemental disclosure because we believe that it, when considered in connection with cash flows from operating, investing and financing activities, provides useful information to investors and because management considers this a key measure used to evaluate financial operating performance. We calculate Adjusted EBITDA by excluding from EBITDA the effect of certain comparison distortion items (or non-recurring items), as disclosed in our financial statements. Adjusted EBITDA for 1999, 2000 pro forma, 2001 and 2002 has been calculated by excluding from EBITDA such comparison distortion items reported in the accompanying statements of operations, which aggregate to a net of SEK 30 million, SEK 130 million, SEK 5 million and SEK (29) million in 1999, 2000, 2001 and 2002, respectively. Adjusted EBITDA may not be indicative of our historical operating results, nor is it indicative of potential future results. Since all companies do not calculate Adjusted EBITDA identically, the presentation of Adjusted EBITDA may not be comparable to similarly entitled measures of other companies. |
|
|
|
|
|
I-6
EBITA |
|
— |
|
EBITA is not a measure of operating performance calculated in accordance with Swedish GAAP or US GAAP. EBITA should not be considered a substitute for operating income, net income, cash flow from operating activities or other statement of operations data as determined in accordance with Swedish GAAP or US GAAP, or as a measure of profitability or liquidity. EBITA does not necessarily indicate whether cash flow will be sufficient or available for cash requirements. EBITA is included as supplemental disclosure, because we believe that it, when considered in connection with cash flows from operating, investing and financing activities, provides useful information to investors and because management considers this a key measure used to evaluate financial operating performance. EBITA, as it is generally defined, is calculated as operating income or loss (including share of earnings from associated companies), before interest, taxes and goodwill amortisation. In addition, we have added back to EBITA depreciation expense recorded on the additional basis recognised on certain tangible and intangible assets in connection with the Acquisition ("Step-Up Depreciation") when calculating EBITA because we view the step-up in asset values as equivalent to goodwill and the Step-Up Depreciation as equivalent to goodwill amortisation. Step-Up Depreciation totaled SEK 319 million in 2002, SEK 334 million in 2001 and SEK 316 million for 2000 on a pro forma annual basis. This Step-Up Depreciation is included in costs of goods sold in our financial statements. EBITA may not be indicative of our historical operating results, nor is it meant to be predictive of potential future results. Since all companies do not calculate EBITA identically, the presentation of EBITA may not be comparable to similarly entitled measures of other companies. |
|
|
|
|
|
I-7
Adjusted EBITA |
|
— |
|
Adjusted EBITA is not a measure of operating performance calculated in accordance with Swedish GAAP or US GAAP. Adjusted EBITA should not be considered a substitute for operating income, net income, cash flow from operating activities or other statement of operations data as determined in accordance with Swedish GAAP or US GAAP, or as a measure of profitability or liquidity. Adjusted EBITA does not necessarily indicate whether cash flow will be sufficient or available for cash requirements. Adjusted EBITA is included as supplemental disclosure, because we believe that it, when considered in connection with cash flows from operating, investing and financing activities, provides useful information to investors and because management considers this a key measure used to evaluate financial operating performance. We calculate Adjusted EBITA by excluding from EBITA the effect of certain comparison distortion items (or non-recurring items), as disclosed in our financial statements. Adjusted EBITA for 1999, 2000 pro forma, 2001 and 2002 has been calculated by excluding from EBITA such comparison distortion items reported in the accompanying statements of operations which aggregate to a net of SEK 30 million, SEK 130 million, SEK 5 million and SEK (29) million in 1999, 2000, 2001 and 2002, respectively. Adjusted EBITA may not be indicative of our historical operating results, nor is it meant to be predictive of potential future results. Since all companies do not calculate Adjusted EBITA identically, the presentation of Adjusted EBITA may not be comparable to similarly entitled measures of other companies. |
Operating income |
|
— |
|
Gross profit less operating expenses (including comparison distortion items). |
Operating margin (%) |
|
— |
|
The ratio of Operating income to net sales expressed as a percentage. |
EBITDA margin (%) |
|
— |
|
The ratio of EBITDA to net sales expressed as a percentage. |
Adjusted EBITDA margin (%) |
|
— |
|
The ratio of Adjusted EBITDA to net sales expressed as a percentage. |
EBITA margin (%) |
|
— |
|
The ratio of EBITA to net sales expressed as a percentage. |
Adjusted EBITA margin (%) |
|
— |
|
The ratio of Adjusted EBITA to net sales expressed as a percentage. |
Investment in fixed assets |
|
— |
|
Cash flows used to acquire and/or maintain plant, property and equipment (Investments in fixed assets under cash flow from investing activities in the consolidated cash flow statement). |
Return on capital employed % |
|
— |
|
EBITA in relation to average capital employed, expressed as a percentage. |
|
|
|
|
|
I-8
Capital employed |
|
— |
|
Total assets less liquid funds, capitalised financing costs, other long-term securities, accrued interest income, operating liabilities and other non-interest bearing liabilities, including tax and deferred tax, but excluding accrued interest costs. Reflects the capital that is used in the operations. The capital employed for the group differs from the net capital for the segments concerning taxes, deferred taxes and pensions. |
Capital turnover rate, times |
|
— |
|
Ratio of net sales to average capital employed. |
Return on equity % |
|
— |
|
The ratio of net income divided by total equity expressed as a percentage. |
Total interest bearing debt |
|
— |
|
Total interest bearing debt comprises the sum of long-term liabilities, liabilities to credit institutions as reported under current liabilities, capitalised financial leases, and interest bearing pension liabilities. |
Net debt |
|
— |
|
Net debt comprises total interest bearing debt (see definition above) less cash and bank and other current deposits. |
Equity/assets ratio % |
|
— |
|
The ratio of total equity to total assets expressed as a percentage. |
Net debt/equity ratio |
|
— |
|
Ratio of net debt (see definition below) to total equity, expressed as a multiple. |
Interest coverage ratio, times |
|
— |
|
The ratio of EBITDA less interest and other financial income/(costs), plus interest costs to interest costs, expressed as a multiple. |
Net working capital excluding financial items |
|
— |
|
Current assets, excluding cash and bank and other current deposits, less current liabilities excluding liabilities to credit institutions. |
Ratio of earnings to fixed charges |
|
— |
|
The ratio of earnings (as defined) to fixed charges, expressed as a multiple. Earnings are defined as income before taxes plus fixed charges. Fixed charges are defined as interest expenses plus one-third of rental expense on operating leases, which represents the portion of rental expenses deemed to be attributable to interest. |
I-9
Unaudited Pro Forma Consolidated Financial Information for
Alfa Laval Special Finance AB
The unaudited pro forma consolidated financial information for the year ended December 31, 2000 has been prepared on the basis of our audited consolidated statement of operations and the audited consolidated statement of operations of Alfa Laval Holding, our predecessor, for 2000 included elsewhere in this annual report, which has been prepared in accordance with Swedish GAAP. Swedish GAAP differs in certain significant respects from US GAAP. See note 34 to our consolidated financial statements for the year ended December 31, 2000, included elsewhere in this annual report for a description of such differences, as they apply to Alfa Laval Special Finance AB. This pro forma consolidated financial information has not been prepared in accordance with Article 11 of Regulation S-X. The audited consolidated information has been adjusted to give effect to the Acquisition and related financing transactions including the offering of the Senior Notes, in each case as if such transactions had been completed on January 1, 2000, as described in the notes set forth below. In addition, the pro forma consolidated financial information has been adjusted to reflect purchase accounting under US GAAP. The pro forma adjustments are based upon available information and certain assumptions that management believes are reasonable. The unaudited pro forma financial information does not purport to represent what our results of operations or financial condition would actually have been had such transactions in fact occurred on January 1, 2000 or to project our results of operations for any future period or our financial condition for any future date. The unaudited pro forma consolidated financial information should be read in conjunction with "Item 5: Operating and Financial Review and Prospects" and our consolidated financial statements included elsewhere in this annual report.
I-10
Alfa Laval Special Finance AB
Unaudited Pro Forma Consolidated Statement of Operations
for the year ended December 31, 2000
| | Swedish GAAP
| | US GAAP
| |
|---|
| | Predecessor
period ended
August 23,
2000
| | Successor
period ended
December 31,
2000
| | Pro Forma
Adjustments
| | Pro Forma
Combined Year ended
December 31,
2000
| | Adjustments
| | Pro Forma
Year ended
December 31,
2000
| |
|---|
| | (SEK millions)
| |
|---|
| Consolidated Statement of Operating Data: | | | | | | | | | | | | | |
| Net sales | | 9,295 | | 5,717 | | | | 15,012 | | (200 | ) | 14,812 | |
| Cost of goods sold | | (5,963 | ) | (3,951 | ) | (210 | )(1) | (10,124 | ) | (82 | ) | (10,206 | ) |
| | |
| |
| | | |
| | | |
| |
| Gross profit | | 3,332 | | 1,766 | | | | 4,888 | | | | 4,606 | |
| Other operating expenses: | | | | | | | | | | | | | |
| Sales costs | | (1,749 | ) | (835 | ) | | | (2,584 | ) | | | (2,584 | ) |
| Administration costs | | (643 | ) | (218 | ) | | | (861 | ) | 61 | | (800 | ) |
| Research and development costs | | (279 | ) | (162 | ) | | | (441 | ) | (45 | ) | (486 | ) |
| Other operating income | | 258 | | 268 | | | | 525 | | 30 | | 555 | |
| Other operating costs | | (327 | ) | (356 | ) | | | (683 | ) | (291 | ) | (974 | ) |
| Goodwill amortisation | | (485 | ) | (55 | ) | 376 | (2) | (164 | ) | 6 | | (158 | ) |
| Comparison distortion items | | 524 | | (394 | ) | | | 130 | | 394 | | 524 | |
| | |
| |
| | | |
| | | |
| |
| Operating income/(loss) | | 631 | | 14 | | | | 810 | | | | 683 | |
| Interest and other financial income | | 139 | | 111 | | | | 250 | | | | 250 | |
| Interest and other financial costs | | (264 | ) | (440 | ) | (348 | )(3) | (1,052 | ) | (10 | ) | (1,061 | ) |
| | |
| |
| | | |
| | | |
| |
| Income/(loss) after financial items before taxes and minority interests | | 506 | | (315 | ) | | | 8 | | | | (128 | ) |
| Income tax benefit/(expense) | | (245 | ) | (56 | ) | 195 | (4) | (105 | ) | (34 | ) | (140 | ) |
| Minority interests | | (36 | ) | (12 | ) | | | (48 | ) | | | (48 | ) |
| | |
| |
| | | |
| | | |
| |
| Net income/(loss) | | 225 | | (383 | ) | | | (145 | ) | | | (316 | ) |
| | |
| |
| | | |
| | | |
| |
I-11
Notes to the Unaudited Pro Forma Financial Data for 2000
Swedish GAAP adjustments for the Acquisition and related financing,
including the offering of Senior Notes
The pro forma adjustments described below reflect the purchase accounting adjustments in accordance with Swedish GAAP, as described in our December 31, 2000 consolidated financial statements.
- (1)
- Reflects the adjustments to depreciation and amortisation expense related to the stepped-up fair values of tangible and intangible assets acquired upon the Acquisition of Alfa Laval Holding, as if the Acquisition and related financing had occurred on January 1, 2000.
- (2)
- Reflects the elimination of prior goodwill amortisation recorded for the period January 1, 2000 to August 23, 2000 and the addition of goodwill amortisation associated with the goodwill established as a result of the Acquisition and related financing as if the Acquisition and financing had occurred on January 1, 2000.
- (3)
- Reflects the elimination of interest expense associated with Tetra Laval debt incurred prior to the Acquisition and the related financing and the addition of interest expense associated with the incurrence of the new debt under the Previous Senior Credit Facility and the issuance of the Senior Notes to refinance the bridge loan facility as if the Acquisition and the related financing had occurred on January 1, 2000. The adjustment also includes the amortisation of additional debt issuance costs related to the Previous Senior Credit Facility and the Senior Notes as if the Acquisition and the related financing had occurred on January 1, 2000. The amounts outstanding under the Previous Senior Credit Facility bear interest at a rate of 1.5% over the applicable inter-bank offered rate. For purposes of this pro forma financial information, we have assumed an effective interest rate of 7.2%. A1/8 per cent variance in floating interest rates would result in a change in interest expense of SEK 7 million. The interest on the Senior Notes is 12.125%.
| | Interest Rate
| | Amount
| | Additional
interest as if
incurred on
January 1,
2000
| |
|---|
| |
| | (SEK in millions)
| |
|---|
| Actual interest on refinanced Tetra Laval Debt | | | | | | (84 | ) |
| Previous Senior Credit Facility | | 7.2 | % | 5,730 | | 250 | |
| Actual interest on bridge loan facility | | | | | | (44 | ) |
| Senior Notes issued to repay bridge loan facility | | 12.125 | % | 1,950 | | 202 | |
| | | | | | |
| |
| | | | | | | 324 | |
Previous Senior Credit Facility debt issue costs amortised over 8 years |
|
|
|
228 |
|
18 |
|
| Senior Notes issue costs amortised over 10 years | | | | 71 | | 6 | |
| | | | | | |
| |
| Total incremental interest expense | | | | | | 348 | |
| | | | | | |
| |
- *
- Prepared on the basis of our capital structure in 2000.
- (4)
- Reflects the tax impact at our effective tax rate of 35% of the change in interest expense, depreciation and amortisation expense related to the stepped-up fair values of tangible and intangible assets as a result of the pro forma adjustments. The goodwill is not deductible for tax purposes; thus no tax impact is included for the adjustments to goodwill amortisation.
I-12
US GAAP Adjustments
The adjustments reflect the sum of the reconciliation adjustments of the consolidated statements of operations for the period January 1, 2000 to August 23, 2000 and for the period August 24, 2000 to December 31, 2000, as described in note 34 of our December 31, 2000 consolidated financial statements included elsewhere in this annual report. The adjustments also reflect certain reclassifications for the realisation of stepped-up values relating to the Acquisition that are presented as comparison distortion items in the Swedish GAAP financial statements. In addition, the US GAAP adjustments reflect the pro forma impact of applying US GAAP differences in purchasing accounting as if the transaction had occurred on January 1, 2000. Such differences result in higher cost of goods sold relating to amortisation of intangible assets and lower goodwill amortisation.
I-13
Exchange Rate Information
The following table sets forth, for the periods ended and dates indicated, certain information concerning the exchange rate for Swedish kronor to US dollars based information published by the Swedish Central Bank, orRiksbanken. No representation is made that Swedish kronor amounts have been, could have been or could be converted into US dollars, or vice versa, at such exchange rates or at any other rate. On April 10, 2003, the rate was $1.00 = SEK 8.49.
| | Swedish kronor per one US dollar
|
|---|
Year ended December 31,
| | Period
End(1)
| | Average
Rate(2)
| | High
| | Low
|
|---|
| 1997 | | 7.87 | | 7.67 | | 8.09 | | 6.86 |
| 1998 | | 8.07 | | 7.96 | | 8.35 | | 7.59 |
| 1999 | | 8.53 | | 8.27 | | 8.66 | | 7.71 |
| 2000 | | 9.54 | | 9.17 | | 10.33 | | 8.34 |
| 2001 | | 10.67 | | 10.33 | | 11.00 | | 9.27 |
| 2002 October | | 9.20 | | N/A | | 9.39 | | 9.20 |
| 2002 November | | 9.13 | | N/A | | 9.16 | | 8.96 |
| 2002 December | | 8.83 | | N/A | | 9.08 | | 8.81 |
| 2003 January | | 8.50 | | N/A | | 8.80 | | 8.50 |
| 2003 February | | 8.48 | | N/A | | 8.64 | | 8.42 |
| 2003 March | | 8.51 | | N/A | | 8.68 | | 8.38 |
| 2003 April (through April 10, 2003) | | 8.49 | | N/A | | 8.67 | | 8.48 |
- (1)
- Represents the exchange rate on the last business day of the applicable period.
- (2)
- Represents the average of the exchange rates on the last business day of each month during the relevant period.
European Monetary Union and Sweden's Currency Policy
On January 1, 2002, the euro replaced national currencies in the twelve member states of the EMU. Monetary policy with respect to the euro is conducted by the European Central Bank which sets interest rate policy for, and manages the foreign reserves of, the euro states.
Three members of the European Union, Denmark, Sweden and the United Kingdom have not adopted the euro.
3.B. Capitalisation and Indebtedness
Not applicable.
3.C. Reasons for the Offer and Use of Proceeds
Not applicable.
I-14
3.D. Risk Factors
Set forth below is a description of certain risks that may affect our business, financial condition and results of operations from time to time.
This annual report contains certain forward-looking statements concerning, among other things, our revenue and Adjusted EBITA margin targets, as well as expected cost savings and operating efficiencies in connection with our cost reduction programme, known as "Beyond Expectations". These forward-looking statements are subject to risks and uncertainties that could cause actual revenue targets, Adjusted EBITA targets, cost savings and operating efficiencies to be substantially lower than those expressed or implied by such statements.
We have set as a target for our revenue growth that we should outperform the markets in which we operate over the course of the business cycle. In addition, we have set an Adjusted EBITA margin target of greater than 12%. This financial target requires that we obtain certain cost savings and operating efficiencies we expect to achieve from our Beyond Expectations restructuring programme. Our cost reduction programme, the implementation of which commenced in late 1999 and which is expected to be completed by the end of 2003, is estimated to generate cost savings and other operating efficiencies of approximately SEK 800 million to SEK 1,000 million by the end of 2003 on an annualised basis. While some of these cost savings and operating efficiencies, and the costs incurred in achieving them, have been recorded to date and are reflected in our results for the years ended December 31, 2001 and 2000, respectively, a significant portion of such cost savings and operating efficiencies, and the costs incurred in achieving them, have not yet been recorded. The discussion under "Item 5.A: Operating and Financial Review and Prospects—Operating Results—Our Restructuring and Cost Reduction Programme—Beyond Expectations" describes generally our revenue and Adjusted EBITA margins targets, together with the cost savings and operating efficiencies attributable to the Beyond Expectations programme, as well as the expected costs incurred in achieving such savings and efficiencies, to the extent not already recorded in our financial results. There can be no assurances, however, that such revenue targets, Adjusted EBITA margin targets, cost savings and operating efficiencies actually will be realised.
Our operating results, including our revenues, operating income, EBITA, Adjusted EBITA and cash flows, could be harmed during economic downturns as demand for our products and services is reduced. This, in turn, could affect our ability to make payments due to you on the Senior Notes.
The businesses of most of our industrial customers, particularly those operating within the marine and oil and gas production industries are, to varying degrees, cyclical and have experienced periodic downturns. Margins in those industries are sensitive to demand cycles, and our customers in those industries historically have tended to delay large capital projects, including expensive maintenance and upgrades, during economic downturns. For example, due to the simultaneous decline in oil and chemical prices in 1998 and 1999, as well as a decline in ship construction, many of our key customers reduced their capital spending, which resulted in declines in our revenues, operating income, EBITA, Adjusted EBITA and cash flows during those years. These industry downturns led to diminished product demand and excess manufacturing capacity.
Any significant downturn in our customers' markets or in general economic conditions could result in a reduction in demand for our products and services and under-utilisation of our facilities. Historically, we have experienced the negative impact of an economic downturn between 6 to 12 months after the onset of the decline. Since our personnel costs constitute a significant component of our operating expenses and these costs, as well as the cost of our facilities, are fixed at the commencement of each financial period, under-utilisation of our personnel and our facilities will negatively impact our revenues, operating income, EBITA, Adjusted EBITA and cash flow. This, in turn, could affect our ability to make payments due to you on the Senior Notes. Our business is also affected by the seasonality of end-user markets and invoicing, more fully discussed under "Item 5.A:
I-15
Operating and Financial Review and Prospects—Operating Results—Seasonality of end-user markets and invoicing".
The markets for our products are highly competitive. If we do not respond effectively and on a timely basis to changes in the industries we serve, our competitiveness may be affected and our business could suffer. We may also experience pricing pressure as a result of competition.
The markets for many of our products are highly competitive, especially as to product quality, product price, reliability of product supply, technical support and service. From time to time, we experience pricing pressure as a result of competitive pressures. To remain competitive, we will need to continue to invest in manufacturing, research and development, marketing, customer service and support and our distribution networks. We may not have sufficient resources to continue to make these investments and we may not maintain our competitive position. Our competitors include large, integrated companies that may have access to greater financial and other resources than we do. See "Item 4.B: Information about the Company—Business Overview—Competition" where the competition we face in our business is more fully described.
We may not be able to continue to increase our sales as a result of our recent corporate and operational reorganisation. This may have a material adverse effect on our results of operations.
Following the completion of our recent corporate and operational reorganisation, additional sales are dependent upon our ability to develop the necessary implementation plans, commit the necessary personnel and rationalise our workforce and operations to establish an integrated business focusing on our customers. In addition, as part of our recent reorganisation, we have integrated and centralised various systems and processes, such as management information, accounting and information technology systems. We may not be able to fully and successfully recognise any expected benefits from our reorganisation and consequently we may not be able to increase our sales. As a result, there may be a material adverse effect on our results of operations.
We are exposed to economic, political and business risks associated with international sales and operations. If we do not address these risks in a cost-effective manner, the growth of our operations may be limited, our operating margins could be reduced and our business, operating results and financial condition could materially adversely affected.
As we sell our products worldwide, our business is subject to risks associated with doing business internationally. Accordingly, our future results could be harmed by a variety of factors, including, but not limited to:
- •
- changes in a specific country's or region's political or economic conditions, particularly in the emerging markets;
- •
- trade protection measures and import or export licensing requirements;
- •
- potentially negative consequences from changes in tax laws;
- •
- difficulty in staffing and managing global operations;
- •
- stringent labour regulations;
- •
- inadequate protection of intellectual property;
- •
- unexpected changes in regulatory requirements; and
- •
- state-imposed restrictions on repatriation of funds.
We manufacture and distribute our products in many countries around the world. We are confronted with different legal and regulatory requirements in many jurisdictions. These include tariffs
I-16
and trade barriers, requirements relating to withholding taxes on remittances and other payments by subsidiaries and different regimes controlling the protection of our intellectual property. Our international operations also expose us to different local business risks and challenges. We are faced with potential difficulties in staffing and managing local operations. We have to manage credit risks of local customers and distributors. Our expansion in emerging markets requires us to respond to rapid changes in market conditions in these countries. Therefore, our overall success as a global business depends, in part, upon our ability to succeed in differing economic, social and political conditions.
We may not be able to succeed in developing and implementing policies and strategies that are effective in each location where we do business. If we fail to address the risks associated with our international operations in a cost-effective and timely manner, the growth of our operations may be limited, our operating margins could be reduced and our business, operating results and financial condition could be materially adversely affected.
Our operations depend on certain raw materials, the prices for which are volatile, and we depend on certain suppliers for those raw materials. Shortage of, or price increases for, supplies could harm our ability to manufacture and sell our products.
We rely on raw materials such as stainless steel, carbon steel, copper and titanium for the manufacture of our products. Shortages of supply have occurred in the past and may occur in the future. We depend on three suppliers for titanium and are subject to a substantial lead time in ordering and obtaining titanium from sources other than our key suppliers. The number of titanium suppliers is limited and a change of suppliers could cause a delay in manufacturing products such as our large heat exchangers, increase our costs and result in a loss of sales. Shortages of, or price increases for, supplies could have a material adverse effect on our ability to manufacture and sell certain of our products in a timely and cost-effective manner.
Prices under these contracts for raw materials are negotiated on a six-month or yearly basis. We also purchase raw materials directly on the spot market. Spot prices fluctuate and may be significantly less than or significantly greater than the prices we pay for our raw materials under long-term agreements. While we seek to balance increases in raw material costs with corresponding increases in the prices of our products, there have been in the past, and may be in the future, periods of time during which we cannot recover cost increases. These failures to recover costs can result in part because of competitive pressures, the timing of changes to the prices of raw materials and because at times, in certain markets, over-capacity prevents selling prices from being raised. Cost decreases are generally reflected more quickly in our sales prices than cost increases due to competitive pressures.
We are exposed to the risk of currency fluctuations in many countries and these fluctuations may have a material effect on our results of operation and financial position. Currency fluctuations may also affect the comparability of our results between financial periods.
Our operations are conducted by in approximately 100 countries. The results of the operations and the financial position of these subsidiaries are reported in the relevant foreign currencies and then translated into Swedish kronor at the applicable exchange rates for inclusion in our consolidated financial statements which are stated in Swedish kronor. The exchange rates between these currencies and the Swedish kronor in recent years have fluctuated significantly and may in the future fluctuate significantly. These fluctuations have had in the past, and may have in the future, a material effect on our results of operations and financial position and may significantly affect the comparability of our results between financial periods.
I-17
In addition, we incur currency transaction risk whenever one of our operating subsidiaries enters into a transaction using a different currency than its functional currency. We attempt to reduce currency transaction risk by:
- •
- matching cash flows and debt in the same currency;
- •
- foreign currency borrowing; and
- •
- entering into foreign exchange contracts for hedging purposes.
However, we may not be able to hedge this risk completely or at an acceptable cost, which may adversely affect our results of operations and financial condition. See "Item 11.A: Quantitative and Qualitative Disclosures About Market Risk—Foreign Currency Exchange Rate Exposure".
Principal and interest on the Senior Notes will be payable in euros. Our ability to pay interest and principal on the Senior Notes when due is in part dependent on the then current exchange rates between euros, on the one hand, and the Swedish kronor and other European, as well as US and Asian currencies that our sales are denominated in, on the other hand, which rates are and will be subject to fluctuation. Exchange rate fluctuations may have a material adverse effect on our results of operations and financial condition and therefore on our ability to make principal and interest payments on our debt, including the Senior Notes, when due.
We may have liabilities associated with the pending Desert Storm litigation. If we are found liable for the claims, our financial condition could be materially adversely affected.
Some of our subsidiaries, along with approximately 70 other defendants, have been sued in lawsuits in the United States arising from claims related to injuries allegedly suffered in the Gulf War in 1991, also known as Desert Storm. These two lawsuits were initiated in 1994. The lawsuits claim damages in excess of $1 billion each and allege that equipment supplied by our subsidiaries, among other defendants, was used to manufacture Iraqi chemical and/or biological weapons. While we consider our liability remote in these cases, litigation is impossible to predict and we may be found liable for these claims, which could have a material adverse effect on our financial condition. See "Item 8.A: Financial Information—Legal Proceedings" for further information regarding this litigation and for a description of the indemnification provisions set forth in the Share Sale and Purchase Agreement between us and Tetra Laval B.V. in respect of this litigation.
We may in the future face large liability and breach of contract claims for defective products which may cause us to lose revenues, cause a delay in market acceptance of our products or harm our reputation. These claims could also be costly and time-consuming to defend.
We are subject to litigation in the ordinary course of our business. Except as described in the previous risk factor, we are not engaged in and do not foresee, at the present time, any litigation that we believe could have a material adverse effect on our financial condition or results of operations. However, litigation having a material adverse effect on our financial condition or results of operations may arise in the future and this may adversely affect our reputation, cause us to lose revenues, cause a delay in the market acceptance of our products and adversely affect our ability to make principal and interest payments on our debt, including the Senior Notes. Our businesses expose us to possible claims for personal injury, death, property damage, breach of contract or other product liability claims which could result from a failure of a product we manufactured or of a product integrated into a product we manufactured, particularly in relation to our high-speed separators. Many factors beyond our control could lead to liability claims, including, but not limited to:
- •
- the failure of a product manufactured by a third party which incorporated components manufactured by us;
I-18
- •
- the reliability and skills of persons using our products or the products of our customers;
- •
- the use of our products that we produce for applications for which our product was not designed; and
- •
- the failure of a product manufactured by a third party whose products we later acquire. See "Item 8.A: Financial Information—Legal Proceedings" for a description of court proceedings initiated against us by the Amylum Group.
These claims could also cause damage to our reputation. Although we test our products extensively and our products are manufactured to industry standards, we have obtained insurance coverage for most of these types of liabilities and we believe that this insurance coverage is adequate. We could, however, be required to pay a material amount if a claim is made against us that is not fully covered by insurance and no third party is required to indemnify us or if a third party fails to indemnify us. Litigation involving significant product recalls or product liability could have a material adverse effect on our financial condition or results of operations. For a discussion of our litigation matters, see "Item 8.A: Financial Information—Legal Proceedings".
Environmental compliance costs and liabilities could adversely affect our financial condition and this, in turn, may adversely affect our ability to make principal and interest payments on our debt, including the Senior Notes.
Our operations and properties are subject to increasingly stringent laws and regulations relating to environmental protection, including laws and regulations governing air emissions, water discharges, waste management and workplace safety. These laws and regulations can impose substantial fines and sanctions for violations and require the installation of costly pollution control equipment or operational changes to limit pollution emissions and/or decrease the likelihood of accidental hazardous substance releases. We must conform our operations and properties to these laws, and adapt to regulatory requirements in all countries as these requirements change.
We use and generate hazardous substances and wastes in our manufacturing operations. In addition, many of our current and former properties are or have been used for industrial purposes and we have arranged for disposal of wastes at third-party disposal sites. Under certain environmental laws, liability for response actions at contaminated sites, including buildings and other facilities, is strict, and in some cases, joint and several. We may be subject to potentially material liabilities relating to the investigation and clean-up of contaminated areas, including groundwater at properties now or formerly owned, operated or used by us, and to claims alleging personal injury or damage to natural resources.
We have experienced, and expect to continue to experience, operating costs to comply with environmental laws and regulations. In addition, new laws and regulations, stricter enforcement of existing laws and regulations, the discovery of previously unknown contamination or the imposition of new clean-up requirements could require us to incur costs or become the basis of new or increased liabilities that could have a material adverse effect on our business, financial condition or results of operations and this may adversely affect our ability to make principal and interest payments on our debt, including the Senior Notes.
Our business could suffer if we are unsuccessful in negotiating new collective bargaining agreements. Strikes and other industrial actions could disrupt our operations or make it more costly to operate our facilities.
As of December 31, 2002, we had approximately 9,125 employees, the majority of whom are represented by unions. The majority of our material collective bargaining agreements with these unions range from one to five years in duration. We may not be successful in negotiating new collective bargaining agreements. Moreover, negotiations may result in significant increases in the cost of labour
I-19
or a breakdown in negotiations leading to a disruption of our operations. Any such action could have a material adverse effect on our results of operations.
Third parties may infringe our intellectual property, and we may expend significant resources enforcing our rights or suffer competitive injury, which could harm our operating results and, in turn, our ability to make principal and interest payments on our debt, including the Senior Notes.
Our success depends in part on our proprietary technology. We rely on a combination of patents, copyrights, trademarks, trade secrets and confidentiality provisions to establish and protect our proprietary rights. If we fail to successfully enforce our intellectual property rights, our competitive position could suffer, which could harm our operating results. We may be required to spend significant resources to monitor and protect our intellectual property rights.
Failure to continue to pursue product innovation would impair our future growth and competitive position. As a result, there could be a material adverse affect on our business, financial position and results of operations and this may affect our ability to make payments of principal and interest on our debt, including the Senior Notes.
Our business experiences technological change, ongoing product improvements and obsolescence of existing products, leading to the introduction of new products or production processes. Our future growth will depend on our ability to gauge the direction of the commercial progress in all key markets and upon our ability to successfully develop, manufacture, market products and sell products in these changing markets. We will have to continue to identify, develop, market and sell innovative products on a timely basis to replace existing products in order to maintain our competitive position.
We intend to devote significant resources to the development of new products and intend to continue to devote a substantial amount of spending to the research, development and technology process functions of our business. However, we may not be successful in developing new products or new products may not be accepted by our customers. If we fail to keep pace with the innovations in our markets, then there could be a material adverse affect on our business, financial position and results of operations and this may affect our ability to make payments of principal and interest on our debt, including the Senior Notes.
Our substantial amount of debt could hurt our financial health and stop us from fulfilling our obligations under our Senior Notes.
We have a significant amount of debt. As of December 31, 2002, we had total consolidated debt of SEK 4,519 million. If we had drawn down all amounts available under our revolving credit facility, the maximum amount of debt that would have been outstanding at December 31, 2002 would have increased by SEK 1,374 million to SEK 5,893 million.
Our annual debt service based on the outstanding debt at December 31, 2002 is SEK 538 million in interest expense and interest payments. The Existing Senior Credit Facility is amortisation free. The committed principal amount for 2002 under the Previous Senior Credit Facility was SEK 89 million. Actual repayments for 2002 totalled SEK 1,760 million. Through April 10, 2003, actual repayments totalled SEK 228 million.
Our Senior Notes have a fixed charge of 12.125%. We are not required to maintain hedging under the terms of the Existing Senior Credit Facility. If the interest rate is increased by 1 percentage unit on all loans with a floating interest charge, our annual debt service cost will increase by SEK 16 million.
I-20
Our substantial debt could have important consequences to you as a holder of the Senior Notes. For example it could:
- •
- limit our ability to obtain additional financing in order to fund future working capital requirements, capital expenditures, acquisitions or other needs;
- •
- require that a substantial portion of our cash flow from operations be dedicated to making periodic payments with respect to principal and interest on our debt, thereby reducing the funds available for operations and future business opportunities;
- •
- restrict our use of funds we acquire through asset dispositions or which constitute excess cash flow;
- •
- require us to maintain specified financial ratios;
- •
- increase our vulnerability to adverse economic and industry conditions;
- •
- limit our flexibility in planning for, or reacting to, changes in our business and the industry in which we operate; and
- •
- place us at a comparative disadvantage compared to our competitors with less debt.
In addition, since all the borrowings under our Existing Senior Credit Facility will be at variable rates of interest, we will be required to make larger payments if interest rates increase.
Our ability to make scheduled payments of the principal of, to pay interest on or to refinance our debt, including the Senior Notes, and to make payments on our other obligations depends on our future performance. Furthermore, we expect that we will need to refinance all or a part of the Senior Notes at final maturity. Certain aspects of our future performance are subject to economic, financial, competitive and other factors beyond our control. We may not be able to generate sufficient cash flow from operations in the future to service our debt and make necessary capital expenditures. If we fail to do so, we may be required:
- •
- to refinance some or all of our existing debt;
- •
- to sell assets in order to make debt service payments; or
- •
- to obtain additional financing.
We may not be able to undertake any of these refinancings, sell any of our assets or obtain additional financing, particularly as our Existing Senior Credit Facility contains a covenant restricting disposals of assets.
If we fail to comply with the payment requirements of any of our debt, including the Senior Notes, it could lead to the acceleration of the related debt and the acceleration of debt under other debt instruments containing cross acceleration or cross default provisions. If this occurred, we might not be able to refinance or otherwise repay this debt.
Despite current debt levels, we may still be able to incur substantially more debt, which may be senior to the guarantee and the Senior Notes and this could further exacerbate the risks described above.
We and our subsidiaries may be able to incur substantial additional debt in the future. If additional debt is added to our current debt levels, the risks that we now face could intensify. The terms of the indenture restrict but do not fully prohibit us and our subsidiaries from borrowing. The additional debt we incur could be secured and debt of the Guarantor could be senior to the guarantee and the Senior Notes. Debt incurred by our subsidiaries, other than the Guarantor, will be senior in right of payment to the Senior Notes. If we incur additional debt, the related risks described above that we face could intensify.
I-21
We depend on payments from our subsidiaries to make payments on the Senior Notes. Our subsidiaries may not generate cash flow sufficient to enable us to meet our payment obligations on the Senior Notes. In addition, our Existing Senior Credit Facility restricts our subsidiaries' ability to provide funds to us and we may be unable to pay you amounts due on the Senior Notes.
Our only assets are shares in our wholly owned subsidiary, the Guarantor, and an intercompany loan to the Guarantor. Our cash flow and our ability to service the Senior Notes and any other debt depend solely upon the cash flow of our subsidiaries and our receipt of funds from them in the form of loans, dividends, interest or otherwise. Our subsidiaries may not generate cash flow sufficient to enable us to meet our payment obligations. Our subsidiaries have debt that is senior to the Senior Notes aggregating to SEK 3,391 million.
In addition, the terms of the Existing Senior Credit Facility restrict our subsidiaries' ability to provide funds to us. See "Item 5.B: Operating and Financial Review—Liquidity and Capital Resources". This ability may be further restricted by applicable laws and regulations and the terms of other agreements to which our subsidiaries may become subject. In particular, the Intercreditor Agreement for the Existing Senior Credit Facility restricts payments under the intercompany loan. Payments to us under this loan, and therefore payments under the guarantee in relation to the Senior Notes, may also be suspended in the case of a payment default under the senior credit facilities until the payment default is remedied and, in the case of a non-payment default, are subject to standstill provisions for up to 179 days.
The Intercreditor Agreement permits us, subject to certain restrictions, to make payments of principal on the Senior Notes.
None of our operating subsidiaries are guarantors of our obligations under the Senior Notes and your rights to receive payments on the Senior Notes may be affected if any of our non-guarantor subsidiaries declare bankruptcy, liquidation or reorganises.
We expect to obtain the money to pay the principal and interest on the Senior Notes from our operating subsidiaries. We are a holding company that does not conduct any business operations. Accordingly, the Senior Notes are structurally subordinated to the obligations of our subsidiaries other than the Guarantor, which guaranteed the Senior Notes on a senior subordinated basis. Our subsidiaries are separate and distinct legal entities. Other than the Guarantor, which is also a holding company, our subsidiaries will have no direct obligation, contingent or otherwise, to pay any amount due under the Senior Notes or to make any funds available to us to allow us to make those payments. In the event of an insolvency, liquidation or other reorganisation of any of our subsidiaries, our creditors (including you) will have no right to proceed against their assets. Creditors of these subsidiaries, including lenders under the terms of the Existing Senior Credit Facility, will be entitled to payment in full from the sale or other disposal of these assets before we, as a shareholder, would be entitled to receive any distribution therefrom, except to the extent that we may be a creditor with recognised claims against these subsidiaries. Moreover, the guarantee of our obligations by the Guarantor ranks behind, and is subordinated to, all of its existing and future obligations under the Existing Senior Credit Facility and can be subordinated, at our designation, to other senior debt incurred by the Guarantor. Payments under the guarantee may be suspended in the case of a payment default under the Existing Senior Credit Facility until the payment default is remedied and, in the case of a non-payment default, are subject to standstill provisions for up to 179 days.
I-22
The terms of our debt, including the indenture pursuant to which our Senior Notes were issued, impose various restrictions on us. These restrictions may affect our ability to successfully carry out our business strategy which could materially and adversely affect our business, financial condition, results of operations and our ability to make payments of principal on interest on the Senior Notes.
The indenture under which our Senior Notes were issued and our Existing Senior Credit Facility restrict our ability to, among other things:
- •
- borrow money;
- •
- pay dividends on, make distributions on or repurchase shares;
- •
- make certain investments;
- •
- create liens on our assets to secure debt;
- •
- substitute another person as issuer of the Senior Notes;
- •
- sell assets, including the capital stock of certain of our subsidiaries and any other property or assets that are sold other than in the ordinary course of business, or merge with or into other companies;
- •
- enter into transactions with affiliates; and
- •
- enter into joint ventures.
These restrictions may adversely affect our ability to carry out our business strategy and could materially and adversely affect our business, financial condition or results of operations. This could affect our ability to make payments of principal or interest on the Senior Notes as those payments become due. A breach of the covenants of the indenture under which the Senior Notes were issued could cause a default under the terms of the other financings of our subsidiaries, causing all debt under those financings to become due.
The Existing Senior Credit Facility requires us, to meet certain financial tests and ratios. We may not be able to meet these tests for reasons beyond our control, which would trigger an event of default under that facility even if we could still continue to make payments to you on the Senior Notes.
A change in the estimated useful life, or a write-off, of goodwill could negatively affect our operating results and net worth.
A change in the estimated useful life of goodwill or the write-off of a portion of goodwill could negatively affect our operating results and net worth. The Acquisition and the related financing resulted in the recognition of a substantial amount of goodwill. At December 31, 2002, goodwill totaled SEK 3,369 million, compared to total assets of SEK 15,427 million and shareholders' equity of SEK 4,413 million. We have estimated the useful life associated with goodwill to be 20 years. Subsequent changes in the industries in which we operate, including competition and advances in technology, may in the future shorten the estimated useful life of goodwill or result in the write-off of a portion of goodwill, which would have a material adverse effect on our earnings.
Industri Kapital 2000 controls us, and its interests may conflict with yours. Industri Kapital 2000 may take actions that prevent or hinder us from making payments on the Senior Notes.
Industri Kapital 2000 is the beneficial owner of approximately 26.9% of the shares of Alfa Laval AB, our parent holding company, which owns 100% of our outstanding share capital. Consequently Industri Kapital 2000 can affect our strategic decisions, our legal and capital structure and our day-to-day operations.
I-23
If circumstances arise where Industri Kapital 2000's interests conflict with your interests—if, for example, we were to encounter financial difficulties or were unable to pay our debts as they matured—you could be disadvantaged by Industri Kapital 2000's ability to take actions contrary to your interests. In addition, Industri Kapital 2000 may benefit if we pursue acquisitions, divestitures, financings, currency exchange or interest rate hedging or other transactions that, in their judgement, could enhance the value of their equity investment, even though these transactions might involve risk to holders of the Senior Notes.
Tetra Laval is our largest customer based on net sales. If we fail to retain Tetra Laval as a customer and/or distributor for our products and services, our business and financial condition could be adversely effected.
For the year ended December 31, 2002, approximately 5.7% of our net sales were attributable to direct sales to Tetra Laval. If our sales to or through Tetra Laval were to significantly decrease, we may not be able to offset this decrease through a corresponding increase in sales to or through other customers and distributors, and such decrease, over time, could have a material adverse effect on our business, financial condition or results of operation.
If we, the Guarantor or any of our Swedish operating subsidiaries incur substantial operating losses, we or they may be subject to liquidation under Swedish law.
The various Companies Acts and insolvency and reorganisation laws of Sweden apply to us, the Guarantor and our and the Guarantor's Swedish subsidiaries. Under this regime, if losses reduce our equity or the equity of certain of our subsidiaries, on a stand-alone rather than a consolidated basis, to an amount less than 50% of our or their registered share capital, or if the equity becomes inadequate compared to the risks and the size of its business, the directors of the entity concerned would be obligated by law to convene a general shareholders meeting to resolve to liquidate the entity unless the directors were able to balance the amount of the equity and share capital by increasing the equity in an amount sufficient to achieve the balance and to ensure that its equity becomes adequate compared to the risks and the size of its business, or reducing the share capital to pay off losses in an amount sufficient to achieve the balance, provided, however, that its equity remains adequate compared to the risks and the size of its business. Similar regimes exist in other jurisdictions in which we have subsidiaries.
Fraudulent conveyance laws of the Kingdom of Sweden may protect our creditors to your disadvantage.
Under Swedish law relating to fraudulent conveyance, it is possible that other creditors may claim that payments to you under the Senior Notes or the guarantee should be voided because they were fraudulent conveyances.
Under Swedish law, in the case of bankruptcy or company reorganisation proceedings affecting us, the payments to you under the Senior Notes or the guarantee, which have been made less than three months (or two years if effected to a related party) before the application for bankruptcy or company reorganisation proceedings was filed with the competent court may, in certain situations, be recovered if the payment has been carried out:
- •
- using unusual means of payment;
- •
- prematurely; or
- •
- in an amount which has materially affected our financial position.
Payments which are deemed to be customary are, however, permissible.
A Swedish court could also determine that a fraudulent conveyance has taken place under the general provision on recovery in circumstances where a payment to you under the Senior Notes or the
I-24
guarantee could be revoked if an agreement, transaction or other act, such as the issuance of the Senior Notes or the guarantee was held to favour a creditor in an unsuitable manner to the detriment of another creditor or to transfer property out of the reach of the creditors or to increase the debt to the detriment of the creditors, provided that:
- •
- the debtor was insolvent at the time the agreement, transaction or other act was concluded or the transaction contributed to the debtor's insolvency; and
- •
- the other party knew or should have known of the insolvency or over-indebtedness or of the impact of the payment on the debtor's financing state as well as of the circumstances due to which the payment under the Senior Notes or the guarantee was unsuitable.
However, under Swedish law, if an agreement, transaction of other act was concluded earlier than five years before the application for bankruptcy or company reorganisation was filed, the payment to you under the Senior Notes or the guarantee could be revoked only if a party to the agreement, transaction or other act was someone related to the bankrupt or reorganised party such as a group company.
In addition, as we have operations all over the world, if any of our major subsidiaries were to enter bankruptcy proceedings, a court in that jurisdiction could prevent our subsidiaries from making payments to us, thereby possibly impairing our ability to pay the amounts due under the Senior Notes.
Your rights as a creditor may not be as strong under Swedish insolvency laws as under US or other insolvency laws and the Guarantor's and our liabilities in respect of the Senior Notes may rank after our debts which are entitled to priority.
The Guarantor's and our liabilities in respect of the Senior Notes may, in the event of bankruptcy or similar proceedings under Swedish insolvency law, rank after certain of our debts which are entitled to priority and after our debt to creditors with rights of set-off.
The business reorganisation laws of Sweden apply to us. Under an official business reorganisation, creditors may be forced to approve the terms of the business reorganisation. During a business reorganisation, we will not be allowed to fulfil any obligations incurred before the reorganisation with the permission of the bankruptcy administrator appointed by the local district court.
Furthermore, under Swedish laws there is no consolidation of bankruptcies of the assets and liabilities of a group of companies. Each individual company would thus be treated separately by a bankruptcy administrator appointed by the local district court. The assets of our subsidiaries would first be used to satisfy the debts of each respective subsidiary and only the remaining surplus (if any) would be available to our creditors. As a result, your ability to protect your interest as a creditor of a parent of a subsidiary may not be as strong under Swedish law as it would be under US law, or the laws of other countries.
I-25
ITEM 4: INFORMATION ABOUT THE COMPANY
The following is a description of the business operations of Alfa Laval Special Finance AB and its respective subsidiaries. The only substantial assets of Alfa Laval Special Finance AB are the capital stock of its subsidiaries. Such subsidiaries include the Guarantor, Alfa Laval Credit Finance AB, and Alfa Laval Holding AB, which holds several subsidiaries, including intermediate holding and operating companies.
4.A. History and Development of Alfa Laval Holding AB, the Company and the Guarantor
Alfa Laval was founded in 1883 as AB Separator by Gustav de Laval, the inventor of the first continuous separator, to produce and sell dairy cream separators. In 1901, Alfa Laval was listed on the Stockholm Exchange. In 1938, Alfa Laval introduced its first heat exchanger and in 1962 it expanded into the spiral heat exchanger market and introduced a series of industrial plate heat exchangers. In 1971 Alfa Laval entered into the sanitary flow business. In 1991, the Alfa Laval group was acquired and became privately owned by an entity within the Tetra Pak group, itself a privately owned group consisting of the industry groups De Laval and Tetra Pak. At the time, Alfa Laval consisted of three major lines of business:
- •
- a food division, including liquid food processing activities, which was subsequently merged into Tetra Pak;
- •
- an agricultural division, including farm equipment and systems, which is now De Laval, a subsidiary of the Tetra Laval Group; and
- •
- an industry division.
Alfa Laval's industry division at the time consisted of five principal business areas: Thermal, Separation, Flow, Automation and Dosing & Analysing. Dosing & Analysing was divested in 1993 and Alfa Laval Automation was divested in 1998. The remaining three business areas provided the basis for our internal organisational structure.
In August 2000, Industri Kapital 2000 and management completed the Acquisition of a majority shareholding in Alfa Laval from Tetra Laval B.V. Alfa Laval Special Finance AB, together with Alfa Laval AB, its parent company, were incorporated by Industri Kapital 2000, Tetra Laval B.V. and management on March 27, 2000 for the purposes of the Acquisition. The Guarantor, formerly known as Alfa Laval Bostadsförvaltning AB, was incorporated on October 11, 1926 and re-named Alfa Laval Credit Finance AB as part of the Acquisition of Alfa Laval Holding AB.
Our registered and principal executive offices are located at Rudeboksvägan 3, Lund, Sweden, and the telephone number at that address is +46 46 36 7000. Our agent in the United States is CT Corporation, 1633 Broadway, New York, New York 10019. We are a private company with limited liability incorporated under the laws of the Kingdom of Sweden.
The purchase price for the operations of Alfa Laval (conducted through Alfa Laval Holding AB and its subsidiaries) was SEK 8,286 million, including transaction costs of SEK 72 million. As part of the Acquisition, an excess purchase price of SEK 7,300 million was paid over the net book value of assets acquired. This excess purchase price was attributable to goodwill totalling SEK 3,277 million and the balance of SEK 4,023 million to tangible and intangible assets.
The Acquisition was financed, in part, by borrowings under a bridge loan facility which was subsequently refinanced through the issuance of our Senior Notes and a €200 million investment by Tetra Laval B.V. in Alfa Laval AB in the form of the Subordinated Loan. The balance was subscribed for in cash by Industri Kapital 2000 and management, and by Tetra Laval retaining ownership in Alfa Laval AB.
I-26
In connection with the Offering, the capital structure of the Alfa Laval Group was changed. See "Item 5.B: Operating and Financial Review and Prospects—Liquidity and Capital Resources—Liquidity Requirements".
For an illustration of our corporate organisation after the Acquisition and its financing, see "Item 4.C: Information on the Company—Organisational Structure".
Historic Capital Expenditures
In 2000, 2001 and 2002 we made investments in fixed assets of SEK 312 million, SEK 275 million and SEK 277 million respectively, in each case principally to maintain and upgrade our machinery and equipment. We also invested to increase our capacity for the production of brazed heat exchangers. An investment in additional plate pressing capacity and brazing furnaces at our Ronneby facility in Sweden and our Jiang Yin City facility in China commenced in late 2000 and was completed in 2002. Our investments in fixed assets for 2000 declined as we made the decision that we had sufficient production capacity to meet demand. Our investments in fixed assets in 2001 declined principally due to our divestment of a substantial number of properties, together with a reduction in the number of our production sites. In addition, we consolidated much of our I.T. infrastructure, which contributed to a reduction in expenditure on hardware. Among the larger investments during 2002 was an expansion of the production facility in Richmond, Virginia in the United States and capacity investments for manufacturing of brazed heat exchangers.
For a discussion of our divestitures, see "Item 5.A: Operating and Financial Review and Prospects—Operating Results—Acquisitions and Divestitures."
For a discussion of our current capital expenditure programme, see "Item 5.B: Operating and Financial Review and Prospects—Liquidity and Capital Resources—Commitments for Future Capital Expenditure".
4.B. Business Overview
Overview
We are a leading global provider of specialised process engineering solutions and equipment based on three key technologies—heat transfer, centrifugal separation and sanitary flow technology. Under our widely recognised brand name, Alfa Laval, we service our customers globally through ten distinct customer segments with an international sales force in over 100 countries. We were founded in Sweden in 1883 by Gustav de Laval, the inventor of the continuous separator. We are a market leader in our target markets of compact heat exchangers, centrifugal separators and sanitary flow equipment. Our products, which we sell individually and in combination with each other to form systems and solutions, are designed to optimise the performance of our customers' manufacturing processes, and as a result are often critical to them. For the year ended December 31, 2002, we had net sales of SEK 14,595 million, operating income of SEK 1,224 million, EBITA (as defined herein) of SEK 1,730 million and Adjusted EBITA (as defined herein) of SEK 1,760 million.
Our key technologies are as follows:
- •
- Heat transfer technology. Our heat exchangers are used in a variety of industries for applications such as heating, cooling, ventilation, evaporation and condensation of fluids. Due to the many applications in which heat exchangers can be used, we have a very large and geographically diversified customer base consisting of plant owners and operators of manufacturing facilities within industries such as marine, oil and gas production, refining, heating, ventilation and air conditioning, food processing and power generation. We believe, based on our market knowledge, that we are the market leader in plate heat exchangers in
I-27
We service over 20,000 customers through ten customer segments: Comfort & Refrigeration; Marine & Diesel; Sanitary; Fluids & Utility; OEMs; Food Technology; Energy & Environment; Process Industry; Water Technology; and Life Science Technology. Our customers are some of the world's leading blue-chip manufacturers, distributors and OEMs, such as Bayer, Coca-Cola, Exxon, Tetra Pak and Unilever. Through our customer segments, we cross-sell our systems and full product range, including our parts and services business, and develop customised solutions by identifying new applications for existing products, as well as developing new products.
Our customer segments are organised into two divisions, the Equipment division and the Process Technology division. In the Equipment division, we sell and market products to customers that have a well defined and regular product based equipment need, such as OEMs that require a large number of small plate heat exchangers for integration into boilers, diesel engines and air conditioning units. In the Process Technology division, we sell and market our customers with specialised or unique solutions for industrial systems and processes, such as for the production of beverages, dairy products, beer and vegetable oils, as well as the purification of fuel and lubricating oil within power plants.
Each of the Equipment and Process Technology divisions is responsible for the world-wide marketing and selling of our products, systems and parts and services with respect to their respective customer segments. Our global parts and services activities cover a broad range of activities, such as provision of parts, maintenance of equipment and systems, training of personnel and efficiency audits, and enables us to serve our customers' needs on a 24-hour basis. We derive an increasing amount of our revenue from the sale of parts and services, which typically generates a higher margin than the sale of our products, systems and or capital sales. Our Equipment and Process Technology divisions are also responsible for research and development for their respective customer segments. Supporting our organisation is an Operations division that performs centralised purchasing, logistics and manufacturing functions.
I-28
We have a diverse customer and geographic base, which we believe mitigates the impact of an economic downturn in any one part of the world or in any given industry. The following charts illustrate our sales by customer segment and by geographic region for the year ended December 31, 2002:
- (1)
- Excluding sales in relation to our parts and services business, which accounted for 27% of sales in 2002.
Our Competitive Strengths
We believe we have a number of competitive strengths which set us apart from our competitors, more fully described under "—Competition" below. These competitive strengths include:
- •
- Global market leadership in key technologies. We are a market leader in our target markets of compact heat exchangers, centrifugal separators and sanitary flow products, and we operate in attractive and growing segments of our target markets. Our technological leadership and focus on finding solutions to our customer needs makes us a natural choice for customers seeking a customised solution for their needs. Due to the need for proprietary design and manufacturing techniques, our products have high technological barriers to entry.
- •
- Diversification by customers and geographical presence. We serve over 20,000 customers. During 2002, our ten largest customers accounted for less than 10% of our net sales. Our products are sold separately or in combination to a wide variety of industries in over 100 countries. We believe that this customer and geographic diversity mitigates the impact of an economic downturn in any one part of the world or in any given industry.
- •
- Large base of installed products. Our base of installed products is of strategic importance to us as it provides a stable, recurring stream of parts and services revenues. Our installed base of heat exchangers and separators have a life span of 5 to 20 years and begin generating significant parts and services revenues after 5 to 10 years of use. In addition, our large installed base enables us to identify opportunities for repeat business.
- •
- Potential for margin expansion and strong cash flows. Since the Acquisition, our management has established a successful record of cost reduction and margin expansion, evidenced in having increased operating margins from 1.7% in 1999 to 8.4% in 2002 and Adjusted EBITA margins from 6.5% in 1999 to 12.1% in 2002. Our continuing focus on cost reduction through the implementation of our "Beyond Expectations" programme provides us with a strong potential for further margin improvement in the near future. This focus, combined with the low capital intensity of our business, generates strong cash flows which provide a stable basis from which to realises our future growth potential.
I-29
- •
- Future growth potential. Our focus on customer segments provides significant opportunities to grow revenues as it enables us to cross-sell our products, systems and services and strengthens our market position, for example by identifying more customers through these segments. We also have a solid base of business from which to leverage in the fast growing markets such as China and India. Additionally, our recently established business development function will help us to pursue growth through selective acquisitions, joint ventures and alliances in areas related to our existing business.
- •
- Premium brand name. The Alfa Laval brand is a widely recognised global brand and we believe that customers around the world associate our brand with characteristics such as reliability, superior product quality and high performance. Our reputation for quality and performance, along with the critical nature of our products for our customers' manufacturing processes, enhances our competitiveness and provides us with a solid foundation for future growth.
Our Strategy
Our strategic objective is to grow shareholder value by delivering growth and continuous improvement in our activities. In order to achieve our strategic objective we intend to focus on the following strategies:
Growth
- •
- Focus on individual customer segments. In 2001, we reorganised into ten customer segments within our two principal business divisions, allowing us to increase our focus on our customers and their particular needs for service. We believe that this has enabled us to respond quickly and effectively to different customers' needs with a range of systems solutions, from individual pieces of equipment to tailored packages that combine high-quality equipment with process knowledge and expertise. By focusing on customer segments, we will be able to cross-sell our existing products, systems and solutions, facilitate the development of new applications and existing products, and expand the use of existing products, systems and solutions in new markets. We will continue to focus on customer segments and seek to enhance our presence and sales with each of our customers.
- •
- Expand the parts and services business. We intend to continue to expand our higher margin, stable and recurring parts and services business. As part of this strategy, we have now established a more focused parts and services function within our two divisions. We will continue to leverage off our substantial installed base of heat exchangers and centrifugal separators, many of which consume spare parts and require servicing throughout their typical life span of approximately 5 to 20 years. We intend to increase the level of our parts and services business by more effectively tracking our installed base of equipment and by selling ongoing customer service contracts along with our products and systems and at the time of their original sale. We believe that by emphasising parts and services we can improve margins with limited additional capital investment. Our focus on the parts and services business is reflected in the increased contribution of this business from 22% of net sales in 1999 to 27% of net sales in 2002.
- •
- Develop new industry applications. We continue to work on providing our customers with efficient and high-quality products. We intend to continue developing our sales by improving existing products and by identifying new applications for existing products. For example, we have recently leveraged our leading position as a supplier of marine-based desalination systems in order to enter the market for land-based desalination technology. Moreover, we are also working with OEMs to develop new industry applications in a variety of areas, including for use in refrigerators and diesel engines.
I-30
- •
- Seek new growth opportunities. We will seek new growth opportunities through strategic add-on acquisitions, joint ventures and alliances in areas related to our existing businesses with a view to broadening our services and product lines. For this purpose, we have established a dedicated business development function within our organisation. We also intend to focus on leveraging our existing strong market positions in certain fast growing emerging markets, such as China and India. We also intend to capitalise on demand for our products, systems and services driven by environmental, legislative and technological advances.
Continuous improvement
- •
- Reduce our cost base. We will continue our efforts to reduce our cost base and increase our operating margins, EBITA margins and Adjusted EBITA margins by consolidating and reducing excess manufacturing capacity, reducing headcount, increasing the outsourcing of certain components and shifting certain production to lower cost manufacturing countries. We will continue to restructure our sales and distribution organisation with the goal of reducing overhead costs by centralising shared services. We aim to achieve further cost savings through various initiatives in purchasing, as well as seek savings in our day to day non-production related activities. In addition, we plan to streamline our inventory management by consolidating and eliminating inventory from our sales companies to a few strategically located centres. Through our continuing cost reduction activities, we have successfully increased our Operating margin from 1.7% in 1999 to 8.4% in 2002, EBITA margin from 6.7% in 1999 to 11.9% in 2002 and Adjusted EBITA margin from 6.5% in 1999 to 12.1% in 2002.
Equipment Division
The following table sets forth details of our five customer segments, their principal end-user markets and their representative customers within our Equipment division. The Parts and Services segment for both the Equipment division and the Process Technology division constitutes the tenth customer segment within Alfa Laval.
Customer Segment
| | End-User Markets
| | Representative Customers
| | % of
2002
Sales
|
|---|
| Sanitary | | Dairy, food products and beverages, pharmaceutical and healthcare industries | | Nestlé, Coca Cola, Procter & Gamble, Tetra Pak | | 26% |
Comfort & Refrigeration |
|
Heating, cooling, air conditioning and refrigeration industry |
|
Uppsala Energi, Climespace, York, Mycom |
|
23% |
Marine & Diesel |
|
Shipping, ship building and power generation industries |
|
Hyundai, Finncantieri, Wärtsila |
|
17% |
OEM Equipment |
|
Manufacturing (diesel engines, boilers, air conditioning, air dryer and condensing unit) industry |
|
Vaillant, Caterpillar, Carrier |
|
7% |
Fluids & Utility |
|
Manufacturing (automotive, metal working and electronic) industry |
|
GM, Scania, Daimler Chrysler, Samsonite |
|
3% |
| | | | | | |
|
| Total Capital Sales | | 76% |
| Parts and Services | | 24% |
| | | | | | |
|
| Total | | 100% |
| | | | | | |
|
I-31
Our Equipment division, employing 2,058 personnel as of December 31, 2002 and accounting for SEK 8,130 million, or 55%, of our total net sales in the year ended December 31, 2002, serves customers who typically have a well-defined and regular need for our products and require more component-type products. Our Equipment division utilises multiple distribution channels to generate sales, including its direct sales force, distributors, strategic partners (including Tetra Pak), OEMs (such as boiler manufacturers) and the Internet, all as more fully described under "—Marketing and Distribution" below. In 2002, approximately 41% of net sales in our Equipment division were related to our heat transfer technology, approximately 28% to our sanitary flow equipment, and approximately 22% to our centrifugal separation technology and approximately 9% to other proprietary equipment
Sanitary. The Sanitary customer segment is focused on the provision of fluid handling equipment to the dairy, beverage, food and pharmaceutical industries. These industries are characterised by stringent safety and hygiene requirements. Our heat exchangers, pumps, valves, installation and tank equipment are used to heat, pump, regulate, process and transport fluid products such as milk, cheese, yoghurt, soft drinks, beer, processed food, skin lotions, shampoo and medicine. Transporting and directing such liquids safely and efficiently is critical to our customers' processes. We believe we are a significant supplier of hygienic fluid handling equipment, manufacturing a comprehensive range of pumps, valves and fittings.
Comfort & Refrigeration. In the Comfort & Refrigeration customer segment, we sell our heat exchangers to a broad spectrum of customers, ranging from large multinational companies to one-man installation firms, principally for use in the context of indoor climate control, refrigeration and industrial cooling processes. In particular, our welded plate heat exchangers are suitable for extremely high temperatures and pressures and can be used in place of shell and tube technology. We believe our brazed heat exchangers for evaporation and condensation have a well-established performance record in the market.
Marine & Diesel. In the Marine & Diesel customer segment, we are a significant supplier of separators, compact heat exchangers and fresh-water generators, which we sell to ship yards and diesel engine manufacturers. We believe that more than half of all ships in service are equipped with our equipment, giving us a leading market position in this sector. Our equipment is used for fuel and lubricating oil cleaning processes and engine cooling and fresh water production.
OEM. In the OEM customer segment, we have close relationships with manufacturers of medium and high-speed diesel engines, air conditioning units and boilers, who typically integrate our products, such as our small brazed heat exchangers into their units. We aim to build alliances with these manufacturers in order to undertake joint development programmes for new products. We are a significant supplier of small brazed heat exchangers to the boiler manufacturing industry, brazed heat exchangers to the air-conditioning industry and gasketed heat exchangers to the diesel engine manufacturing industry.
Fluids & Utility. In the Fluids & Utility customer segment, our knowledge of heating, cooling and separation is focused on a limited number of industries, principally the automotive, metalworking and electronic and plastic products industries. These industries typically use our heat exchangers, separators and sanitary flow products for temperature control and for the cleaning of hydraulic and lubricating oils.
Process Technology Division
The following table sets forth details of our four customer segments, their principal end-user markets and their representative customers within our Process Technology division. The Parts and Services segment for both the Process Technology division and the Equipment division constitutes the tenth customer segment within Alfa Laval. The former Water Technology segment has been dissolved
I-32
and its sales activities have been assumed by mainly the Energy and Environment customer segment, and, to a lesser extent, by the Process Industry customer segment.
Customer Segment
| | End-User Markets
| | Representative Customers
| | % of
2002
Sales
|
|---|
| Food Technology | | Food products, protein and beverage industries | | Anheuser-Busch, ADM, Heineken | | 22% |
Process Industry |
|
Chemical, petrochemical and natural resources (sugar, starch and yeast) industries |
|
BASF, Bayer, Cargill, |
|
21% |
Energy and Environment |
|
Waste-water treatment, oil, gas and power industry, land based desalination industry |
|
General Electric, Exxon, Statoil, City of Chicago, Mitsubishi (power plants), Siemens |
|
22% |
Life Science Technology |
|
Biotech and pharmaceutical industry |
|
Eli Lilly, GlaxoSmithKline, Genentech |
|
4% |
| | | | | | |
|
| Total Capital Sales | | 69% |
| Parts and Services | | 31% |
| | | | | | |
|
| Total | | 100% |
| | | | | | |
|
Our Process Technology division, employing 2,691 personnel as of December 31, 2002 and accounting for SEK 6,377 million, or 44%, of our total net sales in the year ended December 31, 2002, serves customers that require customised solutions to optimise their processes and for which it is critical for us to demonstrate an in-depth knowledge of their processes. For example, we supply customised turn-key process technology solutions (including high speed separators, decanter centrifuges, hydro-cyclone systems and filters) for the extraction of starch from corn, wheat, potatoes and tapioca. Our systems handle the preparation of the raw materials through to the final processing of the various end products. Our decanters, hydro-cyclone systems and dryers are used in splitting, purifying and washing processes in starch extraction. Sales to customers requiring customised solutions are principally channeled through our own sales companies, more fully described under "—Marketing and Distribution" below. Based upon our process and product expertise, in combination with our technologies, we offer a range of bundled packages, from individual products to specialised solutions, together with attentive customer service. In 2002, approximately 52% of net sales in our Process Technology division were related to our centrifugal separation technology, approximately 37% to our heat transfer technology, approximately 8% to other proprietary equipment, approximately 2% to our sanitary flow technology and approximately 1% to our membrane technology.
Food Technology. Within the Food Technology customer segment, we hold a strong position as a supplier of processing solutions to the food and beverage industry. We supply stand-alone equipment, modules, process lines, complete plants and/or specialised services according to customers' needs. The primary products we supply are separators and plate heat exchangers, as well as pumps, valves and installation materials. Our products are used in the production of beverages (including coffee, tea, soft drinks, fruit juices and viscous foods, such as soups, sauces and chocolate products), beer, wine, olive oil, other vegetable oils and meat and fish proteins. We are a significant supplier of process technology in the refining of rapeseed, soy and palm oil and other vegetable oils and, with our acquisition of Scandi-Brew in 1999, we are also a significant supplier of process technology solutions in the production of beer.
I-33
Process Industry. In the Process Industry customer segment, our heat exchangers and separators are used in a wide variety of our customers' processes, including those processes involving high temperatures and concentrated petrochemicals, plastics, polymers, metals, minerals and paper. Our new centrifuges are well-suited to the demands of the chemical industry. With our acquisition of the Merco Dorr Oliver starch business in 2000, we believe we are also a significant supplier of equipment to those industries active in the extraction, refinement and modification of starch.
Energy & Environment. In the Energy & Environment customer segment, our products and systems play a critical role in areas such as waste-water treatment, oil and gas production, the production of energy from oil, gas, other fossil fuels, hydroelectric and nuclear power. In particular, our decanters have a leading market share for use in the treatment of sludge in waste-water treatment plants and are often combined with other core products for use in this context. We supply compact heat exchangers that are used for a variety of heating and cooling applications on oil platforms, where weight and space savings are important criteria. Our centrifugal separation systems for the treatment of fuel oils and lubricating oils are typically used at diesel, gas or steam power stations.
Life Science Technology. In the Life Science Technology customer segment, we have a strong position in the traditional chemical and the pharmaceutical industry, as well as in the bio-tech industry. Our centrifugal separators play a key role in cell separation during the manufacture of pharmaceutical products in the bio-tech industry. Our heat exchangers are used for heating, cooling and thermal regulation of their processes.
Parts and Services
We have recently increased our focus on the higher margin parts and services business within both our Equipment and Process Technology divisions. Our parts and services business covers the maintenance of equipment and systems, the supply of spare parts, the training of personnel and efficiency audits. We have 70 service centres around the world. In 2002, 27% of group sales were derived from this business, as compared to 25% in 2001.
We have a large and growing installed base of heat exchangers and separators which require service and spare parts. Due to the natural ageing of this installed base, particularly in heat exchangers, which have a typical life span of 5 to 20 years, and separators, which have a typical life span of 10 to 20 years, we expect the demand for our parts and services to increase. We intend to increase our parts and services business by more effectively tracking our installed base of equipment and by selling ongoing service contracts along with our systems and products at the time of their original sale. In addition to leveraging off our large and growing installed base of heat exchangers and separators, we believe that another key driver to growth in the parts and services business is the increased outsourcing of equipment maintenance by customers whose core competence is not in the maintenance field, particularly where the plant is sophisticated and downtime costs are high. We also service and sell spare parts for products manufactured by our competitors in the heat transfer and sanitary flow technology markets, which also provide us with an opportunity to expand our customer base and cross-sell our products.
Operations Division
Supporting our two principal divisions is a centralised Operations division that performs three functions for our group—purchasing, logistics and manufacturing. Our Operations division employed 3,892 personnel, as of December 31, 2002. The purchasing unit, which is organised by commodity group and region, is responsible for purchasing strategy, volume and supply agreements, development of relationships with suppliers and outsourcing. The logistics unit, which is organised by region and product, is responsible for all distribution operations in the sales organisation supply chain between us, our customers and our distributors. It is also responsible for inventory management, order processing,
I-34
warehousing, transport and freight. The manufacturing unit, which is also organised by product and region, is responsible for all of our manufacturing sites which produce both components and complete products for supply to our customers. The production unit has the responsibility for long-term production planning and development. In centralising these three principal functions, we aim to streamline our operations, increase our efficiency and productivity, reduce our operating costs and exploit economies of scale. Our group headquarters continues to have sole responsibility for all human resource, information technology and information systems, communications, finance and legal activities.
For a description of our manufacturing facilities, see "Item 4.D: Information about the Company—Property, Plant and Equipment".
Supplies
Our principal raw materials are titanium, sheet stainless steel, rubber gaskets, carbon steel frames, copper and, in relation to our sanitary flow products, rubber, plastic and cast iron. We purchase our supplies from over 3,500 suppliers located in Europe, North America and Asia. No single supplier accounted for more than 3% of our purchasing volume in 2002. We are not dependent on any one supplier and alternative sources of supply are generally available, although we do depend on three suppliers for titanium and we are subject to a substantial lead time in ordering and obtaining titanium from other sources. Supply contracts are typically negotiated on a 6 to 12 month basis and use of consignment stock, or stock that is owned by the supplier until used in production, is more frequently being used with core suppliers as a way to free up working capital. In addition to purchasing raw materials, we also purchase certain components, including motors and electrical systems, which we integrate into some of our products, principally our separators.
Our Products and Services
Heat Transfer Technology Products
Heat transfer technology is used in almost all industrial process activities. Typical heat transfer applications perform heating, cooling, ventilation, evaporation and condensation functions in a wide range of industries such as food, chemical processing and power generation industries. Heat exchangers work by passing fluids or gases close together, with heat moving from the hot substance to the colder one. Such products are critical for the overall efficiency of a process within a manufacturing plant and are generally considered to be an essential purchase in circumstances where technical specifications and superior quality are key factors. These products are either purchased individually, or as part of a larger piece of equipment or an entire processing system. Our heat transfer products, many of which can be customised for specific customer needs, consist principally of:
- •
- compact plate heat exchangers, including gasketed heat exchangers, brazed heat exchangers and welded heat exchangers;
- •
- spiral heat exchangers; and
- •
- air cooling heat exchangers for refrigeration.
A heat exchanger is typically in operation for 5 to 20 years and consumes spare parts and requires qualified service throughout its life. As a result, customers who have purchased our systems and products create a reliable customer base for our parts and services business. We have the capability to service most kinds of plate heat exchanger, including those not manufactured by us. This capability provides a platform for expanding our higher margin parts and services business and provides exposure to new customers to whom we can market our heat transfer products.
I-35
The plate heat exchanger is our main product. We believe that plate heat exchangers combine high efficiency with low investment and operating cost. It consists of a pack of metal plates with portholes for the passage of two fluids, between which heat transfer takes place. There are three types of plate heat exchangers; gasketed, brazed and welded. Gasketed plate heat exchangers are sealed with rubber gaskets and are typically used on ships as part of the cooling process of engine oil. Brazed heat exchanges are a variant of the gasketed heat exchanger and evolved in response to the need for a compact plate heat exchanger for high pressure and high temperature applications, such as district heating or refrigeration. Welded heat exchangers are heavy-duty products and are typically used for high pressure and high temperature applications. The price range for gasketed plate heat exchangers is approximately SEK 5,000-SEK 5 million, for brazed heat exchangers, approximately SEK 100-SEK 20,000 and for welded heat exchangers approximately SEK 5,000-SEK 1.5 million.
Spiral heat exchangers, which are self-cleaning, are typically used for more difficult applications where, for example, temperatures and pressures are higher or where fluids contain a high level of solids, such as sludge or pulp fibers. The price range for a spiral heat exchanger is approximately SEK 5,000-SEK 2 million.
Air cooling heat exchangers are widely used for air conditioning and refrigeration. The price range for an air cooling heat exchanger is approximately SEK 6,000-SEK 120,000.
Centrifugal Separation Products
We use technologies based on centrifugal force to separate liquids from other liquids or solids from liquids by rotating a vessel at very high speeds. Our separators are vital to raising quality and productivity in areas such as:
- •
- process industries—food and beverage, pharmaceutical, biotech, chemical and petrochemical processing;
- •
- crude oil extraction and production—cleaning and recycling of drilling fluids, cleaning of lubrication oil and crude oil;
- •
- marine and power—treatment and cleaning of fuel and lubrication oil for use on board ships and electricity generation plants; and
- •
- waste-water treatment—de-watering of sludge using decanter centrifuges as an alternative to traditional filter presses.
Our principal products include separators and decanters. The separation technology is mainly used for seven basic separation tasks:
- •
- clarification—the removal of solid particles from a liquid;
- •
- purification—the separation of two liquids where the light liquid is the dominating liquid, for example, a small amount of water in oil;
- •
- concentration—the separation of two liquids where the heavy liquid is the dominating liquid, for example, a small amount of oil in water;
- •
- de-watering—the concentration of a slurry, or a high concentration of solids in a liquid phase;
I-36
- •
- classification—the separation of a suspension of solids in a liquid into two streams with different particle size distribution;
- •
- washing—the dissolving of impurities in suspended, crystallised or amorphous solids; and
- •
- extraction—the separation of a liquid agent from an original liquid, where the liquid agent contains a mineral or an extract absorbed through mixing.
A separator or a decanter is in operation for approximately 10 to 20 years and consumes spare parts and services throughout its life.
High-speed separators can perform tasks that range from separating liquid from liquid to the separation of slurries having a solids content of up to 30.0%. We manufacture a wide range of sizes and versions of high-speed separators which are used, for example, in the oil and gas industry to extract water from crude oil, the marine industry to clean diesel oil on board ships and in the dairy industry to separate cream from milk. The price ranges for high-speed separators vary depending on the degree of customisation and the particular end-user market, but typically range between approximately SEK 50,000-SEK 2 million in the marine and power industry and approximately SEK 200,000-SEK 5 million in the process industry.
A decanter centrifuge is a horizontal separation technique which uses a slower speed than high speed separation techniques and a system of continuous discharge of the liquid and the concentrated solid. The main uses for decanter centrifuges are applications that require separation of a relatively higher solid content. For example, decanter centrifuges are used in municipal waste-water treatment plans to dewater sludge. Decanter centrifuges range in price from approximately SEK 300,000-SEK 6 million.
Sanitary Flow Products
Pumps, valves and installation material are used in almost every process and production industry. We provide pumps, valves and fittings for fluid handling in a sanitary context. These applications compliment our overall engineering solutions and demand high quality products that maintain a high level of hygiene. These applications are typically used in the production of dairy products, beverages, food, health and beauty products and pharmaceutical products. OEMs typically incorporate our sanitary flow products in their systems and therefore need a continuing supply of our components. These products perform supportive functions within an overall process and are used with our heat transfer and centrifugal separation products.
The average life of our sanitary flow products varies according to type and application. In a corrosive environment product life can be limited to a few months, while in other applications our sanitary flow products have been in place for more than 20 years. Service is strategically important for us since contact with the customer is a source of repeat sales. We also provide parts and services to customers who have products that were not manufactured by us.
Positive displacement pumps are primarily used to aid the movement of thicker and more sensitive media, for example, in the production of syrup. Sanitary centrifugal pumps are primarily used in circumstances where hygiene is critical, for example, in the dairy industry. Prices range from approximately SEK 5,000-SEK 300,000.
I-37
Valves are used to regulate and redirect liquid flows. Our sanitary diaphragm valve combines reliability with sterile treatment capacity. For example, butterfly valves are shut-off valves that require limited space in a production line, are low-weight and relatively inexpensive. Prices range from approximately SEK 300-SEK 35,000.
We have a complete range of installation material, including piping and connections, available in a range of sizes. Prices range from approximately SEK 30-SEK 1,000.
Marketing and Distribution
We are represented in over 100 countries through 50 sales companies and our various distributors. Our sales companies are organised to reflect our two principal divisions and each is responsible for selling and marketing all of our products and services to industries within our ten customer segments. Every sales company also has a senior manager responsible for all the parts and services business. Our European and US sales companies are respectively supported by two shared-services entities—one in the United States and the other in Europe—from which they purchase administrative services (including financial and accounting services, information technology and information systems, order processing, billing and site service management functions), thus allowing the managing directors of each sales company to focus purely on sales activities. Our entire sales organisation is managed centrally by our senior group management.
The Equipment division depends on our own sales companies, as well as external channels such as distributors, strategic partners (including Tetra Pak), OEMs (including boiler manufacturers) and the Internet. The Process Technology division focuses on interaction with customers and sells its systems, production lines and product service packages directly through the Alfa Laval sales force.
The majority of our sales force, comprising approximately 2,300 personnel, are qualified engineers and are trained in design, configuration, delivery, installation and service as part of the sales and marketing process. Where possible, we compensate our sales force through a base salary and bonuses tied to sales volumes and consolidated gross margins on total sales volumes.
Our sales companies are the vehicle for delivering parts and services to customers and they generally have access to centralised parts stock and workshops for repairs. We use agents and distributors in circumstances where these additional sales channels provide access to customers who would not, due to geographical or political constraints, be reached by our sales companies, or where it would not be cost effective for the customers to be served by one of our sales companies. We are developing our use of e-commerce in the distribution of our products and services. To this end, we have created one group organisation for production and logistics in order to interface with our key distributors and agents with the aim of facilitating the efficiency and speed in the placing of orders, particularly in relation to spare parts, sanitary flow installation equipment and brazed heat exchangers.
Our Markets
The impetus behind our restructuring was a commitment to shift our focus from our products to our customers. Our products and services, however, remain based upon our three key technologies of heat transfer, centrifugal separation and sanitary flow. Our newly created Equipment and Process Technology divisions, therefore, continue to operate and compete in our traditional markets for heat transfer, centrifugal separation and sanitary flow products.
I-38
The markets for plate heat exchanger and centrifugal separation technology, in particular, have high barriers to entry, principally due to the need for:
- •
- proprietary design and manufacturing techniques;
- •
- large capital investments required to replicate the necessary manufacturing infrastructure; and
- •
- a well-established brand and historic track record of product quality and reliability.
Heat transfer technology industry
The heat transfer technology market includes a number of different heat exchangers, including shell and tube heat exchangers, air cooling exchangers, cooling towers and plate heat exchangers. Alfa Laval is focused on the compact heat exchanger market, in particular the plate heat exchanger market. We define the compact heat exchanger market to include brazed, welded and gasketed plate heat exchangers. The market for plate heat exchangers, which has historically been characterised by strong growth and a small number of global players, includes a number of different heat exchangers, including brazed, gasketed and welded heat exchangers, which are all variations on the plate design. We estimate that the size of the combined European and US heat exchanger market is approximately US$6.0 billion, of which we estimate US$ 900 million, or 15%, represents the combined European and US market for plate heat exchangers. Plate heat exchangers represent the fastest growing segment of the European and US heat exchanger markets. Plate heat exchangers represent the fastest growing segment of the European and US heat exchanger markets. We believe this is due to the more compact size, modular design, lower price and higher energy efficiency of the plate heat exchangers as compared to the more traditional shell and tube heat exchangers technology. Moreover, plate heat exchangers are typically more hygienic, easier to maintain and better suited to higher temperature/higher pressure environments than shell and tube heat exchangers. As end users become increasingly confident with the plate heat exchanger technology, we believe that the European, Asian and US markets will continue their strong growth as traditional shell and tube technology is replaced with plate heat exchanger technology.
As heat exchangers improve in sophistication, after-sales support has become an essential service for end users. There has also been a greater emphasis on giving advice to customers relating to the operation and maintenance of equipment. Customer support has therefore become an important competitive factor. The market for parts and services business generates high margins but is highly fragmented, consisting of a number of small companies which primarily operate on a local basis.
Separation equipment industry
The separation equipment market includes the market for filtration equipment, gravitational (or sedimentation) separation equipment and centrifugal separation equipment. We define the centrifugal separation market as decanters centrifuges and high speed separators. We estimate that the market for sedimentation and centrifugal separation equipment is worth US$4.5 billion. Of this, US$2.0 billion represents the centrifugal separation equipment market, defined as decanter centrifuges, disc centrifuges and other centrifuges. Within the centrifugal separation equipment market, disc centrifuges and decanter centrifuges are the two dominant technologies, representing 70% of this market. The centrifugal separation market is served primarily by a small number of global players.
In recent years, there has been a move away from conventional methods of separation, such as gravitational (or sedimentation) separation techniques towards centrifugal technology. Unlike conventional techniques, which require regular interruption to the process in order to allow cleaning to take place, centrifugal separation is a continuous process. We believe our customers are becoming more confident in the application of centrifugal technology, particularly in relation to the clarification process within the brewing industry. However, we expect the highest growth to come from the biotechnology, pharmaceutical and environmental industries.
I-39
Parts and services support is becoming increasingly more important. The market for parts and services for centrifugal separation equipment is highly attractive as the technology is relatively complex and few competitors possess the technological know-how. This compares to the service environment for other less sophisticated centrifugal separators where the competition is based on customer proximity and response time.
Flow applications industry
The market for flow control equipment consists principally of sanitary liquid handling equipment, including pumps, valves and fittings. Alfa Laval is active within the sanitary flow technology market, a market which demands high quality products with an ability to treat liquids with a high level of hygiene in industries such as food, bio-technology, pharmaceutical, cosmetics, healthcare, oil and protein. We estimate that the overall market for sanitary flow applications is approximately $2.2 billion. Flow applications are integral in the context of an overall, systemic process and as companies continue to improve efficiency in their processes, automation is becoming an increasing focus evidenced by the demand to increase the ratio of automated to manual valves.
The market for sanitary liquid handling equipment historically has been characterised by slow market growth and a large number of small, regional industry participants, particularly in relation to commodity products such as butterfly valves and installation material. In recent years, growth among the industry participants has been achieved by consolidation, resulting in an increase in market share. It is expected that further significant consolidation among smaller industry participants will continue. Competitors principally compete on product range, price, a well established brand name, delivery time and distribution networks.
Competition
Our main competitors are still differentiated according to technology. The competition we face in each of our key technologies of heat transfer, centrifugal separation and sanitary flow equipment is as follows:
- •
- Heat transfer technology. Our competitors in the heat technology industry vary in size and in the scope and breadth of the products and services they offer. In addition, competition varies significantly among geographic regions. Our principal competitors in plate heat exchangers include Tranter/SWEP, Invensys/APV, mg technologies/GEA, Hisaka and Sondex. We also compete with Kapp(HES), Kurose and Canzler in relation to spiral heat exchangers. In relation to our production of air cooling heat exchangers, specifically for the refrigeration market, we compete principally with Günter, Eco and Frigabohm. Of our competitors, Tranter/SWEP, Invensys/APV, mg technologies/GEA and Sondex operate globally. Some of our competitors in the refrigeration market generally are niche players, aiming their products specifically at that market. We believe that we have the greatest breadth of product range in heat transfer technology on offer. Tranter/SWEP, Invensys/APV and mg technologies/GEA also have a wide range of technology, although they do not produce spiral heat exchangers.
- •
- Separation technology. Our centrifugal separation technologies compete with similar technologies of other companies as well as with other alternative separation solutions, such as filtration. In respect of disc centrifuge technology, Westfalia (mg technologies/GEA) is our principal competitor. We also compete with Mitsubishi and Veronesi in respect of the mineral oil separation market. In respect of decanter centrifuge technology, Andritz-Guinard and Westfalia are our principal competitors in the waste separation market, Pieralisi in the olive oil separation market and Swaco in the oil and gas market. In the market for filtration of mineral oils for the marine and diesel industry, we compete principally with Boll & Kirsch. Of our competitors, we believe that Westfalia is the most global in nature and has a product range most comparable to
I-40
ours. We also believe that Westfalia has a strong market position in the chemical processing, pharmaceutical and food processing industries. In 2002, Alfa Laval started to provide membrane filtration equipment for the food & beverage and for the life science markets. Our main competitors in the food & beverage market are Orelis (Rhodia), Koch Membrane Systems and PCI Membranes (ITT). Our main competitors in the life science market are Orelis (Rhodia), Koch Membrane Systems, PCI Membranes (ITT) and Millipore.
- •
- Sanitary flow industry. We compete with a large number of small, regional competitors. Our principal competitors in the market for sanitary flow products are Invensys/APV mg technologies/GEA. We also compete with Waukesha/Cherry Burrell (a subsidiary of United Dominion Industries/SPX), ITT Industries, Fristam Pumps, Norit Sudmo, Jensen, Toyo Stainless and Johnson Pump. Of our principal competitors, APV, GEA, Waukesha, Norit Sudmo, ITT and Fristam Pumps are global in nature. We believe that both Waukesha and GEA have a product range, which is comparable to ours.
Environmental Matters
We are subject to extensive, evolving and increasingly stringent environmental, health and safety laws and regulations governing our operations. The laws and regulations applicable to our operations address, among other things, emissions to the air, waste-water discharges to surface and subsurface waters, other releases into the environment, the generation, handling, storage, transportation, treatment and disposal of wastes and the remediation of contaminated areas. We believe we are in substantial compliance with all applicable environmental laws and regulations and, based on currently available information, this compliance has not had and is not expected to have an adverse effect on our competitive position or business.
Historical operations at many of our facilities may have resulted in the discharge of hazardous materials to soil or groundwater that may require investigation or remediation in the future. In addition, future regulatory developments, changes in existing requirements or enforcement policies or the development or discovery of new environmental facts or conditions could require significant expenditures, result in the imposition of fines or penalties or prevent or restrict our operations. There can be no assurance that these developments or changes will not have a material adverse effect on the results of our operations or our financial condition.
Tetra Laval B.V. has indemnified us and Alfa Laval Credit Finance AB, together with our predecessor Alfa Laval Holding AB and its subsidiaries, for any environmental liabilities existing at the time of the Acquisition and, with respect to Alfa Laval Credit Finance AB and Alfa Laval Holding AB and its subsidiaries, for any contamination or pollution existing at the time of the Acquisition that constitutes a violation of environmental law. This indemnification is subject to a €5.5 million (SEK 52 million) deductible and an aggregate limit of €575 million (SEK 5.4 billion) for environmental and non-environmental matters alike. Environmental claims may be brought under the indemnity for seven years from the date of the Acquisition. However, there can be no guarantee that this indemnification will cover all related claims or losses or that the indemnifying party will have sufficient assets to cover such claims or losses.
Insurance
We hold insurance in respect of our property portfolio, with sums insured up to the full value of our plants, equipment and other assets, and in respect of business interruption. The indemnity period for business interruption varies depending on the activity, but is generally for periods of up to twelve months. We also hold insurance in respect of product liability (including insurance coverage for the asbestos-related lawsuits in the United States, more fully described under "Item 8.A: Financial Information—Legal Proceedings"), directors and officers liability and, in relation to our US operations,
I-41
employment practices liability. We believe that the type and relative amounts of insurance which we hold are in accordance with what is customary in the industries and geographic jurisdictions in which we operate.
For a discussion of the principal markets in which the company completes see Item 5.A: Operating and Financial Review and Prospects—Operating Results—Geographic distribution of sales".
For a discussion of the seasonality of our business see Item 5.A: Operating and Financial Review and Prospects—Operating Results—Seasonality of end-user markets and invoicing".
4.C. Organisational Structure
We are a direct wholly-owned subsidiary of Alfa Laval AB, our parent holding company. The table below outlines our corporate organisation after the Acquisition and its financing:
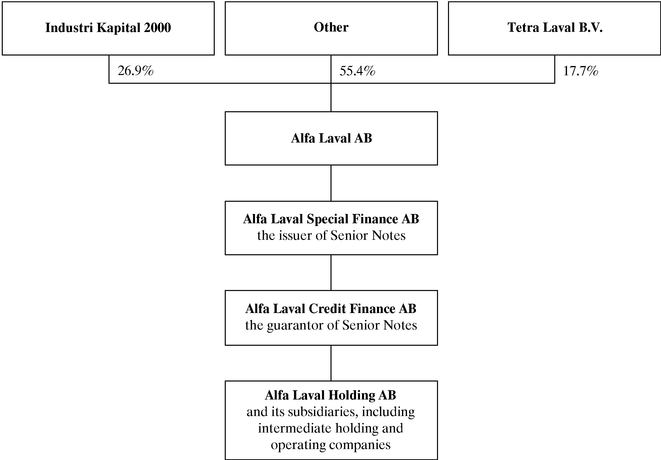
For a description of Industri Kapital 2000 and Tetra Laval B.V., see "Item 7.A: Major Shareholders and Related Party Transactions".
I-42
The following table sets forth our subsidiaries as at December 31, 2002:
Specification of shares in subsidiaries
Company name
| | Domicile
| | Country of
incorporation
| | No. of
shares
| | Share of
capital %
|
|---|
| Alfa Laval Special Finance AB | | Lund | | Sweden | | | | 100 |
| | Alfa Laval Credit Finance AB | | Lund | | Sweden | | | | 100 |
| | | Alfa Laval Holding AB | | Lund | | Sweden | | | | 100 |
| Alfa Laval Holding AB | | Lund | | Sweden | | 12,500,000 | | 100 |
| Alfa Laval NV | | Maarssen | | Netherlands | | 227,754 | | 100 |
| | Alfa Laval Inc | | Newmarket | | Canada | | 1,000,000 | | 68 |
| | Alfa Laval S.A. DE C.V. | | Tlalnepantla | | Mexico | | 45,057,057 | | 100 |
| | Alfa Laval S.A. | | San Isidro | | South Africa | | 699 | | 100 |
| | Alfa Laval Bolivia S.R.L. | | Santa Cruz | | Bolivia | | 69 | | 100 |
| | Alfa Laval S/A | | Sao Paulo | | Brazil | | | | 100 |
| | | Roston do Brasil Ltda | | Sao Paulo | | Brazil | | 5,249 | | 100 |
| | Alfa Laval S.A.C.I. | | Santiago | | Chile | | 2,735 | | 100 |
| | Alfa Laval S.A. | | Bogota | | Colombia | | 12,195 | | 100 |
| | Alfa Laval S.A. | | Lima | | Peru | | 4,346,832 | | 100 |
| | Alfa Laval Venezolana S.A. | | Caracas | | Venezuela | | 10,000 | | 100 |
| | | Alfa Laval Oilfield C.A. | | Caracas | | Venezuela | | 203 | | 81 |
| | Alfa Laval Phe Co Ltd | | Jiang Yin | | China | | | | 100 |
| | Alfa Laval Flow Equipment (Kunshan) Co Ltd | | Jiangsu | | China | | | | 100 |
| | Alfa Laval (Shanghai) Technologies Co Ltd | | Shanghai | | China | | | | 100 |
| | Alfa Laval Taiwan Ltd | | Taipei | | Taiwan | | 1,499,994 | | 100 |
| | Alfa Laval (Hongkong) Ltd | | Hongkong | | Hongkong | | 79,999 | | 100 |
| | Alfa Laval (China) Ltd | | Hongkong | | Hongkong | | 9,999 | | 100 |
| | PT Alfa Laval Separatama | | Jakarta | | Indonesia | | 1,000 | | 80 |
| | Alfa Laval Iran P.J.S. Co | | Teheran | | Iran | | 2,199 | | 100 |
| | Alfa Laval KK | | Tokyo | | Japan | | 1,200,000 | | 100 |
| | Alfa Laval Industry (PVT) Ltd | | Lahore | | Pakistan | | 119,110 | | 100 |
| | Alfa Laval Philippines Inc | | Makati | | Philippines | | 72,000 | | 100 |
| | Alfa Laval Singapore Pte Ltd | | Singapore | | Singapore | | 5,000,000 | | 100 |
| | Alfa Laval (Thailand) Ltd | | Bangkok | | Thailand | | 792,000 | | 100 |
| | Alfa Laval Middle East Ltd | | Nicosia | | Cyprus | | 40,000 | | 100 |
| | Alfa Laval NV SA | | Brussels | | Belgium | | 33,811 | | 100 |
| | Alfa Laval Slovakia S.R.O. | | Bratislanva | | Slovakia | | | | 1 |
| | Cetetherm SR spol S.R.O. | | Liptovsky Mikulas | | Slovakia | | | | 15 |
| | Alfa Laval Spol S.R.O. | | Hradec Kralove | | Czech Republic | | | | 20 |
| | Cetetherm S.R.O. | | Prague | | Czech Republic | | | | 5 |
| | Alfa Laval Denmark Holding A/S | | Kolding | | Denmark | | | | 100 |
| | | Alfa Laval LKM A/S | | Kolding | | Denmark | | 100,000 | | 100 |
| | | | Alfa Laval Nordic A/S | | Rödovre | | Denmark | | 1 | | 100 |
| | | | | Alfa Laval Copenhagen A/S | | Söborg | | Denmark | | 1 | | 100 |
| | | | | Alfa Laval Nakskov A/S | | Nakskov | | Denmark | | 1 | | 100 |
| | Alfa Laval Ltd | | Sofia | | Bulgaria | | 100 | | 100 |
I-43
| | Alfa Laval Nordic OY | | Espoo | | Finland | | 20,000 | | 100 |
| | | Cetetherm OY | | Tuusula | | Finland | | 5,000 | | 100 |
| | Alfa Laval Nederland B.V. | | Maarssen | | Netherlands | | 10,000 | | 100 |
| | | Alfa Laval B.V. | | Maarssen | | Netherlands | | 1,475 | | 100 |
| | | Alfa Laval Merco B.V. | | Hoofddorp | | Netherlands | | 1,475 | | 100 |
| | Alfa Laval Holding A/S | | Oslo | | Norway | | 520,000 | | 100 |
| | | Alfa Laval Nordic A/S | | Oslo | | Norway | | 10,000 | | 100 |
| | CTC Ronneby AB | | Ronneby | | Sweden | | 138,000 | | 100 |
| | Alfa Laval ExCell AB | | Skogstorp | | Sweden | | 2,500 | | 100 |
| | Alfa Laval Nordic AB | | Tumba | | Sweden | | 1,000 | | 100 |
| | Cetetherm AB | | Ronneby | | Sweden | | 20,000 | | 100 |
| | Alfa Laval Corporate AB | | Lund | | Sweden | | 13,920,000 | | 100 |
| | | Alfa Laval Real Estate AB | | Lund | | Sweden | | 680,000 | | 100 |
| | | Alfa Laval (India) Ltd | | Poona | | India | | 9,261,889 | | 64.1 |
| | | | Skansen Engineering & Consultancy Co Ltd | | Poona | | India | | 50,000 | | 64.1 |
| | | Alfa Laval Korea Ltd | | Seoul | | South Korea | | 3,640,000 | | 100 |
| | | Alfa Laval (Malaysia) Sdn Bhd | | Shah Alam | | Malaysia | | 10,000 | | 100 |
| | | Mosgormash Alfa Laval Moloko | | Moscow | | Russia | | | | 55 |
| | | Alfa Laval Oilfield C.A. | | Caracas | | Venezuela | | 47 | | 19 |
| | Alfa Laval Treasury International AB | | Lund | | Sweden | | 50,000 | | 100 |
| | Alfa Laval Europe AB | | Tumba | | Sweden | | 500 | | 100 |
| | Alfa Laval Lund AB | | Lund | | Sweden | | 100 | | 100 |
| | Alfa Laval International Engineering AB | | Tumba | | Sweden | | 4,500 | | 100 |
| | Alfa Laval Tumba AB | | Lund | | Sweden | | 1,000 | | 100 |
| | Bitec Enterprise AG | | Volketswil | | Schweiz | | 86,935 | | 88.8 |
| | Alfa Laval Dis Ticaret Ltd Sti | | Istanbul | | Turkey | | 27,001,755 | | 99 |
| | OÜ Cetetherm | | Tallinn | | Estonia | | 100 | | 100 |
| | Alfa Laval SIA | | Tallinn | | Estonia | | 125 | | 100 |
| | SIA Cetetherm | | Riga | | Latvia | | 200 | | 100 |
| | Alfa Laval UAB Ltd | | Vilnius | | Lithuania | | 2,009 | | 100 |
| | UAB Cetetherm | | Vilnius | | Lithuania | | 100 | | 100 |
| | Alfa Laval Australia Pty Ltd | | Homebush | | Australia | | 2,088,076 | | 100 |
| | | Alfa Laval Pty Ltd | | Homebush | | Australia | | 3,500,000 | | 100 |
| | | Alfa Laval Hamilton Pty Ltd | | Homebush | | Australia | | 10,000 | | 100 |
| | | Heat Transfer Pty Ltd | | Homebush | | Australia | | 15,000 | | 100 |
| | | Alfa Laval Flow Pty Ltd | | Mentone | | Australia | | 3,500,000 | | 100 |
| | Alfa Laval New Zealand Ltd | | Hamilton | | New Zealand | | 1,000 | | 100 |
| Alfa Laval Holding BV | | Maarssen | | Netherlands | | 70,000,000 | | 100 |
| | Alfa Laval (Pty) Ltd | | Isando | | South Africa | | 2,000 | | 100 |
| | Alfa Laval Slovakia S.R.O. | | Bratislava | | Slovakia | | | | 99 |
| | Cetetherm SR spol S.R.O. | | Liptovsky Mikulas | | Slovakia | | | | 85 |
| | Alfa Laval Spol S.R.O. | | Hradec Kralove | | Czech Republic | | | | 80 |
| | Cetetherm S.R.O. | | Prague | | Czech Republic | | | | 95 |
| | Alfa Laval France SAS | | Les Clayes | | France | | 920,000 | | 100 |
| | | Alfa Laval SAS | | Les Clayes | | France | | 560,000 | | 100 |
| | | | Alfa Laval Moatti SNC | | Les Clayes | | France | | 24,000 | | 100 |
I-44
| | | | Alfa Laval Spiral SNC | | Nevers | | France | | 79,999 | | 100 |
| | | MCD SAS | | Guny | | France | | 71,300 | | 100 |
| | | Alfa Laval Vicarb SA | | Grenoble | | France | | 200,000 | | 100 |
| | | | Canada Inc | | Newmarket | | Canada | | 480,000 | | 100 |
| | | | | Alfa Laval Inc | | Newmarket | | Canada | | 481,600 | | 32 |
| | | | SCI du Companil | | Grenoble | | France | | 32,165 | | 100 |
| | | Cetetherm SA | | Lyon | | France | | 150,000 | | 100 |
| | Cetetherm Wärrmetauschersysteme GmbH | | Glinde | | Germany | | | | 6 |
| | Alfa Laval Holding GmbH | | Glinde | | Germany | | | | 100 |
| | | Alfa Laval GmbH | | Wiener Neudorf | | Austria | | | | 100 |
| | | Alfa Laval GmbH | | Glinde | | Germany | | 1 | | 100 |
| | | Cetetherm Wärrmetauschersysteme GmbH | | Glinde | | Germany | | 3 | | 94 |
| | | Cetetherm Wärrmetauschersysteme Glinde GmbH | | Glinde | | Germany | | 1 | | 100 |
| | | Alfa Laval AG | | Dietlikon | | Schweiz | | 647 | | 100 |
| | Alfa Laval AEBE | | Holargos | | Greece | | 10,000 | | 100 |
| | Alfa Laval Kft | | Budapest | | Hungary | | 1 | | 100 |
| | Cetetherm Vicarb Hungary Kft | | Budapest | | Hungary | | | | 100 |
| | Alfa Laval SpA | | Monza | | Italy | | 1,930,500 | | 100 |
| | Alfa Laval Polska Sp.z.o.o. | | Warzaw | | Poland | | 6,862 | | 100 |
| | Cetetherm Polska Sp.z.o.o. | | Warzaw | | Poland | | | | 100 |
| | Wytwornia Separator Krakow Sp.z.o.o. | | Krakow | | Poland | | | | 100 |
| | Alfa Laval (Portugal) Ltd | | Linda-A- Velha | | Portugal | | | | 1 |
| | Alfa Laval SRL | | Bucharest | | Romania | | 61,435 | | 100 |
| | Alfa Laval Iberia SA | | Madrid | | Spain | | | | 100 |
| | | Alfa Laval (Portugal) Ltd | | Linda-A-Velha | | Portugal | | 1 | | 99 |
| | Alfa Laval Dis Ticaret Ltd Sti | | Istanbul | | Turkey | | 1 | | 99 |
| | Alfa Laval Holdings Ltd | | Camberley | | United Kingdom | | 28,107,000 | | 100 |
| | | Alfa Laval 2000 | | Camberley | | United Kingdom | | 28,106 | | 100 |
| | | | Alfa Laval Ltd | | Camberley | | United Kingdom | | 12,710,000 | | 100 |
| | | | Alfa Laval Finance Co Ltd | | Camberley | | United Kingdom | | 856,000 | | 100 |
| | | | Alfa Laval Oilfield Ltd | | Aberdeen | | United Kingdom | | 500,000 | | 100 |
| | | | Alfa Laval Flow Ltd | | Sutton Coldfield | | United Kingdom | | 100 | | 100 |
| | | | Alfa Laval Pumps Ltd | | Eastbourne | | United Kingdom | | 100 | | 100 |
| | | | Alfa Laval Thermal Ltd | | Camberley | | United Kingdom | | 1,000 | | 100 |
| | | | Alfa Laval Separation Ltd | | Camberley | | United Kingdom | | 375,000 | | 100 |
| | | | Rolls Laval Heat Exchangers Ltd | | Wolverhampton | | United Kingdom | | 5,000 | | 50 |
| | Alfa Laval USA inc | | Kenosha | | United States | | | | 100 |
| | | Alfa Laval US Holding Inc | | Kenosha | | United States | | 180 | | 100 |
| | | | Alfa Laval Inc | | Kenosha | | United States | | 44,000 | | 100 |
| | | | | Tri-Lad Inc | | Brantford | | Canada | | 4,000 | | 100 |
| | | | Alfa Laval US Treasury Inc | | Kenosha | | United States | | 1,000 | | 100 |
| | AO Alfa Laval Potok | | Koroljov | | Russia | | 31,057,529 | | 100 |
| | OÜ Alfa Laval | | Tallinn | | Estonia | | 1 | | 100 |
I-45
4.D. Property, Plant and Equipment
The following table sets forth the location, number of employees, products manufactured and capacity utilisation of each of our manufacturing facilities for 2002:
Manufacturing Unit
| | Employees(1)
| | Products
| | Capacity
Utilisation(2)
| | Size(m2)
| | Use of Unit
| | Production
Capacity
in Delivery
Value
|
|---|
| |
| |
| | (%)
| |
| |
| | SEK millions
|
|---|
| Europe: | | | | | | | | | | | | |
| Alonte, Italy | | 216 | | Air conditioners, brazed plate heat exchangers | | 90 | | 19,562 | | Offices, Factory and Warehouse | | 405 |
| Eastbourne, UK | | 112 | | Pumps | | 70 | | 7,726 | | Offices, Factory and Warehouse | | 144 |
| Eskilstuna, Sweden* | | 196 | | Separators | | 90 | | 17,682 | | Factory | | 330 |
| Grenoble, France | | 171 | | Welded plate heat exchangers | | 80 | | 10,710 | | Offices and Factory | | 240 |
| Guny, France | | 60 | | Gaskets | | 80 | | 3,203 | | Factory | | 52 |
| Kolding, Denmark | | 302 | | Fittings, valves and pumps | | 85 | | 17,176 | | Offices, Factory and Warehouse | | 520 |
| Krakow, Poland | | 61 | | Separators | | 85 | | 5,558 | | Factory | | 36 |
| Les Clayes, France* | | 24 | | Filters | | 75 | | 26,632 | | Offices and Factory | | 46 |
| Lund, Sweden | | 502 | | Gasketed and welded plate heat exchangers | | 90 | | 21,329 | | Offices, Factory and Warehouse | | 751 |
| Lyon, France | | 31 | | Heat exchanger modules | | 85 | | 3,100 | | Offices and Factory | | 88 |
| Madrid, Spain | | 115 | | Separators | | 90 | | 13,124 | | Offices and Factory | | 163 |
| Monza, Italy | | 45 | | Separator modules | | 60 | | 22,149 | | Offices, Factory and Warehouse | | 85 |
| Nevers, France | | 96 | | Spiral heat exchangers | | 80 | | 16,137 | | Offices and Factory | | 78 |
| Potok, Russia | | 112 | | Plate heat exchangers, gaskets | | 70 | | 27,382 | | Offices and Factory | | 67 |
| Ronneby, Sweden | | 214 | | Brazed plate heat exchanges, modules | | 85 | | 15,000 | | Offices, Factory and Warehouse | | 437 |
| Söborg, Denmark | | 150 | | Decanters and modules | | 80 | | 21,775 | | Offices and Factory | | 394 |
North America: |
|
|
|
|
|
|
|
|
|
|
|
|
| Lykens, USA | | 44 | | Spiral heat exchangers | | 65 | | 5,388 | | Factory | | 85 |
| Richmond, USA | | 176 | | Scrape, brazed and gasketed plate heat exchangers, fittings, valves and pumps | | 70 | | 19,817 | | Offices, Factory and Warehouse | | 715 |
| Asia: | | | | | | | | | | | | |
| Jiang Yin City, China | | 161 | | Brazed and gasketed plate heat exchangers, gaskets | | 80 | | 6,294 | | Factory | | 138 |
| Kunshan, China* | | 118 | | Fittings, pumps and valves | | 90 | | 6,988 | | Factory | | 71 |
| Pune, India | | 387 | | Decanters and separators | | 90 | | 22,586 | | Offices, Factory and Warehouse | | 185 |
| Sarola, India | | 118 | | Fittings and valves | | 85 | | 5,750 | | Offices, Factory and Warehouse | | 45 |
| Satara, India | | 91 | | Plate and spiral heat exchangers | | 30 | | 8,550 | | Factory | | 59 |
| Shonan, Japan | | 46 | | Gasketed plate heat exchangers | | 75 | | 7,549 | | Offices and Factory | | 308 |
- *
- Indicates the manufacturing unit premises are leased and not owned by Alfa Laval.
- (1)
- Average number of employees for the year ended December 31, 2002.
- (2)
- Capacity utilisation is measured as actual utilisation against a pre-defined maximum load and assuming a constant product mix. The pre-defined maximum load is defined by reference to legal, operating cost, labour and other local restrictions.
In addition to the manufacturing facilities set forth in the table above, Alfa Laval owns several other properties, together having a market value that is substantially in line with book value.
For a discussion of our material plans to construct, expand and improve our manufacturing facilities, see "Item 5.B: Operating and Financial Review and Prospects—Liquidity and Capital Resources—Commitments for Future Capital Expenditure".
For a discussion of the environmental issues affecting us, see "Item 4.B Information About the Company—Business Overview—Environmental Matters".
I-46
ITEM 5: OPERATING AND FINANCIAL REVIEW AND PROSPECTS
5.A. Operating Results
We have prepared the following operating and financial review and prospects based on our consolidated financial data for the period from August 24, 2000 to December 31, 2000 and for the years ended December 31, 2001 and 2002. We acquired the Predecessor on August 24, 2000. See "Item 4.A: Information about the Company—History and Development of Alfa Laval Holding AB, the Company and the Guarantor". For convenience, the results of the periods from January 1, 2000 to August 23, 2000 and from August 24, 2000 to December 31, 2000 have been presented on a pro forma combined basis as if the Acquisition and related financing had been consummated on January 1, 2000. See"Item 3.A: Key Information—Unaudited Pro Forma Consolidated Financial Information" included elsewhere in this annual report. Our financial statements have been prepared in accordance with Swedish GAAP, which differs from US GAAP in certain material respects. For a discussion of the principal differences between Swedish GAAP and US GAAP as they relate to us; see note 34 to our audited consolidated financial statements included elsewhere in this annual report.
Critical Accounting Policies and Estimates
General. The following discussion and analysis of Alfa Laval's financial condition and results of operations is based upon its consolidated financial statements, which have been prepared in accordance with accounting principles generally accepted in Sweden. The preparation of its financial statements requires group management to make estimates and judgements that affect the reported amounts of assets, liabilities, revenues and expenses, and related disclosure of contingent assets and liabilities. On an on-going basis, management evaluates its estimates, including those related to bad debts, inventories, intangible assets, warranty obligations and pensions and other post-retirement benefits. Management of the group bases its estimates on historical experience and on various other assumptions that are believed to be reasonable under the circumstances, the results of which form the basis for making judgements about the carrying values of assets and liabilities that are not readily apparent from other sources. Actual results may differ from these estimates under different assumptions or conditions.
We believe the following critical accounting policies affect our more significant judgements and estimates used in the preparation of our consolidated financial statements.
Bad Debt. The group maintains allowances for doubtful accounts for estimated losses resulting from the inability of its customers to make required payments. If the financial condition of the group's customers were to deteriorate, resulting in an impairment of their ability to make payments, additional allowances may be required.
Inventories. The group writes down its inventory for estimated obsolescence or unmarketable inventory equal to the difference between the cost of inventory and the estimated market value based upon assumptions about future demand and market conditions. If actual market conditions are less favourable than those projected by management, additional inventory write-downs may be required.
Intangible Assets. The group has significant intangible assets related to goodwill and other acquired intangibles. In assessing the recoverability of the goodwill and other intangibles management must make assumptions regarding estimated future cash flows and other factors to estimate the fair value of the respective assets. Changes in strategy, market conditions or other factors could impact these estimates in the future resulting in the group recording impairment charges related to these assets.
The Financial Accounting Standards Board in the United States has issued Statement of Financial Accounting Standards No. 142, "Goodwill and Other Intangible Assets". FAS 142 requires that goodwill, including previously existing goodwill, and intangible assets with indefinite useful lives not be
I-47
amortised; these assets should be tested for impairment annually. Goodwill and intangible assets with indefinite useful lives will no longer be tested for impairment under FAS 121, "Accounting for the Impairment of Long-Lived Assets and for Long-Lived Assets to be Disposed Of". The Group has adopted the provisions of FAS 142 as of January 1, 2002 in the US GAAP reconciliation and management determined that goodwill was not impaired. The effect of FAS 142 can be considerable for the Group if the profitability within the Group or parts of the Group goes down in the future, since this could trigger a substantial impairment write down of the goodwill. Such a write down will affect the net income and thereby the position of the Group according to US GAAP.
According to RR 17 impairments on assets including goodwill shall be calculated if there is any indication that the value of the asset has decreased. This is different to FAS 142, which requires that the impairment test must be made annually irregardless of whether there is an indication or not. If a FAS 142 calculation shows an impairment, this can however be seen as such an indication that could trigger a write down even in the part of the financial reporting that is regulated by the recommendations from the Financial Accounting Standards Council.
Product Claims and Warranty. The group provides for the estimated cost of product warranties at the time revenue is recognised. While the group engages in extensive product quality programmes and processes, including actively monitoring and evaluating the quality of its suppliers, the group's warranty obligation is affected by product failure rates, material usage and repair costs incurred in correcting a product performance issue. Should actual product failure rates, material usage or repair costs differ from the group's estimates, revisions to the estimated warranty liability would be required.
Pension and Post-retirement Benefits. The group has significant pension and post-retirement benefit costs and credits that are developed from actuarial valuations. Inherent in these valuations are key assumptions including discount rates and expected return on plan assets. Management is required to consider current market conditions, including changes in interest rates, in selecting these assumptions. Changes in the related pension and post-retirement benefit costs or credits may occur in the future due to changes in these assumptions in addition to fluctuations related to changes in our employee population.
Provisions. The Group's reporting of provisions according to RR16 means that MSEK 989.3 (1,063.2) is reported as other provisions. This constitutes 6.4 (6.0) percent of the Group's assets and is important for the assessment of the Group's financial position, not the least since provisions normally are based on estimates of costs and risks. If the accounting principles for provision would be changed sometime in the future, this could have a substantial impact on the Group's financial position.
Overview
We are a leading global provider of specialised process engineering solutions and equipment based on three key technologies—heat transfer, centrifugal separation and sanitary flow technology. Under our widely recognised brand name, Alfa Laval, we service our customers globally through ten distinct customer segments with an international sales force in over 100 countries. We were founded in Sweden in 1883 by Gustav de Laval, the inventor of the continuous separator. We are a market leader in our target markets of compact heat exchangers, centrifugal separators and sanitary flow equipment. Our systems and products are designed to optimise the performance of our customers' manufacturing processes, and as a result are often critical to them.
Our Restructuring and Cost Reduction Programme—"Beyond Expectations"
In late 1999, we began to implement a restructuring Programme, which we call "Beyond Expectations", in order to reduce costs and increase our operating efficiency and productivity. This restructuring, which we intend to fully complete by the end of 2003, consists of measures aimed at
I-48
redesigning our organisational structure, consolidating human resource management, information and systems technology and communications functions into one headquartered group operation, rationalising and consolidating our manufacturing operations, centralising our purchasing, logistics and manufacturing functions, restructuring our sales and marketing network and divesting non-core businesses and properties. Due to this restructuring programme, we have successfully reduced our headcount from 11,330 in 1999 to 9,125 in 2002, a reduction of 19.5%, and increased net sales per employee by 33.3% from SEK 1.2 million per employee in 1999 to SEK 1.6 million per employee in 2002. Until the end of 2003, we expect to continue to reduce operating costs and enhance efficiency by the following actions:
- •
- Organisational Redesign. During 1998, we created four customer segments—Brewery Systems, Water Technology, Marine & Power and Oil & Protein Technology—in order to better leverage the synergies across our three former business areas, Thermal, Separation and Flow. Building on this success, we changed our organisational structure from a product focus to a customer oriented focus by organising our sales and marketing infrastructure into two divisions covering ten customer segments. This change was effective beginning January 2001. Our Equipment division provides products to customers that have a well defined and regular need for equipment and includes the Comfort & Refrigeration, Marine & Diesel, Sanitary, Fluids & Utility and OEM customer segments. Our Process Technology division provides our customers with specialised solutions for industrial systems and processes and includes the Food Technology, Energy & Environment, Process Industry and Life Science Technology customer segments. Through our ten customer segments, we cross-sell our systems and full product range, including our parts and services business, and develop customised solutions by identifying new applications for existing and new products, as well as identifying new customers. We believe that our new customer segments will improve our sales growth and strengthen our market position. As part of our organisational redesign, we also consolidated the management of our engineering resources with a view to increasing the output and efficiency of our engineers and reducing the extent to which we outsource our engineering design requirements, with the aim of reducing our operating costs.
- •
- Centralising Group Functions. We have centralised all human resource management, information and systems technology and communications functions in order to reduce costs, increase efficiency and realises economies of scale. For example, each of our former business areas had different and incompatible software systems and it was not possible for us to standardise functions such as order entry and confirmation, delivery tracking and invoicing across these various systems. In order to secure the necessary convergence of these systems so that we may reduce costs and realises economies of scale, we centralised our information and systems technology function.
- •
- Rationalising and Consolidating Manufacturing Operations. With a view to reducing operating costs, we are continuing to rationalise and consolidate our manufacturing operations by reducing excess capacity, increasing the outsourcing of certain standard components, and shifting production to lower cost manufacturing facilities and countries. For example, we have already closed our decanter manufacturing facility in Warminster, USA, where the cost of production was high, and relocated this manufacturing operation to Denmark and India. We have shifted our valve and pump production from Kenosha, Wisconsin, which has high costs of production, to China, India, Mexico and Richmond, Virginia and we have relocated some of our heat exchanger manufacturing from Newmarket, Canada to existing plants in the United States.
- •
- Centralising Purchasing, Logistics and Certain Manufacturing Functions. We have rationalised our purchasing, logistics and manufacturing operations by creating a separate, discrete and centralised Operations business division responsible for all of these functions. For purchasing, there is now a common unit responsible for purchasing strategy, volume agreements,
I-49
development of relationships with suppliers and outsourcing. The logistics unit is responsible for all distribution operations in the sales organisation, as well as for inventory management, order handling, warehousing, transport and freight. The manufacturing unit is responsible for all of our manufacturing sites and has the responsibility for long-term production planning and development. In centralising these three principal functions, we have streamlined our operations and increased our efficiency and productivity, reduced our operating costs and exploited economies of scale. For example, several purchasing initiatives to date, including renegotiating supply arrangements with several of our key suppliers, have already resulted in lower purchasing costs, while group inventories, previously held in various sales companies around the world, are in the process of being reorganised into a limited number of strategically located centres. We have also consolidated our warehousing and distribution centres in the United States, which has resulted in a reduction in working capital.
- •
- Restructuring Sales and Marketing Network. We are continuing to restructure our local sales companies with the goal of reducing costs by centralising their administrative, order processing and billing functions into a European shared-service centre from which our sales companies purchase such services, irrespective of where the sales companies are located, leaving them to focus on cross-selling our solutions, products and services. For example, our European shared-service centre has already installed a single Alfa Laval order processing system for Intranet-based order handling and the collection and analysis of business statistics. We believe this will reduce our operating costs, improve sales growth and strengthen our market position.
- •
- Divestment of Non-Core Business and Properties. We have divested many of those businesses and properties that we believe would not benefit from our core business strategy. For example, until April 2001, we were active in industrial flow market applications, developing, marketing and selling pumps and valves used in the chemical, fresh and waste-water, oil, petrochemical and mining industries. Our industrial flow business generated sales of approximately SEK 656 million in 2000, employed approximately 689 personnel and included manufacturing facilities in India, Germany and the United Kingdom. We believed that this business would better develop under an owner focused on becoming a market leader in industrial valves and pumps and in April 2001, we sold our industrial flow business for SEK 331 million. We have also divested our properties in Johannesburg, South Africa and Glinde, Germany. A number of our properties have also been selected for sale, including São Paolo (Brazil), Newmarket (Canada) and Kenosha (USA). The Newmarket property was sold on February 26, 2003 for SEK 20 million with a realised gain of SEK 4 million.
As a result of our restructuring and cost reduction programme, we expect to increase our sales and reduce our existing operating costs, as well as to generate additional quantifiable and unquantifiable operating efficiencies. We started to incur restructuring costs in connection with our restructuring programme in late 1999. In 2000, we recorded restructuring provisions of SEK 408 million. This provision principally related to restructuring measures that management committed to take at the time of the Acquisition. Such measures included redundancies in connection with the closure of manufacturing sites, the rationalisation of our logistics function and the introduction of our customer segment based organisation. As of December 31, 2002, SEK 51 million of this provision remained outstanding. In addition to this provision, expenses of SEK 105 million, SEK 181 million and SEK 72 million have been recorded in our profit and loss account in 2000, 2001 and 2002, respectively. Some of the benefits associated with these expenses may accrue in subsequent years. We estimate that our Beyond Expectations programme generated cost savings of approximately SEK 450 million in 2001, as a result of headcount reductions, improved manufacturing and sales productivity, reduced operating costs and purchasing initiatives that resulted in lower supply costs.
In order to achieve our strategic objectives, we have set as a target for our revenue growth that we should outperform the markets in which we operate over the course of the business cycle. In addition,
I-50
we have set an Adjusted EBITA margin target of greater than 12%. This financial target requires that we obtain the cost savings and operating efficiencies we expect to achieve from our Beyond Expectations restructuring programme. We believe that a significant portion of the cost savings and operating efficiencies we expect to achieve by the end of 2003, and the costs incurred in achieving them, have not yet been recorded in our financial results. Management expects that our restructuring programme, when fully implemented, will generate cost savings of approximately SEK 800-1,000 million by the end of 2003 on an annualised basis. Over this period, however, we expect our operating costs to increase as a result of the execution of our strategy and our expected sales growth. In order to achieve such cost savings, we will incur additional expenses through the end of 2003. There can be no assurance that we will be able to achieve our expected cost savings or generate additional sales. Any such failure may make it more difficult to attain our Adjusted EBITA margin financial target of greater than 12%. See "Item 3.D: Key Information—Risk Factors". The statements in this paragraph are forward-looking and readers are cautioned not to place undue reliance on such statements. See "Forward-Looking Statements".
Factors Affecting Results of Operations
Presentation of Financial Statements
Sales of our products and services are generally recorded upon delivery of the product or the performance of a particular service, except for certain longer term projects for the development and installation of customised systems. These longer term projects, typically involving large sales of capital goods, including customised products, are recorded as sales under the percentage of completion method and comprised no more than one-third of our sales in 2002. In respect of these sales, there is often a period between the time we receive an order (for which there is a purchase commitment) and when we record the order as a sale. This period typically ranges from several months to, in certain cases, more than one year, depending upon the nature of the contract.
The principal elements comprising cost of goods sold are raw materials, labour and manufacturing overhead costs. Raw materials typically account for slightly more than half of the cost of goods sold. Principal raw materials we use include sheet stainless steel, titanium, rubber gaskets, carbon steel frames, forged steel, cast iron and copper. We generally have a number of suppliers of any given material in each of Europe, North America and Asia and are not dependent on any one supplier. We do however have three key suppliers of titanium and are subject to a substantial lead time in ordering and obtaining titanium from sources other than our key suppliers. Labour costs include costs of salaried and hourly employees. Manufacturing overhead costs include lease costs, depreciation on property, plant and equipment, utilities, property taxes and repairs and maintenance.
Operating costs includes, among other things, sales costs, administrative costs, research and development costs and other operating costs. Sales costs consist primarily of salaries and benefits paid to our sales force and commissions paid to independent sales representatives and agents. Members of our sales force are also paid bonuses based on sales volume and consolidated gross margin targets. Administration costs include corporate overhead costs relating to employee costs, rent expense, professional fees and information system costs. Research and development costs are incurred for the development of new products and the enhancement of existing products.
Other operating income consists of, among other things, royalty and license income from third parties who use our technology, and rental income from third parties renting our property and/or equipment. Other operating costs includes commission and royalties we pay to third parties in respect of use of their technology and certain exceptional items, such as restructuring charges, provisions made for loss of value on net operating capital, and provisions made in respect of legal claims.
I-51
Foreign Currency Effects
As we service our customers globally through ten distinct customer segments with an international sales organisation in over 100 countries, our results of operations are subject to currency transaction risks and currency translation risks. Currency transaction risks occur as a result of one of our operating subsidiaries entering into either a purchase or sales transaction using a currency other than its regular operating currency. We incur most of our costs in Swedish kronor, euro, Danish kroner and US dollars. Our revenues are however far more broadly distributed. We aim to hedge against currency transaction risk by matching revenues and costs in the same currency. Currency translation risks occur as a result of fluctuations in the exchange rates between the currency in which our consolidated assets and liabilities and profit and loss are reported, the Swedish kronor, and the various currencies in which our subsidiaries' assets and liabilities and profit and loss are reported. See "Item 11:—Quantitative and Qualitative Disclosures about Market Risk".
The discussion under the caption "Item 5A: Operating and Financial Review and Prospects—Operating Results—Results of Operations" below contains references to Swedish kronor amounts on a constant exchange rate basis. These Swedish kronor amounts have been converted from various foreign currencies, including the euro at a rate of €1.00 = SEK 9.2415, the average rate calculated on monthly closing rates issued by Reuters.
Cyclicality of end-user markets and commodity prices
Given the industrial nature of our products, we are affected by economic cycles that impact demand in our end-user markets. For example, orders from the oil production and chemical processing industries are dependent on global oil prices, while orders from our customers in the heating, ventilation and air conditioning businesses are subject to the cyclicality of the construction industry in each geographical market we serve. In our higher margin parts and services business, which represented approximately 27% of our net sales in 2002, we generally experience significantly less cyclicality, which contributes to more stable margins. Although we believe our diverse geographic and customer base, as well as our parts and services business, serve to mitigate our exposure to economic cycles in any one region and the volatility of individual industries, we have experienced fluctuations in our operating results due to economic cycles.
During 1998, there was a downturn in the ship building industry that adversely affected our business. With the recovery in 2000 of oil and chemical prices and renewed economic growth in Asia, our orders received increased in 2000 by 12.2% as compared to prior years, excluding currency exchange fluctuations and divested operations. In 2001, our orders received decreased by 1.6%, excluding currency exchange rate fluctuations and divested operations. In 2002, our orders received decreased by 2.0%, excluding currency exchange rate fluctuations and divested operations. As discussed above, market improvements reflected in our orders received generally precede sales growth by several months.
In addition, raw material commodity prices affect our profitability. We generally pass on price increases of raw materials to customers, although increases in the prices of our products generally lag increases in raw material costs. The length of this delay varies, depending on the composition of the relevant backlog of orders. In addition, key raw materials, such as sheet stainless steel, are purchased on the basis of 12-month contracts, which fix the price of sheet stainless steel for the contract period. As a result, benefits in the past have been realised as a result of increases in the price of these materials. When prices for these materials fall, however, market pressures may require us to offer our products at correspondingly lower prices, following which we may experience margin pressures.
I-52
Geographic distribution of sales
Our products are sold in over 100 countries. The following table illustrates our net sales by geographic region in 2000, 2001 and 2002:
| | Year Ended December 31,
| |
|---|
| | Unaudited
Pro Forma
Combined
2000
| | 2001
| | 2002
| |
|---|
| | (% of total sales)
| |
|---|
| European Union | | 42 | | 39 | | 40 | |
| Other Europe | | 8 | | 9 | | 10 | |
| North America(1) | | 22 | | 21 | | 21 | |
| South America | | 4 | | 4 | | 4 | |
| Asia | | 21 | | 24 | | 23 | |
| Africa | | 1 | | 1 | | 0 | |
| Oceania(2) | | 2 | | 2 | | 2 | |
| | |
| |
| |
| |
| Total | | 100 | % | 100 | % | 100 | % |
| | |
| |
| |
| |
- (1)
- Excludes Mexico.
- (2)
- Includes Australia and New Zealand.
We are exposed to changes in a specific country's or region's economic conditions. However, we believe that the diversity of our geographic base mitigates the impact of an economic downturn in any one part of the world on our financial performance.
European Union and Other Europe. Germany, Italy, Sweden, France, United Kingdom, Russian and Denmark are our main markets in Europe. In 2002, the sales increased in Russia, Sweden and France, whereas there was a decrease in the United Kingdom, Italy, Germany and Denmark. After considering acquisitions and disposals and the effect of exchange rate variations, the invoicing increased strongly in Central and Eastern Europe and increased in the Nordic countries, whereas Western Europe is below the level of last year.
North America. The United States has reported a decrease in net sales that is entirely related to the effect of exchange rate variations. This has been partly offset by an increase in invoicing in Canada. After considering the effect of exchange rate variations, the invoicing increased in North America.
South America. Our main markets in South America are Brazil and Chile. Almost all countries in the region have reported lower sales during 2002. This is entirely due to the effect of exchange rate variations. After considering the effect of exchange rate variations, the invoicing increased in Latin America.
Asia. China, India and Japan are our largest markets in Asia. Our sales in Asia, particularly into China and India were strong from 1999 through 2001, following improvements in Asian economies. In 2002, however, this trend ceased and sales in the region decreased compared to 2001 due to weak economic conditions. Also after considering the effect of exchange rate variations, the invoicing in Asia was below the level of 2001.
Oceania and Africa. We experienced a decrease in sales in these regions in 2002.
I-53
Seasonality of end-user markets and invoicing
Some segments of our business have historically experienced generally higher sales in the third and fourth quarters of the calendar year. For example, the heating, ventilation and air conditioning industry and the refrigeration industry experience higher sales due to increased demand for these products in the summer months and prior to the start of late autumn and winter. We also experience strong seasonality of demand in the olive oil business, where separators and decanters must typically be delivered and installed in time for the harvest season in September, October and November. However, we believe our diverse geographic and customer base, in addition to our stable parts and services business, mitigate the effects of seasonality on our financial performance.
Historically, customer spending patterns have also impacted the seasonality of our business, with a substantial number of orders being received during the first and second quarters, which were subsequently recorded as sales in the third and fourth quarters, resulting in higher revenues in these quarters. This trend is especially apparent with regard to contracts for our separation equipment. In contrast, lower cost items, such as valves, fittings and other standard products, are purchased regularly by our customers throughout the year.
The following table sets forth our consolidated orders and net sales for the periods indicated, and the percentage of orders and net sales, respectively, recorded in each quarter of each such period:
| | Unaudited pro forma Combined
Year Ended
December 31,
| | Year Ended December 31,
| |
|---|
| | 2000(1)
| | 2001(2)
| | 2002
| |
| |
|---|
| | (SEK millions)
| | (SEK millions)
| | (SEK millions)
| | (%)
| |
|---|
| Orders Received | | | | | | | | | |
| | First quarter | | 3,923 | | 4,118 | | 3,682 | | 25 | % |
| | Second quarter | | 3,893 | | 4,087 | | 3,964 | | 27 | % |
| | Third quarter | | 3,882 | | 3,983 | | 3,528 | | 24 | % |
| | Fourth quarter | | 3,676 | | 3,706 | | 3,501 | | 24 | % |
| | |
| |
| |
| |
| |
| Total | | 15,374 | | 15,894 | | 14,675 | | 100 | % |
| | |
| |
| |
| |
| |
Net sales |
|
|
|
|
|
|
|
|
|
| | First quarter | | 3,059 | | 3,452 | | 3,262 | | 22 | % |
| | Second quarter | | 3,607 | | 3,807 | | 3,654 | | 25 | % |
| | Third quarter | | 3,714 | | 3,832 | | 3,504 | | 24 | % |
| | Fourth quarter | | 4,632 | | 4,739 | | 4,175 | | 29 | % |
| | |
| |
| |
| |
| |
| Total | | 15,012 | | 15,830 | | 14,595 | | 100 | % |
| | |
| |
| |
| |
| |
- (1)
- Includes operations now divested that had orders of SEK 814 million and generated net sales of SEK 827 million in the year ended December 31, 2000.
- (2)
- Includes operations now divested that had orders of SEK 213 million and generated net sales of SEK 212 million in the year ended December 31, 2001.
I-54
Acquisitions and Divestitures
A number of acquisitions and divestitures have affected our results of operations and financial condition and those of Alfa Laval Holding over the last three years. The following table highlights the most significant of these transactions.
Businesses Acquired
| | Date
| | Sales(1)
|
|---|
| |
| | (SEK in millions)
|
|---|
| Vicarb Group | | January 1999 | | 425 |
| Scandi-Brew | | February 1999 | | 67 |
| Kvaerner Hetland | | March 1999 | | 57 |
| Dorr Oliver | | December 1999 | | 127 |
| Danish Separation Systems A/S | | September 2002 | | 90 |
Businesses Divested
|
|
Date
|
|
Sales(1)
|
|---|
| |
| | (SEK in millions)
|
|---|
| Automation | | July 1998 | | 1,115 |
| Celleco | | September 1998 | | 654 |
| Thermotechnik | | January 1999 | | 49 |
| Cardinal | | November 1999 | | 39 |
| Tetra Pak division of Indian subsidiary | | May 2000 | | 47 |
| Aircoil | | December 2000 | | 51 |
| Rema Control | | January 2001 | | 68 |
| Industrial Flow | | April 2001 | | 656 |
- (1)
- Sales for the most recent year ended prior to transaction in question.
Properties Divested
| | Date
|
|---|
| Oslo (Norway) | | February 2000 |
| Volketswill (Switzerland) | | April 2000 |
| Brentford (UK) | | June 2000 |
| Les Clayes (France) | | July 2000 |
| Tumba (Sweden) | | August 2000 |
| Maarsen (Netherlands) | | September 2000 |
| Johannesburg (South Africa) | | February 2001 |
| Glinde (Germany) | | October 2001 |
| Warminster (US) | | March 2002 |
| Newmarket (Canada) | | February 2003 |
Step-Up in Asset Base; Goodwill Amortisation and Depreciation
Our goodwill increased significantly in 2000, relative to our Predecessor, as a result of the Acquisition of Alfa Laval Holding. The purchase price for the shares of Alfa Laval Holding was SEK 8,286 million, including transaction costs of SEK 72 million. As part of the Acquisition, an excess purchase price of SEK 7,300 million was paid over the net book value of assets acquired. This excess purchase price was attributable to goodwill totalling SEK 3,277 million, which is being depreciated over 20 years, with the balance allocated to tangible and intangible assets in an amount of SEK 4,023 million. This allocation (or "Step-Up") was required to conform with US GAAP and Swedish GAAP accounting standards and was finalised during the second quarter of 2001. In connection with the Acquisition, a restructuring provision of SEK 408 million was recorded. For more detailed information about the book value and the fair value of these tangible and intangible assets, see notes 13 and 14 to our consolidated financial statements, included elsewhere in this annual report.
I-55
Depreciation on the Step-Up (the "Step-Up Depreciation") amounted to SEK 319 million in 2002, SEK 334 million for 2001, and SEK 316 million for 2000 on a pro forma annual basis. This Step-Up Depreciation is included in costs of goods sold within the financial statements of Alfa Laval. The following table sets forth the effects of the Step-Up Depreciation for the years shown:
| | Year ended December 31,
|
|---|
| | Unaudited
Pro Forma
Combined
2000
| | 2001
| | 2002
|
|---|
| | (SEK million)
|
|---|
| Depreciation on pre-Step-Up asset values | | 466 | | 400 | | 331 |
| Step-Up Depreciation | | 316 | | 334 | | 319 |
| | |
| |
| |
|
| Total Depreciation | | 782 | | 734 | | 650 |
| | |
| |
| |
|
Goodwill amortisation amounted to SEK 188 million, SEK 178 million and SEK 164 million for the years ended December 31, 2002, 2001 and 2000, respectively. The increase in goodwill amortisation in 2001 was due primarily to the effects of currency exchange rate fluctuations and additional goodwill relating to the acquisition of shares in Alfa Laval India Ltd., our publicly traded Indian subsidiary. The increase in goodwill amortisation in 2002 was due to the additional goodwill relating to the additional purchase price paid for Alfa Laval Credit Finance AB and the acquisition of shares in Danish Separation Systems A/S. In the near future, management expects that incremental depreciation related to the step-up asset values to be in line with the Step-Up Depreciation for 2002.
Effective Tax Rates
Alfa Laval has significant net operating losses that it can use to offset its taxable income in a number of jurisdictions, primarily in Sweden and the United States. In Sweden, operating losses can be offset against taxable income in perpetuity, until exhausted. In the United States, operating losses can be offset against taxable income for a six year period, after which the tax-loss carry forwards expire. As of December 31, 2002, Alfa Laval had tax-loss carry forwards amounting to SEK 627 million in Sweden and SEK 268 million in the United States. Utilisation of these tax-loss carry forwards may be limited by tax restrictions. As at December 31, 2002, Alfa Laval had SEK 61million in deferred tax assets, comprising tax losses and tax grants.
Goodwill amortisation and Step-Up Depreciation are not tax deductible and consequently have the effect of increasing Alfa Laval's effective tax rate. However, Step-Up Depreciation has been fully provided for as a deferred tax asset and therefore does not result in differences between Alfa Laval's applicable tax rates and the tax rate reported in the income statement as a consequence of the amortisation of this liability in accordance with the amount of Step-Up Depreciation each year.
Change in Financial Reporting
As a result of our organisational redesign discussed above under "Item 5.A: Operating and Financial Review and Prospects—Operating Results—Our Restructuring and Cost Reduction Programme—Beyond Expectations", we now report our financial results by our two reorganised divisions—the Equipment division and the Process Technology division. In addition, certain project sales, engineering, ancillary products and installation services, our common procurement, production and logistics function, certain corporate overhead costs, the financial results of Tri-Lad Inc., our Canadian-based manufacturer of industrial flanges, and certain projects sales in India are incorporated under the heading "Operations and other" as a third financial reporting division. This change has been effective since the beginning of 2001.
I-56
Results of Operations
The following table sets forth certain profit and loss account data as a percentage of sales for the years ended December 31, 2000, 2001 and 2002:
| | Year ended December 31,
| |
|---|
| | Unaudited Pro Forma Combined
| |
| |
| |
| |
| |
|---|
| | 2000
| | 2001
| | 2002
| |
|---|
| | (SEK
millions)
| | (% of sales)
| | (SEK
millions)
| | (% of sales)
| | (SEK
millions)
| | (% of sales)
| |
|---|
| Net sales | | 15,012 | | 100.0 | | 15,830 | | 100.0 | | 14,595 | | 100.0 | |
| Cost of goods sold | | (10,124 | ) | (67.4 | ) | (10,348 | ) | (65.4 | ) | (9,262 | ) | (63.5 | ) |
| | |
| |
| |
| |
| |
| |
| |
| Gross profit | | 4,888 | | 32.6 | | 5,482 | | 34.6 | | 5,333 | | 36.5 | |
| Other operating expenses: | | | | | | | | | | | | | |
| Sales costs | | (2,584 | ) | (17.2 | ) | (2,443 | ) | (15.4 | ) | (2,115 | ) | (14.5 | ) |
| Administrative costs | | (862 | ) | (5.7 | ) | (787 | ) | (5.0 | ) | (1,027 | ) | (7.0 | ) |
| Research and development costs | | (441 | ) | (2.9 | ) | (341 | ) | (2.2 | ) | (355 | ) | (2.4 | ) |
| Other operating income/(costs) | | (157 | ) | (1.1 | ) | (504 | ) | (3.2 | ) | (395 | ) | (2.7 | ) |
| Goodwill Amortisation | | (164 | ) | (1.1 | ) | (178 | ) | (1.1 | ) | (188 | ) | (1.3 | ) |
| Comparison distortion items | | 130 | | 0.9 | | 5 | | — | | (29 | ) | (0.2 | ) |
| | |
| |
| |
| |
| |
| |
| |
| Operating income/(loss) | | 810 | | 5.4 | | 1,233 | | 7.8 | | 1,224 | | 8.4 | |
| Interest and other financial income/(costs) | | (802 | ) | (5.3 | ) | (861 | ) | (5.4 | ) | (764 | ) | (5.2 | ) |
| | |
| |
| |
| |
| |
| |
| |
| Income/(loss) before taxes and minority interests | | 8 | | — | | 373 | | 2.4 | | 460 | | 3.2 | |
| Income tax benefit/(expense) | | (105 | ) | (0.6 | ) | 26 | | 0.2 | | (218 | ) | (1.5 | ) |
| Minority interests | | (48 | ) | (0.3 | ) | (32 | ) | (0.2 | ) | (34 | ) | (0.2 | ) |
| | |
| |
| |
| |
| |
| |
| |
| Net income/(loss) | | (145 | ) | (1.0 | ) | 367 | | 2.3 | | 208 | | (1.4 | ) |
| | |
| |
| |
| |
| |
| |
| |
| Orders received | | 15,374 | | | | 15,894 | | | | 14,675 | | 100.5 | |
| Order backlog | | 4,063 | | | | 4,314 | | | | 4,340 | | 29.7 | |
Years ended December 31, 2001 and 2002
Net Sales
Consolidated. Net sales decreased by SEK 1,235 million, or 7.8%, to SEK 14,595 million in 2002 from SEK 15,830 million in 2001. Our net sales were significantly affected by currency exchange rate fluctuations. On a constant exchange rate basis and excluding divested activities, our consolidated net sales decreased SEK 364 million, or 2.3%. This decrease in net sales was due primarily to weaker sales in both the Process Technology division and in the Equipment division.
Orders received decreased by SEK 1,219 million, or 7.7%, to SEK 14,675 million in the year ended December 31, 2002 from SEK 15,894 million in the year ended December 31, 2001. Orders received for divested operations were SEK 213 million and SEK nil million in 2001 and 2002, respectively. Order backlog increased by SEK 26 million, or 0.6%, to SEK 4,340 million at December 31, 2002 from SEK 4,314 million at December 31, 2001. Order backlog for divested operations was SEK 11 million and SEK nil million in 2001 and 2002, respectively.
I-57
Net sales by division for the year ended December 31, 2001 and 2002 were as follows:
| | Year ended December 31,
|
|---|
| | 2001
| | 2002
|
|---|
| | (SEK in millions)
|
|---|
| Net sales by division | | | | |
| | Equipment | | 8,576 | | 8,130 |
| | Process Technology | | 6,872 | | 6,377 |
| | Operations and other | | 169 | | 88 |
| | |
| |
|
| | | 15,617 | | 14,595 |
| | Divested businesses/businesses for disposal(1) | | 212 | | — |
| | |
| |
|
| Net sales | | 15,830 | | 14,595 |
| | |
| |
|
- (1)
- Includes Industrial Flow, Rema Control, Aircoil and Cardinal.
Equipment. Net sales decreased by SEK 446 million, or 5.2%, to SEK 8,130 million in 2002 compared with SEK 8,576 million in 2001. This decrease was due primarily to the effect of currency exchange rate fluctuations, as well as to a decrease in sales volumes. On a constant exchange rate basis, net sales in our Equipment division decreased by SEK 153 million, or 1.8%. This decrease in net sales was due to decreased sales in the Marine & Diesel customer segment, principally due to fewer contracts for new-buildings at the shipyards. The decrease in net sales in our Equipment division was partially offset by an upturn in sales for both the Parts & Services and OEM customer segments. The increase in net sales in OEM is explained among other factors by an inventory reduction at certain customers that has been completed and the orders have returned to a more normal level.
Orders received decreased by SEK 465 million, or 5.4%, to SEK 8,093 million in the year ended December 31, 2002 from SEK 8,558 million in the year ended December 31, 2001. Order backlog decreased by SEK 83 million, or 5.0%, to SEK 1,565 million at December 31, 2002 from SEK 1,648 million at December 31, 2001.
Process Technology. Net sales decreased by SEK 495 million, or 7.2%, to SEK 6,377 million in 2002 compared with SEK 6,872 million in 2001. This decrease was due primarily to the effects of exchange rate fluctuations. On a constant exchange rate basis, sales in our Process Technology division decreased by SEK 157 million, or 2.3%. This decrease in sales was principally due to decreased sales in the Food Technology and Process Industry customer segments, partially offset by an increase in sales in the Energy & Environment, Life Science and Parts & Service customer segments. Life Science has increased sales principally due to continued investments within pharmaceuticals and biotechnology.
Orders received decreased by SEK 539 million, or 7.7%, to SEK 6,488 million in the year ended December 31, 2002 from SEK 7,027 million in the year ended December 31, 2001. Order backlog increased by SEK 98 million, or 3.7%, to SEK 2,753 million at December 31, 2002 from SEK 2,655 million at December 31, 2001.
Operations and other. Net sales decreased to SEK 88 million in 2002 from SEK 169 million in 2001. This decrease was due primarily to decreased demand.
Costs of Goods Sold
Costs of goods sold decreased by SEK 1,086 million, or 10.5% to SEK 9,262 million in 2002 compared with SEK 10,348 million in 2001. The decrease in cost of goods sold was due primarily to the lower sales volume. In 2002, costs of goods sold also included SEK 319 million of Step-Up Depreciation in connection with the Acquisition of Alfa Laval Holding.
I-58
Gross Profit
Gross profit in 2002 was SEK 5,333, or 36.5% of net sales, as compared to SEK 5,482, or 34.6% of net sales, in 2001. The decrease of SEK 149 million, or 2.7%, was primarily due to the effect of currency exchange rate fluctuations. On a constant exchange rate basis and exclusive of Step-Up Depreciation in 2002 of SEK 319 million, gross profit increased by SEK 40 million, or 0.7%. This increase is a reflection of the increased gross profit margin, which is due to reduced overheads.
Operating Expenses
Sales costs. Sales costs were SEK 2,115 million in 2002 compared with SEK 2,443 million in 2001. The decrease of SEK 328 million, or 13.4%, was due primarily to a changed definition of sales and administration costs, offset in part by customary increases in salaries for employees within the Group.
Administration Costs. Administration costs were SEK 1,027 million in 2002 compared with SEK 787 million in 2001. The increase of SEK 240 million, or 23.4% was due primarily to a changed definition of sales and administration costs, offset in part by cost savings resulting from our "Beyond Expectations" restructuring programme.
Research and Development Costs. Research and development costs increased from SEK 341 million or 2.2% of net sales in 2001 to SEK 355 million or 2.4% of net sales in 2002. This increase was partly due to automatic costs increases related to salaries. Over the next few years, management expect research and development costs to be approximately 2.5% to 3.0% of net sales.
Other Operating Income. Other operating income decreased by SEK 120 million, or 30.8%, to SEK 269 million in 2002 compared with SEK 389 million in 2001 due principally to a number of different factors affecting, among other things, lower rental income and lower reversal of provisions in a large number of our subsidiaries.
Other Operating Costs. Other operating costs decreased by SEK 229 million, or 25.6%, to SEK 664 million in 2002 compared with SEK 893 million in 2001 due to lower restructuring costs and bank charges.
Comparison distortion items, net. Comparison distortion items were a loss of SEK 29 million in 2002 compared to a gain of SEK 5 million in 2001. The comparison distortion items in 2002 were primarily attributable to a loss of SEK 43 million related to the sale of real estate, offset by a further gain of SEK 14 million on the sale of Industrial Flow. Comparison distortion items in 2001 comprised a gain of SEK 10 million realised from the sale of Industrial Flow, offset by a loss of SEK 5 million attributable to the sale of real estate.
Goodwill amortisation. Goodwill amortisation costs were SEK 188 million in 2002 compared with SEK 178 million in 2001. The increase of SEK 10 million, or 5.6%, was due primarily to the additional goodwill relating to the additional purchase price paid for Alfa Laval Credit Finance AB and the acquisition of shares in Danish Separation Systems A/, offset by exchange rate fluctuations.
Operating Income
Operating income decreased to SEK 1,224 million in 2002 from SEK 1,233 million in 2001. This decrease of SEK 9 million was due primarily to exchange rate fluctuations, offset by a decrease of SEK 5 million in Step-Up Depreciation and goodwill amortisation. On a constant exchange rate basis and exclusive of the decrease in goodwill amortisation and Step-Up Depreciation of SEK 5 million and the negative increase in comparison distortion items of SEK 34 million, our operating income increased by SEK 88 million or 5.1%. Included in our operating income are certain one-off costs of SEK 181 million in 2001 and SEK 72 million in 2002, related to our restructuring programme.
I-59
Adjusted EBITA
The following table shows the development of the Adjusted EBITA for 2001 and 2002:
| | Year ended
December 31,
|
|---|
| | 2001
| | 2002
|
|---|
| | (SEK millions)
|
|---|
| Operating Income | | 1,233 | | 1,224 |
| Amortisation of goodwill | | 178 | | 188 |
| Step-Up Depreciation | | 334 | | 319 |
| | |
| |
|
| EBITA | | 1,745 | | 1,731 |
| Comparison distortion items | | (5 | ) | 29 |
| | |
| |
|
| Adjusted EBITA | | 1,740 | | 1,760 |
| | |
| |
|
Adjusted EBITA increased by SEK 20 million in 2002 to SEK 1,760 million compared to SEK 1,740 million in 2001. On a constant exchange rate basis, excluding divested operations, the increase in Adjusted EBITA was SEK 88 million.
Net Interest and Other Financial Income/Costs
Interest and other financial income/costs decreased by SEK 97 million, or 11.3%, to SEK 764 million in 2002 compared with to SEK 861 million in 2001. Total bank borrowings amounted to SEK 3,360.2 million at the end of 2002 compared to SEK 4,573.1 million at the end of 2001. The total financial indebtedness including leasing and interest bearing pension liabilities amounted to SEK 4,518.7 million at the end of 2002 compared to SEK 6,651.6 million at the end of 2001. These two circumstances have reduced the interest costs by SEK 187.2 million or 29.0%. During 2002, the net realised and unrealised exchange gains and losses improved by SEK 171.8 million compared to 2001. The financial comparison distortion cost of SEK 290.7 million offset most of these improvements. This is relating to two items. In connection with the repayment of the previous syndicated loans and the amortisation of the bond loan, capitalised financing costs of totally SEK 205.5 million have been reversed. On June 24, 35 percent of the bond loan of EUR 220 million was amortised. This was made at a premium of 12.125 percent corresponding to one year's interest, which amounted to SEK 85.2 million. Both of these costs have been reported as comparison distortion financial costs.
Income Taxes
The Swedish statutory tax rate on income was 28.0% in 2002 and 2001. Our weighted average tax rate was 33% in 2002 and 35% in 2001. Alfa Laval's taxation charge was SEK 218 million in 2002, compared with a taxation credit of SEK 26 million in 2001 primarily due to reimbursement of taxes in prior years.
Net Income
Principally as a result of the above factors, Alfa Laval had net income of SEK 208 million in 2002 compared with net income of SEK 367 million in 2001.
Years ended December 31, 2000 and 2001
We are the successor company of Alfa Laval Holding, the Predecessor. The information discussed for the year ended December 31, 2000 is based on the Swedish GAAP pro forma combined results for the period ended December 31, 2000, as disclosed elsewhere in this annual report. The Acquisition, more fully described under "Item 4: Information about the Company—History and Development of
I-60
Alfa Laval Holding AB, the Company and the Guarantor", affected our accounting for depreciation and amortisation of tangible and intangible assets (all included in the costs of goods sold), goodwill amortisation, interest expense and deferred income taxes. The Acquisition had no impact on our accounting for net sales or on other operating expenses.
Net Sales
Consolidated. Net sales increased SEK 818 million, or 5.4%, to SEK 15,830 million in 2001 from SEK 15,012 million in 2000. The increase in our consolidated net sales was partially offset by the loss of sales volumes resulting from the sale of our Industrial Flow business in April 2001, our Rema Control business in January 2001 and our Aircoil business in December 2000, which collectively contributed sales volumes of approximately SEK 827 million in 2000. Our net sales were also significantly affected by currency exchange rate fluctuations. Excluding divested activities and the effects of currency exchange rate fluctuations, our consolidated net sales increased SEK 142 million, or 0.9%. This increase was due primarily to stronger sales in our Process Technology division and, to a lesser degree, in our Equipment division.
Orders received increased by SEK 520 million, or 3.4%, to SEK 15,894 million in 2001 from SEK 15,374 million in 2000. Orders received for divested operations were SEK 814 million and SEK 213 million in 2000 and 2001, respectively. Order backlog increased by SEK 251 million, or 6.2%, to SEK 4,314 million at December 31, 2001 from SEK 4,063 million at December 31, 2000. Order backlog for divested operations was SEK 138 million and SEK 1 million in 2000 and 2001, respectively.
Net sales by division for the years ended December 31, 2000 (on a pro forma combined basis) and December 31, 2001 were as follows:
| | Year ended December 31,
|
|---|
| | Unaudited Pro forma Combined
| |
|
|---|
| | 2000
| | 2001
|
|---|
| | (SEK in millions)
|
|---|
| Net sales by division | | | | |
| | Equipment | | 7,981 | | 8,576 |
| | Process Technology | | 5,776 | | 6,872 |
| | Operations and other(1) | | 428 | | 169 |
| | |
| |
|
| | | 14,185 | | 15,617 |
| | Divested businesses/businesses for disposal | | 827 | | 212 |
| | |
| |
|
| Net sales | | 15,012 | | 15,830 |
| | |
| |
|
- (1)
- Includes Industrial Flow, Aircoil and Rema Control for 2000 and includes Industrial Flow and Rema Control only for 2001.
Equipment. Net sales increased by SEK 595 million, or 7.5%, to SEK 8,576 million in 2001 compared with SEK 7,981 million in 2000. This increase was due primarily to the effect of currency exchange rate fluctuations and an increase in sales volumes. On a constant exchange rate basis, net sales in our Equipment division increased marginally by SEK 2 million, or 0.1%. This increase in net sales was due to an increase in net sales in the Marine & Diesel and Fluids & Utility customer segments and an increase in net sales in the Comfort & Refrigeration customer segment, which was partly offset by a loss of sales volumes resulting from the sale of our Aircoil business in December 2000. The increase in net sales in our Equipment division was partially offset by a decrease in sales in the Sanitary customer segment, principally due to reduced demand from the food, dairy and
I-61
brewing industries. Net sales in the OEM customer segment also decreased, while sales from the division's parts and services business decreased marginally.
Orders received increased by SEK 398 million, or 4.9%, to SEK 8,558 million in the year ended December 31, 2001 from SEK 8,160 million in the year ended December 31, 2000. Order backlog increased by SEK 175 million, or 11.9%, to SEK 1,648 million at December 31, 2001 from SEK 1,473 million at December 31, 2000.
Process Technology. Net sales increased by SEK 1,096 million, or 19.0%, to SEK 6,872 million in 2001 compared with SEK 5,776 million in 2000. This increase was due primarily to an increase in sales volumes and the effects of exchange rate fluctuations. On a constant exchange rate basis, sales in our Process Technology division increased by SEK 606 million, or 9.7%. This increase was due to an increase in sales in the parts and services business and an increase in sales in the Energy & Environment, Life Science Technology, Water Technology and Process Industry customer segments. The increase in sales in the Energy & Environment customer segment was attributable to an increase in capital investment by oil companies in order to increase production capacity in view of higher oil prices during early 2001. The increase in this customer segment also reflects increased demand for separation decanters and, to a lesser extent, heat exchangers in the waste-water treatment industries in view of new EU environmental legislation requiring greater separation of effluents in the waste-water treatment industry. The increase in net sales in the Water Technology customer segment was due to a large order backlog in 2000 which was processed and invoiced during 2001, together with our adoption of a more selective approach in favour of capital sales with higher margins to customers in the land based desalination industry. Increased sales in the Process Industry customer segment reflected a large order backlog in 2000 which was processed and invoiced during 2001. Net sales from the Food Technology customer segment remained unchanged, as increased sales volumes were offset by the effects of the foot and mouth and BSE crises, together with a delay in the payment of EU subsidies to producers of olive oil and a decrease in capital investment in the eastern European brewing industry as a result of substantial prior investment in recent years.
Orders received increased by SEK 839 million, or 13.6%, to SEK 7,027 million in the year ended December 31, 2001 from SEK 6,188 million in the year ended December 31, 2000. Order backlog increased by SEK 344 million, or 14.9%, to SEK 2,655 million at December 31, 2001 from SEK 2,311 million at December 31, 2000.
Operations and other. Net sales decreased to SEK 169 million in 2001 compared with SEK 428 million in 2000. This decrease was due primarily to a decrease in sales in respect of our Indian subsidiary due to the invoicing of a very large order during 2000 and the effects of currency exchange rate fluctuations.
Cost of Goods Sold
Costs of goods sold increased by SEK 224 million, or 2.2%, to SEK 10,348 million in 2001 compared with SEK 10,124 million in 2000. This increase in costs of goods sold was due to higher overall sales volumes, the effect of currency exchange rate fluctuations and the reallocation of approximately SEK 90 million of shipping department costs, previously recorded as sales costs, to costs of goods sold in order to conform Alfa Laval's accounting practices among the various entities within the group. Costs of goods sold also increased as a result of provisions in respect of bad debts and claims. The increase in cost of goods sold was partially offset by the benefits of our Beyond Expectations restructuring programme, including a reduction in production overhead costs (primarily headcount reductions), the closure of certain manufacturing plants and procurement initiatives aimed at reducing the cost of raw materials. In 2001, costs of goods sold also included SEK 334 million of Step-Up Depreciation in connection with the Acquisition of Alfa Laval Holding, compared with, SEK 316 million in 2000.
I-62
Gross Profit
Gross profit in 2001 was SEK 5,482 million, or 34.6% of net sales, as compared to SEK 4,888 million, or 32.6% of net sales, in 2000. The increase of SEK 594 million, or 12.2%, was primarily due to the effects of currency exchange rate fluctuations. On a constant exchange rate basis, gross profit increased by SEK 214 million, or 4.1%. This increase was due to sales volume increases consequent upon higher utilisation of manufacturing facilities, a reduction in overhead costs and the positive effects of transactional currency exchange rate fluctuations, offset by a combination of negative price developments and an adverse change in the mix of products and services sold.
Operating Expenses
Sales Costs. Sales costs decreased by SEK 141 million, or 5.5%, to SEK 2,443 million in 2001 compared with SEK 2,584 million in 2000. This decrease included currency exchange rate fluctuations which increased sales costs by SEK 201 million, or 7.8%. Part of the decrease in sales costs was due to the effect of divestments completed in 2001, particularly the sale of Industrial Flow, which decreased sales costs by approximately SEK 100 million. In addition, there was a reallocation of approximately SEK 90 million of shipping department costs to cost of goods sold in order to conform Alfa Laval's accounting practices among the various entities within the group, as well as the effects of restructuring efforts—principally headcount reductions—which resulted in a decrease in sales costs of approximately SEK 150 million.
Administration Costs. Administration costs decreased by SEK 75 million, or 8.7%, to SEK 787 million in 2001 compared with SEK 862 million in 2000. This decrease included currency exchange rate fluctuations, which increased our administration costs by SEK 55 million, or 6.4%. The decrease in administration costs was due in part to the impact of divestments completed in 2001, including the sale of Industrial Flow, which decreased administration costs by approximately SEK 40 million, or 4.7%. In addition, the net of the effects of restructuring efforts—principally headcount reductions and other savings—and of salary increases resulted in a decrease in administration costs of approximately SEK 90 million.
Research and Development Costs. Research and development costs decreased from SEK 441 million, or 2.9% of net sales, in 2000 to SEK 341, or 2.2% of net sales, in 2001. This decrease was due to the timing of expenditures with respect to research and development projects as no major project was concluded in 2001. Research and development costs also decreased due to currency exchange rate fluctuations and divestments completed in 2001, including the sale of Industrial Flow.
Other Operating Income. Other operating income decreased by SEK 137 million, or 26.0%, to SEK 389 million in 2001 compared with SEK 526 million in 2000 due principally to a number of different factors affecting, among other things, commission, royalty, rental and license income in a large number of our subsidiaries.
Other Operating Costs. Other operating costs increased by SEK 210 million, or 30.8%, to SEK 893 million in 2001 as compared with SEK 683 million in 2000, as a result of additional restructuring charges of approximately SEK 70 million in relation to our Operations division, changes in accounting treatment in relation to commissions paid to third-party sales representatives amounting to an increase of approximately SEK 120 million, an increase in other financial costs of approximately SEK 40 million and the effect of currency exchange rate fluctuations, which negatively impacted our other operating costs by approximately SEK 35 million, together with cash discounts and the disposal of fixed assets and certain other items which reduced our other operating costs by approximately SEK 55 million.
Comparison Distortion Items, net. Comparison distortion items were a gain of SEK 5 million in 2001 due to a gain of SEK 10 million realised from the sale of Industrial Flow, offset by a loss of SEK 5 million attributable to the sale of real estate. Comparison distortion items were primarily a gain of
I-63
SEK 130 million in 2000 due primarily to gains from the sale of real estate amounting to SEK 222 million, a refund for past premiums related to a prior defined benefit plan amounting to SEK 271 million and costs amounting to SEK 394 million related to the write off of the excess purchase price allocated to inventories and ongoing research and development at the time of the Acquisition.
Goodwill amortisation. Goodwill amortisation costs increased to SEK 178 million in 2001 compared with SEK 164 million in 2000. The increase of goodwill amortisation costs was due primarily to the effects of currency exchange rate fluctuations and goodwill relating to the acquisition of further shares in Alfa Laval India Ltd., our publicly traded Indian subsidiary.
Operating Income
Operating income increased by SEK 423 million, or 52.2%, to SEK 1,233 million in 2001 compared with SEK 810 million in 2000. This increase was due primarily to an increase in gross profit, and the effect of our restructuring measures, more fully described under "Item 5.A: Operating and Financial Review and Prospects—Operating Results—Our Restructuring and Cost Reduction Programme—Beyond Expectations" above. Currency exchange rate fluctuations also positively impacted our operating income. On a constant exchange rate basis, our operating income increased by SEK 354 million, or 40.4%. Included in our operating income are certain one-off costs of SEK 170 million in 2000 and SEK 232 million in 2001, primarily related to our restructuring programme.
Adjusted EBITA
The following table shows the development of the Adjusted EBITA for 2000 and 2001:
| | Year ended December 31,
| |
|---|
| | Unaudited
Pro forma
Combined
| |
| |
|---|
| | 2000
| | 2001
| |
|---|
| | (SEK millions)
| |
|---|
| Operating income | | 810 | | 1,233 | |
| Amortisation of goodwill | | 164 | | 178 | |
| Step-Up Depreciation | | 316 | | 334 | |
| | |
| |
| |
| EBITA | | 1,290 | | 1,745 | |
| Comparison distortion items | | (130 | ) | (5 | ) |
| | |
| |
| |
| Adjusted EBITA | | 1,160 | | 1,740 | |
| | |
| |
| |
Adjusted EBITA increased by SEK 580 million in 2001 to SEK 1,740 million compared to SEK 1,160 million in 2000. The increase was due primarily to an increase in the gross profit and cost savings due to our restructuring efforts. On a constant exchange rate basis, excluding divested operations, the increase in Adjusted EBITA was SEK 522 million.
Net Interest and Other Financial Income/Costs
Interest and other financial income/costs increased by SEK 59 million, or 7.2%, to SEK 861 million in 2001 compared with SEK 802 million in 2000. This increase was due primarily to the weakened Swedish kronor, which increased interest costs on our non-Swedish-kronor-based debt by approximately SEK 70 million, and an increase of approximately SEK 30 million in unrealised net currency exchange losses. This increase in net interest and other financial costs was notwithstanding our lower outstanding debt balances, which in turn reduced interest costs payable on our debt. In 2001, our debt balances decreased by approximately SEK 1,536 million, on a constant exchange rate basis. This
I-64
decrease was due to amortisations and pre-payments made by utilising cash from our operating activities and the proceeds of business and property disposals. Interest rates also decreased, which resulted in reduced interest payments on our local finance facility drawings.
Income Taxes
The Swedish statutory tax rate on income was 28.0% in 2001 and 2000. Our weighted average tax rate was 35.0% in 2001 and 2000. Alfa Laval's taxation credit was SEK 26 million in 2001 primarily due to reimbursement of taxes in prior years, compared with a taxation charge of SEK 105 million in 2000.
Net Income
Principally as a result of the above factors, Alfa Laval had net income of SEK 367 million in 2001 compared with a net loss of SEK 145 million in 2000.
5.B. Liquidity and Capital Resources
The following summary of certain provisions of our Senior Notes, the Existing Senior Credit Facility, the Subordinated Loan, the Intercompany Note and the Intercreditor Agreement and continuing indebtedness does not purport to be complete and is subject to, and is qualified in its entirety by reference to, the underlying documents.
In November 2000, we issued €220 million in aggregate principal amount of 121/8% Senior Notes due 2010 in reliance on exemptions from registration requirements under the US Securities Act of 1933, as amended (the "Securities Act"). In July 2001, we completed a public exchange offer pursuant to which our Senior Notes issued in November 2000 were exchanged for substantially identical Senior Notes registered under the Securities Act.
Interest on the Senior Notes is paid semi-annually in arrears on May 15 and November 15, beginning May 15, 2001. Holders of the Senior Notes may under certain circumstances be entitled to receive additional payments in respect of taxes and similar charges in respect of payments on the Senior Notes.
The Senior Notes are redeemable (i) at any time prior to November 15, 2005 in whole but not in part at our option at 100% of their principal amount, plus an applicable redemption premium and accrued and unpaid interest, and (ii) at any time on or after November 15, 2005 at our option, at 106.063% of their principal amount, plus accrued and unpaid interest, declining to 100% of their principal amount, plus accrued and unpaid interest, on or after November 15, 2008.
In the event that, as a result of any change or amendment to the laws or treaties of Sweden or certain other jurisdictions, we become obligated to pay material additional payments that we determine cannot be avoided by taking reasonable measures, the Senior Notes are redeemable in whole but not in part at 100% of their principal amount plus accrued and unpaid interest, at our option. We may also, at our option, redeem up to 35% of the Senior Notes using the net proceeds of one or more public equity offerings received by us, at 112.125% of their principal amount, plus accrued and unpaid interest to the redemption date.
On June 24, 2002, we redeemed 35%, or €77 million, of the Senior Notes with the proceeds of the Offering.
The Senior Notes rank equal in right of payment with all of our other unsecured and unsubordinated indebtedness, and are senior in right of payment to any of our future subordinated indebtedness. The Senior Notes are also guaranteed on a senior subordinated basis by Alfa Laval Credit Finance AB.
I-65
The indenture governing the Senior Notes is subject to the Trust Indenture Act of 1939, as amended. It contains covenants applicable to us and certain of our subsidiaries, including Alfa Laval Credit Finance AB, limitations and requirements with respect to indebtedness, restricted payments, dividends and other payments affecting restricted subsidiaries, the ownership of capital stock of restricted subsidiaries, issuances of guarantees of indebtedness by restricted subsidiaries, transactions with affiliates, liens, asset sales, consolidations and mergers and the provision of financial statements and reports. The indenture also requires us to make an offer to purchase all outstanding Senior Notes at a purchase price of 101% of their principal amount upon the occurrence of a change of control. Under the terms of the indenture, the Offering did not cause a change of control to occur. In addition, under certain circumstances, we are required by the indenture to offer to purchase the Senior Notes with the proceeds of sales of certain assets. The indenture also provides for events of default which, if any of them occurs, would permit or require the principal of, premium, if any, interest and any other monetary obligations on the Senior Notes to become or to be declared to be immediately due and payable.
As of April 2, 2003 our Senior Notes, which are listed on the Luxembourg Stock Exchange, traded at 118%. This is the most recent date the Senior Notes were traded.
For a description of the optional redemption provisions of our Senior Notes, see "Item 5.B:—Maturity Profile of Our Borrowings" below.
- •
- The Existing Senior Credit Facility
Following completion of the Offering, we refinanced borrowings under our Previous Senior Credit Facility with borrowings under our Existing Senior Credit Facility. Our Existing Senior Credit Facility comprises a senior multi-currency credit facility with SEB Merchant Banking, a unit within Skandinaviska Enskilda Banken AB (publ) and Svenska Handelsbanken AB (publ), as arrangers, of up to €575 million and is structured in two tranches—a Tranche A €425 million 5 year multi-currency term loan facility and a Tranche B €150 million 5 year multi-currency revolving credit facility. Following the Offering, we to applied the proceeds of Tranche A mainly to the refinancing of term loans under our Previous Senior Credit Facility and for other purposes in connection with the Offering. We use the proceeds of Tranche B for working capital and other general corporate purposes.
Borrowings under the Existing Senior Credit Facility are guaranteed by Alfa Laval AB, our parent, us, Alfa Laval Credit Finance AB, the Guarantor of our Senior Notes, and Alfa Laval Holding AB, on a joint and several basis.
The Existing Senior Credit Facility may be cancelled and/or pre-paid without premium in whole or in part, in minimum amounts of €5 million, or, if greater, in integral multiples of €1 million with the giving of appropriate notice. If a change of control occurs (that is, if any person or group of persons, other than Tetra Laval B.V. and any of its affiliates and Industri Kapital 2000 Ltd. and any of its subsidiaries and any partnership in which Industri Kapital 2000 Ltd. or any of its subsidiaries is general partner, acquire shares in Alfa Laval AB representing more than 50% of Alfa Laval AB's share capital or voting rights), the borrowers may be required by the lenders to prepay the Existing Senior Credit Facility.
The interest payable on each tranche will be the relevant inter-bank rate plus a relevant margin and mandatory costs.
In connection with the Existing Senior Credit Facility, on April 29, 2002, we entered into inter-creditor arrangements under which the Intercompany Note between us and Alfa Laval Credit Finance AB, is subordinated to debt outstanding under the Existing Senior Credit Facility. The guarantee of the Senior Notes given by Alfa Laval Credit Finance AB is also subordinated to outstandings under the Existing Senior Credit Facility. These subordination arrangements include restrictions on the repayment of, or payments in relation to, this intercompany loan. The additional condition subsequent under the
I-66
Existing Senior Credit Facility was that all the security under the Previous Senior Credit Facility be released.
The Existing Senior Credit Facility contains financial covenants which are required ratios of consolidated net debt to consolidated EBITDA of the group, consolidated EBITDA to total interest expense of the group and consolidated net debt to shareholders' equity of the group. In addition to these, there are other covenants, including covenants which restrict borrowing by certain subsidiaries, the creation of security interests over the assets of the group, lending, the giving of guarantees by members of the group and the disposal of assets by members of the group.
The Existing Senior Credit Facility also contains standard representations and warranties customarily found in credit agreements for similar financings. There are standard events of default, including (i) failure to pay, (ii) misrepresentation, (iii) certain events of insolvency and (iv) cross default.
There are no hedging requirements under our Existing Senior Credit Facility.
On August 24, 2000 Alfa Laval AB, our parent company, issued a subordinated vendor note for €200.0 million to the vendor, Tetra Laval B.V. The Subordinated Loan carried interest at 12% per annum, which was capitalised annually in arrears and paid on maturity. The Subordinated Loan was scheduled to be repaid on the date that was (i) ten years and six months after the later of the date of issuance of the vendor note and the date of issuance of the notes or, (ii) if earlier, a flotation or trade sale.
Upon consummation of the Offering, Alfa Laval AB used the proceeds from the Offering and the exercise of the Management Warrants and drawings under the Existing Senior Credit Facility to, among other things, repay the Subordinated Loan on May 23, 2003, together with accrued and unpaid interest thereon.
Funds advanced to us at the time of the Acquisition were on lent to the Guarantor under an intercompany loan facility (the "Intercompany Note") entered into on August 22, 2000 between us and the Guarantor. The Intercompany Note remained in place following the issuance of our Senior Notes on November 9, 2000. Interest is payable thereunder semi-annually in arrears at a rate which matches the funding requirement for interest payments on our Senior Notes.
The Intercompany Note is repayable on demand by us. Payments and other rights under the Intercompany Note are subordinated under, or otherwise subject to the terms of, the Intercreditor Agreement for the Existing Senior Credit Facility. The Intercreditor Agreement provides for payment suspensions and limitations on enforcement in relation to the Intercompany Note.
On April 29, 2002, we, the Guarantor, the financial institutions named as lenders in Schedule 1 and SEB Merchant Banking as facility agent entered into an intercreditor agreement (the "Intercreditor Agreement"). The Intercreditor Agreement sets out the respective rights of certain creditors of us and the Guarantor as regards ranking of debt, security, enforcement and subordination.
Ranking of Debt and Security. The Intercreditor Agreement provides, among other things, that liabilities under the Existing Senior Credit Facility will rank for all purposes and at all times in priority to the Intercompany Note.
I-67
Certain Restrictions on Payment and Enforcement. The Intercreditor Agreement prohibits payments under the Intercompany Note except to fund (i) any scheduled payments due on the Senior Notes, (ii) any payments of principal, interest, premium, additional amounts and amounts payable on account of taxes in relation to the Senior Notes, (iii) any amounts payable to the trustee on the Senior Notes, and (iv) dividends to Alfa Laval AB or otherwise fund Alfa Laval AB to enable it to pay dividends or other amounts for corporate purposes. However payments to us under the Intercompany Note will be suspended, in the case of a payment default, under the Existing Senior Credit Facility until such payment default is remedied and, in the case of a non payment default, for 179 days after a payment blockage notice has been served (or if earlier until such default is remedied or waived or the Existing Senior Credit Facility is repaid in full). Only one such blockage notice can be served in a 365-day period. The Intercreditor Agreement provides that, in addition to the payment blockage described above, no enforcement action can be taken by us in relation to the Intercompany Note prior to the date the Existing Senior Credit Facility is repaid in full unless (i) an insolvency event occurs in relation to the Guarantor or (ii) default occurs in relation to our Senior Notes (unless as a result of a default under the Existing Senior Credit Facility) and (1) we have notified the facility agent under the Existing Senior Credit Facility of such default, (2) a period of not less then 120 days has passed from the date of receipt of such notice and (3) the default is still continuing at the end of such period. Enforcement action includes any demand for payment or commencement of legal proceedings.
The Intercreditor Agreement prohibits any payments or distributions of any kind to us by the Guarantor, except as permitted by the previous paragraph or with the consent of the facility agent for the Existing Senior Credit Facility.
- •
- Other Continuing Indebtedness
In addition to the debt we will or may incur under the Existing Senior Credit Facility and our Senior Notes, we and our operating subsidiaries will continue to retain other debt, contingent liabilities and receivable discounting facilities.
We have central bilateral committed facilities with banks for the provision of guarantees and letters of credit in amounts of up to €119 million. In addition, we have central bilateral uncommitted facilities with banks for the provision of loans, guarantees and letters of credit in amounts of up to €92 million.
In addition, we are entitled by the Existing Senior Credit Facility to retain, at our operating subsidiaries, borrowings and guarantees for financial indebtedness, counter-indemnities for third party performance bonds and guarantees (which are not in respect of financial indebtedness) and receivable discounting facilities (with recourse) up to agreed limits. Utilisations of our local facilities must also fall within the general financial indebtedness ratios set by our Senior Notes and the Existing Senior Credit Facility.
As at December 31, 2002 there was approximately €32.8 million outstanding of borrowings and guarantees for financial indebtedness under local facilities, which included:
- •
- a loan in PLN equivalent to €3.3 million incurred by Wytwornia Separator Krakow Sp.z.o.o in Poland;
- •
- a loan of €3.8 million incurred in Italy by Alfa Laval SpA; and
- •
- a loan in DKK equivalent to €6.2 million incurred by Alfa Laval LKM A/S in Denmark.
Approximately €127 million in face amount of guarantees and performance bonds (of which €44 million refers to performance bonds) have been issued and were outstanding as of December 31, 2002 on behalf of various operating subsidiaries by banks, insurance companies and other financial institutions. The performance bonds and guarantees were issued to support performance under contracts entered into in the ordinary course of business.
I-68
Some of our operating subsidiaries, principally in Italy and Spain, have receivable discounting facilities, which allow for the discounting of receivables from time to time. These facilities were utilised in an amount of €22 million as at December 31, 2002. The financial institutions with whom these receivables are discounted have recourse to us in respect of most of these receivables if they prove unable to collect them.
Liquidity Requirements
Historically, our principal sources of funds have been cash flows from operations, equity contributions, financings from third-party financial institutions and, prior to the Acquisition, borrowings from Tetra Laval. In the future, we expect that our principal sources of funds will be cash flows from operations and we intend to use a significant portion of such cash to continue to reduce our debt. Our liquidity requirements arise primarily from funding our working capital requirements and our capital expenditures for the general maintenance of our facilities and to meet our ongoing debt service requirements. Due to the seasonality of our business, our liquidity needs are highest in the second and third quarters of our fiscal year.
On April 29, 2002 we entered into a Existing Senior Credit Facility of up to €575 million, comprising a € 425 million 5 year term loan facility, and a €150 million 5 year revolving credit facility. We used drawings under the Existing Senior Credit Facility to refinance our Previous Senior Credit Facility. There is no amortisation schedule in respect of the term loan facility. We expect that we will need to refinance all or part of the Existing Senior Credit Facility at maturity, in order to make full repayment.
We replaced our old €79 million ancillary facilities under the Previous Senior Credit Facility with new central bilateral facilities in an amount of up to €35 million and our old syndicated guarantee facilities with new central bilateral guarantee facilities of up to €145 million. We also retain local facilities at our operating companies within the limits to be provided under the Existing Senior Credit Facility for financial indebtedness, receivable financing facilities and counter-indemnities for performance bonds and guarantees (which are not treated as part of financial indebtedness).
I-69
Sources and Amounts of Cash Flows
Cash Flow from Operating, Investing and Financing Activities
The table below sets forth the principal components of Alfa Laval's cash flow for the years indicated:
| | Year ended December 31,
| |
|---|
| | Unaudited Pro forma
Combined
2000
| | 2001
| | 2002
| |
|---|
| | (SEK in millions)
| |
|---|
| Operating income | | 810 | | 1,233 | | 1,224 | |
| Depreciation and amortisation | | 946 | | 912 | | 838 | |
| Adjustment for non cash items | | 141 | | 4 | | 35 | |
| | |
| |
| |
| |
| | | 1,897 | | 2,150 | | 2,097 | |
| Taxes paid | | (360 | ) | (463 | ) | (396 | ) |
| | |
| |
| |
| |
| Cash flow from operations before changes in working capital | | 1,537 | | 1,687 | | 1,701 | |
| | |
| |
| |
| |
| Changes in working capital: | | | | | | | |
| | (Increase)/decrease of current receivables | | (253 | ) | 209 | | 340 | |
| | (Increase)/decrease of inventories | | 48 | | 263 | | 140 | |
| | Increase/(decrease) of liabilities | | 298 | | (182 | ) | (134 | ) |
| | |
| |
| |
| |
| | | 94 | | 290 | | 346 | |
| Cash flow from operating activities | | 1,630 | | 1,977 | | 2,047 | |
| | |
| |
| |
| |
| Cash flow from investment activities | | (8,284 | ) | 112 | | (548 | ) |
| | |
| |
| |
| |
| Cash flow from financing activities | | 6,618 | | (2,069 | ) | (1,443 | ) |
| | |
| |
| |
| |
Cash flows from operating activities were SEK 2,047 million in 2002 compared with SEK 1,977 million in 2001. This increase was due primarily to reduction in net working capital. Cash flows from operating activities were SEK 1,977 million in 2001 compared with SEK 1,630 million in 2000. This increase was due primarily to an increase in operating income and a reduction in net working capital.
Cash flows from investing activities decreased by SEK 660 million from a positive cash flow of SEK 112 million in 2001 to a negative cash flow of SEK 548 million in 2002. This decrease in cash flow from investing activities was principally due to the additional purchase price paid for Alfa Laval Credit Finance and the acquisition of Danish Separation Systems A/S together with the lack of proceeds from divested business compared to 2001. Cash flows from investing activities increased by SEK 8,396 million from a negative cash flow of SEK 8,284 million in 2000 to a positive cash flow of SEK 112 million in 2001. This increase in cash flow from investing activities was principally due to the Acquisition during 2000, a decrease in investments in fixed assets, a decrease in provisions, an increase in proceeds received from the sale of certain businesses, and an increase in cash resulting from a tax-related reduction in purchase price.
Cash flows from financing activities increased in 2002 to a negative cash flow of SEK 1,443 million as compared to negative cash flow of SEK 2,069 million in 2001 due to new issue of shares of SEK 819 million. Cash flows from financing activities decreased in 2001 to a negative cash flow of SEK 2,069 million as compared to the positive cash-flow of SEK 6,618 million in 2000 due to the absence of any shareholder contribution, as compared to the shareholder contribution received in 2000 in connection with the Acquisition, an increase in unrealised foreign exchange gains/losses and an increase
I-70
in liabilities to credit institutions as a result of repayments we made during 2001 in relation to our Previous Senior Credit Facility.
Commitments for Future Capital Expenditure
For a discussion of our historical capital expenditure, see "Item 4.A: Information on the Company—Historic Capital Expenditures".
We are currently investing primarily in replacement machinery and equipment, as well as to increase the capacity for the production of brazed heat exchangers. An investment in additional plate pressing capacity and brazing furnaces at our Ronneby facility in Sweden and our Jiang Yin City facility in China commenced in late 2000 and was completed in 2002.
We have funded, and expect to continue funding, such capital investments from cash generated from our business operations.
Maturity Profile of Our Borrowings
Under the Existing Senior Credit Facility, if a change of control occurs, we may be required by the lenders to prepay the Existing Senior Credit Facility. We are also permitted to make voluntary prepayments on the loans under the Existing Senior Credit Facility. Borrowings under the Existing Senior Credit Facility will bear interest at applicable interbank offered rates for varying interest periods, plus a margin and mandatory costs.
Our Senior Notes are scheduled to be repaid in one instalment in 2010. However, holders of our Senior Notes will be able to require us to purchase the Senior Notes in the event of a change of control. We will not be able to do so without the consent of our lenders under the Existing Senior Credit Facility. In addition, prior to November 15, 2003, we will be permitted to repurchase up to 35% of our Senior Notes at specified redemption rates from the proceeds of a public equity offering and, prior to November 15, 2005, we will be permitted to repurchase all but not part of our Senior Notes at their principal amount plus an applicable redemption premium.
Following the Offering on May 17, 2002, we redeemed 35%, or €77 million, of the outstanding principal amount of our Senior Notes, together with accrued and unpaid interest thereon with the proceeds of the Offering.
We believe that cash flow generated from our operations, together with amounts available under the revolving credit facility under the Existing Senior Credit Facility and new central bilateral facilities, local financing facilities and existing cash balances should be sufficient to fund our debt service requirements, working capital needs, anticipated capital expenditures and other operating needs for the foreseeable future. We expect, however, that we will need to refinance all or a part of our Senior Notes at final maturity. Our future operating performance and ability to service or refinance our existing and future debt, including our Senior Notes, will be subject to future economic conditions and to financial, business and other factors, many of which are beyond our control. See the discussion in the section "Item 3.D: Key Information—Risk Factors".
I-71
Contractual Obligations and Commercial Commitments
The following summaries our contractual obligations and other commercial commitments as of December 31, 2002, and the effect such obligations and commitments are expected to have on our liquidity and cash flow in future periods:
Contractual Obligations
| | Payments Due by Period
|
|---|
| | Total
| | Less than 1 year
| | 1-3 years
| | 4-5 years
| | After 5 years
|
|---|
| | (SEK millions)
|
|---|
| Long Term Debt | | 4,233.4 | | — | | 41.1 | | 3,064.7 | | 1,127.6 |
| Capital Lease Obligations | | 24.7 | | 11.3 | | 10.0 | | 3.4 | | — |
| Operating Leases | | 328.2 | | 96.0 | | 133.9 | | 49.8 | | 48.5 |
| Other Long Term Obligations | | 61.1 | | 61.1 | | | | | | |
| | |
| |
| |
| |
| |
|
| Total Contractual Cash Obligations | | 4,647.4 | | 168.4 | | 185.0 | | 3,117.9 | | 1,176.1 |
Other Commercial Commitments
| | Amount of Commitment Expiration Per Period
|
|---|
| | Total Amounts
Committed
| | Less than 1 year
| | 1-3 years
| | 4-5 years
| | Over 5 years
|
|---|
| | (SEK millions)
|
|---|
| Guarantees | | 798.0 | | 266.0 | | 532.0 | | | | |
| Other Commercial Commitments | | 900.0 | | 409.7 | | 490.3 | | | | |
| | |
| |
| |
| |
| |
|
| Total Commercial Commitments | | 1,698.0 | | 675.7 | | 1,022.3 | | | | |
Restrictions on Ability of Subsidiaries to Transfer Funds
Our only assets are shares in our wholly owned subsidiary, the Guarantor, and an intercompany loan to the Guarantor. Our cash flow and our ability to service our Senior Notes and any other debt depend solely upon the cash flow of our subsidiaries and our receipt of funds from them in the form of loans, dividends, interest or otherwise. Our subsidiaries may not generate cash flow sufficient to enable us to meet our payment obligations.
In addition, the terms of the Existing Senior Credit Facility and the Intercreditor Agreement restrict our subsidiaries' ability to provide funds to us. See "Item 5.B: Operating and Financial Review and Prospects—Liquidity and Capital Resources—Intercreditor Agreement" above. This ability may be further restricted by applicable laws and regulations and the terms of other agreements to which our subsidiaries may become subject. In particular, the Intercreditor Agreement prohibits payments under the inter-company loan except to fund (i) any scheduled payments due on the Senior Notes, (ii) any payments of principal, interest, premium, additional amounts and amounts payable on account of taxes in relation to the Senior Notes, (iii) any amounts payable to the trustee on the Senior Notes, and (iv) dividends to Alfa Laval AB or otherwise fund Alfa Laval AB to enable it to pay dividends or other amounts for corporate purposes. However payments to us under this loan will be suspended in the case of a payment default under the Existing Senior Credit Facility until such payment default is remedied and in the case of a non payment default for 179 days after a payment blockage notice has been served (or if earlier until such default is remedied or waived or the senior credit facility is repaid in full). Only one such blockage notice can be served in a 365 day period. The Intercreditor Agreement provides that, in addition to the payment blockage described above, no enforcement action can be taken by us in relation to the Inter-company Loan prior to the date of repayment of the Existing Senior Credit
I-72
Facility unless (i) an insolvency event occurs in relation to the Guarantor or (ii) default occurs in relation to our Senior Notes (unless as a result of a default under the Existing Senior Credit Facility) and (1) we have notified the facility agent under the Existing Senior Credit Facility of such default, (2) a period of not less then 120 days has passed from the date of receipt of such notice and (3) the default is still continuing at the end of such period.
Until the date on which all indebtedness under the Existing Senior Credit Facility has been fully repaid, to the extent and subject to the restrictions described in the previous paragraph, the Intercreditor Agreement and the Existing Senior Credit Facility permits us to make payments of principal on our Senior Notes.
5.C. Research and Development, Patents and Licenses, etc.
Our research and development expenditure was SEK 441 million (2.9% of total sales), SEK 341 million (2.2% of total sales) and SEK 355 million (2.4% of total sales) in the three years 2000, 2001 and 2002 respectively. Management expect research and development expenditure to be approximately 2.5% to 3.0% of net sales in the foreseeable future.
We conduct research and development at various facilities and employ approximately 300 qualified engineers and technicians. The research and development function for our Process Technology division is located in four centres, in Copenhagen (Denmark), Grenoble (France), Lund (Sweden) and Tumba (Sweden). The research and development function for our Equipment division is located in six centres, in Alonte (Italy), Tumba (Sweden), Lund (Sweden), Moatti (France), Richmond (USA) and Kolding (Denmark).
As a result of our research and development efforts in heat transfer we have achieved the following results. In the Process Technology division the unique plate condensor, named AC 600, was completed and the first order secured in December 2002. In 2002, the Equipment division launched CB 20, a new brazed heat exchanger for district heating applications. This new concept radically increases heat transfer coefficiency. Compared with its predecessors, the CB 20 boosts output by approximately 30%. Also launched in 2002 was the AlfaGreen, a range of high performance axial condenser air units with high capacity and low refrigerant hold-up volume.
In the centrifugal separation market, the Process Technology division continues to develop sterilisable centrifuges for the bio-pharmacy industry. In addition, a new hermetic separator with extremely gentle treatment for mammalian cell cultures was sent for field tests in December 2002. A new olive oil separator based on the new marine platform is expected to be launched in time for the 2003 olive oil campaign. In 2002, the Equipment Division launched Alfie 200, a small adaptable direct-drive separator designed for workshops with a small number of machine tools. Alfie 200 keeps the coolants clean and free from tramp oil and thus from bacteria. Tool life can therefore be improved by approximately 20% and the fluid disposal and replacement costs can be reduced by up to 75%.
In the sanitary flow sector, our main product launches during 2002 were the LKH 120 multistage pump for high pressure applications, for example in filtration systems within the dairy and bio pharmacy industries for nano filtration or reverse osmosis and also the STP rotary lobe pump for trailers transporting sanitary products.
During 2002, our Process Technology division brought 29 new centrifuges to the market. For heat exchangers only one new product was introduced, as a lot of resources were used to upgrade the complete range of heat exchangers to new pressure vessel codes called PED. New projects for 2003 include a large separator for dehydration of heavy crude oils, which is expected to enable exploration of difficult-to-process heavy crude oil deposits. Field tests are scheduled for December 2003 in the United States. For wastewater sludge treatment, Alfa Laval has recently started marketing of a new automatic optimisation solution that can reduce operating cost in sewage treatment plants substantially.
I-73
A complete range of new cost efficient sewage decanters is expected to be launched during mid of 2003. The plate condenser concept will be further extended with larger units. Our Equipment division has a strong focus on future market requirements and customer demands and research and development projects are often conducted in close cooperation with OEMs (Original Equipment Manufactures) who are using Alfa Laval products as an integrated part of their product offering. York International, Carrier International and US companies within cooling, heating and ventilation are such examples. Expanding and developing our technology into new applications is one of our growth strategies. One such example is Alfdex, a crank case gas cleaner for heavy diesel vehicles. The oil mist is efficiently separated from the gas and thereby meeting the emission requirements in 2005.
We own approximately 185 patents relating to the design of our products, a number of which we consider to be important to our business. The Alfa Laval® trademark is owned by us and is registered in approximately 100 countries.
Many of our products are based on established technology but all material improvements are continuously patented to the extent possible. Our pool of proprietary information, consisting of know-how and trade secrets relating to the design, manufacture and operation of our products and their use, is considered particularly important and valuable. Accordingly, we protect this proprietary information, principally through the inclusion of confidentiality clauses in employment contracts with our workforce. In general, we are the owner of the rights to the products which we manufacture and sell, and we are not dependent in any material way upon any license or franchise to operate.
5.D. Trend Information
We expect orders received during 2003 to show a limited increase compared to 2002. The major part of the increase is expected through acquired activities together with a marginal organic growth during the latter part of 2003. The uncertainty that currently characterises the world economy means, however, that such forecasts are uncertain.
Our restructuring programme,"Beyond Expectations", that will be completed by the end of 2003, is expected to result in continued savings during 2003.
I-74
ITEM 6: DIRECTORS, SENIOR MANAGEMENT AND EMPLOYEES
6.A. Directors, Senior Management and Employees
Directors
At present, our board of directors is composed of three members, including the chairman. None of the directors are affiliated with our principal shareholders. The current members of our board, their positions and the years of their original elections are as follows:
Name
| | Member Since
| | Age
| | Position
|
|---|
| Thomas Thuresson | | 2002 | | 45 | | Chairman |
| Sigge Haraldsson | | 2000 | | 58 | | Director |
| Johan Ahlgren | | 2002 | | 41 | | Director |
Thomas Thuresson has been our chairman since 2002. He is also our chief financial officer of the Group. He held various positions at PLM in Sweden and Germany. Mr. Thuresson joined Alfa Laval in 1988 and has held various positions, including controller of business area Automation 1988 to 1990, controller of business area Flow from 1990 to 1991 and vice president group controller from 1991 to 1994. He has served in his current role since 1995, with key responsibilities including group finance and control, treasury, real estate and information technology. Mr. Thuresson received his Bachelor's Degree in Business Administration from the University of Lund in 1981. Mr. Thuresson has no outside directorships.
Johan Ahlgren has been our director since 2002. Mr. Ahlgren is General Counsel of the Alfa Laval Group. He worked as a notarial clerk at the District Court of Ängelholm from 1986 to 1988 and as a lawyer at Wistrand Advokatbyrõ from 1988 to 1992. Mr Ahlgren joined Alfa Laval in 1992. He worked as Corporate Counsel from 1992 to December 1999 in Group staff legal matters. He has held his current position since January 2000. Mr. Ahlgren holds a Master of Law from the University of Lund, which he received in 1986. Mr. Ahlgren has no outside directorships.
Sigge Haraldsson, the Alfa Laval Group chief executive officer since 1998, has been a director of ours since 2000. From 1970 to 1992, Mr. Haraldsson has held various positions within the Alfa Laval Group, including president of Alfa Laval Thermal AB from 1983 to 1992. From 1993 to 1998, he was a member of the Tetra Pak group management, initially heading Processing and Packaging Systems, and from 1995 heading the Fibre Packaging division, the largest of the three divisions in Tetra Pak. He received a M.Sc. from LTH in 1970. Mr. Haraldsson is a member of the board of Hans Stahles Minnesfond.
I-75
Senior Management
Alfa Laval Special Finance has no directly employed members of senior management. However, the following table sets forth the names of the Alfa Laval Group's executive officers. Such executive officers are appointed by and serve at the discretion of the board of directors of Alfa Laval AB.
Name
| | Year of
Employment
| | Age
| | Position
|
|---|
| Sigge Haraldsson | | 1970 | | 58 | | Chief Executive Officer |
| Thomas Thuresson | | 1988 | | 45 | | Chief Financial Officer |
| Svante Karlsson | | 1984 | | 47 | | Executive Vice President, Equipment |
| Yannick Richomme | | 1986 | | 50 | | Executive Vice President, Process Technology |
| Ulf Granstrand | | 1975 | | 55 | | Executive Vice President, Operations |
| Per Erik Lindquist | | 2001 | | 43 | | Executive Vice President, Regions |
| Peter Leifland | | 1985 | | 49 | | Executive Vice President, Regions |
| Peter Torstensson | | 1999 | | 47 | | Vice President, Corporate Communications |
| David Ford | | 1993 | | 48 | | Senior Vice President, Human Resources |
| Nils Olof Björk | | 1975 | | 56 | | Senior Vice President, Corporate Development |
Sigge Haraldsson.See above.
Thomas Thuresson.See above.
Svante Karlsson is an executive vice president of Alfa Laval and president of our Equipment division. Mr. Karlsson joined us in 1984, where he has held various positions, including president of our former business area Thermal from 2000 until 2001, managing director of business segment Marine & Power from 1995 to 2000, business area controller of our former business area Separation from 1991 to 1995 and financial controller of Alfa Laval Industrie B.V., the Netherlands from 1986 to 1988. He has held his current position since 2001. Mr. Karlsson holds a B.Sc. in Business Administration.
Yannick Richomme is an executive vice president of Alfa Laval and president of our Process Technology division. Mr. Richomme has held various positions with us since 1986, including president of business area Separation from 1998 until 2001, managing director of Alfa Laval Separation Inc., USA from 1996 to 1998 and managing director of Alfa Laval SnC France from 1993 to 1996. He has held his current position since 2001. Prior to joining us, Mr. Richomme was managing director at Bran & Luebbe, France from 1989 to 1993. Mr. Richomme has a M.Sc. in Chemistry from the University of Limoges in France and an AMP from INSEAD in France.
Ulf Granstrand is executive vice president for Operations. Since joining us in 1975, Mr. Granstrand has been executive vice president with regional responsibilities from 1999 to 2000, president of business area Thermal from 1992 to 1999 and head of business unit "Heat Transfer Components" from 1987 to 1992. Mr. Granstrand holds a M.Sc. from CTH.
Per Erik Lindquist is an executive vice president with regional responsibilities. Mr. Lindquist joined us in 2001, prior to which he was employed by Scania where he worked in the European sales and marketing organisation. Mr. Lindquist was formerly managing director of Scania, Belgium, a post he held until 2000. Mr. Lindquist holds an M.Sc. from Royal Institute of Technology, Stockholm.
Peter Leifland is an executive vice president with regional responsibilities. Since joining us in 1985, Mr. Leifland has been senior vice president in Alfa Laval group management from 1997 to 1999, president of Alfa Laval Engineering AB from 1995 to 1997 and vice president and General Counsel from 1990 to 1995. He has held his current position since 1999. Mr. Leifland holds an LL.B., Lic. Spec and IMD (PED).
Peter Torstensson is a vice president with overall responsibility for corporate communications. He has held this position since 1999. Prior to that, he was managing director and key account director of
I-76
Borstahusen Informationsdesign from 1992 to 1998 and managing director and account director of Marknadsbyrån, Malmö, Sweden from 1988 to 1991.
David Ford is senior vice president with overall responsibilities for personnel and human resources. Mr. Ford has held this position since 1993. Prior to that, he was personnel manager and director of Tetra Pak U.K. from 1990 to 1993, and technical training manager of Tetra Pak, U.K. from 1986 to 1990. He holds a diploma in Careers Guidance and a B.Sc. in Mechanical Engineering.
Nils Olof Björk became our senior vice president responsible for corporate development in April 2002. Mr. Björk joined Alfa Laval in 1975 and since then has held various positions in the company. He started as head of the materials laboratory in Lund, followed by positions as product manager for heat exchangers, head of Thermal in Canada, marketing director at Alfa Laval Thermal in Lund, head of Alfa Laval, Asia Pacific in Hong Kong and, since 1996, president of Alfa Laval, Japan. Mr. Björk has an M.Sc. and Ph.D. in chemistry from Lund University, Sweden.
None of the above members of senior management has any family relationship with any director or any other member of senior management.
6.B. Compensation
Total compensation, including salaries and pension payments paid by us and our subsidiaries to (a) the current members of our board of directors and (b) the executive officers who were employed by us in the year ended December 31, 2002 were approximately SEK 2 million and SEK 26 million, respectively.
The compensation of our board of directors is not based upon any bonus targets nor linked to stock options.
Total compensation paid to our auditors, Ernst & Young, for the year ended December 31, 2002 was approximately SEK 13 million.
6.C. Board Practices
Under the Swedish Companies Act, our board of directors is ultimately responsible for the organisation and the management of our affairs. According to our articles of association, the board of directors shall consist of no less than three members and no more than eight members, excluding union representatives.
Under Swedish law, the managing director and at least half of our board members must be resident in a European Economic Area country unless exempted by the Swedish Patent and Registration Office. Under Swedish law, a director's term of office (other than a union appointee) may not be more than four years, but is normally one year. Our articles of association provide that board members shall be elected at the annual general meeting of shareholders for a period until the end of the next annual general meeting of shareholders. A director may, however, serve any number of consecutive terms.
Directors elected at the general meeting of the shareholders may be removed from office by a meeting of the shareholders, and vacancies on the board, except when filled by an alternate director, may only be filled by a resolution of shareholders. Each year, if not otherwise stipulated in our articles of association, one director is elected chairman of the board by resolution of the board (unless elected by our shareholders) at the first meeting following its appointment.
Committees of the Board
Our remuneration committee consists of Thomas Oldér, Björn Savén and Jörn Rausing. The remuneration committee meets when necessary, but usually not less than twice a year. Executive
I-77
directors are invited to attend the remuneration committee's meetings as the members consider appropriate. The remuneration committee establishes and reviews remuneration and terms of employment of our executive directors, senior executives and other key personnel.
Management Service Contracts
Unless required by legislation, we aim to have "at will" contracts with our senior management. Upon termination, our senior management is typically entitled to one month's pay per year of service, subject to a minimum of 6 months' and a maximum of 24 months' compensation. Each contract with our senior management includes a non-competition clause.
Sigge Haraldsson, in his capacity as our chief executive officer, has an early retirement clause in his service contract which gives him the option of retiring at 60 years of age at his request, or 55 years of age at the request of the company. He is entitled to a pension equal to 50.0% of his pensionable salary at the time of retirement if he retires after reaching 55 years of age but before reaching 58 years of age, and 70.0% of his pensionable salary at the time of retirement after 58 years of age irrespective of when he retires.
After the age of 65 years, Sigge Haraldsson is entitled to the following pension benefits:
For the part of Sigge Haraldsson's salary at the time of retirement that corresponds to an amount up to 30 basic amounts (one basic amount being equivalent to SEK 37,900 in 2002 under the National Insurance Scheme), Sigge Haraldsson is entitled to Swedish mandatory legal benefits and the Swedish ITP pension plan scheme ("IPT"). For that part of Sigge Haraldsson's salary at the time of retirement that corresponds to an amount between 30 basic amounts and 80 basic amounts, Sigge Haraldsson is entitled to receive an amount which is 52.5% of such salary. For that part of Sigge Haraldsson's salary Haraldsson is entitled to receive an amount which is 32.5% of such salary.
For that part of Sigge Haraldsson's salary at the time of retirement that corresponds to an amount up to 30 basic amounts,, Mr Haraldsson's surviving family is entitled to a family pension in accordance with ITP. For that part of Sigge Haraldsson's salary at the time of retirement that corresponds to an amount of 30 basic amounts and above, Mr Haraldsson's surviving family is entitled to receive a family pension which is 16.3% of such amount. In addition to his entitlements under ITP, Sigge Haraldsson has a special family pension that represents a life long supplement.
Sigge Haraldsson does not have any separate agreement in relation to severance pay.
During 2002, we have recorded costs in relation to Mr. Haraldsson's pension premiums of SEK 7.2 million, of which SEK 3.4 million relates to premium payments he would be entitled to receive upon early retirement.
Early retirement agreements are also in place for those directors and members of senior management over 50 years of age. This currently includes Ulf Granstrand, our Executive Vice President for Operations, and approximately 20 managing directors throughout Alfa Laval. No other termination agreements exist with our directors and members of senior management.
6.D. Employees
Alfa Laval Special Finance AB has no direct employees. However, during the years ended December 31, 2002, 2001 and 2000 the Alfa Laval group employed 9,292, 9,693 and 11,001 employees, respectively. These figures are based on the average number of employees in each year.
I-78
The following charts illustrate the geographical and functional distribution of the Alfa Laval group workforce for the year ended December 31, 2002:
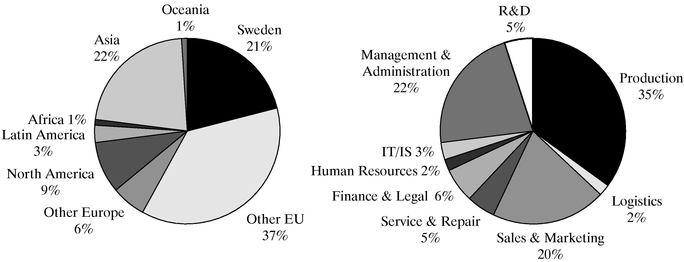
The majority of our manufacturing personnel are members of a trade union, with the exception of those located at our manufacturing unit in Richmond, USA and those located at smaller manufacturing units in countries where union representation is not customary. Our sales personnel are typically not represented by trade unions. None of our senior management are members of any trade union. We believe that our relations with our employees and the unions to which they belong are good and we expect favourable relations to continue in the future.
6.E. Share Ownership
For a discussion of share ownership of the Company, see "Item 7: Major Shareholders and Related Party Transaction".
I-79
ITEM 7: MAJOR SHAREHOLDERS AND RELATED PARTY TRANSACTIONS
7.A. Major Shareholders
We were incorporated on March 27, 2000 by Alfa Laval AB as part of the Acquisition more fully described in "Item 4.A: Information About the Company—History and Development of Alfa Laval Holding AB, the Company and the Guarantor". At the time of this Acquisition, Alfa Laval AB owned all of our outstanding shares. The outstanding shares of the Guarantor were previously held by Alfa Laval N.V. until August 24, 2000. As part of the Acquisition the Guarantor was sold to us.
The following table sets forth information regarding the ownership of Alfa Laval AB's ordinary shares as of December 31, 2002. Alfa Laval AB still owns all of our outstanding shares, and we still own all of the outstanding shares of Alfa Laval Credit Finance AB, the Guarantor. As of the date of this annual report, Alfa Laval AB had 111,671,993 shares outstanding. All shareholders have the same voting rights.
Beneficial Owner
| | Number of Shares
Beneficially Owned
| | Percentage of
Shares
Beneficially
Owned
| |
|---|
Industri Kapital 2000(1)
26 New Street
St. Helier
Jersey
JE2 3RA
Channel Islands | | 30,010,391 | | 26.9 | % |
Tetra Laval B.V.
Amsteldijk 166
1079 LH Amsterdam
The Netherlands | | 19,744,014 | | 17.7 | % |
| Robur Fonder | | 4,553,660 | | 4.1 | % |
| State Street Bank and Trust Co. | | 4,283,520 | | 3.8 | % |
| ALECTA | | 3,789,300 | | 3.4 | % |
| Deutsche Bank | | 3,457,261 | | 3.1 | % |
| Tredje AP-fonden | | 3,414,000 | | 3.1 | % |
| ATP DK Client | | 2,497,828 | | 2.2 | % |
| SEB and Enskilda | | 2,467,996 | | 2.2 | % |
| HQ-fonder | | 2,334,221 | | 2.1 | % |
| Other | | 35,119,802 | | 31.4 | % |
| | |
| |
| |
| Total | | 111,671,993 | | 100 | % |
| | |
| |
| |
- (1)
- Industri Kapital 2000 represents eleven limited partnerships through a contractual arrangement through which Industri Kapital 2000 Ltd., as general partner in each limited partnership, exercises management control. The directors of Industri Kapital 2000 Ltd. are Bo Ennerberg, Björn Savén, Michael Richardson, Peter Byrne, Kim Wahl, Gerrit Russelman, Carl-Johan Granvik, and Hannu Ryöppönen. The alternate directors are Jan-Willem van Oostveen, Esa Auvinen, Niklas Johansson, Michael Rosenlew, Gustav Öhman, Alan Oke Dart, Michael Robinson and Stephanie Guyer. Except for Björn Saven and Kim Wahl, each of these directors disclaim beneficial ownership of the shares managed by Industri Kapital 2000 Ltd.
Industri Kapital is a private equity firm, which has significant experience and expertise in the manufacturing, service, retailing, speciality chemicals and building materials industries. Industri Kapital creates value in companies through refining strategy, operations and by restructuring. Industri Kapital
I-80
has, through its four funds, acquired 45 European companies since 1989 and has a current portfolio of 25 companies. The Industri Kapital 2000 Fund comprises a number of limited partnerships, the general partner of each of which is Industri Kapital 2000 Ltd.
Tetra Laval B.V. is a member of the Tetra Laval group. Tetra Laval is a privately owned Swedish group headquartered in Switzerland with its major subsidiary being Tetra Pak. Tetra Pak develops, manufacturers and markets systems for the processing, packaging and distribution of liquid food. With approximately 20,900 employees, Tetra Pak had € 7.5 billion in sales in 2002.
To our knowledge, there are no arrangements the operation of which may at a subsequent date result in a change of control of us or the Guarantor.
In order to repay € 220 million under a bridge loan facility, which was arranged as part of the financing of the Acquisition, we issued € 220 million Senior Notes. Our Senior Notes are guaranteed by the Guarantor.
7.B. Related Party Transactions
The Tetra Laval group of companies, which includes Tetra Pak International S.A. and all affiliated companies which are under the management control of Tetra Pak International S.A., together with the Tetra Laval holding and financial entities as of the date of this annual report, is a privately owned group of companies with its major subsidiary being Tetra Pak. Tetra Pak develops, manufacturers and markets systems for the processing, packaging and distribution of liquid food. With approximately 20,900 employees, Tetra Pak had € 7.5 billion in sales in 2002. The Tetra Laval group acquired the Alfa Laval group in 1991. Alfa Laval Holding AB was acquired by us in August 2000. See "Item 4.A: Information about the Company—History and Development of Alfa Laval Holding AB, the Company and the Guarantor" for a description of this Acquisition.
The Tetra Laval group is one of our most important customers. For example, Tetra Pak, the major subsidiary within the Tetra Laval group which develops, manufactures and markets systems for the processing, packaging and distribution of liquid food, is currently our single largest customer, accounting for 5.7% of our sales in 2002. Tetra Pak is also the preferred distributor of certain of our sanitary products, principally to liquid food processor end-users, the area in which Tetra Pak itself operates.
Our chief executive officer, Sigge Haraldsson, was a member of the Tetra Pak group management from 1993 to 1997. Both Finn Rausing and Jörn Rausing, each a director of Alfa Laval AB, are directors of Tetra Laval. Tetra Laval B.V., which currently owns 17.7% of our outstanding share capital of Alfa Laval AB, is a wholly-owned subsidiary of Tetra Laval.
Vendor Warrant
Pursuant to the terms of an amended and restated investment and shareholders' agreement and the terms of an amended and restated management shareholders' agreement relating to the Alfa Laval group, each dated August 2000, Tetra Laval B.V. held a warrant (the Vendor Warrant) to subscribe for shares worth up to €40 million if Industri Kapital 2000's internal rate of return exceeds certain specified levels upon a trade sale or public offering of shares in Alfa Laval AB. Pursuant to the terms of an agreement dated April 23, 2002, the parties agreed to settle this obligation in cash, amounting to €40 million (SEK 368 million), upon consummation of the Offering. The Vendor Warrant was assigned to Tetra Laval Finance Ltd., prior to the execution of this agreement.
Purchasing Contract with Tetra Pak
In June 1999, Alfa Laval AB, on behalf of itself and all the companies in which our subsidiary, Alfa Laval Holding AB, directly or indirectly holds or controls more than 50% of the votes of all
I-81
shares, and Tetra Pak International SA, on behalf of all the Tetra Pak companies under the control of the Tetra Laval group, entered into an agreement which governs the relationship between the two companies in the areas of distribution, research and development, market sales and information, use of trademarks and intellectual property.
The agreement addresses the price and terms upon which all purchasing transactions between the Alfa Laval companies and the Tetra Pak companies are effected. The agreement provides that representatives acting on behalf of the Alfa Laval companies and the Tetra Pak companies will, subject to the terms of the agreement, agree upon the following matters from time to time:
- •
- products which are subject to the agreement;
- •
- prices of these products, applicable discounts and sales allowances;
- •
- geographical markets and product areas where the Tetra Pak companies will or will not be the Alfa Laval companies' preferred distributors;
- •
- the right of Tetra Pak to affix its trademarks to agreed Alfa Laval products;
- •
- sales goals of the Tetra Pak companies in defined geographical markets;
- •
- products and technologies that are the focus of joint research and development and the goals, funding obligations, and ownership rights of products that result from joint research and development; and
- •
- use of market and sales information.
The agreement, originally to remain in place through December 31, 2001, was extended for two further years during 2002, and will now remain in effect until December 31, 2003, subject to termination by either party upon 12 months' written notice.
Prices are fixed on a calendar year basis, taking into account the following factors:
- •
- Tetra Pak's efforts in establishing the market, sales and distribution organisation for the products;
- •
- order volumes;
- •
- price competitiveness; and
- •
- that prices of products sold to Tetra Pak are no less favourable to Tetra Pak than prices we offer to third parties.
Tetra Pak as Preferred Distributor in Tetra Pak Areas
Under this agreement, Tetra Pak is the preferred distributor of those Alfa Laval products covered by the agreement in specified geographical areas for specified customer segments. The Alfa Laval companies do not actively sell directly to end-users in the Tetra Pak areas, except for spare parts under certain limited circumstances, subject to Tetra Pak using reasonable endeavors to ensure good and adequate market coverage with end-users in these areas. The Alfa Laval companies also offer Tetra Pak certain lead time advantages (ranging from six to twelve months) in introducing certain new products for which Tetra Pak has contributed in the development or design through joint research and development activity. These lead time advantages do not apply in relation to customers outside the Tetra Pak areas or in respect of customers who request to buy from the Alfa Laval companies directly. The agreement does not restrict the ability of the Alfa Laval companies to market and sell their products to indirect channels such as OEMs, contractors and distributors; provided, however, the Alfa Laval companies have agreed, where such an undertaking is in compliance with applicable legislation, not to actively market and sell Alfa Laval dairy separators to these indirect channels. Alfa Laval is
I-82
unrestricted in actively promoting its products to end-users if the products will be used for purposes other than food processing.
Use of Tetra Pak Trademarks; Market and Sales Information
Tetra Pak has the right to brand with its own trademark certain Alfa Laval products for which Alfa Laval has granted written permission to Tetra Pak. In order to evaluate the efficiency of the parties' activities under the agreement, the parties exchange market and sales information in accordance with this agreement.
Intellectual Property Rights
The agreement also provides for cooperation in research and development processes relating to the products subject to the agreement. The agreement provides that Alfa Laval retains ownership of any invention related to products that result from joint research and development efforts by the parties; Tetra Pak is granted a perpetual, irrevocable, free and non-exclusive license to use the invention. Tetra Pak owns any invention deriving from joint research and development and related to process applications within the Tetra Pak areas, provided that Alfa Laval has a perpetual, irrevocable, free and non-exclusive license to use this invention. Tetra Pak further owns any invention that was 100% funded by Tetra Pak, provided that Alfa Laval has a non-exclusive, perpetual and irrevocable right to use such invention outside the Tetra Pak Areas subject to a royalty payment to be agreed upon on a case-by-case basis. Sub-licensing of either the Alfa Laval or the Tetra Pak licenses granted under the agreement requires consent from both parties during an initial period of five years from the time a product incorporating the invention is first marketed.
Future Offerings Agreement
Tetra Laval B.V. and Industri Kapital 2000 Ltd. have entered into an agreement with Alfa Laval AB regarding future offerings and sales of ordinary shares by Tetra Laval and/or Industri Kapital 2000. The agreement provides, among other things, that at the request of Tetra Laval and/or Industri Kapital 2000, Alfa Laval will cooperate in future offerings of ordinary shares, including assisting in the preparation of an offering circular, making all filings with all relevant authorities and stock exchanges required to complete such transaction, participating in marketing efforts and entering into customary agreements for such transactions. The agreement provides that Alfa Laval cannot be required to cooperate in more than two offerings and that Tetra Laval and/or Industri Kapital 2000 will pay the offering related expenses.
7.C. Interest of Experts and Counsel
Not applicable.
I-83
ITEM 8: FINANCIAL INFORMATION
8.A. Consolidated Statements and Other Financial Information
The audited consolidated financial statements for Alfa Laval Special Finance AB are included under "Item 17: Financial Statements". Except for the consolidated financial statements included under Item 17, our auditors have audited no other information in this annual report.
Export Sales
For a breakdown of our net sales in Europe, North America, Latin America, Asia and other jurisdictions, see "Item 4.B: Information about the Company—Business Overview".
Legal Proceedings
Desert Storm. In addition to routine legal proceedings incidental to the conduct of our business, some of our subsidiaries, along with approximately 70 other defendants, have been sued in two lawsuits in the District Court for Brazoria County in Texas USA arising from claims related to injuries allegedly suffered in the Gulf War. The lawsuits, which were initiated in 1994, claim damages in excess of US$1.0 billion (SEK 10.5 billion) each and allege that equipment supplied by our subsidiaries, among other defendants, was used to create Iraqi weaponry. With the exception of one of our defendant subsidiaries, we have filed motions to dismiss for lack of personal jurisdiction in the state of Texas and have been awaiting a ruling from the trial court since November 1995. While we consider our liability remote, litigation is impossible to predict and there can be no assurance that we will not be found liable for these claims, which could have a material adverse effect on our financial condition.
Tetra Laval B.V. has indemnified us in respect of any losses we may suffer in respect of these claims in accordance with indemnification provisions set forth in the Share Sale and Purchase Agreement. These provisions provide that any amounts paid under this indemnification shall not exceed an amount determined by reference to a formula set forth in the Share Sale and Purchase Agreement. This amount is approximately €800 million (SEK 7.5 billion). Claims may be brought under the indemnity for fifteen years from the date of the Acquisition. This indemnity from Tetra Laval B.V. was secured by a pledge of its shares in Alfa Laval AB to us, Alfa Laval Special Finance AB, the wholly owned subsidiary of Alfa Laval AB. However, this pledge was released upon consummation of the Offering. Tetra Laval B.V. currently owns 17.7% of the outstanding share capital in Alfa Laval AB. Tetra Laval B.V. may sell further shares in Alfa Laval AB. In addition, the Share Sale and Purchase Agreement requires Tetra Laval B.V. to maintain minimum net worth targets, which decrease over time. Tetra Laval B.V. is currently obliged to maintain minimum shareholders' equity of € 280 million through June 30, 2004; thereafter €140 million from July 1, 2004 through December 31, 2006 and €70 million from January 1, 2007 through December 31, 2010. There can be no guarantee that this indemnification will cover all related claims or losses or that the indemnifying party will have sufficient assets to cover such claims or losses.
Asbestos related lawsuits in the United States. During the second half of 2002, a subsidiary of ours in the United States, Alfa Laval Inc., was named with increasing frequency as a co-defendant in lawsuits related to injuries allegedly suffered from the use of asbestos. These lawsuits relate to claims alleging injuries from exposure to asbestos primarily from the 1930s to the end of the 1970s. Historically, claims against Alfa Laval Inc. had been dismissed due to lack of relevance or have been settled for insignificant amounts, far below expected defence costs.
As of February 15, 2003, Alfa Laval Inc., was named as a co-defendant in a total of 73 asbestos-related lawsuits with a total of approximately 15,000 plaintiffs. Alfa Laval Inc. is only named as one of numerous defendants. The lawsuits do not identify any Alfa Laval products that we believe could form the basis for liability. Eleven multiple plaintiff lawsuits, filed in the State of Mississippi, account for
I-84
99% of all plaintiffs. We strongly believe the claims against us are without merit and intend to vigorously contest each lawsuit.
Since November 4, 2002, 13 lawsuits have been dismissed, giving a total of 30 lawsuits that have been dismissed for lack of connection to Alfa Laval Inc. Moreover, one multiple plaintiff lawsuit in Mississippi, with 507 plaintiffs, has been dismissed from state court and transferred to a federal court, which is expected to dismiss all claims from plaintiffs with no manifested illness. This lawsuit, however, is still included in the total count. Since November 4, 2002, Alfa Laval Inc. has also been named as a co-defendant in an additional 19 lawsuits with a total of approximately 7,500 plaintiffs. 99.7% of the increase of plaintiffs is related to multiple plaintiff lawsuits filed in Mississippi. The State of Mississippi has adopted a new law, which took effect on January 1, 2003, that legal experts expect to limit the filing of multiple plaintiff lawsuits after December 31, 2002. It is believed that this new law is the principal driving force behind the increase of lawsuits during the latter part of 2002. We are not aware of any new multiple plaintiff lawsuits filed against Alfa Laval Inc. during 2003.
After thorough investigations we continue to believe that potential claims in connection with the asbestos related lawsuits against Alfa Laval Inc. will be covered by insurance policies. Furthermore, primary insurance policies issued in favour of Alfa Laval Inc. provide for coverage of its defence costs.
Based on current information and Alfa Laval's understanding of these lawsuits, we continue to believe that these lawsuits will not have a material adverse effect on our financial condition or results of operation.
Amylum Group proceedings. In April 1999, the Amylum Group initiated court proceedings in France against Dorr-Oliver for property damage and personal injuries resulting from the alleged failure of high-speed separators manufactured by Dorr-Oliver. In December 1999, Alfa Laval Separation Inc. acquired Dorr-Oliver's intellectual property rights to their high-speed separators, including the rights in relation to the products involved in the Amylum suit. Pursuant to the Sale and Purchase Agreement, Dorr-Oliver agreed to indemnify Alfa Laval Separation Inc. for any litigation related to these products. Amylum has nevertheless included Alfa Laval Separation Inc. and a French subsidiary, Alfa Laval snc, as defendants in these proceedings, along with a number of other defendants. Amylum's claim is presently estimated at US$12 million (SEK 113 million). Court-directed technical investigative proceedings have indicated various possible causes of the product failures, including manufacturing the machines with improper materials and the use of an inappropriate manufacturing process. The court has recently appointed a financial specialist to determine the economic value of the product failures. The financial specialist appointed by the court has estimated the economic value of the product failures to be approximately US$ 8 million.
Dividend Policy
We have never declared or paid any dividends on our ordinary shares and we do not anticipate paying any cash dividends in the foreseeable future. The indenture that governs our Senior Notes limits and, for the foreseeable future, effectively prohibits our ability to declare or pay cash dividends.
8.B. Significant Changes
None.
I-85
ITEM 9: THE OFFER AND LISTING
9.A. Offer and Listing Details
Not applicable.
9.B. Plan of Distribution
Not applicable.
9.C. Markets
Our ordinary shares are not listed on any stock exchange. Our Senior Notes are listed on the Luxembourg Stock Exchange.
9.D. Selling Shareholders
Not applicable.
9.E. Dilution
Not applicable.
9.F. Expenses of the Issue
Not applicable.
I-86
ITEM 10: ADDITIONAL INFORMATION
10.A. Share Capital
Not applicable.
10.B. Memorandum and Articles of Association of the Issuer
Alfa Laval Special Finance AB
Our corporate name is Alfa Laval Special Finance Aktiebolag. Our objects and purposes can be found in section 2 of our articles of association. The object of our business is to own and manage property as well as to carry out other activities compatible therewith. Our registered office shall be in the municipality of Stockholm.
Board of Directors
The board shall consist of no less than three members and no more than six members with no more than three deputy members. In the event that only one or two members are appointed, a deputy member shall be elected. Members and deputy members shall be elected annually at the annual shareholders' meeting for the time until the end of the next annual shareholders' meeting. In addition to the board any person, within or outside the board, appointed by the board, shall be authorised to sign for us.
Share Capital
Our share capital shall amount to not less than SEK two hundred and ten million (210,000,000) and not more than SEK eight hundred and forty million (840,000,000).
The nominal value of each share shall be SEK one hundred (100).
Shareholder Meetings
At the annual shareholders' meeting, the following matters shall be dealt with:
- •
- election of a chairman to conduct the meeting;
- •
- drawing up and approval of the voting list;
- •
- approving of the agenda for the meeting;
- •
- election of one or two persons to sign the minutes;
- •
- determination as to whether the meeting has been duly convened;
- •
- presentation of the annual statement of accounts and the auditor's report and, when applicable, the group annual statement and the auditor's group report;
- •
- decisions concerning:
- 1.
- adoption of the profit and loss statement and the balance sheet and the consolidated profit and loss statement and consolidated balance sheet;
- 2.
- appropriation of the company's profit or loss according to the adopted balance sheet; and
- 3.
- discharge of the directors and managing director from liability.
- •
- decision in respect to the fees for the board of directors and for the auditors;
- •
- election of board members and, where appropriate, of auditor; and
I-87
- •
- other matters which according to the Companies Act (1975:1385) shall be dealt with at the meeting.
At a shareholders' meeting anyone having the right to vote may vote for the full number of shares represented by him.
Notice convening a shareholders' meeting shall be issued by mail not earlier than four and not later than two weeks before the meeting.
Financial Year
The financial year of the company shall be January 1-December 31.
10.C. Material Contracts
Purchasing Contract with Tetra Pak
In June 1999, Alfa Laval AB, on behalf of itself and all the companies in which Alfa Laval Holding AB directly or indirectly holds or controls more than 50% of the votes of all shares (the "Alfa Laval Companies"), and Tetra Pak International SA, on behalf of all the Tetra Pak companies under the control of the Tetra Laval Group (the "Tetra Pak Companies"), entered into an agreement which governs the relationship between the two companies in the areas of distribution, research and development, market sales and information, use of trademarks and intellectual property. A description of the terms of this contract can be found in "Item 7.B: Major Shareholders and Related Party Transactions—Related Party Transactions".
Existing Senior Credit Facility
For a description of our Existing Senior Credit Facility see "Item 5.B: Operating and Financial Review and Prospects—Liquidity and Capital Resources—Existing Senior Credit Facility".
Intercompany Notes
For a description of the Intercompany Note between us and the Guarantor, see "Item 5.B: Operating and Financial Review and Prospects—Liquidity and Capital Resources—The Intercompany Note".
Intercreditor Agreement
For a description of the Intercreditor Agreement between us, the Guarantor, the financial institutions named therein as lenders and SEB Merchant Banking as facility agent, see "Item 5.B: Operating and Financial Review and Prospects—Liquidity and Capital Resources—Intercreditor Agreement".
Purchase Agreement
In connection with our issuance of Senior Notes we, together with the Guarantor, entered into a purchase agreement with Donaldson, Lufkin and Jenrette International and UBG AG, acting through its business group UBS Warburg, as underwriters. The purchase agreement obliged the underwriters to purchase and accept delivery of our Senior Notes, subject to certain conditions. The purchase agreement obliges us, together with the Guarantor, to indemnify the underwriters and certain person controlling the underwriters against certain liabilities and expenses, including liabilities under the US Securities Act of 1933, or to contribute to payments the underwriters are required to make in respect thereof.
I-88
Indenture
Our Senior Notes, issued in November 2000, were issued under an indenture which we, together with the Guarantor, executed with The Bank of New York, as trustee. The indenture, among other things, place certain limitations on our ability and the ability of our restricted subsidiaries to borrow money, pay dividends on, make distributions on or repurchase stock, make certain investments, create liens on our assets to secure debt, substitute another person as issuer of the Senior Notes, sell certain assets or merge with or into other companies, enter into transactions, with affiliates and enter into joint ventures.
10.D. Exchange Controls
There are currently no foreign exchange control restrictions, other than in certain national crisis situations, that would restrict payments that may be remitted by a Swedish company to non-Swedish residents. There is no maximum transferable amount either to or from Sweden, although single cross-border transactions in a principal amount greater than SEK 100,000 must be reported to the Swedish Central Bank, orRiksbanken, for statistical purposes. Furthermore, payments to or from Sweden exceeding SEK 100,000 may be reported to Swedish tax authorities. Such information may also be forwarded to authorities in the countries where the holders of the shares are resident.
10.E. Taxation
Swedish Taxation
The following is a general description of certain Swedish income tax considerations relating to our Senior Notes. It does not purport to be a complete analysis of all tax considerations relating to the Senior Notes. Investors in our Senior Notes should consult their own tax advisers as to which countries' tax laws could be relevant to acquiring, holding and disposing of Senior Notes and receiving payments of interest, principal and/or other amounts under our Senior Notes and the consequences of such actions under the tax laws of those countries. This summary is based upon the law as in effect on the date of this annual report and is subject to any change in law that may take effect after such date.
Under Swedish law as presently in effect, payments of any principal or interest to the holder of any Senior Note will not be subject to Swedish income tax, provided that such holder is not resident in Sweden for tax purposes and provided that the Senior Note does not pertain to a permanent establishment or fixed place of business in Sweden. Payments of any principal or interest to the holder of any Senior Note are not subject to withholding tax under Swedish law. However, for a private individual or an estate of a deceased individual with tax residence in Sweden a preliminary tax of 30 per cent on payments of interest is normally withheld.
US Federal Income Tax
The following describes certain US federal income tax consequences relating to the ownership and disposition of Senior Notes by a holder that is a citizen or resident of the United States or a US corporation or that otherwise is subject to US federal income taxation on a net income basis in respect of the Senior Notes (a "US holder"). The summary does not purport to be a comprehensive description of all of the tax considerations that may be relevant to a holder of Senior Notes. In particular, the following discussion deals only with US holders that purchased their Senior Notes at the issue price as part of the initial distribution and who hold Senior Notes as capital assets, and does not address the tax treatment of holders that are subject to special tax rules, such as banks, tax-exempt entities, insurance companies, dealers in securities or currencies, traders in securities electing to mark to market, persons that hold notes as a hedge against currency risk or as a position in a "straddle" or conversion transaction, and persons that have a "functional currency" other than the US dollar. The summary is based on the Internal Revenue Code of 1986, as amended, existing and proposed Treasury regulations, administrative and judicial interpretations thereof, all
I-89
as in effect on the date hereof and all of which are subject to change, possibly with retroactive effect, and differing interpretations. Holders should consult their own advisers regarding the tax consequences of holding and disposing of the Senior Notes in light of their particular circumstances, including the effect of any state, local or other national laws.
Interest
Interest on the Senior Notes will be includable in a US holder's income at the time the interest is accrued or received, in accordance with the holder's method of tax accounting.
A US holder that uses the cash method of accounting for tax purposes will realises interest income equal to the US dollar value of the interest payment, based on the exchange rate on the date of receipt, regardless of whether the payment in fact is converted into US dollars.
A US holder that uses the accrual method of accounting for tax purposes will accrue interest income on the Senior Notes in euros and translate that amount into US dollars at the average exchange rate in effect during the interest accrual period (or portion thereof within the US holder's taxable year). Alternatively, an accrual basis holder may make an election (which must be applied consistently to all debt instruments from year to year and may not be revoked without the consent of the Internal Revenue Service (the "IRS")) to translate accrued interest income at the spot rate of exchange on the last day of the accrual period (or the last day of the taxable year within that accrual period if the accrual period includes more than one taxable year), or at the spot rate on the date of receipt, if that date is within five business days of the last day of the accrual period. A US holder that uses the accrual method of accounting for tax purposes will recognise foreign currency gain or loss if the exchange rate in effect on the date the payment is received differs from the rate applicable to a previous accrual of that interest. This foreign currency gain or loss will be treated as ordinary income or loss, and generally will not be treated as an adjustment to interest income.
Sale and Retirement of Senior Notes
A US holder's initial tax basis in a Senior Note generally will equal the US dollar value of the foreign currency amount paid for the note determined on the date of purchase. In the case of a Senior Note that is traded on an established securities market, a cash basis US holder (or an accrual-basis US holder that makes a special election), will determine the US dollar value of the cost of the Senior Note by translating the amount of the foreign currency paid for the Senior Note at the spot rate of exchange on the settlement date of the purchase. The conversion of US dollars to a foreign currency and the immediate use of the foreign currency to purchase a Senior Note generally will not result in taxable gain or loss for a US holder.
Upon the sale, exchange or retirement of a Senior Note, a US holder generally will recognise gain or loss equal to the difference between the amount realised (less any accrued interest, which will be taxable as interest income) and the holder's adjusted tax basis in such Senior Note. If a US holder receives foreign currency in respect of the sale, exchange or retirement of a Senior Note, the amount realised will be the US dollar equivalent of the amount received, calculated at the exchange rate in effect at the time of the sale, exchange or retirement. If Senior Notes are traded on an established securities market, a cash basis taxpayer (and if it elects, an accrual basis taxpayer) will determine the US dollar equivalent of the amount realised by translating that amount at the exchange rate on the settlement date of the sale, exchange or retirement. If an accrual method taxpayer makes such an election, the election must be applied consistently to all debt instruments from year to year and may not be changed without the consent of the IRS.
Except as discussed below with respect to foreign currency gain or loss, gain or loss recognised by a US holder on the sale, exchange or retirement of a Senior Note generally will be long-term capital gain or loss if the US holder has held the Senior Note for more than one year at the time of
I-90
disposition. The deductibility of capital losses is subject to significant limitations. If the US holder is an individual, any capital gain generally will be subject to US federal income tax at preferential rates if specified minimum holding periods are met.
Gain or loss recognised by a US holder on the sale, exchange or retirement of a Senior Note generally will be treated as ordinary income or loss to the extent that the gain or loss is attributable to changes in exchange rates during the period in which the holder held such Senior Note. This foreign currency gain or loss generally will not be treated as an adjustment to interest income received on the Senior Note.
Information Reporting and Backup Withholding
Interest payments on the Senior Notes and proceeds from the sale, exchange or other disposition of the Senior Notes may be subject to information reporting to the Internal Revenue Service and possible US backup withholding at a current rate of 30%. Backup withholding will not apply to a holder who furnishes a correct taxpayer identification number or certificate of foreign status and makes any other required certification or who is otherwise exempt from backup withholding. US persons who are required to establish their exempt status generally must provide such certification on a duly completed Internal Revenue Service Form W-9 (Request for Taxpayer Identification Number and Certification). Non-US holders generally will not be subject to US information reporting or backup withholding. However, such holders may be required to provide certification of non-US status (generally on Internal Revenue Service Form W-8BEN) in connection with payments received in the United States or through certain US- related financial intermediaries.
Backup withholding is not an additional tax. Amounts withheld as backup withholding may be credited against a holder's US federal income tax liability, and a holder may obtain a refund of any excess amounts withheld under the backup withholding rules by filing the appropriate claim for refund with the Internal Revenue Service and furnishing any required information.
10.F. Dividends and Paying Agents
Not applicable.
10.G. Statement by Experts
Not applicable.
10.H. Documents on display
The documents that are exhibits to this annual report can be read at the Securities and Exchange Commission's public reference facilities at Room 1024, 450 Fifth Street, N.W., Washington, D.C., 20549, You can request copies of these documents, upon payment of a duplication fee, by writing to the SEC. Please call the SEC at (202) 942-8090 for further information on the operations of the SEC's public reference room. Copies of the documents referred to herein may also be inspected at our offices by contacting Thomas Thuresson, our chief financial officer, on +46 4636 7240.
10.I. Subsidiary Information
Not applicable.
I-91
ITEM 11: QUANTITATIVE AND QUALITATIVE DISCLOSURES ABOUT MARKET RISK
11.A. Quantitative Information about Market Risk
Interest Rate Exposure
On April 29,2002, we entered into the Existing Senior Credit Facility of €575 million with SEB Merchant Banking, a unit within Skandinaviska Enskilda Banken AB (publ) ("SEB"), SEB and Svenska Handelsbanken AB (publ) as arrangers. The Existing Senior Credit Facility was amended and restated on July 11, 2002. It is structured in two tranches—a Tranche A €425 million 5 year multi-currency term loan facility and a Tranche B €150 million 5 year multi-currency revolving credit facility. Tranche B has not yet been utilised. The following table presents our debt instruments sensitive to changes in interest rates.
| | Maturity dates
| |
| |
| |
| |
|
|---|
| |
| | Carrying
value at
| | Fair
value at
| | Fair
value at
|
|---|
| | 2003
| | 2004
| | 2005
| | 2006
| | Thereafter
|
|---|
| | (SEK millions)
| | (SEK millions)
| | (SEK millions)
| | (SEK millions)
| | (€ millions)
|
|---|
| Existing Senior-Credit Facility: | | | | | | | | | | | | | | | | |
| Tranche A | | | | | | | | | | | | | | | | |
| | EUR | | — | | — | | — | | — | | 330 | | 330 | | 330 | | 36 |
| | USD | | — | | — | | — | | — | | 1,838 | | 1,838 | | 1,838 | | 201 |
| | GBP | | — | | — | | — | | — | | 165 | | 165 | | 165 | | 18 |
| | DKK | | — | | — | | — | | — | | 384 | | 384 | | 384 | | 42 |
| | SEK | | — | | — | | — | | — | | 175 | | 175 | | 175 | | 19 |
| | JPY | | — | | — | | — | | — | | 173 | | 173 | | 173 | | 19 |
| | |
| |
| |
| |
| |
| |
| |
| |
|
| | | — | | — | | — | | — | | 3,065 | | 3,065 | | 3,065 | | 335 |
| Notes (fixed interest) | | — | | — | | — | | — | | 1,128 | | 1,128 | | 1,269 | | 139 |
As part of our hedging strategy to minimiser interest rate risk we have undertaken interest rate swaps to effectively convert 64% of our variable rate exposure associated with the senior debt into fixed rate debt. As we do not apply hedge accounting according to FAS 133, our results reported under US GAAP as of December 31, 2002 include the fair value of the interest rate swaps, which resulted in the recognition of a liability of SEK 61 million.
| | Notional amount
| | Fixed rate
| | Market rate
| | Maturity
| | Fair value
| |
|---|
| | (SEK in
millions)
| |
| |
| |
| | (SEK in
millions)
| |
|---|
| Interest rate swaps: | | | | | | | | | | | |
| | EUR | | 119 | | 5.35 | % | 2.51 | % | September 2003 | | (2 | ) |
| | USD | | 1,274 | | 6.54 | % | 1.36 | % | September 2003 | | (49 | ) |
| | JPY | | 36 | | 0.92 | % | 0.70 | % | September 2003 | | (0 | ) |
| | DKK | | 247 | | 6.02 | % | 2.67 | % | September 2003 | | (6 | ) |
| | SEK | | 140 | | 5.44 | % | 3.89 | % | September 2003 | | (2 | ) |
| | GBP | | 108 | | 6.22 | % | 3.55 | % | September 2003 | | (2 | ) |
| | | | | | | | | | |
| |
| | | | | | | | | | | (61 | ) |
| | | | | | | | | | |
| |
Amounts outstanding under the Existing Senior Credit Facility bear annual interest at applicable interbank offered rates plus a margin depending on the status of the Net Debt to EBITDA ratio. The Senior Notes carry a 121/8% fixed rate of interest and are due 10 years from the date of issue.
I-92
Foreign Currency Exchange Rate Exposure
Our operations are conducted by entities in many countries, and accordingly the results of operations are subject to currency translation risk and currency transaction risk. Our historical results were particularly affected by exchange rate fluctuations between the Swedish kronor and other currencies such as the US dollar, British pound, and the euro. Foreign exchange exposures are managed against various local currencies, as we have a significant amount of worldwide production and sales.
As a result of investments, production facilities and other operations on a global basis, we have assets and liabilities and cash flows in currencies other than the Swedish kronor. The equity changes caused by movements in foreign exchange rates are shown as a translation difference in the financial statements. The primary objective of our foreign exchange risk management will be to continue to optimise the Swedish kronor value of net assets and cash flows, keeping the adverse impact of currency movements to a minimum. To achieve this objective, we hedge on a net exposure basis using foreign currency forward contracts. Our main exposures are related to assets and liabilities denominated in the currencies of the United States, the United Kingdom, Denmark, Japan and European countries that have adopted the euro.
- •
- Currency Translation Risk. The assets and liabilities and profit and loss of each of our operating subsidiaries are reported in the operating currency of the jurisdiction in which it primarily operates. Profits and losses and cash flows from each operating subsidiary, if its regular operating currency is other than the Swedish kronor, are then translated into Swedish kronor at average rates of exchange during the relevant financial period, and assets and liabilities from each subsidiary at the exchange rate on the balance sheet date, in each case for inclusion in our consolidated financial statements.
The effect of currency translation on our assets and liabilities and profit and loss arising from the depreciation of the Swedish kronor against other currencies shows a positive impact on our revenues and net income, while the appreciation of the Swedish kronor against other currencies shows a negative impact. These decreases or increases have in the past had, and may in the future have, an effect on our reported assets and liabilities and profit and loss and also affect the comparability of our results between financial periods.
- •
- Currency Transaction Risk. In addition to currency translation risk, we incur currency transaction risk whenever one of our operating subsidiaries enters into either a purchase or sales transaction using a currency other than its regular operating currency. We aim to hedge against currency transaction risk by matching revenues and costs in the same currency. As a result of our geographically diversified customer base we generate, however, a significant portion of our revenues from sales in currencies other than those in which our subsidiaries regularly operate and incur their expenses. To the extent that there is a deficit between local currency funds generated by our subsidiaries' operations and their local currency payment requirements, we generally hedge these deficits using forward exchange contracts. To a degree, we are also able to hedge against these risks by periodically adjusting our prices to account for exchange rate fluctuations.
At December 31, 2002, we had foreign exchange contracts outstanding in various currencies. Our primary net foreign currency exposures at December 31, 2002 included US dollar, euros, Swedish kronor and Danish kroner. Consistent with the nature of the economic hedge of these foreign currency exchange contracts, decreases or increases of the underlying instrument or transaction being hedged would offset any corresponding unrealised gains or losses, respectively. The fair value of our forward exchange contracts that were outstanding as of December 31, 2002 resulted in a receivable of SEK 151 million.
I-93
The following table provides information about our foreign exchange forward contracts at December 31, 2002. The table presents the value of the contracts in Swedish kronor at the contract exchange rate as of the contract maturity date.
Forward Exchange Contracts as of December 31, 2002 are:
| |
| |
| |
| | Notional amount
| |
| |
|---|
Buying currency
| | Selling
currency
| | Average
contractual
rate
| | Maturity
Date
| | Original
currency
| | SEK
| | Fair
value
SEK
| |
|---|
| |
| |
| |
| | (amounts in millions)
| |
|---|
| DKK | | EUR | | 7.436 | | 2003 | | 266 | | 330 | | 0 | |
| DKK | | USD | | 8.277 | | 2003 | | 90 | | 111 | | 15 | |
| EUR | | HKD | | 7.501 | | 2003 | | 24 | | 216 | | 15 | |
| EUR | | JPY | | 109.869 | | 2003 | | 20 | | 183 | | 14 | |
| EUR | | USD | | 1.040 | | 2003 | | 88 | | 808 | | 55 | |
| EUR | | SEK | | 9.107 | | 2003 | | 88 | | 808 | | 8 | |
| SEK | | DKK | | 1.226 | | 2003 | | 1,124 | | 1,124 | | (9 | ) |
| SEK | | EUR | | 9.270 | | 2003 | | 3,264 | | 3,264 | | 14 | |
| SEK | | NOK | | 1.234 | | 2003 | | 188 | | 188 | | (2 | ) |
| SEK | | USD | | 9.367 | | 2003 | | 1,034 | | 1,034 | | 41 | |
| USD | | EUR | | 1.021 | | 2003 | | 19 | | 171 | | (3 | ) |
| Various | | Various | | — | | 2003-2004 | | — | | 797 | | 3 | |
| | | | | | | | | | |
| |
| |
| | | | | | | | | | | 9,034 | | 151 | |
| | | | | | | | | | |
| |
| |
As a result of the Acquisition and related financing transactions we have not significantly changed our foreign currency hedging strategy. The composition of the senior debt serves as a natural hedge of our investments in foreign subsidiaries. We plan to continue to use foreign currency forward contracts and currency options to hedge our foreign currency cash flows.
Foreign Currency Exchange Rate Exposure Sensitivity Analysis
If the currency rates between SEK and the most important foreign currencies are changed by +/- 10%, it has the following effect on operating income, if no hedging measures are taken:
Exchange rate change against the SEK
| | +10%
| | -10%
| |
|---|
| | (SEK millions)
| |
|---|
| USD | | 101 | | (101 | ) |
| EUR | | 154 | | (154 | ) |
| DKK | | (135 | ) | 135 | |
| Other USD related currencies | | 29 | | (29 | ) |
| Other | | 58 | | (58 | ) |
| | |
| |
| |
| Total | | 207 | | (207 | ) |
| | |
| |
| |
11.B. Qualitative Information about Market Risk
Financial Risk Management
Our business operations give rise to market risk exposure due to changes in foreign exchange rates and interest rates. To manage these risks effectively, we have established guidelines and a detailed financial policy relating to those financial risks we are prepared to accept and how such risks should be
I-94
limited and managed. Our financial policy also establishes the division of responsibility between our subsidiaries and our central finance function within Alfa Laval Treasury International AB.
Pursuant to our established guidelines and financial policy, we enter into hedging transactions and generally use derivative financial instruments, which enable us to mitigate the adverse effects of financial market risk. These hedging instruments are classified in a manner consistent with the item being hedged, meaning that the associated asset and liability items are recorded at their hedged values. With respect to the hedging of future cash flows, our treatment differs between Swedish GAAP and US GAAP. According to Swedish GAAP, we do not mark-to-market our hedging contracts, which is the case in our US GAAP treatment. We do not enter into financial instruments for trading or speculative purposes.
We do not anticipate any material adverse effect on our consolidated financial position, results of operations or cash flows resulting from the use of derivative financial instruments. We cannot guarantee, however, that our hedging strategies will be effective or that transaction or translation losses can be minimised or forecast accurately.
Interest Rate Risk
The main objective of interest rate risk management will continue to be to reduce our total funding cost and to alter the interest rate exposure to the desired risk profile. Historically we borrowed funds primarily in euro, US dollars, British pounds and Swedish kronor. We use interest rate swaps to accomplish this objective.
I-95
ITEM 12: DESCRIPTION OF SECURITIES OTHER THAN EQUITY SECURITIES
Not applicable.
I-96
PART II
ITEM 13: DEFAULTS, DIVIDEND ARREARAGES AND DELINQUENCIES
Not applicable.
II-1
ITEM 14: MATERIAL MODIFICATIONS TO THE RIGHTS OF SECURITY HOLDERS AND USE OF PROCEEDS
Not applicable.
II-2
ITEM 15: CONTROLS AND PROCEDURES
Our Chief Executive Officer and our Chief Financial Officer, after evaluating the effectiveness of our disclosure controls and procedures (as defined in US Exchange Act Rules 13a-14(c)) within 90 days of the date of this Form 20-F, have concluded that, as of such date, our disclosure controls and procedures were effective to ensure that material information relating to us was made known to them by others within our organisation particularly during the period in which this Form 20-F was being prepared.
There were no significant changes in our internal controls or in other factors that could significantly affect these controls subsequent to the date our Chief Executive Officer and our Chief Financial Officer completed their evaluation, nor were there any significant deficiencies or material weaknesses in our internal controls requiring corrective actions.
II-3
ITEM 16: [RESERVED.]
II-4
PART III
ITEM 17: FINANCIAL STATEMENTS
The following financial statements are filed as part of this annual report on Form 20-F:
| | Page
|
|---|
| Report of Independent Auditors to Board of Directors and Shareholders of Alfa Laval Special Finance AB | | F-2 |
Consolidated Income Statements of Alfa Laval Special Finance AB for the three years ended December 31, 2002 |
|
F-3 |
Consolidated Balance Sheet of Alfa Laval Special Finance AB as at December 31, 2001 and 2002 |
|
F-4 |
Consolidated Cash Flow Statements of Alfa Laval Special Finance AB for the three years ended December 31, 2002 |
|
F-6 |
Consolidated Statement of Changes in Equity Capital of Alfa Laval Special Finance AB for the two years ended December 31, 2002 |
|
F-7 |
Notes to Consolidated Financial Statements of Alfa Laval Special Finance AB |
|
F-9 |
III-1
INDEX TO FINANCIAL STATEMENTS
| | Page
|
|---|
| Report of Independent Auditors | | F-2 |
Consolidated Statements of Income for the three years ended December 31, 2002 |
|
F-3 |
Consolidated Balance Sheets as at December 31, 2001 and 2002 |
|
F-4 |
Consolidated Cash-Flow Statements for the three years ended December 31, 2002 |
|
F-6 |
Consolidated Statement of Changes in Equity Capital for the two years ended December 31, 2002 |
|
F-7 |
Notes to the Financial Statements |
|
F-9 |
F-1
REPORT OF INDEPENDENT AUDITORS
To the Board of Directors
and Shareholders of Alfa Laval Special Finance AB
We have audited the accompanying consolidated balance sheets of Alfa Laval Special Finance AB (the successor) as of December 31, 2002 and 2001 and the related consolidated statements of income, changes in equity capital and cash flows for each of the two years in the period ended December 31, 2002 and for the period from August 24, 2000 to December 31, 2000 and the related consolidated statements of income, changes in equity capital, and cash flows of Alfa Laval Holding AB (the predecessor) for the period from January 1, 2000 to August 23, 2000. These financial statements are the responsibility of Alfa Laval Special Finance AB's management. Our responsibility is to express an opinion on these financial statements based on our audits.
We conducted our audits in accordance with auditing standards generally accepted in Sweden and in the United States of America. Those standards require that we plan and perform the audit to obtain reasonable assurance about whether the financial statements are free of material misstatement. An audit includes examining, on a test basis, evidence supporting the amounts and disclosures in the financial statements. An audit also includes assessing the accounting principles used and significant estimates made by management, as well as evaluating the overall financial statement presentation. We believe that our audits provide a reasonable basis for our opinion.
In our opinion, the financial statements referred to above present fairly, in all material respects, the consolidated financial position of Alfa Laval Special Finance AB at December 31, 2002 and 2001, and the consolidated results of its operations and its cash flows for each of the two years in the period ended December 31, 2002, and for the period from August 24, 2000 to December 31, 2000 and the consolidated results of operations and cash flows of Alfa Laval Holding AB for the period from January 1, 2000 to August 23, 2000 in conformity with accounting principles generally accepted in Sweden.
Generally accepted accounting principles in Sweden vary in certain significant respects from generally accepted accounting principles in the United States. Application of generally accepted accounting principles in the United States would have affected consolidated net income in each of the three years ended December 31, 2002 and consolidated shareholders' equity as of December 31, 2002 and 2001, to the extent summarised in Note 34 to the consolidated financial statements.
Malmö, Sweden
March 26, 2003
Ingvar Ganestam
Authorised Public Accountant
Ernst & Young AB
F-2
ALFA LAVAL SPECIAL FINANCE AB
CONSOLIDATED INCOME STATEMENT
| | Successor
| | Predecessor
| |
|---|
| |
| |
| |
| | Un-audited
Pro forma**
Year ended
December 31,
2000
| | Period ended
December 31,
| | Period ended
August 23,
| |
|---|
Amounts in MSEK
| |
| | Year ended
December 31,
2002
| | Year ended
December 31,
2001
| |
|---|
| | Note
| | 2000
| | 2000
| |
|---|
| Net sales | | 1 | | 14,594.9 | | 15,829.6 | | 15,012.3 | | 5,717.2 | | 9,295.1 | |
| Cost of goods sold | | 7 | | (9,262.2 | ) | (10,348.0 | ) | (10,124.4 | ) | (3,951.2 | ) | (5,962.6 | ) |
| | | | |
| |
| |
| |
| |
| |
| Gross profit | | 1 | | 5,332.7 | | 5,481.6 | | 4,887.9 | | 1,766.0 | | 3,332.5 | |
| | | | |
| |
| |
| |
| |
| |
| Sales costs | | 2, 3, 5 | | (2,115.1 | ) | (2,442.6 | ) | (2,583.7 | ) | (835.4 | ) | (1,748.3 | ) |
| Administration costs | | 2, 3, 4, 7 | | (1,026.8 | ) | (786.8 | ) | (861.5 | ) | (218.2 | ) | (643.3 | ) |
| Research and development costs | | 2, 3, 5, 7 | | (355.2 | ) | (341.4 | ) | (441.3 | ) | (161.9 | ) | (279.4 | ) |
| Comparison distortion items | | 6 | | (29.2 | ) | 5.3 | | 129.9 | | (393.8 | ) | 523.7 | |
| Other operating income | | | | 268.7 | | 389.1 | | 525.5 | | 267.8 | | 257.7 | |
| Other operating costs | | 7 | | (663.6 | ) | (893.3 | ) | (682.9 | ) | (355.7 | ) | (327.2 | ) |
| Amortisation of goodwill | | 7, 8 | | (187.7 | ) | (178.0 | ) | (163.8 | ) | (54.6 | ) | (485.0 | ) |
| | | | |
| |
| |
| |
| |
| |
| Operating income | | | | 1,223.8 | | 1,233.8 | | 810.1 | | 14.2 | | 630.7 | |
| | | | |
| |
| |
| |
| |
| |
| Dividends | | 9 | | 7.8 | | 9.6 | | 4.3 | | 1.3 | | 3.0 | |
| Interest income | | 10 | | 322.7 | | 238.0 | | 245.1 | | 109.4 | | 135.7 | |
| Interest costs | | 10 | | (803.5 | ) | (1,108.3 | ) | (1,052.0 | ) | (440,2 | ) | (263.8 | ) |
| Comparison distortion items | | | | (290.7 | ) | — | | — | | — | | — | |
| | | | |
| |
| |
| |
| |
| |
| Result after financial items | | | | 460.1 | | 373.1 | | 7.5 | | (315.3 | ) | 505.6 | |
| | | | |
| |
| |
| |
| |
| |
| Minority share in subsidiaries' income | | 11 | | (33.7 | ) | (32.0 | ) | (47.6 | ) | (11.8 | ) | (35.8 | ) |
| Taxes (benefit) on this year's result | | 12 | | (185.7 | ) | 60.9 | | (52.2 | ) | (38.4 | ) | (209.3 | ) |
| Other taxes | | 12 | | (32.6 | ) | (34.6 | ) | (53.0 | ) | (17.7 | ) | (35.3 | ) |
| | | | |
| |
| |
| |
| |
| |
| Net income (loss) for the year | | | | 208.2 | | 367.4 | | (145.3 | ) | (383.2 | ) | 225.2 | |
| | | | |
| |
| |
| |
| |
| |
| Earnings per share (SEK) | | | | 39.82 | | 367,430 | | (145,290 | ) | (383,200 | ) | 18.02 | |
| Average number of shares * | | | | 5,229,137 | | 1,000 | | 1,000 | | 1,000 | | 12,500,000 | |
- *
- The average number of shares has been changed through new issue of shares. See a specification in the statement over "Changes in consolidated equity capital".
- **
- See Note 34 for an explanation of how the un-audited pro forma values have been calculated.
The accompanying notes form an integral part of these financial statements.
F-3
ALFA LAVAL SPECIAL FINANCE AB
CONSOLIDATED BALANCE SHEET
Amounts in MSEK
| | Note
| | 2002
| | 2001
|
|---|
| ASSETS | | | | | | |
| Fixed assets | | | | | | |
| Intangible assets | | 13, 14 | | | | |
| Concessions, patents, licenses, trademarks and similar rights | | | | 1.333.6 | | 1,640.0 |
| Renting and similar rights | | | | 0.7 | | 0.4 |
| Goodwill | | | | 3,369.0 | | 3,372.9 |
| | | | |
| |
|
| | | | | 4,703.3 | | 5,013.3 |
| Property, plant and equipment | | 13, 15 | | | | |
| Real estate | | | | 1,309.9 | | 1,479.0 |
| Machinery and other technical installations | | | | 990.1 | | 1,146.6 |
| Equipment, tools and installations | | | | 742.0 | | 915.3 |
| Construction in progress and advances to suppliers concerning property, plant and equipment | | | | 40.8 | | 57.9 |
| | | | |
| |
|
| | | | | 3,082.7 | | 3,598.9 |
| Financial long-term assets | | | | | | |
| Other long-term securities | | 16 | | 53.1 | | 62.4 |
| Pension assets | | 23 | | 106.8 | | 175.4 |
| Capitalised financing costs, acquisition loans | | | | 58.0 | | 227.9 |
| Deferred tax asset | | | | 534.1 | | 623.8 |
| | | | |
| |
|
| | | | | 751.9 | | 1,089.5 |
| | | | |
| |
|
| Total fixed assets | | | | 8,537.9 | | 9,701.6 |
Current assets |
|
|
|
|
|
|
| Inventories | | 17 | | 2,279.0 | | 2,623.9 |
| Current receivables | | | | | | |
| Accounts receivable | | 18 | | 2,504.0 | | 3,032.0 |
| Other receivables | | 19 | | 973.9 | | 1,172.9 |
| Prepaid costs and accrued income | | | | 99.5 | | 111.0 |
| Capitalised financing costs, acquisition loans | | | | 12.2 | | 35.6 |
| | | | |
| |
|
| | | | | 3,589.6 | | 4,351,5 |
| Current deposits | | | | | | |
| Other current deposits | | 20 | | 414.3 | | 293.3 |
| Cash and bank | | 21 | | 605.9 | | 666.4 |
| | | | |
| |
|
| Total current assets | | | | 6,888.7 | | 7,935.1 |
| | | | |
| |
|
| | | | | | | |
| | | | |
| |
|
| TOTAL ASSETS | | | | 15,426.6 | | 17,636.7 |
| | | | |
| |
|
The accompanying notes form an integral part of these financial statements.
F-4
ALFA LAVAL SPECIAL FINANCE AB
CONSOLIDATED BALANCE SHEET (Continued)
Amounts in MSEK (except share information)
| | Note
| | 2002
| | 2001
|
|---|
| EQUITY CAPITAL AND LIABILITIES | | | | | | |
| Equity capital | | | | | | |
| Restricted equity capital | | | | | | |
| Share capital, 1,000 shares (par value SEK 100) | | | | | | 0.1 |
| Share capital, 8,191,000 shares (par value SEK 100) | | | | 819.1 | | |
| Restricted reserves | | | | 114.6 | | 36.9 |
| | | | |
| |
|
| | | | | 933.7 | | 37.0 |
| Unrestricted equity capital | | | | | | |
| Unrestricted reserves | | | | 3,271.1 | | 3,224.5 |
| Net income (loss) for the year | | | | 208.2 | | 367.4 |
| | | | |
| |
|
| | | | | 3,479.3 | | 3,591.9 |
| | | | |
| |
|
| Total equity | | | | 4,413.0 | | 3,628.9 |
Minority interest |
|
11 |
|
108.2 |
|
131.8 |
Provisions |
|
|
|
|
|
|
| Provisions for pensions and similar commitments | | 23 | | 720.6 | | 774.9 |
| Provisions for taxes | | 12 | | 990.3 | | 1,143.6 |
| Other provisions | | 24 | | 989.3 | | 1,063.2 |
| | | | |
| |
|
| | | | | 2,700.2 | | 2,981.7 |
| Long-term liabilities | | 25 | | | | |
| Liabilities to credit institutions | | | | 3,105.8 | | 4,190.5 |
| Bond loan | | | | 1,127.6 | | 2,045.3 |
| | | | |
| |
|
| | | | | 4,233.4 | | 6,235.8 |
| Current liabilities | | | | | | |
| Liabilities to credit institutions | | 25 | | 254.4 | | 382.5 |
| Advances from customers | | | | 571.3 | | 609.1 |
| Accounts payable | | | | 1,027.9 | | 1,302.8 |
| Notes payable | | | | 145.3 | | 123.1 |
| Liabilities to associated companies | | | | 98.6 | | — |
| Tax liabilities | | | | 457.6 | | 627.2 |
| Other liabilities | | 26 | | 632.5 | | 667.4 |
| Accrued costs and prepaid income | | 27 | | 784.3 | | 946.2 |
| | | | |
| |
|
| | | | | 3,971.9 | | 4,658.4 |
| | | | |
| |
|
| TOTAL EQUITY CAPITAL AND LIABILITIES | | | | 15,426.6 | | 17,636.7 |
| | | | |
| |
|
PLEDGED ASSETS AND CONTINGENT LIABILITIES |
|
|
|
|
|
|
| Pledged assets | | 28 | | 78.3 | | 4,173.9 |
| Contingent liabilities | | 28 | | 1,698.0 | | 2,201.4 |
The accompanying notes form an integral part of these financial statements.
F-5
ALFA LAVAL SPECIAL FINANCE AB
CONSOLIDATED CASH FLOW STATEMENTS
| |
| | Successor
| | Predecessor
| |
|---|
Amounts in MSEK
| | Note
| | Year ended
December 31,
2002
| | Year ended
December 31,
2001
| | Un-audited
Pro forma Year ended
December 31,
2000
| | Period ended
December 31,
2000
| | Period ended
August 23,
2000
| |
|---|
| Cash flow from operating activities | | | | | | | | | | | | | |
| Operating income | | | | 1,223.8 | | 1,233.8 | | 810.1 | | 14.2 | | 630.7 | |
| Adjustment for depreciations | | | | 838.0 | | 912.2 | | 945.9 | | 315.2 | | 795.9 | |
| Adjustment for non cash items | | | | 35.0 | | 3.9 | | 140.8 | | 393.8 | | (253.0 | ) |
| | | | |
| |
| |
| |
| |
| |
| | | | | 2,096.8 | | 2,149.8 | | 1,896.8 | | 723.2 | | 1,173.6 | |
| Taxes paid | | | | (396.2 | ) | (462.9 | ) | (360.1 | ) | (198.3 | ) | (161.8 | ) |
| Cash flow from operations before changes in working capital | | | | 1,700.6 | | 1,686.9 | | 1,536.7 | | 524.9 | | 1,011.8 | |
| Changes in working capital: | | | | | | | | | | | | | |
| | (Increase)/decrease of current receivables | | | | 340.0 | | 209.2 | | (252.8 | ) | (502.4 | ) | 249.6 | |
| | (Increase)/decrease of inventories | | | | 140.4 | | 263.1 | | 48.4 | | 458.4 | | (410.0 | ) |
| | Increase/(decrease) of liabilities | | | | (134.2 | ) | (182,8 | ) | 298.1 | | 437.9 | | (139.8 | ) |
| | | | |
| |
| |
| |
| |
| |
| | | | | 346.2 | | 289.5 | | 93.7 | | 393.9 | | (300.2 | ) |
| | | | |
| |
| |
| |
| |
| |
| Cash flow from operating activities | | | | 2,046.8 | | 1,976.4 | | 1,630.4 | | 918.8 | | 711.6 | |
| | | | |
| |
| |
| |
| |
| |
| Cash flow from investing activities | | | | | | | | | | | | | |
| Investments in fixed assets | | | | (276.7 | ) | (274.9 | ) | (311.7 | ) | (178.8 | ) | (132.9 | ) |
| Divestment of fixed assets | | | | 120.7 | | 336.2 | | 726.8 | | 354.7 | | 372.1 | |
| Additional purchase price | | | | (367.5 | ) | — | | — | | — | | — | |
| Acquisition of businesses | | 22 | | (135.7 | ) | (58.5 | ) | (8,222.6 | ) | (8,222.6 | ) | — | |
| Purchase price reimbursement | | 22 | | 81.6 | | 76.3 | | — | | — | | — | |
| Divestment of businesses | | 22 | | — | | 281.6 | | 39.0 | | — | | 39.0 | |
| Provisions | | | | 29.8 | | (249.1 | ) | (515.5 | ) | (515.5 | ) | — | |
| | | | |
| |
| |
| |
| |
| |
| Cash flow from investing activities | | | | (547.8 | ) | 111.6 | | (8,284.0 | ) | (8,562.2 | ) | 278.2 | |
| | | | |
| |
| |
| |
| |
| |
Cash flow from financing activities |
|
|
|
|
|
|
|
|
|
|
|
|
|
| Financial net, paid | | | | (590.1 | ) | (672.2 | ) | (480.7 | ) | (396.8 | ) | (83.9 | ) |
| New issue of shares | | | | 819.0 | | — | | 0.4 | | 0.4 | | — | |
| Shareholders' contribution | | | | — | | — | | 3,642.3 | | 3,642.3 | | — | |
| (Increase)/decrease of other current deposits | | | | (84.2 | ) | 306.6 | | (364.5 | ) | (334.3 | ) | (30.2 | ) |
| Capitalised financing costs, acquisition loans | | | | (39.7 | ) | — | | (304.3 | ) | (304.3 | ) | — | |
| Increase/(decrease) of liabilities to credit institute. | | | | (1,548.2 | ) | (1,703.8 | ) | 4,124.7 | | 5,132.8 | | (1,008.1 | ) |
| | | | |
| |
| |
| |
| |
| |
| Cash flow from financing activities | | | | (1,443.3 | ) | (2,069.4 | ) | 6,617.9 | | 7,740.1 | | (1,122.2 | ) |
| | | | |
| |
| |
| |
| |
| |
| Net incr/(decr) in cash/bank | | | | 55.7 | | 18.7 | | (35.7 | ) | 96.7 | | (132.4 | ) |
| Cash and bank at the beginning of the year | | | | 666.4 | | 634.5 | | 677.0 | | 549.0 | | 677.0 | |
| Translation difference in cash/bank | | | | (116.2 | ) | 13.2 | | (6.8 | ) | (11.2 | ) | 4.4 | |
| | | | |
| |
| |
| |
| |
| |
| Cash and bank at end of the period | | 21 | | 605.9 | | 666.4 | | 634.5 | | 634.5 | | 549.0 | |
| | | | |
| |
| |
| |
| |
| |
The accompanying notes form an integral part of these financial statements.
F-6
ALFA LAVAL SPECIAL FINANCE AB
CHANGES IN CONSOLIDATED EQUITY CAPITAL
Amounts in MSEK
| | Share
capital
| | Restricted
equity
| | Unrestricted
equity
| | Total
| |
|---|
| 2000 | | | | | | | | | |
| At the formation of the company March 27, 2000 | | 0.1 | | — | | — | | 0.1 | |
| Shareholders' contribution | | — | | — | | 3,642.3 | | 3,642.3 | |
| Translation difference etc. | | — | | — | | (94.5 | ) | (94.5 | ) |
| Net loss for 2000 | | — | | — | | (383.2 | ) | (383.2 | ) |
| | |
| |
| |
| |
| |
| As of December 31, 2000 | | 0.1 | | — | | 3,164.6 | | 3,164.7 | |
| | |
| |
| |
| |
| |
2001 |
|
|
|
|
|
|
|
|
|
| Transfer between restricted equity and unrestricted equity in group companies | | — | | 36.9 | | (36.9 | ) | 0.0 | |
| Translation difference etc. | | — | | — | | 96.7 | | 96.7 | |
| Net income for 2001 | | — | | — | | 367.4 | | 367.4 | |
| | |
| |
| |
| |
| |
| As of December 31, 2001 | | 0.1 | | 36.9 | | 3,591.8 | | 3,628.8 | |
| | |
| |
| |
| |
| |
2002 |
|
|
|
|
|
|
|
|
|
| New issue of shares. | | 819.0 | | | | | | 819.0 | |
| Equity part of group contribution. | | | | | | (38.4 | ) | (38.4 | ) |
| Deferred tax on group contribution. | | | | | | (15.0 | ) | (15.0 | ) |
| Transfer between restricted equity and unrestricted equity in group companies. | | — | | 76.9 | | (76.9 | ) | 0.0 | |
| Translation difference etc. | | — | | 0.8 | | (190.4 | ) | (189.6 | ) |
| Net income for 2002 | | — | | — | | 208.2 | | 208.2 | |
| | |
| |
| |
| |
| |
| As of December 31, 2002 | | 819.1 | | 114.6 | | 3,479.3 | | 4,413.0 | |
| | |
| |
| |
| |
| |
Specification of changes in number of shares and share capital
Consolidated MSEK
Year
| | Event
| | Date
| | Change in
number
of shares
| | Total
number
of shares
| | Change in
equity
capital
| | Total
equity
capital
|
|---|
| 2000 | | Company formation | | March 27, 2000 | | 1,000 | | 1,000 | | 0.1 | | 0.1 |
| 2002 | | New issue of shares | | June 13, 2002 | | 8,190,000 | | 8,191,000 | | 819.0 | | 819.1 |
F-7
Specification of accumulated translation differences reported against equity capital
Consolidated MSEK
Year
| | Change
| | Accumulated
| | Explanation to change
| | The change has been affected by hedging measures of
| |
|---|
| Formation of the Group | | | | | | | | | |
| 2000 | | (94.5 | ) | (94.5 | ) | The EUR was appreciated by 6%, which affected the EUR based acquisition loans | | (312.5 | ) |
2001 |
|
96.7 |
|
2.2 |
|
The USD was appreciated by 10.7% |
|
(105.5 |
) |
2002 |
|
(189.6 |
) |
(187.4 |
) |
The USD was depreciated by 16.7% |
|
(164.9 |
) |
Comments on changes in consolidated equity capital
The share capital of SEK 819,100,000 (100,000) is divided among 8,191,000 (1,000) shares at par value SEK 100 (100).
At the ordinary shareholders' meeting on June 13, 2002 it was decided to increase the share capital by SEK 819,000,000 through a new issue of 8,190,000 shares to Alfa Laval AB (publ).
The allocation into local currencies of the step-up values and the goodwill that arose in connection with the acquisition on August 24, 2000 has been finalised during 2001. This resulted in an increase of the equity capital with MSEK 162.9 as of December 31, 2000 from MSEK 1,149.4 to MSEK 1,312.3. The following adjustments have been made to the comparison figures for 2000:
MSEK
| | Assets
| | Liabilities
| | Equity capital
| |
|---|
| Translation difference taken against equity capital | | — | | — | | 174.5 | |
| Goodwill | | 92.2 | | — | | — | |
| Intangible assets | | 44.2 | | — | | — | |
| Property, plant and equipment | | 52.8 | | — | | — | |
| Deferred tax liability | | — | | 26.3 | | — | |
| Amortisation | | — | | — | | (0.2 | ) |
| Tax cost | | — | | — | | (11.4 | ) |
| | |
| |
| |
| |
| Total | | 189.2 | | 26.3 | | 162.9 | |
| | |
| |
| |
| |
The proposed dispositions of earnings for the subsidiaries suggest transfers to restricted equity capital of MSEK 22.0 (60.7).
The possibilities to distribute un-appropriated profits from foreign subsidiaries are limited in certain countries due to currency regulations and other legislation.
F-8
ALFA LAVAL SPECIAL FINANCE AB
NOTES TO THE FINANCIAL STATEMENTS
Amounts in MSEK unless otherwise stated
Ownership and legal structure
Alfa Laval Special Finance AB is a wholly owned subsidiary of Alfa Laval AB (publ).
The parent company Alfa Laval AB (publ) is listed on the Stockholm Stock Exchange's O-list since May 17, 2002 and on Attract 40 since July 1. The total number of shareholders is 5,746. After the IPO, the two largest owners are Industri Kapital and Tetra Laval, where 26.9 (62.2) percent are owned by the partnerships that are controlled by Industri Kapital 2000 Ltd, United Kingdom and 17.7 (36.7) percent are owned by Tetra Laval B.V., the Netherlands. In November 2002, Tetra Laval BV has increased the ownership in Alfa Laval by 1.8 percentage points from the 15.9 percent that was valid after the IPO. Thereafter, there are eight institutional investors with ownership interests of 4.1 to 2.1 percent. These ten largest owners own 68.6 percent of the shares.
Until August 24, 2000, the Alfa Laval Group with its parent company Alfa Laval Holding AB was owned 100 percent by Tetra Laval BV, the Netherlands. On August 24, 2000, Industri Kapital with partnerships acquired control over Alfa Laval. The acquisition is described in Note 13.
In connection with the acquisition on August 24, 2000, the Alfa Laval Group got a new parent company, Alfa Laval AB (publ). This company was formed on March 27, 2000 specifically for the acquisition.
Due to the above transactions, the following group structure exists:

IPO of the Alfa Laval share
On April 8, the owners of Alfa Laval decided to list the Alfa Laval share in connection with a new issue of shares in the order of MSEK 3,000. The IPO was completed on May 17, 2002. All warrants held by Alfa Laval management have been used for subscription of new shares at the IPO. The capital injection totalling MSEK 3,136.6 from the new issue of shares has been used to repay the debt to Tetra Laval Finance Ltd and to amortise 35 percent of the listed bond loan. In connection with the IPO, the
F-9
previous syndicated loan has been replaced by a new loan at conditions that better reflect the financial position of Alfa Laval after the new issue of shares. In connection with the IPO an additional purchase price of MEUR 40.0, corresponding to MSEK 367.5, was paid to Tetra Laval BV for the original acquisition on August 24, 2000 of the Alfa Laval Credit Finance AB Group. This has entirely been reported as goodwill in the Group and is amortised over 20 years.
Accounting consequences of the change of ownership and the change of parent company
The Alfa Laval Special Finance AB Group was created in connection with the change of ownership on August 24, 2000. Due to this, comparison figures for 2000 are presented on a combined pro forma basis for the predecessor the Alfa Laval Holding AB Group for the period January 1, 2000 to August 23, 2000 and for the successor the Alfa Laval Special Finance AB Group for the period from August 24, 2000 to December 31, 2000. In the pro forma calculation, amortisation of goodwill and other step-up values and the financing costs that arose in connection with the acquisition on August 24 and the consequential tax adjustments, have been accounted for as if the acquisition occurred on January 1, 2000 in order to be comparable with 2001, see Note 34. The figures for 2002 are accompanied by comparison figures within parenthesis for (2001) and (pro forma 2000 for the successor). Comparison figures for 2000 are only stated for items in the income statement.
Operations
The Alfa Laval Special Finance Group is engaged in the development, production and sales of products and systems based on three main technologies: separation/filtration, heat transfer and fluid handling. As of January 1, 2001, the sales and marketing activities are performed in two divisions —"Equipment" and "Process Technology". The divisions are based on ten customer segments. The Group also has a common function "Operations" for procurement, production and logistics. The Group's secondary segments are geographical markets.
Applied recommendations/General
Alfa Laval follows Swedish GAAP as expressed in law, recommendations issued by accounting bodies and relevant good accounting practice. This differs in certain respects from US GAAP, see Note 36.
Alfa Laval follows the recommendations issued by the Financial Accounting Standards Council in Sweden and has strived for early implementation of the recommendations, that is prior to when they must be applied. To the extent that recommendations from the Council have not yet been issued corresponding to already issued International Accounting Standards, the IAS statement has been applied instead. This is referring to IAS 19 "Employee benefits" for 2000 and 2001 and IAS 14 "Segment reporting" for 2001. A comparison has been made with the draft recommendations issued by the Council, which have only been available in 2001 and 2002 respectively.
Changed/implemented accounting principles
During 2002 RR26 Events after the balance sheet date has been implemented. The updated statement by the Industry and Commerce Stock Exchange Committee on information about remunerations to executive officers (approved during 2002) has been implemented during 2002.
During 2001 RR 15 Intangible assets, RR 21 Borrowing costs, RR22 Financial statements and RR23 Related parties disclosures were implemented. Segment reporting is from the same point in time
F-10
reported according to IAS 14 in the absence of a Swedish recommendation at the time (currently RR25 Segment reporting—business and geographical segments).
The application of these new accounting standards has not resulted in any change of accounting principles and has therefore not resulted in any effect on income or equity capital for 2002 or 2001.
During 2000, considerable work was devoted to the implementation of new accounting standards. As of the closing for 2000, deferred tax is accounted for according to RR 9, impairments according to RR17, revenue recognition on large projects according to RR10 and provisions, contingent liabilities and contingent assets according to RR16. As of the same date, employee benefits are accounted for according to IAS 19 in the absence of a Swedish standard (currently RR29 Employee benefits). The effect on equity of the changes in accounting principles for income taxes and pensions amounted to an increase of MSEK 225 for the predecessor the Alfa Laval Holding Group for 1999. Since the effect on the equity because of changed accounting principles changes the opening equity, the net asset value that was acquired by the new group increased correspondingly. Because the acquired equity is fully eliminated, the above adjustment to equity does not appear in the new Alfa Laval Special Finance Group.
Implementation of the Swedish Financial Accounting Standards Council's recommendations before they become effective
RR22 Financial statements, RR25 Segment reporting—business and geographical segments and RR26 Events after the balance sheet date become effective on January 1, 2003. RR 29 Employee benefits become effective on January 1, 2004. Earlier application of all these recommendations is encouraged and the Group has also applied them earlier as described above.
The Swedish Financial Accounting Standards Council's recommendation's RR 1:00 Business combinations, RR 15 Intangible assets, RR16 Provisions, contingent liabilities and contingent assets, RR17 Impairments, RR21 Borrowing costs and RR23 Related parties disclosures became effective on January 1, 2002. Earlier application was encouraged and the Group has applied these recommendations during 2001 or 2000 as described above.
Critical accounting principles
The Financial Accounting Standards Board in the US has issued Statement of Financial Accounting Standards No. 142, Goodwill and Other Intangible Assets. FAS 142 requires that goodwill, including previously existing goodwill, and intangible assets with indefinite useful lives not be amortised; these assets should be tested for impairment annually. Goodwill and intangible assets with indefinite useful lives will no longer be tested for impairment under FAS 121, Accounting for the Impairment of Long-Lived Assets and for Long-Lived Assets to be Disposed Of. The group has adopted the provisions of FAS 142 as of January 1, 2002 in the US GAAP reconciliation. The effect of FAS 142 can be considerable for the group if the profitability within the group or parts of the group goes down in the future, since this could trigger a substantial impairment write down of the goodwill. Such a write down will affect the net income and thereby the position of the group according to US GAAP.
According to RR 17 impairments on assets including goodwill shall be calculated if there is any indication that the value of the asset has decreased. This is different to FAS 142, which requires that the impairment test must be made annually irregardless of whether there is an indication or not. If a FAS 142 calculation shows an impairment, this can however be seen as such an indication that could
F-11
trigger a write down even in the part of the financial reporting that is regulated by the recommendations from the Financial Accounting Standards Council.
The Group's reporting of provisions according to RR16 means that MSEK 989,3 (1 063,2) is reported as other provisions. This constitutes 6.4 (6.0) percent of the Group's assets and is important for the assessment of the Group's financial position, not the least since provisions normally are based on estimates of costs and risks. If the accounting principles for provision would be changed sometime in the future, this could have a substantial impact on the Group's financial position.
Consolidation principles (including associates and joint ventures)
The consolidated financial statements have been prepared according to the RR1:00 recommendation issued by the Financial Accounting Standards Council in Sweden.
For the period after August 24, 2000, the consolidated financial statements include the parent company Alfa Laval AB (publ) and the subsidiaries in which it holds more than 50 percent during the period. For the period up to August 24, 2000, the consolidated financial statements include the parent company Alfa Laval Holding AB and the subsidiaries in which it holds more than 50 percent during the period.
The consolidated balance sheet has been prepared in accordance with the purchase method, which means that the book value of shares in the subsidiaries is eliminated from the reported equity capital in the subsidiaries at the time of their acquisition. Accordingly, the unrestricted reserves in the subsidiaries at the time of acquisition are not included in the consolidated unrestricted reserves. One joint venture, called Rolls Laval Heat Exchangers Ltd with Rolls Royce as partner, is owned 50 percent and is consolidated according to the proportional consolidation method in RR 14 Joint ventures. The Group has only one company that fulfils the definition of an associate in RR 13 Accounting for investments in Associates, that is that the ownership is between 20 and 50 percent, namely Dalian Haven Automation Co Ltd. This company is totally dormant. Since its net assets are not material, it is not consolidated.
The difference between the purchase price paid and the net assets of the acquired companies, with deduction for restructuring provisions, is allocated to the step-up values related to each type of asset, with any remainder accounted for as goodwill.
The foreign subsidiaries have been translated using the current method. This means that assets and liabilities are translated at closing exchange rates and income and expenses are translated at the year's average exchange rate. The translation difference that arises is a result of the fact that net assets in foreign companies are translated at one rate at the beginning of the year and another at year-end and that the result is translated at average rate. The translation differences are charged against equity capital.
Inflationary accounting
Subsidiaries in highly inflationary countries report their closings in the functional hard currency that is valid in each country, which in all cases is USD. Bolivia, Colombia, Indonesia, Mexico, Russia, Turkey and Venezuela are regarded as highly inflationary countries.
F-12
Transactions in foreign currencies
Receivables and liabilities denominated in foreign currencies have been valued at year-end rates of exchange or at the rate fixed by forward contract. Within the parent company there were no unrealised exchange gains on long-term receivables and liabilities that have not been possible to offset against unrealised exchange losses within the same currency. Unrealised exchange gains on short-term receivables and liabilities are, however, included in the result.
Within the Group, exchange gains and losses on loans denominated in foreign currencies that finance acquisitions of foreign subsidiaries are transferred to unrestricted equity if the loans act as a hedge to the acquired net assets. In the parent company, the exchange differences are reported in the income statement.
Inventories
The Group's inventory has been accounted for after elimination of inter-company gains. The inventory has been valued according to the "First-In-First-Out" (FIFO) method at the lowest of cost or net realisable value, taking into account obsolescence.
This means that raw material and purchased components normally are valued at the acquisition cost, unless the market price has fallen. Work in progress is valued at the sum of direct material and direct labour costs with a mark-up for the product's share in capital costs in the manufacturing and other indirect manufacturing costs based on a forecasted assumption on the capacity utilisation in the factory. Finished goods are normally valued at the delivery value from the factory if the delivery is forthcoming. Spare parts that can be in the inventory during longer periods of time are normally valued at net realisable value. Out of the total inventory, the valuation at net realisable value therefore constitutes a considerable part.
Fixed assets (tangible and intangible)
Assets have been accounted for at cost, net after deduction of accumulated depreciation according to plan. Depreciation according to plan is based on the assets acquisition values and is calculated according to estimated economic lives of the assets. The following depreciation periods have been used:
| Computer programmes, computers | | 3.3 years | | The Predecessor: | | Alfa Laval Holding AB |
| Office equipment | | 4 years | | Intangible assets | | 10 years |
| Vehicles | | 5 years | | Goodwill, harmonisation | | 5 years |
| Machinery and equipment | | 7-14 years | | Goodwill, other | | 10 years |
| Land improvements | | 20 years | | | | |
| Buildings | | 25-33 years | | The Successor: | | Alfa Laval Special Finance AB |
| | | | | Patents and trademarks | | 20 years |
| | | | | Step-up values, technology | | 7.5 years |
| | | | | Goodwill | | 20 years |
The acquisition of the Alfa Laval Holding AB Group is considered to be a strategic acquisition where the intangible assets have a lifetime of more than 20 years.
Upon sale or scrapping of assets, the results are calculated in relation to the net book value after depreciation according to plan. The result on sales is included in operating income.
F-13
When there are indications that the value of a fixed asset has decreased, there is a valuation made if it must be written down according to RR17. If the reported value is higher than the net realisable value, a write down is made that burdens net income. When assets are up for sale, for instance items of real estate, a clear indication of the net realisable value is received that can trigger a write down.
Leasing
Leasing is accounted for in accordance with RR6:99 Leasing agreements.
When Alfa Laval is the lessor, leased assets that are regarded as financial leases are accounted for as a financial receivable from the lessee in the balance sheet. The leasing fee received from the lessee is accounted for as financial income calculated as interest on the outstanding receivable and as amortisation of the receivable.
When Alfa Laval is the lessee, leased assets that are regarded as financial leases are accounted for as capitalised assets and a corresponding financial payable to the lessor in the balance sheet. The leasing fee to the lessor is accounted for as financial cost calculated as interest on the outstanding payable and as amortisation of the payable. Depreciation according to plan is done in the same manner as purchased assets.
Leased assets regarded as operational leases are not capitalised. The leasing fees are expensed as incurred.
Research and development
Research and development costs are charged to the income statement in the year in which they are incurred. Development costs do normally not meet the requirements for capitalisation according to RR15 Intangible assets.
Taxes
Current tax is calculated according to the rules that apply in the countries where the profit was generated. Deferred tax is calculated in accordance with RR9 Income taxes. This means that the Group has recognised deferred tax assets relating to temporary differences and unused tax losses and tax credits to the extent it is deemed probable (> 50 percent) that they will decrease future tax costs. When the subsidiaries report losses, deferred tax assets are only recognised if it is probable that the unused tax losses and tax credits will be possible to be utilised against future taxable profits.
Revenue recognition
Revenue recognition is made according to RR11 Revenue. Sales revenue for products and services is recognised at the time of delivery. Net sales are referring to sales value less sales taxes, cancellations and discounts. Long-term construction projects are accounted for through the percentage of completion method, see the below heading.
Long-term construction projects
Revenue for projects is recognised using the percentage of completion method in RR10 Construction projects. This means that when the outcome of a construction project can be calculated reliably, the revenue and the costs related to the project are recognised in relation of the percentage of completion at the balance sheet date. An estimated loss is recognised immediately. The percentage of
F-14
completion for a construction project is normally established through the relationship between incurred project costs for work performed at the closing date and the estimated total project costs.
Other operating income and other operating costs
Other operating income in the income statement relates to commission, royalty and license income. Other operating costs refer mainly to restructuring costs and to royalty costs.
Borrowing costs
Borrowing costs are accounted for according to the main principle in RR 21 Borrowing costs, which means that the borrowing costs are charged to the profit and loss in the period to which they relate. This means, among other things, that transaction costs that arise in connection with raising a loan are capitalised and amortised over the maturity of the loan.
Advertising costs
Advertising costs are expensed as incurred.
Financial instruments
The Group uses a limited number of financial instruments to hedge currency rates or interests. These include currency forward contracts, currency options, interest-rate swaps and interest-forward contracts. To demonstrate the exposure, the outstanding contracts are presented in the financial risk section. If possible, loans are raised in the currencies that match the net investment in each currency, see Note 25.
Employee benefits
Employee benefits are reported according to RR29. The main difference compared with previous reporting (1999 and earlier) has been the reporting for defined benefit pension plans. The Swedish ITP plan is thereby seen as a "multi-employer plan" that is treated as a defined contribution plan according to item 30 in RR29. The present value of the benefit obligations in the defined benefit plans is decided through yearly actuarial calculations made by independent actuaries.
Provisions
The Group is applying RR16 for the reporting of provisions, contingent liabilities and contingent assets.
Events after the balance sheet date
On January 31, 2003, the Danish Toftejorg A/S group was acquired, with effect from January 1, 2003. The group has annual sales of about MSEK 210 and approximately 100 employees. The operations covers R&D, assembly and sales of advanced tank cleaning equipment, targeting the food and marine industries. In addition to the operations in Denmark, the group has sales companies in Sweden, Norway, Germany, the UK, France, Singapore, the US and a own representation in South Korea.
On January 27, 2003 a voluntary amortisation of MSEK 227.7 was made on the syndicated loan.
On February 26, 2003 the real estate in Newmarket in Canada was sold for MSEK 20.0.
F-15
Note 1. Segment reporting
Alfa Laval's primary segments are the two divisions "Equipment" and "Process Technology". The divisions are based on a split into a number of customer segments. The customer segments that belong to the Equipment division purchase products whereas the customer segments that belong to Process Technology purchase systems for the processing industry. In addition, the Group has a common function "Operations" for procurement, manufacturing and logistics.
Presentation of divisions
| | Orders received
| | Order backlog
|
|---|
Consolidated MSEK
| | Year ended
December 31,
2002
| | Year ended
December 31,
2001
| | Un-audited
Pro forma
Year ended
December 31,
2000
| | Period ended
December 31,
2000
| | 2002
| | 2001
| | Un-audited
Pro Forma
2000
|
|---|
| Equipment | | 8,092.6 | | 8,557.9 | | 8,159.9 | | 2,713.6 | | 1,564.5 | | 1,648.3 | | 1,473.3 |
| Process Technology | | 6,488.1 | | 7,026.9 | | 6,188.1 | | 2,025.0 | | 2,752.6 | | 2,654.7 | | 2,311.2 |
| Operations and other | | 94.1 | | 96.1 | | 212.4 | | 66.9 | | 23.0 | | 9.5 | | 140.1 |
| | |
| |
| |
| |
| |
| |
| |
|
| Subtotal | | 14,674.8 | | 15,680.9 | | 14,560.4 | | 4,805.5 | | 4,340.1 | | 4,312.5 | | 3,924.6 |
| Divested | | — | | 213.0 | | 814.0 | | 267.5 | | | | 1.0 | | 138.4 |
| | |
| |
| |
| |
| |
| |
| |
|
| Total | | 14,674.8 | | 15,893.9 | | 15,374.4 | | 5,073.0 | | 4,340.1 | | 4,313.5 | | 4,063.0 |
| | |
| |
| |
| |
| |
| |
| |
|
|
|
Net sales
|
|
Operating income
|
|
|---|
Consolidated MSEK
| | Year ended
December 31,
2002
| | Year ended
December 31,
2001
| | Un-audited
Pro forma
Year ended
December 31,
2000
| | Period ended
December 31,
2000
| | 2002
| | 2001
| |
|---|
| Equipment | | 8,129.6 | | 8,576.2 | | 7,981.4 | | 3,046.3 | | 1,078.3 | | 1,083.6 | |
| Process Technology | | 6,377.1 | | 6,872.0 | | 5,775.9 | | 2,508.5 | | 521.4 | | 472.7 | |
| Operations and other | | 88.2 | | 169.4 | | 427.9 | | 124.9 | | (346.7 | ) | (318.6 | ) |
| | |
| |
| |
| |
| |
| |
| |
| Subtotal | | 14,594.9 | | 15,617.6 | | 14,185.2 | | 5,679.7 | | 1,253.0 | | 1,237.7 | |
| Comparison distortion items | | — | | — | | — | | 277.3 | | (29.2 | ) | 5.3 | |
| Divested | | — | | 212.0 | | 827.1 | | | | — | | (9.2 | ) |
| | |
| |
| |
| |
| |
| |
| |
| Total | | 14,594.9 | | 15,829.6 | | 15,012.3 | | 5,957.0 | | 1,223.8 | | 1,233.8 | |
| | |
| |
| |
| |
| |
| |
| |
F-16
|
|
Assets
|
|
Liabilities
|
|---|
Consolidated MSEK
|
|---|
| | 2002
| | 2001
| | 2002
| | 2001
|
|---|
| Equipment | | 3,425.7 | | 4,988.4 | | 1,085.6 | | 1,534.3 |
| Process Technology | | 3,604.9 | | 4,386.9 | | 1,142.3 | | 1,349.3 |
| Operations and other | | 6,260.3 | | 5,682.2 | | 1,983.9 | | 1,756.7 |
| | |
| |
| |
| |
|
| Subtotal | | 13,290.9 | | 15,057.5 | | 4,211.8 | | 4,640.3 |
| Divested | | 0.0 | | 54.3 | | 0.0 | | 7.6 |
| | |
| |
| |
| |
|
| Subtotal | | 13,290.9 | | 15,111.8 | | 4,211.8 | | 4,647.9 |
| Corporate | | 2,135.7 | | 2,524.9 | | 6,693.7 | | 9,228.0 |
| | |
| |
| |
| |
|
| Total | | 15,426.6 | | 17,636.7 | | 10,905.5 | | 13,875.9 |
| | |
| |
| |
| |
|
Corporate refers to balance sheet items that are interest-bearing or are related to taxes.
| | Investments
| | Depreciation
|
|---|
Consolidated MSEK
| | 2002
| | 2001
| | Un-audited Pro forma
2000
| | 2002
| | 2001
|
|---|
| Equipment | | 24.8 | | 31.5 | | 50.8 | | 250.5 | | 261.9 |
| Process Technology | | 33.7 | | 38.0 | | 66.2 | | 236.2 | | 248.6 |
| Operations and other | | 218.2 | | 205.4 | | 184.2 | | 351.3 | | 395.2 |
| | |
| |
| |
| |
| |
|
| Subtotal | | 276.7 | | 274.9 | | 301.2 | | 838.0 | | 905.8 |
| Divested | | — | | — | | 10.5 | | 0.0 | | 6.4 |
| | |
| |
| |
| |
| |
|
| Total | | 276.7 | | 274.9 | | 311.7 | | 838.0 | | 912.2 |
| | |
| |
| |
| |
| |
|
Alfa Laval's secondary segments are geographical markets. Countries with more than 10 percent of net sales, assets or investments are reported separately.
F-17
Presentation of geographical markets
Consolidated
| | 2002
| | %
| | 2001
| | %
| | Un-audited
Pro forma
2000
| | %
| |
|---|
| | MSEK
| |
| | MSEK
| |
| | MSEK
| |
| |
|---|
| Net sales | | | | | | | | | | | | | |
| Customers in | | | | | | | | | | | | | |
| | Sweden | | 835.1 | | 5.7 | % | 770.0 | | 4.9 | % | 744.3 | | 5.0 | % |
| | Other EU | | 4,953.0 | | 33.9 | % | 5,448.5 | | 34.4 | % | 5,521.3 | | 36.8 | % |
| | Other Europe | | 1,497.8 | | 10.3 | % | 1,426.0 | | 9.0 | % | 1,237.1 | | 8.2 | % |
| | United States | | 2,638.7 | | 18.1 | % | 2,815.7 | | 17.8 | % | 2,865.2 | | 19.1 | % |
| | Other North America | | 423.5 | | 2.9 | % | 347.3 | | 2.2 | % | 371.7 | | 2.5 | % |
| | Latin America | | 626.7 | | 4.3 | % | 728.0 | | 4.6 | % | 635.8 | | 4.2 | % |
| | Africa | | 69.6 | | 0.5 | % | 151.7 | | 1.0 | % | 150.8 | | 1.0 | % |
| | Asia | | 3,296.6 | | 22.6 | % | 3,835.3 | | 24.2 | % | 3,193.5 | | 21.3 | % |
| | Oceania | | 253.8 | | 1.7 | % | 307.2 | | 1.9 | % | 292.6 | | 1.9 | % |
| | |
| |
| |
| |
| |
| |
| |
| Total | | 14,594.9 | | 100.0 | % | 15,829.6 | | 100.0 | % | 15,012.3 | | 100.0 | % |
| | |
| |
| |
| |
| |
| |
| |
The split of net sales by geographical market for 2000 is shown only on a pro forma combined basis since no distribution of the predecessor's invoicing up to August 24, 2000 on geographical markets has been available.
Consolidated
| | 2002
| | %
| | 2001
| | %
| |
|---|
| | MSEK
| |
| | MSEK
| |
| |
|---|
| Assets | | | | | | | | | |
| | Sweden | | 2,202.4 | | 14.3 | % | 2,303.1 | | 13.1 | % |
| | Denmark | | 1,627.0 | | 10.5 | % | 1,516.4 | | 8.6 | % |
| | Other EU | | 4,209.9 | | 27.3 | % | 4,764.6 | | 27.0 | % |
| | Other Europe | | 440.3 | | 2.9 | % | 478.8 | | 2.7 | % |
| | United States | | 2,208.7 | | 14.3 | % | 2.960.9 | | 16.8 | % |
| | Other North America | | 247.2 | | 1.6 | % | 280.4 | | 1.6 | % |
| | Latin America | | 237.4 | | 1.5 | % | 374.0 | | 2.1 | % |
| | Africa | | 25.8 | | 0.2 | % | 14.5 | | 0.1 | % |
| | Asia | | 1,924.9 | | 12.5 | % | 2,235.1 | | 12.7 | % |
| | Oceania | | 167.3 | | 1.1 | % | 184.0 | | 1.0 | % |
| | |
| |
| |
| |
| |
| Subtotal | | 13,290.9 | | 86.2 | % | 15,111.8 | | 85.7 | % |
| | Corporate | | 2,135,7 | | 13.8 | % | 2,524.9 | | 14.3 | % |
| | |
| |
| |
| |
| |
| Total | | 15,426.6 | | 100.0 | % | 17,636.7 | | 100.0 | % |
| | |
| |
| |
| |
| |
F-18
Consolidated
|
|
2002
|
|
%
|
|
2001
|
|
%
|
|
Unaudited
Pro forma
2000
|
|
%
|
|
|---|
| | MSEK
| |
| | MSEK
| |
| | MSEK
| |
| |
|---|
| Investments | | | | | | | | | | | | | |
| | Sweden | | 62.8 | | 22.7 | % | 76.5 | | 27.8 | % | 114.0 | | 36.6 | % |
| | Denmark | | 34.0 | | 12.3 | % | 35.6 | | 13.0 | % | 46.3 | | 14.9 | % |
| | Other EU | | 52.0 | | 18.8 | % | 58.6 | | 21.3 | % | 80.1 | | 25.7 | % |
| | Other Europe | | 11.5 | | 4.2 | % | 22.7 | | 8.3 | % | 11.1 | | 3.6 | % |
| | United States | | 84.8 | | 30.6 | % | 37.5 | | 13.6 | % | 28.5 | | 9.1 | % |
| | Other North America | | 1.9 | | 0.7 | % | 2.4 | | 0.9 | % | 2.5 | | 0.8 | % |
| | Latin America | | 2.2 | | 0.8 | % | 3.8 | | 1.4 | % | 4.0 | | 1.3 | % |
| | Africa | | 0.6 | | 0.2 | % | 0.6 | | 0.2 | % | 1.0 | | 0.3 | % |
| | Asia | | 26.0 | | 9.4 | % | 35.7 | | 13.0 | % | 22.9 | | 7.3 | % |
| | Oceania | | 0.9 | | 0.3 | % | 1.5 | | 0.5 | % | 1.3 | | 0.4 | % |
| | |
| |
| |
| |
| |
| |
| |
| Total | | 276.7 | | 100.0 | % | 274.9 | | 100.0 | % | 311.7 | | 100.0 | % |
| | |
| |
| |
| |
| |
| |
| |
The split of investments by geographical market for 2000 is shown only on a pro forma combined basis since no distribution of the predecessors investments up to August 24, 2000 on geographical markets has been available.
Note 2. Average number of employees—total
| | Number of female employees
| | Total number of employees
|
|---|
Consolidated
| | 2002
| | 2001
| | Un-audited
Pro forma
2000
| | 2002
| | 2001
| | Un-audited
Pro forma
2000
|
|---|
| Parent company | | — | | — | | — | | — | | — | | — |
| Subsidiaries in Sweden (8) | | 347 | | 306 | | 399 | | 1,891 | | 1,793 | | 1,894 |
| | |
| |
| |
| |
| |
| |
|
| Total in Sweden (8) | | 347 | | 306 | | 399 | | 1,891 | | 1,793 | | 1,894 |
| Total abroad (76) | | 1,444 | | 1,544 | | 1,697 | | 7,401 | | 7,900 | | 9,107 |
| | |
| |
| |
| |
| |
| |
|
| Total for the group (84) | | 1,791 | | 1,850 | | 2,096 | | 9,292 | | 9,693 | | 11,001 |
| | |
| |
| |
| |
| |
| |
|
The average number of employees during 2000 is shown only on a pro forma combined basis since no distribution can be made for the period prior to and after August 24, 2000. The figures in brackets in the text column state how many companies had employees as well as salaries and remunerations in 2002.
F-19
Note 2. Continued. Average number of employees—In Sweden by municipality
Employees in Sweden
| | 2002
| | 2001
| | Un-audited Pro forma 2000
|
|---|
| Botkyrka | | 483 | | 476 | | 528 |
| Eskilstuna | | 175 | | 181 | | 182 |
| Göteborg | | 2 | | 2 | | 3 |
| Lund | | 951 | | 873 | | 847 |
| Malmö | | 3 | | 3 | | 4 |
| Ronneby | | 240 | | 215 | | 199 |
| Stockholm | | 3 | | 10 | | 10 |
| Västerõs | | — | | — | | 52 |
| Other municipality with < 10 employees | | 34 | | 33 | | 69 |
| | |
| |
| |
|
| Total | | 1,891 | | 1,793 | | 1,894 |
In the line "Other municipality < 10 employees", employees at branch offices abroad are included.
Note 2. Continued. Average number of employees—by country
| | Number of female employees
| | Total number of employees
|
|---|
Consolidated
| | 2002
| | 2001
| | Un-audited Pro forma 2000
| | 2002
| | 2001
| | Un-audited Pro forma 2000
|
|---|
| Argentina | | 6 | | 20 | | 15 | | 31 | | 37 | | 50 |
| Australia | | 21 | | 22 | | 25 | | 72 | | 84 | | 100 |
| Belgium | | 23 | | 30 | | 29 | | 134 | | 140 | | 154 |
| Brazil | | 23 | | 27 | | 29 | | 111 | | 122 | | 157 |
| Bulgaria | | 4 | | 6 | | 5 | | 14 | | 15 | | 14 |
| Canada | | 28 | | 27 | | 42 | | 111 | | 121 | | 210 |
| Chile | | 4 | | 4 | | 4 | | 21 | | 19 | | 23 |
| Colombia | | 2 | | 2 | | 2 | | 10 | | 10 | | 10 |
| Denmark | | 253 | | 227 | | 217 | | 1,054 | | 978 | | 962 |
| Estonia | | 2 | | 2 | | 0 | | 4 | | 5 | | 4 |
| Philippines | | 3 | | 4 | | 4 | | 21 | | 21 | | 22 |
| Finland | | 28 | | 32 | | 38 | | 111 | | 117 | | 126 |
| France | | 120 | | 121 | | 120 | | 610 | | 620 | | 623 |
| United Arab Emirates | | 7 | | 8 | | 12 | | 49 | | 48 | | 48 |
| Greece | | 12 | | 13 | | 13 | | 34 | | 37 | | 36 |
| Hongkong | | 15 | | 14 | | 29 | | 44 | | 61 | | 78 |
| India | | 29 | | 29 | | 32 | | 1,042 | | 1,101 | | 1,267 |
| Indonesia | | 13 | | 15 | | 15 | | 73 | | 73 | | 70 |
| Iran | | 2 | | 1 | | 1 | | 9 | | 7 | | 8 |
| Italy | | 63 | | 69 | | 64 | | 488 | | 506 | | 509 |
| Japan | | 41 | | 47 | | 47 | | 165 | | 184 | | 192 |
| China | | 75 | | 90 | | 71 | | 378 | | 353 | | 326 |
F-20
| Korea | | 15 | | 16 | | 16 | | 77 | | 68 | | 70 |
| Latvia | | 4 | | 4 | | 0 | | 7 | | 7 | | 6 |
| Lithuania | | 4 | | 3 | | 0 | | 4 | | 4 | | 5 |
| Malaysia | | 24 | | 19 | | 22 | | 68 | | 72 | | 81 |
| Mexico | | 9 | | 13 | | 13 | | 50 | | 62 | | 66 |
| Netherlands | | 32 | | 19 | | 17 | | 108 | | 110 | | 119 |
| Norway | | 16 | | 17 | | 21 | | 60 | | 74 | | 97 |
| New Zealand | | 6 | | 7 | | 7 | | 32 | | 34 | | 39 |
| Peru | | 6 | | 6 | | 6 | | 26 | | 30 | | 33 |
| Poland | | 25 | | 29 | | 26 | | 123 | | 122 | | 88 |
| Portugal | | 3 | | 3 | | 3 | | 14 | | 14 | | 14 |
| Romania | | 5 | | 7 | | 7 | | 16 | | 19 | | 22 |
| Russia | | 112 | | 100 | | 102 | | 244 | | 244 | | 252 |
| Switzerland | | 2 | | 2 | | 3 | | 15 | | 15 | | 17 |
| Singapore | | 21 | | 21 | | 21 | | 46 | | 49 | | 65 |
| Slovakia | | 1 | | 1 | | 4 | | 11 | | 9 | | 11 |
| Spain | | 33 | | 32 | | 41 | | 210 | | 218 | | 320 |
| UK* | | 55 | | 80 | | 121 | | 344 | | 519 | | 817 |
| Sweden | | 347 | | 306 | | 399 | | 1,891 | | 1,793 | | 1,894 |
| South Africa | | 9 | | 9 | | 11 | | 38 | | 39 | | 55 |
| Taiwan | | 12 | | 12 | | 12 | | 32 | | 32 | | 32 |
| Thailand | | 13 | | 13 | | 13 | | 37 | | 36 | | 37 |
| Czech Republic | | 13 | | 14 | | 13 | | 58 | | 54 | | 45 |
| Turkey | | 7 | | 8 | | 7 | | 28 | | 29 | | 31 |
| Germany | | 56 | | 64 | | 102 | | 256 | | 347 | | 496 |
| Hungary | | 5 | | 5 | | 4 | | 26 | | 28 | | 31 |
| USA | | 172 | | 222 | | 275 | | 849 | | 966 | | 1,210 |
| Venezuela | | 4 | | 4 | | 3 | | 15 | | 17 | | 21 |
| Austria | | 6 | | 4 | | 13 | | 21 | | 23 | | 38 |
| | |
| |
| |
| |
| |
| |
|
| Total for the group | | 1,791 | | 1,850 | | 2,096 | | 9,292 | | 9,693 | | 11,001 |
|
|
|
|
|
|
|
|
|
|
|
|
|
| * of which employed by the joint venture Rolls Laval | | | | | | | | 1 | | 21 | | 25 |
F-21
Note 3. Salaries and remunerations—total
Consolidated
| | 2002
| | 2001
| | Un-audited
Pro forma
2000
|
|---|
| Board of Directors, Presidents and Vice Presidents | | 133.8 | | 141.0 | | 137.8 |
| Of which, bonus | | 18.3 | | 23.8 | | 15.9 |
| Other | | 2,815.9 | | 3,062.7 | | 3,176.8 |
| Total salaries and remunerations | | 2,949.7 | | 3,203.7 | | 3,314.6 |
| Social security costs | | 548.5 | | 550.9 | | 693.6 |
| Pension costs, defined benefit plans | | 161.9 | | 85.9 | | 67.0 |
| Pension costs, defined premium plans | | 222.8 | | 267.7 | | 211.7 |
| | |
| |
| |
|
| Total costs of personnel | | 3,883.0 | | 4,108.2 | | 4,286.9 |
Salaries and remunerations for 2000 are shown only on a pro forma combined basis since no distribution has been available for the period prior to and after August 24, 2000.
The Group's pension costs and pension liabilities relating to the Board of Directors, presidents and vice presidents amounts to MSEK 46.8 (31.2) (18.7) and MSEK 346.9 (376.4) (381.5) respectively, of which MSEK 223.0 (246.1) (260.4) is covered by the Alfa Laval Pension Fund.
Chief Executive Officer/Managing Director
The Chief Executive Officer and Managing Director Sigge Haraldsson receives a remuneration of SEK 5,098,854 (5,352,173) (6,085,332), of which bonus was—(200,000) (1,404,000). The bonus refers to bonus paid during the year.
Sigge Haraldsson has an agreement on early retirement that gives him the option to enter into early retirement at his request from the age of 60 or to enter into early retirement at the request of the company from the age of 55. The agreement provides a pension level of 50 percent of the salary at the time of retirement if he enters into early retirement between the age of 55 and 58 and 70 percent of the salary if he enters into early retirement after the age of 58. At early retirement, the company maintains the payments of pension premiums as if the employment had lasted until the age of 65.
For the part of the salary that is above the ITP plan's 30 price base amounts (one price base amount equals SEK 37,900), the old age pension after 65 is paid with 52.5 percent of the salary up to 80 price base amounts and above that with 32.5 percent and family pension with 16.25 percent of the salary. He has a special family pension that represents a life long supplement between the old age pension and the family pension according to ITP. During the year, Alfa Laval has recorded costs for pension premiums of MSEK 7.2 (7.3) (7.5), of which MSEK 3.4 (3.4) (3.3) relates to premiums for early retirement that are paid during a short period of time. There is no separate agreement on severance pay.
Board of Directors
The Chairman of the Board Thomas Oldér receives a remuneration of SEK 500,000 per year. He does not have any agreement on future retirement or severance pay with Alfa Laval.
F-22
For 2002, the Board of Directors receive a total fee of SEK 2,250,000 (2,250,000) (-), which is distributed among the members elected at the Annual General Meeting.
Other executive officers
Other executive officers are the nine members of Group Management in addition to the Chief Executive Officer. Their remunerations amount to MSEK 21.3 (22.1) (20.3), of which bonuses were MSEK 4.1 (2.7) (1.4). The bonus refers to bonus paid during the year.
For these executive officers, early retirement can be offered from the age of 60. The agreement normally gives a pension level of 75 percent of the salary at the time of retirement up to 30 price base amounts and above that 50 percent of the salary. Old age pension after 65 and family pension according to ITP do also include the part of the salary above the ITP plan's 30 price base amounts. They have a special family pension that represents a supplement between the old age pension and the family pension according to ITP. In addition to that they may exchange salary and bonus for a temporary old age and family pension.
Alfa Laval has made commitments for severance pay to a limited group of senior executives. The commitments are restricted to a maximum amount of two annual salaries. The commitments define the conditions that must be fulfilled in order for them to become valid.
Decision procedures for remunerations to Group Management
The remunerations to the Chief Executive Officer/Managing Director and other members of Group Management are decided in the remunerations' committee within the Board.
The principle used when deciding the remunerations to executive officers is that the remuneration is mainly based on a fixed monthly salary, with an option for a company car and in addition to that a floating remuneration in the form of a yearly bonus up to 30 percent of the salary. The size of the resulting bonus depends on the outcome of a number of financial measurements and the result of special projects, all compared with the objectives that have been established for the year.
Note 3. Salaries and remunerations—by country
| | Board of Directors, Presidents and Vice Presidents
| | Other employees
|
|---|
Consolidated
| | 2002
| | 2001
| | Un-audited
Pro forma
2000
| | 2002
| | 2001
| | Un-audited
Pro forma 2000
|
|---|
| Argentina | | 0.5 | | 1.1 | | 1.6 | | 3.6 | | 10.1 | | 12.7 |
| Australia | | 2.6 | | 2.4 | | 2.3 | | 19.9 | | 21.6 | | 25.3 |
| Belgium | | 3.3 | | 3.7 | | 3.7 | | 48.8 | | 46.4 | | 49.3 |
| Brazil | | 1.1 | | 1.4 | | 1.3 | | 16.4 | | 22.2 | | 28.1 |
| Bulgaria | | 0.2 | | 0.2 | | 0.2 | | 1.1 | | 1.1 | | 0.9 |
| Canada | | 3.3 | | 4.0 | | 4.6 | | 41.5 | | 43.8 | | 64.8 |
| Chile | | 0.0 | | 0.0 | | 0.0 | | 3.2 | | 5.5 | | 6.4 |
| Colombia | | 0.4 | | 0.5 | | 1.0 | | 0.9 | | 1.0 | | 1.0 |
F-23
| Denmark | | 9.1 | | 8.3 | | 10.4 | | 409.0 | | 431.9 | | 376.2 |
| Estonia | | 0.0 | | 0.0 | | 0.3 | | 0.5 | | 0.7 | | 0.4 |
| Philippines | | 0.4 | | 0.3 | | 0.3 | | 1.8 | | 1.8 | | 2.0 |
| Finland | | 2.6 | | 2.2 | | 2.2 | | 38.8 | | 40.0 | | 38.9 |
| France | | 3.4 | | 4.2 | | 3.6 | | 178.0 | | 173.9 | | 158.2 |
| United Arab Emirates | | 1.7 | | 1.4 | | 1.2 | | 14.5 | | 13.6 | | 7.7 |
| Greece | | 0.0 | | 0.0 | | 0.0 | | 10.6 | | 10.6 | | 8.9 |
| Hongkong | | 3.4 | | 3.5 | | 3.4 | | 22.7 | | 25.5 | | 29.0 |
| India | | 1.2 | | 1.2 | | 1.0 | | 39.7 | | 39.7 | | 39.6 |
| Indonesia | | 0.5 | | 0.5 | | 0.4 | | 4.6 | | 4.5 | | 2.9 |
| Iran | | 0.0 | | 0.0 | | 0.9 | | 4.1 | | 3.6 | | 0.8 |
| Italy | | 4.5 | | 4.1 | | 3.1 | | 125.2 | | 134.3 | | 122.8 |
| Japan | | 8.8 | | 8.4 | | 8.2 | | 84.9 | | 115.2 | | 113.8 |
| China | | 0.0 | | 0.0 | | 0.0 | | 21.6 | | 19.9 | | 16.1 |
| Korea | | 1.0 | | 0.8 | | 0.8 | | 19.9 | | 18.9 | | 18.5 |
| Latvia | | 0.4 | | 0.4 | | 0.3 | | 1.0 | | 0.9 | | 0.5 |
| Lithuania | | 0.0 | | 0.0 | | 0.2 | | 0.7 | | 0.7 | | 0.6 |
| Malaysia | | 1.5 | | 1.4 | | 1.0 | | 10.5 | | 11.9 | | 9.9 |
| Mexico | | 1.7 | | 5.4 | | 3.5 | | 11.1 | | 13.0 | | 6.2 |
| Netherlands | | 2.3 | | 2.1 | | 3.0 | | 46.4 | | 46.0 | | 41.0 |
| Norway | | 1.3 | | 1.3 | | 1.0 | | 36.4 | | 37.3 | | 38.7 |
| New Zealand | | 0.4 | | 0.0 | | 0.0 | | 7.7 | | 8.4 | | 8.0 |
| Peru | | 1.1 | | 1.1 | | 1.2 | | 3.7 | | 6.1 | | 4.8 |
| Poland | | 4.0 | | 3.7 | | 0.9 | | 14.1 | | 15.0 | | 10.3 |
| Portugal | | 1.8 | | 1.8 | | 1.7 | | 3.2 | | 3.0 | | 2.6 |
| Romania | | 0.0 | | 0.0 | | 0.0 | | 2.3 | | 2.5 | | 2.2 |
| Russia | | 1.4 | | 1.3 | | 0.0 | | 25.8 | | 27.6 | | 20.5 |
| Switzerland | | 1.9 | | 1.7 | | 1.2 | | 10.5 | | 9.9 | | 10.0 |
| Singapore | | 1.4 | | 1.8 | | 2.7 | | 11.8 | | 11.2 | | 16.8 |
| Slovakia | | 0.1 | | 0.0 | | 0.0 | | 1.2 | | 1.4 | | 1.0 |
| Spain | | 1.8 | | 1.1 | | 1.8 | | 64.0 | | 69.5 | | 78.9 |
| UK | | 4.8 | | 6.0 | | 5.8 | | 124.7 | | 176.8 | | 266.7 |
| Sweden | | 21.6 | | 27.6 | | 33.9 | | 676.4 | | 629.6 | | 628.4 |
| South Africa | | 0.6 | | 0.6 | | 0.5 | | 6.0 | | 6.7 | | 9.4 |
| Taiwan | | 0.9 | | 0.9 | | 0.8 | | 7.9 | | 8.9 | | 8.4 |
| Thailand | | 1.3 | | 1.1 | | 1.1 | | 4.4 | | 4.5 | | 4.6 |
| Czech Republic | | 0.8 | | 0.7 | | 0.2 | | 7.0 | | 5.9 | | 4.8 |
| Turkey | | 1.1 | | 0.9 | | 1.2 | | 5.1 | | 4.7 | | 6.0 |
| Germany | | 13.9 | | 11.8 | | 10.0 | | 133.7 | | 168.5 | | 211.9 |
F-24
| Hungary | | 0.7 | | 0.5 | | 0.5 | | 3.4 | | 3.2 | | 2.9 |
| USA | | 17.0 | | 17.5 | | 13.1 | | 475.6 | | 591.8 | | 641.8 |
| Venezuela | | 0.0 | | 0.0 | | 0.3 | | 2.0 | | 2.3 | | 3.9 |
| Austria | | 1.7 | | 1.7 | | 1.4 | | 8.2 | | 9.2 | | 11.7 |
| | |
| |
| |
| |
| |
| |
|
| Total for the group | | 133.8 | | 141.0 | | 137.8 | | 2,815.9 | | 3,062.7 | | 3,176.8 |
| | |
| |
| |
| |
| |
| |
|
Note 4. Information on auditors' fee
During 2000 quotations were taken in from four of the large international audit firms. After a selection process, Ernst & Young were given the assignment to be the Group's auditors as of year 2000 and four years ahead. Ernst & Young were already the Group's main auditors and audited the consolidated group and most of the subsidiaries. To the extent it was not possible to exchange other auditors with Ernst & Young during 2000, this happened during the first part of 2001.
Fees and expense compensation
| | 2002
| | 2001
| | Un-audited
Pro forma
2000
|
|---|
| Audit | | | | | | |
| | Ernst & Young | | 12.7 | | 10.2 | | 9.1 |
| | Other audit firms | | 1.1 | | 2.7 | | 1.9 |
| | |
| |
| |
|
| | Total | | 13.8 | | 12.9 | | 11.0 |
| Other projects | | | | | | |
| | Ernst & Young | | 2.8 | | 7.2 | | 1.9 |
| | Other audit firms | | 6.6 | | 5.3 | | 4.0 |
| | |
| |
| |
|
| | Total | | 9.4 | | 12.5 | | 5.9 |
| | |
| |
| |
|
An audit includes examining the financial statements, assessing the accounting principles used and significant estimates made by management, as well as evaluating the overall financial statement presentation. It also includes an examination in order to give an opinion on the Board's discharge from liability. All other assignments are defined as other projects.
Note 5. Advertising costs
Advertising costs have amounted to MSEK 40.0 (53.9) (62.0). These refer to costs for advertisements in newspapers and technical press, participation in trade fairs, brochures and for year 2001 the building of the Alfa Laval trademark and the new logotype.
F-25
Note 6. Comparison distortion items
| | Successor
| |
|
|---|
| |
| |
| | Un-audited
Pro forma
Year ended
December 31,
2000
| |
| | Predecessor
|
|---|
Consolidated
| | Year ended
December 31,
2002
| | Year ended
December 31,
2001
| | Period ended
December 31,
2000
| | Period ended
August 23,
2000
|
|---|
| | Surplus funds from SPP | | — | | — | | 270.7 | | — | | 270.7 |
| | Sale of Tetra Pak division in India subsidiary | | — | | — | | 30.8 | | — | | 30.8 |
| | Reversal of step up value on inventory | | — | | — | | (340.2 | ) | (340.2 | ) | — |
| | Reversal of step up value on research and development | | — | | — | | (53.6 | ) | (53.6 | ) | — |
| | Sale of real estate | | (43.2 | ) | (4.7 | ) | 222.2 | | — | | 222.2 |
| | Sale of Industrial Flow | | 14.0 | | 10.0 | | — | | — | | — |
| | Sale of Automation | | — | | — | | — | | — | | — |
| | |
| |
| |
| |
| |
|
| Total | | (29.2 | ) | 5.3 | | 129.9 | | (393.8 | ) | 523.7 |
| | |
| |
| |
| |
| |
|
The sale of the property in Warminster in the United States was completed at the end of March at a price of MUSD 6.4 corresponding to MSEK 62.1. The realised loss was MSEK -43.2.
An agreement was signed on December 19, 2000 concerning the divestment of the Industrial Flow operation. The agreement was made with Crane Co in the US and the divestment was made on April 2, 2001. The sales price was MSEK 330.6. After considering the reversal of Group step-up values and provisions for deferred costs, the divestment has resulted in a gain of MSEK 10.0 in the annual report for 2001. A few activities have remained before the divestment could be considered to be completed. During September 2002 a final settlement has been made with the buyer, resulting in an increase of the realised gain by MSEK 14.0.
The real estate in Johannesburg in South Africa was divested in May 2001. The sales price was MSEK 13.6. The local realised gain of MSEK 2.4 corresponded to a reversal of Group step-up values relating to the real estate, which resulted in a loss of MSEK -0.3. The sale of the real estate in Glinde in Germany was completed in October 2001 at a price of MSEK 196.4. The local realised gain of MSEK 147.8 corresponded to a reversal of Group step-up values relating to the real estate and provisions for certain future rent commitments, which resulted in a loss of MSEK -8.3. In addition, some smaller properties in Spain and Sweden and one condominium in Sweden were sold with a total realised gain of MSEK 3.9.
Due to the repayment of the PRI debt that took place in May 1999, the Swedish Group companies have been able to receive all surplus consolidation funds of MSEK 270.7 from SPP in cash as of February 2001.
The Tetra Pak division of the Indian subsidiary was divested in May 2000 for MSEK 38.6, which resulted in a realised gain of MSEK 30.8. During 1999, this division had net sales of MSEK 47.3 and 58 employees.
F-26
The step-up values for inventory and research and development appeared in connection with the acquisition on August 24, 2000 and were reversed the same year, see Note 13.
Note 7. Depreciation by function
| | Successor
| |
| |
|---|
| |
| |
| | Un-audited
Pro forma
Year ended
December 31,
2000
| |
| | Predecessor
| |
|---|
Consolidated
| | Year ended
December 31,
2002
| | Year ended
December 31,
2001
| | Period ended
December 31,
2000
| | Period ended
August 23,
2000
| |
|---|
| Cost of goods sold | | (478.0 | ) | (499.8 | ) | (520.1 | ) | (173.3 | ) | (136.2 | ) |
| Sales | | (60.1 | ) | (68.7 | ) | (132.7 | ) | (44.2 | ) | (88.5 | ) |
| Administration | | (97.9 | ) | (145.3 | ) | (89.0 | ) | (29.7 | ) | (59.3 | ) |
| Research and development | | (7.5 | ) | (8.6 | ) | (13.9 | ) | (4.6 | ) | (9.3 | ) |
| Other income and costs | | (6.8 | ) | (11.8 | ) | (26.4 | ) | (8.8 | ) | (17.6 | ) |
| Goodwill | | (187.7 | ) | (178.0 | ) | (163.8 | ) | (54.6 | ) | (485.0 | ) |
| | |
| |
| |
| |
| |
| |
| Total | | (838.0 | ) | (912.2 | ) | (945.9 | ) | (315.2 | ) | (795.9 | ) |
| | |
| |
| |
| |
| |
| |
Note 8. Depreciation by type of assets
| | Successor
| |
| |
|---|
| |
| |
| | Un-audited
Pro forma
Year ended
December 31,
2000
| |
| | Predecessor
| |
|---|
Consolidated
| | Year ended
December 31,
2002
| | Year ended
December 31,
2001
| | Period ended
December 31,
2000
| | Period ended
August 23,
2000
| |
|---|
| Goodwill | | (187.7 | ) | (178.0 | ) | (163.8 | ) | (54.6 | ) | (485.0 | ) |
| Patents, trademarks, etc. | | (208.3 | ) | (214.6 | ) | (199.4 | ) | (66.4 | ) | (3.6 | ) |
| Machinery and equipment | | (351.4 | ) | (403.6 | ) | (447.2 | ) | (149.1 | ) | (240.5 | ) |
| Financial leasing machinery and equipment | | (7.8 | ) | (10.9 | ) | (20.4 | ) | (6.8 | ) | (13.6 | ) |
| Buildings and ground installations | | (82.8 | ) | (105.1 | ) | (115.1 | ) | (38.3 | ) | (53.2 | ) |
| | |
| |
| |
| |
| |
| |
| Total | | (838.0 | ) | (912.2 | ) | (945.9 | ) | (315.2 | ) | (795.9 | ) |
| | |
| |
| |
| |
| |
| |
Note 9. Result from other securities and receivables accounted for as fixed assets
| | Successor
| |
|
|---|
| |
| |
| | Un-audited
Pro forma
Year ended
December 31,
2000
| |
| | Predecessor
|
|---|
Consolidated
| | Year ended
December 31,
2002
| | Year ended
December 31,
2001
| | Period ended
December 31,
2000
| | Period ended
August 23,
2000
|
|---|
| Dividends from other | | 7.8 | | 9.6 | | 4.3 | | 1.3 | | 3.0 |
| | |
| |
| |
| |
| |
|
| Total | | 7.8 | | 9.6 | | 4.3 | | 1.3 | | 3.0 |
| | |
| |
| |
| |
| |
|
F-27
Note 10. Interest income/costs and similar result items
| | Successor
| |
| |
|---|
| |
| |
| | Un-audited
Pro forma
Year ended
December 31,
2000
| |
| | Predecessor
| |
|---|
Consolidated
| | Year ended
December 31,
2002
| | Year ended
December 31,
2001
| | Period ended
December 31,
2000
| | Period ended
August 23,
2000
| |
|---|
| Interest income | | | | | | | | | | | |
| | Financial leasing | | | | | | | | | | | |
| | | External companies | | 0.2 | | 0.0 | | 0.7 | | 0.7 | | — | |
| | Other interest | | | | | | | | | | | |
| | | External companies | | 139.5 | | 108.0 | | 114.8 | | 49.5 | | 65.3 | |
| Exchange gains | | | | | | | | | | | |
| | Unrealised | | 46.3 | | 76.9 | | 93.5 | | 40.6 | | 52.9 | |
| | Realised | | 136.8 | | 53.0 | | 36.1 | | 18.6 | | 17.5 | |
| | |
| |
| |
| |
| |
| |
| Total | | 322.7 | | 238.0 | | 245.1 | | 109.4 | | 135.7 | |
| | |
| |
| |
| |
| |
| |
Interest costs |
|
|
|
|
|
|
|
|
|
|
|
| | Financial leasing | | | | | | | | | | | |
| | | External companies | | (2.7 | ) | (1.7 | ) | (2.4 | ) | (2.4 | ) | — | |
| | Other interest | | | | | | | | | | | |
| | | External companies | | (644.2 | ) | (831.4 | ) | (908.1 | ) | (393.1 | ) | (167.0 | ) |
| Exchange loss | | | | | | | | | | | |
| | Unrealised | | (26.0 | ) | (244.8 | ) | (115.7 | ) | (29.7 | ) | (86.0 | ) |
| | Realised | | (130.6 | ) | (30.4 | ) | (25.8 | ) | (15.0 | ) | (10.8 | ) |
| | |
| |
| |
| |
| |
| |
| Total | | (803.5 | ) | (1,108.3 | ) | (1,052.0 | ) | (440.2 | ) | (263.8 | ) |
| | |
| |
| |
| |
| |
| |
In the Group, reported net exchange differences of MSEK 164.9 (-105.5) (-312.5) relating to debts in foreign currencies have been charged to unrestricted equity. These debts finance the acquisition of shares in foreign subsidiaries and act as a hedge to the acquired net assets. In the parent company, the exchange differences are taken to the income statement.
Net commercial exchange differences have amounted to MSEK 284.8 (137.7) (-52.5). These arise in connection with delivery of goods and other operational activities and have thereby affected the operating result.
Note 11. Minority interest
The minority share in subsidiaries' result and minority interests in the balance sheet relate to five subsidiaries in India, Russia and Switzerland where minority owners exist.
F-28
Note 12. Taxes on this year's result and other taxes for the Group
| | 2002
| | 2001
| | Un-audited
Pro forma
2000
| |
|---|
| The major components of the group's tax costs: | | | | | | | |
| Current tax cost | | (336.0 | ) | (396.9 | ) | (300.4 | ) |
| Adjustment for current taxes on prior periods | | 72.1 | | 84.8 | | (95.3 | ) |
| Deferred tax costs/income on changes in temporary differences | | 95.0 | | 374.6 | | 375.4 | |
| Deferred tax costs/income on changes in tax rates or new taxes | | 3.4 | | 12.0 | | (13.8 | ) |
| Tax income from previously unrecognised tax losses or tax credits on temporary differences of prior periods | | 6.0 | | 1.3 | | (1.8 | ) |
| Deferred tax income from previously unrecognised tax losses or tax credits on temporary differences of prior periods | | 0.3 | | 0.7 | | 2.4 | |
| Deferred tax cost from the write down or reversal of a previous write down of a deferred tax asset | | (26.5 | ) | (15.6 | ) | (18.6 | ) |
| Other taxes | | (32.5 | ) | (34.6 | ) | (53.0 | ) |
| | |
| |
| |
| |
| Total tax cost/(benefit) | | (218.2 | ) | 26.3 | | (105.2 | ) |
| | |
| |
| |
| |
| The difference between the tax costs of the group and the tax cost based upon applicable tax rates, can be explained as follows: | | | | | | | |
| Result before minority interests and tax | | 460.1 | | 373.1 | | 7.5 | |
| Tax according to applicable tax rates | | (133.6 | ) | (14.6 | ) | (2.6 | ) |
| Tax effect of: | | | | | | | |
| Non deductible costs including group adjustments | | (268.0 | ) | (257.4 | ) | (102.5 | ) |
| Non taxable income | | 164.2 | | 149.3 | | 11.2 | |
| Differences between reported depreciation and depreciation according to tax rules | | (7.2 | ) | (7.4 | ) | (17.7 | ) |
| Differences between reported other depreciation and other depreciation according to tax rules | | (40.7 | ) | 12.1 | | (31.7 | ) |
| Tax losses and tax credits | | 2.9 | | 42.5 | | 124.3 | |
| Other | | (7.9 | ) | 17.0 | | 9.2 | |
| Adjustment for current tax on prior periods | | 72.1 | | 84.8 | | (95.3 | ) |
| | |
| |
| |
| |
| Total tax cost/(benefit) | | (218.2 | ) | 26.3 | | (105.2 | ) |
| | |
| |
| |
| |
The Group's effective tax rate is approximately 33 percent based on taxable result, and it is calculated as a weighted average based on each subsidiaries' part of the result before tax.
F-29
During the year the nominal tax rates have been changed in the following countries:
| | Tax rates in percentage
|
|---|
| | 2002
| | 2001
| | Un-audited
Pro forma
2000
|
|---|
| Peru | | 25 | | 25 | | 30 |
| India | | 37 | | 36 | | 39 |
| Iran | | 40 | | 12 | | 50 |
| Pakistan | | 43 | | 43 | | 40 |
| Singapore | | 22 | | 25 | | 26 |
| Bulgaria | | 20 | | 20 | | 25 |
| France | | 35 | | 34 | | 35 |
| Germany | | 37 | | 37 | | 51 |
| Greece | | 35 | | 38 | | 40 |
| Italy | | 38 | | 40 | | 39 |
| Poland | | 28 | | 28 | | 30 |
| Portugal | | 34 | | 34 | | 30 |
| Australia | | 30 | | 30 | | 36 |
| Chile | | 16 | | 15 | | 15 |
| China | | 11 | | 3 | | 3 |
| Korea | | 29 | | 28 | | 28 |
| United Arab Emirates | | 7 | | 4 | | 4 |
| Switzerland | | 24 | | 28 | | 28 |
| Turkey | | 28 | | 33 | | 33 |
| Russia | | 24 | | 35 | | 35 |
| Latvia | | 22 | | 25 | | 25 |
| Lithuania | | 15 | | 24 | | 24 |
In the Group there are temporary differences and unused tax losses and tax credits of MSEK 2,197.1 (2,567.0) that have not resulted in corresponding deferred tax assets, since these are not likely to be used.
F-30
Temporary differences exist when there is a difference between the book value and the tax base of assets and liabilities. The Group's temporary differences have resulted in a deferred tax asset or a deferred tax liability relating to the following assets and liabilities:
| | 2002
| | 2001
| | 2000
|
|---|
| | Deferred
tax asset
| | Deferred
tax liability
| | Deferred
tax asset
| | Deferred
tax liability
| | Deferred
tax asset
| | Deferred
tax liability
|
|---|
| Intangible assets | | 71.5 | | 410.0 | | 96.9 | | 518.0 | | 104.6 | | 590.7 |
| Tangible assets | | 10.0 | | 471.1 | | 8.3 | | 587.6 | | 24.1 | | 770.4 |
| Inventory | | 44.4 | | 27.7 | | 90.4 | | 21.6 | | 61.5 | | 24.1 |
| Other current assets | | 11.3 | | 2.5 | | 2.5 | | 5.9 | | 0.9 | | 3.8 |
| Financial assets | | 4.5 | | — | | 4.6 | | 4.6 | | 0.7 | | — |
| Short term liabilities | | 361.6 | | 40.8 | | 364.1 | | 0.2 | | 304.4 | | 9.5 |
| Equity capital/minority | | — | | — | | 12.5 | | 2.1 | | 15.9 | | 14.6 |
| Tax losses and tax credits* | | 19.3 | | — | | 59.0 | | 12.7 | | 89.1 | | — |
| Other | | 11.5 | | 0.4 | | (14.5 | ) | (9.1 | ) | 2.8 | | — |
| Total | | 534.0 | | 952.5 | | 623.8 | | 1,143.6 | | 604.0 | | 1,413.1 |
- *
- The Group has reported a deferred tax asset on unused tax losses and tax grants of MSEK 61.4 (181.0). These unused tax losses and tax grants are essentially not restricted in time.
Note 13. Goodwill and step-up values related to the acquisition on August 24, 2000
The acquisition
The acquisition on August 24, 2000 was made in several steps. The first step was that Alfa Laval Holding AB's subsidiary Alfa Laval NV sold Alfa Laval Bostadsförvaltning AB to Tetra Laval BV in the Netherlands. Alfa Laval Bostadsförvaltning AB was in connection with this renamed to Alfa Laval Credit Finance AB. Tetra Laval BV in its turn sold Alfa Laval Holding AB with subsidiaries to Alfa Laval Credit Finance AB. All of these transactions took place on August 24, 2000.
Prior to the acquisition, Industri Kapital had created a new company, Alfa Laval AB. In connection with a new issue of shares, Industri Kapital subscribed for 51.9 percent, Alfa Laval management for 0.3 percent and Tetra Laval BV for 47.8 percent of the total number of shares in the company. Alfa Laval AB had before the acquisition created a new company, Alfa Laval Special Finance AB, which acquired Alfa Laval Credit Finance AB with subsidiaries on August 24, 2000.
The same day Industri Kapital acquired an additional 11.0 percent of the shares in Alfa Laval AB from Tetra Laval BV. Later during the autumn 2000, Industri Kapital sold shares corresponding to 0.4 percent of the share capital to Alfa Laval management. During 2001 Industri Kapital sold shares corresponding to a further 0.4 percent of the share capital to a third group of management within Alfa Laval.
The acquisition value for the shares of Alfa Laval Holding AB was MSEK 8,213.8 at the transaction on August 24, 2000. Below is shown a summary of the goodwill and the group step-up or step down values that the acquisition resulted in and the amortisation cost per type of asset. The
F-31
goodwill is amortised over 20 years. The corresponding presentation by asset type is found in Notes 14 and 15.
| | Alfa Laval August 24, 2000 to December 31, 2000
| |
|---|
Consolidated
| | Allocated value
August 24, 2000
| | Realised 2000
| | Planned
amortisation
| | Translation
difference
| | Residual value
December 31,
2000
| |
|---|
| Buildings | | 1,058.5 | | (178.8 | ) | (11.8 | ) | 22.8 | | 890.7 | |
| Land and land improvements | | (228.4 | ) | — | | — | | 4.1 | | (224.3 | ) |
| Machinery | | 548.3 | | — | | (18.3 | ) | 15.0 | | 545.0 | |
| Equipment | | 452.1 | | — | | (10.5 | ) | 10.5 | | 452.1 | |
| Construction in progress | | 15.9 | | — | | — | | 0.4 | | 16.3 | |
| Inventory | | 340.2 | | (340.2 | ) | — | | — | | 0.0 | |
| Patent and trademarks | | 461.3 | | — | | (7.7 | ) | 13.0 | | 466.6 | |
| Technology | | 1,279.8 | | — | | (57.0 | ) | 31.3 | | 1,254.1 | |
| Research and development | | 53.6 | | (53.6 | ) | — | | — | | 0.0 | |
| Capital gain (Industrial Flow) | | 41.8 | | — | | — | | — | | 41.8 | |
| | |
| |
| |
| |
| |
| |
| Subtotal | | 4,023.1 | | (572.6 | ) | (105.3 | ) | 97.1 | | 3,442.3 | |
| Goodwill | | 3,276.6 | | — | | (54.6 | ) | 92.2 | | 3,314.2 | |
| | |
| |
| |
| |
| |
| |
| Total | | 7,299.7 | | (572.6 | ) | (159.9 | ) | 189.3 | | 6,756.5 | |
| | |
| |
| |
| |
| |
| |
The amortisation for the full-year 2000 (pro forma) was MSEK 163.8 for goodwill and MSEK 315.9 for other Group step-up values.
The costs for the reversal of the step-up values for inventory and research and development have been accounted for as comparison distortion items. For assets sold, net gains or losses are recognised on the costs basis including any related step-up value.
F-32
Construction in process was transferred to machinery in 2001.
| | Alfa Laval 2002
| |
|---|
Consolidated
| | Opening balance
January 1, 2002
| | Realised 2002
| | Planned
amortisation
| | Translation
difference
| | Residual value
December 31,
2002
| |
|---|
| Buildings | | 682.7 | | (16.5 | ) | (27.5 | ) | (33.9 | ) | 604.8 | |
| Land and land improvements | | (180.3 | ) | 25.0 | | — | | 25.4 | | (129.9 | ) |
| Machinery | | 527.2 | | | | (59.0 | ) | (24.5 | ) | 443.7 | |
| Equipment | | 419.7 | | | | (31.2 | ) | (27.3 | ) | 361.2 | |
| Patent and trademarks | | 469.3 | | | | (24.1 | ) | (36.9 | ) | 408.3 | |
| Technology | | 1,128.2 | | | | (177.2 | ) | (59.1 | ) | 891.9 | |
| | |
| |
| |
| |
| |
| |
| Subtotal for other step up values | | 3,046.8 | | 8.5 | | (319.0 | ) | (156.3 | ) | 2,580.0 | |
| Goodwill | | 3,372.9 | | | | (172.9 | ) | (268.9 | ) | 2,931.2 | |
| |
| | Acquired 2002
| |
| |
| |
| |
|---|
| Goodwill related to the acquisition of Alfa Laval Credit Finance AB (additional purchase price) | | | | 367.5 | | (11.4 | ) | (16.7 | ) | 339.4 | |
| Danish Separation System A/S | | — | | 102.4 | | (3.4 | ) | (0.6 | ) | 98.4 | |
| | |
| |
| |
| |
| |
| |
| Subtotal goodwill | | 3,372.9 | | 469.9 | | (187.7 | ) | (286.2 | ) | 3,369.0 | |
| | |
| |
| |
| |
| |
| |
| Total | | 6,419.7 | | 478.4 | | (506.7 | ) | (442.5 | ) | 5,949.0 | |
| | |
| |
| |
| |
| |
| |
In connection with the IPO an additional purchase price of MEUR 40.0, corresponding to MSEK 367.5, was paid to Tetra Laval BV for the original acquisition on August 24, 2000 of the Alfa Laval Credit Finance AB Group. This has been reported entirely as goodwill in the Group and is amortised over 20 years.
At the acquisition of Danish Separation Systems A/S in 2002, no other group surplus values than goodwill have been identified.
There is no deferred tax liability calculated on the goodwill. The deferred tax liability on the other step-up values is MSEK 826.7 (978.7).
F-33
Note 14. Intangible fixed assets
Consolidated
| | 2002
| | 2001
| |
|---|
| Concessions, patents, licenses, trademarks and similar rights | | | | | |
| Opening balance, accumulated acquisition values | | 1,993.8 | | 1,953.9 | |
| Purchases | | 0.6 | | 3.6 | |
| Sales/disposals | | (2.4 | ) | (60.2 | ) |
| Reclassifications | | (13.5 | ) | 6.8 | |
| Translation difference for the year | | 154.3 | | 89.8 | |
| | |
| |
| |
| Closing balance, accumulated acquisition values | | 2,132.8 | | 1,993.8 | |
Opening balance, accumulated depreciation |
|
(353.8 |
) |
(148.8 |
) |
| Sales/disposals | | 2.4 | | 17.9 | |
| Reclassifications | | 10.8 | | (5.1 | ) |
| Depreciation of step-up value, patent & trademarks | | (24.1 | ) | (25.0 | ) |
| Depreciation of step-up value, technology | | (177.2 | ) | (182.0 | ) |
| Depreciation for the year | | (6.9 | ) | (7.6 | ) |
| Translation difference for the year | | (250.4 | ) | (3.2 | ) |
| | |
| |
| |
| Closing balance, accumulated depreciation | | (799.2 | ) | (353.8 | ) |
Closing balance, net book value |
|
1,333.6 |
|
1,640.0 |
|
| | |
| |
| |
Goodwill |
|
|
|
|
|
| Opening balance, accumulated acquisition values | | 3,611.7 | | 3,370.4 | |
| Acquisition of 13.1% of Alfa Laval (India) Ltd | | — | | 39.2 | |
| Goodwill in connection with acquisition of Alfa Laval Nakskov A/S | | 102.4 | | — | |
| Additional purchase price | | 367.5 | | — | |
| Translation difference for the year | | (313.0 | ) | 202.1 | |
| | |
| |
| |
| Closing balance, accumulated acquisition values | | 3,768.6 | | 3,611.7 | |
Opening balance, accumulated depreciation |
|
(238.8 |
) |
(56.2 |
) |
| Depreciation for the year | | (187.7 | ) | (178.0 | ) |
| Translation difference for the year | | 26.8 | | (4.6 | ) |
| | |
| |
| |
| Closing balance, accumulated depreciation | | (399.6 | ) | (238.8 | ) |
Closing balance, net book value |
|
3,369.0 |
|
3,372.9 |
|
| | |
| |
| |
Renting rights and similar rights |
|
|
|
|
|
| Opening balance, accumulated acquisition values | | 0.6 | | 0.4 | |
| Purchases | | 0.1 | | 0.2 | |
| Reclassifications | | 0.4 | | — | |
| | |
| |
| |
| Closing balance, accumulated acquisition values | | 1.1 | | 0.6 | |
Opening balance, accumulated depreciation |
|
(0.2 |
) |
(0.2 |
) |
| Reclassifications | | (0.2 | ) | — | |
| Depreciation for the year | | (0.1 | ) | 0.0 | |
| Translation difference for the year | | 0.1 | | — | |
| | |
| |
| |
| Closing balance, accumulated depreciation | | (0.4 | ) | (0.2 | ) |
Closing balance, net book value |
|
0.7 |
|
0.4 |
|
| | |
| |
| |
F-34
Note 15. Property, plant and equipment
Consolidated
| | 2002
| | 2001
| |
|---|
| Real estate | | | | | |
| Opening balance, accumulated acquisition values | | 2,305.0 | | 2,604.4 | |
| Purchases | | 12.0 | | 5.6 | |
| Acquisitions of businesses | | 17.9 | | — | |
| Sales/disposal | | (158.5 | ) | (243.3 | ) |
| Reclassifications | | 29.1 | | (24.3 | ) |
| Realisation of step-up values due to sale | | 8.5 | | (164.0 | ) |
| Translation difference for the year | | (242.8 | ) | 126.6 | |
| | |
| |
| |
| Closing balance, accumulated acquisition values | | 1,971.2 | | 2,305.0 | |
Opening balance, accumulated depreciation |
|
(916.0 |
) |
(964.7 |
) |
| Sales/disposals | | 75.6 | | 187.4 | |
| Acquisition of businesses | | (1.3 | ) | — | |
| Reclassifications | | 47.7 | | (2.1 | ) |
| Depreciation of step-up value | | (27.5 | ) | (33.4 | ) |
| Depreciation for the year | | (54.6 | ) | (71.0 | ) |
| Translation difference for the year | | 125.4 | | (32.2 | ) |
| | |
| |
| |
| Closing balance, accumulated depreciation | | (750.7 | ) | (916.0 | ) |
Opening balance, accumulated revaluations, net |
|
90.0 |
|
90.6 |
|
| Revaluation for the year | | 0.1 | | 0.0 | |
| Depreciation for the year on revaluation | | (0.7 | ) | (0.6 | ) |
| | |
| |
| |
| Closing balance, accumulated revaluation, net | | 89.4 | | 90.0 | |
Closing balance, net book value |
|
1,309.9 |
|
1,479.0 |
|
| | |
| |
| |
| Machinery and other technical installations | | | | | |
| Opening balance, accumulated acquisition values | | 2,828.1 | | 2,834.9 | |
| Purchases | | 97.6 | | 119.0 | |
| Acquisition of businesses | | 6.6 | | — | |
| Sales/disposal | | (157.0 | ) | (250.6 | ) |
| Reclassifications | | 56.9 | | 1.6 | |
| Realisation of step-up values due to sale | | — | | (1.3 | ) |
| Translation difference for the year | | (220.6 | ) | 124.5 | |
| | |
| |
| |
| Closing balance, accumulated acquisition values | | 2,611.6 | | 2,828.1 | |
Opening balance, accumulated depreciation |
|
(1,690.3 |
) |
(1,619.8 |
) |
| Sales/disposals | | 132.2 | | 170.2 | |
| Acquisitions of businesses | | (2.5 | ) | — | |
| Reclassifications | | (27.6 | ) | (2.4 | ) |
| Depreciation of step-up value | | (59.0 | ) | (60.2 | ) |
| Depreciation for the year | | (130.2 | ) | (111.9 | ) |
| Translation difference for the year | | 148.8 | | (66.2 | ) |
| | |
| |
| |
| Closing balance, accumulated depreciation | | (1,628.6 | ) | (1,690.3 | ) |
Closing balance, net book value |
|
983.0 |
|
1,137.8 |
|
| | |
| |
| |
F-35
Equipment, tools and installations |
|
|
|
|
|
| Opening balance, accumulated acquisition values | | 2,288.1 | | 2,537.9 | |
| Purchases | | 71.6 | | 125.4 | |
| Acquisition of businesses | | 3.9 | | — | |
| Sales/disposal | | (150.3 | ) | (480.8 | ) |
| Reclassifications | | (59.6 | ) | 36.7 | |
| Realisation of step-up values due to sale | | — | | (0.1 | ) |
| Translation difference for the year | | (129.1 | ) | 69.0 | |
| | |
| |
| |
| Closing balance, accumulated acquisition values | | 2,024.6 | | 2,288.1 | |
Opening balance, accumulated depreciation |
|
(1,411.4 |
) |
(1,518.7 |
) |
| Sales/disposals | | 127.4 | | 394.1 | |
| Acquisition of businesses | | (2.1 | ) | — | |
| Reclassifications | | 47.6 | | 3.6 | |
| Depreciation of step-up value | | (31.3 | ) | (33.3 | ) |
| Depreciation for the year | | (130.5 | ) | (198.5 | ) |
| Translation difference for the year | | 83.0 | | (58.7 | ) |
| | |
| |
| |
| Closing balance, accumulated depreciation | | (1,317.3 | ) | (1,411.4 | ) |
Opening balance, accumulated revaluation, net |
|
16.9 |
|
7.7 |
|
| Sales/disposal | | (0.2 | ) | 9.5 | |
| Reclassifications | | (0.5 | ) | 0.0 | |
| Revaluation for the year | | 0.1 | | 0.1 | |
| Depreciation for the year on revaluation | | (0.4 | ) | (0.4 | ) |
| | |
| |
| |
| Closing balance, accumulated revaluation, net | | 15.9 | | 16.9 | |
Closing balance, net book value |
|
723.2 |
|
893.6 |
|
| | |
| |
| |
Construction in progress and advances to suppliers concerning property, plant and equipment |
|
|
|
|
|
| Opening balance, accumulated acquisition values | | 57.9 | | 71.9 | |
| Purchases | | 93.7 | | 38.6 | |
| Sales/disposal | | (1.2 | ) | (4.9 | ) |
| Reclassifications | | (103.9 | ) | (50.9 | ) |
| Translation difference for the year | | (5.7 | ) | 3.2 | |
| | |
| |
| |
| Closing balance, accumulated acquisition values | | 40.8 | | 57.9 | |
Closing balance, net book value |
|
40.8 |
|
57.9 |
|
| | |
| |
| |
| Leased machinery | | | | | |
| Opening balance, accumulated acquisition values | | 13.2 | | 27.4 | |
| Purchases | | 0.2 | | 0.0 | |
| Acquisition of businesses | | 7.2 | | — | |
| Sales/disposal | | (6.2 | ) | (13.4 | ) |
| Reclassifications | | — | | (2.2 | ) |
| Translation difference for the year | | (0.3 | ) | 1.4 | |
| | |
| |
| |
| Closing balance, accumulated acquisition values | | 14.1 | | 13.2 | |
F-36
Opening balance, accumulated depreciation |
|
(4.4 |
) |
(6.2 |
) |
| Sales/disposals | | 3.3 | | 3.1 | |
| Acquisition of businesses | | (3.1 | ) | — | |
| Reclassifications | | — | | 2.2 | |
| Depreciation for the year | | (3.0 | ) | (3.2 | ) |
| Translation difference for the year | | 0.1 | | (0.3 | ) |
| | |
| |
| |
| Closing balance, accumulated depreciation | | (7.1 | ) | (4.4 | ) |
Closing balance, net book value |
|
7.0 |
|
8.8 |
|
| | |
| |
| |
Leased equipment, tools and installations |
|
|
|
|
|
| Opening balance, accumulated acquisition values | | 58.8 | | 94.9 | |
| Purchases | | 0.9 | | 5.7 | |
| Sales/disposal | | (11.2 | ) | (33.4 | ) |
| Reclassifications | | 0.2 | | (13.3 | ) |
| Translation difference for the year | | (4.0 | ) | 4.9 | |
| | |
| |
| |
| Closing balance, accumulated acquisition values | | 44.7 | | 58.8 | |
Opening balance, accumulated depreciation |
|
(37.1 |
) |
(48.4 |
) |
| Sales/disposals | | 8.8 | | 15.8 | |
| Reclassifications | | 4.4 | | 6.0 | |
| Depreciation for the year | | (4.8 | ) | (7.8 | ) |
| Translation difference for the year | | 2.8 | | (2.7 | ) |
| | |
| |
| |
| Closing balance, accumulated depreciation | | (25.9 | ) | (37.1 | ) |
Closing balance, net book value |
|
18.8 |
|
21.7 |
|
| | |
| |
| |
Leased machinery, equipment and real estate relate to fixed assets which are leased and where the leasing agreement has been considered to be a financial lease. These financial leases are capitalised in the balance sheet.
The tax assessment value of the Swedish real estate at December 31, 2002 amounted to MSEK 122.6 (121.8), out of which MSEK 47.2 (47.0) referred to land and land improvements and MSEK 75.4 (74.8) buildings. The book values of the Swedish real estate amounted to MSEK 57.2 (62.5), out of which land and land improvements were MSEK 9.1 (9.9) and buildings were MSEK 48.1 (52.6).
F-37
Note 16. Financial long-term assets
Book value
| | 2002
| | 2001
|
|---|
| Shares in subsidiaries | | — | | — |
| Shares in other companies | | 53.1 | | 62.4 |
| | |
| |
|
| Total | | 53.1 | | 62.4 |
| | |
| |
|
Specification of shares in subsidiaries
Company name
| | Reg.no
| | Domicile
| | No. of
shares
| | Share of
capital
%
| | Book
value
MSEK
|
|---|
| Alfa Laval Special Finance AB | | 556587-8062 | | Lund | | | | 100 | | 4,460.9 |
| | Alfa Laval Credit Finance AB | | 556025-2792 | | Lund | | | | 100 | | 0.0 |
| | | Alfa Laval Holding AB | | 556019-2949 | | Lund | | | | 100 | | 0.0 |
| Alfa Laval Holding AB | | 556019-2949 | | Lund | | 12,500,000 | | 100 | | 0.0 |
| Alfa Laval NV | | | | Maarssen | | 227,754 | | 100 | | 0.0 |
| | Alfa Laval Inc | | | | Newmarket | | 1,000,000 | | 68 | | 0.0 |
| | Alfa Laval S.A. DE C.V. | | | | Tlalnepantla | | 45,057,057 | | 100 | | 0.0 |
| | Alfa Laval S.A. | | | | San Isidro | | 699 | | 100 | | 0.0 |
| | Alfa Laval Bolivia S.R.L. | | | | Santa Cruz | | 69 | | 100 | | 0.0 |
| | Alfa Laval S/A | | | | Sao Paulo | | | | 100 | | 0.0 |
| | | Roston do Brasil Ltda | | | | Sao Paulo | | 5,249 | | 100 | | 0.0 |
| | Alfa Laval S.A.C.I. | | | | Santiago | | 2,735 | | 100 | | 0.0 |
| | Alfa Laval S.A. | | | | Bogota | | 12,195 | | 100 | | 0.0 |
| | Alfa Laval S.A. | | | | Lima | | 4,346,832 | | 100 | | 0.0 |
| | Alfa Laval Venezolana S.A. | | | | Caracas | | 10,000 | | 100 | | 0.0 |
| | | Alfa Laval Oilfield C.A. | | | | Caracas | | 203 | | 81 | | 0.0 |
| | Alfa Laval Phe Co Ltd | | | | Jiang Yin | | | | 100 | | 0.0 |
| | Alfa Laval Flow Equipment (Kunshan) Co Ltd | | | | Jiangsu | | | | 100 | | 0.0 |
| | Alfa Laval (Shanghai) Technologies Co Ltd | | | | Shanghai | | | | 100 | | 0.0 |
| | Alfa Laval Taiwan Ltd | | | | Taipei | | 1,499,994 | | 100 | | 0.0 |
| | Alfa Laval (Hongkong) Ltd | | | | Hongkong | | 79,999 | | 100 | | 0.0 |
| | Alfa Laval (China) Ltd | | | | Hongkong | | 9,999 | | 100 | | 0.0 |
| | PT Alfa Laval Separatama | | | | Jakarta | | 1,000 | | 80 | | 0.0 |
| | Alfa Laval Iran P.J.S. Co | | | | Teheran | | 2,199 | | 100 | | 0.0 |
| | Alfa Laval KK | | | | Tokyo | | 1,200,000 | | 100 | | 0.0 |
| | Alfa Laval Industry (PVT) Ltd | | | | Lahore | | 119,110 | | 100 | | 0.0 |
| | Alfa Laval Philippines Inc | | | | Makati | | 72,000 | | 100 | | 0.0 |
| | Alfa Laval Singapore Pte Ltd | | | | Singapore | | 5,000,000 | | 100 | | 0.0 |
| | Alfa Laval (Thailand) Ltd | | | | Bangkok | | 792,000 | | 100 | | 0.0 |
| | Alfa Laval Middle East Ltd | | | | Nicosia | | 40,000 | | 100 | | 0.0 |
| | Alfa Laval NV SA | | | | Brussels | | 33,811 | | 100 | | 0.0 |
F-38
| | Alfa Laval Slovakia S.R.O. | | | | Bratislanva | | | | 1 | | 0.0 |
| | | | | Liptovsky | | | | | | |
| | Cetetherm SR spol S.R.O. | | | | Mikulas | | | | 15 | | 0.0 |
| | Alfa Laval Spol S.R.O. | | | | Hradec Kralove | | | | 20 | | 0.0 |
| | Cetetherm S.R.O. | | | | Prague | | | | 5 | | 0.0 |
| | Alfa Laval Denmark Holding A/S | | | | Kolding | | | | 100 | | 0.0 |
| | | Alfa Laval LKM A/S | | | | Kolding | | 100,000 | | 100 | | 0.0 |
| | | | Alfa Laval Nordic A/S | | | | Rödovre | | 1 | | 100 | | 0.0 |
| | | | | Alfa Laval Copenhagen A/S | | | | Söborg | | 1 | | 100 | | 0.0 |
| | | | | Alfa Laval Nakskov A/S | | | | Nakskov | | 1 | | 100 | | 0.0 |
| | Alfa Laval Ltd | | | | Sofia | | 100 | | 100 | | 0.0 |
| | Alfa Laval Nordic OY | | | | Espoo | | 20,000 | | 100 | | 0.0 |
| | | Cetetherm OY | | | | Tuusula | | 5,000 | | 100 | | 0.0 |
| | Alfa Laval Nederland B.V. | | | | Maarssen | | 10,000 | | 100 | | 0.0 |
| | | Alfa Laval B.V. | | | | Maarssen | | 1,475 | | 100 | | 0.0 |
| | | Alfa Laval Merco B.V. | | | | Hoofddorp | | 1,475 | | 100 | | 0.0 |
| | Alfa Laval Holding A/S | | | | Oslo | | 520,000 | | 100 | | 0.0 |
| | | Alfa Laval Nordic A/S | | | | Oslo | | 10,000 | | 100 | | 0.0 |
| | CTC Ronneby AB | | 556092-3194 | | Ronneby | | 138,000 | | 100 | | 0.0 |
| | Alfa Laval ExCell AB | | 556306-2404 | | Skogstorp | | 2,500 | | 100 | | 0.0 |
| | Alfa Laval Nordic AB | | 556243-2061 | | Tumba | | 1,000 | | 100 | | 0.0 |
| | Cetetherm AB | | 556058-3162 | | Ronneby | | 20,000 | | 100 | | 0.0 |
| | Alfa Laval Corporate AB | | 556007-7785 | | Lund | | 13,920,000 | | 100 | | 0.0 |
| | | Alfa Laval Real Estate AB | | 556008-3650 | | Lund | | 680,000 | | 100 | | 0.0 |
| | | Alfa Laval (India) Ltd | | | | Poona | | 9,261,889 | | 64.1 | | 0.0 |
| | | | Skansen Engineering & Consultancy Co Ltd | | | | Poona | | 50,000 | | 64.1 | | 0.0 |
| | | Alfa Laval Korea Ltd | | | | Seoul | | 3,640,000 | | 100 | | 0.0 |
| | | Alfa Laval (Malaysia) Sdn Bhd | | | | Shah Alam | | 10,000 | | 100 | | 0.0 |
| | | Mosgormash Alfa Laval Moloko | | | | Moscow | | | | 55 | | 0.0 |
| | | Alfa Laval Oilfield C.A. | | | | Caracas | | 47 | | 19 | | 0.0 |
| | Alfa Laval Treasury International AB | | 556432-2484 | | Lund | | 50,000 | | 100 | | 0.0 |
| | Alfa Laval Europe AB | | 556128-7847 | | Tumba | | 500 | | 100 | | 0.0 |
| | Alfa Laval Lund AB | | 556016-8642 | | Lund | | 100 | | 100 | | 0.0 |
| | Alfa Laval International Engineering AB | | 556039-8934 | | Tumba | | 4,500 | | 100 | | 0.0 |
| | Alfa Laval Tumba AB | | 556021-3893 | | Lund | | 1,000 | | 100 | | 0.0 |
| | Bitec Enterprise AG | | | | Volketswil | | 86,935 | | 88.8 | | 0.0 |
| | Alfa Laval Dis Ticaret Ltd Sti | | | | Istanbul | | 27,001,755 | | 99 | | 0.0 |
| | OÜ Cetetherm | | | | Tallinn | | 100 | | 100 | | 0.0 |
F-39
| | Alfa Laval SIA | | | | Tallinn | | 125 | | 100 | | 0.0 |
| | SIA Cetetherm | | | | Riga | | 200 | | 100 | | 0.0 |
| | Alfa Laval UAB Ltd | | | | Vilnius | | 2,009 | | 100 | | 0.0 |
| | UAB Cetetherm | | | | Vilnius | | 100 | | 100 | | 0.0 |
| | Alfa Laval Australia Pty Ltd | | | | Homebush | | 2,088,076 | | 100 | | 0.0 |
| | | Alfa Laval Pty Ltd | | | | Homebush | | 3,500,000 | | 100 | | 0.0 |
| | | Alfa Laval Hamilton Pty Ltd | | | | Homebush | | 10,000 | | 100 | | 0.0 |
| | | Heat Transfer Pty Ltd | | | | Homebush | | 15,000 | | 100 | | 0.0 |
| | | Alfa Laval Flow Pty Ltd | | | | Mentone | | 3,500,000 | | 100 | | 0.0 |
| | Alfa Laval New Zealand Ltd | | | | Hamilton | | 1,000 | | 100 | | 0.0 |
| Alfa Laval Holding BV | | | | Maarssen | | 70,000,000 | | 100 | | 0.0 |
| | Alfa Laval (Pty) Ltd | | | | Isando | | 2,000 | | 100 | | 0.0 |
| | Alfa Laval Slovakia S.R.O. | | | | Bratislava | | | | 99 | | 0.0 |
| | | | | Liptovsky | | | | | | |
| | Cetetherm SR spol S.R.O. | | | | Mikulas | | | | 85 | | 0.0 |
| | Alfa Laval Spol S.R.O. | | | | Hradec Kralove | | | | 80 | | 0.0 |
| | Cetetherm S.R.O. | | | | Prague | | | | 95 | | 0.0 |
| | Alfa Laval France SAS | | | | Les Clayes | | 920,000 | | 100 | | 0.0 |
| | | Alfa Laval SAS | | | | Les Clayes | | 560,000 | | 100 | | 0.0 |
| | | | Alfa Laval Moatti SNC | | | | Les Clayes | | 24,000 | | 100 | | 0.0 |
| | | | Alfa Laval Spiral SNC | | | | Nevers | | 79,999 | | 100 | | 0.0 |
| | | MCD SAS | | | | Guny | | 71,300 | | 100 | | 0.0 |
| | | Alfa Laval Vicarb SA | | | | Grenoble | | 200,000 | | 100 | | 0.0 |
| | | | Canada Inc | | | | Newmarket | | 480,000 | | 100 | | 0.0 |
| | | | | Alfa Laval Inc | | | | Newmarket | | 481,600 | | 32 | | 0.0 |
| | | | SCI du Companil | | | | Grenoble | | 32,165 | | 100 | | 0.0 |
| | | Cetetherm SA | | | | Lyon | | 150,000 | | 100 | | 0.0 |
| | Cetetherm Wärrmetauschersysteme GmbH | | | | Glinde | | | | 6 | | 0.0 |
| | Alfa Laval Holding GmbH | | | | Glinde | | | | 100 | | 0.0 |
| | | Alfa Laval GmbH | | | | Wiener Neudorf | | | | 100 | | 0.0 |
| | | Alfa Laval GmbH | | | | Glinde | | 1 | | 100 | | 0.0 |
| | | Cetetherm Wärrmetauschersysteme GmbH | | | | Glinde | | 3 | | 94 | | 0.0 |
| | | Cetetherm Wärrmetauschersysteme Glinde GmbH | | | | Glinde | | 1 | | 100 | | 0.0 |
| | | Alfa Laval AG | | | | Dietlikon | | 647 | | 100 | | 0.0 |
| | Alfa Laval AEBE | | | | Holargos | | 10,000 | | 100 | | 0.0 |
| | Alfa Laval Kft | | | | Budapest | | 1 | | 100 | | 0.0 |
F-40
| | Cetetherm Vicarb Hungary Kft | | | | Budapest | | | | 100 | | 0.0 |
| | Alfa Laval SpA | | | | Monza | | 1,930,500 | | 100 | | 0.0 |
| | Alfa Laval Polska Sp.z.o.o. | | | | Warzaw | | 6,862 | | 100 | | 0.0 |
| | Cetetherm Polska Sp.z.o.o. | | | | Warzaw | | | | 100 | | 0.0 |
| | Wytwornia Separator Krakow Sp.z.o.o. | | | | Krakow | | | | 100 | | 0.0 |
| | Alfa Laval (Portugal) Ltd | | | | Linda-A- Velha | | | | 1 | | 0.0 |
| | Alfa Laval SRL | | | | Bucharest | | 61,435 | | 100 | | 0.0 |
| | Alfa Laval Iberia SA | | | | Madrid | | | | 100 | | 0.0 |
| | | Alfa Laval (Portugal) Ltd | | | | Linda-A-Velha | | 1 | | 99 | | 0.0 |
| | Alfa Laval Dis Ticaret Ltd Sti | | | | Istanbul | | 1 | | 99 | | 0.0 |
| | Alfa Laval Holdings Ltd | | | | Camberley | | 28,107,000 | | 100 | | 0.0 |
| | | Alfa Laval 2000 | | | | Camberley | | 28,106 | | 100 | | 0.0 |
| | | | Alfa Laval Ltd | | | | Camberley | | 12,710,000 | | 100 | | 0.0 |
| | | | Alfa Laval Finance Co Ltd | | | | Camberley | | 856,000 | | 100 | | 0.0 |
| | | | Alfa Laval Oilfield Ltd | | | | Aberdeen | | 500,000 | | 100 | | 0.0 |
| | | | Alfa Laval Flow Ltd | | | | Sutton Coldfield | | 100 | | 100 | | 0.0 |
| | | | Alfa Laval Pumps Ltd | | | | Eastbourne | | 100 | | 100 | | 0.0 |
| | | | Alfa Laval Thermal Ltd | | | | Camberley | | 1,000 | | 100 | | 0.0 |
| | | | Alfa Laval Separation Ltd | | | | Camberley | | 375,000 | | 100 | | 0.0 |
| | | | Rolls Laval Heat Exchangers Ltd | | | | Wolverhampton | | 5,000 | | 50 | | 0.0 |
| | Alfa Laval USA inc | | | | Kenosha | | | | 100 | | 0.0 |
| | | Alfa Laval US Holding Inc | | | | Kenosha | | 180 | | 100 | | 0.0 |
| | | | Alfa Laval Inc | | | | Kenosha | | 44,000 | | 100 | | 0.0 |
| | | | | Tri-Lad Inc | | | | Brantford | | 4,000 | | 100 | | 0.0 |
| | | | Alfa Laval US Treasury Inc | | | | Kenosha | | 1,000 | | 100 | | 0.0 |
| | AO Alfa Laval Potok | | | | Koroljov | | 31,057,529 | | 100 | | 0.0 |
| | OÜ Alfa Laval | | | | Tallinn | | 1 | | 100 | | 0.0 |
| | | | | | | | | | |
|
| Total | | | | | | | | | | 4,460.9 |
| | | | | | | | | | |
|
F-41
Specification of shares in other companies
Company name
| | Reg.no
| | Domicile
| | No. of
shares
| | Share of
capital
%
| | Book
value
KSEK
|
|---|
| Alfa Laval (India) Ltd | | | | | | | | | | |
| | National Saving Certificate | | | | India | | 201 | | | | 91.9 |
| | Mutual funds Investment | | | | India | | 22,861,122 | | | | 46,750.3 |
| | Unit Trust of India | | | | India | | 300,000 | | | | 332.8 |
| Alfa Laval KK | | | | | | | | | | |
| | Namura Zosen | | | | Japan | | 5,000 | | | | 51.6 |
| | Cyugairo | | | | Japan | | 5,250 | | | | 36.9 |
| | Orugano | | | | Japan | | 769 | | | | 7.4 |
| | Sasebo Heavy Ind. | | | | Japan | | 10,000 | | | | 51.6 |
| | Asahi Denka | | | | Japan | | 8,618 | | | | 390.4 |
| Alfa Laval Philippines Inc | | | | | | | | | | |
| | Philippine Long Distance Telephone | | | | Philippines | | 820 | | | | 13.6 |
| Alfa Laval Copenhagen A/S | | | | | | | | | | |
| | Green City Denmark A/S | | | | Denmark | | 1 | | | | 20.0 |
| Alfa Laval France SAS | | | | | | | | | | |
| | SEMACLA | | | | France | | 10 | | | | 9.2 |
| Alfa Laval Vicarb SAS | | | | | | | | | | |
| | SAEM SMD | | | | France | | 17 | | 0.85 | | 27.5 |
| Cetetherm SA | | | | | | | | | | |
| | Credit Mutuel | | | | France | | 2 | | | | 9.2 |
| | Thermothec | | | | France | | 9,130 | | | | 1,273.1 |
| | Point Piscine | | | | France | | 210 | | | | 27.5 |
| Alfa Laval NV | | | | | | | | | | |
| | DeSmet Engineering & Contractors S.A. | | | | Netherlands | | 9,999 | | 10 | | 3,077.4 |
| | Dalian Haven Automation Co Ltd | | | | Hongkong | | 102 | | 42.5 | | 815.1 |
| Cetetherm AB | | | | | | | | | | |
| | Stiftelsen VTC Syd | | | | Sweden | | — | | | | 10.0 |
| | VVS—Fabrikanternas Rõd | | | | Sweden | | — | | | | 1.5 |
| AO Alfa Laval Potok | | | | | | | | | | |
| | Unicombank | | | | Russia | | 800 | | 1.6 | | 17.6 |
| | MAX | | | | Russia | | 100 | | 0.25 | | 8.8 |
| Alfa Laval Corporate AB | | | | | | | | | | |
| | European Development Capital Corporation (EDCC) N.V. | | | | Curacao | | 36,129 | | | | |
| | Multiprogress | | | | Hungary | | 100 | | 3.18 | | |
| | Kurose Chemical Equipment Ltd | | | | Japan | | 180,000 | | 11.25 | | |
| | Poljopriveda | | | | Yugoslavia | | | | | | |
| | Tecnica Argo—Industrial S.A. | | | | Mexico | | 490 | | 49.00 | | |
| | Adela Investment Co S.A. (preferens) | | | | Luxembourg | | 1,911 | | 0.30 | | |
| | Adela Investment Co S.A. | | | | Luxembourg | | 1,911 | | 0.30 | | |
| | Mas Dairies Ltd | | | | Pakistan | | 125,000 | | 5.00 | | |
| | | | | | | | | | |
|
| Total | | | | | | | | | | 53,023.4 |
| | | | | | | | | | |
|
F-42
Note 17. Inventories
Consolidated
| | 2002
| | 2001
|
|---|
| Raw materials and consumables | | 694.4 | | 776.7 |
| Work in progress | | 655.2 | | 596.2 |
| Finished goods & goods for resale, new sale | | 570.2 | | 770.4 |
| Finished goods & goods for resale, spare parts | | 330.7 | | 439.8 |
| Advance payments to suppliers | | 28.4 | | 40.8 |
| | |
| |
|
| Total | | 2,278.9 | | 2,623.9 |
| | |
| |
|
The provision for obsolescence amounts to and has changed as follows:
Consolidated
| | January 1
| | Translation
difference
| | New
provisions
and increase
of existing
provisions
| | Amounts used
| | Unused
amounts
reversed
| | Change due
to
discounting
| | December 31
|
|---|
| 2001 | | 673.2 | | 40.8 | | 161.1 | | (223.8 | ) | (80.7 | ) | (0.1 | ) | 570.4 |
| 2002 | | 570.4 | | (56.8 | ) | 112.0 | | (103.7 | ) | (22.9 | ) | 0.0 | | 499.0 |
| | |
| |
| |
| |
| |
| |
| |
|
The Group's inventories have been accounted for after deduction for inter-company gains in inventory due to internal sales within the Group. The inter-company profit reserve at the end of 2002 amounts to MSEK 136.7 (170.3).
Note 18. Accounts receivable
Accounts receivable with a maturity exceeding one year of MSEK 127.7 (173.9) have not been accounted for as fixed assets as they are not intended for permanent use.
Accounts receivable are reported net of provisions for bad debts. The provision for bad debts amounts to and has changed as follows:
Consolidated
| | January 1
| | Translation
difference
| | New
provisions
and increase
of existing
provisions
| | Amounts used
| | Unused
amounts
reversed
| | Change due
to
discounting
| | December 31
|
|---|
| 2001 | | 350.4 | | 12.0 | | 112.7 | | (139.3 | ) | (34.1 | ) | 0.0 | | 301.6 |
| 2002 | | 301.6 | | (17.3 | ) | 71.8 | | (73.5 | ) | (39.6 | ) | (0.7 | ) | 242.3 |
| | |
| |
| |
| |
| |
| |
| |
|
F-43
Note 19. Other short-term receivables
Consolidated
| | 2002
| | 2001
|
|---|
| Notes receivable | | 283.2 | | 314.6 |
| Tax receivable | | 334.9 | | 417.4 |
| Financial leasing receivables | | 0.0 | | 3.1 |
| Other receivables | | 355.8 | | 437.8 |
| | |
| |
|
| Total | | 973.9 | | 1,172.9 |
| | |
| |
|
Of which receivables not due within one year |
|
|
|
|
| | Notes receivable | | 7.1 | | 4.2 |
| | Other receivables | | 13.6 | | 29.5 |
| | |
| |
|
| Total | | 20.7 | | 33.7 |
| | |
| |
|
Note 20. Other current deposits
Consolidated
| | 2002
| | 2001
|
|---|
| Loan receivables | | 253.4 | | 195.3 |
| Bonds and other securities | | 88.6 | | 84.2 |
| Other deposits | | 72.3 | | 13.8 |
| | |
| |
|
| | | 414.3 | | 293.3 |
| | |
| |
|
| Of which deposits not due within one year | | | | |
| | Loans receivable | | 8.4 | | 19.9 |
| | Other deposits | | 5.3 | | 5.2 |
| | |
| |
|
Note 21. Cash and bank
The item cash and bank in the balance sheet and in the cash-flow statement is mainly relating to bank deposits. Cash and bank includes a bank deposit in the publicly listed subsidiary Alfa Laval (India) Ltd of about MSEK 55.2 (66.0). The company is not a wholly owned subsidiary of the Alfa Laval Group, but is only owned to 64.1 percent.
Note 22. Impact on cash flow due to acquisition and sale of business
Acquisitions
On September 4, 2002, Alfa Laval acquired the company Danish Separation Systems A/S, specialists within membrane filtration in the biotechnology, pharmaceutical and food industries. The difference between the purchase price paid and the net assets acquired was MSEK 102.4. This has entirely been allocated to goodwill. This goodwill is amortised over 20 years. The company has annual sales of about MSEK 90 and 65 employees within R&D, manufacturing and sales.
A public offering for an additional 25 percent of the share capital in Alfa Laval (India) Ltd was made on July 14, 2001. The offering to the minority share holders was a requirement according to law as a consequence of the change of majority owner of Alfa Laval. The offering expired on August 14
F-44
and resulted in Alfa Laval acquiring an additional 2.4 million shares corresponding to 13.1 percent of the total number of shares. After the acquisition, Alfa Laval's shareholding is 64.1 percent. This has resulted in a cash payment of MSEK 87.3. The difference between the purchase price paid and the net assets acquired was MSEK 39.2. This has in whole been allocated to goodwill.
On August 24, 2000, the Alfa Laval Holding AB Group was acquired, see description in Note 13.
On September 4, 2000, the separator division of the Polish company Wytwornia Sprzetu Komunikacyjnego "Krakow" SA was acquired for MSEK 10.4. Otherwise no other acquisitions have been made during the year.
The total value of the acquired assets and liabilities is presented in the table below, which also shows the cash flow impact of the acquisitions.
| | 2002
| | 2001
| | 2000
excluding the acquisition of Alfa Laval Holding AB
| | 2000
the acquisition of Alfa Laval Holding AB
| | 2000
Total
|
|---|
| Property, plant and equipment | | 22.6 | | 10.1 | | 0.0 | | 2,844.5 | | |
| Inventory | | 21.6 | | 21.0 | | 4.5 | | 3,338.9 | | |
| Accounts receivable | | 11.9 | | 19.5 | | 2.5 | | 3,200.8 | | |
| Other receivables | | 30,2 | | 3.8 | | 2.9 | | 1,382.3 | | |
| Liquid assets | | 7.4 | | 28.8 | | 1.6 | | 764.0 | | |
| Long-term liabilities | | (8.5 | ) | (2.6 | ) | 0.0 | | (457.0 | ) | |
| Accounts payable | | (6.2 | ) | (10.7 | ) | (1.1 | ) | (1,352.5 | ) | |
| Other liabilities | | (38.3 | ) | (22.3 | ) | 0.0 | | (7,560.3 | ) | |
| Goodwill | | 102.4 | | 39.7 | | 0.0 | | 3,276.6 | | |
| Other surplus values | | | | | | | | 4,023.1 | | |
| Deferred tax | | | | | | | | (1,246.6 | ) | |
| | |
| |
| |
| |
| |
|
| Purchase price | | 143.1 | | 87.3 | | 10.4 | | 8,213.8 | | |
| Liquid assets in the acquired business | | (7.4 | ) | (28.8 | ) | (1.6 | ) | N/A | | |
| | |
| |
| |
| |
| |
|
| Effect on the Group's liquid assets (negative effect) | | 135.7 | | 58.5 | | 8.8 | | 8,213.8 | | 8,222.6 |
| | |
| |
| |
| |
| |
|
The reason why liquid assets are not deducted in the calculation of the cash flow impact of the acquisition of the Alfa Laval Holding AB Group is that these liquid assets were already part of the opening cash and bank in the cash flow statement of MSEK 677.0 and that the change from MSEK 677.0 to MSEK 764.0 at the time of the acquisition is explained as a part of the rest of the cash flow analysis.
Purchase price reimbursement
During the year the Alfa Laval Group has received MSEK 81.6 (76.3) from Tetra Laval BV as a reduction of the purchase price for the acquisition of the Alfa Laval Holding AB Group. The reduction is related to the guarantees issued by the seller in relation to taxes. The amount has not had an impact
F-45
on the goodwill for the acquisition but has instead been reported against the increased tax cost that the Group has experienced after the acquisition. The amount received during 2002 constitutes a final settlement with Tetra Laval concerning these guarantees.
Divestments
RemaControl, operating within sawmill automation, was divested to the management of the operation per January 1, 2001.
Industrial Flow was divested on April 2, 2001 to Crane Co in the US. The sales price amounted to MSEK 330.6 and was paid on the same date. The divestment included three existing subsidiaries in the UK, Germany and India and two, for this purpose, newly created subsidiaries in Italy and Belgium. In addition, fixed assets and personnel have been transferred from a few Alfa Laval companies in other countries. A few activities have remained before the divestment could be considered to be completed. During September 2002 a final settlement has been made with the buyer, resulting in an increase of the realised gain by MSEK 14.0. This result item has however no cash flow impact during 2002.
The Tetra Pak division of the Indian subsidiary was divested in May 2000 for MSEK 38.6.
On January 1, 2000 the subsidiary Ållekulla AB was sold for MSEK 4.8.
One of the Spanish subsidiaries, Aircoil SL, which manufactures heat exchangers for cooling equipment, was sold on December 1, 2000 for MSEK 0.0.
The total value of the divested assets and liabilities is presented in the table below, which also shows the cash flow impact of the divestments.
Consolidated
| | 2002
| | 2001
| | Un-audited Pro forma
2000
| |
|---|
| Property, plant and equipment | | — | | 101.4 | | 35.3 | |
| Inventory | | — | | 219.8 | | 14.0 | |
| Accounts receivable | | — | | 134.9 | | 16.8 | |
| Other receivables | | — | | 35.9 | | 3.6 | |
| Liquid assets | | — | | 49.1 | | 4.4 | |
| Long-term liabilities | | — | | (28.1 | ) | (14.2 | ) |
| Accounts payable | | — | | (32.8 | ) | (33.2 | ) |
| Other liabilities | | — | | (144.5 | ) | (13.8 | ) |
| Realised result | | — | | (5.0 | ) | 30.5 | |
| | |
| |
| |
| |
| Purchase price | | — | | 330.7 | | 43.4 | |
| | |
| |
| |
| |
| Liquid assets in the sold business | | — | | (49.1 | ) | (4.4 | ) |
| | |
| |
| |
| |
| Effect on the Group's liquid assets | | — | | 281.6 | | 39.0 | |
| | |
| |
| |
| |
F-46
Note 23. Defined benefit obligations
The Group has defined benefit commitments to employees and former employees and their survivors. The benefits are referring to old age pension, survivor's pension, disability pension, health care and severance pay.
| | 2002
| | 2001
| | Un-audited
Pro forma
2000
| |
|---|
| (Liability) asset | | | | | | | |
| Present value of the defined benefit obligation, unfounded | | (833.2 | ) | (721.2 | ) | (652.8 | ) |
| Present value of the defined benefit obligation, funded | | (2,196.1 | ) | (2,462.3 | ) | (2,089.8 | ) |
| | |
| |
| |
| |
| Present value of the defined benefit obligation at year end | | (3,029.3 | ) | (3,183.5 | ) | (2,742.7 | ) |
| Unrecognised actuarial gains | | 567.6 | | 204.3 | | 12.9 | |
| Unrecognised past service cost | | 0.9 | | 47.9 | | 74.6 | |
| Fair value of plan assets | | 1,853.1 | | 2,338.2 | | 2,168.7 | |
| | |
| |
| |
| |
| Defined benefit liability | | (607.7 | ) | (593.1 | ) | (486.5 | ) |
| less amount disallowed | | (6.1 | ) | (6.4 | ) | (7.3 | ) |
| | |
| |
| |
| |
| Net defined benefit liability | | (613.8 | ) | (599.5 | ) | (493.7 | ) |
(Cost) income |
|
|
|
|
|
|
|
| Current service cost | | (49.0 | ) | (59.6 | ) | (46.0 | ) |
| Interest cost | | (171.0 | ) | (178.3 | ) | (154.9 | ) |
| Expected return on plan Assets | | 90.3 | | 146.4 | | 141.1 | |
| Recognised actuarial losses | | (82.4 | ) | (109.3 | ) | 2.7 | |
| Recognised past service cost | | (8.2 | ) | — | | (6.9 | ) |
| Effect of any curtailments or settlements | | 67.7 | | 42.1 | | 0.1 | |
| | |
| |
| |
| |
| Net plan cost | | (152.7 | ) | (158.7 | ) | (64.0 | ) |
(Liability) asset |
|
|
|
|
|
|
|
| Change in present value of the defined benefit liability: | | | | | | | |
| Present value of defined benefit liability at January 1, 2002 | | (3,183.5 | ) | (2,742.7 | ) | (2,725.4 | ) |
| Translation difference | | 226,4 | | (290.6 | ) | — | |
| Current service cost | | (49.1 | ) | (59.6 | ) | (46.0 | ) |
| Interest cost | | (171.0 | ) | (178.3 | ) | (154.9 | ) |
| Employee contributions | | (5.9 | ) | (9.0 | ) | (9.0 | ) |
| Recognised actuarial losses | | (82.4 | ) | (109.3 | ) | 74.2 | |
| Recognised past service cost | | (8.2 | ) | — | | (6.9 | ) |
| Effect of any curtailments or settlements | | 67.7 | | 42.1 | | 0.1 | |
| Benefit payments | | 176.7 | | 163.9 | | 125.2 | |
| | |
| |
| |
| |
| Present value of defined benefit liability at December 31, 2002 | | (3,029.3 | ) | (3,183.5 | ) | (2,742.7 | ) |
F-47
| (Liability) asset | | | | | | | |
| Change in plan assets: | | | | | | | |
| Fair value of plan assets at January 1, 2002 | | 2,338.2 | | 2,168.7 | | 2,045.8 | |
| Translation difference | | (222.5 | ) | 259.8 | | — | |
| Employer contributions | | 71.4 | | 44.7 | | 39.1 | |
| Employee contributions | | 5.9 | | 9.0 | | 9.0 | |
| Actual return on plan assets | | (163.1 | ) | 19.9 | | 200.0 | |
| Benefit payments | | (176.7 | ) | (163.9 | ) | (125.2 | ) |
| | |
| |
| |
| |
| Fair value at December 31, 2002 | | 1,853.1 | | 2,338.2 | | 2,168.7 | |
(Liability) asset |
|
|
|
|
|
|
|
| Change in defined benefit liability/(asset) | | | | | | | |
| Defined benefit liability/(asset) at January 1, 2002 | | (599.4 | ) | (493.7 | ) | (449.7 | ) |
| Translation difference | | 71.9 | | (37.3 | ) | — | |
| Net plan cost | | (152.7 | ) | (158.7 | ) | (64.0 | ) |
| Employer contributions | | 71.4 | | 44.7 | | 39.1 | |
| Change in unrecognised actuarial gains/losses | | (7.3 | ) | 46.2 | | 15.3 | |
| Change in unrecognised past service cost | | 0.6 | | 0.6 | | (9.2 | ) |
| Change in disallowed asset amount | | 1.7 | | (1.2 | ) | (25.3 | ) |
| | |
| |
| |
| |
| Defined benefit liability/(asset) at December 31, 2002 | | (613.8 | ) | (599.4 | ) | (493.7 | ) |
(Liability) asset |
|
|
|
|
|
|
|
| Assets | | | | | | | |
| Fair value of plan assets | | 1,853.1 | | 2,338.2 | | 2,168.7 | |
| Less amount disallowed | | (6.1 | ) | (6.4 | ) | (7.3 | ) |
| | |
| |
| |
| |
| | | 1,847.0 | | 2,331.8 | | 2,161.4 | |
| Netting | | (1,740.2 | ) | (2,156.4 | ) | (1,996.9 | ) |
| | |
| |
| |
| |
| Assets in balance sheet | | 106.8 | | 175.4 | | 164.6 | |
| | |
| |
| |
| |
Liabilities |
|
|
|
|
|
|
|
| Present value of the defined benefit obligation at year end | | (3,029.3 | ) | (3,183.5 | ) | (2,742.7 | ) |
| Unrecognised actuarial gains (less losses) | | 567.6 | | 204.3 | | 12.9 | |
| Unrecognised past service costs | | 0.9 | | 47.9 | | 74.6 | |
| | |
| |
| |
| |
| | | (2,460.8 | ) | (2,931.3 | ) | (2,655.2 | ) |
| Netting | | 1,740.2 | | 2,156.4 | | 1,996.9 | |
| | |
| |
| |
| |
| Provision in balance sheet | | (720.6 | ) | (774.9 | ) | (658.3 | ) |
| | |
| |
| |
| |
F-48
The more significant actuarial assumptions that have been used at the year end are:
| | 2002
| | 2001
| | Un-audited
Pro forma
2000
|
|---|
| Discount rate | | 7% | | 7% | | 8% |
| Expected return on investment | | 8% | | 8% | | 8% |
| Expected wage increase | | 4% | | 4% | | 4% |
| Change in health care costs | | 9% | | 9% | | 12% |
| Change of index for future increase of remunerations | | 4% | | 4% | | 4% |
Changes in the health care costs have a significant impact on the costs and the level of the obligations for defined benefit obligations. If the health care costs change by one percent, it gives the following profit and loss effect calculated on the conditions as of the end of 2002:
Effect on:
| | 1% increase
MSEK
| | 1% decrease
MSEK
| |
|---|
| Current service costs and interest costs | | 1.4 | | (1.2 | ) |
| Present value of the defined benefit obligation at year end | | 14.9 | | (12.4 | ) |
Note 24. Other provisions
2001
| | January 1
| | Translation
difference
| | New
provisions
and increase
of existing
provisions
| | Amounts
used
| | Unused
amounts
reversed
| | Change due to discounting
| | December 31
|
|---|
| Claims & warranty | | 343.0 | | 17.3 | | 208.6 | | (128.3 | ) | (54.3 | ) | (2.0 | ) | 384.3 |
| Deferred costs | | 124.4 | | 4.5 | | 52.4 | | (15.0 | ) | (24.8 | ) | 0.0 | | 141.5 |
| Restructuring | | 519.4 | | 8.6 | | 138.6 | | (354.2 | ) | (18.6 | ) | 0.0 | | 293.8 |
| Onerous contracts | | 26.3 | | 0.9 | | 20.2 | | (23.5 | ) | 0.0 | | 0.0 | | 23.9 |
| Environmental | | 22.1 | | 2.3 | | 0.0 | | (15.9 | ) | 0.0 | | (1.1 | ) | 7.3 |
| Litigations | | 62.3 | | 1.1 | | 53.4 | | (0.3 | ) | (2.6 | ) | (4.0 | ) | 109.8 |
| Other | | 81.6 | | 8.7 | | 113.0 | | (83.0 | ) | (17.0 | ) | (0.6 | ) | 102.7 |
| | |
| |
| |
| |
| |
| |
| |
|
| | | 1,179.1 | | 43.4 | | 586.1 | | (620.2 | ) | (117.3 | ) | (7.7 | ) | 1,063.2 |
| | |
| |
| |
| |
| |
| |
| |
|
2002
| | January 1
| | Translation
difference
| | New
provisions
and increase
of existing
provisions
| | Amounts
used
| | Unused
amounts
reversed
| | Change due to discounting
| | December 31
|
|---|
| Claims & warranty | | 348.3 | | (24.4 | ) | 239.9 | | (144.5 | ) | (35.9 | ) | (5.7 | ) | 413.7 |
| Deferred costs | | 141.5 | | (2.0 | ) | 28.3 | | (41.4 | ) | (22.4 | ) | 0.0 | | 104.0 |
| Restructuring | | 293.8 | | (13.7 | ) | 56.6 | | (117.3 | ) | (12.3 | ) | 0.0 | | 207.1 |
| Onerous contracts | | 23.9 | | (0.4 | ) | 0.0 | | (11.2 | ) | (2.8 | ) | 0.0 | | 9.5 |
| Environmental | | 7.3 | | (1.2 | ) | 0.0 | | (2.9 | ) | 0.0 | | 0.0 | | 3.2 |
| Litigations | | 109.8 | | (0.4 | ) | 36.5 | | (27.9 | ) | (2.0 | ) | 0.0 | | 116.0 |
| Other | | 102.7 | | (6.2 | ) | 84.3 | | (34.9 | ) | (10.0 | ) | 0.0 | | 135.9 |
| | |
| |
| |
| |
| |
| |
| |
|
| | | 1,063.2 | | (48.3 | ) | 445.6 | | (380.1 | ) | (85.4 | ) | (5.7 | ) | 989.3 |
| | |
| |
| |
| |
| |
| |
| |
|
F-49
Unused amounts reversed refer to, among other items, sold companies, changed classifications and reversals of provisions made on an estimated basis.
In connection with the acquisition on August 24, 2000, a restructuring provision of MSEK 407.9 was established. This pertains to such restructuring measures that are triggered by the change of ownership and that Alfa Laval management has committed to implement. The costs are mainly referring to redundancies in connection with the close down of manufacturing sites, rationalisation of the logistics function and introduction of a customer segment based organisation with changed order processes. As of the end of 2002, MSEK 50.9 (107.8) remains of this acquisition provision. The remaining amount relates to projects or parts of projects that have not yet been fully implemented.
Due to the financial unrest in Argentina, a provision was made in 2001 under "Other" for estimated losses. Since Alfa Laval has a limited operation in Argentina, the provision could be limited to MSEK 23.7. At the end of 2002, the remaining provision is MSEK 7.0.
Note 25. Loans
Consolidated MSEK
| | 2002
| | 2001
|
|---|
| Credit institutions | | 3,360.2 | | 4,573.1 |
| Bond loan | | 1,127.6 | | 2,045.3 |
| Capitalised financial leases | | 24.7 | | 26.9 |
| Interest-bearing pension liabilities | | 6.1 | | 6.4 |
| | |
| |
|
| Total interest bearing debt | | 4,518.7 | | 6,651.6 |
| Cash and bank and current deposits | | 1,020.2 | | 959.7 |
| | |
| |
|
| Net debt | | 3.498.5 | | 5,691.9 |
| | |
| |
|
As a consequence of the IPO of Alfa Laval AB (publ), the structure of the financial debt has been changed considerably. The costs for the change of the structure are of a non-recurring nature.
In connection with the repayment of the previous syndicated loans and the amortisation of the bond loan, capitalised financing costs of totally MSEK 205.5 have been reversed. This cost is reported as a comparison distortion financial cost.
Total bank borrowings amounted to MSEK 3,360.2 (4,573.1) at the end of the year. The total financial indebtedness including leasing and interest bearing pension liabilities amounted to MSEK 4,518.7 (6,651.6).
Net financial debt amounted to MSEK 3,498.5 (5,691.9) at the end of the year.
Loan from credit institutions
On May 28 the loans from the previous banking syndicate led by SEB were replaced by loans from a new banking syndicate, arranged by SEB and SHB, at terms that better reflect the financial position of Alfa Laval after the new issue of shares. During the period January 1 and May 28, the old loans were amortised by MSEK 323.4. After May 28 the new loans have been amortised by MSEK 551.3.
F-50
The loan facility that has been agreed with the new banking syndicate consists of an amortisation free part of originally MEUR 423.9, that now voluntarily has been amortised down to MEUR 334.6 and a revolving working capital part of MEUR 150, which was unutilised as of December 31 2002. As of the end of December 2001, MSEK 508.6 was utilised of the loan facility for operating capital of MSEK 1,246.0 (MEUR 134) that was in the loan agreement with the old banking syndicate.
The syndicated loans amounted to MSEK 3,064.7 (4,064.7). The maturity of the new loan is five years and the interest is based on applicable IBOR plus a mark up based on the relation between net debt and EBITDA. The mark up is 95 points if the quota is larger than 2.75 and 80 points if the quota is less than or equal to 2.75, but higher than 1.75 and 65 points if the quota is less than or equal to 1.75. The mark up is currently 80 interest points. At the end of 2002 the loans are accruing interest in the range of 0.86% - 4.82%. The average interest rate at the end of 2002 was 5.58 percent. The maturity of the old loan was eight years and the interest was based on EURIBOR or LIBOR plus a mark up of 150 interest points. As of the end of 2001, the loan was accruing interest in the range of 1.59% - 7.92%. The average interest rate at year-end 2001 was 6.49 percent.
When raising the syndicated loans in August 2000, Alfa Laval was obliged to hedge at least 66 percent of the loans to a fixed interest rate. Vis-à-vis the new syndicate these is no such obligation. As per the end of December 2002, 64 percent is, however, hedged.
Transaction costs totalling MSEK 35.1 (194.4) have been capitalised and are being amortised over the maturity of the loan. The current year's cost for the fee amortisation is - -16.8 (-29.2) (-10.0). An additional MSEK -182.2 are reported as comparison distorting as a part of the MSEK -205.5.
The loan is linked to three financial covenants that must be fulfilled throughout the life of the loan. These covenants refer to the relationship between net debt and EBITDA, the interest coverage ratio and the debt ratio. If the covenants are not fulfilled, the banking syndicate is entitled to demand immediate repayment of the loans, provided that the breach is not temporary. Alfa Laval has fulfilled the covenants with a good margin ever since the loans were raised in May 2002.
Bond loan
On June 24, 35 percent of the bond loan of MEUR 220 was amortised, which corresponded to MEUR 77.0 or MSEK 703.6. This was made at a premium of 12.125 percent corresponding to one year's interest, which amounted to MSEK 85.2. This cost has been reported as a comparison distortion financial cost.
At the beginning of October 2002 Alfa Laval has re-purchased bonds at the prevailing market rate for a face value of MSEK 31.4. Additional re-purchases have been made at the beginning of November for a face value of MSEK 150.1. The difference between the higher market value and the face value was MSEK 23.3, which has been reported as an interest expense. The bond loan accrues interest at 12.125 percent, which is considerably more than the Group's current cost for other external financing.
On August 24, 2000, Alfa Laval Special Finance AB borrowed MEUR 220 from Donaldsson, Lufkin & Jenrette and UBS Warburg. On November 9, 2000, this loan was replaced by a bond loan placed with institutional investors of MEUR 220. It was registered with the Stock Exchange in Luxembourg in December 2000. In July 2001, the loan was registered with the SEC (Securities and Exchange Commission) in the US. The loan accrues interest at 12.125 percent and falls due 2010.
F-51
Transaction costs totalling MSEK 35.1 (70.7) have been capitalised and are being amortised over the maturity of the loan. The current year's cost for the fee amortisation is MSEK -12.3 (-8.0) (-1.0). An additional cost of MSEK -23.3 is reported as comparison distorting as a part of the MSEK -205.5.
The loans are distributed among currencies as follows:
| | Short-term
| | Long-term
|
|---|
Consolidated Currency
|
|---|
| | 2002
| | 2001
| | 2002
| | 2001
|
|---|
| BRL | | — | | 6.2 | | — | | — |
| CAD | | 12.4 | | 0.3 | | — | | — |
| CHF | | — | | — | | — | | 6.3 |
| DKK | | 69.3 | | 18.4 | | 398.7 | | 701.8 |
| EUR | | 78.7 | | 119.1 | | 1,472.0 | | 2,154.6 |
| GBP | | 14.3 | | 29.2 | | 164.9 | | 266.7 |
| GRD | | — | | 8.3 | | — | | — |
| JPY | | 14.8 | | 2.8 | | 173.1 | | 116.9 |
| NOK | | — | | — | | — | | 62.3 |
| PLN | | 30.5 | | 46.6 | | — | | — |
| SEK | | 6.0 | | 51.5 | | 175.1 | | 679.8 |
| USD | | 27.8 | | 99.6 | | 1,838.0 | | 2,233.8 |
| Other | | 0.6 | | 0.5 | | 11.6 | | 13.6 |
| | |
| |
| |
| |
|
| Total | | 254.4 | | 382.5 | | 4,233.4 | | 6,235.8 |
| | |
| |
| |
| |
|
| Of which not due within five years: | | | | | | 1,127.7 | | 5,199.7 |
| | | | | | |
| |
|
Note 26. Other liabilities
Consolidated
| | 2002
| | 2001
|
|---|
| Financial lessee payable | | 24.7 | | 26.9 |
| Other non-interest bearing liabilities | | 607.8 | | 640.6 |
| | |
| |
|
| Total | | 632.6 | | 667.4 |
| | |
| |
|
Note 27. Accrued costs and prepaid income
Consolidated
| | 2002
| | 2001
|
|---|
| Accruals for social security | | 130.4 | | 147.1 |
| Reserve for severance pay | | 208.9 | | 229.5 |
| Accrued interest expenses | | 22.2 | | 40.7 |
| Other accrued expenses and prepaid income | | 422.8 | | 528.9 |
| | |
| |
|
| Total | | 784.3 | | 946.2 |
| | |
| |
|
Of which accrued costs an prepaid income not due within one year |
|
|
|
|
| Accruals for social security | | 18.0 | | 15.1 |
| Reserve for severance pay | | 119.1 | | 113.5 |
| Other accrued expenses and prepaid income | | 6.1 | | 8.6 |
| | |
| |
|
| Total | | 143.2 | | 137.1 |
F-52
Note 28. Pledged assets and contingent liabilities
Consolidated
| | 2002
| | 2001
|
|---|
| Pledged assets | | | | |
| Real estate mortgages | | — | | 114.3 |
| Chattel mortgages, etc. | | — | | 1,023.2 |
| Net assets in subsidiaries | | — | | 2,934.0 |
| Other pledges and similar collaterals | | 78.3 | | 102.4 |
| | |
| |
|
| Total | | 78.3 | | 4,173.9 |
| | |
| |
|
Contingent Liabilities |
|
|
|
|
| Discounted bills | | 164.5 | | 194.7 |
| Performance guarantees | | 798.0 | | 1,162.0 |
| Other contingent liabilities | | 735.5 | | 844.7 |
| | |
| |
|
| Total | | 1,698.0 | | 2,201.4 |
| | |
| |
|
Alfa Laval Credit Finance AB and a number of local holding companies have borrowed MSEK—(4,064.7) from a bank syndicate under the lead of SEB. As security for this loan, the Alfa Laval Special Finance Group has made pledges in the form of chattel mortgages of MSEK—(1,023.2) and real estate mortgages of MSEK—(107.5). Furthermore, shares and assets of—(2,934.0) have been pledged in a number of countries. In addition, the Group has to follow customary restrictions on investments, divestments and structural changes. In the new syndicate loan there are no such pledges or restrictions.
During the autumn 2000 and the spring 2001, the Group has been partially restructured in order to better match the pledges that the banks have required as a condition for the financing.
Other contingent liabilities are among other items referring to leased assets.
Note 29. Transactions with related party
Tetra Pak within the Tetra Laval Group is Alfa Laval's single largest customer with 5.7 (4.9) (4.8) percent of net sales. In June 1999, Tetra Pak entered into a purchasing agreement with Alfa Laval that governs the distribution, research and development, market sales and information, use of trademarks and intellectual property. The following areas shall be agreed upon from time to time between representatives of the parties: products that are subject to the agreement, prices and discounts of such products, geographical markets and product areas where Tetra Pak is Alfa Laval's preferred distributor, the right of Tetra Pak to affix its trademarks to Alfa Laval products, sales goals for Tetra Pak in defined geographical markets, products and technologies that are the focus of joint research and development and the ownership rights of the research and development result and use of market and sales information. The agreement aims at the applications within liquid food where Tetra Pak has a natural market presence through the deliveries of packaging equipment and packaging material.
The agreement was prolonged by two years from December 31, 2001. It has a 12-month period of notice. The prices that Tetra Pak receives are not lower than the prices that Alfa Laval would obtain from a comparable third party. The prices are fixed on a calendar year basis.
F-53
Ever since Tetra Laval acquired Alfa Laval in 1991, the Group has purchased services from the Tetra Laval Group Transport & Travel to optimise forwarding, freight and delivery terms and purchase forwarding, freight and person transportation. Alfa Laval has continued to purchase these services even after August 24, 2000 for MSEK 2.2 (1.6) (1.6). In addition, Alfa Laval purchases facilities management services relating to the real estate in Lund in Sweden from Tetra Pak Business Support AB for MSEK 3.3 (3.0) (3.5). Alfa Laval rents premises to Tetra Pak and DeLaval in Russia and, as of this year, in Germany for MSEK 13.8 (4.8) (1.6).
At year-end, Alfa Laval Special Finance AB has the following balance items against companies within the Tetra Laval group (Tetra Pak and DeLaval).
MESK
| | 2002
| | 2001
|
|---|
| Assets: | | | | |
| Accounts receivable | | 48.8 | | 56.1 |
| Other receivables | | 79.1 | | 96.5 |
| Liabilities: | | | | |
| Accounts payable | | 3.8 | | 9.8 |
| Other liabilities | | 0.4 | | — |
Alfa Laval Special Finance AB has had the following transactions with companies within the Tetra Laval group (Tetra Pak and DeLaval).
Consolidated
| | 2002
| | 2002
| | Un-audited Pro forma 2000
| |
|---|
| Income statement: | | | | | | | |
| Net sales | | 830.0 | | 777.9 | | 727.0 | |
| Other operating income | | 13.8 | | 4.8 | | 1.6 | |
| Other operating costs | | (5.5 | ) | (4.6 | ) | (5.1 | ) |
| Comparison distortion items | | | | | | | |
| Sale of the Tetra Pak division in the Indian subsidiary | | — | | — | | 30.8 | |
| Additional purchase price, increasing the goodwill | | 367.5 | | — | | — | |
| Purchase price reimbursement leading to reduced tax costs /increased tax liabilities | | 81.6 | | 76.3 | | — | |
Note 30. Work in progress
Consolidated
| | 2002
| | 2001
| | Un-audited Pro forma 2000
|
|---|
| Gross amount of project sales revenue recognised in the period | | 357.4 | | 635.8 | | 459.2 |
| Aggregated amount of costs incurred and recognised profits (including deduction for reported losses) | | 390.5 | | 692.0 | | 512.7 |
| Advances received | | 179.4 | | 145.2 | | 62.1 |
| Retentions | | 11.4 | | 10.4 | | 3.8 |
| Gross amount due from customers for plant projects | | 80.8 | | 77.7 | | 57.4 |
| Gross amount due to customers for plant projects | | 0.7 | | 0.0 | | 20.9 |
F-54
Note 31. Leasing
Alfa Laval has entered into non-cancellable operating leases mainly relating to premises and finance lease agreements regarding machinery and equipment with leasing periods of 1-20 years. The leasing fees for non-cancellable operating leases were MSEK 232.9 (258.8) (238.0). During the year, the Group has entered into finance leases with a capitalised value of MSEK 1.1 (5.7). See Note 15 for information on the capitalised value of finance leases.
The future minimum leasing fees concerning non-cancellable operating leases, distributed on maturity dates, amount to:
| | Operating leases
|
|---|
Consolidated MSEK Year
| | 2002
| | 2001
| | Un-audited Pro forma 2000
|
|---|
| 2001 | | N/A | | N/A | | 55.0 |
| 2002 | | N/A | | 82.5 | | 44.0 |
| 2003 | | 96.0 | | 62.1 | | 34.0 |
| 2004 | | 75.5 | | 41.5 | | 24.0 |
| 2005 | | 58.4 | | 29.7 | | 22.0 |
| 2006 | | 31.1 | | 16.7 | | |
| 2007 | | 18.7 | | | | |
| Later | | 48.5 | | 46.7 | | 67.0 |
| | |
| |
| |
|
| Total | | 328.2 | | 279.2 | | 246.0 |
| | |
| |
| |
|
The future minimum leasing fees concerning financial leasing agreements and their net present value, distributed on maturity dates, amount to:
| | Financial leases
| | Present value of financial leases
|
|---|
Consolidated MSEK Year
| | 2002
| | 2001
| | Un-audited
Pro forma
2000
| | 2002
| | 2001
| | Un-audited
Pro forma
2000
|
|---|
| 2001 | | N/A | | N/A | | 17.0 | | N/A | | N/A | | 15.0 |
| 2002 | | N/A | | 17.4 | | 17.0 | | N/A | | 16.5 | | 16.0 |
| 2003 | | 11.3 | | 6.2 | | 8.0 | | 10.6 | | 5.2 | | 7.0 |
| 2004 | | 6.0 | | 2.9 | | 4.0 | | 5.5 | | 2.1 | | 4.0 |
| 2005 | | 4.0 | | 0.3 | | — | | 3.5 | | 0.2 | | — |
| 2006 | | 2.5 | | 0.0 | | — | | 2.1 | | — | | — |
| 2007 | | 0.9 | | — | | — | | 0.8 | | — | | — |
| Later | | 0.0 | | 0.0 | | — | | — | | — | | — |
| | |
| |
| |
| |
| |
| |
|
| Total | | 24.7 | | 26.8 | | 46.0 | | 22.5 | | 24.0 | | 42.0 |
| | |
| |
| |
| |
| |
| |
|
Note 32. Un-audited Pro forma 2000 for Successor Alfa Laval Special Finance AB
The Alfa Laval Special Finance AB Group was created in connection with the change of ownership on August 24, 2000. Due to this, comparison figures for 2000 are presented on a combined pro forma basis for the predecessor the Alfa Laval Holding AB Group for the period January 1, 2000 to August 23, 2000 and for the successor the Alfa Laval Special Finance AB Group for the period from
F-55
August 24, 2000 to December 31, 2000. In the pro forma calculation, amortisation of goodwill and other step-up values and the financing costs that appeared in connection with the acquisition on August 24 and the consequential tax adjustments, have been accounted for as if the acquisition occurred on January 1, 2000 in order to be comparable with 2001.
The pro forma figures for the income statement for the Alfa Laval Special Finance Group have been calculated in the following way:
| | A
| | B
| | C
| | D
| | E
| |
|---|
| | Successor
| |
| |
| | Successor
| | Predecessor
| |
|---|
| | Alfa Laval
Special Finance
| |
| |
| | Alfa Laval
Special Finance
| | Alfa Laval
Holding
| |
|---|
Column A is the sum of column B to E:
| | Un-audited
Pro forma
Year ended
December 31,
2000
| | Adjustment of
Financial costs
2000
| | Adjustment of
depreciation of
step-up values
and goodwill
2000
| | Period ended
December 31,
2000
| | Period ended
August 23,
2000
| |
|---|
| Amounts in MSEK | | | | | | | | | | | |
| Net sales | | 15,012.3 | | | | | | 5,717.2 | | 9,295.1 | |
| Cost of goods sold | | (10,124.4 | ) | | | (210.6 | ) | (3,951.2 | ) | (5,962.6 | ) |
| | |
| |
| |
| |
| |
| |
| Gross profit | | 4,887.9 | | 0.0 | | (210.6 | ) | 1,766.0 | | 3,332.5 | |
| | |
| |
| |
| |
| |
| |
| Sales costs | | (2,583.7 | ) | | | | | (835.4 | ) | (1,748.3 | ) |
| Administration costs | | (861.5 | ) | | | | | (218.2 | ) | (643.3 | ) |
| Research and development costs | | (441.3 | ) | | | | | (161.9 | ) | (279.4 | ) |
| Comparison distortion items | | 129.9 | | | | | | (393.8 | ) | 523.7 | |
| Other operating income | | 525.5 | | | | | | 267.8 | | 257.7 | |
| Other operating costs | | (682.9 | ) | | | | | (355.7 | ) | (327.2 | ) |
| Amortisation of goodwill | | (163.8 | ) | | | 375.8 | | (54.6 | ) | (485.0 | ) |
| | |
| |
| |
| |
| |
| |
| Operating income | | 810.1 | | 0.0 | | 165.2 | | 14.2 | | 630.7 | |
| | |
| |
| |
| |
| |
| |
| Dividends | | 4.3 | | | | | | 1.3 | | 3.0 | |
| Interest income | | 245.1 | | | | | | 109.4 | | 135.7 | |
| Interest costs | | (1,052.0 | ) | (348.0 | ) | | | (440.2 | ) | (263.8 | ) |
| | |
| |
| |
| |
| |
| |
| Result after financial items | | (7.5 | ) | (348.0 | ) | 165.2 | | (315.3 | ) | 505.6 | |
| Minority share in subsidiaries' income | | (47.6 | ) | | | | | (11.8 | ) | (35.8 | ) |
| Taxes on this year's result | | (52.2 | ) | 121.8 | | 73.7 | | (38.4 | ) | (209.3 | ) |
| Other taxes | | (53.0 | ) | | | | | (17.7 | ) | (35.3 | ) |
| | |
| |
| |
| |
| |
| |
| Net income for the year | | (145.3 | ) | (226.2 | ) | 238.9 | | (383.2 | ) | 225.2 | |
| | |
| |
| |
| |
| |
| |
Note 33. Fair value of financial instruments
For certain instruments, including cash and bank, other current deposits, accounts receivable, trade accounts payable and short-term debt, the carrying values approximate fair values as the majority of
F-56
these instruments have short maturity periods. Obligations under capital leases are carried at amounts approximating their fair values since the discount rate applicable to lease contracts in deriving the net present value of lease payments approximates market rates.
The fair values of the Group's long-term debt are estimated using discounted cash-flow analyses, based on the Group's current incremental borrowing rates for similar types of borrowing arrangements.
The estimated fair values of the Group's long-term debt as of December 31 are shown below:
| | 2002
| | 2001
|
|---|
MSEK
| | Carrying value
| | Fair value
| | Carrying value
| | Fair value
|
|---|
| Syndicated bank loans | | 3,064.7 | | 3,064.7 | | 4,064.7 | | 4,064.7 |
| Bond loan | | 1,127.6 | | 1,268.6 | | 2,045.3 | | 2,331.6 |
The fair values of the Group's foreign currency contracts and interest-rate swaps are estimated based on dealer quotes, quoted market prices of comparable contracts, adjusted through interpolation where necessary for maturity differences, or if there are no relevant comparable contracts, on pricing models or formulas using current assumptions.
The fair values of the Group's derivative financial instruments as of December 31, 2001, is shown below:
| | 2002
| | 2001
| |
|---|
MSEK
| | Nominal
amount
| | Fair value
| | Nominal amount
| | Fair value
| |
|---|
| Forward exchange contracts | | 9,033.7 | | 151.3 | | 6,916.2 | | (6.3 | ) |
| Currency options | | | | — | | 79.0 | | (4.7 | ) |
| Interest-rate swaps | | 1,951.8 | | (61.1 | ) | 2,910.8 | | (111.1 | ) |
F-57
Note 34. Reconciliation to US GAAP
| | Note
| | Year ended
December 31,
2002
| | Year ended December 31,
2001
| | Period ended December 31,
2000
| |
|---|
| Net income/(loss) under Swedish GAAP | | | | 208.2 | | 367.4 | | (383.2 | ) |
| US GAAP adjustments: | | | | | | | | | |
| Goodwill arising from exchanges between entities under common control | | a | | — | | — | | — | |
| Goodwill and other intangibles arising from push-down accounting | | a | | — | | — | | — | |
| Goodwill and other intangibles with indefinite useful lives | | a | | 187.7 | | | | | |
| Leveraged buy-out accounting | | b | | 2.1 | | 15.0 | | (71.8 | ) |
| Pensions and other post-employment benefits | | c | | — | | — | | — | |
| Derivative instruments and hedge accounting | | d | | 271.2 | | (49.5 | ) | 0.7 | |
| Revenue recognition | | e | | — | | — | | — | |
| Tooling costs | | f | | 11.0 | | 15.3 | | (0.7 | ) |
| Capitalised software | | g | | (20.2 | ) | (6.4 | ) | (5.2 | ) |
| Restructuring and other provisions | | h | | — | | (0.1 | ) | (0.3 | ) |
| Long-term contract accounting | | i | | — | | — | | — | |
| Other | | j | | (0.3 | ) | (0.3 | ) | (0.1 | ) |
| Deferred taxes— | | | | | | | | | |
| | Full provisioning | | k | | — | | — | | — | |
| | Tax effect of US GAAP adjustments | | k | | (26.7 | ) | 14.3 | | 17.5 | |
| Sum of adjustments | | | | 424.8 | | (11.7 | ) | (59.9 | ) |
| Net income (loss) under US GAAP before change in accounting principle | | | | 633.0 | | 355.7 | | (443.1 | ) |
Presented as: |
|
|
|
|
|
|
|
|
|
| Net income (loss) from continuing operations before change in accounting principles and discontinued operations | | | | 633.0 | | 355.7 | | (443.1 | ) |
| Income from discontinued operations | | l | | | | | | — | |
| | | | |
| |
| |
| |
| Net income under US GAAP before change in accounting principle | | | | 633.0 | | 355.7 | | (443.1 | ) |
| Effect of change in accounting principle, net of tax | | d | | | | (61.9 | ) | — | |
| | | | |
| |
| |
| |
| Net income (loss) under US GAAP | | | | 633.0 | | (293.8 | ) | (443.1 | ) |
| | | | |
| |
| |
| |
F-58
| | Note
| | Year ended December 31, 2002
| | Year ended December 31, 2001
| |
|---|
| Shareholder's equity under Swedish GAAP | | | | 4,413.0 | | 3,628.9 | |
US GAAP adjustments: |
|
|
|
|
|
|
|
| Goodwill and other intangibles with indefinite useful lives | | a | | 187.7 | | — | |
| Leveraged buy-out accounting | | b | | 444.2 | | 439.8 | |
| Derivative instruments and hedge accounting | | d | | 26.3 | | (80.0 | ) |
| Tooling costs | | f | | 95.7 | | 84.7 | |
| Capitalised software | | g | | 22.5 | | 42.8 | |
| Restructuring and other provisions | | h | | — | | (6.4 | ) |
| | Other | | j | | 5.1 | | 5.4 | |
| Deferred taxes— | | | | | | | |
| Tax effect of US GAAP adjustments | | k | | (26.7 | ) | (16.3 | ) |
| | | | |
| |
| |
| Sum of adjustments | | | | 754.8 | | 470.0 | |
| | | | |
| |
| |
| Shareholder's equity under US GAAP | | | | 5,167.8 | | 4,098.9 | |
| | | | |
| |
| |
Change in consolidated equity capital according to US GAAP
Alfa Laval Group
| | Total
| |
|---|
| 2000 | | | |
| At the formation of the company March 27, 2000 | | 0.1 | |
| Shareholder's contribution | | 3,642.0 | |
| Impact from leveraged buy-out accounting | | 593.0 | |
| Translation difference etc. | | (255.3 | ) |
| Net income for 2000 according to US GAAP | | (443.1 | ) |
| | |
| |
| As per balance sheet on December 31, 2000 | | 3,536.7 | |
| | |
| |
2001 |
|
|
|
| Translation difference etc. | | 268.3 | |
| Net income for 2001 according to US GAAP | | 293.8 | |
| | |
| |
| As per balance sheet on December 31, 2001 | | 4,098.8 | |
| | |
| |
| 2002 | | | |
| New issue of shares | | 819.0 | |
| Equity part of group contribution | | (38.4 | ) |
| Deferred tax on group contribution | | (15.0 | ) |
| Translation difference etc. | | (329.6 | ) |
| Net income for 2002 according to US GAAP | | 633.0 | |
| | |
| |
| As per balance sheet on December 31, 2002 | | 5,167.8 | |
| | |
| |
F-59
Comments to the US GAAP reconciliation
- a)
- Goodwill arising prior to the August 2000 change in control
Goodwill arising from exchanges between entities under common control
During a reorganisation of Tetra Laval in late 1996 through early 1997, the ownership interests in certain legal entities within Tetra Laval were transferred to Alfa Laval Holding AB and its subsidiaries. Under Swedish GAAP, the excess of the purchase consideration over the net historical book value of the assets acquired was recorded as goodwill. For Swedish GAAP, such goodwill was being amortised over a period of five years. Under US GAAP, exchanges of assets or shares between entities under common control are reflected on a historical cost basis. Goodwill and the effects of its amortisation have been reversed from net income for the period ended August 23, 2000.
Goodwill and other intangibles arising from push-down accounting
In connection with Tetra Laval's acquisition of the Alfa Laval Group in July 1991, goodwill arising from the purchase was written off by Tetra Laval against equity on acquisition under Swedish GAAP. Under US GAAP, purchase accounting requires that the net assets acquired be recorded at fair values, and the excess of the purchase consideration over the fair value of net assets acquired, representing goodwill, be capitalised and amortised. Such goodwill must be pushed down to the subsidiary that was acquired in the subsidiary's stand alone financial statements. For US GAAP purposes, the portion of goodwill associated with the businesses transferred into the Alfa Laval Group (MSEK 4,161), after adjusting for pension liabilities described in item c, was recognised as an asset with effect from the 1991 acquisition and was being amortised over an estimated useful life of 20 years.
Goodwill and other intangibles with indefinite useful lives
The Financial Accounting Standards Board issued Statement of Financial Accounting Standards No. 142, Goodwill and Other Intangible Assets (FAS 142) in July 2001. The Statement is effective for fiscal years beginning after December 15, 2001. FAS 142 requires that goodwill, including previously existing goodwill, and intangible assets with indefinite useful lives not be amortised; these assets should be tested for impairment annually. Goodwill and intangible assets with indefinite useful lives will no longer be tested for impairment under FAS 121, Accounting for the Impairment of Long-Lived Assets and for Long-Lived Assets to be Disposed Of. The Company has adopted the provisions of FAS 142 as of January 1 2002.
Upon adoption of the new standard, goodwill of MSEK 3,217.4 (calculated in accordance with US GAAP as of December 31, 2001) has ceased to be amortised, but is instead tested for impairment. In addition, intangible assets totalling approximately MSEK 594 relating to in-place workforce calculated for US GAAP purposes, as well as approximately MSEK 208 of related deferred tax liabilities, have been reclassified as goodwill. The Group estimates that it does no longer record approximately MSEK 192 of annual amortisation expense (calculated in accordance with US GAAP) relating to its goodwill, as adjusted for the reclassifications discussed above. There has not appeared any need to write down the value of the goodwill in connection with the change in accounting principle.
F-60
Business combinations
Upon the change in control in August 2000 discussed in b, the goodwill associated with the reorganisation, push-down accounting and business combinations occurring prior to the change in control was eliminated.
- b)
- Leveraged buy-out accounting
In August 2000 Alfa Laval Holding AB and its subsidiaries (the predecessor) was acquired by a newly formed entity, resulting in a change in control. Prior to the transaction, the predecessor was owned 100% by Tetra Laval BV, part of the Tetra Laval Group. Subsequent to the transaction, the predecessor ceased to exist and the newly formed company, Alfa Laval AB, was owned 36.8% by Tetra Laval BV, 62.5% by Industri Kapital and 0.7% by management. For US GAAP purposes, this transaction as described in the Board of Director's report must be accounted for as a leveraged buy-out transaction in accordance with Emerging Issues Task Force (EITF) Abstract 88-16 because the transaction was carried out via a series of highly leveraged transactions through the creation of a newly formed entity that acquired 100% of the predecessor and resulting in the former shareholder maintaining a minority interest in the newly formed entity.
For US GAAP purposes, Alfa Laval's basis in the net assets of Alfa Laval Holding consists of 83.6% fair value and 16.4% predecessor basis calculated as shown below:
| | MSEK
| |
|---|
| Fair value of Alfa Laval Holding on August 23, 2000 | | 10,087 | |
| Predecessor basis of Alfa Laval Holding on August 23, 2000 | | 5,592 | |
| 63.2% interest in fair value of Alfa Laval Holding of new investors in Alfa Laval AB | | 6,374 | |
| 36.8% interest in predecessor basis of Alfa Laval Holding of old investors in Alfa Laval AB | | 2,058 | |
| | |
| |
| | | 8,432 | |
| Percentage | | 83.6 | % |
For US GAAP purposes, the individual assets acquired in the transaction were stepped up by 83.6% of the difference between book value and fair value. The difference between the fair value adjustments recorded and the purchase price was recorded as a debit directly to equity
In its Swedish GAAP financial statements, Alfa Laval recorded the acquisition of Alfa Laval Holding as a purchase for cash consideration of MSEK 8,214 plus other consideration and transaction costs for an aggregate purchase price of MSEK 8,286 in exchange for 100% of Alfa Laval Holding. This purchase price excludes the value of the Alfa Laval AB shares issued to Tetra Laval BV because this was considered to be a transaction between shareholders which should not be reflected in the issuer's consolidated financial statements in accordance with Swedish GAAP. For US GAAP purposes, Tetra Laval BV's carryover basis in Alfa Laval Holding through its 36.8% interest in Alfa Laval AB must be considered in purchase accounting. Accordingly, the purchase price for US GAAP purposes
F-61
includes the MSEK 1,800 value of the Alfa Laval AB shares issued to Tetra Laval BV as part of the overall consideration paid in exchange for 100% of Alfa Laval Holding.
The result of applying leveraged buy-out accounting to the transaction in accordance with US GAAP is that the step-up in the value the net assets acquired to fair value has been limited to the extent of the new owners' interest in Alfa Laval AB. In addition to the differences related to leveraged buy-out accounting, the values of the net assets acquired differ for US GAAP purposes because certain intangible assets including workforce and customer relationships must be valued separately in accordance with US GAAP, but such items do not meet the definition of intangible assets in accordance with Swedish GAAP and such value is thus recorded as goodwill under Swedish GAAP.
The inventory acquired in the transaction was all sold prior to December 31, 2000. Accordingly, the fair value adjustments applied to inventory (MSEK 340 for Swedish GAAP and MSEK 284 for US GAAP) have been expensed through operations during the period from August 24, 2000 to December 31, 2000. Such costs are reflected as non-recurring items in the local GAAP financial statements, but would be included in cost of goods sold for US GAAP purposes.
In addition, a minor portion of the purchase price was allocated to in-process research and development by determining the fair value of in-process technology using the income approach, thus MSEK 54 was expensed immediately and is included with non-recurring items in the accompanying statement of operations. These costs relate to on-going research and development being performed by the Group to improve existing products and develop new products. For US GAAP purposes, the amount allocated to in-process research and development would be reflected as research and development expenses.
The combined effect of the MSEK 1,800 higher purchase price for US GAAP purposes and the limitation of the fair value step-up in accordance with EITF 88-16 results in a net increase to equity on the acquisition date for US GAAP as compared to Swedish GAAP because the credit to equity related to the higher purchase price more than offsets the debit to equity related to the EITF 88-16 limitations of the fair value step-up.
During 2001 the Group completed the exercise of pushing down the fair value step-up adjustments related to the transaction into the local currencies of the entities to which the step-up adjustments relate. For presentation under Swedish GAAP the recalculated balances, adjusted for the step-up values of the related assets and equity, have been recorded as a restatement of the balances previously reported at December 31, 2000.
For US GAAP purposes the adjustment related to pushing down the step-up values into local currencies would not be presented by restating the prior year financial statements. Instead, the foreign currency change would be included in 2001 as a component of other comprehensive income. The 2000 US GAAP reconciliation of income and equity include adjustments to reverse the impact of the restatement recorded for Swedish GAAP purposes. The 2001 US GAAP reconciliation of equity includes an adjustment for the foreign currency translation impact recorded in 2000 for Swedish GAAP purposes.
F-62
- c)
- Pensions and other post-employment benefits
Pensions
The Group adopted IAS 19 as of January 1, 2000. Prior to the adoption of this guidance, pension costs under former Swedish GAAP represented the expected cost of providing pension benefits and were required to be charged to the income statement so as to spread the cost over the expected average remaining service lives of the employees. Under IAS 19 and under US GAAP, the annual pension cost comprises the estimated cost of benefits accruing in the period, adjusted to reflect the cost of benefit improvements and amortisation of surpluses/deficits which emerge as a result of the actuarial assumptions made not being borne out in practice. Only surpluses/deficits falling outside ten percent of the greater of projected benefit obligations or the market values of assets are to be amortised.
Upon the transaction discussed in b, the pension obligations of the Group were adjusted to fair value, which is the same under IAS 19 and under US GAAP. This adjustment was recorded as a change in accounting principle and recorded as a credit directly to equity in the Swedish GAAP financial statements. For US GAAP purposes, there was no such change in accounting principle. The statement of operations reconciliation adjustment relates to the difference between pension cost under US GAAP through the date of the transaction. Because the pension assets/obligations were marked to market upon the transaction, there is no difference in the pension assets/obligations as of the transaction date.
Other post-employment benefits
Until IAS 19 was adopted by the Group in 2000, other post-employment benefits representing the expected cost of providing post-retirement healthcare benefits were generally charged to the income statement as and when payments were made in accordance with Swedish GAAP. In 2000, the obligation for other post-employment healthcare benefits was recorded in full as change in accounting principle in accordance with IAS, 19 which is virtually the same as the required accounting under US GAAP. For US GAAP purposes, there was no such change in accounting principle. Under IAS 19 and under US GAAP, the annual cost of post-retirement benefits comprises the estimated cost of benefits accruing in the period, adjusted to reflect the cost of benefit improvements and amortisation of surpluses/deficits which emerge as a result of the actuarial assumptions made not being borne out in practice. Only surpluses/deficits falling outside ten percent of the greater of projected benefit obligations or the market values of assets are to be amortised.
Upon the transaction discussed in b, the other post-employment healthcare obligation of the Group was adjusted to fair value, which is the same under IAS 19 and under US GAAP. Accordingly, there is no difference in the obligation as of December 31, 2000.
When the Group adopted IAS 19, a new actuarial valuation was performed using revised updated assumptions to calculate the beginning and ending balances of the provision. Because of the change in assumptions, the calculated beginning balance is different from the ending balance calculated for US GAAP purposes in the prior year. The change in assumptions is recorded as a decrease to the 2000 benefit cost and this amount is included in the US GAAP net income reconciliation for the period ended August 23, 2000.
F-63
- d)
- Derivative instruments and hedge accounting
Under Swedish GAAP, unrealised gains and losses on forward exchange and other derivative contracts undertaken to hedge current and anticipated transactions are generally deferred and reported when they mature along with the underlying transactions or anticipated future cash flows to which they relate.
In January 2001 Financial Accounting Standards No. 133, "Accounting for Derivative Instruments and Hedging Activities" ("FAS 133") as amended by FAS 137 and FAS 138, became effective for the Group. FAS 133 establishes a new model for accounting for derivatives and hedging activities and supersedes and amends a number of previous standards. Upon initial application, all derivatives are required to be recognised in the balance sheet as either assets or liabilities and measured at fair value. In addition, all hedging relationships must be reassessed and documented pursuant to the provisions of FAS 133.
Prior to the effective date of FAS 133, US GAAP accounting for foreign exchange contracts was governed by Financial Accounting Standards No. 52, "Foreign Currency Translation" (FAS 52), which allows for foreign exchange contracts to be reported as hedges only to the extent that they are specifically matched to underlying firm commitments. Otherwise, such contracts are marked to market and recorded on the balance sheet, with unrealised gains and losses included in the reported results of each year.
Under FAS 133, the accounting for changes in the fair value (i.e. gains and losses) of a derivative financial instrument depends on whether it has been designated and qualifies as part of a hedging relationship and further on the type of hedging relationship. Changes in fair value of derivatives not qualifying as hedges are reported in income.
As a result of adoption of Statement 133, the Group recognises all derivative financial instruments, such as interest-rate swap contracts and foreign exchange contracts, in the consolidated financial statements at fair values regardless of the purpose or intent for holding the instrument. Upon initial adoption of FAS 133 the Group recognised a cumulative effect of accounting change of MSEK 61.9 (net of tax benefit of MSEK 33.0) in the income statement related to the fair value of interest-rate swap contracts in existence as of January 1, 2001. Gains and losses recognised on derivative financial instruments subsequent to initial adoption of FAS 133 are recognised in financial income or expense for purposes of presentation under US GAAP.
For periods prior to adoption of FAS 133, the Group was not able under FAS 52 to account for any of its derivative foreign exchange contracts as hedges as these contracts did not relate to underlying firm commitments and therefore the adoption of FAS 133 did not result in a translation adjustment related to these instruments.
The Group has issued long-term debt in various currencies that for Swedish GAAP purposes are considered to be hedges of its net investment in certain foreign subsidiaries. Accordingly, the change in value of the long-term debt related to currency fluctuations has been reported directly in equity as a foreign currency translation adjustment as an offset to the translation adjustments resulting from the consolidation of its foreign subsidiaries. During 2000 and earlier, this treatment was consistent with US GAAP under FAS 52. Upon adoption of FAS 133 for US GAAP purposes in 2001, the long-term debt
F-64
used to hedge the net investment in foreign subsidiaries must meet strict documentation and effectiveness criteria in order to be accounted for as part of the foreign currency translation adjustment. Because such criteria have not been met, the change in value of the long-term debt because of currency fluctuations is reported in earnings for US GAAP purposes.
The US GAAP reconciliation items can be summarised as follows.
MSEK
| | 2002
| | 2001
| |
|---|
| Hedges of net investments in foreign subsidiaries under Swedish GAAP not qualifying for hedge treatment under FAS 133 | | 164.9 | | (105.5 | ) |
| Change in fair market value of interest-rate swaps not recognised under Swedish GAAP | | 50.0 | | (15.8 | ) |
| Change in fair market value of foreign exchange derivatives not recognised under Swedish GAAP | | 56.3 | | 71.8 | |
| | |
| |
| |
| Total | | 271.2 | | (49.5 | ) |
Under Swedish GAAP, revenue related to sales that are not long-term construction contracts is generally recognised upon delivery. This may include sales for which the Group must provide installation or other services before formal customer acceptance is received, and also may include sales for which legal title does not pass until payment is received.
Under US GAAP, revenue related to sales that are not long-term construction contracts is generally recognised upon delivery, however, with the issuance of Staff Accounting Bulletin No. 101 (SAB 101), the United States Securities and Exchange Commission (SEC) clarified certain aspects of revenue recognition. SAB 101 provides specific criteria to be met before revenue is recognised. The criteria requires considering the formal sales agreement, delivery terms, pricing and collectability. The Group revised its accounting policy for revenue recognition as of January 1, 2000 such that any sales that are not accounted for under the percentage of completion method must be recognised in accordance with the provisions of SAB 101.
Under Swedish GAAP, the Group generally expenses the cost of replacement tools acquired. Under US GAAP, significant tooling costs are capitalised as incurred and amortised on the straight-line basis over their estimated economic lives of 3 years.
Under prior Swedish GAAP, the cost to develop computer software for internal use is expensed as incurred. The Accounting Standards Executive Committee issued Statement of Position ("SOP") No. 98-1, "Accounting for the Costs of Computer Software Developed or Obtained for Internal Use". SOP No. 98-1 is effective for financial statements for fiscal years beginning after December 15, 1998; however, early adoption is encouraged. For US GAAP purposes, the Group has adopted SOP 98-1 with effect from January 1, 1995 and has capitalised direct costs of developing software for internal use.
F-65
Amortisation of these assets is calculated on the straight-line method over their estimated economic lives of 3 years.
- h)
- Restructuring and other provisions
As of January 1, 2000 the Group adopted IAS 37 to account for provisions and contingent liabilities. Prior to this adoption, provisions and accruals were recorded using the principle of conservatism and the guidelines for recording of provisions and accruals were not as proscriptive as those under IAS 37 or under US GAAP. During the years prior to 2000, the Group recorded certain accruals and reserves for items such as inventory losses, restructurings and contingencies that would not be recorded under US GAAP.
Before the Group's adoption of IAS 37, provisions for restructuring costs were made when a plan existed and decisions were made by appropriate levels of authority within the Group. General provisions were also established for loss contingencies. Under US GAAP, requirements for recording provisions are more stringent than those under Swedish GAAP. Provisions for loss contingencies are recognised when they meet FAS 5 "Accounting for Contingencies" criteria of probable occurrence of loss.
Restructuring provisions are recorded when they meet specific requirements including those documented in EITF 94-3 covering severance costs related to the exiting of an activity. Such requirements include all of the following occurring before the date of the financial statements: 1) commitment by the appropriate level of management to the restructuring plan, 2) terminations and related benefits are communicated to affected employees, 3) the plan of termination specifically identifies the number of employees to be terminated, their job classifications or functions, and their locations, and 4) the period of time to complete the plan of termination indicates that significant changes to the plan of termination are not likely. Restructuring provisions recorded in connection with a business combination are accounted for as provided by EITF 95-3 which includes specific requirements similar to those described in EITF 94-3.
Upon adoption of IAS 37, the Group reversed the provisions that were not accruable under IAS 37 or US GAAP into income in the Swedish GAAP financial statements during the period ended August 23, 2000. Because these provisions never met the criteria for accrual under US GAAP, the effect of the reversal of these provisions has been adjusted for US GAAP purposes. As of December 31, 2000 and 2001, the US GAAP differences for other provisions relate primarily to different methods used to calculate reserves for inventory, receivables and compensated absences.
- i)
- Long-term contract accounting
As of January 1, 2000 the Group revised its revenue recognition policy such that all long-term contracts are accounted for using the percentage of completion method. Prior to 2000, the Group recorded most revenues from long-term contracts upon completion of the contract and full customer acceptance. Under US GAAP, revenue and profits are recorded for such contracts using the percentage of completion method.
F-66
Under Swedish GAAP, certain real estate assets are stated at estimated fair value. The revalued amounts of depreciable assets are depreciated over their estimated useful lives. The revaluation of assets is not permitted under US GAAP. Upon the transaction described in b, the fixed assets were adjusted to their fair values, eliminating the effect of past revaluations. For US GAAP purposes, fixed asset values that have been revalued after the transaction have been restated at historical cost based on the purchase accounting adjustments, net of corresponding adjustments for accumulated depreciation. Adjustments to periodic depreciation charges have also been reflected.
Under Swedish GAAP, research and development expenses related to projects that are funded by a government affiliated body are deferred and recorded as an intangible asset. Under US GAAP, research and development costs are expensed as and when incurred.
Under prior Swedish GAAP interest related to long-term construction projects was not required to be capitalised. US GAAP requires that interest incurred during long-term construction projects must be capitalised and included as part of the cost of the asset.
Under Swedish GAAP, short-term loans for which management has the ability to refinance are classified as non-current liabilities. For US GAAP, such liabilities are classified as current.
Under Swedish GAAP, the proportionate consolidation method is an acceptable method of accounting for joint ventures. Under US GAAP, joint ventures must be accounted for using the equity method. This difference in accounting does not result in any adjustment to net shareholder's equity or net income. The effect of using the proportionate consolidation method does not have a material impact on any individual income statement or balance sheet item.
As of December 31, 2002 the Group had sold receivables with recourse totalling MSEK 164.5 (194.7). These are disclosed as discounted bills in the footnote describing contingent liabilities. Under US GAAP, the recourse provisions prevent the transaction from being reported as a sale. Accordingly, the receivables would be kept on the balance sheet, and a loan would be reported for the amount of cash received. The loss on the sale was not material, and this transaction results in no significant impact on US GAAP equity.
In August 2001 the US Financial Accounting Standards Board issued FAS 144. The standard supersedes FAS 121 and parts of Accounting Principles Board Opinion 30 regarding accounting for the impairment or disposal of long-lived assets. FAS 144 requires long-lived assets held for disposal to be measured at the lower of carrying amount or fair values less costs to sell and provides new guidance regarding presentation of assets to be disposed. Within Alfa Laval these assets are mainly relating to real estate and more precisely to one property in the United States, one in Canada and one in Brazil. Accounting under FAS 144 does not mean any difference compared to Swedish GAAP. US GAAP is however requiring a reporting of assets for sale according to the below:
| | 2002
|
|---|
MSEK
Real estate for sale
| | Carrying value
| | Market value
|
|---|
| USA, Canada, Brazil | | 78.1 | | 125.5 |
F-67
As of January 1, 2000 the Group adopted IAS 12 to account for income taxes. Prior to this adoption, Swedish GAAP did not require the provision for deferred taxation, except for the accounting of certain specific timing differences between book and tax charges, which related principally to fixed assets and reserves created for tax purposes. US GAAP requires full recognition of deferred tax liabilities and assets. These balances are determined on the basis of the difference between the income tax basis of assets and liabilities and their respective financial reporting amounts at tax rates in effect for the periods in which the differences are expected to reverse. Where a deferred tax asset is recognised, an on-going assessment is carried out on the likelihood of it being realised, and a valuation allowance is established in respect of such asset where it is considered more likely than not that some portion will not be realised. Additionally, for US GAAP purposes deferred taxes are provided in respect of US GAAP adjustments to the book basis of assets and liabilities.
The Group adopted IAS 12 with a view toward meeting both IAS and US GAAP requirements. Accordingly, the Group has applied the liability method and has recorded deferred taxes in accordance with both IAS 12 and FAS 109. Upon adoption of IAS 12, the Group recorded the impact resulting from deferred tax assets and liabilities built up in prior years as a change in accounting principle and recorded the impact directly to equity. For US GAAP purposes, there was no such change in accounting principle.
The components of income (loss) before taxes under US GAAP are as follows:
MSEK
| | Year ended December 31,
2002
| | Year ended December 31,
2001
| | Period ended December 31,
2000
| |
|---|
| Swedish | | 228.8 | | 161.5 | | (615.5 | ) |
| Foreign | | 564.6 | | (291.9 | ) | 147.0 | |
| | |
| |
| |
| |
| Total | | 793.4 | | (130.4 | ) | (468.5 | ) |
| | |
| |
| |
| |
The tax cost under US GAAP is composed of the following:
MSEK
| | Year ended December 31,
2002
| | Year ended December 31,
2001
| | Period ended December 31,
2000
| |
|---|
| Current: | | | | | | | |
| | Swedish | | (4.2 | ) | (24.4 | ) | 4.0 | |
| | Foreign | | (282.3 | ) | (319.6 | ) | 357.0 | |
| Deferred: | | | | | | | |
| | Swedish | | (20.4 | ) | 77.4 | | (71.0 | ) |
| | Foreign | | 58.6 | | 359.4 | | (139.0 | ) |
| | |
| |
| |
| |
| Total | | (248.3 | ) | 92.8 | | 151.0 | |
| | |
| |
| |
| |
F-68
Cash Flow Information
The definitions of "cash flows" differ between Swedish GAAP and US GAAP. Cash flow under Swedish GAAP represents increases or decreases in "cash," which is comprised of cash on hand and in banks. Under US GAAP, cash flow represents increases or decreases in "cash and cash equivalents," which include short-term, highly liquid investments with remaining maturities of less than 90 days when acquired, and exclude overdrafts.
There are also certain differences in the classification of items within the cash flow statement between Swedish GAAP and US GAAP. Both Swedish GAAP and US GAAP segregate cash flows between operating activities, investing activities and financing activities, however, certain items are included in different categories for Swedish GAAP compared to US GAAP
Cash flows from servicing of finance, and returns on investments would be, with the exception of any interest paid but capitalised, included as cash flows from operating activities under US GAAP. In addition, changes in provisions and changes in assets and liabilities because of foreign currency transaction gains or losses would be included as cash flows from operating activities under US GAAP.
Other comprehensive income (loss)
FAS No. 130, "Reporting Comprehensive Income" establishes standards for reporting comprehensive loss and its components in financial statements. Comprehensive income and loss as defined, includes all changes in equity (net assets) during each financial period from non-owner sources. On a US GAAP basis, the only item included in other comprehensive income and loss that is excluded from net income is currency translation adjustment. There are no tax effects relating to this item. Comprehensive income is not a required disclosure under Swedish GAAP.
Comprehensive income under US GAAP is presented as follows:
MSEK
| | Year ended December 31,
2002
| | Year ended December 31,
2001
| | Period ended December 31,
2000
| |
|---|
| Net income in accordance with US GAAP | | 633.0 | | 293.8 | | (443.1 | ) |
| Foreign currency translation | | (329.6 | ) | 268.3 | | (255.3 | ) |
| | |
| |
| |
| |
| Comprehensive income in accordance with US GAAP | | 303.4 | | 562.1 | | (698.4 | ) |
| | |
| |
| |
| |
F-69
Accumulated comprehensive income under US GAAP is presented as follows:
MSEK
| | Year ended December 31, 2002
| | Year ended December 31, 2001
| | Period ended December 31, 2000
| |
|---|
| Accumulated net income in accordance with US GAAP | | 483.7 | | (149.3 | ) | (443.1 | ) |
| Foreign currency translation | | (316.6 | ) | 13.0 | | (255.3 | ) |
| | |
| |
| |
| |
| Accumulated comprehensive income in accordance with US GAAP | | 167.1 | | (136.3 | ) | (698.4 | ) |
| | |
| |
| |
| |
Recently issued accounting pronouncements
FAS 145
In April 2002 the US Financial Accounting Standards Board issued FAS 145, effective for years beginning after May 15, 2002. The standard eliminates the prior requirement that all gains and losses from the early extinguishment of debt were to be classified as an extraordinary item. The adoption of FAS 145 means that gains and losses from the early extinguishment of debt now are classified as an extraordinary item only if they meet the "unusual and infrequent" criteria contained in Accounting Principles Board Opinion (APBO) 30. All gains and losses from early extinguishment of debt that have previously been classified as an extraordinary item are to be reassessed to determine if they would have met the "unusual and infrequent" criteria of APBO 30. Any such gain or loss that would not have met the APBO 30 criteria are retroactively reclassified and reported as a component of income before extraordinary items.
FAS 145 means that US GAAP in this respect becomes more in line with the accounting under IAS. The adoption of FAS 145 in 2002 has not resulted in any changes of accounting principles for Alfa Laval. Alfa Laval has reported the costs associated with the early extinguishment of debt as a comparison distortion item and not as an extraordinary item.
FAS 146
In June 2002 the US Financial Accounting Standards Board issued FAS 146 "Accounting for Costs Associated with Exit or Disposal Activities". It nullifies Emerging Issues Task Force (EITF) Issue 94-3 "Liability Recognition for Certain Employee Termination Benefits and Other Costs to Exit an Activity". The principal difference between FAS 146 and Issue 94-3 relates to its requirements for recognition of a liability for a cost associated with an exit or disposal activity. FAS 146 requires a liability for a cost associated with an exit or disposal activity be recognised when the liability is incurred. Under Issue 94-3 a liability for an exit cost was recognised at the date of an entity's commitment to an exit plan. FAS 146 also establishes that fair value is the objective for initial measurement of the liability. FAS 146 is effective for exit or disposal activities initiated after December 31, 2002. At this time, management is assessing the impact of adopting the standard in 2003.
F-70
ITEM 18: FINANCIAL STATEMENTS
Not applicable.
ITEM 19: EXHIBITS
| *1.1 | | Certificate of Registration and Articles of Association of Alfa Laval Special Finance AB. |
*2.1 |
|
Indenture, dated November 9, 2000 by and among Alfa Laval Special Finance AB, as issuer, Alfa Laval Credit Finance AB, as guarantor, and The Bank of New York, as trustee. |
*4.1 |
|
Purchasing Contract, dated June 24, 1999, between Alfa Laval AB and Tetra Pak International SA. |
*4.2 |
|
Purchase Agreement, dated November 2, 2000, among Alfa Laval Special Finance AB, as issuer, Alfa Laval Credit Finance AB, as guarantor, Donaldson, Lufkin and Jenrette International and UBS AG, acting through its business group UBS Warburg, as underwriters. |
*4.3 |
|
Intercompany Note, dated August 22, 2000, between Alfa Laval Credit Finance AB, as borrower, and Alfa Laval Special Finance, as lender. |
*4.4 |
|
Amendment Agreement to Intercompany Note, dated November 9, 2000, between Alfa Laval Credit Finance AB, as borrower, and Alfa Laval Special Finance, as lender. |
4.5 |
|
Intercreditor Agreement, dated April 29, 2002, among Alfa Laval Special Finance AB, Alfa Laval Credit Finance AB, SEB Merchant Banking, Debt Capital Markets, a unit within Skandinaviska Enskilda Banken AB as facility agent and the lenders listed in Schedule 1 hereto. |
*4.6 |
|
Multicurrency Credit Facility, dated April 29, 2002, among Alfa Laval Treasury International AB and Alfa Laval US Treasury Inc, as borrowers, and Alfa Laval AB and certain subsidiaries, as guarantors, SEB Merchant Banking, Debt Capital Markets and Svenska Handelsbanken AB (publ), as arrangers, the financial lenders named as lenders therein and SEB Merchant Banking, Debt Capital Markets, as facility agent. |
7.1 |
|
Statements re: computation of earnings to fixed charges. |
8.1 |
|
List of subsidiaries. |
- *
- Incorporated by reference to our annual report on Form 20-F for the fiscal year ended December 31, 2001, filed with the SEC on April 30, 2002.
III-2
SIGNATURES
The Registrant hereby certifies that it meets all of the requirements for filing on Form 20-F and that it has duly caused and authorised this Annual Report to be signed on its behalf by the undersigned.
Date: April 17, 2003
| | | ALFA LAVAL SPECIAL FINANCE AB |
|
|
By: |
/s/ SIGGE HARALDSSON |
| | | |
|
| | | Name: Sigge Haraldsson
Title:Chief Executive Officer |
|
|
By: |
/s/ THOMAS THURESSON |
| | | |
|
| | | Name: Thomas Thuresson
Title:Chief Financial Officer |
CERTIFICATIONS
I, Sigge Haraldsson, certify that:
- 1.
- I have reviewed this annual report on Form 20-F of Alfa Laval Special Finance AB;
- 2.
- Based on my knowledge, this annual report does not contain any untrue statement of a material factor omit to state a material fact necessary to make the statements made, in light of the circumstances under which such statements were made, not misleading with respect to the period covered by this annual report;
- 3.
- Based on my knowledge, the financial statements, and other financial information included in this annual report, fairly represent in all material respects the financial condition, results of operations and cash flows of the registrant as of, and for, the periods presented in this annual report;
- 4.
- The registrant's other certifying officer and I are responsible for establishing and maintaining disclosure controls and procedures (as defined in Exchange Act Rules 13a-14 and 15d-14) for the registrant and have:
- a)
- designed such disclosure controls and procedures to ensure that material information relating to the registrant, including its consolidated subsidiaries, is made known to us by others within those entities, particularly during the period in which this annual report is being prepared;
- b)
- evaluated the effectiveness of the registrant's disclosure controls and procedures as of a date within 90 days prior to the filing date of this annual report (the "Evaluation Date"); and
- c)
- presented in this annual report our conclusions about the effectiveness of the disclosure controls and procedures based on our evaluation as of the Evaluation Date;
- 5.
- The registrant's other certifying officer and I have disclosed, based on our most recent evaluation, to the registrant's auditors and the audit committee of registrant's board of directors (or persons performing the equivalent function):
- a)
- all significant deficiencies in the design or operation of internal controls which could adversely affect the registrant's ability to record, process, summarise and report financial data and have identified for the registrant's auditors any material weaknesses in internal controls; and
- b)
- any fraud, whether or not material, that involves management or other employees who have a significant role in the registrant's internal controls; and
- 6.
- The registrant's other certifying officer and I have indicated in this annual report whether or not there were significant changes in internal controls or in other factors that could significantly affect internal controls subsequent to the date of our most recent evaluation, including any corrective actions with regard to significant deficiencies and material weaknesses.
Date: April 17, 2003
|
/s/ SIGGE HARALDSSON
Chief Executive Officer |
I, Thomas Thuresson, certify that:
- 1.
- I have reviewed this annual report on Form 20-F of Alfa Laval Special Finance AB;
- 2.
- Based on my knowledge, this annual report does not contain any untrue statement of a material fact or omit to state a material fact necessary to make the statements made, in light of the circumstances under which such statements were made, not misleading with respect to the period covered by this annual report;
- 3.
- Based on my knowledge, the financial statements, and other financial information included in this annual report, fairly present in all material respects the financial condition, results of operations and cash flows of the registrant as of, for the periods presented in this annual report;
- 4.
- The registrant's other certifying officer and I are responsible for establishing and maintaining disclosure controls and procedures (as defined in Exchange Act Rules 13a-14 and 15d-14) for the registrant and have:
- (a)
- designed such disclosure controls and procedures to ensure that material information relating to the registrant, including its consolidated subsidiaries, is made known to us by others within those entities, particularly during the period in which this annual report is being prepared;
- (b)
- evaluated the effectiveness of the registrant's disclosure controls and procedures as of a date within 90 days prior to the filing date of this annual report (the "Evaluation Date"); and
- (c)
- presented in this annual report our conclusions about the effectiveness of the disclosure controls and procedures based on our evaluation as of the Evaluation Date;
- 5.
- The registrant's other certifying officer and I have disclosed, based on our most recent evaluation, to the registrant's auditors and the audit committee of registrant's board of directors (or persons performing the equivalent function):
- (a)
- all significant deficiencies in the design or operation of internal controls which could adversely affect the registrant's ability to record, process, summarise and report financial data and have identified for the registrant's auditors any material weaknesses in internal controls; and
- (b)
- any fraud, whether or not material, that involves management or other employees who have a significant role in the registrant's internal controls; and
- 6.
- The registrant's other certifying officer and I have indicated in this annual report whether or not there were significant changes in internal controls or in other factors that could significantly affect internal controls subsequent to the date of our most recent evaluation, including any corrective actions with regard to significant deficiencies and material weaknesses.
Date: April 17, 2003
|
/s/ THOMAS THURESSON
Chief Financial Officer |
QuickLinks
TABLE OF CONTENTSINTRODUCTIONFORWARD-LOOKING STATEMENTSMARKET SHARE AND INDUSTRY DATACERTAIN DEFINITIONSPART IPART IIPART IIIINDEX TO FINANCIAL STATEMENTSREPORT OF INDEPENDENT AUDITORSALFA LAVAL SPECIAL FINANCE AB CONSOLIDATED INCOME STATEMENTALFA LAVAL SPECIAL FINANCE AB CONSOLIDATED BALANCE SHEETALFA LAVAL SPECIAL FINANCE AB CONSOLIDATED CASH FLOW STATEMENTSALFA LAVAL SPECIAL FINANCE AB CHANGES IN CONSOLIDATED EQUITY CAPITALALFA LAVAL SPECIAL FINANCE AB NOTES TO THE FINANCIAL STATEMENTSSIGNATURESCERTIFICATIONS