Use these links to rapidly review the document
TABLE OF CONTENTS
TABLE OF CONTENTS 2
WORLD-CLASS MANUFACTURING
[PHOTO]

INNOVATIVE PRODUCTS
SHARPENED CONSUMER FOCUS
SUPERIOR CRAFTSMANSHIP
FLEXIBILITY AND RESPONSIVENESS
Intier Automotive is an innovative leader in the development and manufacture of vehicle interior and closure components and systems for the global automotive industry. The Company's capabilities are among the most diversified in the industry, ranging from the understanding of end consumers' needs and wants, through market and consumer research, concept development, design and engineering, testing and validation and finally the manufacture of interior and closure systems. Intier is also a leader in vehicle interior integration and program management. Product expertise includes cockpit modules, modular doors and panels, complete seat systems and specialty seat mechanisms, overhead systems, latching systems, glass moving systems, power sliding doors and liftgates and electro-mechanical systems. Intier has approximately 22,500 employees at 65 manufacturing facilities, 17 product development, engineering and testing centres and 13 sales offices throughout North America, Europe, Brazil and Asia Pacific.
Intier Automotive.
Shaping the Inner Dimension™.
On the Cover: (Large image) The Jaguar S-type represents superior craftsmanship. Intier supplies the instrument panel, glove box and door panels. Inset: (Left) Innovative, highly engineered side door latch which represents a breakthrough with a major European customer. (Right) Chrysler Pacifica leather seat manufactured by Intier.
INTERIOR SYSTEMS
[PHOTOS]
COCKPIT SYSTEMS
- •
- Cockpit Modules
- •
- Instrument Panels
- •
- Genuine Leather IP Covering
- •
- Consoles
- •
- Glove Boxes
- •
- Assembly & Sequencing
OVERHEAD SYSTEMS
- •
- Complete Overhead Systems
- •
- Headliner Substrates
- •
- Sun Visors
- •
- Pillar Trim
- •
- Consoles
- •
- Assembly & Sequencing
SIDEWALL SYSTEMS
- •
- Door Trim Modules
- •
- Hard Trim
- •
- Door & Side Panels
- •
- Package Trays
- •
- Trim Hardware Modules
- •
- Assembly & Sequencing
FLOOR CARPET & ACOUSTIC SYSTEMS
REAR CARGO & TRUNK TRIM SYSTEMS
CARGO MANAGEMENT SYSTEMS
INTEGRATION OF SAFETY & ELECTRONIC SYSTEMS
COMPLETE INTERIOR INTEGRATION
SEATING SYSTEMS
- •
- Modular Seat Assemblies
- •
- Integrated Child Safety Seats
- •
- Integrated Occupant Safety Restraints
- •
- In-Vehicle Stowable Seating
- •
- Heavy Truck Sleeper Beds
- •
- Head Restraints & Armrests
- •
- Roof Integrated Head Restraints
- •
- Trim Covers
- •
- Molded Polyurethane Foam Pads
SEATING HARDWARE SYSTEMS
- •
- Manual Adjusters
- •
- Seat Height Adjusters
- •
- EZ Entry Mechanisms
- •
- Fold & Tumble™ Mechanisms
- •
- Manual Recliners
- •
- Fold Flat Mechanisms
- •
- Specialty Latches
- •
- Seat Frames
- •
- Wire Frames
- •
- Spring Suspension Systems
- •
- Risers
- •
- Folding Load Floor Panels
- •
- Sliding Cargo Load Floor
CLOSURE SYSTEMS
[PHOTOS]
LATCHING SYSTEMS
- •
- Side Doors
- •
- Sliding Doors
- •
- Front & Rear Latches
- •
- Seat Latches
- •
- Strikers
- •
- Mechanical Cable Assemblies
- •
- Plastic Handles
- •
- Door Handle Assemblies
- •
- Latch Actuators
- •
- Non-Contact Door Entry Systems
GLASS MOVING SYSTEMS
- •
- Cable & Drum—Single & Dual Rail
- •
- Arm & Sector
- •
- Quarter Systems
- •
- Rear Window Closure Systems
INTIER ENGINEERING AND TESTING CAPABILITIES
INTIER AUTOMOTIVE TESTING
- •
- Safety, structural, fatigue & durability testing for body & interior systems
- •
- Vehicle ride simulation, NVH & road load data acquisition
- •
- CAE, FEA, factory simulation
- •
- Assembly & test equipment
"ADVANCED CAR TECHNOLOGY SYSTEMS" (ACTS)
- •
- 50/50 Joint Venture with Magna Steyr
- •
- Development & supply of modular & functional systems, vehicle structures, occupant restraint systems, pedestrian protection systems & complete doors & new products
- •
- Advanced development & serial application of safety systems, complete doors & structure & Electrical/Electronic systems
- •
- Test execution & evaluation of passive safety testing; environment simulation testing; endurance testing
WELCOME TO INTIER—A MESSAGE FROM THE PRESIDENT
At Intier, we understand how quickly and dramatically the automotive industry is changing. Consumer demand for higher quality at lower prices, combined with increased global competition, is driving our customers to seek new and better ways to differentiate their vehicles in a highly crowded and competitive marketplace. When making a vehicle purchase, the interior is fast becoming a key differentiator in the eyes of the consumer, and at Intier we are uniquely positioned to help our customers adapt to this fast-changing environment.
With full interior capabilities, expertise in closure systems and a carefully defined and executed electronics strategy, we are well positioned to provide full-service, integrated solutions. We support these world-class capabilities with a superior understanding of the industry and extensive research into what drives a new car purchase.
We have proven our ability to manage systems integration with our delivery of complete interiors for the Cadillac CTS and complex modules for the MINI by BMW, the Nissan Micra, the Ford Escape/Mazda Tribute and the Audi A8 as well as complete closure systems such as doors, hardware modules and liftgates for a variety of vehicle platforms. Going forward, we will leverage this experience to meet the increasing demand for systems integration expertise.
Our products on new vehicle programs in both Europe and North America include the Jaguar XJ, the BMW 6 Series and the BMW X3, the Chrysler Pacifica, the Saturn ION, the Cadillac SRX, the Chevrolet Colorado/GMC Canyon and the Ford Freestar/Mercury Monterey. In addition, we have also been awarded business on New Domestic programs including the Mitsubishi Endeavor, the Nissan Maxima, Quest, and Titan and the Toyota Avensis. These programs will contribute to our continuing sales growth. We are also investigating new geographic markets, specifically in Asia as illustrated by our joint alliance with Toyoda Gosei.
Our world-class design, engineering, testing and manufacturing facilities are recognized for delivering innovative and cost-effective solutions. Our investment in engineering development supports our leading-edge capabilities and continues to foster innovation.
Most importantly, it is Intier Automotive's people who, through commitment to craftsmanship, innovation and world-class manufacturing, set us apart and are responsible for our growth, solid financial position, and our enduring customer relationships. We hope you enjoy learning more about us, and how we are trulyShaping the Inner Dimension™.
Donald J. Walker (Signature)
DONALD J. WALKER
President & Chief Executive Officer
[PHOTOS]
WORLD-CLASS MANUFACTURING
With approximately twenty-two thousand five hundred employees at sixty-five manufacturing facilities, seventeen product development, engineering and testing centres, and thirteen sales offices located throughout North America, Europe, Brazil and Asia Pacific, Intier Automotive's global capabilities have built a solid reputation for delivering innovative, high-quality, cost-effective components, modules and systems. Our world-class resources combine to offer a unique and integrated value proposition with complete interior capabilities, extensive closures expertise and a carefully defined electronics strategy. Significant investments have been made in new technologies, equipment, training and education, including the latest inventory, purchasing and workflow control management systems. "Six Sigma" processes have been adopted to ensure quality is built into every component and module, and our operations are independently certified to QS9000/ TS16949 and ISO 14001 standards. We have developed our own Global Manufacturing Standard, ensuring consistent practices and processes are followed at all our facilities around the world. This, in turn, drives competitive pricing and superior delivery performance across the entire organization. Specific performance metrics are developed and benchmarked at all operations, aimed at achieving Best-in-Class levels. Supporting these world-class capabilities, the Company has an ongoing partnership with Magna Steyr in "Advanced Car Technology Systems" (ACTS), a leading European-based automotive development and test facility that amplifies our significant research and development initiatives. As a testament to our industry-leading position, we have been honoured by numerous customers for our commitment to world-class manufacturing performance.
Ingenuity
[PHOTO]
Above: Chrysler Pacifica seating supplied by Intier Automotive. Luxurious leather seating with 2nd and 3rd row seats that fold flat in a variety of configurations, providing outstanding flexibility. Opposite: (Left) Operator prepares Saturn ION seat for delivery. (Middle) Intier Automotive's latch facilities produce more than 40 million latches annually. (Right) An operator completes assembly of the Cadillac CTS centre stack as the cockpit module nears completion.
Inspire
[PHOTO]
Above: Intier Automotive's dedication to craftsmanship and world-class quality is epitomized by the 2002 Jaguar S-Type instrument panel, glove box and door panels. Opposite: (Left) Use of superior materials to enhance the Chrysler Pacifica seating system. (Middle) Total Closures Systems integration includes latches, rods, cables and both inside and outside handles. (Right) Excellent grain definition and contour retention for improved fit and finish are achieved through the use of PUR-FECT™ Skin technology.
CRAFTSMANSHIP
At Intier, craftsmanship means rigorous attention to detail and taking pride in everything we do. It means designing quality, fit and finish from the outset into every component and system we make. It means developing measureables related to specific characteristics such as gap, fit, colour, gloss and grain. It means training and deploying specialized craftsmanship engineers dedicated to establishing performance metrics to ensure our rigorous quality standards are met. It means using the best and most appropriate materials and processes, although not necessarily the most expensive. It means combining strong design with aesthetics, style and flawless execution to deliver an overall impression of value in a vehicle interior. It means a level of fit and finish that works in harmony with the entire vehicle and appeals to all the senses of a new car owner. It means enhancing driver comfort while providing the right level of functionality and information. It also means constantly researching and analyzing each specific geographic marketplace and consumer to fully understand what drives a new car purchase. At Intier, craftsmanship is as much a process as a product, derived from our passionate commitment to make every component, module or system the best it can be. Our success is evidenced by the numerous quality awards we have received from our customers.
[PHOTOS]
[PHOTOS]
INNOVATION
Innovation at Intier continues to be derived from the entrepreneurial spirit and creativity of our people. By working closely with our customers to deliver new ideas, processes, materials and approaches, we help them to provide the right products in the right segments at the right price. Our heritage of innovative thinking has led to several industry-leading solutions such as a variety of highly- functional seating and interior solutions, including Fold & Tumble™ mechanisms, self-positioning head restraints, AudioLITE™ flat speaker system, in-como™ individual cockpit module, and closure systems such as power sliding doors, midgates, non-contact door entry systems, to name a few. Product innovations are also derived from our unique insight into what drives a new vehicle purchase. Every year hundreds of new car purchasers are brought together in our proprietary consumer research clinics where we explore what buyers want to see in a new vehicle, from an aesthetic and functional sense, as well as understanding their impressions of current and future designs and features. Innovation also extends into every aspect of our design, engineering and manufacturing processes. We were the first to develop a foam-in-place seating solution that enhanced product quality and performance. Innovations in our Just-in-Time delivery and material handling systems have reduced costs across the supply chain. New ways of assembly have been developed that increase efficiency while improving operator comfort and safety. At Intier Automotive, we strive for continuous improvement, looking beyond the obvious to seek new and better ways in everything we do.
Innovate
[PHOTO]
Above: Excellent integration of innovation and craftsmanship is seen in Audi A8's cockpit. Opposite: (Left) The Intellispace™ Advanced Cockpit System offers flexibility of design, increased storage space and enhanced safety features. (Middle) Innovative, highly-engineered side door latch which represents a breakthrough with a major European customer. (Right) Innovative, see-through mesh head restraint conceptual rendering.
Integrate
[PHOTO]
Above: Intier is responsible for the design, engineering, and management of the Cadillac SRX complete interior, including the convenient and versatile cargo management system. Opposite: (Left) Power cinching latch provides comfort and convenience. (Middle) Saturn ION coupe seats, manufactured by Intier, provide unique functionality with a fold flat front row passenger seat. (Right) In addition to manufacturing the Saturn ION headliner, Intier assembles and sequences the complete overhead system.
GROWTH
Intier Automotive's carefully defined and well-executed strategies have resulted in solid and consistent growth, a strong financial position, and continuing relationships with many of the world's leading vehicle manufacturers. By working closely as true partners with our customers, we help to build their competitive position and market share. Through our rigorous focus on continuous improvement, our efforts to enhance production efficiencies, and initiatives in such areas as value engineering and analysis, global sourcing and supply chain management, we effectively meet our customers' needs today, and in the future. Going forward, we will continue to leverage our proven world-class facilities, expertise and capabilities to build our position as a full-service, interiors and closures systems supplier. We will emphasize our heritage of innovation and our culture of craftsmanship, supporting our efforts with leading-edge research and in-depth industry knowledge. We will capitalize on our complete systems and proven integration expertise to meet the accelerating trend for ever-larger and more complex responsibilities and solutions. We will solidify and extend our geographic presence with both current and new customers to support their global mandates. We will extend our product reach by leveraging opportunities within our specific areas of expertise. Finally, we will grow and strengthen by simply doing things better each and every day, ultimately providing our customers with a better product for a better price.
[PHOTOS]
Left: The Cadillac SRX door, one of the main interior components for which Intier is responsible, includes unique storage, finely crafted seams, and luxurious material grain definition.
INTERIORS
Intier Automotive's Interior Systems group provides complete integrated vehicle interior systems, from the initial concept to development, validation, manufacture and sequenced delivery of all major interior sub-systems. Our use of state-of-the-art design and engineering tools, progressive program management systems, leading edge products, world-class manufacturing technologies and a skilled team of professional craftspeople enables our customers to effectively and efficiently manage costs while providing maximum flexibility to differentiate their vehicles with unique and well-crafted interiors. Through our in-depth market research, we have a thorough understanding of the evolving wants and needs of consumers, which helps drive our concept developments. With our dedication to craftsmanship, we approach the design of a vehicle interior as a whole, integrated unit, ensuring the entire system fits together seamlessly and harmoniously, with perfectly matching colours, textures and themes. We then combine our extensive capabilities with those of the best sub-suppliers to deliver complete systems that can easily be incorporated into the vehicle on our customers' assembly floor. As a commitment to continuous improvement, we conduct in-depth follow-up consumer research clinics to gauge feedback after a vehicle launches.
[PHOTOS]
Bottom: (Left) The well-crafted result of the Intier-designed Cadillac SRX complete cockpit and centre console assembly. (Middle) Employees assemble components of the Dodge Ram overhead system. (Right) Intier manufactures the cockpit module, door panels and numerous interior panels for the MINI by BMW.
[PHOTOS]
Above: (Left) Analysis of product designs using advanced software packages like MADYMO™ help Intier minimize development time. (Middle) The Integral Positive Engaging Latch (IPEL). Intier Automotive is a leading supplier of manual and specialty mechanisms for complete seat systems. (Right) Mesh head restraint concept improves driver visibility beyond the rear seats of the vehicle.
SEATING SOLUTIONS
Intier Automotive is recognized worldwide as the premier designer and manufacturer of innovative seating systems and components. Delivering world-class comfort, craftsmanship and functionality, we excel at combining an in-depth knowledge of consumer preferences with our superior mechanism capabilities to create unique seating solutions with efficient and cost-effective designs.
COCKPIT, OVERHEAD AND SIDEWALL SYSTEMS
Intier works closely with its customers to develop and supply complex and highly functional cockpit, overhead and sidewall systems that incorporate the latest advances and innovations in manufacturing processes, surface materials, structures, safety systems and electronics.
CARPET, ACOUSTIC AND CARGO MANAGEMENT SYSTEMS
Focused on driver comfort, convenience and safety, our acoustical and carpeting capabilities and cargo management systems deliver optimal noise reduction along with functionality and ease of use.
[PHOTO]
Right: Membrane seating technology built around and for the human body. The shape of the unique membrane surface is driven by the frame design and anthropometric factors. Intier Automotive's "inside-out" design process ensures seating comfort for occupants of different shapes and genders.
[PHOTO]
ELECTRICAL/ELECTRONICS
The importance of functionality and comfort is increasing as consumers spend more and more time in their vehicles. Intier Automotive is committed to providing innovative and unique electronic and electrical solutions to balance the demands of a fast-changing industry with cost competitiveness and flexibility. Intier has established in-house electrical engineering competencies to develop complete systems and detailed electronic product innovations. This capability is complemented through the establishment of tactical relationships, strategic alliances and joint ventures with various Magna partners including Magna Donnelly Electronics, and ACTS "Advanced Car Technology Systems", through our agreement with Magna Steyr, as well as other leading industry suppliers, such as our strategic alliance with Delphi Packard. By leveraging a "virtual enterprise" approach, Intier has expanded its product and technology development capabilities to support integrated interior and closure systems and provide the right solution at a competitive price.
[PHOTO]
Top:in-como™—individual cockpit module is one of Intier Automotive's advanced automotive developments demonstrating integration of electrical/electronic technologies. Bottom: CAD rendering of an instrument panel electrical architecture representing the scope of responsibility Intier has in the development and packaging of electrical systems into the interior.
[PHOTOS]
CLOSURES
Intier Automotive's unique ability to provide complete interior solutions is complemented by our significant closures capabilities. We are one of the world's largest suppliers of door, hood and trunk latching systems, providing customers with highly engineered solutions that combine superior strength with improved acoustics, safety and security. Our glass moving systems are recognized for their durability, quiet operation and long-term reliability. We are respected for our innovations in doors and liftgates, jointly introducing, with our customer, the first power liftgate for a production minivan and power sliding door driven by an operating mechanism contained entirely within the door. We recently developed a midgate module to expand the functionality and useability for hybrid personal-use trucks and sport utility vehicles. We also developed a non-contact, anti-pinch technology to enhance the safety of our doors, power liftgates and glass moving systems. In addition, we offer numerous electro-mechanical solutions such as wiper systems and innovative obstacle detection systems. The ability to tie our closures functionality and engineering excellence with the vehicle interior makes us a truly unique company.
[PHOTO]
Top: (Left) EXPRESS-SOFT™ software and hardware design for express close electronic control modules is completely designed and developed in-house. (Middle) Closures' growing share of wiper systems business reflects it's low-cost, high-quality designs. (Right) Sealed door module for a major New Domestic customer. Bottom: Innovative infinite door detent check mechanism provides infinite control of the door in the open position.
PEOPLE
At Intier Automotive, it is our people that truly make the difference. Our long-standing culture of employee empowerment has fostered an environment that encourages ingenuity, innovation, agility, responsiveness and performance. We provide our people with the appropriate level of autonomy and responsibility, enabling them to take pride of ownership in every product and system they produce. In short, everyone is focused on becoming the value-leader in our industry while meeting the needs of our customers better than any of our competitors.
Our culture of craftsmanship and innovation is supported by numerous initiatives that solicit employee input about current and future trends in vehicle interiors and design, and many of these ideas have been translated into new products and processes. We also reward and recognize the contribution of our people through profit sharing and incentive programs, as outlined in our Employee's Charter and Corporate Constitution. Annual events are also held to recognize specific employees for their innovative ideas and contributions to our success.
Involve
[PHOTO]
EMPLOYEE'S CHARTER
Intier Automotive is committed to an operating philosophy which is based on fairness and concern for people. This philosophy is part of Intier Automotive's Fair Enterprise culture in which employees and management share in the responsibility to ensure the success of the company. It includes these principles:
JOB SECURITY
Being competitive by making a better product for a better price is the best way to enhance job security. Intier Automotive is committed to working together with you to help protect your job security. To assist you, Intier Automotive will provide:
- •
- Job Counselling
- •
- Training
- •
- Employee Assistance Programs
A SAFE AND HEALTHFUL WORKPLACE
Intier Automotive strives to provide you with a working environment which is safe and healthful.
FAIR TREATMENT
Intier Automotive offers equal employment opportunities based on an individual's qualifications and performance, free from discrimination or favouritism.
COMPETITIVE WAGES AND BENEFITS
Intier Automotive will provide you with information which will enable you to compare your total compensation of total wages and total benefits with those earned by employees of your competitors, as well as with other plants in your community. If your total compensation is found not to be competitive, then your wages will be adjusted.
EMPLOYEE EQUITY AND PROFIT PARTICIPATION
Intier Automotive believes that every employee should share in the financial success of the company.
COMMUNICATION AND INFORMATION
Through regular monthly meetings between management and employees and through publications, Intier Automotive will provide you with information so that you will know what is going on in your company and within the industry.
THE HOTLINE
Should you have a problem, or feel the above principles are not being met, we encourage you to call the Hotline or use the self-addressed Hotline Envelopes to register your complaints. You do not have to give your name, but if you do, it will be held in strict confidence. Hotline Investigators will answer your call. The Hotline is committed to investigate and resolve all concerns or complaints and must report the outcome to Magna's Global Human Resources Department. Hotline Number: 1-800-263-1691
EMPLOYEE RELATIONS ADVISORY BOARD
The Employee Relations Advisory Board is a group of people who have proven recognition and credibility relating to humanitarian and social issues. This Board will monitor, advise and ensure that Intier Automotive operates within the spirit of the Intier Automotive Employee's Charter and the principles of Intier Automotive's Corporate Constitution.
CORPORATE CONSTITUTION
BOARD OF DIRECTORS
Intier Automotive believes that outside directors provide independent counsel and discipline. A majority of the members of Intier Automotive's Board of Directors will be outsiders.
EMPLOYEE EQUITY AND PROFIT PARTICIPATION
Ten percent of Intier Automotive's profit before tax will be allocated to employees. These funds will be used for the purchase of Intier Automotive shares in trust for employees for allocation to employee pension plans and for cash distributions to employees, recognizing length of service.
SHAREHOLDER PROFIT PARTICIPATION
Intier Automotive will distribute on average, not less than 20 percent of its annual net profit after tax to shareholders.
MANAGEMENT PROFIT PARTICIPATION
To obtain long-term contractual commitment from senior management, the Company provides a compensation arrangement which, in addition to a base salary below industry standards, allows for the distribution of up to six percent of Intier Automotive's profit before tax.
RESEARCH AND DEVELOPMENT
Intier Automotive will allocate a minimum of seven percent of its profit before tax for research and development to ensure the long-term viability of the Company.
SOCIAL RESPONSIBILITY
The Company will allocate a maximum of two percent of its profit before tax for charitable, cultural, educational and political purposes to support the basic fabric of society.
MINIMUM PROFIT PERFORMANCE
Management has an obligation to produce a profit. If Intier Automotive does not generate a minimum after-tax return of four percent on share capital for two consecutive years, the Class A shareholders, voting as a class, will have the right to elect additional directors.
UNRELATED INVESTMENTS
Class A and Class B shareholders, with each class voting separately, will have the right to approve any investment in an unrelated business in the event such investment together with all other investments in unrelated businesses exceeds 20 percent of Intier Automotive's equity.
CONSTITUTIONAL AMENDMENTS
Any change to Intier Automotive's Corporate Constitution will require the approval of the Class A and Class B shareholders, with each class voting separately.
[PHOTOS]
INNOVATION AWARDS
An important part of Intier Automotive's culture is honouring the Spirit of Innovation within the Company and recognizing the individuals who foster and keep that spirit alive. Every year at our Innovation Awards gala we celebrate the Best of the Best—those Intier employees who, according to their peers, have contributed the most to the Company's success. The event highlights our ability to remain at the forefront of the industry by using the innate skills and abilities of our people to develop new ideas and to think far ahead of the competition. The celebrations culminate with the Spirit of Innovation Award, presented to the individual who has demonstrated the most exceptional innovation in action.
CORPORATE INFORMATION
Office Locations for Intier and its Major Sales Offices
| INTIER AUTOMOTIVE INC. |
521 Newpark Blvd.
Newmarket, Ontario,
Canada L3Y 4X7
Tel: 905-898-5200
Email: info@intier.com |
CLOSURE SYSTEMS |
521 Newpark Blvd.
Newmarket, Ontario
Canada L3Y 4X7
Tel: 905-898-2665
Email: closures@intier.com |
INTERIOR SYSTEMS |
United States |
Intier Automotive (U.S.A.)
39600 Lewis Drive
Novi, Michigan 48377, USA
Tel: 248-567-4000
E-mail: usa@intier.com |
Europe |
Intier Automotive (Europe)
Taunusstr. 27
D-80807 Munich, Germany
Tel: +49-89-959796-200
E-mail: europe@intier.com |
FINANCIAL REVIEW 2002
[PHOTO]
INNOVATIVE PRODUCTS
SHARPENED CONSUMER FOCUS
SUPERIOR CRAFTSMANSHIP
FLEXIBILITY AND RESPONSIVENESS
Intier Automotive is an innovative leader in the development and manufacture of vehicle interior and closure components and systems for the global automotive industry. The Company's capabilities are among the most diversified in the industry, ranging from the understanding of end consumers' needs and wants, through market and consumer research, concept development, design and engineering, testing and validation and finally the manufacture of interior and closure systems. Intier is also a leader in vehicle interior integration and program management. Product expertise includes cockpit modules, modular doors and panels, complete seat systems and specialty seat mechanisms, overhead systems, latching systems, glass moving systems, power sliding doors and liftgates and electro-mechanical systems. Intier has approximately 22,500 employees at 65 manufacturing facilities, 17 product development, engineering and testing centres and 13 sales offices throughout North America, Europe, Brazil and Asia Pacific.
Intier Automotive.
Shaping the Inner Dimension™.
On the Cover: (Large image) The Jaguar S-type represents superior craftsmanship. Intier supplies the instrument panel, glove box and door panels. Inset: (Left) Innovative, highly engineered side door latch which represents a breakthrough with a major European customer. (Right) Chrysler Pacifica leather seat manufactured by Intier.
FINANCIAL HIGHLIGHTS
LETTER TO SHAREHOLDERS
| | | [PHOTO] |
|
|
DONALD J. WALKER
President &
Chief Executive Officer |
|
MICHAEL E. MCCARTHY
Executive Vice-President
& Chief Financial Officer |
"When Intier entered the capital markets in August 2001, we made a number of commitments to our shareholders, customers and employees. As we reflect on our first full year as a publicly-traded company, we are very proud to have met our goals and demonstrated our ability to generate strong growth in sales, profitability, and cashflow. Looking ahead we are confident that we will continue to build on this track record."
OUR COMMITMENT TO SHAREHOLDERS—SOLID FINANCIAL PERFORMANCE
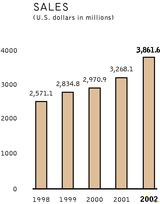
2002 was another strong year for the Company. Total sales rose 18% compared to 2001 as we leveraged our growing reputation for quality, craftsmanship and world-class manufacturing into new business in both North America and Europe. Our North American content per vehicle increased 8% as we expanded our presence with a number of key customers and won new take-over programs from our competitors. In Europe, content per vehicle increased by 32% as we benefited from new product launches and increased volumes for a number of vehicle platforms.
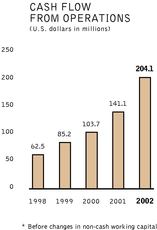
In addition to strong top-line growth, we increased cash flow from operations, before changes in non-cash working capital, by a significant 45% as our profitability improved while costs were largely kept in check to support our customers' need to maintain their competitive positions. We also made progress in improving certain under-performing operations, and are confident they will contribute to our profitability going forward.
Since 1998, Intier has demonstrated a solid track record of consistent year-over-year growth in sales, profitability and cash flow. Sales have risen 11% on a compound annual basis, while cash flow from operations before changes in non-cash working capital, has grown by a much higher 34%. Underpinning this performance is a strong balance sheet with a conservative net debt to equity ratio of approximately 8%, providing us with the financial strength and flexibility to continue delivering superior performance.
To reinforce our commitment to shareholders, Intier is proud of its leadership in matters pertaining to corporate governance and transparent financial accounting. We will continue to adopt best practices in these areas to ensure shareholder interests are encouraged and protected.
Going forward, we are confident in our continuing ability to meet our shareholder commitment—to deliver value through continued sales growth and bottom-line performance.
OUR COMMITMENT TO CUSTOMERS—INNOVATION, CRAFTSMANSHIP AND WORLD-CLASS MANUFACTURING
The automotive industry continues to experience a significant and rapid rate of change in most aspects of its business. Consumer demand for higher quality at lower prices, combined with increased competition in all global markets, is driving automotive manufacturers to seek innovative methods to control costs while finding new and better ways to differentiate their vehicles in a crowded marketplace. At Intier, we are well-positioned to help our customers adapt to this fast-changing and highly competitive environment.
The combination of our two business segments provides us with a unique competitive advantage. By offering our customers full interiors capabilities, combined with expertise in designing and manufacturing innovative closures components and systems, we are able to provide full-service integrated solutions to meet their needs. The styling, craftsmanship and functionality of a vehicle interior has become a key method of brand differentiation, and Intier Automotive's expertise in both interiors and closures is proving to be an important asset.
Our continuing focus on systems integration is also helping our customers reduce their costs and enhance production efficiency through the growing OEM trend to outsource larger and more complex modules and systems. We have proven our ability to manage systems integration with our delivery of complete interiors for the Cadillac CTS and complex modules for the MINI by BMW, Nissan Micra, the Ford Escape/Mazda Tribute, and the Audi A8 as well as complete closure systems such as doors, hardware modules and liftgates for a variety of vehicle platforms. Going forward, we will leverage this experience to meet the increasing demand for systems integration expertise.
Our world-class design, engineering, testing and manufacturing facilities in North America and Europe are recognized for delivering innovative, high-quality and cost-effective products and systems.
These world-class capabilities are supported by market research obtained through our comprehensive consumer clinics and in-depth understanding of the industry that provide true insight into what drives a new car purchase decision. In addition, our ongoing partnership with Magna-Steyr in "Advanced Car Technology Systems" (ACTS), a European-based automotive think-tank, supports our significant research and development initiatives.
However, it is our employees' involvement and commitment to all areas of our business and our expertise in craftsmanship and innovation that is the cornerstone of our Company's strong foundation and commitment to our customers.
At Intier, craftsmanship means a rigorous attention to care and detail, and pride in everything we do. It means combining strong design with aesthetics and style to deliver an overall impression of significant value in a vehicle interior. It means a level of fit and finish that works in harmony with the entire vehicle and appeals to all the senses of a new car owner. Our involvement with the interiors of such industry-leading vehicles as the MINI by BMW, Cadillac CTS, Audi A8, Jaguar XJ and Chrysler Pacifica are excellent examples of our commitment to craftsmanship.
Innovation at Intier continues to be derived from the entrepreneurial spirit and creativity of our people. By working closely with our customers to deliver new ideas, processes and approaches, we help them have the right products in the right segments at the right time. The many innovations developed in 2002 include a midgate that collapses to extend the box inside a light truck to expand storage space and improve vehicle functionality, and a non-contact door entry system to automatically unlock and release a vehicle door.
Our ongoing commitment to innovation and craftsmanship has resulted in long-term relationships with almost all of the world's leading vehicle manufacturers. In 2002, we strengthened these ties by working closely as true partners with our customers to help build their competitive position and market share. Through our rigorous focus on continuous improvement, efforts to enhance production efficiencies, and initiatives in such areas as value engineering and analysis, global sourcing and supply chain management, we have delivered high quality competitive products to our customers while continuing to enhance profitability. We are confident these efforts will further strengthen our customer relationships and generate solid growth over the long term.
OUR COMMITMENT TO EMPLOYEES—AN EMPOWERED AND ENTREPRENEURIAL CULTURE
One of the keys to our prosperity in the past—and going forward—is the significant contribution, dedication and ingenuity of our people. By providing an appropriate level of responsibility and autonomy, we have fostered a culture of empowerment that engenders pride and involvement in the overall success of the Company. This sense of ownership and teamwork is reinforced through annual events that recognize the contribution of individual employees and groups. Further support is lent by employee profit sharing as outlined in our corporate constitution, as well as other programs that reward innovative ideas and creativity.
Our commitment to our people is summarized in our Employee's Charter. In this document we outline our operating principles, which include job security, a safe and healthy workplace, fair treatment and competitive compensation. In short, it reinforces our commitment to fairness and concern for our people.
LOOKING AHEAD—DELIVERING ON OUR VALUE-ENHANCING STRATEGIES
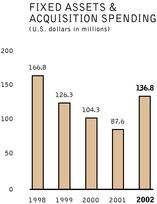
As we look ahead, while the long-term trend of steadily increasing global vehicle production is positive for Intier, we anticipate a leveling or slight reduction in 2003 compared with the strong pace of vehicle production experienced during 2002. However, we are confident in our ability to deliver solid results despite a forecasted short-term softening in the market.
Our order backlog is strong, and is being reinforced with new business wins, take-over contracts and increased volumes on a number of major platforms in which we are involved. In 2002 significant investments in fixed assets totalling $137 million were made primarily in support of new and replacement business. Our products on new vehicles in both Europe and North America, include the Jaguar XJ, BMW 6 Series and the BMW X3, Chrysler Pacifica, Saturn ION, Cadillac SRX, Chevrolet Colorado/GMC Canyon and the Ford Freestar/Mercury Monterey. In addition, we have also been awarded business on New Domestic programs such as the Mitsubishi Endeavor, Nissan Maxima, Quest, and Titan, and the Toyota Avensis. All will contribute to our continuing sales growth. We are also investigating new geographic markets, specifically in Asia as illustrated by our joint alliance with Toyoda Gosei.
Supporting this growth is our solid position in all major vehicle markets, including such segments as luxury (Jaguar XJ), near luxury (Cadillac CTS), youth (MINI by BMW) and cross-over (Chrysler Pacifica). In addition, we have built a strong presence with New Domestic customers like Honda, Nissan and Toyota who are increasing their production capabilities in North America.
We are also very focused on enhancing our strong brand within the global automotive market. The Intier name has become synonymous with innovation, craftsmanship and world-class facilities, and we will continue to deliver the best quality, the best efficiency, and smooth program launches for our customers. Cost reductions and production efficiencies will also support our commitment to meeting our customers' competitive price demands, and to our shareholders to deliver industry-leading growth and solid bottom-line performance.
In closing, we are very proud of our success in meeting our commitments in 2002, and as we look to the future, we are confident in our ability to build on the significant progress made over the past two years. We would also like to take this opportunity to thank everyone on the Intier team for their contribution in helping us meet our objectives.
Donald J. Walker
(Signature) | | Michael E. McCarthy
(Signature) |
Donald J. Walker
President and Chief Executive Officer |
|
Michael E. McCarthy
Executive Vice-President and Chief Financial Officer |
MANAGEMENT'S DISCUSSION AND ANALYSIS OF FINANCIAL CONDITION AND RESULTS OF OPERATIONS
BASIS OF PRESENTATION OF FINANCIAL INFORMATION
The amounts described below are based on the Company's consolidated financial statements, which are prepared in accordance with Canadian GAAP. The significant differences between Canadian and United States GAAP are detailed in note 23 to the consolidated financial statements. The following management's discussion and analysis should be read in conjunction with the consolidated financial statements, including "Significant Accounting Policies—Principles of Consolidation".
OVERVIEW
The Company's operations consist of two business segments, Interiors and Closures, which are generally aligned on a product basis with the corresponding purchasing and engineering groups of the Company's customers and which are further segregated between North America and Europe, the principle geographic regions in which the Company operates. In 2002, the Company's Interiors segment accounted for approximately 79% and 70% of the Company's consolidated sales and operating income, and the Company's Closures segment accounted for approximately 21% and 28% of the Company's consolidated sales and operating income. Corporate accounted for approximately 2% of the Company's consolidated operating income.
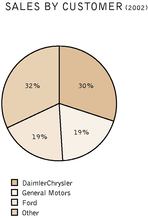
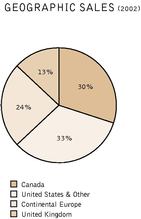
The Company is a global full service supplier of automotive interior and closure components, systems and modules whose principal products include interior systems, such as seating systems, cockpit systems, sidewall systems, cargo management systems and overhead, floor and acoustic systems and related components; and closure systems, including latching systems, glass moving systems, power sliding doors and liftgates, wiper systems and door modules. The Company directly supplies most of the major automobile manufacturers in the world and employs approximately 22,500 employees at 65 manufacturing facilities, 17 product development, engineering and testing centres and 13 sales offices in North America, Europe, Brazil and Asia Pacific. The Company's top five customers, based on consolidated 2002 sales, are DaimlerChrysler (30%), Ford (19%), General Motors (19%), BMW (9%) and Volkswagen (5%).
During 2002, the Company continued to execute its strategy of:
- •
- Delivering full service interior and closure systems capabilities to its customers. Vehicle launches in 2002 included the door cassette modules for the Ford Expedition/Lincoln Navigator, the complete seats for the Saturn ION in North America and the instrument panel for the Opel Epsilon platform, the latch system for the Ford Fiesta/Ka, the instrument panel for the Audi A8, door panels for the Toyota Avensis and the cockpit module for the Nissan Micra in Europe.
- •
- Emphasizing technological innovation and craftsmanship. Earlier in 2002, General Motors awarded the Company a General Motors' Supplier of the Year Award for superior performance as an interior supplier and integrator.
- •
- Improving operating efficiencies. Five of the Company's operations, which experienced an operating loss of approximately $40 million in 2000, incurred an operating loss of $12.5 million in 2002. The reduction in operating loss was as a result of the cost reduction, quality improvement, divisional rationalization and other initiatives taken by the Company. The Company intends to continue to improve its operating performance and competitiveness at these under-performing facilities.
- •
- Capitalizing on "complete system" and integration opportunities. The Company continued to increase its order backlog with the award of significant new programs including $55 million of new window regulator business on various Ford platforms that commenced production late in the fourth quarter of 2002. In addition, General Motors named the Company as the interior integrator for the next generation small car platform and awarded the Company the complete seats, instrument panel and overhead system for the new Chevrolet Equinox. Both programs are expected to commence production in 2004.
- •
- Promoting the Company's policies and principles, including its incentive-based corporate culture. In 2002, the Company established, subject to regulatory approvals, an Employee Equity and Profit Participation Program ("EEPPP"), which is similar to the profit sharing arrangement employees had in the Magna International Inc. ("Magna") EEPPP.
The following are some additional highlights concerning the Company's financial performance in 2002:
- •
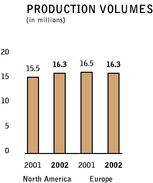
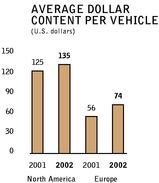
- 2002 North American light vehicle production was 16.3 million units, representing a 5.2% increase from 2001. European vehicle production of 16.3 million units during 2002 was 1.2% lower than production levels in 2001. Total sales for 2002 were $3.9 billion representing an increase of 18.1% from 2001. The Company's growth in sales during 2002 was directly attributable to its higher content per vehicle in North America and Europe. The Company
increased its average dollar content on North American produced vehicles in 2002 by $10 to $135 as compared to $125 in 2001. In addition, European average dollar content per vehicle increased $18 to $74 during 2002 compared to $56 in 2001. The growth in content was primarily attributable to the Company's strong product content on a number of new products that launched in 2002 and in the second half of 2001. New products launched in the second half of 2001, included the overhead system, seat tracks and window regulators for the Dodge Ram pickup, the cockpit module, door panels, overhead system and other interior trim for the Cadillac CTS and the complete seats and overhead system for the Saturn VUE in North America and the complete interior, excluding the overhead system and instrument panel for the Mercedes-Benz Vaneo, and the cockpit module, door panels and interior components for the MINI by BMW in Europe.
- •
- Lower vehicle production volumes and higher than expected costs related to a new program launched at one division in the Company's Closures Europe reporting segment adversely impacted 2002 operating income.
- •
- The Company adopted new rules governing the accounting for goodwill under CICA 3062 and as required completed its review of goodwill impairment as at January 1, 2002. As a result of the new measurement criteria, the Company reduced $35.7 million of unamortized goodwill relating to reporting units in the Interiors Europe, Closures Europe and Interiors North America reporting segments. This transitional write-down was charged against the Company's opening retained earnings for 2002 in accordance with Canadian GAAP. In accordance with CICA 3062, the Company also completed its annual review of goodwill impairment at December 31, 2002 and a further write-down of $3.5 million was required relating to a reporting unit in the Interiors Europe reporting segment. In conjunction with the annual goodwill impairment test, the Company also reviewed the recoverability of its long-lived assets within the same reporting unit and reduced the carrying value of long-lived assets by $20.1 million. The reductions of goodwill and long-lived assets have been recorded in operating income as non-cash impairment charges for 2002. Net tax assets of $1.5 million associated with these operations were charged to income tax expense in 2002 (see "Other Charges").
- •
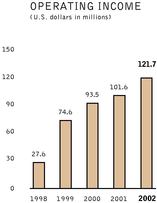
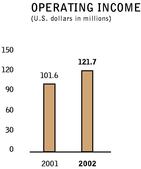
- 2002 operating income increased by 19.8% to $121.7 million from $101.6 million for 2001. The increase was attributable to the increased gross margin related to higher average dollar content per vehicle, increased North American vehicle production volumes, operating improvements at previously identified under-performing divisions, lower EEPPP expense and decreased amortization expense as a result of adopting new accounting recommendations for goodwill under CICA 3062. This was partially offset by $23.6 million of impairment charges for goodwill and other long-lived assets (see "Other Charges"), launch costs on certain new programs, increased SG&A costs and increased affiliation and social fees.
OUTLOOK
Although there is no certainty as to future levels of production, based on currently available information, the Company expects North American light vehicle production volumes to decline by approximately 2% to 16.0 million units for 2003. European vehicle production volumes are expected to decline by approximately 1% to 16.2 million units for 2003. Subject to exchange rate fluctuations and vehicle product mix, the Company expects average dollar content per vehicle to increase by approximately 15% - 20% and 12% - 14% in North America and Europe, respectively for 2003 compared to 2002. Based on these volume estimates, product mix assumptions and tooling sales estimates, 2003 total sales are expected to range between $4.2 billion and $4.4 billion. The forecasted growth in sales and content is attributable to several new significant programs launched in 2002, as well as significant new programs launching in 2003 including the complete seats for the new Chrysler Pacifica, the instrument panel, door panels and overhead system for the Cadillac SRX, the complete seats and other interior trim for the Ford Freestar/Mercury Monterey, the instrument panel for the Chevrolet Colorado/GMC Canyon, the complete interior, excluding seats, for the BMW 6 Series and the overhead system, load space and floor carpet for the BMW X3. The Company also has a strong order backlog beyond 2003 including the interior integration for the next generation of General Motors small car, the complete interior, excluding seats, for the Cadillac STS, and the complete seats, instrument panel and overhead system for the Chevrolet Equinox.
Although a decrease in North American and Western European automobile production volumes will create downward pressure on the Company's operating income, gross margins from a full year of production of new programs launched in 2002 together with continued cost management and improved operating efficiencies at specific under-performing divisions should help the Company achieve its profit targets in 2003.
Industry Risks and Trends
The following are some of the more significant risks and trends relating to the automotive industry that could affect the Company in achieving its results:
- •
- An economic downturn could reduce or eliminate the Company's profitability. The global automotive industry is cyclical and is sensitive to changes in economic conditions such as interest rates, consumer demand and international conflicts. Specifically, circumstances in the Middle East could impact future oil and other energy prices and global consumer demand for automobiles resulting in lower profits.
- •
- Increasing price reduction pressures from the Company's customers could reduce profit margins. In the past, the Company entered into, and will continue to enter into, long-term supply arrangements with automobile manufacturers, which provide for, among other things, price concessions over the supply term. To date, these concessions have been largely offset by cost reductions arising principally from product and process improvements and price reductions from the Company's suppliers. However, the competitive automotive industry environment in both North America and Europe has caused these pricing pressures to intensify. A number of the Company's customers continue to demand additional price reductions beyond existing contractual commitments, which could have an adverse impact on the Company's future profit margins. To the extent that these price reductions are not offset through cost reductions, the Company's future profit margins would be adversely affected.
- •
- The Company is under increasing pressure to absorb more costs related to product design and engineering and tooling as well as other items previously paid for directly by automobile manufacturers. In particular, some automobile manufacturers have requested that the Company pay for design and engineering and tooling costs that are incurred up to the start of production and recover these costs through increasing the unit price of the particular products. If estimated production volumes are not achieved, the design and engineering and tooling costs incurred by the Company may not be fully recovered.
- •
- Although the Company supplies parts to most of the leading automobile manufacturers for a wide variety of vehicles produced in North America and Europe, the Company does not supply parts for all vehicles produced, nor is the number or value of parts evenly distributed among the vehicles for which the Company does supply parts. Shifts in market share among vehicles could have an adverse effect on the Company's sales and profit margins. For example, the Company is affected by the sales mix between passenger cars, SUVs, minivans and other light trucks as the product content and profit margin vary among these types of vehicles.
- •
- Although the Company's financial results are reported in U.S. dollars, a significant portion of the Company's sales and operating costs are realized in Canadian dollars, euros, British pounds and other currencies. The Company's profitability is affected by movements of the U.S. dollar against the
Canadian dollar, the British pound, the euro or other currencies in which the Company generates its revenues.
- •
- In order to retain its global competitiveness with its customers, the Company is under increasing pressure to move operations to lower cost jurisdictions like Mexico, China and Eastern Europe. The impact to the Company could include higher costs associated with the impairment of redundant assets and labour in certain higher cost jurisdictions in which the Company currently carries on business, relocation and start-up costs, all of which would adversely impact profit in the short term. The Company could also be exposed to foreign exchange and liquidity risks in the long term.
- •
- The Company's customers are increasingly requesting that each of their suppliers bear the cost of the repair and replacement of defective products which are either covered under automobile manufacturer's warranty or are the subject of a recall by the customer and which were improperly designed, manufactured or assembled by their suppliers. The obligation to repair or replace such parts could have a negative impact on the Company's results. The Company is also subject to the risk of exposure to product liability claims in the event that the failure of the Company's products results in bodily injury and/or property damage. The Company may experience material product liability losses in the future and may incur significant costs to defend such claims. Currently, the Company has product liability coverage under Magna's insurance policies. This coverage will continue until August 2003, subject to renewal on an annual basis. In addition, some of the Company's European subsidiaries maintain product recall insurance, which is required by law in certain jurisdictions. A successful claim brought against the Company in excess of its available insurance coverage may have an adverse effect on the Company's operations and financial condition.
CRITICAL ACCOUNTING POLICIES
The preparation of the consolidated financial statements requires management to make estimates and judgements that affect the reported amounts of assets, liabilities, revenues and expenses, and the related disclosure of contingent assets and liabilities. On an ongoing basis, the Company evaluates its estimates, including those related to bad debts, inventories, long-lived assets, future tax assets, goodwill, preproduction costs related to long-term supply arrangements, future tax liabilities, warranty, recall and product liability obligations, and contingent liabilities. The Company bases its estimates on historical experience and various other assumptions that are believed to be reasonable in the circumstances, the results of which form the basis for making judgements about the carrying value of assets and liabilities. Actual results may differ from these estimates under different assumptions or conditions.
The Company believes the following critical accounting policies affect its more significant judgements and estimates used in the preparation of its consolidated financial statements.
Revenue Recognition—Integrator Contracts
The Company acts as the vehicle interior integrator on various programs in which the Company manufactures a portion of the integrated products but also collects components from various sub-suppliers for assembly and sale of an integrated product to the customer. Judgement is required in assessing whether these integrator contracts should be reported on a gross (reporting sales and cost of sales gross) or net (netting cost of sales against sales) basis. Some of the factors the Company considers in arriving at its conclusion to record sales on a gross versus net basis include whether the Company has the primary responsibility for providing the integrated product to the customer, exposure to inventory risk on sub-supplier parts, responsibility for design and specifications, latitude in establishing sub-supplier pricing, exposure to warranty and exposure to credit risk for sale of the integrated product to the customer. The method of revenue recognition is reviewed on a component by component basis. To date, all vehicle interior integrator supply contracts have been recorded on a gross basis.
Amortized Engineering and Customer Owned Tooling Arrangements
The Company incurs pre-production engineering, design, research and development ("ER&D") costs related to the products it produces for its customers under long-term supply agreements. The Company expenses ER&D costs which are paid for as part of subsequent related parts production piece-price amounts as incurred unless a contractual guarantee for reimbursement exists, in which case the costs would be capitalized. In addition, the Company expenses all costs as incurred related to the design and development of moulds, dies and other tools that the Company will not own and that will be used in, and reimbursed as part of the piece-price amount for subsequent related parts production. Such costs are capitalized only when the supply agreement provides the Company with a contractual guarantee for reimbursement of costs or the non-cancellable right to use the moulds, dies and other tools during the supply agreement.
ER&D and customer owned tooling costs capitalized in "Other assets" are amortized on a units of production basis over the related parts production long-term supply agreement. As at December 31, 2002 and 2001, total net ER&D and customer owned tooling costs capitalized in other assets amounted to $4.0 million and $4.2 million, respectively. A change in the commercial arrangement affecting any of the Company's significant programs that would require the Company to expense ER&D or customer owned tooling costs that are currently capitalized would have a negative impact on the Company's reported results of operations.
Goodwill
Effective January 1, 2002, the Company adopted new rules governing the accounting for goodwill for Canadian GAAP reporting purposes (see "Depreciation and Amortization" and "Other Charges"). Under the new rules, the Company's goodwill is no longer amortized and is subject to an annual impairment test.
Goodwill impairment is assessed based on a comparison of the fair value of an individual reporting unit to the underlying carrying value of the reporting unit's net assets including goodwill. When the carrying value of the reporting unit exceeds its fair value, the fair value of the reporting unit's goodwill should be compared with its carrying value to measure the amount of the impairment loss, if any. The fair value of goodwill is determined in the same manner as in a business combination.
Management completed its determination of the fair value of the Company's reporting units and its initial goodwill impairment assessments as at January 1, 2002 during the second quarter of 2002 and recorded a write-down of goodwill totalling $35.7 million, of which $27.6 million, $5.6 million and $2.5 million related to reporting units in the Interiors Europe, Closures Europe and Interiors North America reporting segments. In accordance with Canadian GAAP, this impairment loss has been recorded as a change in accounting policy and a charge to opening retained earnings as at January 1, 2002.
The goodwill of a reporting unit must be tested for impairment on an annual basis or between the annual tests when an event or circumstance occurs that more likely than not reduces the fair value of a reporting unit below its carrying value. The Company completed its annual impairment review as at December 31, 2002 and recorded a further write-down of $3.5 million relating to a reporting unit in the Interiors Europe reporting segment. This write-down was charged to operating income as "Other Charges".
The Company believes that the accounting estimates related to goodwill impairments are "critical accounting estimates" because (i) they are subject to significant measurement uncertainty and are susceptible to change as management is required to make forward looking assumptions regarding the impact of improvement plans on current operations, insourcing and other new business opportunities, program price and cost assumptions on current and future business, the timing of new program launches and future forecasted production volumes; and (ii) any resulting impairment loss could have a material impact on the Company's consolidated net income and on the amount of goodwill reported on the Company's consolidated balance sheet.
United States GAAP with respect to goodwill is based on the same accounting principles and estimates as Canadian GAAP. However, for United States GAAP purposes, the $35.7 million transitional impairment charged to opening retained earnings under Canadian GAAP has been recorded as a cumulative catch-up adjustment.
Impairment of Long-Lived Assets
Effective January 1, 2002, the Company adopted new rules governing the accounting for impairment of long-lived assets (see "Other Charges"). The Company evaluates long-lived assets for impairment whenever indicators of impairment exist. Indicators of impairment include prolonged operating losses, goodwill impairment or a decision to dispose of, or otherwise change the use of, an existing long-lived asset.
If the sum of the future cash flows expected to result from the asset, undiscounted and without interest charges, is less than the reported value of the asset, an asset impairment must be recognized in the financial statements. The amount of impairment to recognize is calculated by subtracting the fair value of the asset from the reported value of the asset. Fair value is measured by future discounted cash flows.
In conjunction with the annual impairment test for goodwill at December 31, 2002, the Company also reviewed the recoverability of its long-lived assets in a reporting unit within the Interiors Europe reporting segment where an indicator of goodwill impairment existed. As a result of this review, a $20.1 million write-down of long-lived assets was charged to operating income in the fourth quarter of 2002. This write-down was charged to operating income as "Other Charges".
The Company believes that accounting estimates related to long-lived asset impairment are "critical accounting estimates" because (i) they are subject to significant measurement uncertainty and are susceptible to change as management is required to make forward looking assumptions regarding the impact of improvement plans on current operations, insourcing and other new business opportunities, program price and cost assumptions on current and future business, the timing of new program launches and future forecasted production volumes; and (ii) any resulting impairment loss could have a material impact on the Company's consolidated net income and on the amount of long-lived assets reported on the Company's consolidated balance sheet.
Future Income Tax Assets and Future Income Tax Liabilities
Under both Canadian and United States GAAP, the Company uses the liability method of tax allocation for accounting for income taxes. Under the liability method of tax allocation, future tax assets and liabilities are determined based on differences between the financial reporting carrying value and tax cost bases of assets and liabilities. Future tax assets are reduced by a valuation allowance if it is more likely than not that some or all of the future tax asset will not be realized.
At December 31, 2002 and 2001, the Company had recorded net future tax assets (net of related liabilities and valuation allowances) of $37.5 million and $61.0 million, respectively, consisting primarily of the benefit of loss carryforwards. Future tax assets at December 31, 2002 related primarily to the Company's German and U.S. operations.
The Company evaluates quarterly the carrying value of its future tax assets by assessing its valuation allowance and by adjusting the amount of such allowance, if necessary. The factors used to assess the likelihood of realization are the Company's forecast of future taxable income and available tax planning strategies that could be implemented to realize the future tax assets.
At December 31, 2002, the Company had income tax loss carryforwards of approximately $122.1 million, which relate primarily to operations in Europe, the tax benefits of which have not been recognized in the consolidated financial statements. Of the total tax loss carryforwards, $92.5 million expire between 2003 and 2012 and the remainder have no expiry dates. If operations improve to profitable levels in these jurisdictions, and such improvements are sustained for a prolonged period of time, the Company's earnings will benefit from these tax loss carryforwards.
Employee Defined Benefit Plans
The Company has a number of arrangements in Canada, the United States, the United Kingdom and Europe which provide pension and future employee benefits to its retired and current employees. Pension arrangements include statutory pension plans as well as similar arrangements, which provide pension benefits as required by statute.
The determination of the obligation and expense for defined benefit pension and other post retirement benefits, such as retiree medical benefits, is dependent on the selection of certain assumptions used by actuaries in calculating such amounts. Those assumptions are included in note 12 to the Company's consolidated financial statements and include, among others, the discount rate, expected long-term rate of return on plan assets and rates of increase in compensation and healthcare costs. Actual results that differ from the assumptions used are accumulated and amortized over future periods and, therefore, impact the recognized expense and recorded obligation in future periods.
At December 31, 2002, the Company had obligations under its defined benefit pension plans and other statutory plans of $61.4 million. The defined benefit plans have assets of $28.4 million and unfunded unrecognized net actuarial losses of $12.6 million. The unfunded unrecognized net actuarial losses of $12.6 million, are amortized and charged to earnings over the average remaining service period of active employees. All pension plans and similar arrangements are funded to the minimum legal funding requirement. In certain plans, there is no legal requirement to fund the obligation until such time as they are actually incurred, and as a result these arrangements are unfunded. In addition to the registered plan assets, certain subsidiaries hold $1.2 million of guaranteed securities with respect to their unfunded termination and long service obligations. In addition, the Company has obligations with respect to post retirement medical benefit of $8.2 million. The Company pension and medical benefit expense was $ 6.5 million and $5.3 million in 2002 and 2001, respectively.
Foreign Exchange Contracts
The Company uses foreign exchange contracts to manage foreign exchange risk from its underlying customer and supplier contracts. In particular, the Company uses foreign exchange forward contracts for the sole purpose of hedging certain of the Company's future committed foreign currency outflows and inflows. These derivatives qualify for hedge accounting under Canadian GAAP. The Company does not enter into foreign exchange contracts for speculative purposes.
The Company determines the fair value of the derivatives based on market values provided by independent parties based on contracts with similar remaining terms to maturity. The values of the foreign exchange contracts will change over time as interest rates, currency rates and market conditions change.
While these contracts expose the Company to credit losses in the event of non-performance by counterparties to the agreements, the Company minimizes the risk of non-performance by only entering into contracts with financially sound counterparties and by limiting its exposure with any one financial institution.
The Company's use of foreign exchange contracts is dependent on forecasted future foreign currency outflows and inflows. If such cash flows were no longer probable of occurring, the foreign exchange contracts would cease to be effective as a hedge. For example, if projected net foreign currency cash inflows or outflows declined significantly, previously unrecognized gains or losses pertaining to the portion of the hedging transactions in excess of projected foreign currency denominated cash flows would be recognized in income at the time this condition was identified. At December 31, 2002, the losses not recognized in the Company's reported net income related to significant derivative financial instrument contracts is $14.7 million.
Under United States GAAP, effective January 1, 2002, the Company's foreign exchange forward contracts qualify for hedge accounting. As of January 1, 2002, the Company implemented a new treasury management system that complies with documentation requirements that allow hedge accounting. Changes to fair value of the Company's forward exchange contracts are recorded in other comprehensive income. Prior to January 1, 2002, for United States GAAP purposes, changes in the market value of the Company's foreign exchange forward contracts were recorded in earnings. If the Company's forward exchange contracts ceased to be effective as hedges, for example, if projected net foreign cash inflows declined significantly, previously unrecognized gains or losses pertaining to the portion of the hedging transactions in excess of projected foreign denominated cash flows would be recognized in income at the time this condition was identified.
Warranty, Product Liability and Recall Obligations
The Company is at risk for warranty, product liability and recall costs. Product liability provisions are established based on the Company's best estimate of the amounts necessary to settle existing claims on product default issues. Recall costs are costs incurred when the Company and/or the customer decide, either voluntarily or involuntarily, to recall a product due to a known or suspected performance issue. Costs typically include the cost of the product being replaced, customer cost of the recall and labour to remove and replace the defective part. When a decision to recall a product has been made or is probable, the Company's estimated cost of the recall is recorded as a charge to net earnings in that period. In making this estimate, judgement is required as to the number of units that may be returned as a result of the recall, the total cost of the recall campaign, the ultimate negotiated sharing of the cost between the Company and the customer and, in some cases, the extent to which a supplier to the Company will share the recall cost. Due to the nature of the costs, the Company makes its best estimate of the expected future costs, however, the ultimate amount of such costs could be materially different.
Given the nature of the Company's products, to date, the Company has not experienced significant warranty, including product liability and recall costs. However, the Company continues to experience increased customer pressure to assume greater warranty responsibility. Currently, the Company only accounts for existing or probable claims, however, a significant increase in warranty responsibility could require the Company to consider accounting for possible future claims.
In particular, one of the Company's customers has asserted a claim for reimbursement for warranty costs as well as additional expenses which it expects to incur as a result of a voluntary customer satisfaction-based recall of a product which forms part of a module supplied by the Company to the customer. The product in question is supplied to the Company by another large supplier that the Company was directed to use by its customer. The customer has claimed that the warranty and future recall costs could be up to $42 million. Based on the Company's investigations to date, the Company does not believe that it has any liability for this claim and that any liability that the Company may become subject to, if it is established that the product is defective, will be recoverable from the supplier of the product, although the Company cannot provide assurance that this will be the case.
Contingencies
In the ordinary course of business activities, the Company may be contingently liable for litigation and claims with customers, suppliers and former employees. In addition, the Company may be, or could become, liable to incur environmental remediation costs to bring environmental contamination levels back within acceptable legal limits. On an on-going basis, the Company assesses the likelihood of any adverse judgements or outcomes to these matters as well as potential ranges of probable costs and losses. A determination of the provision required, if any, for these contingencies is made after analysis of each individual issue. The required provision may change in the future due to new developments in each matter or changes in approach such as a change in settlement strategy in dealing with these matters.
To date, contingent liabilities recognized in the Company's consolidated financial statements are not significant.
Stock-Based Compensation
The Company's existing stock-based compensation plan requires its employees and directors to pay the option exercise price in order to obtain stock. As a result, under both current Canadian and United States GAAP, it is acceptable for the Company not to recognize compensation expense with respect to option grants to employees. Instead, the Company discloses the pro forma impact of stock option grants on reported earnings had the Company accounted for all employee and director stock options at fair value as of the date of grant. For this purpose, fair value is determined using the Black-Scholes option valuation model.
The Company has chosen not to recognize compensation expense in reported earnings. The dilutive impact of stock option grants is currently factored into the Company's reported diluted earnings per share. In addition, as a result of limitations with existing option valuation models, it is difficult to determine a reliable single measure of the fair value of stock option grants.
Notwithstanding the above, had the Company recognized compensation expense for stock option grants using the Black-Scholes option valuation model, 2002 net income attributable to Class A Subordinate Voting and Class B Shares would have decreased by $0.9 million under Canadian GAAP and $2.7 million under U.S. GAAP.
RESULTS OF OPERATIONS AND FINANCIAL POSITION FOR THE YEAR 2002 COMPARED TO 2001
| | Years ended December 31,
| |
|---|
| | 2002
| | 2001
| | % Change
| |
|---|
| 1 Canadian dollar equals U.S. dollars | | 0.6372 | | 0.6456 | | (1.3 | ) |
| 1 euro equals U.S. dollars | | 0.9456 | | 0.8951 | | 5.6 | |
| 1 British pound equals U.S. dollars | | 1.5025 | | 1.4397 | | 4.3 | |
The Company's results are directly affected by the average exchange rate used to translate the results of its operations having a functional currency other than the U.S. dollar into U.S. dollars. The table above reflects the average foreign exchange rates between the most common currencies in which the Company conducts business and the Company's U.S. dollar reporting currency. Significant changes in the above foreign exchange rates impact the reported U.S. dollar amounts of the Company's sales, expenses and income. Throughout this MD&A, reference is made to the impact of foreign exchange on reported U.S. dollar amounts where relevant.
SALES
| | Years ended December 31,
|
|---|
| | 2002
| | 2001
|
|---|
| (in millions, except average dollar content per vehicle) | | | | | | |
| Vehicle production volumes | | | | | | |
| | North America | | | 16.3 | | | 15.5 |
| | Europe | | | 16.3 | | | 16.5 |
| | |
| |
|
| Average dollar content per vehicle | | | | | | |
| | North America | | $ | 135 | | $ | 125 |
| | Europe | | | 74 | | | 56 |
| | |
| |
|
| Production sales—North America | | | | | | |
| | Interior Systems | | $ | 1,572.8 | | $ | 1,352.1 |
| | Closure Systems | | | 635.9 | | | 585.6 |
| | |
| |
|
| | | | 2,208.7 | | | 1,937.7 |
| | |
| |
|
| Production sales—Europe | | | | | | |
| | Interior Systems | | $ | 1,078.2 | | $ | 820.9 |
| | Closure Systems | | | 137.8 | | | 104.3 |
| | |
| |
|
| | | | 1,216.0 | | | 925.2 |
| | |
| |
|
| Tooling and engineering sales | | | 436.9 | | | 405.2 |
| | |
| |
|
| Total sales | | $ | 3,861.6 | | $ | 3,268.1 |
| | |
| |
|
Production Sales—North America
Interior Systems: North American production sales for the Interiors business increased 16.3% to $1,572.8 million for 2002 compared to $1,352.1 million for 2001. This growth was primarily the result of an increase in average dollar content per vehicle which was positively impacted by new product launches in the second half of 2001, including the overhead system and seat tracks for the Dodge Ram Pickup, the complete seats and overhead system for the Saturn VUE, the cockpit module, door panels, overhead system and other interior trim for the Cadillac CTS, and the launch of the complete seats and overhead system for the Saturn ION in the fourth quarter of 2002, and by a 5.2% increase in North American light vehicle production volumes from 2001. The increase in production sales was partially offset by the weakening of the Canadian dollar relative to the U.S. dollar which negatively impacted production sales for 2002.
Closure Systems: North American production sales for the Closures business increased 8.6% to $635.9 million for 2002 from $585.6 million for 2001. This was primarily the result of an increase in average dollar content per vehicle which was due to new product launches during 2002 including door cassette modules for the Ford Expedition/Lincoln Navigator, latches for the GMC Savana/Chevrolet Express and Hummer H2 and product launches in the second half of 2001, including window regulators supplied for the Dodge Ram Pickup and latches and window regulators supplied for the GMC Envoy/Chevrolet Trail Blazer and by a 5.2% increase in North American light vehicle production volumes from 2001. This was partially offset by the weakening of the Canadian dollar relative to the U.S. dollar which negatively impacted production sales for 2002.
Production Sales—Europe
Interior Systems: European production sales for the Interiors business increased 31.3% to $1,078.2 million for 2002 compared to $820.9 million for 2001. This growth was primarily attributable to increased average dollar content per vehicle as a result of new product launches in the second half of 2001, including the production of the cockpit module, door panels and interior trim for the MINI by BMW, the complete interior, excluding the overhead system and instrument panel for the Mercedes-Benz Vaneo, and new product launches in 2002, including the instrument panel for the Opel Epsilon platform, the door panels for the Toyota Avensis and the cockpit module for the Nissan Micra and the strengthening of the euro and the British pound relative to the U.S. dollar. The production sales increase was partially offset by a 1.2% decrease in Western European vehicle production volumes from 2001.
Closure Systems: European production sales for the Closures business increased 32.1% to $137.8 million for 2002 from $104.3 million for 2001. This increase was due to the increase in average dollar content per vehicle as a result of the launch of new products during 2002, including the latch system for the Ford Fiesta/Ka and the strengthening of the euro relative to the U.S. dollar. The production sales increase was partially offset by a 1.2% decrease in Western European vehicle production volumes from 2001 and by lower vehicle production volumes on one specific customer's platforms.
Tooling and Engineering Sales
The Company's consolidated tooling and engineering sales for 2002 increased 7.8% to $436.9 million from $405.2 million for 2001. Tooling and engineering sales for 2001 included approximately $38 million of tooling sales for the current DaimlerChrysler minivan program. Excluding the impact of the sales for the DaimlerChrysler minivan, tooling and engineering sales increased by $21.5 million to $218.5 million in North America. Tooling sales in Europe increased by $48.2 million to $218.4 million for 2002 compared to $170.2 million for 2001. These increases in tooling and engineering sales are due to the Company's increased involvement in new incremental programs.
GROSS MARGIN
| | Years ended December 31,
| |
|---|
| | 2002
| | 2001
| |
|---|
| Gross margin | | $ | 486.7 | | $ | 406.5 | |
| | |
| |
| |
| Gross margin as a percentage of total sales | | | 12.6 | % | | 12.4 | % |
| | |
| |
| |
2002 gross margin was positively impacted by the Company's higher average dollar content per vehicle and additional sales on new programs launched during the second half of 2001 and during 2002, operational improvements at previously identified under-performing divisions, the strengthening of the euro and British pound relative to the U.S. dollar and lower EEPPP expense as a result of the introduction by the Company of the Intier EEPPP in 2002. This was offset by higher than expected launch costs related to certain new programs in Europe. During 2002, a $2.8 million charge (2001—$2.7 million) was recorded in the fourth quarter relating to the downsizing of one of the Company's under-performing divisions. Gross margin as a percentage of total sales increased to 12.6% for 2002 compared to 12.4% for 2001.
OPERATING INCOME
| | Years ended December 31,
| |
|---|
| | 2002
| | 2001
| |
|---|
| Gross Margin | | $ | 486.7 | | $ | 406.5 | |
| Less: | | | | | | | |
| | Depreciation and amortization | | | 88.5 | | | 88.0 | |
| | Selling, general and administrative | | | 197.6 | | | 168.1 | |
| | Affiliation and social fees | | | 55.3 | | | 48.8 | |
| | Other charges | | | 23.6 | | | — | |
| | |
| |
| |
| Operating income | | $ | 121.7 | | $ | 101.6 | |
| | |
| |
| |
| Depreciation and amortization as a percentage of total sales | | | 2.3 | % | | 2.7 | % |
| | |
| |
| |
| Selling, general and administrative expenses as a percentage of total sales | | | 5.1 | % | | 5.1 | % |
| | |
| |
| |
Depreciation and amortization: Depreciation and amortization expense increased by $0.5 million to $88.5 million for 2002 from $88.0 million for 2001. The increase is attributable to additional depreciation expense as a result of the Company's continuing investment in capital equipment to support new production programs and facilities, and the strengthening of the euro and British pound relative to the U.S. dollar which had the effect of increasing U.S. dollar reported depreciation and amortization expense in 2002 compared to 2001. This increase is offset by the impact of adopting the new accounting recommendations under the Canadian Institute of Chartered Accountants' Handbook Section 3062, "Goodwill and Other Intangible Assets" ("CICA 3062"). With the adoption of the new recommendations, effective January 1, 2002, the Company ceased recording amortization of existing goodwill. The impact of applying the new recommendations for 2002 was a decrease of approximately $8.3 million in amortization that would have previously been recorded as goodwill amortization under the old recommendations. As a percentage of sales, depreciation and amortization expense decreased to 2.3% for 2002 from 2.7% for 2001.
Selling, general and administrative: Selling, general and administrative ("SG&A") costs increased by $29.5 million to $197.6 million for 2002 from $168.1 million for 2001. The Company has an agreement with Magna to provide certain management and administrative services to the Company. Previously, the costs of such services were included in "Affiliation fees and other charges". Commencing January 1, 2002, the Company began reporting amounts paid to Magna for management and administrative services in SG&A. Affiliation fees and social commitment contributions continue to be shown separately in the consolidated statements of income under "Affiliation and social fees". All comparative period amounts have been reclassified to conform with the current period presentation. The increase in SG&A costs reflects the incremental costs associated with the increase in production sales and the strengthening of the euro and British pound relative to the U.S. dollar which had the effect of increasing U.S. dollar reported SG&A expense in 2002. As a percentage of total sales, SG&A remained unchanged at 5.1%.
Affiliation and social fees: The Company pays fees to Magna for certain rights provided under the terms of the Company's affiliation agreements and contributes a portion of its social commitment obligation under its Corporate Constitution pursuant to social commitment agreements with Magna. These fees and social commitment contributions are based on the Company's sales and pretax profits. The fees and contributions to Magna expensed during 2002 were $55.3 million reflecting an increase of $6.5 million compared to the $48.8 million expensed in 2001. The increase in fees is reflective of the increase in sales and pretax profits in 2002 compared to 2001.
Other charges: Under CICA 3062, after adoption of the new recommendations, goodwill must be assessed for impairment on an annual basis, and any write-down charged against earnings. The Company completed its annual goodwill impairment test as at December 31, 2002 and determined that goodwill of $3.5 million relating to one reporting unit in its Interiors Europe reporting segment was impaired under the new rules. The impairment loss has been recorded in operating income as a charge against 2002 earnings. There was no tax recovery recorded on this charge to earnings.
In conjunction with the review of goodwill, the Company also assessed the recoverability of its long-lived assets in the same reporting unit in its Interiors Europe reporting segment following the new accounting recommendations in CICA 3063. CICA 3063 requires an impairment loss to be recognized when the carrying amount of an asset to be held and used exceeds the sum of the undiscounted cash flows expected from its use and eventual disposition. An impairment loss is measured as the amount by which the asset's carrying value exceeds its fair value. As permitted by CICA 3063, discounted cash flows were used to determine fair value. As a result of this review, the Company reduced the carrying value of machinery and equipment, leasehold improvements and buildings by $17.6 million, $1.4 million and $1.1 million, respectively. As required by CICA 3063, the $20.1 million write-down of long-lived assets has been recorded in operating income as a charge against 2002 earnings. Net tax assets of $1.5 million associated with these operations were charged to income tax expense in 2002.
OPERATING INCOME (LOSS)
| | Years ended December 31,
| |
|---|
| | 2002
| | 2001
| |
|---|
| North America | | | | | | | |
| | Interior Systems | | $ | 108.4 | | $ | 78.4 | |
| | Closure Systems | | | 52.5 | | | 35.9 | |
| Europe | | | | | | | |
| | Interior Systems | | | (23.3 | ) | | (7.2 | ) |
| | Closure Systems | | | (18.1 | ) | | (0.9 | ) |
| Corporate | | | 2.2 | | | (4.6 | ) |
| | |
| |
| |
| Operating income | | $ | 121.7 | | $ | 101.6 | |
| | |
| |
| |
Operating Income—North America
Interior Systems: Operating income for the North American Interiors business increased by $30.0 million to $108.4 million for 2002 from $78.4 million for 2001. The positive impact related to the Company's higher average dollar content per vehicle, increased sales from higher vehicle production volumes, operating improvements at previously identified under-performing divisions, higher sales on new programs launched in the second half of 2001 and during 2002, lower EEPPP expense and the ceasing of goodwill amortization as a result of CICA 3062 (see "Depreciation and Amortization"). This was partially offset by higher engineering costs on new programs, increased SG&A costs associated with the increase in production sales, increased affiliation and social fees, increased corporate office costs and by the weakening of the Canadian dollar relative to the U.S. dollar, which had the effect of reducing U.S. dollar reported operating income.
Closure Systems: Operating income for the North American Closures business increased by $16.6 million to $52.5 million for 2002 from $35.9 million for 2001. The positive impact related to increased sales from higher vehicle production volumes, the Company's increased content on new programs launched during 2002 and in the second half of 2001, and lower EEPPP expense. This increase was partially offset by increased affiliation and social fees, increased corporate office costs, costs associated with vehicle launches in 2002 and the weakening of the Canadian dollar relative to the U.S. dollar, which had the effect of reducing U.S. dollar reported operating income.
Operating Loss—Europe
Interior Systems: Operating loss for the European Interiors business increased by $16.1 million from an operating loss of $7.2 million for 2001 to an operating loss of $23.3 million for 2002. European operating income was positively impacted by the start of production of a number of new contracts in the second half of 2001 and during 2002, continuing operating efficiencies at specific under-performing divisions, lower EEPPP expense, the ceasing of goodwill amortization as a result of CICA 3062 (see "Depreciation and Amortization") and the strengthening of the euro and British pound relative to the U.S. dollar, which had the effect of increasing U.S. dollar reported operating income. These increases were offset by higher than expected launch costs related to certain new programs, increased SG&A costs associated with the increase in production sales and increased affiliation fees. In addition, 2002 included a $3.5 million write-down of goodwill and a $20.1 million write-down of long-lived assets (see "Other Charges"). 2002 also includes a $2.8 million charge (2001—$2.7 million) relating to the downsizing of one of the Company's under-performing divisions.
Closure Systems: Operating loss for the European Closures business increased by $17.2 million from operating loss of $0.9 million in 2001 to an operating loss of $18.1 million in 2002. The operating loss increase was due to higher than expected launch costs related to a new program launched in one division, lower sales on products supplied to one specific customer's platforms and related operating inefficiencies, increased affiliation fees, higher engineering costs on new programs, and the strengthening of the euro relative to the U.S. dollar which had the effect of increasing U.S. dollar reported operating loss. This was partially offset by the ceasing of goodwill amortization as a result of CICA 3062 (see "Depreciation and Amortization").
Operating income—Corporate: Commencing October 1, 2001, certain corporate costs were charged to various operating segments of the Company for services performed at corporate for the operating segments. As a result, the operating loss for corporate of $4.6 million in 2001 increased to operating income of $2.2 million in 2002.
OTHER ITEMS
| | Years ended December 31,
| |
|---|
| | 2002
| | 2001
| |
|---|
| Operating income | | $ | 121.7 | | $ | 101.6 | |
| Interest (income) expense, net | | | (1.5 | ) | | 16.2 | |
| Amortization of discount on Convertible Series Preferred Shares | | | 11.6 | | | 4.8 | |
| Equity (income) loss | | | (0.6 | ) | | 0.4 | |
| | |
| |
| |
| Income before income taxes and minority interest | | | 112.2 | | | 80.2 | |
| Income taxes | | | 64.5 | | | 40.7 | |
| Minority interest | | | (0.9 | ) | | (0.4 | ) |
| | |
| |
| |
| Net income | | | 48.6 | | | 39.9 | |
| Financing charge on Convertible Series Preferred Shares | | | 1.9 | | | 0.9 | |
| | |
| |
| |
| Net income attributable to Class A Subordinate Voting and Class B Shares | | $ | 46.7 | | $ | 39.0 | |
| | |
| |
| |
Interest (income) expense, net: The Company's interest income, net of interest expense, increased by $17.7 million to $1.5 million interest income for 2002 from $16.2 million interest expense for 2001. The increase was primarily the result of a lower average net debt position during 2002 compared to 2001, interest income on a tax refund and interest income on other assets.
Amortization of discount on Convertible Series Preferred Shares: As part of the Reorganization of the Company in August 2001 (see "Earnings Per Share"), $225 million of Convertible Series Preferred Shares were issued to Magna. As a result, an $11.6 million charge relating to the Company's amortization of the discount on the Convertible Series Preferred Shares classified as debt was incurred during 2002 compared to $4.8 million in 2001.
Income taxes: The effective tax rate on income before income taxes and minority interest was 57.5% for 2002 as compared to 50.7% for 2001. Excluding the impact of tax losses not benefited, the impact of "Other Charges" of $23.6 million, the related income tax charge of $1.5 million and the non-deductible amortization of discount on Convertible Series Preferred Shares, the effective tax rate was 35% for 2002 compared to a rate of 41% for 2001.
Net income: Net income for 2002 was $48.6 million as compared to $39.9 million for 2001. The increase was attributable to the increased gross margin related to the higher average dollar content per vehicle, increased North American vehicle production volumes, operating improvements at previously identified under-performing divisions, lower EEPPP expense, the ceasing of goodwill amortization as a result of adopting new accounting recommendations for goodwill under CICA 3062, and increased interest income. This was partially offset by impairment charges for goodwill and long-lived assets (see "Other Charges"), launch costs on certain new programs, increased SG&A costs, increased amortization of discount on the Convertible Series Preferred Shares, increased affiliation and social fees and higher income tax expense for 2002 compared to 2001.
Financing Charge: The deduction from net income of dividends declared and paid on the Convertible Series Preferred Shares (net of return of capital) was $1.9 million for 2002 compared to $0.9 million for 2001. The increase reflects the full year impact of the Series 1 and 2 Convertible Preferred Shares issued in August 2001 to Magna as part of the recapitalization of the Company.
EARNINGS PER SHARE
| | Years ended December 31,
| |
|
|---|
| | Pro forma
Year ended
December 31,
2001
|
|---|
| | 2002
| | 2001*
|
|---|
| Earnings per Class A Subordinate Voting or Class B Share (U.S. $) | | | | | | | | | |
| | Basic | | $ | 0.97 | | $ | 0.37 | | $ | 0.91 |
| | Diluted | | $ | 0.95 | | $ | 0.37 | | $ | 0.90 |
| | |
| |
| |
|
| Average number of Class A Subordinate Voting and Class B Shares outstanding (in millions) | | | | | | | | | |
| | Basic | | | 48.2 | | | 47.9 | | | 44.9 |
| | Diluted | | | 63.6 | | | 47.9 | | | 59.8 |
| | |
| |
| |
|
- *
- represents net income from August 1, 2001 to December 31, 2001
The new capital structure, as a result of a reorganization completed by the Company prior to its initial public offering (the "Reorganization"), was established at the beginning of August 2001. Earnings per share for the period ended December 31, 2001, therefore only includes net income for the five-month period subsequent to July 31, 2001. As a result, diluted earnings per Class A Subordinate Voting or Class B Share, for the five-month period and year ended December 31, 2001 was $0.37. The Reorganization of the Company resulted in significant changes to the Company's capital structure and affiliation agreements with Magna. Therefore, comparable pro forma earnings per share measures, which give effect to the changes in the Company's capital structure and other items, are provided in note 4 to the accompanying consolidated financial statements for 2001 and 2000. Diluted earnings per Class A Subordinate Voting or Class B Share was $0.95 for 2002 compared to pro forma diluted earnings per Class A Subordinate Voting or Class B Share was $0.90 for 2001. The increase in diluted earnings per Class A Subordinate Voting or Class B Share compared to pro forma diluted earnings per Class A Subordinate Voting or Class B Share is a result of higher net income for 2002 as compared to pro forma net income for 2001. Diluted earnings per Class A Subordinate Voting or Class B Share for 2002 includes a $0.39 loss per share associated with the "Other Charges" of $23.6 million and the related income tax charge of $1.5 million.
FINANCIAL CONDITION, LIQUIDITY AND CAPITAL RESOURCES
CASH FROM OPERATING ACTIVITIES
| | Years ended December 31,
|
|---|
| | 2002
| | 2001
|
|---|
| Net income | | $ | 48.6 | | $ | 39.9 |
| Items not involving current cash flows | | | 155.5 | | | 101.2 |
| | |
| |
|
| | | | 204.1 | | | 141.1 |
| Change in non-cash working capital | | | 111.4 | | | 25.9 |
| | |
| |
|
| | | $ | 315.5 | | $ | 167.0 |
| | |
| |
|
During 2002, cash from operations before changes in working capital increased by $63.0 million to $204.1 million from $141.1 million in 2001. The increase was a result of an increase in net income of $8.7 million and an increase in non-cash items of $54.3 million representing higher future tax expense and the non-cash impairment charges for goodwill and long-lived assets (see "Other Charges") and other non-cash charges. The $111.4 million of cash generated from working capital during 2002 is the result of an $86.1 million increase in accounts payable and accrued liabilities, a $31.9 million decrease in accounts receivable, offset by a $4.0 million increase in inventories and a $2.6 million increase in prepaids and other assets. The increase in accounts payable and accrued liabilities are due to new programs launched late in 2001 and in 2002. The decrease in accounts receivable is due to receipts of cash immediately before December 31, 2002, partially offset by programs launched late in 2001 and during 2002.
INVESTMENT ACTIVITIES
| | Years ended December 31,
| |
|---|
| | 2002
| | 2001
| |
|---|
| Fixed asset additions | | $ | (136.8 | ) | $ | (87.6 | ) |
| Investments and other asset additions | | | (3.1 | ) | | (5.0 | ) |
| Proceeds from disposition of long-lived assets | | | 4.8 | | | 2.6 | |
| | |
| |
| |
| | | $ | (135.1 | ) | $ | (90.0 | ) |
| | |
| |
| |
Cash used for fixed assets and investment and other asset spending was $139.9 million and $92.6 million for 2002 and 2001, respectively. This use of funds was partially offset by cash received from normal course fixed and other asset dispositions of $4.8 million and $2.6 million during 2002 and 2001, respectively.
FINANCING ACTIVITIES
| | Years ended December 31,
| |
|---|
| | 2002
| | 2001
| |
|---|
| Increase in bank indebtedness | | $ | 0.6 | | $ | 34.5 | |
| Repayments of long-term debt | | | (4.6 | ) | | (8.1 | ) |
| Net distribution to Magna | | | — | | | (144.4 | ) |
| Issue of Class A Subordinate Voting Shares, net | | | 0.1 | | | 71.7 | |
| Dividends on Class A Subordinate Voting and Class B Shares | | | (9.7 | ) | | (2.0 | ) |
| Dividends on Convertible Series Preferred Shares | | | (8.4 | ) | | (1.9 | ) |
| | |
| |
| |
| | | $ | (22.0 | ) | $ | (50.2 | ) |
| | |
| |
| |
Cash used for financing activities was $22.0 million in 2002 compared to $50.2 million in 2001. Cash used for financing activities in 2002 included net repayments of debt (including bank indebtedness and long-term debt) of $4.0 million compared to net issues of debt of $26.4 million in 2001. 2001 included $71.7 million of net proceeds from the public offering of 5,476,191 Class A Subordinate Voting Shares and net distribution to Magna of $144.4 million. Dividends paid during 2002 were $0.20 per Class A Subordinate Voting and Class B Share totalling $9.7 million, compared to $0.04 per Class A Subordinate Voting and Class B Share during 2001, totalling $2.0 million. Dividends paid on Convertible Series Preferred Shares for 2002 were $8.4 million, compared to $1.9 million for 2001.
Consolidated Capitalization
The Company's net debt (including bank indebtedness, long-term debt including current portion, and the liability portion of the Convertible Series Preferred Shares, less cash and cash equivalents) to total capitalization (including net debt and shareholders' equity), has improved to 7% at December 31, 2002 compared to 25% at December 31, 2001. The reduction in net debt to total capitalization was due primarily to increased net income during the period and debt repayments with the excess of cash generated from operations and dispositions over capital spending and dividends.
The above net debt to total capitalization figures treat the liability portion ($206.2 million as at December 31, 2002) of the Convertible Series Preferred Shares as debt. The Series 1 Convertible Series Preferred Shares are retractable by Magna after December 31, 2003 and the Series 2 Convertible Series Preferred Shares are retractable by Magna after December 31, 2004. However, these instruments are also convertible into Intier Class A Subordinate Voting Shares at a fixed conversion price of $15.09.
Unused and Available Financing Resources
Cash on hand increased to $241.3 million at December 31, 2002 from $77.1 million at December 31, 2001. At December 31, 2002, the Company had credit facilities of $489.1 million, of which $401.5 million are unused and available. $336.4 million of the unused and available facilities represents the unused and available portion of the Company's $385 million three year revolving credit facility which expires September 27, 2004. The credit facility includes customary commercial terms and bears interest at variable rates not exceeding the prime rate of interest.
The credit facility contains negative and affirmative financial and operating convenants and events of default customary for credit facilities of this nature, including requirements that the Company maintain certain financial ratios and restrictions on its ability to incur or guarantee additional indebtedness or to dispose of assets as well as the right of the lenders to declare all outstanding indebtedness to be immediately due and payable upon the occurrence of an event of default. The primary purpose of the facility is to provide funding for general corporate purposes, including working capital and investments.
In addition to the above unused and available financing resources, the Company and certain of its North American subsidiaries sponsor a tooling finance program for tooling suppliers to finance tooling under construction. Under this program, the facility provider orders tooling from tooling suppliers and subsequently sells such tooling to the sponsor or its designee. The facility provider makes advances to tooling suppliers based on tool build milestones approved by the sponsor or its designee. On completion of the tooling, the facility provider sells the tooling to the sponsor or its designee for an amount equal to cumulative advances including carrying costs. In the event of tooling supplier default, the sponsor will purchase in progress tooling for an amount approximating cumulative advances. A number of Magna affiliated company's are also sponsors under this facility. The maximum facility amount is $100 million and is available to individual sponsors on an uncommitted demand basis subject to individual sponsor sub-limits. The Company's sub-limit is $100 million, subject to prior utilization of this facility by other Magna affiliated sponsors. As at December 31, 2002, $29.3 million compared to $15.0 million as at December 31, 2001, had been advanced to tooling suppliers under the Company's portion of this facility. These amounts are included in accounts payable on the Company's December 31, 2002 and 2001 consolidated balance sheets.
The Company typically receives a contract or production purchase order from an automobile manufacturer to produce a component, assembly, module or system for one or more vehicle model years. As part of these contracts, the Company may be required to absorb costs relating to product design and engineering and tooling costs and recover these costs by increasing the unit price of the related products. If estimated production volumes are not achieved, the Company may not fully recover these costs. In 2003, it is expected the Company will continue to incur increasing amounts of design and engineering and tooling costs, primarily related to newly awarded production contracts with production starting 2003 through to 2005.
Capital and investment spending for existing businesses and projects is expected to range between $140 million and $150 million for 2003. The majority of capital spending in 2003 relates to the award of new production contracts and includes spending for new machinery and equipment, new production facilities, maintenance improvements and planned efficiency enhancements. Management believes the Company is in a position to meet all of 2003 planned cash requirements from its cash balances on hand, existing credit facilities and cash provided from operations. A decrease in estimated vehicle production volumes or a change in customer or supplier payment terms could adversely impact cash provided from operating activities in 2003. Cash provided from operating activities totalled $315.5 million for 2002. Cash provided from operating activities totalled $167.0 million for 2001.
Off Balance Sheet Financing
The Company's off balance sheet financing arrangements are limited to operating lease contracts.
A number of the Company's facilities are subject to operating leases with Magna and with third parties. As at December 31, 2002, operating lease commitments for facilities are $28.5 million for 2003, including $12.2 million under lease arrangements with Magna. For 2007, operating lease commitments for facilities are $23.3 million, including $11.8 million under lease arrangements with Magna.
The Company also has operating lease commitments for equipment. These leases are generally for shorter duration. As at December 31, 2002, operating lease commitments for equipment are $10.2 million for 2003. For 2007, operating lease commitments for equipment are $0.4 million.
Although the Company's consolidated contractual annual lease commitments decline year by year, existing leases will either be renewed or replaced resulting in lease commitments being sustained at or increasing from current levels or the Company will incur capital expenditures to acquire equivalent capacity.
During the first quarter of 2002, a European subsidiary of the Company entered into an operating lease for vehicle production parts tooling. Payments on this lease commitment totalling approximately $13 million will be paid evenly over the next 4 years.
The following table summarizes certain of the Company's contractual obligations as at December 31, 2002:
| | Payments due by period
|
|---|
| | Total
| | Less than 1 year
| | 2 - 3 years
| | 4 - 5 years
| | After 5 years
|
|---|
| Bank indebtedness | | $ | 48.6 | | $ | 48.6 | | $ | — | | $ | — | | $ | — |
| Long-term debt | | | 12.8 | | | 3.0 | | | 4.8 | | | 3.7 | | | 1.3 |
| Capital leases | | | 36.5 | | | 3.0 | | | 6.6 | | | 6.6 | | | 20.3 |
| Operating leases | | | 258.0 | | | 38.7 | | | 64.6 | | | 49.9 | | | 104.8 |
Convertible Series
Preferred Shares* | | | 225.0 | | | — | | | 225.0 | | | — | | | — |
| | |
| |
| |
| |
| |
|
| | | $ | 580.9 | | $ | 93.3 | | $ | 301.0 | | $ | 60.2 | | $ | 126.4 |
| | |
| |
| |
| |
| |
|
- *
- These instruments are convertible into Intier Class A Subordinate Voting Shares at a fixed conversion price of $15.09.
Guarantees
The Company has guarantees to third parties that include future rent, utility costs, workers compensation claims under development, commitments linked to maintaining specific employment, customs duties and obligations linked to performance of specific vehicle programs. The amount of these guarantees are not individually or in aggregate significant.
Quantitative and Qualitative Disclosures About Market Risk
The Company operates globally and as such is exposed to diverse regional factors that could have an adverse impact on its financial condition and liquidity. Such factors include, but are not limited to, fluctuations in foreign exchange rates, interest rates and general economic conditions.
The Company's North American operations negotiate sales contracts with North American automobile manufacturers for payment in both U.S. and Canadian dollars. Materials and equipment are purchased in various currencies depending upon competitive factors, including relative currency values. The Company's North American operations, material, equipment and labour are paid for in both U.S. and Canadian dollars.
The Company's European operations negotiate sales contracts with European automobile manufacturers for payment principally in euros and British pounds. The Company's European operations' material, equipment and labour are paid for in the same currencies.
The Company's manufacturing facilities sometimes make commitments to sell product for which the selling price has been determined in currencies different from the currency required to pay for the necessary labour, materials and equipment to perform the sale contracts. These commitments represent contractual obligations by the Company to deliver product over the life of the related program, which normally spans a number of years. In order to manage the foreign currency exposure which results from these activities, when necessary, the Company employs hedging programs which consist largely of purchasing foreign exchange forward contracts. Anticipated production volumes, program costs and the timing of product delivery schedules each impact the amount and timing of the forward contracts. Despite these measures, significant long-term fluctuations in relative currency values could affect the Company's results of operations.
The Company has outstanding foreign exchange forward contracts representing commitments to buy and sell foreign currencies primarily in exchange for Canadian dollars. The table below provides information about the Company's significant derivative financial instruments by functional currency and presents that information in U.S. dollar and euro equivalents. The table summarizes information on instruments and transactions that are sensitive to foreign currency exchange rates, including foreign currency forward exchange agreements. The table presents the notional amounts and weighted average exchange rates by expected maturity or transaction dates. These notional amounts generally are used to calculate the contractual payments to be exchanged under the contract.
FORWARD EXCHANGE AGREEMENTS
(U.S. dollars in millions)
| | 2003
| | 2004
| | 2005
| | 2006
| | 2007
| | Total
| | Fair Value
| |
|---|
| Buy U.S. $/Pay Cdn.$ | | | | | | | | | | | | | | | |
| | Contract amount | | 108.7 | | 44.5 | | 13.1 | | — | | — | | 166.3 | | 6.4 | |
| | Weighted average exchange rate | | 1.5211 | | 1.5375 | | 1.5190 | | — | | — | | | | | |
| Sell U.S.$/Receive Cdn.$ | | | | | | | | | | | | | | | |
| | Contract amount | | 94.2 | | 88.4 | | 85.6 | | 16.1 | | — | | 284.3 | | (25.1 | ) |
| | Weighted average exchange rate | | 1.4556 | | 1.4769 | | 1.4717 | | 1.3862 | | — | | | | | |
| | |
| |
| |
| |
| |
| |
| |
| |
| (euros in millions) | | | | | | | | | | | | | | | |
| Buy euro/Pay Cdn.$ | | | | | | | | | | | | | | | |
| | Contract amount | | 8.3 | | 5.9 | | 2.9 | | — | | — | | 17.1 | | 4.0 | |
| | Weighted average exchange rate | | 1.3862 | | 1.3764 | | 1.4435 | | — | | — | | | | | |
| | |
| |
| |
| |
| |
| |
| |
| |
In addition to transactional foreign currency exposure, the Company's reported results will be impacted by fluctuations in relative currency values, particularly those of the Canadian dollar, the euro and the British pound, on translation of local operating results into the Company's reporting currency, the U.S. dollar.
Financial assets that are exposed to credit risk consist primarily of cash and cash equivalents, accounts receivable and forward exchange contracts. Cash and cash equivalents, which consist of short-term investments, including commercial paper, are only invested in governments and corporations with an investment grade credit rating. Credit risk is further reduced by limiting the amount that is invested in any one government or corporation. In the normal course of business, the Company is exposed to credit risk from its customers, substantially all of which are in the automotive industry. The Company is also exposed to credit risk from the potential default by any of its counterparties on the Company's foreign exchange forward contracts. The Company mitigates this credit risk by dealing with counterparties that are major financial institutions which it anticipates will satisfy their obligations under the contracts.
The Company is not exposed to significant interest rate risk due to the short-term maturity of its monetary current assets and current liabilities. The following table summarizes the Company's interest rate risk as at December 31, 2002:
| | Floating rate
| | Fixed interest rate
| | Non-interest bearing
| | Total
| |
|---|
| Financial Assets: | | | | | | | | | | | | | |
| | Cash and cash equivalents | | $ | 241.3 | | $ | — | | $ | — | | $ | 241.3 | |
| | Accounts receivable | | | — | | | — | | | 579.9 | | | 579.9 | |
| Financial liabilities: | | | | | | | | | | | | | |
| | Bank indebtedness | | | (48.6 | ) | | — | | | — | | | (48.6 | ) |
| | Accounts payable, indebtedness and all other accrued liabilities and payables | | | — | | | — | | | (782.5 | ) | | (782.5 | ) |
| | Long-term debt due within one year | | | — | | | (4.2 | ) | | — | | | (4.2 | ) |
| | Long-term debt | | | — | | | (31.8 | ) | | — | | | (31.8 | ) |
| | Convertible Series Preferred Shares | | | — | | | (206.2 | ) | | — | | | (206.2 | ) |
| | Other long-term liabilities | | | (25.6 | ) | | — | | | — | | | (25.6 | ) |
| | |
| |
| |
| |
| |
| | | $ | 167.1 | | $ | (242.2 | ) | $ | (202.6 | ) | $ | (277.7 | ) |
| | |
| |
| |
| |
| |
| Average fixed rate of long-term debt | | | | | | 5.0 | % | | | | | | |
| | |
| |
| |
| |
| |
TRANSACTIONS WITH RELATED PARTIES
The following table summarizes the Company's transactions with Magna and its affiliates:
| | Years ended December 31,
|
|---|
| | 2002
| | 2001
|
|---|
| Interest expense, net | | $ | 2.1 | | $ | 17.7 |
| Amortization of discount on Convertible Series Preferred Shares | | | 11.6 | | | 4.8 |
| Financing charge on Convertible Series Preferred Shares | | | 1.9 | | | 0.9 |
| Management and administrative services | | | 1.9 | | | 4.7 |
| Affiliation and social fees | | | 55.3 | | | 48.8 |
| Rent | | | 10.8 | | | 6.1 |
| Depreciation of assets under capital lease | | | 1.8 | | | 1.7 |
| Sales of materials to Magna and its affiliates | | | 13.9 | | | 13.7 |
| Purchase of materials from Magna and its affiliates | | | 22.8 | | | 28.6 |
During 2001, the Company entered into new or amended existing affiliation agreements with Magna that were effective January 1, 2001. The affiliation agreements provide for the payment by the Company to Magna of an affiliation fee. The affiliation agreements:
- •
- provide the Company with the right to identify itself as part of the Magna group of companies by granting the Company a non-exclusive, worldwide licence to use trademarks which identify Magna and its goods, services and activities in order to identify the Company and its goods, services and activities as being affiliated with Magna;
- •
- provide the Company with access to Magna's core operating principles and to new policies and programs adopted by Magna from time to time;
- •
- provide the Company with access to Magna's senior management and make available to the Company details of any new management techniques and incentive programs as well as marketing materials to the extent they are made available generally to Magna's other affiliates; and
- •
- grant the Company a sole and exclusive worldwide licence (except as described in the next sentence) to use the "Intier" tradename and certain other trademarks. The Company may not sublicense such tradename and trademarks other than to its subsidiaries.
Pursuant to the Company's affiliation agreements with Magna, the affiliation fees payable by the Company to Magna in respect of each fiscal year will be an aggregate amount equal to:
- •
- 1.5% of the first $3 billion of consolidated net sales for that year;
- •
- 1.0% of the next $3 billion of consolidated net sales for that year; and
- •
- 0.75% of consolidated net sales exceeding $6 billion.
Sales from acquired businesses will not be subject to a fee until January 1 of the year following the date of acquisition, and will be subject to a fee equal to 50% of the fee with respect to the Company's sales in the calendar year following the date of the acquisition, and to the full fee in the second calendar year following the date of the acquisition and thereafter.
The Company's Corporate Constitution also provides that a maximum of 2% of its pre-tax profits in each fiscal year shall be allocated to the promotion of social objectives. Of this maximum, the social commitment agreement the Company entered into with Magna during 2001, effective January 1, 2001, requires the Company to contribute 1.5% of its pre-tax profits in each fiscal year to social and charitable programs co-ordinated by Magna or other charitable or non-profit organizations on behalf of Magna and its affiliates, including Intier.
In addition, Magna provides certain management and administrative services to the Company, including legal, environmental, immigration, administrative, tax, internal audit, treasury, information systems and employee relations services, in return for a specific amount negotiated between the Company and Magna. Commencing January 1, 2002 the Company began reporting amounts paid to Magna for management and administrative services in SG&A. Affiliation and social fees continue to be shown separately in the consolidated statements of income. All comparative period amounts have been reclassified to conform with the current period presentation.
Affiliation and social commitment fees in prior years were calculated on a different basis than the 2002 and 2001 affiliation and social commitment fees and are therefore not comparable.
Various land and buildings used in the Company's operations are leased from Magna and its affiliates under operating and capital lease agreements (see note 11 in the consolidated financial statements).
Transactions with Magna and its affiliates are effected on normal commercial terms.
CONTINGENCIES
From time to time, the Company may be contingently liable for litigation and other claims. Refer to note 22 of the Company's consolidated financial statements.
ACCOUNTING CHANGES
In August 2001, the Canadian Institute of Chartered Accountants issued Handbook Section 3062 "Goodwill and Other Intangible Assets" ("CICA 3062"). CICA 3062 requires the application of the non-amortization and impairment rules for existing goodwill and intangible assets, which meet the criteria for indefinite life beginning with fiscal years starting after December 15, 2001. In all cases, the standard must be adopted at the beginning of a fiscal year. Effective January 1, 2002, the Company adopted these new recommendations prospectively without restatement of any comparable period (see "Other Charges" and "Depreciation and Amortization").
In January 2003, the CICA issued Handbook Section 3063 "Impairment of Long-Lived Assets" ("CICA 3063"). CICA 3063 requires an impairment loss to be recognized when the carrying value of an asset to be held and used exceeds the sum of the undiscounted cash flows expected from its use and eventual disposition. An impairment loss is measured as the amount by which the asset's carrying value exceeds its fair value. As permitted by CICA 3063, discounted cash flows are used to determine fair value. Previously, Canadian GAAP required that asset impairment be measured as the amount by which the asset's carrying value exceeded the undiscounted future cash flow from the use of the asset. In all cases, the standard must be adopted for fiscal years beginning April 1, 2003. The Company has elected to adopt these new recommendations early, effective January 1, 2002, prospectively without restatement of any prior period (see "Other Charges").
In November 2001, the CICA issued Handbook Section 3870 "Stock-Based Compensation and Other Stock-Based Payments" ("CICA 3870"). CICA 3870 requires that all stock-based awards granted to non-employees must be accounted for at fair value. The new standard also encourages but does not require the use of the fair value method for all stock-based compensation paid to employees. However, the fair value method does not have to be applied to option plans where the only choice is for the employee to pay the exercise price and obtain stock. The new standard only applies to awards granted after the adoption date. The Company has prospectively adopted CICA 3870 effective January 1, 2002 and has elected to continue accounting for employee stock options using the intrinsic value method. The adoption of CICA 3870 had no effect on the Company's reported earnings for the year ended December 31, 2002.
NEW ACCOUNTING PRONOUNCEMENTS
Canadian GAAP Standards
In December 2002, the CICA amended Handbook Section 3475, "Disposal of Long-Lived Assets and Discontinued Operations" ("CICA 3475"). CICA 3475 provides guidance on differentiating between assets held for sale and held for disposal other than by sale and on the presentation of discontinued operations. CICA 3475 applies to disposal activities initiated on or after May 1, 2003.
In December 2001, the CICA approved proposed amendments to Accounting Guideline, AcG-13, "Hedging Relationships" ("AcG-13"). The proposed amendments clarify certain of the requirements in AcG-13 and provide additional application guidance. The proposed amendments will be finalized in the first half of 2003 and will be applicable when AcG-13 becomes effective for fiscal years beginning on or after July 1, 2003.
Although the Company is currently reviewing CICA 3475 and AcG-13, the impact, if any, of these pronouncements on its consolidated financial statements has not been determined.
U.S. GAAP Standards
During 2001, the Financial Accounting Standards Board ("FASB") issued Statement of Financial Accounting Standards No. 143, "Accounting for Asset Retirement Obligations" ("FAS 143"). FAS 143 requires that legal obligations arising from the retirement of tangible long-lived assets, including obligations identified by a company upon acquisition and construction and during the operating life of a long-lived asset, be recorded and amortized over the asset's useful life using a systematic and rational allocation method. FAS 143 is effective for fiscal years beginning after June 15, 2002.
During 2002, FASB issued Statement of Financial Accounting Standards No. 146, "Accounting for Costs Associated with Exit or Disposal Activities" ("FAS 146"). FAS 146 requires that costs associated with an exit or disposal activity be recognized and measured at fair value in the period in which the liability is incurred. FAS 146 is effective for exit or disposal activities that are initiated after December 31, 2002.
In 2002, the FASB issued Interpretation No. 45, "Guarantor's Accounting and Disclosure Requirements for Guarantees, Including Indirect Guarantees of Indebtedness of Others" ("FIN 45"). FIN 45 requires certain guarantees to be recorded at fair value; previously a liability was only recorded when a loss under a guarantee was probable and reasonably estimable. The initial recognition and measurement provisions of FIN 45 are applicable on a prospective basis to guarantees issued or modified after December 31, 2002.
In January 2003, the FASB issued Interpretation No. 46, "Consolidation of Variable Interest Entities" ("FIN 46"). FIN 46 requires that a variable interest entity be consolidated by a company if that company is subject to a majority of the risk of loss from the variable interest entity's activities or entitled to receive a majority of the entity's residual returns or both. The consolidation requirements of FIN 46 apply immediately to variable interest entities created after January 31, 2003 and apply to existing variable interest entities in the first fiscal year or interim period beginning after June 15, 2003.
During 2002, the Emerging Issues Task Force ("EITF") issued EITF Abstract 00-21, "Accounting for Revenue Arrangements with Multiple Deliverables" ("EITF 00-21"). EITF 00-21 addresses how to account for arrangements that involve the delivery or performance of multiple products and services. EITF 00-21 is effective for agreements entered into in fiscal periods beginning after June 15, 2003.
Although the Company is currently reviewing FAS 143, FAS 146 and EITF 00-21 and the recognition and measurement requirements of FIN 45 and FIN 46, the impact, if any, of these pronouncements on its consolidated financial statements has not been determined.
FORWARD LOOKING STATEMENTS
The previous discussion contains statements which, to the extent that they are not recitations of historical facts, constitute "forward-looking statements" within the meaning of Section 21E of the Securities Exchange Act of 1934. The words "estimate", "anticipate", "believe", "expect", and similar expressions are intended to identify forward-looking statements. Such forward-looking information involves important risks and uncertainties, that could materially alter results in the future from those expressed in any forward-looking statements made by, or on behalf of the Company. These risks and uncertainties include, but are not limited to industry, cyclicality, trade costs, dependence on certain vehicles and major OEM customers, program launch delays, currency exposure, failure in implementing Company strategy, technological developments by the Company's competitors, government and regulatory policies and changes in the competitive environment in which the Company operates. Persons reading this report are cautioned that such statements are only predictions and that actual events or results may differ materially. In evaluating such forward-looking statements readers should specifically consider the various factors which could cause actual events or results to differ materially from those indicated by such forward-looking statements. The Company expressly disclaims any intention and undertakes no obligation to update or revise any forward-looking statements contained in this report to reflect subsequent information, events or circumstances or otherwise.
MANAGEMENT'S RESPONSIBILITY FOR FINANCIAL REPORTING
Intier Automotive Inc. management is responsible for the preparation and presentation of the consolidated financial statements and all the information in this Annual Report. The consolidated financial statements were prepared by management in accordance with accounting principles generally accepted in Canada. Financial statements include certain amounts based on estimates and judgements. Management has determined such amounts on a reasonable basis designed to ensure that the consolidated financial statements are presented fairly, in all material respects. Financial information presented elsewhere in this Annual Report has been prepared by management to ensure consistency with that in the consolidated financial statements. The consolidated financial statements have been reviewed by the Audit Committee and approved by the Board of Directors of Intier Automotive Inc.
Management is responsible for the development and maintenance of systems of internal accounting and administrative cost controls of high quality, consistent with reasonable cost. Such systems are designed to provide reasonable assurance that the financial information is accurate, relevant and reliable and that the Company's assets are appropriately accounted for and adequately safeguarded.
The Company's Audit Committee is appointed by its Board of Directors annually and is comprised solely of outside directors. The Committee meets periodically with management, as well as the independent auditors, to satisfy itself that each is properly discharging its responsibilities, to review the consolidated financial statements and the independent auditors' report and to discuss significant financial reporting issues and auditing matters. The Audit Committee reports its findings to the Board of Directors for consideration when approving the consolidated financial statements for issuance to the shareholders.
The consolidated financial statements have been audited by Ernst & Young LLP, the independent auditors, in accordance with auditing standards generally accepted in Canada and the United States on behalf of the shareholders. The Auditors' Report outlines the nature of their examination and their opinion to the consolidated financial statements of the Company. The independent auditors have full and unrestricted access to the Audit Committee.
Donald J. Walker
(Signature) | | Michael E. McCarthy
(Signature) |
DONALD J. WALKER
President and Chief Executive Officer |
|
MICHAEL E. MCCARTHY
Executive Vice-President and Chief Financial Officer |
Newmarket, Canada
February 13, 2003
AUDITORS' REPORT
To the Shareholders of Intier Automotive Inc.
We have audited the consolidated balance sheets of Intier Automotive Inc. as at December 31, 2002 and 2001 and the consolidated statements of income, retained earnings and Magna's net investment and cash flows for each of the years in the three-year period ended December 31, 2002. These financial statements are the responsibility of the Company's management. Our responsibility is to express an opinion on these financial statements based on our audits.
We conducted our audits in accordance with Canadian and United States generally accepted auditing standards. Those standards require that we plan and perform an audit to obtain reasonable assurance whether the financial statements are free of material misstatement. An audit includes examining, on a test basis, evidence supporting the amounts and disclosures in the financial statements. An audit also includes assessing the accounting principles used and significant estimates made by management, as well as evaluating the overall financial statement presentation.
In our opinion, these consolidated financial statements present fairly, in all material respects, the financial position of the Company as at December 31, 2002 and 2001 and the results of its operations and its cash flows for each of the years in the three-year period ended December 31, 2002 in accordance with Canadian generally accepted accounting principles.
The Company changed its method of accounting for goodwill and impairment of long-lived assets as described in note 2.

ERNST & YOUNG LLP
Chartered Accountants
Toronto, Canada
February 13, 2003
SIGNIFICANT ACCOUNTING POLICIES
BASIS OF PRESENTATION
The consolidated financial statements have been prepared in U.S. dollars following Canadian generally accepted accounting principles ("Canadian GAAP"). These policies are also in conformity, in all material respects, with United States generally accepted accounting principles ("U.S. GAAP") except as described in note 23 to the consolidated financial statements.
PRINCIPLES OF CONSOLIDATION
The comparative consolidated balance sheet as at December 31, 2001 gives effect to the corporate reorganization which was completed in August 2001 whereby Intier Automotive Inc. (the "Company") acquired from its parent company, Magna International Inc. ("Magna"), certain operating divisions, subsidiaries, jointly controlled entities and investments directly or indirectly under the control of Magna. In exchange for the above net assets, the Company issued 42,751,938 Class B Shares of the Company and 2,250,000 Convertible Series Preferred Shares to Magna.
The consolidated financial statements prior to August 1, 2001 present the historic combined results of operations and cash flows of the assets and liabilities reorganized under the Company on a carve out basis from Magna. To give effect to the continuity of Magna's interest in the assets and liabilities of the Company, all the assets and liabilities have been recorded in these consolidated financial statements at Magna's book values except for assets under capital leases related to the distribution of land and buildings by the Company to certain real estate subsidiaries of Magna during the year ended December 31, 1998.
The Company was formed to hold and operate the interiors and closures businesses owned by Magna and its subsidiaries. The assets and liabilities recognized under the Company include the following businesses:
Interior Systems
These businesses engineer, develop and produce complete seat systems, seat tracks, seat frames, integrated child safety seats and other seating components, cockpit modules, instrument panels, consoles, glove boxes, door modules, door trim panels, package trays, overhead systems, sun visors, acoustics, automotive carpet, interior panels and other interior garnish trim and components. This group also provides expertise and services for its OEM customers including assembly and sequencing, full vehicle process engineering and integrated interior vehicle safety systems.
Closure Systems
These businesses engineer, develop, produce and assemble a multitude of closure, latching and power driven door systems. Products include complete door systems, power liftgates and power sliding doors, window regulators, electronic latching systems, wiper systems and electrical motors.
The comparative information prior to August 1, 2001 reflects financial statements which present the consolidated financial position, results of operations, changes in Magna's net investment and cash flows of the Company as if it had operated as a stand-alone entity subject to Magna's control. Certain of the expenses presented in these consolidated financial statements represent intercompany allocations and management estimates of the cost of services provided by Magna. These allocations and estimates are considered by management to be the best available approximation of the expenses that the Company would have incurred had it operated on a stand-alone basis over the periods presented.
Interest expense, as presented in these consolidated financial statements, includes interest on external debt and amounts due to Magna (included in Magna's net investment). Magna's net investment, which includes both debt and equity components, comprises the accumulated earnings of the Company, contributions by Magna less distributions to Magna and the currency translation adjustment.
Income taxes for the Company in the comparative period prior to August 1, 2001 have been recorded at statutory rates based on income before income taxes and minority interest as reported in the consolidated statements of income as though the Company was a separate tax paying entity. Income taxes payable in respect of historically separate tax paying legal entities have been presented as a current liability in the consolidated balance sheets in the comparable period. Income taxes payable in respect of the components which were not historically separate tax paying legal entities have been included in Magna's net investment. Future income taxes have been presented in the consolidated balance sheets on the basis of temporary differences between the financial reporting and tax bases of the assets and liabilities of separate tax paying legal entities.
As a result of the basis of presentation described above, the comparative consolidated statements of income may not necessarily be indicative of the revenues and expenses that would have resulted had the Company operated as a stand-alone entity prior to August 1, 2001.
The Company's subsidiaries are included in these consolidated financial statements using the purchase method of accounting from the date they were acquired by Magna. All significant intercompany balances and transactions have been eliminated.
The Company proportionately consolidates its interests in jointly controlled operations.
FOREIGN EXCHANGE
Assets and liabilities of the Company's operations having a functional currency other than the U.S. dollar are translated into U.S. dollars using the exchange rate in effect at the year end and revenues and expenses are translated at the average rate during the year. Exchange gains or losses on translation of the Company's net equity investment in these operations are deferred as a separate component of shareholders' equity.
The appropriate amounts of exchange gains or losses accumulated in the separate component of shareholders' equity are reflected in income when there is a reduction in the Company's net investment in the operations that gave rise to such exchange gains and losses.
Foreign exchange gains and losses on transactions occurring in a currency other than an operation's functional currency are reflected in income except for gains and losses on foreign exchange contracts used to hedge specific future commitments in foreign currencies. Gains and losses on these contracts are accounted for as a component of the related hedged transaction. In addition, gains and losses from foreign denominated debt designated as a hedge on the Company's net investments in foreign operations are not included in income, but are shown in the currency translation account.
USE OF ESTIMATES
The preparation of the consolidated financial statements in conformity with generally accepted accounting principles requires management to make estimates and assumptions that affect the amounts reported in the consolidated financial statements and accompanying notes. Actual results could differ from those estimates.
CASH AND CASH EQUIVALENTS
Cash and cash equivalents include cash on account, demand deposits and short-term investments with remaining maturities of less than three months at acquisition.
INVENTORIES
Inventories are valued at the lower of cost and net realizable value, with cost being determined substantially on a first-in, first-out basis. Cost includes the cost of materials plus direct labour applied to the product and the applicable share of manufacturing overhead.
INVESTMENTS
Investments in which the Company has significant influence are accounted for on the equity basis.
FIXED ASSETS
Fixed assets are recorded at historical cost, which includes acquisition and development costs less related investment tax credits. Development costs include direct construction costs, interest capitalized on construction in progress and land under development and indirect costs wholly attributable to development.
Depreciation is provided on a straight-line basis over the estimated useful lives of fixed assets at annual rates of 21/2% to 5% for buildings, 7% to 10% for general purpose equipment and 10% to 30% for special purpose equipment. Assets under capital leases are amortized over the respective lease terms.
Costs incurred to establish new facilities, which require substantial time to reach commercial production capability, are expensed as incurred.
IMPAIRMENT OF LONG-LIVED ASSETS
The Company evaluates long-lived assets for impairment whenever indicators of impairment exist. Indicators of impairment include prolonged operating losses or a decision to cease or dispose of, or otherwise change the use of, an existing long-lived asset or goodwill impairment.
If the sum of the future cash flows expected to result from the asset, undiscounted and without interest charges, is less than the reported value of the asset, an asset impairment must be recognized in the financial statements. The amount of impairment to be recognized is calculated by subtracting the fair value of the asset from the reported value of the asset. Discounted cash flows are used to measure fair value.
GOODWILL
Goodwill represents the excess of the purchase price of the Company's interest in subsidiary companies over the fair value of the underlying net identifiable assets arising on acquisitions. The Company reviews the valuation of goodwill on an annual basis. In doing so, the Company evaluates whether there has been an impairment in the value of goodwill based on a comparison of the fair value of the reporting unit to the underlying carrying value of the reporting unit's net assets, including goodwill. Discounted future cash flows are used to determine the fair value of the reporting unit.
REVENUE RECOGNITION
Revenue from the sale of manufactured products is recognized when the price is fixed or determinable, collectibility is reasonably assured and upon shipment to (or receipt by customers depending on contractual terms), and acceptance by, customers.
Revenue from separately priced engineering service and tooling contracts are recognized on a percentage of completion basis.
Revenue and cost of sales are presented on a gross basis in the consolidated statements of income where the Company is acting as principal and is subject to significant risks and rewards in connection with the process of bringing the product to its final state and in the post sale dealings with its customers. Otherwise, components of revenues and related costs are presented on a net basis.
PREPRODUCTION COSTS RELATED TO LONG-TERM SUPPLY AGREEMENTS
Costs incurred (net of customer subsidies) related to design and engineering, which are reimbursed as part of subsequent related parts production piece price amounts, are expensed as incurred unless a contractual guarantee for reimbursement exists.
Costs incurred (net of customer subsidies) related to design and development costs for moulds, dies and other tools that the Company does not own (and that will be used in, and reimbursed as part of the piece price amounts for subsequent related parts production) are expensed as incurred unless the supply agreement provides a contractual guarantee for reimbursement or the non-cancellable right to use the moulds, dies and other tools during the supply agreement.
GOVERNMENT FINANCING
The Company makes periodic applications for financial assistance under available government assistance programs in the various jurisdictions in which the Company operates. Grants relating to capital expenditures are reflected as a reduction of the cost of the related assets. Grants and tax credits relating to current operating expenditures are generally recorded as a reduction of expense at the time the eligible expenses are incurred. In the case of certain foreign subsidiaries, the Company receives tax super allowances which are accounted for as a reduction of income tax expense. The Company also receives loans which are recorded as liabilities in amounts equal to the cash received.
RESEARCH AND DEVELOPMENT
The Company carries on various applied research and development programs, certain of which are financially assisted by governments or by customers of the Company. Funding received is accounted for using the cost reduction approach. Research costs are expensed as incurred.
INCOME TAXES
The Company follows the liability method of tax allocation for accounting for income taxes. Under the liability method of tax allocation, future tax assets and liabilities are determined based on differences between the financial reporting carrying value and the tax cost bases of assets and liabilities and are measured using the substantively enacted tax rates and laws that will be in effect when the differences are expected to reverse.
EMPLOYEE BENEFIT PLANS
The Company accrues its obligations under employee benefit plans and the related costs, net of plan assets. The cost of pensions and other retirement benefits earned by employees is actuarially determined using the projected benefit method pro rated on service and management's best estimate of expected plan investment performance, salary escalation, retirement ages of employees and expected health care costs. For the purposes of calculating the expected return on plan assets, those assets are valued at fair value. Past service costs from plan amendments are amortized on a straight-line basis over the average remaining service period of employees active at the date of amendment. The net actuarial gain (loss) is amortized over the average remaining service period of active employees.
The cost of providing benefits through defined contribution pension plans is charged to earnings in the period in respect of which contributions become payable.
STOCK-BASED COMPENSATION
No compensation expense is recognized for stock options granted to employees under the Company's Incentive Stock Option Plan as they are accounted for using the intrinsic value method. Stock options granted to non-employees under the Company's Incentive Stock Option Plan, are accounted for under the fair value method and are expensed as the options vest. Consideration received on the exercise of stock options is credited to capital stock. The dilutive impact of stock option grants is factored into the Company's diluted reported earnings per share.
EARNINGS PER CLASS A SUBORDINATE VOTING OR CLASS B SHARE
Basic earnings per Class A Subordinate Voting or Class B Share are calculated on net income less financing charges on the Convertible Series Preferred Shares using the weighted average number of Class A Subordinate Voting and Class B Shares outstanding during the year.
The Company uses the treasury stock method in computing diluted earnings per share. Under the treasury stock method, diluted earnings per Class A Subordinate Voting or Class B Share are calculated on the weighted average number of Class A Subordinate Voting and Class B Shares that would have been outstanding during the year had all the dilutive options and Convertible Series Preferred Shares been exercised or converted into Class A Subordinate Voting Shares at the beginning of the year, or date of issuance, if later. The proceeds from the exercise of options are assumed to be used to purchase Class A Subordinate Voting Shares at the average market price during the period. The incremental shares (the difference between the number of shares assumed issued and the number of shares assumed purchased) are included in the denominator of the diluted earnings per share computation.
CONVERTIBLE SERIES PREFERRED SHARES
For the purposes of accounting for the Convertible Series Preferred Shares, three key attributes of these shares were valued as of their date of issuance and are presented separately in the Company's consolidated financial statements. These three key attributes are:
- i)
- The retraction of the Convertible Series Preferred Shares at their carrying value by the holders;
- ii)
- The non-cumulative cash dividend payable in respect of the Convertible Series Preferred Shares; and
- iii)
- The ability to convert the Convertible Series Preferred Shares into Class A Subordinate Voting Shares at a fixed price.
The retraction attribute is a liability of the Company and is presented as long-term debt because it is at the option of the holder. The non-cumulative nature of the dividend means that it is dissimilar to an interest payment on debt and, therefore, the long-term debt is presented as the net present value of (i.e., at a discount to) the carrying value which becomes payable, at the option of the holder, on the retraction dates. The resultant discount is amortized to income systematically from the date of issuance until the date of retraction for each series of the Convertible Series Preferred Shares.
The non-cumulative dividend, for reasons indicated above, is not considered debt-related. However, because holders of the Convertible Series Preferred Shares expect to receive dividends and it was the Company's expectation, at the date of issuance, to pay dividends, there is a value to the expected stream of dividend payments. The net present value of this expected dividend stream has, therefore, been presented as equity. As dividends are declared, a systematically calculated portion of the dividend is shown as a return of capital and is deducted from the amount presented as equity. The dividends on the Convertible Series Preferred Shares as presented in the consolidated statements of income and retained earnings and Magna's net investment reflect the actual dividend declared net of the amount considered a return on capital.
The third attribute, the conversion feature, is similar to a stock warrant in that it provides holders with the option to exchange their Convertible Series Preferred Shares for Class A Subordinate Voting Shares at a fixed price. The residual approach was used to value this attribute and this amount is classified as equity.
COMPARATIVE FIGURES
Certain of the prior year's figures have been reclassified to conform to the current year's presentation.
CONSOLIDATED BALANCE SHEETS
| |
| | As at December 31,
| |
|---|
(U.S. dollars in millions)
| | Note
| | 2002
| | 2001
| |
|---|
| Assets | | | | | | | | | |
| Current assets: | | | | | | | | | |
| | Cash and cash equivalents | | | | $ | 241.3 | | $ | 77.1 | |
| | Accounts receivable | | 21 | | | 579.9 | | | 574.3 | |
| | Inventories | | 7 | | | 261.7 | | | 240.9 | |
| | Prepaid expenses and other | | | | | 27.8 | | | 23.6 | |
| | Income taxes receivable | | 10 | | | 5.5 | | | — | |
| | | | |
| |
| |
| | | | | | 1,116.2 | | | 915.9 | |
| | | | |
| |
| |
Fixed assets,net |
|
8, 9 |
|
|
478.1 |
|
|
424.0 |
|
| | | | |
| |
| |
| Goodwill | | 9 | | | 100.7 | | | 132.5 | |
| | | | |
| |
| |
| Future tax assets | | 10 | | | 75.5 | | | 96.0 | |
| | | | |
| |
| |
| Other assets | | 6 | | | 11.3 | | | 11.0 | |
| | | | |
| |
| |
| | | | | $ | 1,781.8 | | $ | 1,579.4 | |
| | | | |
| |
| |
Liabilities and Shareholders' Equity |
|
|
|
|
|
|
|
|
|
Current liabilities: |
|
|
|
|
|
|
|
|
|
| | Bank indebtedness | | 11 | | $ | 48.6 | | $ | 46.0 | |
| | Accounts payable | | 21 | | | 658.0 | | | 527.6 | |
| | Accrued salaries and wages | | | | | 74.3 | | | 53.7 | |
| | Other accrued liabilities | | 5 | | | 50.2 | | | 49.6 | |
| | Income taxes payable | | 10 | | | — | | | 1.8 | |
| | Long-term debt due within one year | | 11 | | | 4.2 | | | 6.8 | |
| | | | |
| |
| |
| | | | | | 835.3 | | | 685.5 | |
| | | | |
| |
| |
Long-term debt |
|
11, 21 |
|
|
31.8 |
|
|
30.6 |
|
| | | | |
| |
| |
| Other long-term liabilities | | 12 | | | 25.6 | | | 22.1 | |
| | | | |
| |
| |
| Convertible Series Preferred Shares | | 13 | | | 206.2 | | | 194.6 | |
| | | | |
| |
| |
| Future tax liabilities | | 10 | | | 38.0 | | | 35.0 | |
| | | | |
| |
| |
| Minority interest | | | | | 0.9 | | | 1.7 | |
| | | | |
| |
| |
Shareholders'equity: |
|
|
|
|
|
|
|
|
|
| | Convertible Series Preferred Shares | | 13 | | | 22.0 | | | 31.4 | |
| | Class A Subordinate Voting Shares | | 14 | | | 71.8 | | | 71.7 | |
| | Class B Shares | | 14 | | | 495.8 | | | 495.8 | |
| | Retained earnings | | | | | 17.2 | | | 15.9 | |
| | Currency translation adjustment | | 17 | | | 37.2 | | | (4.9 | ) |
| | | | |
| |
| |
| | | | | | 644.0 | | | 609.9 | |
| | | | |
| |
| |
| | | | | $ | 1,781.8 | | $ | 1,579.4 | |
| | | | |
| |
| |
Commitments and contingencies (notes 11 and 22)
The accompanying notes are an integral part of these consolidated financial statements.
| On behalf of the Board: | | |
Lawrence Worrall |
|
Neil G. Davis |
| (Signature) | | (Signature) |
LAWRENCE WORRALL
Director | | NEIL G. DAVIS
Director |
CONSOLIDATED STATEMENTS OF INCOME, RETAINED EARNINGS AND MAGNA'S NET INVESTMENT
| |
| | Years ended December 31,
| |
|---|
(U.S. dollars in millions, except per share figures and numbers of shares)
| | Note
| | 2002
| | 2001
| | 2000
| |
|---|
| Sales | | 21 | | $ | 3,861.6 | | $ | 3,268.1 | | $ | 2,970.9 | |
| Cost of goods sold | | 21 | | | 3,374.9 | | | 2,861.6 | | | 2,605.5 | |
| Depreciation and amortization | | 9 | | | 88.5 | | | 88.0 | | | 86.1 | |
| Selling, general and administrative | | | | | 197.6 | | | 168.1 | | | 156.0 | |
| Affiliation and social fees | | 21 | | | 55.3 | | | 48.8 | | | 29.8 | |
| Other charges | | 9 | | | 23.6 | | | — | | | — | |
| | | | |
| |
| |
| |
| Operating income | | | | | 121.7 | | | 101.6 | | | 93.5 | |
| Interest (income) expense, net | | 11, 21 | | | (1.5 | ) | | 16.2 | | | 27.4 | |
| Amortization of discount on Convertible Series Preferred Shares | | 13, 21 | | | 11.6 | | | 4.8 | | | — | |
| Equity (income) loss | | 6 | | | (0.6 | ) | | 0.4 | | | 0.7 | |
| Income before income taxes and minority interest | | | | | 112.2 | | | 80.2 | | | 65.4 | |
| Income taxes | | 10 | | | 64.5 | | | 40.7 | | | 30.9 | |
| Minority interest | | | | | (0.9 | ) | | (0.4 | ) | | (0.2 | ) |
| | | | |
| |
| |
| |
| Net income | | | | $ | 48.6 | | $ | 39.9 | | $ | 34.7 | |
| | | | |
| |
| |
| |
| Financing charge on Convertible Series Preferred Shares | | 13, 21 | | | 1.9 | | | 0.9 | | | — | |
| | | | |
| |
| |
| |
| Net income attributable to Class A Subordinate Voting and Class B Shares | | | | | 46.7 | | | 39.0 | | | 34.7 | |
| Retained earnings and Magna's net investment, beginning of year | | | | | 15.9 | | | 850.2 | | | 781.8 | |
| Adjustment for change in accounting policy for goodwill | | 9 | | | (35.7 | ) | | — | | | — | |
| Net (distribution to) contribution by Magna | | | | | — | | | (869.5 | ) | | 46.6 | |
| Dividends on Class A Subordinate Voting and Class B Shares | | | | | (9.7 | ) | | (2.0 | ) | | — | |
| Change in currency translation adjustment | | 17 | | | — | | | (1.8 | ) | | (12.9 | ) |
| | | | |
| |
| |
| |
| Retained earnings and Magna's net investment, end of year | | | | $ | 17.2 | | $ | 15.9 | | $ | 850.2 | |
| | | | |
| |
| |
| |
| Earnings per Class A Subordinate Voting or Class B Share | | 3 | | | | | | | | | | |
| | Basic | | | | $ | 0.97 | | $ | 0.37 | | | — | |
| | Diluted | | | | $ | 0.95 | | $ | 0.37 | | | — | |
Average number of Class A Subordinate Voting and
Class B Shares outstanding (in millions) | | 3 | | | | | | | | | | |
| | Basic | | | | | 48.2 | | | 47.9 | | | — | |
| | Diluted | | | | | 63.6 | | | 47.9 | | | — | |
| | | | |
| |
| |
| |
| Pro forma earnings per Class A Subordinate Voting or Class B Share | | 4 | | | | | | | | | | |
| | Basic | | | | | — | | $ | 0.91 | | $ | 0.60 | |
| | Diluted | | | | | — | | $ | 0.90 | | $ | 0.60 | |
Average number of Class A Subordinate Voting and
Class B Shares outstanding (in millions) | | 4 | | | | | | | | | | |
| | Basic | | | | | — | | | 44.9 | | | 42.8 | |
| | Diluted | | | | | — | | | 59.8 | | | 42.8 | |
| | | | |
| |
| |
| |
The accompanying notes are an integral part of these consolidated financial statements.
CONSOLIDATED STATEMENTS OF CASH FLOWS
| |
| | Years ended December 31,
| |
|---|
(U.S. dollars in millions)
| | Note
| | 2002
| | 2001
| | 2000
| |
|---|
| Cash provided from (used for): | | | | | | | | | | | | |
| Operating Activities: | | | | | | | | | | | | |
| Net income | | | | $ | 48.6 | | $ | 39.9 | | $ | 34.7 | |
| Items not involving current cash flows | | 19 | | | 155.5 | | | 101.2 | | | 69.0 | |
| | | | |
| |
| |
| |
| | | | | | 204.1 | | | 141.1 | | | 103.7 | |
| Change in non-cash working capital | | 19 | | | 111.4 | | | 25.9 | | | (132.4 | ) |
| | | | |
| |
| |
| |
| | | | | | 315.5 | | | 167.0 | | | (28.7 | ) |
| | | | |
| |
| |
| |
| Investment Activities: | | | | | | | | | | | | |
| Fixed asset additions | | | | | (136.8 | ) | | (87.6 | ) | | (104.3 | ) |
| Increase in investments and other assets | | | | | (3.1 | ) | | (5.0 | ) | | — | |
| Proceeds from disposition of fixed assets | | | | | 4.8 | | | 2.6 | | | 3.8 | |
| | | | |
| |
| |
| |
| | | | | | (135.1 | ) | | (90.0 | ) | | (100.5 | ) |
| | | | |
| |
| |
| |
| Financing Activities: | | | | | | | | | | | | |
| Increase (decrease) in bank indebtedness | | | | | 0.6 | | | 34.5 | | | (2.5 | ) |
| Repayments of long-term debt | | | | | (4.6 | ) | | (8.1 | ) | | (1.8 | ) |
| Net (distribution to) contribution by Magna | | 21 | | | — | | | (144.4 | ) | | 79.5 | |
| Issue of Class A Subordinate Voting Shares, net | | 14 | | | 0.1 | | | 71.7 | | | — | |
| Dividends on Class A Subordinate Voting and Class B Shares | | 14 | | | (9.7 | ) | | (2.0 | ) | | — | |
| Dividends on Convertible Series Preferred Shares | | 13, 14 | | | (8.4 | ) | | (1.9 | ) | | — | |
| | | | |
| |
| |
| |
| | | | | | (22.0 | ) | | (50.2 | ) | | 75.2 | |
| | | | |
| |
| |
| |
| Effect of exchange rate changes on cash and cash equivalents | | | | | 5.8 | | | (1.3 | ) | | (1.9 | ) |
| | | | |
| |
| |
| |
| Net increase (decrease) in cash and cash equivalents during the year | | | | | 164.2 | | | 25.5 | | | (55.9 | ) |
| Cash and cash equivalents, beginning of year | | | | | 77.1 | | | 51.6 | | | 107.5 | |
| | | | |
| |
| |
| |
| Cash and cash equivalents, end of year | | | | $ | 241.3 | | $ | 77.1 | | $ | 51.6 | |
| | | | |
| |
| |
| |
The accompanying notes are an integral part of these consolidated financial statements.
NOTES TO CONSOLIDATED FINANCIAL STATEMENTS
(All amounts in U.S. dollars unless otherwise noted and all tabular amounts in millions, except per share figures and number of shares.)
1. SIGNIFICANT ACCOUNTING POLICIES
The significant accounting policies followed by the Company are set out under "Significant Accounting Policies" preceding these consolidated financial statements.
2. ACCOUNTING CHANGES
Goodwill
In August 2001, the Canadian Institute of Chartered Accountants issued Handbook Section 3062 "Goodwill and Other Intangible Assets" ("CICA 3062"). CICA 3062 requires the application of the non-amortization and impairment rules for existing goodwill and intangible assets, which meet the criteria for indefinite life beginning with fiscal years starting after December 15, 2001. In all cases, the standard must be adopted at the beginning of a fiscal year. Effective January 1, 2002, the Company adopted these new recommendations prospectively without restatement of any comparable period (see note 9).
Stock-Based Compensation
In November 2001, the CICA issued Handbook Section 3870 "Stock-Based Compensation and Other Stock-Based Payments" ("CICA 3870"). CICA 3870 requires that all stock-based awards granted to non-employees must be accounted for at fair value. The new standard also encourages but does not require the use of the fair value method for all stock-based compensation paid to employees. However, the fair value method does not have to be applied to options plans where the only choice is for the employee to pay the exercise price and obtain stock. The new standard only applies to awards granted after the adoption date. The Company has prospectively adopted CICA 3870 effective January 1, 2002 and has elected to continue accounting for employee stock options using the intrinsic value method. The adoption of CICA 3870 had no effect on the Company's reported earnings for the year ended December 31, 2002 (see note 15).
Impairment of Long-Lived Assets
In January 2003, the CICA issued Handbook Section 3063 "Impairment of Long-Lived Assets" ("CICA 3063"). CICA 3063 requires an impairment loss to be recognized when the carrying amount of an asset to be held and used exceeds the sum of the undiscounted cash flows expected from its use and eventual disposition. An impairment loss is measured as the amount by which the asset's carrying amount exceeds its fair value. As permitted by CICA 3063, discounted cash flows are used to determine fair value. Previously, Canadian GAAP required that asset impairment be measured as the amount by which the asset's carrying value exceeded the undiscounted future cash flow from the use of the asset. In all cases, the standard must be adopted for fiscal years beginning April 1, 2003. The Company has elected to adopt these new recommendations early, effective January 1, 2002, prospectively without restatement of any prior period (see note 9).
3. EARNINGS PER SHARE AND RETAINED EARNINGS FOR THE YEARS ENDED DECEMBER 31, 2002 AND 2001.
As a result of the reorganization of the Company, as described under "Principles of Consolidation in Significant Accounting Policies", earnings per share and retained earnings for the year ended December 31, 2001 include net income for the five-month period subsequent to July 31, 2001.
The following table summarizes the calculation of earnings per share for the year ended December 31, 2002, and for the five-month period ended December 31, 2001:
| | Years ended December 31,
|
|---|
| | 2002
| | 2001
|
|---|
| Basic earnings per Class A Subordinate Voting or Class B Share: | | | | | | |
| Net income attributable to Class A Subordinate Voting and Class B Shares | | $ | 46.7 | | $ | 17.9 |
| | |
| |
|
| Average number of Class A Subordinate Voting and Class B Shares outstanding during the period | | | 48.2 | | | 47.9 |
| | |
| |
|
| Basic earnings per Class A Subordinate Voting or Class B Share | | $ | 0.97 | | $ | 0.37 |
| | |
| |
|
| Diluted earnings per Class A Subordinate Voting or Class B Share: | | | | | | |
| Net income attributable to Class A Subordinate Voting and Class B Shares | | $ | 46.7 | | $ | 17.9 |
| | |
| |
|
| Adjustments (net of related tax effects): | | | | | | |
| Amortization of discount on Convertible Series Preferred Shares | | | 11.6 | | | — |
| Financing charge on Convertible Series Preferred Shares | | | 1.9 | | | — |
| | |
| |
|
| | | $ | 60.2 | | $ | 17.9 |
| | |
| |
|
| Average number of Class A Subordinate Voting and Class B Shares outstanding during the period | | | 48.2 | | | 47.9 |
| Convertible Series Preferred Shares | | | 14.9 | | | — |
| Stock options | | | 0.5 | | | — |
| | |
| |
|
| | | | 63.6 | | | 47.9 |
| | |
| |
|
| Diluted earnings per Class A Subordinate Voting or Class B Share | | $ | 0.95 | | $ | 0.37 |
| | |
| |
|
At December 31, 2001, the Company had outstanding 2,525,000 incentive stock options and 2,250,000 Convertible Series Preferred Shares, which are anti-dilutive and, therefore, not included in the December 31, 2001 earnings per share calculation above.
4. PRO FORMA EARNINGS PER SHARE
The following pro forma adjustments have been made to arrive at pro forma earnings per share for the years ended December 31, 2001 and 2000:
- •
- Adjustments to reflect the Company's new capital structure as described under Principles of Consolidation in Significant Accounting Policies;
- •
- Adjustments that give effect to the payment of revised affiliation fees and social commitment fees pursuant to the affiliation and social commitment agreements;
- •
- The Company's President and Chief Executive Officer's cash compensation arrangements; and
- •
- The tax effect of the foregoing adjustments, where applicable, using an assumed income tax rate of approximately 40%.
Basic and diluted pro forma earnings per Class A Subordinate Voting or Class B Share are based on the public offering of 5,476,191 Class A Subordinate Voting Shares completed in August 2001 and on the assumption that 42,751,938 Class B Shares and 2,250,000 Convertible Series Preferred Shares were issued and outstanding for the entire periods presented.
The following table summarizes the calculation of pro forma earnings per share:
| | Years ended December 31,
| |
|---|
| | 2001
| | 2000
| |
|---|
| Pro forma basic earnings per Class A Subordinate Voting or Class B Share: | | | | | | | |
| Net income attributable to Class A Subordinate Voting and Class B Shares | | $ | 39.0 | | $ | 34.7 | |
| Pro forma adjustments (net of related tax effects): | | | | | | | |
| | Amortization of discount on Convertible Series Preferred Shares | | | (6.1 | ) | | (11.0 | ) |
| | Interest on debt due to Magna | | | 9.5 | | | 16.4 | |
| | Net adjustment to affiliation fees and other corporate charges | | | (0.6 | ) | | (12.2 | ) |
| | Financing charge on Convertible Series Preferred Shares | | | (0.8 | ) | | (2.1 | ) |
| | |
| |
| |
| Pro forma net income attributable to Class A Subordinate Voting and Class B Shares | | $ | 41.0 | | $ | 25.8 | |
| | |
| |
| |
| Average number of Class A Subordinate Voting and Class B Shares outstanding during the year | | | 44.9 | | | 42.8 | |
| | |
| |
| |
| Pro forma basic earnings per Class A Subordinate Voting or Class B Share | | $ | 0.91 | | $ | 0.60 | |
| | |
| |
| |
| Pro forma diluted earnings per Class A Subordinate Voting or Class B Share: | | | | | | | |
| Pro forma net income attributable to Class A Subordinate Voting and Class B Shares | | $ | 41.0 | | $ | 25.8 | |
| Pro forma adjustments (net of related tax effects): | | | | | | | |
| | Amortization of discount on Convertible Series Preferred Shares | | | 10.9 | | | — | |
| | Financing charge on Convertible Series Preferred Shares | | | 1.7 | | | — | |
| | |
| |
| |
| | | $ | 53.6 | | $ | 25.8 | |
| | |
| |
| |
| Average number of Class A Subordinate Voting and Class B Shares outstanding during the year | | | 44.9 | | | 42.8 | |
| Convertible Series Preferred Shares | | | 14.9 | | | — | |
| Stock options | | | — | | | — | |
| | |
| |
| |
| | | | 59.8 | | | 42.8 | |
| | |
| |
| |
| Pro forma diluted earnings per Class A Subordinate | | | | | | | |
| Voting or Class B Share | | $ | 0.90 | | $ | 0.60 | |
| | |
| |
| |
5. RESTRUCTURING PROVISIONS
At December 31, 2002, the Company had a remaining provision of $1.1 million for severance and termination costs for the termination of 72 remaining employees as part of the relocation of production programs from one facility to another. During the years ended December 31, 2002, 2001 and 2000, the Company utilized severance and termination accruals of $0.9 million, $0.6 million and $0.3 million, respectively. Such amounts were included in the purchase price allocation of previous business acquisitions.
During fiscal 2001, the Company recorded a restructuring charge for $2.7 million relating to the downsizing of one of the Company's under-performing divisions. During fiscal 2002, the Company recorded a further $2.8 million restructuring charge relating to the downsizing of the same under-performing division. At December 31, 2002, the Company had a remaining provision of $3.1 million for severance, termination and premise costs for the termination of 62 remaining employees and the relocation of production programs from one facility to another.
6. EQUITY INVESTMENTS
The Company entered into an operating agreement on August 1, 2002 with Rush Group L.L.C. ("Rush") and Dakkota Integrated Systems, L.L.C. ("DIS"), whereby the Company and Rush each have a membership interest in DIS. The Company's interest in DIS is 45%. DIS is accounted for on an equity basis. DIS is responsible for providing sequencing, logistics management and assembly services previously provided directly by the Company with respect to interior products, modules and related components to OEMs for several OEM programs under which the Company is manufacturing and supplying the interior products.
7. INVENTORIES
Inventories consist of:
| | December 31,
|
|---|
| | 2002
| | 2001
|
|---|
| Raw materials and supplies | | $ | 74.6 | | $ | 63.1 |
| Work-in-process | | | 23.5 | | | 17.0 |
| Finished goods | | | 25.6 | | | 23.4 |
| Tooling and engineering | | | 138.0 | | | 137.4 |
| | |
| |
|
| | | $ | 261.7 | | $ | 240.9 |
| | |
| |
|
Tooling and engineering inventory represents cost incurred on separately priced tooling and engineering services contracts in excess of unbilled amounts included in accounts receivable. Unbilled amounts included in accounts receivable at December 31, 2002 totalled $18.3 million (December 31, 2001—$1.5 million).
8. FIXED ASSETS
Fixed assets consist of:
| | December 31,
| |
|---|
| | 2002
| | 2001
| |
|---|
| Cost | | | | | | | |
| | Land | | $ | 9.0 | | $ | 8.3 | |
| | Buildings | | | 44.9 | | | 38.4 | |
| | Leasehold improvements | | | 24.5 | | | 20.6 | |
| | Machinery and equipment | | | 800.7 | | | 717.1 | |
| | Assets under capital leases (i) | | | 25.7 | | | 25.6 | |
| | |
| |
| |
| | | $ | 904.8 | | $ | 810.0 | |
| | |
| |
| |
| Less: accumulated depreciation | | | | | | | |
| | Buildings | | | (10.9 | ) | | (10.3 | ) |
| | Leasehold improvements | | | (11.6 | ) | | (10.5 | ) |
| | Machinery and equipment | | | (396.7 | ) | | (359.5 | ) |
| | Assets under capital leases (i) | | | (7.5 | ) | | (5.7 | ) |
| | |
| |
| |
| | | $ | 478.1 | | $ | 424.0 | |
| | |
| |
| |
Notes:
- (i)
- Assets under capital leases relate to the leasing of land and buildings by the Company from certain real estate subsidiaries of Magna. These lease agreements were entered into during the year ended December 31, 1998 (see note 11(f)).
- (ii)
- Included in the cost of fixed assets at December 31, 2002 are construction in progress expenditures of $45.3 million (December 31, 2001—$26.8 million).
- (iii)
- No interest was capitalized to fixed assets during the periods presented.
- (iv)
- Fixed assets at December 31, 2002 include a net reduction in the cost and accumulated depreciation of $20.1 million due to an impairment charge relating to one reporting unit in the Company's Interiors Europe reporting segment (see note 9).
9. GOODWILL AND LONG-LIVED ASSET IMPAIRMENT
In accordance with the new recommendations of the CICA, the Company completed a goodwill impairment test as at January 1, 2002, the adoption date under CICA 3062, and determined that unamortized goodwill of $27.6 million, $5.6 million and $2.5 million relating to reporting units in the Interiors Europe, Closures Europe, and Interiors North America reporting segments, respectively were impaired under the new rules.The impairment loss of $35.7 million net of a nil tax recovery, has been recorded as a change in accounting policy by a charge to opening retained earnings as of January 1, 2002.
Prior to CICA 3062 coming into effect, goodwill impairment under Canadian GAAP was assessed based on estimated future undiscounted cash flows for the business to which the goodwill relates. Under CICA 3062, goodwill impairment is assessed based on a comparison of the fair value of the reporting unit to the underlying carrying value of the reporting unit's net assets, including goodwill. As recommended by the CICA 3062 accounting standard, discounted future cash flows were used to determine the fair value of the reporting unit. Under CICA 3062, after adoption of new recommendations, goodwill must be assessed for impairment on an annual basis, and any write-down would be charged against earnings. The Company completed its annual goodwill impairment test as at December 31, 2002 and determined that unamortized goodwill of $3.5 million relating to one reporting unit in its Interiors Europe reporting segment was impaired under the new rules. The impairment loss has been recorded in operating income as a charge against earnings for the fiscal year ending December 31, 2002. There was no tax recovery recorded on this charge to earnings.
In addition, in accordance with the new recommendations of the CICA, the Company no longer records amortization expense for goodwill. On an adjusted basis, the Company's net income for the years ended December 31, 2001 and 2000 would have been as follows if it was applied retroactively:
| | Years ended December 31,
|
|---|
| | 2001
| | 2000
|
|---|
| Net income as reported | | $ | 39.9 | | $ | 34.7 |
| Goodwill amortization, net of taxes | | | 7.2 | | | 6.3 |
| | |
| |
|
| Adjusted net income | | $ | 47.1 | | $ | 41.0 |
| | |
| |
|
In conjunction with the review of goodwill, the Company also assessed the recoverability of its long-lived assets in the same reporting unit in its Interiors Europe reporting segment, following the new accounting recommendations in CICA 3063. CICA 3063 requires an impairment loss to be recognized when the carrying value of an asset to be held and used exceeds the sum of the undiscounted cash flows expected from its use and eventual disposition. An impairment loss is measured as the amount by which the asset's carrying value exceeds its fair value. As permitted by CICA 3063, discounted cash flows were used to determine fair value. Previously, Canadian GAAP required that asset impairment be measured as the amount by which the asset's carrying value exceeded the undiscounted future cash flow from the use of the asset. As a result of this review, the Company reduced the carrying value of machinery and equipment, leasehold improvements and buildings by $17.6 million, $1.4 million and $1.1 million, respectively. As required by CICA 3063, the $20.1 million write-down of long-lived assets has been recorded in operating income as a charge against earnings for the fiscal year ending December 31, 2002. Net tax assets of $1.5 million associated with these operations were charged to income tax expense for the fiscal year ending December 31, 2002.
10. INCOME TAXES
- (a)
- The provision for income taxes differs from the expense that would be obtained by applying Canadian statutory rates as a result of the following:
| | Years ended December 31,
| |
|---|
| | 2002
| | 2001
| | 2000
| |
|---|
| Canadian statutory income tax expense | | $ | 43.3 | | $ | 33.5 | | $ | 28.8 | |
| Manufacturing and processing profits deduction | | | (4.1 | ) | | (5.6 | ) | | (6.3 | ) |
| Foreign rate differentials | | | (5.4 | ) | | (2.6 | ) | | 0.9 | |
| Losses not benefited | | | 19.5 | | | 4.9 | | | 5.2 | |
| Amortization of discount on Convertible Series Preferred Shares | | | 3.8 | | | 2.0 | | | — | |
| Other | | | 7.4 | | | 8.5 | | | 2.3 | |
| | |
| |
| |
| |
| Income tax expense | | $ | 64.5 | | $ | 40.7 | | $ | 30.9 | |
| | |
| |
| |
| |
- (b)
- The details of the income tax provision are as follows:
| | Years ended December 31,
| |
|---|
| | 2002
| | 2001
| | 2000
| |
|---|
| Current provision: | | | | | | | | | | |
| | Canadian federal taxes | | $ | 18.4 | | $ | 17.5 | | $ | 17.9 | |
| | Provincial taxes | | | 9.1 | | | 9.3 | | | 10.9 | |
| | Foreign taxes | | | 9.8 | | | 5.1 | | | 23.7 | |
| | |
| |
| |
| |
| | | | 37.3 | | | 31.9 | | | 52.5 | |
| | |
| |
| |
| |
| Future provision: | | | | | | | | | | |
| | Canadian federal taxes | | | 0.7 | | | 0.9 | | | (1.9 | ) |
| | Provincial taxes | | | 0.3 | | | 0.5 | | | (1.2 | ) |
| | Foreign taxes | | | 26.2 | | | 7.4 | | | (18.5 | ) |
| | |
| |
| |
| |
| | | | 27.2 | | | 8.8 | | | (21.6 | ) |
| | |
| |
| |
| |
| | | $ | 64.5 | | $ | 40.7 | | $ | 30.9 | |
| | |
| |
| |
| |
- (c)
- Future income taxes have been provided on temporary differences, which consist of the following:
| | Years ended December 31,
| |
|---|
| | 2002
| | 2001
| | 2000
| |
|---|
| Fixed assets tax depreciation greater than book depreciation | | $ | 3.5 | | $ | 1.5 | | $ | 1.5 | |
| Other assets tax depreciation (less than) greater than book depreciation | | | (9.8 | ) | | 3.5 | | | 3.9 | |
| Net tax losses utilized (benefited) | | | 33.5 | | | 3.6 | | | (25.2 | ) |
| Other | | | — | | | 0.2 | | | (1.8 | ) |
| | |
| |
| |
| |
| | | $ | 27.2 | | $ | 8.8 | | $ | (21.6 | ) |
| | |
| |
| |
| |
- (d)
- Future tax assets and liabilities consist of the following temporary differences:
| | December 31,
| |
|---|
| | 2002
| | 2001
| |
|---|
| Benefit of tax loss carryforwards | | $ | 86.8 | | $ | 107.2 | |
| Fixed assets | | | (24.3 | ) | | (26.6 | ) |
| Other assets | | | 20.7 | | | 7.6 | |
| | |
| |
| |
| | | | 83.2 | | | 88.2 | |
| Valuation allowance | | | (45.7 | ) | | (27.2 | ) |
| | |
| |
| |
| Future tax assets, net | | $ | 37.5 | | $ | 61.0 | |
| | |
| |
| |
| Represented on the balance sheet as follows: | | | | | | | |
| Future tax assets | | $ | 75.5 | | $ | 96.0 | |
| Future tax liabilities | | | (38.0 | ) | | (35.0 | ) |
| | |
| |
| |
| | | $ | 37.5 | | $ | 61.0 | |
| | |
| |
| |
- (e)
- Income taxes paid in cash for the year ended December 31, 2002 were $37.0 million (for the years ended December 31, 2001 and 2000—$48.0 million and $50.7 million, respectively).
- (f)
- Canadian income before income taxes and minority interest was $74.2 million for the year ended December 31, 2002 (for the years ended December 31, 2001 and 2000—$70.5 million and $71.9 million, respectively). The corresponding amounts for foreign operations were $38.0 million for the year ended December 31, 2002 (for the year ended December 31, 2001, $9.7 million and for the year ended December 31, 2000 a loss of $ 6.5 million).
- (g)
- At December 31, 2002, the Company had income tax loss carryforwards of approximately $122.1 million that relate to certain foreign subsidiaries, the tax benefits of which have not been recognized in the consolidated financial statements. Of the total losses, $92.5 million expire between 2003 and 2012 and the remainder have no expiry date.
- (h)
- At December 31, 2002, $137.0 million of undistributed earnings of foreign subsidiaries and jointly controlled entities may be subject to tax if remitted to Canada. No provision has been made for such taxes as these earnings are considered to be reinvested for the foreseeable future.
11. DEBT AND COMMITMENTS
- (a)
- The Company's long-term debt, which is substantially unsecured, consists of the following:
| | December 31,
|
|---|
| | 2002
| | 2001
|
|---|
| Loans from governments with a weighted average interest rate of approximately 2% denominated primarily in euros | | $ | 6.5 | | $ | 5.5 |
| Bank term debt at a weighted average interest rate of approximately 4% denominated primarily in euros | | | 6.3 | | | 5.6 |
| Obligations under capital leases at an implicit rate of 7.6% (i) | | | 23.2 | | | 23.3 |
| Other | | | — | | | 3.0 |
| | |
| |
|
| | | | 36.0 | | | 37.4 |
| Less due within one year | | | 4.2 | | | 6.8 |
| | |
| |
|
| | | $ | 31.8 | | $ | 30.6 |
| | |
| |
|
Note:
- (i)
- Obligations under capital leases relate to the leasing of land and buildings by the Company from certain real estate subsidiaries of Magna. These agreements were entered into during the year ended December 31, 1998 (see note 11(f)).
- (b)
- At December 31, 2002, future principal repayments on long-term debt (excluding obligations under capital leases) are estimated to be as follows:
| 2003 | | $ | 3.0 |
| 2004 | | | 2.3 |
| 2005 | | | 2.5 |
| 2006 | | | 1.8 |
| 2007 | | | 1.9 |
| Thereafter | | | 1.3 |
| | |
|
| | | $ | 12.8 |
| | |
|
- (c)
- On September 27, 2001, the Company established a $385.0 million three-year unsecured revolving term credit facility with customary commercial terms, bearing interest at variable rates not exceeding the prime rate of interest. The credit facility contains negative and affirmative financial and operating covenants and events of default customary for credit facilities of this nature, including the requirements that the Company maintain certain financial ratios and restrictions on its ability to incur or guarantee additional indebtedness or to dispose of assets as well as the right of the lenders to declare all outstanding indebtedness to be immediately due and payable upon the occurrence of an event of default. The credit facility expires on September 27, 2004.
At December 31, 2002, the Company had operating lines of credit amounting to $68.1 million and term lines of credit amounting to $421.0 million. At December 31, 2002, the Company had unused and available operating lines of credit and term lines of credit of $65.1 million and $336.4 million.
- (d)
- Interest (income) expense includes:
| | Years ended December 31,
| |
|---|
| | 2002
| | 2001
| | 2000
| |
|---|
| Interest expense: | | | | | | | | | | |
| | Current | | $ | 4.8 | | $ | 0.9 | | $ | 0.6 | |
| | Long-term | | | 0.5 | | | 0.6 | | | 0.8 | |
| | Intercompany to Magna and its affiliates | | | 2.1 | | | 40.6 | | | 41.7 | |
| | |
| |
| |
| |
| | | | 7.4 | | | 42.1 | | | 43.1 | |
| �� | |
| |
| |
| |
| Interest income: | | | | | | | | | | |
| | Current | | | (8.9 | ) | | (3.0 | ) | | (3.2 | ) |
| | Intercompany from Magna and its affiliates | | | — | | | (22.9 | ) | | (12.5 | ) |
| | |
| |
| |
| |
| Interest (income) expense, net | | $ | (1.5 | ) | $ | 16.2 | | $ | 27.4 | |
| | |
| |
| |
| |
Interest paid in cash for the year ended December 31, 2002 was $6.8 million (for the years ended December 31, 2001 and 2000—$3.7 million and $3.3 million, respectively).
- (e)
- At December 31, 2002, the Company had commitments under operating leases requiring annual rental payments to third parties and to Magna and its affiliates as follows:
| | Third parties
| | Magna and
its affiliates
|
|---|
| 2003 | | $ | 26.5 | | $ | 12.2 |
| 2004 | | | 20.7 | | | 13.0 |
| 2005 | | | 17.9 | | | 13.0 |
| 2006 | | | 13.8 | | | 12.4 |
| 2007 | | | 11.9 | | | 11.8 |
| Thereafter | | | 41.9 | | | 62.9 |
| | |
| |
|
| | | $ | 132.7 | | $ | 125.3 |
| | |
| |
|
For the year ended December 31, 2002, operating lease expense amounted to $35.1 million (for the years ended December 31, 2001 and 2000—$24.4 million and $23.9 million, respectively).
- (f)
- At December 31, 2002, the Company had commitments under capital leases requiring annual rental payments to Magna and its affiliates as follows:
| 2003 | | $ | 3.0 |
| 2004 | | | 3.3 |
| 2005 | | | 3.3 |
| 2006 | | | 3.3 |
| 2007 | | | 3.3 |
| Thereafter | | | 20.3 |
| | |
|
| | | | 36.5 |
| Less interest and other charges | | | 13.3 |
| | |
|
| Obligations under capital leases | | | 23.2 |
| Less current portion | | | 1.2 |
| | |
|
| Long-term portion of obligations under capital leases | | $ | 22.0 |
| | |
|
12. EMPLOYEE BENEFIT PLANS
Prior to 2001, Magna's Corporate Constitution required that 10% of Magna's qualifying pre-tax profits before profit sharing (defined in its Corporate Constitution) for any fiscal period be allocated to an Employee Equity and Profit Participation Program ("EEPPP") consisting of the Magna deferred profit sharing plans and a cash distribution to eligible employees of Magna. Eligible Canadian, United States, United Kingdom, and European employees participate in the EEPPP.
During 2001, Magna amended its Corporate Constitution to allow for the required contributions under its corporate constitution to be made to certain defined benefit pension plans in addition to the Magna deferred profit sharing plan and cash distributions to eligible employees. All U.S. and Canadian employees that participate in the deferred profit sharing plans were, and all new employees are, given the option of receiving a reduced percentage entitlement under the deferred profit sharing plan plus a defined benefit pension or continuing to receive their previous percentage entitlement. The defined benefit pension is payable to retirees at age 65 or older and is based on years of service and compensation levels. Participants may take early retirement after age 55 and receive a reduced pension package. In 2002, the Company adopted a similar profit sharing arrangement to Magna's, subject to obtaining the necessary regulatory approvals.
In addition, a limited number of companies in the United Kingdom and Europe sponsor defined benefit pension and similar arrangements for their employees. Pursuant to labour laws and national labour agreements in certain European countries, the Company is obliged to provide lump sum termination payments to employees on retirement or involuntary termination and long service payments contingent upon persons reaching a pre-defined number of years of service.
All pension plans and similar arrangements are funded to the minimum legal funding requirements. In certain circumstances there is no legal requirement to fund this obligation until such time as they are actually incurred, and as a result, these arrangements are unfunded.
The cost of pension benefits earned by employees is actuarially determined using the projected benefit method pro rated on service and management's best estimate of expected plan investment performance, salary escalation and retirement ages of employees.
The significant actuarial assumptions adopted in measuring the Company's projected pension benefit obligations are as follows:
| Discount rate | | 5.0 | %-6.75% |
| Rate of compensation increase | | 1.5 | %-4.0% |
| Expected return on plan assets | | 5.0 | %-8.0% |
Information about the Company's defined benefit pension plans is as follows:
| | Years ended December 31,
| |
|---|
| | 2002
| | 2001
| | 2000
| |
|---|
| Benefit obligations: | | | | | | | | | | |
| Beginning of year | | $ | 48.5 | | $ | 51.7 | | $ | 47.9 | |
| | Current service and interest cost | | | 7.7 | | | 6.7 | | | 6.0 | |
| | Actuarial losses (gains) and changes in actuarial assumptions | | | 2.1 | | | (2.6 | ) | | 1.8 | |
| | Benefits paid | | | (2.0 | ) | | (2.3 | ) | | (0.6 | ) |
| | Currency translation | | | 5.1 | | | (5.0 | ) | | (3.4 | ) |
| | |
| |
| |
| |
| End of year | | $ | 61.4 | | $ | 48.5 | | $ | 51.7 | |
| | |
| |
| |
| |
| Plan assets at fair value: | | | | | | | | | | |
| Beginning of year | | $ | 28.5 | | $ | 34.3 | | $ | 31.2 | |
| | Return on plan assets | | | (5.2 | ) | | (3.4 | ) | | 3.8 | |
| | Employer contributions | | | 4.6 | | | 2.7 | | | 2.2 | |
| | Benefits paid | | | (2.0 | ) | | (2.3 | ) | | (0.6 | ) |
| | Currency translation | | | 2.5 | | | (2.8 | ) | | (2.3 | ) |
| | |
| |
| |
| |
| End of year | | $ | 28.4 | | $ | 28.5 | | $ | 34.3 | |
| | |
| |
| |
| |
| Unfunded amount | | | 33.0 | | $ | 20.0 | | $ | 17.4 | |
| | Unrecognized actuarial (losses) gains | | | (12.6 | ) | | (3.1 | ) | | — | |
| | |
| |
| |
| |
| Net amount recognized in the consolidated balance sheets | | $ | 20.4 | | $ | 16.9 | | $ | 17.4 | |
| | |
| |
| |
| |
| Net periodic benefit cost: | | | | | | | | | | |
| Current service and interest costs | | $ | 7.7 | | $ | 6.7 | | $ | 6.0 | |
| | Expected return on plan assets | | | (2.2 | ) | | (2.4 | ) | | (2.2 | ) |
| | Actuarial losses (gains) | | | — | | | — | | | 0.3 | |
| | |
| |
| |
| |
| | | $ | 5.5 | | $ | 4.3 | | $ | 4.1 | |
| | |
| |
| |
| |
During the year ended December 31, 2002, the Company incurred $1.7 million (for the years ended December 31, 2001 and 2000—$1.8 million and $1.9 million, respectively) of defined contribution plan expense.
During the year ended December 31, 2000, the Company introduced a post retirement medical benefits plan covering eligible employees and retirees. Retirees aged 60 or older with ten or more years of service will be eligible for benefits. In addition, existing retirees as at August 1, 2000 that meet the above criteria are also eligible for benefits. Benefits are capped based on years of service.
The cost of retirement medical benefits earned by employees is actuarially determined using the projected benefit method pro rated on service and estimates of retirement ages of employees and expected health care costs.
The significant actuarial assumptions adopted in measuring the Company's projected retirement medical benefit obligations are as follows:
| Discount rate | | 6.75 | % |
| Rate of compensation increase | | 4.0 | % |
Information about the Company's post retirement medical benefit plans is as follows:
| | Years ended December 31,
| |
|---|
| | 2002
| | 2001
| | 2000
| |
|---|
| Benefit obligations: | | | | | | | | | | |
| Beginning of year | | $ | 7.8 | | $ | 8.5 | | $ | 5.0 | |
| | Past service obligations | | | — | | | — | | | 4.4 | |
| | Current service and interest cost | | | 0.8 | | | 0.8 | | | 0.7 | |
| | Actuarial losses (gains) and changes in actuarial assumptions | | | 0.6 | | | (0.5 | ) | | (1.1 | ) |
| | Benefits paid | | | (0.9 | ) | | (0.7 | ) | | (0.5 | ) |
| | Currency translation | | | (0.1 | ) | | (0.3 | ) | | — | |
| | |
| |
| |
| |
| End of year | | $ | 8.2 | | $ | 7.8 | | $ | 8.5 | |
| | |
| |
| |
| |
| Plan assets at fair value: | | | | | | | | | | |
| Beginning of year | | $ | — | | $ | — | | $ | — | |
| | Employer contributions | | | 0.9 | | | 0.7 | | | 0.5 | |
| | Benefits paid | | | (0.9 | ) | | (0.7 | ) | | (0.5 | ) |
| | |
| |
| |
| |
| End of year | | $ | — | | $ | — | | $ | — | |
| Unfunded amount | | $ | 8.2 | | $ | 7.8 | | $ | 8.5 | |
| | Unrecognized past service obligation | | | (3.6 | ) | | (3.8 | ) | | (4.0 | ) |
| | Unrecognized actuarial gain | | | 0.6 | | | 1.2 | | | — | |
| | |
| |
| |
| |
| Net amount recognized in the consolidated balance sheets | | $ | 5.2 | | $ | 5.2 | | $ | 4.5 | |
| | |
| |
| |
| |
| Net periodic benefit cost: | | | | | | | | | | |
| | Current service and interest costs | | $ | 0.8 | | $ | 0.8 | | $ | 0.7 | |
| | Past service costs | | | 0.2 | | | 0.2 | | | 0.2 | |
| | |
| |
| |
| |
| | | $ | 1.0 | | $ | 1.0 | | $ | 0.9 | |
| | |
| |
| |
| |
13. CONVERTIBLE SERIES PREFERRED SHARES
The Company has issued the following Convertible Series Preferred Shares:
| | Number of Shares
|
|---|
| Preferred Shares, Series 1 | | 1,125,000 |
| Preferred Shares, Series 2 | | 1,125,000 |
The Convertible Series Preferred Shares have the following attributes:
- •
- Carrying value of $100 per share;
- •
- Fixed preferential non-cumulative cash dividend of $5.00 per share per annum payable on a quarterly basis;
- •
- Retractable at their carrying value, together with all declared and unpaid dividends, by the holders thereof after December 31, 2003 in the case of the Preferred Shares, Series 1; and after December 31, 2004 in the case of the Preferred Shares, Series 2;
- •
- Redeemable at their carrying value, together with all declared and unpaid dividends, and subject to purchase for cancellation by the Company commencing December 31, 2005; and
- •
- Convertible into Class A Subordinate Voting Shares at the option of the holder at a price of $15.09 per share.
The Convertible Preferred Shares, Series 1 and 2, were issued to Magna in August 2001 in satisfaction of $225.0 million of the Company's indebtedness to Magna.
The portion of the Convertible Series Preferred Shares classified as long-term debt and the amounts reflected as amortization of discount on Convertible Series Preferred Shares are as follows:
| | Series 1
| | Series 2
| | Total
|
|---|
| Issued on August 9, 2001 | | $ | 97.7 | | $ | 92.1 | | $ | 189.8 |
| Amortization of discount | | | 2.4 | | | 2.4 | | | 4.8 |
| | |
| |
| |
|
| Balance, December 31, 2001 | | $ | 100.1 | | $ | 94.5 | | $ | 194.6 |
| Amortization of discount | | | 6.0 | | | 5.6 | | | 11.6 |
| | |
| |
| |
|
| Balance, December 31, 2002 | | $ | 106.1 | | $ | 100.1 | | $ | 206.2 |
The liability amounts for the Convertible Series Preferred Shares are presented as long-term liabilities as Magna's retraction rights related to the shares are not exercisable before December 31, 2003 and December 31, 2004, respectively.
The portion of the Convertible Series Preferred Shares included in shareholder's equity is as follows:
| | 2002
| | 2001
|
|---|
| Warrant portion (relating to conversion feature) | | $ | 6.7 | | $ | 6.7 |
| Dividend stream portion (relating to non-cumulative dividends) | | | 15.3 | | | 24.7 |
| | |
| |
|
| | | $ | 22.0 | | $ | 31.4 |
| | |
| |
|
14. CAPITAL STOCK
(a) Preferred Shares, Class A Subordinate Voting Shares and Class B Shares
The Company's authorized capital stock includes unlimited preferred shares issuable in series. None of these shares are currently issued or outstanding.
Class A Subordinate Voting Shares without par value (unlimited amount authorized) are entitled to one vote per share at all meetings of shareholders and shall participate equally as to cash dividends with each Class B Share.
Class B Shares without par value (unlimited amount authorized) are entitled to 20 votes per share at all meetings of shareholders, shall participate equally as to cash dividends with each Class A Subordinate Voting Share and may be converted at any time into fully-paid Class A Subordinate Voting Shares on a one-for-one basis.
In the event that either the Class A Subordinate Voting Shares or the Class B Shares are subdivided or consolidated, the other class shall be similarly changed to preserve the relative position of each class.
Outstanding Class A Subordinate Voting Shares and Class B Shares included in shareholders'equity as at December 31, 2002 and 2001 consist of:
| | Class A Subordinate Voting Shares
| | Class B Shares
|
|---|
| | Number of Shares
| | Stated Value
| | Number of Shares
| | Stated Value
|
|---|
| Issuance of Class A Subordinate Voting | | | | | | | | | | |
| Shares on initial public offering (i) | | 5,476,191 | | $ | 71.7 | | — | | | — |
| Issuance of Class B Shares on the reorganization of the Company on August 7, 2001 (convertible into Class A Subordinate Voting Shares) | | — | | | — | | 42,751,938 | | $ | 495.8 |
| | |
| |
| |
| |
|
| Balance, December 31, 2001 | | 5,476,191 | | $ | 71.7 | | 42,751,938 | | $ | 495.8 |
| Issuance of Class A Subordinate Voting Shares on exercise of stock options | | 5,000 | | | 0.1 | | — | | | — |
| | |
| |
| |
| |
|
| Balance, December 31, 2002 | | 5,481,191 | | $ | 71.8 | | 42,751,938 | | $ | 495.8 |
| | |
| |
| |
| |
|
Note:
- (i)
- On July 31, 2001, the Company filed a final prospectus with the securities regulatory authorities in Canada and the United States for a public offering of Class A Subordinate Voting Shares. The offering was completed in August 2001. The details of the proceeds from the public offering of Class A Subordinate Voting Shares are as follows:
| Total proceeds on 5,476,191 shares | | $ | 74.8 | |
| Expenses of the issue, net of taxes | | | (3.1 | ) |
| | |
| |
| Net proceeds | | $ | 71.7 | |
| | |
| |
(b) Incentive Stock Options
Under the 2001 Incentive Stock Option Plan adopted by the Company on August 9, 2001, the Company may grant options to purchase Class A Subordinate Voting Shares to employees, officers, directors or consultants of the Company. The remaining number of shares reserved to be issued for options is 5,995,000. The number of the unoptioned shares at December 31, 2002 is 2,840,000.
The Canadian dollar options under Tranche 1, 2, 3, 5 and 6 vest1/5 on the grant date and1/5 on each subsequent July 31 thereafter, Tranche 4 vest1/5 on the grant date and1/5 on each subsequent December 31 thereafter. The U.S. dollar options under Tranche 1 vest1/5 on the grant date and1/5 on each subsequent July 31 thereafter, with the exception of 750,000 options that vest1/3 on the grant date and1/4 of the balance on each subsequent August 8 thereafter, Tranche 2 and 5 vest1/5 on the grant date and1/5 on each subsequent July 31 thereafter, Tranche 3 and 4 vest1/5 on grant date and1/5 on each subsequent December 31 thereafter. All options allow the holder to purchase Class A Subordinate Voting Shares at a price equal to the market price on the trading day immediately prior to date of grant of options.
The following is a continuity schedule of options outstanding:
Canadian dollar options
| | Number
| | Weighted average
exercise price
| | Options
exercisable
|
|---|
| Granted | | 1,400,000 | | Cdn.$21.00 | | |
| Vested | | | | | | 280,000 |
| | |
| |
| |
|
| Outstanding at December 31, 2001 | | 1,400,000 | | Cdn.$21.00 | | 280,000 |
| | |
| |
| |
|
| Granted | | 375,000 | | Cdn.$25.99 | | |
| Exercised | | (5,000 | ) | Cdn.$21.00 | | |
| Cancelled | | (50,000 | ) | Cdn.$26.85 | | |
| Vested | | | | | | 361,000 |
| | |
| |
| |
|
| Outstanding at December 31, 2002 | | 1,720,000 | | Cdn.$21.92 | | 641,000 |
| | |
| |
| |
|
U.S. dollar options
| | Number
| | Weighted average
exercise price
| | Options
exercisable
|
|---|
| Granted | | 1,125,000 | | U.S.$13.72 | | |
| Vested | | | | | | 325,000 |
| | |
| |
| |
|
| Outstanding at December 31, 2001 | | 1,125,000 | | U.S.$13.72 | | 325,000 |
| | |
| |
| |
|
| Granted | | 335,000 | | U.S.$16.55 | | |
| Expired | | (4,000 | ) | U.S.$13.72 | | |
| Cancelled | | (21,000 | ) | U.S.$13.72 | | |
| Vested | | | | | | 262,000 |
| | |
| |
| |
|
| Outstanding at December 31, 2002 | | 1,435,000 | | U.S.$14.38 | | 587,000 |
| | |
| |
| |
|
At December 31, 2002, the outstanding options consist of the following:
Canadian dollar options outstanding
| | Exercise
price
| | Number
| | Remaining
contractual
life (years)
| | Options
exercisable
|
|---|
| Tranche 1 | | $ | 21.00 | | 1,385,000 | | 8.6 | | 563,000 |
| Tranche 2 | | $ | 21.00 | | 10,000 | | 8.6 | | 4,000 |
| Tranche 3 | | $ | 23.56 | | 40,000 | | 9.1 | | 16,000 |
| Tranche 4 | | $ | 29.40 | | 5,000 | | 9.5 | | 2,000 |
| Tranche 5 | | $ | 26.85 | | 245,000 | | 9.6 | | 49,000 |
| Tranche 6 | | $ | 21.00 | | 35,000 | | 9.9 | | 7,000 |
| | |
| |
| |
| |
|
| | | | | | 1,720,000 | | | | 641,000 |
| | | | | |
| | | |
|
| Weighted Average Exercise Price | | $ | 21.92 | | | | | | |
| | |
| | | | | | |
| Weighted Average Remaining Contractual Life | | | | | | | 8.8 | | |
| | | | | | | |
| | |
U.S. dollar options outstanding
| | Exercise
price
| | Number
| | Remaining
contractual
life (years)
| | Options
exercisable
|
|---|
| Tranche 1 | | $ | 13.72 | | 1,060,000 | | 8.6 | | 499,000 |
| Tranche 2 | | $ | 13.72 | | 40,000 | | 8.6 | | 16,000 |
| Tranche 3 | | $ | 18.34 | | 20,000 | | 9.2 | | 8,000 |
| Tranche 4 | | $ | 18.78 | | 5,000 | | 9.4 | | 2,000 |
| Tranche 5 | | $ | 16.40 | | 310,000 | | 9.6 | | 62,000 |
| | |
| |
| |
| |
|
| | | | | | 1,435,000 | | | | 587,000 |
| | | | | |
| | | |
|
| Weighted Average Exercise Price | | $ | 14.38 | | | | | | |
| | |
| | | | | | |
| Weighted Average Remaining Contractual Life | | | | | | | 8.8 | | |
| | | | | | | |
| | |
(c) Maximum Number of Shares
The following table presents the maximum number of Class A Subordinate Voting and Class B Shares that would be outstanding if all of the outstanding options and Convertible Series Preferred Shares issued and outstanding as at December 31, 2002 were exercised or converted:
| | Number of Shares
|
|---|
| Class A Subordinate Voting Shares outstanding as at December 31, 2002 | | 5,481,191 |
| Class B Shares outstanding as at December 31, 2002 | | 42,751,938 |
| Options to purchase Class A Subordinate Voting Shares | | 3,155,000 |
| Convertible Series Preferred Shares, convertible at $15.09 per share | | 14,910,537 |
| | |
|
| | | 66,298,666 |
| | |
|
(d) Dividends
Dividends declared and paid on outstanding Class A Subordinate Voting and Class B Shares were as follows:
| | Per Class A Subordinate
Voting and Class B Share
| | Total
|
|---|
| Dividends declared and paid in respect of the: | | | | | | |
| Three-month period ended September 30, 2001 | | $ | 0.04 | | $ | 2.0 |
| | |
| |
|
| Charged to retained earnings during the year ended December 31, 2001 | | | | | $ | 2.0 |
| | | | | |
|
| Three-month period ended December 31, 2001 | | $ | 0.05 | | $ | 2.4 |
| Three-month period ended March 31, 2002 | | $ | 0.05 | | $ | 2.4 |
| Three-month period ended June 30, 2002 | | $ | 0.05 | | $ | 2.4 |
| Three-month period ended September 30, 2002 | | $ | 0.05 | | $ | 2.5 |
| | |
| |
|
| Charged to retained earnings during the year ended December 31, 2002 | | | | | $ | 9.7 |
| | | | | |
|
Dividends declared on outstanding Series 1 and Series 2 Preferred Shares aggregated to $11.3 million for the year ended December 31, 2002 ($1.9 million for the year ended December 31, 2001). Dividends paid on outstanding Series 1 and Series 2 Preferred Shares aggregated to $8.4 million for the year ended December 31, 2002 ($1.9 million for the year ended December 31, 2001).
15. STOCK-BASED COMPENSATION
The Company does not recognize compensation expense for its outstanding fixed price stock options. Under CICA 3870, the Company is now required to disclose compensation expense for fixed price stock options issued subsequent to January 1, 2002, assuming compensation expense for the stock option plan had been determined based upon the fair value at the grant date, consistent with the methodology prescribed by the CICA.
The fair value of stock options is estimated at the date of grant using the Black-Scholes option pricing model with the following weighted average assumptions:
| |
|
|---|
| Risk free interest rate | | 3.96% - 5.27% |
| Expected dividend yield | | 1.20% |
| Expected volatility | | 26% - 37% |
| Expected time until exercise | | 5 years |
The Black-Scholes options valuation model used by the Company to determine fair values was developed for use in estimating the fair value of freely traded options which are fully transferable and have no vesting restrictions. In addition, this model requires the input of highly subjective assumptions, including future stock price volatility and expected time until exercise. Because the Company's outstanding stock options have characteristics which are significantly different from those of traded options, and because changes in any of the assumptions can materially affect the fair value estimate, in management's opinion, the existing models do not necessarily provide a reliable single measure of the fair value of the stock options.
On a pro forma basis, the net income, basic and diluted earnings per Class A Subordinate Voting and Class B Share for the year ended December 31, 2002 would have been $47.7 million, $0.95 and $0.93, respectively.
The weighted average fair value of the 710,000 options granted during the year ended December 31, 2002 was $ 5.63 per option.
16. FINANCIAL INSTRUMENTS
(a) Foreign Exchange Risk
The Company operates globally, which gives rise to risk that its earnings and cash flows may be adversely impacted by fluctuations in foreign exchange. The Company uses foreign exchange contracts to manage foreign exchange risk from its underlying customer contracts. In particular, the Company uses foreign exchange forward contracts for the sole purpose of hedging certain of the Company's future committed U.S. dollar, euro and British pound outflows and inflows. Gains and losses on these hedging instruments are recognized in the same period as, and part of, the hedged transaction. The Company does not enter into foreign exchange contracts for speculative purposes.
The Company had outstanding foreign exchange forward contracts representing commitments to buy and (sell) foreign currencies in exchange for Canadian dollars as follows:
| | December 31, 2002
|
|---|
| | U.S. dollar amount
| | Weighted average
| | euro amount
| | Weighted average
|
|---|
| 2003 | | $ | 108.7 | | 1.5211 | | € | 8.3 | | 1.3862 |
| 2003 | | | (94.2 | ) | 1.4556 | | | — | | — |
| 2004 | | | 44.5 | | 1.5375 | | | 5.9 | | 1.3764 |
| 2004 | | | (88.4 | ) | 1.4769 | | | — | | — |
| 2005 | | | 13.1 | | 1.5190 | | | 2.9 | | 1.4435 |
| 2005 | | | (85.6 | ) | 1.4717 | | | — | | — |
| 2006 | | | (16.1 | ) | 1.3862 | | | — | | — |
| | |
| |
| |
| |
|
| | | $ | (118.0 | ) | | | € | 17.1 | | |
| | |
| | | |
| | |
At December 31, 2002, the Company had other outstanding foreign exchange contracts to buy and sell various foreign currencies in exchange for either euros, U.S. dollars or British pounds. The total amount of such contracts were to buy euros 59.4 million, buy U.S. dollars 46.2 million and sell British pounds 50.9 million.
Based on forward exchange rates as at December 31, 2002 for contracts with similar remaining terms to maturity, the unrecognized net losses relating to the Company's significant foreign exchange forward contracts are approximately $14.7 million. If the Company's forward exchange contracts ceased to be effective as hedges, for example if projected net foreign cash inflows declined significantly, previously unrecognized gains or losses pertaining to the portion of the hedging transactions in excess of projected foreign denominated cash flows would be recognized in income at the time this condition was identified.
(b) Fair Value
The Company has determined the estimated fair values of its financial instruments based on appropriate valuation methodologies, however considerable judgement is required to develop these estimates. Accordingly, these estimated fair values are not necessarily indicative of the amounts the Company could realize in a current market exchange. The estimated fair value amounts can be materially affected by the use of different assumptions or methodologies. The methods and assumptions used to estimate the fair value of financial instruments are described below.
Cash and cash equivalents, accounts receivable, bank indebtedness, accounts payable and accrued liabilities
Due to the short period to maturity of the instruments, the carrying values as presented in the consolidated balance sheets are reasonable estimates of fair value.
Long-term debt
The fair value of the Company's long-term debt (including debt portion of the Convertible Series Preferred Shares), based on current rates for debt with similar terms and maturities, is not materially different from its carrying value.
(c) Credit Risk
The Company's financial assets that are exposed to credit risk consist primarily of cash and cash equivalents, accounts receivable and forward exchange contracts with positive values.
Cash and cash equivalents which consist of short-term investments, including commercial paper, are only invested in governments and corporations with an investment grade credit rating. Credit risk is further reduced by limiting the amount that is invested in any one government or corporation.
The Company, in the normal course of business, is exposed to credit risk from its customers, substantially all of which are in the automotive industry. These accounts receivable are subject to normal industry credit risks.
The Company is also exposed to credit risk from the potential default by any of its counterparties on foreign exchange forward contracts. The Company mitigates this credit risk by dealing with counterparties who are major financial institutions and who the Company anticipates will satisfy their obligations under the contracts.
(d) Interest Rate Risk
The Company is not exposed to significant interest rate risk due to the short-term maturity of its monetary current assets and current liabilities. In addition, the Company's exposure to interest rate risk on fixed rate long-term instruments is also reduced given the minimum periods to redemption with respect to Convertible Series Preferred Shares.
The following table summarizes the Company's interest rate risk as at December 31, 2002:
| | Floating rate
| | Fixed interest rate
| | Non-interest bearing
| | Total
| |
|---|
| Financial Assets: | | | | | | | | | | | | | |
| | Cash and cash equivalents | | $ | 241.3 | | $ | — | | $ | — | | $ | 241.3 | |
| | Accounts receivable | | | — | | | — | | | 579.9 | | | 579.9 | |
| Financial Liabilities: | | | | | | | | | | | | | |
| | Bank indebtedness | | | (48.6 | ) | | — | | | — | | | (48.6 | ) |
| | Accounts payable and all other accrued liabilities and payables | | | — | | | — | | | (782.5 | ) | | (782.5 | ) |
| | Long-term debt due within one year | | | — | | | (4.2 | ) | | — | | | (4.2 | ) |
| | Long-term debt | | | — | | | (31.8 | ) | | — | | | (31.8 | ) |
| | Convertible Series Preferred Shares | | | — | | | (206.2 | ) | | — | | | (206.2 | ) |
| | Other long-term liabilities | | | (25.6 | ) | | — | | | — | | | (25.6 | ) |
| | |
| |
| |
| |
| |
| | | $ | 167.1 | | $ | (242.2 | ) | $ | (202.6 | ) | $ | (277.7 | ) |
| | |
| |
| |
| |
| |
| Average fixed rate of long-term debt | | | | | | 5.0 | % | | | | | | |
| | |
| |
| |
| |
| |
(e) Electricity Swaps
Since May 2002, the Company pays a floating hourly price for electricity in the deregulated Ontario, Canada electricity market. At December 31, 2002, the Company had entered into electricity swap contracts to manage the cash flow risk from its Ontario electricity purchase contracts with an annual notional energy volume of 88,000 megawatt hours ("MWh") under which it pays a weighted average fixed price of $54.50 per MWh and receives a floating average price per MWh based on the hourly Ontario energy price. These contracts expire at various dates until April 2005. The net settlements under the electricity swap contracts are recognized in the same period as, and as part of, the hedged transaction. The Company does not enter into electricity swap contracts for speculative purposes.
The Company estimates the fair value of these electricity contracts as at December 31, 2002 is $0.5 million, representing a financial benefit to the Company. In December 2002, the Ontario government passed Bill 210, which freezes the electricity price for low volume and designated customers. Although the Company is not directly affected, Bill 210 has disrupted the forward market for Ontario electricity contracts and significantly reduced liquidity. The Company has estimated fair value based on available broker quotes but given the current illiquidity of the market, the fair value is subject to significant measurement uncertainty.
17. CURRENCY TRANSLATION ADJUSTMENT
Unrealized translation adjustments, which arise on the translation to U.S. dollars of assets and liabilities of the Company's operations with a functional currency of other than the U.S. dollar, resulted in an unrealized currency translation gain of $42.1 million for the year ended December 31, 2002. The unrealized gains resulted primarily from the strengthening of the euro, British pound and Canadian dollar against the U.S. dollar.
The Company has designated the debt portion of the Convertible Series Preferred Shares (note 13) as a hedge of its net investment in its operations in the United States. Gains and losses from this hedge are not included in the income statement, but are shown in the currency translation adjustment account. The Company recorded a foreign exchange gain of $3.4 million in the currency translation account related to such shares.
18. INTERESTS IN JOINTLY CONTROLLED ENTITIES
The following is the Company's proportionate share of the major components of the financial statements of the jointly controlled entities in which the Company has an interest (before eliminations):
Balance sheets
| | December 31,
|
|---|
| | 2002
| | 2001
|
|---|
| Current assets | | $ | 63.5 | | $ | 39.9 |
| Long-term assets | | $ | 43.1 | | $ | 34.5 |
| Current liabilities | | $ | 48.9 | | $ | 33.2 |
| Long-term liabilities | | $ | 30.8 | | $ | 15.9 |
Statements of income
| | Years ended December 31,
|
|---|
| | 2002
| | 2001
| | 2000
|
|---|
| Sales | | $ | 180.3 | | $ | 134.6 | | $ | 133.0 |
| Costs of goods sold, expenses and income taxes | | | 176.1 | | | 133.4 | | | 129.3 |
| | |
| |
| |
|
| Net income | | $ | 4.2 | | $ | 1.2 | | $ | 3.7 |
| | |
| |
| |
|
Statements of cash flows
| | Years ended December 31,
| |
|---|
| | 2002
| | 2001
| | 2000
| |
|---|
| Cash provided from (used for): | | | | | | | | | | |
| Operating activities | | $ | 16.9 | | $ | 23.0 | | $ | 9.8 | |
| | |
| |
| |
| |
| Investment activities | | $ | (6.3 | ) | $ | (6.5 | ) | $ | (3.0 | ) |
| | |
| |
| |
| |
| Financing activities | | $ | (7.7 | ) | $ | 3.2 | | $ | (6.3 | ) |
| | |
| |
| |
| |
At December 31, 2002, the Company's share of equity in jointly controlled entities includes undistributed earnings of $21.1 million (December 31, 2001—$19.0 million).
19. DETAILS OF CASH FROM OPERATING ACTIVITIES
(a) Items not involving current cash flows
| | Years ended December 31,
| |
|---|
| | 2002
| | 2001
| | 2000
| |
|---|
| Depreciation and amortization | | $ | 88.5 | | $ | 88.0 | | $ | 86.1 | |
| Future income taxes | | | 27.2 | | | 8.8 | | | (21.6 | ) |
| Pension and retirement medical obligations | | | 6.5 | | | 5.3 | | | 5.0 | |
| Loss (gain) on disposals of fixed assets | | | 2.1 | | | (1.1 | ) | | 1.7 | |
| Other charges | | | 23.6 | | | — | | | — | |
| Amortization of discount on Convertible Series Preferred Shares | | | 11.6 | | | 4.8 | | | — | |
| Other | | | (4.0 | ) | | (4.6 | ) | | (2.2 | ) |
| | |
| |
| |
| |
| | | $ | 155.5 | | $ | 101.2 | | $ | 69.0 | |
| | |
| |
| |
| |
(b) Changes in non-cash working capital
| | Years ended December 31,
| |
|---|
| | 2002
| | 2001
| | 2000
| |
|---|
| Accounts receivable | | $ | 31.9 | | $ | (108.1 | ) | $ | (89.5 | ) |
| Inventories | | | (4.0 | ) | | (22.7 | ) | | (72.7 | ) |
| Prepaid expenses and other | | | (2.6 | ) | | 14.1 | | | 1.0 | |
| Accounts payable and accrued liabilities | | | 86.1 | | | 142.6 | | | 28.8 | |
| | |
| |
| |
| |
| | | $ | 111.4 | | $ | 25.9 | | $ | (132.4 | ) |
| | |
| |
| |
| |
20. SEGMENTED INFORMATION
- (a)
- The Company designs, manufactures and supplies automotive interior and closure components, modules and systems primarily for OEM customers on a Tier One basis and manufactures and supplies interior and closure components on a Tier Two basis to other Tier One suppliers. At December 31, 2002, the Company had operations in 14 countries including 65 manufacturing facilities and 17 product development and engineering facilities.
The Company is organized by two product groups; Interior Systems and Closure Systems. Each group includes the following products and services:
Interior Systems
The Interior Systems group includes the engineering, development and production of complete seat systems, seat tracks, seat frames, integrated child safety seats and their seating components, cockpit modules, instrument panels, consoles, glove boxes, door modules, door trim panels, package trays, overhead systems, sun visors, acoustics, automotive carpets, interior panels and other interior garnish trim and components. This group also provides expertise and services for its OEM customers including assembly and sequencing, full vehicle process engineering and integrated interior vehicle safety systems.
Closure Systems
The Closure Systems group develops, produces and assembles a multitude of closure, latching and power driven door systems. Products include wiper systems, electrical motors, complete door systems, power liftgates and power sliding doors, window regulators and electronic latching systems.
Effective January 1, 2002, the Company changed its measurement of segment profitability from income (loss) before income taxes to operating income (loss).
| | Year ended December 31, 2002
|
|---|
| | Total sales
| | Depreciation and
amortization
| | Operating
income (loss)(1)
| | Fixed asset
additions
| | Fixed assets,
net
|
|---|
| Interior Systems | | | | | | | | | | | | | | | |
| | North America | | $ | 1,774.4 | | $ | 36.9 | | $ | 108.4 | | $ | 65.5 | | $ | 222.2 |
| | Europe | | | 1,278.3 | | | 31.3 | | | (23.3 | ) | | 41.2 | | | 161.1 |
| Closure Systems | | | | | | | | | | | | | | | |
| | North America | | | 662.1 | | | 10.8 | | | 52.5 | | | 18.1 | | | 42.0 |
| | Europe | | | 156.1 | | | 9.4 | | | (18.1 | ) | | 11.7 | | | 52.4 |
| Corporate, other and intersegment eliminations | | | (9.3 | ) | | 0.1 | | | 2.2 | | | 0.3 | | | 0.4 |
| | |
| |
| |
| |
| |
|
| Total reportable segments | | $ | 3,861.6 | | $ | 88.5 | | $ | 121.7 | | $ | 136.8 | | | 478.1 |
| | |
| |
| |
| |
| |
|
| Current assets | | | | | | | | | | | | | | | 1,116.2 |
| Goodwill, future tax and other assets | | | | | | | | | | | | | | | 187.5 |
| | |
| |
| |
| |
| |
|
| Total assets | | | | | | | | | | | | | | $ | 1,781.8 |
| | |
| |
| |
| |
| |
|
- (1)
- Interior Systems Europe includes $23.6 million of other charges (see note 9).
| | Year ended December 31, 2001
|
|---|
| | Total sales
| | Depreciation and
amortization
| | Operating
income (loss)
| | Fixed asset
additions
| | Fixed assets,
net
|
|---|
| Interior Systems | | | | | | | | | | | | | | | |
| | North America | | $ | 1,561.0 | | $ | 35.2 | | $ | 78.4 | | $ | 34.4 | | $ | 199.2 |
| | Europe | | | 974.0 | | | 31.6 | | | (7.2 | ) | | 29.9 | | | 146.5 |
| Closure Systems | | | | | | | | | | | | | | | |
| | North America | | | 614.7 | | | 11.3 | | | 35.9 | | | 10.6 | | | 34.2 |
| | Europe | | | 121.5 | | | 8.5 | | | (0.9 | ) | | 12.6 | | | 43.9 |
| Corporate, other and intersegment eliminations | | | (3.1 | ) | | 1.4 | | | (4.6 | ) | | 0.1 | | | 0.2 |
| | |
| |
| |
| |
| |
|
| Total reportable segments | | $ | 3,268.1 | | $ | 88.0 | | $ | 101.6 | | $ | 87.6 | | | 424.0 |
| | |
| |
| |
| |
| |
|
| Current assets | | | | | | | | | | | | | | | 915.9 |
| Goodwill, future tax and other assets | | | | | | | | | | | | | | | 239.5 |
| | |
| |
| |
| |
| |
|
| Total assets | | | | | | | | | | | | | | $ | 1,579.4 |
| | |
| |
| |
| |
| |
|
| | Year ended December 31, 2000
|
|---|
| | Total sales
| | Depreciation and
amortization
| | Operating
income (loss)
| | Fixed asset
additions
| | Fixed assets,
net
|
|---|
| Interior Systems | | | | | | | | | | | | | | | |
| | North America | | $ | 1,380.1 | | $ | 34.0 | | $ | 39.2 | | $ | 48.0 | | $ | 201.5 |
| | Europe | | | 868.1 | | | 32.2 | | | 10.1 | | | 34.8 | | | 137.8 |
| Closure Systems | | | | | | | | | | | | | | | |
| | North America | | | 595.8 | | | 11.1 | | | 46.6 | | | 12.7 | | | 40.7 |
| | Europe | | | 128.5 | | | 8.0 | | | (1.6 | ) | | 8.8 | | | 36.6 |
| Corporate, other and intersegment eliminations | | | (1.6 | ) | | 0.8 | | | (0.8 | ) | | — | | | — |
| | |
| |
| |
| |
| |
|
| Total reportable segments | | $ | 2,970.9 | | $ | 86.1 | | $ | 93.5 | | $ | 104.3 | | | 416.6 |
| | |
| |
| |
| |
| |
|
| Current assets | | | | | | | | | | | | | | | 788.3 |
| Goodwill, future tax and other assets | | | | | | | | | | | | | | | 260.8 |
| | |
| |
| |
| |
| |
|
| Total assets | | | | | | | | | | | | | | $ | 1,465.7 |
| | |
| |
| |
| |
| |
|
- (b)
- The following tables show certain information with respect to geographic segmentations:
| | Year ended December 31, 2002
|
|---|
| | Canada
| | United States
and Other
| | Continental
Europe
| | United
Kingdom
| | Total
|
|---|
| Sales | | $ | 1,171.0 | | $ | 1,256.2 | | $ | 914.4 | | $ | 520.0 | | $ | 3,861.6 |
| Fixed assets, net | | $ | 83.2 | | $ | 181.4 | | $ | 161.7 | | $ | 51.8 | | $ | 478.1 |
| Goodwill, net | | $ | 31.1 | | $ | 22.5 | | $ | 27.7 | | $ | 19.4 | | $ | 100.7 |
| | |
| |
| |
| |
| |
|
|
|
Year ended December 31, 2001
|
|---|
| | Canada
| | United States
and Other
| | Continental
Europe
| | United
Kingdom
| | Total
|
|---|
| Sales | | $ | 1,138.0 | | $ | 1,034.6 | | $ | 759.5 | | $ | 336.0 | | $ | 3,268.1 |
| Fixed assets, net | | $ | 62.2 | | $ | 171.4 | | $ | 137.4 | | $ | 53.0 | | $ | 424.0 |
| Goodwill, net | | $ | 29.7 | | $ | 24.7 | | $ | 33.5 | | $ | 44.6 | | $ | 132.5 |
| | |
| |
| |
| |
| |
|
|
|
Year ended December 31, 2000
|
|---|
| | Canada
| | United States
and Other
| | Continental
Europe
| | United
Kingdom
| | Total
|
|---|
| Sales | | $ | 1,146.8 | | $ | 827.5 | | $ | 658.9 | | $ | 337.7 | | $ | 2,970.9 |
| Fixed assets, net | | $ | 69.9 | | $ | 172.3 | | $ | 118.1 | | $ | 56.3 | | $ | 416.6 |
| Goodwill, net | | $ | 33.3 | | $ | 27.2 | | $ | 37.4 | | $ | 52.3 | | $ | 150.2 |
| | |
| |
| |
| |
| |
|
- (c)
- For the year ended December 31, 2002, sales to the three largest customers amount to 30%, 19% and 19% (for the year ended December 31, 2001—36%, 20% and 15%; for the year ended December 31, 2000—34%, 20% and 15%) of total sales, respectively.
21. TRANSACTIONS WITH RELATED PARTIES
| | Years ended December 31,
|
|---|
| | 2002
| | 2001
| | 2000
|
|---|
| Charges by Magna and its affiliates: | | | | | | | | | |
| Interest expense, net | | $ | 2.1 | | $ | 17.7 | | $ | 29.2 |
| | |
| |
| |
|
| Amortization of discount on Convertible Series Preferred Shares | | | 11.6 | | | 4.8 | | | — |
| | |
| |
| |
|
| Financing charge on Convertible Series Preferred Shares | | | 1.9 | | | 0.9 | | | — |
| | |
| |
| |
|
| Management and administrative services | | | 1.9 | | | 4.7 | | | 4.3 |
| | |
| |
| |
|
| Affiliation and social fees | | | 55.3 | | | 48.8 | | | 29.8 |
| | |
| |
| |
|
| Rent | | | 10.8 | | | 6.1 | | | 7.4 |
| | |
| |
| |
|
| Depreciation of assets under capital lease | | | 1.8 | | | 1.7 | | | 1.8 |
| | |
| |
| |
|
| Sales of materials to Magna and its affiliates | | | 13.9 | | | 13.7 | | | 6.4 |
| | |
| |
| |
|
| Purchases of materials from Magna and its affiliates | | | 22.8 | | | 28.6 | | | 34.8 |
| | |
| |
| |
|
At December 31, 2002, the Company's accounts receivable include accounts receivable from Magna controlled entities of $11.7 million (December 31, 2001—$36.9 million) and accounts payable include accounts payable to Magna controlled entities of $49.3 million (December 31, 2001—$43.9 million).
Magna provides certain management and administrative services to the Company, including legal, environmental, immigration, administrative, tax, internal audit, treasury, information systems and employee relations services, in return for a specific amount negotiated between the Company and Magna. Commencing January 1, 2002, the Company began reporting amounts paid to Magna for management and administrative services in selling, general and administrative expenses ("SG&A"). Affiliation and social fees continue to be shown separately in the consolidated statements of income. All comparative period amounts have been reclassified to conform with the current period's presentation.
During 2001, the Company entered into new or amended existing affiliation agreements with Magna that were effective January 1, 2001. The affiliation agreements provide for the payment by the Company to Magna of an affiliation fee. The affiliation agreements:
- •
- provide the Company with the right to identify itself as part of the Magna group of companies by granting the Company a non-exclusive, worldwide licence to use trademarks which identify Magna and its goods, services and activities in order to identify the Company and its goods, services and activities as being affiliated with Magna;
- •
- provide the Company with access to Magna's core operating principles and to new policies and programs adopted by Magna from time to time;
- •
- provide the Company with access to Magna's senior management and make available to the Company details of any new management techniques and incentive programs as well as marketing materials to the extent they are made available generally to Magna's other affiliates; and
- •
- grant the Company a sole and exclusive worldwide licence (except as described in the next sentence) to use the Intier trade name and certain other trademarks. The Company may not sublicense such trade name and trademarks other than to its subsidiaries.
Pursuant to the Company's affiliation agreements with Magna, the affiliation fees payable by the Company to Magna in respect of each fiscal year will be an aggregate amount equal to:
- •
- 1.5% of the first $3 billion of consolidated net sales for that year;
- •
- 1.0% of the next $3 billion of consolidated net sales for that year; and
- •
- 0.75% of consolidated net sales exceeding $6 billion.
Sales from acquired businesses will not be subject to a fee until January 1 of the year following the date of acquisition, and will be subject to a fee equal to 50% of the fee with respect to the Company's sales in the calendar year following the date of the acquisition, and to the full fee in the second calendar year following the date of the acquisition and thereafter.
The affiliation fee included in "Affiliation and social fees" was $53.6 million for the year ended December 31, 2002 (for the years ended December 31, 2001 and 2000—$47.6 million and $28.0 million, respectively).
The Company's Corporate Constitution provides that a maximum of 2% of its pre-tax profits in each fiscal year shall be allocated to the promotion of social objectives. Of this maximum, the social commitment agreement the Company entered into with Magna during the year ended December 31, 2001, effective January 1, 2001, requires the Company to contribute 1.5% of its pre-tax profits in each fiscal year to social and charitable programs coordinated by Magna or other charitable or non-profit organizations on behalf of Magna and its affiliates, including Intier.
The social commitment fee included in "Affiliation and social fees" was $1.7 million for the year ended December 31, 2002 (for the years ended December 31, 2001 and 2000—$1.2 million and $1.8 million, respectively).
Affiliation and social fees in prior years were calculated on a different basis than the 2002 and 2001 affiliation fee and social commitment fees and are therefore not comparable.
Pursuant to the Company's Corporate Constitution, 10% of the Company's employee pre-tax profit before profit sharing of participating Intier divisions for any fiscal year is required to be allocated to an Employee Equity and Profit Participation Program (the "Intier EEPPP"). During 2002, the Company's Board of Directors approved the establishment of the Intier EEPPP, subject to obtaining necessary regulatory approvals. The Company's eligible employees in Canada, the United States, the United Kingdom and Austria participate in the Intier EEPPP. Prior to fiscal 2002, the Company's employees participated in the Magna EEPPP. The Company's portion of the costs associated with the Magna EEPPP for the years ended December 31, 2001 and 2000 was $28.0 million and $25.7 million, respectively.
Various land and buildings used in the Company's operations are leased from Magna and its affiliates under operating and capital lease agreements (see note 11).
Transactions with Magna and its affiliates are effected on normal commercial terms.
22. CONTINGENCIES
- (a)
- In November 1997, Magna and two of its subsidiaries were sued by KS Centoco Ltd., an Ontario-based steering wheel manufacturer in which Magna has a 23% equity interest, and by Centoco Holdings Limited, the owner of the remaining 77% equity interest in KS Centoco Ltd. On March 5, 1999, the plaintiffs were granted leave to make substantial amendments to the original statement of claim in order to add several new defendants and claim additional remedies. The amended statement of claim now includes the Company's Advanced Car Technology Systems joint venture ("ACTS") as a named defendant to the lawsuit and alleges, among other things:
- •
- breach of fiduciary duty by Magna and two of its subsidiaries, including ACTS;
- •
- breach by Magna of its binding letter of intent with KS Centoco Ltd., including its covenant not to have any interest directly or indirectly, in any entity that carries on the air bag business in North America, other than through MST Automotive Inc., a company to be 77% owned by Magna and 23% owned by Centoco Holdings Limited;
- •
- the plaintiff's exclusive entitlement to certain airbag technologies in North America pursuant to an exclusive licence agreement, together with an accounting of all revenues and profits resulting from the alleged use by Magna, TRW Inc, ("TRW"), ACTS and other unrelated third party automotive supplier defendants of such technology in North America;
- •
- a conspiracy by Magna, TRW, and ACTS to deprive KS Centoco Ltd. of the benefits of such airbag technology in North America and to cause Centoco Holdings Limited to sell to TRW its interest in KS Centoco Ltd. in conjunction with Magna's sale to TRW of its interest in MST Automotive GmbH and TEMIC Bayern-Chemie Airbag GmbH. The plaintiffs are seeking, amongst other things, damages of approximately Cdn. $3.5 billion.
Magna and ACTS have filed an amended statement of defence and counterclaim and intend to vigorously defend this case. At this time, despite the early stages of this legal proceeding and the difficulty in predicting a final outcome, the Company believes that the ultimate resolution of these claims against ACTS will not have a material adverse effect on the Company's consolidated financial position. In addition, Magna has agreed to indemnify ACTS for any damages, liabilities, or expenses incurred in connection with this claim.
- (b)
- The Company has entered into an agreement with Magna under which it has the option to purchase, and Magna has the right to require it to purchase, Magna's 32% equity interest in Camaco L.L.C. for a purchase price of one dollar.
- (c)
- The Company is at risk for warranty costs including product liability and recall costs. Product liability provisions are established based on the Company's best estimate of the amounts necessary to settle existing claims on product defect issues. Recall costs are costs incurred when the Company and/or the customer decide, either voluntarily or involuntarily, to recall a product due to a known or suspected performance issue. Costs typically include the cost of the product being replaced, customer cost of the recall and labour to remove and replace the defective part. When a decision to recall a product has been made or is probable as the Company is fully or partially responsible for the defective product, the Company's estimated cost of the recall is recorded as a charge to net earnings in that period. In making this estimate, judgement is required as to the number of units that may be returned as a result of the recall, the total cost of the recall campaign, the ultimate negotiated sharing of the cost between the Company and the customer and, in some cases, the extent to which a supplier to the Company will share the recall cost. Due to the nature of the costs, the Company makes its best estimate of the expected future costs, however, the ultimate amount of such costs could be materially different. Given the nature of the Company's products, to date, the Company has not experienced significant warranty including product liability and recall costs. However, the Company continues to experience increased customer pressure to assume greater warranty responsibility. Currently, the Company only accounts for existing or probable claims, however, a significant increase in warranty responsibility could require the Company to consider accounting for possible future claims.
In particular, one of the Company's customers has asserted a claim for reimbursement for warranty costs as well as additional expenses which it expects to incur as a result of a voluntary customer satisfaction-based recall of a product which forms part of a module supplied by the Company to the customer. The product in question is supplied to the Company by another large supplier that the Company was directed to use by its customer. The customer has claimed that the warranty and future recall costs could be up to $42 million. Based on the Company's investigations to date, the Company does not believe that it has any liability for this claim and that any liability that the Company may become subject to, if it is established that the product is defective, will be recoverable from the supplier of the product, although the Company cannot provide assurance that this will be the case.
- (d)
- In the ordinary course of business activities, the Company may be contingently liable for litigation and claims with customers, suppliers and former employees and for potential environmental issues. Management believes that adequate provisions are recorded in the accounts where required. Although it is not possible to estimate the extent of potential costs and losses, if any, management believes, but can provide no assurance, that the ultimate resolution of such contingencies would not have a material adverse effect on the financial position of the Company.
- (e)
- The Company has guarantees to third parties that include future rent, utility costs, workers compensation claims under development, commitments linked to maintaining specific employment, customs duties and obligations linked to performance of specific vehicle programs. The amount of these guarantees are not individually or in aggregate significant.
23. UNITED STATES GENERALLY ACCEPTED ACCOUNTING PRINCIPLES
The consolidated financial statements are prepared using Canadian generally accepted accounting principles which conform with United States generally accepted accounting principles except for the following:
- (a)
- The Company has certain interests in jointly controlled entities that have been proportionately consolidated in these consolidated financial statements. Under U.S. GAAP, these interests would be accounted for by the equity method. Net income, earnings per share, shareholders' equity and Magna's net investment under U.S. GAAP are not impacted by the proportionate consolidation of these interests in jointly controlled entities.
- (b)
- Under U.S. GAAP, the Company would not have accounted for the Convertible Series Preferred Shares as part equity and part debt as required under Canadian GAAP. Under U.S. GAAP, the Convertible Series Preferred Shares would be shown at their face value outside of shareholders' equity and the entire non-cumulative dividend would be deducted from net income attributable to Class A Subordinate Voting and Class B Shares.
- (c)
- In December 1999, the United States Securities and Exchange Commission issued Staff Accounting Bulletin No. 101 ("SAB 101"), Revenue Recognition in Financial Statements. Effective January 1, 2000, the Company changed its method of accounting under U.S. GAAP for in-house engineering service and tooling contracts provided in conjunction with subsequent assembly or production activities which are regarded as a single arrangement. Previously, the Company had recognized revenue from these engineering services and tooling contracts on a percentage of completion basis. Under the new accounting method adopted effective January 1, 2000, for U.S. GAAP purposes, the Company recognizes revenue and related costs of sales for these activities over the estimated life of the assembly or production arrangement. The cumulative adjustment to net income as of January 1, 2000 was not significant.
For the year ended December 31, 2002, revenues and expenses under U.S. GAAP are lower by $3.3 million (for the years ended December 31, 2001 and 2000—$8.7 million and $9.3 million, respectively) and $3.4 million (for the years ended December 31, 2001 and 2000—$8.3 million and $8.4 million, respectively), as a result of this difference between Canadian and U.S. GAAP. The net revenue reduction for the year ended December 31, 2002 includes $3.8 million (for the years ended December 31, 2001 and 2000—$6.8 million and $8.2 million, respectively) in revenue that was included in the cumulative effect adjustment as of January 1, 2000.
- (d)
- The Company continues to measure compensation cost related to awards of stock options using the intrinsic value-based method of accounting as prescribed by APB Opinion No. 25, "Accounting for Stock Issued to Employees" as permitted by Statement of Financial Accounting Standards Board No. 123 "Accounting for Stock-Based Compensation" ("Statement 123"). In addition, under EITF 96-18, when stock options are issued to non-employees other than directors acting in their capacity as a director, the Company must record compensation expense in accordance with Statement 123. Options issued to directors for services provided outside of their role as a director are recorded as compensation expense by the Company. Under Canadian GAAP options issued to directors after December 31, 2001 for services outside of their roles as directors are recorded as compensation expense. For the year ended December 31, 2002, the Company did not issue stock options to non-employees. For the year ended December 31, 2001, the Company issued stock options to non-employees in return for services rendered. The total amount of this compensation expense for 2002 was $ 0.8 million (2001—$0.4 million).
- (e)
- The Company uses foreign exchange forward contracts to manage foreign exchange risk from its underlying customer contracts. In particular, the Company uses foreign exchange forward contracts for the sole purpose of hedging certain of its future committed U.S. dollar, euro and British pound outflows and inflows. Under Canadian GAAP, gains and losses on these contracts are accounted for as a component of the related hedged transaction. For periods up to and including December 31, 2000, gains and losses on these contracts were also accounted for as a component of the related hedged transaction under U.S. GAAP.
Effective January 1, 2001, the Company adopted Statement of Financial Accounting Standards Board No.133 ("Statement 133"), "Accounting for Derivative Instruments and Hedging Activities", as amended, which establishes accounting and reporting standards for derivative instruments, including certain derivative instruments embedded in other contracts, and for hedging activities. Statement 133 requires a company to recognize all of its derivative instruments as either assets or liabilities in the balance sheet at fair value. The accounting for changes in the fair value (i.e. gains or losses) of a derivative instrument depends on whether it has been designated and qualifies as part of a hedging relationship. Statement 133 establishes certain criteria to be met in order to designate a derivative instrument as a hedge and to deem a hedge as effective.
For the year ended December 31, 2001, the Company's derivative portfolio was not eligible for hedge accounting despite the fact that management considered its portfolio to be an effective foreign currency risk management tool and an economic hedge of its future committed U.S. dollar, euro and British pound outflows and inflows. Accordingly, the Company recorded a charge to net income of $16.1 million in the year ended December 31, 2001 for purposes of reconciling to U.S. GAAP. For periods to and including December 31, 2000, this amount would have been deferred and recorded as a component of the related hedge transaction under U.S. GAAP. In addition, the Company recorded a cumulative adjustment to other comprehensive income of $ 8.2 million as of January 1, 2002 upon adoption of Statement 133.
Effective January 1, 2002, the Company implemented a new treasury management system that complies with the documentation requirements for hedge accounting under Statement 133. Gains and losses as a result of changes in fair value of hedges are now recorded in other comprehensive income. For the year ended December 31, 2002, the Company recorded a gain in other comprehensive income of $9.9 million. In addition, gains or losses on hedge contracts that matured during the year that were previously recognized in other comprehensive income are recognized in net income. The Company recorded a loss of $4.2 million for the year ended December 31, 2002 in net income for losses on contracts that matured during 2002 that were previously recognized in other comprehensive income.
- (f)
- As described in note 16, the Company uses electricity swap contracts to manage the cash flow risk from its electricity purchase contracts in Ontario, Canada. Under both Canadian GAAP and U.S. GAAP, these swap contracts are accounted for using hedge accounting and the net swap settlements are recognized in the same period as, and as part of, the hedged transaction. For U.S. GAAP purposes only, the Company reflects the fair value of the swap contract on the balance sheet with an offsetting adjustment to other comprehensive income.
- (g)
- The Company accounts for its operating leases on a pay as you go basis. During the year ended December 31, 2002, the Company entered into certain operating leases with specific scheduled rent increases over the lease term. Under U.S. GAAP, the effects of the scheduled rent increases included in the minimum lease payments are recognized on a straight-line basis over the lease term. As a result, for the year ended December 31, 2002, net income under U.S. GAAP is lower by $1.0 million.
- (h)
- Under U.S. GAAP, the 2002 goodwill write-off as a result of the company's initial review for impairment as described in note 9 is reported as a cumulative catch-up adjustment for a change in accounting policy.
- (i)
- The following table presents net income and comprehensive income under U.S. GAAP:
| | Years ended December 31,
| |
|---|
| | 2002
| | 2001
| | 2000
| |
|---|
| Net income attributable to Class A Subordinate Voting and Class B Shares under Canadian GAAP | | $ | 46.7 | | $ | 39.0 | | $ | 34.7 | |
| Adjustments (net of related tax effects): | | | | | | | | | | |
| | Amortization of discount on Convertible Series Preferred Shares | | | 11.6 | | | 4.8 | | | — | |
| | Return of capital on Convertible Series Preferred Shares | | | (9.4 | ) | | (3.8 | ) | | — | |
| | In-house tooling and engineering | | | 0.1 | | | (0.4 | ) | | (0.9 | ) |
| | Derivative instruments | | | (4.2 | ) | | (16.1 | ) | | — | |
| | Operating leases | | | (1.0 | ) | | — | | | — | |
| | Non-employee stock option compensation expense | | | (0.8 | ) | | (0.4 | ) | | — | |
| | |
| |
| |
| |
| Net income attributable to Class A Subordinate Voting and Class B Shares under U.S. GAAP before cumulative catch-up adjustment | | $ | 43.0 | | $ | 23.1 | | $ | 33.8 | |
| Cumulative adjustment for change in accounting policy related to goodwill | | | (35.7 | ) | | — | | | — | |
| | |
| |
| |
| |
| Net income attributable to Class A Subordinate Voting and Class B Shares under U.S. GAAP after cumulative catch-up adjustment | | $ | 7.3 | | $ | 23.1 | | $ | 33.8 | |
| Other comprehensive income (net of related tax effects): | | | | | | | | | | |
| | Derivative instruments | | | 9.9 | | | — | | | — | |
| | Electricity swap contracts | | | 0.3 | | | — | | | — | |
| | Cumulative adjustment at January 1, 2001 for the change in derivative instrument accounting | | | — | | | (8.2 | ) | | — | |
| | Adjustment for derivative instruments,matured during the period, included in the cumulative adjustment at January 1, 2001 | | | 4.2 | | | 4.4 | | | — | |
| | Unrealized foreign exchange gains (losses) on translation of self-sustaining foreign entities | | | 42.1 | | | (13.4 | ) | | (12.9 | ) |
| | |
| |
| |
| |
| Comprehensive income under U.S. GAAP | | $ | 63.8 | | $ | 5.9 | | $ | 20.9 | |
| | |
| |
| |
| |
- (j)
- As a result of the reorganization of the Company, as described under Principles of Consolidation in Significant Accounting Policies, earnings per share and retained earnings for the year ended December 31, 2001 include net income for the five-month period subsequent to July 31, 2001.
The following table presents net income, comprehensive income and basic earnings per share information under U.S. GAAP for the year ended December 31, 2002 and for the five-month period ended December 31, 2001:
| | Years ended December 31,
| |
|---|
| | 2002
| | 2001
| |
|---|
| Net income attributable to Class A Subordinate Voting and Class B Shares under Canadian GAAP | | $ | 46.7 | | $ | 17.9 | |
| Adjustments (net of related tax effects): | | | | | | | |
| | Amortization of discount on Convertible Series Preferred Shares | | | 11.6 | | | 4.8 | |
| | Return of capital on Convertible Series Preferred Shares | | | (9.4 | ) | | (3.8 | ) |
| | In-house tooling and engineering | | | 0.1 | | | (0.3 | ) |
| | Derivative instruments | | | (4.2 | ) | | — | |
| | Operating leases | | | (1.0 | ) | | — | |
| | Non-employee stock option compensation expense | | | (0.8 | ) | | (0.4 | ) |
| | |
| |
| |
| Net income attributable to Class A Subordinate Voting and Class B Shares under U.S. GAAP before cumulative catch-up adjustment | | $ | 43.0 | | $ | 18.2 | |
| Cumulative adjustment for change in accounting policy related to goodwill | | | (35.7 | ) | | — | |
| | |
| |
| |
| Net income attributable to Class A Subordinate Voting and Class B Shares under U.S. GAAP after cumulative catch-up adjustment | | $ | 7.3 | | $ | 18.2 | |
| | |
| |
| |
| Other comprehensive income (net of related tax effects): | | | | | | | |
| Derivative instruments | | | 9.9 | | | — | |
| Electricity swap contracts | | | 0.3 | | | — | |
| Adjustment for derivative instruments, matured during the period, included in the cumulative adjustment at January 1, 2001 | | | 4.2 | | | — | |
| Unrealized foreign exchange losses on translation of self-sustaining foreign entities | | | 42.1 | | | (4.9 | ) |
| | |
| |
| |
| Comprehensive income under U.S. GAAP | | $ | 63.8 | | $ | 13.3 | |
| | |
| |
| |
| Basic earnings per Class A Subordinate Voting or Class B Share: | | | | | | | |
| Before cumulative catch-up adjustment | | $ | 0.89 | | $ | 0.38 | |
| Cumulative adjustment | | $ | (0.74 | ) | $ | — | |
| After cumulative catch-up adjustment | | $ | 0.15 | | $ | 0.38 | |
| | |
| |
| |
| Average number of Class A Subordinate Voting and Class B Shares outstanding during the period | | | 48.2 | | | 47.9 | |
| | |
| |
| |
The following table presents diluted earnings per share information under U.S. GAAP for the year ended December 31, 2002 and for the five-month period ended December 31, 2001:
| | Years ended December 31,
|
|---|
| | 2002
| | 2001
|
|---|
| Net income attributable to Class A Subordinate Voting and Class B Shares under U.S. GAAP before cumulative catch-up adjustment | | $ | 43.0 | | $ | 18.2 |
| Adjustment (net of related tax effect): | | | | | | |
| | Return of capital and financing charge on Convertible Series Preferred Shares | | | 11.3 | | | 4.7 |
| | |
| |
|
| | | $ | 54.3 | | $ | 22.9 |
| Cumulative adjustment for change in accounting related to goodwill | | | (35.7 | ) | | — |
| | |
| |
|
| Net income attributable to Class A Subordinate Voting and Class B Shares under U.S. GAAP after cumulative catch-up adjustment for diluted earnings per share | | $ | 18.6 | | $ | 22.9 |
| Diluted earnings per Class A Subordinate Voting or Class B Share: | | | | | | |
| Before cumulative catch-up adjustment | | $ | 0.85 | | $ | 0.36 |
| Cumulative adjustment | | $ | (0.56 | ) | | — |
| After cumulative catch-up adjustment | | $ | 0.29 | | $ | 0.36 |
| | |
| |
|
| Average number of Class A Subordinate Voting and Class B Shares outstanding during the period | | | 48.2 | | | 47.9 |
| Convertible Series Preferred Shares | | | 14.9 | | | 14.9 |
| Stock options | | | 0.5 | | | — |
| | |
| |
|
| | | | 63.6 | | | 62.8 |
| | |
| |
|
- (k)
- The following table indicates the significant items in the consolidated balance sheets that would have been affected had the consolidated financial statements been prepared under U.S. GAAP:
| | December 31, 2002
|
|---|
| | Canadian
GAAP
| | Operating
leases
| | Electricity
swap
| | Derivative
instruments
| | In-house
tooling and
engineering
| | Convertible
Series
Preferred
Shares
| | U.S.
GAAP
|
|---|
| Future tax assets | | $ | 75.5 | | $ | 0.6 | | $ | (0.2 | ) | $ | 5.4 | | $ | 0.6 | | $ | — | | $ | 81.9 |
| Other accrued liabilities | | | 50.2 | | | 1.6 | | | (0.5 | ) | | 15.3 | | | 1.8 | | | — | | | 68.4 |
| Convertible Series Preferred Shares | | | 206.2 | | | — | | | — | | | — | | | — | | | 18.8 | | | 225.0 |
| Shareholders' Equity | | | 644.0 | | | (1.0 | ) | | 0.3 | | | (9.9 | ) | | (1.2 | ) | | (18.8 | ) | | 613.4 |
| | December 31, 2001
|
|---|
| | Canadian
GAAP
| | Derivative
instruments
| | In-house
tooling and
engineering
| | Convertible
Series
Preferred
Shares
| | U.S.
GAAP
|
|---|
| Future tax assets | | $ | 96.0 | | $ | 10.7 | | $ | 0.7 | | $ | — | | $ | 107.4 |
| Other accrued liabilities | | | 49.6 | | | 30.6 | | | 2.0 | | | — | | | 82.2 |
| Convertible Series Preferred Shares | | | 194.6 | | | — | | | — | | | 30.4 | | | 225.0 |
| Shareholders' Equity | | | 609.9 | | | (19.9 | ) | | (1.3 | ) | | (30.4 | ) | | 558.3 |
- (l)
- In November 2001, the CICA issued Handbook Section 3870 "Stock-Based Compensation and Other Stock-Based Payments" ("CICA 3870"). CICA 3870 requires that all stock-based awards granted to non-employees must be accounted for at fair value. The new standard also encourages but does not require the use of the fair value method for all stock-based compensation paid to employees. However, the fair value method does not have to be applied to option plans where the only choice is for the employees to pay the exercise price and obtain stock. The new standard only applies to awards granted after the adoption date. The Company has prospectively adopted CICA 3870 effective January 1, 2002 and has elected to continue accounting for employee stock options using the intrinsic value method. Therefore, the Company does not recognize compensation expense for its outstanding fixed price stock options. Under U.S. GAAP, the Company is required to disclose compensation expense assuming compensation expense for the stock option plan had been determined based upon the fair market value at the grant date, consistent with the methodology prescribed under Statement 123. The compensation expense being disclosed includes all options granted to employees up to December 31, 2002.
The fair value of the stock options is estimated at the date of grant using the Black-Scholes options pricing model with the following weighted average assumptions:
| Risk free interest rate | | 3.96% - 5.27% |
| Expected dividend yield | | 1.20% |
| Expected volatility | | 26% - 37% |
| Expected time until exercise | | 5 years |
The Black-Scholes options valuation model used by the Company to determine fair values was developed for use in estimating the fair value of freely traded options which are fully transferable and have no vesting restrictions. In addition, this model requires that input of highly subjective assumptions, including future stock price volatility and expected time until exercise. Because the Company's outstanding stock options have characteristics which are significantly different from those of traded options, and because changes in any of the assumptions can materially affect the fair value estimate, in management's opinion, the existing models do not necessarily provide a reliable single measure of the fair value of its stock options.
The weighted average fair value of 710,000 options granted during the year ended December 31, 2002 was $ 5.63 per option (2001—$4.18).
On a pro forma basis, under Statement 123, the 2002 net income attributable to Class A Subordinate Voting and Class B Shares, and basic and diluted earnings per Class A Subordinate Voting or Class B Share would have been $ 4.6 million and $0.10 and $0.10, respectively (2001—$17.5 million and $0.37 and $0.35, respectively).
- (m)
- Under Staff Accounting Bulletin 74, the Company is required to disclose certain information related to new accounting standards which have not yet been adopted due to delayed effective dates.
CANADIAN GAAP STANDARDS
In December 2002, the CICA amended Handbook Section 3475, "Disposal of Long-Lived Assets and Discontinued Operations" ("CICA 3475"). CICA 3475 provides guidance on differentiating between assets held for sale and held for disposal other than by sale and on the presentation of discontinued operations. CICA 3475 applies to disposal activities initiated on or after May 1, 2003.
In December 2001, the CICA approved proposed amendments to Accounting Guideline, AcG-13, "Hedging Relationships" ("AcG-13"). The proposed amendments clarify certain of the requirements in AcG-13 and provide additional application guidance. The proposed amendments will be finalized in the first half of 2003 and will be applicable when AcG-13 becomes effective for fiscal years beginning on or after July 1, 2003.
Although the Company is currently reviewing CICA 3475 and AcG-13 the impact, if any, of these pronouncements on its consolidated financial statements has not been determined.
U.S. GAAP STANDARDS
During 2001, the Financial Accounting Standards Board ("FASB") issued Statement of Financial Accounting Standards No. 143, "Accounting for Asset Retirement Obligations" ("FAS 143"). FAS 143 requires that legal obligations arising from the retirement of tangible long-lived assets, including obligations identified by a company upon acquisition and construction and during the operating life of a long-lived asset, be recorded and amortized over the assets' useful life using a systematic and rational allocation method. FAS 143 is effective for fiscal years beginning after June 15, 2002.
During 2002, the FASB issued Statement of Financial Accounting Standards No. 146, "Accounting for Costs Associated with Exit or Disposal Activities" ("FAS 146"). FAS 146 requires that costs associated with an exit or disposal activity be recognized and measured at fair value in the period in which the liability is incurred. FAS 146 is effective for exit or disposal activities that are initiated after December 31, 2002.
In 2002, the FASB issued Interpretation No. 45, "Guarantor's Accounting and Disclosure Requirements for Guarantees, Including Indirect Guarantees of Indebtedness of Others" ("FIN 45"). FIN 45 requires certain guarantees to be recorded at fair value; previously a liability was only recorded when a loss under a guarantee was probable and reasonably estimable. The initial recognition and measurement provisions of FIN 45 are applicable on a prospective basis to guarantees issued or modified after December 31, 2002.
In January 2003, the FASB issued Interpretation No. 46, "Consolidation of Variable Interest Entities" ("FIN 46"). FIN 46 requires that a variable interest entity be consolidated by a company if that company is subject to a majority of the risk of loss from the variable interest entity's activities or entitled to receive a majority of the entity's residual returns or both. The consolidation requirements of FIN 46 apply immediately to variable interest entities created after January 31, 2003 and apply to existing variable interest entities in the first fiscal year or interim period beginning after June 15, 2003.
During 2002, the Emerging Issues Task Force ("EITF") issued EITF Abstract 00-21, "Accounting for Revenue Arrangements with Multiple Deliverables" ("EITF 00-21"). EITF 00-21 addresses how to account for arrangements that involve the delivery or performance of multiple products and services. EITF 00-21 is effective for agreements entered into in fiscal periods beginning after June 15, 2003.
Although the Company is currently reviewing FAS 143, FAS 146 and EITF 00-21 and the recognition and measurement requirements of FIN 45 and FIN 46, the impact, if any, of these pronouncements on its consolidated financial statements has not been determined.
FIVE YEAR FINANCIAL SUMMARY
| | Years ended December 31,
| |
|---|
(U.S. dollars in millions, except per share figures)
| | 2002
| | 2001
| | 2000
| | 1999
| | 1998
| |
|---|
| Operational data | | | | | | | | | | | | | | | | |
| Total sales | | $ | 3,861.6 | | $ | 3,268.1 | | $ | 2,970.9 | | $ | 2,834.8 | | $ | 2,571.1 | |
| Net income (loss) | | $ | 48.6 | | $ | 39.9 | | $ | 34.7 | | $ | 26.6 | | $ | (4.3 | ) |
| Basic earnings per Class A Subordinate Voting or Class B Share (note 1) | | $ | 0.97 | | $ | 0.37 | | | — | | | — | | | — | |
| Diluted earnings per Class A Subordinate Voting or Class B Share (note 1) | | $ | 0.95 | | $ | 0.37 | | | — | | | — | | | — | |
| Pro forma basic earnings (loss) per Class A Subordinate Voting or Class B Share (note 2) | | | — | | $ | 0.91 | | $ | 0.60 | | $ | 0.34 | | $ | (0.34 | ) |
| Pro forma diluted earnings (loss) per Class A Subordinate Voting or Class B Share (note 2) | | | — | | $ | 0.90 | | $ | 0.60 | | $ | 0.34 | | $ | (0.34 | ) |
| Depreciation and amortization | | $ | 88.5 | | $ | 88.0 | | $ | 86.1 | | $ | 87.2 | | $ | 77.8 | |
| Cash provided from (used for) operating activities | | $ | 315.5 | | $ | 167.0 | | $ | (28.7 | ) | $ | 89.9 | | $ | 79.9 | |
| Cash dividends paid per Class A Subordinate Voting or Class B Share | | $ | 0.20 | | $ | 0.04 | | | — | | | — | | | — | |
| Cash dividends paid per Convertible Series Preferred Share | | $ | 3.75 | | $ | 0.83 | | | — | | | — | | | — | |
| Average number of Class A Subordinate Voting and Class B Shares outstanding (thousands) | | | 48,230 | | | 47,876 | | | — | | | — | | | — | |
| Average number of Convertible Series Preferred Shares outstanding (thousands) | | | 2,250 | | | 2,250 | | | — | | | — | | | — | |
| | |
| |
| |
| |
| |
| |
Financial position |
|
|
|
|
|
|
|
|
|
|
|
|
|
|
|
|
| Total assets | | $ | 1,781.8 | | $ | 1,579.4 | | $ | 1,465.7 | | $ | 1,388.8 | | $ | 1,344.3 | |
| Fixed assets, net | | | 478.1 | | | 424.0 | | | 416.6 | | | 407.6 | | | 382.3 | |
| Working capital | | | 280.9 | | | 230.4 | | | 259.6 | | | 186.8 | | | 161.1 | |
| Fixed asset additions | | | 136.8 | | | 87.6 | | | 104.3 | | | 121.9 | | | 109.5 | |
| Long-term debt | | | 238.0 | | | 225.2 | | | 32.2 | | | 38.9 | | | 45.7 | |
| Shareholders' equity and Magna's net investment | | | 644.0 | | | 609.9 | | | 850.2 | | | 781.8 | | | 702.7 | |
| Equity per Class A Subordinate Voting or Class B Share | | $ | 13.35 | | $ | 12.74 | | | — | | | — | | | — | |
| Long-term debt to shareholders' equity and Magna's net investment ratio | | | 0.37:1 | | | 0.37:1 | | | 0.04:1 | | | 0.05:1 | | | 0.06:1 | |
| | |
| |
| |
| |
| |
| |
Notes:
- (1)
- As a result of the reorganization of the Company, as described in the notes to the Consolidated Financial Statements under Principles of Consolidation in Significant Accounting Policies, basic and diluted earnings per share for the year ended December 31, 2001 only included net income for the five month period subsequent to July 31, 2001. Historical earnings per share have not been presented since they are not comparable or meaningful.
- (2)
- Pro forma basic and diluted earnings per Class A Subordinate Voting or Class B Share are based on the public offering of 5,476,191 Class A Subordinate Voting Shares completed in August 2001 and on the assumption that 42,751,938 Class B Shares and 2,250,000 Convertible Series Preferred Shares were issued and outstanding for the entire periods presented (see note 4 to the consolidated financial statements).
QUARTERLY SUMMARY
SUPPLEMENTARY QUARTERLY FINANCIAL DATA (UNAUDITED)
| | Year ended December 31, 2002
|
|---|
(U.S. dollars in millions, except per share figures)
| | March 31
| | June 30
| | September 30
| | December 31
| | Total
|
|---|
| Sales | | $ | 878.9 | | $ | 996.4 | | $ | 931.6 | | $ | 1,054.7 | | $ | 3,861.6 |
| Gross margin | | | 107.5 | | | 138.6 | | | 112.1 | | | 128.5 | | | 486.7 |
| Net income (loss) | | | 13.0 | | | 26.4 | | | 12.9 | | | (3.7 | ) | | 48.6 |
| Earnings (loss) per share: | | | | | | | | | | | | | | | |
Basic earnings (loss) per Class A Subordinate Voting or Class B Share
(note 1) | | $ | 0.26 | | $ | 0.54 | | $ | 0.26 | | $ | (0.09 | ) | $ | 0.97 |
Diluted earnings (loss) per Class A Subordinate Voting or Class B Share
(note 1) | | $ | 0.25 | | $ | 0.46 | | $ | 0.25 | | $ | (0.09 | ) | $ | 0.95 |
|
|
Year ended December 31, 2001
|
|---|
(U.S. dollars in millions, except per share figures)
| | March 31
| | June 30
| | September 30
| | December 31
| | Total
|
|---|
| Sales | | $ | 821.8 | | $ | 851.1 | | $ | 728.5 | | $ | 866.7 | | $ | 3,268.1 |
| Gross margin | | | 96.6 | | | 121.0 | | | 86.9 | | | 102.0 | | | 406.5 |
| Net income | | | 6.8 | | | 18.4 | | | 2.0 | | | 12.7 | | | 39.9 |
| Earnings per share: | | | | | | | | | | | | | | | |
| Basic earnings per Class A Subordinate Voting or Class B Share (note 1) | | | — | | | — | | $ | 0.12 | | $ | 0.25 | | $ | 0.37 |
| Diluted earnings per Class A Subordinate Voting or Class B Share (note 1) | | | — | | | — | | $ | 0.12 | | $ | 0.25 | | $ | 0.37 |
Pro forma earnings per share: |
|
|
|
|
|
|
|
|
|
|
|
|
|
|
|
Pro forma basic earnings per Class A Subordinate Voting or Class B Share
(note 2) |
|
$ |
0.17 |
|
$ |
0.46 |
|
$ |
0.04 |
|
$ |
0.25 |
|
$ |
0.91 |
Pro forma diluted earnings per Class A Subordinate Voting or Class B Share
(note 2) |
|
$ |
0.17 |
|
$ |
0.40 |
|
$ |
0.04 |
|
$ |
0.25 |
|
$ |
0.90 |
Notes:
- (1)
- As a result of the reorganization of the Company, as described in the notes to the Consolidated Financial Statements under Principles of Consolidation in Significant Accounting Policies, basic and diluted earnings per share for the year ended December 31, 2001 only included net income for the five month period subsequent to July 31, 2001. Historical earnings per share have not been presented since they are not comparable or meaningful.
- (2)
- Pro forma basic and diluted earnings per Class A Subordinate Voting or Class B Share are based on the public offering of 5,476,191 Class A Subordinate Voting Shares completed in August 2001 and on the assumption that 42,751,938 Class B Shares and 2,250,000 Convertible Series Preferred Shares were issued and outstanding for the entire periods presented (see note 4 to the consolidated financial statements).
SHARE INFORMATION
Canada
The following table sets forth, for the fiscal periods indicated, the high and low sale prices of the Class A Subordinate Voting Shares and volumes of Class A Subordinate Voting Shares traded, as reported by the TSX.
| | Year ended December 31, 2002
|
|---|
(Canadian dollars, except volume)
| | Volume
| | High
| | Low
| | Close
|
|---|
| 3 months March 31, 2002 | | 1,202,580 | | 32.38 | | 19.25 | | 29.88 |
| 3 months June 30, 2002 | | 737,298 | | 33.53 | | 26.05 | | 26.60 |
| 3 months September 30, 2002 | | 309,554 | | 29.00 | | 23.50 | | 27.50 |
| 3 months December 31, 2002 | | 1,116,957 | | 28.00 | | 16.76 | | 17.40 |
|
|
Year ended December 31, 2001
|
|---|
(Canadian dollars, except volume)
| | Volume
| | High
| | Low
| | Close
|
|---|
| 2 months September 30, 2001 | | 2,206,359 | | 23.25 | | 13.50 | | 16.10 |
| 3 months December 31, 2001 | | 325,598 | | 21.05 | | 16.00 | | 19.50 |
United States
The following table sets forth, for the fiscal periods indicated, the high and low sale prices of the Class A Subordinate Voting Shares and volumes of Class A Subordinate Voting Shares traded, as reported by the NASDAQ.
| | Year ended December 31, 2002
|
|---|
(U.S. dollars, except volume)
| | Volume
| | High
| | Low
| | Close
|
|---|
| 3 months March 31, 2002 | | 540,371 | | 20.46 | | 12.12 | | 18.73 |
| 3 months June 30, 2002 | | 342,657 | | 22.75 | | 16.91 | | 17.61 |
| 3 months September 30, 2002 | | 222,767 | | 18.37 | | 14.81 | | 17.82 |
| 3 months December 31, 2002 | | 367,903 | | 17.69 | | 10.75 | | 11.00 |
|
|
Year ended December 31, 2001
|
|---|
(U.S. dollars, except volume)
| | Volume
| | High
| | Low
| | Close
|
|---|
| 2 months September 30, 2001 | | 1,480,317 | | 15.18 | | 8.82 | | 10.17 |
| 3 months December 31, 2001 | | 128,645 | | 13.25 | | 10.18 | | 12.73 |
DISTRIBUTION OF SHARES
Country
| | %
| |
|---|
| Canada | | 68.02 | % |
| United States | | 31.88 | % |
| Other | | 0.10 | % |
DIVIDENDS
Dividends paid on the Intier Automotive Class A Subordinate Voting and Class B Shares for the calendar year 2002 were paid on each of March 15, June 17, September 16, and December 16, 2002 at the rate of U.S. $0.05 per share.
Dividends paid on the Intier Automotive Convertible Series 1 and 2 Preferred Shares for the calendar year 2002 were paid on each of April 1, July 2, September 30, and December 31, 2002 in the amount of U.S. $2,812,500 per quarter.
Dividends on the Intier Automotive Class A Subordinate Voting and Class B Shares and Convertible Series 1 and 2 Preferred Shares, when payable to holders who are non-residents of Canada, are generally subject to withholding tax at a rate of 25% unless reduced, according to the provisions of the applicable tax treaty. Currently, the reduced rate applicable to dividends paid to a resident of the United States is generally 15%.
DIRECTORS
FRANK STRONACH
Chairman of the Board
Magna International Inc. | | RUDOLF STREICHER
Corporate Director |
FLAVIO COTTI
Corporate Director |
|
BELINDA STRONACH
President & Chief Executive Officer
Magna International Inc. |
NEIL G. DAVIS
Partner
Davis Webb Schulze & Moon |
|
DONALD J. WALKER
President & Chief Executive Officer
Intier Automotive Inc. |
LOUIS E. LATAIF
Dean of the School of Management
Boston University |
|
SEIGFRIED WOLF
Executive Vice-Chairman
Magna International Inc. |
THE HONOURABLE
EDWARD C. LUMLEY
Vice-Chairman
BMO Nesbitt Burns Inc. |
|
LAWRENCE WORRALL
Corporate Director |
OFFICERS
FRANK STRONACH
Chairman | | MICHAEL SINNAEVE
Vice-President,
Quality & Operational Improvement |
DONALD J. WALKER
President & Chief Executive Officer |
|
RICHARD GWYNN
Vice-President, Human Resources |
C. DENNIS BAUSCH
Chief Marketing & Strategy Officer |
|
BRUCE R. CLUNEY
Secretary |
MICHAEL E. McCARTHY
Executive Vice-President & Chief Financial Officer |
|
MICHAEL BACCELLIERI
Controller |
SCOTT PARADISE
Executive Vice-President,
Sales & Marketing |
|
PAUL BROCK
Treasurer |
KARL STEINER
Executive Vice-President,
Sales, Europe |
|
|
CORPORATE INFORMATION
STOCK TRANSFER AGENT
Canada
Class A Subordinate Voting Shares—
Computershare Trust Company of Canada,
Toronto, Ontario, Canada | | INVESTOR INFORMATION
Registered shareholders of the Company and non-registered shareholders on our supplementary mailing list automatically receive Intier's Annual and Quarterly Reports. If you wish to be placed on our supplementary mailing list, please contact: |
United States
Class A Subordinate Voting Shares—
Computershare Trust Company Inc.,
Golden, Colorado, U.S.A |
|
Mary Ann Kozlowicz
Tel.: 905-898-5200 ext. 7156
Fax: 905-898-6053
Email: maryann_kozlowicz@intier.com |
STOCK LISTINGS
Class A Subordinate Voting Shares
The Toronto Stock Exchange—IAI.A
NASDAQ National Market—IAIA |
|
For additional information regarding the Company, please contact:
Michael E. McCarthy
Executive Vice-President and Chief Financial Officer |
AUDITORS
Ernst & Young LLP
Toronto, Ontario, Canada |
|
Tel: 905-898-5200 ext. 7042
Fax: 905-898-6053
Email: irinfo@intier.com |
PRINCIPAL BANKERS
Bank of Nova Scotia
Bank of Montreal
Toronto, Ontario, Canada |
|
ANNUAL MEETING
Wednesday, May 7, 2003
10:00 am
The Design Exchange
Toronto Dominion Centre
Ernst & Young Tower
234 Bay Street, 2nd floor
Toronto, Ontario, Canada |
Office Locations for Intier and its Major Subsidiaries and Groups
INTIER AUTOMOTIVE INC.
| | INTERIOR SYSTEMS
|
|---|
521 Newpark Blvd.
Newmarket, Ontario,
Canada L3Y 4X7
Tel: 905-898-5200 | | United States
Intier Automotive
39600 Lewis Drive
Novi, Michigan 48377, USA
Tel: 248-567-4000 | | Europe
19 Ostring
D-63762 Grossostheim
Germany
Tel: 011-49-6026-992-0 |
CLOSURE SYSTEMS
521 Newpark Blvd.
Newmarket, Ontario
Canada L3Y 4X7
Tel: 905-898-2665 | | | |
Bircholt Road,
Parkwood Industrial Trading Estate,
Maidstone, Kent, England
ME15 9XT
Tel: 011-44-162-268-6311 |
MAGNA'S INTERIORS COMPANY
Intier Automotive Inc.
521 Newpark Blvd.
Newmarket, ON
Canada L3Y 4X7
www.intier.com