Exhibit 99.1
Forward-Looking Statements
The Private Securities Litigation Reform Act of 1995 provides a safe harbor from civil litigation for forward-looking statements that reflect our current views as to future events and financial performance with respect to our operations. These statements can be identified by the fact that they do not relate strictly to historical or current facts. They use words such as “aim,” “anticipate,” “estimate,” “expect,” “will be,” “will continue,” “will likely result,” “project,” “intend,” “plan,” “believe” and other words and terms of similar meaning in conjunction with a discussion of future operating or financial performance. Forward-looking statements are not guarantees of future performance and are subject to risks, uncertainties and other factors (many of which are beyond our control) that could cause actual results to differ materially from the future results expressed or implied by such forward-looking statements. The forward-looking statements regarding such matters are based on certain assumptions and analyses made by us in light of our experience and our perception of historical trends, current conditions and expected future developments, as well as other factors we believe are appropriate in the circumstances. Factors that might cause such a difference include: unfavorable economic conditions, including ramifications of any future terrorist attacks; increased operating costs; shortages of qualified personnel; currency risks and other risks associated with international markets; risks associated with acquisitions, including acquisition integration costs; our ability to integrate and derive the expected benefits from recent acquisitions; competition; decline in attendance at client facilities; unpredictability of sales and expenses due to contract terms and terminations; clients’ disputes of our contract determinations; high leverage; claims relating to the provision of food services; costs of compliance with governmental regulations; liability associated with non-compliance with governmental regulations, including regulations pertaining to food services and the environment; and seasonality. For further information regarding risks and uncertainties associated with ARAMARK’s business, please refer to the “Management’s Discussion and Analysis of Results of Operations and Financial Condition” and “Risk Factors” sections of ARAMARK’s SEC filings, including, but not limited to, our annual report on Form 10-K and quarterly reports on Form 10-Q, copies of which may be obtained by contacting ARAMARK’s investor relations department via its web site www.aramark.com.
Forward-looking statements speak only as of the date made. We undertake no obligation to update any forward-looking statements to reflect the events or circumstances arising after the date as of which they are made. As a result of these risks and uncertainties, readers are cautioned not to place undue reliance on the forward-looking statements included herein or that may be made elsewhere from time to time by, or on behalf of, us.
ARAMARK CORPORATION AND SUBSIDIARIES
RECONCILIATION OF NON-GAAP MEASURES
FULL YEAR DEBT/EBITDA EXCLUDING OTHER INCOME/ UNUSUAL ITEMS
(Unaudited)
(In thousands, except per share amounts)
EBITDA represents net income before income from discontinued operations (net), interest, taxes, depreciation and amortization, a measurement used by management to measure operating performance. EBITDA is not a recognized term under generally accepted accounting principles and does not purport to be an alternative to operating income as an indicator of operating performance or to cash flows from operating activities as a measure of liquidity. Because not all companies calculate EBITDA identically, this presentation of EBITDA may not be comparable to other similarly titled measures of other companies. Additionally, EBITDA is not intended to be a measure of free cash flow for management's discretionary use, as it does not consider certain cash requirements such as interest payments, tax payments, debt service requirements or capital expenditure requirements.
In the third quarter of fiscal 2003, ARAMARK completed the previously announced sale of ARAMARK Educational Resources (AER) to Knowledge Learning Corporation, Inc. for approximately $250 million in cash. AER is accounted for as a discontinued operation and its results of operations have been removed from the Company’s results of continuing operations for all periods presented. The fiscal 2003 fourth quarter includes approximately $32 million of business interruption proceeds from the final settlement of the Company’s September 11, 2001 claim. During the fourth quarter of fiscal 2003, ARAMARK reached agreement for the sale of its 15% interest in a previously divested periodicals distribution business to the majority shareholder, and wrote down this investment to the expected recoverable amount. The resulting pre-tax charge of $10.7 million is included in “Other (income) expense.” During fiscal 2002, ARAMARK sold its ownership interests in the Boston Red Sox and a related entity, resulting in a pre-tax gain of $37.9 million, and recorded a pre-tax gain of $5.8 million, resulting principally from the sale of a residual interest in a previously divested business. These items totaling $43.7 million are included in “Other (income) expense.” These items have been excluded from the comparisons of Debt/EBITDA to enhance comparability due to the size and unusual nature of these items.
| Fiscal Year Ended | |||||||
| October 3, 2003 | September 27, 2002 | ||||||
Total Debt | $ | 1,729,881 | 1,875,180 | ||||
Net income | 301,092 | 269,912 | |||||
Less: Income from discontinued operations, net | (35,724 | ) | (18,592 | ) | |||
Add: Interest and other financing costs, net | 142,469 | 136,432 | |||||
Add: Provision for income taxes | 144,185 | 141,829 | |||||
Add: Depreciation and amortization | 262,944 | 229,608 | |||||
Less: Other (income) expense | 10,700 | (43,695 | ) | ||||
Less: Insurance proceeds | (31,990 | ) | — | ||||
EBITDA excluding Other Income and insurance proceeds | $ | 793,676 | 715,494 | ||||
Debt/EBITDA excluding Other Income and insurance proceeds | 2.2 | x | 2.6 | x | |||
2003 Earnings Analysis
| 2003 | 2002 | |||||||||||
Income from Cont. Ops. | Diluted EPS | Income from Cont. Ops. | Diluted EPS | |||||||||
As Reported | $ | 265.4 | $ | 1.34 | $ | 251.3 | $ | 1.25 | ||||
WTC insurance proceeds | - 19.7 | - .09 | — | — | ||||||||
Anderson News adjustment | 6.6 | + .03 | — | — | ||||||||
Debt Extinguishment charges | 4.7 | + .02 | — | — | ||||||||
Tax Provision adjustment | - 8.4 | - .04 | — | — | ||||||||
Spectrum Gain | — | — | - 6.4 | - .03 | ||||||||
Red Sox Gain | — | — | - 24.4 | - .12 | ||||||||
Adj. Income Cont. Ops. | $ | 248.6 | $ | 1.26 | $ | 220.5 | $ | 1.10 | ||||

1
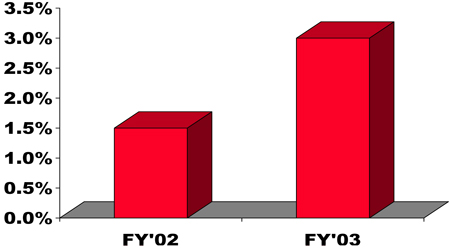
Organic Growth — FY03
| ¨ | Meaningful progress from Mission One efforts |
| ¨ | Progressing towards our stated objective of 6-8% organic growth |
– FY04 organic growth targeted objective of 4-6%
– FY04 Worldwide FSS organic growth target of 4-6%
– FY04 Uniform business organic growth target of 1-3%
1
ARAMARK CORPORATION AND SUBSIDIARIES
RECONCILIATION OF NON-GAAP MEASURES
ORGANIC GROWTH
(Unaudited)
(In Thousands)
The impact of currency translation has been excluded from the comparison of sales to enhance comparability, by identifying the portion of the change in sales related to changes in foreign currency, which provides a comparison of sales on a constant currency basis.
| Three Months Ended | % Change | Fiscal Year Ended | % Change | |||||||||||||||||
Fiscal 2003 Results | October 3, 2003 | September 27, 2002 | October 3, 2003 | September 27, 2002 | ||||||||||||||||
Food and Support Services—Sales (as reported) | $ | 2,204,111 | $ | 1,826,713 | 21 | % | $ | 7,969,220 | $ | 6,917,271 | 15 | % | ||||||||
Less: Impact of Currency Translation | — | (28,203 | ) | — | (129,759 | ) | ||||||||||||||
Food and Support Services—Sales (as adjusted) | $ | 2,204,111 | $ | 1,854,916 | 19 | % | $ | 7,969,220 | $ | 7,047,030 | 13 | % | ||||||||
ARAMARK Corporation Consolidated Sales (as reported) | $ | 2,588,015 | $ | 2,180,925 | 19 | % | $ | 9,447,815 | $ | 8,356,007 | 13 | % | ||||||||
Less: Impact of Currency Translation | — | (28,203 | ) | — | (129,759 | ) | ||||||||||||||
ARAMARK Corporation Consolidated Sales (as adjusted) | $ | 2,588,015 | $ | 2,209,128 | 17 | % | $ | 9,447,815 | $ | 8,485,766 | 11 | % | ||||||||
| Fiscal Year Ended | % Change | |||||||||||||||||||
Fiscal 2002 Results | September 27, 2002 | September 28, 2001 | ||||||||||||||||||
Food and Support Services—Sales (as reported) | $ | 6,917,271 | $ | 5,935,495 | 17 | % | ||||||||||||||
Less: Impact of Currency Translation | — | (15,715 | ) | |||||||||||||||||
Food and Support Services—Sales (as adjusted) | $ | 6,917,271 | $ | 5,951,210 | 16 | % | ||||||||||||||
ARAMARK Corporation Consolidated Sales (as reported) | $ | 8,356,007 | $ | 7,369,492 | 13 | % | ||||||||||||||
Less: Impact of Currency Translation | — | (15,715 | ) | |||||||||||||||||
ARAMARK Corporation Consolidated Sales (as adjusted) | $ | 8,356,007 | $ | 7,385,207 | 13 | % | ||||||||||||||
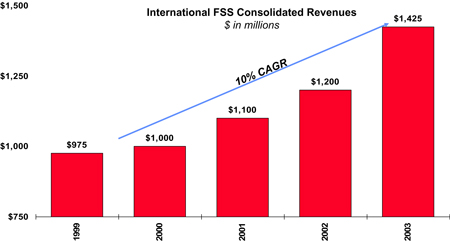
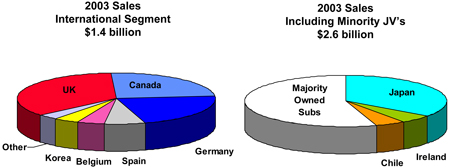
Since 1999, International FSS consolidated sales have grown at an annual rate of 10% to $1.4 billion
1
Adding all sales from minority-owned joint ventures, the total reached $2.6 billion in 2003
2
We are growing attractively from solid positions in our principal international markets
Country | Market Position | Annual Sales Range | ||
Japan | Top 3 | $900M—$1B | ||
United Kingdom | Top 3 | $500M—$600M | ||
Canada | Top 3 | $300M—$400M | ||
Germany | Top 3 | $300M—$400M | ||
Ireland | Top 3 | $100M—$150M | ||
Chile | Top 3 | $100M—$150M | ||
Spain | Top 5 | $100M—$150M | ||
Belgium | Top 3 | $50M—$75M | ||
Korea | Top 5 | $50M—$75M | ||
3