EXHIBIT 99.1
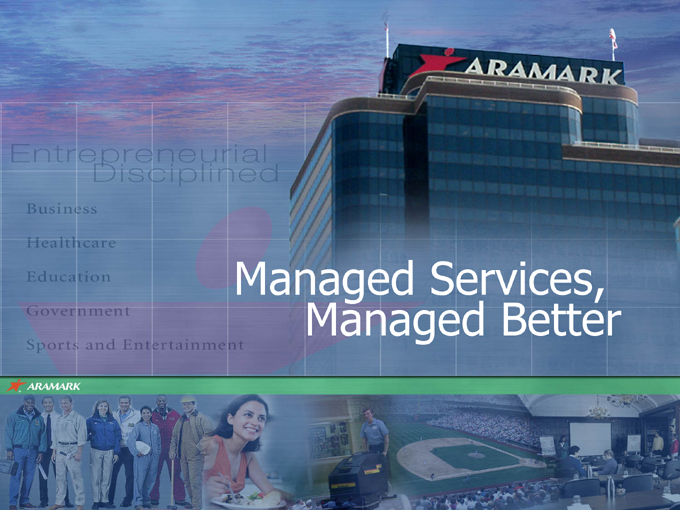
Entrepreneurial Disciplined
Business
Healthcare
Education
Government
Sports and Entertainment
Exhibit 99.1
Managed Services, Managed Better
Special Note about Forward-Looking Statements
This presentation includes “forward-looking statements” within the meaning of the Private Securities Litigation Reform Act of 1995 that reflect our current views as to future events and financial performance with respect to our operations. These statements can be identified by the fact that they do not relate strictly to historical or current facts. They use words such as “aim,” “anticipate,” “estimate,” “expect,” “will be,” “will continue,” “will likely result,” “project,” “intend,” “plan,” “believe” and other words and terms of similar meaning in conjunction with a discussion of future operating or financial performance.
These statements are subject to risks and uncertainties that could cause actual results to differ materially from those expressed or implied in the forward-looking statements.
Factors that might cause such a difference include: unfavorable economic conditions; ramifications of any future terrorist attacks or increased security alert levels; increased operating costs, including labor-related and energy costs; shortages of qualified personnel or increases in labor costs; costs and possible effects of union organizing activities; currency risks and other risks associated with international markets; risks associated with acquisitions, including acquisition integration costs; our ability to integrate and derive the expected benefits from our recent acquisitions; competition; decline in attendance at client facilities; unpredictability of sales and expenses due to contract terms and terminations; the contract intensive nature of our business, which may lead to client disputes; high leverage; claims relating to the provision of food services; costs of compliance with governmental regulations and government investigations; liability associated with noncompliance with governmental regulations, including regulations pertaining to food services, the environment, Federal and state employment laws and wage and hour laws and import and export controls and customs laws; inability to retain current clients and renew existing client contracts; determination by customers to reduce their outsourcing and use of preferred vendors; seasonality; and other risks that are set forth in the “Risk Factors” sections of ARAMARK’s SEC filings.
For further information regarding risks and uncertainties associated with ARAMARK’s business, please refer to the “Management’s
Discussion and Analysis of Results of Operations and Financial Condition” and “Risk Factors” and other sections of ARAMARK’s SEC filings, including, but not limited to, our annual report on Form 10-K and quarterly reports on Form 10-Q, copies of which may be obtained by contacting ARAMARK’s investor relations department via its web site www.aramark.com.
Forward-looking statements speak only as of the date made. We undertake no obligation to update any forward-looking statements to reflect the events or circumstances arising after the date as of which they are made. As a result of these risks and uncertainties, readers are cautioned not to place undue reliance on the forward-looking statements included herein or that may be made elsewhere from time to time by, or on behalf of, us.
Important Disclosure
In this presentation, we mention certain financial measures that are considered non-GAAP. Generally, a non-GAAP financial measure is a numerical measure of a company’s performance, financial position, or cash flows that either excludes or includes items different than those prepared or presented in accordance with generally accepted accounting principles. Following this presentation we have prepared disclosures and reconciliations of non-GAAP financial measures that were used in this presentation and may be used periodically by management when discussing the Company’s financial results with investors and analysts.
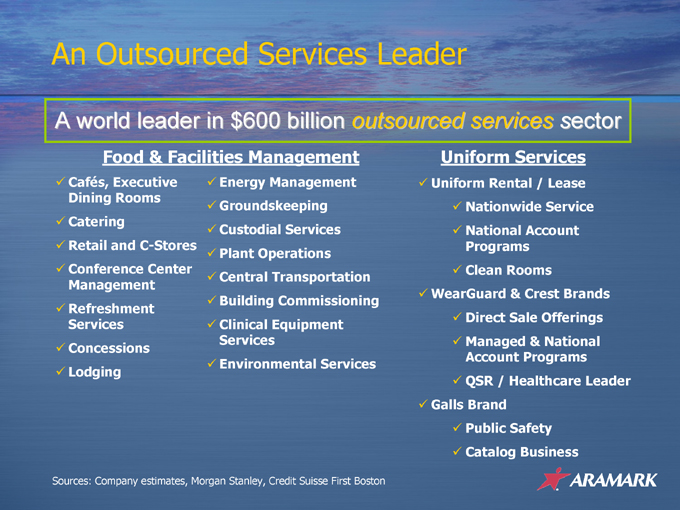
An Outsourced Services Leader
A world leader in $600 billion outsourced services sector
Food & Facilities Management Uniform Services
Cafés, Executive Energy Management Uniform Rental / Lease
Dining Rooms
Groundskeeping Nationwide Service
Catering
Retail and C-Stores Custodial Services National Account Programs
Plant Operations
Conference Center Clean Rooms
Central Transportation
Management
WearGuard & Crest Brands
Building Commissioning
Refreshment Services Direct Sale Offerings
Clinical Equipment Services Managed & National
Concessions
Account Programs
Environmental Services
Lodging
QSR / Healthcare Leader
Galls Brand
Public Safety
Catalog Business
Sources: Company estimates, Morgan Stanley, Credit Suisse First Boston
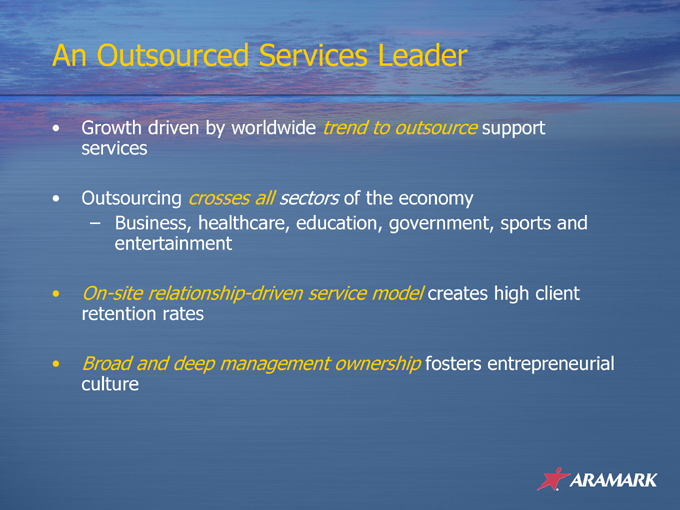
An Outsourced Services Leader
Growth driven by worldwide trend to outsource support services
Outsourcing crosses all sectors of the economy
Business, healthcare, education, government, sports and entertainment
On-site relationship-driven service model creates high client
retention rates
Broad and deep management ownership fosters entrepreneurial
culture
Drivers of Outsourcing
Client focus on core business
Gain access to world-class capabilities, efficiencies Service innovation, quality and end-user satisfaction Cost effectiveness: Control operating costs
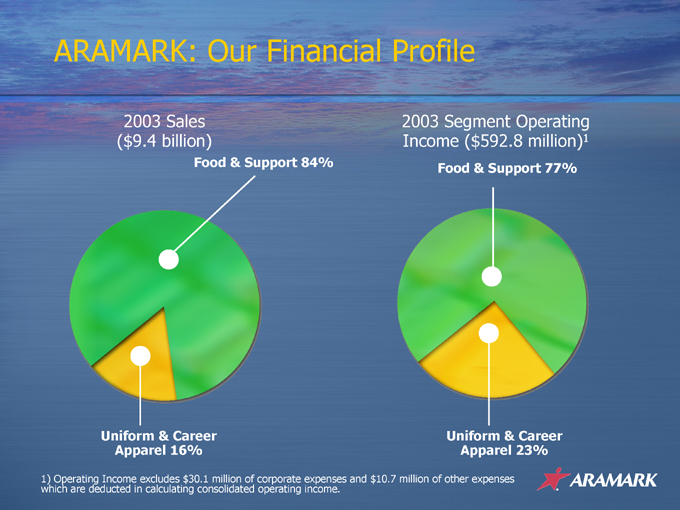
ARAMARK: Our Financial Profile
2003 Sales 2003 Segment Operating
($9.4 billion) Income ($592.8 million)1
Food & Support 84% Food & Support 77%
Uniform & Career Apparel 16% Uniform & Career Apparel 23%
1) Operating Income excludes $30.1 million of corporate expenses and $10.7 million of other expenses which are deducted in calculating consolidated operating income.
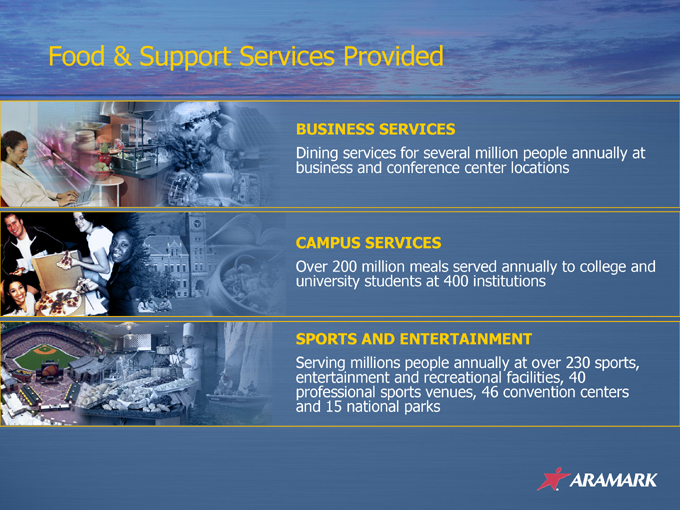
Food & Support Services Provided
BUSINESS SERVICES
Dining services for several million people annually at business and conference center locations
CAMPUS SERVICES
Over 200 million meals served annually to college and university students at 400 institutions
SPORTS AND ENTERTAINMENT
Serving millions people annually at over 230 sports, entertainment and recreational facilities, 40 professional sports venues, 46 convention centers and 15 national parks
Food & Support Services Provided
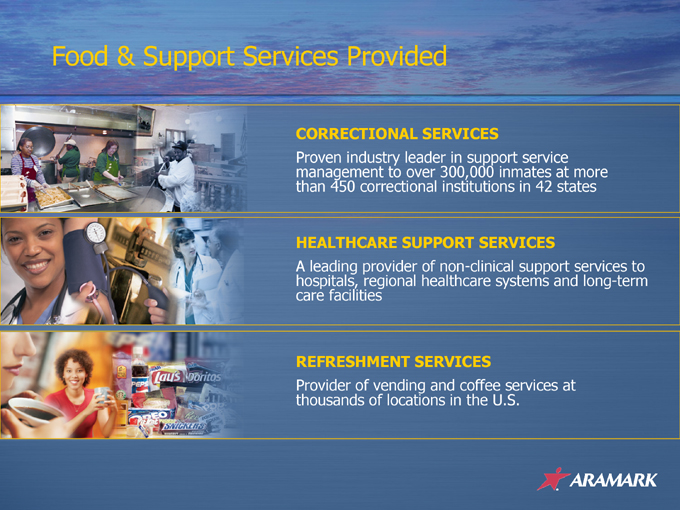
CORRECTIONAL SERVICES
Proven industry leader in support service management to over 300,000 inmates at more than 450 correctional institutions in 42 states
HEALTHCARE SUPPORT SERVICES
A leading provider of non-clinical support services to hospitals, regional healthcare systems and long-term care facilities
REFRESHMENT SERVICES
Provider of vending and coffee services at thousands of locations in the U.S.
Food & Support Services Provided
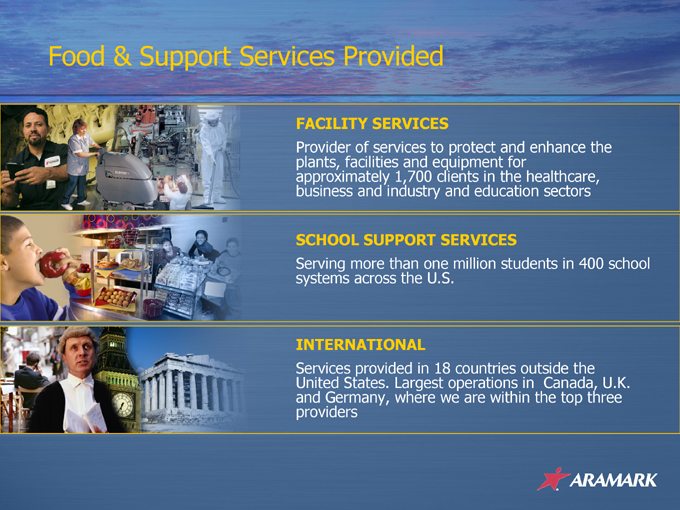
FACILITY SERVICES
Provider of services to protect and enhance the plants, facilities and equipment for approximately 1,700 clients in the healthcare, business and industry and education sectors
SCHOOL SUPPORT SERVICES
Serving more than one million students in 400 school systems across the U.S.
INTERNATIONAL
Services provided in 18 countries outside the United States. Largest operations in Canada, U.K. and Germany, where we are within the top three providers
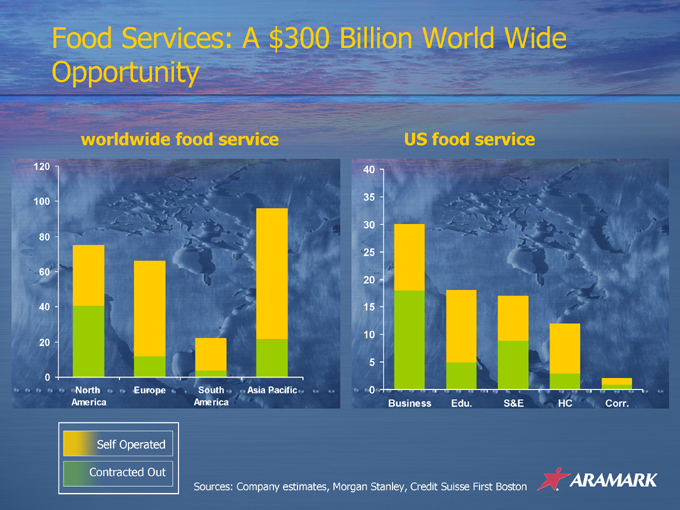
Food Services: A $300 Billion World Wide Opportunity
worldwide food service US food service
120 100 80 60 40 20 0
North America Europe South America Asia Pacific
40 35 30 25 20 15 10 5 0
Business Edu. S&E HC Corr.
Self Operated
Contracted Out
Sources: Company estimates, Morgan Stanley, Credit Suisse First Boston
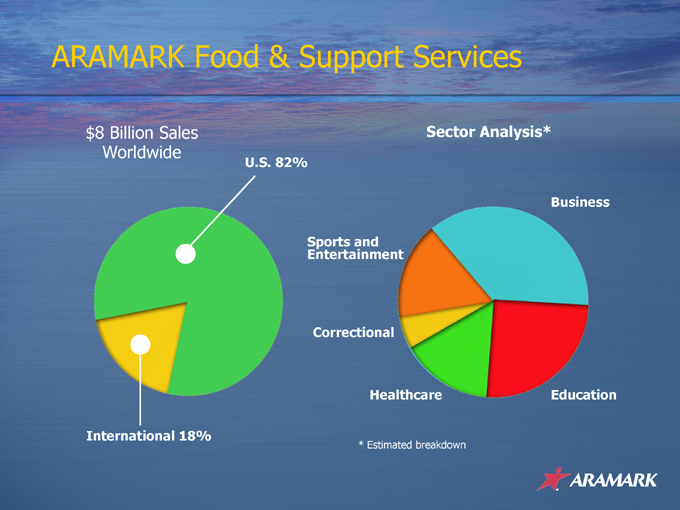
ARAMARK Food & Support Services
$8 Billion Sales Sector Analysis* Worldwide
U.S. 82%
Business Sports and Entertainment Correctional Healthcare * Estimated breakdown Education International 18%
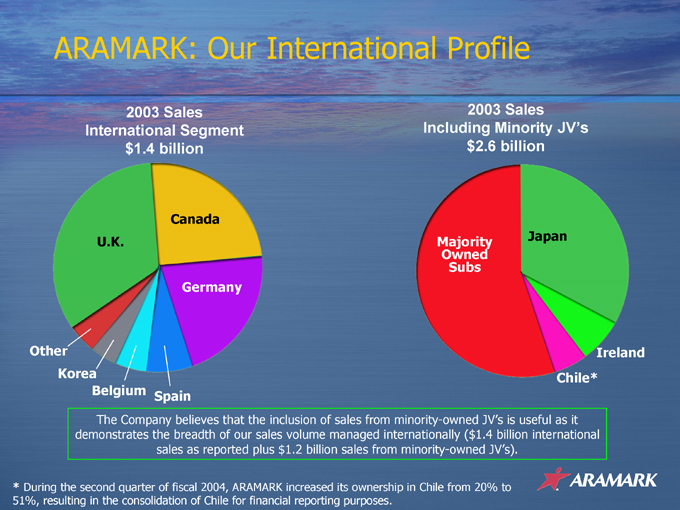
ARAMARK: Our International Profile
2003 Sales International Segment $1.4 billion 2003 Sales Including Minority JV’s $2.6 billion
U.K. Canada Germany
Other Korea Belgium Spain
Majority OwnedSubs Japan Ireland Chile*
The Company believes that the inclusion of sales from minority-owned JV’s is useful as it demonstrates the breadth of our sales volume managed internationally ($1.4 billion international sales as reported plus $1.2 billion sales from minority-owned JV’s).
* During the second quarter of fiscal 2004, ARAMARK increased its ownership in Chile from 20% to 51%, resulting in the consolidation of Chile for financial reporting purposes.

Facility Services:
Another $300 Billion World Wide Opportunity
worldwide facilities services US facilities services
240 200 160 120 80 40 0
Europe & ROW United States
50 40 30 20 10 0
Business Education Healthcare
Self Operated
Contracted Out
Sources: Company estimates, Morgan Stanley, Credit Suisse First Boston
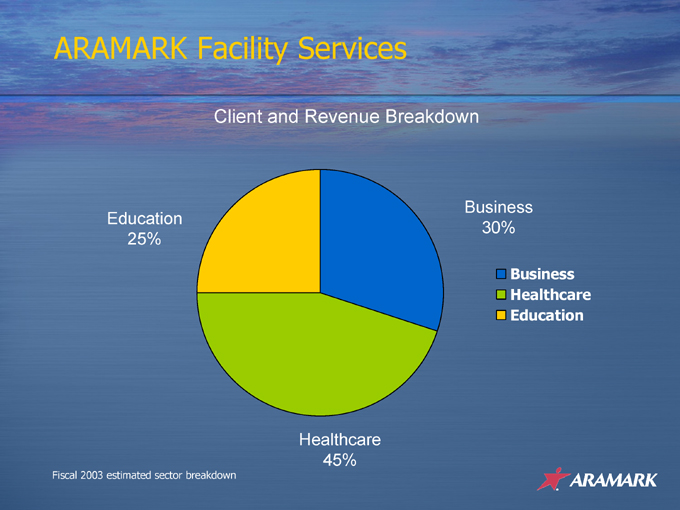
ARAMARK Facility Services
Client and Revenue Breakdown
Education 25%
Business 30%
Business Healthcare Education
Healthcare 45%
Fiscal 2003 estimated sector breakdown
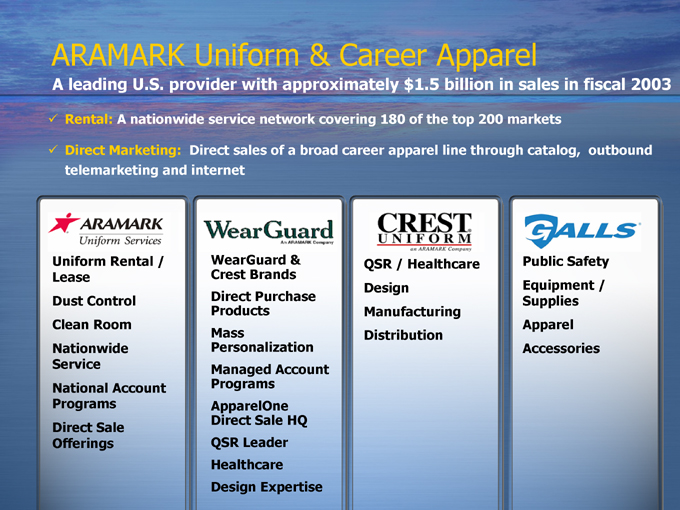
ARAMARK Uniform & Career Apparel
A leading U.S. provider with approximately $1.5 billion in sales in fiscal 2003
Rental: A nationwide service network covering 180 of the top 200 markets
Direct |
| Marketing: Direct sales of a broad career apparel line through catalog, outbound telemarketing and internet |
Uniform Rental / Lease Dust Control Clean Room Nationwide Service National Account Programs Direct Sale Offerings
WearGuard & Crest Brands Direct Purchase Products Mass Personalization Managed Account Programs ApparelOne Direct Sale HQ QSR Leader Healthcare Design Expertise
QSR / Healthcare Design Manufacturing Distribution
Public Safety Equipment / Supplies Apparel Accessories
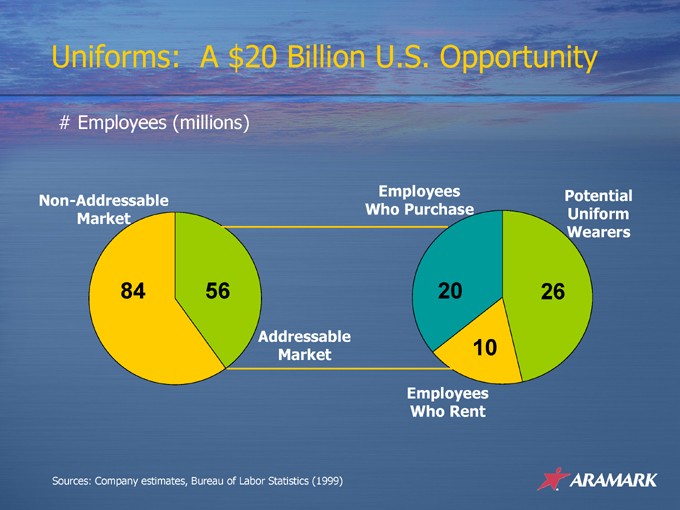
Uniforms: A $20 Billion U.S. Opportunity
# Employees (millions)
Non-Addressable Market
Employees Who Purchase
Potential Uniform Wearers
84 56 Addressable Market
20 26 10
Employees Who Rent
Sources: Company estimates, Bureau of Labor Statistics (1999)
ARAMARK Key Strategies & Objectives
Entrepreneurial approach to solving client challenges
Specific programs to drive organic growth
Emphasis on profit margin, cash flow and ROIC
Disciplined and “return-oriented” acquisition strategy
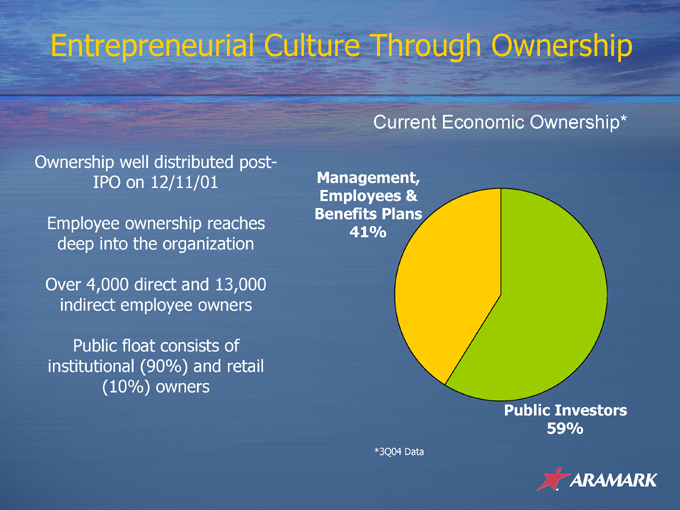
Entrepreneurial Culture Through Ownership
Current Economic Ownership*
Ownership well distributed post-IPO on 12/11/01
Employee ownership reaches deep into the organization
Over 4,000 direct and 13,000 indirect employee owners
Public float consists of institutional (90%) and retail (10%) owners
Management, Employees & Benefits Plans 41%
Public Investors 59%
*3Q04 Data
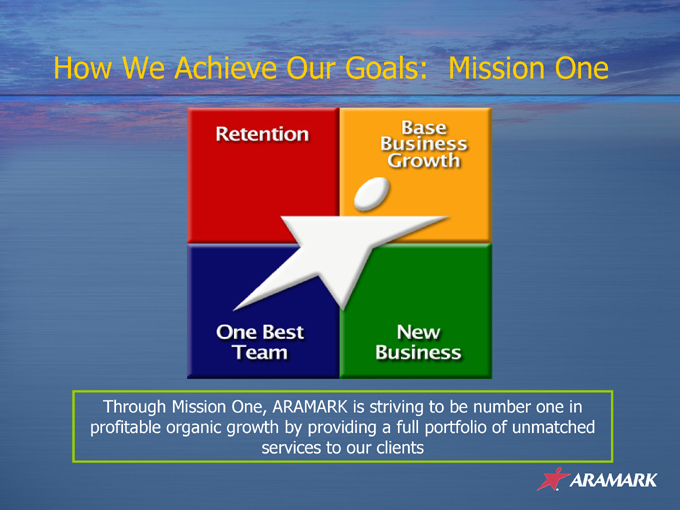
How We Achieve Our Goals: Mission One
Through Mission One, ARAMARK is striving to be number one in profitable organic growth by providing a full portfolio of unmatched services to our clients
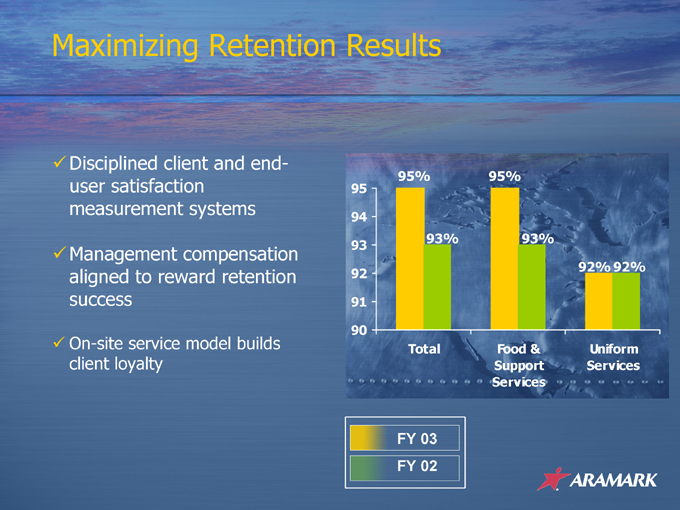
Maximizing Retention Results
Disciplined client and end-user satisfaction measurement systems
Management compensation aligned to reward retention success
On-site service model builds client loyalty
95 94 93 92 91 90
Total Food &Support Services Uniform Services
95% 93% 95% 93% 92% 92%
FY 03 FY 02
Increasing “Client Market Share”
How do we drive it higher?
Focus on quality and innovation
Marketing and promotion of products
Food Service “Build-out”
Food |
| Courts |
Catering |
|
On-Site |
| Convenience Stores |
Vending |
|
Coffee Kiosks
Branded concepts
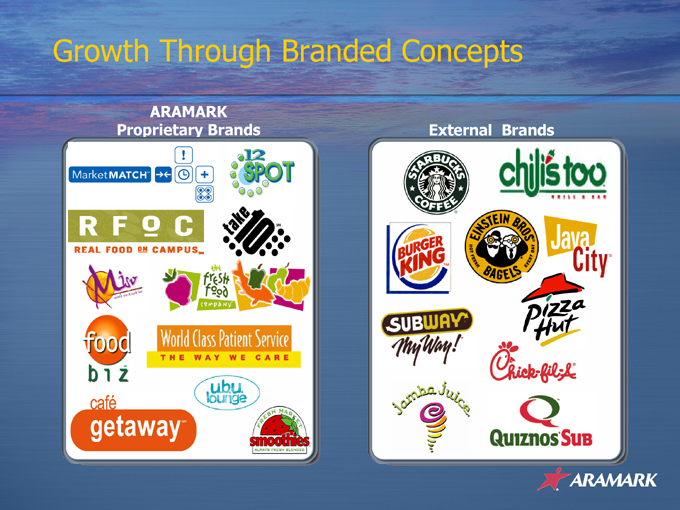
Growth Through Branded Concepts
ARAMARK
Proprietary Brands External Brands
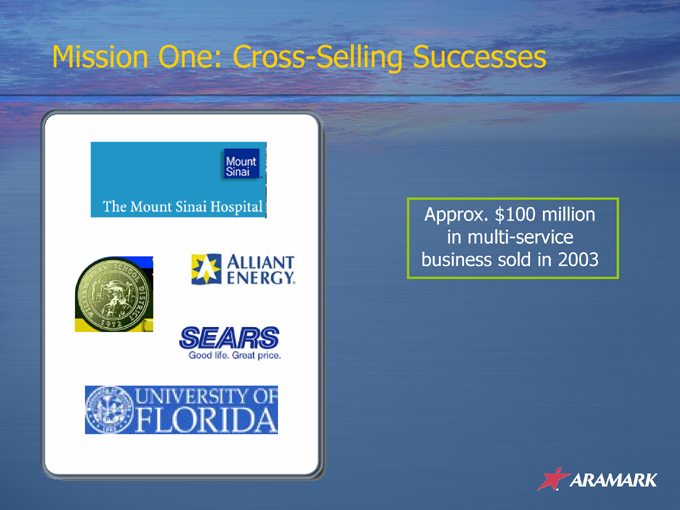
Mission One: Cross-Selling Successes
Approx. $100 million in multi-service business sold in 2003
Building the One Best Team
Fueling the talent pipeline
Leadership development
Five specific leadership development programs for 5,000 management employees
Workforce diversity
Reinforcing the culture of highly ethical standards and customer service
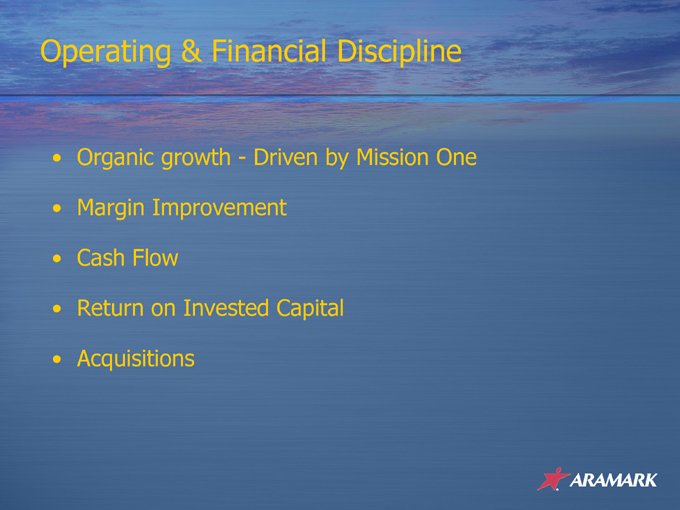
Operating & Financial Discipline
Organic growth—Driven by Mission One
Margin Improvement
Cash Flow
Return on Invested Capital
Acquisitions
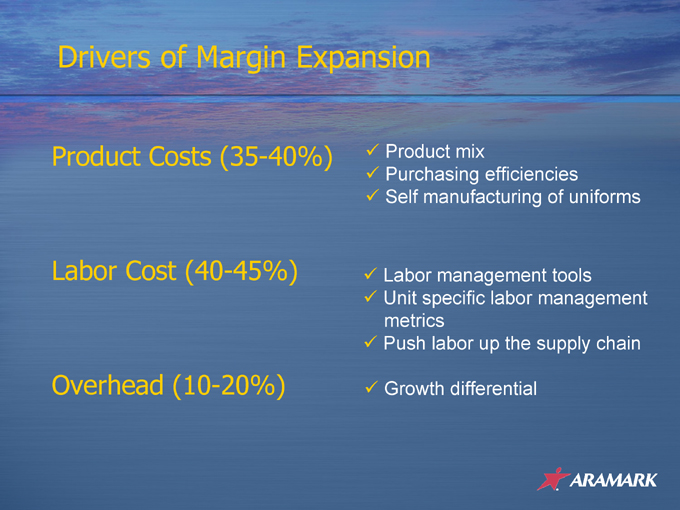
Drivers of Margin Expansion
Product Costs (35-40%) Product mix
Purchasing efficiencies
Self manufacturing of uniforms
Labor Cost (40-45%) Labor management tools
Unit specific labor management metrics
Push labor up the supply chain
Overhead (10-20%) Growth differential
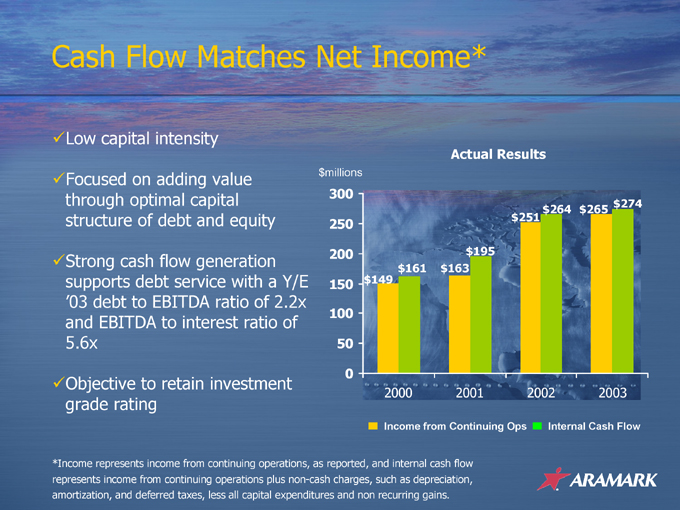
Cash Flow Matches Net Income*
Low capital intensity
Focused on adding value through optimal capital structure of debt and equity
Strong cash flow generation supports debt service with a Y/E ‘03 debt to EBITDA ratio of 2.2x and EBITDA to interest ratio of 5.6x
Objective to retain investment grade rating
Actual Results
$millions
300 250 200 150 100 50 0
2000 2001 2002 2003
$149 $161 $163 $195 $251 $264 $265 $274
Income from Continuing Ops Internal Cash Flow
*Income represents income from continuing operations, as reported, and internal cash flow represents income from continuing operations plus non-cash charges, such as depreciation, amortization, and deferred taxes, less all capital expenditures and non recurring gains.
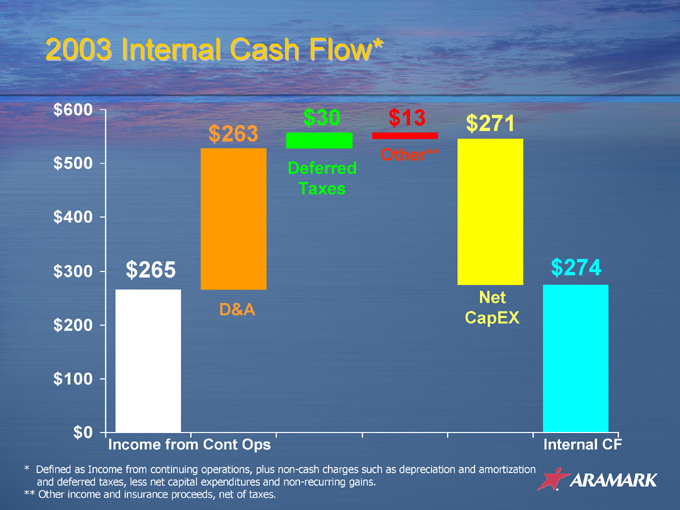
2003 Internal Cash Flow*
$600 $500 $400 $300 $200 $100 $0
Income from Cont Ops Internal CF
$265 $263 $30 $13 $271
Other**
Deferred Taxes
D&A
Net CapEX
$274
* |
| Defined as Income from continuing operations, plus non-cash charges such as depreciation and amortization and deferred taxes, less net capital expenditures and non-recurring gains. |
** Other income and insurance proceeds, net of taxes.
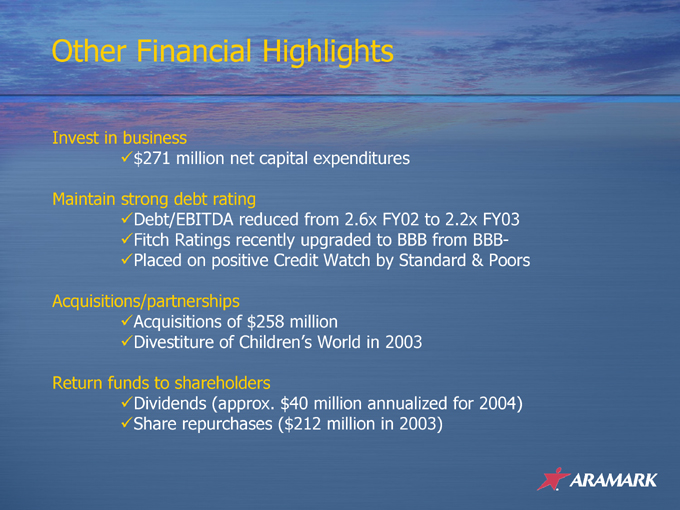
Other Financial Highlights
Invest in business
$271 million net capital expenditures
Maintain strong debt rating
Debt/EBITDA |
| reduced from 2.6x FY02 to 2.2x FY03 |
Fitch |
| Ratings recently upgraded to BBB from BBB- |
Placed on positive Credit Watch by Standard & Poors
Acquisitions/partnerships
Acquisitions |
| of $258 million |
Divestiture of Children’s World in 2003
Return funds to shareholders
Dividends |
| (approx. $40 million annualized for 2004) |
Share |
| repurchases ($212 million in 2003) |
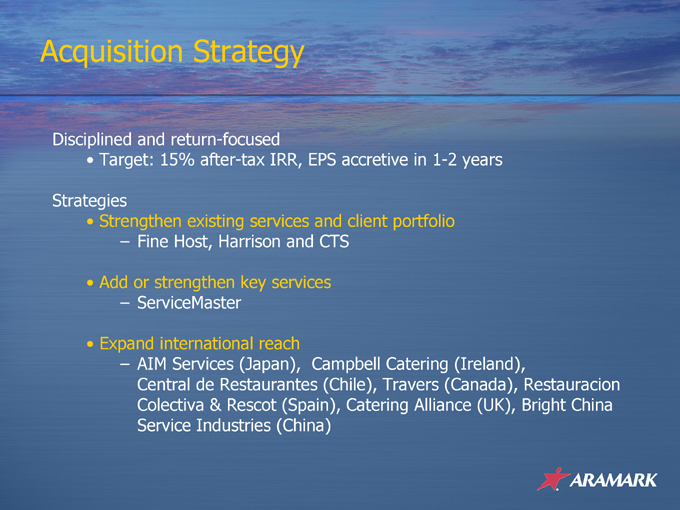
Acquisition Strategy
Disciplined and return-focused
Target: 15% after-tax IRR, EPS accretive in 1-2 years
Strategies
Strengthen |
| existing services and client portfolio |
Fine Host, Harrison and CTS
Add |
| or strengthen key services |
ServiceMaster
Expand |
| international reach |
AIM |
| Services (Japan), Campbell Catering (Ireland), |
Central de Restaurantes (Chile), Travers (Canada), Restauracion Colectiva & Rescot (Spain), Catering Alliance (UK), Bright China Service Industries (China)
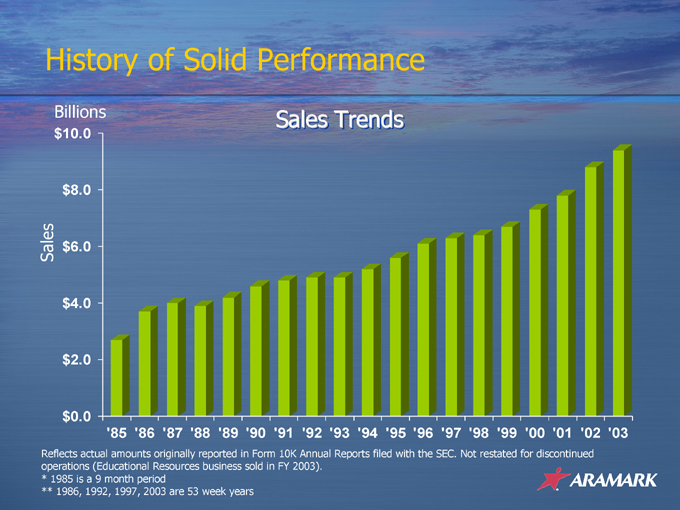
History of Solid Performance
Billions Sales Trends
$10.0 $8.0 $6.0 $4.0 $2.0 $0.0
Sales
‘85 ‘86 ‘87 ‘88 ‘89 ‘90 ‘91 ‘92 ‘93 ‘94 ‘95 ‘96 ‘97 ‘98 ‘99 ‘00 ‘01 ‘02 ‘03
Reflects actual amounts originally reported in Form 10K Annual Reports filed with the SEC. Not restated for discontinued operations (Educational Resources business sold in FY 2003).
* 1985 is a 9 month period
** 1986, 1992, 1997, 2003 are 53 week years
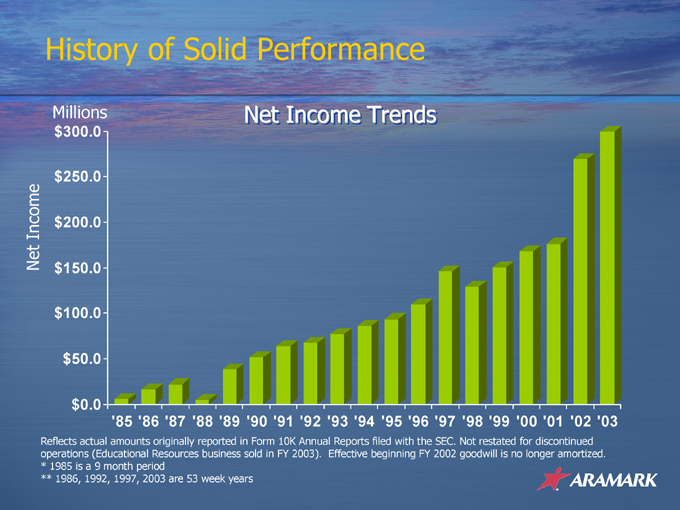
History of Solid Performance
Millions Net Income Trends
$300.0 $250.0 $200.0 $150.0 $100.0 $50.0 $0.0
Net Income
‘85 ‘86 ‘87 ‘88 ‘89 ‘90 ‘91 ‘92 ‘93 ‘94 ‘95 ‘96 ‘97 ‘98 ‘99 ‘00 ‘01 ‘02 ‘03
Reflects actual amounts originally reported in Form 10K Annual Reports filed with the SEC. Not restated for discontinued operations (Educational Resources business sold in FY 2003). Effective beginning FY 2002 goodwill is no longer amortized.
* 1985 is a 9 month period
** 1986, 1992, 1997, 2003 are 53 week years
ARAMARK Key Strengths
Robust outsourcing trends
Best-in-class service provider
Diversified client and revenue portfolio History of financial integrity and performance Barriers to entry
Strong, incentivized management team focused on profitable growth

We Can Do It All…
Dining & Refreshment Services ARAMARK ServiceMaster ARAMARK Harrison Lodging ARAMARK Uniform Services
Turnkey Hotel Operations Uniform rental/sale
Facilities Management
Café Dining Plant Operations & Management Maintenance Conference Center Operations Entry mats Linen
Retail Management
JAVA City Conference Planning Public Safety Needs
Small Site Solutions Energy Management Banquets/Fine Dining
Convenience Stores Grounds Maintenance Meeting AV/IT Services
Vending Housekeeping Services Rooms Operations
Office Coffee Capital Program Management
Office Services
MyAssistant Building Commissioning
Strategic Facilities Planning

Entrepreneurial Disciplined
Business
Healthcare
Education
Government
Sports and Entertainment
Managed Services, Managed Better
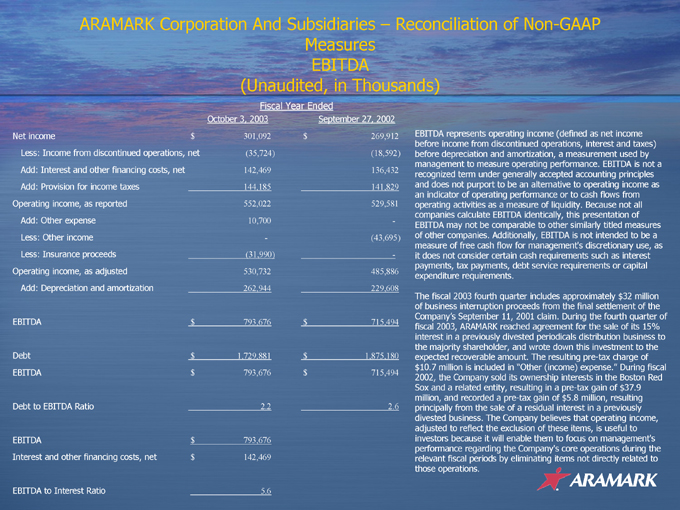
ARAMARK Corporation And Subsidiaries – Reconciliation of Non-GAAP Measures EBITDA
(Unaudited, in Thousands)
EBITDA represents operating income (defined as net income before income from discontinued operations, interest and taxes) before depreciation and amortization, a measurement used by management to measure operating performance. EBITDA is not a recognized term under generally accepted accounting principles and does not purport to be an alternative to operating income as an indicator of operating performance or to cash flows from operating activities as a measure of liquidity. Because not all companies calculate EBITDA identically, this presentation of EBITDA may not be comparable to other similarly titled measures of other companies. Additionally, EBITDA is not intended to be a measure of free cash flow for management’s discretionary use, as it does not consider certain cash requirements such as interest payments, tax payments, debt service requirements or capital expenditure requirements.
The fiscal 2003 fourth quarter includes approximately $32 million of business interruption proceeds from the final settlement of the Company’s September 11, 2001 claim. During the fourth quarter of fiscal 2003, ARAMARK reached agreement for the sale of its 15% interest in a previously divested periodicals distribution business to the majority shareholder, and wrote down this investment to the expected recoverable amount. The resulting pre-tax charge of $10.7 million is included in “Other (income) expense.” During fiscal 2002, the Company sold its ownership interests in the Boston Red Sox and a related entity, resulting in a pre-tax gain of $37.9 million, and recorded a pre-tax gain of $5.8 million, resulting principally from the sale of a residual interest in a previously divested business. The Company believes that operating income, adjusted to reflect the exclusion of these items, is useful to investors because it will enable them to focus on management’s performance regarding the Company’s core operations during the relevant fiscal periods by eliminating items not directly related to those operations.
Fiscal Year Ended
October 3, 2003 September 27, 2002
Net income $301,092 $269,912
Less: Income from discontinued operations, net (35,724) (18,592)
Add: Interest and other financing costs, net 142,469 136,432
Add: Provision for income taxes 144,185 141,829
Operating income, as reported 552,022 529,581
Add: Other expense 10,700 -
Less: Other income - (43,695)
Less: Insurance proceeds (31,990) -
Operating income, as adjusted 530,732 485,886
Add: Depreciation and amortization 262,944 229,608
EBITDA $793,676 $715,494
Debt $1,729,881 $1,875,180
EBITDA $793,676 $715,494
Debt to EBITDA Ratio 2.2 2.6
EBITDA $793,676
Interest and other financing costs, net $142,469
EBITDA to Interest Ratio 5.6
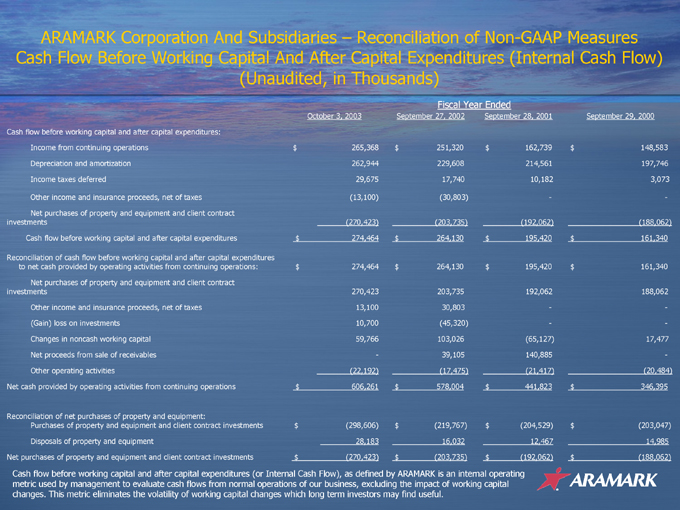
ARAMARK Corporation And Subsidiaries – Reconciliation of Non-GAAP Measures Cash Flow Before Working Capital And After Capital Expenditures (Internal Cash Flow) (Unaudited, in Thousands)
Fiscal Year Ended
October 3, 2003 September 27, 2002 September 28, 2001 September 29, 2000
Cash flow before working capital and after capital expenditures:
Income from continuing operations $265,368 $251,320 $162,739 $148,583
Depreciation and amortization 262,944 229,608 214,561 197,746
Income taxes deferred 29,675 17,740 10,182 3,073
Other income and insurance proceeds, net of taxes (13,100) (30,803) - -
Net purchases of property and equipment and client contract investments (270,423) (203,735) (192,062) (188,062)
Cash flow before working capital and after capital expenditures $274,464 $264,130 $195,420 $161,340
Reconciliation of cash flow before working capital and after capital expenditures
to net cash provided by operating activities from continuing operations: $274,464 $264,130 $195,420 $161,340
Net purchases of property and equipment and client contract investments 270,423 203,735 192,062 188,062
Other income and insurance proceeds, net of taxes 13,100 30,803 - -
(Gain) loss on investments 10,700 (45,320) - -
Changes in noncash working capital 59,766 103,026 (65,127) 17,477
Net proceeds from sale of receivables - 39,105 140,885 -
Other operating activities (22,192) (17,475) (21,417) (20,484)
Net cash provided by operating activities from continuing operations $606,261 $578,004 $441,823 $346,395
Reconciliation of net purchases of property and equipment:
Purchases of property and equipment and client contract investments $(298,606) $(219,767) $(204,529) $(203,047)
Disposals of property and equipment 28,183 16,032 12,467 14,985
Net purchases of property and equipment and client contract investments $(270,423) $(203,735) $(192,062) $(188,062)
Cash flow before working capital and after capital expenditures (or Internal Cash Flow), as defined by ARAMARK is an internal operating metric used by management to evaluate cash flows from normal operations of our business, excluding the impact of working capital changes. This metric eliminates the volatility of working capital changes which long term investors may find useful.