Exhibit 99.1

Managed Services, Managed Better
Special Note about Forward-Looking Statements
This presentation includes “forward-looking statements” within the meaning of the Private Securities Litigation Reform Act of 1995 that reflect our current views as to future events and financial performance with respect to our operations. These statements can be identified by the fact that they do not relate strictly to historical or current facts. They use words such as “aim,” “anticipate,” “estimate,” “expect,” “will be,” “will continue,” “will likely result,” “project,” “intend,” “plan,” “believe” and other words and terms of similar meaning in conjunction with a discussion of future operating or financial performance. These statements are subject to risks and uncertainties that could cause actual results to differ materially from those expressed or implied in the forward-looking statements.
Factors that might cause such a difference include: unfavorable economic conditions; ramifications of any future terrorist attacks or increased security alert levels; increased operating costs, including labor-related and energy costs; shortages of qualified personnel or increases in labor costs; costs and possible effects of union organizing activities; currency risks and other risks associated with international markets; risks associated with acquisitions, including acquisition integration costs; our ability to integrate and derive the expected benefits from our recent acquisitions; competition; decline in attendance at client facilities; unpredictability of sales and expenses due to contract terms and terminations; the contract intensive nature of our business, which may lead to client disputes; high leverage; claims relating to the provision of food services; costs of compliance with governmental regulations and government investigations; liability associated with noncompliance with governmental regulations, including regulations pertaining to food services, the environment, Federal and state employment laws and wage and hour laws and import and export controls and customs laws; dram shop litigation; inability to retain current clients and renew existing client contracts; determination by customers to reduce their outsourcing and use of preferred vendors; seasonality; and other risks that are set forth in the “Risk Factors” sections of ARAMARK’s SEC filings.
For further information regarding risks and uncertainties associated with ARAMARK’s business, please refer to the “Management’s Discussion and Analysis of Results of Operations and Financial Condition” and “Risk Factors” and other sections of ARAMARK’s SEC filings, including, but not limited to, our annual report on Form 10-K and quarterly reports on Form 10-Q, copies of which may be obtained by contacting ARAMARK’s investor relations department via its web site www.aramark.com.
Forward-looking statements speak only as of the date made. We undertake no obligation to update any forward-looking statements to reflect the events or circumstances arising after the date as of which they are made. As a result of these risks and uncertainties, readers are cautioned not to place undue reliance on the forward-looking statements included herein or that may be made elsewhere from time to time by, or on behalf of, us.
Important Disclosure
In this presentation, we mention certain financial measures that are considered non-GAAP. Generally, a non-GAAP financial measure is a numerical measure of a company’s performance, financial position, or cash flows that either excludes or includes items different than those prepared or presented in accordance with generally accepted accounting principles. We have prepared disclosures and reconciliations of non-GAAP financial measures that were used in this presentation and may be used periodically by management when discussing the Company’s financial results with investors and analysts, which are available on our website www.aramark.com.
2
ARAMARK: An Outsourced Services Leader
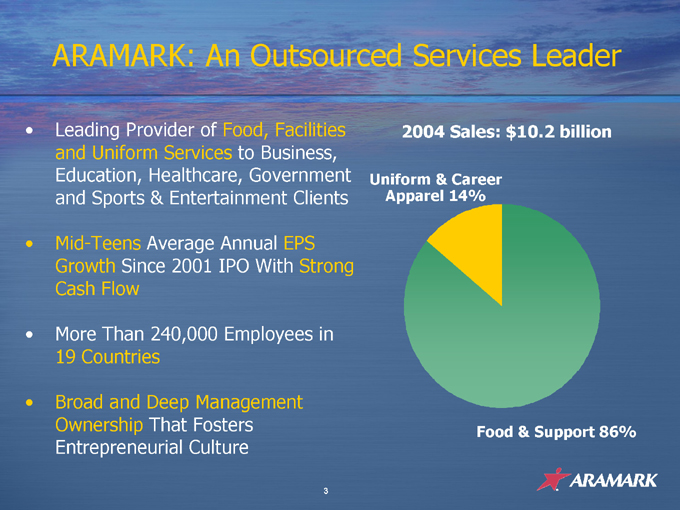
Leading Provider of Food, Facilities and Uniform Services to Business, Education, Healthcare, Government and Sports & Entertainment Clients
Mid-Teens Average Annual EPS Growth Since 2001 IPO With Strong Cash Flow
More Than 240,000 Employees in 19 Countries
Broad and Deep Management Ownership That Fosters Entrepreneurial Culture
2004 Sales: $10.2 billion
Uniform & Career Apparel 14%
Food & Support 86%
3
Entrepreneurial Culture Through Ownership
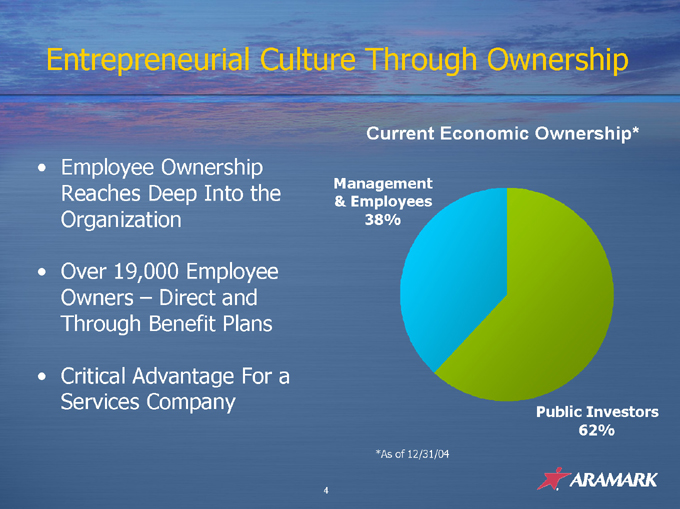
Employee Ownership Reaches Deep Into the Organization
Over 19,000 Employee Owners – Direct and Through Benefit Plans
Critical Advantage For a Services Company
Current Economic Ownership*
Management & Employees 38%
*As of 12/31/04
Public Investors 62%
4
Drivers of Outsourcing
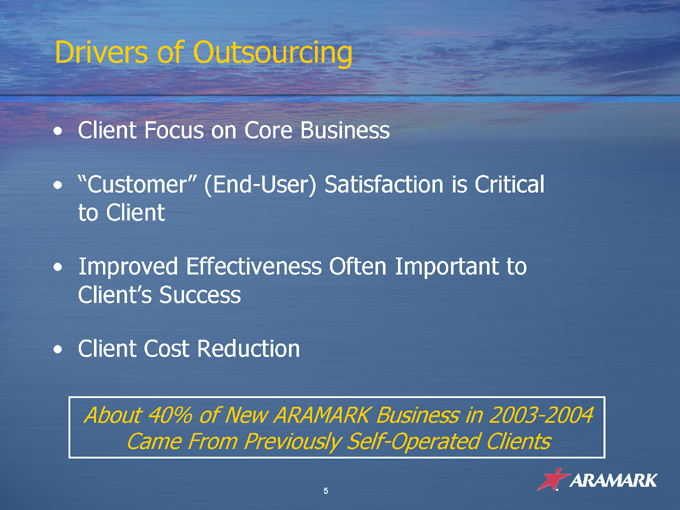
Client Focus on Core Business
“Customer” (End-User) Satisfaction is Critical to Client
Improved Effectiveness Often Important to Client’s Success
Client Cost Reduction
About 40% of New ARAMARK Business in 2003-2004 Came From Previously Self-Operated Clients
5
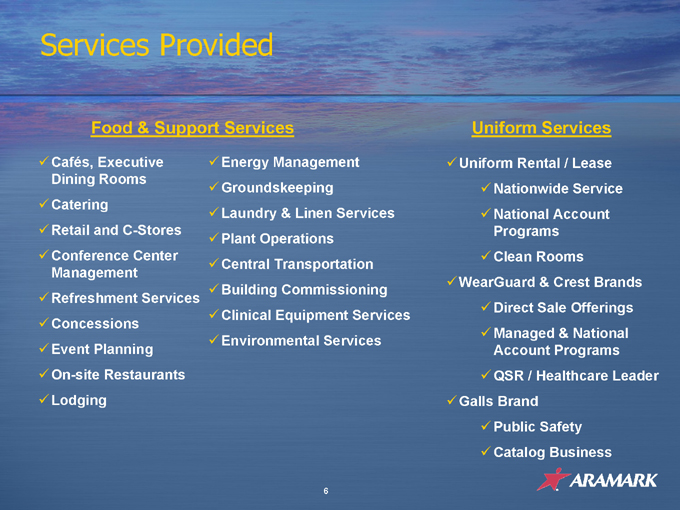
Services Provided
Food & Support Services
Cafés, Executive Dining Rooms
Catering Retail and C-Stores Conference Center Management Refreshment Services Concessions Event Planning On-site Restaurants Lodging
Energy Management Groundskeeping Laundry & Linen Services Plant Operations Central Transportation Building Commissioning Clinical Equipment Services Environmental Services
Uniform Services
Uniform Rental / Lease
Nationwide Service National Account Programs Clean Rooms
WearGuard & Crest Brands
Direct Sale Offerings Managed & National Account Programs QSR / Healthcare Leader
Galls Brand
Public Safety Catalog Business
6
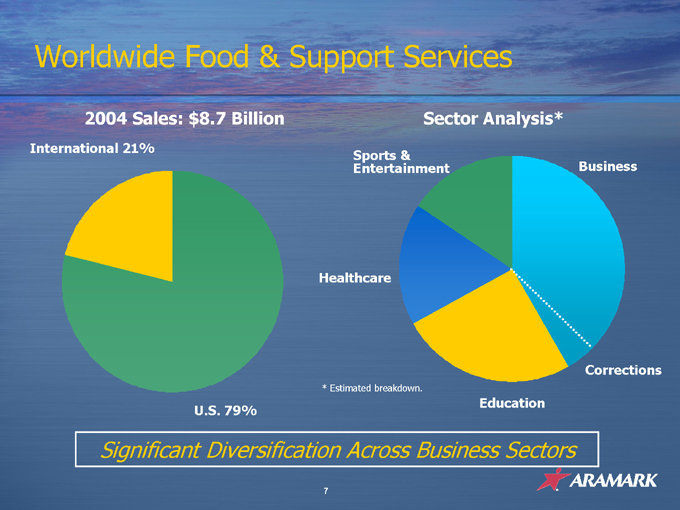
Worldwide Food & Support Services
2004 Sales: $8.7 Billion
International 21%
U.S. 79%
Sector Analysis*
Sports & Entertainment
Healthcare
* Estimated breakdown.
Education
Corrections
Business
Significant Diversification Across Business Sectors
7
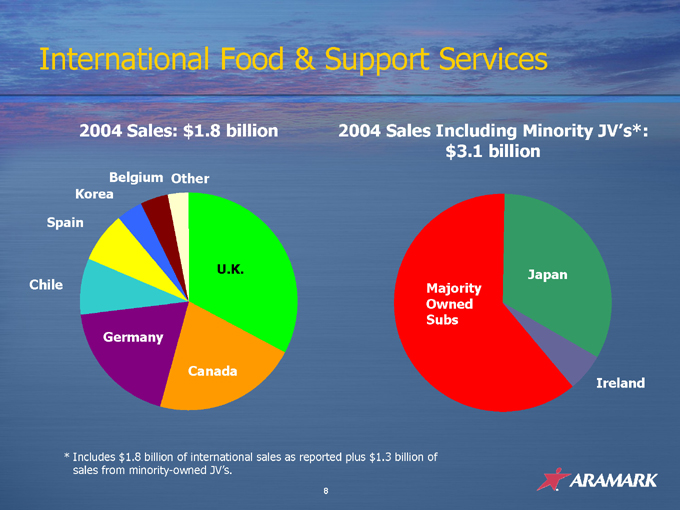
International Food & Support Services
2004 Sales: $1.8 billion
Belgium Other
Korea
Spain
Chile
U.K.
Germany
Canada
2004 Sales Including Minority JV’s*: $3.1 billion
Majority Owned Subs
Japan
Ireland
* Includes $1.8 billion of international sales as reported plus $1.3 billion of sales from minority-owned JV’s.
8
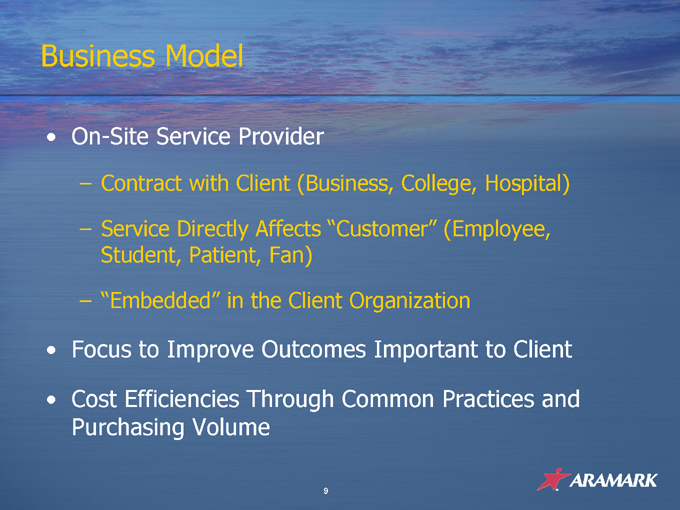
Business Model
On-Site Service Provider
Contract with Client (Business, College,
Hospital) Service Directly Affects “Customer” (Employee, Student, Patient, Fan) “Embedded” in the Client Organization
Focus to Improve Outcomes Important to Client Cost Efficiencies Through Common Practices and Purchasing Volume
9
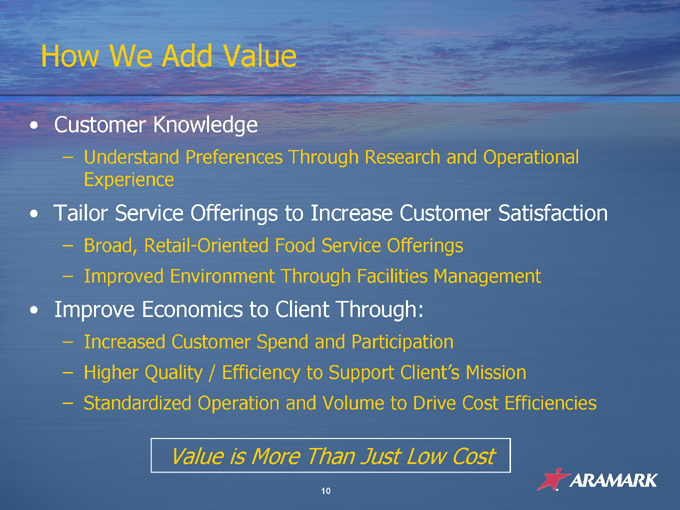
How We Add Value
Customer Knowledge
Understand Preferences Through Research and Operational Experience
Tailor Service Offerings to Increase Customer Satisfaction
Broad, Retail-Oriented Food Service Offerings
Improved Environment Through Facilities Management
Improve Economics to Client Through:
Increased Customer Spend and Participation
Higher Quality / Efficiency to Support Client’s Mission
Standardized Operation and Volume to Drive Cost Efficiencies
Value is More Than Just Low Cost
10
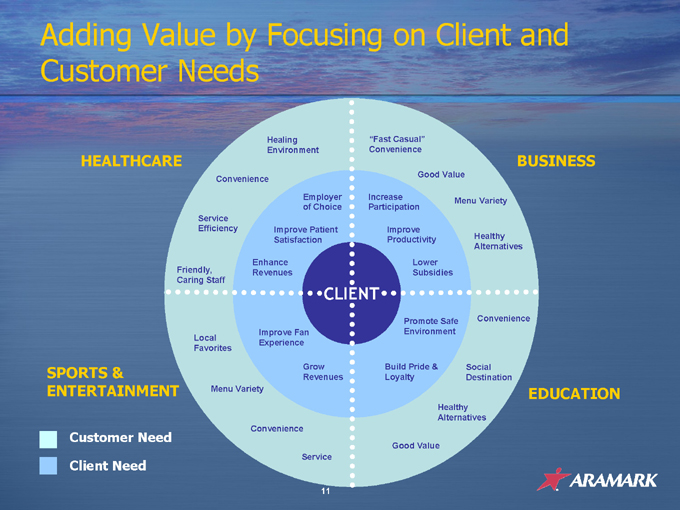
Adding Value by Focusing on Client and Customer Needs
HEALTHCARE
SPORTS & ENTERTAINMENT
BUSINESS
EDUCATION
Healing Environment
Convenience
Service Efficiency
Friendly, Caring Staff
Local Favorites
Menu Variety
Convenience
Service
Good Value
Healthy Alternatives
Social Destination
Convenience
Healthy Alternatives
Menu Variety
Good Value
“Fast Casual” Convenience
Employer of Choice
Improve Patient Satisfaction
Enhance Revenues
Improve Fan Experience
Grow Revenues
Build Pride & Loyalty
Promote Safe Environment
Lower Subsidies
Improve Productivity
Increase Participation
Customer Need
Client Need
11
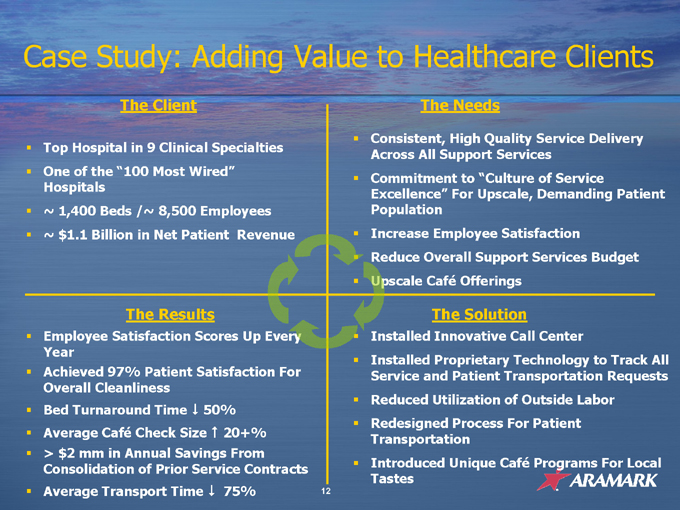
Case Study: Adding Value to Healthcare Clients
The Client
Top Hospital in 9 Clinical Specialties
One of the “100 Most Wired” Hospitals
~ 1,400 Beds /~ 8,500 Employees
~ $1.1 Billion in Net Patient Revenue
The Results
Employee Satisfaction Scores Up Every Year
Achieved 97% Patient Satisfaction For Overall Cleanliness
Bed Turnaround Time 50%
Average Café Check Size 20+%
> $2 mm in Annual Savings From Consolidation of Prior Service Contracts
Average Transport Time 75%
The Needs
Consistent, High Quality Service Delivery Across All Support Services
Commitment to “Culture of Service Excellence” For Upscale, Demanding Patient Population
Increase Employee Satisfaction
Reduce Overall Support Services Budget
Upscale Café Offerings
The Solution
Installed Innovative Call Center
Installed Proprietary Technology to Track All Service and Patient Transportation Requests
Reduced Utilization of Outside Labor
Redesigned Process For Patient Transportation
Introduced Unique Café Programs For Local Tastes
12
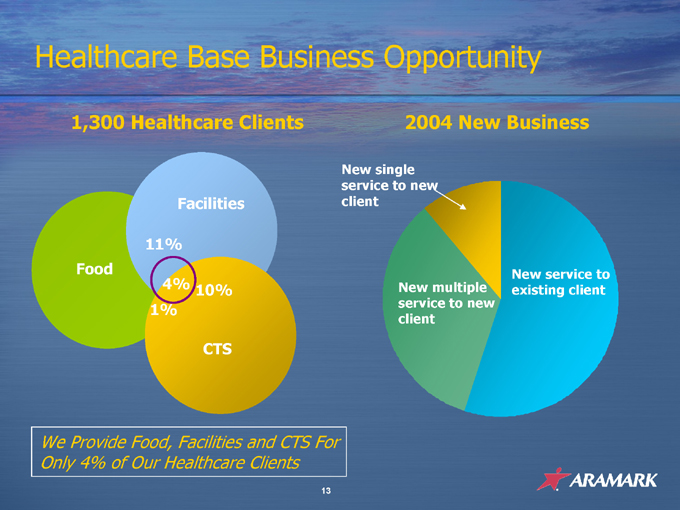
Healthcare Base Business Opportunity
1,300 Healthcare Clients
Food
Facilities
11%
4%
1%
10%
CTS
2004 New Business
New single service to new client
New multiple service to new client
New service to existing client
We Provide Food, Facilities and CTS For Only 4% of Our Healthcare Clients
13
Growth Opportunities
Additional Penetration Into Self-Operated Clients
Healthcare, Education are Underpenetrated
Higher Usage at Existing Clients
Improved Service Offerings Attract More Customers From On-Site Population
Additional Services
Cross-Selling Food and Facilities Services
International Expansion
Grow From Current 19 Country Base
14
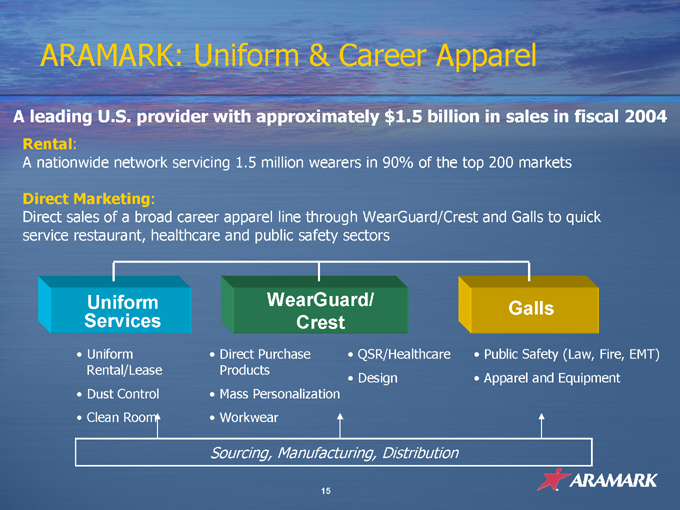
ARAMARK: Uniform & Career Apparel
A leading U.S. provider with approximately $1.5 billion in sales in fiscal 2004
Rental:
A nationwide network servicing 1.5 million wearers in 90% of the top 200 markets
Direct Marketing:
Direct sales of a broad career apparel line through WearGuard/Crest and Galls to quick service restaurant, healthcare and public safety sectors
Uniform Services
Uniform Rental/Lease
Dust Control
Clean Room
WearGuard/ Crest
Direct Purchase Products
Mass Personalization
Workwear
QSR/Healthcare Design
Galls
Public Safety (Law, Fire, EMT)
Apparel and Equipment
Sourcing, Manufacturing, Distribution
15
Business Model
Broad Line of Rental and Direct Sale Career Apparel Covering Nearly All Job Categories
A Nationwide Network of Uniform Rental Service Facilities Covering 90% of the Top 200 Markets
Broad, Direct Distribution Through Catalog, Outbound Telemarketing, Sales Force and Internet
Best-in-Class Global Uniform Manufacturing / Sourcing to Reduce Costs and Control Quality
16
How We Add Value
Important Component of Employer Branding
Particularly Service Companies Significant Customizing Capability
Consistent Employee Image
Increased Employee Satisfaction
Improved Employee Protection
17
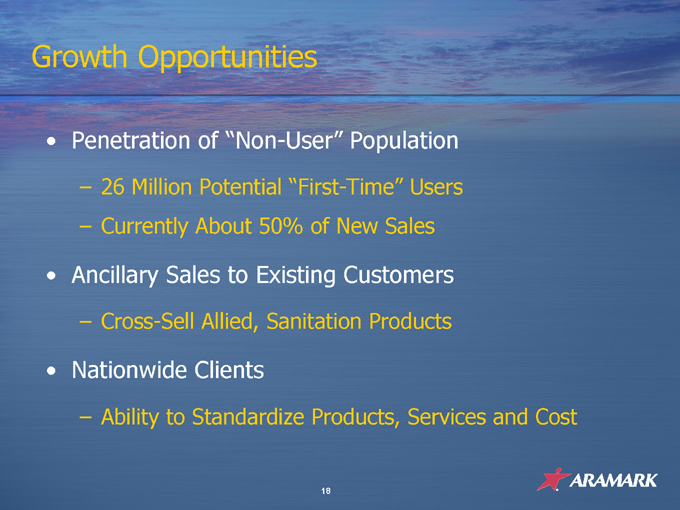
Growth Opportunities
Penetration of “Non-User” Population
26 Million Potential “First-Time” Users
Currently About 50% of New Sales
Ancillary Sales to Existing Customers
Cross-Sell Allied, Sanitation Products
Nationwide Clients
Ability to Standardize Products, Services and Cost
18
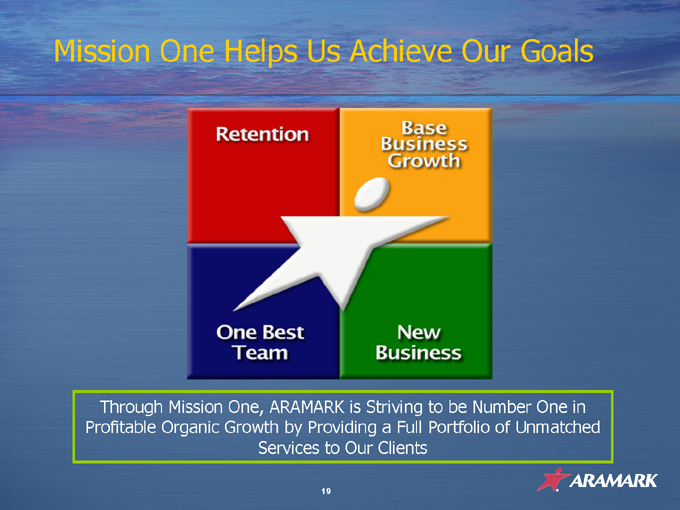
Mission One Helps Us Achieve Our Goals
Retention
Base Business Grrowth
One Best Team
New Business
Through Mission One, ARAMARK is Striving to be Number One in Profitable Organic Growth by Providing a Full Portfolio of Unmatched Services to Our Clients
19
Operating & Financial Discipline
Organic Sales Growth
Margin Improvement
Cash Flow
Return on Invested Capital Acquisition Strategy
20
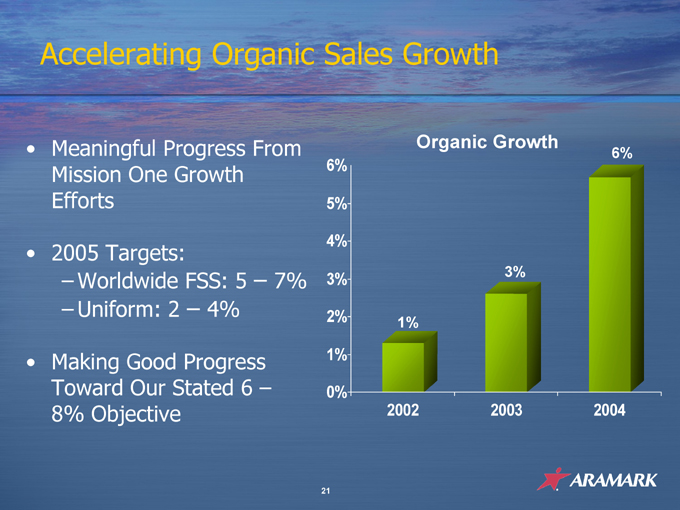
Accelerating Organic Sales Growth
Meaningful Progress From Mission One Growth Efforts
2005 Targets:
Worldwide FSS: 5 – 7%
Uniform: 2 – 4%
Making Good Progress Toward Our Stated 6 –8% Objective
6% 5% 4% 3% 2% 1% 0%
Organic Growth
1%
3%
6%
2002 2003 2004
21
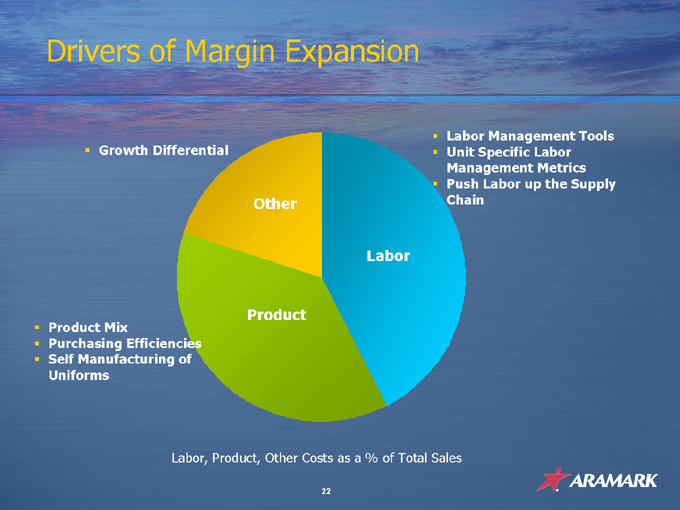
Drivers of Margin Expansion
Growth Differential
Product Mix
Purchasing Efficiencies
Self Manufacturing of Uniforms
Other
Product
Labor
Labor Management Tools
Unit Specific Labor Management Metrics
Push Labor up the Supply Chain
Labor, Product, Other Costs as a % of Total Sales
22
Strong Cash Flow and Return on Invested Capital
Low Capital Intensity ~ 3% of Sales
Focused on Adding Value Through Optimal Capital Structure
Strong Cash Flow
Generation Supports Debt Service
Objective to Retain Investment Grade Rating
Strong Low-Teens ROIC
ROIC Significantly Exceeds Cost of Capital
23
Acquisition Strategy
Disciplined and Return-Focused
Target: 15% After-Tax IRR EPS Accretive in 1-2 years
Strategies
Strengthen Existing Services and Client Portfolio
Fine Host, Harrison, CTS
Add or Strengthen Key Services
ServiceMaster
Expand International Reach
AIM Services (Japan), Campbell Catering (Ireland),
Central Restaurantes (Chile), Travers (Canada), Restauracion
Colectiva & Rescot (Spain), Catering Alliance (UK), Bright
China Service Industries (China)
24
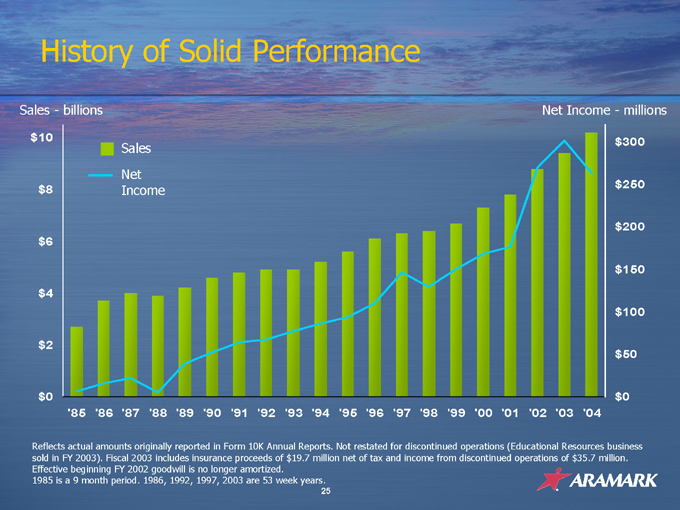
History of Solid Performance
Sales—billions $10 $8 $6 $4 $2 $0
Sales Net Income
Net Income—millions
‘85 ‘86 ‘87 ‘88 ‘89 ‘90 ‘91 ‘92 ‘93 ‘94 ‘95 ‘96 ‘97 ‘98 ‘99 ‘00 ‘01 ‘02 ‘03 ‘04 $300 $250 $200 $150 $100 $50 $0
Reflects actual amounts originally reported in Form 10K Annual Reports. Not restated for discontinued operations (Educational Resources business sold in FY 2003). Fiscal 2003 includes insurance proceeds of $19.7 million net of tax and income from discontinued operations of $35.7 million.
Effective beginning FY 2002 goodwill is no longer amortized.
1985 is a 9 month period. 1986, 1992, 1997, 2003 are 53 week years.
25
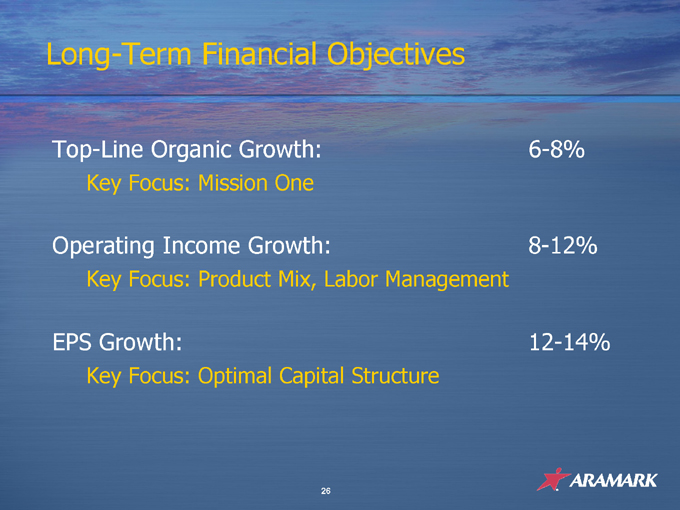
Long-Term Financial Objectives
Top-Line Organic Growth:
Key Focus: Mission One
6-8%
Operating Income Growth:
Key Focus: Product Mix, Labor Management
8-12%
EPS Growth:
Key Focus: Optimal Capital Structure
12-14%
26
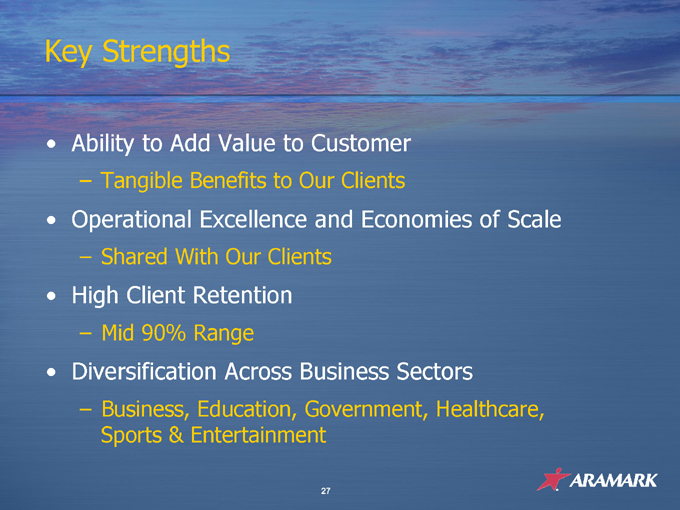
Key Strengths
Ability to Add Value to Customer
Tangible Benefits to Our Clients
Operational Excellence and Economies of Scale
Shared With Our Clients
High Client Retention
Mid 90% Range
Diversification Across Business Sectors
Business, Education, Government, Healthcare, Sports & Entertainment
27
Managed Services, Managed Better
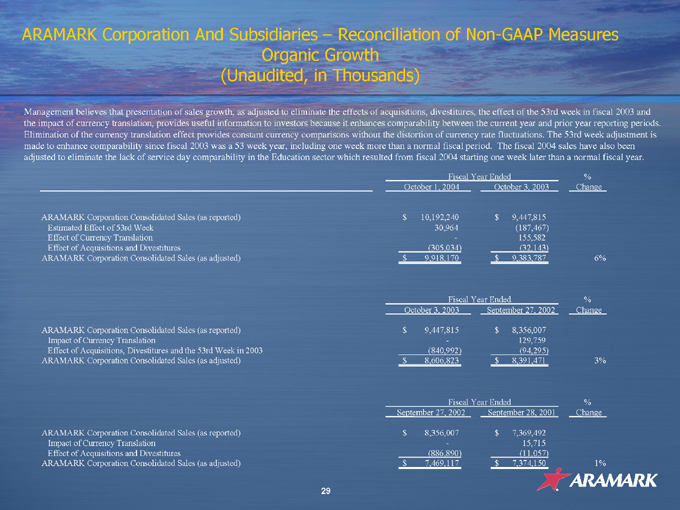
ARAMARK Corporation And Subsidiaries – Reconciliation of Non-GAAP Measures Organic Growth (Unaudited, in Thousands)
Management believes that presentation of sales growth, as adjusted to eliminate the effects of acquisitions, divestitures, the effect of the 53rd week in fiscal 2003 and the impact of currency translation, provides useful information to investors because it enhances comparability between the current year and prior year reporting periods. Elimination of the currency translation effect provides constant currency comparisons without the distortion of currency rate fluctuations. The 53rd week adjustment is made to enhance comparability since fiscal 2003 was a 53 week year, including one week more than a normal fiscal period. The fiscal 2004 sales have also been adjusted to eliminate the lack of service day comparability in the Education sector which resulted from fiscal 2004 starting one week later than a normal fiscal year.
October 1, 2004 Fiscal Year Ended October 3, 2003 % Change
ARAMARK Corporation Consolidated Sales (as reported) $10,192,240 $9,447,815
Estimated Effect of 53rd Week 30,964 (187,467)
Effect of Currency Translation - 155,582
Effect of Acquisitions and Divestitures (305,034) (32,143)
ARAMARK Corporation Consolidated Sales (as adjusted) $9,918,170 $9,383,787 6%
October 3, 2003 Fiscal Year Ended September 27, 2002 % Change
ARAMARK Corporation Consolidated Sales (as reported) $9,447,815 $8,356,007
Impact of Currency Translation - 129,759
Effect of Acquisitions, Divestitures and the 53rd Week in 2003 (840,992) (94,295)
ARAMARK Corporation Consolidated Sales (as adjusted) $8,606,823 $8,391,471 3%
September 27, 2002 Fiscal Year Ended September 28, 2001 % Change
ARAMARK Corporation Consolidated Sales (as reported) $8,356,007 $7,369,492
Impact of Currency Translation - 15,715
Effect of Acquisitions and Divestitures (886,890) (11,057)
ARAMARK Corporation Consolidated Sales (as adjusted) $7,469,117 $7,374,150 1%
29