SECURITIES AND EXCHANGE COMMISSION
WASHINGTON, D.C. 20549
FORM 10-K
| x | Annual report pursuant to Section 13 or 15(d) of the Securities Exchange Act of 1934 for the fiscal year ended September 30, 2005 or |
| ¨ | Transition report pursuant to Section 13 or 15(d) of the Securities Exchange Act of 1934 for the transition period from to |
Commission file number: 001-16807
ARAMARK CORPORATION
(Exact name of registrant as specified in its charter)
| Delaware | 23-3086414 | |
| (State of Incorporation) | (I.R.S. Employer Identification No.) |
ARAMARK Tower
1101 Market Street
Philadelphia, Pennsylvania 19107
(Address of principal executive offices)
Telephone Number: 215-238-3000
Securities registered pursuant to Section 12(b) of the Act:
Class B Common Stock, $0.01 par value, New York Stock Exchange
Securities registered pursuant to Section 12(g) of the Act:
Class A Common Stock, $0.01 par value
Indicate by check mark if the registrant is a well-known seasoned issuer, as defined in Rule 405 of the Securities Act. Yesx No¨
Indicate by check mark if the registrant is not required to file reports pursuant to Section 13 or Section 15(d) of the Act. Yes¨ Nox
Indicate by check mark whether the registrant (1) has filed all reports required to be filed by Section 13 or 15(d) of the Securities Exchange Act of 1934 during the preceding 12 months (or for such shorter period that the registrant was required to file such reports), and (2) has been subject to such filing requirements for the past 90 days. Yesx No¨
Indicate by check mark if disclosure of delinquent filers pursuant to Item 405 of Regulation S-K is not contained herein, and will not be contained, to the best of registrant’s knowledge, in definitive proxy or information statements incorporated by reference in Part III of this Form 10-K or any amendment to this Form 10-K.x
Indicate by check mark whether the registrant is an accelerated filer (as defined in Rule 12b-2 of the Act). Yesx No¨
Indicate by check mark whether the registrant is a shell company (as defined in Rule 12b-2 of the Exchange Act). Yes¨ Nox
Aggregate market value of the voting stock held by nonaffiliates at April 1, 2005: $4,010,221,329
Common stock outstanding at October 28, 2005: | Class A Common Stock | 61,379,683 shares | ||
| Class B Common Stock | 119,506,098 shares |
DOCUMENTS INCORPORATED BY REFERENCE
Portions of the registrant’s Proxy Statement for the 2006 annual meeting of stockholders are incorporated by reference in Part III of this Annual Report.
PART I
Item 1.
BUSINESS
Overview
ARAMARK Corporation (“ARAMARK,” the “Company,” “we” or “us”) is a leading provider of a broad range of managed services to business, educational, healthcare and governmental institutions and sports, entertainment and recreational facilities.
In the United States, we are one of the largest food and support service companies, and in most of the other countries in which we operate, we are one of the leading providers. Our uniform and career apparel business is the second largest in the United States and provides both rental and direct marketing services. Due to our geographic presence and our approximately 240,000 employees (including seasonal employees), we serve thousands of clients and millions of customers in 20 countries around the world. In this Annual Report, when we refer to our fiscal years, we say “fiscal” and the year number, as in “fiscal 2005,” which refers to our fiscal year ended September 30, 2005.
Segment information is incorporated by reference to footnote 12 of our consolidated financial statements.
Fiscal 2005 Acquisitions and Divestitures
On October 4, 2004, the Company’s uniform segment completed the acquisition of L&N Uniform Supply, a Southern California based industrial uniform business that rents, leases and sells uniforms and career wear to customers in the Southern California and Salt Lake City regions for a purchase price of approximately $30 million.
During the second quarter of fiscal 2005, the Company increased its ownership in its Irish food service affiliate from 45% to 90%, for approximately $61 million in cash.
2
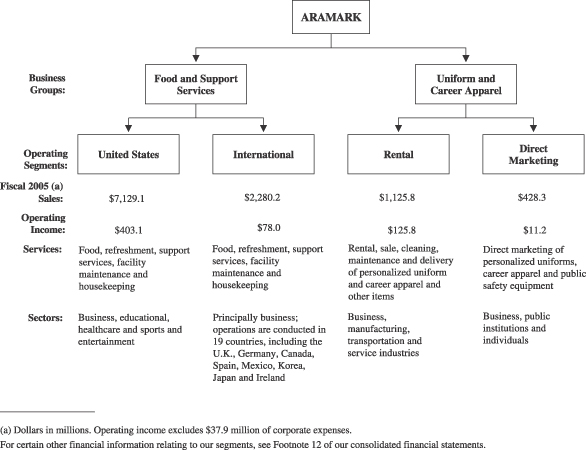
The following chart provides a brief overview of our business:
History
Our business traces its history back to the 1930s, when we began providing vending services to plant employees in the aviation industry in Southern California. In 1959, our founders, Davre J. Davidson and William S. Fishman, combined their two businesses to form our predecessor company, which became publicly traded in 1960. In the ensuing years, we broadened our service offerings and expanded our client base, including through the acquisition of our uniform services business in 1977. In 1984, we completed a management buyout, and from 1984, our management and employees increased their ownership of the Company and, directly and through our employee benefit plans, owned approximately 90% of our equity capital until our public offering was completed in December 2001.
Food and Support Services
Our food and support services group manages a number of interrelated services—including food, refreshment, facility and other support services—for businesses, healthcare facilities, school districts, colleges and universities, conference and convention centers, national and state parks, sports, entertainment and recreational venues and correctional institutions. In fiscal 2005, our Food and Support Services—United States segment generated $7.1 billion in sales, or 65% of our total sales. In fiscal 2005, our Food and Support Services—International segment generated $2.3 billion in sales or 21% of our total sales.
3
We are the exclusive provider of food and beverage services at most of the facilities we serve and are responsible for hiring, training and supervising substantially all of the food service personnel in addition to ordering, receiving, preparing and serving food and beverage items sold at those facilities. In governmental, business, educational and healthcare facilities (for example, offices and industrial plants, schools and universities and hospitals), our clients generally provide us access to customers, namely their employees, students and patients. At sports, entertainment and recreational facilities, which include convention centers, our clients generally are responsible for attracting patrons, usually on an event-specific basis. We focus on new business development, client retention and sales growth at existing locations through marketing efforts directed toward customers and potential customers at the locations we serve.
Industry Overview
The food and support service industry involves the supply of food and beverage services and facilities services to a range of clients, including businesses, educational, governmental, correctional and healthcare institutions, and operators of sports, entertainment and recreational facilities in a variety of formats, service levels and price points.
Although we provide a range of services and call on a wide variety of clients, in recent years the food and support service industry has experienced consolidation and multi-national expansion. We believe that other recent dynamics in the food and support services industry include continued growth in the outsourcing of food service and facilities management as a result of:
| • | clients focusing on their core competencies and outsourcing their non-core activities and services; |
| • | clients addressing the need to satisfy demanding customers; |
| • | clients facing increasing cost pressures and looking for cost-effective alternatives to self-administered food and support activities; |
| • | an increase in the retail orientation of food service management due to the proliferation of alternative retail outlets, including quick serve restaurants; and |
| • | continuing client interest in obtaining food and facilities support management services from one supplier. |
Customers and Services—United States Segment
Our Food and Support Services—United States segment serves a number of client sectors, distinguished by the types of customers served and types of services offered. No individual client represents more than 2% of our consolidated sales, other than, collectively, a number of U.S. government agencies.
Business. We provide a range of business dining services, including on-site restaurants, catering, convenience stores and executive dining rooms.
We also offer a variety of facility management services to business and industry clients. These services are provided nationwide and include the management of housekeeping, plant operations and maintenance, energy management, laundry and linen, groundskeeping, landscaping, capital program management and commissioning services and other facility consulting services relating to building operations.
We provide vending and coffee services to business and industry clients at thousands of locations in the United States. Our service and product offerings include a full range of coffee
4
and beverage offerings, “grab and go” food operations, convenience stores, home meal replacement programs and a proprietary drinking water filtration system.
We provide correctional food services, operate commissaries, laundry facilities and property rooms and/or provide facilities management services for state, county and municipal clients.
Sports & Entertainment. We provide concessions, banquet and catering services, retail, merchandise and novelty sales, recreational and lodging services and facilities management services at sports, entertainment and recreational facilities. We serve 76 professional sports teams, including 50 teams in Major League Baseball, the National Basketball Association, the National Football League and the National Hockey League. We also serve 41 convention and civic centers, 16 national and state parks and other resort operations, plus numerous concert venues, entertainment complexes and other popular tourist attractions across the United States.
We own approximately 50% of SMG, a leader in providing outsourced management of public assembly facilities including arenas, stadiums and theaters, as well as convention centers. SMG offers services such as event booking and management, cash management, maintenance services and risk management while seeking to maximize the number of events and attendance at such facilities. The facilities managed by SMG include facilities throughout the United States as well as facilities in Europe and Canada.
Education. We provide a wide range of food and facility support at more than 1,000 colleges, universities, school systems and districts and private schools. We offer our education clients a single source provider for managed service solutions, including dining, catering, food service management, convenience-oriented retail operations, facilities maintenance, custodial, grounds, energy, construction management, capital project management and building commissioning.
Healthcare. We provide a wide range of non-clinical support services to approximately 1,000 healthcare and senior living facilities in North America. We offer healthcare organizations a single source provider for managed service solutions, including patient food and nutrition services, retail food services, clinical equipment maintenance, environmental services, laundry and linen distribution, plant operations, energy management, strategic/technical services, supply chain management and central transportation.
Customers and Services—International Segment
Our Food and Support Services—International segment provides a similar range of services provided to our United States clients, but primarily to business and industry clients. In addition, in the international segment, we provide lodging, food service, commissary and facilities management at remote sites, such as offshore drilling platforms and mining camps. Our international services are provided in 19 countries outside the United States. Our largest international operations are in the U.K., Canada, Germany, Spain, Chile, Belgium, Mexico, Korea and Ireland, and in each of these countries we are one of the leading food service providers. We also own approximately 50% of AIM Services Co., Ltd., a leader in providing outsourced food services in Japan. The clients we serve in each country are typically similar to those served in the United States and vary by country depending upon local dynamics and conditions. There are particular risks attendant with our international operations. Please see the “Risk Factors” section.
Purchasing
We negotiate the pricing and other terms for the majority of our domestic purchases of food and related products directly with national manufacturers. We purchase these products and other items through SYSCO Corporation and other distributors. We have a master distribution agreement with SYSCO that covers a significant amount of our purchases of these products and
5
items in the United States and another distribution agreement with SYSCO that covers our purchases of these products in Canada. SYSCO and other distributors are responsible for tracking our orders and delivering products to our specific locations. Due to our ability to negotiate favorable terms with our suppliers, we receive vendor consideration, including rebates, allowances and volume discounts. See “Types of Contracts.” With respect to purchases from SYSCO, these discounts include discounts on SYSCO-branded products. Our location managers also purchase a number of items, including bread, dairy products and alcoholic beverages from local suppliers, and we purchase certain items directly from manufacturers.
Our agreements with our distributors are generally for an indefinite term, subject to termination by either party after a notice period, which is generally 60 to 120 days. The pricing and other financial terms of these agreements are renegotiated periodically. We have had distribution agreements with SYSCO for more than 15 years. Our current agreement with SYSCO is terminable by either party with 180 days notice.
Our relationship with SYSCO is important to our operations. In fiscal 2005, SYSCO distributed approximately 55% of our food and non-food products in the United States and Canada, and we believe that we are one of SYSCO’s largest customers. However, we believe that the products acquired through SYSCO can, in all significant cases, be purchased through other sources and that termination of our relationship with SYSCO or any disruption of SYSCO’s business would cause only short-term disruptions to our operations.
Sales and Marketing
We employ sales personnel focused on each specific client or service sector who are responsible for identifying and pursuing potential new business opportunities, analyzing and evaluating such opportunities together with our operational and financial management and developing specific contract proposals. In addition to these professionals dedicated exclusively to sales efforts, our food and support field management shares responsibility for identifying and pursuing new sales opportunities, both with the clients for which they are directly responsible and for potential clients in their geographic area of responsibility. In addition, in several sectors we also have dedicated client retention teams.
Types of Contracts
We use two general contract types in our food and support services segments: profit and loss contracts and client interest contracts. These contracts differ in their provision for the amount of financial risk that we bear and, accordingly, the potential compensation, profits or fees we may receive. Commission rates and management fees, if any, may vary significantly among contracts based upon various factors, including the type of facility involved, the term of the contract, the services we provide and the amount of capital we invest.
Profit and Loss Contracts. Under profit and loss contracts, we receive all of the revenue from, and bear all of the expenses of, the provision of our services at a client location. Expenses under profit and loss contracts sometimes include commissions paid to the client, typically calculated as a fixed or variable percentage of various categories of sales, and, in some cases, require minimum guaranteed commissions. While we may benefit from greater upside potential with a profit and loss contract, we are responsible for all the operating costs and consequently bear greater downside risk than with a client interest contract. For fiscal 2005, approximately 73% of our food and support services sales were derived from profit and loss contracts.
Client Interest Contracts. Client interest contracts include management fee contracts, under which our clients reimburse our operating costs and pay us a management fee, which may be calculated as a fixed dollar amount or a percentage of sales or operating costs. Some
6
management fee contracts entitle us to receive incentive fees based upon our performance under the contract, as measured by factors such as sales, operating costs and customer satisfaction surveys. Client interest contracts also include limited profit and loss contracts, under which we receive a percentage of any profits earned from the provision of our services at the facility and we generally receive no payments if there are losses. As discussed above under “Purchasing,” we receive vendor consideration, including rebates, allowances and volume discounts that we retain except in those cases and to the extent that, under certain arrangements, they are passed through to our clients. For our client interest contracts, both our upside potential and downside risk are reduced compared to our profit and loss contracts. For fiscal 2005, approximately 27% of our food and support services revenues were derived from client interest contracts.
Generally, our contracts require that the client’s consent be obtained in order to raise prices on the food, beverages and merchandise we sell within a particular facility. Approximately half of the sales from our business service clients are derived from contracts in which the clients partially or fully subsidize our food service operations for the benefit of their employees.
The length of contracts that we enter into with clients varies. Business, education and healthcare support services are generally provided under contracts of indefinite duration, which may be subject to termination on short notice by either party without cause. Contracts in other businesses generally are for fixed terms, some of which may be well in excess of one year. Client contracts for sports, entertainment and recreational services typically require larger capital investments, but have correspondingly longer and fixed terms, usually from five to fifteen years.
When we enter into new contracts, or extend or renew existing contracts, particularly those for stadiums, arenas, convention centers and other sports, entertainment and recreational facilities, we are sometimes contractually required to make some form of up-front or future capital investment to help finance improvement or renovation, typically to the food and beverage facilities of the venue from which we operate. Contractually required capital expenditures typically take the form of investment in leasehold improvements, food service equipment and/or grants to clients. At the end of the contract term or its earlier termination, assets such as equipment and leasehold improvements typically become the property of the client, but generally the client must reimburse us for any undepreciated or unamortized capital expenditures.
Contracts within the food and support services group are generally obtained and renewed either through a competitive process or on a negotiated basis, although contracts in the public sector are frequently awarded on a competitive bid basis, as required by applicable law. Contracts for food services with school districts and correctional clients are typically awarded through a formal bid process. Contracts in the private sector may be entered into on a less formal basis, but we and other companies will often compete in the process leading up to the award or the completion of contract negotiations. Typically, after the award, final contract terms are negotiated and agreed upon.
Competition
There is significant competition in the food and support services business from local, regional, national and international companies, as well as from businesses, healthcare institutions, colleges and universities, correctional facilities, school districts and public assembly facilities. Institutions may decide to operate their own services following the expiration or termination of contracts with us or with our competitors. In our U.S. Food and Support Services business, our major external competitors include other multi-regional food and support service providers, such as Centerplate, Inc., Compass Group plc, Delaware North Companies Inc. and Sodexho Alliance SA. Internationally, our major external food service and support service
7
competitors include Compass Group plc, Elior SA, International Service System A/S, Pedus Service and Sodexho Alliance SA. We also face competition from many regional and local service providers.
We believe that the principal competitive factors in our business include:
| • | quality and breadth of services and management talent; |
| • | service innovation; |
| • | reputation within the industry; |
| • | customer and supplier pricing; and |
| • | financial strength and stability. |
Seasonality
Our sales and operating results have varied, and we expect them to continue to vary, from quarter to quarter as a result of different factors. Within our United States Food and Support Services segment, historically there has been a lower level of activity during the first and second fiscal quarters in the generally higher margin sports, entertainment and recreational services. This lower level of activity historically has been partially offset during our first and second fiscal quarters by the increased provision of campus and school support services. Conversely, historically there has been a significant increase in the provision of sports, entertainment and recreational services during the third and fourth fiscal quarters, which is partially offset by the effect of summer recess at colleges, universities and schools.
Uniform and Career Apparel
Overview
Our Uniform and Career Apparel Group provides uniforms, career and image apparel, equipment, work clothes and accessories to meet the needs of clients in a wide range of industries in the United States, including manufacturing, transportation, construction, restaurants and hotels, public safety and healthcare industries and many others. We supply garments, other textile and paper products, public safety equipment and other accessories through rental and direct purchase programs to businesses, government agencies and individuals.
Customers use our uniforms to meet a variety of needs, including:
| • | establishing corporate identity and brand awareness—uniforms can help identify employees working for a particular company or department and promote a company’s brand identity. |
| • | Projecting a professional image—uniformed employees are perceived as trained, competent and dependable, and uniforms provide a professional image of employees by enhancing the public appearance of those employees and their company; |
| • | protecting workers—uniforms can help protect workers from difficult environments such as heavy soils, heat, flame or chemicals; |
| • | protecting products—uniforms can help protect products against contamination in the food, pharmaceutical, electronics, health care and automotive industries; and |
| • | retaining employees—uniforms can enhance worker morale and help promote teamwork. |
8
Uniform and Career Apparel—Rental Segment
Our Uniform and Career Apparel—Rental segment provides a full service employee uniform solution, including design, sourcing and manufacturing, delivery, cleaning and maintenance. We rent or lease uniforms, career and image apparel, work clothing, outerwear, particulate-free garments and additional textile and related products to businesses in a wide range of industries throughout the United States. Our uniform products include shirts, pants, jackets, coveralls, jumpsuits, smocks, aprons and specialized protective wear. We also offer nongarment items and related services, including industrial towels, floor mats, mops, linen products, as well as paper products and safety products. Our uniform rental business is the second largest in the United States, generating $1.1 billion in sales, or 10% of our total fiscal 2005 sales.
The outsourcing of career apparel needs through a uniform rental program offers customers advantages over ownership. Renting eliminates investment in uniforms and the related costs associated with employee turnover, offers flexibility in styles, colors and quantities as customer requirements change, assures consistent professional cleaning, finishing, repair and replacement of items in use and decreases expense and management time necessary to administer a uniform program. Centralized services, specialized equipment and economies of scale generally allow us to be more cost effective in providing garments and garment services than customers could be by themselves.
Customers and Services
Our Uniform and Career Apparel—Rental segment serves businesses of all sizes in many different industries. We have a diverse customer base, serving customers in 44 states and one Canadian province, from over 200 service location and distribution centers across the United States and two service centers in Ontario, Canada. We offer a range of garment rental service options, from full-service rental programs in which we clean and service garments and replace uniforms as needed, to lease programs in which garments are cleaned and maintained by individual employees. We also clean and service customer-owned uniforms.
As part of our full service rental business, we design and choose fabrics, styles and colors specific to a customer’s needs. We stock a broad product line of uniforms and career apparel. We typically visit our customers’ sites weekly, delivering clean, finished uniforms and, at the same time, removing the soiled uniforms or other items for cleaning, repair or replacement. Under our leasing program, we provide the customer with rental garments that are cleaned either by the customer or individual employees. This program benefits clients by reducing their capital investment in garments. We administer and manage the program, and repair and replace garments as necessary.
Our cleanroom service offers advanced static dissipative garments, barrier apparel, sterile garments and cleanroom application accessories for customers with contamination-free operations in the technology, food, healthcare and pharmaceutical industries. We provide reusable and disposable garment programs and all of our cleanroom plants are either ISO 9001-2000 certified or have their initial ISO 9001-2000 audits pending.
Operations
We operate our uniform rental business as a network of 72 laundry plants and 153 satellite plants and depots supporting over 2,700 pick-up and delivery routes. We operate a fleet of service vehicles that pick up and deliver uniforms for cleaning and maintenance.
We operate a fabric cutting facility in Georgia and four sewing plants in Mexico, which satisfy a substantial amount of our standard uniform inventory needs. We also purchase
9
additional uniform and textile products as well as equipment and supplies from several domestic suppliers and, to a limited extent, from non-domestic suppliers. The loss of any one vendor would not have a significant impact on us.
Sales and Marketing
Our route sales drivers and sales representatives are responsible for selling our services to current and potential customers and developing new accounts through the use of an extensive, proprietary database of pre-screened and qualified business prospects. Our customer service representatives and district managers are active salespeople as well. We build our brand identity through local advertising, promotional initiatives and through our distinctive service vehicles. Our customers frequently come to us through client referrals, either from our uniform rental business or from our other service sectors. Our customer service representatives generally interact on a weekly basis with their clients, while our support personnel are charged with expeditiously handling customer requirements regarding the outfitting of new customer employees and other customer service needs.
In connection with the provision of our services, we have developed or acquired long-standing brand name recognition through our ApparelOne®, WearGuard® and Crest® uniform programs. Our ApparelOne program assists customers in meeting their specific needs by offering quality and brand name products through a combination of rental, lease or purchase options. We customize the program on an individual client basis to offer a single catalog and/or website specifically tailored to the client’s needs.
Types of Contracts
We typically serve our rental customers under written service contracts for an initial term of three to five years. While customers are not required to make an up-front investment for their uniforms, in the case of nonstandard uniforms and certain specialty products or programs, customers typically agree to reimburse us for our costs if they terminate their agreement before completion of the current service term.
Competition
Although the U.S. rental industry has experienced some consolidation, there is significant competition in all the areas that we serve, and such competition varies from location to location. Although much of the competition consists of smaller local and regional firms, we also face competition from other large national firms such as Cintas Corporation, G&K Services, Inc. and Unifirst Corporation. We believe that the primary competitive factors that affect our operations, in order of importance, are quality, service, design, consistency of product, garment cost and distribution capability, particularly for large multi-location customers, and price. We believe that our ability to compete effectively is enhanced by the quality and breadth of our product line.
Uniform and Career Apparel—Direct Marketing Segment
Our Uniform and Career Apparel—Direct Marketing segment designs, sells and distributes personalized uniforms, rugged work clothing, outerwear, business casual apparel and footwear, public safety equipment and accessories through mail order catalogs, the internet, telemarketing, retail and field sales representatives. In fiscal 2005, this segment generated $428 million in sales, or 4% of our total company sales, substantially all in the United States. Teamed with our rental business, our direct marketing enables us to provide a total uniform solution to our clients.
10
Customers and Services
WearGuard-Crest. We are a designer and leading national distributor of distinctive image apparel, which includes uniforms and work clothing, to workers in a wide variety of industries including construction, utilities, repair and maintenance services, restaurant and hospitality and healthcare. We deliver expanded services to customers through catalog, the internet and telemarketing sales channels. With its recognized brand name, WearGuard designs and embroiders personalized uniforms and logos for customers through an extensive computer assisted design center and distributes work clothing, outerwear, business casual apparel and footwear throughout the United States. WearGuard operates one company outlet store under the WearGuard name.
Galls. Galls is one of the country’s largest suppliers of uniforms and equipment to public safety professionals. This multi-channel business (catalog, telemarketing sales, field sales, the internet and retail) caters to the special needs of people involved in public safety, law enforcement, fire fighting, federal government agency, military and emergency medical services. Galls markets public safety equipment and apparel under the Galls, Dynamed and other brand names to over one million individuals, as well as to public safety departments, private security companies and the Military. Galls operates seven retail store locations in California and Kentucky and has its European office located in Telford, England.
Operations
We conduct our direct marketing activities principally from our facilities in Norwell, Massachusetts; Salem, Virginia; Lexington, Kentucky; and Reno, Nevada. None of our customers individually represents a material portion of our sales. We manufacture a significant portion of our uniform requirements and offer a variety of customized personalization options such as embroidery and logos. We also purchase uniforms and other products from a number of domestic and international suppliers.
Sales and Marketing
Our direct marketing operations distribute approximately 31 million catalogs annually to approximately 10 million existing and prospective customers. Catalog distribution is based on the selection of recipients in accordance with predetermined criteria from customer lists developed by WearGuard and Galls as well as those purchased or rented from other organizations. Our in-bound and out-bound telemarketing operations are staffed by approximately 600 trained professionals. We also sell across the Internet at www.aramark-uniform.com, www.wearguard.com and www.galls.com.
Types of Contracts
Because the bulk of our customers purchase on a recurring basis, our backlog of orders at any given time consists principally of orders in the process of being filled. With the exception of certain governmental bid business, most of our direct marketing business is conducted under invoice arrangement with repeat customers.
Our direct marketing segment is, to a large degree, relationship-centered. While we have long term relationships with some of our larger customers, we generally do not have contracts with these customers. If such a relationship with one of our larger customers were to be terminated, it could have an adverse effect on our direct marketing segment.
11
Competition
Competition for direct sales varies based on numerous factors such as geographic, product, customer and marketing issues. We believe that the primary competitive factors that affect our direct marketing operations are quality, service, design consistency of products, distribution and price. While there are other companies in the uniform, work clothing or public safety direct marketing business that have financial resources comparable to ours, much of the competition consists of smaller local and regional companies and numerous retailers, including some large chain apparel retailers, as well as numerous catalog sales sources.
Seasonality
Due to a number of factors, primarily related to the weather in the northern tier of the United States and the Thanksgiving-Christmas holiday period, there historically has been a seasonal increase in the sales of direct sale apparel and outerwear during our first fiscal quarter.
Employees of ARAMARK
As of September 30, 2005, we had a total of approximately 240,000 employees, including seasonal employees, consisting of approximately 150,000 full-time and approximately 90,000 part-time employees in our four business segments. The number of part-time employees varies significantly from time to time during the year due to seasonal and other operating requirements. We generally experience our highest level of employment during the fourth quarter. The approximate number of employees by segment is as follows: Food and Support Services—United States: 155,000; Food and Support Services—International: 70,000; Uniform and Career Apparel—Rental: 13,000; and Uniform and Career Apparel—Direct Marketing: 2,000. In addition, the ARAMARK corporate staff is approximately 200 employees. Approximately 32,000 employees in the United States are covered by collective bargaining agreements. We have not experienced any material interruptions of operations due to disputes with our employees and consider our relations with our employees to be satisfactory.
Governmental Regulation
We are subject to various governmental regulations, such as environmental, labor, employment, health and safety laws and liquor licensing and dram shop laws. In addition, our facilities and products are subject to periodic inspection by federal, state, and local authorities. We have established, and periodically update, various internal controls and procedures designed to maintain compliance with these regulations. Our compliance programs are subject to changes in federal or state legislation, or changes in regulatory interpretation, implementation or enforcement. From time to time both federal and state government agencies have conducted audits of our billing practices as part of routine investigations of providers of services under government contracts, or otherwise. Like others in our business, we receive requests for information from governmental agencies in connection with these audits. If we fail to comply with applicable laws, we may be subject to criminal sanctions or civil remedies, including fines, injunctions, seizures or debarment from government contracts.
Our operations are subject to various governmental regulations, including those governing:
| • | the service of food and alcoholic beverages; |
| • | minimum wage, overtime, wage payment and employment discrimination; |
| • | governmentally funded entitlement programs; |
| • | environmental protection; |
| • | human health and safety; |
12
| • | customs, import and export control laws; and |
| • | federal motor carrier safety. |
Food and Support Services Segments
There are a variety of regulations at various governmental levels relating to the handling, preparation and serving of food, including in some cases requirements relating to the temperature of food, the cleanliness of the kitchen, and the hygiene of personnel, which are enforced primarily at the local public health department level. While we attempt to comply with all applicable laws and regulations, we cannot assure you that we are in full compliance at all times with all of the applicable laws and regulations referenced above. Furthermore, additional or amended regulations in this area may significantly increase the cost of compliance.
In addition, various federal and state and provincial agencies impose nutritional guidelines and other requirements on us at certain of the education and corrections facilities we serve. There can be no assurance that federal or state legislation, or changes in regulatory implementation or interpretation of government regulations, would not limit our activities in the future or significantly increase the cost of regulatory compliance.
Because we serve alcoholic beverages at many sports, entertainment and recreational facilities, including convention centers and national and state parks, we also hold liquor licenses incidental to our contract food service business and are subject to the liquor license requirements of the jurisdictions in which we hold a liquor license. As of September 30, 2005, our subsidiaries held liquor licenses in 41 states and the District of Columbia, three Canadian provinces and certain other countries. Typically, liquor licenses must be renewed annually and may be revoked or suspended for cause at any time. Alcoholic beverage control regulations relate to numerous aspects of our operations, including minimum age of patrons and employees, hours of operation, advertising, wholesale purchasing, inventory control and handling, and storage and dispensing of alcoholic beverages. We have not encountered any material problems relating to alcoholic beverage licenses to date. The failure to receive or retain a liquor license in a particular location could adversely affect our ability to obtain such a license elsewhere. Some of our contracts require us to pay liquidated damages during any period in which our liquor license for the facility is suspended, and most contracts are subject to termination if we lose our liquor license for the facility. Our service of alcoholic beverages is also subject to state, provincial and local service laws, commonly called dram shop statutes. Dram shop statutes generally prohibit serving alcoholic beverages to minors or visibly intoxicated persons. If we violate dram shop laws, we may be liable to the patron or to third parties for the acts of the patron. We sponsor regular training programs designed to minimize the likelihood of such a situation. However, we cannot guarantee that intoxicated or minor patrons will not be served or that liability for their acts will not be imposed on us.
Uniform and Career Apparel Segments
Our uniform rental segment is subject to various federal, state and local laws and regulations, including the federal Clean Water Act, Clean Air Act, Resource Conservation and Recovery Act, Comprehensive Environmental Response, Compensation, and Liability Act and similar state statutes and regulations. In particular, industrial laundries use and must discharge wastewater containing detergents and other residues from the laundering of garments and other merchandise through publicly operated treatment works or sewer systems and are subject to volume and chemical discharge limits and penalties and fines for non-compliance. We are attentive to the environmental concerns surrounding the disposal of these materials and have through the years taken measures to avoid their improper disposal. In the past, we have settled,
13
or contributed to the settlement of, actions or claims brought against us relating to the disposal of hazardous materials. We may, in the future, be required to expend material amounts to rectify the consequences of any such disposal. Under federal and state environmental laws, we may be liable for the costs of removal or remediation of certain hazardous or toxic substances located on or in or emanating from our owned or leased property, as well as related costs of investigation and property damage. Such laws often impose liability without regard to whether we knew about or were responsible for the presence of such hazardous or toxic substances. We may not know whether acquired or leased locations have been operated in compliance with environmental laws and regulations or that our future uses or conditions will not result in the imposition of liability upon us under such laws or expose us to third party actions such as tort suits.
We do not anticipate any capital expenditures for environmental remediation that would have a material effect on our financial condition, and we are not aware of any material non-compliance by us with environmental laws.
Intellectual Property
We have the patents, trademarks, trade names and licenses that are necessary for the operation of our business. Other than the ARAMARK brand, we do not consider our patents, trademarks, trade names and licenses to be material to the operation of our business.
Available Information
We file annual, quarterly and current reports, proxy statements and other information with the Securities and Exchange Commission (the “SEC”). These filings are available to the public over the Internet at the Securities and Exchange Commission’s web site at http://www.sec.gov. You may also read and copy any document we file at the Securities and Exchange Commission’s public reference room at 100 F. Street, N.E., Washington, D.C. 20549. Please call the Securities and Exchange Commission at 1-800-SEC-0330 for further information on the public reference room.
Our principal Internet address is www.aramark.com. We make available free of charge on www.aramark.com our annual, quarterly and current reports, and amendments to those reports, as soon as reasonably practicable after we electronically file such material with, or furnish it to, the SEC.
Our Business Conduct Policy includes a code of ethics for our principal executive officer, our principal financial officer and our principal accounting officer. Our Business Conduct Policy is available on the Investor Relations section of our website at www.aramark.com and is available in print to any stockholder who requests it by writing or telephoning us at the address or telephone number set forth below. Our Corporate Governance Guidelines and the charters of our Audit and Corporate Practices Committee, our Nominating and Corporate Governance Committee and our Compensation and Human Resources Committee also are available on the Investor Relations section of our website at www.aramark.com and are available in print to any stockholder who requests them.
You may request a copy of our SEC filings (excluding exhibits) and our Business Conduct Policy, Corporate Governance Guidelines, and charters of the Committees referenced above at no cost by writing or telephoning us at the following address or telephone number:
ARAMARK Corporation
1101 Market Street
Philadelphia, PA 19107
Attention: Investor Relations
Telephone: (215) 238-3726
14
The references to our web site and the SEC’s web site are intended to be inactive textual references only.
In accordance with New York Stock Exchange rules, on March 9, 2005, the Company filed the annual certification by our CEO that, as of the date of the certification, he was unaware of any violation by the Company of the NYSE’s corporate governance listing standards. The Company also files with each of its Form 10-Qs and its Form 10-K certifications by the CEO and the CFO under sections 302 and 906 of the Sarbanes Oxley Act of 2002.
Item 1A.Risk Factors
General
Unfavorable economic conditions and increased operating costs adversely affect our results of operations and financial condition.
Each of our business segments has been adversely affected by weaker economic conditions in the United States during the past several years, including with respect to manufacturing, technology and service industry clients. Layoffs and business downturns among our business clients have negatively affected our sales and operating results. A national or international economic downturn reduces demand for our services in each of our operating segments, which has resulted, and may in the future result, in the loss of business or increased pressure to contract for business on less favorable terms than our generally preferred terms. In addition, insolvency experienced by clients, especially larger clients, particularly in the non-profit healthcare and airline industries, could make it difficult for us to collect amounts we are owed and could result in the voiding of existing contracts. Any future terrorist attacks, and the national and global military, diplomatic and financial response to such attacks or other threats also may adversely affect our sales and operating results. Natural disasters also may affect our sales and operating results. For example, Hurricanes Katrina and Rita, which badly damaged the Gulf Coast of the United States in August and September of 2005, impacted ARAMARK’s food service, facilities and uniform clients in business, healthcare, education, sports and entertainment, and corrections in Louisiana, Mississippi, Alabama and Texas. ARAMARK experienced lost and closed client locations, business disruptions and delays, the loss of inventory and other assets, and the effect of the temporary conversion of a number of ARAMARK client locations to provide food and shelter to those left homeless by the storms.
Our profitability can be adversely affected to the extent we are faced with cost increases for food, wages, other labor related expenses (including workers’ compensation, state unemployment insurance and healthcare costs), insurance, fuel, utilities, piece goods, clothing and equipment, especially to the extent we were unable to recover such increased costs through increases in the prices for our products and services, due to general economic conditions, competitive conditions, or both. For example, oil and natural gas prices have increased significantly in the last twelve months. Substantial increases in the cost of fuel and utilities have historically resulted in substantial cost increases in our uniform services business, and to a lesser extent in our food and support services segment. In addition, approximately 73% of our food and support services sales are from profit and loss contracts under which we have limited ability to pass on cost increases to our clients.
Our business may suffer if we are unable to hire and retain sufficient qualified personnel or if labor costs increase.
In the past, the United States has periodically experienced reduced levels of unemployment, which has created a shortage of qualified workers at all levels. Given that our workforce requires
15
large numbers of entry level and skilled workers and managers, low levels of unemployment can compromise our ability in certain of our businesses to continue to provide quality service or compete for new business. From time to time, we have had difficulty in hiring and maintaining qualified management personnel, particularly at the entry management level. We will continue to have significant requirements to hire such personnel. Our success also depends to a substantial extent on the ability, experience and performance of our management, particularly our Chairman and Chief Executive Officer, Joseph Neubauer. We also regularly hire a large number of part-time workers, particularly in our food and support services segments. Any difficulty we may encounter in hiring such workers could result in significant increases in labor costs which could have a material adverse effect on our business, financial condition and results of operations. Competition for labor has resulted in wage increases in the past and future competition could substantially increase our labor costs. Due to the labor intensive nature of our businesses and the fact that 73% of our Food and Support Services segment’s sales are from profit and loss contracts under which we have limited ability to pass along cost increases, a shortage of labor or increases in wage levels in excess of normal levels could have a material adverse effect on our results of operations.
Our expansion strategy involves risks.
We may seek to acquire companies or interests in companies or enter into joint ventures that complement our business, and our inability to complete acquisitions, integrate acquired companies successfully or enter into joint ventures may render us less competitive. We may be evaluating acquisitions or engaging in acquisition negotiations at any given time. We cannot be sure that we will be able to continue to identify acquisition candidates or joint venture partners on commercially reasonable terms or at all. If we make additional acquisitions, we also cannot be sure that any benefits anticipated from the acquisitions will actually be realized. Likewise, we cannot be sure that we will be able to obtain necessary financing for acquisitions. Such financing could be restricted by the terms of our debt agreements or it could be more expensive than our current debt. The amount of such debt financing for acquisitions could be significant and the terms of such debt instruments could be more restrictive than our current covenants. In addition, our ability to control the planning and operations of our joint ventures and other less than majority owned affiliates may be subject to numerous restrictions imposed by the joint venture agreements and majority shareholders. Our joint venture partners may also have interests which differ from ours.
The process of integrating acquired operations into our existing operations may result in operating, contract and supply chain difficulties, such as the failure to retain clients or management personnel and problems coordinating technology and supply chain arrangements. Also, in connection with any acquisition, we could fail to discover liabilities of the acquired company for which we may be responsible as a successor owner or operator in spite of any investigation we make prior to the acquisition. In addition, labor laws in certain countries may require us to retain more employees than would otherwise be optimal from entities we acquire. Such difficulties may divert significant financial, operational and managerial resources from our existing operations, and make it more difficult to achieve our operating and strategic objectives. The diversion of management attention, particularly in a difficult operating environment, may affect our sales. Possible future acquisitions could result in the incurrence of additional debt and related interest expense, contingent liabilities and amortization expenses related to intangible assets, which could have a material adverse effect on our financial condition, operating results and/or cash flow, or in the issuance of additional shares of our common stock.
16
If we fail to comply with requirements imposed by applicable law or other governmental regulations, we could become subject to lawsuits and other liabilities and restrictions on our operations that could significantly and adversely affect our business.
We are subject to governmental regulation at the federal, state, national, provincial and local levels in many areas of our business, such as food safety and sanitation, the sale of alcoholic beverages, environmental issues, wage and hour, labor and employment, the import and export of goods and customs regulations and the services we provide in connection with governmentally funded entitlement programs. From time to time, both federal and state governmental agencies have conducted audits of our billing practices as part of investigations of providers of services under governmental contracts, or otherwise. We also receive requests for information from governmental agencies in connection with these audits. While we attempt to comply with all applicable laws and regulations, we cannot assure you that we are in full compliance with all applicable laws and regulations or interpretations of these laws and regulations at all times or that we will be able to comply with any future laws, regulations or interpretations of these laws and regulations.
For example, the U.S. Attorney for the District of Columbia is conducting a criminal investigation of Galls, a provider of uniforms and equipment to public safety professionals and a division of ARAMARK Uniform & Career Apparel Group, Inc., one of our primary subsidiaries. On July 21, 2004, agents of the United States Department of Commerce, among others, executed a search warrant at the Lexington, Kentucky facilities of Galls to gather records in connection with certain export sales. Two grand jury subpoenas were subsequently issued from the United States District Court in the District of Columbia seeking certain records at Galls’ California facilities and U.K. facilities, among others. We believe the investigation surrounds the possible failure under export regulations and Office of Foreign Asset Control, or OFAC, regulations to obtain proper export licenses and authorizations in connection with the export of Galls products to various countries, including an embargoed country. We are continuing to review these matters and are cooperating with the government’s investigation.
If we fail to comply with applicable laws and regulations, including with respect to the export matters related to the Galls division described above, we may be subject to criminal sanctions or civil remedies, including fines, injunctions, prohibitions on exporting, seizures or debarments from government contracts. The cost of compliance or the consequences of non-compliance, including debarments, could have a material adverse effect on our business and results of operations. In addition, governmental units may make changes in the regulatory frameworks within which we operate that may require either the corporation as a whole or individual businesses to incur substantial increases in costs in order to comply with such laws and regulations.
Changes in or new interpretations of the governmental regulatory framework may affect our contract terms and may reduce our sales or profits.
A portion of our sales, estimated to be approximately 15% in fiscal 2005, is derived from business with U.S. federal, state and local governments and agencies. Changes or new interpretations in, or changes in the enforcement of, the statutory or regulatory framework applicable to services provided under governmental contracts or bidding procedures, particularly by our food and support services businesses, could result in fewer new contracts or contract renewals, modifications to the methods we apply to price government contracts, or in contract terms of shorter duration than we have historically experienced, any of which could result in lower sales or profits than we have historically achieved, which could have an adverse effect on our results of operations.
17
Our failure to retain our current clients and renew our existing client contracts could adversely affect our business.
Our success depends on our ability to retain our current clients and renew our existing client contracts. Our ability to do so generally depends on a variety of factors, including the quality, price and responsiveness of our services, as well as our ability to market these services effectively and differentiate ourselves from our competitors. We cannot assure you that we will be able to renew existing client contracts at the same or higher rates or that our current clients will not turn to competitors, cease operations, elect to self-operate or terminate contracts with us. The failure to renew a significant number of our existing contracts would have a material adverse effect on our business and results of operations.
We may be adversely affected if customers reduce their outsourcing or use of preferred vendors.
Our business and growth strategies depend in large part on the continuation of a current trend toward outsourcing services. Customers will outsource if they perceive that outsourcing may provide higher quality services at a lower overall cost and permit them to focus on their core business activities. We cannot be certain that this trend will continue or not be reversed or that customers that have outsourced functions will not decide to perform these functions themselves. In addition, labor unions representing employees of some of our current and prospective customers have occasionally opposed the outsourcing trend to the extent that they believed that current union jobs for their memberships might be lost. In these cases, unions typically seek to ensure that jobs that are outsourced continue to be unionized and thus, the unions seek to direct to union employees the performance of the types of services we offer. We have also identified a trend among some of our customers toward the retention of a limited number of preferred vendors to provide all or a large part of their required services. We cannot be certain that this trend will continue or not be reversed or, if it does continue, that we will be selected and retained as a preferred vendor to provide these services. Unfavorable developments with respect to either of these trends could have a material adverse effect on our business and results of operations.
Our international business results are influenced by currency fluctuations and other risks that could have an effect on our results of operations and financial condition.
A significant portion of our sales is derived from international markets. During fiscal 2005, approximately 21% of our sales were generated outside the United States. We have a presence in 19 countries outside of the United States with approximately 70,000 personnel. The operating results of our international subsidiaries are translated into U.S. dollars and such results are affected by movements in foreign currencies relative to the U.S. dollar. Our international operations are also subject to other risks, including the requirement to comply with changing and conflicting national and local regulatory requirements; potential difficulties in staffing and labor disputes; differing local labor laws; managing and obtaining support and distribution for local operations; credit risk or financial condition of local customers; potential imposition of restrictions on investments; potentially adverse tax consequences, including imposition or increase of withholding and other taxes on remittances and other payments by subsidiaries; foreign exchange controls; and local political and social conditions. There can be no assurance that the foregoing factors will not have a material adverse effect on our international operations or on our consolidated financial condition and results of operations. We intend to continue to develop our business in emerging markets over the long term. Emerging market operations present several additional risks, including greater fluctuation in currencies relative to the U.S. dollar; economic and governmental instability; civil disturbances; volatility in gross domestic production; Foreign Corrupt Practice Act compliance issues and nationalization and expropriation of private assets.
18
Our operations are seasonal and quarter to quarter comparisons may not be a good indicator of our performance.
In the first and second fiscal quarters, within the Food and Support Services—United States segment, there historically has been a lower level of sales at the historically higher margin sports, entertainment and recreational food service operations, which is partly offset by increased activity in the educational sector. In the third and fourth fiscal quarters, there historically has been a significant increase in sales at sports, entertainment and recreational accounts, which is partially offset by the effect of summer recess in the educational sector. The sales of WearGuard, one of our direct marketing companies, generally increase during the first quarter of the fiscal year because of the onset of colder weather in the northern tier of the United States, as well as the gift-giving holidays. For these reasons, a quarter-to-quarter comparison is not a good indication of our performance or how we will perform in the future.
Our indebtedness may restrict certain growth opportunities.
As of October 28, 2005 we had approximately $1.9 billion of outstanding indebtedness. The size of our indebtedness may restrict the pursuit of certain new business opportunities. We will also have to use a portion of our cash flow to service our debt, which may prevent us from pursuing certain new business opportunities and certain acquisitions. If we were to incur significant amounts of additional indebtedness in the future, the agreements relating to such indebtedness may include covenants more restrictive than our current debt agreements. Failure to satisfy financial and other covenants or make required debt payments could cause us to violate the terms of our credit facility agreements and thereby result in the exercise of remedies by our lenders, including acceleration of our indebtedness, impair our liquidity and limit our ability to raise additional capital.
Further unionization of our workforce may increase our costs.
Approximately 32,000 employees in our U.S. operations are represented by unions and covered by collective bargaining agreements. Certain unions representing employees in our U.S. Food and Support Services and Uniform Services segments have begun a union campaign targeting us and the other major companies in our industry for increased representation of our workforce. We have always respected our employees’ right to unionize or not to unionize. However, the unionization of a significantly greater portion of our workforce could increase our overall costs at the affected locations and affect adversely our flexibility to run our business in the most efficient manner to remain competitive or acquire new business. In addition, any significant increase in the number of work stoppages at our various operations could affect adversely our business, financial condition or results of operations.
Environmental regulations may subject us to significant liability and limit our ability to grow.
We are subject to various federal, state and local laws and regulations, including the federal Clean Water Act, Clean Air Act, Resource Conservation and Recovery Act, Comprehensive Environmental Response, Compensation, and Liability Act and similar state statutes and regulations. For example, industrial laundries in our uniform rental segment use and must discharge wastewater containing detergents and other residues from the laundering of garments and other merchandise through publicly operated treatment works or sewer systems and are subject to volume and chemical discharge limits and penalties and fines for non-compliance. In the course of our business, we settle, or contribute to the settlement of, actions or claims brought against us relating to the disposal of hazardous materials. We may, in the future, be required to expend material amounts to rectify the consequences of any such disposal. Under federal and state environmental laws, as an owner or operator of real estate we may be liable
19
for the costs of removal or remediation of certain hazardous or toxic substances located on or in or emanating from our owned or leased property, as well as related costs of investigation and property damage. Liability may be imposed upon us without regard to whether we knew of or were responsible for the presence of such hazardous or toxic substances. There can be no assurances that locations that we own, lease or otherwise operate or that we may acquire in the future have been operated in compliance with environmental laws and regulations or that future uses or conditions will not result in the imposition of liability upon us under such laws or expose us to third party actions such as tort suits. In addition, such regulations may limit our ability to identify suitable sites for new or expanded plants. In connection with our operations and the operations of our predecessors or companies that we have acquired, hazardous or toxic substances may migrate from properties on which we operate or which were operated by our predecessors or companies we acquired to other properties. We may be subject to significant liabilities to the extent that human health is damaged or the value of such properties is diminished by such migration.
Food and Support Services
Competition in our industry could adversely affect our results of operations.
There is significant competition in the food and support services business from local, regional, national and international companies, of varying sizes, many of which have substantial financial resources. Our ability to successfully compete depends on our ability to provide quality services at a reasonable price and to provide value to our customers. Certain of our competitors have been and may in the future be willing to underbid us or accept a lower profit margin or expend more capital in order to obtain or retain business. Also, certain regional and local service providers may be better established than we are within a specific geographic region. In addition, existing or potential clients may elect to self operate their food service, eliminating the opportunity for us to serve them or compete for the account. While we have a significant international presence, should business sector clients require multi-national bidding, we may be placed at a competitive disadvantage because we may not be able to offer services in as many countries as some of our competitors.
Sales of sports, entertainment and recreational services would be adversely affected by a decline in attendance at client facilities or by a reduction or cessation of events.
The portion of our food and support services business which provides services in public facilities such as stadiums, arenas, amphitheaters, convention centers and tourist and recreational attractions is sensitive to an economic downturn, as expenditures to attend sporting events or concerts, take vacations, or hold or attend conventions are funded to a partial or total extent by discretionary income. A decrease in such discretionary income on the part of potential attendees at events in our clients’ facilities could result in a reduction in our sales. Further, because our exposure to the ultimate consumer of what we provide is limited by our dependence on our clients to attract customers to their facilities and events, our ability to respond to such a reduction in attendance, and therefore our sales, is limited. There are many factors that could reduce the numbers of events in a facility or attendance at an event, including labor disruptions involving sports leagues, poor performance by the teams playing in a facility and inclement weather, which would adversely affect sales and profits. For example, on September 17, 2004, the owners of the National Hockey League (“NHL”) teams locked out the NHL players and the 2004-2005 season was subsequently cancelled. The cancelled 2004-2005 season resulted in a loss of sales and reduced profits at the National Hockey League venues we service. Sales from NHL venues were approximately $73 million in the 2004 period. In July 2005, the NHL and the NHL Players’ Association announced they had reached an agreement that became effective for the 2005-2006 season.
20
The pricing and cancellation terms of our food and support services contracts may constrain our ability to recover costs and to make a profit on our contracts.
The amount of risk that we bear and our profit potential vary depending on the type of contract under which we provide food and support services. We may be unable to fully recover costs on contracts that limit our ability to increase prices. In addition, we provide many of our services under contracts of indefinite term, which are subject to termination on short notice by either party without cause. Some of our profit and loss contracts contain minimum guaranteed remittances to our client regardless of our sales or profit at the facility involved. If sales do not exceed costs under a contract which contains minimum guaranteed commissions, we will bear any losses which are incurred, as well as the guaranteed commission. Generally, our contracts limit our ability to raise prices on the food, beverages and merchandise we sell within a particular facility without the client’s consent. In addition, some of our contracts exclude certain events or products from the scope of the contract, or give the client the right to modify the terms under which we may operate at certain events. The refusal by individual clients to permit the sale of some products at their venues, the imposition by clients of limits on prices which are not economically feasible for us, or decisions by clients to curtail their use of the services we provide could adversely affect our sales and results of operations.
Our business is contract intensive and may lead to client disputes.
Our business is contract intensive and we are parties to many contracts with clients all over the world. Our client interest contracts (which are described in the Business section of this annual report on Form 10-K), provide that client billings, and for some contracts the sharing of profits and losses, are based on our determinations of costs of service. Contract terms under which we base these determinations may be subject to differing interpretations which could result in disputes with our clients from time to time. Clients generally have the right to audit our contracts, and we periodically review our compliance with contract terms and provisions. If clients were to dispute our contract determinations, the resolution of such disputes in a manner adverse to our interests could negatively affect sales and operating results. While we do not believe any reviews, audits or other such matters would result in material adjustments, if a large number of our client arrangements were modified in response to any such matter, the effect could be materially adverse to our business or results of operations.
Claims of illness or injury associated with the service of food and beverage to the public could adversely affect us.
Claims of illness or injury relating to food quality or food handling are common in the food service industry, and a number of these claims may exist at any given time. As a result, we could be adversely affected by negative publicity resulting from food quality or handling claims at one or more of the facilities that we serve. In addition to decreasing our sales and profitability at our facilities, adverse publicity could negatively impact our service reputation, hindering our ability to renew contracts on favorable terms or to obtain new business. In addition, future food product recalls and health concerns may from time to time disrupt our business.
In fiscal 2005, one distributor provided approximately 55% of our food and non-food products in the U.S. and Canada, and if our relationship or their business were to be disrupted, we could experience disruptions to our operations and cost structure in such countries.
If our relationship with, or the business of, SYSCO, our main U.S. distributor of our food and non-food products were to be disrupted, we would have to arrange alternative distributors and our operations and cost structure could be adversely affected in the short term. Similarly, a
21
sudden termination of the relationship with a significant provider in other geographic areas could in the short term adversely affect our ability to provide services and disrupt our customer relationships in such areas.
Governmental regulations may subject us to significant liability.
Our operations are subject to various governmental regulations, including those governing:
| • | the service of food and alcoholic beverages; |
| • | minimum wage, overtime, wage payment and employment discrimination; |
| • | governmentally funded entitlement programs; |
| • | environmental protection; |
| • | human health and safety; |
| • | customs, import and export control laws; and |
| • | federal motor carrier safety. |
The regulations relating to each of our food and support service sectors are numerous and complex. A variety of regulations at various governmental levels relating to the handling, preparation and serving of food (including in some cases requirements relating to the temperature of food), and the cleanliness of food production facilities and the hygiene of food-handling personnel are enforced primarily at the local public health department level. We cannot assure you that we are in full compliance with all applicable laws and regulations at all times or that we will be able to comply with any future laws and regulations. Furthermore, additional or amended regulations in this area may significantly increase the cost of compliance.
We serve alcoholic beverages at many facilities, and must comply with applicable licensing laws, as well as state and local service laws, commonly called dram shop statutes. Dram shop statutes generally prohibit serving alcoholic beverages to certain persons such as an individual who is intoxicated or a minor. If we violate dram shop laws, we may be liable to the patron and/or third parties for the acts of the patron. Although we sponsor regular training programs designed to minimize the likelihood of such a situation, we cannot guarantee that intoxicated or minor patrons will not be served or that liability for their acts will not be imposed on us. There can be no assurance that additional regulation in this area would not limit our activities in the future or significantly increase the cost of regulatory compliance. We must also obtain and comply with the terms of licenses in order to sell alcoholic beverages in the states in which we serve alcoholic beverages. Some of our contracts require us to pay liquidated damages during any period in which our liquor license for the facility is suspended, and most contracts are subject to termination if we lose our liquor license for the facility.
Uniform and Career Apparel
Competition in the uniform rental industry could adversely affect our results of operations.
We have a number of major national competitors in the uniform rental industry with significant financial resources. In addition, there are regional and local uniform suppliers whom we believe may have strong customer loyalty. While most customers focus primarily on quality of service, uniform rental also is a price-sensitive service and if existing or future competitors seek to gain customers or accounts by reducing prices, we may be required to lower prices, which would reduce our sales and profits. The uniform rental business requires investment capital for growth. Failure to maintain capital investment in this segment would put us at a competitive disadvantage. In addition, due to competition in our Direct Marketing Segment, it has become
22
increasingly important for us to source garments and other products overseas, particularly in Asia. To the extent we are not able to effectively source such products in Asia and gain the related cost savings, we may be at a further disadvantage in relation to some of our competitors.
Economic and business conditions affecting our customer base and our operating costs could negatively impact our sales and operating results.
We supply uniform services to the airline, hospitality, retail and manufacturing industries, among others, all of which have been subject to one or more of shifting employment levels, changes in worker productivity, uncertainty regarding the impacts of rehiring and a shift to offshore manufacturing. Economic hardship among our client base could cause some of our clients to restrict expenditures or even cease to conduct business, both of which could negatively affect our sales and operating results.
Our operations are exposed to fluctuations in garment and fuel prices. The cost of gasoline and natural gas has increased significantly in the United States. To the extent we are not able to mitigate or pass on our increased costs to customers—for fuel expenses or any other of our costs that may increase—our operating results may be negatively affected.
Item 1B.Unresolved Staff Comments
Not Applicable.
Item 2.Properties
Our principal executive offices are located at ARAMARK Tower, 1101 Market Street, Philadelphia, Pennsylvania 19107. Our principal real estate comprises primarily uniform and career apparel facilities. As of September 30, 2005, we operated approximately 250 service facilities in our uniform and career apparel segments, consisting of industrial laundries, cleanroom laundries, warehouses, distribution centers, satellites, depots, stand alone garages and retail stores that are located in 41 states and Canada. Of these, approximately 55% are leased and approximately 45% are owned. We also own 15 buildings that we use in our food and support services segment, including two large conference centers, two office buildings and several office/warehouse spaces, and we lease approximately 185 premises, consisting of offices, office/warehouses and distribution centers. In addition, we lease facilities throughout the world that we use in our Food and Support Services—International segment. We also maintain other real estate and leasehold improvements, which we use in the uniform and career apparel and food and support services segments. No individual parcel of real estate owned or leased is of material significance to our total assets.
Item 3.Legal Proceedings
In connection with our acquisition of certain assets of Fine Host Corporation, we received and have cooperated with document requests from the U.S. Attorney’s Office for the Southern District of New York and the U.S. Department of Agriculture’s Office of Inspector General regarding certain billing practices that Fine Host Corporation put in place prior to our acquisition of the assets of Fine Host Corporation. On September 30, 2005, we signed a settlement agreement with Fine Host Corporation in connection with certain claims for indemnification we had made under our acquisition agreement with Fine Host Corporation.
Our uniform rental segment is subject to various federal, state and local laws and regulations governing, among other things, the generation, handling, storage, transportation, treatment and disposal of water wastes and other substances. We engage in informal settlement discussions with federal, state and local authorities regarding allegations of violations of environmental laws
23
at operations relating to our uniform rental segment or to businesses conducted by our predecessors, the aggregate amount of which and related remediation costs we do not believe should have a material adverse effect on our financial condition or results of operations.
From time to time, we are a party to various legal actions involving claims incidental to the conduct of our business, including actions by clients, customers, employees and third parties, including under federal and state employment laws, wage and hour laws, customs, import and export control laws and dram shop laws. Based on information currently available, advice of counsel, available insurance coverage, established reserves and other resources, we do not believe that any such actions are likely to be, individually or in the aggregate, material to our business, financial condition, results of operations or cash flows. However, in the event of unexpected further developments, it is possible that the ultimate resolution of these matters, or other similar matters, if unfavorable, may be materially adverse to our business, financial condition, results of operations or cash flows.
On July 21, 2004, agents of the United States Department of Commerce, among others, executed a search warrant at the Lexington, Kentucky facilities of Galls, a division of the Company, to gather records in connection with record keeping and documentation of certain export sales. In the Fall of 2004, the Company also provided records in response to grand jury subpoenas. See Risk Factor “If we fail to comply with requirements imposed by applicable law or other governmental regulations, we could become subject to lawsuits and other liabilities and restrictions on our operations that could significantly and adversely affect our business.”
In March 2000, Antonia Verni, by guardian ad litem, and Fazila Verni sued the Company and certain affiliates, along with Ronald Verni, David Lanzaro, the New Jersey Sports & Exposition Authority, the N.Y. Giants, Harry M. Stevens, Inc. of New Jersey, Shakers, The Gallery, Toyota Motors of North America, Inc. and the National Football League, for monetary damages for injuries they suffered in connection with an automobile accident caused by an intoxicated driver who attended a professional football game at which certain affiliates of the Company provided food and beverage service. On January 18 and 19, 2005, a New Jersey jury found various ARAMARK entities liable for approximately $30 million in compensatory damages and $75 million in punitive damages. The Company and its affiliates appealed the judgment to the Appellate Division of Superior Court of New Jersey on April 13, 2005. This process is likely to take considerable time. The Company believes that it has adequate insurance and other resources to address this matter.
Item 4.Submission of Matters to a Vote of Security Holders
Not applicable.
24
Executive Officers of the Company
The following table presents the names and positions of our executive officers, their ages as of October 28, 2005 and the length of time they have been officers:
Name | Age | Position | Officer Since | |||
Joseph Neubauer | 64 | Chairman and Chief Executive Officer | 1979 | |||
Bart J. Colli | 57 | Executive Vice President, General Counsel and Secretary | 2000 | |||
Timothy P. Cost | 46 | Executive Vice President, Corporate Affairs | 2003 | |||
Lynn B. McKee | 50 | Executive Vice President, Human Resources | 2004 | |||
L. Frederick Sutherland | 53 | Executive Vice President and Chief Financial Officer | 1983 | |||
John M. Lafferty | 61 | Senior Vice President, Controller and Chief Accounting Officer | 2000 | |||
John R. Donovan, Jr. | 47 | Senior Vice President and President, ARAMARK Business, Sports and Entertainment | 2004 | |||
Andrew C. Kerin | 42 | Senior Vice President and President, ARAMARK Healthcare and Education | 2004 | |||
Ravi K. Saligram | 49 | Senior Vice President and President, ARAMARK International | 2004 | |||
Thomas J. Vozzo | 43 | Senior Vice President and President, ARAMARK Uniform and Career Apparel | 2004 | |||
Christopher S. Holland | 39 | Vice President and Treasurer | 2003 |
Joseph Neubauer has served as our Chairman and Chief Executive Officer since September 2004. From January 2004 to September 2004, he served as Executive Chairman. From February 1983 until December 2003, he served as our Chief Executive Officer and from April 1984 until December 2003, he served as our Chairman. He was our President from February 1983 to May 1997.
Bart J. Colli joined us in February 2000 as General Counsel and was elected as our Executive Vice President and Secretary in March 2000. Prior to joining us, he was a partner with McCarter & English LLP since 1985.
Timothy P. Cost joined us in June 2003 and was elected as our Executive Vice President, Corporate Affairs in August 2003. Prior to joining us, he served as Senior Vice President of Corporate Affairs at Pharmacia Corporation from March 2002 to June 2003 prior to the company’s acquisition by Pfizer, Inc. From 1996 to 2002, he was Vice President of Investor Relations and Corporate Intelligence for Bristol Myers Squibb Company.
Lynn B. McKee has been our Executive Vice President, Human Resources since May 2004. From January 2004 to May 2004, she was our Senior Vice President of Human Resources and from September 2001 to December 2003, she served as Senior Vice President of Human Resources for our Food and Support Services Group. From August 1998 to August 2001, Ms. McKee served as our Staff Vice President, Executive Development and Compensation.
L. Frederick Sutherland became our Chief Financial Officer in May 1997. He has served as an Executive Vice President since May 1993. From May 1993 to May 1997, he also served as President of our Uniform Services division and from February 1991 to May 1993, he served as our Senior Vice President of Finance and Corporate Development. Mr. Sutherland served as our Treasurer from February 1984 to February 1991.
25
John M. Lafferty joined us and was elected as our Senior Vice President and appointed Controller and Chief Accounting Officer in August 2000. Prior to joining us, he retired as a partner with Arthur Andersen LLP, where he had been a partner since 1977.
John R. Donovan, Jr. was elected as our Senior Vice President and President, ARAMARK Business, Sports and Entertainment in November 2004. He has served as President, ARAMARK Business, Sports and Entertainment since January 2004. From May 2002 to January 2004, Mr. Donovan served as President, ARAMARK Educational Services and from April 1999 to May 2002 as President, ARAMARK Campus Services. He served as President, ARAMARK Correctional Services from October 1997 to April 1999, and prior to that held several positions with ARAMARK Business Services since he joined us in 1988.
Andrew C. Kerin was elected as our Senior Vice President and President, ARAMARK Healthcare and Education in November 2004. He has served as President, ARAMARK Healthcare and Education since January 2004 and from May 2002 to January 2004, as President, Facilities and Healthcare Group. Prior to that, he served as President, ARAMARK ServiceMaster Facility Services from November 2001 to May 2002 and as President, ARAMARK Correctional Services from June 2001 to November 2001. Mr. Kerin served with ARAMARK Facility Services as President from September 1999 to June 2001, as Senior Vice President from April 1998 to September 1999 and as Vice President from when he joined us in October 1995 to April 1998.
Ravi K. Saligram was elected as our Senior Vice President and President, ARAMARK International in November 2004. He joined us in June 2003 as President, ARAMARK International. Prior to joining us, Mr. Saligram held various positions with the Inter-Continental Hotel Group from 1994 to 2002, most recently as President, Brands & Franchise, North America from October 2000 to July 2002, as Chief Marketing Officer & Managing Director, Global Strategy from August 1999 to September 2000, and as President, International from June 1998 to July 1999.
Thomas J. Vozzo was elected as our Senior Vice President and President, ARAMARK Uniform and Career Apparel in November 2004. He has served as President, ARAMARK Uniform and Career Apparel since April 2003. Prior to that, Mr. Vozzo served in various divisions of ARAMARK Uniform and Career Apparel, including as President, Direct Marketing Group from July 2002 to April 2003 and President, Galls from January 1997 to April 2003. He served as Executive Vice President, Galls from April 1996 to January 1997 and as WearGuard Vice President, Marketing and then Vice President, Sales and Marketing from January 1992 to April 1996.
Christopher S. Holland joined us in November 2003, and he became our Vice President and Treasurer in December 2003. Prior to joining us, Mr. Holland served as Vice President, Investment Banking at J.P. Morgan Chase & Co. since 1998.
Our executive officers are elected annually by the Board of Directors and serve at its discretion or until their successors are duly elected and qualified.
26
PART II
Item 5.Market for Registrant’s Common Equity, Related Stockholder Matters and Issuer Purchases of Equity Securities
As of October 28, 2005, there were approximately 967 record holders of Class B common stock of the Company and approximately 2,132 record holders of the Class A common stock of the Company.
The Company has paid quarterly dividends of $.055 per share on its Class A Common Stock and Class B Common Stock since November 2004. From November 2003 to November 2004, the Company paid quarterly dividends of $.05 per share on its Class A Common Stock and Class B Common Stock. Prior to such time, the Company did not pay dividends. On November 15, 2005, the Board of Directors declared a quarterly dividend of $.07 per share on its Class A Common Stock and Class B Common Stock, which is payable on December 14, 2005 to holders of record on November 25, 2005. The Company’s Class B common stock has been listed on the New York Stock Exchange under the symbol “RMK” since it began trading on December 11, 2001. The following table sets forth, on a per share basis for the periods presented, the range of high and low sales prices of the Company’s Class B common stock.
Quarter Ended | High Price | Low Price | ||||
September 30, 2005 | $ | 28.67 | $ | 25.55 | ||
July 1, 2005 | $ | 27.00 | $ | 24.24 | ||
April 1, 2005 | $ | 28.18 | $ | 25.25 | ||
December 31, 2004 | $ | 27.23 | $ | 21.18 | ||
October 1, 2004 | $ | 28.69 | $ | 22.60 | ||
July 2, 2004 | $ | 29.35 | $ | 26.41 | ||
April 2, 2004 | $ | 28.20 | $ | 25.85 | ||
January 2, 2004 | $ | 27.57 | $ | 25.00 | ||
Issuer’s Purchases of Equity Securities
(Fourth Quarter 2005)
Period | Total Number of Shares Purchased | Average Price Paid per Share | Total Number of Shares Purchased as a result of Publicly Announced Plans or Programs(1) | Maximum Number (or Approximate Dollar Value) of Shares that May Yet be Purchased Under the Plans or Programs | ||||
Month 1 (July 2, 2005 – July 29, 2005) | 0 | 0 | 0 | $87,957,112 | ||||
Month 2 (July 30, 2005 – August 26, 2005) | 447,400 | $28.00 | 447,400 | $75,430,654 | ||||
Month 3 (August 27, 2005 – September 30, 2005) | 880,800 | $27.10 | 880,800 | $51,560,541 |
| (1) | On May 28, 2002, the Company announced the establishment of a Stock Repurchase Program. Under the Stock Repurchase Program, the Board of Directors approved the use of up to $200 million to repurchase shares of the Company’s Class A or Class B common stock. On May 8, 2003, the Company announced the addition of $150 million to the repurchase program and on February 3, 2004, the Company announced the addition of another $150 million to the repurchase program. On November 2, 2004, the Company announced the addition of $200 million to the repurchase program. On November 15, 2005, the Company announced an addition of another $200 million to the repurchase program. The repurchase program will expire when all monies authorized for use in the program have been utilized. |
27
Item 6.
SELECTED CONSOLIDATED FINANCIAL DATA
The following table presents selected consolidated financial data. This information should be read in conjunction with the consolidated financial statements and the related notes thereto, Management’s Discussion and Analysis of Results of Operations and Financial Condition, and Risk Factors, each included elsewhere herein.
| ARAMARK Corporation and Subsidiaries(1) | |||||||||||||||
| Fiscal Year Ended on or near September 30(10) | |||||||||||||||
| 2001(3) | 2002(2)(3) | 2003(2) | 2004(2) | 2005(2) | |||||||||||
| (in millions, except per share amounts and ratios) | |||||||||||||||
Income Statement Data: | |||||||||||||||
Sales | $ | 7,369.5 | $ | 8,356.0 | $ | 9,447.8 | $ | 10,192.2 | $ | 10,963.4 | |||||
Depreciation and amortization | 214.6 | 229.6 | 262.9 | 298.0 | 320.1 | ||||||||||
Operating income (2) | 415.5 | 529.6 | 552.0 | 537.6 | 580.2 | ||||||||||
Interest and other financing costs, net (9) | 153.2 | 136.4 | 142.5 | 122.4 | 127.0 | ||||||||||
Income from continuing operations (4) | 162.7 | 251.3 | 265.4 | 263.1 | 288.5 | ||||||||||
Net income (4) | 176.5 | 269.9 | 301.1 | 263.1 | 288.5 | ||||||||||
Basic earnings per share (5): | |||||||||||||||
Income from continuing operations | $ | 0.95 | $ | 1.32 | $ | 1.39 | $ | 1.39 | $ | 1.55 | |||||
Net income | $ | 1.03 | $ | 1.42 | $ | 1.58 | $ | 1.39 | $ | 1.55 | |||||
Diluted earnings per share (4) (5): | |||||||||||||||
Income from continuing operations | $ | 0.90 | $ | 1.25 | $ | 1.34 | $ | 1.36 | $ | 1.53 | |||||
Net income | $ | 0.97 | $ | 1.34 | $ | 1.52 | $ | 1.36 | $ | 1.53 | |||||
Cash dividends per common share (11) | — | — | — | $ | 0.20 | $ | 0.22 | ||||||||
Ratio of earnings to fixed charges (6) | 2.3x | 3.1x | 3.1x | 3.3x | 3.5x | ||||||||||
Balance Sheet Data (at period end): | |||||||||||||||
Total assets | $ | 3,216.4 | $ | 4,259.3 | $ | 4,467.6 | $ | 4,821.6 | $ | 5,157.1 | |||||
Long-term borrowings | 1,635.5 | 1,835.6 | 1,711.7 | 1,843.2 | 1,794.5 | ||||||||||
Common stock subject to potential repurchase (7) | 20.0 | — | — | — | — | ||||||||||
Shareholders’ equity (8) | 246.9 | 858.2 | 1,039.0 | 1,149.7 | 1,325.5 | ||||||||||
| (1) | In the third quarter of fiscal 2003, ARAMARK completed the sale of ARAMARK Educational Resources (AER) to Knowledge Learning Corporation for approximately $250 million in cash. AER has been accounted for as a discontinued operation in accordance with Statement of Financial Accounting Standards No. 144, “Accounting for the Impairment or Disposal of Long-Lived Assets.” AER’s results of operations and cash flows have been removed from the Company’s results of continuing operations for all periods presented. |
| (2) | During the second quarter of fiscal 2005, the Company recorded a gain ($9.7 million) from a real estate sale by an equity affiliate, as well as charges ($7.4 million) for exiting West Africa business and severance. During fiscal 2004, the Company incurred a $10.0 million charge related to a management change. During fiscal 2003, the Company reached agreement for the sale of its 15% interest in a previously divested periodicals distribution business to the majority shareholder, and wrote down this investment by $10.7 million to the expected recoverable amount. Fiscal 2003 also includes approximately $32 million of business interruption proceeds from the final settlement of the Company’s September 11, 2001 claim. During fiscal 2002, the Company recorded a pre-tax net gain of $43.7 million, consisting of a gain ($5.8 million) resulting principally from the sale of a residual interest in a previously divested business and a gain ($37.9 million) on the sale of the Company’s interests in the Boston Red Sox Baseball Club and a related entity which controls the rights to broadcast Red Sox games. |
28
| (3) | On November 30, 2001, ARAMARK completed the acquisition of the management services division of The ServiceMaster Company for approximately $790 million in cash plus costs of the acquisition. The following pro forma results assume the acquisition had occurred at the beginning of the respective fiscal periods. These pro forma disclosures are unaudited and are based on historical results, adjusted for the impact of certain acquisition related items, such as: amortization of identified intangibles, increased interest expense on acquisition debt and the related income tax effects. Pro forma adjustments do not reflect any synergies that might be achieved from the combined operations, and therefore, in management’s opinion, are not indicative of what actual results may have been if the acquisition had occurred at the beginning of the respective periods. Pro forma results are not intended to be a projection of future results. |
| Fiscal 2001 | Fiscal 2002 | |||||
Sales | $ | 8,349.7 | $ | 8,517.5 | ||
Operating income (2) | 474.1 | 537.7 | ||||
Interest and other financing costs, net | 206.9 | 141.9 | ||||
Income from continuing operations | 165.3 | 252.8 | ||||
Net income | 179.1 | 271.4 | ||||
Basic earnings per share: | ||||||
Income from continuing operations | $ | 0.96 | $ | 1.33 | ||
Net income | $ | 1.04 | $ | 1.43 | ||
Diluted earnings per share: | ||||||
Income from continuing operations | $ | 0.91 | $ | 1.26 | ||
Net income | $ | 0.99 | $ | 1.35 | ||
| (4) | ARAMARK adopted the provisions of SFAS No. 142, “Goodwill and Other Intangible Assets,” at the beginning of fiscal 2002. With the adoption of SFAS No. 142, goodwill is no longer subject to amortization. The elimination of goodwill amortization would have increased income from continuing operations by $19.2 million ($0.11 per diluted share) in fiscal 2001. |
| (5) | Earnings per share amounts for fiscal 2001 were restated to reflect the merger exchange ratios, which had the effect of a two-for-one stock split. See Note 8 to the consolidated financial statements. |
| (6) | For the purpose of determining the ratio of earnings to fixed charges, earnings include pre-tax income from continuing operations plus fixed charges (excluding capitalized interest). Fixed charges consist of interest on all indebtedness (including capitalized interest) plus that portion of operating lease rentals representative of the interest factor (deemed to be one-third of operating lease rentals). |
| (7) | Reflects shares of ARAMARK’s common stock, that prior to our corporate reorganization and public offering on December 14, 2001, may have been required to be repurchased under the ARAMARK stockholders’ agreement, subject to a limit on such repurchases in the former senior revolving credit facility. In connection with the stockholder vote on the corporate reorganization, the stockholders’ agreement was terminated. |
| (8) | Shareholders’ equity, commencing in fiscal 2002, reflects the impact of the public offering and related transactions. See Note 8 to the consolidated financial statements. |
| (9) | During fiscal 2003, ARAMARK completed a tender offer to purchase approximately $94.3 million of its 6.75% Guaranteed Notes due August 1, 2004, for approximately $101.9 million, including accrued interest, and retired a $45 million term loan due March 2005. These two transactions resulted in an extinguishment charge of $7.7 million which is included in “Interest and other financing costs, net.” |
| (10) | Fiscal 2003 is a 53-week year. All other periods presented are 52-week years. |
| (11) | During fiscal 2004, the Company paid cash dividends totaling $37.2 million ($0.05/share in each of the four quarters of fiscal 2004). During fiscal 2005, the Company paid cash dividends totaling $40.3 million ($0.055/share in each of the four quarters of fiscal 2005). |
29
Item 7.
MANAGEMENT’S DISCUSSION AND ANALYSIS
OF RESULTS OF OPERATIONS AND FINANCIAL CONDITION
The following discussion and analysis of our results of operations and financial condition for the fiscal years ended October 3, 2003, October 1, 2004 and September 30, 2005, should be read in conjunction with Selected Consolidated Financial Data and our audited consolidated financial statements and the notes to those statements. Our discussion contains forward-looking statements based upon current expectations that involve risks and uncertainties, such as our plans, objectives, opinions, expectations, anticipations and intentions and beliefs. Actual results and the timing of events could differ materially from those anticipated in those forward-looking statements as a result of a number of factors, including those set forth under the Risk Factors, Special Note About Forward-Looking Statements and Business sections and elsewhere in this Annual Report on Form 10-K. In the following discussion and analysis of results of operations and financial condition, certain financial measures may be considered “non-GAAP financial measures” under Securities and Exchange Commission rules. These rules require supplemental explanation and reconciliation, which is provided in Exhibit 99.1 to this Annual Report on Form 10-K, and is incorporated by reference herein.
Critical Accounting Policies and Estimates
The Company’s significant accounting policies are described in the notes to the consolidated financial statements included in this Annual Report. As described in such notes, the Company recognizes sales in the period in which services are provided pursuant to the terms of our contractual relationships with our clients.
In preparing our financial statements, management is required to make estimates and assumptions that, among other things, affect the reported amounts of assets, liabilities, sales and expenses. These estimates and assumptions are most significant where they involve levels of subjectivity and judgment necessary to account for highly uncertain matters or matters susceptible to change, and where they can have a material impact on our financial condition and operating performance. We discuss below the more significant estimates and related assumptions used in the preparation of our consolidated financial statements. If actual results were to differ materially from the estimates made, the reported results could be materially affected.
Asset Impairment Determinations
As a result of the adoption of Statement of Financial Accounting Standards No. 142, “Goodwill and Other Intangible Assets,” goodwill is no longer amortized. Under this accounting standard, goodwill is subject to an impairment test that we conduct at least annually, using a discounted cash flow technique.
With respect to our other long-lived assets, we are required to test for asset impairment whenever events or circumstances indicate that the carrying value of an asset may not be recoverable. We apply Statement of Financial Accounting Standards No. 144, “Accounting for the Impairment or Disposal of Long-Lived Assets,” in order to determine whether or not an asset was impaired. This standard requires an impairment analysis when indicators of impairment are present. If such indicators are present, the standard indicates that if the sum of the future expected cash flows from the asset, undiscounted and without interest charges, is less than the carrying value, an asset impairment must be recognized in the financial statements. The amount of the impairment is the difference between the fair value of the asset and the carrying value of the asset.
30
In making future cash flow analyses of various assets, the Company makes assumptions relating to the following:
| • | The intended use of assets and the expected future cash flows resulting directly from such use. |
| • | Comparable market valuations of businesses similar to ARAMARK’s business segments. |
| • | Industry specific economic conditions. |
| • | Competitor activities and regulatory initiatives. |
| • | Client and customer preferences and behavior patterns. |
We believe that an accounting estimate relating to asset impairment is a critical accounting estimate because the assumptions underlying future cash flow estimates are subject to change from time to time and the recognition of an impairment could have a significant impact on our income statement.
Environmental Loss Contingencies
Accruals for environmental loss contingencies (i.e., environmental reserves) are recorded when it is probable that a liability has been incurred and the amount can reasonably be estimated. Management views the measurement of environmental reserves as a critical accounting estimate because of the considerable uncertainty surrounding estimation, including the need to forecast well into the future. We are involved in legal proceedings under state, federal and local environmental laws in connection with operations of our uniform rental segment or businesses conducted by our predecessors or companies that we have acquired. The calculation of environmental reserves is based on the evaluation of currently available information, prior experience in the remediation of contaminated sites and assumptions with respect to government regulations and enforcement activity, changes in remediation technology and practices, and financial obligations and credit worthiness of other responsible parties and insurers.
Litigation and Claims
The Company is a party to various legal actions and investigations including, among others, employment matters, compliance with government regulations, including import and export controls and customs laws, federal and state employment laws, including wage and hour laws, dram shop laws, environmental laws, contractual disputes and other matters, including matters arising in the ordinary course of business. These claims may be brought by, among others, the government, clients, customers, employees and third parties. Management considers the measurement of litigation reserves as a critical accounting estimate because of the significant uncertainty in some cases relating to the outcome of potential claims or litigation and the difficulty of predicting the likelihood and range of potential liability involved, coupled with the material impact on our results of operations that could result from litigation or other claims. In determining legal reserves, management considers, among other issues:
| • | Interpretation of contractual rights and obligations. |
| • | The status of government regulatory initiatives, interpretations and investigations. |
| • | The status of settlement negotiations. |
| • | Prior experience with similar types of claims. |
| • | Whether there is available insurance. |
| • | Advice of counsel. |
31
Allowance for Doubtful Accounts
We encounter risks associated with sales and the collection of the associated accounts receivable. We record a provision for accounts receivable that are considered to be uncollectible. In order to calculate the appropriate provision, management analyzes the creditworthiness of specific customers and the aging of customer balances. Management also considers general and specific industry economic conditions, industry concentrations, such as exposure to the non-profit healthcare sector and the airline industry, and contractual rights and obligations.
Management believes that the accounting estimate related to the allowance for doubtful accounts is a critical accounting estimate because the underlying assumptions used for the allowance can change from time to time and uncollectible accounts could potentially have a material impact on our results of operations.
Inventory Obsolescence
We record an inventory obsolescence reserve for obsolete, excess and slow-moving inventory, principally in the uniform and career apparel segments. In calculating our inventory obsolescence reserve, management analyzes historical data regarding customer demand within specific product categories and makes assumptions regarding economic conditions within customer specific industries, as well as style and product changes. Management believes that its accounting estimate related to inventory obsolescence is a critical accounting estimate because customer demand in certain of our businesses can be variable and changes in our reserve for inventory obsolescence could materially affect our financial results.
Income Taxes
We use the asset and liability method of accounting for income taxes. Under this method, income tax expense is recognized for the amount of taxes payable or refundable for the current year and for deferred tax liabilities and assets for the future tax consequences of events that have been recognized in our financial statements or tax returns. We must make assumptions, judgments and estimates to determine our current provision for income taxes and also our deferred tax assets and liabilities and any valuation allowance to be recorded against a deferred tax asset. Our assumptions, judgments and estimates relative to the current provision for income tax take into account current tax laws, our interpretation of current tax laws and possible outcomes of current and future audits conducted by foreign and domestic tax authorities. Changes in tax law or our interpretation of tax laws and the resolution of current and future tax audits could significantly impact the amounts provided for income taxes in our consolidated financial statements. Our assumptions, judgments and estimates relative to the amount of deferred income taxes take in to account estimates of the amount of future taxable income, and actual operating results in future years could render our current assumptions, judgments and estimates inaccurate. Any of the assumptions, judgments and estimates mentioned above could cause our actual income tax obligations to differ from our estimates.
Critical accounting estimates and the related assumptions are evaluated periodically as conditions warrant, and changes to such estimates are recorded as new information or changed conditions require revision.
Results of Continuing Operations
On May 9, 2003, the Company completed the sale of its Educational Resources segment (see Note 2 to the consolidated financial statements). Accordingly, the fiscal 2003 operating results for this business are reported as “discontinued operations.” The following tables present our
32
sales and operating income from continuing operations, and the related percentages attributable to each operating segment for fiscal years 2003, 2004 and 2005. Fiscal 2003 was a 53-week year, and fiscal 2004 and 2005 were 52-week years.
| Fiscal Year | |||||||||||||||||||||
| 2003 | 2004 | 2005 | |||||||||||||||||||
Sales by Segment | $ | % | $ | % | $ | % | |||||||||||||||
| (dollars in millions) | |||||||||||||||||||||
Food & Support Services—United States | $ | 6,542.1 | 69 | % | $ | 6,879.3 | 68 | % | $ | 7,129.1 | 65 | % | |||||||||
Food & Support Services—International | 1,427.1 | 15 | 1,830.4 | 18 | 2,280.2 | 21 | |||||||||||||||
Uniform and Career Apparel—Rental | 1,030.3 | 11 | 1,042.5 | 10 | 1,125.8 | 10 | |||||||||||||||
Uniform and Career Apparel—Direct Marketing | 448.3 | 5 | 440.0 | 4 | 428.3 | 4 | |||||||||||||||
| $ | 9,447.8 | 100 | % | $ | 10,192.2 | 100 | % | $ | 10,963.4 | 100 | % | ||||||||||
| Fiscal Year | |||||||||||||||||||||
| 2003 | 2004 | 2005 | |||||||||||||||||||
Operating Income by Segment | $ | % | $ | % | $ | % | |||||||||||||||
| (dollars in millions) | |||||||||||||||||||||
Food & Support Services—United States | $ | 393.3 | 71 | % | $ | 375.8 | 70 | % | $ | 403.1 | 70 | % | |||||||||
Food & Support Services—International | 61.2 | 11 | 66.7 | 12 | 78.0 | 13 | |||||||||||||||
Uniform and Career Apparel—Rental | 111.9 | 20 | 116.0 | 22 | 125.8 | 22 | |||||||||||||||
Uniform and Career Apparel—Direct Marketing | 26.4 | 5 | 20.1 | 4 | 11.2 | 2 | |||||||||||||||
| 592.8 | 107 | 578.6 | 108 | 618.1 | 107 | ||||||||||||||||
Corporate | (30.1 | ) | (5 | ) | (41.0 | ) | (8 | ) | (37.9 | ) | (7 | ) | |||||||||
Other Income (Expense) | (10.7 | ) | (2 | ) | — | — | — | — | |||||||||||||
| $ | 552.0 | 100 | % | $ | 537.6 | 100 | % | $ | 580.2 | 100 | % | ||||||||||
Fiscal 2005 Compared to Fiscal 2004
Consolidated Overview
Sales for fiscal 2005 were $11.0 billion, an increase of 8% over fiscal 2004. Sales increased 8% in our worldwide Food and Support business while sales in the combined Uniform and Career Apparel segments increased 5% over the prior year. Excluding the impact of acquisitions, divestitures and foreign currency translation, sales increased 4% compared to the prior year, as the effect of the National Hockey League (NHL) lockout in 2005 constrained growth in the U.S. Food and Support segment.
Operating income for fiscal 2005 was $580.2 million compared to $537.6 million in fiscal 2004, an increase of 8%. Operating income for fiscal 2005 includes $9.7 million ($7.8 million net of tax) representing our share of the gain on a real estate sale by a 50%-owned equity affiliate. The 2005 period also includes a charge of $7.4 million ($4.8 million net of tax) which includes the effects of our decision to exit the West African oil services business and UK severance costs. Fiscal 2004 includes a charge of approximately $10.0 million related to the management change announced in September 2004. Excluding acquisitions, divestitures and the impact of currency translation, 2005 consolidated operating income increased 6% over the prior year. Consolidated operating income margins were comparable during the periods.
Interest and other financing costs, net, increased 4% compared to the prior year, due to higher average borrowing levels and higher interest rates. The effective income tax rate for fiscal
33
2005 was 36.3% compared to 36.6% in fiscal 2004, reflecting a somewhat higher than historical level of employment-related tax credits in both periods.
Net income increased 10% from $263.1 million in fiscal 2004 to $288.5 million in fiscal 2005. Fiscal 2005 diluted earnings per share was $1.53 on a weighted average share count of 188.3 million shares. Fiscal 2004 diluted earnings per share was $1.36 on a weighted average share count of 193.5 million shares.
Segment Results
The following tables present a 2005/2004 comparison of segment sales and operating income together with the amount of and percentage change between periods.
| Fiscal | Change | ||||||||||||||
Sales by Segment | 2004 | 2005 | $ | % | |||||||||||
| (dollars in millions) | |||||||||||||||
Food and Support Services—United States | $ | 6,879.3 | $ | 7,129.1 | $ | 249.8 | 4 | % | |||||||
Food and Support Services—International | 1,830.4 | 2,280.2 | 449.8 | 25 | |||||||||||
Uniform and Career Apparel—Rental | 1,042.5 | 1,125.8 | 83.3 | 8 | |||||||||||
Uniform and Career Apparel—Direct Marketing | 440.0 | 428.3 | (11.7 | ) | (3 | ) | |||||||||
| $ | 10,192.2 | $ | 10,963.4 | $ | 771.2 | 8 | % | ||||||||
| Fiscal | Change | ||||||||||||||
Operating Income by Segment | 2004 | 2005 | $ | % | |||||||||||
| (dollars in millions) | |||||||||||||||
Food and Support Services—United States | $ | 375.8 | $ | 403.1 | $ | 27.3 | 7 | % | |||||||
Food and Support Services—International | 66.7 | 78.0 | 11.3 | 17 | |||||||||||
Uniform and Career Apparel—Rental | 116.0 | 125.8 | 9.8 | 8 | |||||||||||
Uniform and Career Apparel—Direct Marketing | 20.1 | 11.2 | (8.9 | ) | (44 | ) | |||||||||
Corporate | (41.0 | ) | (37.9 | ) | 3.1 | 8 | |||||||||
| $ | 537.6 | $ | 580.2 | $ | 42.6 | 8 | % | ||||||||
Food and Support Services—United States Segment
Food and Support Services—United States segment sales increased 4% over the prior year period due principally to increased volume (base business). The 2005/2004 comparison was affected by the cancellation of the National Hockey League season. The National Hockey League Collective Bargaining Agreement expired in September 2004 and on September 17, 2004 the owners of the NHL teams locked out the NHL players. Sales from NHL venues were approximately $73 million in the 2004 period. In July 2005, the NHL and the NHL Players’ Association announced they had reached an agreement for the 2005/2006 hockey season and the 2005/2006 hockey season has commenced.
For fiscal 2005, sales growth in the Business Services sector was in the mid single digits, driven primarily by base business growth in corrections and refreshment services. Sales growth in the Education sector was in the high single digits, also reflecting base business growth. The Healthcare sector reported high single digits sales growth due to base business growth and net new business. Sports & Entertainment sector sales declined approximately 8% as improved performance at convention centers, parks and resorts and existing stadiums and arenas was more than offset by the NHL lockout, the loss of two Major League Baseball clients and a weaker concert schedule in our amphitheaters.
34
Segment operating income increased 7% compared to the prior year. The 2005 period includes approximately $9.7 million representing our share of the gain from a real estate sale by a 50%-owned equity affiliate. Excluding the $9.7 million, operating income increased 5%. Fiscal 2005 operating income increased despite the negative effect of the NHL lockout, due primarily to strong performances in the Education sector and the Healthcare sector, where prior year results were lowered by start-up costs at new accounts and high labor and material costs in the clinical equipment services business. Fiscal 2005 was also positively affected by improved Sports & Entertainment results at convention centers, existing stadiums and arenas and our parks and resorts. Operating income margin improved slightly in fiscal 2005.
Food and Support Services—International Segment
Sales in the Food and Support Services—International segment increased 25% compared to the prior year due to foreign currency translation (approximately 7%), acquisitions (approximately 12%), net new accounts (approximately 2%), and increased volume (approximately 4%). Strong sales growth in Canada, Germany, and Chile was partially offset by sales declines in the UK due to challenging trading conditions and lost business.
Segment operating income increased 17%, compared to the prior year, of which approximately 6% represented currency translation. The 2005 period includes a charge of $7.4 million representing the estimated cost of exiting the West African oil services business and a management separation charge in the UK. During the second quarter, the decision was made to cease operations in West Africa. This business has been operating at a loss and efforts to renegotiate a client contract have proved unsuccessful. We are working towards an orderly withdrawal and expect to exit the region shortly. Provision has been made for the losses, principally asset write-offs, expected to be incurred during the withdrawal. Fiscal 2004 results were negatively affected by losses from the offshore oil service operations and several fourth quarter accounting adjustments in the UK. The fiscal 2004 period also includes currency transaction gains of approximately $1.2 million. Broadly affecting year-over-year comparisons, improved results in Canada and Germany were partially offset by lower operating income in the UK due to the challenging trading environment and lost business.
Uniform and Career Apparel—Rental Segment
Uniform and Career Apparel—Rental segment sales increased 8% compared to the prior year. Organic sales growth, which excludes the effects of acquisitions and divestitures, was 5%. Growth in the sales of apparel and ancillary products to rental customers contributed to this performance.
Operating income increased 8% due to increased sales, lower garment costs and a gain on the sale of a dormant property, partially offset by higher energy costs and labor-related expenses, new systems implementation costs and increased selling expense. Operating income margin improved slightly for the year.
Uniform and Career Apparel—Direct Marketing Segment
Uniform and Career Apparel—Direct Marketing segment sales decreased 3% from the prior year period. WearGuard-Crest continued to experience lower demand in the quick service restaurant channel and sales of safety products remained soft.
Segment operating income was $11.2 million compared to $20.1 million in fiscal 2004. Operating income has decreased due to lower sales volume, gross margin erosion at WearGuard- Crest and costs related to the opening of a new distribution center. Margins have been negatively affected by the roll-out of a new program in the quick service restaurant channel.
35
Corporate
Corporate expenses, those administrative expenses not allocated to the business segments, were $37.9 million for fiscal 2005, compared to $41.0 million in the prior year. Fiscal 2004 includes the $10.0 million charge related to the resignation of the Company’s former Chief Executive Officer announced in September 2004. Fiscal 2005 includes increases related to the cost of Sarbanes-Oxley compliance and restricted stock units.
Outlook
Looking forward to fiscal 2006, we anticipate a steady economic environment and stable employment levels. Although we expect some lingering impact from the 2005 hurricanes, particularly in the Education and Sports & Entertainment businesses, the resumption of NHL hockey should have a positive effect on operating results. If energy costs remain at historically high levels, margins in our Uniform Rental segment will continue to be pressured, and we expect the Direct Marketing segment will continue to be affected by lower than historical sales growth and margin pressures. We expect higher interest expense in 2006 due principally to recent rate increases, and fiscal 2006 results will reflect the effect of expensing stock options, as required by the revised Statement of Financial Accounting Standards (SFAS) No. 123.
Fiscal 2004 Compared to Fiscal 2003
Consolidated Overview
Sales for fiscal 2004 were $10.2 billion, an increase of 8% over fiscal 2003. Sales increased 9% in our worldwide Food and Support business while sales in the combined Uniform and Career Apparel segments were about even with the prior year. Excluding the impact of acquisitions, foreign currency translation, the estimated impact of the 53rd week in 2003 and the impact in 2004 of the calendar shift which resulted in the Education sector having fewer service days, sales increased 6% compared to the prior year.
Operating income for fiscal 2004 was $537.6 million compared to $552.0 million in fiscal 2003. Fiscal 2004 includes a charge of approximately $10.0 million related to the management change announced in September 2004. Fiscal 2003 operating income includes $32 million of business interruption insurance proceeds, representing the final settlement of our September 11, 2001 claim (see Note 12 to the consolidated financial statements), and a charge of $10.7 million to write-down an investment in a previously divested periodicals distribution business (see Note 13 to the consolidated financial statements). Excluding these three items for comparison purposes, operating income increased 3% in 2004. Further, excluding the impact of acquisitions, foreign currency translation, the estimated effect of the 53rd week in 2003 and the effect of the calendar shift on the Education sector, 2004 operating income increased 2% over the prior year, as higher income in the U.S. Food and Support and Uniform Rental segments was largely offset by reduced income from the International and Direct Marketing segments. Consolidated operating income margin, excluding the above three items was 5.4% in 2004 and 5.6% in 2003. While the margin in the U.S. Food and Support segment was even with last year and the Uniform Rental margin increased slightly, reduced operating income in the International and Direct Marketing segments resulted in a decrease in consolidated margin.
Interest and other financing costs, net, decreased 14% compared to the prior year, due primarily to the debt extinguishment loss recorded in fiscal 2003 (see Note 5 to the consolidated financial statements) and the impact of lower average borrowing levels and lower interest rates in fiscal 2004.
36
The effective income tax rate was 36.6% in fiscal 2004 and 35.2% in 2003. In 2003, a favorable adjustment, resulting from the closing of certain open tax years, reduced the effective rate by 2.1%. In 2004, higher employment related tax credits reduced the rate by .7%.
Income from continuing operations was $263.1 million in fiscal 2004 compared to $265.4 million in fiscal 2003. Fiscal 2004 includes a charge for the management change ($6.1 million net of tax), and fiscal 2003 includes the insurance proceeds ($19.7 million net of tax) and the investment write-down ($6.6 million net of tax). Fiscal 2004 diluted earnings per share was $1.36 on a weighted average share count of 193.5 million shares. Fiscal 2003 diluted earnings per share was $1.34 on a weighted average share count of 197.5 million shares. Excluding the three items described above and the debt extinguishment charge and tax adjustment from both years, diluted earnings per share was $1.39 in 2004 and $1.26 in 2003.
Net income for fiscal 2004 was $263.1 million compared to $301.1 million reported in fiscal 2003. In addition to the items discussed in the paragraph above, net income for fiscal 2003 includes the after-tax gain of $23.6 million related to the divestiture of the Educational Resources segment. Fiscal 2004 diluted earnings per share was $1.36 and fiscal 2003 diluted earnings per share was $1.52. As noted above, the fully diluted weighted average share count was 193.5 million shares in fiscal 2004 compared to 197.5 million shares in 2003, reflecting the impact of the Company’s ongoing share repurchase program.
Segment Results
The following tables present a 2004/2003 comparison of segment sales and operating income together with the amount of and percentage change between periods.
| Fiscal | Change | ||||||||||||||
| 2003 | 2004 | $ | % | ||||||||||||
| (dollars in millions) | |||||||||||||||
Sales by Segment | |||||||||||||||
Food and Support Services—United States | $ | 6,542.1 | $ | 6,879.3 | $ | 337.2 | 5 | % | |||||||
Food and Support Services—International | 1,427.1 | 1,830.4 | 403.3 | 28 | |||||||||||
Uniform and Career Apparel—Rental | 1,030.3 | 1,042.5 | 12.2 | 1 | |||||||||||
Uniform and Career Apparel—Direct Marketing | 448.3 | 440.0 | (8.3 | ) | (2 | ) | |||||||||
| $ | 9,447.8 | $ | 10,192.2 | $ | 744.4 | 8 | % | ||||||||
| Fiscal | Change | ||||||||||||||
| 2003 | 2004 | $ | % | ||||||||||||
| (dollars in millions) | |||||||||||||||
Operating Income by Segment | |||||||||||||||
Food and Support Services—United States | $ | 393.3 | $ | 375.8 | $ | (17.5 | ) | (4 | )% | ||||||
Food and Support Services—International | 61.2 | 66.7 | 5.5 | 9 | |||||||||||
Uniform and Career Apparel—Rental | 111.9 | 116.0 | 4.1 | 4 | |||||||||||
Uniform and Career Apparel—Direct Marketing | 26.4 | 20.1 | (6.3 | ) | (24 | ) | |||||||||
Corporate | (30.1 | ) | (41.0 | ) | (10.9 | ) | (36 | ) | |||||||
| 562.7 | 537.6 | (25.1 | ) | (4 | ) | ||||||||||
Other income (expense) | (10.7 | ) | — | 10.7 | n/m | ||||||||||
| $ | 552.0 | $ | 537.6 | $ | (14.4 | ) | (3 | )% | |||||||
37
Food and Support Services—United States Segment
Food and Support Services—United States segment sales for fiscal 2004 increased 5% over the prior year. Fiscal 2003 was a 53 week year which included one additional week of operations and resulted in fiscal 2004 starting one week later than normal, causing a lack of service day comparability in the Education sector. Adjusting for the 53rd week and the effect of the fiscal calendar shift, sales increased approximately 8%, due to acquisitions (approximately 1%), increased volume (approximately 5%) and net new accounts (approximately 2%).
Sales increased in all of our business sectors on a comparable week (52 week) basis. Business Services sector sales growth was in the mid single digits driven by a balance of base business growth and net new business. Base business growth resulted in high single digit sales growth in the Education sector. The Facilities sector reported low double digit sales growth resulting from both net new accounts and base business growth. The Healthcare/Corrections sector reported low double digit sales growth due to base business growth and net new accounts. Sales in the Sports & Entertainment sector grew in the high single digits attributable to acquisitions, base business growth and net new accounts.
Segment operating income decreased 4% compared to the prior year, which included results of the extra fiscal week and approximately $32 million of insurance proceeds from the September 11th claim. Excluding these two items from fiscal 2003, operating income increased approximately 8% of which approximately 2% was contributed by acquisitions. Fiscal 2004 segment operating income was influenced by a number of factors. The positive effect of base business and new account sales growth was constrained as a result of start-up transition costs at new healthcare accounts, increased healthcare clinical service labor and material costs, higher labor related expenses (including workers’ compensation, state unemployment insurance and healthcare costs), and somewhat higher food costs, particularly at Education accounts. Broadly affecting year over year comparisons, improved operating performance in the Sports & Entertainment sector was substantially offset by lower operating income in the Facilities sector. The fourth quarter settlement of the school support services civil litigation resulted in a favorable accrual adjustment of approximately $4.0 million.
Food and Support Services—International Segment
Sales in the Food and Support Services—International segment increased 28% compared to the prior year. Excluding the impact of foreign currency translation and the 53rd week impact from 2003, sales increased 17% due to acquisitions (approximately 11%), increased volume (approximately 1%) and net new business (approximately 5%). Spain and Canada reported high single to low double digit sales growth, while growth in Germany and the UK was in the low single digits, reflecting modest gains in base and net new business.
Fiscal 2004 segment operating income increased 9%. Excluding the impact of foreign currency translation and the estimated 53rd week impact, operating income decreased 2% compared to the prior year. Further, excluding acquisitions, operating income decreased approximately 9% in 2004. Increased operating income in Germany and Spain was more than offset by the decrease in UK operating results. UK results were negatively affected by a number of factors, including losses from certain offshore oil services operations (approximately $4.5 million) and several fourth quarter accounting adjustments (approximately $4.7 million). The accounting adjustments included write-offs of amounts previously recorded as due from vendor programs, and a reserve for possible obligations under client contracts. Management has begun improvement initiatives in these areas, which will continue into fiscal 2005. Fiscal 2004 includes currency transaction gains of approximately $1.2 million.
38
Uniform and Career Apparel—Rental Segment
Uniform and Career Apparel—Rental segment fiscal 2004 sales increased 1% compared to the prior year. Adjusting for the estimated effect of the 53rd week in fiscal 2003, sales growth was approximately 3%, with acquisitions contributing about 1%. The expanded sales force and slight improvement in employment levels resulted in increased net new sales and a slowing of the volume reduction at existing accounts. Price increases also contributed approximately 1% to the growth.
Fiscal 2004 segment operating income increased 4% compared to the prior year. Net new sales growth, price increases, and lower garment costs resulting from expanded self-manufacturing activity drove the income increase. Improvement was constrained by the continuing high cost of fuel, increases in labor related expenses and the cost of expanding the sales force.
Uniform and Career Apparel—Direct Marketing Segment
Uniform and Career Apparel—Direct Marketing segment sales in 2004 decreased 2% compared to the prior year. Adjusting for the effect of the 53rd week in 2003, sales were about even to the prior year. Comparable week sales in the fourth quarter of 2004 decreased approximately 3% from the prior year quarter, as sales of safety products were negatively affected by the ongoing Department of Commerce investigation involving certain export sales at Galls. While export sales are not significant, the investigation has had a dampening effect on demand from government agencies (See “Legal Proceedings”).
Segment operating income decreased approximately 24% compared to the prior year. Reduced margin attributable to the decrease in sales of safety products and costs associated with the investigation were the principal causes of the decrease. WearGuard-Crest results were also negatively affected as a result of a customer mix shift to lower margin products and the effects of starting up a new national account program. We expect the difficult conditions encountered in this segment to continue into fiscal 2005.
Corporate
Corporate expenses, those administrative expenses not allocated to the business segments, were $41.0 million in fiscal 2004 compared to $30.1 million in fiscal 2003. The increase was due principally to the $10.0 million pre-tax charge in 2004 related to the resignation of the Company’s former Chief Executive Officer announced in September 2004.
Results of Discontinued Operations
As discussed above, on May 9, 2003, the Company closed the sale of its Educational Resources business to Knowledge Universe Corporation for $250 million in cash. The proceeds were used to repay outstanding borrowings and the sale resulted in a net gain of $23.6 million. The fiscal 2003 results of this business are reflected in the accompanying consolidated financial statements as discontinued operations in accordance with generally accepted accounting principles. Sales, operating income and income from discontinued operations for fiscal 2003 (excluding the net gain) through the transaction closing date are as follows:
Fiscal 2003 | |||
| (in millions) | |||
Sales | $ | 264.3 | |
Income before income taxes | 20.2 | ||
Income from discontinued operations | 12.2 | ||
39
Financial Condition and Liquidity
Reference to the consolidated statements of cash flows will facilitate understanding of the discussion that follows.
Fiscal 2005
Cash provided by operating activities in fiscal 2005 was $612 million compared to $518 million in fiscal 2004. The principal components (in millions) of the net increase were:
• Increase in net income and noncash charges | $ | 11 | |
• Increase in accounts receivable sale proceeds, due principally to increasing the size of the sale facility | 33 | ||
| • Reduced working capital requirements | 50 | ||
| $ | 94 | ||
Although net income increased, net noncash charges (depreciation and deferred income taxes) decreased approximately $14.7 million for fiscal 2005 compared to the prior year period, due to the lower deferred tax provision. A recent change in the tax depreciation rules is expected to reduce the annual tax depreciation deduction resulting in the lower deferred tax provision. The accounts receivable sale facility (see Note 9) was increased by $25.0 million in December 2004.
The lower working capital requirement was due principally to higher current liabilities in 2005, both accounts payable and accrued expenses, reflecting normal payment timing differences including payment of client commissions and income taxes.
Total debt decreased approximately $28 million from the prior year level.
During fiscal 2005, the Company repurchased 6.5 million shares of Class B common stock at an aggregate cost of approximately $173.0 million. On November 15, 2005, the Board of Directors approved an addition of $200 million to the Stock Repurchase Program, resulting in current remaining availability of approximately $252 million.
During the second quarter of fiscal 2005, the Company increased its ownership in its Irish food service affiliate from 45% to 90%, for approximately $61 million in cash. Also, during fiscal 2005, the Company acquired several regional uniform rental companies for a total of approximately $56 million in cash.
During fiscal 2005, the Company paid cash dividends totaling $40.3 million ($0.055/share in each of the four quarters of fiscal 2005). At its November 15, 2005 meeting, the Board of Directors declared a dividend in the amount of $0.07 per share, payable on December 14, 2005 to holders of record of the Company’s Class A and Class B common stock at the close of business on November 25, 2005.
During the third quarter of fiscal 2005, ARAMARK Services, Inc. issued $250 million of 5.00% guaranteed notes due June 1, 2012. Proceeds from the offering were used primarily to repay maturing obligations. At October 28, 2005, there was approximately $700 million of unused committed credit availability under our U.S. Credit Facility. Additionally, the Company has a shelf registration statement on file with the SEC for the issuance of up to $150 million of debt securities. The Company currently expects to fund acquisitions, capital expenditures, dividends and additional share repurchases and other liquidity needs from cash provided from operating
40
activities, normal disposals of property and equipment, and borrowings available under our credit facilities or registered or private note issuances. As of September 30, 2005, there was approximately $434 million outstanding in foreign currency borrowings.
Effective July 2005, Central Restaurantes, a subsidiary of the Company, established a non-revolving credit facility in Chile which consolidated existing debt and provided additional financing. The credit facility expires in July 2010 and requires periodic repayment of amounts borrowed. Interest on borrowings is based on the TAB 180 day bank rate plus a spread of 0.85% (as of September 30, 2005-1.51%). The credit facility contains restrictive covenants which provide, among other things, limitations on liens and disposition of material assets. The terms of the credit facility also require Central Restaurantes maintain certain specified ratios of total liabilities to equity, total borrowings to EBITDA and operating income to interest expense, as defined. At September 30, 2005, the Company was in compliance with all of these covenants.
Subsequent to September 30, 2005, ARAMARK amended its existing $900 million revolving credit facility. The amendment extended the maturity from March 2009 to November 2010. In addition, the amendment reduced the spread the Company pays over either the Prime Rate or LIBOR on US borrowings and the spread over the Canadian Prime Rate or Canadian Bankers Acceptance Rate on Canadian borrowings. All other terms and conditions in the existing facility remained unchanged.
The following table summarizes the Company’s future obligations for debt repayments, capital leases, future minimum rental and similar commitments under noncancelable operating leases as well as contingent obligations related to outstanding letters of credit and guarantees as of September 30, 2005.
| Payments Due by Period | |||||||||||||||
Contractual Obligations as of September 30, 2005 | Total | Less than 1 year | 1-3 years | 3-5 years | More than 5 years | ||||||||||
Long-term borrowings | $ | 1,792,686 | $ | 33,948 | $ | 827,245 | $ | 676,522 | $ | 254,971 | |||||
Capital lease obligations | 48,199 | 12,415 | 17,395 | 11,197 | 7,192 | ||||||||||
Operating leases | 576,170 | 157,103 | 133,115 | 98,657 | 187,295 | ||||||||||
Purchase obligations(1) | 189,440 | 113,043 | 43,977 | 12,988 | 19,432 | ||||||||||
Other long-term liabilities reflected on the balance sheet(2) | 103,216 | 9,000 | — | — | 94,216 | ||||||||||
| $ | 2,709,711 | $ | 325,509 | $ | 1,021,732 | $ | 799,364 | $ | 563,106 | ||||||
| Total Amounts Committed | Amount of Commitment Expiration Per Period | ||||||||||||||
Other Commercial Commitments as of September 30, 2005 | Less than 1 year | 1-3 years | 3-5 years | Over 5 years | |||||||||||
Letters of credit | $ | 134,797 | $ | 134,797 | $ | — | $ | — | $ | — | |||||
Guarantees | — | — | — | — | — | ||||||||||
| $ | 134,797 | $ | 134,797 | $ | — | $ | — | $ | — | ||||||
| (1) | Represents capital commitments in connection with several long-term concession contracts, client contract commitments and commitments to increase our ownership in our Chilean and Irish subsidiaries. |
| (2) | Includes certain unfunded employee retirement obligations. |
The Company has an agreement (the Receivables Facility) with several financial institutions whereby it sells on a continuous basis an undivided interest in all eligible trade accounts receivable, as defined in the Receivables Facility. Pursuant to the Receivables Facility, the Company formed ARAMARK Receivables, LLC, a wholly-owned, consolidated, bankruptcy-remote
41
subsidiary. ARAMARK Receivables, LLC was formed for the sole purpose of buying and selling receivables generated by certain subsidiaries of the Company. Under the Receivables Facility, certain subsidiaries of the Company transfer without recourse all of their accounts receivable to ARAMARK Receivables, LLC. ARAMARK Receivables, LLC, in turn, has sold and, subject to certain conditions, may from time to time sell an undivided interest in these receivables up to $225 million. The Company amended the Receivables Facility during the first quarter of fiscal 2005 and increased the maximum sale amount from $200 million to $225 million. The Company has retained collection and administrative responsibility for the participating interest sold, and has retained an undivided interest in the transferred receivables of approximately $286.4 million and $291.9 million at October 1, 2004 and September 30, 2005, respectively, which is subject to a security interest. This two-step transaction is accounted for as a sale of receivables following the provisions of SFAS No. 140, “Accounting for Transfers and Servicing of Financial Assets and Extinguishments of Liabilities—a Replacement of FASB Statement No. 125.” At October 1, 2004 and September 30, 2005, respectively, $157.3 million and $189.8 million of accounts receivable were sold and removed from the consolidated balance sheet.
The Company’s business activities do not include the use of unconsolidated special purpose entities, and there are no significant business transactions that have not been reflected in the accompanying financial statements. ARAMARK may be exposed to liability resulting from the non-performance of certain indemnification obligations by an entity currently in bankruptcy from which ARAMARK acquired a business in fiscal 2000. The amount of such exposure cannot be quantified at the present time due to uncertainty with respect to the number and amount of claims, if any, originating from or relating to the pre-acquisition period. ARAMARK has $25 million of insurance coverage for such exposure with a $5.0 million retained loss limit. The Company is self-insured for a limited portion of the risk retained under its general liability and workers’ compensation arrangements. When required, self-insurance reserves are recorded based on actuarial analyses.
On January 18 and 19, 2005, a New Jersey jury found various ARAMARK entities liable for approximately $30 million in compensatory damages and $75 million in punitive damages in connection with an automobile accident caused by an intoxicated driver who attended a professional football game at which certain affiliates of the Company provided food and beverage service. The Company and its affiliates appealed the judgment to the Appellate Division of Superior Court of New Jersey on April 13, 2005. This process is likely to take considerable time. The Company believes that it has adequate insurance and other resources to address this matter. Based on the information currently available, and acknowledging the uncertainty of litigation, the September 30, 2005 consolidated balance sheet reflects the amount awarded and the related expected recovery should such liability be confirmed. Such amounts are included in “Other Noncurrent Liabilities” and “Other Assets,” respectively.
New/Proposed Accounting Pronouncements
In November 2004, the Financial Accounting Standards Board (FASB) issued Statement of Financial Accounting Standards (SFAS) No. 151, “Inventory Costs—An Amendment of ARB No. 43, Chapter 4.” The provisions of SFAS No. 151 will be effective for inventory costs incurred during fiscal years beginning after June 15, 2005, and are not expected to have a material effect on the Company’s financial statements.
In December 2004, the FASB issued a revision of SFAS No. 123, “Accounting for Stock-Based Compensation,” which also supersedes APB Opinion No. 25, “Accounting for Stock Issued to its Employees,” and its related implementation guidance. This Statement requires a public entity to measure the cost of employee services received in exchange for an award of equity instruments based on the grant-date fair value of the award, and recognize the cost over the period during
42
which an employee is required to provide service in exchange for the award—the requisite service period. This Statement is effective for annual reporting periods beginning after June 15, 2005, and applies to all awards granted after the required effective date and to awards modified, repurchased, or cancelled after that date. The Company is currently evaluating the provisions of this Statement. Adoption of the Statement in the first quarter of fiscal 2006 using the modified prospective transition method will result in a reduction of reported earnings, which management believes, based on the analysis to date, will be similar to that reflected in the pro forma information included in the “Earnings Per Share” disclosure herein.
On March 30, 2005, the FASB issued FASB Interpretation No. 47, “Accounting for Conditional Asset Retirement Obligations,” which clarifies the term “conditional asset retirement obligation” as used in FASB Statement No. 143. The Interpretation is effective for ARAMARK no later than the end of fiscal 2006. The Company is currently evaluating the Interpretation, but has not yet determined what effect adoption will have on the consolidated financial statements.
SPECIAL NOTE ABOUT FORWARD-LOOKING STATEMENTS
This report includes “forward-looking statements” within the meaning of the Private Securities Litigation Reform Act of 1995 that reflect our current views as to future events and financial performance with respect to our operations. These statements can be identified by the fact that they do not relate strictly to historical or current facts. They use words such as “aim,” “anticipate,” “are confident,” “estimate,” “expect,” “will be,” “will continue,” “will likely result,” “project,” “intend,” “plan,” “believe” and other words and terms of similar meaning in conjunction with a discussion of future operating or financial performance.
These statements are subject to risks and uncertainties that could cause actual results to differ materially from those expressed or implied in the forward-looking statements. Factors that might cause such a difference include: unfavorable economic conditions; ramifications of any future terrorist attacks or increased security alert levels; increased operating costs, including labor-related and energy costs; shortages of qualified personnel or increases in labor costs; costs and possible effects of further unionization of our workforce; currency risks and other risks associated with international markets; risks associated with acquisitions, including acquisition integration issues and costs; our ability to integrate and derive the expected benefits from our recent acquisitions; competition; decline in attendance at client facilities; unpredictability of sales and expenses due to contract terms and terminations; the impact of natural disasters on our sales and operating results; the risk that clients may become insolvent; the contract intensive nature of our business, which may lead to client disputes; high leverage; claims relating to the provision of food services; costs of compliance with governmental regulations and government investigations; liability associated with noncompliance with governmental regulations, including regulations pertaining to food services, the environment, the Federal school lunch program, Federal and state employment and wage and hour laws and import and export controls and customs laws; dram shop compliance and litigation; contract compliance and administration issues, inability to retain current clients and renew existing client contracts; determination by customers to reduce their outsourcing and use of preferred vendors; seasonality; and other risks that are set forth in the “Risk Factors” section, the “Legal Proceedings” section, the “Management’s Discussion and Analysis of Results of Operations and Financial Condition” section and other sections of our Annual Report on Form 10-K and Quarterly Reports on Form 10-Q.
Forward-looking statements speak only as of the date made. We undertake no obligation to update any forward-looking statements to reflect the events or circumstances arising after the date as of which they are made. As a result of these risks and uncertainties, readers are cautioned
43
not to place undue reliance on the forward-looking statements included in this report or that may be made in other filings with the Securities and Exchange Commission or elsewhere from time to time by, or on behalf of, us.
Item 7A.Quantitative and Qualitative Disclosure About Market Risk
We are exposed to the impact of interest rate changes and manage this exposure through the use of variable-rate and fixed-rate debt and by utilizing interest rate swaps. We do not enter into contracts for trading purposes and do not use leveraged instruments. The information below summarizes our market risks associated with debt obligations and other significant financial instruments as of September 30, 2005 and October 1, 2004 (See Note 5 to the consolidated financial statements). Fair values were computed using market quotes, if available, or based on discounted cash flows using market interest rates as of the end of the respective periods. For debt obligations, the table presents principal cash flows and related interest rates by contractual fiscal year of maturity. Variable interest rates disclosed represent the weighted-average rates of the portfolio at September 30, 2005 and October 1, 2004. For interest rate swaps, the table presents the notional amounts and related weighted-average interest rates by fiscal year of maturity. The variable rates presented are the average forward rates for the term of each contract.
| Expected Fiscal Year of Maturity | ||||||||||||||||||||||||||||||||
As of September 30, 2005 | 2006 | 2007 | 2008 | 2009 | 2010 | Thereafter | Total | Fair Value | ||||||||||||||||||||||||
| (US$ equivalent in millions) | ||||||||||||||||||||||||||||||||
Debt: | ||||||||||||||||||||||||||||||||
Fixed rate | $ | 312 | (a) | $ | 534 | (a) | $ | 299 | (a) | $ | 13 | $ | 10 | $ | 262 | (b) | $ | 1,430 | $ | 1,456 | ||||||||||||
Average interest rate | 6.9 | % | 6.4 | % | 6.3 | % | 6.3 | % | 6.2 | % | 5.1 | % | 6.2 | % | ||||||||||||||||||
Variable rate | $ | 58 | $ | 6 | $ | 6 | $ | 333 | $ | 8 | — | $ | 411 | $ | 411 | |||||||||||||||||
Average interest rate | 5.2 | % | 7.9 | % | 8.0 | % | 4.4 | % | 8.0 | % | 4.7 | % | ||||||||||||||||||||
Interest Rate Swaps: | ||||||||||||||||||||||||||||||||
Receive variable/pay fixed | $ | 164 | $ | 300 | $ | 0.7 | ||||||||||||||||||||||||||
Average pay rate | 5.6 | % | 4.4 | % | ||||||||||||||||||||||||||||
Average receive rate | 4.8 | % | 4.9 | % | ||||||||||||||||||||||||||||
Receive fixed/pay variable | $ | 300 | $ | (8.5 | ) | |||||||||||||||||||||||||||
Average pay rate | 7.1 | % | ||||||||||||||||||||||||||||||
Average receive rate | 6.4 | % | ||||||||||||||||||||||||||||||
As of September 30, 2005, the Company had foreign currency forward exchange contracts outstanding, with notional amounts of 16.9 million Euros, 6.0 million GBP, 28.0 million Canadian dollars and 2.0 million Mexican pesos, to mitigate the risk of changes in foreign currency exchange rates on short-term intercompany loans to certain international subsidiaries. As of September 30, 2005, the fair-value of these foreign exchange contracts was $(0.2) million.
44
| Expected Fiscal Year of Maturity | ||||||||||||||||||||||||||||||||
As of October 1, 2004 | 2005 | 2006 | 2007 | 2008 | 2009 | Thereafter | Total | Fair Value | ||||||||||||||||||||||||
| (US$ equivalent in millions) | ||||||||||||||||||||||||||||||||
Debt: | ||||||||||||||||||||||||||||||||
Fixed rate | $ | 129 | $ | 306 | (a) | $ | 529 | (a) | $ | 302 | (a) | $ | 15 | $ | 25 | $ | 1,306 | $ | 1,391 | |||||||||||||
Average interest rate | 7.9 | % | 7.0 | % | 6.4 | % | 6.4 | % | 6.1 | % | 6.0 | % | 6.6 | % | ||||||||||||||||||
Variable rate | $ | 138 | $ | 4 | $ | 2 | $ | 1 | $ | 418 | — | $ | 563 | $ | 563 | |||||||||||||||||
Average interest rate | 2.9 | % | 4.0 | % | 4.0 | % | 3.8 | % | 4.1 | % | 3.8 | % | ||||||||||||||||||||
Interest Rate Swaps: | ||||||||||||||||||||||||||||||||
Receive variable/pay fixed | $ | 100 | $ | 267 | $ | 120 | $ | (7 | ) | |||||||||||||||||||||||
Average pay rate | 3.0 | % | 4.0 | % | 4.7 | % | ||||||||||||||||||||||||||
Average receive rate | 2.0 | % | 3.9 | % | 3.2 | % | ||||||||||||||||||||||||||
Receive fixed/pay variable | $ | 300 | $ | (1 | ) | |||||||||||||||||||||||||||
Average pay rate | 5.0 | % | ||||||||||||||||||||||||||||||
Average receive rate | 6.4 | % | ||||||||||||||||||||||||||||||
As of October 1, 2004, the Company had foreign currency forward exchange contracts outstanding, with notional amounts of 61.6 million Euros and 30 million Canadian dollars, to mitigate the risk of changes in foreign currency exchange rates on short-term intercompany loans to certain international subsidiaries. As of October 1, 2004, the fair-value of these foreign exchange contracts was $(1.1) million, which is included in “Accrued expenses and other liabilities.”
| (a) | Each balance includes $300 million of senior notes callable by us at any time. |
| (b) | Balance includes $250 million of senior notes callable by us at any time. |
Item 8.Financial Statements and Supplementary Data
See Index to Financial Statements and Schedule at page S-1.
Item 9.Changes and Disagreements with Accountants on Accounting and Financial Disclosure
Not applicable.
Item 9A.Controls and Procedures
(a) Evaluation of Disclosure Controls and Procedures
The Company’s management, with the participation of the Company’s Chief Executive Officer and Chief Financial Officer, evaluated the effectiveness of the Company’s disclosure controls and procedures as of the end of the period covered by this report. Based on that evaluation, the Chief Executive Officer and Chief Financial Officer concluded that the Company’s disclosure controls and procedures, as of the end of the period covered by this report, are functioning effectively to provide reasonable assurance that the information required to be disclosed by the Company in reports filed under the Securities Exchange Act of 1934 is recorded, processed, summarized and reported within the time periods specified in the SEC’s rules and forms. A controls system, no matter how well designed and operated, cannot provide absolute assurance that the objectives of the controls system are met, and no evaluation of controls can provide absolute assurance that all control issues and instances of fraud, if any, within a company have been detected.
45
(b) Internal Control over Financial Reporting
Refer to “Management’s Report on Internal Control Over Financial Reporting” and “Report of Independent Registered Public Accounting Firm” on pages S-2 and S-3 herein.
(c) Change in Internal Control over Financial Reporting
No change in the Company’s internal control over financial reporting occurred during the Company’s fourth fiscal quarter that has materially affected, or is reasonably likely to materially affect, the Company’s internal control over financial reporting.
46
PART III
Items 10, 11, 12, 13 and 14 of Part III are incorporated by reference to the information set forth under the caption, “Executive Officers of the Company” in Part I of this Annual Report on Form 10-K and to the information set forth in the Company’s Proxy Statement for its 2006 annual meeting of stockholders, to be filed with the Commission pursuant to Regulation 14A (except for the committee report on executive compensation and the audit committee report in the Company’s Proxy Statement).
PART IV
Item 15.Exhibits and Financial Statement Schedules
(a)Financial Statements
See Index to Financial Statements and Schedule at page S-1.
(b)Exhibits Required by Item 601 of Regulation S-K
See the Exhibit Index which is incorporated herein by reference.
(c)Financial Statement Schedules
See Index to Financial Statements and Schedule at page S-1.
47
SIGNATURES
Pursuant to the requirements of Section 13 or 15(d) of the Securities Exchange Act of 1934, as amended, the registrant has duly caused this annual report to be signed on its behalf by the undersigned, thereunto duly authorized, in the City of Philadelphia, Commonwealth of Pennsylvania, on December 8, 2005.
ARAMARK CORPORATION | ||
| By: | /S/ JOSEPH NEUBAUER | |
Name: Title: | Joseph Neubauer Chairman and Chief Executive Officer | |
POWER OF ATTORNEY
KNOW ALL PERSONS BY THESE PRESENTS, that each person whose name appears below hereby appoints Joseph Neubauer, L. Frederick Sutherland, Bart J. Colli and Harold B. Dichter, and each of them, as his or her true and lawful agent, with full power of substitution and resubstitution, for him or her and in his or her name, place and stead, in any and all capacities, to execute any and all amendments to the within annual report, and to file the same, together with all exhibits thereto, with the Securities and Exchange Commission, granting unto each said attorney-in-fact and agent, full power and authority to do and perform each and every act and thing requisite and necessary to be done in and about the premises, as fully to all intents and purposes as he or she might or could do in person, hereby ratifying and confirming all that each said attorney-in-fact and agent may lawfully do or cause to be done by virtue hereof.
Pursuant to the requirements of the Securities Exchange Act of 1934, as amended, this annual report has been signed below by the following persons in the capacities and on the dates indicated.
Name | Title | Date | ||
/s/ JOSEPH NEUBAUER Joseph Neubauer | Chairman and Chief Executive Officer and Director (Principal Executive Officer) | December 8, 2005 | ||
/s/ L. FREDERICK SUTHERLAND L. Frederick Sutherland | Executive Vice President and Chief Financial Officer (Principal Financial Officer) | December 8, 2005 | ||
/s/ JOHN M. LAFFERTY John M. Lafferty | Senior Vice President, Controller and Chief Accounting Officer (Principal Accounting Officer) | December 8, 2005 | ||
/s/ LAWRENCE T. BABBIO, JR. Lawrence T. Babbio, Jr. | Director | December 8, 2005 | ||
/s/ PATRICIA C. BARRON Patricia C. Barron | Director | December 8, 2005 | ||
/s/ ROBERT J. CALLANDER Robert J. Callander | Director | December 8, 2005 | ||
48
Name | Title | Date | ||
/s/ LEONARD S. COLEMAN, JR. Leonard S. Coleman, Jr. | Director | December 8, 2005 | ||
/s/ RONALD R. DAVENPORT Ronald R. Davenport | Director | December 8, 2005 | ||
/s/ THOMAS H. KEAN Thomas H. Kean | Director | December 8, 2005 | ||
/s/ JAMES E. KSANSNAK James E. Ksansnak | Director | December 8, 2005 | ||
/s/ JAMES E. PRESTON James E. Preston | Director | December 8, 2005 | ||
/s/ RONALD L. SARGENT Ronald L. Sargent | Director | December 8, 2005 | ||
/s/ KARL M.VONDER HEYDEN Karl M. von der Heyden | Director | December 8, 2005 | ||
49
ARAMARK CORPORATION AND SUBSIDIARIES
INDEX TO FINANCIAL STATEMENTS AND SCHEDULE
Management’s Report on Internal Control Over Financial Reporting | S-2 | |
| S-3 | ||
Consolidated Balance Sheets as of October 1, 2004 and September 30, 2005 | S-5 | |
| S-6 | ||
| S-7 | ||
| S-8 | ||
| S-9 | ||
| S-41 |
All other schedules are omitted because they are not applicable, not required, or the information required to be set forth therein is included in the consolidated financial statements or in the notes thereto.
S-1
Management’s Report on Internal Control Over Financial Reporting
Management is responsible for establishing and maintaining adequate internal control over financial reporting of the Company. Internal control over financial reporting is a process designed to provide reasonable assurance regarding the reliability of financial reporting and the preparation of financial statements for external purposes in accordance with accounting principles generally accepted in the United States of America.
The Company’s internal control over financial reporting includes those policies and procedures that (i) pertain to the maintenance of records that, in reasonable detail, accurately and fairly reflect the transactions and dispositions of assets of the Company; (ii) provide reasonable assurance that transactions are recorded as necessary to permit preparation of financial statements in accordance with accounting principles generally accepted in the United States of America, and that receipts and expenditures of the Company are being made only in accordance with authorizations of management and directors of the Company; and (iii) provide reasonable assurance regarding prevention or timely detection of unauthorized acquisition, use, or disposition of the Company’s assets that could have a material effect on the financial statements.
Because of its inherent limitations, internal control over financial reporting may not prevent or detect misstatements. Also, projections of any evaluation of effectiveness to future periods are subject to the risk that controls may become inadequate because of changes in conditions, or that the degree of compliance with the policies or procedures may deteriorate.
Management conducted an evaluation of the effectiveness of internal control over financial reporting based on the framework in Internal Control – Integrated Framework issued by the Committee of Sponsoring Organizations of the Treadway Commission. Based on this evaluation, management concluded that the Company’s internal control over financial reporting was effective as of September 30, 2005. Management’s assessment of the effectiveness of the Company’s internal control over financial reporting as of September 30, 2005 has been audited by KPMG LLP, an independent registered public accounting firm, as stated in their report which is included herein.
/s/ Joseph Neubauer
Joseph Neubauer
Chairman and Chief Executive Officer
/s/ L. Frederick Sutherland
L. Frederick Sutherland
Executive Vice President and Chief Financial Officer
S-2
Report of Independent Registered Public Accounting Firm
The Board of Directors and Shareholders
ARAMARK Corporation:
We have audited management’s assessment, included in the accompanying Management’s Report on Internal Control over Financial Reporting on S-2, that ARAMARK Corporation and subsidiaries (the “Company”) maintained effective internal control over financial reporting as of September 30, 2005, based on criteria established in Internal Control—Integrated Framework issued by the Committee of Sponsoring Organizations of the Treadway Commission (COSO).The Company’s management is responsible for maintaining effective internal control over financial reporting and for its assessment of the effectiveness of internal control over financial reporting. Our responsibility is to express an opinion on management’s assessment and an opinion on the effectiveness of the Company’s internal control over financial reporting based on our audit.
We conducted our audit in accordance with the standards of the Public Company Accounting Oversight Board (United States). Those standards require that we plan and perform the audit to obtain reasonable assurance about whether effective internal control over financial reporting was maintained in all material respects. Our audit included obtaining an understanding of internal control over financial reporting, evaluating management’s assessment, testing and evaluating the design and operating effectiveness of internal control, and performing such other procedures as we considered necessary in the circumstances. We believe that our audit provides a reasonable basis for our opinion.
A company’s internal control over financial reporting is a process designed to provide reasonable assurance regarding the reliability of financial reporting and the preparation of financial statements for external purposes in accordance with generally accepted accounting principles. A company’s internal control over financial reporting includes those policies and procedures that (1) pertain to the maintenance of records that, in reasonable detail, accurately and fairly reflect the transactions and dispositions of the assets of the company; (2) provide reasonable assurance that transactions are recorded as necessary to permit preparation of financial statements in accordance with generally accepted accounting principles, and that receipts and expenditures of the company are being made only in accordance with authorizations of management and directors of the company; and (3) provide reasonable assurance regarding prevention or timely detection of unauthorized acquisition, use, or disposition of the company’s assets that could have a material effect on the financial statements.
Because of its inherent limitations, internal control over financial reporting may not prevent or detect misstatements. Also, projections of any evaluation of effectiveness to future periods are subject to the risk that controls may become inadequate because of changes in conditions, or that the degree of compliance with the policies or procedures may deteriorate.
In our opinion, management’s assessment that the Company maintained effective internal control over financial reporting as of September 30, 2005, is fairly stated, in all material respects, based on criteria established in Internal Control—Integrated Framework issued by the Committee of Sponsoring Organizations of the Treadway Commission (COSO).Also, in our opinion, the Company maintained, in all material respects, effective internal control over financial reporting as of September 30, 2005, based on criteria established inInternal Control—Integrated Framework issued by the Committee of Sponsoring Organizations of the Treadway Commission (COSO).
We also have audited, in accordance with the standards of the Public Company Accounting Oversight Board (United States), the consolidated balance sheets of ARAMARK Corporation and subsidiaries as of October 1, 2004 and September 30, 2005, and the related consolidated statements of income, cash flows, and shareholders’ equity for each of the years in the three-year period ended September 30, 2005, and our report dated December 5, 2005 expressed an unqualified opinion on those consolidated financial statements.

Philadelphia, Pennsylvania
December 5, 2005
S-3
Report of Independent Registered Public Accounting Firm
The Board of Directors and Shareholders
ARAMARK Corporation:
We have audited the accompanying consolidated balance sheets of ARAMARK Corporation and subsidiaries as of October 1, 2004 and September 30, 2005, and the related consolidated statements of income, cash flows and shareholders’ equity for each of the years in the three-year period ended September 30, 2005. In connection with our audits of the consolidated financial statements, we also have audited the financial statement schedule as listed in the accompanying index. These consolidated financial statements and financial statement schedule are the responsibility of the Company’s management. Our responsibility is to express an opinion on these consolidated financial statements and financial statement schedule based on our audits.
We conducted our audits in accordance with the standards of the Public Company Accounting Oversight Board (United States). Those standards require that we plan and perform the audit to obtain reasonable assurance about whether the financial statements are free of material misstatement. An audit includes examining, on a test basis, evidence supporting the amounts and disclosures in the financial statements. An audit also includes assessing the accounting principles used and significant estimates made by management, as well as evaluating the overall financial statement presentation. We believe that our audits provide a reasonable basis for our opinion.
In our opinion, the consolidated financial statements referred to above present fairly, in all material respects, the financial position of ARAMARK Corporation and subsidiaries as of October 1, 2004 and September 30, 2005, and the results of their operations and their cash flows for each of the years in the three-year period ended September 30, 2005, in conformity with U.S. generally accepted accounting principles. Also in our opinion, the related financial statement schedule, when considered in relation to the basic consolidated financial statements taken as a whole, presents fairly, in all material respects, the information set forth therein.
We also have audited, in accordance with the standards of the Public Company Accounting Oversight Board (United States), the effectiveness of ARAMARK Corporation and subsidiaries’ internal control over financial reporting as of September 30, 2005, based on criteria established inInternal Control—Integrated Framework issued by the Committee of Sponsoring Organizations of the Treadway Commission (COSO), and our report dated December 5, 2005 expressed an unqualified opinion on management’s assessment of, and the effective operation of, internal control over financial reporting.
Philadelphia, Pennsylvania
December 5, 2005
S-4
ARAMARK CORPORATION AND SUBSIDIARIES
CONSOLIDATED BALANCE SHEETS
OCTOBER 1, 2004 AND SEPTEMBER 30, 2005
(dollars in thousands, except share amounts)
| Fiscal | ||||||||
| 2004 | 2005 | |||||||
| ASSETS | ||||||||
Current Assets: | ||||||||
Cash and cash equivalents | $ | 45,319 | $ | 56,066 | ||||
Receivables (less allowances: 2004—$32,845; 2005—$42,645) | 759,822 | 808,531 | ||||||
Inventories | 471,839 | 485,834 | ||||||
Prepayments and other current assets | 63,035 | 92,796 | ||||||
Total current assets | 1,340,015 | 1,443,227 | ||||||
Property and Equipment, at cost: | ||||||||
Land, buildings and improvements | 706,953 | 727,817 | ||||||
Service equipment and fixtures | 1,849,189 | 1,948,882 | ||||||
| 2,556,142 | 2,676,699 | |||||||
Less-Accumulated depreciation | (1,341,760 | ) | (1,465,245 | ) | ||||
| 1,214,382 | 1,211,454 | |||||||
Goodwill | 1,589,144 | 1,682,749 | ||||||
Other Intangible Assets | 271,343 | 274,584 | ||||||
Other Assets | 406,689 | 545,086 | ||||||
| $ | 4,821,573 | $ | 5,157,100 | |||||
| LIABILITIES AND SHAREHOLDERS’ EQUITY | ||||||||
Current Liabilities: | ||||||||
Current maturities of long-term borrowings | $ | 25,523 | $ | 46,363 | ||||
Accounts payable | 566,474 | 585,014 | ||||||
Accrued payroll and related expenses | 296,414 | 320,494 | ||||||
Other accrued expenses and current liabilities | 566,519 | 566,809 | ||||||
Total current liabilities | 1,454,930 | 1,518,680 | ||||||
Long-term borrowings | 1,868,723 | 1,840,885 | ||||||
Less-current portion | (25,523 | ) | (46,363 | ) | ||||
Total long-term borrowings | 1,843,200 | 1,794,522 | ||||||
Deferred Income Taxes and Other Noncurrent Liabilities | 373,788 | 518,434 | ||||||
Shareholders’ Equity: | ||||||||
Class A common stock (par value $.01; authorized: 600,000,000 shares; issued: 2004—89,328,415 shares; 2005—80,306,913 shares; outstanding: 2004—71,110,640 shares; 2005—61,577,474 shares) | 893 | 803 | ||||||
Class B common stock (par value $.01; authorized: 1,000,000,000 shares; issued: 2004—133,006,862 shares; 2005—147,462,062 shares; outstanding: 2004—111,414,371 shares; 2005—119,278,523 shares) | 1,330 | 1,475 | ||||||
Capital surplus | 1,007,687 | 1,108,251 | ||||||
Earnings retained for use in the business | 1,080,020 | 1,328,174 | ||||||
Accumulated other comprehensive income (loss) | (4,144 | ) | 11,307 | |||||
Treasury stock (shares held in treasury: 2004—39,810,266 shares; 2005—46,912,978 shares) | (936,131 | ) | (1,124,546 | ) | ||||
Total | 1,149,655 | 1,325,464 | ||||||
| $ | 4,821,573 | $ | 5,157,100 | |||||
The accompanying notes are an integral part of these consolidated financial statements.
S-5
ARAMARK CORPORATION AND SUBSIDIARIES
CONSOLIDATED STATEMENTS OF INCOME
FOR THE FISCAL YEARS ENDED OCTOBER 3, 2003, OCTOBER 1, 2004 AND SEPTEMBER 30, 2005
(dollars in thousands, except per share amounts)
| Fiscal | |||||||||
| 2003 | 2004 | 2005 | |||||||
Sales | $ | 9,447,815 | $ | 10,192,240 | $ | 10,963,360 | |||
Costs and Expenses: | |||||||||
Cost of services provided | 8,506,465 | 9,223,788 | 9,925,799 | ||||||
Depreciation and amortization | 262,944 | 297,993 | 320,118 | ||||||
Selling and general corporate expense | 115,684 | 132,881 | 137,271 | ||||||
Other expense (Note 13) | 10,700 | — | — | ||||||
| 8,895,793 | 9,654,662 | 10,383,188 | |||||||
Operating income | 552,022 | 537,578 | 580,172 | ||||||
Interest and Other Financing Costs, net | 142,469 | 122,362 | 126,999 | ||||||
Income from continuing operations before income taxes | 409,553 | 415,216 | 453,173 | ||||||
Provision for Income Taxes | 144,185 | 152,112 | 164,698 | ||||||
Income from Continuing Operations | 265,368 | 263,104 | 288,475 | ||||||
Income from Discontinued Operations, net (Note 2) | 35,724 | — | — | ||||||
Net Income | $ | 301,092 | $ | 263,104 | $ | 288,475 | |||
Earnings Per Share-Basic: | |||||||||
Income from continuing operations | $ | 1.39 | $ | 1.39 | $ | 1.55 | |||
Net income | $ | 1.58 | $ | 1.39 | $ | 1.55 | |||
Earnings Per Share-Diluted: | |||||||||
Income from continuing operations | $ | 1.34 | $ | 1.36 | $ | 1.53 | |||
Net income | $ | 1.52 | $ | 1.36 | $ | 1.53 | |||
The accompanying notes are an integral part of these consolidated financial statements.
S-6
ARAMARK CORPORATION AND SUBSIDIARIES
CONSOLIDATED STATEMENTS OF CASH FLOWS
FOR THE FISCAL YEARS ENDED OCTOBER 3, 2003, OCTOBER 1, 2004 AND SEPTEMBER 30, 2005
(dollars in thousands)
| Fiscal | ||||||||||||
| 2003 | 2004 | 2005 | ||||||||||
Cash flows from operating activities from continuing operations: | ||||||||||||
Income from continuing operations | $ | 265,368 | $ | 263,104 | $ | 288,475 | ||||||
Adjustments to reconcile income from continuing operations to net cash provided by operating activities: | ||||||||||||
Depreciation and amortization | 262,944 | 297,993 | 320,118 | |||||||||
Income taxes deferred | 29,675 | 32,749 | (4,073 | ) | ||||||||
Other expense | 10,700 | — | — | |||||||||
Changes in noncash working capital: | ||||||||||||
Receivables | (53,802 | ) | (41,881 | ) | (61,179 | ) | ||||||
Inventories | 6,675 | (30,739 | ) | (6,501 | ) | |||||||
Prepayments | (14,397 | ) | 16,665 | 1,019 | ||||||||
Accounts payable | (2,108 | ) | (14,129 | ) | 16,341 | |||||||
Accrued expenses | 123,398 | 27,016 | 57,706 | |||||||||
Net proceeds from sale of receivables | — | — | 32,800 | |||||||||
Changes in other noncurrent liabilities | 8,354 | (3,820 | ) | (914 | ) | |||||||
Changes in other assets | (23,556 | ) | (23,747 | ) | (33,785 | ) | ||||||
Other operating activities | (6,990 | ) | (5,645 | ) | 1,773 | |||||||
Net cash provided by operating activities from continuing operations | 606,261 | 517,566 | 611,780 | |||||||||
Cash flows from investing activities from continuing operations: | ||||||||||||
Purchases of property and equipment and client contract investments | (298,606 | ) | (308,763 | ) | (315,560 | ) | ||||||
Disposals of property and equipment | 28,183 | 20,503 | 21,581 | |||||||||
Proceeds from sales and divestitures | 248,076 | 8,500 | 11,518 | |||||||||
Acquisition of certain businesses: | ||||||||||||
Working capital other than cash acquired | (273 | ) | (24,302 | ) | 4,558 | |||||||
Property and equipment | (41,645 | ) | (15,800 | ) | (4,854 | ) | ||||||
Additions to goodwill, other intangible assets and other assets, net | (216,151 | ) | (116,877 | ) | (120,008 | ) | ||||||
Other investing activities | 11,201 | (2,701 | ) | 36,870 | ||||||||
Net cash used in investing activities from continuing operations | (269,215 | ) | (439,440 | ) | (365,895 | ) | ||||||
Cash flows from financing activities from continuing operations: | ||||||||||||
Proceeds from additional long-term borrowings | 113,190 | 441,091 | 361,382 | |||||||||
Payment of long-term borrowings | (263,896 | ) | (343,349 | ) | (393,629 | ) | ||||||
Proceeds from issuance of common stock | 21,280 | 39,748 | 35,748 | |||||||||
Repurchase of common stock | (212,473 | ) | (184,062 | ) | (187,551 | ) | ||||||
Payment of dividends | — | (37,213 | ) | (40,321 | ) | |||||||
Other financing activities | 3,034 | 6,503 | (10,767 | ) | ||||||||
Net cash used in financing activities from continuing operations | (338,865 | ) | (77,282 | ) | (235,138 | ) | ||||||
Net cash provided by discontinued operations | 14,722 | — | — | |||||||||
Increase in cash and cash equivalents | 12,903 | 844 | 10,747 | |||||||||
Cash and cash equivalents, beginning of year | 31,572 | 44,475 | 45,319 | |||||||||
Cash and cash equivalents, end of year | $ | 44,475 | $ | 45,319 | $ | 56,066 | ||||||
The accompanying notes are an integral part of these consolidated financial statements.
S-7
ARAMARK CORPORATION AND SUBSIDIARIES
CONSOLIDATED STATEMENTS OF SHAREHOLDERS’ EQUITY
FOR THE FISCAL YEARS ENDED OCTOBER 3, 2003, OCTOBER 1, 2004 AND SEPTEMBER 30, 2005
(dollars in thousands)
| Class A Common Stock | Class B Common Stock | Capital Surplus | Retained Earnings | Treasury Stock | Accumulated Other Comprehensive Income (Loss) | Total | ||||||||||||||||||||
Balance, September 27, 2002 | $ | 1,387 | $ | 700 | $ | 821,242 | $ | 553,037 | $ | (499,510 | ) | $ | (18,671 | ) | $ | 858,185 | ||||||||||
Net income | 301,092 | 301,092 | ||||||||||||||||||||||||
Minimum pension liability adjustment (net of tax) | 5 | 5 | ||||||||||||||||||||||||
Foreign currency translation adjustments | 21,077 | 21,077 | ||||||||||||||||||||||||
Change in fair value of cash flow hedges (net of tax) | 1,529 | 1,529 | ||||||||||||||||||||||||
Total comprehensive income | 323,703 | |||||||||||||||||||||||||
Purchases of common stock for the treasury | (232,309 | ) | (232,309 | ) | ||||||||||||||||||||||
Conversion of Class A to Class B | (413 | ) | 413 | — | ||||||||||||||||||||||
Issuance of common stock | 70 | 3 | 89,320 | 89,393 | ||||||||||||||||||||||
Balance, October 3, 2003 | $ | 1,044 | $ | 1,116 | $ | 910,562 | $ | 854,129 | $ | (731,819 | ) | $ | 3,940 | $ | 1,038,972 | |||||||||||
Net income | 263,104 | 263,104 | ||||||||||||||||||||||||
Minimum pension liability adjustment (net of tax) | (7,537 | ) | (7,537 | ) | ||||||||||||||||||||||
Foreign currency translation adjustments (net of tax) | 2,828 | 2,828 | ||||||||||||||||||||||||
Change in fair value of cash flow hedges (net of tax) | (3,375 | ) | (3,375 | ) | ||||||||||||||||||||||
Total comprehensive income | 255,020 | |||||||||||||||||||||||||
Purchases of common stock for the treasury | (204,312 | ) | (204,312 | ) | ||||||||||||||||||||||
Payment of dividends | (37,213 | ) | (37,213 | ) | ||||||||||||||||||||||
Conversion of Class A to Class B | (209 | ) | 209 | — | ||||||||||||||||||||||
Issuance of common stock | 58 | 5 | 97,125 | 97,188 | ||||||||||||||||||||||
Balance, October 1, 2004 | $ | 893 | $ | 1,330 | $ | 1,007,687 | $ | 1,080,020 | $ | (936,131 | ) | $ | (4,144 | ) | $ | 1,149,655 | ||||||||||
Net income | 288,475 | 288,475 | ||||||||||||||||||||||||
Minimum pension liability adjustment (net of tax) | 5,707 | 5,707 | ||||||||||||||||||||||||
Foreign currency translation adjustments (net of tax) | 8,712 | 8,712 | ||||||||||||||||||||||||
Change in fair value of cash flow hedges (net of tax) | 1,032 | 1,032 | ||||||||||||||||||||||||
Total comprehensive income | 303,926 | |||||||||||||||||||||||||
Purchases of common stock for the treasury | (188,415 | ) | (188,415 | ) | ||||||||||||||||||||||
Payment of dividends | (40,321 | ) | (40,321 | ) | ||||||||||||||||||||||
Conversion of Class A to Class B | (137 | ) | 137 | — | ||||||||||||||||||||||
Issuance of common stock | 47 | 8 | 100,564 | 100,619 | ||||||||||||||||||||||
Balance, September 30, 2005 | $ | 803 | $ | 1,475 | $ | 1,108,251 | $ | 1,328,174 | $ | (1,124,546 | ) | $ | 11,307 | $ | 1,325,464 | |||||||||||
The accompanying notes are an integral part of these consolidated financial statements.
S-8
ARAMARK CORPORATION AND SUBSIDIARIES
NOTES TO CONSOLIDATED FINANCIAL STATEMENTS
NOTE 1. SUMMARY OF SIGNIFICANT ACCOUNTING POLICIES:
Fiscal Year
The Company’s fiscal year is the fifty-two or fifty-three week period which ends on the Friday nearest September 30th. The fiscal years ended October 1, 2004 and September 30, 2005 were each fifty-two week periods. The fiscal year ended October 3, 2003 was a fifty-three week period.
Principles of Consolidation
The consolidated financial statements include the accounts of the Company and all its subsidiaries. All significant intercompany balances and transactions have been eliminated.
Reclassification
Certain prior period balances have been reclassified to conform to the current year presentation. The effect was not material.
New Accounting Pronouncements
In November 2004, the Financial Accounting Standards Board (FASB) issued Statement of Financial Accounting Standards (SFAS) No. 151, “Inventory Costs—An Amendment of ARB No. 43, Chapter 4.” The provisions of SFAS No. 151 will be effective for inventory costs incurred during fiscal years beginning after June 15, 2005, and are not expected to have a material effect on the Company’s financial statements.
In December 2004, the FASB issued a revision of SFAS No. 123, “Accounting for Stock-Based Compensation,” which also supersedes APB Opinion No. 25, “Accounting for Stock Issued to its Employees,” and its related implementation guidance. This Statement requires a public entity to measure the cost of employee services received in exchange for an award of equity instruments based on the grant-date fair value of the award, and recognize the cost over the period during which an employee is required to provide service in exchange for the award—the requisite service period. This Statement is effective for annual reporting periods beginning after June 15, 2005, and applies to all awards granted after the required effective date and to awards modified, repurchased, or cancelled after that date. The Company is currently evaluating the provisions of this Statement. Adoption of the Statement in the first quarter of fiscal 2006 using the modified prospective transition method will result in a reduction of reported earnings, which management believes, based on the analysis to date, will be similar to that reflected in the pro forma information included in the “Earnings Per Share” disclosure herein.
On March 30, 2005, the FASB issued FASB Interpretation No. 47, “Accounting for Conditional Asset Retirement Obligations,” which clarifies the term “conditional asset retirement obligation” as used in FASB Statement No. 143. The Interpretation is effective for ARAMARK no later than the end of fiscal 2006. The Company is currently evaluating the Interpretation, but has not yet determined what effect adoption will have on the consolidated financial statements.
Revenue Recognition
In each of our operating segments, we recognize revenue in the period in which services are provided pursuant to the terms of our contractual relationships with our clients. Revenues in our direct marketing segment are recognized upon shipment.
S-9
ARAMARK CORPORATION AND SUBSIDIARIES
NOTES TO CONSOLIDATED FINANCIAL STATEMENTS—(Continued)
Vendor Consideration
Consideration received from vendors is accounted for as an adjustment to the price of the vendor’s products or services and reported as a reduction of Cost of Services Provided, following the provisions of the consensus reached in Emerging Issues Task Force Issue 02-16, “Accounting by a Customer for Certain Consideration Received from a Vendor.”
Use of Estimates
The preparation of financial statements in conformity with generally accepted accounting principles requires management to make estimates and assumptions that affect the reported amounts of assets and liabilities and disclosure of contingent assets and liabilities at the date of the financial statements and the reported amounts of sales and expenses during the reporting period. Actual results could differ from those estimates.
Comprehensive Income
Pursuant to the provisions of SFAS No. 130, “Reporting Comprehensive Income,” comprehensive income includes all changes to shareholders’ equity during a period, except those resulting from investments by and distributions to shareholders. The components of comprehensive income are shown in the consolidated statements of shareholders’ equity.
Currency Translation
Gains and losses resulting from the translation of financial statements of non-U.S. subsidiaries are reflected as a component of accumulated other comprehensive income (loss) in shareholders’ equity. Currency transaction gains and losses included in operating results for fiscal 2003, 2004 and 2005 were not significant.
Current Assets
The Company considers all highly liquid investments with an original maturity of three months or less to be cash equivalents.
Inventories are valued at the lower of cost (principally the first-in, first-out method) or market. The LIFO (last-in, first-out) method of determining cost is used to value certain directly marketed items. The stated value of inventories determined using the LIFO method is not significantly different from replacement or current cost. Personalized work apparel, linens and other rental items in service are recorded at cost and are amortized over their estimated useful lives, approximately two years.
The components of inventories are as follows:
| Fiscal | ||||||
| 2004 | 2005 | |||||
Food | 33.7 | % | 32.4 | % | ||
Career apparel, safety equipment and linens | 62.4 | % | 63.8 | % | ||
Parts, supplies and novelties | 3.9 | % | 3.8 | % | ||
| 100.0 | % | 100.0 | % | |||
S-10
ARAMARK CORPORATION AND SUBSIDIARIES
NOTES TO CONSOLIDATED FINANCIAL STATEMENTS—(Continued)
Property and Equipment
Property and equipment are stated at cost and are depreciated over their estimated useful lives on a straight-line basis. Gains and losses on dispositions are included in operating results. Maintenance and repairs are charged to current operations, and replacements and significant improvements are capitalized. The estimated useful lives for the major categories of property and equipment are 10 to 40 years for buildings and improvements and 3 to 10 years for service equipment and fixtures. Depreciation expense in fiscal 2003, 2004 and 2005 was $201.1 million, $222.9 million and $237.6 million, respectively.
Other Assets
Other assets consist primarily of investments in 50% or less owned entities, client contract investments, computer software costs and long-term receivables. Investments in which the Company owns more than 20% but less than a majority are accounted for using the equity method. Investments in which the Company owns less than 20% are accounted for under the provisions of SFAS No. 115, “Accounting for Certain Investments in Debt and Equity Securities,” or the cost method, as applicable.
Other Accrued Expenses and Liabilities
Other accrued expenses and current liabilities consist principally of insurance accruals, advanced payments from clients, taxes, interest and accrued commissions. Noncurrent liabilities consist primarily of deferred compensation, insurance accruals, pension liabilities, legal reserves and holdbacks on acquisitions.
The Company is self-insured for a limited portion of the risk retained under its general liability and workers’ compensation arrangements. When required, self-insurance reserves are recorded based on actuarial analyses.
��
S-11
ARAMARK CORPORATION AND SUBSIDIARIES
NOTES TO CONSOLIDATED FINANCIAL STATEMENTS—(Continued)
Earnings Per Share
The Company follows the provisions of SFAS No. 128, “Earnings per Share.” Basic earnings per share is based on the weighted average number of common shares outstanding during the respective periods. Diluted earnings per share is based on the weighted average number of common shares outstanding during the respective periods, plus the potential dilution of restricted stock units and shares that could be issued resulting from the exercise of stock options under the ARAMARK Ownership and Equity Incentive Plans. Earnings applicable to common stock and common shares utilized in the calculation of basic and diluted earnings per share are as follows:
| Fiscal | |||||||||
| 2003 | 2004 | 2005 | |||||||
| (in thousands, except per share data) | |||||||||
Earnings: | |||||||||
Income from continuing operations | $ | 265,368 | $ | 263,104 | $ | 288,475 | |||
Net income | $ | 301,092 | $ | 263,104 | $ | 288,475 | |||
Shares: | |||||||||
Weighted average number of common shares outstanding used in basic earnings per share calculation | 190,723 | 188,799 | 185,991 | ||||||
Impact of restricted stock units and potential exercise of stock options under the ARAMARK Ownership and Equity Incentive Plans | 6,782 | 4,655 | 2,318 | ||||||
Total common shares used in diluted earnings per share calculation | 197,505 | 193,454 | 188,309 | ||||||
Earnings per common share—Basic: | |||||||||
Income from continuing operations | $ | 1.39 | $ | 1.39 | $ | 1.55 | |||
Net income | $ | 1.58 | $ | 1.39 | $ | 1.55 | |||
Earnings per common share—Diluted: | |||||||||
Income from continuing operations | $ | 1.34 | $ | 1.36 | $ | 1.53 | |||
Net income | $ | 1.52 | $ | 1.36 | $ | 1.53 | |||
Options to purchase 2,453,112 shares were outstanding at September 30, 2005, but were not included in the computation of diluted earnings per common share, as their effect would have been antidilutive. Options to purchase 629,920 shares were outstanding at October 1, 2004, but were not included in the computation of diluted earnings per common share, as their effect would have been antidilutive.
S-12
ARAMARK CORPORATION AND SUBSIDIARIES
NOTES TO CONSOLIDATED FINANCIAL STATEMENTS—(Continued)
The Company applies Accounting Principles Board Opinion No. 25, “Accounting for Stock Issued to Employees,” and related interpretations in accounting for its stock option plans. Accordingly, no compensation expense has been recognized. If compensation cost for these plans had been determined using the fair-value method prescribed by SFAS No. 123, “Accounting for Stock Based Compensation,” the Company’s net income and earnings per share would have been reduced to the following pro forma amounts:
| Fiscal | ||||||||||||
| 2003 | 2004 | 2005 | ||||||||||
| (in thousands, except per share data) | ||||||||||||
Net income, as reported | $ | 301,092 | $ | 263,104 | $ | 288,475 | ||||||
Add: Stock-based employee compensation expense included in reported net income, net of related tax effects | — | 574 | 2,149 | |||||||||
Deduct: Total stock-based employee compensation expense determined under fair value based method for all awards, net of related tax effects | (12,388 | ) | (14,305 | ) | (17,160 | ) | ||||||
Net income, pro forma | $ | 288,704 | $ | 249,373 | $ | 273,464 | ||||||
Earnings per share | ||||||||||||
As reported: | ||||||||||||
Basic | $ | 1.58 | $ | 1.39 | $ | 1.55 | ||||||
Diluted | $ | 1.52 | $ | 1.36 | $ | 1.53 | ||||||
Pro forma: | ||||||||||||
Basic | $ | 1.51 | $ | 1.32 | $ | 1.47 | ||||||
Diluted | $ | 1.46 | $ | 1.29 | $ | 1.45 | ||||||
The weighted average fair value of options granted in fiscal 2003, 2004 and 2005 was $6.56, $7.39 and $6.51, respectively, per option. The fair value of each option was estimated on the grant date using the Black-Scholes Option Pricing Model, with the following assumptions:
| Fiscal | ||||||
| 2003 | 2004 | 2005 | ||||
Risk-free interest rate | 2.3%-3.2% | 3.1%-3.7% | 3.4%-4.3% | |||
Expected life in years | 5 | 5 | 5 | |||
Dividend yield | — | 0.7%-0.8% | 0.8%-1.0% | |||
Expected volatility | 27% | 27% | 27% | |||
Supplemental Cash Flow Information
| Fiscal | |||||||||
| 2003 | 2004 | 2005 | |||||||
| (in millions) | |||||||||
Interest paid | $ | 135.5 | $ | 125.4 | $ | 128.4 | |||
Income taxes paid | $ | 79.8 | $ | 110.3 | $ | 139.7 | |||
Cash provided by operating activities includes the tax benefit from the employee exercise of non-qualified stock options of approximately $37.4 million, $25.8 million and $26.8 million during the 2003, 2004 and 2005 fiscal years, respectively.
S-13
ARAMARK CORPORATION AND SUBSIDIARIES
NOTES TO CONSOLIDATED FINANCIAL STATEMENTS—(Continued)
Cash flow from other investing activities in fiscal 2005 includes approximately $14.1 million representing a special distribution of proceeds from a real estate sale by a 50%-owned equity affiliate, and approximately $18.0 million from the repayment of a client note receivable.
Significant noncash activities follow:
| • | During fiscal 2003, 2004 and 2005, the Company contributed $3.4 million, $3.2 million and $3.7 million, respectively, of stock units to its stock unit retirement plan in satisfaction of its accrued obligations. See Note 6. |
| • | During fiscal 2003, 2004 and 2005, the Company executed capital lease transactions. The present value of the future rental obligations was approximately $12.8 million, $33.2 million and $16.9 million for fiscal 2003, 2004 and 2005, respectively, which is included in property and equipment. |
| • | During the fourth quarter of fiscal 2003, the Company reached agreement for the sale of its 15% interest in a periodicals distribution business to the majority shareholder, and wrote down this investment to the expected recoverable amount. The resulting pre-tax charge of $10.7 million is included in “Other expense.” |
NOTE 2. DISCONTINUED OPERATIONS:
During the second quarter of fiscal 2003, the Company executed a definitive agreement for the sale of ARAMARK Educational Resources (AER) to Knowledge Learning Corporation, Inc. for approximately $250 million in cash. The sale closed on May 9, 2003, and resulted in an after-tax gain of $23.6 million.
AER is accounted for as a discontinued operation in the accompanying financial statements in accordance with SFAS No. 144, “Accounting for the Impairment or Disposal of Long-Lived Assets.” AER’s results of operations and cash flows have been removed from the Company’s results of continuing operations for fiscal 2003. All related disclosures have also been adjusted to reflect the discontinued operation. Summarized selected financial information from discontinued operations is as follows:
| Fiscal 2003 | ||||
| (in thousands) | ||||
Sales | $ | 264,277 | ||
Income before income taxes | $ | 20,174 | ||
Income tax provision | (8,002 | ) | ||
Income from discontinued operations, net | 12,172 | |||
After-tax gain on sale | 23,552 | |||
Net income | $ | 35,724 | ||
NOTE 3. ACQUISITIONS:
Fiscal 2003
During fiscal 2003, the Company acquired three regional uniform rental companies for a total of approximately $27 million in cash. The Company’s pro forma results of operations for fiscal 2003 would not have been materially different than reported, assuming that these acquisitions had occurred at the beginning of the fiscal period.
S-14
ARAMARK CORPORATION AND SUBSIDIARIES
NOTES TO CONSOLIDATED FINANCIAL STATEMENTS—(Continued)
On September 30, 2002, the Company completed the acquisition of the Clinical Technology Services business from Premier, Inc. for approximately $100 million in cash. Additionally, in mid-December 2002, the Company closed the acquisition of Fine Host Corporation, a food service management company, for approximately $95 million, of which $30 million represented a holdback which was scheduled to be paid over time, subject to satisfaction of any claims made against the holdback pursuant to the terms of the acquisition agreement and the assignment of certain client contracts. During the fourth quarter of fiscal 2005, the Company reached settlement with Fine Host Corporation regarding the asserted claims and certain other claims that each party had against each other. Pursuant to this settlement, an adjustment of approximately $20 million was made to reduce goodwill, with a corresponding reduction in the original holdback amount. The results of Fine Host Corporation have been included starting in the second quarter of fiscal 2003. The proforma results of operations for fiscal 2003 would not have been materially different than reported, assuming that these acquisitions had occurred at the beginning of the fiscal period.
During the fourth quarter of fiscal 2003, the Company also completed the acquisitions of two vending/food service companies, one located in the U.S. and the other in Europe, for total cash consideration of approximately $26.5 million. The pro forma results of operations for fiscal 2003 would not have been materially different than reported, assuming that these acquisitions had occurred at the beginning of the fiscal period.
Fiscal 2004
During fiscal 2004, the Company acquired several regional uniform rental companies for a total of approximately $21 million in cash. The Company’s pro forma results of operations for fiscal 2003 and 2004 would not have been materially different than reported, assuming that these acquisitions had occurred at the beginning of the respective fiscal periods.
During the second quarter of fiscal 2004, the Company acquired Catering Alliance, a contract caterer in the United Kingdom, for approximately $85 million in cash, and increased its ownership in Central Restaurantes (Chile) from 20% to 51% for approximately $37 million in cash. The Company’s pro forma results of operations for fiscal 2003 and 2004 would not have been materially different than reported, assuming that these acquisitions had occurred at the beginning of the respective periods.
During the fourth quarter of fiscal 2004, the Company acquired 90% of Bright China Service Industries, a facility services company, for approximately $13 million in cash. The Company’s pro forma results of operations for fiscal 2003 and 2004 would not have been materially different than reported, assuming that this acquisition had occurred at the beginning of the respective periods.
Fiscal 2005
During the second quarter of fiscal 2005, the Company increased its ownership in its Irish food service affiliate from 45% to 90%, for approximately $61 million in cash. Also, during fiscal 2005, the Company acquired several regional uniform rental companies for a total of approximately $56 million in cash. The Company’s pro forma results of operations for fiscal 2003, 2004 and 2005 would not have been materially different than reported, assuming that these acquisitions had occurred at the beginning of the respective fiscal periods.
S-15
ARAMARK CORPORATION AND SUBSIDIARIES
NOTES TO CONSOLIDATED FINANCIAL STATEMENTS—(Continued)
NOTE 4. GOODWILL AND OTHER INTANGIBLE ASSETS:
The Company follows the provisions of SFAS No. 142, “Goodwill and Other Intangible Assets.” The Company has completed the annual goodwill impairment tests required by SFAS No. 142, which did not result in an impairment charge.
Goodwill, allocated by segment, follows (in thousands):
| October 1, 2004 | Acquisitions | Translation and Other | September 30, 2005 | ||||||||||
Food and Support Services—United States | $ | 1,081,205 | $ | 1,183 | $ | (20,144 | ) | $ | 1,062,244 | ||||
Food and Support Services—International | 207,961 | 66,866 | 2,628 | 277,455 | |||||||||
Uniform and Career Apparel—Rental | 190,559 | 43,072 | — | 233,631 | |||||||||
Uniform and Career Apparel—Direct Marketing | 109,419 | — | — | 109,419 | |||||||||
| $ | 1,589,144 | $ | 111,121 | $ | (17,516 | ) | $ | 1,682,749 | |||||
Goodwill additions during the fiscal year ended September 30, 2005 reflect (i) the increase of ownership in our Irish foodservice company from 45% to 90%, which is included in the Food and Support—International segment, and (ii) the acquisition of several regional uniform rental companies. These amounts may be revised upon final determination of the purchase price allocations.
During the fourth quarter of fiscal 2005, the Company reached settlement with Fine Host Corporation regarding the asserted claims and certain other claims that each party had against each other. Pursuant to this settlement, an adjustment of approximately $20 million was made to reduce goodwill in the Food and Support Services—United States segment, with a corresponding reduction in the holdback amount that was originally recorded in noncurrent liabilities.
Other intangible assets consist of (in thousands):
| October 1, 2004 | September 30, 2005 | |||||||||||||||||||
| Gross Amount | Accumulated Amortization | Net Amount | Gross Amount | Accumulated Amortization | Net Amount | |||||||||||||||
Customer relationship assets | $ | 479,660 | $ | (210,690 | ) | $ | 268,970 | $ | 517,607 | $ | (243,969 | ) | $ | 273,638 | ||||||
Other | 21,363 | (18,990 | ) | 2,373 | 19,195 | (18,249 | ) | 946 | ||||||||||||
| $ | 501,023 | $ | (229,680 | ) | $ | 271,343 | $ | 536,802 | $ | (262,218 | ) | $ | 274,584 | |||||||
Other intangible assets are amortizable and consist primarily of contract rights, customer lists and non-compete agreements. The intangible assets are being amortized on a straight-line basis over the expected period of benefit, 3 to 20 years. Intangible assets of approximately $52 million were acquired through business combinations during fiscal 2005. Amortization of intangible assets for the fiscal years ended October 3, 2003, October 1, 2004 and September 30, 2005 was approximately $50 million, $50 million and $48 million, respectively. Based upon the recorded balances at September 30, 2005, future amortization will average approximately $50 million for both fiscal 2006 and 2007 and average approximately $42 million for each of the following three fiscal years.
S-16
ARAMARK CORPORATION AND SUBSIDIARIES
NOTES TO CONSOLIDATED FINANCIAL STATEMENTS—(Continued)
NOTE 5. BORROWINGS:
Long-term borrowings at October 1, 2004 and September 30, 2005 are summarized in the following table:
| Fiscal | ||||||||
| 2004 | 2005 | |||||||
| (in thousands) | ||||||||
Credit facility borrowings | $ | 182,487 | $ | 51,618 | ||||
European facility borrowings | 235,508 | 273,068 | ||||||
Bank term loan due May 2005 | 50,000 | — | ||||||
Bank term loan due May 2005 | 55,000 | — | ||||||
Bank term loan due October 2006 | 20,000 | 20,000 | ||||||
Japanese borrowings | 49,095 | 47,763 | ||||||
5.00% notes, due June 2012 | — | 249,971 | ||||||
6.375% notes, due February 2008 | 298,668 | 291,260 | ||||||
7.00% notes, due July 2006 | 299,982 | 299,992 | ||||||
7.00% notes, due May 2007 | 299,695 | 299,814 | ||||||
7.10% notes, due December 2006 | 124,960 | 124,979 | ||||||
7.25% notes and debentures, due August 2007 | 30,730 | 30,730 | ||||||
8.15% notes, due May 2005 | 119,575 | — | ||||||
Capital leases | 41,318 | 48,199 | ||||||
Other | 61,705 | 103,491 | ||||||
| 1,868,723 | 1,840,885 | |||||||
Less-current portion | (25,523 | ) | (46,363 | ) | ||||
| $ | 1,843,200 | $ | 1,794,522 | |||||
The Company’s $900 million revolving credit facility (the “U.S. Credit Facility”), consists of an $800 million U.S. dollar tranche and a $100 million Canadian dollar equivalent tranche. The U.S. Credit Facility expires in March 2009. The agreement contains an option for the Company to increase the amount of the facility to $1.25 billion, subject to the lender banks’ approval. Interest on U.S. borrowings is based on the Prime Rate or LIBOR plus a spread of 0.31% to 0.95% (as of September 30, 2005—0.60%). Interest on Canadian borrowings is based on the Canadian Prime Rate or Canadian Bankers Acceptance Rate plus a spread of 0.31% to 0.95% (as of September 30, 2005—0.60%). The spreads increase between 0.1% and 0.25% if the facility utilization (as defined) is 50% or more. There is a facility fee ranging from 0.09% to 0.30% (as of September 30, 2005—0.15%). The spreads and fee margins are based on credit ratings as defined. The credit facility contains restrictive covenants that provide, among other things, limitations on liens and dispositions of material assets. The terms of the credit facility also require that the Company maintain certain specified ratios of cash flow to fixed charges and total borrowings to EBITDA, as defined. At September 30, 2005, the Company was in compliance with all of these covenants. Subsequent to September 30, 2005, ARAMARK amended its existing $900 million revolving credit facility. The amendment extended the maturity from March 2009 to November 2010. In addition, the amendment reduced the spread the Company pays over either the Prime Rate or LIBOR on US borrowings and the spread over the Canadian Prime Rate or Canadian Bankers Acceptance Rate on Canadian borrowings. All other terms and conditions in the existing facility remained unchanged.
S-17
ARAMARK CORPORATION AND SUBSIDIARIES
NOTES TO CONSOLIDATED FINANCIAL STATEMENTS—(Continued)
The Company’s GBP 175 million revolving credit facility provides for borrowings available in multiple currencies. The credit facility expires in June 2009. The agreement contains an option to increase the amount of the facility to GBP 250 million, subject to the lender banks’ approval. Interest on borrowings is based on the relevant currency LIBOR plus a spread of 0.375% to 1.50% (as of September 30, 2005—0.70%). The spread reflects an increase of 0.05% due to the facility utilization (as defined) being 50% or more. The spreads are based on credit ratings of ARAMARK Corporation as defined. The credit facility contains restrictive covenants which provide, among other things, limitations on liens and dispositions of material assets by the Company, which are consistent with the U.S. Credit Facility. The terms of the credit facility also require that the Company maintain certain specified ratios of cash flow to fixed charges and total borrowings to EBITDA, which are consistent with the U.S. Credit Facility. At September 30, 2005, the Company was in compliance with all of these covenants.
During the first quarter of fiscal 2004, the Company entered into a Japanese yen denominated borrowing agreement and borrowed the equivalent of $50 million. The note bears interest at 1.2% and matures in October 2006. This note has been designated as a hedge of the Company’s net Japanese currency exposure represented by the equity investment in our Japanese affiliate, AIM Services Co., Ltd.
The $20 million bank term loan bears interest at 3.58% plus a spread of 0.0%—0.75% (0.0% as of September 30, 2005). The spread is based on credit rating, as defined in the term loan agreement. The term loan matures in October 2006.
During the third quarter of fiscal 2005, ARAMARK Services, Inc. issued $250 million of 5.00% guaranteed notes due June 1, 2012. Proceeds from the offering were used primarily to repay the maturing 8.15% notes (due May 2005) and the bank term loans (due May 2005). The 5.00% notes may be redeemed, in whole or in part, at any time at the Company’s option. The redemption price equals the greater of (i) 100% of the principal amount or (ii) an amount based on the discounted present value of scheduled principal and interest payments, as defined.
The 6.375% (due February 2008), 7.0% (due July 2006) and 7.0% (due May 2007) notes may be redeemed, in whole or in part, at any time at the Company’s option. The redemption price equals the greater of (i) 100% of the principal amount or (ii) an amount based on the discounted present value of scheduled principal and interest payments, as defined.
The 7.25% notes and debentures (due August 2007) may be exchanged, in whole or in part, at the option of the holder, for 7.10% senior notes due December 2006. The Company currently has the right to redeem these notes and debentures, at par, upon being presented with a notice of conversion.
Effective July 2005, Central Restaurantes, a subsidiary of the Company, established a non-revolving credit facility in Chile which consolidated existing debt and provided additional financing. The credit facility expires in July 2010 and requires periodic repayment of amounts borrowed. Interest on borrowings is based on the TAB 180 day bank rate plus a spread of 0.85% (as of September 30, 2005-1.51%). The credit facility contains restrictive covenants which provide, among other things, limitations on liens and disposition of material assets. The terms of the credit facility also require Central Restaurantes maintain certain specified ratios of total liabilities to equity, total borrowings to EBITDA and operating income to interest expense, as defined. At September 30, 2005, the Company was in compliance with all of these covenants.
S-18
ARAMARK CORPORATION AND SUBSIDIARIES
NOTES TO CONSOLIDATED FINANCIAL STATEMENTS—(Continued)
During the third quarter of fiscal 2003, the Company completed a tender offer for its 6.75% guaranteed notes due August 1, 2004 issued by ARAMARK Services, Inc. and guaranteed by ARAMARK Corporation. The total cash consideration paid for the purchase of the notes, including accrued interest, was $102 million. Additionally, during the third quarter of fiscal 2003, the Company retired a $45 million term loan due March 2005. These two transactions resulted in an extinguishment charge of $7.7 million which is included in “Interest and Other Financing Costs, net.”
Debt repayments of $323.7 million, contractually due in fiscal 2006, have been classified as non-current in the accompanying consolidated balance sheet as the Company has the ability and intent to finance the repayments through additional borrowings under the U.S. Credit Facility. Accrued interest on borrowings totaling $33.3 million at October 1, 2004 and $31.7 million as of September 30, 2005 is included in current liabilities as “Other accrued expenses.”
The Company follows the provisions of SFAS No. 133, “Accounting for Derivative Instruments and Hedging Activities,” and SFAS No. 138, “Accounting for Certain Derivative Instruments and Certain Hedging Activities—an Amendment of FASB Statement No. 133.” Derivative financial instruments, such as interest rate swaps and forward exchange contract agreements, are used to manage changes in market conditions related to debt obligations and foreign currency exposures. All derivatives are recognized on the balance sheet at fair value at the end of each quarter. The counterparties to the Company’s derivative agreements are major international banks. The Company continually monitors its positions and the credit ratings of its counterparties, and does not anticipate nonperformance by the counterparties.
As of September 30, 2005, the Company had notional amounts of $300 million and 93 million GBP of interest rate swap agreements, which are designated as cash flow hedging instruments, fixing the rate on a like amount of variable rate borrowings and $300 million of swap agreements designated as fair-value hedging instruments. Changes in the fair value of a derivative that is designated as and meets all the required criteria for a cash flow hedge are recorded in accumulated other comprehensive income (loss) and reclassified into earnings as the underlying hedged item affects earnings. Amounts reclassified into earnings related to interest rate swap agreements are included in interest expense. During fiscal 2004 and 2005, respectively, a charge of approximately $3.4 million (net of tax) and a credit of approximately $1.0 million (net of tax) related to interest rate swaps were recorded in comprehensive income. As of September 30, 2005, approximately $3.1 million of net unrealized losses related to interest rate swaps were included in “Accumulated other comprehensive income.” Changes in the fair value of a derivative that is designated as and meets all the required criteria for a fair value hedge are recognized currently in earnings, offset by recognizing currently in earnings the change in the fair value of the underlying hedged item. As of September 30, 2005, approximately $8.5 million has been included in “Other Noncurrent Liabilities,” with an offsetting decrease in “Long-term borrowings” in the consolidated balance sheet related to fair value hedges. The hedge ineffectiveness for cash flow and fair value hedging instruments for fiscal 2004 and 2005 was not material.
As of September 30, 2005, the Company had foreign currency forward exchange contracts outstanding, with notional amounts of 16.9 million Euros, 6.0 million GBP, 28.0 million Canadian dollars and 2.0 million Mexican pesos, to mitigate the risk of changes in foreign currency exchange rates on short-term intercompany loans to certain international subsidiaries. Gains and losses on these foreign currency exchange contracts are recognized in income currently,
S-19
ARAMARK CORPORATION AND SUBSIDIARIES
NOTES TO CONSOLIDATED FINANCIAL STATEMENTS—(Continued)
substantially offsetting currency transaction gains and losses on the short-term intercompany loans. As of September 30, 2005, the fair-value of these foreign exchange contracts was $(0.2) million. Net foreign currency transaction gains and losses were not material during the periods presented.
The following summarizes the fair value of the Company’s financial instruments as of October 1, 2004 and September 30, 2005. The fair values were computed using market quotes, if available, or based on discounted cash flows using market interest rates as of the end of the respective periods.
| Fiscal 2004 | Fiscal 2005 | |||||||||||||||
| Carrying Amount | Fair Value | Carrying Amount | Fair Value | |||||||||||||
Asset (Liability), in millions: | ||||||||||||||||
Long-term debt | $ | (1,868.7 | ) | $ | (1,953.9 | ) | $ | (1,840.9 | ) | $ | (1,866.8 | ) | ||||
Pay fixed/receive variable interest rate swap agreements | (6.8 | ) | (6.8 | ) | 0.7 | 0.7 | ||||||||||
Receive fixed/pay variable interest rate swap agreements | (1.0 | ) | (1.0 | ) | (8.5 | ) | (8.5 | ) | ||||||||
Forward contracts | (1.1 | ) | (1.1 | ) | (0.2 | ) | (0.2 | ) | ||||||||
Long-term borrowings maturing in the next five fiscal years are as follows:
| Amount | |||
| (in thousands) | |||
2006 | $ | 46,363 | |
2007 | 539,335 | ||
2008 | 305,305 | ||
2009 | 669,593 | ||
2010 | 18,126 | ||
Thereafter | 262,163 | ||
The components of interest and other financing costs, net, are summarized as follows:
| Fiscal | ||||||||||||
| 2003 | 2004 | 2005 | ||||||||||
| (in thousands) | ||||||||||||
Interest expense | $ | 141,156 | * | $ | 121,894 | $ | 124,122 | |||||
Interest income | (2,180 | ) | (2,387 | ) | (3,891 | ) | ||||||
Other financing costs | 3,493 | 2,855 | 6,768 | |||||||||
Total | $ | 142,469 | $ | 122,362 | $ | 126,999 | ||||||
| * | Includes $7.7 million extinguishment charge. |
S-20
ARAMARK CORPORATION AND SUBSIDIARIES
NOTES TO CONSOLIDATED FINANCIAL STATEMENTS—(Continued)
NOTE 6. EMPLOYEE PENSION AND PROFIT SHARING PLANS:
In the United States, the Company maintains qualified contributory and non-contributory defined contribution retirement plans for eligible employees, with Company contributions to the plans based on earnings performance or salary level. The Company also has a non-qualified stock unit retirement plan for certain employees. The total expense of the above plans for fiscal 2003, 2004 and 2005 was $18.9 million, $21.7 million and $22.8 million, respectively. During fiscal 2003, 2004 and 2005, the Company contributed to the stock unit retirement plan 128,092 stock units, 123,890 stock units and 137,976 stock units, respectively, which are convertible into Class A or Class B common stock, in satisfaction of its accrued obligations. The value of the stock units was credited to capital surplus. The Company participates in various multi-employer union administered pension and employee welfare plans. Contributions to these plans, which are primarily defined benefit plans, result from contractual provisions of labor contracts and were $22.5 million, $24.5 million and $27.6 million for fiscal 2003, 2004 and 2005, respectively. Additionally, the Company maintains several contributory and non-contributory defined benefit pension plans, primarily in Canada and the United Kingdom. Pension expense related to these plans was not material to the consolidated financial statements. The following tables set forth changes in the projected benefit obligation and the fair value of plan assets for these plans as of and for the fiscal year ended September 30, 2005 (in thousands):
Benefit obligation, beginning | $ | 127,718 | ||||||||
Foreign currency translation | 4,694 | Fair value of plan assets, beginning | $ | 85,938 | ||||||
Service cost | 6,830 | Foreign currency translation | 3,292 | |||||||
Interest cost | 7,839 | Employer contributions | 10,782 | |||||||
Employee contributions | 2,419 | Employee contributions | 2,419 | |||||||
Actuarial loss (gain) | 9,010 | Actual return on plan assets | 13,720 | |||||||
Benefits paid | (7,450 | ) | Benefits paid | (7,450 | ) | |||||
Benefit obligation, end | $ | 151,060 | Fair value of plan assets, end | $ | 108,701 | |||||
Amounts recognized in the balance sheet: | ||||||||||
| Prepaid asset | $ | 16,355 | ||||||||
Funded status | $ | (42,359 | ) | Accrued benefit liability | (22,156 | ) | ||||
Unrecognized prior service cost | 1,975 | Intangible asset | 467 | |||||||
Unrecognized net loss (gain) | 49,235 | Other comprehensive income | 14,185 | |||||||
Net amount recognized as prepaid asset | $ | 8,851 | Net amount recognized | $ | 8,851 | |||||
The assumptions utilized in the determination of pension expense and the funded status information include a weighted average discount rate of 5.9% for pension expense, a weighted average discount rate of 5.3% for the funded status, a weighted average rate of compensation increase of 3.8% and a weighted average long-term rate of return on assets of 7.2%. Assumptions are adjusted annually, as necessary, based on prevailing market conditions and actual experience.
S-21
ARAMARK CORPORATION AND SUBSIDIARIES
NOTES TO CONSOLIDATED FINANCIAL STATEMENTS—(Continued)
The following tables set forth changes in the projected benefit obligation and the fair value of plan assets for these plans as of and for the fiscal year ended October 1, 2004 (in thousands):
Benefit obligation, beginning | $ | 96,682 | ||||||||
Foreign currency translation | 6,441 | Fair value of plan assets, beginning | $ | 69,593 | ||||||
Service cost | 5,703 | Foreign currency translation | 4,663 | |||||||
Interest cost | 6,515 | Employer contributions | 4,484 | |||||||
Actuarial loss (gain) | 14,834 | Actual return on plan assets | 9,655 | |||||||
Benefits paid | (2,457 | ) | Benefits paid | (2,457 | ) | |||||
Benefit obligation, end | $ | 127,718 | Fair value of plan assets, end | $ | 85,938 | |||||
Amounts recognized in the balance sheet: | ||||||||||
Funded status | $ | (41,780 | ) | Prepaid asset | $ | 11,990 | ||||
Unrecognized prior service cost | 1,969 | Accrued benefit liability | (30,852 | ) | ||||||
Unrecognized net loss (gain) | 43,853 | Other comprehensive income | 22,904 | |||||||
Net amount recognized as prepaid asset | $ | 4,042 | Net amount recognized | $ | 4,042 | |||||
The assumptions utilized in the determination of pension expense and the funded status information include a weighted average discount rate of 6.1% for pension expense, a weighted average discount rate of 5.9% for the funded status, a weighted average rate of compensation increase of 3.8% and a weighted average long-term rate of return on assets of 7.2%.
Assets of the plans are invested with the goal of principal preservation and enhancement over the long-term. The primary goal is total return, consistent with prudent investment management. The current overall capital structure and targeted ranges for asset classes are 50-70% invested in equity securities and 30-50% invested in debt securities. As of September 30, 2005, the overall portfolio mix consisted of 65% equity securities, 30% debt securities and 5% cash and cash equivalents. Performance of the plans is monitored on a regular basis and adjustments of the asset allocations are made when deemed necessary.
It is the Company’s policy to fund at least the minimum required contributions as outlined in the required statutory actuarial valuation for each plan. Contributions for fiscal 2006 will not be material. Based upon the benefit obligations of the plans and estimated future employee service, annual benefit payments are not expected to be material in each of the next ten fiscal years.
NOTE 7. INCOME TAXES:
The Company accounts for income taxes following the provisions of SFAS No. 109, “Accounting for Income Taxes.” SFAS No. 109 requires deferred tax assets or liabilities to be recognized for the estimated future tax effects of temporary differences between the financial reporting and tax bases of assets and liabilities based on the enacted tax law and statutory tax rates applicable to the periods in which the temporary differences are expected to affect taxable income.
S-22
ARAMARK CORPORATION AND SUBSIDIARIES
NOTES TO CONSOLIDATED FINANCIAL STATEMENTS—(Continued)
The components of income before income taxes by source of income are as follows:
| Fiscal | |||||||||
| 2003 | 2004 | 2005 | |||||||
| (in thousands) | |||||||||
United States | $ | 373,831 | $ | 381,688 | $ | 407,950 | |||
Non-U.S. | 35,722 | 33,528 | 45,223 | ||||||
| $ | 409,553 | $ | 415,216 | $ | 453,173 | ||||
The provision for income taxes consists of:
| Fiscal | |||||||||||
| 2003 | 2004 | 2005 | |||||||||
| (in thousands) | |||||||||||
Current: | |||||||||||
Federal | $ | 81,311 | $ | 92,240 | $ | 131,706 | |||||
State and local | 14,716 | 15,472 | 23,148 | ||||||||
Non-U.S. | 10,044 | 11,651 | 13,917 | ||||||||
| 106,071 | 119,363 | 168,771 | |||||||||
Deferred: | |||||||||||
Federal | 32,163 | 27,304 | (4,429 | ) | |||||||
State and local | 5,661 | 5,871 | (952 | ) | |||||||
Non-U.S. | 290 | (426 | ) | 1,308 | |||||||
| 38,114 | 32,749 | (4,073 | ) | ||||||||
| $ | 144,185 | $ | 152,112 | $ | 164,698 | ||||||
Current taxes payable of $36.0 million and $36.9 million at fiscal year end 2004 and 2005, respectively, are included in “Other accrued expenses and current liabilities.” During the third quarter of fiscal 2003, the Company reduced the provision for income taxes by approximately $8.4 million, based upon the settlement of certain open tax years.
The provision for income taxes varies from the amount determined by applying the United States Federal statutory rate to pre-tax income as a result of the following:
| Fiscal | |||||||||
| 2003 | 2004 | 2005 | |||||||
| (% of pre-tax income) | |||||||||
United States statutory income tax rate | 35.0 | % | 35.0 | % | 35.0 | % | |||
Increase (decrease) in taxes, resulting from: | |||||||||
State income taxes, net of Federal tax benefit | 3.2 | 3.3 | 3.2 | ||||||
Foreign tax benefits | 0.1 | (0.7 | ) | (0.5 | ) | ||||
Permanent book/tax differences | 0.4 | 0.7 | 0.3 | ||||||
Tax credits and other | (3.5 | ) | (1.7 | ) | (1.7 | ) | |||
Effective income tax rate | 35.2 | % | 36.6 | % | 36.3 | % | |||
Our effective tax rate is based on expected income, statutory tax rates and tax planning opportunities available to us in the various jurisdictions in which we operate. Judgment is required in determining our effective tax rate and in evaluating our tax positions. We establish reserves when, despite our belief that our tax return positions are supportable, we believe that
S-23
ARAMARK CORPORATION AND SUBSIDIARIES
NOTES TO CONSOLIDATED FINANCIAL STATEMENTS—(Continued)
certain positions are likely to be challenged and that we may not succeed. We adjust these reserves in light of changing facts and circumstances, such as the progress of a tax audit. Our effective tax rate includes the impact of reserve provisions and changes to the reserve that we consider appropriate, as well as related interest. This rate is also applied to our quarterly operating results. In the event that there is a significant unusual/or one-time item recognized in our operating results, the tax attributable to that item would be separately calculated and recorded at the same time as the unusual or one-time item.
A number of years may elapse before a particular tax reporting year is audited and finally resolved. The number of years with open tax audits varies depending on the tax jurisdiction. In the United States, the statutes for 1998 through 2004 remain open and the Internal Revenue Service is currently examining our tax returns for 1998 through 2003. While it is often difficult to predict the final outcome or the timing of resolution of any particular tax matter, we believe that our income tax accruals reflect the probable outcome of known tax contingencies. Unfavorable settlement of any particular issue would require use of our cash. Favorable resolution would be recognized as a reduction of our effective tax rate in the year of resolution.
Certain subsidiaries have accumulated state and foreign net operating loss carryforwards for which no tax benefit has been recorded based upon the uncertainty of realization. At September 30, 2005, the amount of the potential future tax benefit was approximately $30.5 million, of which approximately $6.0 million is attributable to stock option deductions and will be recorded in equity if realized. The state and foreign net operating loss carryforwards will expire from 2006 through 2022. The Company also has accumulated foreign tax credit carryforwards for which no tax benefit has been recorded due to the uncertainty of realization. At September 30, 2005, the amount of the potential foreign tax benefit was approximately $3.0 million. The foreign tax credit carryforwards will expire from 2006 through 2013.
As of October 1, 2004 and September 30, 2005, the components of deferred taxes are as follows:
| Fiscal | ||||||
| 2004 | 2005 | |||||
| (in thousands) | ||||||
Deferred tax liabilities: | ||||||
Property and equipment | $ | 108,690 | $ | 110,552 | ||
Inventory | 31,371 | 14,683 | ||||
Investments | 12,312 | 20,748 | ||||
Contributions | 14,950 | 14,962 | ||||
Other intangible assets, including goodwill | 70,585 | 104,133 | ||||
Other | 10,525 | 9,926 | ||||
Gross deferred tax liability | 248,433 | 275,004 | ||||
Deferred tax assets: | ||||||
Insurance | 11,365 | 12,274 | ||||
Employee compensation and benefits | 70,604 | 76,219 | ||||
Accruals and allowances | 16,611 | 22,807 | ||||
Other | 2,643 | — | ||||
Gross deferred tax asset | 101,223 | 111,300 | ||||
Net deferred tax liability | $ | 147,210 | $ | 163,704 | ||
S-24
ARAMARK CORPORATION AND SUBSIDIARIES
NOTES TO CONSOLIDATED FINANCIAL STATEMENTS—(Continued)
The net deferred tax liability at October 1, 2004 and September 30, 2005 includes approximately $8.0 million and $12.8 million, respectively, of deferred tax liability related to the cumulative translation adjustment.
NOTE 8. CAPITAL STOCK:
On December 14, 2001, the Company completed an initial public offering (IPO) of 34.5 million shares of its Class B common stock at a price of $23.00 per share, raising approximately $742.9 million, net of issuance costs. Just prior to the completion of the IPO, old ARAMARK Corporation merged with its wholly owned subsidiary, ARAMARK Worldwide Corporation. Each outstanding ARAMARK old Class B and old Class A common share was exchanged for two shares and twenty shares, respectively, of the surviving corporation’s Class A common stock which had the effect of a two-for-one stock split. ARAMARK Worldwide’s name was changed to ARAMARK Corporation, and it succeeded to all the assets, liabilities, rights and obligations of old ARAMARK. Upon completion of the merger, the Amended and Restated Stockholders’ Agreement was terminated and the Company’s limited obligation to repurchase shares was eliminated. Although the Class B shares contain the same economic interests in the Company as the Class A shares, the Class A shares entitle holders to ten votes per share, while the Class B stockholders are entitled to one vote per share.
In May 2002, the Company announced the establishment of a Stock Repurchase Program. Under the Stock Repurchase Program, as amended, the Board of Directors approved the use of up to $700 million to repurchase shares of the Company’s Class A or Class B common stock. Repurchases are made in accordance with applicable securities laws in open market or privately negotiated transactions or otherwise, from time to time, depending on market conditions, and may be discontinued at any time. During fiscal 2005, the Company repurchased 6.5 million shares of Class B common stock at an aggregate cost of approximately $173.0 million, resulting in total repurchases of $648.4 million under the Stock Repurchase Program. On November 15, 2005, the Board of Directors approved an addition of $200 million to the Stock Repurchase Program, resulting in current remaining availability of approximately $252 million.
The ARAMARK Ownership Plan provided for the issuance of options to purchase shares of Class A common stock. Concurrent with the establishment of the ARAMARK 2001 Equity Incentive Plan (2001 EIP), as discussed below, no future stock option grants will be made under the ARAMARK Ownership Plan. The Company granted installment stock purchase opportunities under this plan which provide for the purchase of shares of Class A common stock. Installment stock purchase opportunities are exercisable in six annual installments with the exercise price of each purchase opportunity equal to the current fair market value at the time the purchase opportunity is granted.
On December 10, 2001, shareholders approved the 2001 EIP, which provides for the initial issuance of up to 30 million shares of either Class A or Class B common stock, with an additional 3% of the Company’s common stock outstanding as of the end of the prior calendar year becoming available under the plan on each January 1 following the adoption of the plan.
During fiscal 2005, 2.9 million options were granted, to purchase common stock under the 2001 EIP. The options vest ratably over four years, with an exercise price equal to the fair market value at the date of grant. Additionally, during fiscal 2005, the Company issued 0.2 million restricted stock units under the 2001 EIP. The restricted stock units vest ratably over four years
S-25
ARAMARK CORPORATION AND SUBSIDIARIES
NOTES TO CONSOLIDATED FINANCIAL STATEMENTS—(Continued)
and are settled by conversion into Class A or Class B common stock. Compensation expense related to the restricted stock units is recognized ratably over the vesting period based on the fair value of the shares at date of grant, and totaled $3.5 million during fiscal 2005. During fiscal 2005, employees, through stock option exercises, purchased approximately 5.1 million shares of common stock for $50.6 million, of which $15.3 million was satisfied through the exchange of previously-owned shares. Also, during fiscal 2005, approximately 11.4 million Class A shares were converted to Class B shares.
As of September 30, 2005, the Company has reserved approximately 52.7 million shares of common stock for issuance, pursuant to its employee ownership and benefit programs.
The status of options under the various ownership programs follows:
| Number of Shares | Average Option Price | ||||||||||||||
| 2003 | 2004 | 2005 | 2003 | 2004 | 2005 | ||||||||||
Outstanding at beginning of year | 27,210,417 | 21,601,151 | 16,057,824 | $ | 9.90 | $ | 13.54 | $ | 17.20 | ||||||
Options granted | 4,492,670 | 2,645,400 | 2,856,090 | $ | 22.36 | $ | 26.71 | $ | 23.68 | ||||||
Options exercised | 7,013,180 | 5,628,615 | 5,070,736 | $ | 5.84 | $ | 9.03 | $ | 9.97 | ||||||
Canceled/forfeited | 3,088,756 | 2,560,112 | 1,734,561 | $ | 11.80 | $ | 14.10 | $ | 20.00 | ||||||
Outstanding at end of year | 21,601,151 | 16,057,824 | 12,108,617 | $ | 13.54 | $ | 17.20 | $ | 21.35 | ||||||
Exercisable at end of year | 2,173,926 | 4,048,828 | 4,036,171 | $ | 15.08 | $ | 18.50 | $ | 22.31 | ||||||
At September 30, 2005, there were 12,108,617 options outstanding, of which 1,985,104 were granted prior to the IPO and 10,123,513 were granted post-IPO. The exercise prices of the pre-IPO options range from $8.25 to $9.95 per share (weighted average of $8.94 per share) with an average remaining contractual term of less than a year. The exercise prices of the post-IPO options range from $20.40 to $28.90 per share (weighted average of $23.79 per share) with an average remaining contractual term of 7.7 years.
During fiscal 2004, the Company paid cash dividends totaling $37.2 million ($0.05/share in each of the four quarters of fiscal 2004). During fiscal 2005, the Company paid cash dividends totaling $40.3 million ($0.055/share in each of the four quarters of fiscal 2005). At its November 15, 2005 meeting, the Board of Directors declared a dividend in the amount of $0.07 per share, payable on December 14, 2005 to holders of record of the Company’s Class A and Class B common stock at the close of business on November 25, 2005.
NOTE 9. ACCOUNTS RECEIVABLE SECURITIZATION:
The Company has an agreement (the Receivables Facility) with several financial institutions whereby it sells on a continuous basis an undivided interest in all eligible trade accounts receivable, as defined in the Receivables Facility. Pursuant to the Receivables Facility, the Company formed ARAMARK Receivables, LLC, a wholly-owned, consolidated, bankruptcy-remote subsidiary. ARAMARK Receivables, LLC was formed for the sole purpose of buying and selling receivables generated by certain subsidiaries of the Company. Under the Receivables Facility, certain subsidiaries of the Company transfer without recourse all of their accounts receivable to ARAMARK Receivables, LLC. ARAMARK Receivables, LLC, in turn, has sold and, subject to certain conditions, may from time to time sell an undivided interest in these receivables up to $225
S-26
ARAMARK CORPORATION AND SUBSIDIARIES
NOTES TO CONSOLIDATED FINANCIAL STATEMENTS—(Continued)
million. The Company amended the Receivables Facility during the first quarter of fiscal 2005 and increased the maximum sale amount from $200 million to $225 million. The Company has retained collection and administrative responsibility for the participating interest sold, and has retained an undivided interest in the transferred receivables of approximately $286.4 million and $291.9 million at October 1, 2004 and September 30, 2005, respectively, which is subject to a security interest. This two-step transaction is accounted for as a sale of receivables following the provisions of SFAS No. 140, “Accounting for Transfers and Servicing of Financial Assets and Extinguishments of Liabilities—a Replacement of FASB Statement No. 125.” At October 1, 2004 and September 30, 2005, respectively, $157.3 million and $189.8 million of accounts receivable were sold and removed from the consolidated balance sheet. The loss on the sale of receivables was $2.9 million and $6.8 million for fiscal 2004 and 2005, respectively, and is included in “Interest and Other Financing Costs, net.”
NOTE 10. COMMITMENTS AND CONTINGENCIES:
The Company has capital and other purchase commitments of approximately $189.4 million at September 30, 2005, primarily in connection with several long-term concession contracts, client contract commitments and commitments to increase our ownership in our Chilean and Irish subsidiaries. At September 30, 2005, the Company also has letters of credit outstanding in the amount of $134.8 million.
Certain of the Company’s operating lease arrangements, primarily vehicle leases, with terms of one to eight years, contain provisions related to residual value guarantees. The maximum potential liability to ARAMARK under such arrangements was approximately $72.0 million at September 30, 2005 if the terminal fair value of vehicles coming off lease was zero. Consistent with past experience, management does not expect any significant payments will be required pursuant to these arrangements. No amounts have been accrued for guarantee arrangements at September 30, 2005.
Rental expense for all operating leases was $146.7 million, $151.9 million and $150.6 million for fiscal 2003, 2004 and 2005, respectively. Following is a schedule of the future minimum rental and similar commitments under all noncancelable operating leases as of September 30, 2005 (in thousands):
Fiscal Year | |||
2006 | $ | 157,103 | |
2007 | 73,219 | ||
2008 | 59,896 | ||
2009 | 53,906 | ||
2010 | 44,751 | ||
Subsequent years | 187,295 | ||
Total minimum rental obligations | $ | 576,170 | |
The Company may be exposed to liability resulting from the non-performance of certain indemnification obligations by an entity currently in bankruptcy from which the Company acquired a business in fiscal 2000. The amount of such exposure cannot be quantified at the present time due to uncertainty with respect to the number and amount of claims, if any, originating from or relating to, the pre-acquisition period. The Company has $25 million of insurance coverage for such exposure with a $5 million retained loss limit.
S-27
ARAMARK CORPORATION AND SUBSIDIARIES
NOTES TO CONSOLIDATED FINANCIAL STATEMENTS—(Continued)
From time to time, we are a party to various legal actions involving claims incidental to the conduct of our business, including actions by clients, customers, employees and third parties, including under federal and state employment laws, wage and hour laws and customs, import and export control laws, environmental laws and dram shop laws. Based on information currently available, advice of counsel, available insurance coverage, established reserves and other resources, we do not believe that any such actions are likely to be, individually or in the aggregate, material to our business, financial condition, results of operations or cash flows. However, in the event of unexpected further developments, it is possible that the ultimate resolution of these matters, or other similar matters, if unfavorable, may be materially adverse to our business, financial condition, results of operations or cash flows.
On July 21, 2004, agents of the United States Department of Commerce, among others, executed a search warrant at the Lexington, Kentucky facilities of Galls, a division of the Company, to gather records in connection with record keeping and documentation of certain export sales. In the Fall of 2004, the Company also provided records in response to grand jury subpoenas. The investigation surrounds the possible failure to obtain proper export licenses or prepare accurate shipping declarations in connection with the export of Galls products. Galls is cooperating fully in the investigation. The Company can give no assurance as to the outcome of this investigation.
On January 18 and 19, 2005, a New Jersey jury found ARAMARK Corporation and certain affiliates liable for approximately $30 million in compensatory damages and $75 million in punitive damages in connection with an automobile accident caused by an intoxicated driver who attended a professional football game at which certain affiliates of the Company provided food and beverage service. The Company and its affiliates appealed the judgment to the Appellate Division of Superior Court of New Jersey on April 13, 2005. This process is likely to take considerable time. The Company believes that it has adequate insurance and other resources to address this matter. Based on the information currently available, and acknowledging the uncertainty of litigation, the September 30, 2005 consolidated balance sheet reflects the amount awarded and the related expected recovery should such liability be confirmed. Such amounts are included in “Other Noncurrent Liabilities” and “Other Assets,” respectively.
NOTE 11. QUARTERLY RESULTS (Unaudited):
The following table summarizes quarterly financial data for fiscal 2004 and 2005:
| Fiscal Quarter | |||||||||||||||
2004 | First | Second | Third | Fourth | Year | ||||||||||
| (in thousands, except per share data) | |||||||||||||||
Sales | $ | 2,458,857 | $ | 2,517,529 | $ | 2,594,924 | $ | 2,620,930 | $ | 10,192,240 | |||||
Cost of services provided | 2,221,504 | 2,303,392 | 2,356,471 | 2,342,421 | 9,223,788 | ||||||||||
Net income | 67,352 | 46,654 | 64,460 | 84,638 | 263,104 | ||||||||||
Diluted earnings per share | $ | 0.35 | $ | 0.24 | $ | 0.33 | $ | 0.44 | $ | 1.36 | |||||
S-28
ARAMARK CORPORATION AND SUBSIDIARIES
NOTES TO CONSOLIDATED FINANCIAL STATEMENTS—(Continued)
| Fiscal Quarter | |||||||||||||||
2005 | First | Second | Third | Fourth | Year | ||||||||||
| (in thousands, except per share data) | |||||||||||||||
Sales | $ | 2,730,233 | $ | 2,659,142 | $ | 2,792,366 | $ | 2,781,619 | $ | 10,963,360 | |||||
Cost of services provided | 2,474,763 | 2,429,619 | 2,533,272 | 2,488,145 | 9,925,799 | ||||||||||
Net income | 72,446 | 53,094 | 71,383 | 91,552 | 288,475 | ||||||||||
Diluted earnings per share | $ | 0.38 | $ | 0.28 | $ | 0.38 | $ | 0.49 | $ | 1.53 | |||||
In the first and second fiscal quarters, within the “Food and Support Services—United States” segment, historically there has been a lower level of activity at the higher margin sports, entertainment and recreational food service operations that is partly offset by increased activity in the educational operations. However, in the third and fourth fiscal quarters, historically there has been a significant increase at sports, entertainment and recreational accounts that is partially offset by the effect of summer recess on the educational accounts. In addition, there is a seasonal increase in volume of directly marketed work clothing during the first fiscal quarter.
NOTE 12. BUSINESS SEGMENTS:
The Company provides or manages services in two strategic areas: Food and Support Services and Uniform and Career Apparel, which are organized and managed in the following reportable business segments:
Food and Support Services—United States—Food, refreshment, specialized dietary and support services, including facility maintenance and housekeeping, provided to business, educational and healthcare institutions and in sports, entertainment, recreational and other facilities serving the general public. Included in the fourth quarter 2003 operating income is approximately $32 million of business interruption proceeds related to the September 11, 2001 terrorist attacks. The second quarter of 2003 also includes business interruption proceeds related to that claim of $6 million. Fiscal 2003 also includes approximately $6 million of costs related to the second quarter special manager meeting to launch our “Mission One” initiatives. Food and Support Services—United States operating income for fiscal 2005 includes a gain of approximately $9.7 million representing the Company’s share of the gain from a real estate sale by a 50%-owned equity affiliate.
The National Hockey League Collective Bargaining Agreement expired in September 2004 and the National Hockey League (“NHL”) and the NHL Players’ Association failed to agree on the terms of a new Collective Bargaining Agreement. On September 17, 2004, the owners of the NHL teams locked out the NHL players. As a result, the Food and Support Services—United States segment results for 2005 do not include operating results from NHL venues. In July 2005, the NHL and the NHL Players’ Association announced they have reached an agreement which will be effective for the 2005/2006 hockey season.
Food and Support Services—International—Food, refreshment, specialized dietary and support services, including facility maintenance and housekeeping, provided to business, educational and healthcare institutions and in sports, entertainment, recreational and other facilities serving the general public. Operations are conducted in 19 countries, including Belgium, Canada, Chile, China, the Czech Republic, Germany, Hungary, Ireland, Japan, Korea, Mexico, Spain and the United Kingdom. Food and Support Services—International operating income for fiscal 2005 includes a charge of approximately $7.4 million related to withdrawing from our offshore oil service business in West Africa and management separation costs in the UK.
S-29
ARAMARK CORPORATION AND SUBSIDIARIES
NOTES TO CONSOLIDATED FINANCIAL STATEMENTS—(Continued)
Uniform and Career Apparel—Rental—Rental, sale, cleaning, maintenance and delivery of personalized uniform and career apparel and other textile items on a contract basis. Also provided are walk-off mats, cleaning cloths, disposable towels and other environmental control items.
Uniform and Career Apparel—Direct Marketing—Direct marketing of personalized uniforms and career apparel, public safety equipment and accessories to businesses, public institutions and individuals.
Corporate—Corporate includes general corporate expenses not specifically allocated to an individual segment. Fiscal 2004 includes a $10.0 million charge for a management change.
Sales by segment are substantially comprised of services to unaffiliated customers and clients. Operating income reflects expenses directly related to individual segments plus an allocation of corporate expenses applicable to more than one segment.
Net property and equipment by geographic area is as follows:
| Fiscal | ||||||
| 2004 | 2005 | |||||
| (in millions) | ||||||
United States | $ | 1,091.6 | $ | 1,082.4 | ||
International | 122.8 | 129.1 | ||||
Total | $ | 1,214.4 | $ | 1,211.5 | ||
| Sales | |||||||||
| Fiscal | |||||||||
| 2003 | 2004 | 2005 | |||||||
| (in millions) | |||||||||
Food and Support Services—United States | $ | 6,542.1 | $ | 6,879.3 | $ | 7,129.1 | |||
Food and Support Services—International | 1,427.1 | 1,830.4 | 2,280.2 | ||||||
Uniform and Career Apparel—Rental | 1,030.3 | 1,042.5 | 1,125.8 | ||||||
Uniform and Career Apparel—Direct Marketing | 448.3 | 440.0 | 428.3 | ||||||
Total | $ | 9,447.8 | $ | 10,192.2 | $ | 10,963.4 | |||
| Depreciation and Amortization | |||||||||
| Fiscal | |||||||||
| 2003 | 2004 | 2005 | |||||||
| (in millions) | |||||||||
Food and Support Services—United States | $ | 170.0 | $ | 190.5 | $ | 194.5 | |||
Food and Support Services—International | 26.1 | 36.5 | 48.3 | ||||||
Uniform and Career Apparel—Rental | 53.8 | 58.5 | 68.5 | ||||||
Uniform and Career Apparel—Direct Marketing | 12.3 | 11.6 | 7.7 | ||||||
Corporate | 0.7 | 0.9 | 1.1 | ||||||
Total | $ | 262.9 | $ | 298.0 | $ | 320.1 | |||
S-30
ARAMARK CORPORATION AND SUBSIDIARIES
NOTES TO CONSOLIDATED FINANCIAL STATEMENTS—(Continued)
| Operating Income | ||||||||||||
| Fiscal | ||||||||||||
| 2003 | 2004 | 2005 | ||||||||||
| (in millions) | ||||||||||||
Food and Support Services—United States | $ | 393.3 | $ | 375.8 | $ | 403.1 | ||||||
Food and Support Services—International | 61.2 | 66.7 | 78.0 | |||||||||
Uniform and Career Apparel—Rental | 111.9 | 116.0 | 125.8 | |||||||||
Uniform and Career Apparel—Direct Marketing | 26.4 | 20.1 | 11.2 | |||||||||
| 592.8 | 578.6 | 618.1 | ||||||||||
Corporate | (30.1 | ) | (41.0 | ) | (37.9 | ) | ||||||
Other expense (Note 13) | (10.7 | ) | — | — | ||||||||
Operating income | 552.0 | 537.6 | 580.2 | |||||||||
Interest and other financing costs, net | (142.5 | ) | (122.4 | ) | (127.0 | ) | ||||||
Income before income taxes | $ | 409.5 | $ | 415.2 | $ | 453.2 | ||||||
| Capital Expenditures and Client Contract Investments * | Identifiable Assets | ||||||||||||||
| Fiscal | Fiscal | ||||||||||||||
| 2003 | 2004 | 2005 | 2004 | 2005 | |||||||||||
| (in millions) | (in millions) | ||||||||||||||
Food and Support Services—United States | $ | 213.4 | $ | 187.2 | $ | 172.3 | $ | 2,607.7 | $ | 2,513.4 | |||||
Food and Support Services—International | 37.5 | 57.4 | 65.0 | 834.4 | 1,002.8 | ||||||||||
Uniform and Career Apparel—Rental | 84.8 | 74.3 | 77.0 | 1,032.7 | 1,146.9 | ||||||||||
Uniform and Career Apparel—Direct Marketing | 4.3 | 5.3 | 6.1 | 278.9 | 280.6 | ||||||||||
Corporate | 0.3 | 0.4 | — | 67.9 | 213.4 | ||||||||||
| $ | 340.3 | $ | 324.6 | $ | 320.4 | $ | 4,821.6 | $ | 5,157.1 | ||||||
| * | Includes amounts acquired in business combinations. |
NOTE 13. OTHER EXPENSE:
During the fourth quarter of fiscal 2003, the Company reached agreement for the sale of its 15% interest in a periodicals distribution business to the majority shareholder, and wrote down this investment to the expected recoverable amount, resulting in a pre-tax charge of $10.7 million. This item has been presented as “Other expense” in the 2003 consolidated statement of income.
NOTE 14. CONDENSED CONSOLIDATING FINANCIAL STATEMENTS OF ARAMARK CORPORATION AND SUBSIDIARIES:
The following condensed consolidating financial statements of ARAMARK Corporation and subsidiaries have been prepared pursuant to Rule 3-10 of Regulation S-X.
These condensed consolidating financial statements have been prepared from the Company’s financial information on the same basis of accounting as the consolidated financial statements. ARAMARK Services, Inc. is the borrower under the Credit Agreement and certain other senior debt, described in Note 5, and incurs interest expense thereunder. The interest expense and certain administrative costs are only partially allocated to all of the other subsidiaries of the Company. The Company has fully and unconditionally guaranteed certain debt obligations of
S-31
ARAMARK CORPORATION AND SUBSIDIARIES
NOTES TO CONSOLIDATED FINANCIAL STATEMENTS—(Continued)
ARAMARK Services, Inc., its wholly-owned subsidiary, which totaled $1.8 billion as of September 30, 2005. The other subsidiaries do not guarantee any registered securities of the Company or ARAMARK Services, Inc., although certain other subsidiaries guarantee, along with the Company, certain other unregistered debt.
S-32
ARAMARK CORPORATION AND SUBSIDIARIES
NOTES TO CONSOLIDATED FINANCIAL STATEMENTS—(Continued)
CONDENSED CONSOLIDATING BALANCE SHEETS
October 1, 2004
(In Millions)
| ARAMARK Services, Inc. and Subsidiaries | Other Subsidiaries | ARAMARK Corporation | Eliminations | Consolidated | ||||||||||||
| ASSETS | ||||||||||||||||
Current Assets: | ||||||||||||||||
Cash and cash equivalents | $ | 33.8 | $ | 11.4 | $ | 0.1 | $ | — | $ | 45.3 | ||||||
Receivables | 557.1 | 202.6 | 0.1 | — | 759.8 | |||||||||||
Inventories, at lower of cost or market | 125.0 | 346.8 | — | — | 471.8 | |||||||||||
Prepayments and other current assets | 53.0 | 7.9 | 2.2 | — | 63.1 | |||||||||||
Total current assets | 768.9 | 568.7 | 2.4 | — | 1,340.0 | |||||||||||
Property and Equipment, net | 450.1 | 762.1 | 2.2 | — | 1,214.4 | |||||||||||
Goodwill | 1,099.3 | 489.9 | — | — | 1,589.2 | |||||||||||
Intercompany Receivables | 1,585.1 | 765.8 | — | (2,350.9 | ) | — | ||||||||||
Investment in Subsidiaries | — | — | 2,792.0 | (2,792.0 | ) | — | ||||||||||
Other Intangible Assets | 224.2 | 47.1 | — | — | 271.3 | |||||||||||
Other Assets | 298.3 | 105.9 | 2.5 | — | 406.7 | |||||||||||
| $ | 4,425.9 | $ | 2,739.5 | $ | 2,799.1 | $ | (5,142.9 | ) | $ | 4,821.6 | ||||||
| LIABILITIES AND SHAREHOLDERS’ EQUITY | ||||||||||||||||
Current Liabilities: | ||||||||||||||||
Current maturities of long-term borrowings | $ | 17.9 | $ | 7.6 | $ | $ | — | $ | 25.5 | |||||||
Accounts payable | 439.7 | 103.1 | 23.7 | — | 566.5 | |||||||||||
Accrued expenses and other liabilities | 624.5 | 226.0 | 12.4 | — | 862.9 | |||||||||||
Total current liabilities | 1,082.1 | 336.7 | 36.1 | — | 1,454.9 | |||||||||||
Long-Term Borrowings | 1,823.9 | 19.3 | — | — | 1,843.2 | |||||||||||
Deferred Income Taxes and Other Noncurrent Liabilities | 228.4 | 117.2 | 28.2 | — | 373.8 | |||||||||||
Intercompany Payable | 446.5 | 319.3 | 1,585.1 | (2,350.9 | ) | — | ||||||||||
Shareholders’ Equity | 845.0 | 1,947.0 | 1,149.7 | (2,792.0 | ) | 1,149.7 | ||||||||||
| $ | 4,425.9 | $ | 2,739.5 | $ | 2,799.1 | $ | (5,142.9 | ) | $ | 4,821.6 | ||||||
S-33
ARAMARK CORPORATION AND SUBSIDIARIES
NOTES TO CONSOLIDATED FINANCIAL STATEMENTS—(Continued)
CONDENSED CONSOLIDATING BALANCE SHEETS
September 30, 2005
(In Millions)
| ARAMARK Services, Inc. and Subsidiaries | Other Subsidiaries | ARAMARK Corporation | Eliminations | Consolidated | |||||||||||||
| ASSETS | |||||||||||||||||
Current Assets: | |||||||||||||||||
Cash and cash equivalents | $ | 46.9 | $ | 9.2 | $ | — | $ | — | $ | 56.1 | |||||||
Receivables | 590.5 | 218.0 | — | — | 808.5 | ||||||||||||
Inventories, at lower of cost or market | 130.4 | 355.4 | — | — | 485.8 | ||||||||||||
Prepayments and other current assets | 60.9 | 31.3 | 0.6 | — | 92.8 | ||||||||||||
Total current assets | 828.7 | 613.9 | 0.6 | — | 1,443.2 | ||||||||||||
Property and Equipment, net | 437.1 | 772.3 | 2.1 | — | 1,211.5 | ||||||||||||
Goodwill | 1,148.7 | 534.0 | — | — | 1,682.7 | ||||||||||||
Intercompany Receivables | 1,733.4 | — | — | (1,733.4 | ) | — | |||||||||||
Investment in Subsidiaries | — | — | 3,095.9 | (3,095.9 | ) | — | |||||||||||
Other Intangible Assets | 220.4 | 54.2 | — | — | 274.6 | ||||||||||||
Other Assets | 323.3 | 219.3 | 2.5 | — | 545.1 | ||||||||||||
| $ | 4,691.6 | $ | 2,193.7 | $ | 3,101.1 | $ | (4,829.3 | ) | $ | 5,157.1 | |||||||
| LIABILITIES AND SHAREHOLDERS’ EQUITY | |||||||||||||||||
Current Liabilities: | |||||||||||||||||
Current maturities of long-term borrowings | $ | 34.9 | $ | 11.5 | $ | — | $ | — | $ | 46.4 | |||||||
Accounts payable | 480.6 | 98.4 | 6.0 | — | 585.0 | ||||||||||||
Accrued expenses and other liabilities | 633.5 | 242.0 | 11.8 | — | 887.3 | ||||||||||||
Total current liabilities | 1,149.0 | 351.9 | 17.8 | — | 1,518.7 | ||||||||||||
Long-Term Borrowings | 1,769.8 | 24.7 | — | — | 1,794.5 | ||||||||||||
Deferred Income Taxes and Other Noncurrent Liabilities | 257.5 | 236.5 | 24.4 | — | 518.4 | ||||||||||||
Intercompany Payable | 483.2 | (483.2 | ) | 1,733.4 | (1,733.4 | ) | — | ||||||||||
Shareholders’ Equity | 1,032.1 | 2,063.8 | 1,325.5 | (3,095.9 | ) | 1,325.5 | |||||||||||
| $ | 4,691.6 | $ | 2,193.7 | $ | 3,101.1 | $ | (4,829.3 | ) | $ | 5,157.1 | |||||||
S-34
ARAMARK CORPORATION AND SUBSIDIARIES
NOTES TO CONSOLIDATED FINANCIAL STATEMENTS—(Continued)
CONDENSED CONSOLIDATING STATEMENTS OF INCOME
For the year ended October 3, 2003
(In Millions)
| ARAMARK Services, Inc. and Subsidiaries | Other Subsidiaries | ARAMARK Corporation | Eliminations | Consolidated | |||||||||||||
Sales | $ | 6,731.2 | $ | 2,716.6 | $ | — | $ | — | $ | 9,447.8 | |||||||
Equity in Net Income of Subsidiaries | — | — | 301.1 | (301.1 | ) | — | |||||||||||
Management Fee Income | — | — | 31.0 | (31.0 | ) | — | |||||||||||
| 6,731.2 | 2,716.6 | 332.1 | (332.1 | ) | 9,447.8 | ||||||||||||
Costs and Expenses: | |||||||||||||||||
Cost of services provided | 6,287.8 | 2,249.2 | — | (30.5 | ) | 8,506.5 | |||||||||||
Depreciation and amortization | 149.6 | 113.0 | — | 0.3 | 262.9 | ||||||||||||
Selling and general corporate expenses | 55.0 | 30.5 | 30.1 | 0.1 | 115.7 | ||||||||||||
Other income, net | — | 10.7 | — | — | 10.7 | ||||||||||||
| 6,492.4 | 2,403.4 | 30.1 | (30.1 | ) | 8,895.8 | ||||||||||||
Operating income | 238.8 | 313.2 | 302.0 | (302.0 | ) | 552.0 | |||||||||||
Interest and Other Financing Costs, net: | |||||||||||||||||
Interest expense, net | 140.5 | 1.0 | 0.9 | — | 142.4 | ||||||||||||
Intercompany interest, net | (39.4 | ) | 40.3 | — | (0.9 | ) | — | ||||||||||
Interest and Other Financing Costs, net | 101.1 | 41.3 | 0.9 | (0.9 | ) | 142.4 | |||||||||||
Income from continuing operations before income taxes | 137.7 | 271.9 | 301.1 | (301.1 | ) | 409.6 | |||||||||||
Provision for Income Taxes | 51.6 | 92.6 | — | — | 144.2 | ||||||||||||
Income from continuing operations | 86.1 | 179.3 | 301.1 | (301.1 | ) | 265.4 | |||||||||||
Income from discontinued operations, net | — | 35.7 | — | — | 35.7 | ||||||||||||
Net income | $ | 86.1 | $ | 215.0 | $ | 301.1 | $ | (301.1 | ) | $ | 301.1 | ||||||
S-35
ARAMARK CORPORATION AND SUBSIDIARIES
NOTES TO CONSOLIDATED FINANCIAL STATEMENTS—(Continued)
CONDENSED CONSOLIDATING STATEMENTS OF INCOME
For the year ended October 1, 2004
(In Millions)
| ARAMARK Services, Inc. and Subsidiaries | Other Subsidiaries | ARAMARK Corporation | Eliminations | Consolidated | |||||||||||||
Sales | $ | 7,406.9 | $ | 2,785.3 | $ | — | $ | — | $ | 10,192.2 | |||||||
Equity in Net Income of Subsidiaries | — | — | 263.1 | (263.1 | ) | — | |||||||||||
Management Fee Income | — | — | 38.9 | (38.9 | ) | — | |||||||||||
| 7,406.9 | 2,785.3 | 302.0 | (302.0 | ) | 10,192.2 | ||||||||||||
Costs and Expenses: | |||||||||||||||||
Cost of services provided | 6,927.6 | 2,336.1 | — | (40.0 | ) | 9,223.7 | |||||||||||
Depreciation and amortization | 178.0 | 119.8 | — | 0.2 | 298.0 | ||||||||||||
Selling and general corporate expenses | 60.1 | 33.0 | 38.8 | 1.0 | 132.9 | ||||||||||||
| 7,165.7 | 2,488.9 | 38.8 | (38.8 | ) | 9,654.6 | ||||||||||||
Operating income | 241.2 | 296.4 | 263.2 | (263.2 | ) | 537.6 | |||||||||||
Interest and Other Financing Costs, net | |||||||||||||||||
Interest expense, net | 121.1 | 1.2 | 0.1 | — | 122.4 | ||||||||||||
Intercompany interest, net | (22.6 | ) | 22.7 | — | (0.1 | ) | — | ||||||||||
Interest and Other Financing Costs, net | 98.5 | 23.9 | 0.1 | (0.1 | ) | 122.4 | |||||||||||
Income before income taxes | 142.7 | 272.5 | 263.1 | (263.1 | ) | 415.2 | |||||||||||
Provision for Income Taxes | 48.6 | 103.5 | — | — | 152.1 | ||||||||||||
Net income | $ | 94.1 | $ | 169.0 | $ | 263.1 | $ | (263.1 | ) | $ | 263.1 | ||||||
S-36
ARAMARK CORPORATION AND SUBSIDIARIES
NOTES TO CONSOLIDATED FINANCIAL STATEMENTS—(Continued)
CONDENSED CONSOLIDATING STATEMENTS OF INCOME
For the year ended September 30, 2005
(In Millions)
| ARAMARK Services, Inc. and Subsidiaries | Other Subsidiaries | ARAMARK Corporation | Eliminations | Consolidated | |||||||||||||
Sales | $ | 8,170.2 | $ | 2,793.2 | $ | — | $ | — | $ | 10,963.4 | |||||||
Equity in Net Income of Subsidiaries | — | — | 288.5 | (288.5 | ) | — | |||||||||||
Management Fee Income | — | — | 37.4 | (37.4 | ) | — | |||||||||||
| 8,170.2 | 2,793.2 | 325.9 | (325.9 | ) | 10,963.4 | ||||||||||||
Costs and Expenses: | |||||||||||||||||
Cost of services provided | 7,651.6 | 2,308.5 | — | (34.3 | ) | 9,925.8 | |||||||||||
Depreciation and amortization | 192.4 | 127.6 | — | 0.1 | 320.1 | ||||||||||||
Selling and general corporate expenses | 64.9 | 38.2 | 37.1 | (2.9 | ) | 137.3 | |||||||||||
| 7,908.9 | 2,474.3 | 37.1 | (37.1 | ) | 10,383.2 | ||||||||||||
Operating income | 261.3 | 318.9 | 288.8 | (288.8 | ) | 580.2 | |||||||||||
Interest and Other Financing Costs, net: | |||||||||||||||||
Interest expense, net | 125.4 | 1.3 | 0.3 | — | 127.0 | ||||||||||||
Intercompany interest, net | (59.9 | ) | 60.2 | — | (0.3 | ) | — | ||||||||||
Interest and Other Financing Costs, net | 65.5 | 61.5 | 0.3 | (0.3 | ) | 127.0 | |||||||||||
Income before income taxes | 195.8 | 257.4 | 288.5 | (288.5 | ) | 453.2 | |||||||||||
Provision for Income Taxes | 71.1 | 93.6 | — | — | 164.7 | ||||||||||||
Net income | $ | 124.7 | $ | 163.8 | $ | 288.5 | $ | (288.5 | ) | $ | 288.5 | ||||||
S-37
ARAMARK CORPORATION AND SUBSIDIARIES
NOTES TO CONSOLIDATED FINANCIAL STATEMENTS—(Continued)
CONDENSED CONSOLIDATING STATEMENTS OF CASH FLOWS
For the year ended October 3, 2003
(In Millions)
| ARAMARK Services, Inc. and Subsidiaries | Other Subsidiaries | ARAMARK Corporation | Eliminations | Consolidated | |||||||||||||||
Net cash provided by (used in) operating activities from continuing operations | $ | 281.1 | $ | 347.5 | $ | (22.4 | ) | $ | — | $ | 606.2 | ||||||||
Cash flows from investing activities from continuing operations: | |||||||||||||||||||
Purchases of property and equipment and client contract investments | (169.6 | ) | (128.8 | ) | (0.2 | ) | — | (298.6 | ) | ||||||||||
Disposals of property and equipment | 19.5 | 8.7 | — | — | 28.2 | ||||||||||||||
Divestiture of businesses | — | 248.1 | — | — | 248.1 | ||||||||||||||
Acquisition of businesses, net of cash acquired | (226.6 | ) | (31.5 | ) | — | — | (258.1 | ) | |||||||||||
Other investing activities | 6.6 | 4.6 | — | — | 11.2 | ||||||||||||||
Net cash provided by (used in) investing activities from continuing operations | (370.1 | ) | 101.1 | (0.2 | ) | — | (269.2 | ) | |||||||||||
Cash flows from financing activities from continuing operations: | |||||||||||||||||||
Proceeds from additional long-term borrowings | 129.7 | (16.5 | ) | — | — | 113.2 | |||||||||||||
Payment of long-term borrowings | (275.2 | ) | 11.4 | — | — | (263.8 | ) | ||||||||||||
Proceeds from issuance of common stock | — | — | 21.3 | — | 21.3 | ||||||||||||||
Repurchase of stock | — | — | (212.5 | ) | — | (212.5 | ) | ||||||||||||
Other financing activities | (0.8 | ) | — | 3.8 | — | 3.0 | |||||||||||||
Change in intercompany, net | 256.7 | (466.6 | ) | 209.9 | — | — | |||||||||||||
Net cash provided by (used in) financing activities from continuing operations | 110.4 | (471.7 | ) | 22.5 | — | (338.8 | ) | ||||||||||||
Net cash provided by discontinued operations | — | 14.7 | — | — | 14.7 | ||||||||||||||
Increase (decrease) in cash and cash equivalents | 21.4 | (8.4 | ) | (0.1 | ) | — | 12.9 | ||||||||||||
Cash and cash equivalents, beginning of period | 19.1 | 12.3 | 0.2 | — | 31.6 | ||||||||||||||
Cash and cash equivalents, end of period | $ | 40.5 | $ | 3.9 | $ | 0.1 | $ | — | $ | 44.5 | |||||||||
S-38
ARAMARK CORPORATION AND SUBSIDIARIES
NOTES TO CONSOLIDATED FINANCIAL STATEMENTS—(Continued)
CONDENSED CONSOLIDATING STATEMENTS OF CASH FLOWS
For the year ended October 1, 2004
(In Millions)
| ARAMARK Services, Inc. and Subsidiaries | Other Subsidiaries | ARAMARK Corporation | Eliminations | Consolidated | |||||||||||||||
Net cash provided by operating activities | $ | 248.8 | $ | 259.3 | $ | 9.4 | $ | — | $ | 517.5 | |||||||||
Cash flows from investing activities: | |||||||||||||||||||
Purchases of property and equipment and client contract investments | (184.2 | ) | (124.5 | ) | — | — | (308.7 | ) | |||||||||||
Disposals of property and equipment | 14.0 | 6.5 | — | — | 20.5 | ||||||||||||||
Proceeds from sale of investment | — | 8.5 | — | — | 8.5 | ||||||||||||||
Acquisitions of businesses, net of cash acquired | (132.9 | ) | (24.1 | ) | — | — | (157.0 | ) | |||||||||||
Other investing activities | (7.1 | ) | 4.4 | — | — | (2.7 | ) | ||||||||||||
Net cash used in investing activities | (310.2 | ) | (129.2 | ) | — | — | (439.4 | ) | |||||||||||
Cash flows from financing activities: | |||||||||||||||||||
Proceeds from additional long-term borrowings | 441.1 | — | — | — | 441.1 | ||||||||||||||
Payment of long-term borrowings | (336.2 | ) | (7.1 | ) | — | — | (343.3 | ) | |||||||||||
Proceeds from issuance of common stock | — | — | 39.7 | — | 39.7 | ||||||||||||||
Repurchase of stock | — | — | (184.1 | ) | — | (184.1 | ) | ||||||||||||
Payment of dividends | — | — | (37.2 | ) | — | (37.2 | ) | ||||||||||||
Other financing activities | 5.4 | — | 1.1 | — | 6.5 | ||||||||||||||
Change in intercompany, net | (55.6 | ) | (115.5 | ) | 171.1 | — | — | ||||||||||||
Net cash provided by (used in) financing activities | 54.7 | (122.6 | ) | (9.4 | ) | — | (77.3 | ) | |||||||||||
Increase (decrease) in cash and cash equivalents | (6.7 | ) | 7.5 | — | — | 0.8 | |||||||||||||
Cash and cash equivalents, beginning of period | 40.5 | 3.9 | 0.1 | — | 44.5 | ||||||||||||||
Cash and cash equivalents, end of period | $ | 33.8 | $ | 11.4 | $ | 0.1 | $ | — | $ | 45.3 | |||||||||
S-39
ARAMARK CORPORATION AND SUBSIDIARIES
NOTES TO CONSOLIDATED FINANCIAL STATEMENTS—(Continued)
CONDENSED CONSOLIDATING STATEMENTS OF CASH FLOWS
For the year ended September 30, 2005
(In Millions)
| ARAMARK Services, Inc. and Subsidiaries | Other Subsidiaries | ARAMARK Corporation | Eliminations | Consolidated | |||||||||||||||
Net cash provided by operating activities | $ | 347.7 | $ | 246.1 | $ | 18.0 | $ | — | $ | 611.8 | |||||||||
Cash flows from investing activities: | |||||||||||||||||||
Purchases of property and equipment and client contract investments | (198.3 | ) | (117.1 | ) | (0.2 | ) | — | (315.6 | ) | ||||||||||
Disposals of property and equipment | 15.7 | 5.9 | — | — | 21.6 | ||||||||||||||
Proceeds from sales and divestitures | 11.5 | — | — | — | 11.5 | ||||||||||||||
Acquisitions of businesses, net of cash acquired | (63.4 | ) | (56.9 | ) | — | — | (120.3 | ) | |||||||||||
Other investing activities | 23.5 | 13.4 | — | — | 36.9 | ||||||||||||||
Net cash used in investing activities | (211.0 | ) | (154.7 | ) | (0.2 | ) | — | (365.9 | ) | ||||||||||
Cash flows from financing activities: | |||||||||||||||||||
Proceeds from additional long-term borrowings | 361.4 | — | — | — | 361.4 | ||||||||||||||
Payment of long-term borrowings | (385.1 | ) | (8.5 | ) | — | — | (393.6 | ) | |||||||||||
Proceeds from issuance of common stock | — | — | 35.7 | — | 35.7 | ||||||||||||||
Repurchase of stock | — | — | (187.6 | ) | — | (187.6 | ) | ||||||||||||
Payment of dividends | — | — | (40.3 | ) | — | (40.3 | ) | ||||||||||||
Other financing activities | (11.9 | ) | — | 1.2 | — | (10.7 | ) | ||||||||||||
Change in intercompany, net | (88.0 | ) | (85.1 | ) | 173.1 | — | — | ||||||||||||
Net cash used in financing activities | (123.6 | ) | (93.6 | ) | (17.9 | ) | — | (235.1 | ) | ||||||||||
Increase (decrease) in cash and cash equivalents | 13.1 | (2.2 | ) | (0.1 | ) | — | 10.8 | ||||||||||||
Cash and cash equivalents, beginning of period | 33.8 | 11.4 | 0.1 | — | 45.3 | ||||||||||||||
Cash and cash equivalents, end of period | $ | 46.9 | $ | 9.2 | $ | — | $ | — | $ | 56.1 | |||||||||
S-40
ARAMARK CORPORATION AND SUBSIDIARIES
SCHEDULE II—VALUATION AND QUALIFYING ACCOUNTS AND RESERVES
For the Fiscal Years Ended October 3, 2003, October 1, 2004 and September 30, 2005
| Additions | Reductions | |||||||||||||||||
| Balance, Beginning of Fiscal Year | Acquisition of Businesses | Charged to Income | Divestiture of Businesses | Deductions from Reserves(1) | Balance, End of Fiscal Year | |||||||||||||
| (in thousands) | ||||||||||||||||||
Description | ||||||||||||||||||
Fiscal Year 2003 | ||||||||||||||||||
Reserve for doubtful accounts, advances & current notes receivable | $ | 30,639 | $ | 1,143 | $ | 17,475 | $ | — | $ | 19,560 | $ | 29,697 | ||||||
Fiscal Year 2004 | ||||||||||||||||||
Reserve for doubtful accounts, advances & current notes receivable | $ | 29,697 | $ | 1,750 | $ | 10,202 | $ | — | $ | 8,804 | $ | 32,845 | ||||||
Fiscal Year 2005 | ||||||||||||||||||
Reserve for doubtful accounts, advances & current notes receivable | $ | 32,845 | $ | 862 | $ | 20,303 | $ | — | $ | 11,365 | $ | 42,645 | ||||||
| (1) | Allowances granted and amounts determined not to be collectible. |
S-41
EXHIBIT INDEX
Copies of any of the following exhibits are available to Stockholders for the cost of reproduction upon written request from the Secretary, ARAMARK Corporation, 1101 Market Street, Philadelphia, PA 19107.
| 2 | Agreement and Plan of Merger dated as of November 14, 2001 between ARAMARK Corporation and ARAMARK Worldwide Corporation (incorporated by reference to Annex A to ARAMARK Corporation’s Registration Statement on Form S-4 filed with the Commission on November 15, 2001, pursuant to the Securities Act (Registration No. 333-65228)). | |
| 3.1 | Amended and Restated Certificate of Incorporation of ARAMARK Corporation (incorporated by reference to Exhibit 3.1 to ARAMARK Corporation’s Quarterly Report on Form 10-Q filed with the Commission on August 11, 2003, pursuant to the Exchange Act (File No. 001-16807)). | |
| Certificate of Designations for Series C Junior Participating Preferred Stock (incorporated by reference to Exhibit 3.1 to ARAMARK Corporation’s Quarterly Report on Form 10-Q filed with the Commission on February 9, 2005, pursuant to the Exchange Act (File No. 001-16807)). | ||
| 3.2 | Bylaws of ARAMARK Corporation (incorporated by reference to Exhibit 99.2 to ARAMARK Corporation’s Current Report on Form 8-K filed with the Commission on September 22, 2004, pursuant to the Exchange Act (File No. 001-16807)). | |
| 4.1 | Form of stock certificate for Class B common stock (incorporated by reference to Exhibit 4.8 to ARAMARK Corporation’s Registration Statement on Form S-1 filed with the Commission on October 9, 2001, pursuant to the Securities Act (Registration No. 333-65226)). | |
| 4.2 | Form of stock certificate for Class A-1, Class A-2, Class A-3, Class B-1, Class B-2 and Class B-3 common stock (incorporated by reference to Exhibit 4.9 to ARAMARK Corporation’s Registration Statement on Form S-1 filed with the Commission on October 9, 2001, pursuant to the Securities Act (Registration No. 333-65226)). | |
| 4.3 | Form of Rights Agreement (incorporated by reference to Exhibit 4.4 to ARAMARK Corporation’s Registration Statement on Form S-1 filed with the Commission on November 1, 2001, pursuant to the Securities Act (Registration No. 333-65226)). | |
| 4.4 | Form of Registration Rights Agreement among ARAMARK Worldwide Corporation (now ARAMARK Corporation) and Joseph Neubauer and each of the other holders listed on Schedule 1 thereto (incorporated by reference to Exhibit 4.13 to ARAMARK Corporation’s Registration Statement on Form S-1 filed with the Commission on September 6, 2001, pursuant to the Securities Act (Registration No. 333-65226)). | |
| 4.5 | Form of 1991 Subordinated Indenture, between ARAMARK Corporation and The Bank of New York, as trustee, relating to the subordinated securities (incorporated by reference to Exhibit (4)(a) to ARAMARK Corporation’s Registration Statement on Form S-3 filed with the SEC on June 21, 1991, pursuant to the Securities Act (Registration No. 33-41357)). | |
| 4.6 | Form of 1991 Guaranteed Indenture, among ARAMARK Services, Inc., ARAMARK Corporation, as guarantor, and The Bank of New York, as trustee, relating to the guaranteed securities (incorporated by reference to Exhibit (4)(b) to ARAMARK Corporation’s Registration Statement on Form S-3 filed with the SEC on June 21, 1991, pursuant to the Securities Act (Registration No. 33-41357)). | |
1
| 4.7 | Form of Debt Indenture, between ARAMARK Corporation and Bank One Trust Company, National Association, as trustee (incorporated by reference to Exhibit 4.3 to ARAMARK Corporation’s Registration Statement on Form S-3 filed with the SEC on March 27, 2002, pursuant to the Securities Act (Registration No. 33-85050)). | |
| 4.8 | Form of Guaranteed Indenture, among ARAMARK Services, Inc., ARAMARK Corporation, as guarantor, and Bank One Trust Company, National Association, as trustee (incorporated by reference to Exhibit 4.4 to ARAMARK Corporation’s Registration Statement on Form S-3 filed with the SEC on March 27, 2002, pursuant to the Securities Act (Registration No. 33-85050)). | |
| Long-term debt instruments authorizing debt that does not exceed 10% of the total consolidated assets of ARAMARK are not filed herewith but will be furnished on request of the Commission. | ||
| 10.1 | Employment Agreement dated October 27, 2003 between ARAMARK Corporation and Joseph Neubauer (incorporated by reference to Exhibit 10.27 to ARAMARK Corporation’s Annual Report on Form 10-K filed with the SEC on December 19, 2003, pursuant to the Exchange Act (File No. 001-16807)). ** | |
| 10.2 | Employment Agreement dated November 2, 2004 between ARAMARK Corporation and Joseph Neubauer (incorporated by reference to exhibit 10.1 to the Company’s Current Report on Form 8-K/A filed with the SEC on November 8, 2004, pursuant to the Exchange Act (file number 001-16807)).** | |
| 10.3 | Form of Agreement Relating to Employment and Post-Employment Competition with L. Frederick Sutherland (incorporated by reference to Exhibit 10.3 to ARAMARK Corporation’s Registration Statement on Form S-1 filed with the Commission on December 4, 2001, pursuant to the Securities Act (Registration No. 333-65226)).** | |
| 10.4 | Form of Agreement Relating to Employment and Post-Employment Competition with Bart J. Colli (incorporated by reference to Exhibit 10.13 to ARAMARK Corporation’s Registration Statement on Form S-1 filed with the Commission on December 7, 2001, pursuant to the Securities Act (Registration No. 333-65226)).** | |
| 10.5 | Agreement Relating to Employment and Post-Employment Competition with Timothy P. Cost (incorporated by reference to Exhibit 10.2 to ARAMARK Corporation’s Quarterly Report on Form 10-Q filed with the SEC on August 11, 2003, pursuant to the Exchange Act (File No. 001-16807)).** | |
| 10.6 | Agreement Relating to Employment and Post Employment Competition with Lynn B. McKee dated May 5, 2004 (incorporated by reference to Exhibit 10.2 to ARAMARK Corporation’s Quarterly Report on Form 10-Q filed with the SEC on August 13, 2004, pursuant to the Exchange Act (File No. 001-16807)). ** | |
| 10.7 | Agreement Relating to Employment and Post-Employment Competition dated November 10, 2004 between ARAMARK Corporation and John R. Donovan, Jr. (incorporated by reference to exhibit 10.1 to ARAMARK Corporation’s Current Report on Form 8-K filed with the SEC on November 12, 2004, pursuant to the Exchange Act (file number 001-16807)).** | |
| 10.8 | Agreement Relating to Employment and Post-Employment Competition dated November 10, 2004 between ARAMARK Corporation and Andrew Kerin (incorporated by reference to exhibit 10.2 to ARAMARK Corporation’s Current Report on Form 8-K filed with the SEC on November 12, 2004, pursuant to the Exchange Act (file number 001-16807)).** | |
2
| 10.9 | Agreement Relating to Employment and Post-Employment Competition dated November 10, 2004 between ARAMARK Corporation and Ravi Saligram (incorporated by reference to exhibit 10.3 to ARAMARK Corporation’s Current Report on Form 8-K filed with the SEC on November 12, 2004, pursuant to the Exchange Act (file number 001-16807)).** | |
| 10.10 | Agreement Relating to Employment and Post-Employment Competition dated November 10, 2004 between ARAMARK Corporation and Thomas Vozzo (incorporated by reference to exhibit 10.4 to ARAMARK Corporation’s Current Report on Form 8-K filed with the SEC on November 12, 2004, pursuant to the Exchange Act (file number 001-16807)).** | |
| 10.11 | Agreement Relating to Employment and Post-Employment Competition dated November 26, 2001 between ARAMARK Corporation and John M. Lafferty (incorporated by reference to exhibit 10.13 to ARAMARK Corporation’s Annual Report on Form 10-K filed with the SEC on December 10, 2004, pursuant to the Exchange Act (file number 001-16807)).** | |
| 10.12 | Agreement Relating to Employment and Post-Employment Competition dated November 12, 2003 between ARAMARK Corporation and Christopher Holland (incorporated by reference to exhibit 10.14 to ARAMARK Corporation’s Annual Report on Form 10-K filed with the SEC on December 10, 2004, pursuant to the Exchange Act (file number 001-16807)).** | |
| 10.13 | Credit Agreement Among ARAMARK Services, Inc., ARAMARK Uniform & Career Apparel Group, Inc. and ARAMARK Canada Ltd, ARAMARK Corporation, as Guarantor, the Lenders, J.P. Morgan Chase Bank, N.A., as General Administrative Agent and J.P. Morgan Chase Bank, N.A., Toronto Branch, as Canadian Administrative Agent, dated as of March 31, 2004 (incorporated by reference to Exhibit 10.1 to ARAMARK Corporation’s Quarterly Report on Form 10-Q filed with the SEC on May 17, 2004, pursuant to the Exchange Act (File No. 001-16807)). | |
| 10.14 | Amendment No. 1 to the Credit Agreement dated as of November 18, 2005 (incorporated by reference to Exhibit 10.1 to ARAMARK Corporation’s Current Report on Form 8-K filed with the SEC on November 25, 2005, pursuant to the Exchange Act (File No. 001-16807). | |
| 10.15 | £150,000,000 Credit Facility for ARAMARK Ireland Holdings Limited dated June 21, 2004 (incorporated by reference to Exhibit 10.1 to ARAMARK Corporation’s Quarterly Report on Form 10-Q filed with the SEC on August 13, 2004, pursuant to the Exchange Act (File No. 001-16807)). | |
| 10.16 | Accession Agreement dated September 22, 2004 from ARAMARK Ireland Holdings Limited, ARAMARK GmbH & Co. KG and ARAMARK GmbH to Barclay’s Bank PLC, as facility agent. (incorporated by reference to exhibit 10.17 to ARAMARK Corporation’s Annual Report on Form 10-K filed with the SEC on December 10, 2004, pursuant to the Exchange Act (file number 001-16807)). | |
| 10.17 | First Amendment to £150,000,000 Credit Facility for ARAMARK Ireland Holdings Limited dated September 22, 2004. (incorporated by reference to exhibit 10.18 to ARAMARK Corporation’s Annual Report on Form 10-K filed with the SEC on December 10, 2004, pursuant to the Exchange Act (file number 001-16807)). | |
| 10.18 | Amendment Agreement dated December 14, 2004 between ARAMARK Ireland Holdings Limited and Barclays Bank PLC (incorporated by reference to exhibit 10.1 to ARAMARK Corporation’s Current Report on Form 8-K filed with the SEC on January 10, 2005, pursuant to the Exchange Act (file number 001-16807)). | |
3
| 10.19 | Master Distribution Agreement dated as of February 1, 2002, between SYSCO Corporation and ARAMARK Food and Support Services Group, Inc. (incorporated by reference to Exhibit 10.1 to ARAMARK Corporation’s Quarterly Report on Form 10-Q filed with the SEC on August 12, 2002, pursuant to the Exchange Act (File No. 001-16807)). † | |
| 10.20 | Purchase Agreement between The ServiceMaster Company and ARAMARK Corporation, dated as of October 3, 2001, (incorporated by reference to Exhibit 10.11 to ARAMARK Corporation’s Registration Statement on Form S-1 filed with the Commission on November 1, 2001, pursuant to the Securities Act (Registration No. 333-65226)). | |
| 10.21 | Stock Purchase Agreement dated March 3, 2003 among Knowledge Schools, Inc., Children’s Discovery Centers of America, Inc. (to be renamed Knowledge Learning Corporation), ARAMARK Corporation, ARAMARK Organizational Services, Inc. and ARAMARK Educational Resources, Inc. (incorporated by reference to Exhibit 10.1 to ARAMARK Corporation’s Quarterly Report on Form 10-Q filed with the SEC on May 12, 2003, pursuant to the Exchange Act (File No. 001-16807)). | |
| 10.22 | First Amendment to Stock Purchase Agreement dated March 14, 2003 among Knowledge Schools, Inc., Children’s Discovery Centers of America, Inc. (to be renamed Knowledge Learning Corporation), ARAMARK Corporation, ARAMARK Organizational Services, Inc. and ARAMARK Educational Resources, Inc. (incorporated by reference to Exhibit 10.2 to ARAMARK Corporation’s Quarterly Report on Form 10-Q filed with the SEC on May 12, 2003, pursuant to the Exchange Act (File No. 001-16807)). | |
| 10.23 | Second Amendment to Stock Purchase Agreement, dated May 9, 2003, among Knowledge Schools, Inc., Knowledge Learning Corporation formerly known as Children’s Discovery Centers of America, Inc., ARAMARK Corporation, ARAMARK Organizational Services, Inc. and ARAMARK Educational Resources, Inc. (incorporated by reference to Exhibit 10.1 to ARAMARK Corporation’s Quarterly Report on Form 10-Q filed with the SEC on August 11, 2003, pursuant to the Exchange Act (File No. 001-16807)). | |
| 10.24 | ARAMARK 2001 Equity Incentive Plan (incorporated by reference to Annex E to ARAMARK Corporation’s Registration Statement on Form S-4 filed with the Commission on November 16, 2001, pursuant to the Securities Act (Registration No. 333-65228)).** | |
| 10.25 | Amended and Restated ARAMARK 2001 Stock Unit Retirement Plan (incorporated by reference to Exhibit 10.22 to ARAMARK Corporation’s Annual Report on Form 10-K filed with the SEC on December 19, 2003, pursuant to the Exchange Act (File No. 001-16807)). ** | |
| 10.26 | ARAMARK 2001 Deferred Compensation Plan (incorporated by reference to Exhibit 10.1 to ARAMARK Corporation’s Registration Statement on Form S-8 filed with the Commission on May 24, 2002, pursuant to the Securities Act (Registration No. 333-89120)).** | |
| 10.27 | ARAMARK Deferred Compensation Plan for Directors (incorporated by reference to Exhibit 10.2 to ARAMARK Corporation’s Registration Statement on Form S-8 filed with the Commission on May 24, 2002, pursuant to the Securities Act (Registration No. 333-89118)).** | |
| 10.28 | ARAMARK Corporation Combined Stock Ownership Plan for Employees (incorporated by reference to Exhibit 10.1 to ARAMARK Corporation’s Registration Statement on Form S-8 filed with the Commission on December 17, 2001, pursuant to the Securities Act (Registration No. 333-53163)).** | |
4
| 10.29 | ARAMARK 2005 Stock Unit Retirement Plan (incorporated by reference to exhibit 10.2 to the Company’s Current Report on Form 8-K filed with the SEC on May 13, 2005, pursuant to the Exchange Act (file number 001-16807)).** | |
| 10.30 | ARAMARK 2005 Deferred Compensation Plan for Directors (incorporated by reference to exhibit 10.3 to the Company’s Current Report on Form 8-K filed with the SEC on May 13, 2005, pursuant to the Exchange Act (file number 001-16807)).** | |
| 10.31 | ARAMARK 2005 Deferred Compensation Plan (incorporated by reference to exhibit 10.3 to the Company’s Current Report on Form 8-K filed with the SEC on August 10, 2005, pursuant to the Exchange Act (file number 001-16807)).** | |
| 10.32 | ARAMARK 2001 Equity Incentive Plan form of Non-Qualified Stock Option Award Certificate of Grant for Non-Employee Directors (incorporated by reference to exhibit 10.1 to the Company’s Current Report on Form 8-K filed with the SEC on November 5, 2004, pursuant to the Exchange Act (file number 001-16807)).** | |
| 10.33 | ARAMARK 2001 Equity Incentive Plan form of Certificate of Grant and Rules and Procedures for Non-Qualified Stock Option Award (incorporated by reference to exhibit 10.3 to the Company’s Current Report on Form 8-K filed with the SEC on November 18, 2005, pursuant to the Exchange Act (file number 001-16807)).** | |
| 10.34 | ARAMARK 2001 Equity Incentive Plan Rules and Procedures for Restricted Stock Units granted under the Management Stock Purchase Program (incorporated by reference to exhibit 10.1 to the Company’s Current Report on Form 8-K filed with the SEC on November 18, 2005, pursuant to the Exchange Act (file number 001-16807)).** | |
| 10.35 | Rules and Procedures for Restricted Stock Units Granted Under the ARAMARK 2001 Equity Incentive Plan (incorporated by reference to exhibit 10.2 to the Company’s Current Report on Form 8-K filed with the SEC on November 18, 2005, pursuant to the Exchange Act (file number 001-16807)).** | |
| 10.36 | Senior Executive Annual Performance Bonus Arrangement (incorporated by reference to Appendix C to the Company’s Definitive Proxy Statement filed with the SEC on December 23, 2003, pursuant to the Exchange Act (file number 001-16807)).** | |
| 10.37 | ARAMARK Directors’ Compensation Summary (incorporated by reference to exhibit 10.1 to the Company’s Current Report on Form 8-K filed with the SEC on August 10, 2005, pursuant to the Exchange Act (file number 001-16807)).** | |
| 10.38 | Grant Certificate for Deferred Stock Units (incorporated by reference to exhibit 10.2 to the Company’s Current Report on Form 8-K filed with the SEC on August 10, 2005, pursuant to the Exchange Act (file number 001-16807)).** | |
| 10.39 | Form of Indemnification Agreement and attached schedule (incorporated by reference to exhibit 10.4 to the Company’s Current Report on Form 8-K filed with the SEC on August 10, 2005, pursuant to the Exchange Act (file number 001-16807)).** | |
| 12 | Ratio of Earnings to Fixed Charges.* | |
| 21 | List of subsidiaries of ARAMARK Corporation.* | |
| 23 | Consent of Independent Registered Public Accounting Firm.* | |
| 24 | Power of Attorney (included on the signature page hereto). | |
| 31.1 | Certification of Joseph Neubauer pursuant to Section 302 of the Sarbanes-Oxley Act of 2002.* | |
5
| 31.2 | Certification of L. Frederick Sutherland pursuant to Section 302 of the Sarbanes-Oxley Act of 2002.* | |
| 32.1 | Certification of Joseph Neubauer pursuant to Section 906 of the Sarbanes-Oxley Act of 2002.* | |
| 32.2 | Certification of L. Frederick Sutherland pursuant to Section 906 of the Sarbanes-Oxley Act of 2002.* | |
| 99.1 | Reconciliation of non-GAAP financial measures.* | |
| † | Portions omitted pursuant to a request for confidential treatment. |
| * | Filed herewith. |
| ** | Management contract or compensatory plan or arrangement required to be filed or incorporated as an exhibit. |
6