Exhibit 99.1
|
| TRANSALTA CORPORATION NEWS RELEASE |
TransAlta Reports Fourth Quarter and Full Year 2013 Results, 2014 Outlook, Asset Sale, and Revised Dividend
CALGARY, Alberta (February 20, 2014) — TransAlta Corporation (“TransAlta”) (TSX: TA; NYSE: TAC) today reported its fourth quarter 2013 and full year 2013 financial results, its outlook for 2014 and two significant initiatives to enhance the Corporation’s financial strength to grow, provide a solid and sustainable dividend, and to ensure a strong balance sheet throughout the commodity cycle.
Comparable EBITDA(1) for the full year ending Dec. 31, 2013 was $1,023 million, an increase of $8 million from 2012. Strong performance in gas, renewables, and trading, more than offset the lower pricing in the Pacific Northwest and higher unplanned outages at Canadian Coal. Free Cash Flow(1) for the full year ending Dec. 31, 2013 increased by $37 million to $295 million, or $1.12 per share. Comparable EBITDA for the fourth quarter 2013 was $242 million compared to $312 million during the same period last year. Results were lower than last year due to lower prices in Alberta and the Pacific Northwest, icing events in Eastern Canada that impacted our wind results, and higher unplanned outages in Canadian Coal.
Comparable net earnings for the full year ending Dec. 31, 2013 were $81 million, or $0.31 per share. A reported net loss of $71 million ($0.27 per share) was recorded for the full year ending Dec. 31, 2013 due to a number of one-time items and the impact of certain de-designated and ineffective hedges. Comparable net earnings and reported net loss for the three months ending Dec. 31, 2013 were $1 million and $66 million, respectively.
Over the past five years, TransAlta has invested a large amount of capital in growth projects in our core markets which is a key part of our strategy. To enhance our ability to continue to execute on our growth strategy and be competitive, TransAlta also announced today two key initiatives; the sale of our 50 per cent interest in CE Generation, Blackrock development and Wailuku to our partner in these holdings, MidAmerican Renewables for U.S.$193.5 million and the resizing of our dividend to an annualized amount of $0.72 per common share to align with our growth and financial objectives. These initiatives, combined with actions we have taken since late 2012, will enhance the Corporation’s ability to execute its growth strategy, maintain a strong balance sheet and create shareholder value. Specifically, these two initiatives deliver a number of key benefits to security holders, including:
· Increasing cash flow per share
· Providing an attractive, sustainable dividend
· Improving the Corporation’s credit metrics and balance sheet
· Generating an additional $120 million per year in free cash flow
· Creating a stronger financial base for growing TransAlta and maintaining a strong balance sheet throughout the commodity cycle
(1) Comparable EBITDA refers to Earnings before interest, taxes, depreciation and amortization including finance lease income and adjusted for certain other items. Free Cash Flow refers to Funds from Operations less sustaining capital less preferred dividends less non-controlling interest payments. Comparable EBITDA, comparable net earnings attributable to common shareholders, funds from operations, free cash flow, comparable earnings per share, funds from operations per share, and free cash flow per share are not defined under International Financial Reporting Standards (“IFRS”). Presenting these measures from period to period provides supplemental information to help management and shareholders evaluate earnings’ and cash flow trends in comparison with prior periods’ results. Refer to the Non-IFRS Measures section of our Management’s Discussion and Analysis (“MD&A”) for further discussion of these items.
“Our growth strategy is unchanged and our ability to execute is enhanced through these two additional initiatives” said Dawn Farrell, President and CEO. “An attractive, sustainable dividend continues to be an important part of our approach to delivering value to shareholders. In addition, a strong investment grade balance sheet is critical for enhancing our ability to compete for growth opportunities.”
2014 Outlook
TransAlta expects comparable EBITDA for 2014 to be in the range of $1,015 and $1,065 million based on the current outlook for power prices in Alberta and the Pacific Northwest. Free Cash Flow is expected to be in the range of $293 to $343 million, or $1.07 and $1.26 per share, based on sustaining capital expenditures of approximately $350 million. With the revised dividend, our expected dividend is 57 per cent to 67 per cent of Free Cash Flow.
Recent Strategic Accomplishments
· Announced sale of CE Generation, Blackrock development, and Wailuku to MidAmerican Renewables
· The TAMA Transmission partnership between TransAlta and MidAmerican Transmission successfully qualified to compete in the next phase of the competitive bid process within Alberta for the Fort McMurray West 500 kV Transmission Project.
· Established the Fortescue River Gas Pipeline joint venture to build and own a $178 million natural gas pipeline in Western Australia to better serve our customers within that region. TransAlta’s interest in the joint venture is 43 per cent.
· Concluded a long-term contract extension with BHP Billiton’s Nickel West operations in Western Australia for 245 MW.
· Completed the acquisition of TransAlta’s first wind project in the United States. An economic interest in the 144 MW wind farm in Wyoming was purchased by TransAlta’s majority owned subsidiary, TransAlta Renewables Inc. (“TransAlta Renewables”).
· Formation of TransAlta Renewables, a sponsored vehicle by TransAlta. The 29 facilities within TransAlta Renewables are fully operational and 100 per cent contracted.
· Executed 24-year contract with the City of Riverside in California for 86 MW at CalEnergy LLC.
· Executed 24-year contract with Salt River Project in Arizona for 50 MW at CalEnergy LLC.
· Executed a 20-year contract with the Ontario Power Authority for 74 MW from the Ottawa Gas Facility.
Q4 2013 compared to Q4 2012
· Comparable EBITDA of $242 million down from $312 million for the same period last year
· Funds from Operations of $179 million down from $214 million for the same period last year
· Free Cash Flow of $61 million down from $74 million in 2012
· Availability of 91.8 per cent
Full year 2013 compared to full year 2012
· Comparable EBITDA of $1,023 million up from $1,015 million in 2012
· Funds from operations of $729 million down from $788 million in 2012
· Free cash flow of $295 million, an increase of $37 million from 2012
· Adjusted availability(1) of 87.8 per cent as compared to our annual target of 89 to 90 per cent. Lower availability is primarily attributed to the force majeure at Keephills Unit 1
(1) Adjusted for economic dispatching at Centralia Thermal, but not for Keephills Unit 1 force majeure.
Full Year Business Line Review by Segment
Generation
· Canadian Coal: Comparable EBITDA decreased $64 million to $309 million compared to $373 million in 2012. The main impact to the business in 2013 was increased unplanned outages compared to 2012 that could not be offset by lower planned outages. We also took over the Highvale Mine in 2013 and expanded the mine to be able to deliver coal to all six Sundance units and all three Keephills units. Planned major maintenance for this business sector has returned to normal levels after a large capital program in 2012 was completed.
· U.S. Coal: Comparable EBITDA decreased $82 million to $66 million in 2013 compared to $148 million in 2012. The decline in comparable EBITDA was primarily due to weak merchant pricing and the expiry of contracts. Fuel costs were lower in 2013 reflecting re-negotiated coal and rail costs. Capital was reduced significantly due to the long period of economic curtailment of these units under low prices.
· Gas: Comparable EBITDA increased $15 million to $327 million in 2013 compared to $312 million in 2012 primarily due to a full year of income from the Solomon power plant that was acquired in late 2012 and stronger merchant pricing in our Alberta business. Capital expenditures in this business were up $9 million to $58 million compared to 2012.
· Wind: Comparable EBITDA increased $29 million to $180 million in 2013 compared to $151 million in 2012 primarily due to higher prices in the Alberta market and the commencement of operations at the New Richmond facility in Québec.
· Hydro: Comparable EBITDA increased $20 million to $147 million in 2013 compared to $127 million in 2012 primarily due to favourable pricing in the Alberta market.
Energy Trading
· Comparable EBITDA increased $74 million to $61 million in 2013 compared to a loss of $13 million in 2012 due to strong trading performance across all markets and prudent management of risk.
Corporate
· OM&A expense decreased $16 million to $66 million in 2013 compared to $82 million in 2012 primarily due to lower compensation costs as a result of restructuring in the fourth quarter of 2012 and a continued focus on managing costs.
Full Year Consolidated Financial Review
Comparable EBITDA increased $8 million to $1,023 million in 2013 from $1,015 million for 2012, reflecting the higher gross margins in Gas, Wind, Hydro, and Energy Trading, which more than offset higher unplanned outages in Canadian Coal and lower pricing within our U.S. Coal business.
Despite higher comparable EBITDA, Funds from Operations for the year decreased $59 million to $729 million from $788 million for the same period last year primarily due to higher interest expenses and cash taxes, and differences in timing of cash proceeds associated with power hedges and coal inventories.
Free Cash Flow increased $37 million to $295 million in 2013 from $258 million in 2012 primarily due to lower sustaining capital expenditures associated with fewer planned outages in 2013 relative to 2012.
Comparable earnings for the year were $81 million ($0.31 per share) down from $117 million ($0.50 per share) in 2012. The decrease in comparable earnings is primarily due to an increase in depreciation and amortization, income taxes, and net interest, partially offset by an increase in comparable EBITDA.
A reported net loss of $71 million ($0.27 per share) was recorded for the year compared to a net loss of $615 million ($2.62 per share) last year. This year over year change is primarily driven by a decrease in asset impairment charges of $342 million, a decrease in costs associated with the return of Sundance Units 1 and 2 to service of $170 million, a decrease in the impact of write off of deferred income tax assets of $141 million partially offset by a provision of $42 million associated with a potential settlement related to California power markets during the 2000 - 2001 period.
Full Year Operating Review
· Fleet availability, including finance leases and equity investments, was 85.5 per cent compared to 88.4 per cent last year. Adjusting for economic dispatching at Centralia Thermal in our U.S. Coal business, availability was 87.8 per cent compared to 90.0 per cent in 2012. The decrease is mainly due to higher unplanned outages in our Canadian Coal business at the Alberta coal PPA facilities and the Keephills Unit 1 force majeure outage, partially offset by lower planned outages at the Alberta coal facilities.
· We completed the four major outages scheduled for 2013.
· Total sustaining expenditures were $341 million for the year compared to $439 million last year. Sustaining expenditures fell within our target range of $295-$345 million for 2013.
Significant Events
Sale of CE Generation
On Feb. 20, 2014, we announced the sale of our 50 per cent interest in CE Generation, Blackrock development and Wailuku to our partner in these holdings, MidAmerican Renewables for a price of U.S.$193.5 million.
Revised Dividend
On Feb. 20, 2014, our Board of Directors declared a quarterly dividend of $0.18 per common share (or $0.72 per common share on an annualized basis).
Sundance Unit 6 Agreement
On Feb. 19, 2014, we reached an agreement with the PPA Buyer related to the dispute on Sundance Unit 6. We don’t expect any material impact to the financial statements as a result of the agreement.
Wyoming Wind Acquisition
On Dec. 20, 2013, we completed the acquisition, through one of our wholly owned subsidiaries, of a 144 MW wind farm in Wyoming for approximately U.S.$102 million from an affiliate of NextEra Energy Resources, LLC. The wind farm is fully operational and contracted under a long-term PPA until 2028 with an investment grade counterparty. An economic interest in the wind farm was acquired by TransAlta Renewables from TransAlta in consideration for a payment equal to the original purchase price of the acquisition.
Western Australia Contract Extension
On Oct. 30, 2013, we announced a long-term contract extension to supply power to the BHP Billiton Nickel West operations in Western Australia from our Southern Cross Energy facilities (“Southern Cross”). The extension is effective immediately and replaces the previous contract which was set to expire at the beginning of 2014.
Operating since 1996, Southern Cross has a total installed capacity of 245 MW from the Kambalda, Mt. Keith, Leinster, and Kalgoorlie power stations.
Ottawa Facility’s Long-term Contract with Ontario Power Authority
On Aug. 30, 2013, we announced the execution of an agreement for a 20-year power supply term with the Ontario Power Authority for our Ottawa gas facility, effective January 2014. Under the new deal, the plant has become dispatchable. This will assist in reducing the incidents of surplus baseload generation in the market, while maintaining the ability of the system to reliably produce energy when it is needed.
This new contract will benefit our shareholders by providing long-term stable earnings from this facility and is also expected to benefit ratepayers of Ontario by securing attractively priced capacity from this existing facility, reducing the need for new capacity to be built in the future and allowing hospitals in the area to continue to be served with the steam they need for heat and other energy processes, in an environmentally friendly manner.
TransAlta Renewables
On Aug. 9, 2013, we transferred 28 indirectly owned wind and hydroelectric generating assets to TransAlta Renewables through the sale of all the issued and outstanding shares of two subsidiaries: Canadian Hydro Developers, Inc. and Western Sustainable Power Inc. The initial public offering resulted in an aggregate of 22.1 million common shares being issued for gross proceeds to TransAlta Renewables of $221 million. TransAlta, directly and indirectly, holds 92.6 million common shares, representing approximately 80.7 per cent of the common shares in TransAlta Renewables.
Sundance Units 1 and 2 Return to Service
In December 2010, Units 1 and 2 of our Sundance facility were shut down due to conditions observed in the boilers at both units. On July 20, 2012, an arbitration panel concluded that Unit 1 and Unit 2 were not economically destroyed and required TransAlta to return these units to service. Unit 1 returned to service on Sept. 2, 2013 and Unit 2 returned to service on Oct. 4, 2013.
The following table depicts key financial results and statistical operating data:
Fourth Quarter and 12 Months Ended Dec. 31 2013 Highlights
In $CAD millions, unless otherwise stated |
| 3 months |
| 3 months |
| 12 months |
| 12 months |
|
Adjusted availability (%)(1) |
| 91.8 |
| 89.4 |
| 87.8 |
| 90.0 |
|
Production (GWh) |
| 12,640 |
| 10,880 |
| 42,482 |
| 38,750 |
|
Revenue |
| 587 |
| 646 |
| 2,292 |
| 2,210 |
|
Comparable EBITDA(2) |
| 242 |
| 312 |
| 1,023 |
| 1,015 |
|
Reported Net Earnings (loss) attributable to common shareholders |
| (66 | ) | 39 |
| (71 | ) | (615 | ) |
Comparable Net Earnings attributable to common shareholders(2) |
| 1 |
| 55 |
| 81 |
| 117 |
|
Funds from Operations(2) |
| 179 |
| 214 |
| 729 |
| 788 |
|
Cash Flow from Operating Activities |
| 165 |
| 245 |
| 765 |
| 520 |
|
Free Cash Flow(2) |
| 61 |
| 74 |
| 295 |
| 258 |
|
|
|
|
|
|
|
|
|
|
|
Basic and Diluted Earnings (loss) per common share |
| (0.25 | ) | 0.15 |
| (0.27 | ) | (2.62 | ) |
Comparable Earnings per share(2) |
| 0.00 |
| 0.22 |
| 0.31 |
| 0.50 |
|
Funds from Operations per share(2) |
| 0.67 |
| 0.84 |
| 2.76 |
| 3.35 |
|
Free Cash Flow per share(2) |
| 0.23 |
| 0.29 |
| 1.12 |
| 1.10 |
|
Dividends paid per common share |
| 0.29 |
| 0.29 |
| 1.16 |
| 1.16 |
|
The complete report for the quarter, including MD&A and unaudited interim financial statements, as well as our quarterly presentation, will be available on the Investors section of our website: www.transalta.com.
Dividend Declarations
The Board of Directors of TransAlta today declared a quarterly dividend of $0.18 per share on common shares payable on April 1, 2014 to shareholders of record at the close of business March 4, 2014.
The Board of Directors of TransAlta also declared a quarterly dividend of $0.2875 per share on TransAlta’s issued and outstanding Cumulative Redeemable Rate Reset First Preferred Shares, Series A, payable on March 31, 2014 to shareholders of record at the close of business on March 4, 2014.
The Board of Directors of TransAlta also declared a quarterly dividend of $0.2875 per share on TransAlta’s issued and outstanding Cumulative Redeemable Rate Reset First Preferred Shares, Series C, payable on March 31, 2014 to shareholders of record at the close of business on March 4, 2014.
(1) Adjusted for economic dispatching at Centralia Thermal, but not for Keephills Unit 1 force majeure.
(2) Comparable EBITDA refers to Earnings before interest, taxes, depreciation and amortization including finance lease income and adjusted for certain other items. Free Cash Flow refers to Funds from Operations less sustaining capital less preferred dividends less non-controlling interest payments. Comparable EBITDA, comparable net earnings attributable to common shareholders, funds from operations, free cash flow, comparable earnings per share, funds from operations per share, and free cash flow per share are not defined under International Financial Reporting Standards (“IFRS”). Presenting these measures from period to period provides supplemental information to help management and shareholders evaluate earnings’ and cash flow trends in comparison with prior periods’ results. Refer to the Non-IFRS Measures section of our Management’s Discussion and Analysis (“MD&A”) for further discussion of these items.
The Board of Directors of TransAlta also declared a quarterly dividend of $0.3125 per share on TransAlta’s issued and outstanding Cumulative Redeemable Rate Reset First Preferred Shares, Series E, payable on March 31, 2014 to shareholders of record at the close of business on March 4, 2014.
TransAlta files year end disclosure documents
TransAlta also announced today it has filed its Annual Information Form, Audited Consolidated Financial Statements and accompanying notes, as well as its MD&A. These documents will be available through TransAlta’s website at www.transalta.com or through Sedar at www.sedar.com.
TransAlta has also filed its 40-F with the U.S. Securities and Exchange Commission. The form is available through their website at www.sec.gov. Paper copies of all documents are available to shareholders free of charge upon request.
Conference call
We will hold a conference call and web cast at 7:00 a.m. MT (9:00 a.m. ET) today to discuss fourth quarter, full year 2013 results and 2014 Outlook, as well as the asset sale and revised dividend. The call will begin with formal remarks by Dawn Farrell, President and CEO, and Brett Gellner, Chief Financial Officer and Chief Investment Officer, followed by a question and answer period for investment analysts, investors and other interested parties. A question and answer period for the media will immediately follow. Please contact the conference operator five minutes prior to the call, noting “TransAlta Corporation” as the company and “Brent Ward” as moderator.
Dial-in numbers:
Toll-free North American participants call: 1-800-319-4610
Outside of Canada & USA call: 1-604-638-5340
A link to the live webcast will be available on the Investor Centre section of TransAlta’s website at http://www.transalta.com/investor-centre/events-presentations/webcasts-conference-calls. If you are unable to participate in the call, the instant replay is accessible at 1-800-319-6413 (Canada and USA toll free) or 1-604-638-9010 (Outside of Canada) with TransAlta pass code 2231 followed by the # sign. A complete copy of TransAlta’s fourth quarter extended news release is available in the Investor Centre section of our website: www.transalta.com. A transcript of the broadcast will be posted on the website once it becomes available. Note: If using a hands-free phone, lift the handset and press one to ask a question.
TransAlta is a power generation and wholesale marketing company focused on creating long-term shareholder value. TransAlta maintains a low-to-moderate risk profile by operating a highly contracted portfolio of assets in Canada, the United States and Australia. TransAlta’s focus is to efficiently operate wind, hydro, natural gas and coal facilities in order to provide customers with a reliable, low-cost source of power. For over 100 years, TransAlta has been a responsible operator and a proud contributor to the communities in which it works and lives. TransAlta has been selected by Sustainalytics as one of Canada’s Top 50 Socially Responsible Companies since 2009 and is recognized globally for its leadership on sustainability and corporate responsibility standards by FTSE4Good.
This news release contains forward looking statements, including statements regarding the business and anticipated financial performance of TransAlta Corporation. In particular, this news release contains forward-looking statements pertaining to the sale of the Corporation’s interest in CE Generation, Blackrock development and Wailuku to the MidAmerican Renewables, a potential settlement related to California power markets as well as the Corporation’s expectations for its 2014 comparable EBITDA. Free Cash Flow, sustaining capital expenditures and dividend payout. These statements are based on TransAlta Corporation’s belief and assumptions based on information available at the time the assumptions were made. These statements are subject to a number of risks and uncertainties that may cause actual results to differ materially from those contemplated by the forward-looking statements. Some of the factors that could cause such differences include: operational risks involving our facilities, market prices where we operate, unplanned outages at generating facilities and the capital investments required, equipment failure and our ability to carry out repairs in a cost effective manner or timely manner, the effects of weather, disruptions in the source of fuels, water, or wind required to operate our facilities, energy trading risks, failure to obtain necessary regulatory approvals in a timely fashion, legislative or regulatory developments, competition, global capital markets activity, changes in prevailing interest rates, currency exchange rates, inflation levels, commodity, prices general economic conditions in geographic areas where TransAlta Corporation operates and successful completion of the conditions applicable to the sale of CE Generation, Blackrock development and Wailuku.
Note: All financial figures are in Canadian dollars unless noted otherwise.
For more information: |
|
|
|
Investor inquiries: | Media inquiries: |
|
|
Brent Ward | Stacey Hatcher |
Director, Corporate Finance and Investor Relations | Senior Corporate Relations Advisor |
Phone: 1-800-387-3598 in Canada and U.S. | Cell: 587-216-2242 |
Email: investor_relations@transalta.com | Toll-free media number: 1-855-255-9184 |
| Alternate local number: 403-267-2540 |
BASIS OF PRESENTATION
This news release should be read in conjunction with our 2013 audited consolidated financial statements and our 2013 Annual Management’s Discussion and Analysis (“MD&A”). In this news release, unless the context otherwise requires, ‘we’, ‘our’, ‘us’, the ‘Corporation’, and ‘TransAlta’ refers to TransAlta Corporation and its subsidiaries. The consolidated financial statements have been prepared in accordance with International Financial Reporting Standards (“IFRS”). All tabular amounts in the following discussion are in millions of Canadian dollars unless otherwise noted. Certain financial measures included in this news release do not have a standardized meaning as prescribed by IFRS. These measures may not be comparable to similar measures presented by other issuers and should not be considered in isolation or as a substitute for measures prepared in accordance with IFRS. See the Non-IFRS Measures section of this news release for additional information. This news release is dated Feb. 20, 2014. Additional information respecting TransAlta, including its Annual Information Form, is available on SEDAR at www.sedar.com.
RESULTS OF OPERATIONS
The results of operations are presented on a consolidated basis and by business segment. We have three business segments: Generation, Energy Trading, and Corporate. For this news release, we have further split what is reported as our Generation business segment into the various fuel types to provide additional information to our readers. In this news release, the impact of foreign exchange fluctuations on foreign currency denominated transactions and balances is discussed with the relevant Consolidated Statements of Earnings (Loss) and Consolidated Statements of Financial Position items. While individual line items in the Consolidated Statements of Financial Position may be impacted by foreign exchange fluctuations, the net impact of the translation of these items relating to foreign operations to our presentation currency is reflected in accumulated other comprehensive income (loss) (“AOCI”) in the equity section of the Consolidated Statements of Financial Position.
HIGHLIGHTS
Fourth Quarter Highlights
Strategic Highlights
· Announced plans to build and own (TransAlta ownership 48 per cent) a $178 million natural gas pipeline to our Solomon power station.
· Acquired 144 megawatt (“MW”) wind farm in Wyoming.
· TAMA Transmission LP (“TAMA transmission”) successfully qualified to participate as a proponent in the Fort McMurray West 500 kilovolt Transmission Project.
Operational Financial Results
· Consolidated: Comparable earnings before interest, taxes, depreciation, and amortization (“EBITDA”) for 2013 decreased $70 million to $242 million. The decline in comparable EBITDA from our Canadian and United States (“U.S.”) coal operations, gas, and hydro could not be offset by the improvements in wind and trading. Higher unplanned outages at our Alberta coal Power Purchase Arrangement (“PPA”) facilities, and lower pricing at Centralia Thermal contributed to the bulk of the decline in the coal business in 2013.
· Canadian Coal: In 2013, comparable EBITDA was $68 million compared to $102 million in 2012. The decrease in comparable EBITDA resulted from higher coal costs, unfavourable market pricing, and higher unplanned outages at the Alberta coal PPA facilities, partially offset by lower planned outages at the Alberta coal PPA facilities and Genesee Unit 3.
· U.S. Coal: Comparable EBITDA decreased to $14 million in 2013 compared to $37 million in 2012. The decline in comparable EBITDA is due to lower pricing, including margins on purchased power, partially offset by favourable coal pricing.
· Gas: Comparable EBITDA decreased by $17 million to $82 million primarily due to lower pricing and higher OM&A due to higher routine maintenance.
· Wind: Comparable EBITDA for wind improved by $4 million in 2013 to $58 million primarily due to the commencement of commercial operations at New Richmond.
· Hydro: Comparable EBITDA decreased by $11 million to $21 million primarily due to lower prices and lower water resources.
· Equity Investments: The geothermal business, which is recorded within equity investments, lost $5 million in 2013 compared to a loss of $10 million in 2012. The reduction of the loss is primarily due to favourable pricing and favourable changes in foreign exchange rates, partially offset by higher planned and unplanned outages.
· Energy Trading Segment: Our Energy Trading business showed an improvement in comparable EBITDA of $12 million in 2013 as a result of increased value from trading around power and gas assets, prudent management of risk, increased customer margins, and favourable market conditions driven largely by extreme weather events during the quarter.
· Corporate Segment: The Corporate Segment was comparable to 2012.
· Overall availability, including finance leases and equity investments, was 91.8 per cent compared to 89.4 per cent in 2012. The increase is primarily due to lower planned outages at the Alberta coal PPA facilities, Genesee Unit 3, and Sarnia, partially offset by higher unplanned outages at the Alberta coal PPA facilities.
· Overall production increased 1,760 gigawatt hours (“GWh”) to 12,640 GWh compared to 2012.
Consolidated Highlights
· Funds from operations (“FFO”) decreased $35 million to $179 million compared to the prior year due to primarily due to higher cash interest and cash taxes as well as differences in timing of cash proceeds associated with power hedges.
· Comparable net earnings were $1 million ($0.00 net earnings per share), down from $55 million ($0.22 net earnings per share) in 2012. The decrease is primarily due to a decrease in comparable EBITDA and an increase depreciation and amortization, partially offset by a decrease in income tax expense.
· Reported net loss attributable to common shareholders was $66 million ($0.25 net loss per share), down from net earnings of $39 million ($0.15 net earnings per share) in 2012. The change is driven by a decrease in comparable EBITDA of $70 million and the following non-comparable amounts, net of tax:
· Increase in impact of the California claim of $42 million
· Increase in loss on de-designated hedges of $19 million
· Increase in impact of Sundance Units 1 and 2 return to service of $8 million
· Increase in impact of writeoff of deferred income tax assets of $12 million
· We have accrued for a potential settlement with San Diego Gas & Electric Company, the California Attorney General, and other government agencies with a pre-tax impact of U.S.$52 million.
The following table depicts key financial results and statistical operating data:
|
| 3 months ended Dec. 31 |
| Year ended Dec. 31 |
| ||||
|
| 2013 |
| 2012 |
| 2013 |
| 2012 |
|
Availability (%)(1) |
| 91.8 |
| 89.4 |
| 85.5 |
| 88.4 |
|
Adjusted availability (%)(1),(2) |
| 91.8 |
| 89.4 |
| 87.8 |
| 90.0 |
|
Production (GWh)(1) |
| 12,640 |
| 10,880 |
| 42,482 |
| 38,750 |
|
Revenues |
| 587 |
| 646 |
| 2,292 |
| 2,210 |
|
Comparable EBITDA(3) |
| 242 |
| 312 |
| 1,023 |
| 1,015 |
|
Net earnings (loss) attributable to common shareholders |
| (66 | ) | 39 |
| (71 | ) | (615 | ) |
Comparable net earnings attributable to common shareholders(3) |
| 1 |
| 55 |
| 81 |
| 117 |
|
Funds from operations(3) |
| 179 |
| 214 |
| 729 |
| 788 |
|
Cash flow from operating activities |
| 165 |
| 245 |
| 765 |
| 520 |
|
Free cash flow(4) |
| 61 |
| 74 |
| 295 |
| 258 |
|
|
|
|
|
|
|
|
|
|
|
Net earnings (loss) per share attributable to common shareholders, basic and diluted |
| (0.25 | ) | 0.15 |
| (0.27 | ) | (2.62 | ) |
Comparable net earnings (loss) per share(3) |
| 0.00 |
| 0.22 |
| 0.31 |
| 0.50 |
|
Funds from operations per share(3) |
| 0.67 |
| 0.84 |
| 2.76 |
| 3.35 |
|
Free cash flow per share(3) |
| 0.23 |
| 0.29 |
| 1.12 |
| 1.10 |
|
Dividends paid per common share |
| 0.29 |
| 0.29 |
| 1.16 |
| 1.16 |
|
As at |
| Dec. 31, 2013 |
| Dec. 31, 2012 |
|
Total assets |
| 9,783 |
| 9,503 |
|
Total long-term liabilities |
| 5,508 |
| 4,769 |
|
Comparable EBITDA is as follows:
|
| 3 months ended Dec. 31 |
| Year ended Dec. 31 |
| ||||
Comparable EBITDA |
| 2013 |
| 2012 |
| 2013 |
| 2012 |
|
Generation Segment |
|
|
|
|
|
|
|
|
|
Canadian Coal |
| 68 |
| 102 |
| 309 |
| 373 |
|
U.S. Coal |
| 14 |
| 37 |
| 66 |
| 148 |
|
Gas |
| 82 |
| 99 |
| 327 |
| 312 |
|
Wind |
| 58 |
| 54 |
| 180 |
| 151 |
|
Hydro |
| 21 |
| 32 |
| 147 |
| 127 |
|
Total Generation Segment |
| 243 |
| 324 |
| 1,029 |
| 1,111 |
|
Energy Trading Segment |
| 20 |
| 8 |
| 61 |
| (13 | ) |
Corporate Segment |
| (21 | ) | (20 | ) | (67 | ) | (83 | ) |
Total comparable EBITDA |
| 242 |
| 312 |
| 1,023 |
| 1,015 |
|
(1) Availability and production includes all generating assets (generation operations, finance leases, and equity investments).
(2) Adjusted for economic dispatching at Centralia Thermal.
(3) These items are not defined under IFRS. Presenting these items from period to period provides management and investors with the ability to evaluate earnings trends more readily in comparison with prior periods’ results. Refer to the Non-IFRS Measures section of this news release for further discussion of these items, including, where applicable, reconciliations to measures calculated in accordance with IFRS.
AVAILABILITY & PRODUCTION
Availability for the three months ended Dec. 31, 2013 increased compared to the same period in 2012, primarily due to lower planned outages at the Alberta coal PPA facilities, partially offset by higher unplanned outages at the Alberta coal PPA facilities.
Availability for the year ended Dec. 31, 2013 decreased compared to 2012, mainly due to higher unplanned outages at the Alberta coal PPA facilities, primarily driven by the Keephills Unit 1 force majeure outage, partially offset by lower planned outages at the Alberta coal PPA facilities.
Production for the three months ended Dec. 31, 2013 increased 1,760 GWh compared to the same period in 2012, primarily due to Sundance Units 1 and 2 returning to service, lower economic dispatching at Centralia Thermal, and lower planned outages at the Alberta coal PPA facilities, partially offset by higher unplanned outages at the Alberta coal PPA facilities and higher contract curtailments at our Ottawa facility.
For the year ended Dec. 31, 2013, production increased 3,732 GWh compared to 2012, primarily due to lower economic dispatching at Centralia Thermal, Sundance Units 1 and 2 returning to service, lower planned outages at the Alberta coal PPA facilities, higher PPA customer demand, and lower market curtailments, partially offset by higher unplanned outages at the Alberta coal PPA facilities, primarily driven by the Keephills Unit 1 force majeure outage, and higher planned and unplanned outages at Centralia Thermal.
FUNDS FROM OPERATIONS AND FREE CASH FLOW
FFO for the three months and year ended Dec. 31, 2013 decreased $35 million and $59 million, respectively, compared to the same periods in 2012 to $179 million and $729 million, respectively, primarily due to higher cash interest and cash taxes as well as differences in timing of cash proceeds associated with power hedges.
Free cash flow for the three months ended Dec. 31, 2013 decreased $13 million compared to the same period in 2012 to $61 million due to lower comparable net earnings, partially offset by lower sustaining capital expenditures.
For the year ended Dec. 31, 2013, free cash flow increased $37 million compared to 2012 to $295 million due to lower sustaining capital expenditures, partially offset by lower comparable net earnings.
SUBSEQUENT EVENTS
Sale of CE Generation LLC, Blackrock Development Project, and Wailuku Holding Company, LLC
On Feb. 20, 2014 we announced an agreement to sell our 50 per cent ownership of CE Generation LLC (“CE Gen”), the Blackrock development project (“Blackrock”), and Wailuku Holding Company, LLC (“Wailuku”) to MidAmerican Renewables for proceeds of U.S.$193.5 million. MidAmerican Renewables holds the other 50 per cent interest in CE Gen, Blackrock, and Wailuku.
Dividend
On Feb. 20, 2014, we announced the resizing of our dividend to a quarterly dividend of $0.18 per common share (or $0.72 per common share on an annualized basis) to align with our growth and financial objectives.
Sundance Unit 6 Agreement
On Feb. 19, 2014, we reached an agreement with the PPA Buyer related to the dispute on Sundance Unit 6. We don’t expect any material impact to the financial statements as a result of the agreement.
California Claim
In response to complaints filed by San Diego Gas & Electric Company, the California Attorney General, and other government agencies, the Federal Energy Regulatory Commission (“FERC”) ordered us to refund approximately U.S.$47 million for sales we made in the organized markets of the California Power Exchange, the California Independent System Operator, and the California Department of Water Resources during the 2000 - 2001 period. In addition, the California parties have sought additional refunds that to date have been rejected by FERC. We have established a U.S.$47 million provision to cover any potential refunds. Final rulings are not expected in the near future.
For the year ended Dec. 31, 2013, we accrued for a potential settlement of all outstanding disputes with the California parties, which resulted in a pre-tax charge to earnings of approximately U.S.$52 million.
Keephills Unit 2
On Jan. 31, 2014, an outage commenced at Unit 2 of our Keephills facility to perform a rewind of the generator stator as a result of the generator event in 2013 at Keephills Unit 1. We gave notice of a High Impact Low Probability event and claimed force majeure relief under the PPA.
Fort McMurray Transmission Project
On Jan. 17, 2014, we announced that our strategic partnership with MidAmerican Transmission, TAMA Transmission, which was formed on May 9, 2013, successfully qualified to participate as a proponent in the Fort McMurray West 500 kilovolt Transmission Project. The Alberta Electric System Operator announced its selection of a short-list of companies, identifying that TAMA Transmission will participate in the next stage of its competitive process for the project.
Australia Natural Gas Pipeline
On Jan. 15, 2014, we announced that, through a wholly owned subsidiary, an unincorporated joint venture named Fortescue River Gas Pipeline was formed, of which we have a 43 per cent interest. The first project of the new joint venture will be to build, own, and operate a $178 million natural gas pipeline from the Dampier to Bunbury Natural Gas Pipeline to our Solomon power station.
BUSINESS ENVIRONMENT
We operate in a variety of business environments to generate electricity, find buyers for the power we generate, and arrange for its transmission. The major markets we operate in are Western Canada, the Western U.S., and Eastern Canada. For a further description of the regions in which we operate as well as the impact of prices of electricity and natural gas upon our financial results, refer to our 2013 Annual MD&A.
Electricity Prices
Please refer to the Business Environment section of our 2013 Annual MD&A for a full discussion of the spot electricity market and the impact of electricity prices on our business, as well as our strategy to hedge our risks associated with changes in these prices.
The average spot electricity prices for the three months and ended Dec. 31, 2013 and 2012 in our three major markets are shown in the following graphs.
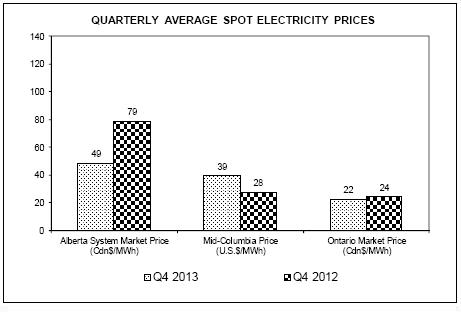
For the three months ended Dec. 31, 2013, average spot prices in Alberta decreased compared to the same period in 2012, primarily due to an increase in supply as a result of Sundance Units 1 and 2 returning to service. In the Pacific Northwest, average spot prices increased due to higher natural gas prices, lower hydro generation, and strong demand, particularly in December. Average spot prices in Ontario for the three months ended Dec. 31, 2013 decreased compared to the same period in 2012 due to an increase in supply as a result of increased nuclear, hydro, and wind generation.

For the year ended Dec. 31, 2013, average spot prices in Alberta increased compared to 2012, primarily due to tighter supply and demand conditions. In the Pacific Northwest, average spot prices increased due to higher natural gas prices and lower hydro generation. Average spot prices in Ontario for the year ended Dec. 31, 2013 increased compared to 2012 due to higher natural gas prices, which was partially offset by an increase in supply as a result of nuclear generating plants returning to service.
In 2014, power prices in Alberta are expected to be lower than 2013 as a result of more baseload generation and fewer planned maintenance outages across the market. However, prices can vary based on supply and weather conditions. In the Pacific Northwest, we expect prices to settle higher than in 2013 due to marginally higher natural gas prices and an outlook for lower hydro generation compared to 2013.
Spark Spreads
Please refer to the Business Environment section of our 2013 Annual MD&A for a full discussion of spark spreads and the impact of spark spreads on our business.
The average spark spreads for the three months and year ended Dec. 31, 2013 and 2012 in our three major markets are shown in the following graphs.

(1) For a 7,000 British Thermal Units per kilowatt hour heat rate plant.
For the three months ended Dec. 31, 2013, average spark spreads decreased in Alberta compared to the same period in 2012 due to an increase in supply as a result of Sundance Units 1 and 2 returning to service. In the Pacific Northwest, average spark spreads increased due to higher power prices driven by lower hydro generation and high demand associated with colder weather in 2013. For the three months ended Dec. 31, 2013, average spark spreads decreased in Ontario compared to the same period in 2012 due to lower power prices driven by an increase in supply as a result of increased nuclear, hydro, and wind generation.

(1) For a 7,000 British Thermal Units per kilowatt hour heat rate plant.
For the year ended Dec. 31, 2013, average spark spreads increased in Alberta compared to 2012 due to higher power prices driven by tighter supply and demand conditions. In the Pacific Northwest, average spark spreads increased due to higher power prices driven by lower hydro generation. Average spark spreads in Ontario decreased for the year ended Dec. 31, 2013 compared to 2012 as power prices did not rise as rapidly as natural gas prices, largely due to nuclear generating plants returning to service and increased renewables generation.
DISCUSSION OF SEGMENTED RESULTS
3 months ended Dec. 31, 2013 |
| Generation |
| Energy |
| Corporate |
| Total |
|
Revenues |
| 561 |
| 26 |
| — |
| 587 |
|
Fuel and purchased power |
| 278 |
| — |
| — |
| 278 |
|
Gross margin |
| 283 |
| 26 |
| — |
| 309 |
|
Operations, maintenance, and administration |
| 110 |
| 9 |
| 21 |
| 140 |
|
Depreciation and amortization |
| 137 |
| — |
| 6 |
| 143 |
|
Inventory writedown |
| 1 |
| — |
| — |
| 1 |
|
Taxes, other than income taxes |
| 5 |
| — |
| — |
| 5 |
|
Intersegment cost allocation |
| 3 |
| (3 | ) | — |
| — |
|
Operating income (loss) |
| 27 |
| 20 |
| (27 | ) | 20 |
|
Finance lease income |
| 12 |
| — |
| — |
| 12 |
|
Equity loss |
| (5 | ) | — |
| — |
| (5 | ) |
California claim |
| — |
| (56 | ) | — |
| (56 | ) |
Sundance Units 1 and 2 return to service |
| (10 | ) | — |
| — |
| (10 | ) |
Gain on sale of assets |
| — |
| — |
| 2 |
| 2 |
|
Insurance recovery |
| 8 |
| — |
| — |
| 8 |
|
Foreign exchange gain |
|
|
|
|
|
|
| 3 |
|
Net interest expense |
|
|
|
|
|
|
| (66 | ) |
Loss before income taxes |
|
|
|
|
|
|
| (92 | ) |
3 months ended Dec. 31, 2012 (Restated)* |
| Generation |
| Energy |
| Corporate |
| Total |
|
Revenues |
| 633 |
| 13 |
| — |
| 646 |
|
Fuel and purchased power |
| 245 |
| — |
| — |
| 245 |
|
Gross margin |
| 388 |
| 13 |
| — |
| 401 |
|
Operations, maintenance, and administration |
| 93 |
| 8 |
| 19 |
| 120 |
|
Depreciation and amortization |
| 114 |
| — |
| 5 |
| 119 |
|
Inventory writedown |
| 10 |
| — |
| — |
| 10 |
|
Restructuring provision |
| 5 |
| — |
| 8 |
| 13 |
|
Taxes, other than income taxes |
| 5 |
| — |
| 1 |
| 6 |
|
Intersegment cost allocation |
| 3 |
| (3 | ) | — |
| — |
|
Operating income (loss) |
| 158 |
| 8 |
| (33 | ) | 133 |
|
Finance lease income |
| 11 |
| — |
| — |
| 11 |
|
Equity loss |
| (10 | ) | — |
| — |
| (10 | ) |
Foreign exchange loss |
|
|
|
|
|
|
| (2 | ) |
Net interest expense |
|
|
|
|
|
|
| (60 | ) |
Earnings before income taxes |
|
|
|
|
|
|
| 72 |
|
* Please refer to Note 3 of our audited consolidated financial statements within our 2013 Annual Report for additional information regarding the restatements.
Year ended Dec. 31, 2013 |
| Generation |
| Energy |
| Corporate |
| Total |
|
Revenues |
| 2,213 |
| 79 |
| — |
| 2,292 |
|
Fuel and purchased power |
| 926 |
| — |
| — |
| 926 |
|
Gross margin |
| 1,287 |
| 79 |
| — |
| 1,366 |
|
Operations, maintenance, and administration |
| 418 |
| 32 |
| 66 |
| 516 |
|
Depreciation and amortization |
| 501 |
| 1 |
| 23 |
| 525 |
|
Asset impairment charges (reversals) |
| (18 | ) | — |
| — |
| (18 | ) |
Inventory writedown |
| 22 |
| — |
| — |
| 22 |
|
Restructuring provision |
| (2 | ) | — |
| (1 | ) | (3 | ) |
Taxes, other than income taxes |
| 26 |
| — |
| 1 |
| 27 |
|
Intersegment cost allocation |
| 14 |
| (14 | ) | — |
| — |
|
Operating income (loss) |
| 326 |
| 60 |
| (89 | ) | 297 |
|
Finance lease income |
| 46 |
| — |
| — |
| 46 |
|
Equity loss |
| (10 | ) | — |
| — |
| (10 | ) |
California claim |
| — |
| (56 | ) | — |
| (56 | ) |
Sundance Units 1 and 2 return to service |
| (25 | ) | — |
| — |
| (25 | ) |
Gain on sale of assets |
| — |
| — |
| 12 |
| 12 |
|
Insurance recovery |
| 8 |
| — |
| — |
| 8 |
|
Foreign exchange gain |
|
|
|
|
|
|
| 1 |
|
Loss on assumption of pension obligations |
|
|
|
|
|
|
| (29 | ) |
Net interest expense |
|
|
|
|
|
|
| (256 | ) |
Loss before income taxes |
|
|
|
|
|
|
| (12 | ) |
Year ended Dec. 31, 2012 (Restated)* |
| Generation |
| Energy |
| Corporate |
| Total |
|
Revenues |
| 2,207 |
| 3 |
| — |
| 2,210 |
|
Fuel and purchased power |
| 753 |
| — |
| — |
| 753 |
|
Gross margin |
| 1,454 |
| 3 |
| — |
| 1,457 |
|
Operations, maintenance, and administration |
| 388 |
| 29 |
| 82 |
| 499 |
|
Depreciation and amortization |
| 489 |
| — |
| 20 |
| 509 |
|
Asset impairment charges |
| 324 |
| — |
| — |
| 324 |
|
Inventory writedown |
| 44 |
| — |
| — |
| 44 |
|
Restructuring provision |
| 5 |
| — |
| 8 |
| 13 |
|
Taxes, other than income taxes |
| 27 |
| — |
| 1 |
| 28 |
|
Intersegment cost allocation |
| 13 |
| (13 | ) | — |
| — |
|
Operating income (loss) |
| 164 |
| (13 | ) | (111 | ) | 40 |
|
Finance lease income |
| 16 |
| — |
| — |
| 16 |
|
Equity loss |
| (15 | ) | — |
| — |
| (15 | ) |
Sundance Units 1 and 2 return to service |
| (254 | ) | — |
| — |
| (254 | ) |
Gain on sale of assets |
| 3 |
| — |
| — |
| 3 |
|
Gain on sale of collateral |
| — |
| 15 |
| — |
| 15 |
|
Other income |
|
|
|
|
|
|
| 1 |
|
Foreign exchange loss |
|
|
|
|
|
|
| (9 | ) |
Net interest expense |
|
|
|
|
|
|
| (242 | ) |
Loss before income taxes |
|
|
|
|
|
|
| (445 | ) |
* Please refer to Note 3 of our audited consolidated financial statements within our 2013 Annual Report for additional information regarding the restatements.
Coal: TransAlta owns and operates coal-fired facilities and related mining operations in Canada and the U.S. Coal revenues and overall profitability are derived from the availability and production of electricity. For a full listing of all of our generating assets and the regions in which they operate, refer to the Plant Summary section of our 2013 Annual MD&A.
Canadian Coal
During 2013, we completed the restoration of Sundance Units 1 and 2. For further information please refer to the Significant Events section of our 2013 Annual MD&A.
|
| 3 months ended Dec. 31 |
| Year ended Dec. 31 |
| ||||
|
| 2013 |
| 2012 |
| 2013 |
| 2012 |
|
Production (GWh) |
| 6,643 |
| 5,285 |
| 21,568 |
| 20,265 |
|
Installed capacity (MW) |
| 3,576 |
| 3,012 |
| 3,576 |
| 3,012 |
|
|
|
|
|
|
|
|
|
|
|
Revenues |
| 251 |
| 239 |
| 916 |
| 913 |
|
Fuel and purchased power |
| 144 |
| 110 |
| 451 |
| 383 |
|
Comparable gross margin(1) |
| 107 |
| 129 |
| 465 |
| 530 |
|
Operations, maintenance, and administration |
| 53 |
| 47 |
| 201 |
| 195 |
|
Taxes, other than income taxes |
| 2 |
| 1 |
| 11 |
| 10 |
|
Intersegment cost allocation |
| 1 |
| 1 |
| 4 |
| 3 |
|
Gain on sale of property, plant, and equipment |
| (1 | ) | (7 | ) | (2 | ) | (10 | ) |
Mine depreciation |
| (16 | ) | (15 | ) | (58 | ) | (41 | ) |
Comparable EBITDA(1) |
| 68 |
| 102 |
| 309 |
| 373 |
|
Depreciation and amortization |
| 82 |
| 73 |
| 292 |
| 268 |
|
Other(2) |
| — |
| — |
| — |
| (20 | ) |
Comparable operating income (loss)(1) |
| (14 | ) | 29 |
| 17 |
| 125 |
|
|
|
|
|
|
|
|
|
|
|
Sustaining expenditures: |
|
|
|
|
|
|
|
|
|
Routine capital |
| 26 |
| 14 |
| 69 |
| 59 |
|
Mining equipment and land purchases |
| 15 |
| 9 |
| 65 |
| 38 |
|
Finance leases |
| 2 |
| — |
| 9 |
| — |
|
Planned major maintenance(3) |
| 7 |
| 45 |
| 94 |
| 219 |
|
Total sustaining expenditures |
| 50 |
| 68 |
| 237 |
| 316 |
|
Production for the three months ended Dec. 31, 2013 increased 1,358 GWh compared to the same period in 2012 due to Sundance Units 1 and 2 returning to service, lower planned outages at the Alberta coal PPA facilities and Genesee Unit 3, partially offset by higher unplanned outages at the Alberta coal PPA facilities, primarily driven by the Keephills Unit 1 force majeure outage.
For the three months ended Dec. 31, 2013, comparable EBITDA decreased by $34 million compared to the same period in 2012 due to higher coal costs, unfavourable market pricing, higher unplanned outages at the Alberta coal PPA facilities, and an increase in OM&A, partially offset by lower planned outages at the Alberta coal PPA facilities and Genesee Unit 3. Coal costs increased as a result of an increased asset base from the mine transition and the normal advancement of the mine. OM&A increased as a result of Sundance Units 1 and 2 returning to service and higher routine maintenance costs.
(1) Comparable figures are not defined under IFRS. Refer to the Non-IFRS Measures section of this MD&A for further discussion of these items, including, where applicable, reconciliations to net earnings attributable to common shareholders and cash flow from operating activities.
(2) Impacts to revenue associated with Sundance Units 1 and 2 to provide period over period comparability.
(3) Consists of no planned outages in the fourth quarter of 2013, two planned outages in the fourth quarter of 2012, three planned outages in 2013, and six planned outages in 2012.
Depreciation and amortization for the three months ended Dec. 31, 2013 increased by $9 million compared to the same period in 2012 due to an increased asset base.
For the three months ended Dec. 31, 2013, the decrease in sustaining capital expenditures compared to 2012 is mainly due to the lower number of planned outages.
Production for the year ended Dec. 31, 2013 increased 1,303 GWh compared to 2012 due to Sundance Units 1 and 2 returning to service, lower planned outages at the Alberta coal PPA facilities, lower market curtailments, and higher PPA customer demand, partially offset by higher unplanned outages at the Alberta coal PPA facilities, primarily driven by the Keephills Unit 1 force majeure outage.
For the year ended Dec. 31, 2013, comparable EBITDA decreased by $64 million compared to 2012 due to lower realized prices, higher penalties, higher coal costs, and higher unplanned outages at the Alberta coal PPA facilities, partially offset by lower planned outages at the Alberta coal PPA facilities and lower market curtailments. Coal costs increased as a result of an increased asset base from the mine transition and the normal advancement of the mine.
Depreciation and amortization for the year ended Dec. 31, 2013 increased by $24 million compared to 2012 due to an increased asset base and an increase in mine depreciation, partially offset by a decrease in asset retirements and the effect of the change of the economic useful lives of certain plants during 2012.
For the year ended Dec. 31, 2013, the decrease in sustaining capital expenditures compared to 2012 is mainly due to the lower number of planned outages, offset by higher mining equipment purchases.
U.S. Coal
|
| 3 months ended Dec. 31 |
| Year ended Dec. 31 |
| ||||
|
| 2013 |
| 2012 |
| 2013 |
| 2012 |
|
Production (GWh) |
| 2,480 |
| 2,090 |
| 6,711 |
| 3,736 |
|
Installed capacity (MW) |
| 1,340 |
| 1,340 |
| 1,340 |
| 1,340 |
|
|
|
|
|
|
|
|
|
|
|
Revenues |
| 113 |
| 128 |
| 346 |
| 368 |
|
Fuel and purchased power |
| 84 |
| 67 |
| 205 |
| 150 |
|
Comparable gross margin |
| 29 |
| 61 |
| 141 |
| 218 |
|
Operations, maintenance, and administration |
| 12 |
| 11 |
| 43 |
| 39 |
|
Inventory writedown |
| 1 |
| 10 |
| 22 |
| 19 |
|
Taxes, other than income taxes |
| 1 |
| 2 |
| 4 |
| 6 |
|
Intersegment cost allocation |
| 1 |
| 2 |
| 6 |
| 7 |
|
Gain on sale of property, plant, and equipment |
| — |
| (1 | ) | — |
| (1 | ) |
Comparable EBITDA |
| 14 |
| 37 |
| 66 |
| 148 |
|
Depreciation and amortization |
| 15 |
| 12 |
| 56 |
| 66 |
|
Comparable operating income (loss) |
| (1 | ) | 25 |
| 10 |
| 82 |
|
|
|
|
|
|
|
|
|
|
|
Sustaining expenditures: |
|
|
|
|
|
|
|
|
|
Routine capital |
| 1 |
| 2 |
| 6 |
| 10 |
|
Planned major maintenance |
| 2 |
| 4 |
| 10 |
| 22 |
|
Total sustaining expenditures |
| 3 |
| 6 |
| 16 |
| 32 |
|
Production for the three months ended Dec. 31, 2013 increased 390 GWh compared to the same period in 2012 due to lower economic dispatching at Centralia Thermal and lower unplanned outages at Centralia Thermal.
For the three months ended Dec. 31, 2013, comparable EBITDA decreased by $23 million compared to the same period in 2012, primarily due to lower pricing, including margins on purchased power, partially offset by favourable coal pricing.
Depreciation and amortization for the three months ended Dec. 31, 2013 increased by $3 million compared to the same period in 2012 due to an increased asset base.
Production for the year ended Dec. 31, 2013 increased 2,975 GWh compared to 2012 due to lower economic dispatching at Centralia Thermal, driven by improving market conditions, partially offset by higher planned outages at Centralia Thermal.
For the year ended Dec. 31, 2013, comparable EBITDA decreased by $82 million compared to 2012 due to contracts expiring and lower spot prices, partially offset by favourable coal pricing.
Depreciation and amortization for the year ended Dec. 31, 2013 decreased by $10 million compared to 2012 due to the impact of a lower asset base as a result of asset impairments.
For the year ended Dec. 31, 2013, the decrease in sustaining capital expenditures compared to 2012 is mainly due to the lower expenditures on planned outages.
Gas: TransAlta owns and operates natural gas-fired facilities in Canada and Australia. Gas revenues and overall profitability are derived from the availability and production of electricity and steam. For a full listing of all of our generating assets and the regions in which they operate, refer to the Plant Summary section of our 2013 Annual MD&A.
|
| 3 months ended Dec. 31 |
| Year ended Dec. 31 |
| ||||
|
| 2013 |
| 2012 |
| 2013 |
| 2012 |
|
Production (GWh)(1) |
| 1,886 |
| 1,989 |
| 7,854 |
| 8,230 |
|
Installed capacity (MW)(1) |
| 1,567 |
| 1,567 |
| 1,567 |
| 1,567 |
|
|
|
|
|
|
|
|
|
|
|
Revenues |
| 144 |
| 173 |
| 636 |
| 607 |
|
Fuel and purchased power |
| 48 |
| 68 |
| 252 |
| 226 |
|
Comparable gross margin |
| 96 |
| 105 |
| 384 |
| 381 |
|
Operations, maintenance, and administration |
| 26 |
| 20 |
| 100 |
| 86 |
|
Taxes, other than income taxes |
| — |
| 1 |
| 3 |
| 4 |
|
Intersegment cost allocation |
| 1 |
| — |
| 2 |
| 1 |
|
Finance lease income |
| (12 | ) | (12 | ) | (47 | ) | (19 | ) |
Gain on sale of property, plant, and equipment |
| — |
| (3 | ) | — |
| (3 | ) |
Insurance recovery |
| (1 | ) | — |
| (1 | ) | — |
|
Comparable EBITDA |
| 82 |
| 99 |
| 327 |
| 312 |
|
Depreciation and amortization |
| 28 |
| 30 |
| 107 |
| 109 |
|
Other |
| — |
| 1 |
| 1 |
| 3 |
|
Comparable operating income |
| 54 |
| 68 |
| 219 |
| 200 |
|
|
|
|
|
|
|
|
|
|
|
Sustaining expenditures: |
|
|
|
|
|
|
|
|
|
Routine capital |
| 7 |
| 5 |
| 17 |
| 13 |
|
Planned major maintenance |
| 17 |
| 15 |
| 41 |
| 36 |
|
Total sustaining expenditures |
| 24 |
| 20 |
| 58 |
| 49 |
|
(1) Includes production and net ownership capacity for Fort Saskatchewan, a natural gas-fired facility that has been accounted for as a finance lease.
Production for the three months ended Dec. 31, 2013 decreased 103 GWh compared to the same period in 2012 due to higher contract curtailments at our Ottawa facility, partially offset by lower customer demand and lower planned outages at our Sarnia facility.
For the three months ended Dec. 31, 2013, comparable EBITDA decreased by $17 million compared to the same period in 2012 due to lower pricing and higher OM&A due to higher routine maintenance.
Depreciation and amortization for the three months ended Dec. 31, 2013 decreased by $2 million compared to the same period in 2012 due to an increase in asset retirements.
Production for the year ended Dec. 31, 2013 decreased 376 GWh compared to 2012 due to higher contract and market curtailments at our Ottawa and Sarnia facilities, partially offset by lower unplanned outages at our Sarnia facility.
For the year ended Dec. 31, 2013, comparable EBITDA increased by $15 million compared to 2012 due to a full year of income from the Solomon power station that was acquired in August 2012, partially offset by higher OM&A costs resulting from higher routine maintenance.
Depreciation and amortization for the year ended Dec. 31, 2013 decreased by $2 million compared to 2012 due to a decrease in asset retirements and favourable changes in foreign exchange rates.
Renewables: TransAlta owns and operates hydro and wind facilities in Canada and the U.S. Renewable revenues and overall profitability are derived from the availability of water and wind resources and the production of electricity, as well as ancillary services such as system support. For a full listing of all of our generating assets and the regions in which they operate, refer to the Plant Summary section of our 2013 Annual MD&A.
Wind
During 2013, we began commercial operations at New Richmond, a 68 MW wind farm in Québec. We also completed the acquisition of a 144 MW wind farm in Wyoming through one of our wholly owned subsidiaries. For further information please refer to the Significant Events section of our 2013 Annual MD&A.
|
| 3 months ended Dec. 31 |
| Year ended Dec. 31 |
| ||||
|
| 2013 |
| 2012 |
| 2013 |
| 2012 |
|
Production (GWh) |
| 872 |
| 750 |
| 2,709 |
| 2,583 |
|
Installed capacity (MW) |
| 1,077 |
| 1,061 |
| 1,077 |
| 1,061 |
|
|
|
|
|
|
|
|
|
|
|
Revenues |
| 73 |
| 67 |
| 237 |
| 207 |
|
Fuel and purchased power |
| 4 |
| 3 |
| 13 |
| 12 |
|
Comparable gross margin |
| 69 |
| 64 |
| 224 |
| 195 |
|
Operations, maintenance, and administration |
| 10 |
| 9 |
| 38 |
| 38 |
|
Taxes, other than income taxes |
| 1 |
| 1 |
| 5 |
| 5 |
|
Intersegment cost allocation |
| — |
| — |
| 1 |
| 1 |
|
Comparable EBITDA |
| 58 |
| 54 |
| 180 |
| 151 |
|
Depreciation and amortization |
| 21 |
| 18 |
| 79 |
| 72 |
|
Comparable operating income |
| 37 |
| 36 |
| 101 |
| 79 |
|
|
|
|
|
|
|
|
|
|
|
Sustaining expenditures: |
|
|
|
|
|
|
|
|
|
Routine capital |
| 2 |
| 1 |
| 3 |
| 2 |
|
Planned major maintenance |
| 3 |
| 1 |
| 6 |
| 2 |
|
Total sustaining expenditures |
| 5 |
| 2 |
| 9 |
| 4 |
|
Production for the three months ended Dec. 31, 2013 increased 122 GWh compared to the same period in 2012 due to higher wind resources and the commencement of commercial operations at New Richmond, partially offset by higher unplanned outages.
For the three months ended Dec. 31, 2013, comparable EBITDA increased by $4 million compared to the same period in 2012 due to the commencement of commercial operations at New Richmond and higher wind volumes, partially offset by a decrease in prices in Alberta.
Depreciation and amortization for the three months ended Dec. 31, 2013 increased by $3 million compared to the same period in 2012 due to the commencement of operations at New Richmond.
Production for the year ended Dec. 31, 2013 increased 126 GWh compared to 2012 due to the commencement of commercial operations at New Richmond.
For the year ended Dec. 31, 2013, comparable EBITDA increased by $29 million compared to 2012 due to the commencement of commercial operations at New Richmond and higher Alberta merchant prices.
Depreciation and amortization for the year ended Dec. 31, 2013 increased by $7 million compared to 2012 due to the commencement of operations at New Richmond.
Hydro
|
| 3 months ended Dec. 31 |
| Year ended Dec. 31 |
| ||||
|
| 2013 |
| 2012 |
| 2013 |
| 2012 |
|
Production (GWh) |
| 368 |
| 397 |
| 2,085 |
| 2,356 |
|
Installed capacity (MW) |
| 893 |
| 913 |
| 893 |
| 913 |
|
|
|
|
|
|
|
|
|
|
|
Revenues |
| 23 |
| 40 |
| 181 |
| 164 |
|
Fuel and purchased power |
| (2 | ) | 2 |
| 5 |
| 7 |
|
Comparable gross margin |
| 25 |
| 38 |
| 176 |
| 157 |
|
Operations, maintenance, and administration |
| 9 |
| 6 |
| 31 |
| 27 |
|
Taxes, other than income taxes |
| 1 |
| — |
| 3 |
| 2 |
|
Intersegment cost allocation |
| — |
| — |
| 1 |
| 1 |
|
Insurance recovery |
| (6 | ) | — |
| (6 | ) | — |
|
Comparable EBITDA |
| 21 |
| 32 |
| 147 |
| 127 |
|
Depreciation and amortization |
| 6 |
| 7 |
| 25 |
| 29 |
|
Comparable operating income |
| 15 |
| 25 |
| 122 |
| 98 |
|
|
|
|
|
|
|
|
|
|
|
Sustaining expenditures: |
|
|
|
|
|
|
|
|
|
Routine capital |
| 5 |
| 2 |
| 9 |
| 7 |
|
Planned major maintenance |
| 4 |
| 4 |
| 5 |
| 7 |
|
Total sustaining expenditures |
| 9 |
| 6 |
| 14 |
| 14 |
|
Production for the three months ended Dec. 31, 2013 decreased by 29 GWh compared to the same period in 2012 due to lower water resources.
For the three months ended Dec. 31, 2013, comparable EBITDA decreased by $11 million compared to the same period in 2012 due to lower prices and lower water resources.
Depreciation and amortization for the three months ended Dec. 31, 2013 was comparable to the same period in 2012.
Production for the year ended Dec. 31, 2013 decreased by 271 GWh compared to 2012 due to lower water resources.
For the year ended Dec. 31, 2013, comparable EBITDA increased by $20 million compared to 2012 due to favourable prices, partially offset by lower water resources.
Depreciation and amortization for the year ended Dec. 31, 2013 decreased by $4 million compared to 2012 due to a change in the useful lives of the hydro assets during 2013.
Asset Impairment Charges and Reversals
Renewables
During 2013, we recognized a total pre-tax impairment charge of $4 million related to three contracted hydro assets within the renewables fleet. The assets were impaired primarily due to an increase in future capital and operating expenses that resulted from the completion of condition assessments. The annual impairment assessments are based on estimates of fair value less costs to sell derived from long range forecasts. The impairment losses are included in the Generation Segment.
Alberta Merchant
As part of the annual impairment review and assessment process in 2013, it was determined that our Alberta plants with significant merchant capacity, should be considered one cash-generating unit (the “Alberta Merchant CGU”). Previously, each plant was assessed for impairment individually. The reasons for this change include consideration of the Final Regulations published by the Canadian federal government in September 2012 governing Greenhouse Gas (“GHG”) emissions and the 50-year total life for Canadian coal-fired power plants; and the refinement of our risk management approach and practices regarding our Alberta wholesale market price exposure. The Final Regulations confirmed additional operating time and increased flexibility for our Alberta coal plants and led, in part, to a broadening of our view on the management of our Alberta wholesale market price exposure. While no impairment losses were recognized in 2013 for the Alberta Merchant CGU, total pre-tax impairment losses of $23 million that were recognized previously on renewables plants that now form part of the Alberta Merchant CGU were reversed. The Alberta Merchant CGU’s recoverable amount was based on an estimate of fair value less costs to sell using a discounted cash flow methodology, based on our long range forecasts and prices evidenced in the marketplace.
The pre-tax reversal is recognized in the Generation Segment.
Centralia Thermal
The TransAlta Energy Bill and a Memorandum of Agreement that was signed on Dec. 23, 2011 provided a framework for the orderly transition from coal-fired energy produced at Centralia Thermal and the shutdown of the units in 2020 and 2025. On July 25, 2012, we announced that we entered into a long-term power agreement to provide electricity from the Centralia Thermal plant to Puget Sound Energy from December 2014 until the facility is fully retired in 2025. As a result of these agreements, we recognized a pre-tax impairment charge of nil and $347 million included in the Generation Segment during the three months and year ended Dec. 31, 2012, respectively. The impairment assessment was based on whether the carrying amount of the Centralia Thermal plant was recoverable based on an estimate of fair value less costs to sell.
In 2013 and 2012, $28 million and $169 million, respectively, of deferred income tax assets were written off related to the tax benefits of losses associated with our U.S. operations. We wrote these assets off as it was no longer considered probable that sufficient taxable income would be available from our existing U.S. operations to utilize the underlying tax losses. An increase in future U.S. income will allow us to write up our deferred income tax assets in future periods.
Reversals
Impairment charges can be reversed in future periods if the forecasted cash flows to be generated by the impacted plants improve.
Equity Investments
Our investments in joint ventures are accounted for using the equity method and consist of our investments in CE Gen, Wailuku, TAMA Transmission, and CalEnergy, LLC (“CalEnergy”).
Our interests in the CE Gen and Wailuku joint ventures are comprised of geothermal, natural gas, and hydro facilities in various locations throughout the U.S., with 852 MW of gross generating capacity (396 MW net ownership interest). The table below summarizes key operational information adjusted to reflect our interest in these investments:
|
| 3 months ended Dec. 31 |
| Year ended Dec. 31 |
| ||||
|
| 2013 |
| 2012 |
| 2013 |
| 2012 |
|
Availability (%) |
| 94.3 |
| 93.8 |
| 91.2 |
| 94.2 |
|
Production (GWh): |
|
|
|
|
|
|
|
|
|
Gas |
| 84 |
| 90 |
| 385 |
| 380 |
|
Renewables |
| 307 |
| 279 |
| 1,170 |
| 1,200 |
|
Total production |
| 391 |
| 369 |
| 1,555 |
| 1,580 |
|
Availability for the three months ended Dec. 31, 2013 increased compared to the same period in 2012 due to lower unplanned outages.
Production for the three months ended Dec. 31, 2013 increased by 22 GWh compared to the same period in 2012 due to an increase in customer demand and lower unplanned outages.
Equity loss for the three months ended Dec. 31, 2013 was $5 million compared to $10 million for the same period in 2012. The reduction of the loss is primarily due to lower unplanned outages and favourable pricing.
Availability for the year ended Dec. 31, 2013 decreased compared to 2012 due to higher planned and unplanned outages.
Production for the year ended Dec. 31, 2013 decreased by 25 GWh compared to 2012 due to higher planned and unplanned outages, partially offset by an increase in customer demand.
Equity loss for the year ended Dec. 31, 2013 was $10 million compared to $15 million for 2012. The reduction of the loss is primarily due to favourable pricing and favourable changes in foreign exchange rates, partially offset by higher planned and unplanned outages.
Since 2001, a significant portion of the output from the CE Gen plants has been subject to modified fixed energy price contracts. Commencing May 1, 2012, the terms of the contracts reverted to a pricing clause that permits the power purchaser to pay their short-run avoided costs (“SRAC”) as the price for power. The SRAC is linked to the price of natural gas. There can be no assurances that prices based on the avoided cost of energy after May 1, 2012 will result in revenues equivalent to those realized under the fixed energy price structure.
On Sept. 17, 2013, we announced that CalEnergy, a joint venture with MidAmerican Energy Holdings Company, executed a 50 MW long-term contract for renewable geothermal power with Salt River Project, an Arizona utility, which runs from 2016 to 2039.
On June 18, 2013, we also announced that CalEnergy had executed an 86 MW long-term contract for renewable geothermal power with the City of Riverside that runs from 2016 to 2039. CalEnergy will purchase the power from CE Gen’s portfolio of geothermal generating facilities in California’s Imperial Valley.
Energy Trading: Derives revenue and earnings from the wholesale trading of electricity and other energy-related commodities and derivatives. Achieving gross margins, while remaining within Value at Risk (“VaR”) limits, is a key measure of Energy Trading’s activities. Refer to the Value at Risk and Trading Positions discussion in the Risk Management section of our 2013 Annual MD&A for further discussion on VaR.
Energy Trading utilizes contracts of various durations for the forward purchase and sale of electricity and for the purchase and sale of natural gas and transmission capacity. If the activities are performed on behalf of the Generating Segment, the results of these activities are included in the Generating Segment.
For a more in-depth discussion of our Energy Trading activities, refer to the Discussion of Segmented Results section of our 2013 Annual MD&A.
The results of the Energy Trading Segment, with all trading results presented on a net basis, are as follows:
|
| 3 months ended Dec. 31 |
| Year ended Dec. 31 |
| ||||
|
| 2013 |
| 2012 |
| 2013 |
| 2012 |
|
Revenues |
| 26 |
| 13 |
| 79 |
| 3 |
|
Fuel and purchased power |
| — |
| — |
| — |
| — |
|
Comparable gross margin |
| 26 |
| 13 |
| 79 |
| 3 |
|
Operations, maintenance, and administration |
| 9 |
| 8 |
| 32 |
| 29 |
|
Intersegment cost allocation |
| (3 | ) | (3 | ) | (14 | ) | (13 | ) |
Comparable EBITDA |
| 20 |
| 8 |
| 61 |
| (13 | ) |
Depreciation and amortization |
| — |
| — |
| 1 |
| — |
|
Comparable operating income (loss) |
| 20 |
| 8 |
| 60 |
| (13 | ) |
|
|
|
|
|
|
|
|
|
|
Capital expenditures: |
|
|
|
|
|
|
|
|
|
|
|
|
|
|
|
|
|
|
|
Total capital expenditures |
| — |
| — |
| — |
| — |
|
For the three months ended Dec. 31, 2013, Energy Trading comparable EBITDA increased $12 million due to increased value from trading around power and gas assets, prudent management of risk, increased customer margins, and favourable market conditions driven largely by extreme weather events during the quarter.
The intersegment allocation for the three months ended Dec. 31, 2013 was comparable to the same period in 2012.
For the year ended Dec. 31, 2013, Energy Trading comparable EBITDA increased by $74 million compared to 2012 due to strong trading performance across all markets and prudent management of risk. The increase is attributable to successful trading strategies involving regional power demand and price differentials across all markets.
Corporate: Our Generation and Energy Trading segments are supported by a Corporate group that provides finance, tax, treasury, legal, regulatory, environmental, procurement, health and safety, sustainable development, corporate communications, government and investor relations, information technology, risk management, human resources, internal audit, and other administrative support.
The expenses incurred by the Corporate Segment are as follows:
|
| 3 months ended Dec. 31 |
| Year ended Dec. 31 |
| ||||
|
| 2013 |
| 2012 |
| 2013 |
| 2012 |
|
Operations, maintenance, and administration |
| 21 |
| 19 |
| 66 |
| 82 |
|
Taxes, other than income taxes |
| — |
| 1 |
| 1 |
| 1 |
|
Comparable EBITDA |
| (21 | ) | (20 | ) | (67 | ) | (83 | ) |
Depreciation and amortization |
| 6 |
| 5 |
| 23 |
| 20 |
|
Comparable operating loss |
| (27 | ) | (25 | ) | (90 | ) | (103 | ) |
|
|
|
|
|
|
|
|
|
|
Sustaining expenditures: |
|
|
|
|
|
|
|
|
|
Routine capital |
| 8 |
| 10 |
| 22 |
| 24 |
|
Total sustaining expenditures |
| 8 |
| 10 |
| 22 |
| 24 |
|
For the year ended Dec. 31, 2013, OM&A expense decreased by $16 million compared to 2012, primarily due to lower compensation costs as a result of restructuring in the fourth quarter of 2012 and a continued focus on managing costs, partially offset by a decrease as a result of the way in which certain overhead cost allocations are made within the organization. These changes in methodologies primarily arose as a result of our 2012 realignment of resources and more clear focus between base operations and growth.
NET INTEREST EXPENSE
The components of net interest expense are shown below:
|
| 3 months ended Dec. 31 |
| Year ended Dec. 31 |
| ||||
|
| 2013 |
| 2012 |
| 2013 |
| 2012 |
|
Interest on debt |
| 61 |
| 60 |
| 240 |
| 227 |
|
Interest income |
| — |
| (1 | ) | — |
| (2 | ) |
Capitalized interest |
| — |
| (2 | ) | (2 | ) | (4 | ) |
Ineffectiveness on hedges |
| — |
| 1 |
| — |
| 4 |
|
Other |
| — |
| (1 | ) | — |
| — |
|
Interest expense |
| 61 |
| 57 |
| 238 |
| 225 |
|
Accretion of provisions |
| 5 |
| 3 |
| 18 |
| 17 |
|
Net interest expense |
| 66 |
| 60 |
| 256 |
| 242 |
|
The change in net interest expense for the three months and year ended Dec. 31, 2013, compared to the same periods in 2012, is shown below:
|
| 3 months ended |
| Year ended |
|
Net interest expense, 2012 |
| 60 |
| 242 |
|
Higher debt levels |
| — |
| 3 |
|
Unfavourable foreign exchange impacts |
| 1 |
| 4 |
|
Lower financing costs |
| (2 | ) | — |
|
Higher interest rates |
| 2 |
| 5 |
|
Lower capitalized interest |
| 2 |
| 2 |
|
Lower ineffectiveness on hedges |
| (1 | ) | (4 | ) |
Lower interest income |
| 1 |
| 2 |
|
Higher accretion |
| 2 |
| 1 |
|
Other |
| 1 |
| 1 |
|
Net interest expense, 2013 |
| 66 |
| 256 |
|
INCOME TAXES
A reconciliation of income taxes and effective tax rates on earnings, excluding non-comparable items, is presented below:
|
| 3 months ended Dec. 31 |
| Year ended Dec. 31 |
| ||||
|
| 2013 |
| 2012 |
| 2013 |
| 2012 |
|
Earnings (loss) before income taxes |
| (92 | ) | 72 |
| (12 | ) | (445 | ) |
(Income) loss attributable to non-controlling interests |
| (13 | ) | (12 | ) | (29 | ) | (37 | ) |
Equity loss |
| 5 |
| 10 |
| 10 |
| 15 |
|
Impacts associated with certain de-designated and ineffective hedges |
| 43 |
| 14 |
| 103 |
| 72 |
|
Asset impairment charges (reversal) |
| — |
| — |
| (18 | ) | 324 |
|
Inventory writedown (reversal) |
| — |
| (5 | ) | — |
| — |
|
Restructuring provision |
| — |
| 13 |
| (3 | ) | 13 |
|
Gain on sale of assets |
| (2 | ) | — |
| (12 | ) | (3 | ) |
Sundance Units 1 and 2 return to service |
| 10 |
| — |
| 25 |
| 254 |
|
Gain on sale of collateral |
| — |
| — |
| — |
| (15 | ) |
Loss on assumption of pension obligations |
| — |
| — |
| 29 |
| — |
|
Insurance recovery |
| (1 | ) | — |
| (1 | ) | — |
|
California claim |
| 56 |
| — |
| 56 |
| — |
|
Other non-comparable items |
| 2 |
| — |
| 7 |
| 3 |
|
Earnings attributable to TransAlta shareholders, excluding non-comparable items, subject to tax |
| 8 |
| 92 |
| 155 |
| 181 |
|
Income tax expense (recovery) |
| (49 | ) | 11 |
| (8 | ) | 102 |
|
Income tax recovery related to impacts associated with certain de-designated and ineffective hedges |
| 15 |
| 5 |
| 36 |
| 25 |
|
Income tax expense related to asset impairment charges (reversals) |
| — |
| — |
| (5 | ) | (5 | ) |
Income tax expense related to inventory writedown (reversal) |
| — |
| (2 | ) | — |
| — |
|
Income tax (expense) recovery related to restructuring provision |
| — |
| 3 |
| (1 | ) | 3 |
|
Income tax expense related to gain on sale of assets |
| (1 | ) | — |
| (2 | ) | (1 | ) |
Income tax recovery related to Sundance Units 1 and 2 return to service |
| 2 |
| — |
| 6 |
| 65 |
|
Income tax expense related to gain on sale of collateral |
| — |
| — |
| — |
| (4 | ) |
Income tax (expense) recovery related to write off of deferred income tax assets |
| 12 |
| — |
| (28 | ) | (169 | ) |
Income tax recovery related to the resolution of certain outstanding tax matters |
| — |
| — |
| — |
| 9 |
|
Income tax (expense) recovery related to changes in corporate income tax rates |
| (2 | ) | — |
| 5 |
| (8 | ) |
Income tax recovery related to loss on assumption of pension obligations |
| — |
| — |
| 7 |
| — |
|
Income tax recovery related to California claim |
| 14 |
| — |
| 14 |
| — |
|
Income tax recovery related to other non-comparable items |
| 1 |
| — |
| 2 |
| 1 |
|
Income tax expense (recovery) excluding non-comparable items |
| (8 | ) | 17 |
| 26 |
| 18 |
|
Effective tax rate on earnings attributable to TransAlta shareholders excluding non-comparable items (%) |
| (100 | ) | 18 |
| 17 |
| 10 |
|
The income tax expense excluding non-comparable items for the three months ended Dec. 31, 2013 decreased compared to the same period in 2012 due to lower comparable earnings and changes in the amount of earnings between the jurisdictions in which pre-tax income is earned.
The effective tax rate on earnings attributable to TransAlta shareholders excluding non-comparable items for the three months ended Dec. 31, 2013 decreased compared to the same period in 2012 due to changes in the amount of earnings between the jurisdictions in which pre-tax income is earned and the effect of certain deductions that do not fluctuate with earnings.
The income tax expense excluding non-comparable items for the year ended Dec. 31, 2013 increased compared to 2012 due to the positive resolution of certain tax contingency matters in the prior period and changes in the amount of earnings between the jurisdictions in which pre-tax income is earned.
For the year ended Dec. 31, 2013, the effective tax rate on earnings attributable to TransAlta shareholders excluding non-comparable items increased compared to 2012 due to changes in the amount of earnings between the jurisdictions in which pre-tax income is earned, the effect of certain deductions that do not fluctuate with earnings, and due to the positive resolution of certain tax contingency matters in the prior period.
NON-CONTROLLING INTERESTS
Net earnings attributable to non-controlling interests for the three months ended Dec. 31, 2013 increased $1 million compared to the same period in 2012, primarily due to earnings at TransAlta Renewables Inc. (“TransAlta Renewables”). Net earnings attributable to non-controlling interests for the year ended Dec. 31, 2013 decreased $8 million compared to 2012, primarily due to lower earnings at TransAlta Cogeneration, L.P.
ADDITIONAL IFRS MEASURES
An additional IFRS measure is a line item, heading, or subtotal that is relevant to an understanding of the financial statements but is not a minimum line item mandated under IFRS, or the presentation of a financial measure that is relevant to an understanding of the financial statements but is not presented elsewhere in the financial statements. We have included line items entitled gross margin and operating income (loss) in our Consolidated Statements of Earnings (Loss) for the three months and years ended Dec. 31, 2013 and 2012. Presenting these line items provides management and investors with a measurement of ongoing operating performance that is readily comparable from period to period.
NON-IFRS MEASURES
We evaluate our performance and the performance of our business segments using a variety of measures. Those discussed below, and elsewhere in this news release, are not defined under IFRS and, therefore, should not be considered in isolation or as an alternative to or to be more meaningful than net earnings attributable to common shareholders or cash flow from operating activities, as determined in accordance with IFRS, when assessing our financial performance or liquidity. These Non-IFRS measures are not necessarily comparable to a similarly titled measure of another company.
Presenting earnings on a comparable basis, comparable gross margin, comparable operating income, and comparable EBITDA from period to period provides management and investors with supplemental information to evaluate earnings trends in comparison with results from prior periods. In calculating these items, we exclude the impact related to certain hedges that are either de-designated or deemed ineffective for accounting purposes, as management believes that these transactions are not representative of our business operations. As these gains (losses) have already been recognized in earnings in current or prior periods, future reported earnings will be lower; however, the expected cash flows from these contracts will not change. In calculating comparable earnings measures we have also excluded the 2012 coal inventory writedown, as the recognition of the writedown is related to the hedges that were de-designated or deemed ineffective during prior periods.
Other adjustments to earnings, such as those included in the earnings on a comparable basis calculation, have also been excluded as management believes these transactions are not representative of our business operations. Earnings on a comparable basis per share are calculated using the weighted average common shares outstanding during the period.
Presenting comparable EBITDA from period to period provides management and investors with a proxy for the amount of cash generated from operating activities before net interest expense, non-controlling interests, income taxes, and working capital adjustments.
Comparable operating income and EBITDA also include the earnings from the finance lease facilities that we operate. The finance lease income is used as a proxy for the operating income and EBITDA of these facilities.
|
| 3 months ended Dec. 31, 2013 |
| Year ended Dec. 31, 2013 |
| ||||||||
|
| Reported |
| Comparable |
| Comparable |
| Reported |
| Comparable |
| Comparable |
|
Revenues |
| 587 |
| 43 | (1) | 630 |
| 2,292 |
| 103 | (1) | 2,395 |
|
Fuel and purchased power |
| 278 |
| — |
| 278 |
| 926 |
| — |
| 926 |
|
Gross margin |
| 309 |
| 43 |
| 352 |
| 1,366 |
| 103 |
| 1,469 |
|
Operations, maintenance, and administration |
| 140 |
| — |
| 140 |
| 516 |
| (5 | )(9) | 511 |
|
Inventory writedown |
| 1 |
| — |
| 1 |
| 22 |
| — |
| 22 |
|
Taxes, other than income taxes |
| 5 |
| — |
| 5 |
| 27 |
| — |
| 27 |
|
Finance lease income |
| (12 | ) | — |
| (12 | ) | (46 | ) | (1 | )(10) | (47 | ) |
Insurance recovery |
| — |
| (7 | )(2) | (7 | ) | — |
| (7 | )(2) | (7 | ) |
Gain on sale of property, plant, and equipment |
| — |
| (1 | )(3) | (1 | ) | — |
| (2 | )(3) | (2 | ) |
Mine depreciation |
| — |
| (16 | )(4) | (16 | ) | — |
| (58 | )(4) | (58 | ) |
Earnings before interest, taxes, depreciation, and amortization |
| 175 |
| 67 |
| 242 |
| 847 |
| 176 |
| 1,023 |
|
Depreciation and amortization |
| 143 |
| 15 | (5) | 158 |
| 525 |
| 58 | (5) | 583 |
|
Asset impairment reversals |
| — |
| — |
| — |
| (18 | ) | 18 |
| — |
|
Restructuring provision |
| — |
| — |
| — |
| (3 | ) | 3 | (6) | — |
|
Other |
| — |
| — |
| — |
| — |
| 1 | (10) | 1 |
|
Operating income |
| 32 |
| 52 |
| 84 |
| 343 |
| 96 |
| 439 |
|
Equity loss |
| (5 | ) | — |
| (5 | ) | (10 | ) | — |
| (10 | ) |
California claim |
| (56 | ) | 56 | (6) | — |
| (56 | ) | 56 | (6) | — |
|
Sundance Units 1 and 2 return to service |
| (10 | ) | 10 | (6) | — |
| (25 | ) | 25 | (6) | — |
|
Gain on sale of assets |
| 2 |
| (2 | )(6) | — |
| 12 |
| (12 | )(6) | — |
|
Foreign exchange gain |
| 3 |
| — |
| 3 |
| 1 |
| — |
| 1 |
|
Loss on assumption of pension obligations |
| — |
| — |
| — |
| (29 | ) | 29 | (6) | — |
|
Insurance recovery |
| 8 |
| (8 | )(7) | — |
| 8 |
| (8 | )(7) | — |
|
Earnings before interest and taxes |
| (26 | ) | 108 |
| 82 |
| 244 |
| 186 |
| 430 |
|
Net interest expense |
| 66 |
| — |
| 66 |
| 256 |
| — |
| 256 |
|
Income tax expense (recovery) |
| (49 | ) | 41 | (8) | (8 | ) | (8 | ) | 34 | (8) | 26 |
|
Net earnings (loss) |
| (43 | ) | 67 |
| 24 |
| (4 | ) | 152 |
| 148 |
|
Non-controlling interests |
| 13 |
| — |
| 13 |
| 29 |
| — |
| 29 |
|
Net earnings (loss) attributable to TransAlta shareholders |
| (56 | ) | 67 |
| 11 |
| (33 | ) | 152 |
| 119 |
|
Preferred share dividends |
| 10 |
| — |
| 10 |
| 38 |
| — |
| 38 |
|
Net earnings (loss) attributable to common shareholders |
| (66 | ) | 67 |
| 1 |
| (71 | ) | 152 |
| 81 |
|
Weighted average number of common shares outstanding in the period |
| 268 |
|
|
| 268 |
| 264 |
|
|
| 264 |
|
Net earnings (loss) per share attributable to common shareholders |
| (0.25 | ) |
|
| 0.00 |
| (0.27 | ) |
|
| 0.31 |
|
(1) Impacts associated with certain de-designated and ineffective hedges.
(2) Comparable portion of insurance recovery received.
(3) Gain on sale of PP&E that is included in depreciation and amortization for presentation purposes.
(4) Mine depreciation that is included in fuel and purchased power for presentation purposes.
(5) Total adjustments for gain on sale of PP&E, mine depreciation, and flood-related maintenance costs.
(6) Non-comparable item.
(7) Reclassification to include in EBITDA.
(8) Net tax effect of all non-comparable items.
(9) Flood-related maintenance costs.
(10) Decrease in finance lease receivable.
|
| 3 months ended Dec. 31, 2012 (Restated)* |
| Year ended Dec. 31, 2012 (Restated)* |
| ||||||||
|
| Reported |
| Comparable |
| Comparable |
| Reported |
| Comparable |
| Comparable |
|
Revenues |
| 646 |
| 14 | (1) | 660 |
| 2,210 |
| 52 | (9) | 2,262 |
|
Fuel and purchased power |
| 245 |
| 5 | (2) | 250 |
| 753 |
| 25 | (2) | 778 |
|
Gross margin |
| 401 |
| 9 |
| 410 |
| 1,457 |
| 27 |
| 1,484 |
|
Operations, maintenance, and administration |
| 120 |
| — |
| 120 |
| 499 |
| (3 | )(10) | 496 |
|
Inventory writedown |
| 10 |
| — |
| 10 |
| 44 |
| (25 | )(2) | 19 |
|
Taxes, other than income taxes |
| 6 |
| — |
| 6 |
| 28 |
| — |
| 28 |
|
Finance lease income |
| (11 | ) | (1 | )(3) | (12 | ) | (16 | ) | (3 | )(3) | (19 | ) |
Gain on sale of property, plant, and equipment |
| — |
| (11 | )(4) | (11 | ) | — |
| (14 | )(4) | (14 | ) |
Mine depreciation |
| — |
| (15 | )(5) | (15 | ) | — |
| (41 | )(5) | (41 | ) |
Earnings before interest, taxes, depreciation, and amortization |
| 276 |
| 36 |
| 312 |
| 902 |
| 113 |
| 1,015 |
|
Depreciation and amortization |
| 119 |
| 26 | (6) | 145 |
| 509 |
| 55 | (6) | 564 |
|
Asset impairment charges |
| — |
| — |
| — |
| 324 |
| (324 | )(7) | — |
|
Restructuring provision |
| 13 |
| (13 | )(7) | — |
| 13 |
| (13 | )(7) | — |
|
Other |
| — |
| 1 |
| 1 |
| — |
| (17 | )(11) | (17 | ) |
Operating income |
| 144 |
| 22 |
| 166 |
| 56 |
| 412 |
| 468 |
|
Equity loss |
| (10 | ) | — |
| (10 | ) | (15 | ) | — |
| (15 | ) |
Sundance Units 1 and 2 return to service |
| — |
| — |
| — |
| (254 | ) | 254 | (7) | — |
|
Gain on sale of assets |
| — |
| — |
| — |
| 3 |
| (3 | )(7) | — |
|
Other income |
| — |
| — |
| — |
| 1 |
| — |
| 1 |
|
Foreign exchange loss |
| (2 | ) | — |
| (2 | ) | (9 | ) | — |
| (9 | ) |
Gain on sale of collateral |
| — |
| — |
| — |
| 15 |
| (15 | )(7) | — |
|
Earnings (loss) before interest and taxes |
| 132 |
| 22 |
| 154 |
| (203 | ) | 648 |
| 445 |
|
Net interest expense |
| 60 |
| — |
| 60 |
| 242 |
| — |
| 242 |
|
Income tax expense |
| 11 |
| 6 | (8) | 17 |
| 102 |
| (84 | )(8) | 18 |
|
Net earnings (loss) |
| 61 |
| 16 |
| 77 |
| (547 | ) | 732 |
| 185 |
|
Non-controlling interests |
| 12 |
| — |
| 12 |
| 37 |
| — |
| 37 |
|
Net earnings (loss) attributable to TransAlta shareholders |
| 49 |
| 16 |
| 65 |
| (584 | ) | 732 |
| 148 |
|
Preferred share dividends |
| 10 |
| — |
| 10 |
| 31 |
| — |
| 31 |
|
Net earnings (loss) attributable to common shareholders |
| 39 |
| 16 |
| 55 |
| (615 | ) | 732 |
| 117 |
|
Weighted average number of common shares outstanding in the period |
| 255 |
|
|
| 255 |
| 235 |
|
|
| 235 |
|
Net earnings (loss) per share attributable to common shareholders |
| 0.15 |
|
|
| 0.22 |
| (2.62 | ) |
|
| 0.50 |
|
* Please refer to Note 3 of our audited consolidated financial statements within our 2013 Annual Report for additional information regarding the restatements.
(1) Impacts associated with certain de-designated and ineffective hedges.
(2) Non-comparable portion of inventory writedown.
(3) Decrease in finance lease receivable.
(4) Gain on sale of PP&E that is included in depreciation and amortization for presentation purposes.
(5) Mine depreciation that is included in fuel and purchased power for presentation purposes.
(6) Total adjustments for gain on sale of PP&E and mine depreciation.
(7) Non-comparable item.
(8) Net tax effect of all non-comparable items.
(9) Includes impacts associated with certain de-designated and ineffective hedges and impacts to revenue associated with Sundance Units 1 and 2 to provide period over period comparability.
(10) Writeoff of Project Pioneer costs.
(11) Total net adjustments for impacts to revenue associated with Sundance Units 1 and 2 and decrease in finance lease receivable.
Funds from Operations, Free Cash Flow, Funds from Operations per Share, and Free Cash Flow per Share
Presenting these items from period to period provides management and investors with a proxy for the amount of cash generated from operating activities before changes in working capital, and provides the ability to evaluate cash flow trends more readily in comparison with results from prior periods. Starting in 2013, we have adjusted the calculation of free cash flow to be calculated as FFO less sustaining capital expenditures, dividends paid on preferred shares and distributions paid to subsidiaries’ non-controlling interests. FFO per share and free cash flow per share are calculated as follows using the weighted average number of common shares outstanding during the period:
|
| 3 months ended Dec. 31 |
| Year ended Dec. 31 |
| ||||
|
| 2013 |
| 2012 |
| 2013 |
| 2012 |
|
Cash flow from operating activities |
| 165 |
| 245 |
| 765 |
| 520 |
|
Impacts to working capital associated with Sundance Units 1 and 2 arbitration |
| — |
| — |
| — |
| 204 |
|
Impacts to working capital associated with California claim |
| 27 |
| — |
| 27 |
| — |
|
Payment of restructuring costs |
| — |
| 5 |
| 5 |
| 5 |
|
Flood-related maintenance costs |
| — |
| — |
| 5 |
| — |
|
Decrease in finance lease receivable |
| — |
| 1 |
| 1 |
| 3 |
|
Change in non-cash operating working capital balances |
| (13 | ) | (37 | ) | (74 | ) | 56 |
|
FFO |
| 179 |
| 214 |
| 729 |
| 788 |
|
Deduct: |
|
|
|
|
|
|
|
|
|
Sustaining capital expenditures |
| (96 | ) | (112 | ) | (341 | ) | (439 | ) |
Dividends paid on preferred shares |
| (10 | ) | (11 | ) | (38 | ) | (32 | ) |
Distributions paid to subsidiaries’ non-controlling interests |
| (12 | ) | (17 | ) | (55 | ) | (59 | ) |
Free cash flow |
| 61 |
| 74 |
| 295 |
| 258 |
|
Weighted average number of common shares outstanding in the period |
| 268 |
| 255 |
| 264 |
| 235 |
|
FFO per share |
| 0.67 |
| 0.84 |
| 2.76 |
| 3.35 |
|
Free cash flow per share |
| 0.23 |
| 0.29 |
| 1.12 |
| 1.10 |
|
A reconciliation of comparable EBITDA to FFO is as follows:
|
| 3 months ended Dec. 31 |
| Year ended Dec. 31 |
| ||||
|
| 2013 |
| 2012 |
| 2013 |
| 2012 |
|
Comparable EBITDA |
| 242 |
| 312 |
| 1,023 |
| 1,015 |
|
Unrealized (gain) loss from risk management activities |
| (11 | ) | (17 | ) | (27 | ) | 27 |
|
Impacts to revenue associated with Sundance Units 1 and 2 to provide period over period comparability |
| — |
| — |
| — |
| 20 |
|
Cash interest expense |
| (61 | ) | (57 | ) | (238 | ) | (225 | ) |
Provisions |
| 1 |
| (6 | ) | 11 |
| 11 |
|
Cash income tax expense |
| (3 | ) | (4 | ) | (39 | ) | (13 | ) |
Realized foreign exchange loss |
| (3 | ) | (4 | ) | — |
| (4 | ) |
Decommissioning and restoration costs settled |
| (5 | ) | (9 | ) | (24 | ) | (34 | ) |
Restructuring provision |
| — |
| (13 | ) | 3 |
| (13 | ) |
Gain on sale of assets |
| 2 |
| — |
| — |
| — |
|
Sundance Units 1 and 2 return to service |
| — |
| — |
| — |
| (211 | ) |
Gain on sale of collateral |
| — |
| — |
| — |
| 15 |
|
Impacts to working capital associated with Sundance Units 1 and 2 arbitration |
| — |
| — |
| — |
| 204 |
|
Payment of restructuring costs |
| — |
| 5 |
| 5 |
| 5 |
|
Flood-related maintenance costs |
| — |
| — |
| 5 |
| — |
|
Other non-cash items |
| 17 |
| 7 |
| 10 |
| (9 | ) |
FFO |
| 179 |
| 214 |
| 729 |
| 788 |
|
STATEMENTS OF CASH FLOWS
The following charts highlight significant changes in the Consolidated Statements of Cash Flows for the three months and year ended Dec. 31, 2013 compared to the same periods in 2012:
3 months ended Dec. 31 |
| 2013 |
| 2012 |
| Primary factors explaining change |
|
Cash and cash equivalents, beginning of period |
| 55 |
| 71 |
|
|
|
Provided by (used in): |
|
|
|
|
|
|
|
Operating activities |
| 165 |
| 245 |
| Unfavourable changes in working capital of $29 million and lower cash earnings of $51 million, net of a $27 million impact associated with the California claim |
|
|
|
|
|
|
|
|
|
Investing activities |
| (244 | ) | (226 | ) | Aquisition of the Wyoming wind farm for $109 million, a decrease in investing non-cash working capital balances of $28 million, and an increase in equity investments of $7 million, partially offset by a decrease in additions to PP&E and intangibles of $100 million, an increase in other items of $13 million, and a decrease in realized gains on financial instruments of $9 million |
|
|
|
|
|
|
|
|
|
Financing activities |
| 66 |
| (64 | ) | Increase in borrowings under credit facilities of $413 million, an increase in realized gains on financial instruments of $56 million, and an increase in proceeds on issuance of long-term debt of $10 million, partially offset by an increase in long-term debt payments of $318 million and an increase in common share cash dividends of $34 million |
|
Translation of foreign currency cash |
| — |
| 1 |
|
|
|
Cash and cash equivalents, end of period |
| 42 |
| 27 |
|
|
|
Year ended Dec. 31 |
| 2013 |
| 2012 |
| Primary factors explaining change |
|
Cash and cash equivalents, beginning of period |
| 27 |
| 49 |
|
|
|
Provided by (used in): |
|
|
|
|
|
|
|
Operating activities |
| 765 |
| 520 |
| Favourable changes in working capital of $307 million, partially offset by lower cash earnings of $62 million, net of a $27 million impact associated with the California claim in 2013 and a $204 million impact associated with the Sundance Units 1 and 2 arbitration in 2012 |
|
|
|
|
|
|
|
|
|
Investing activities |
| (703 | ) | (1,048 | ) | Decrease in acquisition of finance lease of $312 million, a decrease in additions to PP&E and intangibles of $149 million, an increase in realized gains on financial instruments of $26 million, and an increase in proceeds on sale of PP&E of $11 million, partially offset by the acquisition of the Wyoming wind farm for $109 million, an increase in equity investments of $17 million, a net negative impact of $12 million related to changes in collateral received from or paid to counterparties, and a decrease in investing non-cash working capital balances of $27 million |
|
|
|
|
|
|
|
|
|
Financing activities |
| (47 | ) | 504 |
| Decrease in proceeds on issuance of common shares of $293 million, a decrease in borrowings under credit facilities of $271 million partially due to the use of net proceeds received from the sale of the non-controlling interest in TransAlta Renewables to pay down borrowings on our credit facility, a decrease in proceeds on issuance of preferred shares of $217 million, an increase in common share cash dividends of $12 million, partially offset by an increase in proceeds on sale of non-controlling interest in subsidiary of $207 million, an increase in realized gains on financial instruments of $46 million, a decrease in long-term debt payments of $14 million, and an increase in proceeds on the issuance of long-term debt of $10 million |
|
Translation of foreign currency cash |
| — |
| 2 |
|
|
|
Cash and cash equivalents, end of period |
| 42 |
| 27 |
|
|
|
LIQUIDITY AND CAPITAL RESOURCES
Share Capital
On Feb. 19, 2014, we had 270.4 million common shares outstanding, 12.0 million Series A, 11.0 million Series C, and 9.0 million Series E first preferred shares outstanding. At Dec. 31, 2013, we had 268.2 million (Dec. 31, 2012 - 254.7 million) common shares issued and outstanding and 32.0 million (Dec. 31, 2012 - 32.0 million) preferred shares issued and outstanding.
We issue common shares for cash proceeds, upon exercise of stock options and other share-based payment plans, or for reinvestment of dividends. During February 2012, we added a Premium DividendTM component to the Premium Dividend™, Dividend Reinvestment and Optional Common Share Purchase Plan (the “Plan”). Please refer to Note 31 of our audited consolidated financial statements within our 2013 Annual Report for additional information regarding the amendments. On May 8, 2013, we announced that as a result of the current low share price environment, we would suspend the Premium Dividend™ component of the Plan following the payment of the quarterly dividend on July 1, 2013. Our Dividend Reinvestment and Optional Common Share Purchase Plan, components of the Plan remain effective in accordance with their current terms.
During the three months ended Dec. 31, 2013, 1.9 million common shares were issued for $25 million, which was primarily comprised of dividends reinvested under the terms of the Plan. During the three months ended Dec. 31, 2012, 3.6 million common shares were issued for $49 million, which was primarily comprised of common shares issued under a public offering and dividends reinvested under the terms of the Plan. During the year ended Dec. 31, 2013, 13.5 million common shares were issued for $186 million, which was primarily comprised of dividends reinvested under the terms of the Plan. During the year ended Dec. 31, 2012, 31.1 million common shares were issued for $456 million, which was primarily comprised of common shares issued under a public offering and dividends reinvested under the terms of the Plan.
2014 OUTLOOK
Business Environment
Power Prices
In 2014, power prices in Alberta are expected to be lower than 2013 as a result of more baseload generation and fewer planned maintenance outages across the market. However, prices can vary based on supply and weather conditions. In the Pacific Northwest, we expect prices to settle higher than in 2013 due to marginally higher natural gas prices and an outlook for lower hydro generation compared to 2013.
Environmental Legislation
The finalization of the federal Canadian GHG regulations for coal-fired power has initiated further activities. We are in discussions with the provincial government to ensure coordination between GHG and air pollutant regulations, such that emission reduction objectives are achieved in the most effective manner while taking into consideration the reliability and cost of Alberta’s generation supply. This may provide additional flexibility to coal-fired generators in meeting such regulatory requirements. For further information on the Canadian GHG regulations, please refer to the Significant Events section of our 2013 Annual MD&A.
In addition, there are ongoing discussions between the federal and provincial governments regarding a national Air Quality Management System for air pollutants. In Alberta’s recently released Clean Air Strategy, the province indicated that its provincial air quality management system will operationalize any national system. Our current outlook is that, for Alberta, provincial regulations will be considered as equivalent to any future national framework.
On Jan. 21, 2013, the Ontario government released a discussion paper for public input on reducing GHG emissions in the province, with the stated intent of developing GHG regulations for all major industrial sectors by 2015. No specific targets or regulatory approaches have yet been proposed.
In the U.S., the President’s Climate Action Plan provides an indication of how GHG regulation of existing fossil-fuel based generation may unfold, although we expect the implementation process to take several years. Our agreement with Washington State, established in April 2011, provides regulatory clarity at the state level regarding an emissions regime related to the Centralia Coal plant until 2025. We expect this agreement may mitigate separate federal action from the Environmental Protection Agency. Additionally, new federal air pollutant regulations for the power sector are anticipated, but are not expected to directly affect our coal-fired operations in Washington State.
Effective January 2013, direct deliveries of power to the California Independent System Operator were subject to Cap and Trade Regulations established by the California Air Resource Board. We continue to monitor our GHG inventory into California.
In Australia, the carbon tax implemented in July 2012 remains in place. However, on Nov. 13, 2013, the recently elected Liberal government introduced legislation to repeal the carbon tax by July 2014, and replace it with a Direct Action plan that would fund industry for actions to reduce emissions. The legislation has not yet been passed. While TransAlta’s gas-fired operations are subject to the tax, all related costs are flowed to contracted customers.
We continue to closely monitor the progress and risks associated with environmental legislation changes on our future operations.
The siting, construction, and operation of electrical energy facilities requires interaction with many stakeholders. Recently, certain stakeholders have brought actions against government agencies and owners over alleged adverse impacts of wind projects. We are monitoring these claims in order to assess the risk associated with these activities.
Economic Environment
In 2014, we expect slow to moderate growth in all markets. We continue to monitor global events and their potential impact on the economy and our supplier and commodity counterparty relationships.
We had no material counterparty losses in 2013. We continue to monitor counterparty credit risk and have established risk management policies to mitigate counterparty risk. We do not anticipate any material change to our existing credit practices and continue to deal primarily with investment grade counterparties.
Operations
Capacity, Production, and Availability
Generating capacity is expected to increase in 2014 primarily due to the commencement of operations at our Solomon power station in Australia. Prior to the effect of any economic dispatching, overall production is expected to increase in 2014 due to lower planned and unplanned outages. Overall availability is expected to be in the range of 88 to 90 per cent in 2014.
Contracted Cash Flows
Through the use of Alberta PPAs, long-term contracts, and other short-term physical and financial contracts, on average, approximately 72 per cent of our capacity is contracted over the next seven years. On an aggregated portfolio basis, depending on market conditions, we target being up to 90 per cent contracted for the upcoming calendar year. As at the end of 2013, approximately 88 per cent of our 2014 capacity was contracted. The average prices of our short-term physical and financial contracts for 2014 are approximately $55 per megawatt hour (“MWh”) in Alberta and approximately U.S.$40 per MWh in the Pacific Northwest.
Fuel Costs
Mining coal in Alberta is subject to cost increases due to greater overburden removal, inflation, capital investments, and commodity prices. Seasonal variations in coal costs at our Alberta mine are minimized through the application of standard costing. Coal costs for 2014, on a standard cost per tonne basis, are expected to be 10 to 12 per cent lower than 2013 due to Sundance Units 1 and 2 operating for a full year and realizing the benefits from insourcing operational accountability from Prairie Mines and Royalty Ltd. at the Highvale Mine during 2013.
Although we own the Centralia mine in the State of Washington, it is not currently operational. Fuel at Centralia Thermal is purchased from external suppliers in the Powder River Basin and delivered by rail. The delivered cost of fuel per MWh for 2014 is expected to increase between one to three per cent.
The value of coal inventories is assessed for impairment at the end of each reporting period. If the inventory is impaired, further charges are recognized in net earnings. For more information on the inventory impairment charges recorded in 2013, please refer to the Significant Events section of our 2013 Annual MD&A.
We purchase natural gas from outside companies coincident with production or have it supplied by our customers, thereby minimizing our risk to changes in prices. The continued success of unconventional gas production in North America could reduce the year-to-year volatility of prices in the near term.
We closely monitor the risks associated with changes in electricity and input fuel prices on our future operations and, where we consider it appropriate, use various physical and financial instruments to hedge our assets and operations from such price risks.
Energy Trading
Earnings from our Energy Trading Segment are affected by prices in the market, overall strategies adopted, and changes in legislation. We continuously monitor both the market and our exposure in order to maximize earnings while still maintaining an acceptable risk profile. Our 2014 objective is for Energy Trading to contribute between $50 million and $65 million in gross margin for the year.
Exposure to Fluctuations in Foreign Currencies
Our strategy is to minimize the impact of fluctuations in the Canadian dollar against the U.S. dollar, euro, and Australian dollar by offsetting foreign-denominated assets with foreign-denominated liabilities and by entering into foreign exchange contracts. We also have foreign-denominated expenses, including interest charges, which largely offset our net foreign-denominated revenues.
Net Interest Expense
Net interest expense for 2014 is expected to be in line with 2013. However, changes in interest rates and in the value of the Canadian dollar relative to the U.S. dollar can affect the amount of net interest expense incurred.
Liquidity and Capital Resources
If there is increased volatility in power and natural gas markets, or if market trading activities increase, we may need additional liquidity in the future. We expect to maintain adequate available liquidity under our committed credit facilities.
Accounting Estimates
A number of our accounting estimates, including those outlined in the Critical Accounting Policies and Estimates section of our 2013 Annual MD&A, are based on the current economic environment and outlook. Under the current economic environment, market fluctuations could impact, among other things, future commodity prices, foreign exchange rates, and interest rates, which could, in turn, impact future earnings and the unrealized gains or losses associated with our risk management assets and liabilities and asset valuation for our asset impairment calculations.
Income Taxes
The effective tax rate on earnings excluding non-comparable items for 2014 is expected to be approximately 17 to 22 per cent, which is lower than the statutory tax rate of 25 per cent, due to changes in the amount of earnings between the jurisdictions in which pre-tax income is earned and the effect of certain deductions that do not fluctuate with earnings.
Capital Expenditures
Our major projects are focused on sustaining our current operations and supporting our growth strategy.
Growth and Major Project Expenditures
A summary of the significant growth and major projects that are in progress is outlined below:
|
| Total Project |
| 2014 |
| Target |
|
|
| ||
|
| Estimated |
| Spent to |
| Estimated |
| completion |
| Details |
|
|
|
|
|
|
|
|
|
|
|
|
|
Project |
|
|
|
|
|
|
|
|
|
|
|
|
|
|
|
|
|
|
|
|
|
|
|
Australia natural gas pipeline |
| 86 |
| — |
| 86 |
| Q1 2015 |
| 270 kilometer pipeline to supply natural gas to our Solomon power station in Western Australia |
|
Transmission |
| 10 |
| — |
| 10 |
| Q4 2014 |
| Regulated transmission that receives a return on investment |
|
Hydro life extension |
| 15 - 20 |
| — |
| 15 - 20 |
| Q4 2014 |
| Generator replacement and turbine runner improvements to extend the life of selected plants |
|
Total major projects and growth |
| 111 - 116 |
| — |
| 111 - 116 |
|
|
|
|
|
Transmission
For the three months and year ended Dec. 31, 2013, a total of $2 million and $2 million, respectively, was spent on transmission projects. Transmission projects consist of the major maintenance and reconfiguration of Alberta’s transmission networks to reinforce the transmission system and to increase the capacity of power flow in the lines.
Sustaining Capital and Productivity Expenditures
For 2014, our estimate for total sustaining capital and productivity expenditures, net of any contributions received, is allocated among the following:
|
|
|
|
|
| Expected |
|
|
|
|
| Spent |
| spend in |
|
Category |
| Description |
| in 2013 |
| 2014 |
|
|
|
|
|
|
|
|
|
Routine capital |
| Expenditures to maintain our existing generating capacity |
| 126 |
| 110 - 115 |
|
Mining equipment and land purchases(1) |
| Expenditures related to mining equipment and land purchases |
| 53 |
| 45 - 50 |
|
Finance leases |
| Payments related to mining equipment under finance leases |
| 9 |
| 5 - 10 |
|
Planned major maintenance |
| Regularly scheduled major maintenance |
| 153 |
| 175 - 190 |
|
Total sustaining expenditures |
|
|
| 341 |
| 335 - 365 |
|
Productivity capital |
| Projects to improve power production efficiency and corporate improvement initiatives |
| 33 |
| 10 - 15 |
|
Total sustaining and productivity expenditures |
|
|
| 374 |
| 345 - 380 |
|
Insurance recoveries on hydro facilities |
|
|
|
|
|
|
|
Net sustaining and productivity expenditures |
|
|
|
|
|
|
|
During the year, we acquired $33 million of mining equipment under finance leases and we made principal repayments of $9 million.
Our planned major maintenance program relates to regularly scheduled major maintenance activities and includes costs related to inspection, repair and maintenance, and replacement of existing components. It excludes amounts for day-to-day routine maintenance, unplanned maintenance activities, and minor inspections and overhauls, which are expensed as incurred. Details of the 2014 planned major maintenance program are outlined as follows:
|
| Coal |
| Gas and |
| Expected |
|
Capitalized |
| 120 - 130 |
| 55 - 60 |
| 175 - 190 |
|
Expensed |
| — |
| 0 - 5 |
| 0 - 5 |
|
|
| 120 - 130 |
| 55 - 65 |
| 175 - 195 |
|
|
| Coal |
| Gas and Renewables |
| Total |
|
GWh lost |
| 2,200 - 2,210 |
| 400 - 410 |
| 2,600 - 2,620 |
|
Financing
Financing for these capital expenditures is expected to be provided by cash flow from operating activities, existing borrowing capacity, reinvested dividends under the Plan, and capital markets. The funds required for committed growth, sustaining capital, and productivity projects are not expected to be significantly impacted by the current economic environment due to the highly contracted nature of our cash flows, our financial position, and the amount of capital available to us under existing committed credit facilities.
(1) An additional $12 million for mining equipment in use is not payable until 2014.
FUTURE ACCOUNTING CHANGES
Additional new or amended accounting standards that have been previously issued by the International Accounting Standards Board but are not yet effective, and have not yet been applied, are as follows: IFRS 9 Financial Instruments, International Accounting Standard (“IAS”) 32 Financial Instruments: Presentation, and Investment Entities (Amendments to IFRS 10 and 11 and IAS 27). Please refer to the Future Accounting Changes section of our 2013 Annual MD&A for more information.
SELECTED QUARTERLY INFORMATION
|
| Q1 2013 |
| Q2 2013 |
| Q3 2013 |
| Q4 2013 |
|
|
|
|
|
|
|
|
|
|
|
Revenue |
| 540 |
| 542 |
| 623 |
| 587 |
|
Net earnings (loss) attributable to common shareholders |
| (11 | ) | 15 |
| (9 | ) | (66 | ) |
Net earnings (loss) per share attributable to common shareholders, basic and diluted |
| (0.04 | ) | 0.06 |
| (0.03 | ) | (0.25 | ) |
Comparable earnings per share |
| 0.12 |
| 0.03 |
| 0.15 |
| 0.00 |
|
|
| Q1 2012 |
| Q2 2012 |
| Q3 2012 |
| Q4 2012 |
|
|
|
|
|
|
|
|
|
|
|
Revenue |
| 644 |
| 398 |
| 522 |
| 646 |
|
Net earnings (loss) attributable to common shareholders |
| 88 |
| (798 | ) | 56 |
| 39 |
|
Net earnings (loss) per share attributable to common shareholders, basic and diluted |
| 0.39 |
| (3.52 | ) | 0.24 |
| 0.15 |
|
Comparable earnings (loss) per share |
| 0.20 |
| (0.10 | ) | 0.18 |
| 0.22 |
|
Basic and diluted earnings per share attributable to common shareholders and comparable earnings per share are calculated each period using the weighted average common shares outstanding during the period. As a result, the sum of the earnings per share for the four quarters making up the calendar year may sometimes differ from the annual earnings per share.
FORWARD-LOOKING STATEMENTS
This news release, the documents incorporated herein by reference, and other reports and filings made with the securities regulatory authorities include forward-looking statements or information (collectively referred to herein as “forward-looking statements”) within the meaning of the “safe harbour” provisions of applicable securities legislation. All forward-looking statements are based on our beliefs as well as assumptions based on information available at the time the assumption was made and on management’s experience and perception of historical trends, current conditions, and expected future developments, as well as other factors deemed appropriate in the circumstances. Forward-looking statements are not facts, but only predictions and generally can be identified by the use of statements that include phrases such as “may”, “will”, “believe”, “expect”, “anticipate”, “intend”, “plan”, “foresee”, “potential”, “enable”, “continue”, or other comparable terminology. These statements are not guarantees of our future performance and are subject to risks, uncertainties, and other important factors that could cause our actual performance to be materially different from that projected.
In particular, this news release contains forward-looking statements pertaining to our business and anticipated financial performance including, for example: the timing and the completion and commissioning of projects under development, including major projects, and their attendant costs; expectations regarding the Alberta Electric System Operator’s plans for resolving regional constraints on Alberta’s transmission system; our estimated spend on matters relating to the 2013 flood in Alberta, spend on growth, and sustaining capital and productivity projects; expectations in terms of the cost of operations, capital spend, and maintenance, and the
variability of those costs; the impact of certain hedges on future reported earnings and cash flows; expectations related to future earnings and cash flow from operating and contracting activities; estimates of fuel supply and demand conditions and the costs of procuring fuel; expectations for demand for electricity in both the short term and long term, and the resulting impact on electricity prices; the impact of load growth, increased capacity, and natural gas costs on power prices; expectations in respect of generation availability, capacity, and production; expectations regarding the role different energy sources will play in meeting future energy needs; expected financing of our capital expenditures; expected governmental regulatory regimes and legislation and their expected impact on us and the timing of the implementation of such regimes and regulations, as well as the cost of complying with resulting regulations and laws; our trading strategies and the risk involved in these strategies; estimates of future tax rates, future tax expense, and the adequacy of tax provisions; accounting estimates; anticipated growth rates in our markets; expectations for the outcome of existing or potential legal and contractual claims; investigations and disputes; expectations regarding the renewals of collective bargaining agreements; expectations for the ability to access capital markets at reasonable terms; the estimated impact of changes in interest rates and the value of the Canadian dollar relative to the U.S. dollar and other currencies in locations where we do business; the monitoring of our exposure to liquidity risk; expectations in respect to the global economic environment and growing scrutiny by investors relating to sustainability performance; our credit practices; the estimated contribution of Energy Trading activities to gross margin; and expectations relating to the performance of TransAlta Renewables’ assets.
Factors that may adversely impact our forward-looking statements include risks relating to: fluctuations in market prices and the availability of fuel supplies required to generate electricity; our ability to contract our generation for prices that will provide expected returns; the regulatory and political environments in the jurisdictions in which we operate; environmental requirements and changes in, or liabilities under, these requirements; changes in general economic conditions including interest rates; operational risks involving our facilities, including unplanned outages at such facilities; disruptions in the transmission and distribution of electricity; the effects of weather; disruptions in the source of fuels, water, or wind required to operate our facilities; natural disasters; the threat of domestic terrorism and cyber-attacks; equipment failure and our ability to carry out the repairs in a cost-effective manner or timely manner; energy trading risks; industry risk and competition; fluctuations in the value of foreign currencies and foreign political risks; the need for additional financing; structural subordination of securities; counterparty credit risk; insurance coverage; our provision for income taxes; legal and contractual proceedings involving the Corporation; outcomes of investigations and disputes; reliance on key personnel; labour relations matters; development projects and acquisitions; and the satisfactory receipt of applicable regulatory approvals for the closing of the Wyoming acquisition. The foregoing risk factors, among others, are described in further detail in the Risk Management section of our 2013 Annual MD&A and under the heading “Risk Factors” in our 2014 Annual Information Form.
Readers are urged to consider these factors carefully in evaluating the forward-looking statements and are cautioned not to place undue reliance on these forward-looking statements. The forward-looking statements included in this document are made only as of the date hereof and we do not undertake to publicly update these forward-looking statements to reflect new information, future events or otherwise, except as required by applicable laws. In light of these risks, uncertainties, and assumptions, the forward-looking events might occur to a different extent or at a different time than we have described, or might not occur. We cannot assure that projected results or events will be achieved.
TRANSALTA CORPORATION
CONSOLIDATED STATEMENTS OF EARNINGS (LOSS)
(in millions of Canadian dollars except per share amounts)
|
| 3 months ended Dec. 31 |
| 12 months ended Dec. 31 |
| ||||
Unaudited |
| 2013 |
| 2012 |
| 2013 |
| 2012 |
|
|
|
|
| (Restated)* |
|
|
| (Restated)* |
|
|
|
|
|
|
|
|
|
|
|
Revenues |
| 587 |
| 646 |
| 2,292 |
| 2,210 |
|
Fuel and purchased power |
| 278 |
| 245 |
| 926 |
| 753 |
|
Gross margin |
| 309 |
| 401 |
| 1,366 |
| 1,457 |
|
Operations, maintenance, and administration |
| 140 |
| 120 |
| 516 |
| 499 |
|
Depreciation and amortization |
| 143 |
| 119 |
| 525 |
| 509 |
|
Asset impairment charges (reversals) |
| — |
| — |
| (18 | ) | 324 |
|
Inventory writedown |
| 1 |
| 10 |
| 22 |
| 44 |
|
Restructuring provision |
| — |
| 13 |
| (3 | ) | 13 |
|
Taxes, other than income taxes |
| 5 |
| 6 |
| 27 |
| 28 |
|
Operating income |
| 20 |
| 133 |
| 297 |
| 40 |
|
Finance lease income |
| 12 |
| 11 |
| 46 |
| 16 |
|
Equity loss |
| (5 | ) | (10 | ) | (10 | ) | (15 | ) |
California claim |
| (56 | ) | — |
| (56 | ) | — |
|
Sundance Units 1 and 2 return to service |
| (10 | ) | — |
| (25 | ) | (254 | ) |
Gain on sale of assets |
| 2 |
| — |
| 12 |
| 3 |
|
Other income |
| — |
| — |
| — |
| 1 |
|
Foreign exchange gain (loss) |
| 3 |
| (2 | ) | 1 |
| (9 | ) |
Loss on assumption of pension obligations |
| — |
| — |
| (29 | ) | — |
|
Gain on sale of collateral |
| — |
| — |
| — |
| 15 |
|
Insurance recovery |
| 8 |
| — |
| 8 |
| — |
|
Net interest expense |
| (66 | ) | (60 | ) | (256 | ) | (242 | ) |
Earnings (loss) before income taxes |
| (92 | ) | 72 |
| (12 | ) | (445 | ) |
Income tax expense (recovery) |
| (49 | ) | 11 |
| (8 | ) | 102 |
|
Net earnings (loss) |
| (43 | ) | 61 |
| (4 | ) | (547 | ) |
|
|
|
|
|
|
|
|
|
|
Net earnings (loss) attributable to: |
|
|
|
|
|
|
|
|
|
TransAlta shareholders |
| (56 | ) | 49 |
| (33 | ) | (584 | ) |
Non-controlling interests |
| 13 |
| 12 |
| 29 |
| 37 |
|
|
| (43 | ) | 61 |
| (4 | ) | (547 | ) |
|
|
|
|
|
|
|
|
|
|
Net earnings (loss) attributable to TransAlta shareholders |
| (56 | ) | 49 |
| (33 | ) | (584 | ) |
Preferred share dividends |
| 10 |
| 10 |
| 38 |
| 31 |
|
Net earnings (loss) attributable to common shareholders |
| (66 | ) | 39 |
| (71 | ) | (615 | ) |
Weighted average number of common shares outstanding in the period (millions) |
| 268 |
| 255 |
| 264 |
| 235 |
|
|
|
|
|
|
|
|
|
|
|
Net earnings (loss) per share attributable to common shareholders, basic and diluted |
| (0.25 | ) | 0.15 |
| (0.27 | ) | (2.62 | ) |
* Please refer to Note 3 of our audited consolidated financial statements within our 2013 Annual Report for additional information regarding the restatements.
TRANSALTA CORPORATION
CONSOLIDATED STATEMENTS OF COMPREHENSIVE INCOME (LOSS)
(in millions of Canadian dollars)
|
| 3 months ended Dec. 31 |
| 12 months ended Dec. 31 |
| ||||
Unaudited |
| 2013 |
| 2012 |
| 2013 |
| 2012 |
|
|
|
|
| (Restated)* |
|
|
| (Restated)* |
|
Net earnings (loss) |
| (43 | ) | 61 |
| (4 | ) | (547 | ) |
Net actuarial gains (losses) on defined benefit plans, net of tax(1) |
| 3 |
| 3 |
| 31 |
| (23 | ) |
Gains (losses) on derivatives designated as cash flow hedges, net of tax(2) |
| — |
| 1 |
| — |
| (2 | ) |
Reclassification of losses on derivatives designated as cash flow hedges to non-financial assets, net of tax(3) |
| — |
| 2 |
| 1 |
| 5 |
|
Total items that will not be reclassified subsequently to net earnings |
| 3 |
| 6 |
| 32 |
| (20 | ) |
|
|
|
|
|
|
|
|
|
|
Gains (losses) on translating net assets of foreign operations |
| 21 |
| 13 |
| 37 |
| (23 | ) |
Gains (losses) on financial instruments designated as hedges of foreign operations, net of tax(4) |
| (21 | ) | (12 | ) | (35 | ) | 13 |
|
Gains (losses) on derivatives designated as cash flow hedges, net of tax(5) |
| 96 |
| 6 |
| 76 |
| (12 | ) |
Reclassification of gains on derivatives designated as cash flow hedges to net earnings, net of tax(6) |
| (20 | ) | (20 | ) | (24 | ) | (6 | ) |
Other comprehensive income of equity investees, net of tax(7) |
| — |
| 2 |
| — |
| — |
|
Total items that will be reclassified subsequently to net earnings |
| 76 |
| (11 | ) | 54 |
| (28 | ) |
Other comprehensive income (loss) |
| 79 |
| (5 | ) | 86 |
| (48 | ) |
Total comprehensive income (loss) |
| 36 |
| 56 |
| 82 |
| (595 | ) |
|
|
|
|
|
|
|
|
|
|
Total comprehensive income (loss) attributable to: |
|
|
|
|
|
|
|
|
|
Common shareholders |
| 18 |
| 44 |
| 41 |
| (626 | ) |
Non-controlling interests |
| 18 |
| 12 |
| 41 |
| 31 |
|
|
| 36 |
| 56 |
| 82 |
| (595 | ) |
* Please refer to Note 3 of our audited consolidated financial statements within our 2013 Annual Report for additional information regarding the restatements.
(1) Net of income tax expense of 1 and 11 for the three months and year ended Dec. 31, 2013 (2012 - 2 expense and 8 recovery), respectively.
(2) Net of income tax of nil for the three months and year ended Dec. 31, 2013 (2012 - nil and 1 recovery), respectively.
(3) Net of income tax recovery of nil and 1 for the three months and year ended Dec. 31, 2013 (2012 - 1 and 2 recovery), respectively.
(4) Net of income tax recovery of 3 and 5 for the three months and year ended Dec. 31, 2013 (2012 - 1 recovery and 2 expense), respectively.
(5) Net of income tax expense of 38 and 12 for the three months and year ended Dec. 31, 2013 (2012 - nil and 4 expense), respectively.
(6) Net of income tax expense of 4 and 1 for the three months and year ended Dec. 31, 2013 (2012 - 7 and 20 expense), respectively.
(7) Net of income tax of nil for the three months and year ended Dec. 31, 2013 (2012 - 1 expense and nil), respectively.
TRANSALTA CORPORATION
CONSOLIDATED STATEMENTS OF FINANCIAL POSITION
(in millions of Canadian dollars)
Unaudited |
| Dec. 31, 2013 |
| Dec. 31, 2012 |
|
|
|
|
| (Restated)* |
|
Cash and cash equivalents |
| 42 |
| 27 |
|
Accounts receivable |
| 473 |
| 597 |
|
Current portion of finance lease receivable |
| 3 |
| 2 |
|
Collateral paid |
| 20 |
| 19 |
|
Prepaid expenses |
| 12 |
| 7 |
|
Risk management assets |
| 112 |
| 201 |
|
Inventory |
| 77 |
| 93 |
|
Income taxes receivable |
| 8 |
| 4 |
|
|
| 747 |
| 950 |
|
Investments |
| 192 |
| 172 |
|
Long-term portion of finance lease receivable |
| 377 |
| 357 |
|
Property, plant, and equipment |
|
|
|
|
|
Cost |
| 12,024 |
| 11,481 |
|
Accumulated depreciation |
| (4,831 | ) | (4,437 | ) |
|
| 7,193 |
| 7,044 |
|
|
|
|
|
|
|
Goodwill |
| 460 |
| 447 |
|
Intangible assets |
| 323 |
| 284 |
|
Deferred income tax assets |
| 118 |
| 90 |
|
Risk management assets |
| 276 |
| 69 |
|
Other assets |
| 97 |
| 90 |
|
Total assets |
| 9,783 |
| 9,503 |
|
|
|
|
|
|
|
Accounts payable and accrued liabilities |
| 447 |
| 495 |
|
Current portion of decommissioning and other provisions |
| 16 |
| 33 |
|
Collateral received |
| — |
| 2 |
|
Risk management liabilities |
| 84 |
| 167 |
|
Income taxes payable |
| 3 |
| 7 |
|
Dividends payable |
| 85 |
| 75 |
|
Current portion of finance lease obligation |
| 8 |
| — |
|
Current portion of long-term debt |
| 209 |
| 607 |
|
|
| 852 |
| 1,386 |
|
Long-term debt |
| 4,113 |
| 3,610 |
|
Finance lease obligation |
| 17 |
| — |
|
Decommissioning and other provisions |
| 316 |
| 279 |
|
Deferred income tax liabilities |
| 459 |
| 473 |
|
Risk management liabilities |
| 263 |
| 106 |
|
Deferred credits and other long-term liabilities |
| 340 |
| 301 |
|
Equity |
|
|
|
|
|
Common shares |
| 2,913 |
| 2,726 |
|
Preferred shares |
| 781 |
| 781 |
|
Contributed surplus |
| 9 |
| 9 |
|
Deficit |
| (735 | ) | (362 | ) |
Accumulated other comprehensive loss |
| (62 | ) | (136 | ) |
Equity attributable to shareholders |
| 2,906 |
| 3,018 |
|
Non-controlling interests |
| 517 |
| 330 |
|
Total equity |
| 3,423 |
| 3,348 |
|
Total liabilities and equity |
| 9,783 |
| 9,503 |
|
* Please refer to Note 3 of our audited consolidated financial statements within our 2013 Annual Report for additional information regarding the restatements.
TRANSALTA CORPORATION
CONSOLIDATED STATEMENTS OF CHANGES IN EQUITY
(in millions of Canadian dollars)
Unaudited |
| Common |
| Preferred |
| Contributed |
| Retained |
| Accumulated other |
| Attributable to |
| Attributable to |
| Total |
|
|
|
|
|
|
|
|
| (Restated)* |
| (Restated)* |
|
|
|
|
|
|
|
Balance, Dec. 31, 2011 |
| 2,273 |
| 562 |
| 9 |
| 524 |
| (94 | ) | 3,274 |
| 358 |
| 3,632 |
|
Net earnings (loss) |
| — |
| — |
| — |
| (584 | ) | — |
| (584 | ) | 37 |
| (547 | ) |
Other comprehensive income (loss): |
|
|
|
|
|
|
|
|
|
|
|
|
|
|
|
|
|
Net losses on translating net assets of foreign operations, net of hedges and of tax |
| — |
| — |
| — |
| — |
| (10 | ) | (10 | ) | — |
| (10 | ) |
Net losses on derivatives designated as cash flow hedges, net of tax |
| — |
| — |
| — |
| — |
| (9 | ) | (9 | ) | (6 | ) | (15 | ) |
Net actuarial gains on defined benefits plans, net of tax |
| — |
| — |
| — |
| — |
| (23 | ) | (23 | ) | — |
| (23 | ) |
Total comprehensive income |
|
|
|
|
|
|
| (584 | ) | (42 | ) | (626 | ) | 31 |
| (595 | ) |
Common share dividends |
| — |
| — |
| — |
| (271 | ) | — |
| (271 | ) | — |
| (271 | ) |
Preferred share dividends |
| — |
| — |
| — |
| (31 | ) | — |
| (31 | ) | — |
| (31 | ) |
Distributions paid to non-controlling interests |
| — |
| — |
| — |
| — |
| — |
| — |
| (59 | ) | (59 | ) |
Common shares issued |
| 453 |
| — |
| — |
| — |
| — |
| 453 |
| — |
| 453 |
|
Preferred shares issued |
| — |
| 219 |
| — |
| — |
| — |
| 219 |
| — |
| 219 |
|
Balance, Dec. 31, 2012 |
| 2,726 |
| 781 |
| 9 |
| (362 | ) | (136 | ) | 3,018 |
| 330 |
| 3,348 |
|
Net earnings (loss) |
| — |
| — |
| — |
| (33 | ) | — |
| (33 | ) | 29 |
| (4 | ) |
Other comprehensive income: |
|
|
|
|
|
|
|
|
|
|
|
|
|
|
|
|
|
Net gains on translating net assets of foreign operations, net of hedges and of tax |
| — |
| — |
| — |
| — |
| 2 |
| 2 |
| — |
| 2 |
|
Net gains on derivatives designated as cash flow hedges, net of tax |
| — |
| — |
| — |
| — |
| 41 |
| 41 |
| 12 |
| 53 |
|
Net actuarial gains on defined benefits plans, net of tax |
| — |
| — |
| — |
| — |
| 31 |
| 31 |
| — |
| 31 |
|
Total comprehensive income |
|
|
|
|
|
|
| (33 | ) | 74 |
| 41 |
| 41 |
| 82 |
|
Common share dividends |
| — |
| — |
| — |
| (306 | ) | — |
| (306 | ) | — |
| (306 | ) |
Preferred share dividends |
| — |
| — |
| — |
| (38 | ) | — |
| (38 | ) | — |
| (38 | ) |
Formation of TransAlta Renewables Inc. |
| — |
| — |
| — |
| 4 |
| — |
| 4 |
| 206 |
| 210 |
|
Distributions paid, and payable, to non-controlling interests |
| — |
| — |
| — |
| — |
| — |
| — |
| (60 | ) | (60 | ) |
Common shares issued |
| 187 |
| — |
| — |
| — |
| — |
| 187 |
| — |
| 187 |
|
Balance, Dec. 31, 2013 |
| 2,913 |
| 781 |
| 9 |
| (735 | ) | (62 | ) | 2,906 |
| 517 |
| 3,423 |
|
*Please refer to Note 3 of our audited consolidated financial statements within our 2013 Annual Report for additional information regarding the restatements.
TRANSALTA CORPORATION
CONSOLIDATED STATEMENTS OF CASH FLOWS
(in millions of Canadian dollars)
|
| 3 months ended Dec. 31 |
| 12 months ended Dec. 31 |
| ||||
Unaudited |
| 2013 |
| 2012 |
| 2013 |
| 2012 |
|
|
|
|
| (Restated)* |
|
|
| (Restated)* |
|
|
|
|
|
|
|
|
|
|
|
Operating activities |
|
|
|
|
|
|
|
|
|
Net earnings (loss) |
| (43 | ) | 61 |
| (4 | ) | (547 | ) |
Depreciation and amortization |
| 160 |
| 145 |
| 585 |
| 564 |
|
Gain on sale of assets |
| — |
| — |
| (12 | ) | (3 | ) |
California claim |
| 28 |
| — |
| 28 |
| — |
|
Accretion of provisions |
| 5 |
| 3 |
| 18 |
| 17 |
|
Decommissioning and restoration costs settled |
| (5 | ) | (9 | ) | (24 | ) | (34 | ) |
Deferred income tax expense (recovery) |
| (52 | ) | 7 |
| (47 | ) | 89 |
|
Unrealized (gain) loss from risk management activities |
| 32 |
| (3 | ) | 76 |
| 99 |
|
Unrealized foreign exchange (gain) loss |
| (6 | ) | (2 | ) | (1 | ) | 5 |
|
Provisions |
| 1 |
| (6 | ) | 11 |
| 11 |
|
Asset impairment charges (reversals) |
| — |
| — |
| (18 | ) | 324 |
|
Sundance Units 1 and 2 return to service |
| 10 |
| — |
| 25 |
| 43 |
|
Equity loss, net of distributions received |
| 5 |
| 9 |
| 10 |
| 14 |
|
Other non-cash items |
| 17 |
| 3 |
| 44 |
| (6 | ) |
Cash flow from operations before changes in working capital |
| 152 |
| 208 |
| 691 |
| 576 |
|
Change in non-cash operating working capital balances |
| 13 |
| 37 |
| 74 |
| (56 | ) |
Cash flow from operating activities |
| 165 |
| 245 |
| 765 |
| 520 |
|
|
|
|
|
|
|
|
|
|
|
Investing activities |
|
|
|
|
|
|
|
|
|
Additions to property, plant, and equipment |
| (119 | ) | (218 | ) | (561 | ) | (703 | ) |
Additions to intangibles |
| (11 | ) | (12 | ) | (32 | ) | (39 | ) |
Acquisition of finance lease |
| — |
| — |
| — |
| (312 | ) |
Addition to equity investments |
| (7 | ) | — |
| (17 | ) | — |
|
Proceeds on sale of property, plant, and equipment |
| 3 |
| 3 |
| 14 |
| 3 |
|
Proceeds on sale of facilities and development projects |
| — |
| — |
| — |
| 3 |
|
Resolution of certain outstanding tax matters |
| 2 |
| — |
| 2 |
| 9 |
|
Realized gains (losses) on financial instruments |
| (2 | ) | (12 | ) | 14 |
| (13 | ) |
Net decrease in collateral received from counterparties |
| — |
| (1 | ) | (1 | ) | (13 | ) |
Net increase (decrease) in collateral paid to counterparties |
| (2 | ) | (3 | ) | — |
| 24 |
|
Decrease in finance lease receivable |
| — |
| 1 |
| 1 |
| 3 |
|
Acquisition of Wyoming wind farm |
| (109 | ) | — |
| (109 | ) | — |
|
Other |
| 13 |
| — |
| 15 |
| (8 | ) |
Change in non-cash investing working capital balances |
| (12 | ) | 16 |
| (29 | ) | (2 | ) |
Cash flow used in investing activities |
| (244 | ) | (226 | ) | (703 | ) | (1,048 | ) |
|
|
|
|
|
|
|
|
|
|
Financing activities |
|
|
|
|
|
|
|
|
|
Net increase (decrease) in borrowings under credit facilities |
| 51 |
| (362 | ) | (119 | ) | 152 |
|
Repayment of long-term debt |
| (320 | ) | (2 | ) | (328 | ) | (314 | ) |
Issuance of long-term debt |
| 398 |
| 388 |
| 398 |
| 388 |
|
Dividends paid on common shares |
| (52 | ) | (18 | ) | (116 | ) | (104 | ) |
Dividends paid on preferred shares |
| (10 | ) | (11 | ) | (38 | ) | (32 | ) |
Net proceeds on issuance of common shares |
| — |
| — |
| — |
| 293 |
|
Net proceeds on issuance of preferred shares |
| — |
| — |
| — |
| 217 |
|
Net proceeds on sale of non-controlling interest in subsidiary |
| — |
| — |
| 207 |
| — |
|
Realized gains on financial instruments |
| 15 |
| (41 | ) | 15 |
| (31 | ) |
Distributions paid to subsidiaries’ non-controlling interests |
| (12 | ) | (17 | ) | (55 | ) | (59 | ) |
Decrease in finance lease obligation |
| (2 | ) | — |
| (9 | ) | — |
|
Other |
| (2 | ) | (1 | ) | (2 | ) | (6 | ) |
Cash flow from (used in) financing activities |
| 66 |
| (64 | ) | (47 | ) | 504 |
|
Cash flow from (used) in operating, investing, and financing activities |
| (13 | ) | (45 | ) | 15 |
| (24 | ) |
Effect of translation on foreign currency cash |
| — |
| 1 |
| — |
| 2 |
|
Increase (decrease) in cash and cash equivalents |
| (13 | ) | (44 | ) | 15 |
| (22 | ) |
Cash and cash equivalents, beginning of period |
| 55 |
| 71 |
| 27 |
| 49 |
|
Cash and cash equivalents, end of period |
| 42 |
| 27 |
| 42 |
| 27 |
|
Cash income taxes paid |
| 13 |
| 6 |
| 46 |
| 30 |
|
Cash interest paid |
| 81 |
| 72 |
| 240 |
| 234 |
|
* Please refer to Note 3 of our audited consolidated financial statements within our 2013 Annual Report for additional information regarding the restatements.
SUPPLEMENTAL INFORMATION
|
|
|
| Dec. 31, 2013 |
| Dec. 31, 2012 |
|
|
|
|
|
|
|
|
|
Closing market price (TSX) ($) |
|
|
| 13.48 |
| 15.12 |
|
|
|
|
|
|
|
|
|
Price range for the last 12 months (TSX) ($) |
| High |
| 16.86 |
| 21.37 |
|
|
| Low |
| 12.91 |
| 14.11 |
|
|
|
|
|
|
|
|
|
Debt to invested capital (%) |
|
|
| 55.6 |
| 55.6 |
|
|
|
|
|
|
|
|
|
Debt to invested capital excluding non-recourse debt (%)(1) |
|
|
| 53.3 |
| 53.3 |
|
Debt to invested capital including finance lease obligation and non-recourse debt (%) |
|
|
| 55.7 |
| 55.6 |
|
|
|
|
|
|
|
|
|
Debt to comparable EBITDA (times)(2) |
|
|
| 4.2 |
| 4.1 |
|
Return on equity attributable to common shareholders (%) |
|
|
| (3.1 | ) | (23.7 | ) |
|
|
|
|
|
|
|
|
Comparable return on equity attributable to common shareholders(1), (2) (%) |
|
|
| 3.6 |
| 4.5 |
|
Return on capital employed(2) (%) |
|
|
| 2.8 |
| (3.1 | ) |
Comparable return on capital employed(1), (2) (%) |
|
|
| 5.2 |
| 5.3 |
|
Cash dividends per share(2) ($) |
|
|
| 1.16 |
| 1.16 |
|
Price to comparable earnings ratio(2) (times) |
|
|
| 43.5 |
| 30.2 |
|
Earnings coverage(2) (times) |
|
|
| 0.9 |
| (1.1 | ) |
Dividend payout ratio based on net earnings(2) (%) |
|
|
| (431.0 | ) | (44.1 | ) |
Dividend payout ratio based on comparable earnings(1), (2) (%) |
|
|
| 377.8 |
| 231.6 |
|
Dividend payout ratio based on funds from operations(1), (2), (3) (%) |
|
|
| 42.0 |
| 34.4 |
|
Dividend yield(2) (%) |
|
|
| 8.6 |
| 7.7 |
|
Adjusted cash flow to debt(2), (3) (%) |
|
|
| 16.9 |
| 19.0 |
|
Adjusted cash flow to interest coverage(2), (3) (times) |
|
|
| 4.0 |
| 4.4 |
|
(1) These ratios incorporate items that are not defined under IFRS. None of these measurements should be used in isolation or as a substitute for the Corporation’s reported financial performance or position as presented in accordance with IFRS. These ratios are useful complementary measurements for assessing the Corporation’s financial performance, efficiency, and liquidity and are common in the reports of other companies but may differ by definition and application. For a reconciliation of the Non-IFRS measures used in this calculation, refer to the Non-IFRS Measures section of this news release.
(2) Last 12 months.
(3) The December 2013 ratios have been adjusted for the impact of the California claim. The December 2012 ratios have been adjusted for the impact of the Sundance Units 1 and 2 arbitration.
RATIO FORMULAS
Debt to invested capital = long-term debt including current portion - cash and cash equivalents / long-term debt including current portion + non-controlling interests + equity attributable to shareholders - cash and cash equivalents
Debt to comparable EBITDA = long-term debt including current portion - cash and cash equivalents / comparable EBITDA
Return on equity attributable to common shareholders = net earnings attributable to common shareholders or earnings on a comparable basis / average equity attributable to common shareholders excluding AOCI
Return on capital employed = earnings before non-controlling interests and income taxes + net interest expense or comparable earnings before non-controlling interests and income taxes + net interest expense / average invested capital excluding AOCI
Price to comparable earnings ratio = current period’s closing market price / comparable earnings per share
Earnings coverage = net earnings attributable to shareholders + income taxes + net interest expense / interest on debt - interest income
Dividend payout ratio = common share dividends / net earnings attributable to common shareholders or earnings on a comparable basis or funds from operations
Dividend yield = dividend per common share / current period’s closing market price
Adjusted cash flow to debt = cash flow from operating activities before changes in working capital / average total debt - average cash and cash equivalents
Adjusted cash flow to interest coverage = cash flow from operating activities before changes in working capital + interest on debt - interest income - capitalized interest / interest on debt - interest income
GLOSSARY OF KEY TERMS
Alberta Power Purchase Arrangement (PPA) - A long-term arrangement established by regulation for the sale of electric energy from formerly regulated generating units to PPA buyers.
Availability - A measure of the time, expressed as a percentage of continuous operation 24 hours a day, 365 days a year that a generating unit is capable of generating electricity, regardless of whether or not it is actually generating electricity.
British Thermal Units (Btu) - A measure of energy. The amount of energy required to raise the temperature of one pound of water one degree Fahrenheit, when the water is near 39.2 degrees Fahrenheit.
Capacity - The rated continuous load-carrying ability, expressed in megawatts, of generation equipment.
Force Majeure - Literally means “major force”. These clauses excuse a party from liability if some unforeseen event beyond the control of that party prevents it from performing its obligations under the contract.
Geothermal Power — Power is derived from a steam turbine. The turbine is driven either by steam produced from hot water or by natural steam that derives its energy from heat found in rocks or fluids at various depths beneath the surface of the earth. The energy is extracted by drilling and/or pumping.
Gigawatt - A measure of electric power equal to 1,000 megawatts.
Gigawatt Hour (GWh) - A measure of electricity consumption equivalent to the use of 1,000 megawatts of power over a period of one hour.
Greenhouse Gas (GHG) - Gases having potential to retain heat in the atmosphere, including water vapour, carbon dioxide, methane, nitrous oxide, hydrofluorocarbons, and perfluorocarbons.
Heat Rate - A measure of conversion, expressed as Btu/MWh, of the amount of thermal energy required to generate electrical energy.
Megawatt (MW) - A measure of electric power equal to 1,000,000 watts.
Megawatt Hour (MWh) - A measure of electricity consumption equivalent to the use of 1,000,000 watts of power over a period of one hour.
Power Purchase Arrangement (PPA) - A long-term arrangement established by regulation for the sale of electric energy from formerly regulated generating units to PPA Buyers.
Renewable Power - Power generated from renewable terrestrial mechanisms including wind, geothermal, and solar with regeneration.
Spark Spread - A measure of gross margin per MW (sales price less cost of natural gas).
Turbine - A machine for generating rotary mechanical power from the energy of a stream of fluid (such as water, steam, or hot gas). Turbines convert kinetic energy of fluids to mechanical energy through the principles of impulse and reaction or a mixture of the two.
Unplanned Outage - The shut down of a generating unit due to an unanticipated breakdown.
Value at Risk (VaR) - A measure to manage earnings exposure from energy trading activities.
![]()
TransAlta Corporation
110 - 12th Avenue S.W.
Box 1900, Station “M”
Calgary, Alberta Canada T2P 2M1
Phone
403.267.7110
Website
www.transalta.com
CST Trust Company
P.O. Box 700 Station “B”
Montreal, Québec Canada H3B 3K3
Phone
Toll-free in North America: 1.800.387.0825
Toronto or outside North America: 416.682.3860
Fax
514.985.8843
Website
www.canstockta.com
FOR MORE INFORMATION
Media and Investor Inquiries
Investor Relations
Phone
1.800.387.3598 in Canada and United States
or 403.267.2520
Fax
403.267.7405
investor_relations@transalta.com