Exhibit 2
TA2003ARFeb28 3/3/04 11:36 AM Page 17
This management’s discussion and analysis (MD&A) should be read in conjunction with the consolidated financial statements and Auditors’ Report included in this Annual Report. The consolidated financial statements have been prepared in accordance with Canadian generally accepted accounting principles (GAAP). The effect of significant differences between Canadian and U.S. GAAP has been disclosed inNote 27to the consolidated financial statements. All tabular amounts in the following discussion are in millions of Canadian dollars unless otherwise noted. This MD&A is current as of Feb. 27, 2004. Additional information respecting TransAlta Corporation (TransAlta or the corporation), including its annual information form, is available on SEDAR at www.sedar.com.
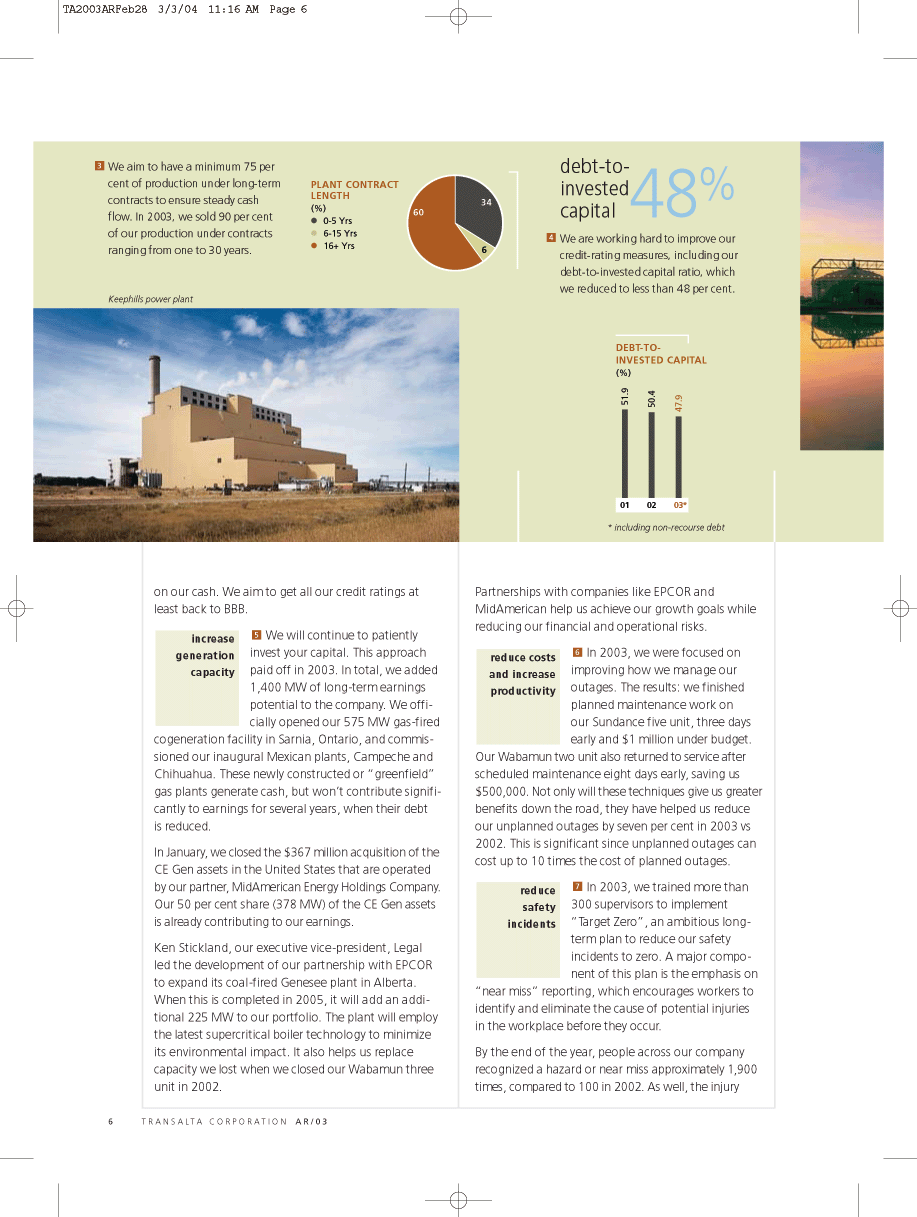
F O R WA R D - L O O K I N G S TAT E M E N T S
This MD&A contains forward-looking statements, including statements regarding the business and anticipated financial performance of TransAlta. In some cases, forward-looking statements can be identified by terms such as ‘may’, ‘will’, ‘believe’, ‘expect’, ‘potential’, ‘enable’, ‘continue’ or other comparable terminology. These statements are not guarantees of TransAlta’s future performance and are subject to risks, uncertainties and other important factors that could cause the corporation’s actual performance to be materially different from those projected. Some of the risks, uncertainties, and factors include, but are not limited to: legislative and regulatory developments that could affect revenues, costs, and the speed and degree of competition entering the market; global capital markets activity; timing and extent of changes in commodity prices, prevailing interest rates , currency exchange rates, inflation levels and general economic conditions in geographic areas where TransAlta operates; results of financing efforts; changes in counterparty risk; and the impact of accounting policies issued by Canadian and U.S. standard setters. Given these uncertainties, the reader should not place undue reliance on these forward-looking statements. See additional discussion under Risk Factors and Risk Management in this MD&A.
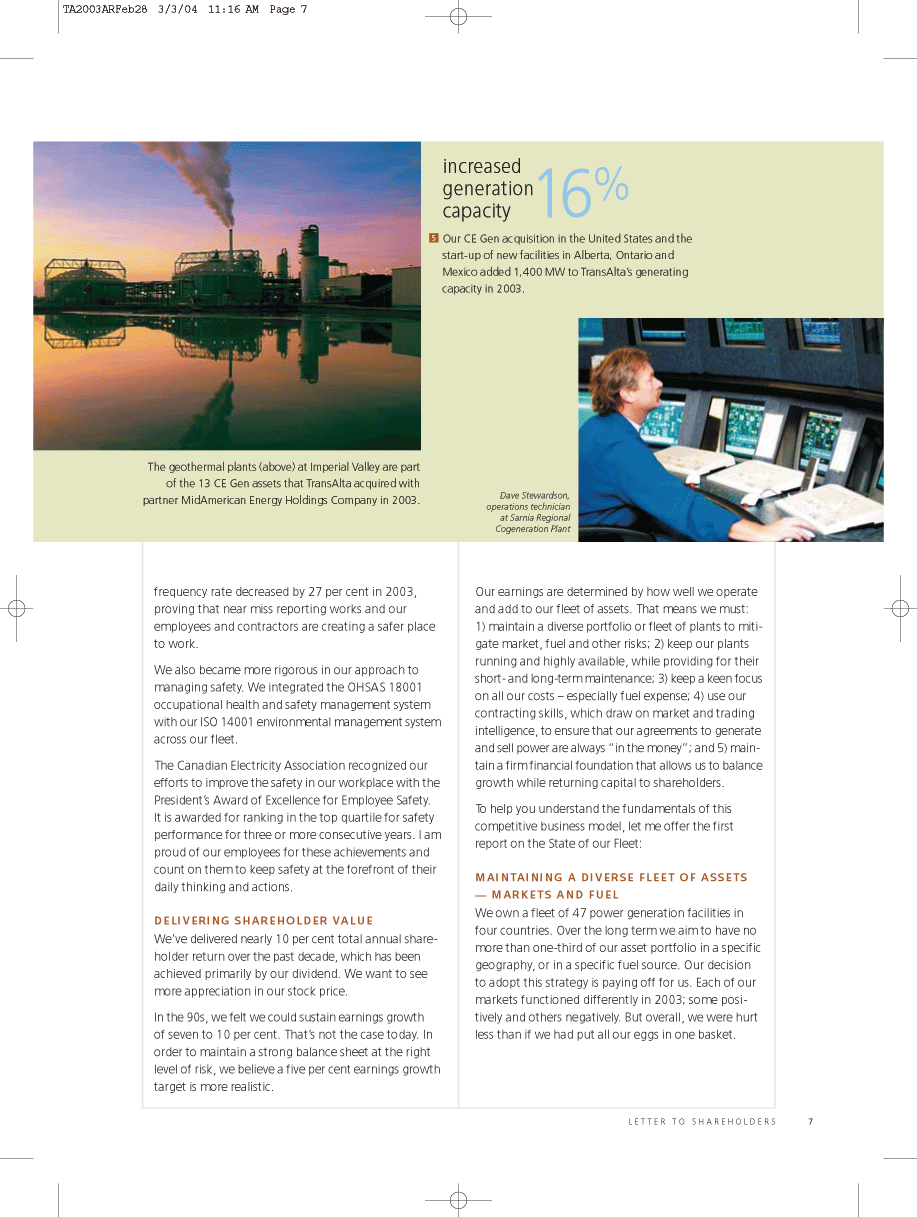
M A N A G E M E N T ’ S D I S C U S S I O N & A N A L Y S I S 17
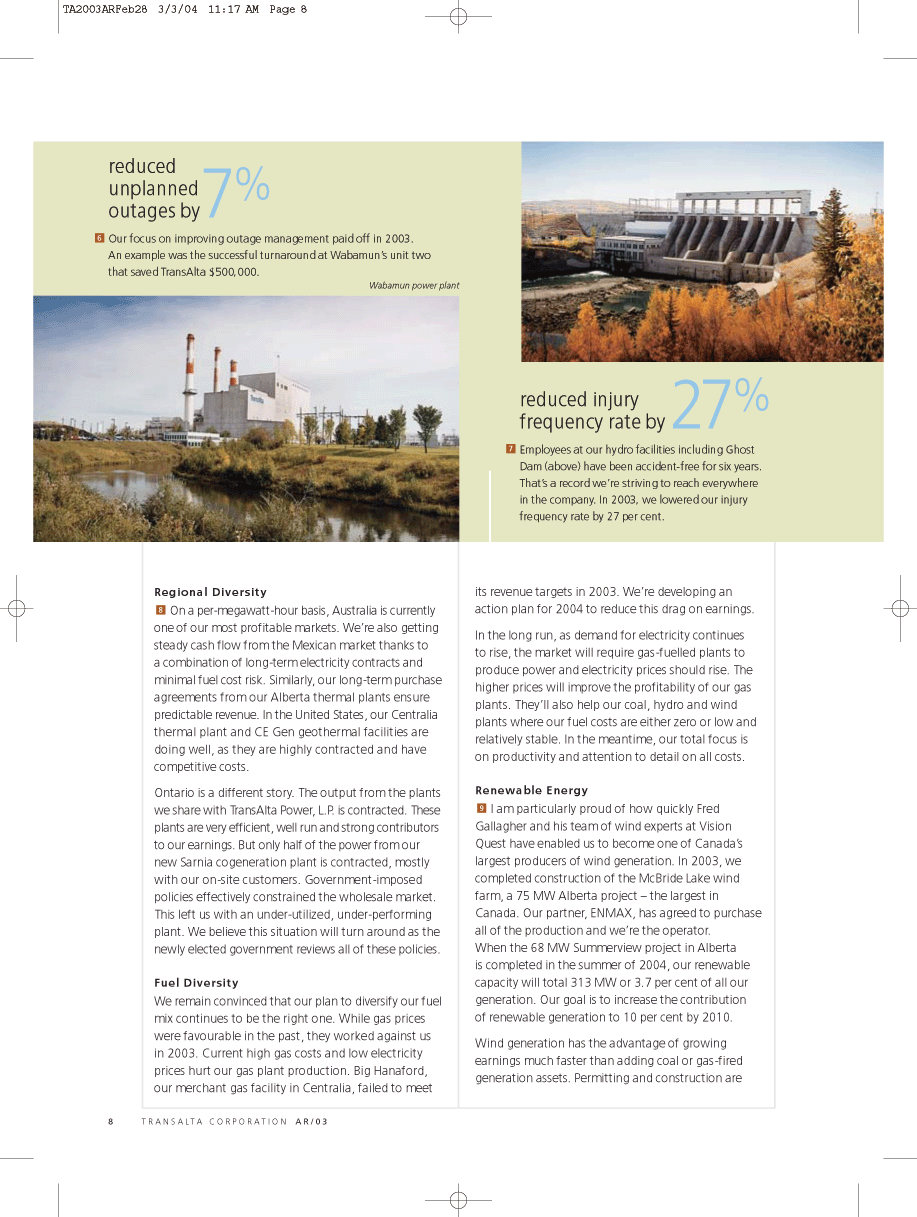
TA2003ARFeb28 3/3/04 11:36 AM Page 18
O V E R V I E W
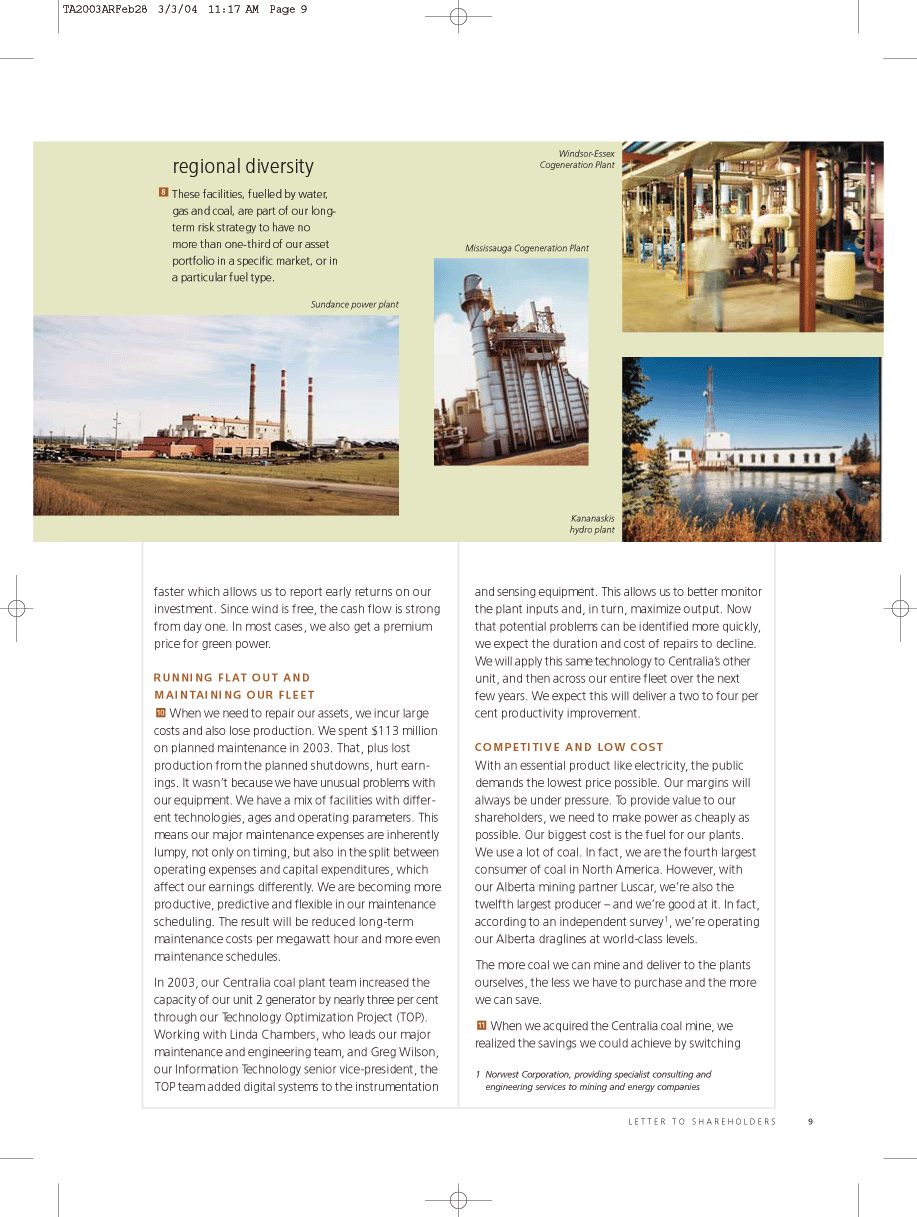
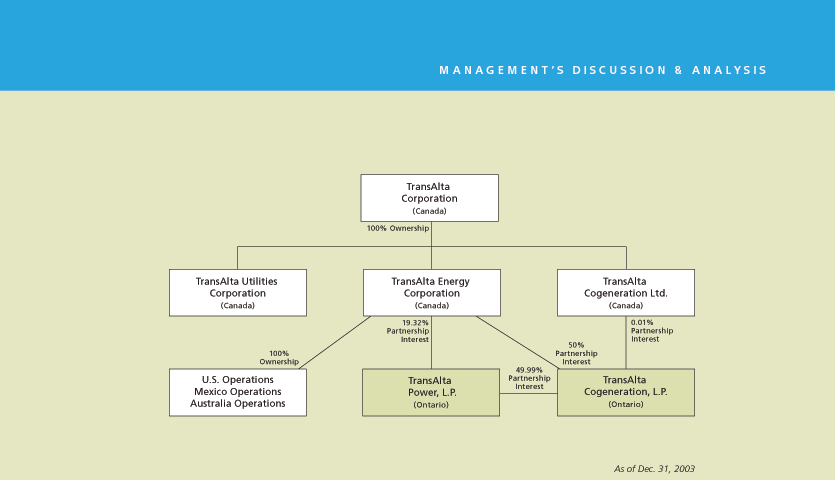
The analysis of TransAlta’s 2003 operating results is organized by consolidated results and by business segment. TransAlta has two business segments: Generation and Energy Marketing. A third business segment, Independent Power Projects (IPP), was combined with the Generation segment effective Jan. 1, 2002 following changes to TransAlta’s organizational structure. TransAlta’s Transmission operations were sold on April 29, 2002. Prior period amounts have been reclassified to reflect these changes. TransAlta’s segments are supported by a corporate group that provides finance, treasury, legal, human resources and other administrative support. These corporate group overheads are allocated to the business segments if they are not directly attributable to discontinued operations.
Each business segment assumes responsibility for its operating results measured to operating income. Operating income is not defined under GAAP and should not be considered in isolation or as an alternative to, or more meaningful than, net income or cash flow as determined in accordance with GAAP as an indicator of the corporation’s financial performance or liquidity. TransAlta’s operating income is not necessarily comparable to a similarly titled measure of another company. Operating income has been calculated on a consistent basis for the three years ended Dec. 31, 2003 and is reconciled to net earnings applicable to common shareholders below:
| 2 0 0 3 | 2 0 0 2)1 | 2 0 0 1)1 | |||||||
| Operating income | $ | 561.6 | $ | 212.6 | $ | 400.8 | |||
| Other income (expense) | (3.2) | 0.1 | 1.5 | ||||||
| Foreign exchange gain (loss) | (4.7) | 1.2 | 0.8 | ||||||
| Net interest expense | (183.9) | (82.7) | (88.1) | ||||||
| Earnings from continuing operations before income taxes | |||||||||
| and non-controlling interests | 369.8 | 131.2 | 315.0 | ||||||
| Income tax expense | 78.4 | 23.4 | 97.6 | ||||||
| Non-controlling interests | 34.2 | 20.1 | 20.6 | ||||||
| Earnings from continuing operations | 257.2 | 87.7 | 196.8 | ||||||
| Earnings from discontinued operations, net of tax | – | 12.8 | 45.1 | ||||||
| Gain on disposal of discontinued operations, net of tax | – | 120.0 | – | ||||||
| Net earnings | 257.2 | 220.5 | 241.9 | ||||||
| Preferred securities distributions, net of tax | 23.0 | 20.9 | 13.1 | ||||||
| Net earnings applicable to common shareholders | $ | 234.2 | $ | 199.6 | $ | 228.8 | |||
| 1 | TransAlta adopted the new accounting standard for asset retirement obligations on Jan. 1, 2003. The standard was adopted retroactively with restatement of prior periods. SeeNote 1to the consolidated financial statements for further discussion. |
Some of the corporation’s accounting policies require management to make estimates or assumptions that in some cases may relate to matters that are inherently uncertain. Critical accounting policies and estimates for TransAlta include: revenue recognition; valuation and useful life of property, plant and equipment (PP&E); asset retirement obligations; valuation of goodwill; income taxes; and employee future benefits. See additional discussion under Critical Accounting Policies and Estimates in this MD&A.
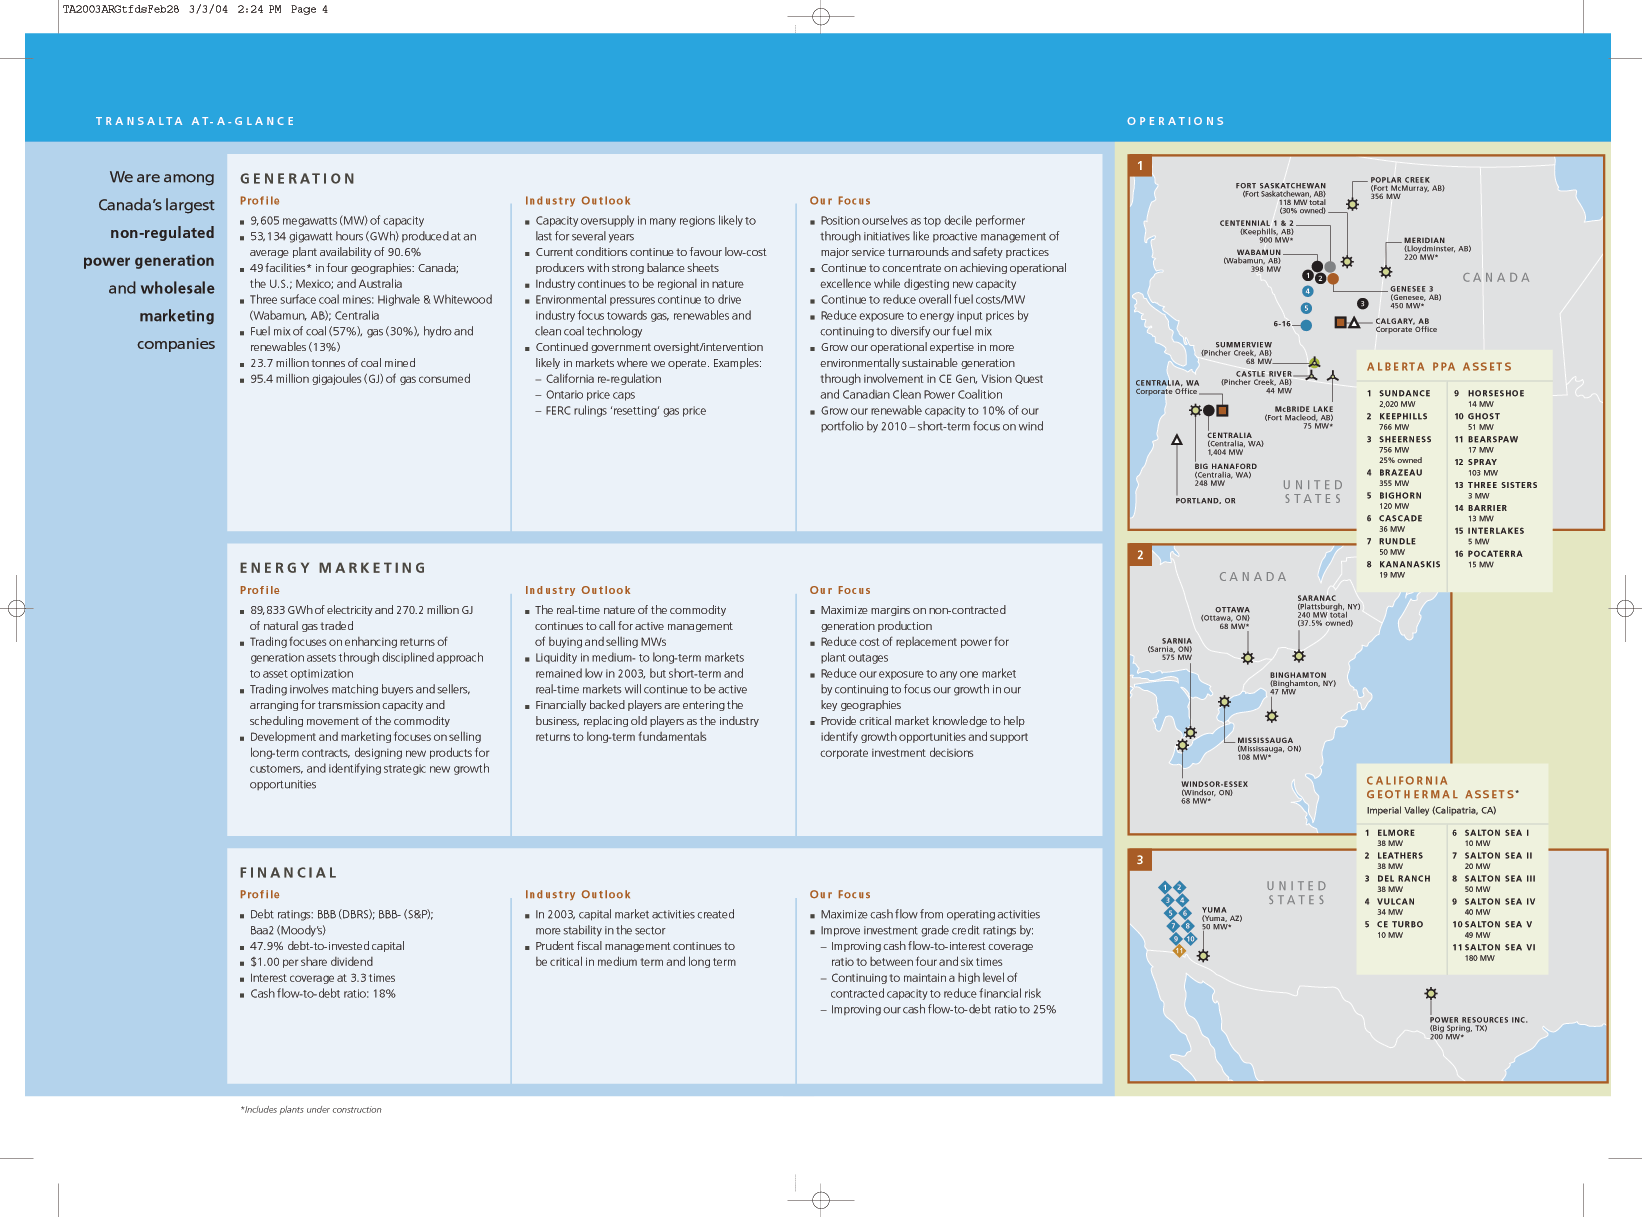
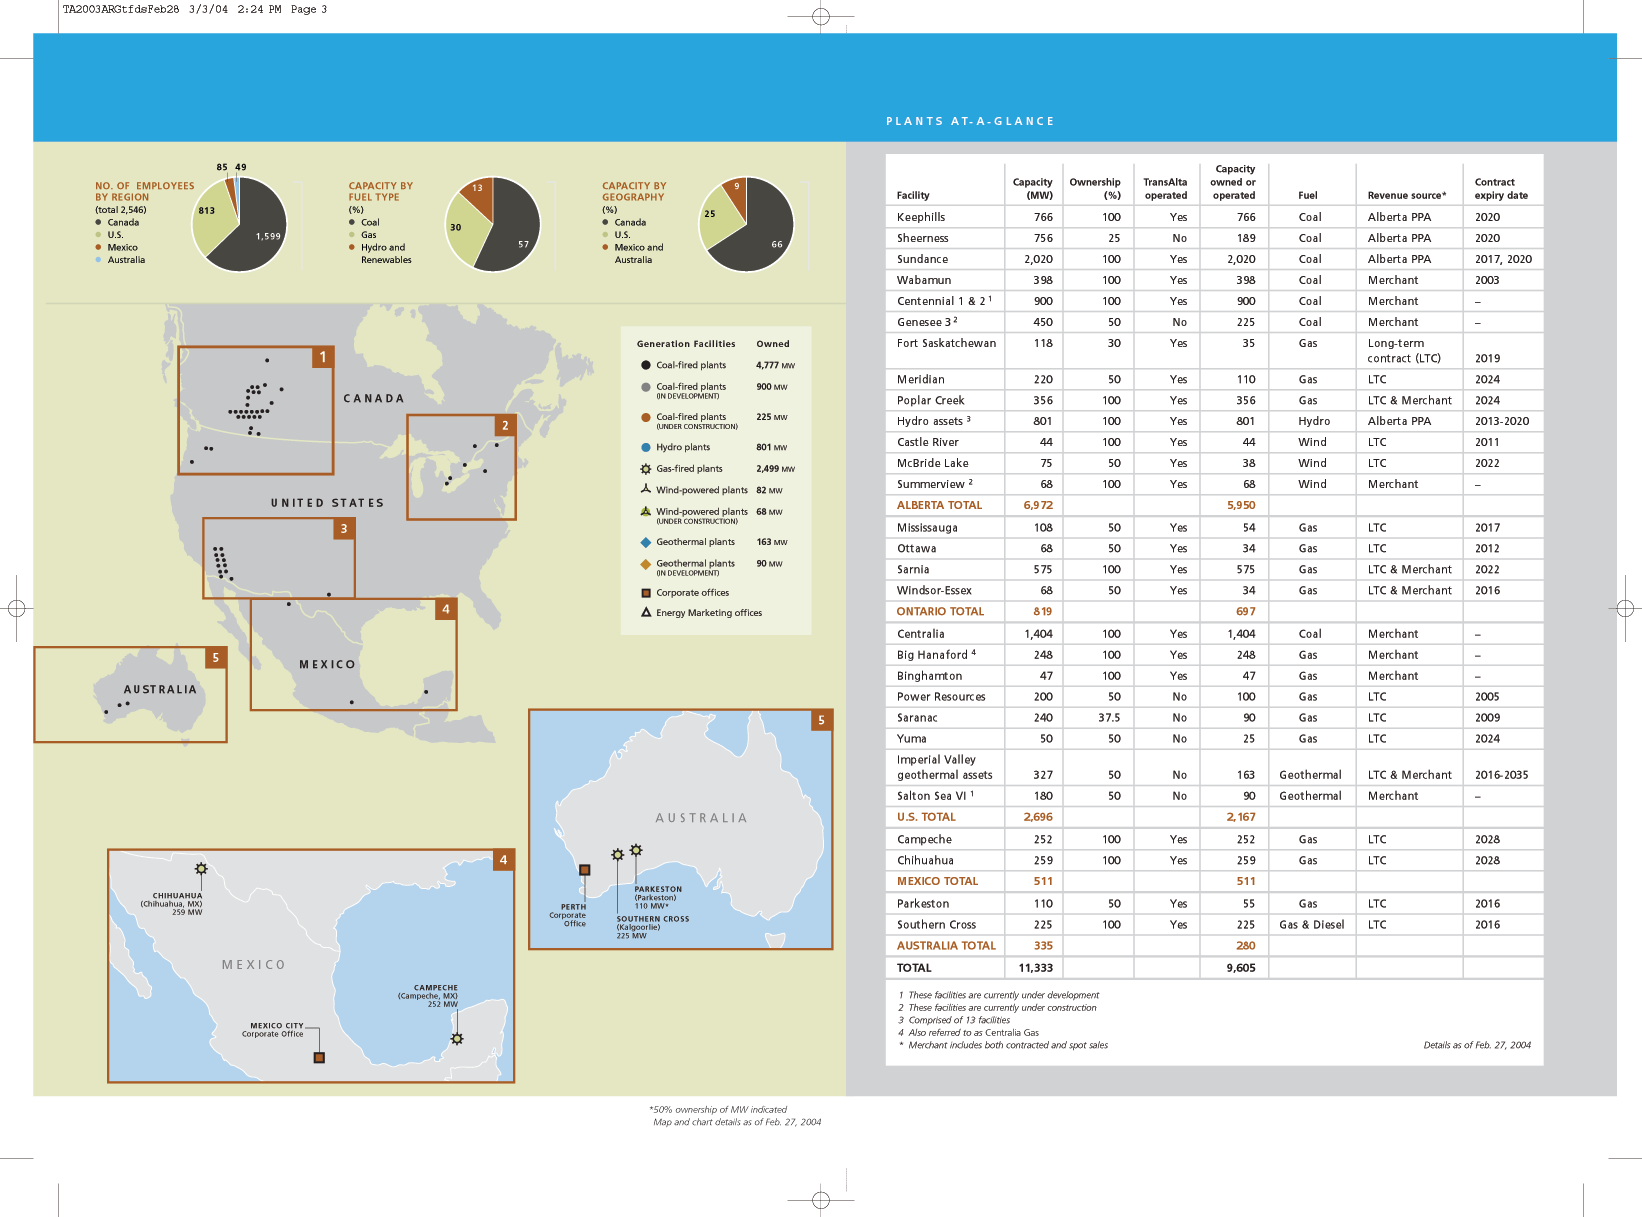
TransAlta measures capacity as net maximum capacity (see glossary for definition of this and other key terms) which is consistent with industry standards. Capacity figures represent capacity owned and in operation unless otherwise stated.
S T R AT E G Y A N D K E Y P E R F O R M A N C E I N D I C AT O R S
Strategy
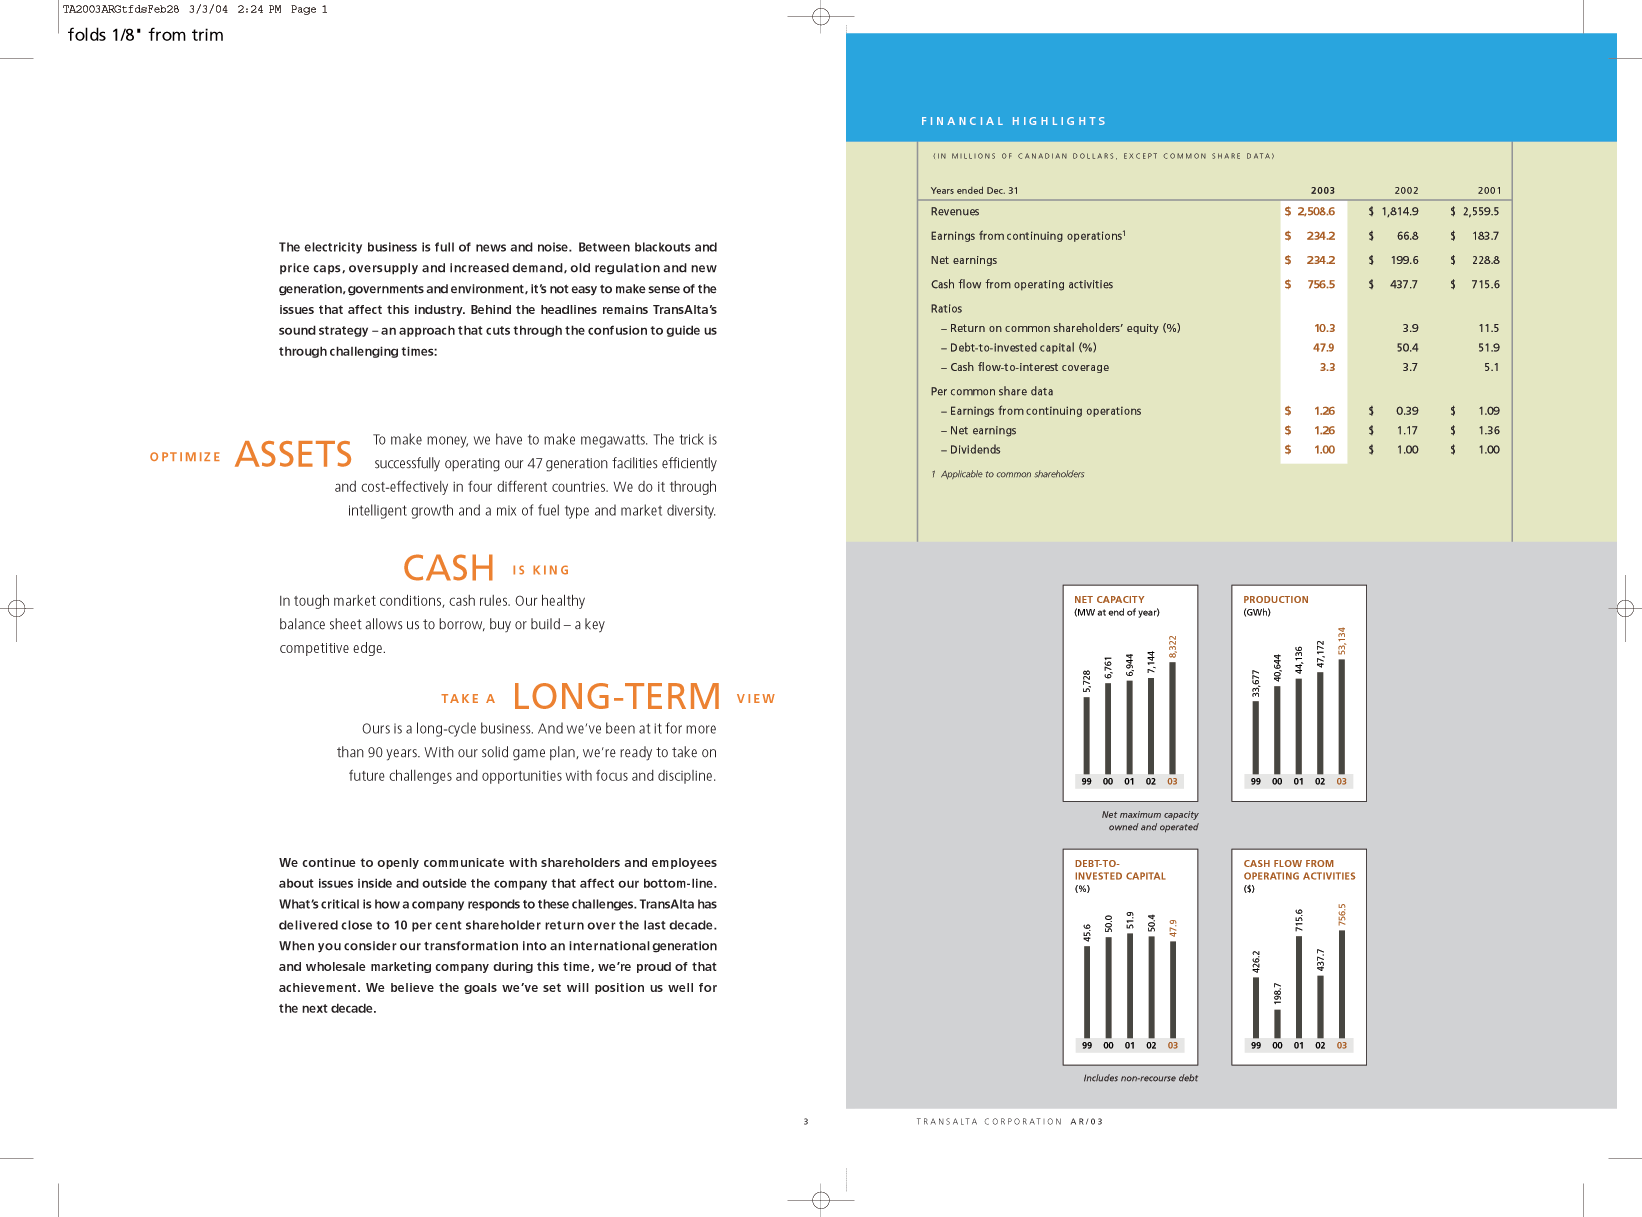
The corporation’s strategy is to deliver sustainable and increasing earnings and cash flow through operations and growth of a diversified portfolio of power generating assets. To implement this strategy, TransAlta focuses on maintaining a strong balance sheet, minimizing costs, utilizing existing assets efficiently and carefully managing the risk profile while methodically growing capacity.
In 2003, TransAlta increased net generating capacity by 1,178 megawatts (MW). The corporation commissioned two plants in Mexico and completed the Sarnia plant and the McBride Lake wind generation project. In addition, the corporation acquired a 50 per cent interest in CE Generation LLC (CE Gen).
18 T R A N S A L T A C O R P O R A T I O N A R / 0 3
TA2003ARFeb28 3/3/04 11:36 AM Page 19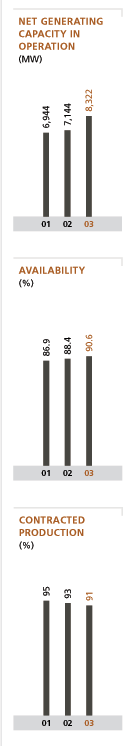
TransAlta has 225 MW of capacity under construction at the Genesee 3 project and 68 MW of capacity under construction at the Summerview Wind Farm. TransAlta also has 990 MW approved for development. At Dec. 31, 2003 TransAlta had 9,605 MW of owned capacity in operation, under construction or approved for development.
|
The increase in net generating capacity was partially offset by the sale of a portion of TransAlta’s 50 per cent interest in the Sheerness Generating Station (Sheerness) to TransAlta Cogeneration, L.P. (TA Cogen) in July 2003. The proceeds received in 2003 from this sale were used to reduce the debt incurred to fund the new capacity additions previously discussed. The approximately $125 million remaining sale proceeds are expected to be received in 2004.
|
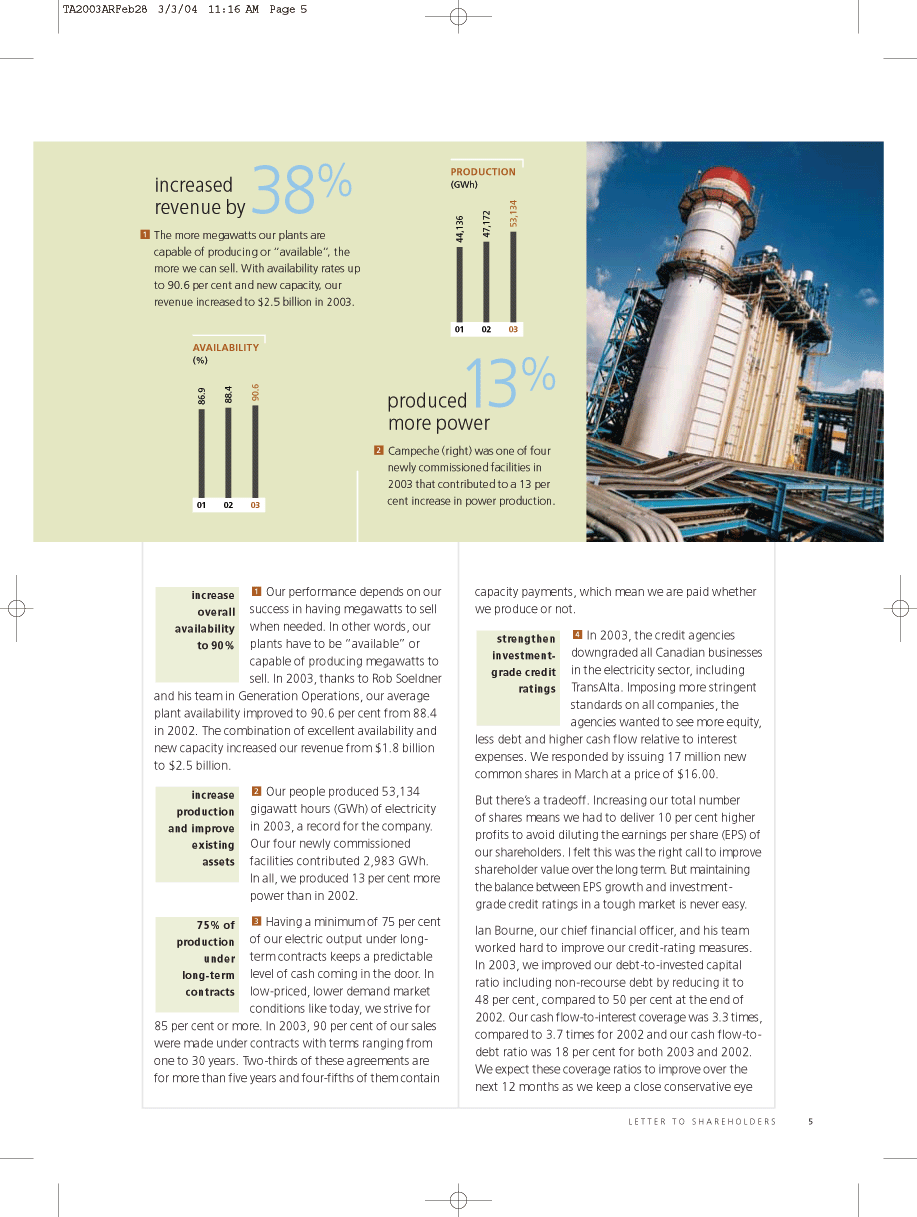
Availability is a key driver of TransAlta’s financial results as approximately 88 per cent of the corporation’s revenues are derived from contracts with either production or availability components. In 2003, TransAlta spent $112.5 million on planned maintenance and increased fleet availability to 90.6 per cent from 88.4 per cent in 2002. TransAlta’s goal is to have an overall availability rate of 90 per cent. As a result of the increased capacity and availability, production also increased by 13 per cent to 53,134 gigawatt hours (GWh) in 2003.
|
Long-term contracts minimize TransAlta’s exposure to market price fluctuations and provide a stable stream of revenues to support fixed operating costs, pay interest and recover capital expenditures. The corporation also reserves a portion of its capacity to be available to be sold at market rates. In 2003, 91 per cent of the corporation’s production was sold under contracts with durations of at least 12 months and 74 per cent was sold under contracts with original terms of 10 years or more.
|
Energy Marketing is a vital asset in delivering sustainable revenues. Energy Marketing acts to maximize margins from the production and sale of electricity, minimize the cost of natural gas used to generate electricity and steam and reduce the risk to the corporation from unplanned outages by acquiring replacement power at the lowest possible price. During 2003, Energy Marketing helped to increase revenues from generating assets from $36 per MWh in 2002 to $45 per MWh in 2003. Although Energy Marketing incurred a $15.5 million operating loss on proprietary trading, mainly due to a $33.3 million clerical error in the Annapolis office described in Significant Events in this MD&A, proprietary trading is expected to contribute between $20 million and $40 million in operating income annually.
|
To minimize risk, TransAlta’s long-term goal is to ensure no more than 30 per cent of the corporation’s generating capacity is in one fuel source or market. TransAlta would like to have 10 per cent of capacity from renewable generation sources by 2010.
|
In addition to increasing production from renewable sources, the continued investment in international emission offset credits and development of clean coal technology will position the corporation to manage future climate change regulations. The corporation is focused on managing international emission levels and has reduced its worldwide greenhouse gas intensity by 10 per cent from 1990 levels while increasing generation by approximately 75 per cent over the same period. TransAlta is positioning itself to meet the requirements of a Canadian climate change program expected in 2008. TransAlta also has a longer-term strategy to seek emission reduction opportunities as its existing plants are retired and as new combustion and environmental technology is developed to further reduce emissions.
|
TransAlta has strategic alliances with EPCOR Utilities Inc. (EPCOR), ENMAX Corporation (ENMAX) and MidAmerican Energy Holdings Company (MidAmerican). The EPCOR alliance provided the opportunity to acquire a 50 per cent ownership in the 450 MW Genesee 3 project. The ENMAX partnership in the McBride Lake wind project provides the economic support to expand TransAlta’s renewable energy business. MidAmerican owns the other 50 per cent interest in CE Gen.
|
In 2003, TransAlta implemented ‘Target Zero’, a long-term plan focused on reducing safety incidents to zero. TransAlta also integrated ISO 14001, an environmental health and safety management system. These initiatives resulted in the injury frequency rate decreasing by 27 per cent in 2003. |
M A N A G E M E N T ’ S D I S C U S S I O N & A N A L Y S I S 19
TA2003ARFeb28 3/3/04 11:36 AM Page 20
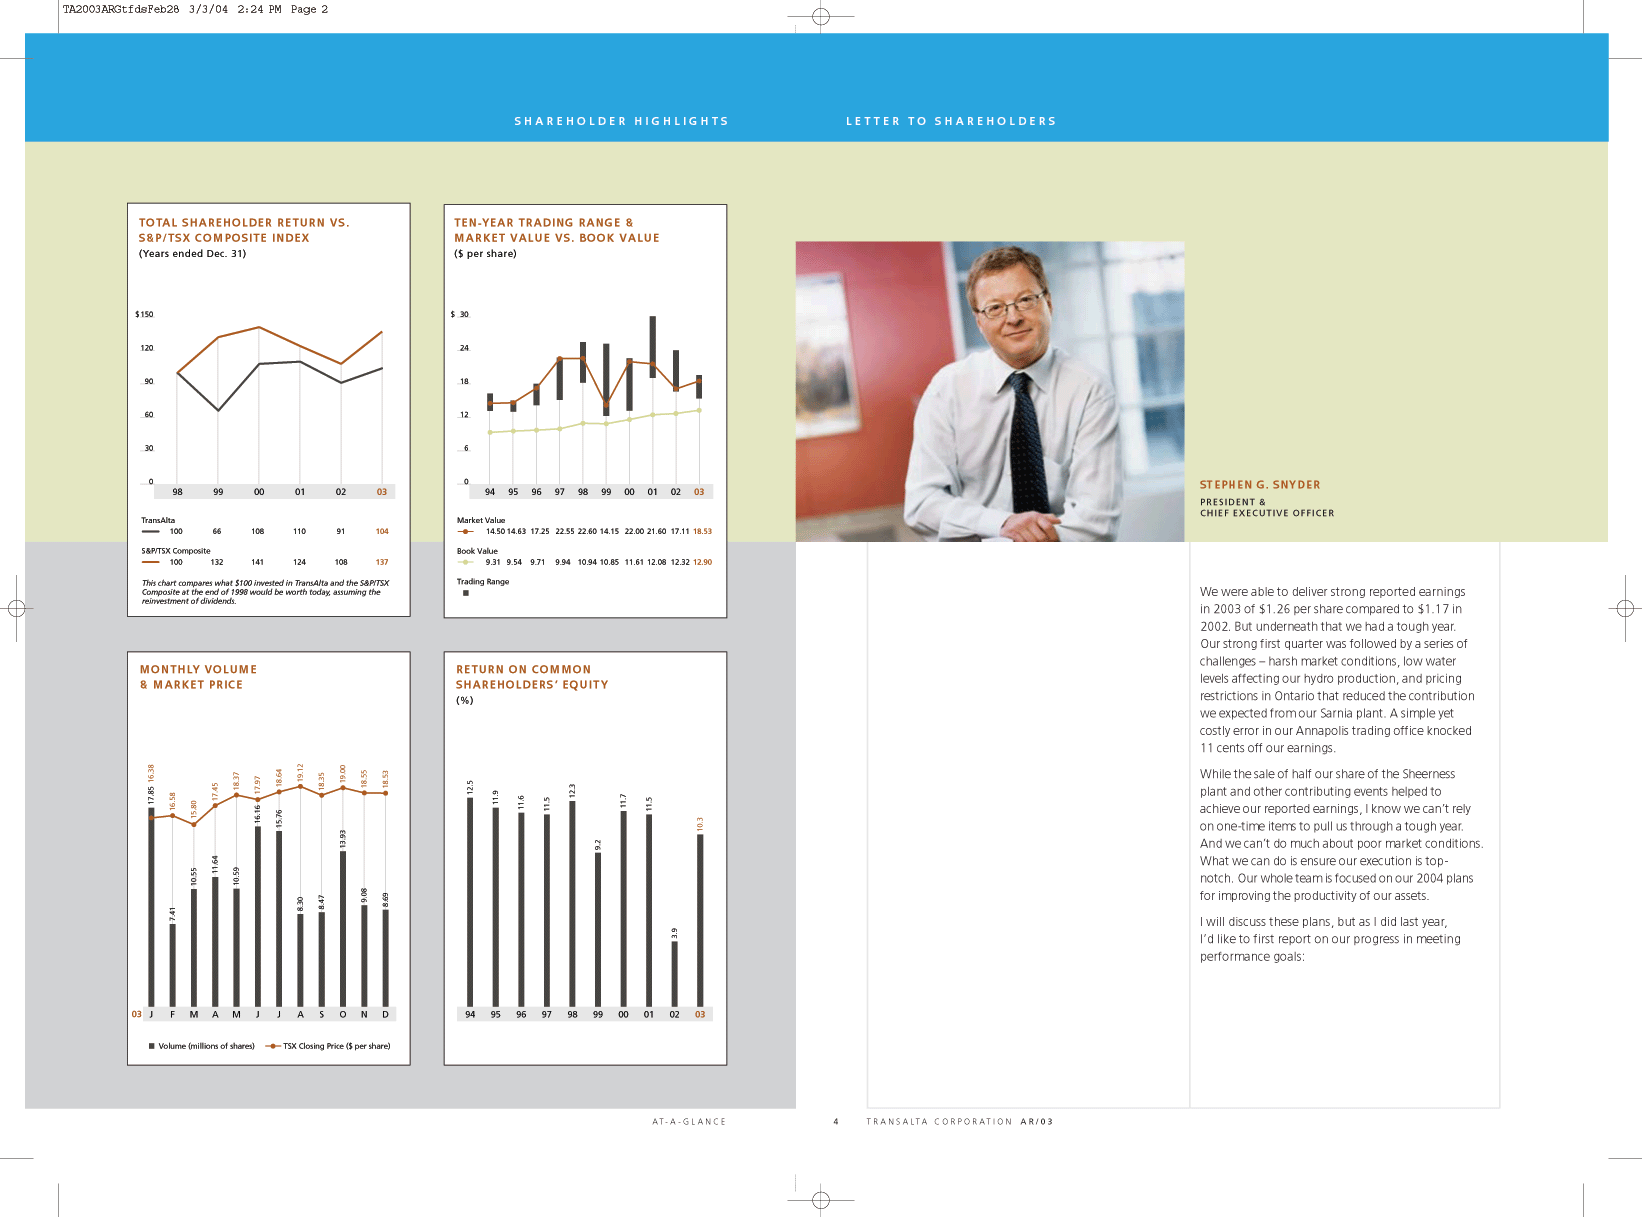
 | TransAlta is focused on maintaining a strong balance sheet and investment grade credit ratings. At Dec. 31, 2003, TransAlta’s debt-to-invested capital ratio (including non-recourse debt) was 47.9 per cent and the corporation’s credit rating was BBB- (stable) by Standard & Poor’s.
|
For the year ended Dec. 31, 2003, TransAlta earned $1.26 per common share, an increase of eight per cent over 2002. Earnings in 2003 included a $145.8 million after-tax gain related to the sale of a portion of the interest in the Sheerness plant, as well as $59.0 million of after-tax asset impairment charges. While TransAlta will attempt to achieve average earnings growth of five per cent per annum in the medium term, 2004 earnings are expected to be negatively impacted by increased planned maintenance.
| |
Key Performance Indicators | |
For the Generation segment, key performance indicators (KPIs) include availability, production, fuel and operating costs, and pricing applicable to non-contracted production. For the Energy Marketing segment, KPIs include trading volumes, margins and value at risk (VAR), which is a measure used to manage earnings exposure from proprietary (non asset-backed) trading activities. Each of these KPIs is discussed in greater detail in Segmented Business Results in this MD&A. KPIs for the corporate segment include the debt-to-invested capital ratio, interest and debt-coverage ratios and credit ratings. These KPIs are discussed under Liquidity and Capital Resources.
| |
M A R K E T T R E N D S | |
Changes in the price of electricity have an influence on TransAlta’s financial performance. Fluctuating supply and demand and the regional nature of electricity markets resulted in high market volatility and high prices for electricity in early 2001. In the last half of 2001, additional capacity was brought to market and economic conditions reduced demand; this combination resulted in lower volatility and prices throughout 2002 and 2003. Electricity price levels in Alberta and the Pacific Northwest are expected to be slightly lower in 2004 compared to 2003 due to forecasted lower natural gas prices and higher hydro production. In Ontario, electricity prices are also expected to be lower in 2004 compared to 2003 due to the recommissioning of several large nuclear units and only moderate growth in electricity demand.
| |
Electricity prices generally increase as a result of higher natural gas prices. However, as experienced in 2002 and 2003, increased natural gas prices can also reduce spark spreads (the difference between the price of natural gas consumed to produce power and the selling price of electricity). The increases in electricity prices may not be completely correlated to the increase in natural gas prices due to imbalances between traditional supply and demand levels.
| |
Liquidity in the medium- and longer-term energy trading markets has decreased considerably since 2001, while activity levels in the short-term market have increased. Margins in the energy trading business, particularly the Pacific Northwest, have declined relative to 2001.
| |
In 2003, the Canadian dollar appreciated significantly against the U.S. dollar. As the Canadian dollar appreciates, U.S. denominated earnings decrease upon translation to Canadian dollars.
| |
From January 2002 until May 2003, Canadian long-term interest rates decreased by approximately 0.8 per cent, reaching the lowest point in May 2003. During the same period, Canadian short-term interest rates increased approximately 0.6 per cent. In the two year period ended Dec. 31, 2003, U.S. long-term interest rates declined by approximately 0.8 per cent, reaching a multi-decade low point in June 2003. U.S. short-term interest rates declined over the same period by approximately 0.7 per cent. |
20 T R A N S A L T A C O R P O R A T I O N A R / 0 3
TA2003ARFeb28 3/3/04 11:36 AM Page 21
H I G H L I G H T S
TransAlta made significant additions to its asset base and generating capacity in late 2002 and 2003. The corporation purchased the remainder of Vision Quest Windelectric Inc. (Vision Quest) in December 2002 and a 50 per cent interest in CE Gen in January 2003. TransAlta completed the construction of the Sarnia, Chihuahua and Campeche plants in the first three quarters of 2003. These projects added 1,367 MW of net operating capacity, of which approximately 75 per cent is under long-term contracts. Throughout 2003, TransAlta took steps to maintain the strength of its balance sheet. Proceeds from the sales of Sheerness, the Calgary head office building, the Goldfields pipeline and the issuance of common shares were substantially directed to repaying the debt that was incurred to expand capacity.
For the year ended Dec. 31, 2003, the additional capacity resulted in increased production and higher gross margin compared to 2002. This was substantially offset by higher planned maintenance on existing plants and higher interest and depreciation costs from the new capacity additions. A $33.3 million clerical error contributed to Energy Marketing’s operating loss of $15.5 million for the year ended Dec. 31, 2003. Cash flow from operations was higher than in 2002 due to higher earnings and lower working capital requirements.
In this MD&A, the impact of foreign exchange fluctuations on foreign currency transactions and balances is discussed with the relevant income statement and balance sheet items. While individual balance sheet line items will be impacted by foreign exchange fluctuations, the net impact of the individual items is reflected in the cumulative translation account on the consolidated balance sheet.
The following table depicts key financial results and statistical operating data:
| Years ended Dec. 31 | 2 0 0 3 | 2 0 0 24 | 2 0 0 1 4 | ||||||
| Availability (%) | 90.6 | 88.4 | 86.9 | ||||||
| Production (GWh) | 53,134 | 47,172 | 44,136 | ||||||
| Electricity trading volumes (GWh)1 | 89,833 | 92,874 | 27,619 | ||||||
| Gas trading volumes (million GJ)1 | 270.2 | 162.0 | 99.3 | ||||||
| Total assets | $ | 8,420.2 | $ | 7,414.9 | $ | 7,579.1 | |||
| Long-term debt (including current portion), net of cash | $ | 3,007.1 | $ | 2,563.3 | $ | 2,449.1 | |||
| Revenue | $ | 2,508.6 | $ | 1,814.9 | $ | 2,559.5 | |||
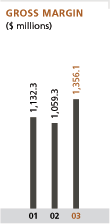
| Gross margin | 1,356.1 | 1,059.3 | 1,132.3 | ||||||
| Earnings from continuing operations2 | 234.2 | 66.8 | 183.7 | ||||||
| Earnings from discontinued operations, net of tax3 | – | 12.8 | 45.1 | ||||||
| Gain on disposal of discontinued operations, net of tax3 | – | 120.0 | – | ||||||
| Net earnings applicable to common shareholders | $ | 234.2 | $ | 199.6 | $ | 228.8 | |||
| Basic earnings per common share: | |||||||||
| Earnings from continuing operations | $ | 1.26 | $ | 0.39 | $ | 1.09 | |||
| Net earnings | 1.26 | 1.17 | 1.36 | ||||||
| Diluted earnings per common share: | |||||||||
| Earnings from continuing operations | 1.26 | 0.39 | 1.07 | ||||||
| Net earnings | 1.26 | 1.17 | 1.34 | ||||||
| Cash flow from operating activities | $ | 756.5 | $ | 437.7 | $ | 715.6 | |||
| 1 | 2002 production and electricity and gas trading volumes have been restated to conform with current reporting practices and standards. |
| 2 | Continuing operations include the Generation and Energy Marketing segments plus corporate costs not directly attributable to discontinued operations, and are net of preferred securities distributions. |
| 3 | Discontinued operations consist of the Transmission operation that was sold on April 29, 2002. |
| 4 | TransAlta adopted the new standard for asset retirement obligations on Jan. 1, 2003. The standard was adopted retroactively with restatement of prior periods. SeeNote 1to the consolidated financial statements for further discussion. |
M A N A G E M E N T ’ S D I S C U S S I O N & A N A L Y S I S
21
TA2003ARFeb28 3/3/04 11:36 AM Page 22
Availability increased in 2003 compared to 2002 as a result of significantly fewer planned outages at the Centralia plant and a higher proportion of gas-fired plant capacity. Planned maintenance at the Alberta thermal plants increased compared to 2002, which partially offset the increased availability at the Centralia plant and new gas plants. The increase in 2002 availability compared to 2001 is attributable to improved operational performance at the thermal and gas plants. | |
Production increased in 2003 due to capacity additions from the acquisitions of a 50 per cent interest in CE Gen and the remainder of Vision Quest; the commencement of commercial operations at the Sarnia, Campeche and Chihuahua plants; and higher production from the Centralia and Poplar Creek plants. The increase was partially offset by the decommissioning of unit three of the Wabamun plant in November 2002. Production increased in 2002 compared to 2001 as a result of increased production from the Centralia plant and incremental production from the Centralia Gas plant, partially offset by lower production due to accelerated maintenance at the Alberta thermal plants. | |
Gross margins increased in 2003 compared to 2002 as a result of increased production and availability and the $38.9 million Wabamun arbitration decision which was recorded as a reduction to revenues in 2002. Gross margins decreased in 2002 compared to 2001 due to significantly lower Energy Marketing margins, offset by increased production and availability from generating assets. | |
In 2003, operating income increased to $561.6 million compared to $212.6 million in 2002 and $400.8 million in 2001 as shown below: |
 | Operating income Dec. 31, 2001 | $ | 400.8 | |
| Higher Generation gross margins | 77.9 | |||
| Wabamun arbitration decision | (38.9) | |||
| Lower Energy Marketing gross margins | (112.0) | |||
| Increased operations, maintenance and administration | (28.3) | |||
| Increased depreciation | (30.2) | |||
| Pierce Power plant impairment | 118.8 | |||
| Prior period regulatory decisions | (14.3) | |||
| Wabamun impairment charge | (110.0) | |||
| Turbine order cancellation | (42.5) | |||
| Other | (8.7) | |||
| Operating income Dec. 31, 2002 | $ | 212.6 | ||
| Higher Generation gross margins | 67.0 | |||
| CE Gen operating income | 79.5 | |||
| Wabamun arbitration decision | 38.9 | |||
| Lower Energy Marketing gross margins | (37.7) | |||
| Increased operations, maintenance and administration | (68.0) | |||
| Increased depreciation | (17.5) | |||
| Gain on sale of Sheerness | 191.5 | |||
| Gain on sale of TransAlta Power partnership units | 15.2 | |||
| Wabamun impairment charge | 110.0 | |||
| Turbine order cancellation | 42.5 | |||
| Turbine impairment | (84.7) | |||
| Other | 12.3 | |||
| Operating income Dec. 31, 2003 | $ | 561.6 | ||
Earnings from continuing operations, net of preferred securities distributions, for 2003 were $234.2 million ($1.26 per common share), compared to $66.8 million ($0.39 per common share) for 2002. In 2003, earnings from continuing operations, net of preferred securities distributions, includes the $145.8 million after-tax gain on the sale of Sheerness, the $9.9 million after-tax dilution gain on the sale of TransAlta Power, L.P. (TransAlta Power) partnership units, the $3.6 million after-tax Binghamton impairment, the $4.1 million after-tax write-down of long-term investments and the $55.4 million after-tax turbine impairment |
22 T R A N S A L T A C O R P O R A T I O N A R / 0 3
TA2003ARFeb28 3/3/04 11:36 AM Page 23
charge. Earnings from continuing operations, net of preferred securities distributions, for the year ended Dec. 31, 2002 include the $11.2 million after-tax gain from refinancing of foreign operations, the $27.6 million after-tax turbine order cancellation charge, the $71.5 million after-tax Wabamun impairment charge and the $25.2 million after-tax charge resulting from the Wabamun arbitration decision. See Significant Events below for further discussion.
Earnings from continuing operations, net of preferred securities distributions, decreased by $116.9 million in 2002 compared to 2001. The decrease was primarily due to lower Energy Marketing margins, the Wabamun plant impairment charge, the cancellation of turbines ordered, and the impact of the accelerated Alberta thermal plant maintenance schedule, partially offset by reduced purchased power requirements.
Net earnings applicable to common shareholders for 2002 included the $120.0 million after-tax gain on sale of the Transmission operation.
Cash flow from operating activities in 2003 was $756.5 million compared to $437.7 million for 2002. The increase was primarily due to higher earnings and the collection of commodity tax receivables in the U.S. and Mexico (US$79.0 million) in 2003, the settlement of a disputed ancillary services revenue issue with the Balancing Pool of Alberta ($49.9 million) in 2002, the timing of cash tax obligations ($55.6 million) in 2002, and the final instalment of 2001 income taxes paid in 2002 ($109.0 million). Cash flow from operating activities was $277.9 million lower in 2002 compared to 2001. The decrease was due to lower earnings, the impact of the collection in 2001 of accounts receivable relating to the Alberta Power Pool upon implementation of deregulation on Jan. 1, 2001 ($170.0 million), and other reasons discussed above.
The corporation’s disclosure controls and procedures have enabled the certification of TransAlta’s annual report to shareholders in compliance with the requirements of Section 302 of the Sarbanes-Oxley Act.
S I G N I F I C A N T E V E N T S
These consolidated financial results include the following significant events. All gains and losses discussed below are presented as pre-tax (after-tax) amounts.
2 0 0 3
Acquisitions
In January 2003, TransAlta acquired a 50 per cent interest in EPCOR’s Genesee 3 project for an estimated $395 million, of which $256.8 million had been spent at Dec. 31, 2003. The 450 MW addition to the existing Genesee Generating Station is currently under construction southwest of Edmonton, Alberta. EPCOR will continue to manage the project’s construction and will operate the plant upon commercial operation in the first quarter of 2005. Both parties will independently dispatch and market their share of the electrical output from the unit. Included in the arrangement is an option for EPCOR to purchase a 50 per cent interest in TransAlta’s Centennial 1 project. The option expires Dec. 31, 2005. EPCOR also has the option to purchase a 50 per cent interest in TransAlta’s Sarnia plant, which may be exercised between January 2003 and Mar. 31, 2004.
In January 2003, the corporation acquired a 50 per cent interest in CE Gen for $366.6 million. CE Gen, through its subsidiaries, is primarily engaged in the development, ownership and operation of power production facilities in the U.S. using geothermal resources and natural gas as fuel. CE Gen has 13 facilities with an aggregate operating capacity of 757 MW. The acquisition included the right to a 50 per cent interest in a geothermal project currently under development in Imperial Valley, California.
Equity Offering
In March and April of 2003, the corporation issued a total of 17.25 million common shares for gross proceeds of $276.0 million. Proceeds were used to finance growth projects and repay debt.
M A N A G E M E N T ’ S D I S C U S S I O N & A N A L Y S I S 23
TA2003ARFeb28 3/3/04 11:36 AM Page 24
Sale of Goldfields Gas Pipeline
In April 2003, TransAlta sold its remaining interest in the Goldfields gas pipeline for proceeds of AUD$24.1 million (Cdn$21.6 million), which approximated book value.
Sale of Head Office Building
In May 2003, TransAlta sold the Calgary head office building for $65.8 million, which approximated book value. TransAlta is leasing the property for a term of 20 years.
Energy Marketing Loss on Transmission Congestion Contracts
TransAlta submitted an erroneous bid to the New York Independent System Operator (New York ISO) for May 2003 transmission congestion contracts (TCCs). The New York ISO manages New York’s electricity transmission system and TCCs are financial contracts. TransAlta’s computer spreadsheet contained mismatched bids for TCCs due to a clerical error and resulted in TransAlta purchasing more contracts at higher prices than intended. The erroneous bid resulted in a loss of $33.3 million ($20.0 million) in May 2003.
Turbine Impairment Charges
Following a strategic review and after examining expected unfavourable market conditions, the corporation concluded that the book value of its turbine inventory was unlikely to be fully recovered. As a result, TransAlta recorded an $84.7 million ($55.4 million) impairment charge in the third quarter of 2003 to write down the turbines to fair value.
Sale of Sheerness
In July 2003, TransAlta completed the sale of its 50 per cent interest in the two-unit, 756-MW coal-fired Sheerness plant to TA Cogen for $630.0 million. TA Cogen is owned 50.01 per cent by TransAlta and 49.99 per cent by TransAlta Power. The transaction allowed TransAlta to realize a portion of the inherent value of the plant and provide cash for repaying debt. TransAlta received cash proceeds of $149.9 million, $315.0 million in TA Cogen units and $165.1 million in TransAlta Power units. As part of the financing and concurrent with the sale, TransAlta Power issued 17.75 million partnership units and 17.75 million warrants to the public for gross proceeds of $165.1 million, and 17.75 million partnership units to TransAlta for gross proceeds of $165.1 million. Following the issue of the units, TransAlta’s ownership interest in TransAlta Power on July 31, 2003 was approximately 26 per cent. The warrants, when exercised, are exchangeable for one TransAlt a Power unit at any time until Aug. 3, 2004. As the warrants are exercised, TransAlta will sell TransAlta Power units back to TransAlta Power for $9.30 per unit, reducing its ownership interest in TransAlta Power to its original 0.01 per cent and increasing cash proceeds by a further $165.1 million, assuming all the warrants are exercised. As a result of the exercising of warrants and the subsequent sale of TransAlta Power units back to TransAlta Power, TransAlta’s ownership interest in TransAlta Power was approximately 19 per cent at Dec. 31, 2003.
As a consequence of the sale, the obligation for TransAlta to purchase all of TransAlta Power’s interest in TA Cogen on Dec. 31, 2018 that arose on the sale of power generation assets to TA Cogen in 1998 has been eliminated; therefore, the remaining deferred gain of $119.8 million ($99.1 million) related to this sale was recognized in earnings in 2003. In addition, the management agreements between TransAlta, TransAlta Power and TA Cogen were amended to remove the mechanism for the deferral of management fees and remove the obligation for TransAlta Power and TA Cogen to pay management fees to TransAlta in the future. As consideration for the amendments, TransAlta received $1.0 million from TransAlta Power and $5.0 million from TA Cogen.
In the third quarter of 2003, TransAlta realized a gain on sale of $191.5 million ($145.8 million), which included the realization of the 1998 deferred gain of $119.8 million. During the fourth quarter, TransAlta recognized $15.2 million ($9.9 million) of gains on the sale of TransAlta Power units. TransAlta expects to recognize approximately $53 million ($34 million) of further gains on the assumption that the warrants are fully exercised and TransAlta’s effective interest in TransAlta Power is reduced to its original 0.01 per cent.
24 T R A N S A L T A C O R P O R A T I O N A R / 0 3
TA2003ARFeb28 3/3/04 11:36 AM Page 25
Plant Impairment Charge
The corporation performed an annual review of its PP&E. As a result of this review, TransAlta recorded a $5.6 million ($3.6 million) impairment charge on the Binghamton plant in the fourth quarter of 2003. The Binghamton plant sells electricity to the New York area at spot market rates when such prices exceed its marginal operating costs. Due to generation overcapacity in the Northeastern U.S. and transmission constraints, TransAlta does not expect the plant to operate on a regular basis or at prices that would justify its current book value. The impairment charge reduces the Binghamton plant’s book value to fair value.
Write-down of Investments
On an annual basis, TransAlta reviews the valuation of its long-term equity investments. As a result of this review, in the fourth quarter of 2003, the corporation recorded a $6.2 million ($4.1 million) charge to recognize an other than temporary decline in fair value of its investments. The charge is included in corporate operations, maintenance and administration (OM&A) expenses.
Sale of Seebe Land
On Dec. 31, 2003, TransAlta sold 539 acres of undeveloped land at Seebe, Alberta for $11.0 million. The corporation recognized a gain on sale of $10.5 million ($8.6 million).
2 0 0 2
Centennial Project
In February 2002, the Alberta Energy and Utilities Board (EUB) approved the previously announced Centennial project, which is a 900 MW merchant expansion at the Keephills site. The first phase of the project (Centennial 1) is now part of the arrangement with EPCOR and the two corporations will jointly proceed with the development phase of the project.
Gain on Disposal of Discontinued Operations
In April 2002, TransAlta’s Transmission operation was sold for proceeds of $820.7 million. The disposal resulted in an after-tax gain on sale of $120.0 million ($0.71 per common share).
Prior Period Regulatory Decisions
Financial results for 2001 and 2002 were affected by EUB decisions relating to other reporting periods. The impact of such regulatory decisions is recorded when the effect of such decisions is known, without adjustment to the financial statements of prior periods.
In April 2002, the EUB rendered a negative decision of $3.3 million ($2.1 million) with respect to TransAlta’s hydro bidding strategy in 2000.
Wabamun Arbitration Decision
In May 2002, the corporation received the arbitrators’ decision with respect to the Wabamun outage. As a result of the decision, the corporation was required to pay $38.9 million ($25.2 million), which was recorded as a reduction of revenue.
Ancillary Services Revenue Settlement
In July 2002, a dispute with the Balancing Pool of Alberta in respect of the allocation of hydro ancillary services deferred revenue under the power purchase arrangements (PPAs) was resolved. TransAlta repaid $49.9 million received in advance from the Balancing Pool. The settlement had no earnings impact as the corporation had not previously recognized the amount as revenue.
Refinancing of Foreign Operations
During the third quarter of 2002, TransAlta restructured the financing of certain of its foreign operations. As a result, the corporation was able to record the benefit of previously unrecognized foreign tax loss carryforward balances. This restructuring contributed $11.2 million to earnings as reduced income tax expense in the third quarter of 2002.
M A N A G E M E N T ’ S D I S C U S S I O N & A N A L Y S I S 25
TA2003ARFeb28 3/3/04 11:36 AM Page 26
Turbine Order Cancellation
In the fourth quarter of 2002, the corporation cancelled orders for four turbines and recorded a cancellation charge of $42.5 million ($27.6 million). The costs consisted solely of progress payments made to the date of the contract termination.
Decommissioning of Wabamun Plant
In the fourth quarter of 2002, TransAlta decided to implement a phased decommissioning of the Wabamun facility by removing the 139-MW unit three from service. As a result of this decision to decommission unit three and the upcoming retirements of units one and two (62 MW and 57 MW, respectively), the corporation recognized an impairment charge of $110.0 million ($71.5 million) in the fourth quarter of 2002. The corporation plans to retire units one and two in 2004 and unit four (279 MW) in 2010 when its operating license expires. The PPA for the plant expired on Dec. 31, 2003. 2004 production will be sold on the spot market.
Purchase of Vision Quest
In the fourth quarter of 2002, TransAlta purchased the remaining interest in Vision Quest. The transaction increased the corporation’s total investment in the wind power company to $68.8 million. Vision Quest operates 124 wind turbines with 119 MW of gross generating capacity in operation (82 MW net ownership interest). Vision Quest’s financial results are included in Generation’s results for segmented reporting purposes.
2 0 0 1
Sale of Discontinued Operations
On June 29, 2001, the corporation sold its Composter facility in Edmonton, Alberta for cash proceeds of $97.0 million. No gain or loss resulted from the disposal.
Pierce Power
In September 2001, TransAlta reassessed its investment in the 154-MW Pierce Power plant as a result of weak economic conditions. Revenue hedges that were no longer expected to be effective were unwound and realized, resulting in the recognition of $121.8 million in revenue, partially offset by a write-down in the carrying amount of PP&E of $66.5 million and $52.3 million recognized in anticipated future plant operating costs.
Prior Period Regulatory Decisions
In December 2001, the EUB ruled that the Wabamun unit four outage qualified for relief under the Temporary Suspension Regulation (TSR) and ordered TransAlta receive $11.0 million ($7.0 million) to compensate the corporation for obligation payments incurred in 2000 as a result of the outage.
N E W A C C O U N T I N G S TA N D A R D S
Effective Jan. 1, 2003, TransAlta early adopted the new Canadian Institute of Chartered Accountants (CICA) standard for accounting for asset retirement obligations. Under the new standard, the corporation recognizes asset retirement obligations in the period in which they are incurred if a reasonable estimate of a fair value can be determined. The associated asset retirement costs are capitalized as part of the carrying amount of the long-lived asset. The liability is accreted over the estimated time period until settlement of the obligation and the asset is depreciated over the estimated useful life of the asset. Previously, future site restoration costs for coal and hydro plants were recognized over the estimated life of the plant on a straight-line basis. Reclamation costs for mining assets were recognized on a unit-of-production basis. No provision for future site restoration for gas generation plants had been recorded as the costs of restoration were e xpected to be offset by the salvage value of the related plant. TransAlta recorded an asset retirement obligation for all generating facilities, as it is legally required to remove the facilities at the end of their useful lives and restore the plant and mine sites to their original condition. For the hydro facilities, the corporation is required to remove the generating equipment,
26 T R A N S A L T A C O R P O R A T I O N A R / 0 3
TA2003ARFeb28 3/3/04 11:36 AM Page 27
but is not legally required to remove the structures. TransAlta has recognized legal obligations arising from government legislation, written agreements between entities, case law and promises conveyed to third parties that impose reasonable expectations of performance upon the corporation under the doctrine of promissory estoppel. The asset retirement liabilities are recognized when the asset retirement obligation is incurred. Asset retirement liabilities for coal mines are incurred over time, as new areas are mined, and a portion of the liability is settled over time as areas are reclaimed prior to final pit reclamation. The effect of this change in accounting policy was recorded retroactively with restatement of prior periods. The impact of the adoption of the new standard resulted in an $87.4 million reduction of the future site restoration liability at Dec. 31, 2002 and a $14.2 million and $9.7 million recovery of future site restoration costs booked i n 2001 and 2002, respectively.
Effective Jan. 1, 2003, TransAlta elected to account for stock-based compensation in accordance with the fair value method and will expense stock-based compensation in respect of stock options granted after that date. No stock options were granted in 2003. Prior to 2003, TransAlta used the intrinsic method of accounting for its stock option plans and performance stock option plan. The impact of adopting the fair value method was immaterial to the consolidated financial statements.
The CICA established a new standard on the disposal of long-lived assets and discontinued operations. This standard was effective May 1, 2003, however TransAlta early adopted the standard on Jan.1, 2003. The standard requires that a long-lived asset to be disposed of other than by sale shall continue to be classified as held and used until it is disposed of. Certain criteria must be met before a long-lived asset can be classified as held for sale. The standard also defines discontinued operations more broadly than previously and prohibits the inclusion of future operating losses in a loss recognized upon classification of a long-lived asset as held for sale. The impact of adopting this standard was immaterial to the consolidated financial statements.
In 2003, the U.S. Financial Accounting Standards Board (FASB) Emerging Issues Task Force (EITF) reached a consensus on EITF 03-11,Reporting Realized Gains and Losses on Derivative Instruments That Are Subject to FASB Statement 133, Accounting for Derivative Instruments and Hedging Activities, and Not Held for Trading Purposes.EITF 03-11 gives guidance on whether realized gains and losses on derivative contracts not held for trading purposes should be reported on a net or gross basis and concluded such classification is a matter of judgment that depends on the relevant facts and circumstances. TransAlta concluded that real-time physical trading contracts meet the definition of derivative contracts held for delivery and therefore all gains and losses on real-time physical trading contracts are shown gross in the statements of earnings. Prior periods have been restate d.
The CICA has amended the standard on the presentation of liabilities and equity effective for years beginning on or after Nov. 1, 2004. The standard addresses the situation in which an entity has a contractual obligation of a fixed amount or an amount that fluctuates in part or in full in response to changes in a variable other than the market price of the entity’s own equity instruments, but the entity must, or can, settle the obligation by delivery of its own equity instruments (the number of which depends on the amount of the obligation). Such an obligation is a financial liability of the entity. TransAlta will early adopt this standard effective Jan. 1, 2004 and will therefore include the corporation’s preferred securities in long-term debt on the consolidated balance sheet. Preferred securities distributions will be included in interest expense on the consolidated statement of earnings. There will be no effect on earnings applicable to common shareholders as a result of adopting this standard.
Effective Jan. 1, 2004, TransAlta has elected to prospectively present employee share purchase plan loans(Note 16)as a deduction from shareholders’ equity. The impact of this new accounting treatment will be immaterial to the consolidated financial statements.
M A N A G E M E N T ’ S D I S C U S S I O N & A N A L Y S I S 27
TA2003ARFeb28 3/3/04 11:36 AM Page 28
O U T L O O K
The key factors affecting the financial results in 2004 are the megawatt capacity in place, the availability of and production from generating assets, the costs of production, the margins applicable to non-contracted production, and the volumes traded and margins achieved on Energy Marketing activities within pre-established risk limits.
The following factors will be influenced by, but not limited to, certain risks and uncertainties. For further discussion, see Risk Factors and Risk Management in this MD&A.
Production, Availability and Capacity
In 2004, production is expected to increase due to the capacity additions that occurred throughout 2003, partially offset by increased planned maintenance. Availability for 2004 is expected to be similar to 2003. Generating capacity is expected to decrease in 2004 from the Dec. 31, 2003 level due to the decom-missioning of units one and two (62 MW and 57 MW, respectively) of the Wabamun plant during the year, partially offset by the expected completion of the 68-MW Summerview Wind Farm project in the third quarter of 2004. The Genesee 3 project is expected to be commissioned in the first quarter of 2005.
Power Prices
In the Alberta and Pacific Northwest markets, electricity spot prices in 2004 are expected to be lower on average than in 2003 due to a reduction in natural gas prices from early 2003 levels, increased system wide reserve margins and increased hydro production. In Ontario, electricity spot prices are also expected to be lower in 2004 than in 2003 due to overcapacity from the recommissioning of nuclear power facilities. Spark spreads are expected to be comparable to or higher than 2003 as natural gas prices are expected to decrease more than power prices.
Exposure to volatility in electricity prices and spark spreads is substantially mitigated through firm-price, long-term electricity sales contracts with creditworthy counterparties. Exposure to volatility in gas prices is partially mitigated by the flow-through of the costs of natural gas to customers in some of these contracts and the existence of price caps in certain natural gas supply contracts. For 2004, 83 per cent of production is contracted, a significant portion of which relates to the Alberta PPAs, which are based on achieving specified availability rates. The corporation will continue to focus on maximizing revenues from these contracts.
Energy Marketing
Short-term and real-time markets are expected to be similar to the last quarter of 2003. Power trading strategies will consist of shorter-term physical and financial trades in regions where TransAlta has assets and the markets that interconnect with those regions. TransAlta’s trading activities will be mainly short-term transactions, thereby limiting credit risk and maintaining low working capital requirements.
In 2004, Energy Marketing is expected to contribute between $20 million and $40 million to operating income.
Costs of Production
Fluctuations in the cost of coal are minimized through ownership of reserves in Alberta and Central Washington. OM&A costs per megawatt hour (MWh) will fluctuate by quarter dependent on the timing and nature of maintenance activities. OM&A per MWh in 2004 is expected to be consistent with 2003.
Depreciation
Depreciation expense will increase in 2004 as the plants acquired and commissioned during 2003 will be depreciated for the full year.
28 T R A N S A L T A C O R P O R A T I O N A R / 0 3
TA2003ARFeb28 3/3/04 11:36 AM Page 29
Exposure to Fluctuations in Foreign Currencies
TransAlta’s target is to offset 100 per cent of foreign denominated assets with foreign denominated liabilities. TransAlta also has foreign currency expenses, primarily interest charges, that offset foreign currency revenues. This strategy minimizes the impact on TransAlta of the recent appreciation in the Canadian dollar against the U.S. dollar.
Net Interest Expense
Net interest expense is expected to increase in 2004 as a result of the reduction of capitalized interest due to the completion of construction of the Sarnia, Campeche and Chihuahua plants. During 2003, the corporation capitalized interest of $45.2 million as a result of the significant construction activity during the year.
Income Tax Rate
Income tax rates in 2004 are expected to be consistent with 2003 levels. Assuming a similar geographic distribution of earnings and no material changes in tax rates, the corporation anticipates an effective tax rate for 2004 of approximately 25 per cent.
Non-controlling Interests
Non-controlling interests are expected to increase in 2004 as a result of the exercise of the TransAlta Power warrants related to the Sheerness sale.
Preferred Securities Distributions
2004 preferred securities distributions are expected to be similar to 2003 levels. As previously discussed in New Accounting Standards, as of Jan. 1, 2004, preferred securities will be classified as long-term debt on the consolidated balance sheet and distributions will be included in interest expense on the consolidated statement of earnings.
Cash Requirements
In 2004, cash will be provided by a combination of cash flow from operations, utilization of various credit facilities and the sale of TransAlta Power units related to the sale of Sheerness. Cash will be required for maintenance, additions to PP&E, dividend payments and repayment of short-term and maturing senior debt. Capital expenditures are expected to be between $400 million and $425 million, of which approximately $160 million will be spent on the Summerview and Genesee 3 projects. The remainder will be spent on planned and preventative maintenance, including CE Gen. TransAlta expects to increase planned maintenance expenditures in 2004, as there will be more replacement than repair work conducted. In 2004, $183.8 million of existing debt is required to be refinanced.
Climate Change
In December 2002, the Canadian government ratified the Kyoto Protocol. The Kyoto Protocol is not expected to have an impact on TransAlta’s U.S., Mexican or Australian operations. TransAlta is not able to estimate the full impact the Protocol will have on its Canadian operations, as the Canadian government has not yet established the regulatory requirements. However, the PPAs for TransAlta’s coal-fired plants in Alberta contain ‘Change of Law’ provisions that provide an opportunity to recover compliance costs from the PPA customers.
TransAlta continues to take measured action to mitigate future climate change costs. The corporation is building a portfolio of emission offsets for its merchant plants as part of its response to climate change. As a member of the Canadian Clean Power Coalition, TransAlta, along with its peers, is exploring other means to reduce greenhouse gas emissions, including the development of clean coal technology. TransAlta continues to grow its renewable energy portfolio, reduce its emissions intensity and diversify its fuel mix.
M A N A G E M E N T ’ S D I S C U S S I O N & A N A L Y S I S 29
TA2003ARFeb28 3/3/04 11:36 AM Page 30
S E G M E N T E D B U S I N E S S R E S U LT S
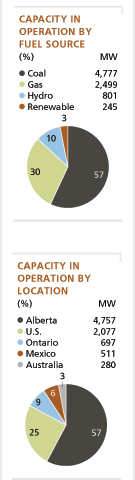
GenerationOwns and operates hydro, wind, geothermal, gas-, and coal-fired plants and related mining operations in Canada, the U.S., Mexico and Australia. At Dec. 31, 2003 Generation had 8,846 MW of gross generating capacity in operation (8,322 MW net ownership interest) and 293 MW under construction. Key performance indicators for Generation include availability, production, operating costs and natural gas and electricity market prices.
Effective Jan. 1, 2002, TransAlta’s organizational structure changed to combine the Generation and IPP business segments into one Generation segment. This was done to improve the corporation’s operational capability and reliability through the sharing of resources and best practices across all generating assets. Prior period amounts have been reclassified to reflect the combination of these assets.
TransAlta added 1,178 MW of net generating capacity in 2003 as detailed below:
| Net | |||
| Date | ownership | ||
| Project | completed | interest | |
| Purchase of 50% interest in CE Gen | January | 378 MW | |
| Commissioning of Sarnia plant (excluding previous 135 MW acquired in 2002) | March | 440 MW | |
| Commissioning of Campeche plant | May | 252 MW | |
| Completion of McBride Lake wind generation project | June | 38 MW | |
| Sale of a portion of the Sheerness plant | July | (189 MW) | |
| Commissioning of Chihuahua plant | September | 259 MW | |
| Additions to net generating capacity in 2003 | 1,178 MW | ||
In 2003, availability was 90.6 per cent compared to 88.4 per cent in 2002 and 86.9 per cent in 2001. The increase in 2003 was due to higher availability at the Centralia and Poplar Creek plants and the addition of the new gas plants.
Availability increased in 2002 compared to 2001 as a result of improved operational performance at the thermal and gas plants, partially offset by the accelerated maintenance at the Alberta thermal plants. At various times during 2002, when the market price of electricity was lower than the variable costs of production at certain plants, the corporation reduced production at these plants, and purchased electricity from the market to fulfill contractual obligations (economic dispatch). During these periods of economic dispatch, the affected plants were available to generate the electricity if required.
The results of the Generation segment were as follows:
| 2 0 0 3 | 2 0 0 21 | 2 0 0 11 | ||||||||||||||||
| Years ended Dec. 31 | Total | Per MWh | Total | Per MWh | Total | Per MWh | ||||||||||||
| Revenues | $ | 2,412.2 | $ | 45.40 | $ | 1,674.9 | $ | 35.51 | $ | 2,158.4 | $ | 48.90 | ||||||
| Fuel and purchased power | (1,067.4) | (20.09) | (664.6) | (14.09) | (1,187.1) | (26.90) | ||||||||||||
| Gross margin | 1,344.8 | 25.31 | 1,010.3 | 21.42 | 971.3 | 22.00 | ||||||||||||
| Operating expenses: | ||||||||||||||||||
| Operations, maintenance and administration | 480.0 | 9.03 | 346.7 | 7.35 | 290.6 | 6.58 | ||||||||||||
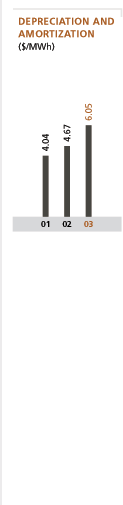
| Depreciation and amortization | 321.6 | 6.05 | 220.3 | 4.67 | 178.1 | 4.04 | ||||||||||||
| Taxes, other than income taxes | 23.1 | 0.44 | 27.3 | 0.58 | 18.7 | 0.42 | ||||||||||||
| Gain on sale of Sheerness Generating Station | (191.5) | (3.60) | – | – | – | – | ||||||||||||
| Gain on sale of TransAlta Power partnership units | (15.2) | (0.29) | – | – | – | – | ||||||||||||
| Gain on sale of Seebe land | (10.5) | (0.20) | – | – | – | – | ||||||||||||
| Asset impairment charges | 90.3 | 1.70 | 152.5 | 3.23 | 118.8 | 2.69 | ||||||||||||
| Prior period regulatory decision | – | – | 3.3 | 0.07 | (11.0) | (0.25) | ||||||||||||
| Operating income before corporate allocations | 647.0 | 12.18 | 260.2 | 5.52 | 376.1 | 8.52 | ||||||||||||
| Corporate allocations | (69.9) | (1.32) | (70.6) | (1.50) | (82.5) | (1.87) | ||||||||||||
| Operating income | $ | 577.1 | $ | 10.86 | $ | 189.6 | $ | 4.02 | $ | 293.6 | $ | 6.65 | ||||||
| 1 | TransAlta adopted the new accounting standard for asset retirement obligations on Jan.1, 2003. The standard was adopted retroactively with restatement of prior periods. SeeNote 1to the consolidated financial statements for further discussion. |
30 T R A N S A L T A C O R P O R A T I O N A R / 0 3
TA2003ARFeb28 3/3/04 11:36 AM Page 31
On an annualized basis, approximately 90 per cent of production is subject to contracted prices, including capacity payments, and approximately 10 per cent is subject to market pricing. Revenues received under contractual arrangements are not subject to short-term fluctuations in the spot price for electricity. For the year ended Dec. 31, 2003, 91 per cent of total production was subject to contracted prices (2002 – 93 per cent, 2001 – 95 per cent), with the remaining production subject to market pricing. | 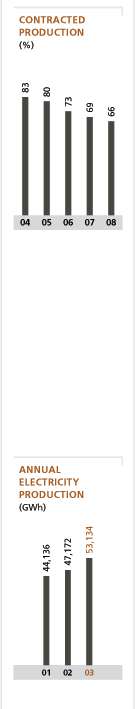 |
The existing contracts have remaining terms ranging from one to 31 years. Contracted production, as a percentage of potential production from existing assets and assets currently under construction at Dec. 31, 2003, is shown for the next five years in the chart to the right. | |
Generation’s revenues are derived from the production of electricity and steam as well as ancillary services such as system support. Revenues are subject to seasonal variations: during the summer months, warmer temperatures result in less efficient fuel conversion rates (higher heat rates) and increased hydro production from spring run-off generally results in lower electricity prices. TransAlta’s electricity and steam production revenues are generated from the following revenue streams: | |
Alberta Power Purchase Arrangementsare long-term arrangements that apply to the previously regulated Alberta generation plants. All of TransAlta’s Alberta coal-fired and hydroelectric facilities operated under PPAs during 2003. Under the terms of a PPA, a single customer has the rights to the entire production of a plant or unit for the length of the PPA. | |
PPAs established committed capacity and electrical energy generation requirements and availability targets to be achieved by each coal-fired plant, energy and ancillary services obligations for the hydroelectric plants, and the pricing formula at which capacity and power would be supplied. The corporation bears the risk or retains the benefit of volume variances (except for those arising from events considered to be force majeure, in the case of the coal-fired plants), and any change in costs required to maintain and operate the facilities. A component of the PPA capacity payment represents fixed operating, maintenance and fuel costs and is escalated annually based on certain indices published by Statistics Canada. The component of the capacity payment representing debt interest and a return on equity invested is subject to changes in the Canadian long-term bond ratio. | |
The corporation’s hydroelectric facilities are not contracted on a facility-by-facility basis, rather facilities are aggregated in a single Alberta PPA that provides for energy and ancillary services obligations based on hourly targets. These targeted amounts are met by TransAlta through physical delivery or third party purchases. | |
Long-term Contractsare similar to PPAs. TransAlta defines a long-term contract as having an original term between 10 and 25 years. Long-term contracts are typically for gas-fuelled cogeneration plants and have between one and four customers per plant. Revenues are derived from payments for capacity and/or the production of electrical energy and steam. | |
Merchantrevenue is derived from the sale of production only, with multiple customers per plant. Production is sold via: medium-term contract sales (typically three to seven years); short-term asset-backed trading; and spot or short-term (less than one year) forward markets. | |
CE Genearns revenues from 10 geothermal plants (163 MW) and three gas-fired facilities (215 MW). Eight of the geothermal plants sell their output under long-term contracts expiring between 2016 and 2035. One facility is partially contracted while the remaining facility sells its output on the spot market but has an option to sell output under a 35-year contract based on market prices. The gas-fired facilities sell their output under fixed-price contracts ranging from two to 30 years in length, with expiration dates of 2005, 2009 and 2024. All three facilities have gas supply arrangements in place for the duration of the electricity sales contracts. |
M A N A G E M E N T ’ S D I S C U S S I O N & A N A L Y S I S 31
TA2003ARFeb28 3/3/04 11:36 AM Page 32
Fuel & purchased power per MWh | ||||||||||||||||||||
Fuel & purchased power | ||||||||||||||||||||
Production (GWh) | Gross margin | Revenue per MWh | Gross margin per MWh | |||||||||||||||||
| Year ended Dec. 31, 2003 | Revenue | |||||||||||||||||||
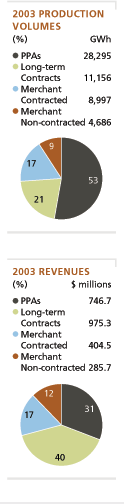
| Alberta PPAs | 28,295 | $ | 746.7 | $ | 191.7 | $ | 555.0 | $ | 26.39 | $ | 6.78 | $ | 19.61 | |||||||
| Long-term contracts | 8,538 | 666.3 | 408.3 | 258.0 | 78.04 | 47.82 | 30.22 | |||||||||||||
| Merchant | 13,683 | 690.2 | 387.0 | 303.2 | 50.44 | 28.28 | 22.16 | |||||||||||||
| CE Gen | 2,618 | 309.0 | 80.4 | 228.6 | 118.03 | 30.71 | 87.32 | |||||||||||||
| 53,134 | $ | 2,412.2 | $ | 1,067.4 | $ | 1,344.8 | $ | 45.40 | $ | 20.09 | $ | 25.31 | ||||||||
|
|
|
|
|
|
|
|
|
|
|
|
|
|
Fuel & purchased power per MWh |
|
|
| |||
|
|
|
|
|
Fuel & purchased power |
|
|
Gross margin |
|
|
|
|
|
|
| |||||
Production (GWh) |
|
|
Revenue |
|
|
|
|
| Revenue per MWh |
|
| Gross margin per MWh | ||||||||
| Year ended Dec. 31, 2002 |
|
|
|
|
|
|
|
|
| |||||||||||
| Alberta PPAs | 29,792 | $ | 761.6 | $ | 175.4 | $ | 586.2 | $ | 25.56 | $ | 5.89 | $ | 19.68 | |||||||
| Long-term contracts | 6,157 | 364.8 | 165.9 | 198.9 | 59.25 | 26.94 | 32.30 | |||||||||||||
| Merchant1 | 11,223 | 587.4 | 323.3 | 264.1 | 49.14 | 27.05 | 22.09 | |||||||||||||
| Wabamun arbitration decision | – | (38.9) | – | (38.9) | – | – | – | |||||||||||||
| 47,172 | $ | 1,674.9 | $ | 664.6 | $ | 1,010.3 | $ | 35.51 | $ | 14.09 | $ | 21.42 | ||||||||
| 1 | Revenue per MWh and fuel and purchased power per MWh includes actual production volumes and economic dispatch volumes purchased (731 GWh). Fuel & |
|
|
|
|
|
|
|
| Fuel & purchased Power |
|
|
|
|
|
|
| Fuel & purchased power per MWh |
|
|
| ||
|
|
| Production (GWh) |
|
|
|
|
|
| Gross margin | Revenue per MWh |
|
| Gross margin per MWh | |||||||
Year ended Dec. 31, 2001 |
|
|
| Revenue |
|
|
|
|
| ||||||||||||
| Alberta PPAs | 27,775 | $ | 728.3 | $ | 147.5 | $ | 580.8 | $ | 26.22 | $ | 5.31 | $ | 20.91 | ||||||||
| Long-term contracts | 5,935 | 301.4 | 150.9 | 150.5 | 50.78 | 25.43 | 25.35 | ||||||||||||||
| Merchant | 10,426 | 1,128.7 | 888.7 | 240.0 | 108.26 | 85.24 | 23.02 | ||||||||||||||
| 44,136 | $ | 2,158.4 | $ | 1,187.1 | $ | 971.3 | $ | 48.90 | $ | 26.90 | $ | 22.00 | |||||||||
 | Alberta PPA's |
In 2003, production decreased by 1,497 GWh compared to 2002 as a result of increased planned maintenance at the Alberta thermal plants and the decommissioning of unit three of the Wabamun plant in November 2002. Production increased by 2,017 GWh in 2002 compared to 2001 as a result of increased production at the Wabamun plant. From August 200 to June 2001, unit four at the Wabamun plant experienced a 10-month outage resulting from fatigue cracks within the waterwall tubing of its boiler. | |
In 2003, revenues increased by $0.83 per MWh compared to 2002 due to incentives earned from exceeding the availability targets in the PPAs. Fuel and purchased power increased by $0.89 per MWh compared to 2002 due to increased commodity prices and higher planned maintenance costs at the coal mines in 2003. The coal used for production under Alberta PPAs is from coal reserves owned by TransAlta. | |
Revenues decreased in 2002 by $0.66 per MWh compared to 2001 due to lower net incentives/ penalties realized at the Alberta PPA plants. Fuel and purchased power in 2002 increased by $0.58 per MWh compared to 2001 as a result of increased maintenance at the Alberta coal mines. | |
Long-term Contracts | |
Production increased by 2,381 GWh in 2003 compared to the same period in 2002. The increase is primarily a result of increased production from the Sarnia plant, the acquisition of Vision Quest and the commencement of commercial operations at the Campeche and Chihuahua plants. Production increased by 222 GWh in 2002 compared to 2001 primarily as a result of incremental production from the Sarnia plant. | |
Revenues increased by $18.79 per MWh in 2003 compared to 2002. The increase is due in part to $102.9 million ($12.05 per MWh) of incremental steam revenues earned from the Sarnia plant in 2003. Revenues also increased as a result of increased natural gas prices. In 2003, 71 per cent of natural gas prices flowed through to customers and were therefore recovered through revenues. Fuel and purchased power increased by $20.88 per MWh in 2003 compared to 2002 primarily due to higher heat rates at |
32 T R A N S A L T A C O R P O R A T I O N A R / 0 3
TA2003ARFeb28 3/3/04 11:36 AM Page 33
Sarnia, higher natural gas market prices and the cost of the gas used for steam production. Revenues increased by $8.47 per MWh in 2002 compared to 2001 due to the addition of steam revenues from Sarnia and increased capacity payments from the Australian plants. Fuel and purchased power increased by $1.51 per MWh as a result of increased natural gas costs. | 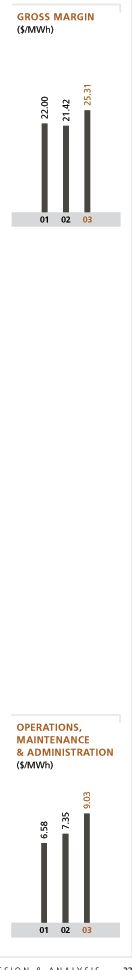 |
Gross margin per MWh decreased by $2.08 per MWh in 2003 compared to 2002. This decrease is due to higher natural gas prices and the commencement of commercial operations at the Sarnia, Campeche and Chihuahua plants. Gross margin per MWh increased by $6.95 per MWh in 2002 compared to 2001 as a result of the issues discussed above. | |
Merchant Production | |
In 2003, electricity spot prices increased over 2002 prices. The Ontario market was regulated until May 2002. Spark spreads increased in both Alberta and the Pacific Northwest markets, but decreased in Ontario. Spark spreads were reduced in 2002 compared to 2001 as increases in electricity prices were not completely correlated to increases in natural gas prices due to generation overcapacity in the markets. | |
In 2003, merchant production was 13,683 GWh, of which 8,997 GWh was contracted under short- to medium-term contracts. For 2002, merchant production was 11,223 GWh, of which 8,020 GWh was contracted. In 2001, merchant production was 10,426 GWh, of which 8,386 was contracted. At certain times during 2002, when the market price of electricity was lower than the variable costs of production at certain plants, the corporation reduced production at these plants and purchased electricity from the market to fulfill contractual obligations (economic dispatch). The increase in production in 2003 reflects increased production from the Sarnia, Centralia and Centralia Gas plants as well as the 731 GWh of economic dispatch that occurred in 2002. In 2002, merchant production increased by 797 GWh compared to 2001 as a result of increased production at Centralia offset by the economic dispatch decisions described above. | |
In 2003, merchant revenues increased by $1.30 per MWh compared to 2002 as a result of higher electricity spot prices. In 2003, fuel and purchased power increased by $1.23 per MWh as a result of increased natural gas prices. In 2002, revenues decreased by $59.12 per MWh due to lower electricity prices in the Pacific Northwest and the monetization of Pierce Power which resulted in $121.8 million of revenues in 2001. Fuel and purchased power in 2002 decreased by $58.19 per MWh as a result of lower natural gas prices in 2002 and high purchase power requirements in 2001 due to unplanned outages. | |
Gross margins increased by $0.07 per MWh in 2003 compared to 2002 due to increased power prices, substantially offset by increased natural gas costs and the strengthening of the Canadian dollar compared to the U.S. dollar. Gross margins in 2002 decreased by $0.93 per MWh compared to 2001 as a result of lower electricity prices partially offset by lower purchase power requirements. | |
CE Gen | |
From the date of acquisition on Jan. 29, 2003 to Dec. 31, 2003, CE Gen production was 2,618 GWh, revenue was $118.03 per MWh and fuel and purchased power was $30.71 per MWh. | |
Operations, Maintenance and Administration Expense | |
In 2003, OM&A increased by $133.3 million ($1.68 per MWh) compared to 2002. Excluding the impact of the CE Gen acquisition, OM&A costs increased by $68.0 million ($0.86 per MWh) due to the commencement of commercial operations at the Sarnia, Campeche and Chihuahua plants and increased planned maintenance at the Alberta thermal plants. In 2002, OM&A expenses increased by $56.1 million ($0.77 per MWh) over 2001. The increase represents the impact of the accelerated maintenance at the Alberta thermal plants and the commissioning of the Centralia Gas plant, partially offset by cost reduction initiatives. | |
OM&A costs for CE Gen were $65.3 million ($24.94 per MWh) in 2003. The relatively high cost per MWh at the geothermal generation facilities results from the requirement to process and refine the geothermal resources before they can be used for the generation of electricity. |
M A N A G E M E N T ’ S D I S C U S S I O N & A N A L Y S I S 33
TA2003ARFeb28 3/3/04 11:36 AM Page 34
 | Depreciation and Amortization |
Depreciation and amortization increased by $101.3 million ($1.38 per MWh) in 2003 compared to 2002 of which $83.8 million is the result of the CE Gen acquisition. The remaining increase is due to incremental depreciation from the commissioning of the Sarnia, Campeche and Chihuahua plants, substantially offset by the decommissioning of Wabamun unit three and the strengthening of the Canadian dollar compared to the U.S. dollar. In 2002, depreciation and amortization increased by $42.2 million ($0.63 per MWh) compared to 2001. The increase was due to the addition of the Centralia Gas plant and increased capital projects at the thermal plants. | |
Taxes Other than Income Taxes | |
Taxes other than income taxes for 2003 were consistent with 2002. The increase in taxes other than income taxes in 2002 compared to 2001 relates to higher property tax assessments by local municipalities on the majority of the corporation’s plants. | |
Other Significant Events | |
Each of the events below is discussed in greater detail in Significant Events in this MD&A. | |
In 2003, TransAlta recognized a $191.5 million pre-tax gain on sale of Sheerness, a $15.2 million pre-tax gain on the sale of TransAlta Power partnership units resulting from the sale of Sheerness, a $10.5 million pre-tax gain on sale of the Seebe land and $90.3 million of pre-tax impairment charges on the corporation’s turbine inventory and the Binghamton plant. | |
In 2002, the corporation recognized a $110.0 million pre-tax impairment charge on the Wabamun plant, a $42.5 million pre-tax charge on the cancellation of turbine orders and a $3.3 million pre-tax charge relating to an EUB prior period regulatory decision. | |
In 2001, TransAlta recognized an asset impairment charge of $66.5 million and $52.3 million of anticipated future operating costs relating to the 154-MW Pierce Power plant. The corporation also received $11.0 million pre-tax as a result of an EUB decision on the Wabamun unit four outage. | |
Energy MarketingDerives revenue and earnings from the wholesale trading of electricity and other energy-related commodities and derivatives not supported by TransAlta-owned generation assets. Energy Marketing also utilizes contracts of various durations for the forward sale of electricity and purchase of natural gas and transmission capacity to effectively manage available generating capacity and fuel and transmission needs on behalf of Generation. The results of these contracts are included in the Generation segment. Key performance indicators for Energy Marketing include trading volumes, margins and VAR. | |
TransAlta is exposed to market fluctuations in energy commodity prices related to its generation activities. The corporation closely monitors the risks associated with these commodity price changes on its future operations and where appropriate uses various physical and financial instruments to hedge the value of its assets and operations from such price risk. These contracts are designated as effective hedge positions of future cash flows or fair values of the output and production of its owned assets. Under Canadian GAAP, settlement accounting is used for hedging. Under U.S. GAAP, hedging activities are accounted in accordance with the FASB Statement 133. | |
Energy Marketing also uses commodity derivatives to manage risk, earn trading revenue and gain market information. The portfolio consists of physical and financial derivative instruments including forwards, swaps, futures, and options in various commodities. These contracts meet the definition of trading activities and have been accounted for using fair values for both Canadian and U.S. GAAP. Changes in the fair values of the portfolio are recognized in income in the period they occur. | |
The EITF has reached a consensus on EITF 03-11which gives guidance on whether realized gains and losses on derivative contracts not held for trading purposes should be reported on a net or gross basis and concluded such classification is a matter of judgment that depends on the relevant facts and |
34 T R A N S A L T A C O R P O R A T I O N A R / 0 3
TA2003ARFeb28 3/3/04 11:36 AM Page 35
circumstances. TransAlta has concluded that real-time physical trading meets the definition of derivative contracts held for delivery and therefore is reported gross in compliance with EITF 03-11.
TransAlta’s price risk management assets and liabilities represent the value of unsettled (unrealized) proprietary trading transactions accounted for on a fair value, mark-to-market basis. With the exception of transmission contracts, the fair value of all energy trading activities is generally based on quoted market prices. The fair value of financial transmission contracts is based upon statistical analysis of historical data. All transmission contracts are accounted for in accordance with EITF 02-03. The following charts show the balance sheet classifications for price risk management assets and liabilities as well as the changes in the fair value of the net assets for the period.
| Dec. 31 | 2 0 0 3 | 2 0 0 2 | ||||
| Balance Sheet | ||||||
| Price risk management assets | ||||||
| Current | $ | 77.1 | $ | 157.8 | ||
| Long-term | 71.9 | 60.7 | ||||
| Price risk management liabilities | ||||||
| Current | (71.2) | (173.8) | ||||
| Long-term | (65.1) | (50.6) | ||||
| Net price risk management assets (liabilities) outstanding | $ | 12.7 | $ | (5.9) | ||
| Net price risk management liabilities outstanding at Dec. 31, 2002 | $ | (5.9) | ||||
| New contracts entered into during the period | 13.1 | |||||
| Changes in values attributable to market price and other market changes | 0.7 | |||||
| Contracts realized, amortized or settled during the period | 4.8 | |||||
| Changes in values attributable to changes in valuation techniques and assumptions | – | |||||
| Net price risk management assets outstanding at Dec. 31, 2003 | $ | 12.7 | ||||
The net price risk management assets and liabilities increased by $18.6 million compared to Dec. 31, 2002, due to a decrease in liabilities as a result of the decision to exit from the New York TCC market as well as higher gas prices compared to 2002.
The source of the valuations of the above contracts and maturities over each of the next five calendar years and thereafter is as follows:
| 2009 and | |||||||||||||||||||||
| 2004 | 2005 | 2006 | 2007 | 2008 | thereafter | Total | |||||||||||||||
| Prices actively quoted | $ | 4.0 | $ | 3.1 | $ | 2.1 | $ | 1.5 | $ | – | $ | – | $ | 10.7 | |||||||
| Prices based on models | 2.0 | – | – | – | – | – | 2.0 | ||||||||||||||
| $ | 6.0 | $ | 3.1 | $ | 2.1 | $ | 1.5 | $ | – | $ | – | $ | 12.7 | ||||||||
In accordance with EITF 02-03, physical transmission is accounted for using accrual accounting. At Dec. 31, 2003 TransAlta recorded $1.5 million on the balance sheet as prepaid transmission related to these contracts. Physical transmission is widely used in the California and Ontario markets. The maximum term of these contracts is 12 months.
Energy Marketing’s fixed trading positions at Dec. 31, 2003 were as follows:
| Fixed price | Fixed price | ||||||
| payor | receiver | Maximum | |||||
| notional | notional | term in | |||||
| Units (000s) | amounts | amounts | months | ||||
| Electricity | MWh | 13,872.6 | 4,106.8 | 33 | |||
| Natural gas | GJ | 37,805.3 | 56,308.8 | 24 | |||
The corporation’s electrical transmission contracts trading position was 7.4 million MWh at Dec. 31, 2003 compared to 18.1 million MWh at Dec. 31, 2002. The decrease in trading position relates to TransAlta’s systematic withdrawal from the New York TCC market and increased focus on asset-backed trading.
M A N A G E M E N T ’ S D I S C U S S I O N & A N A L Y S I S 35
TA2003ARFeb28 3/3/04 11:36 AM Page 36
Gross physical and financial settled sales of proprietary trading transactions are as follows:
| Electricity (GWh) | |||||||
| Years ended Dec. 31 | 2 0 0 3 | 2 0 0 2 | 2 0 0 1 | ||||
| Physical | 55,506 | 61,089 | 18,504 | ||||
| Financial | 34,327 | 31,785 | 9,115 | ||||
| 89,833 | 92,874 | 27,619 | |||||
| Gas (million GJ) | |||||||
| Years ended Dec. 31 | 2 0 0 3 | 2 0 0 2 | 2 0 0 1 | ||||
| Physical | 100.1 | 101.5 | 30.6 | ||||
| Financial | 170.1 | 60.5 | 68.7 | ||||
| 270.2 | 162.0 | 99.3 | |||||
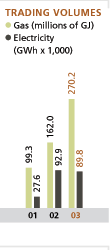 | Electricity volumes in 2003 were lower than in 2002 due to the consolidation of the Annapolis trading office. Power trading strategies consist of shorter-term physical and financial trades in regions where TransAlta has assets and the markets that interconnect with those regions. The increase in gas volumes relates to the increased use of heat rate contracts, which involve a gas component, to manage power price risk. Gas trading, independent of power trading strategies, continues to be a small part of the risk taken in the marketplace. TransAlta’s trading activities are mainly short-term transactions, thereby limiting credit risk and maintaining low working capital requirements. |
Electricity trading volumes increased in 2002 over 2001 volumes as Energy Marketing focused on short-term transactions due to low liquidity in the medium- to long-term markets. Gas trading volumes increased due to the use of heat rate contracts. | |
Based on the above positions, trading activities and changes in market prices, Energy Marketing’s results were as follows: |
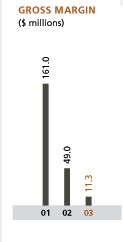 | Years ended Dec. 31 | 2 0 0 3 | 2 0 0 2 | 2 0 0 1 | ||||||
| Revenues | $ | 96.4 | $ | 140.0 | $ | 401.1 | ||||
| Trading purchases | (85.1) | (91.0) | (240.1) | |||||||
| Gross margin | 11.3 | 49.0 | 161.0 | |||||||
| Operations, maintenance and administration | 14.9 | 15.1 | 36.2 | |||||||
| Depreciation and amortization | 3.1 | 2.5 | 11.0 | |||||||
| Taxes other than income taxes | – | 0.1 | – | |||||||
| Operating income (loss) before corporate allocations | (6.7) | 31.3 | 113.8 | |||||||
| Corporate allocations | (8.8) | (8.3) | (6.6) | |||||||
| Operating income (loss) | $ | (15.5) | $ | 23.0 | $ | 107.2 | ||||
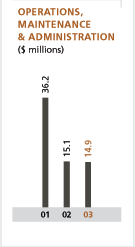 | Gross margins decreased by $37.7 million in 2003 compared to 2002 mainly due to a $33.3 million clerical error made on TCCs that occurred in the second quarter of 2003. During the third quarter of 2003, Energy Marketing re-evaluated trading strategies and consolidated the Annapolis trading office in Calgary. The closure of the Annapolis office and changing market opportunities in Alberta resulted in fewer volumes being traded and settled in the remainder of 2003. |
Gross margins decreased by $112.0 million in 2002 compared to 2001 due to significantly lower market prices and margins, particularly in the Pacific Northwest. The 2001 Pacific Northwest prices were influenced by the process of deregulation in California. | |
OM&A costs for 2003 included $2.6 million of severance and exit costs incurred as a result of the closure of the Annapolis office. OM&A expenses decreased by $21.1 million in 2002 compared to 2001 due to lower annual incentive compensation resulting from lower annual net revenue and operating income, as well as one-time costs associated with the acquisition of the remainder of Merchant Energy Group of the Americas, Inc. (MEGA) in June 2001. |
36 T R A N S A L T A C O R P O R A T I O N A R / 0 3
TA2003ARFeb28 3/3/04 11:36 AM Page 37
Depreciation and amortization for 2003 was consistent with 2002. Depreciation and amortization decreased by $8.5 million in 2002 compared to 2001. The decrease was due to $29.3 million of goodwill arising from the MEGA acquisition, previously recorded as acquired intangibles, which is no longer being amortized.
VAR is a measure to manage earnings exposure for Energy Marketing activities. The average daily VAR in fiscal 2003 was approximately $3.5 million compared to $2.6 million in 2002. See additional discussion under commodity price risk in Risk Factors and Risk Management.
TransAlta has a US$53.0 million receivable relating to energy sales in California between Jan. 1, 2000 and June 20, 2001. On Dec. 12, 2002, a U.S. Federal Energy Regulatory Commission (FERC) Administrative Law Judge issued proposed findings of fact that recommended TransAlta refund US$9.2 million for electricity sales made to the California Independent System Operator, which would reduce the receivable to US$43.8 million. In March 2003, FERC proposed further adjustments in respect of power and gas prices, which could result in further adjustments to the amount to be received by TransAlta. As a result, TransAlta has a provision of US$28.8 million to account for potential refund liabilities and will maintain this provision until a final ruling is made by FERC with respect to these issues. Ultimate collection of the net receivable is expected.
In June 2003, FERC issued two show cause orders, the Partnership Gaming Order and the Gaming Practices Order, in which TransAlta’s U.S. subsidiaries were named. These orders required TransAlta to justify certain trading activities in California between Jan. 1, 2000 and June 20, 2001. In response to FERC’s show cause orders, TransAlta confirmed that it did not engage in gaming behavior. Based on the information provided by TransAlta, FERC Trial Staff filed a Motion to Dismiss with respect to TransAlta in the two show cause proceedings. On Jan. 22, 2004, FERC granted the Trial Staff’s motion to dismiss TransAlta from both the Partnership Gaming Order and the Gaming Practices Order. FERC found that TransAlta did not engage in prohibited gaming practices.
As the result of another June 2003 FERC order, the FERC Office of Market Oversight and Investigations instituted an investigation into bidding behaviour in the California markets between May 1, 2000 and Oct. 2, 2000 and made information requests of TransAlta’s U.S. energy marketing subsidiaries. TransAlta filed its response to this investigation on July 24, 2003. TransAlta’s investigations revealed no significant bidding behaviours outlined in the FERC request for information. On Jan. 29, 2004, TransAlta received official notice from the Commodity Futures Trading Commission (CFTC) that it was closing its investigation at that time. Such closure is not a conclusive finding that TransAlta did not commit any violations and the CFTC reserved its right to re-open the investigation; however, TransAlta believes this is unlikely.
N E T I N T E R E S T E X P E N S E , O T H E R E X P E N S E A N D F O R E I G N E X C H A N G E
| Years ended Dec. 31 | 2 0 0 3 | 2 0 0 2 | 2 0 0 1 | ||||||
| Gross interest expense | $ | 234.1 | $ | 172.9 | $ | 170.3 | |||
| Interest income | (5.0) | (8.7) | (24.2) | ||||||
| Interest allocated to discontinued operations | – | (2.4) | (9.7) | ||||||
| Capitalized interest | (45.2) | (79.1) | (48.3) | ||||||
| Net interest expense | 183.9 | 82.7 | 88.1 | ||||||
| Other expense (income) | 3.2 | (0.1) | (1.5) | ||||||
| Foreign exchange loss (gain) | 4.7 | (1.2) | (0.8) | ||||||
| $ | 191.8 | $ | 81.4 | $ | 85.8 | ||||
Net interest expense increased by $101.2 million in 2003 compared to 2002. The increase is primarily due to lower capitalized interest, higher debt levels, higher effective interest rates and approximately $5 million a month of interest expense related to the CE Gen non-recourse debt.
Net interest expense decreased by $5.4 million in 2002 compared to 2001 as a result of an overall decline in short-term interest rates and higher capitalized interest, partially offset by a higher proportion of debt subject to long-term interest rates.
M A N A G E M E N T ’ S D I S C U S S I O N & A N A L Y S I S 37
TA2003ARFeb28 3/3/04 11:36 AM Page 38
The decrease in capitalized interest in 2003 compared to 2002 is a result of the commissioning of the Sarnia, Centralia Gas, Campeche and Chihuahua plants, partially offset by the Genesee 3 project.
P R E F E R R E D S E C U R I T I E S D I S T R I B U T I O N S |
Years ended Dec. 31 2 0 0 3 2 0 0 2 2 0 0 1 |
Preferred securities distribution, net of tax $ 23.0 $ 20.9 $ 13.1 |
Preferred securities distributions, net of tax, in 2003 are consistent with 2002. The increase in 2002 compared to 2001, reflects the issuance of $175.0 million of 7.75 per cent preferred securities in November 2001.
| I N C O M E TA X E S | |||||||||
| Years ended Dec. 31 | 2 0 0 3 | 2 0 0 2 | 2 0 0 1 | ||||||
| Income tax expense | $ | 78.4 | $ | 23.4 | $ | 97.6 | |||
| Effective tax rate (%) | 21.2 | 17.8 | 31.0 | ||||||
Income tax expense increased by $55.0 million in 2003 compared to 2002 due to increased earnings. Income tax expense decreased by $74.2 million in 2002 compared to 2001 due to lower earnings and the refinancing of foreign operations, discussed earlier, that allowed previously unrecognized foreign loss carryforward balances to be recognized. The 2003 effective income tax rate, expressed as a percentage of earnings from continuing operations before income taxes and non-controlling interests, reflects the impact of the taxation of the sale of the Sheerness plant, the recognition of the deferred gain and the impairment charges. The effective tax rate in 2002 reflects the benefit of the refinancing of foreign operations discussed above.
N O N - C O N T R O L L I N G I N T E R E S T S |
Years ended Dec. 31 2 0 0 3 2 0 0 2 2 0 0 1 |
Non-controlling interests $ 34.2 $ 20.1 $ 20.6 |
Earnings attributable to non-controlling interests in 2003 increased by $14.1 million compared to 2002 due to the sale of Sheerness to TA Cogen and the 25 per cent interest in CE Gen’s Saranac facility. Earnings attributable to non-controlling interests in 2002 were consistent with 2001.
D I S C O N T I N U E D O P E R AT I O N S
Transmission
As discussed in Significant Events, TransAlta sold its Transmission operation in April 2002 for proceeds of $820.7 million. The disposal resulted in an after-tax gain on sale of $120.0 million ($0.71 per common share). Net earnings from Transmission operations were $12.8 million in 2002 and $44.4 million in 2001.
Edmonton Composter
As discussed in Significant Events, TransAlta sold its Edmonton Composter facility for proceeds of $97.0 million, which approximated its book value. Net earnings from Composter operations were $0.7 million in 2001.
38 T R A N S A L T A C O R P O R A T I O N A R / 0 3
TA2003ARFeb28 3/3/04 11:36 AM Page 39
C O N S O L I D AT E D B A L A N C E S H E E T S
The following chart outlines significant changes in the consolidated balance sheets between
| Dec. 31, 2003 and Dec. 31, 2002: | |||||
| Increase/ | |||||
| (Decrease) | Explanation | ||||
| Cash and cash equivalents | $ | 11.7 | Refer to Consolidated Statements of Cash Flows. | ||
| Investments | (27.2) | Sale of the Goldfields gas pipeline and write down to | |||
| recognize a loss in value other than a temporary decline. | |||||
| Long-term receivables | 80.2 | Increase due to the acquisition of CE Gen. | |||
| Property, plant and equipment, | 309.5 | Acquisition of CE Gen and Genesee 3, as well as | |||
| net of accumulated depreciation | capital expenditures and construction activity during | ||||
| the period, offset by depreciation, the turbine write- | |||||
| down and the effect of the strengthening Canadian | |||||
| dollar relative to the U.S. dollar. | |||||
| Goodwill | 93.1 | Increase due to the acquisition of CE Gen. | |||
| Intangible assets | 459.0 | Increase due to the acquisition of CE Gen, partially | |||
| offset by amortization. | |||||
| Future income tax assets | 43.8 | Increase in unused tax losses that are expected to | |||
| (including current portion) | be recovered in future years. | ||||
| Other assets | 103.7 | Increase in mark-to-market valuation of cross-currency | |||
| swaps. | |||||
| Short-term debt | (170.2) | Repayment of short-term debt. | |||
| Accounts payable and accrued liabilities | 75.0 | Increase due to the acquisition of CE Gen. | |||
| Long-term debt | (124.0) | Repayments and a reduction of approximately | |||
| (including current portion) | $ | 108 million due to the effect of the strengthening | |||
| Canadian dollar relative to the U.S. dollar on | |||||
| U.S. dollar debt, partially offset by new borrowings | |||||
| during the year. | |||||
| Non-recourse long-term debt | 579.5 | Debt acquired on the acquisition of CE Gen, net of | |||
| (including current portion) | principal repayments. | ||||
| Deferred credits and other | (93.5) | Primarily due to the recognition of the deferred gain | |||
| long-term liabilities | as a result of the Sheerness transaction and an increase | ||||
| in mark-to-market valuation of cross-currency swaps of | |||||
| $ | 21.0 million. | ||||
| Future income tax liabilities | 272.1 | Increase primarily due to the acquisition of CE Gen. The | |||
| (including current portion) | remaining is the result of Canadian and U.S. operations. | ||||
| Non-controlling interests | 214.9 | Increase in non-controlling interest due to the | |||
| Sheerness transaction and the acquisition of CE Gen, | |||||
| partially offset by cash distributions. | |||||
| Shareholders’ equity | 368.5 | Net earnings, common share offering, and re-investment | |||
| of dividends, partially offset by dividends paid. | |||||
M A N A G E M E N T ’ S D I S C U S S I O N & A N A L Y S I S 39
TA2003ARFeb28 3/3/04 11:36 AM Page 40
L I Q U I D I T Y A N D C A P I TA L R E S O U R C E S
TransAlta Corporation raises substantially all external capital to be invested in the various business units and affiliated or subsidiary companies as required. This strategy allows TransAlta to gain access to sufficient capital at the lowest overall cost to finance growth opportunities and provide financial flexibility. Historically, external financing has been obtained from borrowings under credit facilities, proceeds from the disposal of non-core assets and the issuance of debt, preferred securities and equity. Internally, capital is also raised through operations. A summary of cash flows is as follows:
| Years ended Dec. 31 | 2 0 0 3 | 2 0 0 2 | 2 0 0 1 | ||||||
| Cash and cash equivalents, beginning of year | $ | 143.3 | $ | 62.0 | $ | 53.8 | |||
| Cash flow from (used in): | |||||||||
| Operating activities | 756.5 | 437.7 | 715.6 | ||||||
| Investing activities | (535.1) | (36.2) | (1,076.9) | ||||||
| Financing activities | (201.0) | (320.9) | 368.7 | ||||||
| Translation of foreign currency cash | (8.7) | 0.7 | 0.8 | ||||||
| Cash and cash equivalents, end of year | $ | 155.0 | $ | 143.3 | $ | 62.0 | |||
In October 2003, the corporation renewed its Cdn$1.0 billion medium-term note shelf registration. The corporation also increased its committed bank credit facility to $1.5 billion from $1.2 billion in July 2003 in order to increase its liquidity. The corporation maintained approximately $340 million of uncommitted credit facilities. At Dec. 31, 2003, the corporation had approximately $1 billion of credit available from its committed and uncommitted credit facilities.
In November 2003, TransAlta issued US$300.0 million of 10-year senior notes under a US$1.0 billion shelf registration statement filed May 14, 2002. The notes bear interest at 5.75 per cent per annum. Proceeds from the issuance were primarily used to refinance bonds that matured in 2003. In June 2002, the corporation issued US$300.0 million of 10-year senior notes under the same shelf registration statement. The notes bear interest at 6.75 per cent and proceeds were used to repay short-term debt and U.S. denominated commercial paper. TransAlta intends to renew this registration in 2004 for a further two-year term for US$1.0 billion.
Operating Activities
Operating activities after changes in non-cash working capital provided cash of $756.5 million in 2003 compared to $437.7 million in 2002 and $715.6 million in 2001. The increase in 2003 is primarily due to higher earnings and the collection of commodity tax receivables in the U.S. and Mexico (US$79.0 million) in 2003, the settlement of a disputed ancillary services revenue issue with the Balancing Pool of Alberta ($49.9 million) in 2002, the timing of cash tax obligations ($55.6 million) in the third quarter of 2002, and the final instalment of 2001 income taxes paid in the first quarter of 2002 ($109.0 million).
Cash flow from operating activities was $277.9 million lower in 2002 compared to 2001. The decrease was due to the impact of the Wabamun arbitration and increased working capital requirements.
Investing Activities
Investing activities used cash of $535.1 million in 2003 compared to $36.2 million in 2002 and $1,076.9 million in 2001.
In 2003, additions to capital assets totalled $555.7 million and consisted primarily of the completion of the two Mexican plants and the McBride projects and the continuing construction of the Genesee 3 project. Acquisitions consisted of the purchase of a 50 per cent interest in CE Gen for $323.4 million (net of cash acquired of $43.2 million).
In 2002, additions to capital assets totalled $945.8 million and consisted primarily of the completion of the Centralia Gas plant and continued construction of the Sarnia, Campeche and Chihuahua plants. Acquisitions of $40.1 million consisted of the purchase of the remaining interests in Vision Quest and Southern Cross Energy.
40 T R A N S A L T A C O R P O R A T I O N A R / 0 3
TA2003ARFeb28 3/3/04 11:36 AM Page 41
In 2001, capital expenditures of $1,246.5 million related primarily to the continued construction activities at the Centralia Gas, Sarnia, Campeche and Chihuahua plants.
Cash provided by disposals and the sale of capital assets in 2003 was $285.5 million, comprised of $149.9 million received from the sale of the Sheerness plant, $65.8 million of proceeds from the sale of the head office building, $37.2 million of proceeds from the sale of TransAlta Power partnership units, $21.6 million of proceeds from the sale of the Goldfields pipeline and $11.0 million of proceeds from the sale of the Seebe land.
In 2003, TransAlta recovered US$32.0 million in restricted cash related to the CE Gen acquisition.
Cash provided by disposals and the sale of capital assets in 2002 totalled $820.3 million, comprised primarily of proceeds from the sale of the discontinued Transmission operation in April 2002. Proceeds were used to repay short- and long-term debt.
Cash provided by disposals and the sale of capital assets in 2001 was $236.6 million, comprised primarily of proceeds of $97.0 million from the sale of the Edmonton Composter, $60.3 million from the sale of the Mildred Lake plant, $44.1 million from the sale of the Fort Nelson plant and $35.0 million from the sale of half of the corporation’s interest in the Fort Saskatchewan plant.
Financing Activities
Financing activities used cash of $201.0 million compared to $320.9 million in 2002 and provided cash of $368.7 million in 2001.
In 2003, net proceeds on the issuance of common shares ($265.0 million) were more than offset by net long-term debt repayment ($56.5 million), net repayment of short-term debt ($170.2 million), cash dividends on common shares ($158.3 million), distributions on preferred securities ($35.5 million) and non-controlling interest distributions ($38.9 million), some of which were funded from cash flow from operating activities.
In 2002, the issuance of US$300.0 million in senior notes was more than offset by the net repayment of short-term debt ($247.1 million), repayment of long-term debt ($454.5 million), cash dividends ($115.5 million), and the net redemption of common shares ($48.1 million).
In 2001, cash used for the redemption of preferred securities of a subsidiary ($122.1 million), cash dividends ($149.6 million), net redemption of common shares ($30.3 million), distributions to non-controlling interests ($26.3 million) and net distributions on preferred securities ($23.4 million) were offset by an increase in short-term debt ($61.9 million), a net increase in long-term debt ($497.2 million) and the net proceeds from the issuance of preferred securities ($169.4 million). The net addition to long-term debt and the proceeds from the preferred securities issuance were used to finance the significant capital expenditures during the year.
In 2003, TransAlta repaid the following senior secured debt of TransAlta Utilities Corporation:
| Maturity | Rate | Amount | |||||
| Debentures | 2003 | 7.25% | $ | 150.0 | |||
| Debentures | 2003 | 8.35% | $ | 200.0 | |||
In 2003, under the terms of the Normal Course Issuer Bid, the corporation did not purchase any common shares for cancellation (2002 – 2.0 million; 2001 – 2.0 million).
TransAlta’s dividends per common share were $1.00 in 2003, 2002 and 2001.
M A N A G E M E N T ’ S D I S C U S S I O N & A N A L Y S I S 41
TA2003ARFeb28 3/3/04 11:36 AM Page 42
Financing Arrangements
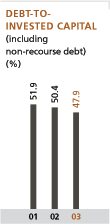 | TransAlta Corporation raises capital in the Canadian and U.S. markets. TransAlta has the following financing arrangements in place: |
| US$1.0 billion shelf registration program, with US$300.0 million issued in November 2003 bearing interest at 5.75 per cent and US$300.0 million senior notes issued in June 2002 bearing 6.75 per cent interest. This program expires in May 2004, and is expected to be renewed; | |
| $1.0 billion medium-term note program; no amount has been issued since its renewal in October 2003. This program expires in October 2005, and is expected to be renewed; | |
| $74.8 million of commercial paper issued at Dec. 31, 2003; | |
| $1.5 billion committed syndicated bank credit facility, with $247.0 million utilized at Dec. 31, 2003. $600.0 million of the facility expires in July 2004, and the remainder expires in July 2006. The facility is expected to be renewed; and | |
| $343.2 million of additional bank credit facilities, with $323.1 million utilized at Dec. 31, 2002. All of these facilities are non-committed. | |
In addition to the above, the corporation has US$133.6 million of project financing for the Campeche project, which is expected to become non-recourse in the first quarter of 2004. It is the corporation’s expectation that future financing requirements, including financing requirements in foreign jurisdictions, will be met primarily through raising capital at the TransAlta Corporation level. | |
At Dec. 31, 2003, TransAlta had a working capital ratio of 0.94 per cent compared to 0.70 per cent at Dec. 31, 2002. The corporation does not foresee any inability to meet obligations as they come due. | |
In 2004, cash will be provided by a combination of cash flow from operations, utilization of various credit facilities and the sale of TransAlta Power units related to the sale of Sheerness. Cash requirements include maintenance, additions to capital assets, dividend payments and repayment of short-term and maturing senior debt. Cash provided by operations in 2003 was $756.5 million and at Dec. 31, 2003, there were approximately $1 billion of funds available under credit facilities. In 2004, capital expenditures are expected to be $400 million to $425 million and $183.8 million of existing debt is required to be refinanced. Proceeds of approximately $125 million are expected in 2004 from the sale of the remaining TransAlta Power units. | |
Long-term funding is provided through the maintenance of investment grade credit ratings and a carefully managed capital structure, which together create a strong balance sheet and ready access to capital markets at competitive rates. The corporation’s objective is to manage the maturities of the various securities on issue such that no more than 15 per cent of the total outstanding securities mature in any one year. The corporation’s target is to maintain a capital structure and coverage ratios consistent with investment grade credit ratings. The corporation’s capital structure consisted of the following components at Dec. 31, 2003, 2002 and 2001: |
| 2 0 0 3 | 2 0 0 2 | 2 0 0 1 | |||||||||||||
| Debt, net of cash and interest-earning investments | $ | 3,126.9 | 48% | $ | 2,853.3 | 50% | $ | 2,986.3 | 52% | ||||||
| Preferred securities | 450.8 | 7% | 451.7 | 8% | 452.6 | 8% | |||||||||
| Other non-controlling interests | 477.9 | 7% | 263.0 | 5% | 281.0 | 5% | |||||||||
| Common shareholders’ equity | 2,460.6 | 38% | 2,092.1 | 37% | 2,032.5 | 35% | |||||||||
| $ | 6,516.2 | 100% | $ | 5,660.1 | 100% | $ | 5,752.4 | 100% | |||||||
At Dec. 31, 2003, TransAlta’s total debt (including non-recourse debt) to invested capital ratio was 47.9 per cent (42.8 per cent excluding non-recourse debt). This represents an improvement from the Dec. 31, 2002 ratio of 50.4 per cent and the Dec. 31, 2001 ratio of 51.9 per cent.
42 T R A N S A L T A C O R P O R A T I O N A R / 0 3
TA2003ARFeb28 3/3/04 11:36 AM Page 43
Additional key financial ratios were as follows: | 2 0 0 3 | 2 0 0 2 | 2 0 0 1 |
Cash flow to interest1 | 3.3x 18% | 3.7x 17% | 5.1x 23% |
Cash flow to total debt2 | 18% | 17% | 23% |
| 1 | Cash flow from operations before changes in working capital plus net interest expense divided by gross interest expense less interest income. |
| 2 | Cash flow from operations before changes in working capital divided by two-year average of total debt. |
Contractual repayments of long-term debt, commitments under operating leases, turbine purchase commitments, fixed price purchase contracts and commitments under mining agreements are as follows:
| 2 0 0 9 and | ||||||||||||||||||||||
| 2 0 0 4 | 2 0 0 5 | 2 0 0 6 | 2 0 0 7 | 2 0 0 8 | thereafter | Total | ||||||||||||||||
| Long-term debt1 | $ | 183.8 | $ | 294.2 | $ | 415.7 | $ | 66.3 | $ | 173.9 | $ | 2,028.2 | $ | 3,162.1 | ||||||||
| Operating leases | 13.0 | 12.1 | 11.4 | 10.0 | 9.0 | 98.0 | 153.5 | |||||||||||||||
| Turbine purchase commitments | 21.6 | 18.9 | – | – | – | – | 40.5 | |||||||||||||||
| Fixed price contracts | 55.8 | 57.9 | 58.0 | 62.4 | 64.2 | 32.8 | 331.1 | |||||||||||||||
| Mining agreements | 32.3 | 35.1 | 33.9 | 34.0 | 34.0 | 337.9 | 507.2 | |||||||||||||||
| Total contractual cash obligations | $ | 306.5 | $ | 418.2 | $ | 519.0 | $ | 172.7 | $ | 281.1 | $ | 2,496.9 | $ | 4,194.4 | ||||||||
| 1 Includes capital lease obligations. | ||||||||||||||||||||||
In addition, the corporation has entered into a number of long-term power sales, gas purchase and transportation agreements in the normal course of operations as hedges of its operations.
In the normal course of operations, TransAlta and certain of its subsidiaries enter into agreements to provide financial or performance assurances to third parties. This includes guarantees, letters of credit and surety bonds which are entered into to support or enhance creditworthiness in order to facilitate the extension of sufficient credit for Energy Marketing trading activities, treasury hedging, Generation construction projects, equipment purchases and mine reclamation obligations.
At Dec. 31, 2003, the corporation had letters of credit outstanding aggregating $518.1 million, comprised of $198.5 million, US$187.8 million, 222.8 million Danish kroner and 172.3 million Mexican pesos. The letters of credit were issued to counterparties that have credit exposure to certain subsidiaries. If a subsidiary does not pay amounts due under the covered contract, the counterparty may present its claim for payment to the financial institution, which in turn will request payment from the corporation. Any amounts owed by the corporation’s subsidiaries are reflected in the consolidated balance sheet. All letters of credit expire in 2004.
The corporation had a surety bond in the amount of US$156.7 million in support of future asset retirement obligations at the Centralia mine outstanding at Dec. 31, 2003. The surety bond is renewed annually and expires in October 2004. A provision for retirement obligations is included in deferred credits and other long-term liabilities(Note 12).
TransAlta has guaranteed certain payments for its subsidiaries. These guarantees are provided to counterparties in order to facilitate physical and financial transactions. To the extent liabilities exist for trading activities, they are included in the consolidated balance sheet. To the extent liabilities exist for hedging activities, they are disclosed inNote 20.The limit under these guarantees at Dec. 31, 2003 for trading and hedging activities was $1.8 billion. In addition, the corporation has a number of unlimited guarantees. The exposure at Dec. 31, 2003 under both limited and unlimited guarantees was approximately $381.3 million. Including contracts that were not guaranteed but facilitate hedging and trading activities, TransAlta’s maximum collateral requirements would have been $409.6 million at Dec. 31, 2003. Collateral available was approximately $1 b illion. See discussion under liquidity risk in Risk Factors and Risk Management.
M A N A G E M E N T ’ S D I S C U S S I O N & A N A L Y S I S 43
TA2003ARFeb28 3/3/04 11:36 AM Page 44
TransAlta has also provided guarantees to counterparties for obligations of various subsidiaries for performance and payment of obligations. In the event of the subsidiaries’ inability to meet the obligations, TransAlta would be obligated to make such payments. To the extent obligations exist under these guarantees at Dec. 31, 2003, they are included in accounts payable and accrued liabilities. The limit under these guarantees at Dec. 31, 2003 was $828.6 million.
During construction and until certain conditions are met, the corporation has provided a guarantee to the lenders for the completion of the Campeche plant. The Campeche plant was completed in May 2003, and it is expected that the plant will be pledged as collateral in early 2004. At that time, the US$133.6 million of debt related to the plant will become non-recourse to the corporation.
At Dec. 31, 2003, the credit ratings for the corporation’s various securities and TransAlta Power’s units as determined by Standard & Poor’s (S&P), the Dominion Bond Rating Service (DBRS) and Moody’s Rating Services were as follows:
| Credit Ratings | S&P | DBRS | Moody’s |
| TransAlta Corporation | |||
| Issuer rating | BBB- | Baa 2 | |
| Commercial paper | R-2 (high) | ||
| Senior unsecured debentures | BBB- | BBB | Baa 2 |
| Preferred securities / stock | Pfd-3y | ||
| TransAlta Utilities Corporation | |||
| Issuer rating | BBB- | ||
| Secured debt | BBB | A (low) | |
| TransAlta Power, L.P.1 | SR-1 | STA-2 (middle) | |
| 1 Non-controlling partner in TransAlta’s subsidiary, TA Cogen | |||
In November 2003, DBRS assigned TransAlta Corporation ratings of R-2 (high), BBB and Pfd-3y to the corporation’s commercial paper, senior unsecured debentures and preferred shares, respectively; all with a negative trend. In August 2003, Moody’s assigned TransAlta a credit rating of Baa 2 with a negative outlook and removed the corporation from credit watch. In May 2003, S&P assigned TransAlta a credit rating of BBB- (stable) and removed the corporation from credit watch. These ratings, which are lower than previously assigned, did not have a significant impact on TransAlta’s operations or ability to raise capital.
At Feb. 27, 2004, TransAlta had 191.4 million common shares outstanding in the amount of $1,567.6 million. At the same date, there were 3.1 million options to purchase common shares outstanding with 1.8 million exercisable.
44 T R A N S A L T A C O R P O R A T I O N A R / 0 3
TA2003ARFeb28 3/3/04 11:36 AM Page 45
O F F - B A L A N C E S H E E T A R R A N G E M E N T S
Disclosure is required of all off-balance sheet arrangements such as transactions, agreements or contractual arrangements with unconsolidated entities, structured finance entities, special purpose entities or variable interest entities that are reasonably likely to materially affect liquidity or the availability of, or requirements for, capital resources. The corporation has no such off-balance sheet arrangements.
Under Canadian GAAP, most derivatives used in hedging relationships are not recorded on the balance sheet(Note 1(P)).Gains or losses during the term of the hedge are deferred and recognized in earnings in the same period and financial statement caption as the hedged exposure (settlement accounting). The fair values of these derivatives are disclosed inNote 20to the consolidated financial statements. The corporation also enters into long-term electricity purchase and sale, gas purchase and transportation agreements in the normal course of operations. These contracts are not recorded on the balance sheet under Canadian GAAP. Under U.S. GAAP, some of these contracts meet the definition of a derivative, and would require mark-to-market accounting, but are eligible for the normal purchase and sale exemption under FASB Statement 133. This exemption is available as electricity cannot be stored in significant quantities and due to the requirement for electricity generators to maintain sufficient capacity to meet customers’ demands, and is also available for physically settled commodity contracts if certain criteria are met.
Information regarding guarantees has been disclosed in the Liquidity and Capital Resources section.
R E L AT E D PA R T Y T R A N S A C T I O N S
As previously discussed in Significant Events, TransAlta sold its 50 per cent interest in the Sheerness plant to TA Cogen in July 2003. The exchange amount was determined based on an estimate of the future net cash flows of the plant and approved by the independent directors of TA Cogen. There are no ongoing contractual commitments or arrangements resulting from this sale apart from the provision of operational and management services under normal commercial terms.
The obligation to purchase all of TransAlta Power’s interest in TA Cogen on Dec. 31, 2018 (resulting from the 1998 sale of an interest in three Ontario cogeneration plants held by TA Cogen to TransAlta Power) was removed as part of the Sheerness transaction. Accordingly, the unamortized portion of the 1998 deferred gain was recognized in 2003.
In February 2003, TransAlta entered into an agreement with CE Gen whereby TransAlta buys available power from certain CE Gen subsidiaries under normal commercial terms. In addition, CE Gen has entered into contracts with related parties to provide administrative and maintenance services.
For the period from November 2002 to November 2007, TA Cogen has a transportation swap transaction with a wholly owned subsidiary of TransAlta Corporation. The business purpose of the transportation swap was to provide TA Cogen with the delivery of fixed-price gas without being exposed to escalating costs of pipeline transportation for two of its plants over the period of the swap. This stabilizes cash distributions in TA Cogen and thereby preserves the value of the limited partnership as a financing vehicle of TransAlta Corporation. The notional gas volume in the transaction was the total delivered fuel for both facilities. Exchange amounts are based on the market value of the contract. TransAlta entered into an offsetting contract with an external third party.
In 2001, the corporation sold its 60 per cent interest in its Fort Saskatchewan plant to TA Cogen. Total cash consideration to the corporation was $35.0 million in respect of the 30 per cent interest effectively sold to the minority interest in TA Cogen. The corporation recorded a pre-tax gain of $6.2 million. The business purpose of the arrangement was to realize a portion of the inherent value of the plant and provide cash for future growth initiatives while retaining control and operation of the asset. The exchange amount was determined based on an estimate of the future net cash flows of the plant and approved by the independent directors of TA Cogen. There are no ongoing contractual commitments or arrangements resulting from this sale apart from the provision of operational and management services under normal commercial terms.
M A N A G E M E N T ’ S D I S C U S S I O N & A N A L Y S I S 45
TA2003ARFeb28 3/3/04 11:36 AM Page 46
In 2000, TA Cogen entered into a fixed-for-floating gas swap transaction with TransAlta Energy, for a 61-month period starting Dec. 1, 2000. The business purpose of the swap was to provide TA Cogen with fixed-price gas for two of its plants over the period of the swap to stabilize cash distributions. The floating prices associated with the plants’ long-term fuel supply agreements were transferred to TransAlta Energy’s account. The notional gas volume in the transaction was the total delivered fuel for both facilities. As consideration and in negotiation, TA Cogen transferred the right to incremental revenues associated with curtailed electrical production and subsequent higher revenue gas sales to TransAlta Energy. Exchange amounts were based on the fair value of the contract and approved by the independent directors of TA Cogen.
E M P L O Y E E S H A R E O W N E R S H I P
TransAlta employs a variety of stock-based compensation plans to align employee and corporate objectives. In 2001, the corporation expanded enrolment in the corporation’s common share option program to include all Canadian and U.S. employees of the corporation. At Dec. 31, 2003, 3.1 million options to purchase the corporation’s common shares were outstanding, with 1.5 million exercisable at the reporting date. At Dec. 31, 2002, 3.2 million options to purchase the corporation’s common shares were outstanding, with 0.8 million exercisable at the reporting date.
Under the terms of the Performance Share Ownership Plan (PSOP), certain employees receive awards which, after three years, make them eligible to receive a set number of common shares or cash equivalent plus dividends thereon based upon the performance of the corporation relative to a selected group of publicly traded companies. On Dec. 31, 2001, the plan was modified so that after three years, once PSOP eligibility has been determined, 50 per cent of the common shares may be released to the participant, while the remaining 50 per cent will be held in trust for one additional year. At Dec. 31, 2003, there were 1.5 million PSOP awards outstanding.
Under the terms of the Employee Share Purchase Plan, the corporation will extend an interest-free loan to employees below executive level of up to 30 per cent of the employee’s base salary for the purchase of common shares of the corporation from the open market. The loan is repaid over a three-year period by the employee through payroll deductions unless the shares are sold, at which point the loan becomes due on demand. At Dec. 31, 2003, 0.4 million shares had been purchased by employees under this program.
E M P L O Y E E F U T U R E B E N E F I T S
TransAlta has registered pension plans in Canada and the U.S. covering substantially all employees of the corporation, its domestic subsidiaries and specific named employees working internationally. These plans have defined benefit and defined contribution options and in Canada, there is a supplemental defined benefit plan for certain employees. The defined benefit option of the registered pension plan ceased for new employees on June 30, 1998. The latest actuarial valuations of the registered and supplemental pension plans were as at Dec. 31, 2003.
The corporation provides other health and dental benefits to the age of 65 for both disabled members (other post-employment benefits) and retired members (other post-retirement benefits). The latest actuarial valuation of these other plans was as at April 30, 2002.
The supplemental pension plan is an obligation of the corporation. The corporation is not obligated to fund the supplemental plan but is obligated to pay benefits under the terms of the plan as they come due. The corporation has posted a letter of credit in the amount of $40.2 million to secure the obligations under the supplemental plan.
46 T R A N S A L T A C O R P O R A T I O N A R / 0 3
TA2003ARFeb28 3/3/04 11:36 AM Page 47
R I S K F A C T O R S A N D R I S K M A N A G E M E N T
TransAlta uses a multi-level risk management oversight structure to manage the corporation���s various risk and energy trading exposures.
The Audit and Environment (A&E) Committee provides assistance to the Board of Directors in fulfilling its oversight responsibility relating to the integrity of the corporation’s financial statements and the financial reporting process; the systems of internal accounting and financial controls; the internal audit function; the external auditors’ qualifications, independence, performance and reports and the legal and environmental compliance programs as established by management and the Board of Directors.
The Exposure Management (EM) Committee is chaired by the Chief Financial Officer and is comprised of the Directors of Financial Operations for each business unit, the Executive Vice-President of Commercial Development and Marketing, Vice-President and Treasurer, Vice-President and Comptroller and the Director of Risk Management. The EM Committee is responsible for the review, monitoring and reporting on compliance of these financial and commodity risk exposure management policies.
The following addresses some, but not all, risk factors that could affect TransAlta’s future results. A discussion of critical estimates made in the application of accounting policies is provided in the Critical Accounting Policies and Estimates section that follows.
Commodity Price Risk
The corporation has exposure to movements in certain commodity prices including electricity and natural gas in both its electricity generation and proprietary trading businesses. A significant portion of the coal used in electricity generation is from coal reserves owned by TransAlta, thereby limiting the corporation’s exposure to fluctuations in the market price of coal.
Electricity generation is exposed to price fluctuations of electricity sold to the market and natural gas used in generating electricity. In addition to the PPAs, the corporation has entered into a variety of short- and long-term contracts to minimize its exposure to short-term fluctuations in electricity prices. In 2003, TransAlta had approximately 74 per cent of production under long-term contracts and 91 per cent (2002 – 93 per cent) of production was contracted for terms greater than one year. In 2003, 71 per cent (2002 – 62 per cent) of TransAlta’s cost of gas used in generating electricity was contractually fixed or passed through to customers and 100 per cent (2002 – 100 per cent) of the corporation’s purchased coal costs were contractually fixed. In the event of an unplanned plant outage or other similar event, however, the corporation is exposed to electricity prices on purchases of electricity from the market to fulfill it s supply obligations under these short- and long-term contracts. The corporation actively mitigates this exposure through continued and proper maintenance of its electricity generating plants, force majeure clauses negotiated in the contracts, trading activities and insurance.
Production and gross margins from the merchant gas plants are subject to changes in spark spreads. TransAlta has not entered into fixed commodity agreements for gas for these merchant plants as gas will be purchased concurrent with spot market spark spreads being adequate to produce and sell electricity.
The corporation’s proprietary trading of gas and electricity is limited, strictly controlled and managed through the use of VAR methodologies.
VAR is the primary measure used to manage Energy Marketing’s exposure to market risk resulting from trading activities. VAR is monitored on a daily basis, and is used to determine the potential change in the value of the corporation’s marketing portfolio over a three-day period within a 95 per cent confidence level resulting from normal market fluctuations. Stress tests are performed weekly on both earnings and VAR to measure the potential effects of various market events that could impact financial results, including fluctuations in market prices, volatilities of those prices and the relationships between those prices.
M A N A G E M E N T ’ S D I S C U S S I O N & A N A L Y S I S 47
TA2003ARFeb28 3/3/04 11:36 AM Page 48
The corporation estimates VAR using the historical variance/covariance approach. Currently, there is no uniform energy industry methodology for estimating VAR. An inherent limitation of historical variance/ covariance VAR is that historical information used in the estimate may not be indicative of future market risk.
Another method of looking at VAR is based on a 99 per cent confidence interval over a 10-day holding period. For comparison purposes, the following table provides this average daily VAR of the corporation’s marketing portfolio for 2003 and 2002:
2 0 0 3 | 2 0 0 2 | |
| 10-day average VAR – 99% confidence level | $ 9.2 | $ 6.6 |
Currency Rate Exposure
The corporation has exposure to various currencies as a result of its investments and operations in foreign jurisdictions and the acquisition of equipment and services from foreign suppliers. The corporation has exposures primarily to the U.S., Mexican and Australian currencies. These exposures are managed through the use of a variety of hedging instruments including cross-currency interest rate swaps and foreign currency forward sales contracts. At Dec. 31, 2003, the corporation had hedged approximately 100 per cent (2002 – 94 per cent) of its currency rate exposure to its foreign operations on a pre-tax basis. TransAlta’s strategy is to offset 100 per cent of foreign denominated exposures using foreign denominated liabilities, foreign currency expenses and derivatives.
Translation gains and losses related to the carrying value of the corporation’s foreign operations are deferred and included in the cumulative translation account in shareholders’ equity. At Dec. 31, 2003, the balance in this account was a $29.0 million loss compared to an $18.8 million loss at the end of 2002.
Credit Risk
TransAlta actively manages its exposure to credit risk by assessing the ability of counterparties to fulfill their obligations under the related contracts prior to entering into such contracts. The corporation sets strict credit limits for each counterparty and the mix of counterparties based on their credit ratings and halts trading activities with a counterparty if the limits are exceeded.
TransAlta is exposed to minimal credit risk for Alberta PPAs because under the terms of these arrangements all receivables are guaranteed by letters of credit.
A summary of the corporation’s credit risk exposure for its trading operations at Dec. 31, 2003, including asset-backed trading is provided below:
Number of counter- parties greater than 10% | Net exposure of counter- parties greater than 10% | |||||||||||||
Exposure before credit collateral | ||||||||||||||
Credit collateral |
Net exposure | |||||||||||||
| Rating | ||||||||||||||
| Investment grade | $ | 67.8 | $ | – | $ | 67.8 | – | $ | – | |||||
| Non-investment grade | 5.7 | 3.2 | 2.5 | – | – | |||||||||
| No external rating, internally rated – | ||||||||||||||
| investment grade | 15.5 | – | 15.5 | – | – | |||||||||
| No external rating, internally rated – | ||||||||||||||
| non-investment grade | 4.0 | – | 4.0 | – | – | |||||||||
| $ | 93.0 | $ | 3.2 | $ | 89.8 | – | $ | – | ||||||
The maximum credit exposure to any one customer, excluding the California Independent System Operator and California Power Exchange Corp. discussed earlier in the Energy Marketing Segmented discussion, and including the fair value of open trading positions, is $10.2 million receivable from Constellation Power.
48 T R A N S A L T A C O R P O R A T I O N A R / 0 3
TA2003ARFeb28 3/3/04 11:36 AM Page 49
Liquidity Risk
TransAlta is exposed to liquidity risk under certain electricity and natural gas purchase and sale contracts entered into for the purposes of asset-backed sales or proprietary trading. Liquidity risk relates to TransAlta’s ability to meet margin and collateral requirements of these contracts. The terms and conditions of these contracts may require TransAlta to provide collateral when the fair value of these contracts is both negative (out-of-the-money) and in excess of any credit limits granted by TransAlta’s counter-parties. The fair value of these contracts changes due to changes in commodity prices and foreign exchange rates. These contracts are out-of-the-money in these circumstances: (i) for purchase agreements, when forward commodity prices are less than contracted prices; and (ii) for sales agreements, when forward commodity prices exceed contracted prices. Downgrades in TransAlta’s creditworthiness may decrease the credit limits grant ed by TransAlta’s counterparties.
In the absence of any credit limits granted by TransAlta’s counterparties, TransAlta’s maximum collateral requirements would have been $409.6 million at Dec. 31, 2003. Collateral available was approximately $1 billion.
Interest Rate Exposure
The corporation has exposure to movements in interest rates and manages this exposure by maintaining a limit on the amount of debt subject to floating interest rates. At Dec. 31, 2003, approximately 24 per cent (2002 – 25 per cent) of the corporation’s total debt portfolio was subject to movements in floating interest rates through a combination of floating rate debt and interest rate swaps.
Operational Risk
The corporation’s plants have exposure to operational risks such as fatigue cracks in boilers, corrosion in boiler tubing, turbine failures and other issues that can lead to outages. A comprehensive plant maintenance program and regular turnarounds reduce this exposure. If the plants do not meet the availability or production targets specified in the PPAs or the other long-term contracts, then the corporation must either compensate the purchaser for the loss in the availability of production or suffer a reduction in electrical or capacity payments. Consequently, an extended outage could have a material adverse effect on the business, financial condition, results of operations, or cash flows of the corporation. Insurance and force majeure clauses in the PPAs and other long-term contracts further mitigate this exposure.
Approximately 55 per cent of the corporation’s labour force is covered under collective bargaining agreements. The agreements of approximately 97 per cent of this unionized labour force are being negotiated during 2004. Management does not anticipate any significant issues in the renegotiations of these agreements.
The construction and development of generating facilities and acquisition activities are subject to various environmental, engineering and construction risks relating to cost-overruns, delays and performance. The corporation attempts to minimize these risks by performing detailed analysis of project economics prior to construction or acquisition and by securing favourable power sales agreements.
The corporation’s fuel supply and fuel costs for gas-fired plants are managed with short-, medium- and long-term gas supply contracts, gas hedging transactions, and contractual agreements that provide for the flow-through of gas costs. The corporation believes adequate supplies of natural gas at reasonable prices will be available for plants when existing supply contracts expire.
Environmental, Health and Safety Risk
TransAlta’s approach is to continually improve the management of operational risks in the areas of environment, health and safety while developing mechanisms to manage future risks. These programs are integrated into the operations and management systems of the corporation and are designed to mitigate the potential competitive risks to its fossil-fuelled generation plants from future changes in environmental policy.
M A N A G E M E N T ’ S D I S C U S S I O N & A N A L Y S I S 49
TA2003ARFeb28 3/3/04 11:36 AM Page 50
TransAlta has implemented an ISO-based environmental, health and safety (EHS) management system, designed to continuously improve environmental and safety performance. At Dec. 31, 2003, 94 per cent of TransAlta’s plants had implemented the system. Compliance with both regulatory requirements and management system standards is regularly audited through TransAlta’s Performance Assurance policy and results are reported quarterly to the Board of Directors.
TransAlta is subject to federal, provincial and local environmental laws, regulations and guidelines concerning the generation and transmission of electrical and thermal energy and surface mining. TransAlta strives to maintain compliance with all environmental regulations relating to its operations and facilities. Quarterly reports on all EHS regulatory changes are provided to each facility to ensure compliance is maintained. TransAlta works with regulators in Canada and the U.S. to ensure regulatory changes are well-designed and cost effective. If regulations were to change however, the operational and financial impact on all plants would need to be assessed. Outcomes may include, but are not limited to: increased compliance, maintenance or capital costs; plant impairment charges; or the decommissioning of certain facilities.
TransAlta’s environmental policy requires that the environmental impacts and risks of the corporation’s activities are identified, assessed and managed. This is done by the use of an environmental management system to set environmental objectives and regularly review subsequent performance with senior management and mitigative action on longer-term environmental policy impacts such as climate change.
Canada is the only country within TransAlta’s operations that has emission reduction obligations under the Kyoto Protocol. While uncertainty still exists as to the ultimate form and specific detail of Canada’s climate change regulations, TransAlta’s climate change strategy addresses the potential competitive risks to its fossil-fuelled generation plants. That strategy includes increased use of less carbon-intensive fuels such as natural gas and renewables, continued investment in international emission offsets, and development of clean coal technology.
The Dow Jones Sustainability Index has again recognized TransAlta as one of the world’s best utility companies in terms of sustainability performance, and TransAlta is also recognized on the FTSE4 (Financial Times Stock Exchange) Good Global Index, a London-based sustainability index.
Regulatory and Political Risk
Regulatory and political risks exist in the jurisdictions in which TransAlta operates. TransAlta manages these risks by working with governments, regulators and other stakeholders to attempt to resolve issues. Legislation was passed in Ontario in late 2002 capping retail market prices at $43 per MWh. Adjustments were made to this fixed price scheme in November 2003 when a two-tiered fixed price scheme was announced at $47 per MWh and $55 per MWh. The government has announced that this is an interim step until May 2005 when the Ontario Energy Board is scheduled to regulate price. Wholesale market prices have not been directly impacted by this decision; however, liquidity has decreased in the Ontario market as a result.
International investments are subject to unique risks and uncertainties relating to the political, social and economic structures of the respective country. This risk is mitigated through the use of non-recourse financing and political risk insurance.
Transmission Risks
In August 2003, a blackout cut off electricity to millions of residents in the Northeastern U.S. and Eastern Canada. This type of event, although extremely unusual, is an ongoing risk for electric companies. This risk is mitigated through force majeure clauses in the Alberta PPAs and power sales contracts and access to multiple transmission lines.
Corporate Structure
The corporation conducts a significant amount of business through subsidiaries and partnerships. The corporation’s ability to meet and service debt obligations is dependent upon the results of operations
50 T R A N S A L T A C O R P O R A T I O N A R / 0 3
TA2003ARFeb28 3/3/04 11:36 AM Page 51
of its subsidiaries and the payment of funds by such subsidiaries to the corporation in the form of distributions, loans, dividends or otherwise. In addition, TransAlta’s subsidiaries may be subject to statutory or contractual restrictions which limit their ability to distribute cash to the ultimate shareholder, TransAlta Corporation.
General Economic Conditions
Changes in general economic conditions impact product demand, revenue, operating costs, timing and extent of capital expenditures, the net recoverable value of PP&E, results of financing efforts, credit risk and counterparty risk.
Income Taxes
The corporation’s operations are complex, and the computation of the provision for income taxes involves tax interpretations, regulations and legislation that are continually changing. The corporation’s tax filings are subject to audit by taxation authorities. Management believes that it has adequately provided for income taxes based on all information currently available.
Legal Contingencies
The corporation, through generation and marketing activities, is occasionally named as a defendant in various claims and legal action. The nature of these claims is usually related to personal injury, environmental issues and pricing. Exposure to these claims is mitigated through levels of insurance coverage considered appropriate by management. Except as disclosed inNote 24to the consolidated financial statements, the corporation does not expect the outcome of the claims or potential claims to have a materially adverse effect on the corporation as a whole.
Other Contingencies
The corporation maintains a level of insurance coverage deemed appropriate by management and for matters for which insurance coverage can be maintained. There were no significant changes to TransAlta’s insurance coverage during 2003. In 2002 TransAlta discontinued coverage for terrorist acts, as it was no longer available from insurance providers.
Sensitivity Analysis
The following table shows the effect on net earnings and cash flows of changes in certain key variables. The analysis is based on business conditions and production volumes in 2003. Each separate item in the sensitivity assumes the others are held constant. While these sensitivities are applicable to the period and magnitude of changes on which they are based, they may not be applicable in other periods, under other economic circumstances, or for greater magnitude of changes.
Approximate impact | ||||||||||
| Earnings | ||||||||||
| Factor | Change | Cash flow | (after-tax) | |||||||
| Electricity price | $ | 1.00/MWh | $ | 6.6 | $ | 6.6 | ||||
| Natural gas price | $ | 0.1/GJ | (0.2) | (0.2) | ||||||
| Availability/production | 1% | 14.8 | 14.8 | |||||||
| Exchange rate (US$ per Cdn$) | US$0.01 | – | – | |||||||
| Interest rate | 1% | 7.0 | 7.0 | |||||||
| Tax rate | 1% | 1.4 | 1.4 | |||||||
The impact of a $1.00 per MWh change in electricity prices has minimal impact on cash flow and after-tax earnings, as approximately 91 per cent of output is at contractually fixed prices. A change in natural gas prices also has minimal impact as 71 per cent of gas costs have been contractually fixed or flow through to customers under terms of agreements.
The calculation of the impact of a one per cent change in availability assumes that production levels will change by an equivalent amount at the contracted plants. An increase in availability at the merchant gas plants would not result in increased production.
M A N A G E M E N T ’ S D I S C U S S I O N & A N A L Y S I S 51
TA2003ARFeb28 3/3/04 11:36 AM Page 52
TransAlta’s hedging strategies have minimized the impact of changes in exchange rates and interest rates as the corporation’s net investments in foreign operations have been hedged and interest rates on approximately 76 per cent of TransAlta’s debt have been fixed.
The income tax rate can change depending on the mix of earnings from various countries. Increased operating income will incur income tax expense at a rate of approximately 35 per cent compared to the forecasted overall rate of approximately 25 per cent.
C R I T I C A L A C C O U N T I N G P O L I C I E S A N D E S T I M AT E S
The selection and application of accounting policies is an important process that has developed as TransAlta’s business activities have evolved and as accounting rules have changed. Accounting rules generally do not involve a selection among alternatives, but involve an implementation and interpretation of existing rules and the use of judgment relative to the circumstances existing in the corporation’s business. Every effort is made to comply with all applicable rules on or before the effective date, and TransAlta believes the proper implementation and consistent application of accounting rules is critical. However, not all situations are specifically addressed in the accounting literature. In these cases, the corporation’s best judgment is used to adopt a policy for accounting for these situations. This is accomplished by analogizing to similar situations and the accounting guidelines governing them, consideration of foreign accounting stan dards and consultation with the corporation’s independent auditors about the appropriate interpretation and application of these policies. Each of the critical accounting policies involves complex situations and a high degree of judgment either in the application and interpretation of existing literature or in the development of estimates that impact the corporation’s consolidated financial statements.
TransAlta’s significant accounting policies are described inNote 1to the consolidated financial statements. The most critical of these policies are those related to revenue recognition, PP&E, goodwill, asset retirement obligations, income taxes and employee future benefits(Notes 1(D), (G), (H), (J), (M) and (N), respectively). Each policy involves a number of estimates and assumptions to be made by management about matters that are highly uncertain at the time the estimate is made. Different estimates, with respect to key variables the corporation used for the calculations, or changes to estimates could potentially have a material impact on TransAlta’s financial position or results of operations. These critical accounting estimates are d escribed below.
Management has discussed the development and selection of these critical accounting estimates with the A&E Committee and the corporation’s independent auditors. The A&E Committee has reviewed and approved the corporation’s disclosure relating to critical accounting estimates in this MD&A.
Tables are provided in the following discussion to reflect the sensitivities associated with changes in key assumptions used in the estimates. The tables reflect an increase or decrease in the percentage or other factor for each assumption. The inverse of each change is generally expected to have a similar opposite impact. Each separate item in the sensitivity assumes all other factors remain constant.
Revenue Recognition
The majority of the corporation’s revenues are derived from the sale of physical power and from energy marketing and trading activities. Revenues under long-term electricity and thermal sales contracts generally include one or more of the following components: fixed capacity payments for being available; energy payments for generation of electricity; availability incentives or penalties for exceeding or not meeting availability targets; excess energy payments for power generation above committed capacity; and ancillary services. Each is recognized upon output, delivery, or satisfaction of specific targets, as specified by contractual terms. Revenues from non-contracted capacity are comprised of energy payments for each MWh produced at market prices, and are recognized upon delivery.
52 T R A N S A L T A C O R P O R A T I O N A R / 0 3
TA2003ARFeb28 3/3/04 11:36 AM Page 53
Trading activities use derivatives such as physical and financial swaps, forward sales contracts, futures contracts and options, which are used to earn trading revenues and to gain market information. These derivatives are accounted for using fair value accounting. Derivatives, other than real-time physical contracts, are presented on a net basis in the statements of earnings. The initial recognition of fair value and subsequent changes in fair value affect reported earnings in the period the change occurs. The fair values of those instruments that remain open at the balance sheet date represent unrealized gains or losses and are presented on the balance sheets as price risk management assets and liabilities. Non-derivative contracts are accounted for using the accrual method. To be consistent with the EITF 03-11, TransAlta has concluded that real-time physical contracts meet the definition of derivative contracts held for delivery and therefore realized ga ins and losses are reported gross in the statement of earnings.
The determination of the fair value of energy trading contracts and derivative instruments is complex and relies on judgments concerning future prices, volatility and liquidity, among other factors. Some derivatives have quoted market prices from the New York Mercantile Exchange, or over-the-counter quotes are available from brokers. However, some derivatives are not traded on an active exchange or extend beyond the time period for which exchange-based quotes are available. These derivatives require the use of internal valuation techniques or models (mark-to-model accounting).
Mark-to-model accounting is currently used for physical and financial forward contracts and option contracts on transmission and transmission congestion, other than transmission rights acquired to sell production from TransAlta plants, and physical transmission rights used by the Energy Marketing segment. Changes in fair value of derivatives subsequent to inception are recorded on the balance sheet as price risk management assets or liabilities with the offset recorded in revenues. The values can be favourable or unfavourable, and depending on current market conditions, values can fluctuate significantly, with the effect of changes being recorded through earnings in the period of the change. Modeling techniques require the corporation to model future prices, price correlation, market volatility, liquidity and other forecasted market intelligence, as well as the use of mathematical extrapolation techniques. Where appropriate, the estimates used to derive fai r value reflect the potential impact for uncertainties in the modeling process, the potential impact of liquidating the corporation’s position in an orderly manner over a reasonable period of time under present market conditions and operational risk. TransAlta validates its mark-to-model results by comparing against settled data. The amounts reported in the financial statements may change as estimates are revised to reflect actual results or new information, changes in market conditions or other factors, many of which are beyond the control of the corporation, and may be material.
Key variables used in the models are uncertain. The estimated value of these contracts at Dec. 31, 2003 using mark-to-model methodology was $2.0 million. Sensitivities of the valuation, which would have been recorded in earnings in the current year, are as follows:
| Impact on | |||||
| Change in | pre-tax | ||||
| Assumption | assumption | earnings | |||
| Change in volatility | 1% | $ | 0.1 | ||
| Change in commodity price | 1% | 0.1 | |||
There have been no significant changes to the modeling techniques in the past three years.
M A N A G E M E N T ’ S D I S C U S S I O N & A N A L Y S I S 53
TA2003ARFeb28 3/3/04 11:36 AM Page 54
Valuation of Property, Plant and Equipment
PP&E makes up 75 per cent of the corporation’s assets, of which 99 per cent relates to the Generation segment. On an annual basis, and when indicators of impairment exist, TransAlta determines whether the net carrying amount of PP&E is recoverable from future undiscounted cash flows. Factors which could indicate that an impairment exists include significant underperformance relative to historical or projected operating results, significant changes in the manner or use of the assets, the strategy for the corporation’s overall business and significant negative industry or economic trends. In some cases, these events are clear. However, in many cases, a clearly identifiable event indicating possible impairment does not occur. Instead, a series of individually insignificant events occur over a period of time leading to an indication that an asset may be impaired. This can be further complicated in situations where TransAlta is not the operator of the project. Events can occur in these situations that may not be known until a date subsequent to their occurrence.
The corporation’s businesses, the markets and business environment are continually monitored, and judgments and assessments are made to determine whether an event has occurred that indicates possible impairment. If such an event has occurred, an estimate is made of the future undiscounted cash flows from the asset. If the total of the undiscounted future cash flows excluding financing charges, with the exception of plants that have specifically dedicated debt, is less than the carrying amount of the asset, an asset impairment charge must be recognized in the financial statements. The amount of the impairment recognized is calculated by subtracting the fair value of the asset from the carrying value of the asset. Fair value is the amount at which an item could be bought or sold in a current transaction between willing parties, and is best estimated by calculating the net present value of future expected cash flows related to the asset. Both the identifi cation of events that may trigger an impairment and the estimates of future cash flows and the fair value of the asset require considerable judgment.
The assessment of asset impairment requires management to make significant assumptions about future sales prices, cost of sales, production and fuel consumed over the life of the plants (up to 30 years), retirement costs and discount rates. In addition, when impairment tests are performed, the estimated useful lives of the plants are reassessed, with any change accounted for prospectively.
In estimating future cash flows of the plants, the corporation uses estimates of contracted and future market prices based on expected market supply and demand in the region in which the plant operates, anticipated production levels, planned and unplanned outages, and transmission capacity or constraints for the remaining life of the plant. Actual results can, and often do, differ from the estimates, and can have either a positive or negative impact on the estimate of the impairment charge, and may be material.
During 2003, the Binghamton plant did not run on a regular basis. This indicated that an impairment may have existed; therefore the plant was reviewed for impairment. The Binghamton plant sells electricity to the New York area at spot market rates when such prices exceed its marginal operating costs of producing electricity. The corporation determined that undiscounted expected future cash flows from the Binghamton plant were less than the carrying value of the asset, therefore a pre-tax impairment charge of $5.6 million was recognized in the fourth quarter of 2003. The carrying value of the Binghamton plant was $6.9 million at Dec. 31, 2003.
The fair value of the Binghamton plant was calculated from the expected present value of future cash flows. Management was required to make several estimates of future results and events. The range of pre-tax impairment charges resulting from management’s estimates was from $3.1 million to $8.1 million.
The Centralia Gas plant is a merchant plant. As spark spreads continue to be depressed in the Pacific Northwest, an impairment test was performed. The corporation determined that undiscounted expected future cash flows exceeded the carrying value, so no impairment charge was recognized.
54 T R A N S A L T A C O R P O R A T I O N A R / 0 3
TA2003ARFeb28 3/3/04 11:36 AM Page 55
Undiscounted future cash flows for the Centralia Gas plant were calculated based on the corporation’s forward view of spark spreads at Dec. 31, 2003, which are expected to compress in the near term, and to recover in the medium to long term. Because the plant only operates when spark spreads are above certain levels to recover marginal costs of electricity production, fluctuations in electricity prices and natural gas prices will also affect production levels. Therefore, the calculation of sensitivities of changes in these variables, with all other variables remaining constant, will not produce a meaningful result.
The results of TransAlta’s annual impairment review for all other plants showed no indications of impairment.
In the second quarter of 2003, TransAlta determined that future growth would be slower than previously anticipated. This reduction in expansion plans, combined with an unsuccessful bid for the Valladolid project in Mexico, indicated that an impairment of TransAlta’s turbine inventory may exist. As a result, the turbine inventory was reviewed for impairment. The corporation concluded that the carrying amount of the turbine inventory was not recoverable and the fair value of the turbines was less than the carrying value of the assets; therefore an $84.7 million asset impairment charge was recognized. Fair value was estimated using market prices for the same or similar turbines.
Asset Retirement Obligations
The corporation recognizes asset retirement obligations for PP&E in the period in which they are incurred if a reasonable estimate of a fair value can be determined. The fair value of the liability is described as the amount at which the liability could be settled in a current transaction between willing parties. Expected values are probability weighted to deal with the risks and uncertainties inherent in the timing and amount of settlement of many asset retirement obligations. Expected values are discounted at the risk-free interest rate adjusted to reflect the market’s evaluation of the entity’s credit standing. Determining asset retirement obligations requires estimating the life of the related asset and the costs of activities such as demolition, dismantling, restoration and remedial work based on present day methods and technologies.
At Dec. 31, 2003, the asset retirement obligations recorded on the consolidated balance sheet were $258.2 million. TransAlta estimates the undiscounted amount of cash flow required to settle the obligations is approximately $1.5 billion, which will be incurred between 2007 and 2082. The majority of these costs will be incurred between 2030 and 2035.
Sensitivities for the major assumptions are as follows:
| Impact on | |||||
| Change in | pre-tax | ||||
| Assumption | assumption | earnings | |||
| Discount rate | 1% | $ | 2.4 | ||
| Undiscounted asset retirement obligations | 1% | 0.1 | |||
Useful life of Property, Plant and Equipment
PP&E is depreciated over its estimated useful life. Estimated useful lives were determined based on current facts and past experience, and take into consideration the anticipated physical life of the asset, existing long-term sales agreements and contracts, current and forecasted demand and the potential for technological obsolescence. Major components of plants are depreciated over their own useful lives. A component is a tangible asset that can be separately identified as an asset, and is expected to provide a benefit of greater than one year.
Depreciation and amortization expense was $364.1 million in 2003, of which $47.1 million relates to mining equipment, and is included in fuel and purchased power.
The rates used are reviewed on an ongoing basis to ensure they continue to be appropriate, and are also reviewed in conjunction with impairment testing, as discussed above.
A five per cent change in the estimated useful life of depreciable assets will result in a change of $17.6 million in depreciation and amortization expense.
M A N A G E M E N T ’ S D I S C U S S I O N & A N A L Y S I S 55
TA2003ARFeb28 3/3/04 11:36 AM Page 56
Valuation of Goodwill
The corporation evaluates goodwill for impairment at least annually, or more frequently if indicators of impairment exist. If the carrying value of a reporting unit including goodwill exceeds the reporting unit’s fair value, any excess represents the impairment loss.
Goodwill was recorded on the acquisitions of the remainder of MEGA,Vision Quest and CE Gen(Note 4).At Dec. 31, 2003, this goodwill had a total carrying value of $149.6 million.
The corporation reviewed goodwill related to MEGA in the second quarter of 2003 subsequent to the closure of the Annapolis office. The corporation reviewed the goodwill resulting from the Vision Quest and CE Gen purchases in the fourth quarter of 2003 in connection with the corporation’s annual impairment test. To test for impairment, the fair value of the reporting units to which the goodwill relates were compared to the carrying values of the reporting units. The corporation determined that the fair values of the reporting units, based on historical cash flows and estimates of future cash flows, exceeded their carrying values; therefore, no impairment charges were recorded.
Determining the fair value of the reporting units is susceptible to changes from period to period as management is required to make assumptions about future cash flows, production and trading volumes, margins and fuel and operating costs. Had assumptions been made that resulted in fair values of the reporting units declining by 10 per cent from current levels, there would not have been any impairment of goodwill. To the extent goodwill was impaired, the impairment charge would impact earnings in the period of the charge.
Income Taxes
In accordance with Canadian GAAP, the corporation uses the liability method of accounting for future income taxes and provides future income taxes for all significant income tax temporary differences.
Preparation of the consolidated financial statements requires an estimate of income taxes in each of the jurisdictions in which the corporation operates. The process involves an estimate of the corporation’s actual current tax exposure and an assessment of temporary differences resulting from differing treatment of items, such as depreciation and amortization, for tax and accounting purposes. These differences result in future tax assets and liabilities which are included in the corporation’s consolidated balance sheet.
An assessment must also be made to determine the likelihood that the corporation’s future tax assets will be recovered from future taxable income. To the extent that recovery is not considered likely, a valuation allowance must be determined. Judgment is required in determining the provision for income taxes, future income tax assets and liabilities and any related valuation allowance. To the extent a valuation allowance is created or revised, current period earnings will be affected.
Future tax assets of $134.7 million have been recorded on the consolidated balance sheet at Dec. 31, 2003. This is comprised primarily of unrealized losses on electricity trading contracts, future site restoration costs and net operating and capital loss carryforwards. The corporation believes there will be sufficient taxable income and capital gains that will permit the use of these deductions and carry-forwards in the tax jurisdictions where they exist.
Future tax liabilities of $691.3 million have been recorded on the consolidated balance sheet at Dec. 31, 2003. The liability is comprised primarily of unrealized gains on electricity trading contracts and income tax deductions in excess of related depreciation of PP&E.
Judgment is required to assess tax interpretations, regulations and legislation, which are continually changing, to ensure liabilities are complete and to ensure assets, net of valuation allowances, are realizable. The impact of different interpretations and applications could potentially be material.
The corporation’s tax filings are subject to audit by taxation authorities. The outcome of some audits may change the tax liability of the corporation, although management believes that it has adequately provided for income taxes based on all information currently available. The outcome of the audits is not known, nor is the potential impact on the financial statements determinable.
56 T R A N S A L T A C O R P O R A T I O N A R / 0 3
TA2003ARFeb28 3/3/04 11:36 AM Page 57
Employee Future Benefits
As explained inNote 19to the consolidated financial statements, the corporation provides post-retirement benefits to employees. The cost of providing these benefits is dependent upon many factors which result from actual plan experience and assumptions of future experience.
The liability for future benefits and associated pension costs included in annual compensation expenses are impacted by employee demographics, including age, compensation levels, employment periods, the level of contributions made to the plans and earnings on plan assets. Changes to the provisions of the plans may also affect current and future pension costs. Pension costs may also be significantly impacted by changes in key actuarial assumptions, including anticipated rates of return on plan assets and the discount rates used in determining the projected benefit obligation and pension costs.
The plan assets are comprised primarily of equity and fixed income investments. Fluctuations in actual equity market returns and changes in interest rates may result in increased or decreased pension costs in future periods.
The following chart reflects the sensitivities associated with a change in certain actuarial assumptions:
Impact on projected benefit obligation | Impact on pension cost reported in earnings | |||||||
Change in assumption | ||||||||
| Actuarial assumption | ||||||||
| Discount rate | 1% | $ | 45.6 | $ | 3.9 | |||
| Rate of return on plan assets | 1% | – | 3.3 | |||||
The discount rate used represents high-quality fixed income securities currently available and expected to be available during the period to maturity of the pension benefits. The corporation does not expect to make any changes to the rate in 2004.
The expected long-term rate of return on plan assets is based on past performance and economic forecasts for the types of investments held by the plan. For the year ended Dec. 31, 2003, the plan assets had a return of $36.6 million compared to a loss of $6.7 million in 2002 and earnings of $9.9 million in 2001. The 2003 actuarial valuation used the same rate of return on plan assets (7.1 per cent) as was used in 2002 and 2001.
As a result of the corporation’s plan asset return experience for its U.S. registered pension plan, at Dec. 31, 2002, the corporation was required under U.S. GAAP to recognize an additional minimum liability(Note 27). The liability was recorded as a reduction in common equity through a charge to other comprehensive income (OCI), and did not affect net income for 2002. In 2003, the charge to OCI was partially restored through common equity as the fair value of the trust assets increased relative to the accumulated benefit obligation.
The amount of the additional pension liability recognized for U.S. GAAP depended on a number of factors, including the discount rate and asset returns experienced, contributions made by the corporation and any resulting change in management’s assumptions. Pension cost and cash funding requirements could increase in future years.
S E L E C T E D Q U A R T E R LY F I N A N C I A L I N F O R M AT I O N
For information regarding the eight quarters ended Dec. 31, 2003, see page 99.
M A N A G E M E N T ’ S D I S C U S S I O N & A N A L Y S I S 57
TA2003ARFeb28 3/3/04 11:36 AM Page 58
M A N A G E M E N T ’ S R E S P O N S I B I L I T Y
TransAlta’s management is responsible for presentation and preparation of the annual consolidated financial statements, management’s discussion and analysis (MD&A) and all other information in this annual report.
The accompanying consolidated financial statements have been prepared in accordance with Canadian generally accepted accounting principles and the requirements of the Securities and Exchange Commission (SEC) in the U.S., as applicable.
The MD&A has been prepared in accordance with the requirements of securities regulators including National Instruments 44-101 and 51-102 of the Canadian Securities Administrators as well as Item 303 of Regulation S-K of the Securities Exchange Act, and their related published requirements.
The consolidated financial statements and information in the MD&A necessarily include amounts based on informed judgments and estimates of the expected effects of current events and transactions with appropriate consideration for materiality. In addition, in preparing financial information, the corporation must interpret the requirements described above, make determinations as to the relevancy of information to be included, and make estimates and assumptions that affect reported information. The MD&A also includes information regarding the estimated impact of current transactions and events, sources of liquidity and capital resources, operating trends, risks and uncertainties. Actual results in the future may differ materially from management’s present assessment of this information because future events and circumstances may not occur as expected.
The financial information presented elsewhere in this annual report is consistent with that in the consolidated financial statements.
To meet its responsibility for reliable and accurate financial statements, management has established systems of internal control which are designed to provide reasonable assurance that financial information is relevant, reliable and accurate, and that assets are safeguarded and transactions are executed in accordance with management’s authorization. These systems are monitored by management and by internal auditors. In addition, the internal auditors perform appropriate tests and related audit procedures.
The consolidated financial statements have been examined by Ernst & Young LLP, independent chartered accountants. The external auditors’ responsibility is to express a professional opinion on the fairness of management’s consolidated financial statements. The auditors’ report outlines the scope of their examination and sets forth their opinion.
The Audit and Environment (A&E) Committee of the Board of Directors is comprised of independent directors. The A&E Committee meets regularly with management, the internal auditors and the external auditors to satisfy itself that each is properly discharging its responsibilities, and to review the consolidated financial statements and MD&A. The A&E Committee reports its findings to the Board of Directors for consideration when approving the consolidated financial statements for issuance to the shareholders. The A&E Committee also recommends, for review by the Board of Directors and approval of shareholders, the appointment of the external auditors. The internal and external auditors have full and free access to the A&E Committee.
TransAlta’s Chief Executive Officer and Chief Financial Officer have certified TransAlta Corporation’s annual disclosure document filed with the SEC (Form 40-F) as required by the U.S. Sarbanes-Oxley Act.

58 T R A N S A L T A C O R P O R A T I O N A R / 0 3
TA2003ARFeb28 3/3/04 11:36 AM Page 59
A U D I T O R S ’ R E P O R T
To the Shareholders of TransAlta Corporation
We have audited the consolidated balance sheets of TransAlta Corporation as at December 31, 2003 and 2002 and the consolidated statements of earnings and retained earnings and cash flows for each of the years in the three year period ended December 31, 2003. These financial statements are the responsibility of the corporation’s management. Our responsibility is to express an opinion on these financial statements based on our audits.
We conducted our audits in accordance with generally accepted auditing standards in Canada and the United States. Those standards require that we plan and perform an audit to obtain reasonable assurance whether the financial statements are free of material misstatement. An audit includes examining, on a test basis, evidence supporting the amounts and disclosures in the financial statements. An audit also includes assessing the accounting principles used and significant estimates made by management, as well as evaluating the overall financial statement presentation.
In our opinion, these consolidated financial statements present fairly, in all material respects, the financial position of the corporation as at December 31, 2003 and 2002 and the results of its operations and its cash flows for each of the years in the three year period ended December 31, 2003 in accordance with Canadian generally accepted accounting principles. We also report that, in our opinion, these principles have been applied, except for changes in the method of accounting for asset retirement obligations, disposal of long-lived assets and discontinued operations and the presentation of trading activities, as described inNote 1(R)to the consolidated financial statements, on a basis consistent with that of the preceding year.

Calgary, Canada February 11, 2004
C O N S O L I D A T E D F I N A N C I A L S T A T E M E N T S 59
TA2003ARFeb28 3/3/04 11:36 AM Page 60
C O N S O L I D A T E D S T A T E M E N T S O F E A R N I N G S & R E T A I N E D E A R N I N G S
| Y E A R S E N D E D D E C . 3 1 | 2003 | 2002 | 2001 | ||||||||
| ( IN M I L L I O N S OF C A N A D I A N D O L L A R S E X C E P T PE R S H A R E A M O U N T S ) | (Restated, Note 1) | (Restated, Note 1) | |||||||||
| Revenues | $ | 2,508.6 | $ | 1,814.9 | $ | 2,559.5 | |||||
| Fuel and purchased power | (1,067.4) | (664.6) | (1,187.1) | ||||||||
| Trading purchases | (85.1) | (91.0) | (240.1) | ||||||||
| Gross margin | 1,356.1 | 1,059.3 | 1,132.3 | ||||||||
| Operating expenses | |||||||||||
| Operations, maintenance and administration | 559.3 | 420.5 | 392.2 | ||||||||
| Depreciation and amortization(Note 2) | 339.0 | 243.0 | 212.8 | ||||||||
| Taxes, other than income taxes | 23.1 | 27.4 | 18.7 | ||||||||
| Gain on sale of Sheerness Generating Station | (Note 4) | (191.5) | – | – | |||||||
| Gain on sale of TransAlta Power partnership units(Note 4) | (15.2) | – | – | ||||||||
| Gain on sale of Seebe land(Note 4) | (10.5) | – | – | ||||||||
| Asset impairment charges(Note 7) | 90.3 | 152.5 | 118.8 | ||||||||
| Prior period regulatory decisions(Note 17) | – | 3.3 | (11.0) | ||||||||
| 794.5 | 846.7 | 731.5 | |||||||||
| Operating income | 561.6 | 212.6 | 400.8 | ||||||||
| Other income (expense) | (3.2) | 0.1 | 1.5 | ||||||||
| Foreign exchange gain (loss) | (4.7) | 1.2 | 0.8 | ||||||||
| Net interest expense(Note 11) | (183.9) | (82.7) | (88.1) | ||||||||
| Earnings from continuing operations before income taxes | |||||||||||
| and non-controlling interests | 369.8 | 131.2 | 315.0 | ||||||||
| Income tax expense(Note 18) | 78.4 | 23.4 | 97.6 | ||||||||
| Non-controlling interests(Note 13) | 34.2 | 20.1 | 20.6 | ||||||||
| Earnings from continuing operations | 257.2 | 87.7 | 196.8 | ||||||||
| Earnings from discontinued operations, net of tax(Note 3) | – | 12.8 | 45.1 | ||||||||
| Gain on disposal of discontinued operations, net of tax(Note 3) | – | 120.0 | – | ||||||||
| Net earnings | 257.2 | 220.5 | 241.9 | ||||||||
| Preferred securities distributions, net of tax | 23.0 | 20.9 | 13.1 | ||||||||
| Net earnings applicable to common shareholders | $ | 234.2 | $ | 199.6 | $ | 228.8 | |||||
| Common share dividends | (185.0) | (169.0) | (168.4) | ||||||||
| Adjustment arising from normal course issuer bid | – | (27.0) | (34.8) | ||||||||
| Retained earnings | |||||||||||
| Opening balance | 884.7 | 881.1 | 855.5 | ||||||||
| Closing balance | $ | 933.9 | $ | 884.7 | $ | 881.1 | |||||
| Weighted average common shares outstanding in the year | 185.3 | 169.6 | 168.9 | ||||||||
| Basic earnings per share | |||||||||||
| Earnings from continuing operations | $ | 1.26 | $ | 0.39 | $ | 1.09 | |||||
| Earnings from discontinued operations | – | 0.07 | 0.27 | ||||||||
| Net earnings from operations | 1.26 | 0.46 | 1.36 | ||||||||
| Gain on disposal of discontinued operations, net of tax | – | 0.71 | – | ||||||||
| Net earnings | $ | 1.26 | $ | 1.17 | $ | 1.36 | |||||
| Diluted earnings per share | |||||||||||
| Earnings from continuing operations | $ | 1.26 | $ | 0.39 | $ | 1.07 | |||||
| Earnings from discontinued operations | – | 0.07 | 0.27 | ||||||||
| Net earnings from operations | 1.26 | 0.46 | 1.34 | ||||||||
| Gain on disposal of discontinued operations, net of tax | – | 0.71 | – | ||||||||
| Net earnings | $ | 1.26 | $ | 1.17 | $ | 1.34 | |||||
| See accompanying notes. | |||||||||||
60 T R A N S A L T A C O R P O R A T I O N A R / 0 3
TA2003ARFeb28 3/3/04 11:36 AM Page 61
C O N S O L I D A TE D B A L AN C E S H E E T S | |||||||
| D E C . 3 1 | 2003 | 2002 | |||||
| ( I N M I L L I O N S O F C A N A D I A N D O L L A R S ) | (Restated, Note 1) | ||||||
| ASSETS | |||||||
| Current assets | |||||||
| Cash and cash equivalents | $ | 155.0 | $ | 143.3 | |||
| Accounts receivable | 410.2 | 419.0 | |||||
| Prepaid expenses | 53.8 | 49.4 | |||||
| Price risk management assets (Note 20) | 77.1 | 157.8 | |||||
| Future income tax assets (Note 18) | 29.4 | 18.7 | |||||
| Income taxes receivable | 108.9 | 111.5 | |||||
| Inventory | 47.0 | 48.9 | |||||
| 881.4 | 948.6 | ||||||
| Restricted cash(Note 4) | 9.9 | – | |||||
| Investments(Note 5) | 5.0 | 32.2 | |||||
| Long-term receivables(Note 6) | 120.1 | 39.9 | |||||
| Property, plant and equipment(Note 7) | |||||||
| Cost | 8,619.4 | 8,074.1 | |||||
| Accumulated depreciation | (2,302.5) | (2,066.7) | |||||
| 6,316.9 | 6,007.4 | ||||||
| Goodwill(Note 4) | 149.6 | 56.5 | |||||
| Intangible assets(Note 8) | 545.8 | 86.8 | |||||
| Future income tax assets(Note 18) | 105.3 | 72.2 | |||||
| Price risk management assets(Note 20) | 71.9 | 60.7 | |||||
| Other assets(Note 9) | 214.3 | 110.6 | |||||
| Total assets | $ | 8,420.2 | $ | 7,414.9 | |||
| LIABILITIES AND SHAREHOLDERS’ EQUITY | |||||||
| Current liabilities | |||||||
| Short-term debt(Note 10) | $ | 119.8 | $ | 290.0 | |||
| Accounts payable and accrued liabilities | 547.2 | 472.2 | |||||
| Price risk management liabilities(Note 20) | 71.2 | 173.8 | |||||
| Future income tax liabilities(Note 18) | 4.6 | 17.1 | |||||
| Dividends payable | 14.9 | 42.9 | |||||
| Current portion of long-term debt(Note 11) | 138.5 | 355.4 | |||||
| Current portion of long-term debt – non-recourse(Note 11) | 45.3 | – | |||||
| 941.5 | 1,351.4 | ||||||
| Long-term debt(Note 11) | 2,444.1 | 2,351.2 | |||||
| Long-term debt – non-recourse(Note 11) | 534.2 | – | |||||
| Deferred credits and other long-term liabilities(Note 12) | 359.3 | 452.8 | |||||
| Future income tax liabilities(Note 18) | 686.7 | 402.1 | |||||
| Price risk management liabilities(Note 20) | 65.1 | 50.6 | |||||
| Non-controlling interests(Note 13) | 477.9 | 263.0 | |||||
| Preferred securities(Note 14) | 450.8 | 451.7 | |||||
| Common shareholders’ equity | |||||||
| Common shares(Note 15) | 1,555.7 | 1,226.2 | |||||
| Retained earnings | 933.9 | 884.7 | |||||
| Cumulative translation adjustment | (29.0) | (18.8) | |||||
| 2,460.6 | 2,092.1 | ||||||
| Total liabilities and shareholders’ equity | $ | 8,420.2 | $ | 7,414.9 | |||
| Commitments and contingencies(Notes 23 and 24) | |||||||
| See accompanying notes. | |||||||
| On behalf of the board: | |||||||

C O N S O L I D A T E D F I N A N C I A L S T A T E M E N T S 61
TA2003ARFeb28 3/3/04 11:36 AM Page 62
C O N S O L I D A T E D S T A T E M E N T S O F C A S H F L O W S
| Y E A R S E N D E D D E C . 3 1 | 2003 | 2002 | 2001 | ||||||
| ( I N M I L L I O N S O F C A N A D I A N D O L L A R S ) | (Restated, Note 1) | (Restated, Note 1) | |||||||
| Operating activities | |||||||||
| Net earnings | $ | 257.2 | $ | 220.5 | $ | 241.9 | |||
| Depreciation and amortization(Note 2) | 378.1 | 276.8 | 276.1 | ||||||
| Loss (gain) on sale of assets | (202.0) | 15.6 | (5.4) | ||||||
| Asset impairment charge | 90.3 | 152.5 | 66.5 | ||||||
| Non-controlling interests | 34.2 | 20.1 | 20.6 | ||||||
| Future income taxes(Note 18) | 27.4 | (54.4) | 50.4 | ||||||
| Site restoration costs incurred | (26.5) | (14.5) | (14.9) | ||||||
| Site restoration accretion | 22.0 | 18.7 | 17.6 | ||||||
| Unrealized loss (gain) from energy marketing activities | (18.6) | 31.7 | (6.3) | ||||||
| Dilution gain on sale of TransAlta Power units | (15.2) | – | – | ||||||
| Write-down of investments(Note 5) | 6.2 | – | – | ||||||
| Foreign exchange loss (gain) | 4.7 | (1.2) | – | ||||||
| Gain on sale of discontinued operations | – | (120.0) | – | ||||||
| Other non-cash items | 3.2 | (15.2) | 27.1 | ||||||
| 561.0 | 530.6 | 673.6 | |||||||
| Change in non-cash operating working capital balances | 195.5 | (92.9) | 42.0 | ||||||
| Cash flow from operating activities | 756.5 | 437.7 | 715.6 | ||||||
| Investing activities | |||||||||
| Additions to property, plant and equipment | (555.7) | (945.8) | (1,246.5) | ||||||
| Acquisitions(Note 4) | (323.4) | (40.1) | (9.8) | ||||||
| Proceeds on the sale of property, plant and equipment | |||||||||
| to TransAlta Cogeneration, L.P.(Note 4) | 149.9 | – | 35.0 | ||||||
| Proceeds on sale of property, plant and equipment(Note 4) | 76.8 | 2.3 | 104.6 | ||||||
| Restricted cash(Note 4) | 46.7 | – | – | ||||||
| Proceeds on sale of TransAlta Power partnership units(Note 4) | 37.2 | – | – | ||||||
| Proceeds on sale of long-term investments(Note 5) | 21.6 | – | – | ||||||
| Deferred charges and other | 11.8 | (29.8) | (10.9) | ||||||
| Proceeds on sale of discontinued operations(Note 3) | – | 818.0 | 97.0 | ||||||
| Long-term receivables | – | 165.3 | (46.3) | ||||||
| Investments | – | (6.1) | – | ||||||
| Cash flow used in investing activities | (535.1) | (36.2) | (1,076.9) | ||||||
| Financing activities | |||||||||
| Repayment of long-term debt | (601.1) | (454.5) | (292.7) | ||||||
| Issuance of long-term debt | 544.6 | 611.3 | 789.9 | ||||||
| Net proceeds on issuance of common shares(Note 15) | 265.0 | 1.8 | 14.1 | ||||||
| Net increase (decrease) in short-term debt | (170.2) | (247.1) | 61.9 | ||||||
| Dividends on common shares | (158.3) | (115.5) | (149.6) | ||||||
| Distributions on preferred securities | (35.5) | (34.9) | (23.4) | ||||||
| Deferred financing charges and other | (6.6) | (7.6) | 0.2 | ||||||
| Distributions to subsidiary’s non-controlling limited partner | (38.9) | (24.5) | (26.3) | ||||||
| Redemption of preferred shares of a subsidiary(Note 13) | – | – | (122.1) | ||||||
| Redemption of common shares | – | (49.9) | (44.4) | ||||||
| Net proceeds on issuance of preferred securities | – | – | 169.4 | ||||||
| Dividends to subsidiary’s non-controlling preferred shareholders | – | – | (8.3) | ||||||
| Cash flow from (used in) financing activities | (201.0) | (320.9) | 368.7 | ||||||
| Cash flow from operating, investing and financing activities | 20.4 | 80.6 | 7.4 | ||||||
| Effect of translation on foreign currency cash | (8.7) | 0.7 | 0.8 | ||||||
| Increase in cash and cash equivalents | 11.7 | 81.3 | 8.2 | ||||||
| Cash and cash equivalents, beginning of year | 143.3 | 62.0 | 53.8 | ||||||
| Cash and cash equivalents, end of year | $ | 155.0 | $ | 143.3 | $ | 62.0 | |||
| Cash taxes paid | $ | 34.1 | $ | 123.1 | $ | 41.5 | |||
| Cash interest paid | $ | 232.8 | $ | 210.8 | $ | 163.1 | |||
| See accompanying notes. | |||||||||
62 T R A N S A L T A C O R P O R A T I O N A R / 0 3
TA2003ARFeb28 3/3/04 11:36 AM Page 63
N O T E S T O C O N S O L I D A T E D F I N A N C I A L S T A T E M E N T S
( T A B U L A R D O L L A R A M O U N T S I N M I L L I O N S O F C A N A D I A N D O L L A R S , E X C E P T A S
O T H E R W I S E N O T E D )
1. S U M M A RY O F S I G N I F I C A N T A C C O U N T I N G P O L I C I E S
A. Consolidation
These consolidated financial statements have been prepared by management in accordance with Canadian generally accepted accounting principles (Canadian GAAP). These accounting principles are different in some respects from United States generally accepted accounting principles (U.S. GAAP). The significant differences are described inNote 27.
The consolidated financial statements include the accounts of TransAlta Corporation (TransAlta or the corporation), all subsidiaries and the proportionate share of the accounts of jointly controlled corporations.
B. Measurement Uncertainty
The preparation of financial statements in accordance with GAAP requires management to make estimates and assumptions that affect the reported amounts of assets and liabilities and disclosures of contingent assets and liabilities at the date of the financial statements and the reported amounts of revenues and expenses during the period. Actual results could differ from those estimates due to factors such as fluctuations in interest rates, currency exchange rates, inflation levels and commodity prices, changes in economic conditions and legislative and regulatory changes(Notes 3, 19, 20 and 24).
C. Regulation
Commencing Jan. 1, 2001, all Alberta generating plants were deregulated and became subject to long-term power purchase arrangements (PPAs) for the remaining estimated life of each plant. The PPAs set a production requirement and availability target to be supplied by each plant or unit and the price at which each megawatt-hour (MWh) will be supplied to the customer. As the criteria for regulatory accounting were no longer met, Canadian GAAP for non-regulated businesses commenced on Dec. 31, 2000, in respect of the Alberta Generation operations. The discontinued Transmission operation followed regulatory accounting.
D. Revenue Recognition
The majority of the corporation’s revenues are derived from the sale of physical power and from energy marketing and trading activities. Revenues under long-term electricity and thermal sales contracts generally include one or more of the following components: fixed capacity payments for being available, energy payments for generation of electricity, availability incentives or penalties for exceeding or not meeting availability targets, excess energy payments for power generation above committed capacity and ancillary services. Each is recognized upon output, delivery, or satisfaction of specific targets, all as specified by contractual terms. Revenues from non-contracted capacity are comprised of energy payments for each MWh produced at market prices, and are recognized upon delivery.
Derivatives used in trading activities include physical and financial swaps, forward sales contracts, futures contracts and options, which are used to earn trading revenues and to gain market information. These derivatives are accounted for using the fair value method of accounting. Derivatives, other than real-time physical contracts, are presented on a net basis in the statements of earnings. The initial recognition of fair value and subsequent changes in fair value affect reported earnings in the period the change occurs. The fair values of those instruments that remain open at the balance sheet date represent unrealized gains or losses and are presented on the balance sheets as price risk management assets and liabilities. Non-derivative contracts are accounted for using the accrual method.
To be consistent with the U.S. Financial Accounting Standards Board (FASB) Emerging Issues Task Force (EITF) pronouncement 03-11,Reporting Realized Gains and Losses on Derivative Instruments That Are Subject to FASB Statement 133, Accounting for Derivative Instruments and Hedging Activities, and Not Held for Trading Purposes,TransAlta has concluded that real-time physical contracts meet the definition of derivative contracts held for delivery and therefore realized gains and losses are reported gross in the consolidated statements of earnings.
The majority of the corporation’s derivatives have quoted market prices or over-the-counter quotes are available from brokers. However, some derivatives are not traded on an active exchange or extend beyond the time period for which exchange-based quotes are available, requiring the use of internal valuation techniques or models (mark-to-model accounting).
E. Discontinued Operations
The results of discontinued operations are presented on a one-line basis in the consolidated statements of earnings. Interest expense, direct corporate overheads and income taxes are allocated to discontinued operations. General corporate overheads are not allocated to discontinued operations.
F. Inventory
The corporation’s inventory balance represents fuel which is valued at the lower of cost and market value, defined as net replacement value.
C O N S O L I D A T E D F I N A N C I A L S T A T E M E N T S 63
TA2003ARFeb28 3/3/04 11:36 AM Page 64
G. Property, Plant and Equipment
The corporation’s investment in property, plant and equipment (PP&E) is stated at original cost at the time of construction, purchase or acquisition. Original cost includes items such as materials, labour, interest and other appropriately allocated costs. As costs are expended for new construction, the entire amount is capitalized as PP&E on the consolidated balance sheet and is subject to depreciation upon commencement of commercial operations. The cost of routine maintenance and repairs, such as inspections and corrosion removal, and the replacement of minor parts, are charged to expense as incurred. Certain expenditures relating to replacement of components incurred during major maintenance are capitalized and amortized over the estimated benefit period of such expenditures. A component is a tangible portion of the asset that can be separately identified as an asset and depreciated over its own expected useful life, and is expected to provide a benefit of g reater than one year.
The estimate of the useful life of PP&E is based on current facts and past experience, and takes into consideration existing long-term sales agreements and contracts, current and forecasted demand and the potential for technological obsolescence. The useful life is used to estimate the rate at which the PP&E is amortized. These estimates are subject to revision in future periods based on new or additional information.
TransAlta capitalizes interest on capital invested in projects under construction. Upon commencement of commercial operations, capitalized interest, as a portion of the total cost of the plant, is amortized over the estimated useful life of the plant.
The corporation determines those debt instruments that best represent a reasonable measure of the cost of financing the assets under construction. These debt instruments and associated interest costs are included in the calculation of the weighted average interest rate used for capitalizing interest.
On an annual basis, and when indicators of impairment exist, TransAlta determines whether the net carrying amount of PP&E is recoverable from future undiscounted cash flows. Factors, which could indicate an impairment exists, include significant underperformance relative to historical or projected future operating results, significant changes in the manner or use of the assets, significant negative industry or economic trends, or a change in the strategy for the corporation’s overall business. In some cases, these events are clear. However, in many cases, a clearly identifiable event indicating possible impairment does not occur. Instead, a series of individually insignificant events occur over a period of time leading to an indication that an asset may be impaired. This can be further complicated where TransAlta is not the operator of the project. Events can occur in these situations that may not be known until a date subsequent to their occurrence.
The corporation’s businesses, the markets and business environment are continually monitored, and judgments and assessments are made to determine whether an event has occurred that indicates possible impairment. If such an event has occurred, an estimate is made of future undiscounted cash flows from the PP&E. If the total of the undiscounted future cash flows, excluding financing charges with the exception of plants that have specifically dedicated debt, is less than the carrying amount of the PP&E, an asset impairment must be recognized in the financial statements. The amount of the impairment charge to be recognized is calculated by subtracting the fair value of the asset from the carrying value of the asset. Fair value is the amount at which an item could be bought or sold in a current transaction between willing parties, and is estimated by calculating the present value of expected future cash flows related to the asset.
H. Goodwill
Goodwill is the cost of an acquisition less the fair value of the net assets of an acquired business. Prior to Jan. 1, 2002, TransAlta amortized goodwill on a straight-line basis over the useful life of the acquired assets. Effective Jan. 1, 2002, the corporation prospectively adopted the new Canadian Institute of Chartered Accountants (CICA) standard for goodwill and other intangibles. The new standard requires business combinations initiated after June 30, 2001 to be accounted for using the purchase method of accounting. It also specifies that goodwill and certain intangibles are no longer subject to amortization, but are instead tested for impairment at least annually, or more frequently if an analysis of events and circumstances indicate that a possible impairment may arise earlier. These events could include a significant change in financial position of the reporting unit to which the goodwill relates or significant negative industry or economic trends.
64 T R A N S A L T A C O R P O R A T I O N A R / 0 3

C O N S O L I D A T E D F I N A N C I A L S T A T E M E N T S 65
TA2003ARFeb28 3/3/04 11:36 AM Page 66
A reconciliation between the opening and closing asset retirement obligation balances is provided below:
| Balance, Jan. 1, 2002 | $ | 232.2 | |
| Liabilities incurred in period | 28.5 | ||
| Liabilities settled in period | (14.5) | ||
| Accretion expense | 18.7 | ||
| Balance, Dec. 31, 2002 | $ | 264.9 | |
| Liabilities incurred in period | 9.3 | ||
| Liabilities settled in period | (26.5) | ||
| Accretion expense | 22.0 | ||
| Acquisition of CE Gen | 5.2 | ||
| Change in foreign exchange rates | (16.7) | ||
| Balance, Dec. 31, 2003 | $ | 258.2 | |
TransAlta estimates the undiscounted amount of cash flow required to settle the asset retirement obligations is approximately $1.5 billion, which will be incurred between 2007 and 2082. The majority of the costs will be incurred between 2030 and 2035. A discount rate of eight per cent was used to calculate the carrying value of the asset retirement obligations. At Dec. 31, 2003, the corporation had a surety bond in the amount of US$156.7 million in support of future retirement obligations at the Centralia mine.
K. Investments
Investments in shares of companies over which the corporation exercises significant influence are accounted for using the equity method. Other investments are carried at cost. If there is other than a temporary decline in the value of the investment, it is written down to net realizable value.
L. Other Assets
Deferred license fees and deferred contract costs are amortized on a straight-line basis over the useful life of the related assets or long-term contracts.
Financing costs for the issuance of long-term debt, preferred shares and preferred securities are amortized to earnings on a straight-line basis over the term of the related issue.
Other costs capitalized on the balance sheet include business development costs, which includes external, direct and incremental costs which are necessary for completion of a potential acquisition or construction project. Business development costs are included in operating expenses until construction of a plant or acquisition of an investment is likely to occur, there is reason to believe that future costs are recoverable and that efforts will result in future value to the corporation, at which time the future costs are included in PP&E or investments. The appropriateness of the carrying value of these costs is evaluated each reporting period, and unrecoverable amounts of capitalized costs for projects no longer probable of occurring are charged to expense in the current period.
M. Income Taxes
The corporation uses the liability method of accounting for income taxes for its operations. Under the liability method, income taxes are recognized for the differences between financial statement carrying values and the respective income tax basis of assets and liabilities (temporary differences), the carry forward of unused tax losses and income tax reductions. Future income tax assets and liabilities are measured using income tax rates expected to apply in the years in which temporary differences are expected to be recovered or settled. The effect on future income tax assets and liabilities of a change in tax rates is included in income in the period the change is substantively enacted. Future income tax assets are evaluated and if realization is not considered ‘more likely than not’, a valuation allowance is provided.
N. Employee Future Benefits
The corporation accrues its obligations under employee benefit plans and the related costs, net of plan assets. The cost of pensions and other post-employment and post-retirement benefits earned by employees is actuarially determined using the projected benefit method pro-rated on services and management’s best estimate of expected plan investment performance, salary escalation, retirement ages of employees and expected health care costs. For the purpose of calculating the expected return on plan assets, those assets are valued at quoted market value. The discount rate used to calculate the interest cost on the accrued benefit obligation is the long-term market rate at the balance sheet date. Past service costs from plan amendments are amortized on a straight-line basis over the average remaining service period of employees active at the date of amendment (EARSL). The excess of the net cumulative unamortized actuarial gain or loss over 10 per cent of the greater of th e accrued benefit obligation and the market value of plan assets is amortized over the average remaining service period of the active employees.
66 T R A N S A L T A C O R P O R A T I O N A R / 0 3
TA2003ARFeb28 3/3/04 11:36 AM Page 68
specific firm commitments or anticipated transactions. The corporation also formally assesses, both at the hedge’s inception and on an ongoing basis, whether the derivatives used are highly effective in offsetting changes in fair values or cash flows of hedged items. Hedge effectiveness of cash flows is achieved if the derivatives’ cash flows substantially offset the cash flows of the hedged item and the timing of the cash flows is similar. Hedge effectiveness of fair values is achieved if changes in the fair value of the derivative substantially offset changes in the fair value of the item hedged. In a highly effective hedging relationship, U.S. GAAP requires any hedge ineffectiveness to be recognized in earnings in the current period. If the above hedge criteria are not met, the derivative is accounted for on the balance sheet at fair value, with the initial fair value and subsequent changes in fair value recorded in earnings in the period of change.
If a derivative that has been accorded hedge accounting matures, expires, is sold, terminated or cancelled, and is not replaced as part of the corporation’s hedging strategy, the termination gain or loss is deferred and recognized when the gain or loss on the item hedged is recognized. If a designated hedged item matures, expires, is sold, extinguished or terminated, and the hedged item is no longer probable of occurring, any previously deferred amounts associated with the hedging item are recognized in current earnings along with the corresponding gains or losses recognized on the hedged item. If a hedging relationship is terminated or ceases to be effective, hedge accounting is not applied to subsequent gains or losses. Any previously deferred amounts are carried forward and recognized in earnings in the same period as the hedged item.
Q. Stock-based Compensation Plans
The corporation has three types of stock-based compensation plans comprised of two stock option-based plans, and a Performance Share Ownership Plan (PSOP), described inNote 16. On Jan. 1, 2002, the corporation retroactively adopted the new CICA standard for stock-based compensation. The new standard requires that stock-based payments to non-employees, direct awards of stock and awards that call for settlement in cash or other assets be accounted for using the fair value method of accounting. The fair value method is encouraged for other stock-based compensation plans, but other methods of accounting, such as the intrinsic value method, are permitted. Under the fair value method, compensation expense is measured at the grant date and recognized over the service period. Under the intrinsic value method, compensation expense is determined as the difference between the market price of the underlying stock and the exe rcise price of the equity instrument granted. If the intrinsic value method is used, disclosure is made of earnings and per share amounts as if the fair value method had been used. Effective Jan. 1, 2003, the corporation elected to prospectively use the fair value method of accounting for stock-based compensation and its performance stock option plan. No awards were granted in 2003.Note 16provides pro forma measures of net earnings and earnings per share had compensation expense been recognized for awards granted prior to 2003 based on the estimated fair value of the options on the grant date in accordance with the fair value method of accounting for stock-based compensation.
Stock grants under PSOP are accrued in corporate operations, maintenance and administration expense as earned to the balance sheet date, based upon the percentile ranking of the total shareholder return of the corporation’s common shares in comparison to the total shareholder returns of a selected group of publicly traded companies. Compensation expense under the phantom stock option plan is recognized in operations, maintenance and administration expense for the amount by which the quoted market price of TransAlta’s shares exceed the option price, and adjusted for changes in each period for changes in the excess over the option price. If stock options or stock are repurchased from employees, the excess of the consideration paid over the carrying amount of the stock option or stock cancelled is charged to retained earnings.
R. Changes in Accounting Standards
The CICA established a new standard for asset retirement obligations, effective Jan. 1, 2004, with earlier adoption encouraged. TransAlta early adopted this standard on Jan. 1, 2003 and the impact of adoption is described inNote 1 (J).
The CICA established a new standard on the disposal of long-lived assets and discontinued operations. This standard became effective May 1, 2003, however TransAlta early adopted the standard on Jan. 1, 2003 with retroactive restatement. The standard requires that a long-lived asset to be disposed of other than by sale shall continue to be classified as held and used until it is disposed of. Certain criteria must be met before a long-lived asset can be classified as held for sale. The standard also defines discontinued operations more broadly than previously and prohibits the inclusion of future operating losses in a loss recognized upon classification of a long-lived asset as held for sale. The impact of adopting this standard was not material to the consolidated financial statements.
In the fourth quarter of 2003, in response to changes in accounting standards in the U.S. with respect to derivative instruments not held for trading, the corporation adopted a policy that all gains and losses on real-time physical trading contracts be shown gross in the statements of earnings. Prior period amounts have been restated.
The CICA has amended the standard on the presentation of liabilities and equity effective for years ending on or after Nov. 1, 2004. The standard addresses the situation in which an entity has a contractual obligation of a fixed amount or an amount that fluctuates in part or in full in response to changes in a variable other than the market price of the entity’s own equity instruments, but
68 T R A N S A L T A C O R P O R A T I O N A R / 0 3
TA2003ARFeb28 3/3/04 11:36 AM Page 70
| Energy | ||||||||||||
| Year ended Dec. 31, 2002 | Generation | Marketing | Corporate | Total | ||||||||
| Revenues | $ | 1,674.9 | $ | 140.0 | $ | – | $ | 1,814.9 | ||||
| Fuel and purchased power | (664.6) | – | – | (664.6) | ||||||||
| Trading purchases | – | (91.0) | – | (91.0) | ||||||||
| Gross margin | 1,010.3 | 49.0 | – | 1,059.3 | ||||||||
| Operations, maintenance and administration | 346.7 | 15.1 | 58.7 | 420.5 | ||||||||
| Depreciation and amortization | 220.3 | 2.5 | 20.2 | 243.0 | ||||||||
| Asset impairment and equipment cancellation charges | 152.5 | – | – | 152.5 | ||||||||
| Taxes, other than income taxes | 27.3 | 0.1 | – | 27.4 | ||||||||
| Prior period regulatory decisions | 3.3 | – | – | 3.3 | ||||||||
| Operating income before corporate allocations | 260.2 | 31.3 | (78.9) | 212.6 | ||||||||
| Corporate allocations | (70.6) | (8.3) | 78.9 | – | ||||||||
| Operating income | $ | 189.6 | $ | 23.0 | $ | – | 212.6 | |||||
| Other income | 0.1 | |||||||||||
| Foreign exchange gain | 1.2 | |||||||||||
| Net interest expense | (82.7) | |||||||||||
| Earnings from continuing operations before income taxes | ||||||||||||
| and non-controlling interests | $ | 131.2 | ||||||||||
| Energy | ||||||||||||
| Year ended Dec. 31, 2001 | Generation | Marketing | Corporate | Total | ||||||||
| Revenues | $ | 2,158.4 | $ | 401.1 | $ | – | $ | 2,559.5 | ||||
| Fuel and purchased power | (1,187.1) | – | – | (1,187.1) | ||||||||
| Trading purchases | – | (240.1) | – | (240.1) | ||||||||
| Gross margin | 971.3 | 161.0 | – | 1,132.3 | ||||||||
| Operations, maintenance and administration | 290.6 | 36.2 | 65.4 | 392.2 | ||||||||
| Depreciation and amortization | 178.1 | 11.0 | 23.7 | 212.8 | ||||||||
| Asset impairment and equipment cancellation charges | 118.8 | – | – | 118.8 | ||||||||
| Taxes, other than income taxes | 18.7 | – | – | 18.7 | ||||||||
| Prior period regulatory decisions | (11.0) | – | – | (11.0) | ||||||||
| Operating income before corporate allocations | 376.1 | 113.8 | (89.1) | 400.8 | ||||||||
| Corporate allocations | (82.5) | (6.6) | 89.1 | – | ||||||||
| Operating income | $ | 293.6 | $ | 107.2 | $ | – | 400.8 | |||||
| Other income | 1.5 | |||||||||||
| Foreign exchange gain | 0.8 | |||||||||||
| Net interest expense | (88.1) | |||||||||||
| Earnings from continuing operations before income taxes | ||||||||||||
| and non-controlling interests | $ | 315.0 | ||||||||||
| II. Selected Balance Sheet Information | ||||||||||||
Energy | ||||||||||||
| Dec. 31, 2003 | Generation | Marketing | Corporate | Total | ||||||||
| Goodwill | $ | 120.3 | $ | 29.3 | $ | – | $ | 149.6 | ||||
| Total segment assets | $ | 7,598.8 | $ | 267.1 | $ | 554.3 | $ | 8,420.2 | ||||
| Dec. 31, 2002 | ||||||||||||
| Goodwill | $ | 27.2 | $ | 29.3 | $ | – | $ | 56.5 | ||||
| Total segment assets | $ | 6,348.7 | $ | 344.6 | $ | 721.6 | $ | 7,414.9 | ||||
70 T R A N S A L T A C O R P O R A T I O N A R / 0 3
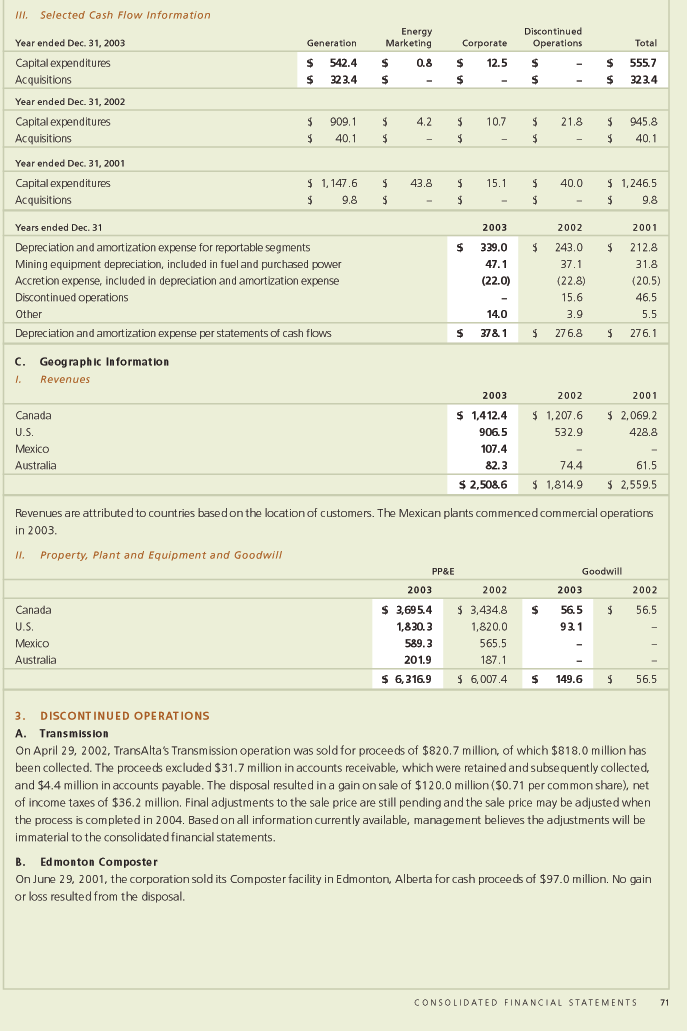
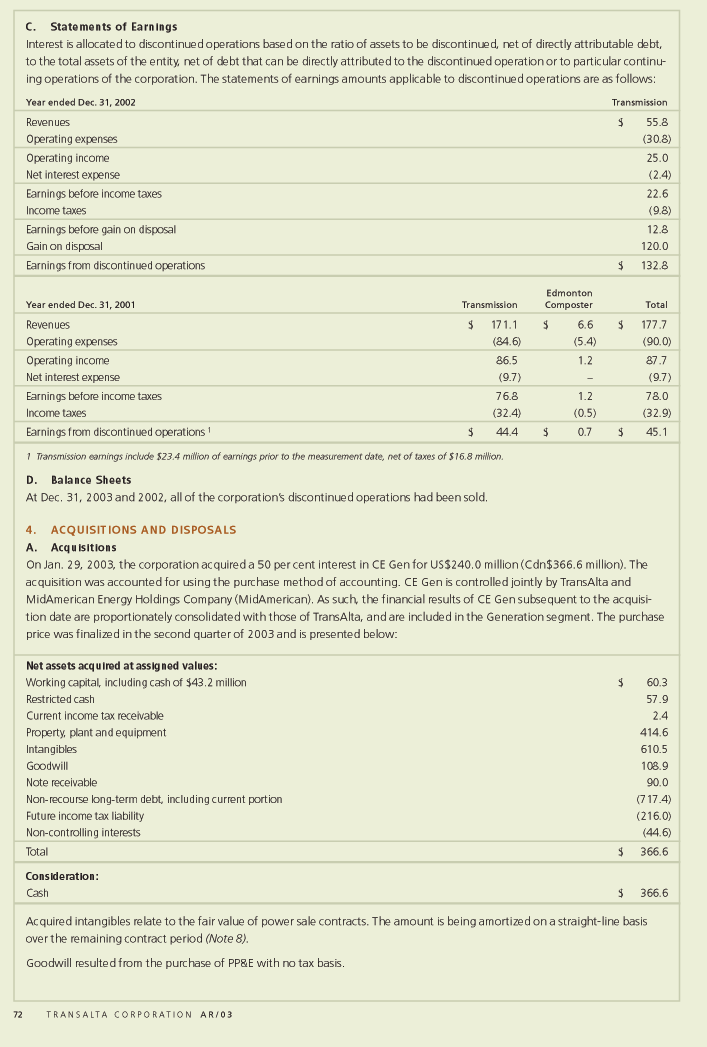
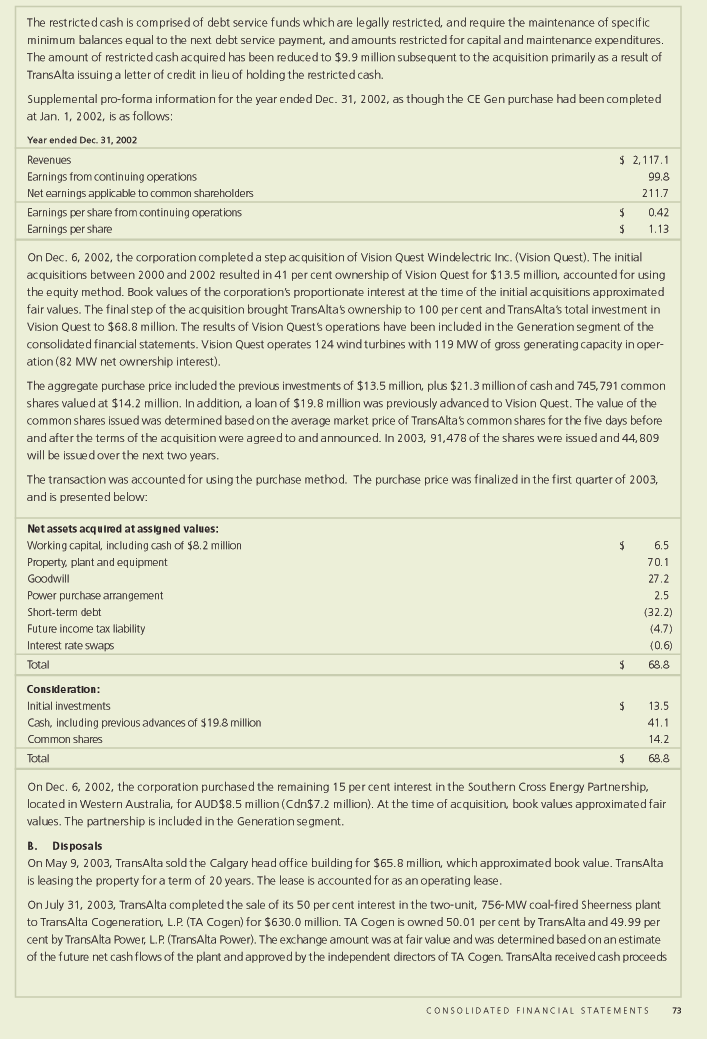
TA2003ARFeb28 3/3/04 11:36 AM Page 74
of $149.9 million, $315.0 million in TA Cogen units and $165.1 million in TransAlta Power units. As part of the financing and concurrent with the sale, TransAlta Power issued 17.75 million partnership units and 17.75 million warrants to the public for gross proceeds of $165.1 million, and 17.75 million partnership units to TransAlta for gross proceeds of $165.1 million. As a result of the unit issuance, TransAlta’s ownership interest in TransAlta Power on July 31, 2003 was approximately 26 per cent. The warrants, when exercised, are exchangeable for one TransAlta Power unit at any time until Aug. 3, 2004. As the warrants are exercised, TransAlta will sell TransAlta Power units back to TransAlta Power for $9.30 per unit, reducing its ownership interest in TransAlta Power to its original 0.01 per cent and increasing cash proceeds by a further $165.1 million assuming all the warrants are exercised. As a result of the exercising of warrants and the subsequent sale of Tran sAlta Power units back to TransAlta Power, TransAlta’s ownership interest in TransAlta Power was approximately 19 per cent at Dec. 31, 2003.
As a result of the sale, in the third quarter of 2003, TransAlta realized a gain on sale of $191.5 million, which included the realization of the 1998 deferred gain of $119.8 million previously included in deferred credits and other long-term liabilities(Note 12). In the fourth quarter TransAlta recognized $15.2 million of dilution gains on the exercise of warrants. TransAlta expects to recognize approximately $53 million of further gains on the assumption that the warrants are fully exercised and TransAlta’s effective interest in TransAlta Power is reduced to its original 0.01 per cent.
On Dec. 31, 2003, TransAlta completed the sale of 539 acres of undeveloped land at Seebe, Alberta for $11.0 million. The corporation recognized a pre-tax gain on sale of $10.5 million.
In January 2001, the corporation sold its 265-MW Mildred Lake plant to Syncrude’s joint venture owners for cash proceeds of $60.3 million plus a receivable in the amount of $4.7 million, which approximated its book value.
In August 2001, the corporation sold its 45-MW Fort Nelson gas-fired facility for cash proceeds of $44.1 million. The gain on disposition was $1.3 million after-tax.
In September 2001, the corporation sold its 60 per cent interest in the Fort Saskatchewan cogeneration facility to TA Cogen. Total cash consideration to the corporation was $35.0 million in respect of the 30 per cent interest effectively sold to the minority interest in TA Cogen. The corporation recorded a pre-tax gain of $6.2 million. The effective book value of the assets transferred to TA Cogen was $57.6 million, with $28.8 million representing TransAlta Power’s 49.99 per cent interest in the assets.
| 5 . | I N V E S T M E N T S | ||||||
| 2 0 0 3 | 2 0 0 2 | ||||||
| Investment in distributed generation companies | $ | 5.0 | $ | 10.3 | |||
| Investment in Australian gas transmission pipeline | – | 21.2 | |||||
| Other | – | 0.7 | |||||
| $ | 5.0 | $ | 32.2 | ||||
In 2003, the corporation performed its annual review on its long-term investments. As a result of this review, the corporation recorded a $6.2 million charge to recognize an other than temporary decline in the fair value. The charge is included in corporate operations, maintenance and administration expenses.
Also in 2003, the corporation sold its 8.82 per cent interest in the Goldfields gas pipeline for proceeds of AUD$24.1 million (Cdn$21.6 million), which approximated book value.
| 6 . L O N G- T E R M R E C E I VA B L E S | |||||||
| 2 0 0 3 | 2 0 0 2 | ||||||
| Note receivable | $ | 78.6 | $ | – | |||
| California receivables | 32.2 | 37.6 | |||||
| Other | 9.3 | 2.3 | |||||
| Sulphur tax abatement | – | 60.9 | |||||
| 120.1 | 100.8 | ||||||
| Less current portion included in accounts receivable | – | 60.9 | |||||
| $ | 120.1 | $ | 39.9 | ||||
The note receivable represent amounts advanced to MidAmerican affiliates by CE Gen. The purpose of the loans were to fund refinancing of certain indebtedness, fund construction, and other general purposes, the funding flowing through CE Gen. SeeNote 26for further discussion.
74 T R A N S A L T A C O R P O R A T I O N A R / 0 3
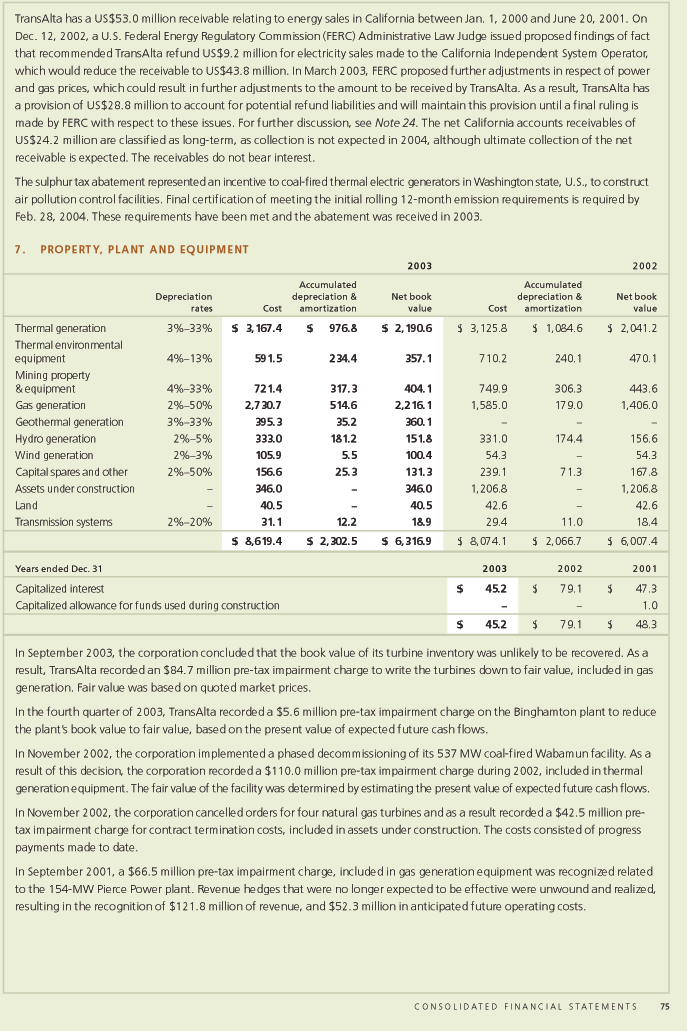
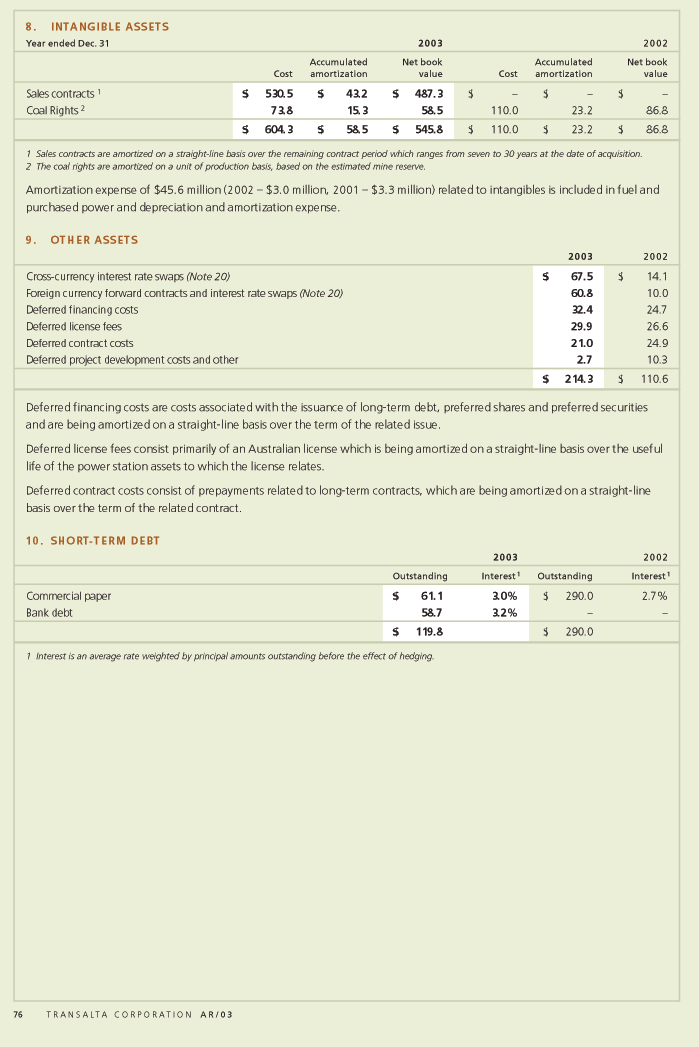
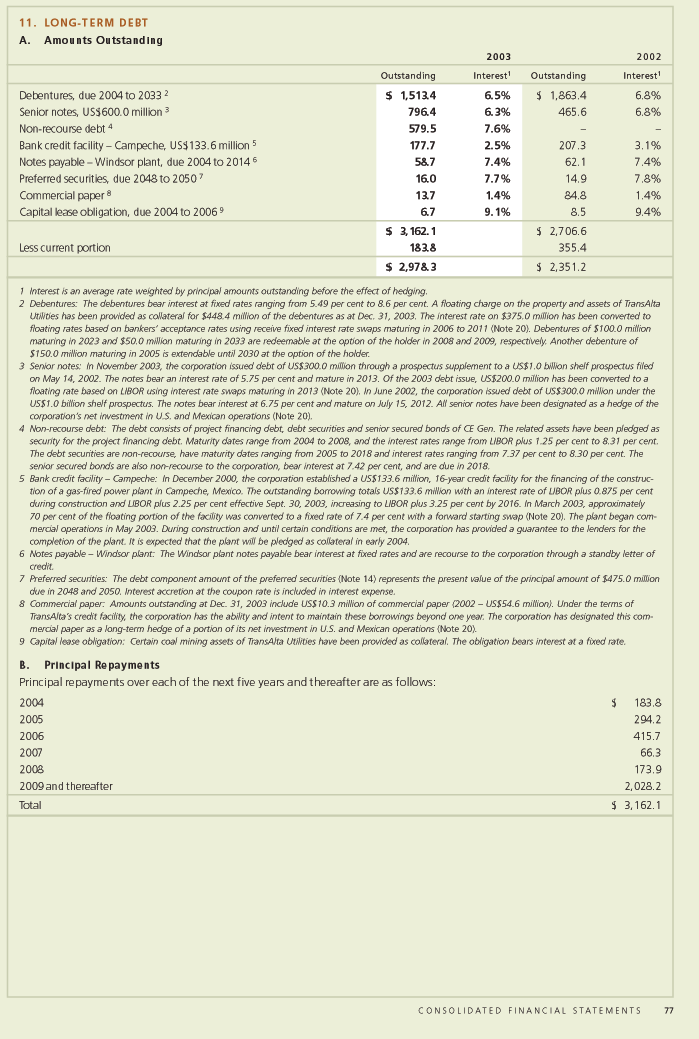
TA2003ARFeb28 3/3/04 11:36 AM Page 78
C. Interest Expense
Interest expense on long-term debt was $216.2 million (2002 – $161.9 million; 2001 – $150.3 million), all of which relates to continuing operations (2002 – $159.5 million; 2001 – $140.6 million).
D. Guarantees
In the normal course of operations, TransAlta and certain of its subsidiaries enter into agreements to provide financial or performance assurances to third parties. This includes guarantees, letters of credit and surety bonds which are entered into to support or enhance creditworthiness in order to facilitate the extension of sufficient credit for Energy Marketing trading activities, treasury hedging, Generation construction projects, equipment purchases and mine reclamation obligations.
At Dec. 31, 2003, the corporation had letters of credit outstanding of $198.5 million, US$187.8 million, 222.8 million Danish kroner and 172.3 million Mexican pesos. The letters of credit were issued to counterparties that have credit exposure to certain subsidiaries. If a subsidiary does not pay amounts due under the covered contract, the counterparty may present its claim for payment to the financial institution, which in turn will request payment from the corporation. Any amounts owed by the corporation’s subsidiaries are reflected in the consolidated balance sheet. All letters of credit expire in 2004.
The corporation had a surety bond in the amount of US$156.7 million in support of asset retirement obligations at the Centralia mine outstanding at Dec. 31, 2003. Asset retirement obligations are included in deferred credits and other long-term liabilities(Note 12). The surety bond expires in 2004.
TransAlta has guaranteed payments for its subsidiaries involved in hedging and trading activities. These guarantees are provided to counterparties in order to facilitate physical and financial transactions in various derivatives. To the extent liabilities exist for trading activities, they are included in the consolidated balance sheet. To the extent liabilities exist for hedging activities, they are disclosed inNote 20.The limit under these guarantees at Dec. 31, 2003 for trading and hedging activities was $1.8 billion. In addition, the corporation has a number of unlimited guarantees. The exposure at Dec. 31, 2003 under both limited and unlimited guarantees was approximately $381.3 million. Including contracts that were not guaranteed but facilitate hedging and trading activities, TransAlta’s maximum collateral requirements would have been $409.6 million at Dec. 31, 2003. Collateral available was approxim ately $1 billion.
TransAlta has also provided guarantees to counterparties for obligations of various subsidiaries for performance and payment of obligations. In the event of the subsidiaries’ inability to meet the obligations, TransAlta would be obligated to make such payments. To the extent obligations exist under these guarantees at Dec. 31, 2003, they are included in accounts payable and accrued liabilities. The limit under these guarantees at Dec. 31, 2003 was $828.6 million.
During construction and until certain conditions are met, the corporation has provided a guarantee to the lenders for the completion of the Campeche plant. The Campeche plant was completed in May 2003, and it is expected that the plant will be pledged as collateral in early 2004. At that time, the guarantee will be removed and the US$133.6 million of debt related to the plant will become non-recourse to the corporation.
At Dec. 31, 2003, CE Gen and its subsidiaries had US$39.7 million of letters of credit outstanding to provide financial or performance assurances to third parties. TransAlta has issued a letter of credit of US$32.7 million on behalf of CE Gen, which expires on May 30, 2004, and this amount is included in TransAlta’s total guarantees outstanding.
| 1 2 . D E F E R R E D C R E D I T S A N D O T H E R L O N G- T E R M L I A B I L I T I E S | ||||||||
| 2003 | 2002 | |||||||
| Asset retirement obligation(Note 1) | $ | 258.2 | $ | 264.9 | ||||
| Deferred revenues and other | 43.8 | 20.2 | ||||||
| Power purchase arrangement in limited partnership | 29.9 | – | ||||||
| Cross-currency interest rate swaps(Note 20) | 13.3 | 34.3 | ||||||
| Fair value of swap transaction with limited partnership(Note 22) | 7.9 | 9.7 | ||||||
| Foreign currency forward contracts | 6.2 | – | ||||||
| Unamortized gain on sale of assets in limited partnership | – | 123.7 | ||||||
| $ | 359.3 | $ | 452.8 | |||||
78 T R A N S A L T A C O R P O R A T I O N A R / 0 3
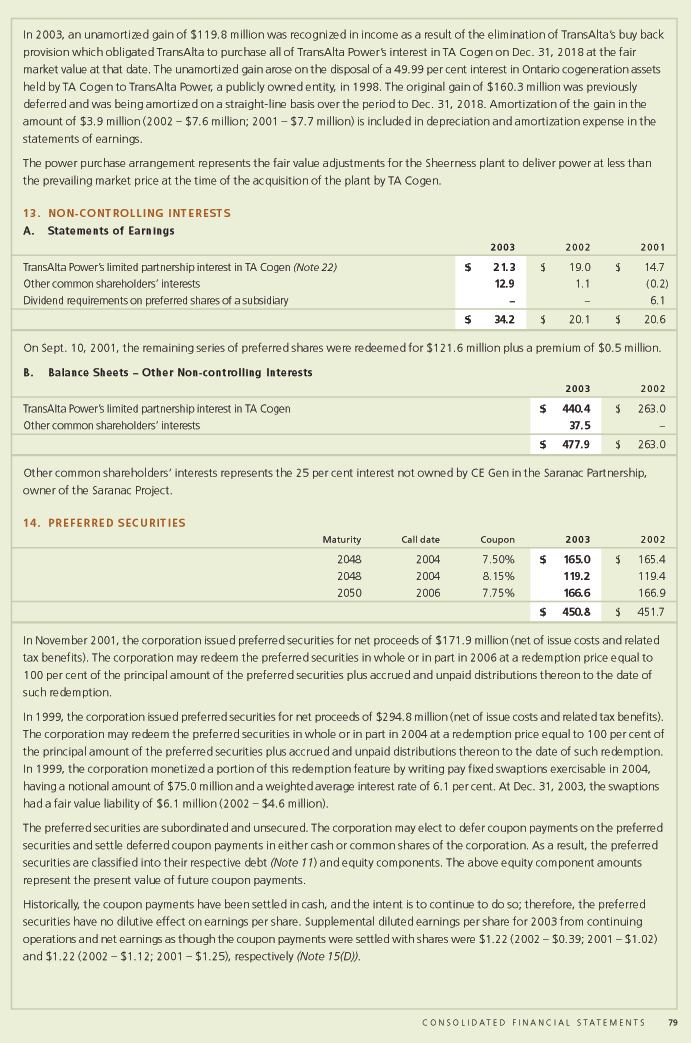
TA2003ARFeb28 3/3/04 11:36 AM Page 80
| 1 5 . C O M M O N S H A R E S | |||||||||||||||
| A. Issued and Outstanding | |||||||||||||||
| The corporation is authorized to issue an unlimited number of voting common shares without nominal or par value. | |||||||||||||||
| 2 0 0 3 | 2 0 0 2 | 2 0 0 1 | |||||||||||||
| Common | Common | Common | |||||||||||||
| shares | shares | shares | |||||||||||||
| (millions) | Amount | (millions) | Amount | (millions) | Amount | ||||||||||
| Issued and outstanding, beginning of year | 169.8 | $ | 1,226.2 | 168.3 | $ | 1,170.9 | 168.6 | $ | 1,150.3 | ||||||
| Issued as public offering | 17.3 | 270.4 | – | – | – | – | |||||||||
| Issued under dividend reinvestment | |||||||||||||||
| and share purchase plan | 3.3 | 54.6 | 2.7 | 53.4 | 0.9 | 19.1 | |||||||||
| Issued on purchase of Vision Quest | 0.1 | 1.7 | 0.6 | 11.6 | – | – | |||||||||
| Issued for cash under stock option plans | 0.1 | 1.4 | 0.1 | 1.8 | 0.7 | 13.8 | |||||||||
| Issued under Performance | |||||||||||||||
| Share Ownership Plan | 0.1 | 1.4 | 0.1 | 1.9 | 0.1 | 1.8 | |||||||||
| Repurchased by the corporation | – | – | (2.0) | (13.4) | (2.0) | (14.1) | |||||||||
| Issued and outstanding, end of year | 190.7 | $ | 1,555.7 | 169.8 | $ | 1,226.2 | 168.3 | $ | 1,170.9 | ||||||
At Dec. 31, 2003, the corporation had 190.7 million (2002 – 169.8 million; 2001 – 168.3 million) common shares issued and outstanding plus outstanding employee stock options to purchase an additional 3.1 million shares (2002 – 3.2 million; 2001 –2.8 million).
In March 2003, the corporation issued 15.0 million common shares for gross proceeds of $240.0 million, with issue costs of $8.0 million. The offering included an option for the underwriters to purchase a further 2.25 million common shares for $36.0 million. This option was exercised on April 17, 2003 with issue costs of $3.0 million.
In February 2003, TransAlta announced a normal course issuer bid to repurchase up to 3.0 million common shares for cancellation. No shares were repurchased during 2003. In 2002, the corporation purchased for cancellation 2.0 million common shares and in 2001, 2.0 million common shares in the amount of $40.4 million and $48.9 million respectively. The $27.0 million in 2002 and $34.8 million in 2001 in excess of the repurchase price over the average net book value was charged to retained earnings.
B. Shareholder Rights Plan
The primary objective of the shareholder rights plan is to provide the corporation’s Board of Directors sufficient time to explore and develop alternatives for maximizing shareholder value if a takeover bid is made for the corporation and to provide every shareholder with an equal opportunity to participate in such a bid. The plan was originally approved in 1992, and has been revised from time to time for conformity with current practices.
When an acquiring shareholder acquires 20 per cent or more of the outstanding common shares of the corporation and that shareholder does not make a bid for all of the common shares outstanding, each shareholder other than the acquiring shareholder may receive one right for each common share owned. Each right will entitle the holder to acquire an additional $160 worth of common shares for $80.
C. Dividend Reinvestment and Share Purchase Plan
Under the terms of the dividend reinvestment and share purchase plan, participants are able to purchase additional common shares by reinvesting dividends. Common shares will be issued from treasury. In 2003, 3.3 million (2002 – 2.7 million; 2001 –0.9 million) common shares were purchased under this program for $54.6 million (2002 – $53.4 million; 2001 – $19.1 million).
| D. Diluted Earnings Per Share | |||||||||||||||
| 2 0 0 3 | 2 0 0 2 | 2 0 0 1 | |||||||||||||
| Numerator | Denominator | Numerator | Denominator | Numerator | Denominator | ||||||||||
| Basic EPS from continuing operations | $ | 234.2 | 185.3 | $ | 66.8 | 169.6 | $ | 183.7 | 168.9 | ||||||
| Impact of PSOP | – | 0.1 | – | 0.1 | (2.7) | 0.4 | |||||||||
| Diluted EPS from continuing operations | 234.2 | 185.4 | 66.8 | 169.7 | 181.0 | 169.3 | |||||||||
| Impact of preferred securities | |||||||||||||||
| coupon payment | 23.0 | 24.8 | – | – | 13.1 | 21.4 | |||||||||
| Diluted supplemental EPS | |||||||||||||||
| from continuing operations | $ | 257.2 | 210.2 | $ | 66.8 | 169.7 | $ | 194.1 | 190.7 | ||||||
80 T R A N S A L T A C O R P O R A T I O N A R / 0 3
TA2003ARFeb28 3/3/04 11:36 AM Page 82
Options outstanding | Options exercisable | |||||||||||||
| Weighted | ||||||||||||||
| Number | average | Weighted | Number | Weighted | ||||||||||
| outstanding at | remaining | average | exercisable at | average | ||||||||||
| Dec. 31, 2003 | contractual | exercise | Dec. 31, 2003 | exercise | ||||||||||
| Range of exercise prices | (millions) | life (years) | price | (millions) | price | |||||||||
| $ | 13.12 – $18.00 | 0.9 | 6.7 | $ | 13.76 | 0.4 | $ | 13.99 | ||||||
| $ | 18.01 – $23.00 | 1.5 | 7.6 | 20.03 | 0.6 | 19.78 | ||||||||
| $ | 27.70 | 0.5 | 7.3 | 27.70 | 0.3 | 27.70 | ||||||||
| $ | 13.12 – $27.70 | 2.9 | 7.3 | $ | 19.53 | 1.3 | $ | 19.59 | ||||||
| B. | Performance Stock Option Plan | |||||||||||||
In 1999, the corporation expanded enrolment in the share option program to include all Canadian employees of the corporation, excluding the level of director and above, by issuing stock options with an expiry date of 2009 and vesting dependent upon achieving certain earnings per share targets.
| 2 0 0 3 | 2 0 0 2 | 2 0 0 1 | |||||||||||||
Number of share options (millions) | Weighted average exercise price | Number of share options (millions) | Weighted average exercise price | Number of share options (millions) | Weighted average exercise price | ||||||||||
| Outstanding, beginning of year | 0.2 | $ | 22.44 | 0.4 | $ | 22.31 | 0.6 | $ | 21.87 | ||||||
| Granted | – | – | – | – | – | – | |||||||||
| Exercised | – | – | (0.1) | 15.16 | (0.2) | 21.27 | |||||||||
| Cancelled or expired | – | – | (0.1) | 22.99 | – | – | |||||||||
| Outstanding, end of year | 0.2 | $ | 22.44 | 0.2 | $ | 22.44 | 0.4 | $ | 22.31 | ||||||
At Dec. 31, 2003, the corporation had 15,008 options under this plan with an exercise price of $14.15 and a weighted average remaining contractual life of 6.0 years and 210,925 options with an exercise price of $23.05 and a weighted average remaining contractual life of 5.1 years outstanding. At Dec. 31, 2003, all outstanding options had vested.
C. Performance Share Ownership Plan (PSOP)
Under the terms of the PSOP, which commenced in 1997, the corporation was authorized to grant to employees and directors up to an aggregate of 2.0 million common shares. The number of common shares which could be issued under both the PSOP and the share option plans, however, could not exceed 6.0 million common shares. Participants in the PSOP receive awards which, after three years, make them eligible to receive a set number of common shares or cash equivalent up to the maximum of the award amount plus any accrued dividends thereon. The actual number of common shares or cash equivalent a participant may receive is determined by the percentile ranking of the total shareholder return over three years of the corporation’s common shares amongst a selected group of publicly traded companies. Until Dec. 31, 2001, where common shares were awarded, such shares were then held in trust and therefore could not be disposed of for a period of two additional years.
On Dec. 31, 2001, the plan was modified so that after three years, once the PSOP eligibility has been determined, 50 per cent of the shares may be released to the participant, while the remaining 50 per cent will be held in trust for one additional year. In addition, the number of common shares the corporation is authorized to grant under the terms of the PSOP was increased to 4.0 million common shares and the maximum number of common shares which may be issued under both the PSOP and share option plans was increased to 13.0 million common shares.
| 2 0 0 3 | 2 0 0 2 | 2 0 0 1 | ||||
| Number of awards outstanding, beginning of year | 1.3 | 0.9 | 0.7 | |||
| Granted | 0.7 | 0.6 | 0.4 | |||
| Awarded | (0.1) | (0.1) | (0.1) | |||
| Cancelled or expired | (0.4) | (0.1) | (0.1) | |||
| Number of awards outstanding, end of year | 1.5 | 1.3 | 0.9 | |||
In 2003, PSOP compensation expense was $nil (2002 – $5.3 million; 2001 – $4.8 million), which is included in operations, maintenance and administration expense in the statements of earnings. In 2001, 83,077 common shares were issued at $22.00 per share. In 2002, 84,578 common shares were issued at $21.60 per share. In 2003, 83,300 common shares were issued at $17.11 per share.
82 T R A N S A L T A C O R P O R A T I O N A R / 0 3
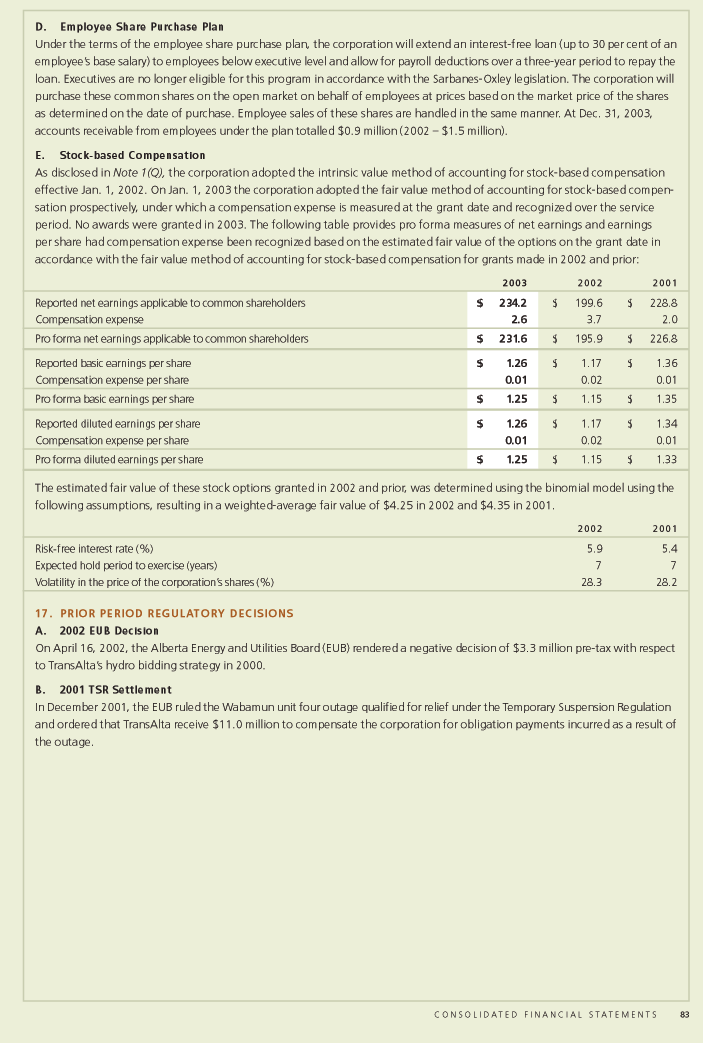
TA2003ARFeb28 3/3/04 11:36 AM Page 84
1 8 . I N C O M E TA X E S
The corporation uses Canadian GAAP for non-regulated entities for all electricity generation operations and as a result, future income taxes have been recorded for all operations.
| A. Statements of Earnings | |||||||||
| I. Rate Reconciliations | |||||||||
| 2 0 0 3 | 2 0 0 2 | 2 0 0 1 | |||||||
| Earnings from continuing operations before income taxes and non-controlling interests | $ | 369.8 | $ | 131.2 | $ | 315.0 | |||
| Statutory Canadian federal and provincial income tax rate | 36.8% | 39.3% | 43.3% | ||||||
| Expected taxes on income | $ | 136.1 | $ | 51.6 | $ | 136.4 | |||
| Increase (decrease) in income taxes resulting from: | |||||||||
| Lower effective foreign tax rates | (22.9) | (19.9) | (19.0) | ||||||
| Utilization of previously unrecognized tax losses | – | (11.2) | – | ||||||
| Resource allowance net of non-deductible royalties | (2.5) | (3.1) | (2.6) | ||||||
| Non-controlling interests’ share of income | (15.4) | (7.7) | (6.2) | ||||||
| Manufacturing and processing rate reduction | (3.5) | (3.5) | (7.9) | ||||||
| Non-taxable portion of deferred gain | (22.7) | – | – | ||||||
| Non-deductible costs and other | 0.6 | 4.6 | (0.1) | ||||||
| Large corporations tax (net of surtax) | 9.5 | 8.0 | 7.1 | ||||||
| Asset impairment and equipment cancellation recognized at lower rate | 1.8 | 6.3 | – | ||||||
| Effect of tax rate changes | (4.3) | (1.7) | (13.2) | ||||||
| Unrecognized future income tax assets | 1.7 | – | 3.1 | ||||||
| Income tax expense | $ | 78.4 | $ | 23.4 | $ | 97.6 | |||
| Effective tax rate | 21.2% | 17.8% | 31.0% | ||||||
The corporation’s operations are complex, and the computation and provision for income taxes involves tax interpretations, regulations and legislation that are continually changing. The corporation’s tax filings are subject to audit by taxation authorities. The outcome of some audits may change the tax liability of the corporation and adjustment could be material. Management believes it has adequately provided for income taxes based on all information currently available.
| II. Components of Income Tax Expense | |||||||||
| 2 0 0 3 | 2 0 0 2 | 2 0 0 1 | |||||||
| Current tax expense | $ | 51.0 | $ | 77.8 | $ | 47.2 | |||
| Future income tax expense (benefit) related to the origination | |||||||||
| and reversal of temporary differences | 31.7 | (41.5) | 63.6 | ||||||
| Future income tax benefit resulting from changes in tax rates or laws | (4.3) | (1.7) | (13.2) | ||||||
| Utilization of previously unrecognized tax losses | – | (11.2) | – | ||||||
| Income tax expense | $ | 78.4 | $ | 23.4 | $ | 97.6 | |||
| B. Balance Sheets | |||||||||
| Significant components of the corporation’s future income tax assets and liabilities are as follows: | |||||||||
| 2 0 0 3 | 2 0 0 2 | ||||||||
| Net operating and capital loss carry forwards | $ | 202.4 | $ | 207.6 | |||||
| Asset retirement obligations costs | 79.1 | 94.8 | |||||||
| Unrealized losses on electricity trading contracts | 62.8 | 74.0 | |||||||
| Property, plant and equipment | (866.4) | (661.9) | |||||||
| Unrealized gains on electricity trading contracts | (68.3) | (82.4) | |||||||
| Other deductible temporary differences | 33.8 | 39.6 | |||||||
| $ | (556.6) | $ | (328.3) | ||||||
84 T R A N S A L T A C O R P O R A T I O N A R / 0 3

TA2003ARFeb28 3/3/04 11:36 AM Page 86
| Dec. 31, 2002 | Registered | Supplemental | Other | Total | ||||||||
| Current service cost | $ | 4.0 | $ | 1.0 | $ | 0.6 | $ | 5.6 | ||||
| Interest cost | 21.7 | 1.9 | 1.0 | 24.6 | ||||||||
| Expected return on plan assets | (26.8) | – | – | (26.8) | ||||||||
| Experience loss | 0.2 | 0.2 | 0.5 | 0.9 | ||||||||
| Settlement upon sale of Transmission operation(Note 3) | 3.8 | – | (0.5) | 3.3 | ||||||||
| Amortization of net transition obligation (asset) | (9.2) | 0.3 | – | (8.9) | ||||||||
| Defined benefit expense (income) | (6.3) | 3.4 | 1.6 | (1.3) | ||||||||
| Defined contribution option expense of registered pension plan | 9.2 | – | – | 9.2 | ||||||||
| Net expense | $ | 2.9 | $ | 3.4 | $ | 1.6 | $ | 7.9 | ||||
| Dec. 31, 2001 | Registered | Supplemental | Other | Total | ||||||||
| Current service cost | $ | 3.9 | $ | 0.8 | $ | 0.4 | $ | 5.1 | ||||
| Interest cost | 22.1 | 1.7 | 0.9 | 24.7 | ||||||||
| Expected return on plan assets | (28.8) | – | – | (28.8) | ||||||||
| Amortization of net transition obligation (asset) | (9.3) | 0.3 | 0.3 | (8.7) | ||||||||
| Defined benefit expense (income) | (12.1) | 2.8 | 1.6 | (7.7) | ||||||||
| Defined contribution option expense of registered pension plan | 9.3 | – | – | 9.3 | ||||||||
| Expense (income) before capitalization | (2.8) | 2.8 | 1.6 | 1.6 | ||||||||
| Regulatory capitalization to plant and equipment | (0.1) | – | – | (0.1) | ||||||||
| Net (income) expense | $ | (2.9) | $ | 2.8 | $ | 1.6 | $ | 1.5 | ||||
| In 2003 the entire net expense related to continuing operations (2002 – $4.3 million). | ||||||||||||
| C. Status of Plans | ||||||||||||
| Dec. 31, 2003 | Registered | Supplemental | Other | |||||||||
| Market value of plan assets | $ | 351.9 | $ | 0.9 | $ | – | ||||||
| Accrued benefit obligation | 366.6 | 36.5 | 18.0 | |||||||||
| Funded status – plan deficit1 | (14.7) | (35.6) | (18.0) | |||||||||
| Amounts not yet recognized in statements of earnings: | ||||||||||||
| Unrecognized past service cost | 0.6 | (0.5) | – | |||||||||
| Unamortized transition obligation (asset) | (64.2) | 3.3 | – | |||||||||
| Unamortized net actuarial loss | 55.7 | 7.9 | 6.9 | |||||||||
| Total recognized in balance sheets: | ||||||||||||
| Accrued liability | $ | (22.6) | $ | (24.9) | $ | (11.1) | ||||||
| Amortization period in years (EARSL) | 9 | 9 | 12 | |||||||||
| Dec. 31, 2002 | Registered | Supplemental | Other | |||||||||
| Market value of plan assets | $ | 353.3 | $ | 0.4 | $ | – | ||||||
| Accrued benefit obligation | 349.8 | 35.5 | 18.2 | |||||||||
| Funded status – plan surplus (deficit)1 | 3.5 | (35.1) | (18.2) | |||||||||
| Amounts not yet recognized in statements of earnings: | ||||||||||||
| Unamortized transition obligation (asset) | (73.3) | 3.6 | – | |||||||||
| Unamortized net actuarial loss | 50.4 | 9.0 | 7.4 | |||||||||
| Total recognized in balance sheets: | ||||||||||||
| Accrued liability | $ | (19.4) | $ | (22.5) | $ | (10.8) | ||||||
| Amortization period in years (EARSL) | 9 | 9 | 11 | |||||||||
| 1 | The Canadian registered benefit option has a surplus and management intends to use the surplus to pay contributions to the registered defined contribution option and the supplemental defined benefit plan. |
The accrued benefit liability is included in accounts payable and accrued liabilities on the consolidated balance sheets.
86 T R A N S A L T A C O R P O R A T I O N A R / 0 3
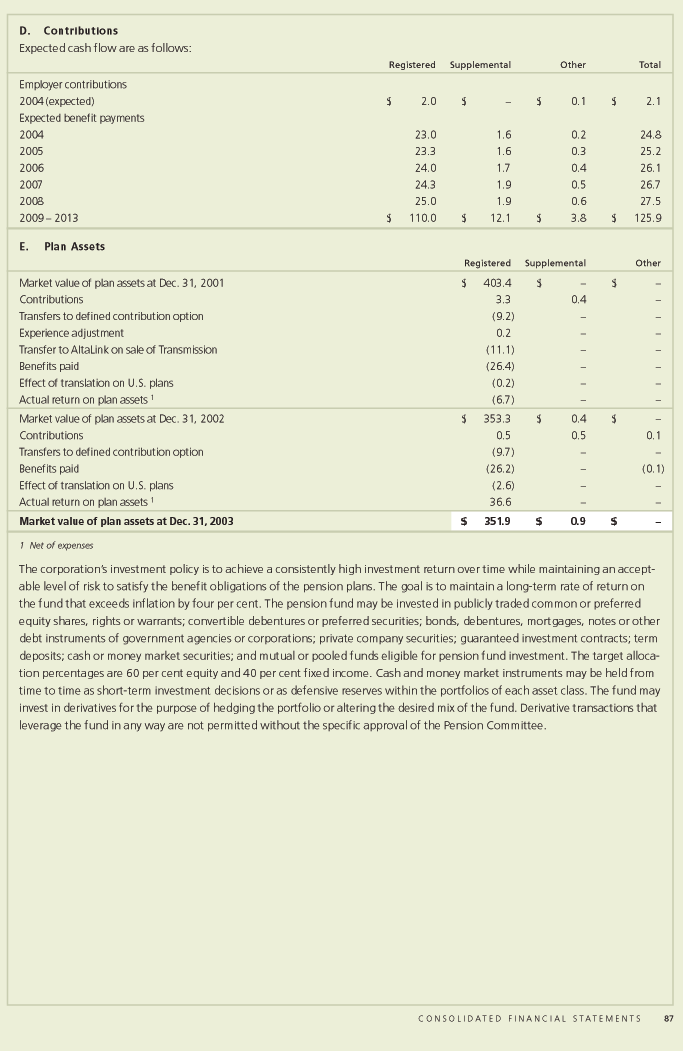
TA2003ARFeb28 3/3/04 11:36 AM Page 88
The allocation of plan assets by major asset category at Dec. 31, 2003 and 2002 is as follows:
| Dec. 31, 2003 | Registered | Supplemental | ||
| Equity securities | 55.0% | – | ||
| Debt securities | 44.2% | – | ||
| Cash equivalents | 0.8% | 100.0% | ||
| Total | 100.0% | 100.0% | ||
| Dec. 31, 2002 | Registered | Supplemental | ||
| Equity securities | 50.7% | – | ||
| Debt securities | 46.2% | – | ||
| Cash equivalents | 3.1% | 100.0% | ||
| Total | 100.0% | 100.0% | ||
Plan assets include common shares of the corporation having a fair value of $0.7 million at Dec. 31, 2003 (2002 – $0.6 million). The corporation charged the registered plan $0.1 million for administrative services provided for the year ended Dec. 31, 2003 (2002 – $0.1 million).
| F. Reconciliation of Accrued Benefit Obligations | |||||||||
| Registered | Supplemental | Other | |||||||
| Accrued benefit obligation as at Dec. 31, 2001 | $ | 345.5 | $ | 27.5 | $ | 13.6 | |||
| Current service cost | 4.0 | 1.0 | 0.6 | ||||||
| Interest cost | 21.7 | 1.9 | 1.0 | ||||||
| Benefits paid | (25.1) | (1.3) | (0.9) | ||||||
| Transfer to AltaLink on sale of Transmission | (5.6) | – | (0.8) | ||||||
| Effects of translation on U.S. plans | (0.6) | – | (0.1) | ||||||
| Actuarial loss | 9.9 | 6.4 | 4.8 | ||||||
| Accrued benefit obligation as at Dec. 31, 2002 | $ | 349.8 | $ | 35.5 | $ | 18.2 | |||
| Current service cost | 3.8 | 1.4 | 0.5 | ||||||
| Interest cost | 21.0 | 2.2 | 1.1 | ||||||
| Benefits paid | (25.0) | (1.3) | (1.0) | ||||||
| Past service charge | 0.6 | (0.6) | – | ||||||
| Plan amendments | 0.1 | – | – | ||||||
| Effects of translation on U.S. plans | (5.2) | – | (1.3) | ||||||
| Actuarial loss (gain) | 21.5 | (0.7) | 0.5 | ||||||
| Accrued benefit obligation as at Dec. 31, 2003 | $ | 366.6 | $ | 36.5 | $ | 18.0 | |||
| G. Assumptions | |||||||||
The significant actuarial assumptions adopted in measuring the corporation’s accrued benefit obligations were as follows:
| Dec. 31, 2003 | Registered | Supplemental | Other | |||
| Liability discount rate | 5.8% | 5.8% | 6.1% | |||
| Expected long-term rate of return on plan assets | 7.1% | – | – | |||
| Rate of compensation increase (exclusive of promotion increases) | 3.6% | 3.5% | – | |||
| Health care cost escalation | – | – | 6.6%–7.0%1) | |||
| Dental care cost escalation | – | – | 3.5% | |||
| Provincial health care premium escalation | – | – | 2.5% | |||
| Dec. 31, 2002 | Registered | Supplemental | Other | |||
| Liability discount rate | 6.3% | 6.3% | 6.4% | |||
| Expected long-term rate of return on plan assets | 7.1% | – | – | |||
| Rate of compensation increase (exclusive of promotion increases) | 3.6% | 3.5% | – | |||
| Health care cost escalation | – | – | 6.6%–7.0%1) | |||
| Dental care cost escalation | – | – | 3.5% | |||
| Provincial health care premium escalation | – | – | 2.5% | |||
1 For five years and 5 per cent thereafter for Canadian plans. For U.S. plans, decreasing gradually to 4.5 per cent for 2016 and remaining at that level thereafter.
88 T R A N S A L T A C O R P O R A T I O N A R / 0 3
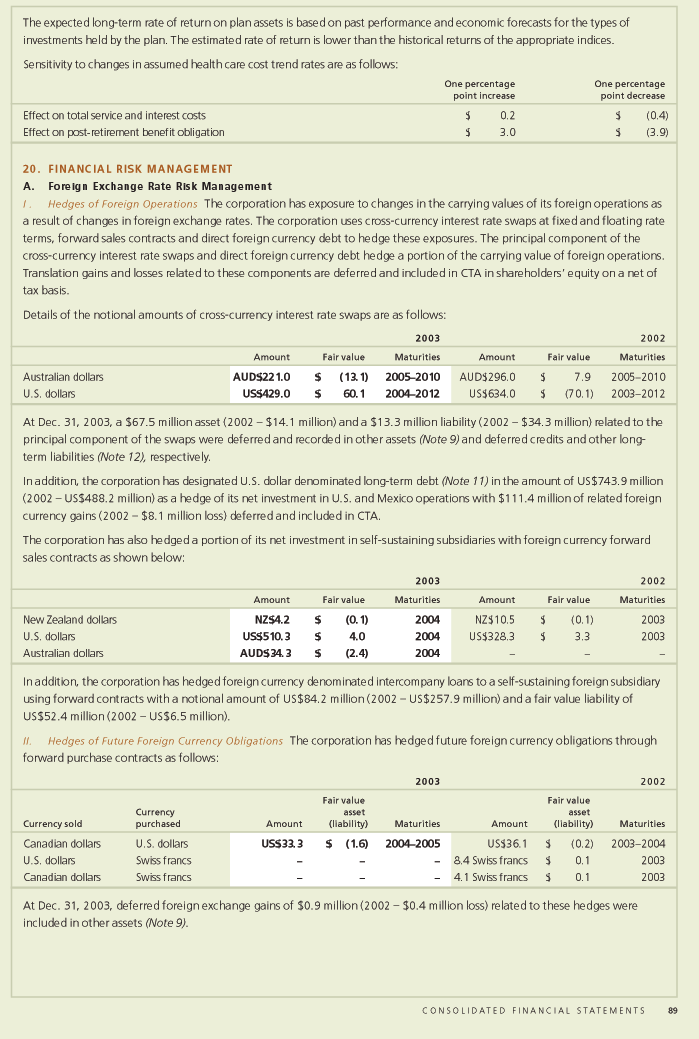
TA2003ARFeb28 3/3/04 11:36 AM Page 92
| 2 1 . J O I N T | V E N T U R E S | ||
| Joint ventures at Dec. 31, 2003 included the following: | |||
| Joint venture | Ownership interest | Description | |
| Sheerness joint venture | 25% | Coal-fired plant in Alberta, of which TA Cogen has a | |
| 50 per cent interest, and is operated by Canadian Utilities | |||
| Meridian joint venture | 50% | Cogeneration plant in Alberta, operated by Husky Energy | |
| Fort Saskatchewan joint venture | 30% | Cogeneration plant in Alberta, of which TA Cogen | |
| has a 60 per cent interest, and is operated by TransAlta | |||
| McBride Lake joint venture | 50% | Wind generation facilities in Alberta, operated by TransAlta | |
| Goldfields Power joint venture | 50% | Gas-fired plant in Australia, operated by TransAlta | |
| CE Generation LLC | 50% | Geothermal and gas plants in the U.S., operated by | |
| CE Gen affiliates | |||
| Genesee 3 | 50% | Coal-fired plant in Alberta, currently under construction | |
| and to be operated by EPCOR | |||
Summarized information on the results of operations, financial position and cash flows relating to the corporation’s pro-rata interests in its jointly controlled corporations was as follows:
| 2 0 0 3 | 2 0 0 2 | 2 0 0 1 | ||||||||
| Results of operations | ||||||||||
| Revenues | $ | 540.9 | $ | 197.9 | $ | 220.0 | ||||
| Expenses | (420.3) | (116.3) | (133.9) | |||||||
| Non-controlling interests | (27.4) | (4.5) | (4.7) | |||||||
| Proportionate share of net earnings | $ | 93.2 | $ | 77.1 | $ | 81.4 | ||||
| Cash flows | ||||||||||
| Cash flow from operations | $ | 197.0 | $ | 122.0 | $ | 93.7 | ||||
| Cash flow used in investing activities | (286.4) | (35.3) | (13.9) | |||||||
| Cash flow used in financing activities | (129.6) | (111.5) | (82.4) | |||||||
| Proportionate share of decrease in cash and cash equivalents | $ | (219.0) | $ | (24.8) | $ | (2.6) | ||||
| Financial position | ||||||||||
| Current assets | $ | 133.3 | $ | 24.1 | ||||||
| Long-term assets | 2,220.8 | 646.5 | ||||||||
| Current liabilities | (135.2) | (16.7) | ||||||||
| Long-term liabilities | (804.0) | (3.3) | ||||||||
| Non-controlling interests | (301.5) | (31.0) | ||||||||
| Proportionate share of net assets | $ | 1,113.4 | $ | 619.6 | ||||||
| 2 2. R E L AT E D PA RT Y T R A N S A C T I O N S | ||||||||||
On July 31, 2003, TransAlta completed the sale of its 50 per cent interest in the two-unit, 756-MW coal-fired Sheerness plant to TA Cogen for $630.0 million. The exchange amount was at fair value and was determined based on an estimate of the future net cash flows of the plant and approved by the independent directors of TA Cogen. There are no ongoing contractual commitments or arrangements resulting from this sale apart from the provision of operational and management services under normal commercial terms for the Sheerness plant. TA Cogen is owned 50.01 per cent by TransAlta and 49.99 per cent by TransAlta Power(Note 4).
In connection with the sale, the obligation for TransAlta to purchase all of TransAlta Power’s interest in TA Cogen on Dec. 31, 2018 that arose on the sale of power generation assets to TA Cogen in 1998 has been eliminated; therefore the deferred gain of a $119.8 million related to this sale was recognized in earnings. In addition, the management agreements between TransAlta, TransAlta Power and TA Cogen were amended to remove the mechanism for the deferral of management fees and remove the obligation for TransAlta Power and TA Cogen to pay management fees to TransAlta in the future. As consideration for the amendments, TransAlta received $1.0 million from TransAlta Power and $5.0 million from TA Cogen.
In February 2003, TransAlta entered into an agreement with CE Gen whereby TransAlta buys available power from certain CE Gen subsidiaries under normal commercial terms. In addition, CE Gen has entered into contracts with related parties to provide administrative and maintenance services.
92 T R A N S A L T A C O R P O R A T I O N A R / 0 3
For the period November 2002 to November 2007, TA Cogen entered into a transportation swap transaction with a wholly owned subsidiary of TransAlta, TransAlta Energy Corporation (TEC)(Note 12). TEC operates and maintains TA Cogen’s three combined-cycle power plants in Ontario and a plant in Fort Saskatchewan, Alberta. TEC also provides management services to the Sheerness plant in Alberta, which is operated by Canadian Utilities. The business purpose of the transportation swap was to provide TA Cogen with the delivery of fixed price gas without being exposed to escalating costs of pipeline transportation for two of its plants over the period of the swap. This stabilizes cash distributions in TA Cogen and thereby preserves the value of the limited partnership as a financing vehicle of TransAlta. The notional gas volume in the transaction was the total delivered fuel for both facilities. Exchange amounts are ba sed on the market value of the contract. TransAlta entered into an offsetting contract with an external third party, therefore TransAlta has no risk other than counterparty risk.
In September 2001, the corporation sold its 60 per cent interest in its Fort Saskatchewan plant to TA Cogen for a pre-tax gain of $6.2 million(Note 4).
TA Cogen entered into a fixed-for-floating gas swap transaction with TransAlta Energy for a 61-month period starting Dec. 1, 2000. The swap transaction provides TA Cogen with fixed price gas for both the Mississauga and Ottawa plants over the period. The floating prices associated with the Mississauga and Ottawa cogen plants’ long-term fuel supply agreements were transferred to TransAlta Energy’s account. The notional gas volume in the transaction was the total delivered fuel for both facilities. As consideration and in negotiation, TA Cogen transferred the right to incremental revenues associated with curtailed electrical production and subsequent higher revenue gas sales. At Dec. 31, 2003, the portion of the contract related to the non-controlling interest had a fair value liability of $7.9 million (2002 – $9.7 million).
2 3 . C O M M I T M E N T S
A significant portion of the corporation’s electricity and thermal sales revenues are subject to PPAs and long-term contracts. Commencing Jan. 1, 2001, Alberta Generation assets became subject to long-term PPAs for a period approximating the remaining life of each plant or unit. These PPAs set a production requirement and availability target to be supplied by each plant or unit and the price at which each megawatt-hour will be supplied to the customer. For Mexico, the plants’ energy production is subject to 25-year contracts with the Comisión Federal de Electricidad. These contracts set availability targets and the price at which the plant will be paid per kilowatt of available capacity, as well as plant efficiency targets for recovery of fuel costs based on market prices. At Sarnia, there are 20-year contracts with a customer group with three, five-year options for extensions to the contracts. The contracts allow for up to 40 per cent of the plant’s maximum capacity. These contracts set payments for peak megawatts, total megawatt hours and steam consumed, while TransAlta assumes the availability and heat rate risk. The remaining capacity is available for export to the merchant market, based on market conditions. Energy production at the remaining Ontario plants is subject to contracts expiring in nine to 14 years. These contracts set availability targets and the price at which the plant will be paid per kilowatt of available capacity for base and peak hours, as well as risk sharing of fuel costs based on market prices. Thermal energy contracts for these Ontario plants expire the same time as the energy production contracts and are with a different customer base. These contracts set payments for volumes consumed, while TA Cogen assumes the heat rate risk. At Centralia, a significant portion of production is subject to short- to medium-term energy sales contracts. In addition, a portion of the corporation’s energy sales from its gas plants are subjec t to medium- to long-term energy sales contracts.
The corporation has entered into a number of long-term gas purchase agreements, transportation and transmission agreements, royalty and right-of-way agreements in the normal course of operations. In addition, the corporation has committed to purchase turbines for a total purchase price of $40.5 million, and has entered into a number of operating lease agreements and commitments under mining agreements. In 2002, the corporation cancelled orders on several turbines, and incurred a pre-tax impairment charge of $42.5 million(Note 7).Approximate future payments under the fixed price purchase contracts turbine commitments, operating lease and mining agreements are as follows:
| Fixed price | ||||||||||||||
| gas purchase | Operating | Mining | ||||||||||||
| contracts | leases | Turbines | agreements | Total | ||||||||||
| $ | 55.8 | $ | 13.0 | $ | 21.6 | $ | 32.3 | $ | 122.7 | |||||
| 57.9 | 12.1 | 18.9 | 35.1 | 124.0 | ||||||||||
| 58.0 | 11.4 | – | 33.9 | 103.3 | ||||||||||
| 62.4 | 10.0 | – | 34.0 | 106.4 | ||||||||||
| 64.2 | 9.0 | – | 34.0 | 107.2 | ||||||||||
| 32.8 | 98.0 | – | 337.9 | 468.7 | ||||||||||
| $ | 331.1 | $ | 153.5 | $ | 40.5 | $ | 507.2 | $ | 1,032.3 | |||||
C O N S O L I D A T E D F I N A N C I A L S T A T E M E N T S 93
TA2003ARFeb28 3/3/04 11:36 AM Page 94
2 4 . O T H E R C O N T I N G E N C I E S
In June 2003, FERC issued two show cause orders, the Partnership Gaming Order and the Gaming Practices Order, in which TransAlta’s U.S. subsidiaries were named. These orders required TransAlta to justify certain trading activities in California between Jan. 1, 2000 and June 20, 2001. In response to FERC’s show cause orders TransAlta confirmed that it did not engage in gaming behavior. Based on the information provided by TransAlta, FERC Trial Staff filed a Motion to Dismiss with respect to TransAlta in the two show cause proceedings. On Jan. 22, 2004 FERC granted the FERC Trial Staff’s motion to dismiss TransAlta from both the Partnership Gaming Order and the Gaming Practices Order. FERC found that TransAlta did not engage in prohibited gaming practices.
As the result of another June 2003 FERC order, the FERC Office of Market Oversight and Investigations instituted an investigation into bidding behavior in the California markets between May 1, 2000 and Oct. 2, 2000 and made information requests of TransAlta’s U.S. energy marketing subsidiaries. TransAlta filed its response to this investigation on July 24, 2003. TransAlta’s investigations revealed no significant bidding behaviors outlined in the FERC request for information. On Jan. 29, 2004, TransAlta received official notice from the Commodity Futures Trading Commission (CFTC) that it was closing its investigation at that time. Such closure is not a conclusive finding that TransAlta did not commit any violations and the CFTC reserved its right to re-open the investigation.
On May 30, 2002, the California Attorney General’s Office filed civil complaints in the state court of California against eight wholesale power companies, including TransAlta. The complaint alleges violations of California’s unfair business practices law in connection with rates charged for wholesale electricity sales. The state court denied the Attorney General’s complaint and granted an order to dismiss the claims against TransAlta. The Attorney General has appealed this decision. The appeal is still ongoing at this time.
CE Gen’s geothermal and cogeneration facilities are qualifying facilities under the Public Utility Regulatory Policies Act of 1978 (PURPA) and their contracts for the sale of electricity are subject to regulations thereunder. In order to promote open competition in the industry, legislation has been proposed in the U.S. Congress that calls for either a repeal of PURPA on a prospective basis or the significant restructuring of the regulations governing the electric industry, including sections of PURPA. Current federal legislative proposals would not abrogate, amend, or modify existing contracts with electric utilities. The ultimate outcome of any proposed legislation is unknown at this time.
On Dec. 16, 2002, the Canadian government ratified the Kyoto Protocol. The Kyoto Protocol is not expected to have an impact on TransAlta’s U.S., Mexican or Australian operations. TransAlta is not able to estimate the full impact the Protocol will have on its Canadian operations, as the Canadian government has not yet established an implementation plan. However, the PPAs for TransAlta’s coal-fired plants in Alberta contain ‘Change of Law’ provisions that may provide an opportunity to recover compliance costs from the PPA customers.
The corporation is involved in various other claims and legal actions arising from the normal course of business. The corporation does not expect that the outcome of these proceedings will have a materially adverse effect on the corporation.
2 5 . C O M PA R AT I V E F I G U R E S
Certain of the comparative figures have been reclassified to conform with the current year’s presentation.
2 6 . S U B S E Q U E N T E V E N T S
On Jan. 22, 2004, CE Gen announced its intention to redeem early $78.6 million of the senior secured bonds. The senior secured bonds are due in 2018 and were classified as long-term non-recourse debt on TransAlta’s balance sheet at Dec. 31, 2003. A corresponding note receivable represents amounts advanced to the Zinc Recovery Project which is owned by MidAmerican affiliates and will be repaid concurrent with the repayment of the bonds. The note receivable was also classified as a long-term receivable on TransAlta’s balance sheet at Dec. 31, 2003. The actions taken by CE Gen result in both the senior bonds and the note receivable being considered current.
94 T R A N S A L T A C O R P O R A T I O N A R / 0 3
TA2003ARFeb28 3/3/04 11:36 AM Page 96
| B. Balance Sheet Information | |||||||||||||
Reconciling items | 2 0 0 3 | 2 0 0 2 | |||||||||||
Cdn GAAP | U.S. GAAP | Cdn GAAP | U.S. GAAP | ||||||||||
| Assets | |||||||||||||
| Current derivative assets | (I) | $ | – | $ | 6.9 | $ | – | $ | 8.3 | ||||
| Accounts receivable | (IX) | 410.2 | 409.3 | 419.0 | 417.5 | ||||||||
| Income taxes receivable | (I, II, IV) | 108.9 | 126.3 | 111.5 | 120.7 | ||||||||
| Investments | (X) | 5.0 | 189.4 | 32.2 | 271.9 | ||||||||
| Property, plant and equipment, net | (II) | 6,316.9 | 6,314.0 | 6,007.4 | 6,015.8 | ||||||||
| Long-term derivative assets | (I,XII) | – | 102.8 | – | 53.3 | ||||||||
| Other assets | (I, II, III) | 214.3 | 77.4 | 110.6 | 57.4 | ||||||||
| Liabilities | |||||||||||||
| Accounts payable and accrued liabilities | (VI) | 547.2 | 517.2 | 472.2 | 436.7 | ||||||||
| Current derivative liabilities | (I) | – | 40.3 | – | 27.6 | ||||||||
| Long-term debt | (I, III, X) | 2,978.3 | 3,660.9 | 2,351.2 | 3,087.6 | ||||||||
| Deferred credits and other long-term liabilities | (I, IV, XII) | 359.3 | 364.5 | 452.8 | 526.9 | ||||||||
| Long-term derivative liabilities | (I) | – | 12.2 | – | 133.1 | ||||||||
| Future or deferred income tax liability | (I, II, III, IV, V, VI) | 686.7 | 676.9 | 402.1 | 339.1 | ||||||||
| Non-controlling interest | (II) | 477.9 | 475.6 | 263.0 | 263.0 | ||||||||
| Equity | |||||||||||||
| Preferred securities | (III) | 450.8 | – | 451.7 | – | ||||||||
| Common shares | (IX) | 1,555.7 | 1,554.8 | 1,226.2 | 1,224.7 | ||||||||
| Retained earnings | (I, II ,IV, V, VI) | 933.9 | 936.0 | 884.7 | 839.0 | ||||||||
| Cumulative translation adjustment | (I, VIII) | (29.0) | – | (18.8) | – | ||||||||
| Accumulated other comprehensive income | (I, VIII) | – | (106.1) | – | (123.7) | ||||||||
| C. | Reconciling Items |
| I. | Derivatives and Hedging Activities |
| i. | Fair Value Hedging StrategyThe corporation enters into forward exchange contracts to hedge certain firm commitments denominated in foreign currencies to protect against adverse changes in exchange rates and uses interest rate swaps to manage interest rate exposure. The swaps modify exposure to interest rate risk by converting a portion of the corporation’s fixed-rate debt to a floating rate. |
The corporation’s fair value hedges resulted in no net impact to income in the years ended Dec. 31, 2003 and 2002 related to the ineffective portion of its hedging instruments (inclusive of the time value of money) as well as the portion of the hedging instrument excluded from the assessment of hedge effectiveness.
ii. Cash Flow Hedging StrategyIn the year ended Dec. 31, 2003 the corporation’s cash flow hedges resulted in an after-tax loss of $1.9 million (2002 – $nil) related to the ineffective portion of its hedging instruments, and an after-tax gain of $2.0 million (2002 – $nil) related to the portion of the hedging instrument excluded from the assessment of hedge effectiveness.
In November 2003, forward starting swaps with a notional amount of US$200.0 million and treasury and spread locks with a notional amount of $100.0 million were settled and debt was issued, resulting in an after-tax loss of $25.3 million. The loss will be reclassified from other comprehensive income (OCI) into income as interest expense is recognized on the debt.
In June 2002, forward starting swaps with a notional amount of US$125.0 million were settled and debt was issued, resulting in an after-tax loss of $6.7 million. The loss will be reclassified from accumulated other comprehensive income (AOCI) into income as interest expense is recognized on the debt.
Over the next 12 months, the corporation estimates that $6.0 million of after-tax losses that arose from cash flow hedges will be reclassified from OCI to net earnings. The corporation also estimates that $3.7 million of after-tax losses on cash flow hedging instruments that arose on adoption of Statement 133 will be reclassified from AOCI to earnings. These estimates assume constant gas and power prices, interest rates and exchange rates over time; however, the actual amounts that will be reclassified will vary based on changes in these factors. Therefore, management is unable to predict what the actual reclassification from OCI to earnings (positive or negative) will be for the next 12 months.
iii. Net Investment HedgesThe company uses cross-currency interest rate swaps, forward sales contracts and direct foreign currency debt to hedge its exposure to changes in the carrying value of its investments in its foreign subsidiaries in the U.S., Australia and Mexico. Realized and unrealized gains and losses from these hedges are included in OCI, with the related amounts due to or from counterparties included in other assets, long-term debt and other liabilities.
96 T R A N S A L T A C O R P O R A T I O N A R / 0 3
TA2003ARFeb28 3/3/04 11:36 AM Page 98
VII. Joint Ventures
In accordance with Canadian GAAP, joint ventures are required to be proportionately consolidated regardless of the legal form of the entity. Under U.S. GAAP, incorporated joint ventures are required to be accounted for by the equity method. However, in accordance with practices prescribed by the SEC, the corporation, as a Foreign Private Issuer, has elected for the purpose of this reconciliation to account for incorporated joint ventures by the proportionate consolidation method.
| VIII. Other Comprehensive Income (Loss) | |||||||||
| The changes in the components of OCI were as follows: | |||||||||
| Years ended Dec. 31 | 2 0 0 3 | 2 0 0 2 | 2 0 0 1 | ||||||
| Cumulative effect of accounting change, net of tax | $ | – | $ | – | $ | (38.5) | |||
| Net gain (loss) on derivative instruments: | |||||||||
| Unrealized gain (loss), net of tax of $3.6 million | 5.4 | (55.5) | 0.5 | ||||||
| Reclassification adjustment for gain included in net income, net of tax of $2.2 million | 3.4 | 4.0 | 9.5 | ||||||
| Net gain (loss) on derivative instruments | 8.8 | (51.5) | 10.0 | ||||||
| Translation adjustments | 8.2 | (16.8) | (5.4) | ||||||
| Registered pension alternate minimum liability | 0.6 | (1.7) | – | ||||||
| Other comprehensive income (loss) | $ | 17.6 | $ | (70.0) | $ | (33.9) | |||
| The components of AOCI were: | |||||||||
| 2 0 0 3 | 2 0 0 2 | 2 0 0 1 | |||||||
| Net loss on derivative instruments | $ | (71.2) | $ | (80.0) | $ | (28.5) | |||
| Translation adjustments | (33.8) | (42.0) | (25.2) | ||||||
| Registered pension alternate minimum liability | (1.1) | (1.7) | – | ||||||
| Accumulated other comprehensive loss | $ | (106.1) | $ | (123.7) | $ | (53.7) | |||
| IX. Share Capital |
Under U.S. GAAP, amounts receivable for share capital should be recorded as a deduction from shareholders’ equity. Under the corporation’s employee share purchase plan, accounts receivable for share purchases at Dec. 31, 2003 were $0.9 million (2002 – $1.5 million).
X. Right of Offset Agreement
The corporation has a New Zealand bank deposit that has been offset with a New Zealand bank facility under a right of offset agreement. The arrangement does not qualify for offsetting under U.S. GAAP.
XI. Asset Retirement Obligations
FASB issued Statement 143,Asset Retirement Obligations,which requires asset retirement obligations to be measured at fair value and recognized when the obligation is incurred. A corresponding amount is capitalized as part of the asset’s carrying amount and depreciated over the asset’s useful life. Statement 143 is effective for fiscal years beginning after June 15, 2002, with earlier application encouraged. TransAlta adopted the provisions of Statement 143 effective Jan. 1, 2003.
In accordance with Canadian GAAP, the asset retirement obligations standard was adopted retroactively with restatement of prior periods. Under U.S. GAAP, the impact of adopting Statement 143 was recognized as a cumulative effect of a change in accounting principle as of Jan. 1, 2003, the beginning of the fiscal year in which the Statement was first applied. The change resulted in an after-tax increase in net earnings of $52.5 million, ($82.7 million pre-tax). Had the change in accounting principle been applied retroactively, basic and diluted earnings per share under U.S. GAAP for the year ended Dec. 31, 2002 would have been $1.10 and $1.10 per share, respectively, and basic and diluted earnings per share under U.S. GAAP for the year ended Dec. 31, 2001 would have been $1.59 and $1.57 per share, respectively.
XII. Guarantees
TransAlta accounts for guarantees and related contracts, for which it is the guarantor, under FASB Interpretation No. 45 (FIN 45),
Guarantor’s Accounting and Disclosure Requirements for Guarantees, Including Indirect Guarantees of Indebtedness to Others.
In accordance with FIN 45, upon issuance or modification of a guarantee on or after Jan. 1, 2003, the corporation recognizes a liability at the time of issuance or material modification for the estimated fair value of the obligation it assumes under the guarantee. TransAlta reduces the obligation over the term of the guarantee or related contract in a systematic and rational method as risk is reduced under the obligation.
98 T R A N S A L T A C O R P O R A T I O N A R / 0 3
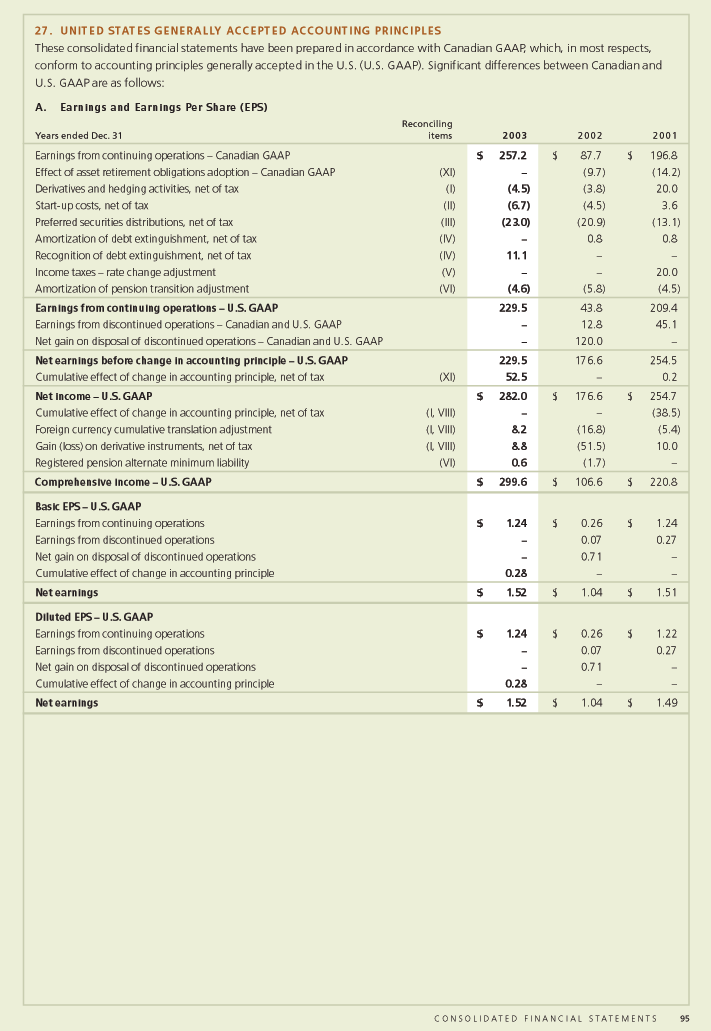
TA2003ARFeb28 3/3/04 11:36 AM Page 100
E L E V E N - Y E A R F I N A N C I A L & S T A T I S T I C A L S U M M A R Y *
| ( M I L L I O N S O F C A N A D I A N D O L LA R S , E X C E P T W H E R E N O T E D ) | 2 0 0 3 | 2 0 0 2 | 2 0 0 1 | |||||||||
| FINANCIAL SUMMARY | ||||||||||||
| Earnings statement | ||||||||||||
| Revenues | $ | 2,508.6 | $ | 1,814.9)1 | $ | 2,559.5)1 | ||||||
| Operating income | $ | 553.7 | $ | 223.9)2 | $ | 468.9)2 | ||||||
| Net earnings applicable to common shareholders | $ | 234.2 | $ | 189.9 | $ | 214.6 | ||||||
| Balance sheet | ||||||||||||
| Total assets | $ | 8,420.2 | $ | 7,419.6 | $ | 7,877.9 | ||||||
| Short-term debt, net of cash and interest-earning investments | (35.2) | 146.7 | 475.2 | |||||||||
| Long-term debt | 3,162.1 | 2,706.6 | 2,511.1 | |||||||||
| Preferred shares of a subsidiary | – | – | – | |||||||||
| Other non-controlling interests | 477.9 | 263.0 | 281.0 | |||||||||
| Preferred securities | 450.8 | 451.7 | 452.6 | |||||||||
| Common shareholders’ equity | 2,460.6 | 2,039.6 | 1,989.7 | |||||||||
| Total invested capital | $ | 6,516.2 | $ | 5,607.6 | $ | 5,709.6 | ||||||
| Cash flow | ||||||||||||
| Cash flow from operating activities | $ | 756.5 | $ | 437.7 | $ | 715.6 | ||||||
| Cash flow used in investing activities | $ | (535.1) | $ | (36.2) | $ | (1,076.9) | ||||||
| Common share information(per share) | ||||||||||||
| Net earnings | $ | 1.26 | $ | 1.12 | $ | 1.27 | ||||||
| Dividends declared | $ | 1.00 | $ | 1.00 | $ | 1.00 | ||||||
| Book value (at year-end) | $ | 12.90 | $ | 12.01 | $ | 11.82 | ||||||
| Market price: | ||||||||||||
| High | $ | 19.55 | $ | 23.95 | $ | 30.13 | ||||||
| Low | $ | 15.36 | $ | 16.69 | $ | 19.15 | ||||||
| Close (TSX at Dec. 31) | $ | 18.53 | $ | 17.11 | $ | 21.60 | ||||||
| Ratios(percentage except where noted) | ||||||||||||
| Debt/invested capital | 47.9 | 50.9 | 52.3 | |||||||||
| Return on common shareholders’ equity | 10.3 | 3.5 | 10.9 | |||||||||
| Return on invested capital | 9.1 | 4.0 | 8.7 | |||||||||
| Cash flow to total debt | 17.9 | 16.1 | 21.8 | |||||||||
| Dividend payout | 79.0 | 241.8 | 78.5 | |||||||||
| Dividend yield | 5.4 | 5.8 | 4.6 | |||||||||
| Price/earnings multiple | 14.7 | 41.7 | 17.3 | |||||||||
| Weighted average common shares for year (in millions) | 185.3 | 169.6 | 169.0 | |||||||||
| Common shares outstanding at Dec. 31 (in millions) | 190.7 | 169.8 | 168.3 | |||||||||
| STATISTICAL SUMMARY | ||||||||||||
| Number of employees | 2,563 | 2,573 | 2,656 | |||||||||
| Generating capacity (net MW)3: | ||||||||||||
| Hydro | 801 | 801 | 800 | |||||||||
| Coal | 4,777 | 4,966 | 5,090 | |||||||||
| Gas | 2,499 | 1,333 | 1,108 | |||||||||
| Renewables | 245 | 44 | – | |||||||||
| Total generating capacity | 8,322 | 7,144 | 6,998 | |||||||||
| Total generation production (GWh)4 | 53,134 | 46,877 | 44,136 | |||||||||
| * | Prior years have not been restated to conform with the current year’s presentation. |
| 1 | 2002 and 2001 Energy Marketing real-time trading contract revenues restated to be presented on a gross basis. |
| 2 | Includes discontinued operations. |
| 3 | Represents TransAlta’s ownership. |
| 4 | Includes discontinued operations. |
Ratio Formulas
Debt/invested capital = (short-term debt + long-term debt – cash and interest-earning investments)/(debt + preferred shares + non-controlling interests + common equity)
Return on common shareholders’ equity = net earnings excluding gain on discontinued operations/average of opening and closing common equity
100 T R A N S A L T A C O R P O R A T I O N A R / 0 3
TA2003ARFeb28 3/3/04 11:36 AM Page 101
| 2 0 0 0 | 1 9 9 9 | 1 9 9 8 | 1 9 9 7 | 1 9 9 6 | 1 9 9 5 | 1 9 9 4 | 1 9 9 3 | ||||||||||||||||
| $ | 1,587.0 | $ | 1,029.4 | $ | 1,089.9 | $ | 1,656.4 | $ | 1,515.6 | $ | 1,330.5 | $ | 1,261.0 | $ | 1,208.3 | ||||||||
| $ | 604.6)2 | $ | 442.0)2 | $ | 660.1)2 | $ | 586.6 | $ | 570.6 | $ | 591.4 | $ | 588.7 | $ | 573.5 | ||||||||
| $ | 279.8 | $ | 170.1 | $ | 211.4 | $ | 182.6 | $ | 181.0 | $ | 181.7 | $ | 186.9 | $ | 183.8 | ||||||||
| $ | 7,627.1 | $ | 6,038.4 | $ | 5,392.6 | $ | 4,882.2 | $ | 4,804.4 | $ | 4,346.9 | $ | 3,969.7 | $ | 4,060.8 | ||||||||
| 220.5 | (173.6) | (149.4) | (20.3) | 13.3 | 1.3 | 84.8 | 37.1 | ||||||||||||||||
| 2,201.4 | 2,177.4 | 1,903.6 | 2,198.0 | 2,364.0 | 2,009.0 | 1,584.5 | 1,748.8 | ||||||||||||||||
| 121.6 | 268.3 | 268.4 | 267.6 | 270.5 | 371.9 | 462.8 | 549.0 | ||||||||||||||||
| 253.4 | 377.4 | 503.3 | 162.9 | 164.4 | 73.3 | – | – | ||||||||||||||||
| 292.0 | 287.1 | – | – | – | – | – | – | ||||||||||||||||
| 1,957.4 | 1,835.6 | 1,855.0 | 1,594.3 | 1,582.3 | 1,542.7 | 1,515.0 | 1,477.6 | ||||||||||||||||
| $ | 5,046.3 | $ | 4,772.2 | $ | 4,380.9 | $ | 4,202.5 | $ | 4,394.5 | $ | 3,998.2 | $ | 3,647.1 | $ | 3,812.5 | ||||||||
| $ | 188.7 | $ | 422.0 | $ | 470.7 | $ | 666.4 | $ | 563.2 | $ | 430.7 | $ | 422.9 | $ | 363.9 | ||||||||
| $ | (205.0) | $ | (988.8) | $ | (137.2) | $ | (319.7) | $ | (459.9) | $ | (361.3) | $ | (152.7) | $ | (295.8) | ||||||||
| $ | 1.66 | $ | 1.00 | $ | 1.31 | $ | 1.14 | $ | 1.14 | $ | 1.14 | $ | 1.18 | $ | 1.16 | ||||||||
| $ | 1.00 | $ | 1.00 | $ | 0.99 | $ | 0.98 | $ | 0.98 | $ | 0.98 | $ | 0.98 | $ | 0.98 | ||||||||
| $ | 11.61 | $ | 10.85 | $ | 10.94 | $ | 9.96 | $ | 9.92 | $ | 9.71 | $ | 9.54 | $ | 9.31 | ||||||||
| $ | 22.55 | $ | 25.15 | $ | 25.40 | $ | 22.75 | $ | 18.20 | $ | 14.88 | $ | 16.25 | $ | 15.50 | ||||||||
| $ | 13.20 | $ | 12.25 | $ | 18.20 | $ | 15.10 | $ | 14.25 | $ | 13.00 | $ | 13.13 | $ | 12.63 | ||||||||
| $ | 22.00 | $ | 14.15 | $ | 22.60 | $ | 22.55 | $ | 17.25 | $ | 14.63 | $ | 14.50 | $ | 15.25 | ||||||||
| 48.0 | 45.6 | 40.0 | 51.8 | 54.1 | 50.3 | 45.8 | 46.8 | ||||||||||||||||
| 11.7 | 9.2 | 12.3 | 11.5 | 11.6 | 11.9 | 12.5 | 12.6 | ||||||||||||||||
| 12.3 | 9.7 | 15.4 | 13.7 | 13.6 | 15.5 | 15.8 | 15.3 | ||||||||||||||||
| 25.3 | 21.7 | 22.8 | 22.0 | 22.1 | 24.0 | 23.9 | 25.5 | ||||||||||||||||
| 75.8 | 99.7 | 75.8 | 85.7 | 86.2 | 85.7 | 83.3 | 84.6 | ||||||||||||||||
| 4.6 | 7.1 | 4.4 | 4.4 | 5.7 | 6.7 | 6.8 | 6.4 | ||||||||||||||||
| 16.7 | 14.2 | 17.3 | 19.8 | 15.1 | 12.8 | 12.3 | 13.2 | ||||||||||||||||
| 168.8 | 169.5 | 161.3 | 159.7 | 159.2 | 158.9 | 158.8 | 158.7 | ||||||||||||||||
| 168.6 | 169.2 | 169.6 | 160.0 | 159.5 | 158.9 | 158.8 | 158.7 | ||||||||||||||||
| 2,363 | 2,679 | 2,455 | 2,667 | 3,099 | 2,128 | 2,213 | 2,435 | ||||||||||||||||
| 800 | 800 | 800 | 800 | 800 | 800 | 800 | 800 | ||||||||||||||||
| 5,016 | 3,676 | 3,676 | 3,676 | 3,676 | 3,676 | 3,676 | 3,676 | ||||||||||||||||
| 1,054 | 1,464 | 1,008 | 832 | 815 | 485 | 485 | 375 | ||||||||||||||||
| – | – | – | – | – | – | – | – | ||||||||||||||||
| 6,870 | 5,940 | 5,484 | 5,308 | 5,291 | 4,961 | 4,961 | 4,851 | ||||||||||||||||
| 40,644 | 37,771 | 39,001 | 36,401 | 34,264 | 33,373 | 32,171 | 30,295 | ||||||||||||||||
Return on invested capital = operating income/average annual invested capital
Cash flow to total debt = cash flow from operations before changes in working capital divided by two-year average of total debt
Dividend payout = dividends/net earnings excluding gain on discontinued operations
Dividend yield = common share dividends/current year’s close price
Price/earnings multiple = current year’s close/earnings per share from continuing operations
E L E V E N - Y E A R F I N A N C I A L & S T A T I S T I C A L S U M M A R Y 101