TransAlta Corporation
For Immediate Release
NEWS RELEASE
Higher electricity prices power TransAlta's fourth quarter results
Fourthquarter2005highlights:
- Comparable earnings of $0.29 per share compared to $0.19 per share in 2004
- Reported net earnings of $0.35 per share compared to $0.32 per share last year
- Generated cash flow from operations of $211.9 million compared to $175.9 million in 2004
- Dividend declared of $0.25 per common share payable April 1, 2006
CALGARY, Alberta (Jan. 27, 2006) - TransAlta Corporation (TransAlta or the corporation) (TSX: TA; NYSE: TAC) today announced comparable earnings* for the fourth quarter 2005 of $58.2 million ($0.29 per share) versus $37.2 million ($0.19 per share) for the fourth quarter 2004. Reported net earnings were $70.2 million ($0.35 per share), compared to $62.1 million ($0.32 per share) for the fourth quarters of 2005 and 2004. Cash flow from operating activities for the quarter was $211.9 million, compared to $175.9 million for the fourth quarter of 2004.
"We realized higher earnings and cash flow by capturing opportunities created by the market while keeping the focus on achieving high availability and solid plant performance," said Steve Snyder, TransAlta president and CEO. "Both the Generation and Energy Marketing business segments performed well and we are pleased with both our fourth quarter and full year results."
For the twelve months ended Dec. 31, 2005, comparable earnings were $173.8 million ($0.88 per share) compared to $128.1 million ($0.66 per share) for the twelve months ended Dec. 31, 2004. For the year ended Dec. 31, 2005, reported net earnings were $198.8 million or $1.01 per share compared to $170.2 million or $0.88 per share the year prior. Cash flow from operating activities was $619.4 million for the twelve months ended Dec. 31, 2005 versus $591.2 million for the same period in 2004. Capital expenditures during 2005 were $325.5 million compared to $345.7 million for 2004. Net debt was also reduced by $262.9 million at Dec. 31, 2005.
In the fourth quarter of 2005, TransAlta:
- Announced its subsidiary TransAlta Energy Marketing (U.S.) Inc. signed a four-year, US$450 million agreement for the delivery of electricity from its coal-fired Centralia, Washington power plant.
- Appointed Brian Burden as executive vice-president and CFO.
- Issued $200 million of two-year, 4.20 per cent senior unsecured notes.
- Had its BBB credit rating outlook revised from Negative to Stable trend by Dominion Bond Rating Service.
TransAlta today also declared a dividend of $0.25 per share on common shares payable April 1, 2006 to shareholders of record at the close of business March 1, 2006.
All financial figures are in Canadian dollars unless noted otherwise.
| * | Comparable earnings is not defined under Canadian generally accepted accounting principles (GAAP). Presenting earnings on a comparable basis from period to period provides management with the ability to evaluate earnings trends more readily in comparison with prior periods' results. An explanation of this Non-GAAP financial measure can be found on page 10 of this news release. |
|
TransAlta Corporation Q4/05 1
RESULTS OF OPERATIONS |
The results of operations are presented on a consolidated basis and by business segment. TransAlta has two business segments: Generation and Energy Marketing. TransAlta's segments are supported by a corporate group that provides finance, treasury, information technology, legal, human resources and other administrative support. These corporate group overheads are allocated to the business segments.
Operating results
The following table depicts key financial and statistical operational data.
3 months ended Dec. 31 | Year ended Dec. 31 | ||||||||||
| 2005 | 20041 | 2005 | 20041 | ||||||||
| Availability (%) | 90.4 | 90.3 | 89.4 | 89.2 | |||||||
| Production (GWh) | 13,408 | 13,117 | 51,810 | 51,396 | |||||||
| Revenue | $ | 810.1 | $ | 660.1 | $ | 2,838.5 | $ | 2,586.2 | |||
| Gross margin2 | $ | 387.2 | $ | 332.9 | $ | 1,462.6 | $ | 1,356.8 | |||
| Operating income2 | $ | 94.4 | $ | 150.3 | $ | 441.2 | $ | 470.9 | |||
| Earnings from continuing operations | $ | 58.2 | $ | 62.1 | $ | 186.8 | $ | 160.6 | |||
| Earnings from discontinued operations, net of tax | 12.0 | – | 12.0 | 9.6 | |||||||
| Net earnings | $ | 70.2 | $ | 62.1 | $ | 198.8 | $ | 170.2 | |||
| Basic earnings per common share: | |||||||||||
| Earnings from continuing operations | $ | 0.29 | $ | 0.32 | $ | 0.95 | $ | 0.83 | |||
| Earnings from discontinued operations | 0.06 | – | 0.06 | 0.05 | |||||||
| Net earnings | $ | 0.35 | $ | 0.32 | $ | 1.01 | $ | 0.88 | |||
| Diluted earnings per common share: | |||||||||||
| Earnings from continuing operations | $ | 0.29 | $ | 0.32 | $ | 0.95 | $ | 0.83 | |||
| Earnings from discontinued operations | 0.06 | – | 0.06 | 0.05 | |||||||
| Net earnings | $ | 0.35 | $ | 0.32 | $ | 1.01 | $ | 0.88 | |||
| Cash flow from operating activities | $ | 211.9 | $ | 175.9 | $ | 619.4 | $ | 591.2 | |||
| 1 | TransAlta adopted the new accounting standard for variable interest entities on Jan. 1, 2005. Prior periods have been restated. |
| 2 | Gross margin and operating income are not defined under GAAP. Refer to the Non-GAAP Measures section on page 10 of this news release for a further discussion of operating income, including a reconciliation to net earnings. |
A reconciliation of net earnings from the fourth quarter of 2004 to the fourth quarter of 2005 is presented below.
| Net earnings for the three months ended Dec. 31, 2004 | $ | 62.1 |
| Increased Generation gross margins | 64.4 | |
| Increased lost margins due to planned outages | (16.3) | |
| Increased Energy Marketing gross margins | 6.2 | |
| Increase in operational and administrative costs | (24.2) | |
| Increased depreciation | (9.6) | |
| Gain on sale of TransAlta Power partnership units | (20.6) | |
| Gain on sale of Meridian cogeneration facility | (17.7) | |
| Tax recovery on discontinued operations | 12.0 | |
| Lower interest expense | 5.6 | |
| Lower income taxes | 13.5 | |
| Other | (5.2) | |
| Net earnings for the three months ended Dec. 31, 2005 | $ | 70.2 |
Availability for the three months and year ended Dec. 31, 2005 is consistent with the corresponding periods in 2004.
Production for the fourth quarter increased by 291 gigawatt hours (GWh) from the same period in 2004 as a result of incremental production from Genesee 3 of 365 GWh and higher production at Centralia gas plant of 119 GWh due to favorable spark spreads, offset by the decommissioning of units one and two of the Wabamun plant of 236 GWh.
| 2 TransAlta Corporation Q4/05 |
|
The improvement in gross margins of $54.3 million was the result of an increase of $66.9 million due to higher prices and spark spreads and $20.0 million of gross margin from incremental production from Genesee 3. These gains were offset by increased penalties for planned outages because of higher prices of $16.3 million, increased fuel costs of $13.5 million at Centralia Coal and $9.0 million of lower margin from the decommissioning of units one and two of the Wabamun plant. Energy Marketing's gross margin improved by $6.2 million from 2004 due to improved margins from gas trading compared to 2004.
Fourth quarter operations, maintenance and administration (OM&A) costs increased $24.2 million compared to the same period in 2004. This increase was the result of the addition of Genesee 3, increased overall maintenance expenses of $9.0 million, cost escalations related to labour and materials and increased compensation costs.
Depreciation expense in the quarter was up by $45.8 million mainly due to a $36.2 million impairment charge attributable to TransAlta Power, L.P.'s (TA Power) interest in the Ottawa plant. Excluding this charge, depreciation increased by $9.6 million due to the addition of Genesee 3 and the retirement of equipment replaced during planned maintenance. The income attributable to non-controlling interests was reduced by $36.2 million as a result of the Ottawa impairment charge.
Net interest expense declined $5.6 million due to reduced debt balances and the redemption of $300.0 million of preferred securities in the first quarter of 2005.
Income taxes decreased by $13.5 million compared to 2004 as last year's income tax expense includes $13.4 million related to the sale of the Meridian cogeneration facility and TA Power units and lower effective tax rates in 2005.
CASH FLOW |
Cash flow from operating activities increased by $36.0 million for the three months ended Dec. 31, 2005 as compared to the same period in 2004. The key factors responsible for this increase are listed below in the reconciliation of cash flow from operating activities.
| Cash flow from operating activities for 3 months ended Dec. 31, 2004 | $ | 175.9 |
| Increased cash earnings | 51.4 | |
| Asset retirement obligations costs settled | (5.4) | |
| Changes in other non-cash items | 8.0 | |
| Changes in non-cash operating working capital balances | (18.0) | |
| Cash flow from operating activities for 3 months ended Dec. 31, 2005 | $ | 211.9 |
Capital expenditures in the quarter were $103.6 million compared to $77.6 million in the fourth quarter of last year. Net debt retirement in the quarter, including both short- and long-term debt, was $62.5 million compared to $162.1 million in the same period in 2004.
At Dec. 31, 2005, TransAlta's total debt (including non-recourse debt) to invested capital ratio was 43.6 per cent (39.8 per cent excluding non-recourse debt). This represents an improvement from the Dec. 31, 2004 ratio of 46.4 per cent (42.4 per cent excluding non-recourse debt).
CONSOLIDATED |
Segment results-at-a-glance
| 3 months ended Dec. 31, 2005 | Generation | Energy Marketing | Corporate | Total | |||||||
| Revenues | $ | 761.5 | $ | 48.6 | $ | – | $ | 810.1 | |||
| Trading purchases | – | (38.9) | – | (38.9) | |||||||
| Fuel and purchased power | (384.0) | – | – | (384.0) | |||||||
| Gross margin | 377.5 | 9.7 | – | 387.2 | |||||||
| Operations, maintenance and administration | 127.3 | 4.3 | 20.4 | 152.0 | |||||||
| Depreciation and amortization | 133.1 | 0.4 | 2.5 | 136.0 | |||||||
| Taxes, other than income taxes | 4.8 | – | – | 4.8 | |||||||
| Operating expenses | 265.2 | 4.7 | 22.9 | 292.8 | |||||||
| Operating income (loss) before corporate allocations | 112.3 | 5.0 | (22.9) | 94.4 | |||||||
| Corporate allocations | 20.0 | 2.9 | (22.9) | – | |||||||
| Operating income | $ | 92.3 | $ | 2.1 | $ | – | 94.4 | ||||
| Foreign exchange loss | (0.7) | ||||||||||
| Net interest expense | (40.4) | ||||||||||
| Equity loss | (1.0) | ||||||||||
| Earnings from continuing operations before income taxes and non-controlling interests | $ | 52.3 | |||||||||
| TransAlta Corporation Q4/05 3 |
| Energy | |||||||||||
| 3 months ended Dec. 31, 2004 (Restated) | Generation | Marketing | Corporate | Total | |||||||
| Revenues | $ | 599.3 | $ | 60.8 | $ | – | $ | 660.1 | |||
| Trading purchases | – | (57.3) | – | (57.3) | |||||||
| Fuel and purchased power | (269.9) | – | – | (269.9) | |||||||
| Gross margin | 329.4 | 3.5 | – | 332.9 | |||||||
| Operations, maintenance and administration | 108.9 | 0.3 | 18.6 | 127.8 | |||||||
| Depreciation and amortization | 86.9 | 0.5 | 2.8 | 90.2 | |||||||
| Taxes, other than income taxes | 2.9 | – | – | 2.9 | |||||||
| Operating expenses | 198.7 | 0.8 | 21.4 | 220.9 | |||||||
| Gain on sale of TransAlta Power partnership units | 20.6 | – | – | 20.6 | |||||||
| Gain on sale of Meridian cogeneration facility | 17.7 | – | – | 17.7 | |||||||
| Operating income (loss) before corporate allocations | 169.0 | 2.7 | (21.4) | 150.3 | |||||||
| Corporate allocations | 19.2 | 2.2 | (21.4) | – | |||||||
| Operating income | $ | 149.8 | $ | 0.5 | $ | – | 150.3 | ||||
| Foreign exchange gain | 3.1 | ||||||||||
| Net interest expense | (46.0) | ||||||||||
| Equity loss | (4.3) | ||||||||||
| Earnings from continuing operations before income taxes and non-controlling interests | $ | 103.1 | |||||||||
| Energy | |||||||||||
| Year ended Dec. 31, 2005 | Generation | Marketing | Corporate | Total | |||||||
| Revenues | $ | 2,607.5 | $ | 231.0 | $ | – | $ | 2,838.5 | |||
| Trading purchases | – | (174.1) | – | (174.1) | |||||||
| Fuel and purchased power | (1,201.8) | – | – | (1,201.8) | |||||||
| Gross margin | 1,405.7 | 56.9 | – | 1,462.6 | |||||||
| Operations, maintenance and administration | 507.1 | 12.5 | 76.4 | 596.0 | |||||||
| Depreciation and amortization | 391.1 | 1.7 | 11.3 | 404.1 | |||||||
| Taxes, other than income taxes | 21.3 | – | – | 21.3 | |||||||
| Operating expenses | 919.5 | 14.2 | 87.7 | 1,021.4 | |||||||
| Operating income (loss) before corporate allocations | 486.2 | 42.7 | (87.7) | 441.2 | |||||||
| Corporate allocations | 76.4 | 11.3 | (87.7) | – | |||||||
| Operating income | $ | 409.8 | $ | 31.4 | $ | – | 441.2 | ||||
| Foreign exchange gain | 1.0 | ||||||||||
| Net interest expense | (188.6) | ||||||||||
| Equity loss | (0.9) | ||||||||||
| Earnings from continuing operations before income taxes | |||||||||||
| and non-controlling interests | $ | 252.7 | |||||||||
| Energy | |||||||||||
| Year ended Dec. 31, 2004 (Restated) | Generation | Marketing | Corporate | Total | |||||||
| Revenues | $ | 2,341.7 | $ | 244.5 | $ | – | $ | 2,586.2 | |||
| Trading purchases | – | (197.7) | – | (197.7) | |||||||
| Fuel and purchased power | (1,031.7) | – | – | (1,031.7) | |||||||
| Gross margin | 1,310.0 | 46.8 | – | 1,356.8 | |||||||
| Operations, maintenance and administration | 476.0 | 5.3 | 66.2 | 547.5 | |||||||
| Depreciation and amortization | 343.5 | 2.0 | 12.0 | 357.5 | |||||||
| Taxes, other than income taxes | 20.5 | – | – | 20.5 | |||||||
| Operating expenses | 840.0 | 7.3 | 78.2 | 925.5 | |||||||
| Prior period regulatory decision | – | (22.9) | – | (22.9) | |||||||
| Gain on sale of TransAlta Power partnership units | 44.8 | – | – | 44.8 | |||||||
| Gain on sale of Meridian cogeneration facility | 17.7 | – | – | 17.7 | |||||||
| Operating income (loss) before corporate allocations | 532.5 | 16.6 | (78.2) | 470.9 | |||||||
| Corporate allocations | 69.7 | 8.5 | (78.2) | – | |||||||
| Operating income | $ | 462.8 | $ | 8.1 | $ | – | 470.9 | ||||
| Foreign exchange gain | 0.7 | ||||||||||
| Net interest expense | (207.4) | ||||||||||
| Equity loss | (8.5) | ||||||||||
| Earnings from continuing operations before income taxes and non-controlling interests | $ | 255.7 | |||||||||
| 4 TransAlta Corporation Q4/05 |
|
- TransAlta's net earnings for the fourth quarter 2005 were $70.2 million or $0.35 per share compared to $62.1 million or $0.32 per share for the fourth quarter 2004. Included in net earnings for the fourth quarter 2005 is $12.0 million related to the favourable resolution of a tax dispute related to the corporation's discontinued operations. Fourth quarter earnings in 2004 included a $13.4 million after-tax gain from the disposition of the corporation's remaining interest in TA Power and an after-tax gain of $11.5 million related to the disposition of the corporation's 50 per cent interest in the Meridian cogeneration facility to TransAlta Cogeneration, L.P. (TA Cogen). On a comparable basis, net earnings were $58.2 million or $0.29 per share and $37.2 million or $0.19 per share for the fourth quarter 2005 and 2004, respectively.
- For the year ended Dec. 31, 2005, TransAlta's net earnings were $198.8 million or $1.01 per share compared to $170.2 million or $0.88 per share for the year ended Dec. 31, 2004. Included in net earnings for the year ended Dec. 31, 2005 is $12.0 million related to the resolution of the previously described tax dispute and $13.0 million related to the tax settlement on timing and taxability of certain revenues. Included in net earnings for the year ended Dec. 31, 2004 are $6.8 million related to the resolution of certain outstanding tax positions, $29.1 million related to the disposition of the corporation's remaining interest in TA Power, $11.5 million related to the disposition of the corporation's 50 per cent interest in Meridian, $9.6 million gain from discontinued operations, and an after-tax charge of $14.9 million related to a prior period regulatory decision. On a comparable basis, net earnings were $173.8 million or $0.88 per share and $128.1 milli on or $0.66 per share for the year ended Dec. 31, 2005 and 2004, respectively.
- For the three months and year ended Dec 31, 2005, TA Cogen, a subsidiary that is owned 50.01 per cent by TransAlta and 49.99 per cent by TA Power, a publicly traded entity, recorded an impairment charge of $78.3 million in respect of the Ottawa facility as the net book value of that facility exceeded its net recoverable amount, measured as the future cash flows from the facility. The net book value of the Ottawa facility in the accounts of the corporation is lower than that in TA Cogen. The carrying value in TransAlta is fully recoverable from future cash flows of the facility. The difference in net book value between the accounts of the corporation and TA Cogen is due to the higher purchase price of the plant by TA Cogen. The corporation has recognized an increase in depreciation expense of $36.2 million related to TA Power's share of the loss. This amount is offset by a recovery in the earnings attributable to non-controlling interests in the corporatio n's income statement.
GENERATION |
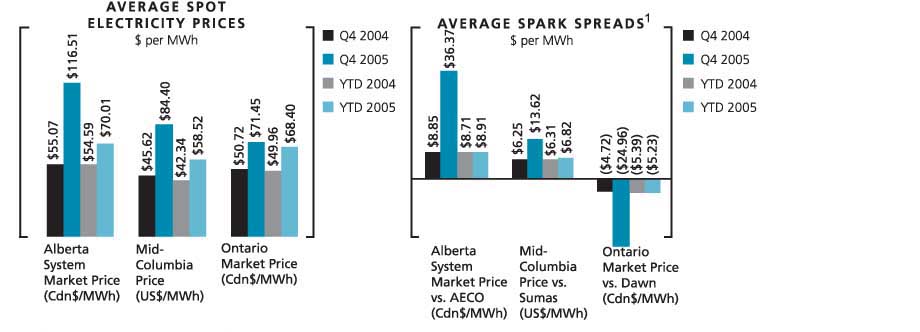
1 For a 7,000 Btu/KWh heat rate plant.
As shown in the above graphs, all markets had higher fourth quarter average electricity prices in 2005 compared to the same period in 2004. Significant year over year gas price strength dominated the market fundamentals to bolster power prices in all markets. Spark spreads (power price less cost of gas consumed) in Alberta and the Pacific Northwest were higher in the fourth quarter of 2005 compared to the same period in 2004 as demand growth outpaced supply additions over the year. In Ontario, lower demand and the November commissioning of Pickering A-1 reduced spark spreads compared to the same period last year.
| TransAlta Corporation Q4/05 5 |
Plannedmaintenance
The table below shows the amount of planned maintenance capitalized and expensed in the three months and year ended Dec. 31, 2005 and 2004, excluding Mexico and CE Generation LLC (CE Gen):
Coal | Gas and Hydro | Total | |||||||||||||||
| 3 months ended Dec. 31 | 2005 | 2004 | 2005 | 2004 | 2005 | 2004 | |||||||||||
| Capitalized | $ | 16.0 | $ | 16.3 | $ | 15.2 | $ | 4.5 | $ | 31.2 | $ | 20.8 | |||||
| Expensed | 10.8 | 4.6 | 0.6 | 0.5 | 11.4 | 5.1 | |||||||||||
| $ | 26.8 | $ | 20.9 | $ | 15.8 | $ | 5.0 | $ | 42.6 | $ | 25.9 | ||||||
| GWh lost | 458 | 462 | 111 | 79 | 569 | 541 | |||||||||||
Coal | Gas and Hydro | Total | |||||||||||||||
| Year ended Dec. 31 | 2005 | 2004 | 2005 | 2004 | 2005 | 2004 | |||||||||||
| Capitalized | $ | 69.9 | $ | 76.4 | $ | 49.2 | $ | 11.7 | $ | 119.1 | $ | 88.1 | |||||
| Expensed | 64.0 | 69.3 | 4.3 | 3.7 | 68.3 | 73.0 | |||||||||||
| $ | 133.9 | $ | 145.7 | $ | 53.5 | $ | 15.4 | $ | 187.4 | $ | 161.1 | ||||||
| GWh lost | 2,246 | 2,293 | 572 | 214 | 2,818 | 2,507 | |||||||||||
For the three months ended Dec. 31, 2005, the corporation capitalized $4.9 million on the purchase of long-lead materials for 2006 outages, and for the year ended Dec. 31, 2005, capitalized $6.2 million on such items.
In the three months and year ended Dec. 31, 2005, there were 569 GWh and 2,818 GWh of production lost due to planned maintenance compared to 541 GWh and 2,507 GWh lost for planned maintenance in the three months and year ended Dec. 31, 2004. During the fourth quarter of 2005, incremental outages in the gas fleet contributed 32 GWh of lost production over the same period in 2004. Lost production in the coal fleet remained consistent between periods. During the year ended Dec. 31, 2005, four major inspections ("C" inspections) in the gas fleet contributed to an additional 358 GWh of lost production in 2005 compared to the same period in 2004. Lost production from the coal fleet was 47 GWh lower in the year ended Dec. 31, 2005 as compared to 2004, driven primarily by improvements in durations on certain outages in 2005.
In the three months and year ended Dec. 31, 2005, capitalized maintenance costs increased by $10.4 million and $31.0 million, respectively, compared to the same period in 2004 due to incremental outages in the gas fleet in 2005 as compared to 2004. Expensed maintenance costs in the three months ended Dec. 31, 2005 increased by $6.3 million from the same period in 2004 due to the timing and nature of work performed in the period. For the year ended Dec. 31, 2005, expensed maintenance costs decreased by $4.7 million from the same period in 2004 due to increased activity in the gas fleet which has a higher proportion of capital spending.
Generation results-at-a-glance
| 2005 | 2004 | |||||||||||
| 3 months ended Dec. 31 | Total | Per MWh | Total | Per MWh | ||||||||
| Revenues | $ | 761.5 | $ | 56.79 | $ | 599.3 | $ | 45.69 | ||||
| Fuel and purchased power | (384.0) | (28.64) | (269.9) | (20.58) | ||||||||
| Gross margin | 377.5 | 28.15 | 329.4 | 25.11 | ||||||||
| Operations, maintenance and administration | 127.3 | 9.49 | 108.9 | 8.30 | ||||||||
| Depreciation and amortization | 133.1 | 9.93 | 86.9 | 6.63 | ||||||||
| Taxes, other than income taxes | 4.8 | 0.36 | 2.9 | 0.22 | ||||||||
| Operating expenses | 265.2 | 19.78 | 198.7 | 15.15 | ||||||||
| Gain on sale of TransAlta Power partnership units | – | – | 20.6 | 1.57 | ||||||||
| Gain on sale of Meridian cogeneration facility | – | – | 17.7 | 1.35 | ||||||||
| Operating income before corporate allocations | 112.3 | 8.37 | 169.0 | 12.88 | ||||||||
| Corporate allocations | 20.0 | 1.49 | 19.2 | 1.46 | ||||||||
| Operating income | $ | 92.3 | $ | 6.88 | $ | 149.8 | $ | 11.42 | ||||
| Production (GWh) | 13,408 | 13,117 | ||||||||||
| Availability (%) | 90.4 | 90.3 | ||||||||||
| 6 TransAlta Corporation Q4/05 |
|
| 2005 | 2004 | |||||||||||||||||||
| Year ended Dec. 31 | Total | Per MWh | Total | Per MWh | ||||||||||||||||
| Revenues | $ | 2,607.5 | $ | 50.33 | $ | 2,341.7 | $ | 45.56 | ||||||||||||
| Fuel and purchased power | (1,201.8) | (23.20) | (1,031.7) | (20.07) | ||||||||||||||||
| Gross margin | 1,405.7 | 27.13 | 1,310.0 | 25.49 | ||||||||||||||||
| Operations, maintenance and administration | 507.1 | 9.79 | 476.0 | 9.26 | ||||||||||||||||
| Depreciation and amortization | 391.1 | 7.55 | 343.5 | 6.68 | ||||||||||||||||
| Taxes, other than income taxes | 21.3 | 0.41 | 20.5 | 0.40 | ||||||||||||||||
| Operating expenses | 919.5 | 17.75 | 840.0 | 16.34 | ||||||||||||||||
| Gain on sale of Meridian cogeneration facility | – | – | 17.7 | 0.34 | ||||||||||||||||
| Gain on sale of TransAlta Power partnership units | – | – | 44.8 | 0.87 | ||||||||||||||||
| Operating income before corporate allocations | 486.2 | 9.38 | 532.5 | 10.36 | ||||||||||||||||
| Corporate allocations | 76.4 | 1.47 | 69.7 | 1.36 | ||||||||||||||||
| Operating income | $ | 409.8 | $ | 7.91 | $ | 462.8 | $ | 9.00 | ||||||||||||
| Production (GWh) | 51,810 | 51,396 | ||||||||||||||||||
| Availability (%) | 89.4 | 89.2 | ||||||||||||||||||
| Generation segmented gross margins | ||||||||||||||||||||
| Fuel & | ||||||||||||||||||||
| Fuel & | Purchased | Gross | ||||||||||||||||||
| Production | Purchased | Gross | Revenue | Power per | Margin | |||||||||||||||
3 months ended Dec. 31, 2005 | (GWh) | Revenue | Power | Margin | per MWh | MWh | per MWh | |||||||||||||
| Alberta PPAs | 6,205 | $ | 171.5 | $ | 59.3 | $ | 112.2 | $ | 27.64 | $ | 9.56 | $ | 18.08 | |||||||
| Long-term contracts | 1,674 | 188.2 | 123.9 | 64.3 | 112.42 | 74.01 | 38.41 | |||||||||||||
| Merchant | 4,744 | 328.7 | 179.9 | 148.8 | 69.29 | 37.92 | 31.37 | |||||||||||||
| CE Gen | 785 | 73.1 | 20.9 | 52.2 | 93.12 | 26.62 | 66.50 | |||||||||||||
| TOTAL | 13,408 | $ | 761.5 | $ | 384.0 | $ | 377.5 | $ | 56.79 | $ | 28.64 | $ | 28.15 | |||||||
| Fuel & | ||||||||||||||||||||
| Fuel & | Purchased | Gross | ||||||||||||||||||
| Production | Purchased | Gross | Revenue | Power per | Margin | |||||||||||||||
3 months ended Dec. 31, 2004 | (GWh) | Revenue | Power | Margin | per MWh | MWh | per MWh | |||||||||||||
| Alberta PPAs | 6,302 | $ | 162.4 | $ | 47.8 | $ | 114.6 | $ | 25.76 | $ | 7.58 | $ | 18.18 | |||||||
| Long-term contracts | 1,881 | 155.8 | 88.1 | 67.7 | 82.83 | 46.84 | 35.99 | |||||||||||||
| Merchant | 4,279 | 219.1 | 118.5 | 100.6 | 51.20 | 27.69 | 23.51 | |||||||||||||
| CE Gen | 655 | 62.0 | 15.5 | 46.5 | 94.66 | 23.66 | 71.00 | |||||||||||||
| TOTAL | 13,117 | $ | 599.3 | $ | 269.9 | $ | 329.4 | $ | 45.69 | $ | 20.58 | $ | 25.11 | |||||||
| Fuel & | ||||||||||||||||||||
| Fuel & | Purchased | Gross | ||||||||||||||||||
| Production | Purchased | Gross | Revenue | Power per | Margin | |||||||||||||||
| Year ended Dec. 31, 2005 | (GWh) | Revenue | Power | Margin | per MWh | MWh | per MWh | |||||||||||||
| Alberta PPAs | 25,279 | $ | 682.1 | $ | 201.6 | $ | 480.5 | $ | 26.98 | $ | 7.97 | $ | 19.01 | |||||||
| Long-term contracts | 6,947 | 647.9 | 392.7 | 255.2 | 93.26 | 56.53 | 36.73 | |||||||||||||
| Merchant | 16,630 | 983.2 | 535.2 | 448.0 | 59.12 | 32.18 | 26.94 | |||||||||||||
| CE Gen | 2,954 | 294.3 | 72.3 | 222.0 | 99.63 | 24.48 | 75.15 | |||||||||||||
| TOTAL | 51,810 | $ | 2,607.5 | $ | 1,201.8 | $ | 1,405.7 | $ | 50.33 | $ | 23.20 | $ | 27.13 | |||||||
| Fuel & | ||||||||||||||||||||
| Fuel & | Purchased | Gross | ||||||||||||||||||
| Production | Purchased | Gross | Revenue | Power per | Margin | |||||||||||||||
| Year ended Dec. 31, 2004 | (GWh) | Revenue | Power | Margin | per MWh | MWh | per MWh | |||||||||||||
| Alberta PPAs | 25,836 | $ | 679.2 | $ | 187.9 | $ | 491.3 | $ | 26.29 | $ | 7.27 | $ | 19.02 | |||||||
| Long-term contracts | 7,183 | 581.9 | 341.9 | 240.0 | 81.01 | 47.60 | 33.41 | |||||||||||||
| Merchant | 15,676 | 799.5 | 435.2 | 364.3 | 51.00 | 27.76 | 23.24 | |||||||||||||
| CE Gen | 2,701 | 281.1 | 66.7 | 214.4 | 104.07 | 24.69 | 79.38 | |||||||||||||
| TOTAL | 51,396 | $ | 2,341.7 | $ | 1,031.7 | $ | 1,310.0 | $ | 45.56 | $ | 20.07 | $ | 25.49 | |||||||
| TransAlta Corporation Q4/05 7 |
Availability for the three months and year ended Dec. 31, 2005 is consistent with the corresponding periods in 2004.
For the three months ended Dec. 31, 2005, production increased by 291 GWh to 13,408 GWh. Alberta Power Purchase Arrangement (Alberta PPA) volumes for the three months ended Dec. 31, 2005 were comparable to the same period in 2004. Merchant volumes were up by 465 GWh to 4,744 GWh due to the commissioning of Genesee 3 (365 GWh), favorable spark spreads at Centralia Gas (119 GWh), and increased output at Centralia Coal (81 GWh). These increases were partially offset by production losses from the decommission-ing of units one and two of the Wabamun plant (236 GWh). Long-term contract volumes decreased 207 GWh to 1,674 GWh due to lower production at Sarnia (68 GWh), planned maintenance and lower customer demand at Ft. Saskatchewan (79 GWh) and higher unplanned maintenance at Windsor and Mississauga (48 GWh). CE Gen volumes increased 130 GWh to 785 GWh due to increased production at the Power Resources facility and Saranac.
For the year ended Dec. 31, 2005, production was 51,810 GWh compared to 51,396 GWh in 2004. Alberta PPA volumes decreased 557 GWh due to higher planned maintenance in 2005 (267 GWh). Merchant volumes increased 954 GWh to 16,630 GWh due to the commissioning of Genesee 3 (1,308 GWh), increased hydro production due to higher rainfall in 2005 and low reservoir levels in 2004 (345 GWh), incremental production at unit four of the Wabamun plant (388 GWh) as a major maintenance outage was performed in 2004, incremental production from Summerview (140 GWh), as well as increased production from the Sarnia facility (126 GWh). These increases were partially offset by the decommissioning of units one and two of the Wabamun plant (858 GWh), the impact of the Canadian National Railway Company (CN Rail) train derailment at Wabamun (208 GWh), and the impact of planned maintenance and reduced customer demand at Poplar Creek (299 GWh).
Gross margin increased $48.1 million for the three months ended Dec. 31, 2005 to $377.5 million. Margins at the Alberta PPA plants were flat compared to 2004 as higher prices were offset by increased penalties for planned outages and increased coal costs. Margins for long-term contracts were also flat compared to 2004 while merchant margins increased $48.2 million to $148.8 million during the period. The increase was due to higher production and pricing at Centralia Coal ($20.6 million); incremental production from Genesee 3 ($20.1 million); higher hydro volumes and pricing ($12.1 million); favourable spark spreads at Poplar Creek ($10.1 million); and favourable volume and prices at our windfarms ($5.2 million). These increases were partially offset by higher fuel costs at Centralia ($13.5 million) and the decommissioning of units one and two of the Wabamun plant ($9.0 million). Gross margin at CE Gen increased by $5.7 million due to higher prices partially offset by higher gas costs.
For the year ended Dec. 31, 2005, gross margin increased $95.7 million to $1,405.7 million. Margins at the Alberta PPA plants declined $10.8 million to $480.5 million due to higher net penalties paid from lost production ($7.9 million) and increased coal costs ($17.9 million), partially offset by increases to the indices within the Alberta PPAs ($7.0 million). Merchant gross margin increased $83.7 million to $448.0 million due to the addition of Genesee 3 ($60.0 million), reduced planned maintenance at Wabamun ($16.2 million), increased hydro production and pricing ($36.3 million) and increased price and production at Centralia Coal ($46.0 million). These increases were offset by higher fuel costs at Centralia Coal ($41.0 million), lost margin due to the CN Rail train derailment at Wabamun ($7.2 million) and the decommissioning of units one and two of the Wabamun plant ($29.2 million). Long-term contract margins increased $15.2 million to $255.2 million primarily d ue to increased thermal volumes at Sarnia ($5.5 million) and revised contract pricing at the other gas plants ($11.7 million). Margins at CE Gen increased $7.6 million to $222.0 million due to higher volume partially offset by higher gas prices and foreign exchange.
OM&A costs increased $18.4 million for the three months ended Dec. 31, 2005 to $127.3 million. Major maintenance expenses were $6.3 million higher than the same period in 2004. Incremental OM&A at Genesee 3 ($3.0 million), additional fleet equipment repairs ($2.6 million) and cost escalations related to labour and materials contributed to the increase.
For the year ended Dec. 31, 2005, OM&A increased $31.1 million to $507.1 million. The increase is due to cost escalations that are recovered through revenue at the Alberta plants ($5.9 million), incremental costs from Genesee 3 ($9.5 million), additional fleet equipment repairs ($8.5 million), and increased incentive compensation and cost escalations related to labour and materials expenses, partially offset by the decommissioning of units one and two of the Wabamun plant ($2.7 million) and lower planned maintenance expenses ($4.7 million).
Depreciation and amortization increased for the three months ended Dec. 31, 2005 by $46.2 million to $133.1 million due to the impairment provision recorded by TA Cogen related to the Ottawa facility ($36.2 million), the addition of Genesee 3, and the retirement of equipment replaced during planned maintenance.
Depreciation and amortization increased for the year ended Dec. 31, 2005 to $391.1 million from $343.5 million, for the reasons outlined above.
| 8 TransAlta Corporation Q4/05 |
|
Energy Marketing results-at-a-glance
The results of the Energy Marketing segment are as follows:
3 months ended Dec. 31 | Year ended Dec. 31 | ||||||||||
| 2005 | 2004 | 2005 | 2004 | ||||||||
| Revenues | $ | 48.6 | $ | 60.8 | $ | 231.0 | $ | 244.5 | |||
| Trading purchases | (38.9) | (57.3) | (174.1) | (197.7) | |||||||
| Gross margin | 9.7 | 3.5 | 56.9 | 46.8 | |||||||
| Operations, maintenance and administration | 4.3 | 0.3 | 12.5 | 5.3 | |||||||
| Depreciation and amortization | 0.4 | 0.5 | 1.7 | 2.0 | |||||||
| Operating expenses | 4.7 | 0.8 | 14.2 | 7.3 | |||||||
| Prior period regulatory decision | – | – | – | 22.9 | |||||||
| Operating income before corporate allocations | 5.0 | 2.7 | 42.7 | 16.6 | |||||||
| Corporate allocations | 2.9 | 2.2 | 11.3 | 8.5 | |||||||
| Operating income | $ | 2.1 | $ | 0.5 | $ | 31.4 | $ | 8.1 | |||
Revenues include all power and gas trading activities which are recorded net, in addition to gross revenues related to energy trading contracts settled in real-time physical markets. For the three months ended Dec. 31, 2005, real-time physical power purchases decreased by $18.4 million relative to the same period in 2004 due to TransAlta's decision to exit an energy services agreement effective April 2005. In the three months ended Dec. 31, 2005, gross margin increased by $6.2 million compared to the same period in 2004 due to the impact of losses on gas trading activities during the hurricane season in 2004, combined with gains on gas positions in 2005.
For the year ended Dec. 31, 2005, real-time physical power purchases decreased by $23.6 million relative to the same period in 2004 due to the termination of the energy services agreement noted above, partially offset by increased real-time physical power purchases. For the year ended Dec. 31, 2005, gross margin increased by $10.1 million compared to the same period in 2004 due to strong second quarter western region results in electricity trading in 2005 combined with gains on gas positions.
OM&A costs for the three months and year ended Dec. 31, 2005 increased by $4.0 million and $7.2 million, respectively, relative to the same periods in 2004 due to higher compensation expenses and increased project consulting costs. OM&A is net of Energy Marketing's inter-segment charge for management services in the amount of $6.5 million (2004 - $6.5 million) for the three months ended Dec. 31, 2005, and $26.0 million (2004 - $26.0 million) for the year ended Dec. 31, 2005.
The prior period regulatory decision relates to an additional pre-tax provision of $22.9 million recorded in 2004 for amounts owing to the California Independent System Operator, California Power Exchange and the Automated Power Exchange.
PRICERISKMANAGEMENT
The following tables show the balance sheet classification for price risk management assets and liabilities, as well as the changes in the fair value of the net price risk management assets for the period.
| Dec. 31, | Dec. 31, | ||||
| Balance Sheet | 2005 | 2004 | |||
| Price risk management assets | |||||
| Current | $ | 63.8 | $ | 41.9 | |
| Long-term | 13.8 | 11.3 | |||
| Price risk management liabilities | |||||
| Current | (58.3) | (27.7) | |||
| Long-term | (8.6) | (10.0) | |||
| Net price risk management assets outstanding | $ | 10.7 | $ | 15.5 | |
| Change in fair value of net assets | Fair value | ||||
| Net price risk management assets outstanding at Dec. 31, 2004 | $ | 15.5 | |||
| Contracts realized, amortized or settled during the year | (24.4) | ||||
| Changes in values attributable to market price and other market changes | 6.1 | ||||
| New contracts entered into during the current calendar year | 13.5 | ||||
| Net price risk management assets outstanding at Dec. 31, 2005 | $ | 10.7 | |||
| TransAlta Corporation Q4/05 9 |
For the year ended Dec. 31, 2005, the net price risk management assets and liabilities decreased by $4.8 million compared to the same period in 2004 primarily due to contracts settled in the year partially offset by new contracts entered in the 2005 year and value changes associated with contracts which existed at both year ends.
The source of the valuations of the above contracts and maturities over each of the next five calendar years and thereafter are as follows:
| 2011 and | ||||||||||||||||||||
| 2006 | 2007 | 2008 | 2009 | 2010 | thereafter | Total | ||||||||||||||
| Prices actively quoted | $ | 1.6 | $ | 1.0 | $ | 2.1 | $ | 1.3 | $ | 0.8 | $ | – | $ | 6.8 | ||||||
| Prices based on models | 3.9 | – | – | – | – | – | 3.9 | |||||||||||||
| $ | 5.5 | $ | 1.0 | $ | 2.1 | $ | 1.3 | $ | 0.8 | $ | – | $ | 10.7 | |||||||
NET INTEREST EXPENSE AND NON-CONTROLLING INTERESTS |
Net interest expense decreased $5.6 million and $18.8 million in the three months and year ended Dec. 31, 2005, respectively, compared to the same periods in 2004. The decrease is primarily a result of the repayment of $300 million of preferred securities in February 2005, and overall reductions in debt balances.
Non-controlling interest for the three months and year ended Dec. 31, 2005 were impacted by the impairment charge of $36.2 million recorded in respect of the Ottawa facility. This amount is recorded as a recovery in the non-controlling interests. Adjusting for this recovery, non-controlling interests increased to $17.5 million and $54.7 million in the three months and year ended Dec. 31, 2005, compared to $14.7 million and $46.0 million in the same periods in 2004. The increase is due to the disposition of the corporation's remaining interest in TA Power related to the sale of the Sheerness facility in 2003.
INCOME TAXES |
Income tax expense for the three months ended Dec. 31, 2005 was $12.8 million compared to $26.3 million for the same period in 2004 or 18 per cent of pre-tax earnings, compared to 30 per cent in the same period in 2004. The lower tax rate in the fourth quarter is due to adjustments to the timing of the deductibility of certain expenditures related to planned maintenance and mining activities.
For the year ended Dec. 31, 2005, income tax expense was $47.4 million compared to $49.1 million in 2004. Included in income tax expense for 2005 is a $13.0 million recovery related to the favourable settlement of previously described tax disputes during the year. Included in income tax expense for the year ended Dec. 31, 2004 is $6.8 million related to a tax settlement on the corporation's New Zealand operations. Adjusting for these two items, income taxes for the year ended Dec. 31, 2005 and 2004 were $60.4 million and $55.9 million or 26 per cent and 27 per cent, respectively.
During the fourth quarter of 2005, TransAlta also settled a dispute over the timing of revenue recognition related to the sale of the Distribution and Retail business. This settlement resulted in the release of a $12.0 million tax provision related to the sale and is shown as discontinued operations.
NON-GAAP MEASURES |
TransAlta evaluates its performance and the performance of its business segments using a variety of measures. Those discussed below are not defined under Canadian GAAP and therefore should not be considered in isolation or as an alternative to, or more meaningful than, net income or cash flow from operations as determined in accordance with GAAP as an indicator of the corporation's financial performance or liquidity. These measures are not necessarily comparable to a similarly titled measure of another company.
Each business unit assumes responsibility for its operating results measured to gross margin and operating income. Operating income is a measure of financial performance used by TransAlta's analysts and investors to analyze and compare companies on the basis of operating performance.
Operating income provides management with a measurement of operating performance which is readily comparable from period to period.
| 10 TransAlta Corporation Q4/05 |
|
Gross margin and operating income are reconciled to net earnings below:
| 3 months ended Dec. 31 | Year ended Dec. 31 | ||||||||||
| 2005 | 20041 | 2005 | 20041 | ||||||||
| Gross margin | $ | 387.2 | $ | 332.9 | $ | 1,462.6 | $ | 1,356.8 | |||
| Operating expenses | (292.8) | (220.9) | (1,021.4) | (925.5) | |||||||
| 94.4 | 112.0 | 441.2 | 431.3 | ||||||||
| Gain on sale of Meridian cogeneration facility | – | 17.7 | – | 17.7 | |||||||
| Gain on sale of TA Power partnership units | – | 20.6 | – | 44.8 | |||||||
| Prior period regulatory decision | – | – | – | (22.9) | |||||||
| Operating income | 94.4 | 150.3 | 441.2 | 470.9 | |||||||
| Foreign exchange (loss) gain | (0.7) | 3.1 | 1.0 | 0.7 | |||||||
| Net interest expense | (40.4) | (46.0) | (188.6) | (207.4) | |||||||
| Equity loss | (1.0) | (4.3) | (0.9) | (8.5) | |||||||
| Earnings before non-controlling interests and income taxes | 52.3 | 103.1 | 252.7 | 255.7 | |||||||
| Non-controlling interests | (18.7) | 14.7 | 18.5 | 46.0 | |||||||
| Earnings before income taxes | 71.0 | 88.4 | 234.2 | 209.7 | |||||||
| Income tax expense | 12.8 | 26.3 | 47.4 | 49.1 | |||||||
| Earnings from continuing operations | 58.2 | 62.1 | 186.8 | 160.6 | |||||||
| Gain on disposal of discontinued operations, net of tax | 12.0 | – | 12.0 | 9.6 | |||||||
| Net earnings | $ | 70.2 | $ | 62.1 | $ | 198.8 | $ | 170.2 | |||
1 TransAlta adopted the new accounting standard for variable interest entities on Jan. 1, 2005. Prior periods have been restated.
Presenting earnings on a comparable basis from period to period provides management with the ability to evaluate earnings trends more readily in comparison with prior periods' results. To do so, the following items which management believes would otherwise affect the comparability of TransAlta's operating results from period to period are excluded from net earnings: material tax adjustments, gain on sale of TA Power units and the Meridian Cogeneration Facility and prior period regulatory decisions, and earnings from discontinued operations, net of tax.
Earnings presented on a comparable basis from period to period is reconciled to net earnings below:
| 3 months ended Dec. 31 | Year ended Dec. 31 | ||||||||||
| 2005 | 20041 | 2005 | 20041 | ||||||||
| Earnings on a comparable basis | $ | 58.2 | $ | 37.2 | $ | 173.8 | $ | 128.1 | |||
| Tax settlement on deferred receivable | – | – | 13.0 | – | |||||||
| Gain on sale of Meridian cogeneration facility, net of tax | – | 11.5 | – | 11.5 | |||||||
| Gain on sale of TA Power units, net of tax | – | 13.4 | – | 29.1 | |||||||
| Prior period regulatory decision, net of tax | – | – | – | (14.9) | |||||||
| Gain from discontinued operations, net of tax | – | – | – | 9.6 | |||||||
| Tax settlement on discontinued operations | 12.0 | – | 12.0 | – | |||||||
| New Zealand tax settlement | – | – | – | 6.8 | |||||||
| Net earnings | $ | 70.2 | $ | 62.1 | $ | 198.8 | $ | 170.2 | |||
| Weighted average common shares outstanding in the period | 198.0 | 194.0 | 196.8 | 192.7 | |||||||
| Earnings on a comparable basis per share | $ | 0.29 | $ | 0.19 | $ | 0.88 | $ | 0.66 | |||
1 TransAlta adopted the new accounting standard for variable interest entities on Jan. 1, 2005. Prior periods have been restated.
| TransAlta Corporation Q4/05 11 |
TRANSALTA CORPORATION
CONSOLIDATED STATEMENTS OF EARNINGS AND RETAINED EARNINGS
(IN MILLIONS OF CANADIAN DOLLARS EXCEPT PER SHARE AMOUNTS)
| 3 months ended Dec. 31 | Year ended Dec. 31 | ||||||||||
| Unaudited | 2005 | 2004 | 2005 | 2004 | |||||||
(Restated) | (Restated) | ||||||||||
| Revenues | $ | 810.1 | $ | 660.1 | $ | 2,838.5 | $ | 2,586.2 | |||
| Trading purchases | (38.9) | (57.3) | (174.1) | (197.7) | |||||||
| Fuel and purchased power | (384.0) | (269.9) | (1,201.8) | (1,031.7) | |||||||
| Gross margin | 387.2 | 332.9 | 1,462.6 | 1,356.8 | |||||||
| Operations, maintenance and administration | 152.0 | 127.8 | 596.0 | 547.5 | |||||||
| Depreciation and amortization | 136.0 | 90.2 | 404.1 | 357.5 | |||||||
| Taxes, other than income taxes | 4.8 | 2.9 | 21.3 | 20.5 | |||||||
| Operating expenses | 292.8 | 220.9 | 1,021.4 | 925.5 | |||||||
| Gain on sale of Meridian cogeneration facility | – | (17.7) | – | (17.7) | |||||||
| Gain on sale of TransAlta Power partnership units | – | (20.6) | – | (44.8) | |||||||
| Prior period regulatory decision | – | – | – | 22.9 | |||||||
| – | (38.3) | – | (39.6) | ||||||||
| Operating income | 94.4 | 150.3 | 441.2 | 470.9 | |||||||
| Foreign exchange (loss) gain | (0.7) | 3.1 | 1.0 | 0.7 | |||||||
| Net interest expense | (40.4) | (46.0) | (188.6) | (207.4) | |||||||
| Equity loss | (1.0) | (4.3) | (0.9) | (8.5) | |||||||
| Earnings before non-controlling interests and income taxes | 52.3 | 103.1 | 252.7 | 255.7 | |||||||
| Non-controlling interests | (18.7) | 14.7 | 18.5 | 46.0 | |||||||
| Earnings before income taxes | 71.0 | 88.4 | 234.2 | 209.7 | |||||||
| Income tax expense | 12.8 | 26.3 | 47.4 | 49.1 | |||||||
| Earnings from continuing operations | 58.2 | 62.1 | 186.8 | 160.6 | |||||||
| Earnings from discontinued operations, net of tax | 12.0 | – | 12.0 | 9.6 | |||||||
| Net earnings | 70.2 | 62.1 | 198.8 | 170.2 | |||||||
| Common share dividends | (49.6) | (48.6) | (196.9) | (192.7) | |||||||
| Adjustment arising from normal course issuer bid | – | – | – | (1.1) | |||||||
| Retained earnings | |||||||||||
| Opening balance | 891.6 | 896.8 | 910.3 | 933.9 | |||||||
| Closing balance | $ | 912.2 | $ | 910.3 | $ | 912.2 | $ | 910.3 | |||
| Weighted average common shares outstanding in the period | 198.0 | 194.0 | 196.8 | 192.7 | |||||||
| Basic earnings per share | |||||||||||
| Earnings from continuing operations | $ | 0.29 | $ | 0.32 | $ | 0.95 | $ | 0.83 | |||
| Earnings from discontinued operations | 0.06 | – | 0.06 | 0.05 | |||||||
| Net earnings | $ | 0.35 | $ | 0.32 | $ | 1.01 | $ | 0.88 | |||
| Diluted earnings per share | |||||||||||
| Earnings from continuing operations | $ | 0.29 | $ | 0.32 | $ | 0.95 | $ | 0.83 | |||
| Earnings from discontinued operations | 0.06 | – | 0.06 | 0.05 | |||||||
| Net earnings | $ | 0.35 | $ | 0.32 | $ | 1.01 | $ | 0.88 | |||
| 12 TransAlta Corporation Q4/05 |
|
TRANSALTA CORPORATION
CONSOLIDATED STATEMENTS OF CASH FLOWS
(IN MILLIONS OF CANADIAN DOLLARS)
| 3 months ended Dec. 31 | Year ended Dec. 31 | ||||||||||
| Unaudited | 2005 | 2004 | 2005 | 2004 | |||||||
| (Restated) | (Restated) | ||||||||||
| Operating activities | |||||||||||
| Net earnings | $ | 70.2 | $ | 62.1 | $ | 198.8 | $ | 170.2 | |||
| Depreciation and amortization | 146.3 | 97.6 | 437.1 | 390.1 | |||||||
| Non-controlling interests | (18.7) | 14.7 | 18.5 | 46.0 | |||||||
| Asset retirement obligation accretion | 4.1 | 3.9 | 19.3 | 19.3 | |||||||
| Future income taxes | (5.4) | 16.8 | 5.6 | 17.8 | |||||||
| Change in the unrealized gains from Energy Marketing activities | 10.2 | (4.9) | 4.9 | (9.7) | |||||||
| Asset retirement obligation costs settled | (8.4) | (3.0) | (29.4) | (19.7) | |||||||
| Foreign exchange loss (gain) | 0.7 | (3.1) | (1.0) | (0.7) | |||||||
| Gain on sale of assets | – | (13.8) | – | (24.7) | |||||||
| Equity loss | 1.0 | 4.3 | 0.9 | 8.5 | |||||||
| Other non-cash items | 4.8 | (3.2) | (3.0) | – | |||||||
| Prior period regulatory decision | – | – | – | 22.9 | |||||||
| Gain on sale of TransAlta Power partnership units | – | (20.6) | – | (44.8) | |||||||
| 204.8 | 150.8 | 651.7 | 575.2 | ||||||||
| Change in non-cash operating working capital balances | 7.1 | 25.1 | (32.3) | 16.0 | |||||||
| Cash flow from operating activities | 211.9 | 175.9 | 619.4 | 591.2 | |||||||
| Investing activities | |||||||||||
| Long-term receivables | – | – | – | 90.8 | |||||||
| Additions to property, plant and equipment | (103.6) | (77.6) | (325.5) | (345.7) | |||||||
| Proceeds on sale of property, plant and equipment | – | 30.5 | 1.6 | 43.2 | |||||||
| Proceeds on sale of TransAlta Power partnership units | – | 54.8 | – | 116.5 | |||||||
| Equity investment | (24.2) | (25.7) | (9.3) | (10.1) | |||||||
| Restricted cash | 7.0 | (2.4) | 2.3 | 1.1 | |||||||
| Realized foreign exchange gain on net investment hedges | 6.6 | 37.6 | 89.8 | 47.8 | |||||||
| Deferred charges and other | (1.0) | (1.1) | (1.0) | (1.0) | |||||||
| Cash flow (used in) from investing activities | (115.2) | 16.1 | (242.1) | (57.4) | |||||||
| Financing activities | |||||||||||
| Repayment of short-term debt | (163.3) | (12.5) | (23.6) | (85.4) | |||||||
| Repayment of long-term debt | (99.2) | (149.6) | (139.3) | (284.7) | |||||||
| Dividends on common shares | (2.4) | (32.8) | (99.2) | (135.4) | |||||||
| Issuance of long-term debt | 200.0 | – | 200.0 | 2.7 | |||||||
| Redemption of common shares | – | (0.8) | – | (2.3) | |||||||
| Redemption of preferred securities | – | – | (300.0) | – | |||||||
| Net proceeds on issuance of common shares | 6.2 | 1.0 | 19.6 | 3.4 | |||||||
| Distributions to subsidiaries’ non-controlling interests | (24.1) | (14.9) | (77.5) | (48.4) | |||||||
| Deferred financing charges and other | – | (1.2) | – | (1.2) | |||||||
| Reduction in advance to TransAlta Power | 10.5 | 2.0 | 23.7 | 2.0 | |||||||
| Cash flow used in financing activities | (72.3) | (208.8) | (396.3) | (549.3) | |||||||
| Cash flow from (used in) operating, investing and financing activities | 24.4 | (16.8) | (19.0) | (15.5) | |||||||
| Effect of translation on foreign currency cash | (1.1) | (7.1) | (2.9) | (7.1) | |||||||
| Increase (decrease) in cash and cash equivalents | 23.3 | (23.9) | (21.9) | (22.6) | |||||||
| Cash and cash equivalents, beginning of period | 56.0 | 125.1 | 101.2 | 123.8 | |||||||
| Cash and cash equivalents, end of period | $ | 79.3 | $ | 101.2 | $ | 79.3 | $ | 101.2 | |||
| Cash taxes paid | $ | (17.0) | $ | (19.4) | $ | 14.7 | $ | 4.6 | |||
| Cash interest paid | $ | 47.7 | $ | 58.1 | $ | 183.7 | $ | 218.2 | |||
| TransAlta Corporation Q4/05 13 |
TRANSALTA CORPORATION
CONSOLIDATED STATEMENTS BALANCE SHEETS
(IN MILLIONS OF CANADIAN DOLLARS)
| Dec. 31, | Dec. 31, | ||||
| Unaudited | 2005 | 2004 | |||
(Restated) | |||||
| ASSETS | |||||
| Current assets | |||||
| Cash and cash equivalents | $ | 79.3 | $ | 101.2 | |
| Accounts receivable | 593.4 | 422.5 | |||
| Prepaid expenses | 75.8 | 52.3 | |||
| Price risk management assets | 63.8 | 41.9 | |||
| Future income tax assets | 26.6 | 21.5 | |||
| Income taxes receivable | 48.8 | 60.1 | |||
| Inventory | 27.7 | 39.9 | |||
| Current portion of other assets | 10.9 | 301.0 | |||
| 926.3 | 1,040.4 | ||||
| Restricted cash | 6.3 | 8.9 | |||
| Investments | 414.3 | 421.3 | |||
| Property, plant and equipment | |||||
| Cost | 8,411.8 | 8,295.4 | |||
| Accumulated depreciation | (2,866.3) | (2,592.8) | |||
| 5,545.5 | 5,702.6 | ||||
| Goodwill | 137.6 | 142.2 | |||
| Intangible assets | 349.8 | 392.3 | |||
| Future income tax assets | 147.1 | 132.0 | |||
| Price risk management assets | 13.8 | 11.3 | |||
| Other assets | 241.9 | 199.7 | |||
| Total assets | $ | 7,782.6 | $ | 8,050.7 | |
| LIABILITIES AND SHAREHOLDERS' EQUITY | |||||
| Current liabilities | |||||
| Short-term debt | $ | 13.1 | $ | 34.4 | |
| Accounts payable and accrued liabilities | 590.3 | 442.6 | |||
| Price risk management liabilities | 58.3 | 27.7 | |||
| Income taxes payable | 13.8 | 6.1 | |||
| Future income tax liabilities | 18.2 | 11.1 | |||
| Dividends payable | 50.5 | 19.3 | |||
| Deferred credits and other current liabilities | 0.4 | 241.5 | |||
| Current portion of long-term debt - recourse | 354.2 | 538.1 | |||
| Current portion of long-term debt - non-recourse | 42.2 | 42.0 | |||
| 1,141.0 | 1,362.8 | ||||
| Long-term debt - recourse | 1,887.0 | 1,939.8 | |||
| Long-term debt - non-recourse | 321.6 | 381.3 | |||
| Preferred securities | 175.0 | 175.0 | |||
| Deferred credits and other long-term liabilities | 407.4 | 391.5 | |||
| Future income tax liabilities | 740.3 | 703.9 | |||
| Price risk management liabilities | 8.6 | 10.0 | |||
| Non-controlling interests | 558.6 | 616.4 | |||
| Common shareholders' equity | |||||
| Common shares | 1,697.9 | 1,611.9 | |||
| Retained earnings | 912.2 | 910.3 | |||
| Cumulative translation adjustment | (67.0) | (52.2) | |||
| 2,543.1 | 2,470.0 | ||||
| Total liabilities and shareholders' equity | $ | 7,782.6 | $ | 8,050.7 | |
| 14 TransAlta Corporation Q4/05 |
|
RESTATEMENT |
Effective Jan. 1, 2005, TransAlta retroactively adopted the Canadian Institute of Chartered Accountant Accounting Guideline 15 "Consolidation of Variable Interest Entities". The consolidated statements of earnings and retained earnings, statements of cash flows, and balance sheets for the three months and year ended Dec. 31, 2004 have been restated to reflect the change in accounting principle.
OUTLOOK |
The key factors affecting the financial results for 2006 are the megawatt capacity in place, the availability of and production from generating assets, the margins applicable to non-contracted production, the costs of production, and the volumes traded and margins achieved on Energy Marketing activities.
Production and availability
For 2006, production is expected to increase as a result of a full year of production from Genesee 3 and recovery of lost production due to the CN Rail train derailment in 2005. Availability is expected to increase slightly due to reduced planned maintenance, primarily at gas facilities.
Heavy rainfall in the Pacific Northwest experienced early in 2006 is affecting Centralia mine operations and power production in the short-term. The impact of the abnormal rainfall on our ability to deliver coal to the plant to produce electricity is being partially offset by increasing coal imports, de-rating the plant when required, purchasing replacement power and running Centralia Gas when economically feasible. We are anticipating between 650 GWh’s and 950 GWh’s of lower production at the Centralia Coal plant during the first quarter of 2006.
Power prices
Electricity spot prices for 2006 are expected to be comparable to those experienced in 2005 in all markets. Gas price strength is expected to continue with downward pressure a possibility later in the year when the current heating season comes to a close. Our assumption is that 2006 gas prices will be similar to those achieved in 2005. Alberta and the Pacific Northwest markets should see minimal supply additions and good demand growth, average hydro reservoir levels in the Pacific Northwest should keep power prices in both markets relatively unchanged year over year. In Ontario, additional nuclear supply should offset organic demand growth and leave prices and heat rates comparable year over year. Summer weather conditions could also impact demand. Overall, in 2006, spark spreads should also remain relatively unchanged across all markets relative to 2005.
Exposure to volatility in electricity prices and spark spreads is substantially mitigated through firm-price, long-term electricity sales contracts and hedging arrangements. For 2006, approximately 87 per cent of output is contracted, of which a significant portion relates to the Alberta PPAs, which are based on achieving specified availability rates. For the first quarter of 2006, approximately 89 per cent of Alberta and 88 per cent of Pacific Northwest exposure is hedged. TransAlta continues to manage future price exposure as market liquidity exists.
Fuel costs
Mining coal is subject to cost increases due to inflation and diesel commodity prices, which the corporation seeks to mitigate through diesel hedges. Seasonal variations in coal mining are minimized through the application of standard costing.
The coal mines continue to be exposed to increasing input costs, higher amounts of overburden being removed and mining operations moving further away from the power plants. We expect these conditions to continue at Centralia until new areas of the mine are opened.
Exposure on gas costs for facilities under long-term sales contracts are minimized to the extent possible through long-term gas purchase contracts or corresponding offsets within revenues. Merchant gas facilities are exposed to the changes in spark spreads, discussed in the power prices section. TransAlta has not entered into fixed commodity agreements for gas for these merchant plants as gas will be purchased coincident with spot pricing.
Operations, maintenance and administration costs
OM&A costs per megawatt hour (MWh) fluctuate by quarter and are dependent on the timing and nature of maintenance activities. OM&A costs per MWh for 2006 are expected to be consistent with 2005.
Capital and maintenance expenditures
Capital expenditures for 2006 are expected to be approximately $260 million to $275 million (excluding Mexico) of which approximately $110 million will be spent on major maintenance (excluding CE Gen) and $45 million will be spent on the Alberta and Centralia mines. The remainder will be spent at CE Gen and on productivity related investments. Financing for these expenditures is expected to be provided by cash flow from operations.
| TransAlta Corporation Q4/05 15 |
Planned maintenance
During 2006, TransAlta expects to spend between $165 million and $185 million on planned maintenance as outlined in the following table (excluding CE Gen & Mexico):
| Gas and | ||||||||
Coal | Hydro | Total | ||||||
| Capitalized | $ | 70-75 | $ | 30-35 | $ | 100-110 | ||
| Expensed | 65-70 | 0-5 | 65-75 | |||||
| $ | 135-145 | $ | 30-40 | $ | 165-185 | |||
| GWh lost | 2,250-2,300 | 200-225 | 2,450-2,525 | |||||
TransAlta expects to lose approximately 2,500 GWh of production due to planned maintenance during 2006. In 2006, TransAlta expects to capitalize $15.0 million on planned maintenance activities in Mexico and lose approximately 300 GWh.
Exposure to fluctuations in foreign currencies
TransAlta's strategy is to minimize the impact of fluctuations in the Canadian dollar against the U.S. dollar by offsetting foreign denominated assets with foreign denominated liabilities. TransAlta also has foreign currency expenses, primarily interest charges that offset foreign currency revenues.
Net interest expense
Net interest expense for 2006 is expected to decline slightly compared to 2005 as a result of lower debt levels.
Liquidity and capital resources
With the increased volatility in power and gas markets, market trading opportunities are expected to increase, which can potentially cause the need for additional liquidity. To mitigate this liquidity risk, the corporation maintains a $1.5 billion committed credit facility and monitors exposures to determine any liquidity requriements.
Sarnia
Negotiations with the Ontario Power Authority are continuing and a preliminary agreement has been reached on basic contract terms. A contract with the Ontario Power Authority is expected to be finalized in the next few months.
FORWARD-LOOKING STATEMENTS |
This news release contains forward-looking statements, including statements regarding the business and anticipated financial performance of TransAlta. In some cases, forward-looking statements can be identified by terms such as 'may', 'will', 'believe', 'expect', 'potential', 'enable', 'continue' or other comparable terminology. These statements are not guarantees of TransAlta's future performance and are subject to risks, uncertainties and other important factors that could cause the corporation's actual performance to be materially different from those projected. Some of the risks, uncertainties, and factors include, but are not limited to: legislative and regulatory developments that could affect revenues, costs, the speed and degree of competition entering the market; global capital markets activity; timing and extent of changes in commodity prices, prevailing interest rates, currency exchange rates, inflation levels and general economic conditions in geographic areas where TransAlta operates; results of financing efforts; changes in counterparty credit risk; and the impact of accounting standards issued by Canadian and U.S. standard setters. Given these uncertainties, the reader should not place undue reliance on these forward-looking statements.
CONFRENCE CALL |
TransAlta will be holding a conference call and Web cast at 9 a.m. MST (11 a.m. EST) today to discuss its fourth quarter 2005 results. The call will begin with a short address by Steve Snyder, President and CEO and Brian Burden, Executive Vice-President and CFO, followed by a question and answer period for investment analysts. A question and answer period for the media will immediately follow. Please contact the conference operator five minutes prior to the call, noting "TransAlta Corporation" as the company and moderator "Daniel Pigeon".
Dial-in numbers:
For local Calgary participants - (403) 232-6311
For local Toronto participants - (416) 883-0139
Toll-free North American participants - 1-888-458-1598
Participant pass code - 26326#
Questions can also be asked via Web cast, at www.transalta.com. If you are unable to participate in the call, the instant replay is accessible at 1-877-653-0545 with TransAlta pass code 303736#. An archived recording of the call and a transcript will be posted on TransAlta's site approximately one day after the conference call.
Note: If using a hands-free phone, lift the handset and press one to ask a question.
| 16 TransAlta Corporation Q4/05 |
|
SUPPLEMENTAL INFORMATION |
| Dec. 31, | Dec 31 | ||||||
| (Annualized) | 2005 | 2004 | |||||
| Restated | |||||||
| Closing market price | $ | 25.41 | $ | 18.05 | |||
| Price range (last 12 months) | High | $ | 26.66 | $ | 18.79 | ||
| Low | $ | 17.67 | $ | 15.25 | |||
| Debt/invested capital (including non-recourse debt) | 43.6% | 46.4% | |||||
| Debt/invested capital (excluding non-recourse debt) | 39.8% | 42.4% | |||||
| Return on common shareholders' equity | 7.5% | 6.5% | |||||
| Return on invested capital | 7.4% | 7.5% | |||||
| Book value per share | $ | 12.80 | $ | 12.73 | |||
| Cash dividends per share | $ | 1.00 | $ | 1.00 | |||
| Price/earnings ratio (times) | 26.7 x | 21.7 x | |||||
| Dividend payout ratio | 105.4% | 120.0% | |||||
| Dividend coverage (times) | 3.1 x | 3.1 x | |||||
| Dividend yield | 3.9% | 5.5% | |||||
| Cash flow to debt | 23.5% | 18.6% | |||||
RATIO FORMULAS |
Debt/invested capital = (short-term debt + long-term debt – cash and interest-earning investments) / (debt + preferred securities + non-controlling interests + common equity)
Return on common shareholders’ equity = net earnings excluding gain on discontinued operations / average of opening and closing common equity
Return on invested capital = (earnings before non-controlling interests and income taxes + net interest expense) / average annual invested capital
Book value per share = common shareholders’ equity / common shares outstanding
Price/earnings ratio = current year’s close / basic earnings per share from continuing operations
Cash flow to total debt = cash flow from operations before changes in working capital / two-year average of total debt Dividend payout = dividends / net earnings excluding gain on discontinued operations Dividend coverage = cash flow from operating activities / common share dividends Dividend yield = dividend per common share / current period’s close price
GLOSSARY OF KEY TERMS |
Availability -A measure of time, expressed as a percentage of continuous operation 24 hours a day, 365 days a year, that a generating unit is capable of generating electricity, whether or not it is actually generating electricity.
Btu (British Thermal Unit) -A measure of energy. The amount of energy required to raise the temperature of one pound of water one degree Fahrenheit, when the water is near 39.2 degrees Fahrenheit.
Capacity -The rated continuous load-carrying ability, expressed in megawatts of generation equipment.
Gigawatt-A measure of electric power equal to 1,000 megawatts.
Gigawatt hour (GWh) -A measure of electricity consumption equivalent to the use of 1,000 megawatts of power over a period of one hour.
Heat rate - A measure of conversion, expressed as Btu/MW, of the amount of thermal energy required to generate electrical energy.
Megawatt -A measure of electric power equal to 1,000,000 watts.
Megawatt hour (MWh) - A measure of electricity consumption equivalent to the use of 1,000,000 watts of power over a period of one hour.
Net maximum capacity - The maximum capacity or effective rating, modified for ambient limitations that a generating unit or power plant can sustain over a specific period, less the capacity used to supply the demand of station service or auxiliary needs.
Spark spread -A measure of gross margin per MW (sales price less cost of fuel).
| TransAlta Corporation Q4/05 17 |
![]()
FOR MORE INFORMATION |
| TransAlta Corporation Box 1900, Station “M” 110 - 12th Avenue S.W. Calgary, Alberta Canada T2P 2M1 Phone 403.267.7110 Website www.transalta.com CIBC Mellon Trust Company P.O. Box 7010 Adelaide Street Station Toronto, Ontario Canada M5C 2W9 Phone Toll-free in North America: 1.800.387.0825 Toronto or outside North America: 416.643.5500 Fax 416.643.5501 Website www.cibcmellon.com | Media inquiries Sneh Seetal Senior Media Relations Advisor Phone 403.267.7330 Pager 403.213.7041 media_relations@transalta.com Investor inquiries Daniel J. Pigeon Director, Investor Relations Phone 1.800.387.3598 in Canada and United States or 403.267.2520 Fax 403.267.2590 investor_relations@transalta.com |
TransAlta is a power generation and wholesale marketing company focused on creating long-term shareholder value. We maintain a low-risk profile for investors by operating a highly contracted portfolio of assets in Canada, the U.S., Mexico and Australia. Our focus is to efficiently operate our coal-fired, gas-fired, hydro and renewable facilities in order to provide our customers with a reliable, low-cost source of power. For more than 90 years, we've been a responsible operator and a proud contributor to the communities where we work and live.
| 18 TransAlta Corporation Q4/05 |
|