![[mda002.gif]](https://capedge.com/proxy/6-K/0001137171-06-001986/mda002.gif)
TRANSALTA CORPORATION
THIRD QUARTER REPORT FOR 2006
MANAGEMENT’S DISCUSSION AND ANALYSIS
This management’s discussion and analysis (MD&A) contains forward-looking statements. These statements are based on certain estimates and assumptions and involve risks and uncertainties. Actual results may differ materially. See page 21 for additional information.
This MD&A should be read in conjunction with the unaudited interim consolidated financial statements of TransAlta Corporation as at and for the three and nine months ended Sept. 30, 2006 and 2005, and should also be read in conjunction with the audited consolidated financial statements and MD&A contained in our annual report for the year ended Dec. 31, 2005. In this MD&A, unless the context otherwise requires, ‘we’, ‘our’, ‘us’, the ‘corporation’ and ‘TransAlta’ refers to TransAlta Corporation and its subsidiaries. The consolidated financial statements have been prepared in accordance with Canadian generally accepted accounting principles (GAAP). All tabular amounts in the following discussion are in millions of Canadian dollars unless otherwise noted. This MD&A is dated Oct. 19, 2006. Additional information respecting TransAlta, including its annual information form, is available on SEDAR atwww.sedar.com.
RESULTS OF OPERATIONS
The results of operations are presented on a consolidated basis and by business segment. We have two business segments: Generation and Corporate Development & Marketing (CD&M). Our segments are supported by a corporate group that provides finance, treasury, legal, environmental health and safety, sustainable development, corporate communications, government relations, information technology, human resources and other administrative support.
In this MD&A, the impact of foreign exchange fluctuations on foreign currency transactions and balances is discussed with the relevant income statement and balance sheet items. While individual balance sheet line items will be impacted by foreign exchange fluctuations, the net impact of the translation of individual items is reflected in the cumulative translation account on the consolidated balance sheets.
The following table depicts additional key financial results and statistical operating data:
| | | 3 months ended Sept. 30 | | 9 months ended Sept. 30 |
| | | 2006 | | 20051 | | 2006 | | 20051 |
| Availability (%) | | 84.1 | | 89.8 | | 88.6 | | 89.1 |
| Production (GWh) | | 12,420 | | 13,172 | | 34,915 | | 38,402 |
| Revenue | $ | 684.0 | $ | 722.9 | $ | 2,016.7 | $ | 2,028.4 |
| Gross margin2 | $ | 353.9 | $ | 369.4 | $ | 1,087.0 | $ | 1,066.7 |
| Operating income2 | $ | 98.2 | $ | 116.4 | $ | 327.9 | $ | 338.1 |
| Net earnings | $ | 35.3 | $ | 51.2 | $ | 190.9 | $ | 126.4 |
| Basic and diluted earnings per common share | $ | 0.18 | $ | 0.26 | $ | 0.95 | $ | 0.64 |
| Cash flow from operating activities | $ | 144.8 | $ | 148.5 | $ | 411.9 | $ | 407.9 |
| 1 | TransAlta adopted the standard for stripping costs incurred in the production phase of a mining operation on Jan. 1, 2006 . SeeNote 1to the unaudited interim consolidated financial statements for further discussion. Prior periods have been restated. |
| |
| 2 | Gross margin and operating income are not defined under Canadian GAAP. Refer to the Non-GAAP Measures section on page 19 of this MD&A for a further discussion of operating income and gross margin, including a reconciliation to net earnings. |
TRANSALTA CORPORATION / Q3 2006 1
AVAILABILITY & PRODUCTION
Availability for the three months ended Sept. 30, 2006 decreased to 84.1 per cent from 89.8 per cent compared to the same period in 2005 primarily due to higher unplanned outages at the Alberta Thermal Plants and at the Centralia Coal plant (“Centralia Coal”) partially offset by fewer planned outages at Ottawa.
Availability for the nine months ended Sept. 30, 2006 decreased to 88.6 per cent from 89.1 per cent compared to the same period in 2005 primarily due to higher unplanned outages at Centralia Coal partially offset by fewer planned outages at Ottawa as well as lower unplanned outages at Sarnia.
Production for the third quarter decreased 752 gigawatt hours (GWh) compared to the same period in 2005 as a result of higher unplanned outages at Centralia Coal along with decreased hydro production. These decreases were partially offset by increased production at Poplar Creek and Centralia Gas.
Production for the nine months ended Sept. 30, 2006 decreased 3,487 GWh compared to the same period in 2005 as a result of reduced production at Centralia Coal, Hydro and Sarnia. These decreases were partially offset by fewer unplanned outages at the Alberta Thermal plants and increased production at Poplar Creek, Genesee 3 and Centralia Gas.
NET EARNINGS
For the three months ended Sept. 30, 2006, reported net earnings decreased to $35.3 million from $51.2 million compared to the same period in 2005. For the nine months ended Sept. 30, 2006, reported net earnings increased $64.5 million to $190.9 million from $126.4 million in 2005. For the three months ended Sept. 30, 2006, comparable earnings1 were $35.3 million ($0.18 per common share) compared to $38.2 million ($0.20 per common share) in the same period in 2005. Comparable earnings for the nine months ended Sept. 30, 2006 were $141.8 million ($0.71 per common share) compared to $113.4 million ($0.58 per common share) in the same period in 2005.
A reconciliation of net earnings is presented below:
| | 3 months ended Sept. 30 | | 9 months ended Sept. 30 | |
| Net earnings, 2005(as restated) | $ | 51.2 | | $ | 126.4 | |
| (Decreased) increased Generation gross margins | | (26.5 | ) | | 12.1 | |
| Higher Energy Trading margins | | 11.0 | | | 8.2 | |
| Decrease in operations, maintenance and administration costs | | 14.6 | | | 8.3 | |
| Reduced net interest expense | | 1.4 | | | 22.1 | |
| (Increased) decreased income tax expense | | (1.1 | ) | | 52.7 | |
| Increased depreciation expense | | (17.5 | ) | | (39.3 | ) |
| (Increase) decrease in non-controlling interest | | (0.2 | ) | | 1.1 | |
| Other | | 2.4 | | | (0.7 | ) |
| Net earnings, 2006 | $ | 35.3 | | $ | 190.9 | |
Generation gross margins decreased by $26.5 million for the three months ended Sept. 30, 2006 as a result of higher unplanned outages at Centralia Coal, increased coal costs at the Alberta Thermal plants and at Centralia Coal, and lower Hydro production. These decreases were partially offset by improved pricing in Alberta, increased gross margin at Sarnia and favourable spark spreads at Poplar Creek.
For the nine months ended Sept. 30, 2006, Generation gross margins increased by $12.1 million as a result of incremental production from Genesee 3, higher spark spreads at Poplar Creek, higher pricing and fewer unplanned outages at the Alberta Thermal plants, and increased
1Comparable earnings is not defined under Canadian GAAP. Presenting earnings on a comparable basis from period to period provides management and investors with the ability to evaluate earnings trends more readily in comparison with prior periods’ results. Refer to the Non-GAAP Measures section on page 19 of this MD&A for further discussion of comparable earnings, including reconciliation to net earnings.
2 TRANSALTA CORPORATION / Q3 2006
gross margin at Sarnia partially offset by reduced production at Centralia Coal, lower hydro production, and increased coal costs at the Alberta Thermal plants and Centralia Coal.
Energy trading gross margins increased $11.0 million and $8.2 million for the three and nine months ended Sept. 30, 2006 compared to the same periods in 2005 due to higher gains from trading activities.
Operations, maintenance and administration (OM&A) costs for the three and nine months ended Sept. 30, 2006 decreased by $14.6 million and $8.3 million, respectively compared to the same periods in 2005 mainly due to general cost reductions.
Depreciation expense increased $17.5 million for the three months ended Sept. 30, 2006 compared to 2005 primarily due to revised depreciation rates at the Ottawa, Mississauga, Windsor, Fort Saskatchewan, and Meridian plants, accelerated depreciation on parts replaced during planned outages and revised estimates of asset retirement obligations (ARO) at the Alberta Thermal plants.
For the nine months ended Sept. 30, 2006, depreciation increased $39.3 million due to revised depreciation rates at the above-mentioned plants, revised estimates of ARO at the Alberta Thermal plants, and the impairment recorded in the first quarter on turbines held in inventory. The change in depreciation rates at the above-mentioned plants in both the third quarter and year to date resulted in an increase in depreciation expense which was offset by a decrease in non-controlling interest.
For the three months ended Sept. 30, 2006, net interest expense declined $1.4 million mainly due to the impact of lower debt levels partially offset by higher short-term interest rates. Net interest expense declined $22.1 million for the nine months ended Sept. 30, 2006 due to lower debt levels and the settlement of net investment hedges in the first and second quarters. For the three months ended Sept. 30, 2006, net debt of $26.2 million was acquired. Net debt of $159.7 million was retired in the nine months ended Sept. 30, 2006.
Income taxes increased by $1.1 million for the three months ended Sept. 30, 2006, due to the impact of a tax recovery recorded in 2005 partially offset by lower pre-tax earnings and tax rates. For the nine months ended Sept. 30, 2006, income taxes decreased by $52.7 million due to reduced tax rates partially offset by the impact of a tax recovery recorded in 2005. The effective tax rates, excluding the impact of the change of tax rates on previous period earnings, for the quarter and nine months ended Sept. 30, 2006 were 9.5 per cent and 18.6 per cent, respectively.
CASH FLOW
Cash flow from operating activities for the three months ended Sept. 30, 2006 decreased $3.7 million mainly due to lower cash earnings, partially offset by changes in working capital.
Cash flow from operating activities for the nine months ended Sept. 30, 2006 increased $4.0 million mainly due to increased cash earnings partially offset by cash used to build inventories at Centralia Coal.
The key factors responsible for these changes are listed below in the reconciliation of cash flow from operating activities for the three and nine months ended Sept. 2005 to 2006:
| | 3 months ended Sept. 30 | | | 9 months ended Sept. 30 | |
| Cash flow from operating activities, 2005(as restated) | $ | 148.5 | | $ | 407.9 | |
| (Decreased) Increased cash earnings | | (28.7 | ) | | 56.6 | |
| Changes in non-cash working capital | | 25.0 | | | (52.6 | ) |
| Cash flow from operating activities, 2006 | $ | 144.8 | | $ | 411.9 | |
At Sept. 30, 2006, our total debt (including non-recourse debt) to invested capital ratio was 41.3 per cent (37.7 per cent excluding non-recourse debt). This represents an improvement from the Dec. 31, 2005 ratio of 43.9 per cent (40.2 per cent excluding non-recourse debt) and from the June 30, 2006 ratio of 41.5 per cent (37.8 per cent excluding non-recourse debt).
TRANSALTA CORPORATION / Q3 2006 3
SIGNIFICANT EVENTS
Three months ended Sept. 30, 2006
Centralia Coal unplanned outage
The 700 megawatt (MW) Unit 2 of our Centralia Coal plant experienced an unplanned outage on Aug. 6, 2006 as a result of a turbine blade failure. We continued to generate power from Unit 1 of the plant and purchased replacement power to fulfill our contractual obligations. Unit 2 resumed operations on Sept. 19, 2006. As a result of the event, total production was reduced 727 GWh and gross margins declined by $19.2 million.
Nine months ended Sept. 30, 2006
Sarnia power plant
On Feb. 15, 2006, we signed a five-year contract with the Ontario Power Authority for our Sarnia Regional Cogeneration Power Plant to supply an average of 400 MW of electricity to the Ontario electricity market. The contract was effective Jan. 1, 2006.
Centralia Coal reduced production and economic dispatch
Due to heavy rainfall in the Pacific Northwest in the first quarter of 2006, we derated Centralia Coal and started rebuilding our coal inventory. The impact of derating the plant during this time was partially offset by increasing coal imports and purchasing replacement power. We experienced 875 GWh of lower production during the first quarter compared to the same period of 2005. During the second quarter, lower market prices allowed us to purchase power at a price lower than our variable cost of production. As a result, Centralia Coal did not operate for the majority of the second quarter. We experienced 1,936 GWh of lower production during the second quarter compared to the same period of 2005. The total decrease in production in the first six months of 2006 was 2,811 GWh. In the third quarter of 2006, the 700 MW Unit 2 experienced a turbine blade failu re. As a result of the event, total production was reduced by 727 GWh and gross margins declined by $19.2 million.
Purchase of Wailuku River Hydroelectric L.P.
On Feb. 17, 2006 we purchased a 50 per cent interest in Wailuku River Hydroelectric L.P. through Wailuku Holding Company, LLC (“Wailuku”) for cash of USD$1.0 million (CAD$1.2 million). Wailuku had debt of USD$19.2 million (CAD$22.3 million) at the time of acquisition. Refer to Note 2 of the unaudited interim consolidated financial statements for the nine months ended Sept. 30, 2006 for the final purchase price allocation. Wailuku owns a run of the river hydro facility with an operating capacity of 10 MW. Mid American Energy Holdings Company owns the other 50 per cent interest in Wailuku.
Change in depreciation rate
In the first quarter of 2006 we changed the depreciation method of the Windsor, Mississauga, Ottawa, Meridian, and Fort Saskatchewan plants. Previously, these plants were being amortized on a unit of production method over the life of the plants. After reviewing the estimated useful life and considering the uncertainty for the plants’ operations beyond the terms of the current sales contracts, we determined that it was more reasonable to allocate the remaining net book value of the plants on a straight line basis over the remaining term of the respective contracts.
Keephills 3 project
On March 14, 2006 we signed a development agreement with EPCOR Utilities Inc. (EPCOR) to jointly examine the development of the Keephills 3 power project, a proposed 450 MW unit adjacent to our existing Keephills facility. Development work is in the early stages, and in 2006 we will continue stakeholder consultations, focus on the regulatory process, define the commercial and financial details and complete preliminary engineering and design work.
4 TRANSALTA CORPORATION / Q3 2006
2006 Federal and Alberta budgets
On May 24, 2006, the Alberta budget received Royal Assent. As a result, the general corporate income tax rate was reduced from 11.5 per cent to 10 per cent effective April 1, 2006. The federal budget received Royal Assent on June 22, 2006. As a result, the general corporate income tax rate will be reduced from 21 per cent to 19 per cent by Jan. 1, 2010. The corporate surtax has been eliminated for taxation years ended after Dec. 31, 2007 as well as the federal capital tax has been eliminated effective Jan. 1, 2006. The carry-forward period for non-capital losses and investment tax credits earned after 2005 has been extended from 10 to 20 years. As a result of these changes, in the second quarter the Corporation reduced income tax expense by $62.2 million which reflected the impact of these changes on current and prior years’ earnings.
DISCUSSION OF SEGMENTED RESULTS
GENERATION: Owns and operates hydro, wind, geothermal, gas- and coal-fired plants and related mining operations in Canada, the U.S., and Australia. At Sept. 30, 2006, Generation had 8,366 MW of gross generating capacity1 in operation (7,962 MW net ownership interest). Generation's revenues are derived from the availability and production of electricity and steam as well as ancillary services such as system support (see the detailed discussion of the four revenue streams in our annual report for the year ended Dec. 31, 2005).
The results of the Generation segment are as follows:
| | | | | | | | | | | 2005 | |
| | | | | | | | | | | (Restated, Note | |
| | | | | | 2006 | | | | | 1 | ) |
| 3 months ended Sept. 30 | | Total | | | Per MWh | | Total | | | Per MWh | |
| Revenues | $ | 635.6 | | $ | 51.18 | $ | 668.2 | | $ | 50.73 | |
| Fuel and purchased power | | (302.1 | ) | | (24.32 | ) | (308.2 | ) | | (23.40 | ) |
| Gross margin | | 333.5 | | | 26.86 | | 360.0 | | | 27.33 | |
| Operations, maintenance and administration | | 119.4 | | | 9.61 | | 132.2 | | | 10.04 | |
| Depreciation and amortization | | 100.0 | | | 8.05 | | 83.0 | | | 6.30 | |
| Taxes, other than income taxes | | 4.9 | | | 0.40 | | 5.1 | | | 0.39 | |
| Intersegment cost allocations | | 7.1 | | | 0.57 | | 6.5 | | | 0.49 | |
| Operating expenses | | 231.4 | | | 18.63 | | 226.8 | | | 17.22 | |
| Operating income | | 102.1 | | | 8.23 | | 133.2 | | | 10.11 | |
| Production (GWh) | | 12,420 | | | | | 13,172 | | | | |
| Availability (%) | | 84.1 | | | | | 89.8 | | | | |
| | | | | | | | | | | | 2005 | |
| | | | | | | | | | | | (Restated, Note | |
| | | | | | 2006 | | | | | | 1) | |
| 9 months ended Sept. 30 | | Total | | | Per MWh | | | Total | | | Per MWh | |
| Revenues | $ | 1,870.2 | | $ | 53.56 | | $ | 1,846.0 | | $ | 48.07 | |
| Fuel and purchased power | | (838.6 | ) | | (24.02 | ) | | (826.5 | ) | | (21.52 | ) |
| Gross margin | | 1,031.6 | | | 29.54 | | | 1,019.5 | | | 26.55 | |
| Operations, maintenance and administration | | 352.6 | | | 10.10 | | | 360.3 | | | 9.38 | |
| Depreciation and amortization | | 296.9 | | | 8.50 | | | 258.0 | | | 6.72 | |
| Taxes, other than income taxes | | 16.0 | | | 0.46 | | | 16.5 | | | 0.43 | |
| Intersegment cost allocations | | 21.0 | | | 0.60 | | | 19.5 | | | 0.51 | |
| Operating expenses | | 686.5 | | | 19.66 | | | 654.3 | | | 17.04 | |
| Operating income | $ | 345.1 | | $ | 9.88 | | $ | 365.2 | | $ | 9.51 | |
| Production (GWh) | | 34,915 | | | | | | 38,402 | | | | |
| Availability (%) | | 88.6 | | | | | | 89.1 | | | | |
1 TransAlta measures capacity as net maximum capacity (see glossary for definition of this and other key items) which is consistent with industry standards. Capacity figures represent capacity owned and in operation unless otherwise stated.
TRANSALTA CORPORATION / Q3 2006 5
Market prices and spark spreads
Gas- and coal-fired facilities that have exposure to market fluctuations in energy commodity prices represent6 per cent and 21 per cent of our total generating production, respectively. We closely monitor the risks associated with these commodity price changes on our future operations and, where we consider it appropriate, use various physical and financial instruments to hedge our assets and operations from such price risk.
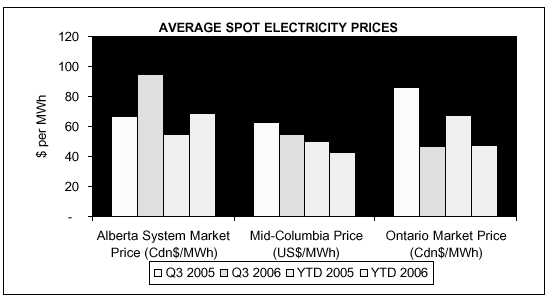

1 For a 7,000 Btu/KWh heat rate plant.
In the third quarter of 2006, compared to the same period in 2005, spot electricity prices were higher in Alberta while they decreased in both the Pacific Northwest and Ontario. Weaker natural gas prices put downward pressure across all three regions, but year over year demand growth offset such weakness in Alberta. Improved hydro generation provided further downward pressure on prices in the Pacific Northwest while more moderate temperatures and improved nuclear generation decreased prices in Ontario. Spark spreads increased in Alberta and the Pacific Northwest due to lower natural gas prices but decreased in Ontario compared to the same period in 2005.
6 TRANSALTA CORPORATION / Q3 2006
Availability
Availability for the three months ended Sept. 30, 2006 decreased to 84.1 per cent from 89.8 per cent compared to the same period in 2005 primarily due to higher unplanned outages at the Alberta Thermal Plants and at Centralia Coal. These were partially offset by fewer planned outages at Ottawa.
Availability for the nine months ended Sept. 30, 2006 decreased to 88.6 per cent from 89.1 per cent compared to the same period in 2005 primarily due to higher unplanned outages at Centralia Coal partially offset by fewer planned outages at Ottawa as well as lower unplanned outages at Sarnia.
Production
Production for the three months ended Sept. 30, 2006 decreased 752 GWh to 12,420 GWh as compared to the same period in 2005 primarily due to higher unplanned outages at Centralia Coal (959 GWh) combined with lower hydro production (190 GWh). These decreases were partially offset by higher production at Poplar Creek (98 GWh), Centralia Gas (283 GWh) and Genesee 3 (51 GWh).
Production for the nine months ended Sept. 30, 2006 decreased 3,487 GWh as compared to the same period in 2005 due to reduced production at Centralia Coal (3,770 GWh), reduced customer and market demand at Fort Saskatchewan (138 GWh) and Sarnia (177 GWh), and lower hydro production (303 GWh). These decreases were partially offset by incremental production from Genesee 3 (417 GWh), higher production at Poplar Creek (216 GWh) and Centralia Gas (316 GWh).
Revenue
Revenue decreased by $32.6 million for the three months ended Sept. 30, 2006 as compared to the same period in 2005 primarily due to higher unplanned outages at Centralia Coal ($54.8 million) and the strengthening of the Canadian dollar ($15.2 million) partially offset by improved pricing at Centralia Coal ($4.0 million), higher revenue from Ottawa gas sales ($10.4 million), higher production and spark spreads at Poplar Creek ($4.2 million), incremental revenue from Sarnia ($5.3 million) and improved production and pricing at CE Gen ($10.4 million).
For the nine months ended Sept. 30, 2006 revenue increased $24.2 million due to higher revenues from Ottawa gas sales ($30.1 million), improved pricing in Alberta and at Centralia Coal mainly in the first quarter ($51.4 million), incremental revenues from Genesee 3 ($25.1 million), lower unplanned outages at the Alberta Thermal plants ($20.7 million), incremental revenue from Sarnia ($22.9 million), increased revenue from CE Gen ($7.3 million), and higher production and spark spreads at Poplar Creek ($13.4 million). These increases were partially offset by reduced production at Centralia Coal due to derating in the first quarter ($42.8 million), lower net prices at Centralia Coal during the second quarter ($8.1 million), higher planned outages at Centralia Coal in the third quarter ($54.8 million), higher planned outages at the Alberta Thermal plants ($5.9 million) and the strengthening of the Canadian dollar ($41.7 million).
Fuel and purchased power
Fuel and purchased power decreased by $6.1 million for the three months ended Sept. 30, 2006 compared to the same period in 2005. Lower production at Centralia Coal ($31.5 million), the strengthening of the Canadian dollar ($9.5 million) and lower natural gas prices ($10.2 million) partially offset by increased cost of coal at the Alberta Thermal plants ($9.6 million) and at Centralia Coal ($25.6 million) and incremental gas purchases at Ottawa ($8.0 million).
Fuel and purchased power increased by $12.1 million for the nine months ended Sept. 30, 2006 compared to the same period in 2005. Increased cost of coal at Centralia Coal ($56.3 million) and the Alberta Thermal plants ($18.1 million), incremental gas purchases at Ottawa ($17.7 million) and increased production from Poplar Creek ($7.0 million) were partially offset by lower production at Centralia Coal ($45.7 million), strengthening of the Canadian dollar ($25.8 million) and the net benefit of economic dispatch at Centralia Coal ($20.9 million) in the second quarter.
Operations, maintenance and administration expense
For the three and nine months ended Sept. 30, 2006, OM&A expense decreased by $12.8 million and $7.7 million, respectively, compared to the same periods in 2005 primarily due to general cost reductions across the fleet.
TRANSALTA CORPORATION / Q3 2006 7
Depreciation expense
For the three months ended Sept. 30, 2006, depreciation expense increased $17.0 million primarily due to revised depreciation rates at the Windsor, Mississauga, Ottawa, Meridian, and Fort Saskatchewan plants ($5.2 million), acceleration of depreciation on parts replaced during planned outages ($7.5 million), and revised ARO estimates at the Alberta Thermal plants in the second quarter ($1.8 million).
For the nine months ended Sept. 30, 2006, depreciation increased $38.9 million primarily due to the change in depreciation rates at the above mentioned plants ($13.0 million), acceleration of depreciation on parts replaced during planned outages ($7.5 million), revised ARO estimates at the Alberta Thermal plants in the second quarter ($5.4 million), and the impairment recorded in the first quarter on turbines held in inventory ($9.6 million). The change in depreciation rates at the above-mentioned plants in both the third quarter and year to date resulted in an increase in depreciation expense which was offset by a decrease in non-controlling interest.
Planned maintenance
The table below shows the amount of planned maintenance capitalized and expensed in the three and nine months ended Sept. 30, 2006 and 2005, excluding CE Gen and Mexico:
| | | | | Coal | | Gas and Hydro | | | | Total |
| 3 months ended Sept. 30 | | 2006 | | 2005 | | 2006 | | 2005 | | 2006 | | 2005 |
| Capitalized | $ | 14.4 | $ | 24.5 | $ | 6.4 | $ | 7.2 | $ | 20.8 | $ | 31.7 |
| Expensed | | 23.2 | | 22.7 | | 0.7 | | 2.1 | | 23.9 | | 24.8 |
| | $ | 37.6 | $ | 47.2 | $ | 7.1 | $ | 9.3 | $ | 44.7 | $ | 56.5 |
| GWh lost | | 565 | | 600 | | 1 | | 94 | | 566 | | 694 |
| | | | | Coal | | Gas and Hydro | | | | Total |
| 9 months ended Sept. 30 | | 2006 | | 2005 | | 2006 | | 2005 | | 2006 | | 2005 |
| Capitalized | $ | 47.1 | $ | 53.9 | $ | 18.8 | $ | 34.0 | $ | 65.9 | $ | 87.9 |
| Expensed | | 53.4 | | 53.2 | | 2.0 | | 3.7 | | 55.4 | | 56.9 |
| | $ | 100.5 | $ | 107.1 | $ | 20.8 | $ | 37.7 | $ | 121.3 | $ | 144.8 |
| GWh lost | | 1,948 | | 1,788 | | 106 | | 461 | | 2,054 | | 2,249 |
In the three months ended Sept. 30, 2006, production lost due to planned maintenance decreased to 566 GWh from 694 GWh for the same period in 2005 primarily due to fewer planned outages at the Alberta Thermal plants and at Ottawa. Production lost in the nine months ended Sept. 30, 2006 decreased by 195 GWh due to reduced planned maintenance at the Alberta Thermal plants.
In the three and nine months ended Sept. 30, 2006, total capitalized and expensed maintenance costs are lower than the same periods in 2005 mainly due to fewer planned outages in the gas fleet.
Generation gross margins
Generation’s production volumes, electricity and steam production revenues and fuel and purchased power costs are presented below:
| | | | | | | | | | | | Fuel & | | |
| | | | | | Fuel & | | | | | | Purchased | | Gross |
| | Production | | | | Purchased | | Gross | | Revenue | | Power per | | Margin per |
| 3 months ended September 30, 2006 | (GWh) | | Revenue | | Power | | Margin | | per MWh | | MWh | | MWh |
| Alberta PPAs | 6,191 | $ | 169.7 | $ | 57.5 | $ | 112.2 | $ | 27.41 | $ | 9.29 | $ | 18.12 |
| Long-term contracts | 1,768 | | 147.8 | | 83.1 | | 64.7 | | 83.60 | | 47.00 | | 36.60 |
| Merchant | 3,634 | | 231.6 | | 141.6 | | 90.0 | | 63.73 | | 38.97 | | 24.76 |
| CE Gen | 8 2 7 | | 86.5 | | 19.9 | | 66.6 | | 104.59 | | 24.06 | | 80.53 |
| | 12,420 | $ | 635.6 | $ | 302.1 | $ | 333.5 | $ | 51.18 | $ | 24.32 | $ | 26.86 |
8 TRANSALTA CORPORATION / Q3 2006
| | | | | | | | | | | | Fuel & | | |
| | | | | | Fuel & | | | | | | Purchased | | Gross |
| | Production | | | | Purchased | | | | Revenue per | | Power per | | Margin per |
| 3 months ended September 30, 2005 (Restated, Note 1 ) | (GWh) | | Revenue | | Power | | Gross Margin | | MWh | | MWh | | MWh |
| Alberta PPAs | 6,435 | $ | 171.5 | $ | 49.8 | $ | 121.7 | $ | 26.65 | $ | 7.74 | $ | 18.91 |
| Long-term contracts | 1,700 | | 147.7 | | 91.9 | | 55.8 | | 86.88 | | 54.06 | | 32.82 |
| Merchant | 4,222 | | 266.8 | | 148.2 | | 118.6 | | 63.19 | | 35.10 | | 28.09 |
| CE Gen | 815 | | 82.2 | | 18.3 | | 63.9 | | 100.86 | | 22.45 | | 78.41 |
| | 13,172 | $ | 668.2 | $ | 308.2 | $ | 360.0 | $ | 50.73 | $ | 23.40 | $ | 27.33 |
| | | | | | | | | | | | Fuel & | | |
| | | | | | Fuel & | | | | | | Purchased | | Gross |
| | Production | | | | Purchased | | Gross | | Revenue | | Power per | | Margin per |
| 9 months ended September 30, 2006 | (GWh) | | Revenue | | P o w e r | | Margin | | per MWh | | MWh | | MWh |
| A l b e r t a P P A s | 18,953 | $ | 536.6 | $ | 166.0 | $ | 370.6 | $ | 28.31 | $ | 8.76 | $ | 19.55 |
| Long-term contracts | 5,039 | | 478.2 | | 270.6 | | 207.6 | | 94.90 | | 53.70 | | 41.20 |
| Merchant | 8,815 | | 643.7 | | 351.4 | | 292.3 | | 73.02 | | 39.86 | | 33.16 |
| C E G e n | 2,108 | | 211.7 | | 50.6 | | 161.1 | | 100.43 | | 24.00 | | 76.43 |
| | 34,915 | $ | 1,870.2 | $ | 838.6 | $ | 1,031.6 | $ | 53.56 | $ | 24.02 | $ | 29.54 |
| | | | | | | | | | | | Fuel & | | |
| | | | | | Fuel & | | | | | | Purchased | | Gross |
| | Production | | | | Purchased | | | | Revenue per | | Power per | | Margin per |
| 9 months ended September 30, 2005 (Restated, Note 1 ) | (GWh) | | Revenue | | Power | | Gross Margin | | MWh | | MWh | | MWh |
| Alberta PPAs | 19,074 | $ | 510.6 | $ | 143.8 | $ | 366.8 | $ | 26.77 | $ | 7.54 | $ | 19.23 |
| Long-term contracts | 5,273 | | 459.7 | | 268.8 | | 190.9 | | 87.18 | | 50.98 | | 36.20 |
| Merchant | 11,886 | | 654.5 | | 362.5 | | 292.0 | | 55.06 | | 30.50 | | 24.56 |
| CE Gen | 2,169 | | 221.2 | | 51.4 | | 169.8 | | 101.98 | | 23.70 | | 78.28 |
| | 38,402 | $ | 1,846.0 | $ | 826.5 | $ | 1,019.5 | $ | 48.07 | $ | 21.52 | $ | 26.55 |
Alberta PPAs
Under the Power Purchase Arrangements (PPAs), we earn monthly capacity revenues, which are designed to recover fixed costs and provide a return on capital for our plants and mines. We also earn energy payments for the recovery of predetermined variable costs of producing energy, an incentive/penalty for achieving above/below the targeted availability and an excess energy payment for power production above committed capacity. Our Sundance, Keephills, Sheerness and contracted portion of the Alberta hydro assets are included in this segment.
Production for the three months ended Sept. 30, 2006 decreased by 244 GWh compared to the same period in 2005 primarily as a result of higher unplanned outages (155 GWh) and lower customer demand from PPA customers (110 GWh).
Production for the nine months ended Sept. 30, 2006 decreased by 121 GWh compared to the same period in 2005 as a result of lower demand from PPA customers (358 GWh) and higher planned outages (70 GWh) partially offset by lower unplanned outages (346 GWh).
Revenues for the three months ended Sept. 30, 2006 decreased by $1.8 million ($0.76 per MWh) compared to the same period in 2005 primarily due to higher unplanned outages ($9.6 million) offset by improved net pricing ($6.4 million).
Revenues for the nine months ended Sept. 30, 2006 increased by $26.0 million ($1.54 per MWh) compared to the same period in 2005 primarily due to lower unplanned outages ($13.1 million) and higher net prices ($20.7 million) partially offset by higher planned outages ($5.9 million).
Fuel and replacement power costs for the three months ended Sept. 30, 2006 increased $7.7 million ($1.55 per MWh) compared to the same period in 2005 mainly due to an increase in cost of coal as a result of higher overburden removal and increased input costs.
Fuel and replacement power costs for the nine months ended Sept. 30, 2006 were $22.2 million ($1.22 per MWh) higher than the comparable period in 2005 mainly due to an increase in cost of coal as a result of higher overburden removal and increased input costs.
TRANSALTA CORPORATION / Q3 2006 9
Long-termcontracts
Long-term contracts typically have an original term between 10 and 25 years. Long-term contracts are typically for gas-fired cogeneration plants and have between one and four customers per plant. Revenues are derived from payments for capacity and/or the production of electrical energy and steam. The results from our Mississauga, Windsor, Wailuku, Ottawa, Fort Saskatchewan, and Meridian plants as well as the contracted portions of Sarnia, Poplar Creek, and Vision Quest are included in this segment.
Production for the three months ended Sept. 30, 2006 increased 68 GWh compared to the same period in 2005 due to increased production at various gas facilities.
Production for the nine months ended Sept. 30, 2006 decreased 234 GWh due to reduced customer demand at Fort Saskatchewan (138 GWh) and Mississauga (31 GWh) and lower production at Ottawa primarily due to gas sales (55 GWh).
For the three months ended Sept. 30, 2006, revenues were consistent with the prior year. The impact of lower natural gas prices on revenues being charged to customers were mostly offset by incremental revenues from gas sales at Ottawa ($10.4 million).
For the nine months ended Sept. 30, 2006, revenues increased by $18.5 million ($7.72 per MWh) primarily due to the gas sales revenue from Ottawa ($30.1 million) partially offset by the impact of lower natural gas prices in the second and third quarters.
Fuel and purchased power costs decreased by $8.8 million ($7.06 per MWh) for the three months ended Sept. 30, 2006 compared to the same periods in 2005 due to lower natural gas prices partially offset by incremental gas purchases at Ottawa ($8.0 million).
Fuel and purchased power costs increased by $1.8 million ($2.72 per MWh) for the nine months ended Sept. 30, 2006 compared to the same periods in 2005 due to incremental gas purchases at Ottawa ($17.7 million) partially offset by lower natural gas prices in the second and third quarters.
Merchant
Merchant revenue is derived from production and is sold via: medium-term contract sales (typically two to ten years), short-term asset-backed trading, and spot or short-term (less than one year) forward markets. The results from Centralia Coal, Centralia Gas, Genesee 3, Wabamun, Binghamton, excess energy sales from Sundance, Keephills, Hydro, and Sheerness, and uncontracted portions of Vision Quest, Poplar Creek, and Sarnia are included in this segment.
In the third quarter of 2006, merchant production was 3,634 GWh, of which 1,194 GWh was contracted under short- to medium-term contracts. In the third quarter of 2005, merchant production was 4,222 GWh, of which 1,934 GWh was contracted. The decrease in total production of 588 GWh was primarily due to the turbine failure at Centralia Coal (727 GWh), higher unplanned outages at Centralia Coal (232 GWh) and lower hydro production (190 GWh) partially offset by increased production at Poplar Creek (98 GWh), Centralia Gas (283 GWh), Genesee 3 (51 GWh) and the Alberta Thermal plants (106 GWh).
For the nine months ended Sept. 30, 2006, merchant production was 8,815 GWh, of which 2,451 GWh was contracted under short- to medium- term contracts. For the nine months ended Sept. 30, 2005, merchant production was 11,886 GWh of which 5,058 was contracted. The decrease in production of 3,071 GWh is due to derating and economic dispatch at Centralia Coal in the first and second quarter, respectively (2,811 GWh), higher unplanned outages at Centralia Coal in the third quarter (959 GWh) and lower production at Hydro (303 GWh) and Sarnia (154 GWh) offset by increased production from Genesee 3 (417 GWh), increased production at Centralia Gas (316 GWh), Poplar Creek (216 GWh) and Sheerness (75 GWh) and increased production at the Alberta Thermal plants (138 GWh).
For the three months ended Sept. 30, 2006, gross margins decreased $28.6 million ($3.33 per MWh) compared to the same period in 2005 due to higher input costs at Centralia Coal ($25.6 million), impact of the turbine failure at Centralia Coal ($19.2 million), higher unplanned outages at Centralia Coal ($3.6 million), lower hydro production ($5.3 million) and the strengthening of the Canadian dollar ($1.9 million) partially offset by increased production at Genesee 3 ($3.4 million), incremental revenue from the Sarnia contract ($5.3 million), increased production at the Alberta Thermal plants ($6.2 million), and favourable spark spreads at Poplar Creek ($9.6 million).
10 TRANSALTA CORPORATION / Q3 2006
For the nine months ended Sept. 30, 2006, gross margins increased $0.3 million ($8.60 per MWh) due to increased production from Genesee 3 ($24.4 million), favourable spark spreads at Poplar Creek ($20.6 million), increased revenue from the Sarnia contract ($22.9 million) and higher production at the Alberta Thermal plants ($11.1 million). These increases were offset by lower margins at Centralia Coal ($79.8 million) due to higher costs of coal ($56.3 million), impact of turbine failure ($19.2 million), higher unplanned outages ($32.2 million) and the strengthening of the Canadian dollar ($6.5 million) partially offset by higher contract prices in the first quarter ($25.1 million) and the net benefit of economic dispatch in the second quarter ($12.8 million).
CEGen
Our share of CE Gen production for the three months ended Sept. 30, 2006, increased 12 GWh compared to the same period in 2005 primarily due to higher production at Imperial Valley and Saranac. For the nine months ended Sept. 30, 2006, production decreased 61 GWh compared to 2005 due to higher planned outages at Imperial Valley.
For the three months ended Sept. 30 2006, gross margin increased $2.7 million compared to the same period in 2005 due to improved pricing and production at Imperial Valley partially offset by the strengthening of the Canadian dollar. For the nine months ended Sept. 30 2006, gross margin decreased $8.7 million compared to the same period in 2005 primarily due to the strengthening of the Canadian dollar partially offset by improved pricing at Imperial Valley.
CORPORATE DEVELOPMENT & MARKETING:is composed of three primary departments: Trading & Delivery Optimization, Commercial Portfolio Management and Portfolio Strategy & Execution. This segment also utilizes contracts of various durations for the forward sales of electricity and purchases of natural gas and transmission capacity to effectively manage available generating capacity and fuel and transmission needs on behalf of Generation. Operating income reported in the CD&M segment is comprised of energy trading activities not supported by TransAlta owned generation assets combined with the directly associated operating expenses.
Our Energy Trading activities utilize a variety of instruments to manage risk, earn trading revenue and gain market information. Our trading strategies consist of shorter-term physical and financial trades in regions where we have assets and the markets that interconnect with those regions. The portfolio primarily consists of physical and financial derivative instruments including forwards, swaps, futures, and options in various commodities. These contracts meet the definition of trading activities and have been accounted for using fair values for both Canadian and U.S. GAAP. Changes in the fair values of the portfolio are recognized in income in the period they occur.
While trading products are generally consistent between periods, positions held and resulting earnings impacts will vary due to current and forecasted external market conditions. Positions for each region are established based on the market conditions and the risk reward ratio established for each trade at the time they are entered. Results therefore are generally not consistent regionally or by strategy from one reported period to the next.
OM&A costs incurred within CD&M are allocated to the Generation segment based on an estimate of operating expenses and an estimated percentage of resources dedicated to providing the support and analysis. This fixed fee inter-segment allocation is represented as a cost recovery in CD&M and an operating expense within Generation.
The results of the CD&M segment are as follows:
| | 3 months ended Sept. 30 | 9 months ended Sept. 30 |
| | | 2006 | | 2005 | | | 2006 | | 2005 | |
| Revenues | $ | 48.4 | $ | 54.7 | | $ | 146.5 | $ | 182.4 | |
| Trading purchases | | (28.0 | ) | (45.3 | ) | | (91.1 | ) | (135.2 | ) |
| Gross margin | | 20.4 | | 9.4 | | | 55.4 | | 47.2 | |
| Operations, maintenance and administration | | 8.8 | | 9.5 | | | 25.2 | | 27.7 | |
| Depreciation and amortization | | 0.3 | | 0.5 | | | 1.0 | | 1.3 | |
| Intersegment cost allocation | | (7.1 | ) | (6.5 | ) | | (21.0 | ) | (19.5 | ) |
| Operating expenses | | 2.0 | | 3.5 | | | 5.2 | | 9.5 | |
| Operating income | $ | 18.4 | $ | 5.9 | | $ | 50.2 | $ | 37.7 | |
TRANSALTA CORPORATION / Q3 2006 11
For the third quarter of 2006 relative to the same period in 2005, gross margin increased $11.0 million. The western region reacted favourably to high power consumption and market heat rates. Eastern region results were lower than 2005 due to reduced electricity trading, but still had a positive contribution.
For the nine months ended September 30, 2006 compared to the same periods in 2005, gross margin increased $8.2 million due to opportunities in the western region partially offset by lower margins in the eastern region.
OM&A costs decreased $0.7 million and $2.5 million for the three and nine months ended Sept. 30, 2006, respectively, compared to the same periods in 2005. These cost decreases result from fewer consulting projects and lower staffing costs in the current year.
The inter-segment cost allocations are consistent with the prior comparable periods.
PRICERISK MANAGEMENT
Our price risk management assets and liabilities represent the value of unsettled (unrealized) Energy Trading transactions and certain Generation marketing activities accounted for on a fair value basis. With the exception of physical transmission contracts and gas storage assets, the fair value of all energy trading activities is based on quoted market prices. The fair value of financial transmission contracts is based upon statistical analysis of historical data. All transmission contracts are accounted for in accordance with EITF 02-3.
The following tables show the balance sheet classifications for price risk management assets and liabilities; as well as the changes in the fair value of the net price risk management assets for the period, separately by source of valuation:
| Balance Sheet | | Sept. 30, 2006 | | | Dec. 31, 2005 | |
| Price risk management assets | | | | | | |
| - Current | $ | 64.8 | | $ | 63.8 | |
| - Long-term | | 12.3 | | | 13.8 | |
| Price risk management liabilities | | | | | | |
| - Current | | (60.6 | ) | | (58.3 | ) |
| - Long-term | | (4.3 | ) | | (8.6 | ) |
| Net price risk management assets outstanding | $ | 12.2 | | $ | 10.7 | |
The corporation seeks to actively manage its exposure to credit risk by assessing the ability of counterparties to fulfill their obligations under the related contracts prior to entering into such contracts, and continually monitors these exposures after entering into these contracts. Detailed assessments are made of the credit quality of all counterparties and, where appropriate, corporate guarantees and/or letters of credit are obtained to support the ultimate collection of these receivables. See Risk Factors and Risk Management in the MD&A in our annual report for the year ended Dec. 31, 2005 for further discussion of credit risk exposures and management thereof.
| Change in fair value of net assets | Mark to Market | | | Mark to Model | | | Total | |
| Net price risk management assets outstanding at Dec. 31, 2005 | $ | 7.4 | | $ | 3.3 | | $ | 10.7 | |
| Contracts realized, amortized or settled during the period | | (5.3 | ) | | (4.8 | ) | | (10.1 | ) |
| Changes in values attributable to market price and other market changes | | (5.7 | ) | | 1.5 | | | (4.2 | ) |
| New contracts entered into during the current calendar year | | 14.6 | | | 1.2 | | | 15.8 | |
| Net price risk management assets outstanding at Sept. 30, 2006 | $ | 11.0 | | $ | 1.2 | | $ | 12.2 | |
For the nine months ended Sept. 30, 2006, our net price risk management assets and liabilities increased $1.5 million compared to Dec. 31, 2005 primarily due to new contracts entered in 2006 and value changes associated with contracts in existence at both period ends partially offset by contracts being settled during the quarter. To the extent applicable, changes in net price risk management assets and liabilities are reflected within the gross margin of both the CD&M and the Generation business segments.
12 TRANSALTA CORPORATION / Q3 2006
The anticipated timing of settlement of the above contracts over each of the next five calendar years and thereafter are as follows:
| | | | | | | | | | | | | | 2011 and | | | |
| | | 2006 | | | 2007 | | 2008 | | 2009 | | 2010 | | thereafter | | | Total |
| Prices actively quoted | $ | 3.1 | | $ | 1.3 | $ | 3.9 | $ | 1.8 | $ | 0.9 | $ | - | | $ | 11.0 |
| Prices based on models | | (0.8 | ) | | 0.9 | | 1.0 | | 0.1 | | - | | - | | | 1.2 |
| | $ | 2.3 | | $ | 2.2 | $ | 4.9 | $ | 1.9 | $ | 0.9 | $ | - | | $ | 12.2 |
Our Energy Trading activities are mainly transactions under 18 months in duration, thereby reducing credit risk and working capital requirements. Transactions extending past 2007 are generally Generation asset-backed contracts that do not qualify for hedge accounting and have a low risk profile including long-term fixed for floating power swaps and heat rate swaps.
NET INTEREST EXPENSE
| | 3 months ended Sept. 30 | | 9 months ended Sept. 30 | |
| | | 2006 | | | 2005 | | | 2006 | | | 2005 | |
| Interest on recourse and non-recourse debt | $ | 45.2 | | $ | 48.3 | | $ | 120.2 | | $ | 141.2 | |
| Interest on preferred securities | | 3.4 | | | 3.4 | | | 10.2 | | | 13.1 | |
| Interest income | | (1.0 | ) | | (2.7 | ) | | (4.3 | ) | | (2.7 | ) |
| Capitalized interest | | - | | | - | | | - | | | (3.4 | ) |
| Net interest expense | $ | 47.6 | | $ | 49.0 | | $ | 126.1 | | $ | 148.2 | |
For the three months ended Sept. 30, 2006, net interest expense was $1.4 million lower than the comparable period in 2005 due to lower debt levels ($3.4 million) partially offset by higher short term interest rates ($2.0 million).
For the nine months ended Sept. 30, 2006, net interest expense was $22.1 million lower than the comparable period in 2005 due to lower debt levels ($12.5 million) and the settlement of net investment hedges in the first and second quarter ($12.7 million) partially offset by lower capitalized interest ($3.4 million).
NON-CONTROLLING INTERESTS
The earnings attributable to non-controlling interests in the three and nine months ended Sept. 30, 2006 at $13.2 million and $36.1 million were consistent with the same periods in 2005 as changes in depreciation at Mississauga, Ottawa, Windsor, Meridian, and Fort Saskatchewan were mostly offset by higher earnings from those plants and at Sheerness.
EQUITY (LOSS)/ INCOME
Equity (loss)/income represents the results from the wholly owned subsidiaries that hold our interests in the Campeche and Chihuahua plants.
| | | 3 months ended Sept. 30 | | | 9 months ended Sept. 30 |
| | | 2006 | | | 2005 | | | 2006 | | | 2005 |
| Availability (%) | | 98.8 | | | 93.2 | | | 91.7 | | | 94.0 |
| Production (GWh) | | 894 | | | 809 | | | 2,382 | | | 2,239 |
| Equity (loss)/income | $ | (1.4 | ) | $ | (2.1 | ) | $ | (0.4 | ) | $ | 0.1 |
Availability and production increased for the three months ended Sept. 30, 2006 as a result of lower unplanned outages at the Campeche and Chihuahua plants. For the nine months ended Sept. 30, 2006, availability decreased due to higher planned outages at the Chihuahua plant during the first quarter. Production increased due to lower unplanned outages at the Campeche and Chihuahua plants partially offset by higher planned outages at Chihuahua.
TRANSALTA CORPORATION / Q3 2006 13
For the three months ended Sept. 30, 2006, equity loss was mainly due to the strengthening of the Canadian dollar. For the nine months ended Sept. 30, 2006, an equity loss also resulted due to the strengthening of the Canadian dollar and the recognition of the deferred financing fees of $7.2 million for the Campeche project loan. We have given the lender irrevocable notice that we intend to repay the remaining balance of USD $118.3 million (CAD $137.2 million). This transaction is expected to close in the fourth quarter of 2006. This balance will be refinanced from internal cash flows and from available credit facilities.
INCOME TAXES
| | 3 months ended Sept. 30 | 9 months ended Sept. 30 |
| | | | | 2005 | | | | | | 2005 | |
| | | 2006 | | (Restated, Note 1) | | | 2006 | | | (Restated, Note 1) | |
| Earnings before income taxes | $ | 39.0 | $ | 53.8 | | $ | 166.5 | | $ | 154.7 | |
| Income tax expense | | 3.7 | | 15.6 | | | 30.9 | | | 41.3 | |
| Tax settlement on deferred receivable | | - | | (13.0 | ) | | - | | | (13.0 | ) |
| Change in tax rate related to prior periods | | - | | - | | | (55.3 | ) | | - | |
| Income tax expense (recovery) per financial statements | | 3.7 | | 2.6 | | | (24.4 | ) | | 28.3 | |
| Net income | $ | 35.3 | $ | 51.2 | | $ | 190.9 | | $ | 126.4 | |
| Effective tax rate (%) | | 9.5 | | 29.0 | | | 18.6 | | | 26.7 | |
Tax expense decreased in the three and nine months ended Sept. 30, 2006 compared to the same periods last year due to the reduction in the Canadian corporate tax rate as well as a result of a change in the mix of jurisdictions in which pre-tax income is earned.
FINANCIAL POSITION
The following chart outlines significant changes in the consolidated balance sheet from Dec. 31, 2005 to Sept. 30, 2006:
| | | Increase/ | | |
| | | (Decrease) | | Explanation |
| Cash and cash equivalents | $ | 19.5 | | Refer to Consolidated Statements of Cash Flows |
| Accounts receivable | | (133.9 | ) | Decrease due to lower Energy Trading activities and higher unplanned |
| | | | | outages at Alberta Thermal. |
| Prepaid expenses | | 12.6 | | Insurance premiums and other prepaids |
| Inventory | | 91.2 | | Higher inventory at Centralia Coal |
| Long-term receivables | | 31.6 | | Revised ARO estimate |
| Property, plant and equipment, net of accumulated depreciation | | (161.0 | ) | Increased depreciation, impact of strengthening of the Canadian dollar |
| | | | | compared to the U.S. dollar and turbine impairment partially offset by |
| | | | | capital additions and revised ARO adjustment |
| Intangible assets | | (51.0 | ) | Amortization and strengthening of the Canadian dollar compared to the |
| | | | | U.S. dollar |
| Other assets (including current portion) | | (32.1 | ) | Realized gain on settlement of net investment hedges and mark to |
| | | | | market changes on hedging derivatives |
| Short-term debt | | 125.1 | | Net increase in short-term debt |
| Accounts payable and accrued liabilities | | (129.8 | ) | Decreased Energy Trading activitiy and timing of major maintenance |
| | | | | activities |
| Recourse long-term debt (including current portion) | | (267.4 | ) | Debt repayments and stronger Canadian dollar compared to the U.S. |
| Non-recourse long-term debt (including current portion) | | (40.3 | ) | Scheduled dollar debt repayments |
| Deferred credits and other long-term liabilities (including current portion) | | 58.4 | | Revised ARO estimate |
| Net future income tax liabilities (including current portions) | | (49.7 | ) | Reduction in tax rates |
| Non-controlling interests | | (17.3 | ) | Distributions in excess of earnings |
| Shareholders’ equity | | 101.6 | | Net earnings for the period, dividend reinvestment program and share |
| | | | | issuances, offset by dividends |
14 TRANSALTA CORPORATION / Q3 2006
STATEMENTS OF CASH FLOWS
| 3 months ended Sept. 30 | | 2006 | | | 2005 | | Explanation |
| Cash and cash equivalents, beginning of period | $ | 55.0 | | $ | 58.3 | | |
| Provided by (used in): | | | | | | | |
| Operating activities | | 144.8 | | | 148.5 | | Decreased cash earnings partially offset by decreased working capital balances. |
| Investing activities | | (76.1 | ) | | 27.7 | | In 2006 cash outflows were primarily due to additions to property, plant and equipment of |
| | | | | | | | $66.2 million, negative cash flow from equity investments of $18.7 million, partially offset |
| | | | | | | | by proceeds on the sale of property, plant and equipment of $11.1 million. |
| | | | | | | | In 2005, cash inflows were primarily due to postive cash flows from equity investments of |
| | | | | | | | $31.8 million and realized foreign exchange gains on net investments of $79.9 million |
| | | | | | | | partially offset by additions to property, plant and equipment of $77.0 million. |
| Financing activities | | (25.2 | ) | | (180.4 | ) | |
| | | | | | | | In 2006, cash outflows were due to repayment of long-term debt of $11.6 million, dividends |
| | | | | | | | on common shares of $34.1 million and distributions to subsidiaries' non-controlling |
| | | | | | | | interests of $18.0 million partially offset by an increase in short-term debt of $37.8 million. |
| | | | | | | | In 2005, cash outflows were due to repayment of short- and long-term debt of $110.2 |
| | | | | | | | million, dividends on common shares of $61.2 million, deferred financing charges and |
| | | | | | | | other of $9.8 million and distributions to subsidiaries' non-controlling interest of $17.8 |
| | | | | | | | million partially offset by reduction in advances to TransAlta Power of $13.2 million. |
| Translation of foreign currency cash | | 0.3 | | | 1.9 | | |
| Cash and cash equivalents, end of period | $ | 98.8 | | $ | 56.0 | | |
| 9 months ended Sept. 30 | | 2006 | | | 2005 | | Explanation |
| Cash and cash equivalents, beginning of period | $ | 79.3 | | $ | 101.2 | | |
| Provided by (used in): | | | | | | | |
| Operating activities | | 411.9 | | | 407.9 | | Increased cash earnings partially offset by higher working capital requirements. |
| Investing activities | | (93.1 | ) | | (127.3 | ) | Capital expenditures of $164.1 million and negative cash flows from equity investments of |
| | | | | | | | $10.5 million offset by realized gains on net investment hedges of $60.7 million and |
| | | | | | | | proceeds on sale of assets of $20.3 million. |
| | | | | | | | In 2005, cash outflows were primarily due to additions to property, plant and equipment of |
| | | | | | | | $222.3 million partially offset by realized foreign exchange gains on net investments. |
| Financing activities | | (302.4 | ) | | (324.0 | ) | Cash used in financing activities increased due to repayment of long-term debt of $283.8 |
| | | | | | | | million, distributions to the subsidiaries' non-controlling interest of $52.1 million, dividend |
| | | | | | | | payments of $100.1 million and offset by an increase in short-term debt of $124.1 million. |
| | | | | | | | In 2005, cash outflows were due to the redemption of preferred securities of $300.0 |
| | | | | | | | million, dividends on common shares of $96.8 million, distribution to subsidiaries' non- |
| | | | | | | | controlling interests of $53.4 million and repayment of long-term debt of $40.1 million |
| | | | | | | | partially offset by an increase in short-term debt of $139.7 million. |
| | | 3.1 | | | (1.8 | ) | |
| Translation of foreign currency cash | | | | | | | |
| Cash and cash equivalents, end of period | $ | 98.8 | | $ | 56.0 | | |
Operating activities
For the three months ended Sept. 30, 2006, funds generated from operations decreased to $144.8 million from $148.5 million for the same period in 2005 due to lower cash earnings being partially offset by less cash being used in working capital balances.
For the nine months ended Sept. 30, 2006, funds generated from operations increased to $411.9 million compared to $407.9 million for the same period in 2005 due to higher cash earnings partially offset by higher working capital used to build coal inventories at Centralia Coal.
Investing activities
For the three months ended Sept. 30, 2006, cash used in investing activities was $76.1 million compared to cash generated of $27.7 million for the same period in 2005. The increase in cash used was mainly due to lower cash flows from equity investments and from the realization of gains on settling net investment hedges in 2005 partially offset by lower capital expenditures.
TRANSALTA CORPORATION / Q3 2006 15
For the nine months ended Sept. 30, 2006, cash used in investing activities was $93.1 million compared to $127.3 million in the same period in 2005 due reduced capital expenditures offset by reduced cash flows from equity investments and net higher gains on settling net investment hedges in 2005.
For the three months ended Sept. 30, 2006, the corporation realized cash outflows of $3.9 million from the settlement of net investment hedges of foreign subsidiaries compared to cash inflows of $79.9 million for the same period in 2005.
For the nine months ended Sept. 30, 2006, the corporation realized cash inflows of $60.7 million from the settlement of net investment hedges of foreign subsidiaries compared to $83.2 million for the same period in 2005.
Financing activities
For the three months ended Sept. 30, 2006, cash used in financing activities was $25.2 million compared to $180.4 million for the same quarter for 2005. This decrease in cash used was mainly due to timing of dividends on common shares ($27.1 million) and a net increase in short-term debt.
For the nine months ended Sept. 30, 2006, cash used in financing activities decreased to $302.4 million from $324.0 million in the same period in 2005 due to a net decrease in debt balances.
LIQUIDITY AND CAPITAL RESOURCES
Liquidity risk arises from our ability to meet general funding needs, engage in trading and hedging activities and manage the assets, liabilities and capital structure of the company. Liquidity risk is managed to maintain sufficient liquid financial resources to fund obligations as they come due in the most cost-effective manner.
Our liquidity needs are met through a variety of sources, including: cash generated from operations, short-term borrowings against our credit facilities, commercial paper program and long-term debt issued under the corporation’s U.S. shelf registrations and Canadian Medium Term Note program. Our primary uses of funds are operational expenses, capital expenditures, dividends, distributions to non-controlling limited partners and interest and principal payments on debt securities.
We have a $1.5 billion committed syndicated credit facility and approximately $0.3 billion of uncommitted credit facilities. At Sept. 30, 2006, we had $1.1 billion available under these credit facilities (Dec. 31, 2005 - $1.2 billion).
We have obligations to issue letters of credit to secure potential liabilities to certain parties including those related to potential environmental obligations, trading activities, hedging activities and purchase obligations. At Sept. 30, 2006, we had issued letters of credit totaling $624.0 million compared to $694.6 million at Dec. 31, 2005. The decrease in letters of credit is due primarily to lower electricity prices in the Pacific Northwest.
We expect that our ability to generate adequate cash flow from operations in the short-term and the long-term and, when needed, to maintain financial capacity and flexibility to provide for planned growth remains substantially unchanged since Dec. 31, 2005.
On Oct. 19, 2006, we had approximately 201.4 million common shares outstanding.
Guarantee contracts
TransAlta has provided guarantees of subsidiaries' obligations under contracts that facilitate physical and financial transactions in various derivatives. To the extent liabilities related to these guaranteed contracts exist for trading activities, they are included in the consolidated balance sheet. To the extent liabilities exist related to these guaranteed contracts for hedges, they are not recognized on the consolidated balance sheet. The guarantees provided for under all contracts facilitating physical and financial transactions in various derivatives at Sept. 30, 2006 was a maximum of $1.9 billion. In addition, the corporation has a number of unlimited guarantees. The fair value of the trading and
16 TRANSALTA CORPORATION / Q3 2006
hedging positions under contracts where TransAlta has a net liability at Sept. 30, 2006, under the limited and unlimited guarantees, was $297.9 million as compared to $559.7 million at Dec. 31, 2005.
TransAlta has also provided guarantees of subsidiaries' obligations to perform and make payments under various other contracts. The amount guaranteed under these contracts at Sept. 30, 2006 was a maximum of $771.2 million, as compared to $645.3 million at Dec. 31, 2005. In addition, the corporation has a number of unlimited guarantees. To the extent actual obligations exist under the performance guarantees at Sept. 30, 2006, they are included in accounts payable and accrued liabilities.
The corporation has approximately $1.1 billion of undrawn collateral available to secure these exposures.
OUTLOOK
The key factors affecting the financial results for the remainder of 2006 are the megawatt capacity in place, the availability of and production from generating assets, the margins applicable to non-contracted production, the costs of production, and the margins achieved on Energy Trading activities.
Production and availability
Generating capacity is expected to be consistent with Sept. 30, 2006 levels. Availability and production in the remainder of the year is expected to increase due to reduced planned and unplanned outages.
Power prices
Electricity prices for the fourth quarter of 2006 are anticipated to be equal to or higher than those observed in the first nine months of the year due to stronger natural gas prices in the fourth quarter, year over year demand growth and only marginal supply additions. For similar reasons, spark spreads are also anticipated to be higher than those seen in the first nine months of the year in all markets.
Exposure to volatility in electricity prices and spark spreads is substantially mitigated through firm-price, long-term electricity sales contracts and hedging arrangements. For the balance of 2006, approximately 95 per cent of plant capability is contracted, of which a significant portion relates to the Alberta PPAs, which are based on achieving specified availability rates. We continue to manage future price exposure as market liquidity exists.
Fuel costs
Mining coal is subject to cost increases due to increased overburden removal, inflation and diesel commodity prices, the latter of which the corporation seeks to mitigate through diesel hedges. Seasonal variations in coal mining are minimized through the application of standard costing. Coal costs for the remainder of the year are expected to be similar to those experienced in the third quarter.
Exposure on gas costs for facilities under long-term sales contracts are minimized to the extent possible through long-term gas purchase contracts or corresponding offsets within revenues. Merchant gas facilities are exposed to the changes in spark spreads, discussed in the power prices section. We have not entered into fixed commodity agreements for gas for these merchant plants as gas will be purchased coincident with spot pricing.
Operations, maintenance and administration costs
OM&A costs per MWh fluctuate by quarter and are dependent on the timing and nature of maintenance activities. OM&A costs per MWh for the remainder of the year are forecast to be lower than the third quarter due to lower planned maintenance activities and increased production.
Capital expenditures
Our capital expenditures are comprised of spending on sustaining our current operations and for growth activities. The two components are described in greater detail below.
Sustaining expenditures
TRANSALTA CORPORATION / Q3 2006 17
Sustaining expenditures include planned maintenance, regular expenditures on plant equipment, systems and related infrastructures, as well as investments in our mines. For 2006, our estimate for total sustaining expenditures is between $250 million and $265 million, excluding Mexico. Of this amount, approximately $45 million is allocated to our mines.
During 2006, we expect to spend between $140 million and $160 million on planned maintenance as outlined in the following table (excluding CE Gen & Mexico):
| | | | | Gas and | | |
| | | Coal | | Hydro | | Total |
| Capitalized | $ | 60-65 | $ | 30-35 | $ | 90-100 |
| Expensed | | 50-55 | | 0-5 | | 50-60 |
| | $ | 110-120 | $ | 30-40 | $ | 140-160 |
| GWh lost | | 2,050-2,150 | | 200-250 | | 2,250-2,400 |
We expect to lose approximately 2,250 to 2,400 GWh of production due to planned maintenance during 2006. In 2006, we expect to capitalize $10.5 million on planned maintenance activities in Mexico and lose approximately 275 GWh.
Growth expenditures
For 2006, our growth expenditures are estimated to be between $15 million and $20 million. Financing for these expenditures is expected to be provided by cash flow from operations.
Exposure to fluctuations in foreign currencies
Our strategy is to minimize the impact of fluctuations in the Canadian dollar against the U.S. dollar by offsetting foreign denominated assets with foreign denominated liabilities and foreign exchange contracts. We also have foreign currency expenses, including interest charges, which offset foreign currency revenues.
Net interest expense
Net interest expense for the remainder of 2006 is expected to be consistent with those seen to date. However, higher interest rates and changes in the value of the Canadian dollar to the U.S. dollar could offset the benefit of lower debt levels.
Liquidity and capital resources
With the increased volatility in power and gas markets, market trading opportunities are expected to increase, which can potentially cause the need for additional liquidity. To mitigate this liquidity risk, the corporation maintains a $1.5 billion committed credit facility and monitors exposures to determine any liquidity requirements.
Change in law
On Oct. 10, 2006, the Canadian government announced its intention to introduce the Clean Air Act. We are not able to estimate the full impact of this Act upon our operations as the Canadian government has not yet defined the impact upon power generating companies. However, the PPAs for our coal-fired facilities contain ‘Change in Law’ provisions that provide an opportunity to recover compliance costs from the PPA customers.
On Oct. 11, 2006, the Canadian Council of Ministers of the Environment released Canada-wide standards for mercury emissions for coal-fired power generating plants. Under the standard, provincial caps on mercury emissions are established which are significantly below current emission rates. New facilities must meet best available technology targets. Within Alberta, plant operators are required to monitor mercury emissions and have appropriate control technology in place between 2008 and 2010. TransAlta anticipates being able to meet these standards within the defined timelines.
18 TRANSALTA CORPORATION / Q3 2006
NON-GAAP MEASURES
We evaluate our performance and the performance of our business segments using a variety of measures. Those discussed below are not defined under GAAP and therefore should not be considered in isolation or as an alternative to or more meaningful than, net income or cash flow from operating activities as determined in accordance with GAAP as an indicator of the corporation’s financial performance or liquidity. These measures are not necessarily comparable to a similarly titled measure of another company.
Each business unit assumes responsibility for its operating results measured to gross margin and operating income. Operating income provides management and investors with a measurement of operating performance which is readily comparable from period to period.
Gross margin and operating income are reconciled to net earnings below:
| | | 3 months ended Sept. 30 | | | 9 months ended Sept. 30 | |
| | | 2006 | | | 20051 | | | 2006 | | | 20051 | |
| Gross margin | $ | 353.9 | | $ | 369.4 | | $ | 1,087.0 | | $ | 1,066.7 | |
| Operating expenses | | (255.7 | ) | | (253.0 | ) | | (759.1 | ) | | (728.6 | ) |
| Operating income | | 98.2 | | | 116.4 | | | 327.9 | | | 338.1 | |
| Foreign exchange gain | | 3.0 | | | 1.5 | | | 1.2 | | | 1.9 | |
| Net interest expense | | (47.6 | ) | | (49.0 | ) | | (126.1 | ) | | (148.2 | ) |
| Equity (loss)/income | | (1.4 | ) | | (2.1 | ) | | (0.4 | ) | | 0.1 | |
| Earnings before non-controlling interests and income taxes | | 52.2 | | | 66.8 | | | 202.6 | | | 191.9 | |
| Non-controlling interests | | 13.2 | | | 13.0 | | | 36.1 | | | 37.2 | |
| Earnings before income taxes | | 39.0 | | | 53.8 | | | 166.5 | | | 154.7 | |
| Income tax expense (recovery) | | 3.7 | | | 2.6 | | | (24.4 | ) | | 28.3 | |
| Net earnings | $ | 35.3 | | $ | 51.2 | | $ | 190.9 | | $ | 126.4 | |
1 TransAlta adopted the standard for stripping costs incurred in the production phase of a mining operation on Jan. 1, 2006. See Note 1 to the unaudited interim consolidated financial statements for further discussion. Prior periods have been restated.
Presenting earnings on a comparable basis from period to period provides management and investors with the ability to evaluate earnings trends more readily in comparison with prior periods’ results. Because we believe the turbine impairment charge recorded in the first quarter and tax rate change adjustment related to prior period earnings in the second quarter would otherwise affect the comparability of our results from period to period, we have excluded those items to calculate earnings on a comparable basis.
| | | 3 months ended Sept. 30 | | 9 months ended Sept. 30 |
| | | 2006 | | 20051 | | 2006 | | | 20051 |
| Earnings on a comparable basis | $ | 35.3 | $ | 38.2 | $ | 141.8 | | $ | 113.4 |
| Turbine impairment, net of tax | | - | | - | | (6.2 | ) | | - |
| Change in tax rate related to prior periods | | - | | - | | 55.3 | | | - |
| Tax settlement on deferred receivable | | - | | 13.0 | | - | | | 13.0 |
| Net earnings | $ | 35.3 | $ | 51.2 | $ | 190.9 | | $ | 126.4 |
| Weighted average common shares outstanding in the period | | 201.1 | | 195.3 | | 200.4 | | | 196.3 |
| Earnings on a comparable basis per share | $ | 0.18 | $ | 0.20 | $ | 0.71 | | $ | 0.58 |
1 TransAlta adopted the standard for stripping costs incurred in the production phase of a mining operation on Jan. 1, 2006. See Note 1 to the unaudited interim consolidated financial statements for further discussion. Prior periods have been restated.
TRANSALTA CORPORATION / Q3 2006 19
Free cash flow is intended to demonstrate the amount of cash we have available to invest in capital growth initiatives, repay recourse debt or repurchase common shares.
The reconciliation between cash flow from operating activities and free cash flow is calculated below:
| | 3 months ended Sept. 30 | 9 months ended Sept. 30 |
| | | 2006 | | | 2005 | | 2006 | | | 2005 |
| Cash flow from operating activities | $ | 144.8 | | $ | 148.5 | $ | 411.9 | | $ | 407.9 |
| Less: | | | | | | | | | | |
| Sustaining capital expenses | | 55.3 | | | 50.3 | | 153.2 | | | 184.8 |
| Dividends on common shares | | 34.1 | | | 61.2 | | 100.1 | | | 96.8 |
| Distribution to subsidiaries' non-controlling interest | | 18.0 | | | 17.8 | | 52.1 | | | 53.4 |
| Non-recourse debt repayments | | 8.2 | | | 7.5 | | 33.7 | | | 26.0 |
| Add: | | | | | | | | | | |
| Cash flows (to) from equity investments | | (18.7 | ) | | 31.8 | | (10.5 | ) | | 14.9 |
| Free cash flow | $ | 10.5 | | $ | 43.5 | $ | 62.3 | | $ | 61.8 |
SELECTED QUARTERLY INFORMATION 1
(in millions of Canadian dollars except per share amounts)
| | | Q4 2005 | | Q1 2006 | | Q2 2006 | | Q3 2006 |
| Revenue | $ | 810.1 | $ | 733.7 | $ | 599.0 | $ | 684.0 |
| Earnings from continuing operations | | 47.9 | | 6 9 . 2 | | 86.4 | | 35.3 |
| Net earnings | | 59.9 | | 6 9 . 2 | | 86.4 | | 35.3 |
| Basic earnings per common share: | | | | | | | | |
| Continuing operations | | 0.24 | | 0 . 3 5 | | 0.43 | | 0.18 |
| Net earnings | | 0.30 | | 0 . 3 5 | | 0.43 | | 0.18 |
| Diluted earnings per common share: | | | | | | | | |
| Continuing operations | | 0.24 | | 0 . 3 5 | | 0.43 | | 0.18 |
| Net earnings | | 0.30 | | 0 . 3 5 | | 0.43 | | 0.18 |
| | | Q4 2004 | | Q1 2005 | | Q2 2005 | | Q3 2005 |
| Revenue | $ | 660.1 | $ | 684.3 | $ | 621.2 | $ | 722.9 |
| Earnings from continuing operations | | 65.9 | | 49.4 | | 25.8 | | 51.2 |
| Net earnings | | 65.9 | | 49.4 | | 25.8 | | 51.2 |
| Basic earnings per common share: | | | | | | | | |
| Continuing operations | | 0.34 | | 0.25 | | 0.13 | | 0.26 |
| Net earnings | | 0.34 | | 0.25 | | 0.13 | | 0.26 |
| Diluted earnings per common share: | | | | | | | | |
| Continuing operations | | 0.34 | | 0.25 | | 0.13 | | 0.26 |
| Net earnings | | 0.34 | | 0.25 | | 0.13 | | 0.26 |
1 TransAlta adopted the standard for stripping costs incurred in the production phase of a mining operation on Jan. 1, 2006. See Note 1 to the unaudited interim consolidated financial statements for further discussion. Prior periods have been restated.
CONTROLS AND PROCEDURES
As of the end of the period covered by this quarterly report, TransAlta’s management, together with TransAlta’s President and Chief Executive Officer and Chief Financial Officer have evaluated the effectiveness of the design and operation of the company’s disclosure controls and procedures. Based on this evaluation, the President and Chief Executive Officer and Chief Financial Officer have concluded that the disclosure controls and procedures of the company are effective.
20 TRANSALTA CORPORATION / Q3 2006
There were no changes in TransAlta’s internal control over financial reporting during the most recent fiscal quarter that have materially affected or are reasonably likely to materially affect TransAlta’s internal control over financial reporting.
FORWARD-LOOKING STATEMENTS
This MD&A and other reports and filings made with the securities regulatory authorities include forward-looking statements. All forward-looking statements are based on TransAlta Corporation's beliefs and assumptions based on information available at the time the assumption was made. In some cases, forward-looking statements can be identified by terms such as ‘may’, ‘will’, ‘believe’, ‘expect’, ‘potential’, ‘enable’, ‘continue’ or other comparable terminology. The forward-looking statements relate to, among other things, statements regarding the anticipated business prospects and financial performance of TransAlta. These statements are not guarantees of TransAlta's future performance and are subject to risks, uncertainties and other important factors that could cause the corporation’s actual performanc e to be materially different from those projected, including those material risks discussed in this MD&A under the heading ‘Outlook’ and in the MD&A in our annual report for the year ended Dec. 31, 2005 under the heading ‘Risk Factors and Risk Management’. Some of the risks, uncertainties, and factors include, but are not limited to: legislative and regulatory developments that could affect revenues, costs, cost and availability of fuel to produce electricity, the speed and degree of competition entering the market; global capital markets activity; timing and extent of changes in commodity prices, prevailing interest rates, currency exchange rates, inflation levels and general economic conditions where TransAlta Corporation operates; results of financing efforts; changes in counterparty risk; and the impact of accounting standards issued by Canadian standard setters. Given these uncertainties, the reader should not place undue reliance on these forward-look ing statements which is given as of the date it is expressed in this MD&A or otherwise and TransAlta undertakes no obligation to update publicly or revise any forward-looking information, whether as a result of new information, future events or otherwise, except as required by law.
TRANSALTA CORPORATION / Q3 2006 21