 | TRANSALTA CORPORATION SECOND QUARTER REPORT FOR 2014 |
MANAGEMENT’S DISCUSSION AND ANALYSIS
This Management’s Discussion and Analysis (“MD&A”) contains forward-looking statements. These statements are based on certain estimates and assumptions and involve risks and uncertainties. Actual results may differ materially. See the Forward-Looking Statements section of this MD&A for additional information.
This MD&A should be read in conjunction with the unaudited interim condensed consolidated financial statements of TransAlta Corporation as at and for the three and six months ended June 30, 2014 and 2013, and should also be read in conjunction with the audited consolidated financial statements and MD&A contained within our 2013 Annual Report. In this MD&A, unless the context otherwise requires, ‘we’, ‘our’, ‘us’, the ‘Corporation’, and ‘TransAlta’ refer to TransAlta Corporation and its subsidiaries. The condensed consolidated financial statements have been prepared in accordance with International Financial Reporting Standard (“IFRS”) IAS 34 Interim Financial Reporting. All tabular amounts in the following discussion are in millions of Canadian dollars unless otherwise noted. This MD&A is dated July 29, 2014. Additional information respecting TransAlta, including its Annual Information Form, is available on SEDAR at www.sedar.com.
RESULTS OF OPERATIONS
The results of operations are presented on a consolidated basis and by business segment. We have three business segments: Generation, Energy Trading, and Corporate. For this MD&A, we have further split what is reported as our Generation business segment into the various fuel types to provide additional information to our readers. In this MD&A, the impact of foreign exchange fluctuations on foreign currency denominated transactions and balances is discussed with the relevant Condensed Consolidated Statements of Earnings (Loss) and Condensed Consolidated Statements of Financial Position items. While individual line items in the Condensed Consolidated Statements of Financial Position may be impacted by foreign exchange fluctuations, the net impact of the translation of these items relating to foreign operations to our presentation currency is reflected in Accumulated Other Comprehensive Income (Loss) (“AOCI”) in the equity section of the Condensed Consolidated Statements of Financial Position.
NON-IFRS MEASURES
We evaluate our performance and the performance of our business segments using a variety of measures. Certain of these measures discussed in this MD&A are not defined under IFRS and, therefore, should not be considered in isolation or as an alternative to or to be more meaningful than net earnings attributable to common shareholders or cash flow from operating activities, as determined in accordance with IFRS, when assessing our financial performance or liquidity. These measures may not be comparable to similar measures presented by other issuers and should not be considered in isolation or as a substitute for measures prepared in accordance with IFRS. See the Funds from Operation and Free Cash Flow and Earnings and Other Measures on a Comparable Basis sections of this MD&A for additional information.
TRANSALTA CORPORATION / Q2 2014 1
HIGHLIGHTS
Consolidated Highlights
| 3 months ended June 30 | 6 months ended June 30 | |||||||||||||||
| 2014 | 2013 | 2014 | 2013 | |||||||||||||
| Revenues | 491 | 542 | 1,266 | 1,082 | ||||||||||||
Comparable EBITDA(1) | 213 | 247 | 523 | 515 | ||||||||||||
| Net earnings (loss) attributable to common shareholders | (50 | ) | 15 | (1 | ) | 4 | ||||||||||
Comparable net earnings (loss) attributable to common shareholders(1) | (12 | ) | 9 | 35 | 41 | |||||||||||
Funds from operations(1) | 154 | 184 | 392 | 377 | ||||||||||||
| Cash flow from operating activities | 51 | 92 | 330 | 348 | ||||||||||||
Free cash flow(1) | 19 | 57 | 158 | 171 | ||||||||||||
| Net earnings (loss) per share attributable to common shareholders, basic and diluted | (0.18 | ) | 0.06 | - | 0.02 | |||||||||||
Comparable net earnings (loss) per share(1) | (0.04 | ) | 0.03 | 0.13 | 0.16 | |||||||||||
Funds from operations per share(1) | 0.57 | 0.70 | 1.45 | 1.45 | ||||||||||||
Free cash flow per share(1) | 0.07 | 0.22 | 0.58 | 0.66 | ||||||||||||
| Dividends paid per common share | 0.18 | 0.29 | 0.47 | 0.58 | ||||||||||||
| As at | June 30, 2014 | Dec. 31, 2013(2) | ||||||||||||||
| Total assets | 9,296 | 9,624 | ||||||||||||||
| Total long-term liabilities | 4,648 | 5,348 | ||||||||||||||
Financial Highlights
| § | Comparable earnings before interest, taxes, depreciation, and amortization (“EBITDA”) for the second quarter of 2014 totalled $213 million with strong availability from our Generation Segment and improved operational performance at Canadian Coal. Results during the second quarter were consistent with our expectations to meet our full year EBITDA guidance of $1,015 million to $1,065 million. Comparable EBITDA decreased $34 million compared to the same period in 2013, primarily due to lower prices in Alberta which impacted our hydro, wind and gas assets in the province. Prices in Alberta averaged $42 per megawatt hour (“MWh”) during the second quarter of 2014 compared to $123 per MWh in the same period in 2013. Our strategy of being highly contracted generally limited the impacts of lower price volatility and lower prices in Alberta in the quarter. |
| § | For the six months ended June 30, 2014, comparable EBITDA was $523 million, $8 million higher than the same period in 2013, primarily due to strong earnings from our Energy Trading Segment in the first quarter of 2014, strong availability from our Generation Segment, and improved operational performance at Canadian Coal, partially offset by lower Alberta prices in the second quarter of 2014. |
| § | Funds from operations (“FFO”) for the three months ended June 30, 2014 was impacted by lower comparable EBITDA and decreased $30 million to $154 million, compared to the same period in 2013. Year-to-date FFO totalled $392 million, $15 million higher than the same period in 2013. We are still on track to meet our full year FFO guidance of between $743 million and $793 million. |
___________________
| (1) | These items are not defined under IFRS. Presenting these items from period to period provides management and investors with the ability to evaluate earnings trends more readily in comparison with prior periods’ results. Refer to the Funds from Operations and Free Cash Flow and Earnings and Other Measures on a Comparable Basis sections of this MD&A for further discussion of these items, including, where applicable, reconciliations to measures calculated in accordance with IFRS. |
| (2) | After giving effect to the reclassification described in the Current Accounting Changes section of this MD&A. |
2 TRANSALTA CORPORATION / Q2 2014
| § | Second quarter comparable net loss attributable to common shareholders was $12 million ($0.04 net loss per share), down from comparable net earnings of $9 million ($0.03 net earnings per share) in the same period in 2013, due to the decrease in comparable EBITDA, partially offset by lower income tax expense. |
| § | Year-to-date comparable net earnings attributable to common shareholders were $35 million ($0.13 net earnings per share) in 2014, down from $41 million ($0.16 net earnings per share) in 2013. The increase in comparable EBITDA and lower income taxes were more than offset by higher depreciation and amortization, foreign exchange losses and income attributable to non-controlling interests. |
| § | Reported net loss attributable to common shareholders for the second quarter was $50 million ($0.18 net loss per share), down $65 million from net earnings of $15 million ($0.06 net earnings per share) in the same period in 2013. The decrease is driven by lower volumes of higher priced hedge contracts at Centralia Thermal, lower Alberta prices, and lower gains on sale of assets, partially offset by improved operational performance at Canadian Coal and lower income tax expense. The reported net loss for the second quarter of 2014 does not include the impact of certain de-designated hedges that settled in the period as these gains were recognized when they were de-designated in prior periods. |
| § | Year-to-date reported net loss attributable to common shareholders was $1 million ($0.00 net loss per share), down |
| $5 million from net earnings of $4 million ($0.02 net earnings per share) in 2013. The decrease is driven primarily by lower volumes of higher priced hedge contracts at Centralia Thermal, lower Alberta prices, and higher income tax expense, partially offset by strong results from our Energy Trading Segment, improved operational performance at Canadian Coal, and the one-time loss on assumption of pension obligations in the prior period. The year-to-date reported net earnings does not include the impact of certain de-designated hedges that settled in the period as these gains were recognized when they were de-designated in prior periods. |
Strategic Initiative Highlights
Since the beginning of the year we made significant progress to grow our portfolio of highly contracted assets, improve our operating performance, and strengthen our financial condition.
| § | Entered into agreements to build and operate an AUD$570 million, 150 megawatt (“MW”) combined cycle gas power station in South Hedland, Western Australia. The fully contracted power station is expected to be commissioned and delivering power to customers in the first half of 2017. |
| § | Continued development with our joint venture partner of a $178 million natural gas pipeline to our Solomon power station. We hold a 43 per cent interest in the joint venture. The project is on schedule and within budget. |
| § | Completed the sale of our 50 per cent ownership of CE Generation LLC (“CE Gen”), the Blackrock Development Project (“Blackrock”), and CalEnergy, LLC (“CalEnergy”) for net proceeds of U.S.$188.5 million in the quarter. |
| § | Completed a secondary offering of TransAlta Renewables Inc. (“TransAlta Renewables”) shares in the second quarter for proceeds of approximately $129 million, net of offering costs. |
| § | Successfully completed an offering of U.S.$400 million of senior notes, due in June 2017. |
TRANSALTA CORPORATION / Q2 2014 3
Operational Results
Comparable EBITDA is as follows:
| 3 months ended June 30 | 6 months ended June 30 | |||||||||||||||
| 2014 | 2013 | 2014 | 2013 | |||||||||||||
Availability (%)(1) | 82.1 | 72.1 | 86.8 | 81.7 | ||||||||||||
Adjusted availability (%)(1),(2) | 85.4 | 81.8 | 88.4 | 86.6 | ||||||||||||
Production (GWh)(1) | 9,283 | 8,110 | 21,350 | 18,754 | ||||||||||||
| Comparable EBITDA | ||||||||||||||||
| Generation Segment | ||||||||||||||||
| Canadian Coal | 83 | 48 | 177 | 146 | ||||||||||||
| U.S. Coal | 14 | 21 | 31 | 33 | ||||||||||||
| Gas | 69 | 85 | 151 | 169 | ||||||||||||
| Wind | 33 | 46 | 95 | 96 | ||||||||||||
| Hydro | 20 | 52 | 39 | 76 | ||||||||||||
| Total Generation Segment | 219 | 252 | 493 | 520 | ||||||||||||
| Energy Trading Segment | 4 | 11 | 53 | 24 | ||||||||||||
| Corporate Segment | (10 | ) | (16 | ) | (23 | ) | (29 | ) | ||||||||
| Total comparable EBITDA | 213 | 247 | 523 | 515 | ||||||||||||
| § | Canadian Coal: Comparable EBITDA increased to $83 million in the second quarter and $177 million year-to-date, compared to $48 million and $146 million, respectively, for the same periods in 2013. The improvement period over period is due to higher availability. In 2013, our results were impacted by the purchase of higher-priced power to settle existing financial contracts due to lower than expected generation during unplanned outages. Canadian Coal was not significantly impacted by the much lower average second quarter and year-to-date prices in Alberta due to the PPAs and long-term hedges in place for most of our capacity. |
| § | U.S. Coal: Comparable EBITDA was $14 million in the second quarter of 2014 compared to $21 million for the same period in 2013. Results in 2013 were positively impacted by higher priced hedge contracts. |
| § | Gas: Comparable EBITDA was $69 million in the second quarter and $151 million year-to-date, compared to $85 million and $169 million, respectively, for the same periods in 2013. The decrease in comparable EBITDA is primarily due to lower Alberta prices impacting results from the Poplar Creek facility and the effects of the new contract at Ottawa. |
| § | Wind: Comparable EBITDA was $33 million in the second quarter compared to $46 million for the same period in 2013. Lower Alberta prices impacted our revenue while production was slightly below 2013 in both Western and Eastern Canada. Wyoming Wind contributed 78 gigawatt hours (“GWh”) during the second quarter, compared to 164 GWh during the first quarter. Year-to-date comparable EBITDA for 2014 was down $1 million to $95 million compared to 2013, due to lower Alberta prices, partially offset by a full six months of operations at New Richmond and Wyoming Wind. |
| § | Hydro: Comparable EBITDA was $20 million in the second quarter and $39 million year-to-date, compared to $52 million and $76 million, respectively, for the same periods in 2013. Lower prices and low price volatility in Alberta limited our ability to take advantage of resource flexibility to produce electricity during higher priced hours. Additionally, lower water resource than in 2013 impacted our second quarter and year-to-date results. |
___________________
| (1) | Availability and production includes all generating assets (generation operations, finance leases, and equity investments). |
| (2) | Adjusted for economic dispatching at Centralia Thermal. |
4 TRANSALTA CORPORATION / Q2 2014
| § | Energy Trading Segment: After generating substantial comparable EBITDA of $49 million in the first quarter of 2014, Energy Trading generated $4 million in the second quarter, down $7 million compared to the second quarter of 2013. Lower commodity price volatility in Alberta impacted Energy Trading’s ability to generate gross margin. Results from other markets in which we transact were consistent with 2013. Higher operations, maintenance, and administration (“OM&A”) costs resulting from higher corporate cost allocations and increased compensation costs also impacted Energy Trading’s results. Year-to-date comparable EBITDA in 2014 was $53 million, up $29 million from $24 million in the 2013 year-to-date period as a result of our ability to optimize our energy marketing assets during extraordinarily volatile market conditions caused by extreme weather events in the northeast during the first quarter. |
| § | Corporate Segment: Our Corporate Segment incurred lower costs in the second quarter of 2014 of $10 million, compared to $16 million in 2013, and $23 million in year-to-date 2014 compared to $29 million in the same period in 2013. The lower costs resulted from lower provisions for incentive-based compensation in the second quarter and a change allocation of overhead costs to our business units. |
AVAILABILITY & PRODUCTION
Availability for the three and six months ended June 30, 2014 increased compared to the same periods in 2013, primarily due to lower unplanned outages at Canadian Coal, and lower economic dispatching at Centralia Thermal, partially offset by higher planned outages at Alberta PPA plants.
Adjusted availability for the three and six months ended June 30, 2014 increased compared to the same periods in 2013, primarily due to lower unplanned outages at Canadian Coal, partially offset by higher planned outages at Alberta PPA plants.
Production for the three and six months ended June 30, 2014 increased 1,565 GWh and 3,068 GWh, respectively, compared to the same periods in 2013, primarily due to Sundance Units 1 and 2 returning to service, lower unplanned outages at Canadian Coal, lower economic dispatching at Centralia Thermal, and the acquisition of Wyoming Wind, partially offset by higher planned outages at Alberta PPA plants.
FUNDS FROM OPERATIONS AND FREE CASH FLOW
Presenting non-IFRS measures such as FFO, free cash flow, funds from operations per share, and free cash flow per share from period to period provides management, and investors, with a proxy for the amount of cash generated from operating activities before changes in working capital, and provides the ability to evaluate cash flow trends more readily in comparison with results from prior periods.
TRANSALTA CORPORATION / Q2 2014 5
FFO per share and free cash flow per share are calculated as follows using the weighted average number of common shares outstanding during the period:
| 3 months ended June 30 | 6 months ended June 30 | |||||||||||||||
| 2014 | 2013 | 2014 | 2013 | |||||||||||||
| Cash flow from operating activities | 51 | 92 | 330 | 348 | ||||||||||||
| Impacts associated with California claim | 33 | - | 33 | - | ||||||||||||
| Payment of restructuring costs | - | - | - | 4 | ||||||||||||
| Non-comparable insurance proceeds | (6 | ) | - | (6 | ) | - | ||||||||||
| Timing of payments related to assumption of pension obligations | - | (2 | ) | - | 7 | |||||||||||
| Decrease in finance lease receivable | - | - | 1 | 1 | ||||||||||||
| Flood related maintenance costs | 8 | 1 | 8 | 1 | ||||||||||||
| Change in non-cash operating working capital balances | 68 | 93 | 26 | 16 | ||||||||||||
| FFO | 154 | 184 | 392 | 377 | ||||||||||||
| Deduct: | ||||||||||||||||
| Sustaining capital expenditures | (107 | ) | (101 | ) | (171 | ) | (152 | ) | ||||||||
| Dividends paid on preferred shares | (10 | ) | (10 | ) | (19 | ) | (19 | ) | ||||||||
| Distributions paid to subsidiaries' non-controlling interests | (18 | ) | (16 | ) | (44 | ) | (35 | ) | ||||||||
| Free cash flow | 19 | 57 | 158 | 171 | ||||||||||||
| Weighted average number of common shares outstanding in the period | 272 | 262 | 271 | 260 | ||||||||||||
| FFO per share | 0.57 | 0.70 | 1.45 | 1.45 | ||||||||||||
| Free cash flow per share | 0.07 | 0.22 | 0.58 | 0.66 | ||||||||||||
A reconciliation of comparable EBITDA to FFO is as follows:
| 3 months ended June 30 | 6 months ended June 30 | |||||||||||||||
| 2014 | 2013 | 2014 | 2013 | |||||||||||||
| Comparable EBITDA | 213 | 247 | 523 | 515 | ||||||||||||
| Realized gains from risk management activities | 5 | 10 | 10 | 10 | ||||||||||||
| Interest expense | (58 | ) | (58 | ) | (119 | ) | (116 | ) | ||||||||
| Provisions | 6 | 7 | 4 | - | ||||||||||||
| Current income tax expense | (9 | ) | (18 | ) | (17 | ) | (26 | ) | ||||||||
| Realized foreign exchange gain (loss) | (3 | ) | 2 | 1 | 5 | |||||||||||
| Decommissioning and restoration costs settled | (4 | ) | (8 | ) | (7 | ) | (13 | ) | ||||||||
| Reversal of restructuring charges | - | 2 | - | 2 | ||||||||||||
| Flood-related maintenance costs | 4 | - | - | - | ||||||||||||
| Payment of restructuring costs | - | - | - | 4 | ||||||||||||
| Timing of payments related to assumption of pension obligations | - | (2 | ) | - | 7 | |||||||||||
| Other non-cash items | - | 2 | (3 | ) | (11 | ) | ||||||||||
| FFO | 154 | 184 | 392 | 377 | ||||||||||||
FFO for the three months ended June 30, 2014 decreased $30 million compared to the same period in 2013 to $154 million, primarily due to lower comparable EBITDA. For the six months ended June 30, 2014, FFO increased $15 million compared to the same period in 2013, primarily due to higher comparable EBITDA. Cash interest and cash income taxes paid are consistent for the three and six month periods in 2014 and 2013.
6 TRANSALTA CORPORATION / Q2 2014
Free cash flow for the three months ended June 30, 2014 decreased $38 million compared to the same period in 2013 to $19 million primarily due to the decrease in FFO.
For the six months ended June 30, 2014, free cash flow decreased $13 million compared to the same period in 2013 to $158 million. Sustaining capital expenditures for the six months ended June 30, 2014 were $19 million higher than in the same period in 2013. We expect our sustaining capital expenditures to be between $315 million and $345 million for the 2014 fiscal year. Distributions paid to our subsidiaries’ non-controlling interests increased $9 million as a result of the reduction of our interest in TransAlta Renewables and improved performance at TransAlta Cogeneration LP.
SIGNIFICANT EVENTS
South Hedland Power Project
On July 28, 2014, we announced that we agreed to build, own, and operate a 150 MW combined cycle gas power station in South Hedland, Western Australia. The project is estimated to cost approximately AUD$570 million to build, including the cost of acquiring existing equipment from Horizon Power. The development has been fully contracted under 25-year PPAs with Horizon Power, a state owned utility company, and The Pilbara Infrastructure Pty Ltd., a wholly owned subsidiary of Fortescue, a mining company. The project may be expanded to accommodate additional customers at later dates. The power station will supply Horizon Power’s customers in the Pilbara region as well as Fortescue’s port operations. IHI Engineering Australia has been selected as the contractor to construct the power station. Applications for the relevant work and environmental permits have been submitted and are now in progress. Construction is expected to take place over the next three years and the power station is expected to be commissioned and delivering power to customers in the first half of 2017.
Australia Natural Gas Pipeline
On Jan. 15, 2014, we announced the formation of an unincorporated joint venture named Fortescue River Gas Pipeline Joint Venture to build, own, and operate a $178 million natural gas pipeline from the Dampier to Bunbury Natural Gas Pipeline to our Solomon power station. We hold a 43 per cent interest in the joint venture through a wholly owned subsidiary. The project is on schedule and within budget. All of the design work is now complete, licenses have been issued, and the first shipment of linepipe is on site. In addition to our portion of the pipeline cost, $10 million in plant retrofitting costs are being incurred as part of the project, which will be recovered over time through increased lease payments.
Sale of CE Gen, Blackrock, and CalEnergy
On June 12, 2014, we completed the previously announced sale of our 50 per cent ownership of CE Gen, Blackrock, and CalEnergy to MidAmerican Renewables for gross proceeds of U.S.$200.5 million. The net proceeds were U.S.$188.5 million, after consideration of an equity contribution made by us to CE Gen in May 2014. As a result of the sale, we recognized a pre-tax gain of $1 million in second quarter earnings.
We expect the sale of our 50 per cent interest in the Wailuku Holding Company, LLC, announced in February 2014, to close in December 2014.
TRANSALTA CORPORATION / Q2 2014 7
Secondary Offering of TransAlta Renewables Shares
On April 29, 2014, we completed the previously announced secondary offering of 11,950,000 common shares of TransAlta Renewables at a price of $11.40 per common share. As a result of the offering, we received gross proceeds of approximately $136 million (net proceeds of approximately $129 million after issuance costs). The net proceeds from the offering were used to reduce indebtedness, to fund growth, and for general corporate purposes. Following completion of the offering, we own approximately 70.3 per cent of the common shares of TransAlta Renewables.
Fort McMurray Transmission Project
On Jan. 17, 2014, we announced that our strategic partnership with MidAmerican Transmission, TAMA Transmission LP (“TAMA Transmission”), which was formed on May 9, 2013, successfully qualified to participate as a proponent in the Fort McMurray West 500 kilovolt Transmission Project. The Alberta Electric System Operator (“AESO”) announced its selection of a short-list of companies, identifying TAMA Transmission as a participant in the next stage of its competitive process for the project. The AESO has indicated that it intends to select the preferred proponent in December 2014.
California Claim
On May 30, 2014, we announced that our settlement with California utilities, the California Attorney General and certain other parties (“California Parties”) to resolve claims related to the 2000 - 2001 power crisis in the State of California had been approved by the U.S. Federal Energy Regulatory Commission. The settlement provides for the payment by us of U.S.$52 million in two equal payments and a credit of approximately U.S.$97 million for monies owed to us from accounts receivable. The first payment of U.S.$26 million was paid in June 2014 and the second is expected to be made in 2015. During the fourth quarter of 2013, the Corporation accrued for the then expected settlement of these disputes with the California Parties, which resulted in a pre-tax charge to earnings of approximately $56 million. An additional pre-tax charge to 2014 second quarter earnings of $5 million arose as a result of the final settlement.
Proceedings before the Alberta Utilities Commission
On March 21, 2014, the Alberta Market Surveillance Administrator (the “MSA”) filed an application with the Alberta Utilities Commission (the “AUC”) alleging, among other things, that TransAlta manipulated the price of electricity in the Province of Alberta when it took outages at certain of its coal-fired generating units in late 2010 and early 2011. TransAlta has denied the MSA’s allegations in their entirety. The MSA’s application is presently before the AUC. The hearing in relation to the application is currently set to proceed in December 2014.
Senior Notes Offering
On June 3, 2014, we completed an offering of U.S.$400 million of senior notes, due in June 2017, that carry a coupon rate of 1.90 per cent, payable semi-annually, at an issue price equal to 99.887 per cent of the principal amount of the notes. The net proceeds from the offering were used to repay borrowings under existing credit facilities and for general corporate purposes.
Sundance Unit 6 Agreement
On Feb. 19, 2014, we reached an agreement with the PPA Buyer related to the dispute on Sundance Unit 6. There were no material impacts to the financial statements as a result of the agreement.
8 TRANSALTA CORPORATION / Q2 2014
Executive Leadership Team Appointments
On March 18, 2014, we announced three senior leadership appointments that will enhance our objectives of operational excellence from the base business and growth. Brett Gellner was appointed to the role of Chief Investment Officer, responsible for leading all growth aspects of the Corporation. Donald Tremblay joined TransAlta as Chief Financial Officer, effective March 31, 2014, and Wayne Collins assumed leadership accountabilities for our Coal and Mining Operations on July 3, 2014.
BUSINESS ENVIRONMENT
We operate in a variety of business environments to generate electricity, find buyers for the power we generate, and arrange for its transmission. The major markets we operate in are Western Canada, the Western U.S., and Eastern Canada. For a further description of the regions in which we operate as well as the impact of prices of electricity and natural gas upon our financial results, refer to our 2013 Annual MD&A.
Contracted Cash Flows
During the second quarter of 2014, approximately 90 per cent of our consolidated power portfolio was contracted through the use of PPAs and other long-term contracts. We also entered into short-term physical and financial contracts for the remaining volumes, which are primarily for periods of up to five years. The average prices of these contracts for the balance of 2014 are approximately $55 per MWh in Alberta and approximately U.S.$40 per MWh in the Pacific Northwest.
Electricity Prices
Please refer to the Business Environment section of our 2013 Annual MD&A for a full discussion of the spot electricity market and the impact of electricity prices on our business, as well as our strategy to hedge our risks associated with changes in these prices.
TRANSALTA CORPORATION / Q2 2014 9
The average spot electricity prices for the three and six months ended June 30, 2014 and 2013 in our three major markets are shown in the following graphs:

For the three months ended June 30, 2014, average spot prices in Alberta decreased compared to the same period in 2013, primarily due to an increase in supply as a result of Sundance Units 1 and 2 returning to service and higher supply. Although averages prices decreased slightly in the Pacific Northwest, specific prices at the beginning and the end of the three month period ended June 30, 2014 were higher than in the same period in 2013. Average spot prices in Ontario for the three months ended June 30, 2014 were unchanged compared to the same period in 2013.
10 TRANSALTA CORPORATION / Q2 2014
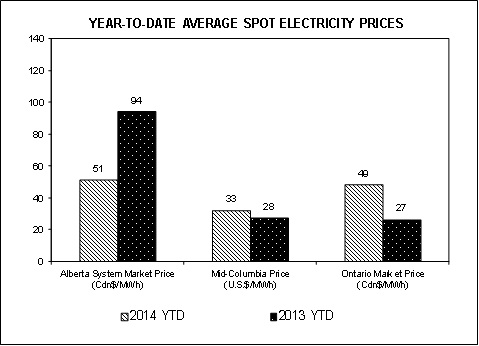
For the six months ended June 30, 2014, average spot prices in Alberta decreased compared to the same period in 2013, primarily due to an increase in supply as a result of Sundance Units 1 and 2 returning to service and higher supply. In the Pacific Northwest, average spot prices increased due to higher natural gas prices, particularly in February, partially offset by higher hydro and nuclear production. Average spot prices in Ontario for the six months ended June 30, 2014 increased compared to the same period in 2013 due to extreme cold weather across the entire northeast during the first quarter, which led to higher natural gas prices and increased demand.
Over the balance of 2014, power prices in Alberta are expected to be lower than 2013 as a result of more baseload generation and fewer planned maintenance outages across the market. However, prices can vary based on supply and weather conditions. In the Pacific Northwest, we expect prices to settle higher than in 2013 due to marginally higher natural gas prices. In Ontario, prices for the balance of the year are expected to be higher than 2013 due to higher natural gas prices and coal unit retirements.
TRANSALTA CORPORATION / Q2 2014 11
DISCUSSION OF SEGMENTED RESULTS
We have three business segments: Generation, Energy Trading, and Corporate.
Generation: Owns and operates hydro, wind, natural gas-fired and coal-fired facilities, and related mining operations in Canada, the U.S., and Australia. Generation revenues and overall profitability are derived from the availability and production of electricity and steam as well as ancillary services such as system support. Electricity sales generated by our Commercial and Industrial group are assumed to be sourced from TransAlta’s production and have been included in the Generation Segment on a net basis.
The full capacity of the facilities in which we have a share of ownership is 10,144 MW (1)(2). At June 30, 2014, our generating assets had 9,092 MW (1)(2) of gross generating capacity in operation (8,381 MW (1)(2) net ownership interest). The following information excludes assets that were accounted for using the equity method, which are discussed separately within this discussion of the Generation Segment.
The results of the Generation Segment are as follows:
| 3 months ended June 30, 2014 | 3 months ended June 30, 2013 | |||||||||||||||||||||||
| Reported | Comparable adjustments and reclassification(3) | Comparable total | Reported | Comparable adjustments and reclassifications(3) | Comparable total | |||||||||||||||||||
Availability (%)(4) | 82.1 | 3.3 | 85.4 | 70.8 | 9.7 | 80.5 | ||||||||||||||||||
Production (GWh)(4) | 9,283 | - | 9,283 | 7,718 | - | 7,718 | ||||||||||||||||||
Gross installed capacity (MW)(1), (4) | 9,092 | - | 9,092 | 8,388 | - | 8,388 | ||||||||||||||||||
Net installed capacity (MW)(1), (4) | 8,381 | - | 8,381 | 8,007 | - | 8,007 | ||||||||||||||||||
| Revenues | 483 | 47 | 530 | 528 | 20 | 548 | ||||||||||||||||||
| Fuel and purchased power | 212 | (13 | ) | 199 | 187 | (15 | ) | 172 | ||||||||||||||||
| Gross margin | 271 | 60 | 331 | 341 | 35 | 376 | ||||||||||||||||||
| Operations, maintenance, and administration | 104 | 2 | 106 | 111 | (1 | ) | 110 | |||||||||||||||||
| Inventory writedown (reversal) | (4 | ) | - | (4 | ) | 2 | - | 2 | ||||||||||||||||
| Taxes, other than income taxes | 7 | - | 7 | 8 | - | 8 | ||||||||||||||||||
| Intersegment cost allocation | 4 | - | 4 | 3 | - | 3 | ||||||||||||||||||
| Insurance recovery | - | (1 | ) | (1 | ) | - | - | - | ||||||||||||||||
| Gain on sale of assets | - | - | - | - | 1 | 1 | ||||||||||||||||||
| Mine depreciation | - | - | - | - | - | - | ||||||||||||||||||
| EBITDA | 160 | 59 | 219 | 217 | 35 | 252 | ||||||||||||||||||
| Depreciation and amortization | 125 | 13 | 138 | 125 | 14 | 139 | ||||||||||||||||||
| Restructuring provision | - | - | - | (1 | ) | 1 | - | |||||||||||||||||
| Operating income | 35 | 46 | 81 | 93 | 20 | 113 | ||||||||||||||||||
___________________
| (1) | We measure capacity as net maximum capacity (see Glossary of Key Terms for definition of this and other key terms), which is consistent with industry standards. Capacity figures represent capacity owned and in operation unless otherwise stated. Gross capacity reflects the basis of consolidation of underlying assets, while net capacity deducts capacity attributable to non-controlling interests in these assets. |
| (2) | The Centralia gas plant is currently not in operation. We are currently assessing the generation needs of the region and the financial feasibility of bringing the plant back into operation. |
| (3) | Comparable figures are not defined under IFRS. Refer to the Earnings and Other Measures on a Comparable Basis section of this MD&A for further discussion of these items, including, where applicable, reconciliations to net earnings attributable to common shareholders. |
12 TRANSALTA CORPORATION / Q2 2014
| 6 months ended June 30, 2014 | 6 months ended June 30, 2013 | |||||||||||||||||||||||
| Reported | Comparable adjustments and reclassifications(3) | Comparable total | Reported | Comparable adjustments and reclassifications(3) | Comparable total | |||||||||||||||||||
Availability (%)(4) | 86.8 | 1.6 | 88.4 | 81.1 | 4.9 | 86.0 | ||||||||||||||||||
Production (GWh)(4) | 21,036 | - | 21,036 | 17,968 | - | 17,968 | ||||||||||||||||||
Gross installed capacity (MW)(1), (4) | 9,092 | - | 9,092 | 8,388 | - | 8,388 | ||||||||||||||||||
Net installed capacity (MW)(1), (4) | 8,381 | - | 8,381 | 8,007 | - | 8,007 | ||||||||||||||||||
| Revenues | 1,193 | 53 | 1,246 | 1,051 | 73 | 1,124 | ||||||||||||||||||
| Fuel and purchased power | 547 | (28 | ) | 519 | 388 | (26 | ) | 362 | ||||||||||||||||
| Gross margin | 646 | 81 | 727 | 663 | 99 | 762 | ||||||||||||||||||
| Operations, maintenance, and administration | 216 | (2 | ) | 214 | 205 | (1 | ) | 204 | ||||||||||||||||
| Inventory writedown | - | - | - | 16 | - | 16 | ||||||||||||||||||
| Taxes, other than income taxes | 14 | - | 14 | 15 | - | 15 | ||||||||||||||||||
| Intersegment cost allocation | 7 | - | 7 | 7 | - | 7 | ||||||||||||||||||
| Insurance recovery | - | (1 | ) | (1 | ) | - | - | - | ||||||||||||||||
| EBITDA | 409 | 84 | 493 | 420 | 100 | 520 | ||||||||||||||||||
| Depreciation and amortization | 254 | 28 | 282 | 247 | 26 | 273 | ||||||||||||||||||
| Decrease in finance lease receivable | - | 1 | 1 | - | 1 | 1 | ||||||||||||||||||
| Restructuring provision | - | - | - | (1 | ) | 1 | - | |||||||||||||||||
| Operating income | 155 | 55 | 210 | 174 | 72 | 246 | ||||||||||||||||||
___________________
| (4) | Availability, production, and installed capacity include assets under generation operations and finance leases. |
| (1) | We measure capacity as net maximum capacity (see Glossary of Key Terms for definition of this and other key terms), which is consistent with industry standards. Capacity figures represent capacity owned and in operation unless otherwise stated. Gross capacity reflects the basis of consolidation of underlying assets, while net capacity deducts capacity attributable to non-controlling interests in these assets. |
| (2) | The Centralia gas plant is currently not in operation. We are currently assessing the generation needs of the region and the financial feasibility of bringing the plant back into operation. |
| (3) | Comparable figures are not defined under IFRS. Refer to the Earnings and Other Measures on a Comparable Basis section of this MD&A for further discussion of these items, including, where applicable, reconciliations to net earnings attributable to common shareholders. |
| (4) | Availability, production, and installed capacity include assets under generation operations and finance leases. |
TRANSALTA CORPORATION / Q2 2014 13
Coal: TransAlta owns and operates coal-fired facilities and related mining operations in Canada and the U.S. Coal revenues and overall profitability are derived from the availability and production of electricity. For a full listing of all of our generating assets and the regions in which they operate, refer to the Plant Summary section of our 2013 Annual MD&A.
14 TRANSALTA CORPORATION / Q2 2014
Canadian Coal
| 3 months ended June 30 | 6 months ended June 30 | |||||||||||||||
| 2014 | 2013 | 2014 | 2013 | |||||||||||||
| Availability (%) | 86.9 | 74.5 | 87.0 | 79.9 | ||||||||||||
| Production (GWh) | 5,875 | 4,509 | 12,124 | 9,784 | ||||||||||||
| Gross installed capacity (MW) | 3,771 | 3,211 | 3,771 | 3,211 | ||||||||||||
| Net installed capacity (MW) | 3,576 | 3,016 | 3,576 | 3,016 | ||||||||||||
| Revenues | 236 | 188 | 490 | 416 | ||||||||||||
| Fuel and purchased power | 103 | 81 | 210 | 164 | ||||||||||||
Comparable gross margin(1) | 133 | 107 | 280 | 252 | ||||||||||||
| Operations, maintenance, and administration | 46 | 54 | 95 | 98 | ||||||||||||
| Taxes, other than income taxes | 3 | 3 | 6 | 6 | ||||||||||||
| Intersegment cost allocation | 1 | 1 | 2 | 2 | ||||||||||||
| Gain on sale of assets | - | 1 | - | - | ||||||||||||
Comparable EBITDA(1) | 83 | 48 | 177 | 146 | ||||||||||||
| Depreciation and amortization | 68 | 71 | 144 | 140 | ||||||||||||
Comparable operating income (loss)(1) | 15 | (23 | ) | 33 | 6 | |||||||||||
| Sustaining capital expenditures: | ||||||||||||||||
| Routine capital | 15 | 13 | 25 | 19 | ||||||||||||
| Mining equipment and land purchases | 3 | 12 | 8 | 20 | ||||||||||||
| Finance leases | 2 | 4 | 4 | 4 | ||||||||||||
Planned major maintenance(2) | 36 | 36 | 64 | 59 | ||||||||||||
| Total | 56 | 65 | 101 | 102 | ||||||||||||
Production for the three and six months ended June 30, 2014 increased 1,366 GWh and 2,340 GWh, respectively, compared to the same periods in 2013, primarily due to Sundance Units 1 and 2 returning to service. During the second quarter of 2014 availability was impacted as Sundance Unit 6 was taken out of service for a 60 day planned major maintenance outage. Sundance Unit 6 returned to service on July 13, 2014. In addition, during the second quarter of 2013 Keephills Unit 1 was out of service due to a Force Majeure event. Keephills Unit 1 returned to service Oct 6, 2013. For the balance of 2014, there are no further scheduled planned major maintenance outages on plants we operate.
For the three and six months ended June 30, 2014, comparable gross margin increased by $26 million and $28 million, respectively, compared to the same periods in 2013. Prior year results were negatively impacted by the purchase of higher-priced power to settle existing financial contracts due to lower than expected generation during unplanned outages. Comparable gross margin in 2014 also increased due to lower unplanned outages at PPA plants and the return to service of Sundance Units 1 and 2, partially offset by the unfavourable impact of higher planned outages at PPA plants and higher coal and Greenhouse Gas (“GHG”) offset costs driven by higher production.
For the three and six months ended June 30, 2014, comparable OM&A costs decreased by $8 million and $3 million, respectively, compared to the same periods in 2013, primarily due to reduced maintenance costs associated with lower unplanned outages and the implementation of an initiative to reduce contract labour, staff overtime work, and material usage, partially offset by higher corporate cost allocations resulting from the way in which certain overhead cost allocations are made.
___________________
| (1) | Comparable figures are not defined under IFRS. Refer to the Earnings and Other Measures on a Comparable Basis section of this MD&A for further discussion of these items, including, where applicable, reconciliations to net earnings attributable to common shareholders. |
| (2) | For the three and six months ended June 30, 2014, consists of three and three planned outages, respectively. For the three and six months ended June 30, 2013, consists of one and two planned outages, respectively. |
TRANSALTA CORPORATION / Q2 2014 15
Depreciation and amortization for the three months ended June 30, 2014 was lower than in the same period in 2013, primarily due to lower asset retirements, largely offset by the effects of Sundance Units 1 and 2 returning to service.
Depreciation and amortization for the six months ended June 30, 2014 increased by $4 million compared to the same period in 2013 due to an increased asset base, primarily related to Sundance Units 1 and 2 returning to service, largely offset by lower asset retirements.
U.S. Coal
| 3 months ended June 30 | 6 months ended June 30 | |||||||||||||||
| 2014 | 2013 | 2014 | 2013 | |||||||||||||
| Availability (%) | 49.0 | 22.2 | 71.8 | 60.1 | ||||||||||||
Adjusted availability (%)(1) | 68.9 | 76.7 | 81.9 | 87.8 | ||||||||||||
| Production (GWh) | 370 | 132 | 2,486 | 1,810 | ||||||||||||
| Gross and net installed capacity (MW) | 1,340 | 1,340 | 1,340 | 1,340 | ||||||||||||
| Revenues | 44 | 52 | 150 | 123 | ||||||||||||
| Fuel and purchased power | 21 | 18 | 92 | 49 | ||||||||||||
| Comparable gross margin | 23 | 34 | 58 | 74 | ||||||||||||
| Operations, maintenance, and administration | 10 | 9 | 23 | 20 | ||||||||||||
| Inventory writedown (reversal) | (4 | ) | 2 | - | 16 | |||||||||||
| Taxes, other than income taxes | 1 | 1 | 1 | 2 | ||||||||||||
| Intersegment cost allocation | 2 | 1 | 3 | 3 | ||||||||||||
| Comparable EBITDA | 14 | 21 | 31 | 33 | ||||||||||||
| Depreciation and amortization | 13 | 14 | 27 | 27 | ||||||||||||
| Comparable operating income | 1 | 7 | 4 | 6 | ||||||||||||
| Sustaining capital expenditures: | ||||||||||||||||
| Routine capital | 1 | 2 | 1 | 4 | ||||||||||||
| Planned major maintenance | 8 | 6 | 9 | 7 | ||||||||||||
| Total | 9 | 8 | 10 | 11 | ||||||||||||
Production for the three and six months ended June 30, 2014 increased 238 GWh and 676 GWh, respectively, compared to the same periods in 2013 due to lower economic dispatching as a result of certain months during the period in which higher prices made production economical. In periods of low market prices, such as during spring runoff, it can be more economical for us to not produce power at Centralia Thermal and purchase power in the market to satisfy our contractual obligations.
For the three months ended June 30, 2014, comparable EBITDA decreased by $7 million compared to the same period in 2013, primarily due to lower volumes of higher priced hedge contracts and low prices in the Pacific Northwest, partially offset by the reversal of writedowns of coal inventories associated with increasing forecast market prices and higher production. We were also able to offset some of the earnings shortfall by optimizing the plant through short-term contracting.
Year-to-date comparable EBITDA for the six months ended June 30, 2014 decreased to $31 million in 2014, down $2 million when compared to 2013, primarily as a result of the lower second quarter comparable EBITDA, partially offset by higher market prices in the first quarter.
___________________
| (1) | Adjusted for economic dispatching. |
16 TRANSALTA CORPORATION / Q2 2014
Gas: TransAlta owns and operates natural gas-fired facilities in Canada, the U.S., and Australia. Gas revenues and overall profitability are derived from the availability and production of electricity and steam. For a full listing of all of our generating assets and the regions in which they operate, refer to the Plant Summary section of our 2013 Annual MD&A.
| 3 months ended June 30 | 6 months ended June 30 | |||||||||||||||
| 2014 | 2013 | 2014 | 2013 | |||||||||||||
| Availability (%) | 89.0 | 90.2 | 92.5 | 93.9 | ||||||||||||
Production (GWh)(1) | 1,839 | 1,826 | 3,847 | 3,959 | ||||||||||||
Gross installed capacity (MW)(1), (2) | 1,779 | 1,779 | 1,779 | 1,779 | ||||||||||||
Net installed capacity (MW)(1), (2) | 1,618 | 1,618 | 1,618 | 1,618 | ||||||||||||
| Revenues | 168 | 180 | 413 | 359 | ||||||||||||
| Fuel and purchased power | 70 | 67 | 206 | 138 | ||||||||||||
| Comparable gross margin | 98 | 113 | 207 | 221 | ||||||||||||
| Operations, maintenance, and administration | 28 | 27 | 53 | 49 | ||||||||||||
| Taxes, other than income taxes | 1 | 1 | 2 | 2 | ||||||||||||
| Intersegment cost allocation | - | - | 1 | 1 | ||||||||||||
| Comparable EBITDA | 69 | 85 | 151 | 169 | ||||||||||||
| Depreciation and amortization | 28 | 27 | 55 | 54 | ||||||||||||
| Decrease in finance lease receivable | - | - | 1 | 1 | ||||||||||||
| Comparable operating income | 41 | 58 | 95 | 114 | ||||||||||||
| Sustaining capital expenditures: | ||||||||||||||||
| Routine capital | 5 | 5 | 8 | 7 | ||||||||||||
| Planned major maintenance | 20 | 13 | 24 | 17 | ||||||||||||
| Total | 25 | 18 | 32 | 24 | ||||||||||||
Production for the three months and six months ended June 30, 2014 was comparable to the same periods in 2013.
For the three and six months ended June 30, 2014, comparable EBITDA decreased by $16 million and $18 million, respectively, compared to the same periods in 2013, primarily due to lower Alberta prices in the second quarter, which impacted our Poplar Creek facility, and the reduced contribution from our Ottawa facility under the terms of the contract effective Jan. 1, 2014. Those decreases in comparable EBITDA were partially offset by the benefits achieved through resale of excess gas during unplanned outages. The decreased contribution from the Ottawa contract was included in our 2014 full year EBITDA forecast. The capacity-based contract is consistent with our contracting strategy and its twenty-year duration supports continued investment in the facility.
For the three and six months ended June 30, 2014, the increase in sustaining capital expenditures compared to the same periods in 2013 is mainly due to an increase in planned major maintenance activities, including outages at Ottawa and Sarnia.
| (1) | Includes production capacity for Fort Saskatchewan and Solomon power stations, which have been accounted for as finance leases. |
| (2) | The Centralia gas plant is currently not in operation. We are currently assessing the generation needs of the region and the financial feasibility of bringing the plant back into operation. |
TRANSALTA CORPORATION / Q2 2014 17
Renewables: TransAlta owns and operates hydro and wind facilities in Canada and the U.S. Renewable revenues and overall profitability are derived from the availability of water and wind resources and the production of electricity, as well as ancillary services such as system support. For a full listing of all of our generating assets and the regions in which they operate, refer to the Plant Summary section of our 2013 Annual MD&A.
Wind
| 3 months ended June 30 | 6 months ended June 30 | |||||||||||||||
| 2014 | 2013 | 2014 | 2013 | |||||||||||||
| Availability (%) | 93.5 | 93.8 | 93.9 | 93.9 | ||||||||||||
| Production (GWh) | 649 | 617 | 1,661 | 1,405 | ||||||||||||
| Gross installed capacity (MW) | 1,289 | 1,145 | 1,289 | 1,145 | ||||||||||||
| Net installed capacity (MW) | 965 | 1,120 | 965 | 1,120 | ||||||||||||
| Revenues | 49 | 62 | 129 | 126 | ||||||||||||
| Fuel and purchased power | 3 | 3 | 7 | 7 | ||||||||||||
| Comparable gross margin | 46 | 59 | 122 | 119 | ||||||||||||
| Operations, maintenance, and administration | 11 | 10 | 23 | 19 | ||||||||||||
| Intersegment cost allocation | 1 | 1 | 1 | 1 | ||||||||||||
| Taxes, other than income taxes | 1 | 2 | 3 | 3 | ||||||||||||
| Comparable EBITDA | 33 | 46 | 95 | 96 | ||||||||||||
| Depreciation and amortization | 23 | 19 | 44 | 38 | ||||||||||||
| Comparable operating income | 10 | 27 | 51 | 58 | ||||||||||||
| Sustaining capital expenditures: | ||||||||||||||||
| Routine capital | 1 | 1 | 1 | 2 | ||||||||||||
| Planned major maintenance | 3 | 1 | 4 | 2 | ||||||||||||
| Total | 4 | 2 | 5 | 4 | ||||||||||||
Production for the three months ended June 30, 2014 increased 32 GWh compared to the same period in 2013, primarily due to the contribution from Wyoming Wind, partially offset by lower wind volumes in both Western and Eastern Canada.
For the three months ended June 30, 2014, comparable EBITDA decreased by $13 million compared to the same period in 2013, due to lower prices in Alberta and lower wind volumes, partially offset by the contribution from Wyoming Wind.
Depreciation and amortization for the three months ended June 30, 2014 increased by $4 million compared to the same period in 2013 primarily due to the acquisition of Wyoming Wind.
Production for the six months ended June 30, 2014 increased 256 GWh compared to the same period in 2013 due to the contribution from Wyoming Wind, a full six months of operations at New Richmond, and higher wind volumes in Eastern Canada, partially offset by lower wind volumes in Western Canada.
For the six months ended June 30, 2014, comparable EBITDA decreased by $1 million compared to the same period in 2013, due to lower prices in Western Canada, largely offset by the contributions from New Richmond and Wyoming Wind and higher wind volumes in Eastern Canada.
Depreciation and amortization for the six months ended June 30, 2014 increased by $6 million compared to the same period in 2013 due to a full six months of operations at New Richmond and the acquisition of Wyoming Wind.
18 TRANSALTA CORPORATION / Q2 2014
Hydro
| 3 months ended June 30 | 6 months ended June 30 | |||||||||||||||
| 2014 | 2013 | 2014 | 2013 | |||||||||||||
| Production (GWh) | 550 | 634 | 918 | 1,010 | ||||||||||||
| Gross installed capacity (MW) | 913 | 913 | 913 | 913 | ||||||||||||
| Net installed capacity (MW) | 882 | 913 | 882 | 913 | ||||||||||||
| Revenues | 33 | 66 | 64 | 100 | ||||||||||||
| Fuel and purchased power | 2 | 3 | 4 | 4 | ||||||||||||
| Comparable gross margin | 31 | 63 | 60 | 96 | ||||||||||||
| Operations, maintenance, and administration | 11 | 10 | 20 | 18 | ||||||||||||
| Taxes, other than income taxes | 1 | 1 | 2 | 2 | ||||||||||||
| Insurance recovery | (1 | ) | - | (1 | ) | - | ||||||||||
| Comparable EBITDA | 20 | 52 | 39 | 76 | ||||||||||||
| Depreciation and amortization | 6 | 8 | 12 | 14 | ||||||||||||
| Comparable operating income | 14 | 44 | 27 | 62 | ||||||||||||
| Sustaining capital expenditures: | ||||||||||||||||
| Routine capital | 8 | 2 | 11 | 3 | ||||||||||||
| Total | 8 | 2 | 11 | 3 | ||||||||||||
Production for the three and six months ended June 30, 2014 decreased by 84 GWh and 92 GWh, respectively, compared to the same periods in 2013 due to lower water resource in the second quarter in Western Canada. In 2013, water inflows in Western Canada were much higher than normal.
Comparable EBITDA decreased by $32 million and $37 million, respectively, for the three and six months ended June 30, 2014 compared to the same periods in 2013, primarily as a result of lower market pricing in Alberta for power and ancillary services and lower production. Lower prices and low price volatility in Alberta limited our ability to take advantage of our flexibility to produce electricity during higher priced hours.
For the three and six months ended June 30, 2014, the increase in sustaining capital expenditures compared to the same periods in 2013 is mainly due to flood recovery expenditures.
Equity Investments
As outlined in the Significant Events section of this MD&A, we completed the sale of our interests in CE Gen and CalEnergy in
June 2014. We continue to be the beneficial owner of our 50 per cent interest in Wailuku until the proposed sale closes in December 2014. The Wailuku hydro facility has 10 MW of gross generating capacity (5 MW net ownership interest).
The equity method was used to account for the results of the CE Gen, CalEnergy, and Wailuku joint ventures for the months of January and February 2014, but ceased effective March 1, 2014 with classification of these investments as assets held for sale in compliance with IFRS requirements.
TRANSALTA CORPORATION / Q2 2014 19
The table below summarizes key operational information adjusted to reflect our interest in these investments:
| 2 months ended | 3 months ended | 6 months ended | ||||||||||
| Feb. 28, 2014 | June 30, 2013 | June 30, 2013 | ||||||||||
| Availability (%) | 97.1 | 91.9 | 89.4 | |||||||||
| Production (GWh): | ||||||||||||
| Gas | 127 | 68 | 208 | |||||||||
| Renewables | 187 | 324 | 578 | |||||||||
| Total production | 314 | 392 | 786 | |||||||||
Our investment in TAMA Transmission continues to be accounted for using the equity method.
Energy Trading: Derives revenue and earnings from the wholesale marketing and trading of electricity and other energy-related commodities and derivatives. Achieving gross margins, while remaining within Value at Risk (“VaR”) limits, is a key measure of Energy Trading’s activities. Refer to the Value at Risk and Trading Positions discussion in the Risk Management section of our 2013 Annual MD&A for further discussion on VaR.
Energy Trading markets our production through short-term and long-term contracts, ensures cost effective and reliable fuel supply, and seeks to capture margin upside within dynamic market conditions. We leverage our core marketing capabilities by also serving third party customers' energy supply and marketing needs.
Our marketing commitments are backed by our own supply and through the acquisition of third party supply and proprietary marketing assets, such as transmission, transportation, and storage rights. In the course of managing our portfolio, we actively seek to take advantage of our knowledge of physical power and fuel markets to capture incremental arbitrage margins.
All activities are managed within our core markets and within our low to moderate risk profile. Direct marketing of our own generation is reported in the Generation Segment results. All activities indirectly related to our assets and all other marketing activities are reported in the Energy Trading Segment.
For a more in-depth discussion of our Energy Trading activities, refer to the Discussion of Segmented Results section of our 2013 Annual MD&A.
The results of the Energy Trading Segment, with all trading results presented on a net basis, are as follows:
| 3 months ended June 30 | 6 months ended June 30 | |||||||||||||||
| 2014 | 2013 | 2014 | 2013 | |||||||||||||
| Revenues and comparable gross margin | 8 | 14 | 73 | 31 | ||||||||||||
| Operations, maintenance, and administration | 8 | 6 | 27 | 14 | ||||||||||||
| Intersegment cost allocation | (4 | ) | (3 | ) | (7 | ) | (7 | ) | ||||||||
| Comparable EBITDA and comparable operating income | 4 | 11 | 53 | 24 | ||||||||||||
For the three months ended June 30, 2014, comparable EBITDA decreased by $7 million compared to the same period in 2013, primarily due to lower commodity price volatility, higher performance-based compensation costs, and higher corporate cost allocations. Lower commodity price volatility in Alberta impacted Energy Trading’s ability to generate gross margin. Results from other markets in which we transact were consistent with 2013.
20 TRANSALTA CORPORATION / Q2 2014
For the six months ended June 30, 2014, comparable EBITDA increased by $29 million to $53 million. The increase in revenues and comparable gross margin resulted from extreme weather events caused by unprecedented gas and power commodity price volatility in eastern markets during the first quarter of 2014, which positively impacted our ability to optimize our portfolio of generation, transportation, transmission, and storage assets. We also capitalized on low risk arbitrage opportunities brought about by the extreme market volatility. The increase was partially offset by higher performance-based compensation costs driven by the strong results and higher corporate cost allocations.
We expect the Energy Trading gross margin to remain closer to historical levels for the balance of the year.
Corporate: Our Generation and Energy Trading segments are supported by a Corporate group that provides finance, tax, treasury, legal, regulatory, environmental, procurement, health and safety, sustainable development, corporate communications, government and investor relations, information technology, risk management, human resources, internal audit, and other administrative support.
The expenses incurred by the Corporate Segment are as follows:
| 3 months ended June 30 | 6 months ended June 30 | |||||||||||||||
| 2014 | 2013 | 2014 | 2013 | |||||||||||||
| Operations, maintenance, and administration and comparable EBITDA | 10 | 16 | 23 | 29 | ||||||||||||
| Depreciation and amortization | 7 | 6 | 13 | 11 | ||||||||||||
| Comparable operating loss | (17 | ) | (22 | ) | (36 | ) | (40 | ) | ||||||||
| Sustaining capital expenditures: | ||||||||||||||||
| Routine capital | 5 | 6 | 12 | 8 | ||||||||||||
| Total | 5 | 6 | 12 | 8 | ||||||||||||
For the three months ended June 30, 2014, OM&A expenses decreased by $6 million compared to the same period in 2013, primarily due to a decrease in incentive-based compensation and a change in the way in which certain overhead cost allocations are made within the organization.
For the six months ended June 30, 2014, OM&A expense decreased by $6 million compared to the same period in 2013, primarily due to a change in the way in which certain overhead cost allocations are made within the organization.
Routine capital expenditures for the six months ended June 30, 2014 increased compared to the same period in 2013, primarily as a result of an increase in corporate information technology expenditures.
NET INTEREST EXPENSE
The components of net interest expense are as follows:
| 3 months ended June 30 | 6 months ended June 30 | |||||||||||||||
| 2014 | 2013 | 2014 | 2013 | |||||||||||||
| Interest on debt | 58 | 58 | 119 | 118 | ||||||||||||
| Capitalized interest | - | - | - | (2 | ) | |||||||||||
| Interest expense | 58 | 58 | 119 | 116 | ||||||||||||
| Accretion of provisions | 4 | 5 | 9 | 9 | ||||||||||||
| Net interest expense | 62 | 63 | 128 | 125 | ||||||||||||
For the six months ended June 30, 2014, net interest expense increased compared to the same period in 2013, primarily due to lower capitalized interest.
TRANSALTA CORPORATION / Q2 2014 21
INCOME TAXES
A reconciliation of income taxes and effective tax rates on earnings, excluding non-comparable items, is presented below:
| 3 months ended June 30 | 6 months ended June 30 | |||||||||||||||
| 2014 | 2013 | 2014 | 2013 | |||||||||||||
| Earnings (loss) before income taxes | (32 | ) | 44 | 59 | 35 | |||||||||||
| Income attributable to non-controlling interests | (11 | ) | (9 | ) | (26 | ) | (19 | ) | ||||||||
| Equity loss | - | 3 | - | 7 | ||||||||||||
| Impacts associated with certain de-designated and ineffective hedges | 35 | 8 | 28 | 49 | ||||||||||||
| Restructuring provision | - | (2 | ) | - | (2 | ) | ||||||||||
| Gain on sale of assets | (1 | ) | (10 | ) | (1 | ) | (10 | ) | ||||||||
| Loss on assumption of pension obligations | - | - | - | 29 | ||||||||||||
| Insurance recovery | (1 | ) | - | (1 | ) | - | ||||||||||
| California claim | 5 | - | 5 | - | ||||||||||||
| Flood-related maintenance costs, net of insurance recovery | (2 | ) | 1 | 2 | 1 | |||||||||||
| Earnings (loss) attributable to TransAlta shareholders, excluding non-comparable items, subject to tax | (7 | ) | 35 | 66 | 90 | |||||||||||
| Income tax expense (recovery) | (3 | ) | 10 | 15 | (7 | ) | ||||||||||
| Income tax (expense) recovery related to impacts associated with certain de-designated and ineffective hedges | 12 | 3 | 10 | 17 | ||||||||||||
| Income tax (expense) recovery related to gain on sale of assets | 1 | (1 | ) | 1 | (1 | ) | ||||||||||
| Income tax recovery related to sale of investment | 36 | - | 36 | - | ||||||||||||
| Income tax (expense) related to write off of deferred income tax assets | (51 | ) | - | (51 | ) | - | ||||||||||
| Income tax recovery related to deferred tax rate adjustment | - | 1 | - | 7 | ||||||||||||
| Income tax recovery related to loss on assumption of pension obligations | - | - | - | 7 | ||||||||||||
| Income tax (expense) related to insurance recovery | - | - | - | - | ||||||||||||
| Income tax recovery related to California claim | 1 | - | 1 | - | ||||||||||||
| Income tax recovery related to flood-maintenance costs, net of insurance recovery | (1 | ) | - | - | - | |||||||||||
| Income tax expense (recovery) excluding non-comparable items | (5 | ) | 13 | 12 | 23 | |||||||||||
| Effective tax rate on earnings attributable to TransAlta shareholders excluding non-comparable items (%) | 71 | 37 | 18 | 26 | ||||||||||||
The income tax expense excluding non-comparable items for the three and six months ended June 30, 2014 decreased compared to the same periods in 2013, due to lower comparable earnings, changes in the amount of earnings between the jurisdictions in which pre-tax income is earned, and the effect of certain prior year amounts that do not fluctuate with earnings.
The effective tax rate on earnings attributable to TransAlta shareholders excluding non-comparable items for the three months ended June 30, 2014 increased compared to the same period in 2013, due to the effect of certain deductions that do not fluctuate with earnings, changes in the amount of earnings between the jurisdictions in which pre-tax income is earned, and the effect of certain prior year amounts that do not fluctuate with earnings.
22 TRANSALTA CORPORATION / Q2 2014
The effective tax rate on earnings attributable to TransAlta shareholders excluding non-comparable items for the six months ended June 30, 2014 decreased compared to the same period in 2013, due to the effect of certain deductions that do not fluctuate with earnings, changes in the amount of earnings between the jurisdictions in which pre-tax income is earned, and the effect of certain prior year amounts that do not fluctuate with earnings.
NON-CONTROLLING INTERESTS
Net earnings attributable to non-controlling interests for the three and six months ended June 30, 2014 increased $2 million and $7 million, respectively, compared to the same periods in 2013, primarily due to earnings at TransAlta Renewables, which was formed as a separate public entity in August 2013. As outlined in the Significant Events section of this MD&A, we completed a secondary offering of the common shares of TransAlta Renewables on April 29, 2014. As a result, the public share ownership of TransAlta Renewables increased from 19.4 per cent to 29.7 per cent.
ADDITIONAL IFRS MEASURES
An additional IFRS measure is a line item, heading, or subtotal that is relevant to an understanding of the financial statements but is not a minimum line item mandated under IFRS, or the presentation of a financial measure that is relevant to an understanding of the financial statements but is not presented elsewhere in the financial statements. We have included line items entitled gross margin and operating income (loss) in our Condensed Consolidated Statements of Earnings (Loss) for the three and six months ended June 30, 2014 and 2013. Presenting these line items provides management and investors with a measurement of ongoing operating performance that is readily comparable from period to period.
EARNINGS AND OTHER MEASURES ON A COMPARABLE BASIS
Presenting non-IFRS measures such as earnings on a comparable basis, comparable gross margin, comparable operating income, and comparable EBITDA from period to period provides management and investors with supplemental information to evaluate earnings trends in comparison with results from prior periods. In calculating these items, we exclude the impact related to certain hedges that are either de-designated or deemed ineffective for accounting purposes, as management believes that these transactions are not representative of our business operations and that these are still effective economic hedges. As these gains (losses) have already been recognized in earnings in current or prior periods, future reported earnings will be lower; however, the expected cash flows from these contracts will not change.
Other adjustments to earnings, such as those included in the earnings on a comparable basis calculation, have also been excluded as management believes these transactions are not representative of our business operations. Earnings on a comparable basis per share are calculated using the weighted average common shares outstanding during the period.
Presenting comparable EBITDA from period to period provides management and investors with a proxy for the amount of cash generated from operating activities before net interest expense, non-controlling interests, income taxes, and working capital adjustments.
Comparable operating income and EBITDA also include the earnings from the finance lease facilities that we operate. The finance lease income is used as a proxy for the operating income and EBITDA of these facilities.
TRANSALTA CORPORATION / Q2 2014 23
A reconciliation of comparable results to reported results for the three months ended June 30, 2014 and 2013 is as follows:
| 3 months ended June 30, 2014 | 3 months ended June 30, 2013 | |||||||||||||||||||||||||||||||||||
| Reported | Comparable reclassifications | Comparable adjustments | Comparable total | Reported | Comparable reclassifications | Comparable adjustments | Comparable total | |||||||||||||||||||||||||||||
| Revenues | 491 | 12 | (1) | 35 | (4) | 538 | 542 | 12 | (1) | 8 | (4) | 562 | ||||||||||||||||||||||||
| Fuel and purchased power | 212 | (13 | ) | (2) | - | 199 | 187 | (15 | ) | (2) | - | 172 | ||||||||||||||||||||||||
| Gross margin | 279 | 25 | 35 | 339 | 355 | 27 | 8 | 390 | ||||||||||||||||||||||||||||
| Operations, maintenance, and administration | 122 | - | 2 | (5) | 124 | 133 | - | (1 | ) | (5) | 132 | |||||||||||||||||||||||||
| Inventory writedown (reversal) | (4 | ) | - | - | (4 | ) | 2 | - | - | 2 | ||||||||||||||||||||||||||
| Taxes, other than income taxes | 7 | - | - | 7 | 8 | - | - | 8 | ||||||||||||||||||||||||||||
| Insurance recovery | - | (1 | ) | (3) | - | (1 | ) | - | - | - | - | |||||||||||||||||||||||||
| Gain on sale of assets | - | - | - | - | - | 1 | (9) | - | 1 | |||||||||||||||||||||||||||
| EBITDA | 154 | 26 | 33 | 213 | 212 | 26 | 9 | 247 | ||||||||||||||||||||||||||||
| Depreciation and amortization | 132 | 13 | (2) | - | 145 | 131 | 14 | (2)(9) | - | 145 | ||||||||||||||||||||||||||
| Restructuring provision | - | - | - | - | (2 | ) | - | 2 | - | |||||||||||||||||||||||||||
| Operating income | 22 | 13 | 33 | 68 | 83 | 12 | 7 | 102 | ||||||||||||||||||||||||||||
| Finance lease income | 12 | (12 | ) | (1) | - | - | 12 | (12 | ) | (1) | - | - | ||||||||||||||||||||||||
| Foreign exchange gain (loss) | (2 | ) | - | - | (2 | ) | 5 | - | - | 5 | ||||||||||||||||||||||||||
| Gain on sale of assets | 1 | - | (1 | ) | (6) | - | 10 | - | (10 | ) | (7) | - | ||||||||||||||||||||||||
| California claim | (5 | ) | - | 5 | (7) | - | - | - | - | - | ||||||||||||||||||||||||||
| Insurance recovery | 2 | (1 | ) | (3) | (1 | ) | (7) | - | - | - | - | - | ||||||||||||||||||||||||
| Equity loss | - | - | - | - | (3 | ) | - | - | (3 | ) | ||||||||||||||||||||||||||
| Earnings before interest and taxes | 30 | - | 36 | 66 | 107 | - | (3 | ) | 104 | |||||||||||||||||||||||||||
| Net interest expense | 62 | - | - | 62 | 63 | - | - | 63 | ||||||||||||||||||||||||||||
| Income tax expense (recovery) | (3 | ) | - | (2 | ) | (8) | (5 | ) | 10 | - | 3 | (10) | 13 | |||||||||||||||||||||||
| Net earnings (loss) | (29 | ) | - | 38 | 9 | 34 | - | (6 | ) | 28 | ||||||||||||||||||||||||||
| Non-controlling interests | 11 | - | - | 11 | 9 | - | - | 9 | ||||||||||||||||||||||||||||
Net earnings (loss) attributable to TransAlta shareholders | (40 | ) | - | 38 | (2 | ) | 25 | - | (6 | ) | 19 | |||||||||||||||||||||||||
| Preferred share dividends | 10 | - | - | 10 | 10 | - | - | 10 | ||||||||||||||||||||||||||||
Net earnings (loss) attributable to common shareholders | (50 | ) | - | 38 | (12 | ) | 15 | - | (6 | ) | 9 | |||||||||||||||||||||||||
| Weighted average number of common shares outstanding in the period | 272 | 272 | 262 | 262 | ||||||||||||||||||||||||||||||||
| Net earnings (loss) per share attributable to common shareholders | (0.18 | ) | (0.04 | ) | 0.06 | 0.03 | ||||||||||||||||||||||||||||||
___________________
| (1) Finance lease income used as a proxy for operating income. | (8) Gain on sale of property, plant, and equipment that is included in depreciation and amortization | |
| (2) Mine depreciation that is included in fuel and purchased power. | (9) Flood-related maintenance costs. | |
| (3) Comparable insurance proceeds | (10) Net tax effect of all non-comparable items. | |
| (4) Impacts associated with certain de-designated and ineffective hedges. | ||
| (5) Flood-related maintenance costs of $4 m, offset by insurance proceeds of $6m. | ||
| (6) Non-comparable item. | ||
| (6) Reclassification into operating income. | ||
| (7) Valuation allowance on deferred income tax assets and net tax effect of all non-comparable items. | ||
24 TRANSALTA CORPORATION / Q2 2014
A reconciliation of comparable results to reported results for the six months ended June 30, 2014 and 2013 is as follows:
| 6 months ended June 30, 2014 | 6 months ended June 30, 2013 | |||||||||||||||||||||||||||||||||||
| Reported | Comparable reclassifications | Comparable adjustments | Comparable total | Reported | Comparable reclassifications | Comparable adjustments | Comparable total | |||||||||||||||||||||||||||||
| Revenues | 1,266 | 25 | (1) | 28 | (4) | 1,319 | 1,082 | 24 | (1) | 49 | (4) | 1,155 | ||||||||||||||||||||||||
| Fuel and purchased power | 547 | (28 | ) | (2) | - | 519 | 388 | (26 | ) | (2) | - | 362 | ||||||||||||||||||||||||
| Gross margin | 719 | 53 | 28 | 800 | 694 | 50 | 49 | 793 | ||||||||||||||||||||||||||||
| Operations, maintenance, and administration | 266 | - | (2 | ) | (5) | 264 | 248 | - | (1 | ) | (5) | 247 | ||||||||||||||||||||||||
| Inventory writedown (reversal) | - | - | - | - | 16 | - | - | 16 | ||||||||||||||||||||||||||||
| Taxes, other than income taxes | 14 | - | - | 14 | 15 | - | - | 15 | ||||||||||||||||||||||||||||
| Insurance recovery | - | (1 | ) | (3) | - | (1 | ) | - | - | - | - | |||||||||||||||||||||||||
| EBITDA | 439 | 54 | 30 | 523 | 415 | 50 | 50 | 515 | ||||||||||||||||||||||||||||
| Depreciation and amortization | 267 | 28 | (2) | - | 295 | 258 | 26 | (2) | - | 284 | ||||||||||||||||||||||||||
| Restructuring provision | - | - | - | - | (2 | ) | - | 2 | (7) | - | ||||||||||||||||||||||||||
| Decrease in finance lease receivable | - | 1 | (1) | - | 1 | - | 1 | (1) | - | 1 | ||||||||||||||||||||||||||
| Operating income | 172 | 25 | 30 | 227 | 159 | 23 | 48 | 230 | ||||||||||||||||||||||||||||
| Finance lease income | 24 | (24 | ) | (1) | - | - | 23 | (23 | ) | (1) | - | - | ||||||||||||||||||||||||
| Foreign exchange gain (loss) | (7 | ) | - | - | (7 | ) | 4 | - | - | 4 | ||||||||||||||||||||||||||
| Gain on sale of assets | 1 | - | (1 | ) | (6) | - | 10 | - | (10 | ) | (7) | - | ||||||||||||||||||||||||
| California claim | (5 | ) | - | 5 | (7) | - | - | - | - | - | ||||||||||||||||||||||||||
| Insurance recovery | 2 | (1 | ) | (3) | (1 | ) | (7) | - | - | - | - | - | ||||||||||||||||||||||||
| Equity loss | - | - | - | - | (7 | ) | - | - | (7 | ) | ||||||||||||||||||||||||||
| Loss on assumption of pension obligations | - | - | - | - | (29 | ) | - | 29 | (7) | - | ||||||||||||||||||||||||||
| Earnings before interest and taxes | 187 | - | 33 | 220 | 160 | - | 67 | 227 | ||||||||||||||||||||||||||||
| Net interest expense | 128 | - | - | 128 | 125 | - | - | 125 | ||||||||||||||||||||||||||||
| Income tax expense (recovery) | 15 | (3 | ) | (8) | 12 | (7 | ) | - | 30 | (9) | 23 | |||||||||||||||||||||||||
| Net earnings (loss) | 44 | - | 36 | 80 | 42 | - | 37 | 79 | ||||||||||||||||||||||||||||
| Non-controlling interests | 26 | - | - | 26 | 19 | - | - | 19 | ||||||||||||||||||||||||||||
Net earnings (loss) attributable to TransAlta shareholders | 18 | - | 36 | 54 | 23 | - | 37 | 60 | ||||||||||||||||||||||||||||
| Preferred share dividends | 19 | - | - | 19 | 19 | - | - | 19 | ||||||||||||||||||||||||||||
Net earnings (loss) attributable to common shareholders | (1 | ) | - | 36 | 35 | 4 | - | 37 | 41 | |||||||||||||||||||||||||||
| Weighted average number of common shares outstanding in the period | 271 | 271 | 260 | 260 | ||||||||||||||||||||||||||||||||
| Net earnings (loss) per share attributable to common shareholders | - | 0.13 | 0.02 | 0.16 | ||||||||||||||||||||||||||||||||
_________________
| (1) Finance lease income used as a proxy for operating income. | (5) Flood-related maintenance costs, net of insurance recoveries. | (9) Gain on sale of property, plant and equipment that is included in depreciation. | ||
| (2) Mine depreciation that is included in fuel and purchased power. | (6) Gain on sale of CE Gen. | (10) Net tax effects of all non-comparable items. | ||
| (3) Comparable portion of insurance recovery. | (7) Non-comparable item. | |||
| (4) Impacts associated with certain de-designated and ineffective hedges. | (8) Valuation allowance on deferred income tax effect of all non-comparable items. |
TRANSALTA CORPORATION / Q2 2014 25
FINANCIAL POSITION
The following chart highlights significant changes in the Condensed Consolidated Statements of Financial Position from Dec. 31, 2013 to June 30, 2014:
| Increase/ | ||||
| (Decrease) | Primary factors explaining change | |||
| Cash and cash equivalents | 52 | Timing of receipts and payments | ||
| Accounts receivable | (145) | Timing of customer receipts and seasonality of revenues | ||
| Prepaid expenses | 37 | Prepayment of annual insurance premiums, royalties, and service agreements | ||
| Inventory | 41 | Increase in coal inventory due to economic dispatching at Centralia Thermal and lower writedowns | ||
| Investments | (192) | Sale of CE Gen | ||
| Property, plant, and equipment, net | (59) | Depreciation for the period, partially offset by additions and favourable changes in foreign exchange rates | ||
| Deferred income tax assets | (21) | Net deferred income tax expense | ||
Risk management assets (current and long-term)(1) | (44) | Price movements and changes in underlying positions and settlements | ||
| Accounts payable and accrued liabilities | (56) | Timing of payments and lower capital accruals | ||
| Collateral received | Reduction in collateral received from counterparties associated with changes in forward prices | |||
| Dividends payable | (30) | Reduction of quarterly dividend | ||
| Liabilities held for sale | ||||
| Long-term debt (including current portion) | (306) | Reduction of borrowings under credit facility and payout on maturity of medium term notes, partially offset by the issuance of senior notes | ||
| Decommissioning and other provisions (current and long-term) | 15 | Fluctuations in period end discount rates | ||
| Defined benefit obligation and other long-term liabilities | (13) | Payment related to California claim, partially offset by increase in defined benefit accrual | ||
| Deferred income tax liabilities | (23) | Net deferred income tax recovery | ||
Risk management liabilities (current and long-term)(1) | 20 | Price movements and changes in underlying positions and settlements | ||
| Equity attributable to shareholders | (34) | Net earnings for the period and gain on sale of subsidiary shares, partially offset by declared dividends | ||
| Non-controlling interests | 99 | Sale of additional non-controlling interest in TransAlta Renewables, partially offset by non-controlling interests' portion of net earnings net of distributions |
_____________________________
| (1) | After giving effect to the $160 million reduction in risk management assets and liabilities as at Dec. 31, 2013, as described in the Current Accounting Changes section of this MD&A. |
26 TRANSALTA CORPORATION / Q2 2014
FINANCIAL INSTRUMENTS
Refer to Note 19 of the notes to the audited consolidated financial statements within our 2013 Annual Report and Note 9 of our unaudited interim condensed consolidated financial statements as at and for the three and six months ended June 30, 2014 for details on Financial Instruments. Refer to the Risk Management section of our 2013 Annual Report and Note 10 of our interim condensed consolidated financial statements for further details on our risks and how we manage them. Our risk management profile and practices have not changed materially from Dec. 31, 2013.
Energy Trading may enter into commodity transactions involving non-standard features for which market observable data is not available. These are defined under IFRS as Level III financial instruments. Level III financial instruments are not traded in an active market and fair value is, therefore, developed using valuation models based upon internally developed assumptions or inputs. Our Level III fair values are determined using data such as unit availability, transmission congestion, or demand profiles. Fair values are validated on a quarterly basis by using reasonably possible alternative assumptions as inputs to valuation techniques, and any material differences are disclosed in the notes to the financial statements.
We also have various contracts with terms that extend beyond a liquid trading period. As forward market prices are not available for the full period of these contracts, the value of these contracts must be derived by reference to a forecast that is based on a combination of external and internal fundamental modeling, including discounting. As a result, these contracts are classified in Level III. These contracts are for specified prices with counterparties that we believe to be creditworthy.
At June 30, 2014, total Level III financial instruments had a net asset carrying value of $62 million (Dec. 31, 2013 - $66 million net asset).
Following the divestiture of CE Gen and Blackrock and the repatriation of proceeds into Canadian funds, we de-designated approximately U.S.$180 million of debt from hedging U.S. net investments. Prospectively, this tranche of U.S.-denominated debt is being hedged with foreign currency derivative instruments in a cash flow hedge relationship.
During the second quarter, we also de-designated the cash flow hedge of the foreign-exchange exposure on a U.S.$20 million debt. No significant reclassifications from AOCI arise as a result of this discontinuation of hedge accounting.
TRANSALTA CORPORATION / Q2 2014 27
STATEMENTS OF CASH FLOWS
The following chart highlights significant changes in the Condensed Consolidated Statements of Cash Flows for the three and six months ended June 30, 2014 compared to the same periods in 2013:
| 3 months ended June 30 | 2014 | 2013 | Primary factors explaining change | |||
| Cash and cash equivalents, beginning of period | 37 | 50 | ||||
| Provided by (used in): | ||||||
| Operating activities | 51 | 92 | Decrease in cash earnings of $66 million, partially offset by an increase in the change in working capital of $25 million | |||
| Investing activities | 126 | (160) | Increase in proceeds on sale of investments of $218 million, a decrease in additions to PP&E of $48 million, and a decrease in investing non-cash working capital balances of $28 million, partially offset by a decrease in realized gains on financial instruments of $11 million | |||
| Financing activities | (120) | 86 | An increase in repayments of borrowings under credit facilities and in repayments (net of issuances) of long-term debt of $345 million, partially offset by an increase in net proceeds on sale of additional non-controlling interest in a subsidiary of $129 million and a decrease in common share cash dividends of $12 million | |||
| Translation of foreign currency cash | - | (1) | ||||
| Cash and cash equivalents, end of period | 94 | 67 |
| 6 months ended June 30 | 2014 | 2013 | Primary factors explaining change | |||
| Cash and cash equivalents, beginning of period | 42 | 27 | ||||
| Provided by (used in): | ||||||
| Operating activities | 330 | 348 | Decrease in cash earnings of $8 million and a decrease in the change in working capital of $10 million | |||
| Investing activities | 21 | (310) | Increase in proceeds on sale of investments of $218 million, a decrease in additions to PP&E of $102 million, and a decrease in investing non-cash working capital balances of $38 million, partially offset by a decrease in realized gains on financial instruments of $25 million | |||
| Financing activities | (300) | 2 | An increase in repayments of borrowings under credit facilities and in repayments (net of issuances) of long-term debt of $428 million, an increase in common share cash dividends of $18 million, and a decrease in distributions paid to subsidiaries' non-controlling interests of $9 million, partially offset by an increase in net proceeds on sale of additional non-controlling interest in a subsidiary of $129 million and an increase in realized gains on financial instruments of $23 million | |||
| Translation of foreign currency cash | 1 | - | ||||
| Cash and cash equivalents, end of period | 94 | 67 |
28 TRANSALTA CORPORATION / Q2 2014
LIQUIDITY AND CAPITAL RESOURCES
Liquidity risk arises from our ability to meet general funding needs, engage in trading and hedging activities, and manage the assets, liabilities, and capital structure of the Corporation. Liquidity risk is managed by maintaining sufficient liquid financial resources to fund obligations as they come due in the most cost-effective manner.
Our liquidity needs are met through a variety of sources, including cash generated from operations, availability under our long-term credit facilities, and long-term debt or equity issued under our Canadian and U.S. shelf registrations. Our primary uses of funds are operational expenses, capital expenditures, dividends, distributions to non-controlling interest partners, and interest and principal payments on debt securities.
Debt
Long-term debt totalled $4.0 billion as at June 30, 2014 compared to $4.3 billion as at Dec. 31, 2013. Long-term debt decreased from Dec. 31, 2013 primarily due to the use of proceeds from the sale of CE Gen and the secondary offering of TransAlta Renewables common shares to pay down our credit facility borrowings and repay, in May, the scheduled maturity of a debenture, partially offset by the senior note offering also undertaken in May.
Credit Facilities
At June 30, 2014, we had a total of $2.1 billion (Dec. 31, 2013 - $2.1 billion) of committed credit facilities, of which $1.4 billion (Dec. 31, 2013 - $0.9 billion) was not drawn and is available, subject to customary borrowing conditions. At June 30, 2014, the $0.7 billion (Dec. 31, 2013 - $1.2 billion) of credit utilized under these facilities was comprised of actual drawings of $0.3 billion (Dec. 31, 2013 - $0.8 billion) and letters of credit of $0.4 billion (Dec. 31, 2013 - $0.4 billion). In addition to the $1.4 billion available under the credit facilities, we have $94 million of available cash.
Share Capital
On July 29, 2014, we had 273.4 million common shares outstanding, 12.0 million Series A, 11.0 million Series C, and 9.0 million Series E first preferred shares outstanding. At June 30, 2014, we had 271.8 million (June 30, 2013 – 262.1 million) common shares issued and outstanding. At June 30, 2014, we had 32.0 million (June 30, 2013 - 32.0 million) first preferred shares issued and outstanding.
On July 22, 2014, we declared a quarterly dividend of $0.18 per share on common shares payable on Oct. 1, 2014.
On July 22, 2014, we declared a quarterly dividend of $0.2875 per share on the Series A and Series C preferred shares, and $0.3125 per share on the Series E preferred shares, all payable Sept. 30, 2014.
We issue common shares for the reinvestment of dividends, for cash proceeds, or upon exercise of stock options and other share-based payment plans.
During the three and six months ended June 30, 2014, 1.5 million and 3.6 million, respectively (June 30, 2013 – 3.7 million and 7.4 million, respectively) common shares were issued under the Dividend Reinvestment and Optional Common Share Purchase Plan (the “Plan”) for $18 million and $46 million, respectively (June 30, 2013 - $53 million and $106 million, respectively).
TRANSALTA CORPORATION / Q2 2014 29
Letters of Credit and Cash Collateral
We have obligations to issue letters of credit and cash collateral to secure potential liabilities to certain parties, including those related to potential environmental obligations, energy trading activities, hedging activities, and purchase obligations. At June 30, 2014, we provided letters of credit totalling $369 million (Dec. 31, 2013 - $370 million) and cash collateral of $17 million (Dec. 31, 2013 - $20 million). These letters of credit and cash collateral secure certain amounts included on our Condensed Consolidated Statements of Financial Position under risk management liabilities and decommissioning and other provisions.
CLIMATE CHANGE AND THE ENVIRONMENT
In Alberta there are requirements for coal-fired generation units to implement additional air emission controls for oxides of nitrogen (“NOx”) and sulphur dioxide (“SO2”) once they reach the end of their respective PPAs, in most cases at 2020. These regulatory requirements were developed by the province in 2004 as a result of multi-stakeholder discussions under Alberta’s Clean Air Strategic Alliance (“CASA”). However, the release of the federal Greenhouse Gas (“GHG”) regulations creates a potential misalignment between the CASA air pollutant requirements and schedules, and the GHG retirement schedules for older coal plants, which in themselves will result in significant reductions of NOx, SO2, and particulates. We are in discussions with the provincial government in an effort to ensure coordination between GHG and air pollutant regulations, such that emission reduction objectives are achieved in the most effective manner while taking into consideration the reliability and cost of Alberta’s generation supply.
On June 2, 2014, the U.S. EPA released draft regulations for managing greenhouse gas emissions from the power sector. These draft regulations target GHG emissions from all existing fossil-fired generation in the U.S.: coal, natural gas, and other hydrocarbon fuels. The draft regulations are designed to achieve a 30 per cent reduction from 2005 emission levels by 2030, for that sector. The proposed framework would establish 2030 emission rate goals, measured in pounds of CO2/MWh, for each State’s electricity sector.
The draft regulations require interim goals to be achieved between 2020 and 2030 and a final goal to be achieved by 2030, and maintained beyond. The goals are State-specific depending on circumstances. States are to be given broad freedom to achieve the goals in a variety of ways, ranging from single- or multi-state cap and trade programs, heat rate improvements, fuel switching initiatives, to more prescriptive approaches, such as, renewable energy and conservation programs. States will develop their individual approaches or State Implementation Plans, which will subsequently have to be reviewed and approved by the EPA. The draft regulations are expected to be finalized by the EPA by June, 2015, with State Implementation Plans submitted by June, 2016.
2014 OUTLOOK
Business Environment
Power Prices
Over the balance of 2014, power prices in Alberta are expected to be lower than 2013 as a result of more baseload generation and fewer planned maintenance outages across the market. However, prices can vary based on supply and weather conditions. In the Pacific Northwest, we expect prices to settle higher than in 2013 due to marginally higher natural gas prices. In Ontario, prices for the balance of the year are expected to be higher than 2013 due to higher natural gas prices and coal unit retirements.
30 TRANSALTA CORPORATION / Q2 2014
Environmental Legislation
The finalization of the federal Canadian GHG regulations for coal-fired power has initiated further activities. We are in discussions with the Alberta government in an effort to ensure coordination between GHG and air pollutant regulations, such that emission reduction objectives are achieved in the most effective manner while taking into consideration the reliability and cost of Alberta’s generation supply. This may provide additional flexibility to coal-fired generators in meeting such regulatory requirements. For further information on the Canadian GHG regulations, please refer to the Significant Events section of our 2013 Annual MD&A.
On Jan. 21, 2013, the Ontario government released a discussion paper for public input on reducing GHG emissions in the province, with the stated intent of developing GHG regulations for all major industrial sectors by 2015. No specific targets or regulatory approaches have yet been proposed.
The recently proposed EPA greenhouse gas regulations for existing power plants are not expected to significantly affect our US operations. Regarding our Centralia coal-fired plant, TransAlta has agreed with Washington State to retire units in 2020 and 2025. This agreement is formally part of the State’s climate change program. We believe that there will be no additional greenhouse gas regulatory burden on Centralia given these commitments.
Effective January 2013, direct deliveries of power to the California Independent System Operator were subject to Cap and Trade Regulations established by the California Air Resource Board. We continue to monitor our GHG inventory into California.
In Australia, the carbon tax implemented in July 2012 remains in place. However, on Nov. 13, 2013, the then elected Liberal government introduced legislation to repeal the carbon tax by July 2014, and replace it with a Direct Action plan that would fund industry for actions to reduce emissions. The legislation has not yet been passed. While our gas-fired operations are subject to the tax, all related costs are passed on to contracted customers. On July 17, 2014, the Australian Government repealed the nation’s carbon tax. This will eliminate the previous emission charges on our Australian gas-fired generation, although the impact is expected to be minimal as these emission charges were generally passed through to contracted customers.
We continue to closely monitor the progress and risks associated with environmental legislation changes on our future operations.
Economic Environment
In 2014, we expect slow to moderate growth in all markets. We continue to monitor global events and their potential impact on the economy and our supplier and commodity counterparty relationships.
We had no material counterparty losses in the second quarter of 2014. We continue to monitor counterparty credit risk and have established risk management policies to mitigate counterparty risk. We do not anticipate any material change to our existing credit practices and continue to deal primarily with investment grade counterparties.
Operations
Capacity, Production, and Availability
Generating capacity is expected to increase primarily due to the commencement of operations at our Solomon power station in Australia. Prior to the effect of any economic dispatching, overall production is expected to increase in 2014 compared to 2013 due to Sundance Units 1 and 2 returning to service, lower planned and unplanned outages, and the acquisition of Wyoming Wind. Overall availability is expected to be in the range of 88 to 90 per cent in 2014.
TRANSALTA CORPORATION / Q2 2014 31
Contracted Cash Flows
As a result of Alberta PPAs, long-term contracts, and other short-term physical and financial contracts, on average, approximately 75 per cent of our capacity is contracted over the next seven years. On an aggregated portfolio basis, depending on market conditions, we target being up to 90 per cent contracted for the upcoming calendar year. As at the end of the second quarter of 2014, approximately 90 per cent of our 2014 capacity was contracted. The average prices of our short-term physical and financial contracts for 2014 are approximately $55 per MWh in Alberta and approximately U.S.$40 per MWh in the Pacific Northwest.
Fuel Costs
Mining coal in Alberta is subject to cost increases due to greater overburden removal, inflation, capital investments, and commodity prices. Seasonal variations in coal costs at our Alberta mine are minimized through the application of standard costing. Coal costs for 2014, on a standard cost per tonne basis, are expected to be seven to nine per cent lower than 2013 due to Sundance Units 1 and 2 operating for a full year and the benefits realized from insourcing operational accountability from Prairie Mines and Royalty Ltd. at the Highvale Mine during 2013.
Although we own the Centralia mine in the State of Washington, it is not currently operational. Fuel at Centralia Thermal is purchased from external suppliers in the Powder River Basin and delivered by rail. The delivered cost of fuel per MWh for 2014 is expected to increase by approximately one to three per cent.
The value of coal inventories is assessed for impairment at the end of each reporting period. If the inventory is impaired, further charges are recognized in net earnings.
We purchase natural gas from outside companies coincident with production or have it supplied by our customers, thereby minimizing our risk to changes in prices. The continued success of unconventional gas production in North America could reduce the year-to-year volatility of prices in the near term.
We closely monitor the risks associated with changes in electricity and input fuel prices on our future operations and, where we consider it appropriate use various physical and financial instruments to hedge our assets and operations from such price risks.
Energy Trading
Earnings from our Energy Trading Segment are affected by prices in the market, overall strategies adopted, and changes in legislation. We continuously monitor both the market and our exposure in order to maximize earnings while still maintaining an acceptable risk profile. Our 2014 objective for Energy Trading was to contribute between $50 million to $65 million in gross margin. Following strong performance in the first quarter we now expect Energy Trading to contribute between $80 million and $100 million in gross margin for the year as markets return to more normal volatility for the remainder of the year.
Exposure to Fluctuations in Foreign Currencies
Our strategy is to minimize the impact of fluctuations in the Canadian dollar against the U.S. dollar, euro, and Australian dollar by offsetting foreign-denominated assets with foreign-denominated liabilities and by entering into foreign exchange contracts. We also have foreign-denominated expenses, including interest charges, which largely offset our foreign-denominated revenues.
32 TRANSALTA CORPORATION / Q2 2014
Net Interest Expense
Net interest expense for 2014 is expected to be lower than in 2013 due to reduced debt levels resulting from the use of proceeds from the sale of CE Gen and the secondary offering of TransAlta Renewables’ common shares to pay down our credit facility borrowings. However, changes in interest rates and in the value of the Canadian dollar relative to the U.S. dollar can affect the amount of net interest expense incurred.
Liquidity and Capital Resources
If there is increased volatility in power and natural gas markets, or if market trading activities increase, we may need additional liquidity in the future. We expect to maintain adequate available liquidity under our committed credit facilities.
Accounting Estimates
A number of our accounting estimates, including those outlined in the Critical Accounting Policies and Estimates section of our 2013 Annual MD&A, are based on the current economic environment and outlook. Under the current economic environment, market fluctuations could impact, among other things, future commodity prices, foreign exchange rates, and interest rates, which could, in turn, impact future earnings, and the unrealized gains or losses associated with our risk management assets and liabilities, and asset valuation for our asset impairment calculations.
Income Taxes
The effective tax rate on earnings, excluding non-comparable items for 2014, is expected to be approximately 17 to 22 per cent, which is lower than the statutory tax rate of 25 per cent, due to changes in the amount of earnings between the jurisdictions in which pre-tax income is earned and the effect of certain deductions that do not fluctuate with earnings.
TRANSALTA CORPORATION / Q2 2014 33
Capital Expenditures
Our major projects are focused on sustaining our current operations and supporting our growth strategy.
Growth and Major Project Expenditures
A summary of the significant growth and major projects that are in progress is outlined below:
| Total Project | 2014 | Target | |||||||||||||||||||
Estimated spend | Spent to date(1) | Estimated spend | Spent to date(1) | completion date | Details | ||||||||||||||||
| Project | |||||||||||||||||||||
Australia natural gas pipeline(2) | 86 | 10 | 86 | 10 | Q1 2015 | 270 kilometer pipeline to supply natural gas to our Solomon power station in Western Australia | |||||||||||||||
| Transmission | 10 | - | 10 | - | Q4 2014 | Regulated transmission that receives a return on investment | |||||||||||||||
| Hydro life extension | 15 - 20 | 4 | 15 - 20 | 4 | Q4 2014 | Generator replacement and turbine runner improvements to extend the life of selected plants | |||||||||||||||
| Total | 111 - 116 | 14 | 111 - 116 | 14 | |||||||||||||||||
Sustaining and Productivity Expenditures(1)
For 2014, our estimate for total sustaining and productivity expenditures, net of any contributions received, is allocated among the following:
| Category | Description | Expected cost | Spent to date(1) | |||||||
| Routine capital | Expenditures to maintain our existing generating capacity | 110 - 115 | 58 | |||||||
| Mining equipment and land purchases | Expenditures related to mining equipment and land purchases | 45 - 50 | 8 | |||||||
| Finance leases | Payments related to mining equipment under finance leases | 5 - 10 | 4 | |||||||
| Planned major maintenance | Regularly scheduled major maintenance | 175 - 190 | 101 | |||||||
| Total sustaining expenditures | 335 - 365 | 171 | ||||||||
| Productivity capital | Projects to improve power production efficiency and corporate improvement initiatives | 10 - 15 | 5 | |||||||
| Total sustaining and productivity expenditures | 345 - 380 | 176 | ||||||||
Our planned major maintenance program relates to regularly scheduled major maintenance activities and includes costs related to inspection, repair and maintenance, and replacement of existing components. It excludes amounts for day-to-day routine maintenance, unplanned maintenance activities, and minor inspections and overhauls, which are expensed as incurred.
___________________
| (1) | Represents amounts spent as of June 30, 2014. |
| (2) | Includes certain natural gas conversion costs at the Solomon power station that will be recognized as a finance lease receivable. |
34 TRANSALTA CORPORATION / Q2 2014
Details of the 2014 planned major maintenance program are outlined as follows:
| Coal | Gas and Renewables | Expected spend in 2014 | Spent to date(1) | |||||||||||||
| Capitalized | 120 - 130 | 55 - 60 | 175 - 190 | 101 | ||||||||||||
| Expensed | - | 0 - 5 | 0 - 5 | - | ||||||||||||
| 120 - 130 | 55 - 65 | 175 - 195 | 101 | |||||||||||||
| Coal | Gas and Renewables | Total | Lost to date(1) | |||||||||||||
| GWh lost | 2,050 - 2,060 | 400 - 410 | 2,450 - 2,470 | 2,053 | ||||||||||||
Our estimate of the overall GWh of lost production due to our planned major maintenance program has decreased compared to that as reported in our 2013 annual MD&A as a result of the deferral of one outage from 2014 to 2015.
Financing
Financing for these capital expenditures is expected to be provided by cash flow from operating activities, existing borrowing capacity, dividends reinvested under the Plan, and capital markets. The funds required for committed growth, sustaining capital, and productivity projects are not expected to be significantly impacted by the current economic environment due to the highly contracted nature of our cash flows, our financial position, and the amount of capital available to us under existing committed credit facilities.
CURRENT ACCOUNTING CHANGES
Inception Gains and Losses
We restated the Condensed Consolidated Statement of Financial Position as at Dec. 31, 2013 to reclassify the inception gains or losses arising from differences between the fair value of a financial instrument at initial recognition (the transaction price) and the amount calculated through a valuation model. These amounts were previously reported as gross contra-risk management assets or liabilities. The adjustment reclassifies them as direct offsets to the value of the derivative contract to which they relate. As a result of the adjustment, long-term risk management assets and long-term risk management liabilities were reduced by $160 million at Dec. 31, 2013. Corresponding adjustments to the Dec. 31, 2012 Condensed Consolidated Statement of Financial Position were immaterial. Refer to Note 9(C) in our interim condensed consolidated financial statements as at and for the three and six months ended June 30, 2014 for further information on inception gains and losses.
IAS 32 Financial Instruments: Presentation
On Jan. 1, 2014, we adopted the amendments to IAS 32 Financial Instruments: Presentation. There was no impact of adopting the IAS 32 amendments on the condensed consolidated financial statements.
TRANSALTA CORPORATION / Q2 2014 35
IAS 36 Impairment of Assets
On Jan. 1, 2014, we adopted the amendments to the disclosure requirements of IAS 36 Impairment of Assets. The amended disclosure requirements did not have an impact on the condensed consolidated financial statements.
Comparative Figures
Certain comparative figures have been reclassified to conform to current period’s presentation. These reclassifications did not impact previously reported net earnings.
FUTURE ACCOUNTING CHANGES
Accounting standards that have been previously issued by the International Accounting Standards Board (“IASB”) but are not yet effective, and have not been applied by the Corporation include:
I. IFRS 9 Financial Instruments
In February 2014, the IASB indicated that IFRS 9 will be effective for annual periods beginning on or after Jan. 1, 2018. Please refer to the Future Accounting Changes section of our 2013 Annual MD&A for more information regarding IFRS 9. The Corporation continues to assess the impact of adopting this standard.
II. IFRS 15 Revenue from Contracts with Customers
In May 2014, the IASB issued IFRS 15 Revenue from Contracts with Customers which replaces existing revenue recognition guidance with a single comprehensive accounting model. The model specifies that an entity recognizes revenue when it transfers promised goods or services to customers in an amount that reflects the consideration to which it expects to be entitled in exchange for those goods or services. IFRS 15 is effective for annual reporting periods beginning on or after Jan. 1, 2017 with early application permitted. We are assessing the impact that adopting this standard will have on our consolidated financial statements.
36 TRANSALTA CORPORATION / Q2 2014
SELECTED QUARTERLY INFORMATION
| Q3 2013 | Q4 2013 | Q1 2014 | Q2 2014 | |||||||||||||
| Revenue | 623 | 587 | 775 | 491 | ||||||||||||
| Net earnings (loss) attributable to common shareholders | (9 | ) | (66 | ) | 49 | (50 | ) | |||||||||
| Net earnings (loss) per share attributable to common shareholders, basic and diluted | (0.03 | ) | (0.25 | ) | 0.18 | (0.18 | ) | |||||||||
| Comparable net earnings per share | 0.15 | 0.00 | 0.17 | (0.04 | ) | |||||||||||
| Q3 2012 | Q4 2012 | Q1 2013 | Q2 2013 | |||||||||||||
| Revenue | 522 | 646 | 540 | 542 | ||||||||||||
| Net earnings (loss) attributable to common shareholders | 56 | 39 | (11 | ) | 15 | |||||||||||
| Net earnings (loss) per share attributable to common shareholders, basic and diluted | 0.24 | 0.15 | (0.04 | ) | 0.06 | |||||||||||
| Comparable net earnings (loss) per share | 0.18 | 0.22 | 0.12 | 0.03 |
Basic and diluted earnings per share attributable to common shareholders and comparable earnings per share are calculated each period using the weighted average common shares outstanding during the period. As a result, the sum of the earnings per share for the four quarters making up the calendar year may sometimes differ from the annual earnings per share.
DISCLOSURE CONTROLS AND PROCEDURES
Management has evaluated, with the participation of our Chief Executive Officer and Chief Financial Officer, the effectiveness of our disclosure controls and procedures as of the end of the period covered by this report. Disclosure controls and procedures refer to controls and other procedures designed to ensure that information required to be disclosed in the reports we file or submit under the Securities Exchange Act of 1934, as amended (“Exchange Act”) are recorded, processed, summarized, and reported within the time periods specified in the rules and forms of the Securities and Exchange Commission. Disclosure controls and procedures include, without limitation, controls and procedures designed to ensure that information required to be disclosed by us in our reports that we file or submit under the Exchange Act is accumulated and communicated to management, including our Chief Executive Officer and Chief Financial Officer, as appropriate to allow timely decisions regarding our required disclosure. In designing and evaluating our disclosure controls and procedures, management recognizes that any controls and procedures, no matter how well designed and operated, can provide only reasonable assurance of achieving the desired control objectives, and management is required to apply its judgment in evaluating and implementing possible controls and procedures.
There has been no change in the internal control over financial reporting during the period covered by this report that has materially affected, or is reasonably likely to materially affect, our internal control over financial reporting. Based on the foregoing evaluation, our Chief Executive Officer and Chief Financial Officer have concluded that, as of June 30, 2014, the end of the period covered by this report, our disclosure controls and procedures were effective at a reasonable assurance level.
TRANSALTA CORPORATION / Q2 2014 37
FORWARD-LOOKING STATEMENTS
This MD&A, the documents incorporated herein by reference, and other reports and filings made with the securities regulatory authorities include forward-looking statements or information (collectively referred to herein as “forward-looking statements”) within the meaning of applicable securities legislation. All forward-looking statements are based on our beliefs as well as assumptions based on information available at the time the assumptions were made and on management’s experience and perception of historical trends, current conditions, and expected future developments, as well as other factors deemed appropriate in the circumstances. Forward-looking statements are not facts, but only predictions and generally can be identified by the use of statements that include phrases such as “may”, “will”, “believe”, “expect”, “anticipate”, “intend”, “plan”, “project”, “foresee”, “potential”, “enable”, “continue”, or other comparable terminology. These statements are not guarantees of our future performance and are subject to risks, uncertainties, and other important factors that could cause our actual performance to be materially different from that projected.
In particular, this MD&A contains forward-looking statements pertaining to our business and anticipated future financial performance, our success in executing on our growth projects, the timing and the completion and commissioning of projects under development, including major projects such as the South Hedland Power Project, and their attendant costs; expectations regarding the AESO’s plans for resolving regional constraints on Alberta’s transmission system; spending on growth and sustaining capital and productivity projects; expectations in terms of the cost of operations, capital spend, and maintenance, and the variability of those costs; the impact of certain hedges on future reported earnings and cash flows; expectations related to future earnings and cash flow from operating and contracting activities; estimates of fuel supply and demand conditions and the costs of procuring fuel; expectations for demand for electricity in both the short term and long term, and the resulting impact on electricity prices; the impact of load growth, increased capacity, and natural gas costs on power prices; expectations in respect of generation availability, capacity, and production; expectations regarding the role different energy sources will play in meeting future energy needs; expected financing of our capital expenditures; expected governmental regulatory regimes and legislation and their expected impact on us and the timing of the implementation of such regimes and regulations, as well as the cost of complying with resulting regulations and laws; our expectations regarding the proceedings before the AUC; our trading strategies and the risk involved in these strategies; estimates of future tax rates, future tax expense, and the adequacy of tax provisions; accounting estimates; anticipated growth rates in our markets; expectations for the outcome of existing or potential legal and contractual claims, regulatory investigations, and disputes; expectations regarding the renewals of collective bargaining agreements; expectations for the ability to access capital markets at reasonable terms; the estimated impact of changes in interest rates and the value of the Canadian dollar relative to the U.S. dollar and other currencies in locations where we do business; the monitoring of our exposure to liquidity risk; expectations in respect of the global economic environment and growing scrutiny by investors relating to sustainability performance; our credit practices; the estimated contribution of Energy Trading activities to gross margin; and expectations relating to the performance of TransAlta Renewables’ assets.
38 TRANSALTA CORPORATION / Q2 2014
Factors that may adversely impact our forward-looking statements include risks relating to: fluctuations in market prices and the availability of fuel supplies required to generate electricity; our ability to contract our generation for prices that will provide expected returns; the regulatory and political environments in the jurisdictions in which we operate; environmental requirements and changes in, or liabilities under, these requirements; changes in general economic conditions including interest rates; operational risks involving our facilities, including unplanned outages at such facilities; disruptions in the transmission and distribution of electricity; the effects of weather; disruptions in the source of fuels, water, or wind required to operate our facilities; natural disasters; the threat of domestic terrorism and cyber-attacks; equipment failure and our ability to carry out the repairs in a cost-effective manner or timely manner; energy trading risks; industry risk and competition; fluctuations in the value of foreign currencies and foreign political risks; the need for additional financing; structural subordination of securities; counterparty credit risk; insurance coverage; our provision for income taxes; legal, regulatory, and contractual proceedings involving the Corporation; outcomes of investigations and disputes; reliance on key personnel; labour relations matters; development projects and acquisitions including delays in the construction of the South Hedland Power Project; the satisfactory receipt of applicable regulatory approvals for existing and proposed operations and growth initiatives; and the satisfactory closing of Wailuku.
The foregoing risk factors, among others, are described in further detail in the Risk Management section of our 2013 Annual MD&A and under the heading “Risk Factors” in our 2014 Annual Information Form.
Readers are urged to consider these factors carefully in evaluating the forward-looking statements and are cautioned not to place undue reliance on these forward-looking statements. The forward-looking statements included in this document are made only as of the date hereof and we do not undertake to publicly update these forward-looking statements to reflect new information, future events or otherwise, except as required by applicable laws. In light of these risks, uncertainties, and assumptions, the forward-looking events might occur to a different extent or at a different time than we have described, or might not occur. We cannot assure that projected results or events will be achieved.
TRANSALTA CORPORATION / Q2 2014 39
SUPPLEMENTAL INFORMATION
| June 30, 2014 | Dec. 31, 2013 | |||||||||
| Closing market price (TSX) ($) | 13.08 | 13.48 | ||||||||
| Price range for the last 12 months (TSX) ($) | High | 15.08 | 16.86 | |||||||
| Low | 12.60 | 12.91 | ||||||||
| Debt to invested capital (%) | 52.9 | 55.6 | ||||||||
Debt to invested capital excluding non-recourse debt(1) (%) | 50.4 | 53.3 | ||||||||
| Debt to invested capital including finance lease obligation and non-recourse debt (%) | 53.1 | 55.7 | ||||||||
Debt to comparable EBITDA(2) (times) | 3.8 | 4.2 | ||||||||
Return on equity attributable to common shareholders(2) (%) | (3.4 | ) | (3.1 | ) | ||||||
Comparable return on equity attributable to common shareholders(1), (2) (%) | 3.3 | 3.6 | ||||||||
Return on capital employed(2) (%) | 3.1 | 2.8 | ||||||||
Comparable return on capital employed(1), (2) (%) | 5.0 | 5.2 | ||||||||
Cash dividends per share(2) ($) | 1.05 | 1.16 | ||||||||
Price to comparable earnings ratio(1), (2) (times) | 46.7 | 43.5 | ||||||||
Earnings coverage(2) (times) | 1.0 | 0.9 | ||||||||
Dividend payout ratio based on net earnings(2) (%) | (331.6 | ) | (431.0 | ) | ||||||
Dividend payout ratio based on comparable earnings(1), (2) (%) | 336.0 | 377.8 | ||||||||
Dividend payout ratio based on funds from operations(1), (2), (3) (%) | 33.9 | 42.0 | ||||||||
Dividend yield(2) (%) | 8.0 | 8.6 | ||||||||
Adjusted cash flow to debt(2), (3) (%) | 17.7 | 16.9 | ||||||||
Adjusted cash flow to interest coverage(2), (3) (times) | 4.1 | 4.0 | ||||||||
____________________
| (1) | These ratios incorporate items that are not defined under IFRS. None of these measurements should be used in isolation or as a substitute for the Corporation’s reported financial performance or position as presented in accordance with IFRS. These ratios are useful complementary measurements for assessing the Corporation’s financial performance, efficiency, and liquidity and are common in the reports of other companies but may differ by definition and application. For a reconciliation of the Non-IFRS measures used in this calculation, refer to the Non-IFRS Measures section of this MD&A. |
| (2) | Last 12 months. |
| (3) | The December 2013 ratios have been adjusted for the impact of the California claim. |
RATIO FORMULAS
Debt to invested capital = long-term debt including current portion - cash and cash equivalents / long-term debt including current portion + non-controlling interests + equity attributable to shareholders - cash and cash equivalents
Debt to comparable EBITDA = long-term debt including current portion - cash and cash equivalents / comparable EBITDA
Return on equity attributable to common shareholders = net earnings attributable to common shareholders or earnings on a comparable basis / average equity attributable to common shareholders excluding AOCI
Return on capital employed = earnings before non-controlling interests and income taxes + net interest expense or comparable earnings before non-controlling interests and income taxes + net interest expense / average invested capital excluding AOCI
Price to comparable earnings ratio = current period’s closing market price / comparable earnings per share
Earnings coverage = net earnings attributable to shareholders + income taxes + net interest expense / interest on debt - interest income
Dividend payout ratio = common share dividends / net earnings attributable to common shareholders or earnings on a comparable basis or funds from operations
40 TRANSALTA CORPORATION / Q2 2014
Dividend yield = dividend per common share / current period’s closing market price
Adjusted cash flow to debt = cash flow from operating activities before changes in working capital / average total debt - average cash and cash equivalents
Adjusted cash flow to interest coverage = cash flow from operating activities before changes in working capital + interest on debt - interest income - capitalized interest / interest on debt - interest income
GLOSSARY OF KEY TERMS
Availability - A measure of the time, expressed as a percentage of continuous operation 24 hours a day, 365 days a year that a generating unit is capable of generating electricity, regardless of whether or not it is actually generating electricity.
British Thermal Units (Btu) - A measure of energy. The amount of energy required to raise the temperature of one pound of water one degree Fahrenheit, when the water is near 39.2 degrees Fahrenheit.
Capacity - The rated continuous load-carrying ability, expressed in megawatts, of generation equipment.
Force Majeure - Literally means “major force”. These clauses excuse a party from liability if some unforeseen event beyond the control of that party prevents it from performing its obligations under the contract.
Geothermal Power – Power derived from a steam turbine. The turbine is driven either by steam produced from hot water or by natural steam that derives its energy from heat found in rocks or fluids at various depths beneath the surface of the earth. The energy is extracted by drilling and/or pumping.
Gigawatt - A measure of electric power equal to 1,000 megawatts.
Gigawatt Hour (GWh) - A measure of electricity consumption equivalent to the use of 1,000 megawatts of power over a period of one hour.
Greenhouse Gas (GHG) - Gases having potential to retain heat in the atmosphere, including water vapour, carbon dioxide, methane, nitrous oxide, hydrofluorocarbons, and perfluorocarbons.
Heat Rate - A measure of conversion, expressed as Btu/MWh, of the amount of thermal energy required to generate electrical energy.
Megawatt (MW) - A measure of electric power equal to 1,000,000 watts.
Megawatt Hour (MWh) - A measure of electricity consumption equivalent to the use of 1,000,000 watts of power over a period of one hour.
Power Purchase Arrangement (PPA) - A long-term arrangement established by regulation for the sale of electric energy from formerly regulated generating units to buyers.
Renewable Power - Power generated from renewable terrestrial mechanisms including wind, geothermal, and solar with regeneration.
Spark Spread - A measure of gross margin per MW (sales price less cost of natural gas).
Turbine - A machine for generating rotary mechanical power from the energy of a stream of fluid (such as water, steam, or hot gas). Turbines convert kinetic energy of fluids to mechanical energy through the principles of impulse and reaction or a mixture of the two.
Unplanned Outage - The shut down of a generating unit due to an unanticipated breakdown.
Value at Risk (VaR) - A measure to manage earnings exposure from energy trading activities.
TRANSALTA CORPORATION / Q2 2014 41
TransAlta Corporation
110 - 12th Avenue S.W.
Box 1900, Station “M”
Calgary, Alberta Canada T2P 2M1
Phone
403.267.7110
Website
www.transalta.com
CST Trust Company
P.O. Box 700 Station “B”
Montreal, Québec Canada H3B 3K3
Phone
Toll-free in North America: 1.800.387.0825
Toronto or outside North America: 416.682.3860
Fax
514.985.8843
E-mail
inquiries@canstockta.com
Website
www.canstockta.com
FOR MORE INFORMATION
Media and Investor Inquiries
Investor Relations
Phone
1.800.387.3598 in Canada and United States
or 403.267.2520
Fax
403.267.7405
E-mail
investor_relations@transalta.com
42 TRANSALTA CORPORATION / Q2 2014