EXHIBIT 13.2
 | TRANSALTA CORPORATION SECOND QUARTER REPORT FOR 2015 |
MANAGEMENT’S DISCUSSION AND ANALYSIS
This Management’s Discussion and Analysis (“MD&A”) contains forward-looking statements. These statements are based on certain estimates and assumptions and involve risks and uncertainties. Actual results may differ materially. See the Forward-Looking Statements section of this MD&A for additional information.
This MD&A should be read in conjunction with the unaudited interim condensed consolidated financial statements of TransAlta Corporation as at and for the three and six months ended June 30, 2015 and 2014, and should also be read in conjunction with the audited annual consolidated financial statements and MD&A contained within our 2014 Annual Report. In this MD&A, unless the context otherwise requires, ‘we’, ‘our’, ‘us’, the ‘Corporation’, and ‘TransAlta’ refers to TransAlta Corporation and its subsidiaries. The condensed consolidated financial statements have been prepared in accordance with International Financial Reporting Standards (“IFRS”) IAS 34 Interim Financial Reporting. All tabular amounts in the following discussion are in millions of Canadian dollars unless otherwise noted. This MD&A is dated July 28, 2015. Additional information respecting TransAlta, including its Annual Information Form, is available on SEDAR at www.sedar.com, on EDGAR at www.sec.gov, and on our website at www.transalta.com. Information on or connected to our website is not incorporated by reference herein.
RESULTS OF OPERATIONS
The results of operations are presented on a consolidated basis and by business segments. We have seven business segments. See the Discussion of Segmented Comparable Results section of this MD&A for information regarding the first quarter change in our segments. In this MD&A, the impact of foreign exchange fluctuations on foreign currency denominated transactions and balances is discussed with the relevant Condensed Consolidated Statements of Earnings and Condensed Consolidated Statements of Financial Position items. While individual line items in the Condensed Consolidated Statements of Financial Position may be impacted by foreign exchange fluctuations, the net impact of the translation of these items relating to foreign operations to our presentation currency is reflected in Accumulated Other Comprehensive Income (“AOCI”) in the equity section of the Condensed Consolidated Statements of Financial Position.
NON-IFRS MEASURES
We evaluate our performance and the performance of our business segments using a variety of measures. Certain of these measures discussed in this MD&A are not defined under IFRS and, therefore, should not be considered in isolation or as an alternative to or to be more meaningful than net earnings attributable to common shareholders or cash flow from operating activities, as determined in accordance with IFRS, when assessing our financial performance or liquidity. These measures may not be comparable to similar measures presented by other issuers and should not be considered in isolation or as a substitute for measures prepared in accordance with IFRS. See the Funds from Operations and Free Cash Flow and Earnings and Other Measures on a Comparable Basis sections of this MD&A for additional information.
TRANSALTA CORPORATION / Q2 2015 M1
FORWARD-LOOKING STATEMENTS
This MD&A, the documents incorporated herein by reference, and other reports and filings made with securities regulatory authorities include forward-looking statements or information (collectively referred to herein as “forward-looking statements”) within the meaning of applicable securities legislation. All forward-looking statements are based on our beliefs as well as assumptions based on information available at the time the assumptions were made and on management’s experience and perception of historical trends, current conditions, and expected future developments, as well as other factors deemed appropriate in the circumstances. Forward-looking statements are not facts, but only predictions and generally can be identified by the use of statements that include phrases such as “may”, “will”, “believe”, “expect”, “anticipate”, “intend”, “plan”, “project”, “foresee”, “potential”, “enable”, “continue”, or other comparable terminology. These statements are not guarantees of our future performance and are subject to risks, uncertainties, and other important factors that could cause our actual performance to be materially different from that projected.
In particular, this MD&A contains forward-looking statements pertaining to our business and anticipated future financial performance; our success in executing on our growth projects; the timing of the construction and commissioning of projects under development, including major projects such as the South Hedland power project or the Sundance 7 project, and their attendant costs; spending on growth and sustaining capital and productivity projects; expectations in terms of the cost of operations, capital spending, and maintenance, and the variability of those costs; the impact of certain hedges on future reported earnings and cash flows, including future reversals of unrealized gains or losses; expectations related to future earnings and cash flow from operating and contracting activities (including estimates of 2015 comparable earnings before interest, taxes, depreciation, and amortization (“EBITDA”), comparable funds from operations (“FFO”), and comparable free cash flow (“FCF”)); expectations in respect of financial ratios (including comparable FFO before interest to adjusted interest coverage, adjusted comparable FFO to adjusted net debt, and adjusted net debt to comparable EBITDA); estimates of fuel supply and demand conditions and the costs of procuring fuel; expectations for demand for electricity in both the short term and long term, and the resulting impact on electricity prices; the impact of load growth, increased capacity, and natural gas costs on power prices; expectations in respect of generation availability, capacity, and production; expectations regarding the role different energy sources will play in meeting future energy needs; expected financing of our capital expenditures; expected governmental regulatory regimes and legislation and their expected impact on us and the timing of the implementation of such regimes and regulations, as well as the cost of complying with resulting regulations and laws, including the anticipated financial impact of increased Specified Gas Emitters Regulation (“SGER”) obligations in Alberta, and the value of offsets generated by our wind facilities in the province; our trading strategies and the risk involved in these strategies; estimates of future tax rates, future tax expense, and the adequacy of tax provisions; accounting estimates; anticipated growth rates in our markets; our expectations regarding future proceedings before the Alberta Utilities Commission (the “AUC”) as well as those relating to the outcome of existing or potential legal and contractual claims, regulatory investigations, and disputes; expectations regarding the renewal of collective bargaining agreements; expectations for the ability to access capital markets at reasonable terms; the estimated impact of changes in interest rates and the value of the Canadian dollar relative to the U.S. dollar, the Australian dollar, and other currencies in which we do business; the monitoring of our exposure to liquidity risk; expectations in respect of the global economic environment and growing scrutiny by investors relating to sustainability performance; our credit practices; the estimated contribution of Energy Marketing activities to gross margin; expectations relating to the performance of TransAlta Renewables Inc.’s (“TransAlta Renewables”) assets; expectations regarding our continued ownership of common shares of TransAlta Renewables; expectations in respect of the Keephills 1 Force Majeure event, including the impact of the claim, penalties, and insurance coverage; completion of the Poplar Creek restructuring transaction and the acquisition of the Kent Breeze and Wintering Hills wind facilities and the associated benefits therefrom; and completion of the 71 MW U.S. wind and solar acquisition, including future growth in the country and expected yield from the acquisition.
M2 TRANSALTA CORPORATION / Q2 2015
Factors that may adversely impact our forward-looking statements include risks relating to: fluctuations in market prices and the availability of fuel supplies required to generate electricity; our ability to contract our generation for prices that will provide expected returns; the regulatory and political environments in the jurisdictions in which we operate; increasingly stringent environmental requirements and changes in, or liabilities under, these requirements; changes in general economic conditions including interest rates; operational risks involving our facilities, including unplanned outages at such facilities; disruptions in the transmission and distribution of electricity; the effects of weather; disruptions in the source of fuels, water, or wind required to operate our facilities; natural or man-made disasters; the threat of domestic terrorism and cyberattacks; equipment failure and our ability to carry out or have completed the repairs in a cost-effective or timely manner; commodity risk management; industry risk and competition; fluctuations in the value of foreign currencies and foreign political risks; the need for additional financing and the ability to access financing at a reasonable cost; our ability to fund our growth projects while maintaining our investment grade credit rating; structural subordination of securities; counterparty credit risk; our ability to recover our losses through our insurance coverage; our provision for income taxes; legal, regulatory, and contractual proceedings involving the Corporation; outcomes of investigations and disputes; reliance on key personnel; labour relations matters; development projects and acquisitions, including delays or changes in costs in the construction of the South Hedland Power Project; the satisfactory receipt of applicable regulatory approvals for existing and proposed operations and growth initiatives; and failure to satisfy the conditions to the closing of the Poplar Creek restructuring transaction and U.S. wind and solar acquisition, respectively, including regulatory approvals being satisfied or met and changes in the markets in which the facilities operate.
The foregoing risk factors, among others, are described in further detail in the Risk Management section of our 2014 Annual MD&A and under the heading “Risk Factors” in our 2015 Annual Information Form.
Readers are urged to consider these factors carefully in evaluating the forward-looking statements and are cautioned not to place undue reliance on these forward-looking statements. The forward-looking statements included in this document are made only as of the date hereof and we do not undertake to publicly update these forward-looking statements to reflect new information, future events or otherwise, except as required by applicable laws. In light of these risks, uncertainties, and assumptions, the forward-looking events might occur to a different extent or at a different time than we have described, or might not occur. We cannot assure that projected results or events will be achieved.
TRANSALTA CORPORATION / Q2 2015 M3
HIGHLIGHTS
Consolidated Highlights
| Three months ended June 30 | Six months ended June 30 | |||||||||||||||
| 2015 | 2014 | 2015 | 2014 | |||||||||||||
| Revenues | 438 | 491 | 1,031 | 1,266 | ||||||||||||
Comparable EBITDA(1) | 183 | 213 | 458 | 523 | ||||||||||||
| Net loss attributable to common shareholders | (131 | ) | (50 | ) | (124 | ) | (1 | ) | ||||||||
Comparable net earnings (loss) attributable to common shareholders(1) | (44 | ) | (12 | ) | (18 | ) | 35 | |||||||||
Comparable funds from operations(1) | 160 | 154 | 371 | 392 | ||||||||||||
| Cash flow from operating activities | (39 | ) | 51 | 114 | 330 | |||||||||||
Comparable free cash flow(1) | 23 | 20 | 133 | 159 | ||||||||||||
Net loss per share attributable to common shareholders, basic and diluted | (0.47 | ) | (0.18 | ) | (0.45 | ) | - | |||||||||
Comparable net earnings (loss) per share(1) | (0.16 | ) | (0.04 | ) | (0.06 | ) | 0.13 | |||||||||
Comparable funds from operations per share(1) | 0.57 | 0.57 | 1.33 | 1.45 | ||||||||||||
Comparable free cash flow per share(1) | 0.08 | 0.07 | 0.48 | 0.59 | ||||||||||||
| Dividends paid per common share | 0.18 | 0.18 | 0.36 | 0.47 | ||||||||||||
| As at | June 30, 2015 | Dec. 31, 2014 | ||||||
| Total assets | 10,116 | 9,833 | ||||||
Total credit facilities, long-term debt, and finance lease obligations(2), net of cash | 4,142 | 4,013 | ||||||
| Total long-term liabilities | 5,354 | 4,504 | ||||||
Financial Highlights
| ▪ | Comparable EBITDA for the three and six months ended June 30, 2015 decreased by $30 million and $65 million to $183 million and $458 million, respectively, compared to the same periods in 2014. A significant part of the decrease is attributable to unfavourable Energy Marketing results during the second quarter, mark-to-market losses on economic hedges on Canadian Coal and U.S. Coal, and lower availability in Canadian Coal. Last year Energy Marketing performance was positively impacted by higher volatility due to extraordinary conditions in the first quarter. | |
| ▪ | Comparable FFO increased slightly by $6 million to $160 million for the three months ended June 30, 2015 as much of the variance in EBITDA in the second quarter was due to unrealized mark-to-market losses. On a year-to-date basis, comparable FFO decreased by $21 million to $371 million. | |
| ▪ | During the quarter, comparable net loss attributable to common shareholders was $44 million ($0.16 net loss per share), down from a comparable net loss of $12 million ($0.04 net loss per share) in the same period in 2014. Year-to-date, comparable net loss attributable to common shareholders was $18 million ($0.06 net loss per share), down from comparable net earnings of $35 million ($0.13 net earnings per share) in the same period in 2014. The decreases in each case were a result of lower comparable EBITDA. |
________________
| (1) | These items are not defined under IFRS. Presenting these items from period to period provides management and investors with the ability to evaluate earnings trends more readily in comparison with prior periods’ results. Refer to the Funds from Operations and Free Cash Flow and Earnings and Other Measures on a Comparable Basis sections of this MD&A for further discussion of these items, including, where applicable, reconciliations to measures calculated in accordance with IFRS. |
| (2) | Includes current portion. |
M4 TRANSALTA CORPORATION / Q2 2015
| ▪ | Reported net loss attributable to common shareholders was $131 million for the quarter ($0.47 net loss per share) compared to a net loss of $50 million ($0.18 net loss per share) for the same period in 2014. On a year-to-date basis, reported net loss attributable to common shareholders was $124 million ($0.45 net loss per share) compared to a net loss of $1 million ($0.00 net loss per share) for the same period in 2014. For each period, the differences between comparable and reported net earnings are mainly due to changes in the fair value of de-designated and economic hedges at U.S. Coal(2), net of related tax expense. Deferred income tax expense during the second quarter of 2015 was also significantly impacted by the increase in the Alberta Corporate tax rate in June 2015, and by an internal reorganization associated with the sale of an economic interest in our Australian business to TransAlta Renewables. | |
| ▪ | Increases in credit facilities, long-term debt, and finance lease obligations since Dec. 31, 2014 are primarily due to the impact of the strengthening U.S. dollar on our U.S.-denominated debt. This increase is offset by a corresponding increase in U.S.-denominated assets. As at June 30, 2015, the increase in working capital also offsets the debt reduction achieved through the Australian transaction. |
Strategic Initiative Highlights
During the quarter we continued to strengthen our financial condition, improve our operating performance, and make significant progress to grow our portfolio of highly contracted assets through initiatives such as:
| ▪ | TransAlta Renewables acquired an economic interest based on the cash flows of our Australian assets (the “Transaction”). We received net cash proceeds of $217 million as well as approximately $1,067 million as consideration for the interest through a combination of Common Shares and Class B Shares in TransAlta Renewables, increasing our ownership from 70 per cent to 76 per cent. Cash proceeds of the Transaction were used to reduce borrowings on our credit facilities. | |
| ▪ | TAMA Power, our joint venture with Berkshire Hathaway Energy Company, received approval from the AUC to construct Sundance 7, an 856 megawatt (“MW”) high efficiency natural gas-fired power plant in Alberta. Construction of Sundance 7 will not commence until we have contracted a significant portion of the plant capacity. | |
| ▪ | We restructured contractual agreements at our Poplar Creek facility, to extend the contract on gas generators to 2030, compared to the current 2023 expiry, and acquire two wind facilities, representing 65 MW of capacity, in consideration for our customer acquiring steam generators, rights to the output of gas generators, and operational control of the facility. The transaction was signed on July 7, 2015. Over the last three years, we have nearly doubled the weighted average remaining contractual life of our gas fleet from 6 years to 12 years. | |
| ▪ | On July 26, 2015, we agreed to acquire 71 MW of fully contracted renewable generation assets for cash consideration of U.S.$76 million together with the assumption of certain tax equity and U.S.$42 million of non-recourse project debt. The assets include our first solar facilities, representing 21 MW of capacity in Massachusetts, and one 50 MW wind farm in Minnesota. |
Earlier this year, we also completed the following transactions:
| ▪ | Successfully completed construction of the natural gas pipeline to our Solomon power station. | |
| ▪ | Commenced construction of the South Hedland Power Project. Most of the earthwork at the site is now completed and contractors are now executing civil work. | |
| ▪ | Entered into a new 15-year 72 MW power supply contract for our Windsor facility with Ontario’s Independent Electricity System Operator (“IESO”). The new contract will take effect in December 2016. | |
| ▪ | Eliminated 122 positions at our Canadian Coal operations providing sustained savings of $12 million annually. |
___________________
| (1) | Hedge accounting could not be applied to certain contracts, and accordingly, the mark-to-market on these contracts impacted reporting earnings. The impacts of these mark-to-market fluctuations have been removed from revenues to arrive at comparable results, which reflect the economic nature of these contracts. |
TRANSALTA CORPORATION / Q2 2015 M5
Operational Results
Comparable EBITDA and operational performance for the business is as follows:
| Three months ended June 30 | Six months ended June 30 | |||||||||||||||
| 2015 | 2014 | 2015 | 2014 | |||||||||||||
Availability (%)(1) | 81.0 | 82.1 | 85.4 | 86.8 | ||||||||||||
Adjusted availability (%)(2) | 80.9 | 85.4 | 86.1 | 88.4 | ||||||||||||
Production (GWh)(1,3) | 8,820 | 9,283 | 18,720 | 21,350 | ||||||||||||
| Comparable EBITDA: | ||||||||||||||||
| Canadian Coal | 71 | 83 | 166 | 178 | ||||||||||||
| U.S. Coal | 11 | 16 | 34 | 33 | ||||||||||||
| Gas | 77 | 72 | 160 | 155 | ||||||||||||
| Wind | 33 | 33 | 88 | 96 | ||||||||||||
| Hydro | 25 | 20 | 39 | 40 | ||||||||||||
| Energy Marketing | (18 | ) | 4 | 5 | 53 | |||||||||||
| Corporate | (16 | ) | (15 | ) | (34 | ) | (32 | ) | ||||||||
| Total comparable EBITDA | 183 | 213 | 458 | 523 | ||||||||||||
| ▪ | Canadian Coal: Comparable EBITDA in the second quarter was $71 million and $166 million on a year-to-date basis, compared to $83 million and $178 million, respectively, for the same periods in 2014. The decrease in our quarterly EBITDA is primarily driven by mark-to-market losses on certain forward financial contracts that do not qualify for hedge accounting but provide a solid economic hedge against price fluctuations for Canadian Coal. Losses on these contracts generally reverse over time as we deliver power to the market. Canadian Coal was also impacted by lower availability than last year. This lower availability was driven by an additional planned outage during the second quarter of 2015, higher derates due to the impact of hot weather (normally occurring in the third quarter) on cooling ponds and a recurring baghouse issue at Keephills 3, and an extension of one of our two planned outages to allow for more work to be completed. | |
| ▪ | U.S. Coal: Comparable EBITDA was $11 million in the quarter compared to $16 million for the same period in 2014 and $34 million on a year-to-date basis compared to $33 million in 2014. Quarterly results were negatively impacted by mark-to-market losses on financial contracts put in place to hedge our future generation. Both units at U.S. Coal are back to service after their annual maintenance. | |
| ▪ | Gas: Comparable EBITDA in the second quarter was $77 million and $160 million on a year-to-date basis, compared to $72 million and $155 million, respectively, for the same periods in 2014. The increase is primarily driven by additional revenues from the Australian natural gas pipeline, which was commissioned in the first quarter, and the strengthening of the U.S. dollar. | |
| ▪ | Wind: Comparable EBITDA in the quarter was consistent with the same period in 2014. On a year-to date basis, comparable EBITDA decreased by $8 million to $88 million compared to the same period in 2014, primarily as a result of lower power prices during the first quarter of 2015 in Alberta. | |
| ▪ | Hydro: Comparable EBITDA in the second quarter was $25 million compared to $20 million for the same period in 2014, as we used flexibility under our contracts to capture higher prices in Alberta following increased price volatility. |
________________
| (1) | Availability and production includes all generating assets (generation operations and finance leases). 2014 availability also includes equity investments, which were sold in May 2014. |
| (2) | Adjusted for economic dispatching at U.S. Coal. |
| (3) | 2014 production includes 314 GWh from CE Generation LLC and Wailuku Holding Company, LLC, both of which were sold in May 2014. Refer to the Significant 2014 Events and Subsequent Events section of our 2014 Annual MD&A for further discussion. |
M6 TRANSALTA CORPORATION / Q2 2015
| ▪ | Energy Marketing: Energy Marketing generated comparable EBITDA loss of $18 million in the quarter and comparable EBITDA of $5 million on a year-to-date basis, down from earnings of $4 million and $53 million, respectively, compared to the same periods in 2014. The decrease is attributable to extraordinary market conditions in the first quarter of last year that resulted in substantial customer margins and volatile market conditions in the second quarter of this year that negatively affected our Energy Marketing results. | |
| ▪ | Corporate: Our Corporate Segment incurred slightly higher costs for the three and six months ended June 30, 2015 compared to the same periods in 2014 due to increased costs incurred as a result of the Transaction with TransAlta Renewables. |
AVAILABILITY & PRODUCTION
Availability for the three and six months ended June 30, 2015 decreased compared to the same period in 2014, primarily due to a two-month Force Majeure outage at our Keephills 1 facility caused by a damaged superheater. The unit returned to service on May 17, 2015. Availability during the period was also impacted by higher thermal derates at Canadian Coal due to the early season hot weather impacting cooling ponds. Our second quarter availability was also affected by two planned outages compared to only one last year. The planned outage at Sundance 3 was also extended to allow for more work to be completed.
Lower production for the six months ended June 30, 2015 compared to the same period in 2014 is also due to a longer period of seasonal economic dispatching at U.S. Coal due to the mild winter in the Pacific Northwest this year.
TRANSALTA CORPORATION / Q2 2015 M7
COMPARABLE FUNDS FROM OPERATIONS AND COMPARABLE FREE CASH FLOW
Comparable funds from operations and comparable free cash flow provide investors with a proxy for the amount of cash generated from operating activities before changes in working capital, and provide the ability to evaluate cash flow trends more readily in comparison with results from prior periods. Comparable FFO per share and comparable FCF per share are calculated using the weighted average number of common shares outstanding during the period.
| Three months ended June 30 | Six months ended June 30 | |||||||||||||||
| 2015 | 2014 | 2015 | 2014 | |||||||||||||
| Cash flow from (used in) operating activities | (39 | ) | 51 | 114 | 330 | |||||||||||
| Change in non-cash operating working capital balances | 198 | 68 | 247 | 26 | ||||||||||||
| Cash flow from operations before changes in working capital | 159 | 119 | 361 | 356 | ||||||||||||
| Adjustments: | ||||||||||||||||
| Payment of restructuring costs | - | - | 7 | - | ||||||||||||
| Impacts associated with California claim | - | 33 | - | 33 | ||||||||||||
| Decrease in finance lease receivable | 1 | - | 2 | 1 | ||||||||||||
| Maintenance costs related to Alberta flood of 2013, net of insurance recoveries | - | 2 | 1 | 2 | ||||||||||||
| Comparable FFO | 160 | 154 | 371 | 392 | ||||||||||||
| Deduct: | ||||||||||||||||
| Sustaining capital | (104 | ) | (107 | ) | (174 | ) | (171 | ) | ||||||||
| Insurance recoveries of sustaining capital expenditures related to Alberta flood of 2013 | - | 1 | - | 1 | ||||||||||||
| Dividends paid on preferred shares | (11 | ) | (10 | ) | (23 | ) | (19 | ) | ||||||||
| Distributions paid to subsidiaries' non-controlling interests | (22 | ) | (18 | ) | (41 | ) | (44 | ) | ||||||||
| Comparable FCF | 23 | 20 | 133 | 159 | ||||||||||||
| Weighted average number of common shares outstanding in the period | 279 | 272 | 278 | 271 | ||||||||||||
| Comparable FFO per share | 0.57 | 0.57 | 1.33 | 1.45 | ||||||||||||
| Comparable FCF per share | 0.08 | 0.07 | 0.48 | 0.59 | ||||||||||||
A reconciliation of comparable EBITDA to comparable FFO is as follows:
| Three months ended June 30 | Six months ended June 30 | |||||||||||||||
| 2015 | 2014 | 2015 | 2014 | |||||||||||||
| Comparable EBITDA | 183 | 213 | 458 | 523 | ||||||||||||
| Unrealized losses from risk management activities | 31 | 5 | 36 | 10 | ||||||||||||
| Interest expense | (54 | ) | (58 | ) | (109 | ) | (119 | ) | ||||||||
| Provisions | 5 | 6 | (4 | ) | 4 | |||||||||||
| Current income tax expense | (5 | ) | (9 | ) | (11 | ) | (17 | ) | ||||||||
| Realized foreign exchange gain (loss) | 5 | (3 | ) | 13 | 1 | |||||||||||
| Decommissioning and restoration costs settled | (8 | ) | (4 | ) | (13 | ) | (7 | ) | ||||||||
| Maintenance costs related to Alberta flood of 2013 | - | 4 | - | - | ||||||||||||
| Other non-cash items | 3 | - | 1 | (3 | ) | |||||||||||
| Comparable FFO | 160 | 154 | 371 | 392 | ||||||||||||
In the second quarter of 2015, comparable FFO and FCF were not impacted by the reduction in EBITDA as much of the shortfall was caused by non-cash mark-to-market losses. Lower interest expense and cash taxes also offset some of the shortfall in EBITDA.
M8 TRANSALTA CORPORATION / Q2 2015
FINANCIAL POSITION
We seek to maintain financial flexibility by using multiple sources of capital to finance our business plans, while maintaining a sufficient level of available liquidity to support contracting and trading activities. We are focused on strengthening our financial position and cash flow coverage ratios to support stable investment grade credit ratings.
We have developed our own definitions of ratios and targets to manage our capital. These metrics and ratios are not defined under IFRS, and may not be comparable to those used by other entities or by rating agencies.
Comparable Funds From Operations before Interest to Adjusted Interest Coverage
| As at | June 30, 2015 | Dec. 31, 2014 | ||||||
Comparable FFO(1) | 741 | 762 | ||||||
Add: Interest on debt net of interest income and capitalized interest(1) | 226 | 236 | ||||||
Comparable FFO before interest(1) | 967 | 998 | ||||||
Interest on debt net of interest income(1) | 234 | 239 | ||||||
Add: 50 per cent of dividends paid on preferred shares(1) | 23 | 21 | ||||||
Adjusted interest(1) | 257 | 260 | ||||||
| Comparable FFO before interest to adjusted interest coverage (times) | 3.8 | 3.8 | ||||||
Our target for Comparable FFO before Interest to Adjusted Interest Coverage is four to five times. The ratio is comparable to last year. We are aiming to meet our target range by the end of the year.
Adjusted Comparable Funds From Operations to Adjusted Net Debt
| As at | June 30,2015 | Dec. 31, 2014 | ||||||
Comparable FFO(1) | 741 | 762 | ||||||
Less: 50 per cent of dividends paid on preferred shares(1) | (23 | ) | (21 | ) | ||||
Adjusted comparable FFO(1) | 718 | 741 | ||||||
| Period-end long-term debt, including finance lease obligations | 4,213 | 4,056 | ||||||
| Add: 50 per cent of issued preferred shares | 471 | 471 | ||||||
| Less: Cash and cash equivalents (excluding restricted cash) | (71 | ) | (43 | ) | ||||
Fair value (asset) of hedging instruments on debt(2) | (90 | ) | (96 | ) | ||||
| Adjusted net debt | 4,523 | 4,388 | ||||||
| Adjusted comparable FFO to adjusted net debt (%) | 15.9 | 16.9 | ||||||
Our target for Adjusted Comparable FFO to Adjusted Net Debt is 20 to 25 per cent. We are aiming to meet our target range in 2016. The reduction in the ratio during the year-to-date is due to lower comparable FFO and the strengthening of the U.S. dollar impacts on our U.S.-denominated debt. Our U.S.-denominated debt is fully hedged by U.S.-denominated assets, some of which revalue outside of net debt adjustments. As at June 30, 2015, net debt is also impacted by seasonal variations in working capital, which offsets the debt reduction of $217 million achieved through the funds raised by the Transaction with TransAlta Renewables.
________________
| (1) | Last 12 months. |
| (2) | Included in risk management assets and/or liabilities on the condensed consolidated financial statements as at June 30, 2015 and Dec. 31, 2014. |
TRANSALTA CORPORATION / Q2 2015 M9
Adjusted Net Debt to Comparable EBITDA
| As at | June 30, 2015 | Dec. 31, 2014 | ||||||
| Period-end long-term debt, including finance lease obligations | 4,213 | 4,056 | ||||||
| Less: cash and cash equivalents | (71 | ) | (43 | ) | ||||
| Add: 50 per cent of issued preferred shares | 471 | 471 | ||||||
Fair value (asset) of hedging instruments on debt(1) | (90 | ) | (96 | ) | ||||
| Adjusted net debt | 4,523 | 4,388 | ||||||
Comparable EBITDA(2) | 971 | 1,036 | ||||||
| Adjusted net debt to comparable EBITDA (times) | 4.7 | 4.2 | ||||||
6
Our target for Adjusted Net Debt to Comparable EBITDA is three to four times. During the year-to-date, our ratio deteriorated compared to Dec. 31, 2014, mainly as a result of lower comparable EBITDA during the period and strengthening of the U.S. dollar as described in the Adjusted Comparable FFO to Adjusted Net Debt section above. We are aiming to meet our target range in 2016.
SIGNIFICANT AND SUBSEQUENT EVENTS
Sale of Economic Interest to TransAlta Renewables Inc.
On May 7, 2015, we completed the sale of an economic interest based on the cash flows of our Australian assets to TransAlta Renewables. The Australian assets consist of 575 MW of power generation from six operating assets and the South Hedland project currently under construction, as well as the recently commissioned 270 kilometre gas pipeline. TransAlta Renewables’ investment consists of the acquisition of securities that, in aggregate, provide an economic interest based on cash flows of the Australian assets for a total consideration of $1.78 billion.
With the closing of the Transaction, TransAlta Renewables paid the Corporation $217 million as well as approximately
$1,067 million through a combination of Common Shares and Class B Shares in TransAlta Renewables, increasing our ownership from 70 per cent to 76 per cent. TransAlta Renewables has also committed to funding the remaining costs to construct the South Hedland project, estimated at $491 million.
TransAlta Renewables funded the cash proceeds through the public issuance of 17,858,423 Common Shares at a price of $12.65 per share. The offering closed in two parts on April 15 and 23, 2015. TransAlta Renewables shareholder approval was received on May 7, 2015.
Sundance 7
On June 9, 2015, TAMA Power received approval from the AUC to construct and operate an 856 MW combined-cycle natural
gas-fired power plant in Alberta.
The next stage in the development of the project, the Alberta Environment and Sustainable Resource Development review, is currently underway. Construction of Sundance 7 will not commence until we have contracted a significant portion of the plant capacity.
_________________
| (1) | Included in risk management assets and/or liabilities on the condensed consolidated financial statements as at June 30, 2015 and Dec. 31, 2014. |
| (2) | Last 12 months. |
M10 TRANSALTA CORPORATION / Q2 2015
Poplar Creek
On July 7, 2015, we agreed with Suncor Energy (“Suncor”) to restructure the current arrangement for power generation services at Suncor’s oil sands base site near Fort McMurray and for TransAlta to acquire Suncor’s interest in two wind projects located in Alberta and Ontario.
Our Poplar Creek co-generation facility, which has a maximum capability of 376 MW, had been built and contracted to provide steam and electricity to Suncor until 2023. Under the terms of the new arrangement, Suncor will acquire two steam turbines with an installed capacity of 132 MW and certain transmission interconnection assets. In addition, Suncor will assume full operational control of the co-generation facility, including responsibility for all capital costs, and have the right to use the full 244 MW capacity of TransAlta’s gas generators until Dec. 31, 2030. We will provide Suncor with centralized monitoring, diagnostics and technical support to maximize performance and reliability of plant equipment. Ownership of the entire Poplar Creek co-generation facility will transfer to Suncor in 2030.
As part of the restructuring of the arrangement, we will acquire Suncor’s interest in the 20 MW Kent Breeze facility located in Ontario and Suncor’s 51 per cent interest in the 88 MW Wintering Hills facility located in Alberta. The Kent Breeze facility has a 20-year contract with the Ontario IESO.
The restructuring is creating value by increasing the duration of the contract until 2030 and reducing our exposure to Alberta’s merchant power market. It also adds two high quality wind projects to our portfolio and creates potential for future
drop-down into TransAlta Renewables of the fully contracted gas generating assets and the two wind projects.
As a result of the agreement, the net assets of Poplar Creek, totalling approximately $226 million will be reclassified to assets held for sale in the third quarter. The amount includes the net book value of gas generators, as the new contract is anticipated to constitute a finance lease arrangement.
The restructuring transaction and related arrangements are subject to the satisfaction of a number of customary conditions and the receipt of regulatory approvals and is expected to close in the third quarter.
U.S. Wind and Solar Acquisition
On July 26, 2015, we agreed to acquire 71 MW of fully contracted renewable generation assets for cash consideration of
U.S.$76 million together with the assumption of certain tax equity and U.S.$42 million of non-recourse debt. The assets acquired include 21 MW of solar projects located in Massachusetts and a 50 MW Lakeswind wind project located in Minnesota. The assets are contracted under long-term power purchase agreements ranging from 20 to 30 years. The acquisition is subject to customary regulatory approvals and is expected to close by the end of September 2015.
The acquisition marks our first solar facilities and aligns with our strategy of growing our renewables platform, diversifying our portfolio, and increasing the pipeline of assets for potential future drop-down into TransAlta Renewables. The acquisition adds geographic, technological and counterparty diversification, and establishes a broader platform in the U.S. for future growth in renewables.
The solar projects, consisting of four ground mounted facilities and four roof-top facilities, are all contracted on a long-term basis and are qualified under phase one of the Massachusetts Solar Renewable Energy Credit (SREC-I) program, established to encourage investment in distributed solar generation. The wind facility has been operational since March 2014 and is contracted under three long-term power purchase agreements until 2034 with high quality counterparties.
TRANSALTA CORPORATION / Q2 2015 M11
South Hedland Power Project
Construction of the South Hedland Project commenced in January 2015. In May 2015, bulk earthworks and soil remediation work was completed. Civil works have commenced and contractors have been mobilized. Long lead equipment has been ordered and manufacturing is underway with no reported delays in delivery. Factory acceptance testing was completed on various pieces of equipment. Detailed engineering of the power island is ongoing.
Keephills 1 Force Majeure
On March 17, 2015, an unplanned outage began at our 395 MW Keephills 1 facility due to a damaged superheater. The unit returned to service on May 17, 2015.
Following the establishment of the plan to return the unit to service and the review of the causes of the outage, we gave notice under the PPA to the PPA buyer and the Balancing Pool of a “High Impact Low Probability” Force Majeure event. In the event of a Force Majeure event, we are entitled to continue to receive our PPA capacity payment and are protected under the terms of the PPA from having to pay availability penalties. We also anticipate the costs incurred as a result of the event will be covered by insurance. Consequently, the outage is not anticipated to have a material financial impact.
Australian Natural Gas Pipeline
On March 19, 2015, we announced the completion of the Fortescue River Gas Pipeline in Western Australia. The project, our first pipeline, was completed within a nine month timeframe and for an estimated total cost of AUD$183 million. We hold a 43 per cent interest in the pipeline. The pipeline delivers gas to our Solomon power station which services Fortescue Metals Group’s mining operations at the Solomon Hub.
Windsor Recontracting
During the first quarter, we executed a new 15-year power supply contract with Ontario’s IESO for our Windsor facility, which will be effective Dec. 1, 2016. The contract is similar to the contract signed in 2013 for our Ottawa facility. Under the new contract, the plant will become dispatchable for up to 72 MW of capacity. The new contract provides long-term stable earnings for this facility.
Financing Activities
On Jan.15, 2015, our U.S.$500 million 4.75 per cent senior notes matured and were paid out using existing liquidity and on
Feb. 11, 2015, we refinanced maturing debt at our Pingston hydroelectric generating facility in British Columbia. Our share of gross proceeds was $45 million. The bonds bear interest at the annual fixed interest rate of 2.95 per cent, payable semi-annually with no principal repayments until maturity in May 2023. Proceeds were used to repay the $35 million secured debenture bearing interest at 5.28 per cent. Excess proceeds, net of transaction costs, are to be used for general corporate purposes and to repay corporate debt.
Restructuring of Canadian Coal
On Jan. 14, 2015, we initiated a significant cost-reduction initiative at our Canadian Coal power generation operations, resulting in a 20 per cent reduction in the workforce. The initiative is expected to generate savings of approximately $12 million annually. The initiative was quickly implemented and we are already capturing a large part of these savings. As a result, we incurred approximately $7 million of restructuring costs in the first quarter.
M12 TRANSALTA CORPORATION / Q2 2015
Proceedings before the Alberta Utilities Commission
On July 27, 2015, the Alberta Utilities Commission issued its decision in the Alberta Market Surveillance Administrator case. We are still reviewing the ruling which found, among other things, that our actions in relation to four outage events at our coal-fired generating units, spanning 11 days in 2010 and 2011, restricted or prevented a competitive response from the associated PPA buyers and manipulated market prices away from a competitive market outcome. Our review includes the possibility of filing a leave to appeal with the Alberta Court of Appeal, which must be filed within 30 days. The ruling marks the end of the first phase of the proceedings. The second phase of the proceedings will consider any penalties the AUC may impose against the Corporation.
ELECTRICITY PRICES
The average spot electricity prices for the three and six months ended June 30, 2015 and 2014 in the three major markets in which we have merchant capacity are shown in the following graphs:

For the three months ended June 30, 2015, average spot prices in Alberta increased compared to the same period in 2014 primarily due to lower supply as a result of outages and strong bidding behaviour throughout June. In the Pacific Northwest, average spot prices increased relative to 2014 due to drier than normal hydro conditions and hot weather in late June. Average spot prices in Ontario for the three months ended June 30, 2015 decreased compared to the same period in 2014 due to lower natural gas prices and low power prices in surrounding markets, which reduced potential exports.
TRANSALTA CORPORATION / Q2 2015 M13
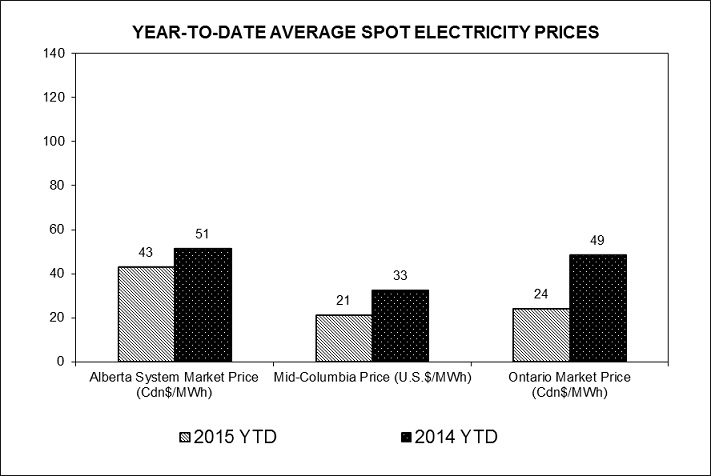
For the six months ended June 30, 2015, average spot prices decreased in all three markets. Lower natural gas prices have impacted all markets. Increased supply in Alberta led to a weak first half of the year, with the exception of June. Higher water resources in the Pacific Northwest in the first quarter more than offset the drier conditions during the second quarter. Ontario has seen consistently lower demand so far in 2015 compared to 2014.
DISCUSSION OF SEGMENTED COMPARABLE RESULTS
During the first quarter of 2015 we began reporting Canadian Coal, U.S. Coal, Gas, Wind, and Hydro as separate business segments. Previously, these were collectively reported as the Generation Segment and were further differentiated by fuel type within our MD&A to provide additional information to our readers. As a result, the change in segmentation under IFRS has minimal impact on our MD&A. No changes arose in respect of our Energy Marketing and Corporate Segments. See the Current Accounting Changes section of this MD&A for additional information.
Comparable figures are not defined under IFRS. Refer to the Earnings and Other Measures on a Comparable Basis section of this MD&A for further discussion of these items, including, where applicable, reconciliations to net earnings attributable to common shareholders.
M14 TRANSALTA CORPORATION / Q2 2015
Canadian Coal
| Three months ended June 30 | Six months ended June 30 | |||||||||||||||
| 2015 | 2014 | 2015 | 2014 | |||||||||||||
| Availability (%) | 74.6 | 86.9 | 79.5 | 87.0 | ||||||||||||
| Contract production (GWh) | 4,265 | 4,998 | 9,181 | 10,263 | ||||||||||||
| Merchant production (GWh) | 958 | 877 | 1,979 | 1,861 | ||||||||||||
| Total production (GWh) | 5,223 | 5,875 | 11,160 | 12,124 | ||||||||||||
| Gross installed capacity (MW) | 3,771 | 3,771 | 3,771 | 3,771 | ||||||||||||
| Revenues | 205 | 236 | 451 | 490 | ||||||||||||
| Fuel and purchased power | 83 | 103 | 182 | 210 | ||||||||||||
Comparable gross margin(1) | 122 | 133 | 269 | 280 | ||||||||||||
| Operations, maintenance, and administration | 48 | 47 | 97 | 96 | ||||||||||||
| Taxes, other than income taxes | 3 | 3 | 6 | 6 | ||||||||||||
Comparable EBITDA(1) | 71 | 83 | 166 | 178 | ||||||||||||
| Depreciation and amortization | 75 | 68 | 146 | 144 | ||||||||||||
Comparable operating income (loss)(1) | (4 | ) | 15 | 20 | 34 | |||||||||||
| Sustaining capital: | ||||||||||||||||
| Routine capital | 15 | 15 | 23 | 25 | ||||||||||||
| Mining equipment and land purchases | 8 | 3 | 12 | 8 | ||||||||||||
| Finance leases | 3 | 2 | 6 | 4 | ||||||||||||
| Planned major maintenance | 47 | 36 | 77 | 64 | ||||||||||||
| Total | 73 | 56 | 118 | 101 | ||||||||||||
Production for the three and six months ended June 30, 2015 decreased 652 gigawatt hours (“GWh”) and 964 GWh, respectively, compared to the same periods in 2014, primarily due to an increase in planned and unplanned outages and derates. The 2015 second quarter results include two major maintenance projects as opposed to one during 2014. The planned outage at
Sundance 3 also was extended this year as a result of the level of turbine work found. The increase in unplanned outages is attributable mainly to the two-month Force Majeure outage at the Keephills 1 facility. Higher derates are primarily associated with the effects of hot weather on our cooling ponds at our Sundance facility.
Lower availability and mark-to-market losses from economic hedges negatively impacted our gross margin for the three and six months ended June 30, 2015. Comparable gross margin and comparable EBITDA decreased by approximately $11 million compared to the same periods in 2014. Reductions in operating expenses at our Highvale mine partly offset the shortfall in availability.
Depreciation and amortization for the three months ended June 30, 2015 increased compared to the same period in 2014 due to higher asset retirements during 2015 in connection with planned maintenance activities.
Year-to-date sustaining capital increased $17 million compared to last year due to one additional planned major maintenance project in the current period as well as the cost to repair Keephills 1 which we expect will be recovered under our insurance program, and timing of mining expenditures.
_________________
| (1) | Comparable figures are not defined under IFRS. Refer to the Earnings and Other Measures on a Comparable Basis section of this MD&A for further discussion of these items, including, where applicable, reconciliations to net earnings attributable to common shareholders. |
TRANSALTA CORPORATION / Q2 2015 M15
U.S. Coal
| Three months ended June 30 | Six months ended June 30 | |||||||||||||||
| 2015 | 2014 | 2015 | 2014 | |||||||||||||
| Availability (%) | 70.4 | 49.0 | 80.7 | 71.8 | ||||||||||||
Adjusted availability (%)(1) | 69.8 | 68.9 | 84.8 | 71.8 | ||||||||||||
| Contract sales volume (GWh) | 696 | 250 | 1,385 | 496 | ||||||||||||
| Merchant sales volume (GWh) | 759 | 227 | 1,336 | 2,225 | ||||||||||||
| Purchased power (GWh) | (738 | ) | (107 | ) | (1,449 | ) | (235 | ) | ||||||||
| Total production (GWh) | 717 | 370 | 1,272 | 2,486 | ||||||||||||
| Gross installed capacity (MW) | 1,340 | 1,340 | 1,340 | 1,340 | ||||||||||||
| Revenues | 65 | 44 | 147 | 150 | ||||||||||||
| Fuel and purchased power | 43 | 17 | 89 | 92 | ||||||||||||
| Comparable gross margin | 22 | 27 | 58 | 58 | ||||||||||||
| Operations, maintenance, and administration | 10 | 10 | 22 | 24 | ||||||||||||
| Taxes, other than income taxes | 1 | 1 | 2 | 1 | ||||||||||||
| Comparable EBITDA | 11 | 16 | 34 | 33 | ||||||||||||
| Depreciation and amortization | 17 | 13 | 32 | 27 | ||||||||||||
| Comparable operating income (loss) | (6 | ) | 3 | 2 | 6 | |||||||||||
| Sustaining capital: | ||||||||||||||||
| Routine capital | 1 | 1 | 1 | 1 | ||||||||||||
| Finance leases | 1 | - | 1 | - | ||||||||||||
| Planned major maintenance | 6 | 8 | 9 | 9 | ||||||||||||
| Total | 8 | 9 | 11 | 10 | ||||||||||||
8
For the three months ended June 30, 2015, production increased 347 GWh compared to the same period in 2014 as we increased our production to take advantage of the higher power prices in the quarter. This year we took advantage of lower prices in the first quarter to start our annual maintenance early in anticipation of higher prices in the Pacific Northwest. Normally, maintenance is completed during the second quarter.
Production decreased 1,214 GWh for the six months ended June 30, 2015 compared to the same period in 2014 due mainly to the lower power prices in the first quarter of 2015. These lower prices provided us the opportunity to shut down our generation and supply our contractual obligation by buying cheaper power in the market.
In December 2014, we commenced supplying power to Puget Sound Energy under a 10-year contract. Contracted capacity in 2015 is 180 MW and the contract price is higher than current market prices in the Pacific Northwest. We can also re-supply the contract by buying power from the market when economical to do so and further improve our margin.
Despite the benefits of this contract, comparable EBITDA decreased by $5 million for the three months ended June 30, 2015 compared to the same period in 2014. This was mostly due to mark-to-market losses on financial contracts put in place to hedge our future generation. Also impacting EBITDA this quarter is the reversal of earlier coal inventory write-downs due to higher power prices and a smaller coal pile. The Segment’s results were also positively impacted by the appreciation of the U.S. dollar.
__________________
| (1) | Adjusted for economic dispatching. |
M16 TRANSALTA CORPORATION / Q2 2015
Gas
| Three months ended June 30 | Six months ended June 30 | |||||||||||||||
| 2015 | 2014 | 2015 | 2014 | |||||||||||||
| Availability (%) | 93.7 | 89.0 | 95.3 | 92.5 | ||||||||||||
| Contract production (GWh) | 1,376 | 1,392 | 2,705 | 2,729 | ||||||||||||
| Merchant production (GWh) | 360 | 447 | 1,055 | 1,118 | ||||||||||||
| Total production (GWh) | 1,736 | 1,839 | 3,760 | 3,847 | ||||||||||||
Gross installed capacity (MW)(1) | 1,531 | 1,779 | 1,531 | 1,779 | ||||||||||||
| Revenues | 154 | 168 | 335 | 413 | ||||||||||||
| Fuel and purchased power | 53 | 70 | 126 | 206 | ||||||||||||
| Comparable gross margin | 101 | 98 | 209 | 207 | ||||||||||||
| Operations, maintenance, and administration | 23 | 25 | 47 | 50 | ||||||||||||
| Taxes, other than income taxes | 1 | 1 | 2 | 2 | ||||||||||||
| Comparable EBITDA | 77 | 72 | 160 | 155 | ||||||||||||
| Depreciation and amortization | 27 | 28 | 55 | 56 | ||||||||||||
| Comparable operating income | 50 | 44 | 105 | 99 | ||||||||||||
| Sustaining capital: | ||||||||||||||||
| Routine capital | 2 | 5 | 4 | 8 | ||||||||||||
| Planned major maintenance | 5 | 20 | 12 | 24 | ||||||||||||
| Total | 7 | 25 | 16 | 32 | ||||||||||||
9
As a substantial portion of revenue in the Gas Segment is attributable to the transfer of gas costs to our customers, revenue and costs of fuel have decreased by similar amounts during the first half of 2015 compared to last year, following the decrease in gas input costs. The increase in EBITDA is primarily attributable to revenue from the Australian natural gas pipeline, which was commissioned in March 2015. Revenue from our Solomon facility was also positively impacted by the appreciation of the U.S. dollar.
Sustaining capital decreased by $18 million and $16 million, respectively, for the three and six months ended June 30, 2015 compared to the same periods in 2014 as a result of fewer planned maintenance activities. In 2014, planned maintenance outages occurred at our Ottawa and Sarnia facilities.
________________
| (1) | Includes production capacity for Fort Saskatchewan and Solomon power stations, which have been accounted for as finance leases. Assets of the Centralia gas plant were sold in the fourth quarter of 2014. The production capacity was removed from our gross capacity measures at that time. |
TRANSALTA CORPORATION / Q2 2015 M17
Wind
| Three months ended June 30 | Six months ended June 30 | |||||||||||||||
| 2015 | 2014 | 2015 | 2014 | |||||||||||||
| Availability (%) | 95.2 | 93.5 | 95.1 | 93.9 | ||||||||||||
| Contract production (GWh) | 451 | 446 | 1,088 | 1,196 | ||||||||||||
| Merchant production (GWh) | 157 | 203 | 497 | 465 | ||||||||||||
| Total production (GWh) | 608 | 649 | 1,585 | 1,661 | ||||||||||||
| Gross installed capacity (MW) | 1,289 | 1,289 | 1,289 | 1,289 | ||||||||||||
| Revenues | 49 | 49 | 122 | 129 | ||||||||||||
| Fuel and purchased power | 2 | 3 | 6 | 7 | ||||||||||||
| Comparable gross margin | 47 | 46 | 116 | 122 | ||||||||||||
| Operations, maintenance, and administration | 12 | 12 | 24 | 23 | ||||||||||||
| Taxes, other than income taxes | 2 | 1 | 4 | 3 | ||||||||||||
| Comparable EBITDA | 33 | 33 | 88 | 96 | ||||||||||||
| Depreciation and amortization | 22 | 23 | 44 | 44 | ||||||||||||
| Comparable operating income | 11 | 10 | 44 | 52 | ||||||||||||
| Sustaining capital: | ||||||||||||||||
| Routine capital | - | 1 | - | 1 | ||||||||||||
| Planned major maintenance | 4 | 3 | 6 | 4 | ||||||||||||
| Total | 4 | 4 | 6 | 5 | ||||||||||||
Production for the three and six months ended June 30, 2015 decreased 41 GWh and 76 GWh, respectively, compared to the same periods in 2014, primarily due to lower wind volumes at our Wyoming wind facility.
Comparable EBITDA decreased by $8 million for the six months ended June 30, 2015 compared to the same period in 2014 and is due to lower prices in the first quarter of 2015 that have impacted the financial performance of our Alberta wind facilities as we generally do not hedge our merchant wind generation.
M18 TRANSALTA CORPORATION / Q2 2015
Hydro
| Three months ended June 30 | Six months ended June 30 | |||||||||||||||
| 2015 | 2014 | 2015 | 2014 | |||||||||||||
| Contract production (GWh) | 507 | 527 | 905 | 890 | ||||||||||||
| Merchant production (GWh) | 29 | 23 | 38 | 28 | ||||||||||||
| Total production (GWh) | 536 | 550 | 943 | 918 | ||||||||||||
| Gross installed capacity (MW) | 913 | 913 | 913 | 913 | ||||||||||||
| Revenues | 38 | 33 | 63 | 64 | ||||||||||||
| Fuel and purchased power | 3 | 2 | 4 | 4 | ||||||||||||
| Comparable gross margin | 35 | 31 | 59 | 60 | ||||||||||||
| Operations, maintenance, and administration | 9 | 11 | 19 | 19 | ||||||||||||
| Taxes, other than income taxes | 1 | 1 | 1 | 2 | ||||||||||||
| Insurance recovery | - | (1 | ) | - | (1 | ) | ||||||||||
| Comparable EBITDA | 25 | 20 | 39 | 40 | ||||||||||||
| Depreciation and amortization | 6 | 6 | 12 | 12 | ||||||||||||
| Comparable operating income | 19 | 14 | 27 | 28 | ||||||||||||
| Sustaining capital: | ||||||||||||||||
| Routine capital | 5 | 3 | 11 | 4 | ||||||||||||
| Planned major maintenance | 2 | - | 3 | - | ||||||||||||
| Total before flood-recovery capital | 7 | 3 | 14 | 4 | ||||||||||||
| Flood-recovery capital | - | 5 | - | 7 | ||||||||||||
| Total | 7 | 8 | 14 | 11 | ||||||||||||
Comparable EBITDA increased by $5 million for the three months ended June 30, 2015 compared to the same period in 2014, primarily as a result of an increase in price volatility in Alberta in the second quarter, which allowed us to take advantage of our flexibility to produce electricity in higher priced hours.
Sustaining capital expenditures increased in 2015 compared to 2014 mainly due to hydro life extension costs, which were classified as growth capital expenditures last year.
Energy Marketing
| Three months ended June 30 | Six months ended June 30 | |||||||||||||||
| 2015 | 2014 | 2015 | 2014 | |||||||||||||
| Revenues and comparable gross margin | (17 | ) | 8 | 14 | 73 | |||||||||||
| Operations, maintenance, and administration | 1 | 4 | 9 | 20 | ||||||||||||
| Comparable EBITDA and operating income (loss) | (18 | ) | 4 | 5 | 53 | |||||||||||
For the three and six months ended June 30, 2015, comparable EBITDA decreased by $22 million and $48 million, respectively, compared to the same periods in 2014. The decrease is attributable to extraordinary market conditions in the first quarter of last year that resulted in substantial customer margins and volatile market conditions in the second quarter of this year that negatively affected our Energy Marketing results. The decrease in gross margin was partially offset by a decrease in operating costs, which includes performance-based compensation costs.
TRANSALTA CORPORATION / Q2 2015 M19
Corporate
| Three months ended June 30 | Six months ended June 30 | |||||||||||||||
| 2015 | 2014 | 2015 | 2014 | |||||||||||||
Operations, maintenance, and administration and taxes other than income taxes | 16 | 15 | 34 | �� | 32 | |||||||||||
| Depreciation and amortization | 7 | 7 | 13 | 13 | ||||||||||||
| Comparable operating loss | 23 | 22 | 47 | 45 | ||||||||||||
| Sustaining capital: | ||||||||||||||||
| Routine capital | 5 | 5 | 9 | 12 | ||||||||||||
| Total | 5 | 5 | 9 | 12 | ||||||||||||
For the three and six months ended June 30, 2015, corporate costs increased compared to the same periods in 2014. The increase was a result of the Transaction with TransAlta Renewables.
Routine capital expenditures for the six months ended June 30, 2015 decreased compared to the same period in 2014, mainly resulting from a reduction in corporate information technology costs.
OTHER CONSOLIDATED RESULTS
Net Interest Expense
The components of net interest expense are as follows:
| Three months ended June 30 | Six months ended June 30 | |||||||||||||||
| 2015 | 2014 | 2015 | 2014 | |||||||||||||
| Interest on debt | 56 | 58 | 113 | 119 | ||||||||||||
| Capitalized interest | (2 | ) | - | (5 | ) | - | ||||||||||
| Interest on finance lease obligations | - | - | 1 | - | ||||||||||||
| Accretion of provisions | 5 | 4 | 10 | 9 | ||||||||||||
| Net interest expense | 59 | 62 | 119 | 128 | ||||||||||||
For the three months ended June 30, 2015, net interest expense was comparable to the same period in 2014.
Net interest expense was lower for the six months ended June 30, 2015 compared to the same period in 2014 due to lower debt levels and higher capitalized interest. These impacts were partially offset by higher interest on our U.S.-denominated debt due to the strengthening of the U.S. dollar.
M20 TRANSALTA CORPORATION / Q2 2015
Income Taxes
A reconciliation of income taxes and effective tax rates on earnings, excluding non-comparable items, is presented below:
| Three months ended June 30 | Six months ended June 30 | |||||||||||||||
| 2015 | 2014 | 2015 | 2014 | |||||||||||||
| Earnings (loss) before income taxes | (73 | ) | (32 | ) | (44 | ) | 59 | |||||||||
| Income attributable to non-controlling interests | (12 | ) | (11 | ) | (26 | ) | (26 | ) | ||||||||
| Comparable adjustments: | ||||||||||||||||
| Impacts associated with certain de-designated and ineffective hedges | 42 | 35 | 73 | 28 | ||||||||||||
| Asset impairment charges (reversals) | (1 | ) | - | (1 | ) | - | ||||||||||
| Gain on sale of assets | - | (1 | ) | - | (1 | ) | ||||||||||
| Economic hedges of non-controlling interest in intercompany foreign exchange contracts | 1 | - | 1 | - | ||||||||||||
| Flood-related maintenance costs, net of insurance recovery | - | (3 | ) | 1 | 1 | |||||||||||
| Restructuring provision | - | - | 7 | - | ||||||||||||
| Non-comparable items attributable to non-controlling interest | (4 | ) | - | (4 | ) | - | ||||||||||
| Other net operating (income) losses | - | 5 | - | 5 | ||||||||||||
Comparable earnings (loss) attributable to TransAlta shareholders subject to tax | (47 | ) | (7 | ) | 7 | 66 | ||||||||||
| Comparable income tax expense adjustments: | ||||||||||||||||
Income tax recovery related to impacts associated with certain de-designated and ineffective hedges | 14 | 12 | 25 | 10 | ||||||||||||
| Income tax recovery related to restructuring provision | - | - | 2 | - | ||||||||||||
| Income tax recovery related to gain on sale of assets | - | 1 | - | 1 | ||||||||||||
| Income tax recovery related to sale of investment | - | 36 | - | 36 | ||||||||||||
| Income tax expense related to write off of deferred income tax assets | - | (51 | ) | - | (51 | ) | ||||||||||
| Deferred income tax rate adjustment | (20 | ) | - | (20 | ) | - | ||||||||||
| Income tax recovery (expense) related to reversal (accrual) of a writedown of deferred income tax assets | (3 | ) | - | 12 | - | |||||||||||
| Income tax expense related to the Transaction | (40 | ) | - | (48 | ) | - | ||||||||||
| Income tax expense related to flood-related maintenance costs, net of insurance recovery | - | (1 | ) | - | - | |||||||||||
| Income tax recovery related to other net operating (income) losses | - | 1 | - | 1 | ||||||||||||
| Total comparable income tax expense adjustments | (49 | ) | (2 | ) | (29 | ) | (3 | ) | ||||||||
| Income tax expense (recovery) | 35 | (3 | ) | 31 | 15 | |||||||||||
| Comparable income tax expense (recovery) | (14 | ) | (5 | ) | 2 | 12 | ||||||||||
Comparable effective tax rate on earnings attributable to TransAlta shareholders (%) | 30 | 71 | 29 | 18 | ||||||||||||
The comparable income tax recovery increased for the three months ended June 30, 2015 compared to the same period in 2014 due to higher comparable losses and changes in the amount of earnings between the jurisdictions in which pre-tax income is earned, offset by certain amounts that do not fluctuate with earnings.
The comparable income tax expense decreased for the six months ended June 30, 2015 compared to the same period in 2014 due to lower comparable earnings and changes in the amount of earnings between the jurisdictions in which pre-tax income is earned, offset by certain amounts that do not fluctuate with earnings.
TRANSALTA CORPORATION / Q2 2015 M21
The comparable effective tax rate on earnings attributable to TransAlta shareholders for the three and six months ended
June 30, 2015 decreased and increased, respectively, compared to the same periods in 2014 due to the effect of certain deductions that do not fluctuate with earnings and changes in the amount of earnings between the jurisdictions in which pre-tax income is earned.
During the three months ended June 30, 2015, we recognized a writedown of deferred income tax assets of $3 million
(June 30, 2014 - $51 million writedown). During the six months ended June 30, 2015, we reversed a writedown of deferred income tax assets of $12 million (June 30, 2014 - $51 million writedown). The deferred income tax assets related mainly to the tax benefits of losses associated with our directly owned U.S. operations. We wrote these assets off as it was no longer considered probable that sufficient future taxable income would be available from our directly owned U.S. operations to utilize the underlying tax losses. Recognized other comprehensive income in the six month period ended June 30, 2015 has given rise to a taxable temporary difference which forms the primary basis for utilization of some of the tax losses and the reversal of the writedown.
In order to give effect to the Transaction with TransAlta Renewables, a reorganization of certain TransAlta companies was completed. The reorganization resulted in the recognition of a $40 million and $48 million deferred tax liability for the three and six months ended June 30, 2015, respectively, on our investment in a subsidiary.
During the second quarter of 2015, the Government of Alberta substantively enacted legislation to increase its provincial corporate income tax rate from 10 per cent to 12 per cent, effective July 1, 2015, resulting in a net increase in our deferred income tax liability of $18 million. Of which, $20 million is recorded in the income statement with an offsetting $2 million deferred tax recovery recorded in other comprehensive income during the period the legislation is substantively enacted.
Non-Controlling Interests
Net earnings attributable to non-controlling interests for the three and six months ended June 30, 2015 was consistent with the same periods in 2014 Higher non-controlling interests were offset by lower earnings in subsidiaries that we do not wholly-own. As a result of the closing of the Transaction the non-controlling interests’ equity participation in TransAlta Renewables decreased to
27.2 per cent from 29.7 per cent while growing in value. Refer to Note 6 of our condensed consolidated financial statements for additional information.
ADDITIONAL IFRS MEASURES
An additional IFRS measure is a line item, heading, or subtotal that is relevant to an understanding of the financial statements but is not a minimum line item mandated under IFRS, or the presentation of a financial measure that is relevant to an understanding of the financial statements but is not presented elsewhere in the financial statements. We have included line items entitled gross margin and operating income in our Condensed Consolidated Statements of Earnings for the three and six months ended June 30, 2015 and 2014. Presenting these line items provides management and investors with a measurement of ongoing operating performance that is readily comparable from period to period.
M22 TRANSALTA CORPORATION / Q2 2015
EARNINGS AND OTHER MEASURES ON A COMPARABLE BASIS
We evaluate our performance and the performance of our business segments using a variety of measures. Those discussed below, and elsewhere in this MD&A, are not defined under IFRS and, therefore, should not be considered in isolation or as an alternative to or to be more meaningful than net earnings attributable to common shareholders or cash flow from operating activities, as determined in accordance with IFRS, when assessing our financial performance or liquidity. These measures are not necessarily comparable to a similarly titled measure of another company.
Each business segment assumes responsibility for its operating results measured to gross margin and operating income. Operating income and gross margin provides management and investors with a measurement of operating performance that is readily comparable from period to period.
In calculating these items, we exclude certain items as management believes these transactions are not representative of our business operations. Earnings on a comparable basis per share are calculated using the weighted average common shares outstanding during the period.
The adjustments made to calculate comparable EBITDA and comparable earnings for the three and six months ended June 30, 2015 and 2014 are as follows. References are to the reconciliation presented on the following page.
TRANSALTA CORPORATION / Q2 2015 M23
| Three months ended June 30 | Six months ended June 30 | |||||||||||||||||||
| 2015 | 2014 | 2015 | 2014 | |||||||||||||||||
| Reference number | Adjustment | Segment | ||||||||||||||||||
| Reclassifications: | ||||||||||||||||||||
| 1 | Finance lease income used as a proxy for operating revenue | Gas | 13 | 12 | 26 | 24 | ||||||||||||||
| 2 | Decrease in finance lease receivable used as a proxy for operating revenue and depreciation | Gas | 1 | - | 2 | 1 | ||||||||||||||
| 3 | Reclassification of mine depreciation from fuel and purchased power | Canadian Coal | 16 | 13 | 30 | 28 | ||||||||||||||
| 4 | Comparable portion of insurance recovery received | Hydro | - | (1 | ) | - | (1 | ) | ||||||||||||
| Adjustments to earnings to arrive at comparable results: | ||||||||||||||||||||
| 5 | Impacts to revenue associated with certain de-designated and economic hedges | U.S. Coal | 42 | 35 | 73 | 28 | ||||||||||||||
| 6 | Maintenance costs related to the Alberta flood of 2013, net of insurance recoveries | Hydro | - | (2 | ) | 1 | 2 | |||||||||||||
| 7 | Asset impairment charges (reversals) | Gas | (1 | ) | - | (1 | ) | - | ||||||||||||
| 8 | Restructuring provision | Canadian Coal | - | - | 7 | - | ||||||||||||||
| 9 | Non-comparable portion of insurance recovery received | Hydro | - | (1 | ) | - | (1 | ) | ||||||||||||
| 10 | California claim | Energy Marketing | - | 5 | - | 5 | ||||||||||||||
| 11 | Non-comparable gain on sale of assets | Equity Investments | - | (1 | ) | - | (1 | ) | ||||||||||||
| 12 | Economic hedges of non-controlling interest in intercompany foreign exchange contracts | Unassigned | 1 | - | 1 | - | ||||||||||||||
| 13 | Net tax effect of comparable adjustments subject to tax | Unassigned | (14 | ) | 2 | (27 | ) | 3 | ||||||||||||
| 14 | (Reversal) accrual of writedown of deferred income tax assets | Unassigned | 3 | - | (12 | ) | - | |||||||||||||
| 15 | Income tax expense related to the Transaction | Unassigned | 40 | - | 48 | - | ||||||||||||||
| 16 | Deferred income tax rate adjustment | Unassigned | 20 | - | 20 | - | ||||||||||||||
| 17 | Non-comparable items attributable to non-controlling interest | Unassigned | 4 | 4 | ||||||||||||||||
M24 TRANSALTA CORPORATION / Q2 2015
A reconciliation of comparable results to reported results for the three and six months ended June 30, 2015 and 2014 is as follows:
| Three months ended June 30, 2015 | Three months ended June 30, 2014 | |||||||||||||||||||||||||||||||||||
| Reported | Comparable reclassifications | Comparable adjustments | Comparable total | Reported | Comparable reclassifications | Comparable adjustments | Comparable total | |||||||||||||||||||||||||||||
| Revenues | 438 | 14 | (1,2) | 42 | (5) | 494 | 491 | 12 | (1,2) | 35 | (5) | 538 | ||||||||||||||||||||||||
| Fuel and purchased power | 200 | (16 | ) | (3) | - | 184 | 208 | (13 | ) | (3) | - | 195 | ||||||||||||||||||||||||
| Gross margin | 238 | 30 | 42 | 310 | 283 | 25 | 35 | 343 | ||||||||||||||||||||||||||||
| Operations, maintenance, and administration | 119 | - | - | 119 | 122 | - | 2 | (6) | 124 | |||||||||||||||||||||||||||
| Asset impairment charges (reversals) | (1 | ) | - | 1 | (7) | - | - | - | - | - | ||||||||||||||||||||||||||
| Taxes, other than income taxes | 8 | - | - | 8 | 7 | - | - | 7 | ||||||||||||||||||||||||||||
| Insurance recovery | - | - | - | - | - | (1 | ) | (4) | - | (1 | ) | |||||||||||||||||||||||||
| Net other operating (income) losses | - | - | - | - | 3 | 1 | (4) | (4 | ) | (9,10) | - | |||||||||||||||||||||||||
| EBITDA | 112 | 30 | 41 | 183 | 151 | 25 | 37 | 213 | ||||||||||||||||||||||||||||
| Depreciation and amortization | 137 | 17 | (2,3) | - | 154 | 132 | 13 | (2,3) | - | 145 | ||||||||||||||||||||||||||
| Operating income (loss) | (25 | ) | 13 | 41 | 29 | 19 | 12 | 37 | 68 | |||||||||||||||||||||||||||
| Finance lease income | 13 | (13 | ) | (1) | - | - | 12 | (12 | ) | (1) | - | - | ||||||||||||||||||||||||
| Foreign exchange gain (loss) | (2 | ) | - | 1 | (12) | (1 | ) | (2 | ) | - | - | (2 | ) | |||||||||||||||||||||||
| Gain on sale of assets | - | - | - | - | 1 | - | (1 | ) | (11) | - | ||||||||||||||||||||||||||
| Earnings (loss) before interest and taxes | (14 | ) | - | 42 | 28 | 30 | - | 36 | 66 | |||||||||||||||||||||||||||
| Net interest expense | 59 | - | - | 59 | 62 | - | - | 62 | ||||||||||||||||||||||||||||
| Income tax expense (recovery) | 35 | - | (49 | ) | (13,14,15,16) | (14 | ) | (3 | ) | - | (2 | ) | (13) | (5 | ) | |||||||||||||||||||||
| Net earnings (loss) | (108 | ) | - | 91 | (17 | ) | (29 | ) | - | 38 | 9 | |||||||||||||||||||||||||
| Non-controlling interests | 12 | - | 4 | (17) | 16 | 11 | - | - | 11 | |||||||||||||||||||||||||||
Net earnings (loss) attributable to TransAlta shareholders | (120 | ) | - | 87 | (33 | ) | (40 | ) | - | 38 | (2 | ) | ||||||||||||||||||||||||
| Preferred share dividends | 11 | - | - | 11 | 10 | - | - | 10 | ||||||||||||||||||||||||||||
Net earnings (loss) attributable to common shareholders | (131 | ) | - | 87 | (44 | ) | (50 | ) | - | 38 | (12 | ) | ||||||||||||||||||||||||
Weighted average number of common shares outstanding in the period | 279 | 279 | 272 | 272 | ||||||||||||||||||||||||||||||||
Net earnings (loss) per share attributable to common shareholders | (0.47 | ) | (0.16 | ) | (0.18 | ) | (0.04 | ) | ||||||||||||||||||||||||||||
TRANSALTA CORPORATION / Q2 2015 M25
| Six months ended June 30, 2015 | Six months ended June 30, 2014 | |||||||||||||||||||||||||||||||||||
| Reported | Comparable reclassifications | Comparable adjustments | Comparable total | Reported | Comparable reclassifications | Comparable adjustments | Comparable total | |||||||||||||||||||||||||||||
| Revenues | 1,031 | 28 | (1,2) | 73 | (5) | 1,132 | 1,266 | 25 | (1,2) | 28 | (5) | 1,319 | ||||||||||||||||||||||||
| Fuel and purchased power | 437 | (30 | ) | (3) | - | 407 | 547 | (28 | ) | (3) | - | 519 | ||||||||||||||||||||||||
| Gross margin | 594 | 58 | 73 | 725 | 719 | 53 | 28 | 800 | ||||||||||||||||||||||||||||
| Operations, maintenance, and administration | 253 | - | (1 | ) | (6) | 252 | 266 | - | (2 | ) | (6) | 264 | ||||||||||||||||||||||||
| Asset impairment charges (reversals) | (1 | ) | - | 1 | (7) | - | - | - | - | - | ||||||||||||||||||||||||||
| Restructuring provision | 7 | - | (7 | ) | (8) | - | - | - | - | - | ||||||||||||||||||||||||||
| Taxes, other than income taxes | 15 | - | - | 15 | 14 | - | - | 14 | ||||||||||||||||||||||||||||
| Insurance recovery | - | - | - | - | - | (1 | ) | (4) | - | (1 | ) | |||||||||||||||||||||||||
| Other net operating (income) losses | - | - | - | - | 3 | 1 | (4) | (4 | ) | (9,10) | - | |||||||||||||||||||||||||
| EBITDA | 320 | 58 | 80 | 458 | 436 | 53 | 34 | 523 | ||||||||||||||||||||||||||||
| Depreciation and amortization | 270 | 32 | (2,3) | - | 302 | 267 | 29 | (2,3) | - | 296 | ||||||||||||||||||||||||||
| Operating income | 50 | 26 | 80 | 156 | 169 | 24 | 34 | 227 | ||||||||||||||||||||||||||||
| Finance lease income | 26 | (26 | ) | (1) | - | - | 24 | (24 | ) | (1) | - | - | ||||||||||||||||||||||||
| Foreign exchange gain (loss) | (1 | ) | - | 1 | (12) | - | (7 | ) | - | - | (7 | ) | ||||||||||||||||||||||||
| Gain on sale of assets | - | - | - | - | 1 | - | (1 | ) | (11) | - | ||||||||||||||||||||||||||
| Earnings before interest and taxes | 75 | - | 81 | 156 | 187 | - | 33 | 220 | ||||||||||||||||||||||||||||
| Net interest expense | 119 | - | - | 119 | 128 | - | - | 128 | ||||||||||||||||||||||||||||
| Income tax expense (recovery) | 31 | - | (29 | ) | (13, 14,15,16) | 2 | 15 | - | (3 | ) | (13) | 12 | ||||||||||||||||||||||||
| Net earnings (loss) | (75 | ) | - | 110 | 35 | 44 | - | 36 | 80 | |||||||||||||||||||||||||||
| Non-controlling interests | 26 | - | 4 | (17) | 30 | 26 | - | - | 26 | |||||||||||||||||||||||||||
Net earnings (loss) attributable to TransAlta shareholders | (101 | ) | - | 106 | 5 | 18 | - | 36 | 54 | |||||||||||||||||||||||||||
| Preferred share dividends | 23 | - | - | 23 | 19 | - | - | 19 | ||||||||||||||||||||||||||||
Net earnings (loss) attributable to common shareholders | (124 | ) | - | 106 | (18 | ) | (1 | ) | - | 36 | 35 | |||||||||||||||||||||||||
Weighted average number of common shares outstanding in the period | 278 | 278 | 271 | 271 | ||||||||||||||||||||||||||||||||
Net earnings (loss) per share attributable to common shareholders | (0.45 | ) | (0.06 | ) | - | 0.13 | ||||||||||||||||||||||||||||||
M26 TRANSALTA CORPORATION / Q2 2015
FINANCIAL INSTRUMENTS
Refer to Note 13 of the notes to the audited annual consolidated financial statements within our 2014 Annual Report and Note 7 of our unaudited interim condensed consolidated financial statements as at and for the three and six months ended June 30, 2015 for details on Financial Instruments. Refer to the Risk Management section of our 2014 Annual Report and Note 8 of our unaudited interim condensed consolidated financial statements for further details on our risks and how we manage them. Our risk management profile and practices have not changed materially from Dec. 31, 2014.
We may enter into commodity transactions involving non-standard features for which market observable data is not available. These are defined under IFRS as Level III financial instruments. Level III financial instruments are not traded in an active market and fair value is, therefore, developed using valuation models based upon internally developed assumptions or inputs. Our
Level III fair values are determined using data such as unit availability, transmission congestion, or demand profiles.
Fair values are validated on a quarterly basis by using reasonably possible alternative assumptions as inputs to valuation techniques, and any material differences are disclosed in the notes to the financial statements.
We may also have various contracts with terms that extend beyond a liquid trading period. As forward market prices are not available for the full period of these contracts, the value of these contracts must be derived by reference to a forecast that is based on a combination of external and internal fundamental modeling, including discounting. As a result, these contracts are classified in Level III. These contracts are for specified prices with counterparties that we believe to be creditworthy.
At June 30, 2015, total Level III financial instruments had a net asset carrying value of $369 million (Dec. 31, 2014 - $217 million net asset). The increase during the period is attributable primarily to decreased estimated long-term power prices on a long-term power sale contract designated as an all-in-one cash flow hedge, for which changes in fair value are recognized in other comprehensive income.
LIQUIDITY AND CAPITAL RESOURCES
Liquidity risk arises from our ability to meet general funding needs, engage in trading and hedging activities, and manage the assets, liabilities, and capital structure of the Corporation. Liquidity risk is managed by maintaining sufficient liquid financial resources to fund obligations as they come due in the most cost-effective manner. Liquidity risk related to commodity risk management activities is managed by maintaining sufficient reserves and monitoring our counterparties and the markets in which we transact.
Our liquidity needs are met through a variety of sources, including cash generated from operations, availability under our long-term credit facilities, and long-term debt or equity issued under our Canadian and U.S. shelf registrations. Our primary uses of funds are operational expenses, capital expenditures, dividends, distributions to non-controlling interests, and interest and principal payments on debt securities.
Debt
Long-term debt totalled $4.1 billion as at June 30, 2015 compared to $4.0 billion as at Dec. 31, 2014. Long-term debt increased from Dec. 31, 2014 primarily due to strengthening of the U.S. dollar. As at June 30, 2015, $1.6 billion of our debt is denominated in U.S. dollars (Dec. 31, 2014 - $2.1 billion).
During the second quarter, we applied the net proceeds of $217 million received from TransAlta Renewables’ investment in the economic interest in our Australian portfolio to reduce our debt.
TRANSALTA CORPORATION / Q2 2015 M27
Almost all of our U.S.-denominated debt is hedged either through financial contracts or as a natural hedge of our net investment in our U.S. operations. For the three and six months ended June 30, 2015, the changes in our U.S.-denominated debt were offset as follows:
Three months ended June 30, 2015 | Six months ended June 30, 2015 | |||||||
Effects of foreign exchange on carrying amounts of U.S. operations (net investment hedge) | (10 | ) | 53 | |||||
| Foreign currency cash flow hedges on debt | (2 | ) | 67 | |||||
Effects of foreign exchange on value of U.S.-denominated Solomon finance lease | (9 | ) | 24 | |||||
| Other economic hedges | (10 | ) | 2 | |||||
| Total | (31 | ) | 146 | |||||
Credit Facilities
At June 30, 2015, we had a total of $2.1 billion (Dec. 31, 2014 - $2.1 billion) of committed credit facilities, of which $1.0 billion (Dec. 31, 2014 - $1.6 billion) is available, subject to customary borrowing conditions. At June 30, 2015, the $1.1 billion (Dec. 31, 2014 - $0.5 billion) of credit utilized under these facilities was comprised of actual drawings of $0.7 billion (Dec. 31, 2014 - $0.1 billion) and letters of credit of $0.4 billion (Dec. 31, 2014 - $0.4 billion). These facilities are comprised of a $1.5 billion committed syndicated bank facility that matures in 2019, with the remainder comprised of bilateral credit facilities, of which $0.3 billion matures in 2017 and $0.2 billion matures in the fourth quarter of 2016. We anticipate renewing these facilities, based on reasonable commercial terms, prior to their maturities.
In addition to the $1.0 billion available under the credit facilities, we have $71 million of available cash (Dec. 31, 2014 - $43 million).
Share Capital
On July 28, 2015, we had 280.6 million common shares outstanding, 12.0 million Series A, 11.0 million Series C, 9.0 million Series E, and 6.6 million Series G preferred shares outstanding. At June 30, 2015, we had 278.7 million (June 30, 2014 - 271.8 million) common shares issued and outstanding. At June 30, 2015, we had 38.6 million (June 30, 2014 - 32.0 million) first preferred shares issued and outstanding.
During the three and six months ended June 30, 2015, 1.7 million and 3.7 million, respectively (June 30, 2014 - 1.5 million and 3.6 million, respectively), common shares were issued to shareholders that elected dividend reinvestment, for a total of $18 million and $38 million, respectively (June 30, 2014 - $18 million and $46 million, respectively).
On July 21, 2015, we declared a quarterly dividend of $0.18 per common share, payable on Oct. 1, 2015. Declaration of dividends is at the discretion of the Board of Directors.
On July 21, 2015, we declared a quarterly dividend of $0.2875 per share on the Series A and Series C preferred shares, $0.3125 per share on the Series E preferred shares, and $0.33125 per share on the Series G preferred shares, all payable Sept. 30, 2015.
M28 TRANSALTA CORPORATION / Q2 2015
Letters of Credit and Cash Collateral
We have obligations to issue letters of credit and cash collateral to secure potential liabilities to certain parties, including those related to potential environmental obligations, commodity risk management and hedging activities, unfunded pension obligations, construction projects, and purchase obligations. At June 30, 2015, we provided letters of credit and cash collateral totalling $433 million (Dec. 31, 2014 - $421 million). These letters of credit and cash collateral secure certain amounts included on our Condensed Consolidated Statements of Financial Position for risk management liabilities, decommissioning and other provisions, and defined benefit obligations.
Financial Position
The following chart highlights significant changes in the Condensed Consolidated Statements of Financial Position from
Dec. 31, 2014 to June 30, 2015:
| Increase/ | ||||
| (decrease) | Primary factors explaining change | |||
| Cash and cash equivalents | 28 | Timing of receipts and payments and financing activities | ||
| Trade and other receivables | 61 | Timing of customer receipts, including seasonality of revenue and changes in collateral | ||
| Prepaid expenses | 37 | Prepayment of annual insurance premiums, royalties, and service agreements | ||
| Inventory | 60 | Increase in coal inventory at U.S. Coal and Canadian Coal following lower production | ||
| Finance lease receivables (long-term) | 22 | Favourable effects of changes in foreign exchange rates | ||
| Property, plant, and equipment, net | (12) | Depreciation for the period and asset retirements, partially offset by additions and favourable changes in foreign exchange rates | ||
| Deferred income tax assets | 33 | Effect of the internal reorganization associated with the Transaction | ||
| Risk management assets and liabilities (current and long-term), net | (27) | Losses on commodity and foreign currency cash flow hedges | ||
| Other | 81 | |||
| Total increase in assets | 283 | |||
| Accounts payable and accrued liabilities | (102) | Lower capital accruals and timing of payments and accruals | ||
| Credit facilities, long-term debt, and finance lease obligations (including current portion) | 157 | Unfavourable effects of changes in foreign exchange rates | ||
| Deferred income tax liabilities | 63 | Increase in Alberta Coporate tax rate and the effect of the internal reorganization associated with the Transaction | ||
| Equity attributable to shareholders | (134) | Net loss for the period, dividends declared in the period, and sale of investment in subsidiaries to Transalta Renewables, partially offset by gains on cash flow hedges and gains on translating net assets of foreign operations recognized in other comprehensive income, and issuance of common shares | ||
| Non-controlling interests | 219 | Net earnings for the period and sale of investment in subsidiaries to Transalta Renewables, partially offset by distributions paid and payable to non-controlling interests | ||
| Other | 80 | |||
| Total increase in liabilities and equity | 283 |
TRANSALTA CORPORATION / Q2 2015M29
Cash Flows
The following chart highlights significant changes in the Condensed Consolidated Statements of Cash Flows for the three and six months ended June 30, 2015 compared to the same periods in 2014:
| Three months ended June 30 | 2015 | 2014 | Primary factors explaining change | ||||||
Cash and cash equivalents, beginning of period | 61 | 37 | |||||||
| Provided by (used in): | |||||||||
| Operating activities | (39 | ) | 51 | Further decrease in working capital of $130 million, partially offset by an increase in cash earnings of $40 million | |||||
| Investing activities | (116 | ) | 126 | A decrease in proceeds on sale of investment of $218 million | |||||
| Financing activities | 165 | (120 | ) | Reduction in the net decrease in borrowings of $207 million and an increase in proceeds on the sale of non-controlling interest in subsidiary of $82 million | |||||
| Cash and cash equivalents, end of period | 71 | 94 | |||||||
| Six months ended June 30 | 2015 | 2014 | Primary factors explaining change | ||||||
Cash and cash equivalents, beginning of period | 43 | 42 | |||||||
| Provided by (used in): | |||||||||
| Operating activities | 114 | 330 | Further decrease in working capital of $221 million | ||||||
| Investing activities | (259 | ) | 21 | A decrease in proceeds on sale of investment of $218 million and an increase in additions to PP&E of $67 million | |||||
| Financing activities | 172 | (300 | ) | Reduction in the net decrease in borrowings of $320 million, an increase in proceeds on the sale of non-controlling interest in subsidiary of $82 million, and an increase in realized gains on financial instruments of $54 million | |||||
| Translation of foreign currency cash | 1 | 1 | |||||||
| Cash and cash equivalents, end of period | 71 | 94 | |||||||
CLIMATE CHANGE AND THE ENVIRONMENT
Environmental issues and related legislation have, and will continue to have, an impact upon our business. We are committed to complying with legislative and regulatory requirements and to minimizing the environmental impact of our operations. We work with governments and the public to develop appropriate frameworks to protect the environment and to promote sustainable development. Refer to the Climate Change and the Environment section of our 2014 Annual MD&A for further details.
M30 TRANSALTA CORPORATION / Q2 2015
Recent Regulatory Developments
Alberta
On June 29, 2015, the Alberta Government announced changes to its provincial greenhouse gas (“GHG”) regulation, referred to as the SGER. Specifically, the government announced a scheduled increase in the carbon levy as follows:
| ▪ | On Jan 1, 2016, an increase in the GHG reduction obligation for large emitters from 12 per cent to 15 per cent of emissions, with the compliance price of the technology fund rising from $15 per tonne to $20 per tonne. | |
| ▪ | On Jan. 1, 2017, a further increase to a 20 per cent reduction requirement and a $30 per tonne compliance price. |
At the same time, the Alberta Government announced an intention to develop a broader climate change program which could result in greater emissions reductions over time. That program is expected to be developed by the fall of 2015 through consultations with Albertans and advice from an independent expert panel. It is not clear at this time if this broader climate change program will supplant the SGER framework, or be incremental to it.
The increased compliance costs of the extended SGER program is not anticipated to have a material impact on TransAlta in the next five years, as a significant portion of these costs are passed though under the change-in-law provisions of our PPAs. Additionally, the GHG offsets created by our Alberta wind facilities are expected to increase in value through 2017, as greenhouse gas emitters can use them as compliance instruments in place of contributing to the technology fund.
Ontario
On April 13, 2015, the Ontario Government announced that Ontario will be implementing a GHG cap-and-trade system in an effort to reduce emissions and fight climate change. The cap and trade system will impose a hard ceiling on the GHG emissions allowed in each sector of the economy. The details of the cap and trade system (such as specifics on a potential cap, covered sectors, or anticipated launch date) have not been determined but are to be developed through stakeholder consultations. Our contracts at Gas facilities in the province generally include provisions protecting us from adverse changes in laws.
2015 OUTLOOK
Market
Power Prices
For the balance of 2015, power prices in Alberta are expected to be comparable or lower than 2014 as a result of increased supply and lower natural gas prices. However, prices can vary based on supply and weather conditions. In the Pacific Northwest, following lower prices in the first quarter, we expect prices to settle lower than in 2014 due to lower natural gas prices. In Ontario, we expect prices to be comparable to 2014 as baseload generation outages will offset lower natural gas prices.
TRANSALTA CORPORATION / Q2 2015 M31
Economic Environment
We expect growth to decelerate in Western Canada in 2015. The slowdown in the oil and gas sector is expected to reduce economic growth as a result of investment slowdown and lower consumer spending. After several years of weak growth, economic growth in the Pacific Northwest is expected to accelerate as the overall economic recovery in the U.S. gains strength. Growth in Ontario is expected to improve to moderate rates in 2015, driven largely by exports supported by the U.S. recovery and the strengthening U.S. dollar.
We had no material counterparty losses in the second quarter of 2015. We continue to monitor counterparty credit risk and have established risk management policies to mitigate counterparty risk. We do not anticipate any material change to our existing credit practices and continue to deal primarily with investment grade counterparties.
Operations
Capacity, Production, and Availability
Generating capacity is expected to increase in 2015 primarily due to the full commissioning of operations at our Solomon power station in Australia. Overall production is expected to decrease three to four per cent in 2015 due to a longer period of economic dispatching at our U.S. Coal facility and higher unplanned outages at Canadian Coal. Overall adjusted availability is still expected to be in the range of 89 to 91 per cent in 2015 but more likely at the lower end of the range.
Contracted Cash Flows
As a result of Alberta PPAs, long-term contracts, and other short-term physical and financial contracts, on average, approximately 75 per cent of our capacity is contracted over the period to the end of 2020. On an aggregated portfolio basis, depending on market conditions, we target being up to 90 per cent contracted for the upcoming calendar year. As at the end of 2014, approximately 88 per cent of our 2015 capacity was contracted. The average prices of our short-term physical and financial contracts for 2015 are approximately $50 per megawatt hour (“MWh”) in Alberta and approximately U.S.$40 per MWh in the Pacific Northwest. The average Alberta contract prices have been reduced from the previously reported $55 per MWh as a result of the addition of more recent hedges at lower prices.
Fuel Costs
Mining coal in Alberta is subject to cost increases due to greater overburden removal, inflation, capital investments, and commodity prices. Seasonal variations in coal costs at our Alberta mine are minimized through the application of standard costing. Coal costs for 2015, on a standard cost per tonne basis, are expected to be two to three per cent lower than 2014 unit costs.
In the Pacific Northwest, our U.S. Coal mine, adjacent to our power plant, is being reclaimed. Fuel at U.S. Coal is purchased primarily from external suppliers in the Powder River Basin and delivered by rail. The delivered cost of fuel per MWh for 2015 is expected to increase by approximately two to three per cent as a result of inflation in accordance with our contracts.
The value of coal inventories is assessed for impairment at the end of each reporting period. If the inventory is impaired, further charges are recognized in net earnings.
We purchase natural gas from outside companies coincident with production or have it supplied by our customers, thereby minimizing our risk to changes in prices. The continued success of unconventional gas production in North America could reduce the year-to-year volatility of prices in the near term.
M32 TRANSALTA CORPORATION / Q2 2015
We closely monitor the risks associated with changes in electricity and input fuel prices on our future operations and, where we consider it appropriate, use various physical and financial instruments to hedge our assets and operations from such price risks.
Energy Marketing
Earnings from our Energy Marketing Segment are affected by prices and volatility in the market, overall strategies adopted, and changes in legislation. We continuously monitor both the market and our exposure to maximize earnings while maintaining an acceptable risk profile. Our 2015 objective for Energy Marketing is to contribute between $50 million to $70 million in gross margin for the year. Following lower than expected earnings in the year through June 30, 2015, our revised 2015 objective for Energy Marketing is to contribute between $40 million to $60 million in gross margin for the year.
Exposure to Fluctuations in Foreign Currencies
Our strategy is to minimize the impact of fluctuations in the Canadian dollar against the U.S. dollar, Euro, and Australian dollar by offsetting foreign-denominated assets with foreign-denominated liabilities and by entering into foreign exchange contracts. We also have foreign-denominated expenses, including interest charges, which largely offset our foreign-denominated revenues.
Net Interest Expense
Net interest expense for 2015 is expected to be lower than in 2014 due to lower debt levels and higher capitalized interest. However, changes in interest rates and in the value of the Canadian dollar relative to the U.S. dollar can affect the amount of net interest expense incurred.
Liquidity and Capital Resources
We expect to maintain adequate available liquidity under our committed credit facilities.
Income Taxes
The comparable effective tax rate on earnings for 2015 is expected to be approximately 17 to 22 per cent, which is lower than the statutory tax rate of 25.87 per cent, due to changes in the amount of earnings between the jurisdictions in which pre-tax income is earned and the effect of certain deductions that do not fluctuate with earnings.
TRANSALTA CORPORATION / Q2 2015 M33
Capital Expenditures
Our projects are focused on sustaining our current operations and supporting our growth strategy.
Growth and Major Project Expenditures
A summary of the significant growth and major projects that are in progress is outlined below:
| Total Project | 2015 | Target (actual) | |||||||||||||||||||
| Estimated spend | Spent to date(1) | Estimated spend | Spent to date(1) | completion date | Details | ||||||||||||||||
| Project | |||||||||||||||||||||
South Hedland Power Station(2) | 566 | 135 | 172 | 66 | Q2 2017 | 150 MW combined cycle power plant | |||||||||||||||
Australia natural gas pipeline(3) | 98 | 94 | 21 | 17 | (Q1 2015 | ) | 270 kilometre pipeline to supply natural gas to our Solomon power station in Western Australia | ||||||||||||||
Solomon load bank facility(3) | 5 | 2 | 5 | 2 | Q3 2015 | Installation of 20 MW load bank facility required to complete the Solomon power station | |||||||||||||||
| Transmission | 17 | 4 | 15 | 2 | Q4 2015 | Regulated transmission that receives a return on investment | |||||||||||||||
| Total | 686 | 235 | 213 | 87 | |||||||||||||||||
1
The total estimated project spend for transmission increased by $4 million during the first quarter due to changes in scope relating to an increase in line rebuilds, structure replacements, contractor pricing, and substation equipment replacement. Incremental spend is anticipated to give rise to incremental regulated revenues.
________________
| (1) | Represents amounts spent as of June 30, 2015. |
| (2) | Estimated project spend is AUD$570 million. Total estimated project spend is stated in CAD$ and includes estimated capitalized interest costs. The total estimated project spend may change due to fluctuations in foreign exchange rates. |
| (3) | Includes certain natural gas conversion costs at the Solomon power station that will be recognized as a finance lease receivable. The total estimated project spend may change due to fluctuations in foreign exchange rates. |
M34 TRANSALTA CORPORATION / Q2 2015
Sustaining and Productivity Expenditures(1)
Our estimate for total sustaining and productivity capital is allocated among the following:
| Category | Description | Expected cost | Spent to date(1) | |||||||
Routine capital(2) | Capital required to maintain our existing generating capacity | 100 - 110 | 48 | |||||||
| Planned major maintenance | Regularly scheduled major maintenance | 165 - 175 | 107 | |||||||
| Mining capital | Capital related to mining equipment and land purchases | 20 - 25 | 12 | |||||||
| Finance leases | Payments on finance leases | 10 - 15 | 7 | |||||||
| Total sustaining capital excluding flood-recovery capital | 295 - 325 | 174 | ||||||||
| Flood-recovery capital | Capital arising from the 2013 Alberta flood | 25 - 30 | - | |||||||
| Total sustaining capital | 320 - 355 | 174 | ||||||||
| Productivity capital | Projects to improve power production efficiency and corporate improvement initiatives | 5 - 10 | 4 | |||||||
| Total sustaining and productivity capital | 325 - 365 | 178 | ||||||||
We continue to anticipate that most flood-recovery capital expenditures related to the Alberta flood in 2013 will be recovered from third parties.
As a result of lower generation from our U.S. Coal assets we decided to defer a planned major maintenance outage at one of our units at the U.S. Coal generating facility, reducing our estimated sustaining capital for the current year by over $15 million.
The expected cost of planned major maintenance for the year includes approximately $13 million associated with major maintenance at Poplar Creek, set to be incurred prior to the close of the contractual restructuring described in the Significant and Subsequent Events section of this document. Our customer will assume capital obligations of the facility arising after closing, and on an ongoing basis thereafter.
Lost production as a result of planned major maintenance, excluding planned major maintenance for U.S. Coal, which was scheduled during a period of economic dispatching, was estimated as follows for 2015:
| Coal | Gas and Renewables | Total | Lost to date(3) | |||||||||||||
| GWh lost | 1,144 - 1,154 | 220 - 230 | 1,364 - 1,384 | 1,100 | ||||||||||||
During the quarter, we increased the estimated GWh lost for the year as a result of the extended planned outage at Sundance 3.
__________________
| (1) | Represents amounts spent as of June 30, 2015. |
| (2) | Includes expected hydro life extension costs of $17 million and actual amounts spent to date of $10 million, respectively. |
| (3) | As of June 30, 2015. |
TRANSALTA CORPORATION / Q2 2015 M35
Financing
Financing for these capital expenditures is expected to be provided by cash flow from operating activities, existing borrowing capacity, dividends reinvested, sale of economic interests in assets or transfers to TransAlta Renewables, and capital markets. The funds required for committed growth, sustaining capital, and productivity projects are not expected to be significantly impacted by the current economic environment due to the highly contracted nature of our cash flows, our financial position, and the amount of capital available to us under existing committed credit facilities.
CURRENT ACCOUNTING CHANGES
Operating and Reportable Segments
In January 2015, we completed changes to our internal reporting to systematize allocations of certain costs to each fuel type within our Generation Segment. This permitted internal reports regularly provided to the chief operating decision maker to be presented at the disaggregated fuel type level. Accordingly, commencing with first quarter 2015 reporting, we consider the following distinct fuel types as reportable segments: Canadian Coal, U.S. Coal, Gas, Wind, and Hydro. Previously, these were collectively reported as the Generation Segment. Comparative results for the second quarter 2014 have been restated to align with the re-segmentation: general expenditures of the Generation Segment were allocated to each fuel type segment based on estimated relative benefit derived from those expenditures and for the three and six months ended June 30, 2015, $5 million and $9 million, respectively, in expenditures associated with certain functions that were determined to benefit the broader organization were reassigned to the Corporate Segment from the Canadian Coal, Gas, Wind, and Hydro Segments. No changes arose in respect of our Energy Marketing Segment.
Management has exercised judgment in aggregating our Canadian gas and Australian gas operating segments together into a single reportable segment, Gas. The operating segments were determined to share the following similar economic characteristics: nature of revenue sources, level of contractedness, and customer assumption of fuel and regulatory compliance costs. In addition, the Canadian gas and Australian gas operating segments share substantial similarity in products (energy), processes (gas turbines), customers (industrial and regional utilities) and distribution methods (connection to grid or behind-the-fence generation).
Change in Estimates - Useful Lives
During the first quarter of 2015, our subsidiary TransAlta Cogeneration L.P. executed a new 15-year power supply contract with Ontario’s IESO for the Windsor facility, which is effective Dec. 1, 2016. Accordingly, the useful life of the Windsor facility was extended prospectively to Nov. 30, 2031. As a result, depreciation expense for the three six and months ended June 30, 2015 decreased by $2 million and $3 million, respectively, and the full year 2015 depreciation expense is expected to be lower by $8 million.
FUTURE ACCOUNTING CHANGES
Accounting standards that have been previously issued by the International Accounting Standards Board (“IASB”) but are not yet effective, and which we have not yet applied include IFRS 9 Financial Instruments and IFRS 15 Revenue from Contracts with Customers. Refer to the Future Accounting Changes section of our 2014 Annual MD&A for information regarding the requirements of IFRS 9 and IFRS 15.
M36 TRANSALTA CORPORATION / Q2 2015
IFRS 9 is effective for annual periods beginning on or after Jan. 1, 2018 and IFRS 15 is effective for annual periods beginning on or after Jan. 1, 2017. Early application is permitted for both.
In May 2015 the IASB proposed a deferral of the effective date of IFRS 15 by one year to Jan. 1, 2018 and on July 22, 2015, the IASB voted to confirm the one year deferral.
We continue to assess the impact of adopting these standards on the consolidated financial statements.
SELECTED QUARTERLY INFORMATION
| Q3 2014 | Q4 2014 | Q1 2015 | Q2 2015 | |||||||||||||
| Revenue | 639 | 718 | 593 | 438 | ||||||||||||
| Comparable EBITDA | 212 | 301 | 275 | 183 | ||||||||||||
| Comparable FFO | 145 | 225 | 211 | 160 | ||||||||||||
| Net earnings (loss) attributable to common shareholders | (6 | ) | 148 | 7 | (131 | ) | ||||||||||
| Comparable net earnings (loss) attributable to common shareholders | (13 | ) | 46 | 26 | (44 | ) | ||||||||||
Net earnings (loss) per share attributable to common shareholders, basic and diluted | (0.03 | ) | 0.54 | 0.03 | (0.47 | ) | ||||||||||
| Comparable net earnings (loss) per share, basic and diluted | (0.05 | ) | 0.17 | 0.09 | (0.16 | ) | ||||||||||
| Q3 2013 | Q4 2013 | Q1 2014 | Q2 2014 | |||||||||||||
| Revenue | 623 | 587 | 775 | 491 | ||||||||||||
| Comparable EBITDA | 266 | 242 | 310 | 213 | ||||||||||||
| Comparable FFO | 174 | 179 | 238 | 154 | ||||||||||||
| Net earnings (loss) attributable to common shareholders | (9 | ) | (66 | ) | 49 | (50 | ) | |||||||||
| Comparable net earnings attributable to common shareholders | 39 | 1 | 47 | (12 | ) | |||||||||||
Net earnings (loss) per share attributable to common shareholders, basic and diluted | (0.03 | ) | (0.25 | ) | 0.18 | (0.18 | ) | |||||||||
| Comparable net earnings per share, basic and diluted | 0.15 | 0.00 | 0.17 | (0.04 | ) |
Basic and diluted earnings per share attributable to common shareholders and comparable earnings per share are calculated each period using the weighted average common shares outstanding during the period. As a result, the sum of the earnings per share for the four quarters making up the calendar year may sometimes differ from the annual earnings per share.
Comparable net earnings is generally higher in the first and fourth quarters due to higher demand associated with winter cold in the markets in which we operate. The third quarter of 2013 benefitted from high Alberta prices, offsetting some of the impacts of unplanned outages at Canadian Coal during the period. In 2014, Canadian Coal improved its operational performance, with the third and fourth quarters also including reductions in coal costs. Some of these gains compared to the same periods in the previous year were offset by a downward trend in Alberta prices, starting from the second quarter of 2013 and continuing into the first quarter of 2015. Market volatility can also impact quarterly contributions from our Energy Marketing Segment, as the first quarter of 2014 benefitted from exceptional weather conditions in northeastern North America, with the subsequent two quarters seeing muted volatility and reduced contribution from the Segment. Following public offerings of TransAlta Renewables Common Shares in the second quarter of 2014 and 2015, an increasing portion of earnings is attributable to non-controlling interests.
Revenue is impacted by market and operational factors listed above, and by changes in future power prices in the Pacific Northwest, which cause de-designated and economic hedges in the region to fluctuate in value. These hedges significantly depreciated in the fourth quarter of 2013, in the second quarter of 2014, and in the first half of 2015, and significantly increased in value over the second half of 2014.
TRANSALTA CORPORATION / Q2 2015 M37
Net earnings attributable to common shareholders have also been impacted by the following events:
| ▪ | writedown of deferred tax assets, in the third quarter of 2013 and the first quarter of 2015; | |
| ▪ | change in income tax rates in Alberta and deferred income tax impacts of the Transaction in the second quarter of 2015; | |
| ▪ | loss associated with the California claim, in the fourth quarter of 2013. |
Amounts per share reflect these fluctuations, with between approximately one to two million shares issued in each quarter over the last eight quarters.
DISCLOSURE CONTROLS AND PROCEDURES
Management has evaluated, with the participation of our Chief Executive Officer and Chief Financial Officer, the effectiveness of our disclosure controls and procedures as of the end of the period covered by this report. Disclosure controls and procedures refer to controls and other procedures designed to ensure that information required to be disclosed in the reports we file or submit under the Securities Exchange Act of 1934, as amended (“Exchange Act”) are recorded, processed, summarized, and reported within the time periods specified in the rules and forms of the U.S. Securities and Exchange Commission. Disclosure controls and procedures include, without limitation, controls and procedures designed to ensure that information required to be disclosed by us in our reports that we file or submit under the Exchange Act is accumulated and communicated to management, including our Chief Executive Officer and Chief Financial Officer, as appropriate to allow timely decisions regarding our required disclosure. In designing and evaluating our disclosure controls and procedures, management recognizes that any controls and procedures, no matter how well designed and operated, can provide only reasonable assurance of achieving the desired control objectives, and management is required to apply its judgment in evaluating and implementing possible controls and procedures.
There has been no change in the internal control over financial reporting during the period covered by this report that has materially affected, or is reasonably likely to materially affect, our internal control over financial reporting. Based on the foregoing evaluation, our Chief Executive Officer and Chief Financial Officer have concluded that, as of June 30, 2015, the end of the period covered by this report, our disclosure controls and procedures were effective at a reasonable assurance level.
M38 TRANSALTA CORPORATION / Q2 2015
SUPPLEMENTAL INFORMATION
| June 30, 2015 | Dec. 31, 2014 | |||||||||
| Closing market price (TSX) ($) | 9.68 | 10.52 | ||||||||
| Price range for the last 12 months (TSX) ($) | High | 13.14 | 14.94 | |||||||
| Low | 9.68 | 9.81 | ||||||||
| Adjusted net debt to invested capital (%) | 56.4 | 56.3 | ||||||||
Adjusted net debt to invested capital excluding non-recourse debt(1) (%) | 54.2 | 54.1 | ||||||||
Adjusted net debt to comparable EBITDA(2) (times) | 4.7 | 4.2 | ||||||||
Return on equity attributable to common shareholders(2) (%) | 0.9 | 6.3 | ||||||||
Comparable return on equity attributable to common shareholders(1), (2) (%) | 0.7 | 3.0 | ||||||||
Return on capital employed(2) (%) | 4.2 | 5.8 | ||||||||
Comparable return on capital employed(1), (2) (%) | 4.1 | 5.1 | ||||||||
Cash dividends per share(2) ($) | 0.72 | 0.83 | ||||||||
Earnings coverage(2) (times) | 1.3 | 1.7 | ||||||||
Dividend payout ratio based on comparable funds from operations(1), (2) (%) | 27.7 | 26.4 | ||||||||
Dividend yield(2) (%) | 7.4 | 7.9 | ||||||||
Adjusted comparable FFO to adjusted net debt(2) (%) | 15.9 | 16.9 | ||||||||
Comparable FFO before interest to adjusted interest coverage(2) (times) | 3.8 | 3.8 | ||||||||
| (1) | These ratios incorporate items that are not defined under IFRS. None of these measurements should be used in isolation or as a substitute for the Corporation’s reported financial performance or position as presented in accordance with IFRS. These ratios are useful complementary measurements for assessing the Corporation’s financial performance, efficiency, and liquidity and are common in the reports of other companies but may differ by definition and application. For a reconciliation of the Non-IFRS measures used in this calculation, refer to the Non-IFRS Measures section of this MD&A. |
| (2) | Last 12 months. |
RATIO FORMULAS
Adjusted net debt to invested capital = long-term debt and finance lease obligations including current portion and fair value (asset) liability of hedging instruments on debt + 50 per cent issued preferred shares - cash and cash equivalents/ long-term debt including current portion + non-controlling interests + equity attributable to shareholders - 50 per cent issued preferred shares - cash and cash equivalents
Adjusted net debt to comparable EBITDA = long-term debt and finance lease obligations including current portion and fair value (asset) liability of hedging instruments on debt - cash and cash equivalents + 50 per cent issued preferred shares / comparable EBITDA
Return on equity attributable to common shareholders = net earnings attributable to common shareholders or earnings on a comparable basis / equity attributable to common shareholders excluding AOCI
Return on capital employed = earnings before non-controlling interests and income taxes + net interest expense or comparable earnings before
non-controlling interests and income taxes + net interest expense / invested capital excluding AOCI
Earnings coverage = net earnings attributable to shareholders + income taxes + net interest expense / interest on debt + 50 per cent dividends paid on preferred shares - interest income
Dividend payout ratio = common share dividends / funds from operations - 50 per cent dividends paid on preferred shares
Dividend yield = dividend per common share / current period’s closing market price
Adjusted comparable funds from operations to adjusted net debt = comparable funds from operations - 50 per cent dividends paid on preferred shares/ period end long-term debt and finance lease obligations including fair value (asset) liability of hedging instruments on debt + 50 per cent issued preferred shares - cash and cash equivalents
Comparable funds from operations before interest to adjusted interest coverage = comparable funds from operations + interest on debt - interest income - capitalized interest / interest on debt + 50 per cent dividends paid on preferred shares - interest income
TRANSALTA CORPORATION / Q2 2015 M39
GLOSSARY OF KEY TERMS
Availability - A measure of the time, expressed as a percentage of continuous operation 24 hours a day, 365 days a year that a generating unit is capable of generating electricity, regardless of whether or not it is actually generating electricity.
Capacity - The rated continuous load-carrying ability, expressed in megawatts, of generation equipment.
Force Majeure - Literally means “greater force”. These clauses excuse a party from liability if some unforeseen event beyond the control of that party prevents it from performing its obligations under the contract.
Gigawatt - A measure of electric power equal to 1,000 megawatts.
Gigawatt Hour (GWh) - A measure of electricity consumption equivalent to the use of 1,000 megawatts of power over a period of one hour.
Greenhouse Gas (GHG) - Gases having potential to retain heat in the atmosphere, including water vapour, carbon dioxide, methane, nitrous oxide, hydrofluorocarbons, and perfluorocarbons.
Megawatt (MW) - A measure of electric power equal to 1,000,000 watts.
Megawatt Hour (MWh) - A measure of electricity consumption equivalent to the use of 1,000,000 watts of power over a period of one hour.
Power Purchase Arrangement (PPA) - A long-term arrangement established by regulation for the sale of electric energy from formerly regulated generating units to buyers.
Unplanned Outage - The shut down of a generating unit due to an unanticipated breakdown.
M40 TRANSALTA CORPORATION / Q2 2015
TransAlta Corporation
110 - 12th Avenue S.W.
Box 1900, Station “M”
Calgary, Alberta Canada T2P 2M1
110 - 12th Avenue S.W.
Box 1900, Station “M”
Calgary, Alberta Canada T2P 2M1
Phone
403.267.7110
403.267.7110
Website
www.transalta.com
CST Trust Company
www.transalta.com
CST Trust Company
P.O. Box 700 Station “B”
Montreal, Québec Canada H3B 3K3
Phone
Toll-free in North America: 1.800.387.0825
Toronto or outside North America: 416.682.3860
Toll-free in North America: 1.800.387.0825
Toronto or outside North America: 416.682.3860
Fax
514.985.8843
514.985.8843
E-mail
inquiries@canstockta.com
Website
www.canstockta.com
FOR MORE INFORMATION
www.canstockta.com
FOR MORE INFORMATION
Media and Investor Inquiries
Investor Relations
Phone
1.800.387.3598 in Canada and United States
or 403.267.2520
1.800.387.3598 in Canada and United States
or 403.267.2520
Fax
403.267.7405
403.267.7405
E-mail
investor_relations@transalta.com
investor_relations@transalta.com
TRANSALTA CORPORATION / Q2 2015 M41