
TRANSALTA CORPORATION
Management’s Discussion and Analysis
Third Quarter Report for 2022
This Management’s Discussion and Analysis (“MD&A”) contains forward-looking statements. These statements are based on certain estimates and assumptions and involve risks and uncertainties. Actual results may differ materially. Refer to the Forward-Looking Statements section of this MD&A for additional information.
Table of Contents
| Forward-Looking Statements | M2 | ||||
| Description of the Business | M4 | ||||
| Highlights | M5 | ||||
| Significant and Subsequent Events | M8 | ||||
| Performance by Segment with Supplemental Geographical Information | M11 | ||||
| Alberta Electricity Portfolio | M12 | ||||
| Segmented Financial Performance and Operating Results | M14 | ||||
| Selected Quarterly Information | M23 | ||||
| Strategy and Capability to Deliver Results | M25 | ||||
| 2022 Financial Outlook | M29 | ||||
| Financial Position | M31 | ||||
| Financial Capital | M33 | ||||
| Other Consolidated Analysis | M36 | ||||
| Cash Flows | M38 | ||||
| Financial Instruments | M38 | ||||
| Additional IFRS Measures and Non-IFRS Measures | M39 | ||||
| Financial Highlights on a Proportional Basis of TransAlta Renewables | M48 | ||||
| Key Non-IFRS Financial Ratios | M50 | ||||
| Critical Accounting Policies and Estimates | M54 | ||||
| Accounting Changes | M55 | ||||
| Governance and Risk Management | M56 | ||||
| Regulatory Updates | M57 | ||||
| Disclosure Controls and Procedures | M58 | ||||
TRANSALTA CORPORATION M1
Management’s Discussion and Analysis
Forward-Looking Statements
This MD&A includes "forward-looking information" within the meaning of applicable Canadian securities laws and "forward-looking statements" within the meaning of applicable United States ("US") securities laws, including the US Private Securities Litigation Reform Act of 1995 (collectively referred to herein as "forward-looking statements"). All forward-looking statements are based on our beliefs as well as assumptions based on information available at the time the assumptions were made and on management's experience and perception of historical trends, current conditions and expected future developments, as well as other factors deemed appropriate in the circumstances. Forward-looking statements are not facts, but only predictions and generally can be identified by the use of statements that include phrases such as "may," "will," "can," "could," "would," "shall," "believe," "expect," "estimate," "anticipate," "intend," "plan," "forecast," "foresee," "potential," "enable," "continue" or other comparable terminology. These statements are not guarantees of our future performance, events or results and are subject to risks, uncertainties and other important factors that could cause our actual performance, events or results to be materially different from that set out in or implied by the forward-looking statements.
In particular, this MD&A contains forward-looking statements including, but not limited to, statements relating to: our Clean Electricity Growth Plan and ability to achieve the target of 2 gigawatts ("GW") of incremental renewables capacity with an estimated capital investment of $3 billion that is expected to deliver incremental average annual EBITDA of $250 million; the Company's projects under construction, including the timing of commercial operations, expected annual EBITDA and associated costs, including the Horizon Hill wind project ("Horizon Hill wind project"), the White Rock East and White Rock West wind power projects ("White Rock wind projects"), Northern Goldfields solar project, Garden Plain wind project and the Mount Keith 132kV transmission expansion; the execution of the Company's early and advanced stage development pipeline, including the size, cost and expected EBITDA from such projects; the expansion of the Company's early stage development pipeline to 5 GW; the proportion of EBITDA to be generated from renewable sources by the end of 2025; the 2022 Financial Outlook (defined below), including adjusted EBITDA and free cash flow; the Company's ability to enhance shareholder value through its NCIB (as defined below); the reduction of carbon emissions by 75 per cent from 2015 emissions levels by 2026; the remediation of the Kent Hills 1 and 2 wind facilities, including, the timing and cost of such remediation, the resulting impact of such remediation on the Company's revenues and the potential battery storage project at and repowering of, the Kent Hills facilities; the expected impact and quantum of carbon compliance costs; the ability to realize future growth opportunities with BHP (as defined below); regulatory developments and their expected impact on the Company, including the Canadian federal climate plan and the implementation of the major aspects thereof (including increased carbon pricing and increased funding for clean technology), the proposed new Clean Electricity Regulation, the Clean Fuel Regulations and Canadian Greenhouse Gas Offset Credit System Regulations and the ability of the Company to realize benefits from Canadian, United States and Australian regulatory developments, including receiving funding for clean electricity projects; the potential increase in value of emission reduction credits; sustaining and productivity capital in 2022; expected power prices in Alberta, Ontario and the Pacific Northwest; AECO gas price assumptions; the cyclicality of the business, including as it relates to maintenance costs, production and loads; expectations regarding refinancing the debt maturing in 2022; and the Company continuing to maintain a strong financial position and significant liquidity without any significant impact from the current economic environment.
The forward-looking statements contained in this MD&A are based on many assumptions including, but not limited to, the following: no significant changes to applicable laws and regulations beyond those that have already been announced; no significant changes to fuel and purchased power costs; no material adverse impacts to the long-term investment and credit markets; no significant changes to power price and hedging assumptions including, Alberta spot prices of $125/MWh to $150/MWh in 2022 and Mid-Columbia spot prices of US$55/MWh to US$65/MWh in 2022; AECO gas prices of between $5.00/GJ and $6.00/GJ; sustaining capital of $145 million to $155 million; Energy Marketing adjusted gross margin of $145 to $160 million; no significant changes to gas commodity prices and transport costs; the Company's proportionate ownership of TransAlta Renewables Inc. ("TransAlta Renewables") not changing materially; no decline in the dividends to be received from TransAlta Renewables; and the impacts arising from COVID-19 not becoming significantly more onerous on the Company.
Forward-looking statements are subject to a number of significant risks and uncertainties that could cause actual plans, performance, results or outcomes to differ materially from current expectations. Factors that may adversely impact what is expressed or implied by forward-looking statements contained in this MD&A include risks relating to: increased force majeure claims; reduced labour availability and ability to continue to staff our operations and facilities; disruptions to our supply chains, including our ability to secure necessary
TRANSALTA CORPORATION M2
Management’s Discussion and Analysis
equipment; our ability to obtain regulatory and any other third party approvals on the expected timelines or at all in respect of our growth projects; risks associated with development and construction projects, including as it pertains to increased capital costs, permitting, labour and engineering risks and potential delays in the construction or commissioning of such projects; restricted access to capital and increased borrowing costs; changes in short-term and long-term electricity supply and demand; fluctuations in market prices, including lower merchant pricing in Alberta, Ontario and Mid-Columbia; reductions in production; a higher rate of losses on our accounts receivable; impairments and/or write-downs of assets; adverse impacts on our information technology systems and our internal control systems, including increased cybersecurity threats; commodity risk management and energy trading risks, including the effectiveness of the Company’s risk management tools associated with hedging and trading procedures to protect against significant losses; changes in demand for electricity and capacity and our ability to contract our generation for prices that will provide expected returns and replace contracts as they expire; changes to the legislative, regulatory and political environments in the jurisdictions in which we operate; environmental requirements and changes in, or liabilities under, these requirements; disruptions in the transmission and distribution of electricity; the effects of weather, including man made or natural disasters and other climate-change related risks; increases in costs; reductions to our generating units’ relative efficiency or capacity factors; disruptions in the source of fuels, including natural gas, water, solar or wind resources required to operate our facilities; operational risks, unplanned outages and equipment failure and our ability to carry out or have completed any repairs in a cost-effective or timely manner or at all, including as it applies to the remediation and replacement of turbine foundations of the Kent Hills 1 and 2 wind facilities; general economic risks, including deterioration of equity markets, increasing interest rates or rising inflation; failure to meet financial expectations; general domestic and international economic and political developments; armed hostilities, including the war in Ukraine and associated impacts; the threat of terrorism; adverse diplomatic developments or other similar events that could adversely affect our business; industry risk and competition; fluctuations in the value of foreign currencies; structural subordination of securities; counterparty credit risk; changes to our relationship with, or ownership of, TransAlta Renewables; changes in the payment or receipt of future dividends, including from TransAlta Renewables; inadequacy or unavailability of insurance coverage; our provision for income taxes and any risk of reassessment; legal, regulatory and contractual disputes and proceedings involving the Company; reliance on key personnel; labour relations matters; and the impact of COVID-19. The foregoing risk factors, among others, are described in further detail in the Governance and Risk Management section of our 2021 Annual MD&A and the Risk Factors section in our AIF for the year ended Dec. 31, 2021.
Readers are urged to consider these factors carefully in evaluating the forward-looking statements, which reflect the Company's expectations only as of the date hereof and are cautioned not to place undue reliance on them. The forward-looking statements included in this document are made only as of the date hereof and we do not undertake to publicly update these forward-looking statements to reflect new information, future events or otherwise, except as required by applicable laws. The purpose of the financial outlooks contained herein is to give the reader information about management's current expectations and plans and readers are cautioned that such information may not be appropriate for other purposes. In light of these risks, uncertainties and assumptions, the forward-looking statements might occur to a different extent or at a different time than we have described, or might not occur at all. We cannot assure that projected results or events will be achieved.
TRANSALTA CORPORATION M3
Management’s Discussion and Analysis
Description of the Business
Portfolio of Assets
TransAlta is a Canadian corporation and one of Canada's largest publicly traded power generators with over 111 years of operating experience. We own, operate and manage a geographically diversified portfolio of assets utilizing a broad range of fuels that includes water, wind, solar, natural gas and battery storage.
The following table provides our consolidated ownership of our facilities across the regions in which we operate as at Sept. 30, 2022:
| As at Sept. 30, 2022 | Hydro | Wind and Solar | Gas(5) | Energy Transition(6) | Total | |||||||||||||||||||||
| Alberta | Gross installed capacity (MW)(1) | 834 | 636 | 1,960 | — | 3,430 | ||||||||||||||||||||
| Number of facilities | 17 | 13 | 7 | — | 37 | |||||||||||||||||||||
Weighted average contract life(2)(3)(4) | — | 6 | 1 | — | 2 | |||||||||||||||||||||
| Canada, Excl. Alberta | Gross installed capacity (MW)(1) | 91 | 751 | 645 | — | 1,487 | ||||||||||||||||||||
| Number of facilities | 9 | 9 | 3 | — | 21 | |||||||||||||||||||||
Weighted average contract life(3) | 6 | 12 | 10 | — | 9 | |||||||||||||||||||||
| United States | Gross installed capacity (MW)(1) | — | 519 | 29 | 671 | 1,219 | ||||||||||||||||||||
| Number of facilities | — | 7 | 1 | 2 | 10 | |||||||||||||||||||||
Weighted average contract life(3) | — | 11 | 3 | 3 | 7 | |||||||||||||||||||||
| Australia | Gross installed capacity (MW)(1) | — | — | 450 | — | 450 | ||||||||||||||||||||
| Number of facilities | — | — | 6 | — | 6 | |||||||||||||||||||||
Weighted average contract life(3) | — | — | 16 | — | 16 | |||||||||||||||||||||
| Total | Gross installed capacity (MW)(1) | 925 | 1,906 | 3,084 | 671 | 6,586 | ||||||||||||||||||||
| Number of facilities | 26 | 29 | 17 | 2 | 74 | |||||||||||||||||||||
Weighted average contract life(3) | 1 | 10 | 5 | 3 | 6 | |||||||||||||||||||||
(1) Gross installed capacity for consolidated reporting represents 100 per cent output of a facility. Capacity figures for Wind and Solar includes 100 per cent of the Kent Hills wind facilities; Gas includes 100 per cent of the Ottawa and Windsor facilities, 100 per cent of the Poplar Creek facility, 50 per cent of the Sheerness facility and 60 per cent of the Fort Saskatchewan facility.
(2) The weighted average contract life for Hydro and certain gas and wind assets in Alberta are nil as they are operating primarily on a merchant basis in the Alberta market. Refer to the Alberta Electricity Portfolio section for more information.
(3) For power generated under long-term power purchase agreements ("PPA"), power hedge contracts and short-term and long-term industrial contracts, the PPAs have a weighted average remaining contract life based on long-term average gross installed capacity.
(4) The weighted average remaining contract life is related to the contract period for McBride Lake (38 MW), Windrise Wind (206 MW), Poplar Creek (115 MW) and Fort Saskatchewan (71 MW), with the remaining wind and gas facilities operated on a merchant basis in the Alberta market.
(5) The Gas segment includes the segments previously known as Australian Gas and North American Gas and the coal-fired generation assets converted to gas from the segment previously known as Alberta Thermal.
(6) The Energy Transition segment includes Centralia Unit 2 and the Skookumchuck dam.
The Company has retired all coal-fired generating assets located in Alberta within the Energy Transition segment. Effective Dec. 31, 2021, Keephills Unit 1 was retired and Sundance Unit 4 was retired from service effective March 31, 2022, resulting in a reduction in capacity of 801 MW within the Energy Transition segment from Dec. 31, 2021.
TRANSALTA CORPORATION M4
Management’s Discussion and Analysis
Highlights
Unaudited Interim Condensed Consolidated Financial Highlights
| 3 months ended Sept. 30 | 9 months ended Sept. 30 | |||||||||||||
| 2022 | 2021 | 2022 | 2021 | |||||||||||
| Adjusted availability (%) | 93.8 | 89.2 | 90.1 | 87.5 | ||||||||||
| Production (GWh) | 5,432 | 6,053 | 15,253 | 16,282 | ||||||||||
| Revenues | 929 | 850 | 2,122 | 2,111 | ||||||||||
Fuel and purchased power(1) | 348 | 328 | 817 | 788 | ||||||||||
| Carbon compliance | 23 | 47 | 51 | 139 | ||||||||||
Operations, maintenance and administration(1) | 135 | 130 | 364 | 381 | ||||||||||
Adjusted EBITDA(2) | 555 | 402 | 1,093 | 1,043 | ||||||||||
| Earnings (loss) before income taxes | 126 | (441) | 346 | (348) | ||||||||||
| Net earnings (loss) attributable to common shareholders | 61 | (456) | 167 | (498) | ||||||||||
| Cash flow from operating activities | 204 | 610 | 526 | 947 | ||||||||||
Funds from operations(2) | 488 | 318 | 887 | 808 | ||||||||||
Free cash flow(2) | 393 | 210 | 646 | 506 | ||||||||||
| Net earnings (loss) per share attributable to common shareholders, basic and diluted | 0.23 | (1.68) | 0.62 | (1.84) | ||||||||||
Dividends declared per common share(3) | 0.050 | 0.045 | 0.100 | 0.090 | ||||||||||
Dividends declared per preferred share(3) | 0.2896 | 0.2484 | 0.5453 | 0.5075 | ||||||||||
Funds from operations per share(2)(4) | 1.80 | 1.17 | 3.27 | 2.98 | ||||||||||
Free cash flow per share(2)(4) | 1.45 | 0.77 | 2.38 | 1.87 | ||||||||||
| As at | Sept. 30, 2022 | Dec. 31, 2021 | ||||||||||||
| Total assets | 10,045 | 9,226 | ||||||||||||
Total consolidated net debt(5) | 2,700 | 2,636 | ||||||||||||
Total long-term liabilities | 4,668 | 4,702 | ||||||||||||
| Total liabilities | 7,628 | 6,633 | ||||||||||||
(2) These items are not defined and have no standardized meaning under IFRS. Presenting these items from period to period provides management and investors with the ability to evaluate earnings (loss) trends more readily in comparison with prior periods’ results. Please refer to the Segmented Financial Performance and Operating Results section of this MD&A for further discussion of these items, including, where applicable, reconciliations to measures calculated in accordance with IFRS. Please see also the Additional IFRS Measures and Non-IFRS Measures section of this MD&A.
(3) Weighted average of the Series A, B, C, D, E and G preferred share dividends declared. Dividends declared vary period over period due to the timing of dividend declarations and quarterly floating rates.
(4) Funds from operations ("FFO") per share and free cash flow ("FCF") per share are calculated using the weighted average number of common shares outstanding during the period. The weighted average number of common shares outstanding for the three and nine months ended Sept. 30, 2022, was 271 million shares (Sept. 30, 2021 - 271 million for both periods). Please refer to the Additional IFRS Measures and Non-IFRS Measures section in this MD&A for the purpose of these non-IFRS ratios.
(5) Total consolidated net debt includes long-term debt, including current portion, amounts due under credit facilities, exchangeable securities, US tax equity financing and lease liabilities, net of available cash and cash equivalents, the principal portion of restricted cash on our subsidiary TransAlta OCP LP ("TransAlta OCP") and the fair value of economic hedging instruments on debt. Please refer to the table in the Financial Capital section of this MD&A for more details on the composition of total consolidated net debt.
TRANSALTA CORPORATION M5
Management’s Discussion and Analysis
For the three and nine months ended Sept. 30, 2022, we have generated exceptional performance from our Alberta Electricity Portfolio, driving overall strong performance for the Company. Both the Hydro and the Gas segments had high availability during periods of peak pricing. Higher power prices were mainly due to above normal temperatures increasing the demand for electricity, higher power prices in adjacent markets reducing electricity imports, and periods of significant planned and unplanned thermal and transmission outages. The Alberta merchant portfolio was positioned to capture opportunities from the strong spot market conditions through both energy and ancillary services revenues. Subsequent to the third quarter, we revised and increased our guidance for adjusted EBITDA and FCF based on the strong financial performance attained to date and our expectations for the balance of year. Please refer to the 2022 Financial Outlook section of this MD&A for more details on our updated guidance.
Adjusted availability for the three and nine months ended Sept. 30, 2022, was 93.8 per cent and 90.1 per cent, respectively, compared to 89.2 per cent and 87.5 per cent for the same periods in 2021. The increase was primarily due to lower planned outages within the Gas segment with the completion of the coal-to-gas conversions in 2021, and lower planned and unplanned outages at our Alberta Hydro Assets, partially offset by the extended outage at the Kent Hills 1 and 2 wind facilities. In addition, adjusted availability for the nine months ended Sept. 30, 2022, was further offset by the early-stage operational issues associated with the commissioning of the Windrise wind facility in the Wind and Solar segment.
Production for the three and nine months ended Sept. 30, 2022, was 5,432 gigawatt hours ("GWh") and 15,253 gigawatt hours, respectively, compared to 6,053 GWh and 16,282 GWh in the same periods in 2021. The decrease in production was primarily due to the retirement of Keephills Unit 1 and Sundance Unit 4, portfolio optimization activities and the extended outage at the Kent Hills 1 and 2 wind facilities. This was partially offset by an increase in production from the addition of the Windrise wind facility commissioned in the fourth quarter of 2021 and North Carolina Solar facility acquired in the fourth quarter of 2021 in our Wind and Solar segment. Production for the three months ended Sept. 30, 2022, was also impacted by higher water resources and lower wind resources across North America driven by higher than average temperatures. Production for the nine months ended Sept. 30, 2022, was impacted by higher water resources and lower availability at the Windrise wind facility.
Revenues increased by $79 million and $11 million, respectively, for the three and nine months ended Sept. 30, 2022, compared to the same periods in 2021, mainly as a result of capturing higher realized energy prices within the Alberta electricity market through our optimization and operating activities and higher realized ancillary services prices and volumes in the Hydro segment. Revenues also increased due to higher merchant prices at Centralia partially offset by lower production. In addition, revenues during the third quarter of 2022, were partially offset by lower environmental credit sales. During the second quarter of 2021, the Company experienced unfavourable adjustments for unplanned steam supply outages and steam reconciliation adjustments that did not reoccur within the current period within the Gas segment.
Fuel and purchased power costs increased by $20 million and $29 million, respectively, for the three and nine months ended Sept. 30, 2022, compared to the same periods in 2021. Fuel and purchased power costs increased compared to 2021 due to higher natural gas prices and increased natural gas consumption for our converted units in 2022, partially offset by our hedged positions on gas, lower coal costs and no mine depreciation due to the termination of all coal-mining activities in Canada as of Dec. 31, 2021.
Carbon compliance costs decreased by $24 million and $88 million, respectively, for the three and nine months ended Sept. 30, 2022, compared to the same periods in 2021, primarily due to reductions in greenhouse gas ("GHG") emissions, lower production and utilization of our compliance credits to settle a portion of the GHG obligation, partially offset by an increase in the carbon price per tonne. Lower GHG emissions were a direct result of operating exclusively on natural gas in Alberta rather than coal, resulting in changes in the fuel mix ratio.
Operations, maintenance and administration ("OM&A") expenses increased by $5 million for the three months ended Sept. 30, 2022, compared to the same period in 2021. For the three months ended Sept. 30, 2021, the Company recorded a write-down of $5 million on parts and material inventory related to the Highvale mine and coal operations at our converted gas facilities. Excluding the impact of this write-down, OM&A increased by $10 million in 2022, mainly due to higher contractor costs, higher incentive accruals reflecting the Company's performance, OM&A related to the addition of the Windrise wind and North Carolina Solar facilities and higher general operating expenses.
TRANSALTA CORPORATION M6
Management’s Discussion and Analysis
For the nine months ended Sept. 30, 2022, OM&A decreased by $17 million. For the nine months ended Sept. 30, 2021, the Company recorded a write-down of $30 million on parts and material inventory related to the retirement of the Highvale mine and coal operations at our converted gas facilities. In addition, during the first quarter of 2021, the Company recognized the Canada Emergency Wage Subsidy ("CEWS") proceeds of $8 million. Excluding the impact of the write-downs and the CEWS funding, OM&A expenses were higher by $5 million in 2022, mainly due to higher contractor costs, higher incentive accruals reflecting Company's performance, OM&A related to the addition of the Windrise wind and North Carolina Solar facilities and higher general operating expenses.
Adjusted EBITDA increased by $153 million for the three months ended Sept. 30, 2022, compared to the same period in 2021, largely due to strong performance from our Alberta Electricity Portfolio, driven primarily by the Hydro and Gas segments as a result of strong weather-adjusted demand and higher power prices. This was partially offset by lower adjusted EBITDA from the retirement of units in the Energy Transition segment, lower production and lower revenues in the Wind and Solar segment, lower gross margin in Energy Marketing and higher corporate expenses.
Adjusted EBITDA increased by $50 million for the nine months ended Sept. 30, 2022, compared to the same period in 2021, largely due to higher adjusted EBITDA from higher production and merchant power pricing in the Hydro segment, continuing strong performance and contribution from the Gas segment for Alberta, incremental production from new facilities, liquidated damages related to turbine availability at the Windrise wind facility, higher environmental credit sales in the Wind and Solar segment and lower carbon compliance costs in both the Gas and Energy Transition segments. This was partially offset from lower production from the Gas and Energy Transition segments, higher fuel and purchased power costs within the Gas segment. On a year-to-date basis, the Energy Marketing segment results were lower but in line with expectations compared with the exceptional results in the prior period. Significant changes in segmented adjusted EBITDA are highlighted in the Segmented Financial Performance and Operating Results section of this MD&A.
Earnings (loss) before income taxes increased by $567 million and $694 million, respectively, for the three and nine months ended Sept. 30, 2022, compared to the same periods in 2021. Net earnings attributable to common shareholders for the three and nine months ended Sept. 30, 2022, increased by $517 million and $665 million, respectively, to net earnings of $61 million and $167 million, respectively, compared to a net loss of $456 million and $498 million, respectively, for the same period in 2021. Net earnings attributable to common shareholders in 2021 were significantly impacted by asset impairment charges resulting from the Company's decisions to shut down the Highvale mine, suspend the Sundance Unit 5 repowering project, and retire Sundance Unit 4 and Keephills Unit 1. The Company benefited from higher revenues and lower carbon compliance costs, partially offset by higher fuel and purchased power, higher depreciation due to the acceleration of useful lives on certain facilities and higher tax expense. In addition, during the nine months ended Sept. 30, 2022, the Company recognized liquidated damages payable to the Company related to turbine availability at the Windrise wind facility and insurance proceeds related to the replacement costs for a tower at the Kent Hills facility. During the nine months ended Sept. 30, 2021, the Company recognized a gain on the sale of the Pioneer Pipeline.
Cash flow from operating activities decreased by $406 million and $421 million, respectively, for the three and nine months ended Sept. 30, 2022, compared to the same periods in 2021, mainly due to unfavourable changes in working capital from higher accounts receivable and movements in the collateral accounts related to high commodity prices and volatility in the markets.
FCF, one of the Company's key financial metrics, for the three and nine months ended Sept. 30, 2022, totaled $393 million and $646 million, respectively, compared to $210 million and $506 million, respectively, for the same periods in 2021. This represents an increase to FCF of $183 million and $140 million, respectively, driven primarily by higher adjusted EBITDA, higher realized foreign exchange gains, lower current income tax expenses and a decrease in sustaining capital spending related to fewer planned maintenance turnarounds.
TRANSALTA CORPORATION M7
Management’s Discussion and Analysis
Significant and Subsequent Events
Changes to the Board of Directors
On Sept. 30, 2022, Ms. Beverlee Park retired from TransAlta's Board of Directors. Ms. Park served on the Board of Directors since 2015 and as Chair of the Audit, Finance and Risk Committee from April 2018 to April 2022. The Company recognizes her for the many contributions made by Ms. Park to TransAlta and thanks her for the many years of service.
New Term Facility
During the third quarter of 2022, the Company closed a two year $400 million floating rate Term Facility with its banking syndicate with a maturity date of Sept. 7, 2024.
Conversion Results for Series E and F Preferred Shares
On Sept. 21, 2022, there were 89,945 Cumulative Redeemable Rate Reset First Preferred Shares, Series E (“Series E Shares”) tendered for conversion, which was less than the one million shares required to give effect to conversions into Cumulative Redeemable Rate Reset First Preferred Shares, Series F (“Series F Shares”). As a result, the Series E Shares were not converted into Series F Shares.
Executed Contract Renewals with the IESO at Sarnia Cogeneration and Melancthon 1 Wind Facilities
On Aug. 23, 2022, TransAlta Renewables Inc., a subsidiary of the Company ("TransAlta Renewables") announced that it was awarded capacity contracts for the Sarnia cogeneration facility and the Melancthon 1 wind facility from the Ontario Independent Electricity System Operator (“IESO”) as part of the IESO’s Medium-Term Capacity Procurement Request For Proposals (the “RFP”). The new capacity contracts for the Sarnia cogeneration facility and the Melancthon 1 wind facility run from May 1, 2026 to April 30, 2031. The Company expects the gross margin from the Sarnia cogeneration facility to be reduced by approximately 30 per cent per year as a result of the IESO price cap under the new contract.
Sarnia Industrial Contract Extensions
During the second quarter of 2022, the Company executed contract extensions for the supply of electricity with three industrial customers, and steam with one of these customers, at the Sarnia cogeneration facility. These agreements will extend the delivery term from Dec. 31, 2022 to April 30, 2031, in one case, and to Dec. 31, 2032, for the other two.
TransAlta Debuts New Brand Reiterating Commitment to a Clean Energy Future
On June 20, 2022, the Company announced a new visual identity including logo and tagline, "Energizing the Future". The new visual identity encapsulates the TransAlta of today while reinforcing the Company’s focus as a leader in creating a carbon-neutral future for our customers.
Conversion Results for Series C and D Preferred Shares
On June 16, 2022, the Company announced that 1,044,299 of its 11,000,000 currently outstanding Cumulative Redeemable Rate Reset First Preferred Shares, Series C (“Series C Shares”) were tendered for conversion, on a one-for-one basis, into Cumulative Redeemable Floating Rate First Preferred Shares, Series D (“Series D Shares”) after having taken into account all election notices.
Court of Appeal Upholds TransAlta’s Favourable Force Majeure Arbitration Decision
On June 9, 2022, the Alberta Court of Appeal released a unanimous decision dismissing ENMAX Energy Corporation's ("ENMAX") and the Balancing Pool's application seeking to set aside an arbitration decision in favour of the Company. The Court of Appeal upheld the Company’s claim of force majeure that arose when its Keephills Unit 1 generating unit tripped offline in 2013. As a result of the decision, the Company’s claim of force majeure remains valid and the associated costs of the force majeure event will not be reassessed against TransAlta.
TRANSALTA CORPORATION M8
Management’s Discussion and Analysis
Keephills Unit 2 Stator Force Majeure Dispute Settled
After the Keephills Unit 1 stator force majeure outage in 2013, it was determined that Keephills Unit 2 could face a similar stator failure before the next planned outage. In response, the Company took Keephills Unit 2 offline between January 31, 2014 and March 15, 2014 to perform a full rewind of the generator stator and claimed force majeure. The Balancing Pool disputed this force majeure event but the dispute was held in abeyance pending the outcome of the Keephills Unit 1 stator force majeure dispute, which was recently concluded. The Company and the Balancing Pool recently settled this dispute and so both stator Force majeure claims have been resolved.
Kent Hills Wind Facilities Update
On June 2, 2022, TransAlta Renewables announced the rehabilitation plan for the Kent Hills 1 and 2 wind facilities together with the execution of amended and extended contracts with New Brunswick Power Corporation ("NB Power") in respect of each of the Kent Hills 1, 2 and 3 wind facilities providing for an additional 10-year contract term to December 2045 and an effective 10 per cent reduction to the original contract prices from January 2023 through December 2033. In addition, both parties have agreed to work in good faith to evaluate the installation of a battery energy storage system at Kent Hills and to consider a potential repowering of Kent Hills at the end of life in 2045. A waiver for the Kent Hills wind non-recourse bonds ("KH Bonds") was also obtained from the project bond holders and a supplemental indenture was entered into with the bond holders that facilitates the rehabilitation of the Kent Hills 1 and 2 wind facilities. Refer to the Wind and Solar section and Financial Capital section of this MD&A for further details.
TSX Acceptance of Normal Course Issuer Bid
On May 24, 2022, the Toronto Stock Exchange (“TSX”) accepted the notice filed by the Company to renew its normal course issuer bid (“NCIB”) for a portion of its common shares. Pursuant to the NCIB, TransAlta may repurchase up to a maximum of 14,000,000 common shares, representing approximately 7.16 per cent of its public float of common shares as at May 17, 2022. Purchases under the NCIB may be made through open market transactions on the TSX and any alternative Canadian trading platforms on which the common shares are traded, based on the prevailing market price. Any common shares purchased under the NCIB will be cancelled. The period during which TransAlta is authorized to make purchases under the NCIB commenced on May 31, 2022 and ends on May 30, 2023, or such earlier date on which the maximum number of common shares are purchased under the NCIB or the NCIB is terminated at the Company’s election.
The NCIB provides the Company with a capital allocation alternative with a view to ensuring long-term shareholder value. TransAlta’s Board of Directors and Management believe that, from time to time, the market price of the common shares does not reflect their underlying value and purchases of common shares for cancellation under the NCIB may provide an opportunity to enhance shareholder value.
During the nine months ended Sept. 30, 2022, the Company purchased and cancelled a total of 2.7 million common shares at an average price of $12.50 per common share, for a total cost of $34 million.
Mount Keith 132kV Transmission Expansion
On May 3, 2022, TransAlta Renewables exercised its option to acquire an economic interest in the expansion of the Mount Keith 132kV transmission system in Western Australia, to support the Northern Goldfields-based operations of BHP Nickel West ("BHP"). Total construction capital is estimated at between AU$50 million and AU$53 million. Southern Cross Energy, a subsidiary of the Company, has entered into an engineering, procurement and construction agreement for the expansion. The project is being developed under the existing PPA with BHP, which has a term of 15 years. It is expected to be completed in the second half of 2023 and will generate annual adjusted EBITDA in the range of AU$6 million and AU$7 million. The project will facilitate the connection of additional generating capacity to our network to support BHP's operations and increase its competitiveness as a supplier of low-carbon nickel.
Executed Long-term PPA for the Remaining 30 MW at Garden Plain
During the second quarter of 2022, the Company entered into a long-term PPA for the remaining 30 MW of renewable electricity and environmental attributes for the Garden Plain wind project in Alberta with a new investment-grade globally-recognized customer. The 130 MW Garden Plain wind project, which was announced in May 2021 with a 100 MW PPA contracted to Pembina Pipeline Corporation ("Pembina"), is now fully contracted with a weighted average contract life of approximately 17 years. Construction is underway with a target commercial operation date in the fourth quarter of 2022.
TRANSALTA CORPORATION M9
Management’s Discussion and Analysis
Energy Impact Partners ("EIP") Investment
During the second quarter of 2022, the Company entered into a commitment to invest US$25 million over the next four years in EIP's Deep Decarbonization Frontier Fund 1 (the “Frontier Fund”). The Company invested US$6 million in May 2022. The investment in the Frontier Fund provides the Company with a portfolio approach to investing in emerging technologies and the opportunity to identify, pilot, commercialize and bring to market emerging technologies that will facilitate the transition to net-zero emissions.
Customer Update at White Rock Wind Projects
During the second quarter of 2022, TransAlta identified Amazon Energy LLC (“Amazon”) as the customer for the 300 MW White Rock wind projects, to be located in Caddo County, Oklahoma. On Dec. 22, 2021, Amazon and TransAlta entered into two long-term PPAs for the supply of 100 per cent of the generation from the projects. Construction activities started in the fall of 2022 with a target commercial operation date in the second half of 2023. TransAlta will construct, operate and own the facility.
MSCI Environmental, Social and Governance ("ESG") Rating Upgrade
During the second quarter of 2022, TransAlta's MSCI ESG Rating was upgraded to 'A' from 'BBB'. The upgrade reflects the Company's strong renewable energy growth compared to peers. In 2021, the Company grew its installed renewable energy capacity by 15 per cent through the acquisition and construction of solar and wind facilities and secured 600 MW in additional renewable energy projects. In line with its goal to reduce carbon emissions by 75 per cent from 2015 emissions levels by 2026, TransAlta also completed coal-to-gas conversions of its Canadian coal-fired facilities in 2021, nine years ahead of Alberta’s coal phase-out plan.
Horizon Hill Wind Project and Fully Executed Corporate PPA with Meta
On April 5, 2022, TransAlta executed a long-term renewable energy PPA with a subsidiary of Meta Platforms Inc. ("Meta"), formerly known as Facebook, Inc., for 100 per cent of the generation from its 200 MW Horizon Hill wind project to be located in Logan County, Oklahoma. Under this agreement, Meta will receive both renewable electricity and environmental attributes from the Horizon Hill facility. The facility will consist of a total of 34 Vestas turbines. Construction commenced in the fall of 2022 with a target commercial operation date in the second half of 2023. TransAlta will construct, operate and own the facility.
Refer to the audited annual 2021 consolidated financial statements within our 2021 Annual Integrated Report and our unaudited interim condensed consolidated financial statements for the three and nine months ended Sept. 30, 2022, for significant events impacting both prior and current year results.
TRANSALTA CORPORATION M10
Management’s Discussion and Analysis
Performance by Segment with Supplemental Geographical Information
The following table provides the performance of our facilities across the regions in which we operate:
| 3 months ended Sept. 30, 2022 | Hydro | Wind and Solar | Gas(1) | Energy Transition(2) | Energy Marketing | Corporate and Other | Total | ||||||||||||||||
| Alberta | 239 | 14 | 139 | (6) | 53 | (31) | 408 | ||||||||||||||||
| Canada, excluding Alberta | 6 | 14 | 21 | — | — | — | 41 | ||||||||||||||||
| United States | — | 14 | 2 | 57 | — | — | 73 | ||||||||||||||||
| Australia | — | — | 33 | — | — | — | 33 | ||||||||||||||||
Adjusted EBITDA(3) | 245 | 42 | 195 | 51 | 53 | (31) | 555 | ||||||||||||||||
| Earnings before income taxes | 126 | ||||||||||||||||||||||
| 3 months ended Sept. 30, 2021 | Hydro | Wind and Solar | Gas(1) | Energy Transition(2) | Energy Marketing | Corporate and Other | Total | ||||||||||||||||
| Alberta | 78 | 21 | 94 | 18 | 79 | (24) | 266 | ||||||||||||||||
| Canada, excluding Alberta | 4 | 21 | 22 | — | — | — | 47 | ||||||||||||||||
| United States | — | 13 | 3 | 37 | — | — | 53 | ||||||||||||||||
| Australia | — | — | 36 | — | — | — | 36 | ||||||||||||||||
Adjusted EBITDA(3) | 82 | 55 | 155 | 55 | 79 | (24) | 402 | ||||||||||||||||
| Loss before income taxes | (441) | ||||||||||||||||||||||
| 9 months ended Sept. 30, 2022 | Hydro | Wind and Solar | Gas(1) | Energy Transition(2) | Energy Marketing | Corporate and Other | Total | ||||||||||||||||
| Alberta | 382 | 85 | 194 | (12) | 120 | (72) | 697 | ||||||||||||||||
| Canada, excluding Alberta | 12 | 70 | 64 | — | — | — | 146 | ||||||||||||||||
| United States | — | 64 | 6 | 79 | — | — | 149 | ||||||||||||||||
| Australia | — | — | 101 | — | — | — | 101 | ||||||||||||||||
Adjusted EBITDA(3) | 394 | 219 | 365 | 67 | 120 | (72) | 1,093 | ||||||||||||||||
| Earnings before income taxes | 346 | ||||||||||||||||||||||
| 9 months ended Sept. 30, 2021 | Hydro | Wind and Solar | Gas(1) | Energy Transition(2) | Energy Marketing | Corporate and Other | Total | ||||||||||||||||
| Alberta | 245 | 41 | 227 | 33 | 177 | (56) | 667 | ||||||||||||||||
| Canada, excluding Alberta | 10 | 92 | 51 | — | — | — | 153 | ||||||||||||||||
| United States | — | 53 | 8 | 63 | — | — | 124 | ||||||||||||||||
| Australia | — | — | 99 | — | — | — | 99 | ||||||||||||||||
Adjusted EBITDA(3) | 255 | 186 | 385 | 96 | 177 | (56) | 1,043 | ||||||||||||||||
| Loss before income taxes | (348) | ||||||||||||||||||||||
(1) The Gas segment includes the segments previously known as Australian Gas and North American Gas and the coal-fired generation assets converted to gas from the segment previously known as Alberta Thermal.
(2) The Energy Transition segment includes the segment previously known as Centralia and the coal-fired generation assets not converted to gas and the mining assets from the segment previously known as Alberta Thermal. Keephills Unit 1 was retired Dec. 31, 2021 and Sundance Unit 4 was retired March 31, 2022.
(3) Adjusted EBITDA is not defined and has no standardized meaning under IFRS. Presenting this from period to period provides management and investors with the ability to evaluate earnings (loss) trends more readily in comparison with prior periods’ results. Please refer to the Segmented Financial Performance and Operating Results section of this MD&A for further discussion of these items, including, where applicable, reconciliations to measures calculated in accordance with IFRS. See also the Additional IFRS Measures and Non-IFRS Measures section of this MD&A.
TRANSALTA CORPORATION M11
Management’s Discussion and Analysis
Alberta Electricity Portfolio
Approximately 52 per cent of our gross installed capacity is located in Alberta. Our portfolio of merchant assets in Alberta consists of hydro facilities, wind facilities, a battery storage facility, cogeneration facilities and converted natural gas-fired thermal facilities. Some of the wind and gas facilities within the Alberta Electricity Portfolio operate on long-term contracts. Optimization of portfolio performance is driven by the diversity of fuel types, which enables portfolio management and allows for maximization of operating margins. It also provides us with capacity that can be monetized as ancillary services or dispatched into the energy market during times of supply tightness. A portion of the installed generation capacity in the portfolio has been hedged to provide cash flow certainty.
Generating energy in Alberta is subject to market forces, rather than rate regulation. Energy from commercial generation is cleared through a wholesale electricity market. Energy is dispatched in accordance with an economic merit order administered by the Alberta Electric System Operator ("AESO"), based upon offers by generators to sell energy in the real-time energy-only market. Our merchant Alberta fleet operates under this framework and we internally manage our offers to sell energy.
| 2022 | 2021 | ||||||||||||||||||||||||||||||||||
| 3 months ended Sept. 30 | Hydro | Wind and Solar | Gas | Energy Transition | Total | Hydro | Wind and Solar | Gas | Energy Transition | Total | |||||||||||||||||||||||||
Total Production (GWh)(1) | 614 | 259 | 1,993 | — | 2,866 | 513 | 259 | 2,025 | 600 | 3,397 | |||||||||||||||||||||||||
| Contract Production (GWh) | 4 | 111 | 127 | — | 242 | — | 55 | 117 | — | 172 | |||||||||||||||||||||||||
| Merchant Production (GWh) | 610 | 148 | 1,866 | — | 2,624 | 513 | 204 | 1,908 | 600 | 3,225 | |||||||||||||||||||||||||
Revenues(2) | 256 | 25 | 290 | (2) | 569 | 90 | 29 | 205 | 59 | 383 | |||||||||||||||||||||||||
Fuel and purchased power(3) | 6 | 3 | 110 | — | 119 | 3 | 2 | 68 | 17 | 90 | |||||||||||||||||||||||||
| Carbon compliance | — | 1 | 23 | 2 | 26 | — | — | 27 | 15 | 42 | |||||||||||||||||||||||||
| Gross margin | 250 | 21 | 157 | (4) | 424 | 87 | 27 | 110 | 27 | 251 | |||||||||||||||||||||||||
| 2022 | 2021 | ||||||||||||||||||||||||||||||||||
| 9 months ended Sept. 30 | Hydro | Wind and Solar | Gas | Energy Transition | Total | Hydro | Wind and Solar | Gas | Energy Transition | Total | |||||||||||||||||||||||||
Total Production (GWh)(1) | 1,356 | 1,211 | 5,537 | 19 | 8,123 | 1,263 | 819 | 5,953 | 1,416 | 9,451 | |||||||||||||||||||||||||
| Contract Production (GWh) | 4 | 433 | 385 | — | 822 | — | 108 | 367 | — | 475 | |||||||||||||||||||||||||
| Merchant Production (GWh) | 1,352 | 778 | 5,152 | 19 | 7,301 | 1,263 | 711 | 5,586 | 1,416 | 8,976 | |||||||||||||||||||||||||
Revenues(2) | 426 | 109 | 588 | 5 | 1,128 | 282 | 64 | 544 | 149 | 1,039 | |||||||||||||||||||||||||
Fuel and purchased power(3) | 14 | 12 | 294 | 5 | 325 | 5 | 5 | 187 | 48 | 245 | |||||||||||||||||||||||||
| Carbon compliance | — | 1 | 47 | (1) | 47 | — | — | 87 | 35 | 122 | |||||||||||||||||||||||||
| Gross margin | 412 | 96 | 247 | 1 | 756 | 277 | 59 | 270 | 66 | 672 | |||||||||||||||||||||||||
(1) Units in the Gas and Energy Transition segments in the prior periods operated on coal. Keephills Unit 1 was retired Dec. 31, 2021, and Sundance Unit 4 was retired March 31, 2022.
(2) Adjustments to revenues include the impact of unrealized mark-to-market gains or losses and realized gains and losses on closed exchange positions.
(3) Adjustments to fuel and purchased power include the impact of coal mine depreciation and coal inventory write-downs at the Highvale mine in 2021.
For the three and nine months ended Sept. 30, 2022, the Alberta Electricity Portfolio generated 2,866 GWh and 8,123 GWh of energy, respectively, a decrease of 531 GWh and 1,328 GWh, respectively, compared to the same periods in 2021. Production was impacted by the retirement of Keephills Unit 1 on Dec. 31, 2021, and Sundance Unit 4 on March 31, 2022, dispatch optimization, lower wind resources impacted the three-month period, partially offset by increased production from the addition of the Windrise wind facility commissioned in the fourth quarter of 2021. Production in the three months ended Sept. 30, 2022, benefited from higher water resources from a delayed spring runoff.
TRANSALTA CORPORATION M12
Management’s Discussion and Analysis
Gross margin for the three and nine months ended Sept. 30, 2022, was $424 million and $756 million, respectively, an increase of $173 million and $84 million, respectively, compared to the same periods in 2021. Gross margin for the three months ended Sept. 30, 2022, was positively impacted by higher merchant pricing resulting from strong weather-driven demand, higher natural gas prices and higher power prices in adjacent markets compared to 2021. Energy and ancillary services revenue from the Hydro segment was higher as a result of higher power prices and market volatility. Gross margin for the nine months ended Sept. 30, 2022, was positively impacted by strong weather-driven demand, partially offset by a better-supplied market. The Gas and Energy Transition segment results were impacted by lower production due to unit retirements and higher dispatch optimization in response to lower market heat rates and higher gas prices.
The following table provides information about the Company's Alberta Electricity Portfolio:
| 3 months ended Sept. 30 | 9 months ended Sept. 30 | |||||||||||||||||||
| 2022 | 2021 | 2022 | 2021 | |||||||||||||||||
| Spot power price average per MWh | $221 | $100 | $145 | $100 | ||||||||||||||||
| Natural gas price (AECO) per GJ | $4.04 | $3.29 | $5.14 | $3.04 | ||||||||||||||||
| Carbon compliance price per tonne | $50 | $40 | $50 | $40 | ||||||||||||||||
Realized merchant power price per MWh(1) | $253 | $113 | $164 | $112 | ||||||||||||||||
| Hydro energy spot power price per MWh | $246 | $110 | $177 | $116 | ||||||||||||||||
| Hydro ancillary spot price per MWh | $128 | $47 | $74 | $58 | ||||||||||||||||
| Wind energy spot power price per MWh | $136 | $73 | $86 | $58 | ||||||||||||||||
| Gas and Energy Transition spot power price per MWh | $264 | $121 | $171 | $115 | ||||||||||||||||
Hedged volume(2) | 1,681 | 1,863 | 5,320 | 5,158 | ||||||||||||||||
| Hedged power price average per MWh | $80 | $76 | $79 | $67 | ||||||||||||||||
Fuel and purchased power per MWh(3) | $60 | $34 | $58 | $33 | ||||||||||||||||
Carbon compliance cost per MWh(3) | $13 | $16 | $8 | $17 | ||||||||||||||||
(1) Realized power price for the Alberta Electricity Portfolio is the average price realized as a result of the Company's merchant power sales (excluding assets under long-term contract and ancillary revenues) and portfolio optimization activities divided by total merchant GWh produced.
(2) Hedge volumes are for expected production volumes primarily from the Gas segment.
(3) Fuel and purchased power per MWh and carbon compliance cost per MWh are calculated on production from carbon-emitting generation segments in Gas and Energy Transition and carbon compliance cost per MWh includes compliance credits to settle a portion of our GHG carbon pricing obligations.
For the three and nine months ended Sept. 30, 2022, the spot power price increased to $221 per MWh and $145 per MWh, respectively, from $100 per MWh in both periods in 2021.
For the three and nine months ended Sept. 30, 2022, the realized merchant power price per MWh of production increased by $140 and $52 per MWh, respectively, compared with the same periods in 2021. Higher realized merchant power pricing for energy across the fleet was due to higher market prices, increased price volatility and optimization of our available capacity across all fuel types. The segment spot prices exclude gains and losses from hedging positions that are entered into in order to mitigate the impact of unfavourable market pricing.
For the three and nine months ended Sept. 30, 2022, the Hydro ancillary spot power price increased to $128 and $74 per MWh, respectively, compared with the same periods in 2021, due to higher power prices mainly related to higher natural gas prices and stronger weather-driven demand compared to the same periods in 2021.
For the three and nine months ended Sept. 30, 2022, the fuel and purchased power cost per MWh of production increased by $26 per MWh and $25 per MWh, respectively, compared to the same periods in 2021, due to higher natural gas pricing, higher fixed gas transportation costs, partially offset by our hedge positions for gas prices and lower coal costs due to the cessation of mining operations in 2021.
TRANSALTA CORPORATION M13
Management’s Discussion and Analysis
For the three and nine months ended Sept. 30, 2022, carbon compliance costs per MWh of production decreased by $3 per MWh and $9 per MWh, respectively, compared to the same periods in 2021, primarily due to lower carbon emissions from the retirement of our coal fleet and the utilization of compliance credits to settle a portion of our GHG carbon pricing obligation for 2021. Carbon compliance prices have increased to $50 per tonne from $40 per tonne; however, the shift to gas-fired generation effectively lowered our GHG compliance costs as natural gas combustion produces lower GHG emissions than coal combustion.
Segmented Financial Performance and Operating Results
Reporting Segment Changes
Segmented information is prepared on the same basis that the Company manages its business, evaluates financial results and makes key operating decisions. With the completion of the Clean Energy Transition plan and the announcement of our strategic focus on customer-centered renewable generation, the Company realigned its current operating segments during the fourth quarter of 2021 to better reflect the Company's current strategic focus and to align with the Company's Clean Electricity Growth Plan. The segment reporting changes reflect a corresponding change in how the President and Chief Executive Officer assess the performance of the Company.
The primary changes in 2021, were the elimination of the Alberta Thermal and the Centralia segments and the reorganization of the North American Gas and Australia Gas segments into a new "Gas" segment. The Alberta Thermal facilities that have been converted to gas are included in the Gas segment. The remaining assets previously included in Alberta Thermal, including the mining assets, those facilities not converted to gas and the remaining Centralia unit are included in a new "Energy Transition" segment. No changes have been made to the Hydro, Wind and Solar, Energy Marketing or the Corporate and Other segments. The prior year's metrics were restated to reflect the re-alignment of the operating segments.
TRANSALTA CORPORATION M14
Consolidated Results
The following table reflects the generation and summary financial information on a consolidated basis for each of our segments:
LTA Generation (GWh)(1) | Actual Production (GWh)(2) | Adjusted EBITDA(3) | |||||||||||||||||||||||||||
| 3 months ended Sept. 30 | 2022 | 2021 | 2022 | 2021 | 2022 | 2021 | |||||||||||||||||||||||
| Hydro | 617 | 617 | 738 | 611 | 245 | 82 | |||||||||||||||||||||||
| Wind and Solar | 930 | 783 | 685 | 718 | 42 | 55 | |||||||||||||||||||||||
| Renewables | 1,547 | 1,400 | 1,423 | 1,329 | 287 | 137 | |||||||||||||||||||||||
| Gas | 2,842 | 2,913 | 195 | 155 | |||||||||||||||||||||||||
| Energy Transition | 1,167 | 1,811 | 51 | 55 | |||||||||||||||||||||||||
| Energy Marketing | 53 | 79 | |||||||||||||||||||||||||||
| Corporate | (31) | (24) | |||||||||||||||||||||||||||
| Total | 5,432 | 6,053 | 555 | 402 | |||||||||||||||||||||||||
| Total earnings (loss) before income taxes | 126 | (441) | |||||||||||||||||||||||||||
LTA Generation (GWh)(1) | Actual Production (GWh)(2) | Adjusted EBITDA(3) | |||||||||||||||||||||||||||
| 9 months ended Sept. 30 | 2022 | 2021 | 2022 | 2021 | 2022 | 2021 | |||||||||||||||||||||||
| Hydro | 1,592 | 1,592 | 1,644 | 1,525 | 394 | 255 | |||||||||||||||||||||||
| Wind and Solar | 3,451 | 2,860 | 3,026 | 2,675 | 219 | 186 | |||||||||||||||||||||||
| Renewables | 5,043 | 4,452 | 4,670 | 4,200 | 613 | 441 | |||||||||||||||||||||||
| Gas | 8,073 | 8,370 | 365 | 385 | |||||||||||||||||||||||||
| Energy Transition | 2,510 | 3,712 | 67 | 96 | |||||||||||||||||||||||||
| Energy Marketing | 120 | 177 | |||||||||||||||||||||||||||
| Corporate | (72) | (56) | |||||||||||||||||||||||||||
| Total | 15,253 | 16,282 | 1,093 | 1,043 | |||||||||||||||||||||||||
| Total earnings (loss) before income taxes | 346 | (348) | |||||||||||||||||||||||||||
(1) Long-term average production ("LTA Generation (GWh)") is calculated based on our portfolio as at Sept. 30, 2022, on an annualized basis from the average annual energy yield predicted from our simulation model based on historical resource data performed over a period of typically 30-35 years for the Wind and Solar segments and 36 years for Hydro segment. LTA Generation (GWh) for Energy Transition is not considered as we are currently transitioning these units completely by the end of 2025 and the LTA Generation (GWh) for Gas is not considered as it is largely dependent on market conditions and merchant demand. LTA Generation (GWh) for the three and nine months ended Sept. 30, 2022, excluding the Kent Hills 1 and 2 wind facilities which are currently not in operation, is approximately 846 GWh and 3,176 GWh, respectively.
(2) Actual production levels are compared against the long-term average to highlight the impact of an important factor that affects the variability in our business results. In the short-term, for each of the Hydro and Wind and Solar segments, the conditions will vary from one period to the next and over time facilities will continue to produce in line with their long-term averages, which have proven to be reliable indicators of performance.
(3) These items are not defined and have no standardized meaning under IFRS. Refer to the Additional IFRS Measures and Non-IFRS Measures section of this MD&A.
TRANSALTA CORPORATION M15
Hydro
| 3 months ended Sept. 30 | 9 months ended Sept. 30 | |||||||||||||
| 2022 | 2021 | 2022 | 2021 | |||||||||||
| Gross installed capacity (MW) | 925 | 925 | 925 | 925 | ||||||||||
| LTA Generation (GWh) | 617 | 617 | 1,592 | 1,592 | ||||||||||
| Availability (%) | 97.7 | 90.3 | 96.6 | 91.8 | ||||||||||
| Contract production (GWh) | 125 | 98 | 292 | 262 | ||||||||||
| Merchant production (GWh) | 613 | 513 | 1,352 | 1,263 | ||||||||||
| Total energy production (GWh) | 738 | 611 | 1,644 | 1,525 | ||||||||||
Ancillary service volumes (GWh)(1) | 797 | 657 | 2,324 | 2,155 | ||||||||||
Alberta Hydro Assets(2) | 151 | 54 | 240 | 145 | ||||||||||
Other Hydro assets and other revenue(2)(3) | 12 | 12 | 34 | 32 | ||||||||||
Alberta Hydro Ancillary services(1) | 102 | 30 | 172 | 125 | ||||||||||
| Environmental attribute revenue | — | — | 1 | 1 | ||||||||||
| Total gross revenues | 265 | 96 | 447 | 303 | ||||||||||
Net payment relating to Alberta Hydro PPA(4) | — | — | — | (4) | ||||||||||
| Revenues | 265 | 96 | 447 | 299 | ||||||||||
Fuel and purchased power(5) | 7 | 4 | 17 | 13 | ||||||||||
| Gross margin | 258 | 92 | 430 | 286 | ||||||||||
OM&A(5) | 12 | 10 | 33 | 29 | ||||||||||
| Taxes, other than income taxes | 1 | — | 3 | 2 | ||||||||||
| Adjusted EBITDA | 245 | 82 | 394 | 255 | ||||||||||
| Supplemental Information: | ||||||||||||||
| Gross Revenues per MWh | ||||||||||||||
| Alberta Hydro Assets energy ($/MWh) | 246 | 110 | 177 | 116 | ||||||||||
| Alberta Hydro Assets ancillary ($/MWh) | 128 | 46 | 74 | 58 | ||||||||||
| Sustaining capital | 8 | 6 | 20 | 18 | ||||||||||
(1) Ancillary services as described in the AESO Consolidated Authoritative Document Glossary.
(2) Alberta Hydro Assets include 13 hydro facilities on the Bow and North Saskatchewan river systems. Other Hydro energy include our hydro facilities in BC and Ontario, hydro facilities in Alberta other than the Alberta Hydro Assets and transmission revenues.
(3) Other revenue includes revenues from our transmission business and other contractual arrangements including the flood mitigation agreement with the Alberta government and black start services.
(4) The net payment relating to the Alberta Hydro PPA represents the Company's financial obligations for notional amounts of energy and ancillary services in accordance with the Alberta Hydro PPA that expired on Dec. 31, 2020. The amount in the first and second quarters of 2021 related to adjustments for the final payment under the Alberta PPA.
(5) During the three and nine months ended Sept. 30, 2021, $1 million and $6 million, respectively, related to station service costs for the Hydro segment were reclassified from OM&A to fuel and purchased power for comparative purposes. This did not impact previously reported net earnings.
Availability, for the three and nine months ended Sept. 30, 2022, increased compared to the same periods in 2021, primarily due to lower planned and unplanned outages at our Alberta Hydro Assets.
Production, for the three and nine months ended Sept. 30, 2022, increased by 127 GWh and 119 GWh, respectively, compared to the same periods in 2021, mainly due to higher water resources in the third quarter from a delayed spring runoff.
Ancillary service volumes, for the three and nine months ended Sept. 30, 2022, increased by 140 GWh and 169 GWh, respectively, compared to the same periods in 2021, due to higher availability and higher water resources in the third quarter from a delayed spring runoff.
TRANSALTA CORPORATION M16
Adjusted EBITDA, for the three and nine months ended Sept. 30, 2022, increased by $163 million and $139 million, respectively, compared to the same periods in 2021, primarily due to higher merchant pricing and higher ancillary services realized prices in the Alberta market as well as higher energy and ancillary services volumes due to higher water resources. OM&A costs for the year are higher due to increased insurance premiums for updated replacement value coverage. For further discussion on the Alberta market conditions and pricing, refer to the 2022 Financial Outlook section and Alberta Electricity Portfolio section of this MD&A.
Sustaining capital expenditures for the three and nine months ended Sept. 30, 2022, were consistent, compared with the same periods in 2021.
Wind and Solar
| 3 months ended Sept. 30 | 9 months ended Sept. 30 | |||||||||||||
| 2022 | 2021 | 2022 | 2021 | |||||||||||
Gross installed capacity (MW)(1) | 1,906 | 1,682 | 1,906 | 1,682 | ||||||||||
| LTA Generation (GWh) | 930 | 783 | 3,451 | 2,860 | ||||||||||
| Availability (%) | 85.0 | 94.0 | 83.1 | 94.8 | ||||||||||
| Contract production (GWh) | 537 | 514 | 2,247 | 1,964 | ||||||||||
| Merchant production (GWh) | 148 | 204 | 779 | 711 | ||||||||||
| Total energy production (GWh) | 685 | 718 | 3,026 | 2,675 | ||||||||||
| Wind and Solar revenues | 64 | 62 | 253 | 224 | ||||||||||
| Environmental attribute revenue | 3 | 14 | 33 | 23 | ||||||||||
Revenues(2) | 67 | 76 | 286 | 247 | ||||||||||
| Fuel and purchased power | 6 | 4 | 20 | 11 | ||||||||||
| Carbon compliance | — | — | 1 | — | ||||||||||
Gross margin(2) | 61 | 72 | 265 | 236 | ||||||||||
| OM&A | 19 | 14 | 50 | 42 | ||||||||||
| Taxes, other than income taxes | 1 | 3 | 7 | 8 | ||||||||||
Net other operating income(2) | (1) | — | (11) | — | ||||||||||
Adjusted EBITDA(2) | 42 | 55 | 219 | 186 | ||||||||||
| Supplemental information: | ||||||||||||||
| Sustaining capital | 5 | 4 | 12 | 8 | ||||||||||
Kent Hills wind rehabilitation expenditures(3) | 31 | — | 41 | — | ||||||||||
| Insurance proceeds - Kent Hills | — | — | (7) | — | ||||||||||
(1) The gross installed capacity in 2022 includes incremental capacity related to new facilities: Windrise wind facility (206 MW), North Carolina Solar (122 MW) and Oldman wind facility (4 MW).
(2) For details of the adjustments to revenues and net other operating income included in adjusted EBITDA, refer to the Additional IFRS and Non-IFRS Measures section of this MD&A.
(3)The Kent Hills wind facilities rehabilitation capital expenditures are segregated from the sustaining capital expenditures due to the extraordinary nature of the expenditures and have been reflected separately.
Availability, for the three and nine months ended Sept. 30, 2022, decreased compared to the same periods in 2021, primarily as a result of the extended outage at the Kent Hills 1 and 2 wind facilities. For the three months ended Sept. 30, 2022, availability was further impacted by planned and unplanned outages in Ontario. For the nine months ended Sept. 30, 2022, availability was also impacted by early-stage operational issues at our Windrise wind facility.
Production, for the three months ended Sept. 30, 2022, decreased by 33 GWh compared to the same period in 2021, primarily due to lower wind resources across North America driven by higher than average temperatures and lower availability, partially offset by increased production from the addition of the Windrise wind facility commissioned, and North Carolina Solar facility acquired, in the fourth quarter of 2021.
TRANSALTA CORPORATION M17
Production, for the nine months ended Sept. 30, 2022, increased by 351 GWh compared to the same period in 2021, primarily due to higher production from the addition of the Windrise wind and North Carolina Solar facilities and higher wind resources across North America, partially offset by lower production from the extended outage at the Kent Hills 1 and 2 wind facilities.
Adjusted EBITDA, for the three months ended Sept. 30, 2022, decreased by $13 million, compared to the same period in 2021, primarily due to lower production, lower environmental attribute revenues and an increase in OM&A related to the addition of the Windrise wind and North Carolina Solar facilities. This was partially offset by higher realized merchant pricing in Alberta.
Adjusted EBITDA, for the nine months ended Sept. 30, 2022, increased by $33 million, compared to the same period in 2021, primarily due to higher production, higher realized merchant pricing in Alberta, higher environmental attribute revenues and recognition of liquidated damages payable to the Company related to turbine availability at the Windrise wind facility. This was partially offset by an increase in transmission rates and OM&A related to the addition of the Windrise wind and North Carolina Solar facilities. A one-time favourable adjustment as a result of the AESO transmission line loss ruling was included in the nine months ended Sept. 30, 2021.
Sustaining capital expenditures for the three months ended Sept. 30, 2022, were consistent with the same period in 2021. Sustaining capital expenditures for the nine months ended Sept. 30, 2022, were $4 million higher compared to the same period in 2021, due to one-time sustaining capital investments in wind control systems in 2022.
The Kent Hills 1 and 2 wind facilities are not currently in operation following the tower failure event that occurred in September 2021. This event has taken approximately 150 MW of gross production offline temporarily as the Company replaces all 50 turbine foundations at the Kent Hills 1 and 2 wind facilities. The extended outage is expected to result in foregone revenue of approximately $3 million per month on an annualized basis (assuming all 50 turbines at the Kent Hills 1 and 2 wind facilities are offline), based on average historical wind production, with revenue expected to be earned as the wind turbines are returned to service.1 Each turbine at Kent Hills 1 and 2 wind facilities will return to service as soon as its foundation is replaced and the turbine is reassembled and tested.
Kent Hills Wind LP ("KHLP") has entered into agreements with vendors to complete the rehabilitation of the Kent Hills 1 and 2 wind facilities and has commenced execution of its rehabilitation plan. The current estimate of the capital expenditures is approximately $120 million, inclusive of insurance proceeds. Rehabilitation for the Kent Hills 1 and 2 wind facilities is well underway including turbine disassembly and foundation demolition. During the third quarter of 2022, over half of the towers have been fully disassembled including foundation removal. Construction of new foundations has begun with the first concrete pours completed and the new wind turbine components delivered to replace the unit that was damaged. Rehabilitation is targeted to be completed by the second half of 2023 for the Kent Hills 1 and 2 wind facilities.
The Company is actively evaluating all options that may be available to recover the rehabilitation costs from third parties and their insurance providers and intends to pursue claims to recover costs and related damages from those parties.
1 The Kent Hills 1 and 2 wind facilities lost production is based on average historical wind production.
TRANSALTA CORPORATION M18
Gas
| 3 months ended Sept. 30 | 9 months ended Sept. 30 | |||||||||||||
| 2022 | 2021 | 2022 | 2021 | |||||||||||
| Gross installed capacity (MW) | 3,084 | 3,084 | 3,084 | 3,084 | ||||||||||
| Availability (%) | 97.8 | 88.0 | 95.2 | 85.6 | ||||||||||
| Contract production (GWh) | 887 | 900 | 2,657 | 2,665 | ||||||||||
| Merchant production (GWh) | 1,974 | 2,038 | 5,460 | 5,834 | ||||||||||
| Purchased power (GWh) | (19) | (25) | (44) | (129) | ||||||||||
| Total production (GWh) | 2,842 | 2,913 | 8,073 | 8,370 | ||||||||||
Revenues(1) | 431 | 326 | 984 | 862 | ||||||||||
Fuel and purchased power(1) | 166 | 102 | 442 | 265 | ||||||||||
| Carbon compliance | 26 | 33 | 56 | 104 | ||||||||||
Gross margin(1) | 239 | 191 | 486 | 493 | ||||||||||
OM&A(1) | 49 | 42 | 138 | 127 | ||||||||||
| Taxes, other than income taxes | 5 | 4 | 13 | 11 | ||||||||||
| Net other operating income | (10) | (10) | (30) | (30) | ||||||||||
Adjusted EBITDA(1) | 195 | 155 | 365 | 385 | ||||||||||
| Supplemental information: | ||||||||||||||
| Sustaining capital | 8 | 31 | 16 | 97 | ||||||||||
(1) For details of the adjustments to revenues, fuel and purchased power and OM&A included in adjusted EBITDA, refer to the Additional IFRS Measures and Non-IFRS Measures section of this MD&A.
The Gas segment is a new segment as described in the Segmented Financial Performance and Operating Results section of this MD&A. Included in the Gas segment is the previous North American Gas segment, Australian Gas segment and the facilities from the previous Alberta Thermal segment which have been converted to gas. The previous Alberta thermal facilities included in the Gas segment include Sheerness Units 1 and 2, Keephills Units 2 and 3 and Sundance Unit 6. Prior periods have been adjusted to be comparable to the current period and reflect operations as coal units.
Availability, for the three and nine months ended Sept. 30, 2022, increased compared to the same periods in 2021, primarily due to higher reliability of the coal-to-gas converted units compared to coal.
Production for the three and nine months ended Sept. 30, 2022, decreased by 71 GWh and 297 GWh, respectively, compared to the same periods in 2021, mainly due to dispatch optimization of our Alberta assets and lower customer demand in Ontario due to a customer outage, partially offset by higher demand in Australia at our South Hedland facility due to the Fortescue Metals Group Ltd. contract and higher production from our Ada cogeneration facility. The nine months ended Sept. 30, 2022, production was positively impacted by higher merchant demand in Ontario.
Adjusted EBITDA, for the three months ended Sept. 30, 2022, increased by $40 million, compared to the same period in 2021. The increase was primarily due to higher merchant pricing in Alberta, net of hedging, lower carbon costs and a favourable change in legal provisions, partially offset by lower production, higher natural gas prices and increased natural gas consumption. Lower carbon costs and increased natural gas consumption in the period were a result of no longer operating on coal.
TRANSALTA CORPORATION M19
Adjusted EBITDA, for the nine months ended Sept. 30, 2022, decreased by $20 million, compared to the same period in 2021. The decrease was primarily due to lower production, higher natural gas prices and increased OM&A due to higher incentive accruals related to the Company's performance and increased general operating expenses, partially offset by lower carbon compliance costs and higher merchant pricing in Alberta, net of hedging. Carbon compliance costs were lower due to reductions in GHG emissions, lower production and utilization of our compliance credits to settle a portion of the GHG obligation, partially offset by an increase in the carbon price per tonne. Lower GHG emissions were a direct result of operating exclusively on natural gas in Alberta rather than coal, resulting in changes in the fuel mix ratio. The nine months ended Sept. 30, 2021, was also impacted by the unplanned short-term steam supply outages at the Sarnia cogeneration facility in 2021. Refer to the Alberta Electricity Portfolio section of this MD&A for further details.
Sustaining capital expenditures for the three and nine months ended Sept. 30, 2022, decreased by $23 million and $81 million, respectively, compared to the same periods in 2021, mainly due to the coal-to-gas conversions being completed in 2021.
Energy Transition
| 3 months ended Sept. 30 | 9 months ended Sept. 30 | |||||||||||||
| 2022 | 2021 | 2022 | 2021 | |||||||||||
Gross installed capacity (MW)(1) | 671 | 1,876 | 671 | 1,876 | ||||||||||
| Availability (%) | 96.6 | 85.6 | 77.4 | 76.1 | ||||||||||
Adjusted availability (%)(2) | 96.6 | 85.6 | 79.8 | 80.8 | ||||||||||
| Contract sales volume (GWh) | 839 | 839 | 2,489 | 2,490 | ||||||||||
| Merchant sales volume (GWh) | 1,251 | 1,898 | 2,780 | 3,960 | ||||||||||
| Purchased power (GWh) | (923) | (926) | (2,759) | (2,738) | ||||||||||
| Total production (GWh) | 1,167 | 1,811 | 2,510 | 3,712 | ||||||||||
Revenues(3) | 237 | 229 | 450 | 498 | ||||||||||
Fuel and purchased power(3) | 167 | 137 | 332 | 295 | ||||||||||
| Carbon compliance | 2 | 14 | (1) | 35 | ||||||||||
Gross margin(3) | 68 | 78 | 119 | 168 | ||||||||||
OM&A(3) | 17 | 23 | 50 | 69 | ||||||||||
| Taxes, other than income taxes | — | 1 | 2 | 5 | ||||||||||
| Net other operating income | — | (1) | — | (2) | ||||||||||
Adjusted EBITDA(3) | 51 | 55 | 67 | 96 | ||||||||||
| Supplemental information: | ||||||||||||||
| Highvale mine reclamation spend | 2 | 2 | 7 | 4 | ||||||||||
| Centralia mine reclamation spend | 4 | 4 | 11 | 8 | ||||||||||
| Sustaining capital | 2 | — | 18 | 13 | ||||||||||
(1) The gross installed capacity for the three and nine months ended Sept. 30, 2022, excludes Keephills Unit 1 (395 MW retired on Dec. 31, 2021), Sundance Unit 5 (406 MW retired on Nov. 1 2021) and Sundance Unit 4 (406 MW retired on March 31, 2022).
(2) Adjusted for dispatch optimization.
(3) For details of the adjustments to revenues, fuel and purchased power and OM&A included in adjusted EBITDA, refer to the Additional IFRS Measures and Non-IFRS Measures section of this MD&A.
Energy Transition segment is a new segment as described in the Segmented Financial Performance and Operating Results section of this MD&A. Included in the Energy Transition segment are the previous Centralia segment, mine assets and the previous Alberta Thermal segment facilities that were not converted to gas. The previous Alberta thermal facilities included in the Energy Transition segment include Keephills Unit 1 and Sundance Unit 4. Both units have since been retired. Previous periods have been adjusted to be comparable to the current period.
TRANSALTA CORPORATION M20
Adjusted availability, increased for the three months ended Sept. 30, 2022, compared to the same period in 2021, mainly due to lower unplanned outages at Centralia Unit 2. Adjusted availability for the nine months ended Sept. 30, 2022, decreased primarily due to the retirement of Sundance Unit 4 and Keephills Unit 1, partially offset by lower planned and unplanned outages at Centralia Unit 2.
Production, for the three and nine months ended Sept. 30, 2022, decreased by 644 GWh and 1,202 GWh, respectively, compared to the same periods in 2021, primarily due to the retirements of Keephills Unit 1 and Sundance Unit 4 and higher economic dispatch at Centralia Unit 2. For the nine months ended Sept. 30, 2022, the decrease in production is partially offset by increased production from higher availability at Centralia Unit 2.
Adjusted EBITDA, for the three and nine months ended Sept. 30, 2022, decreased by $4 million and $29 million, respectively, compared to the same periods in 2021. The decreases were primarily due to lower production and higher purchased power costs incurred due to higher power prices during outages at Centralia Unit 2 in 2022, partially offset by higher merchant pricing at Centralia and lower carbon costs in Alberta. Carbon costs were lower as the facilities in Alberta no longer operated on coal and have now been retired. For the nine months ended Sept. 30, 2022, the Company utilized 0.5 million tonnes of emission credits to settle the 2021 carbon compliance obligation, reducing our carbon compliance costs by $5 million.
Mine reclamation spend for the Highvale and Centralia mines for the three and nine months ended Sept. 30, 2022, increased due to the advancement of reclamation activities compared to the same periods in 2021.
The sustaining capital expenditures for the three and nine months ended Sept. 30, 2022, increased by $2 million and $5 million, respectively, compared to the same period in 2021, primarily due to major maintenance for the Centralia Unit 2.
Energy Marketing
| 3 months ended Sept. 30 | 9 months ended Sept. 30 | |||||||||||||
| 2022 | 2021 | 2022 | 2021 | |||||||||||
Revenues(1) | 62 | 93 | 143 | 208 | ||||||||||
| OM&A | 9 | 14 | 23 | 31 | ||||||||||
Adjusted EBITDA(1) | 53 | 79 | 120 | 177 | ||||||||||
(1) For details of the adjustments to revenues included in adjusted EBITDA, refer to the Additional IFRS Measures and Non-IFRS Measures section of this MD&A.
Adjusted EBITDA, for the three and nine months ended Sept. 30, 2022, decreased by $26 million and $57 million, respectively, compared to the same periods in 2021. The decrease for the three and nine months ended Sept. 30, 2022, exceeded segment expectations due to short-term trading of both physical and financial power and gas products across all North American markets but was below 2021 due to the exceptional results in the prior period. The Company was able to capitalize on short-term volatility in the trading markets without materially changing the risk profile of the business unit.
TRANSALTA CORPORATION M21
Corporate
| 3 months ended Sept. 30 | 9 months ended Sept. 30 | |||||||||||||
| 2022 | 2021 | 2022 | 2021 | |||||||||||
| OM&A | 30 | 23 | 71 | 55 | ||||||||||
| Taxes, other than income taxes | 1 | 1 | 1 | 1 | ||||||||||
| Adjusted EBITDA | (31) | (24) | (72) | (56) | ||||||||||
| Adjusted EBITDA | (31) | (24) | (72) | (56) | ||||||||||
| Total return swap (gains) losses | (1) | 1 | — | (4) | ||||||||||
| CEWS funding received | — | — | — | (8) | ||||||||||
| CEWS funding applied to incremental employment | 1 | 1 | 4 | 2 | ||||||||||
| Adjusted EBITDA excluding impact of total return swap and CEWS | (31) | (22) | (68) | (66) | ||||||||||
| Supplemental information: | ||||||||||||||
| Total sustaining capital | 4 | 3 | 9 | 8 | ||||||||||
Adjusted EBITDA, for the three and nine months ended Sept. 30, 2022, decreased by $7 million and $16 million, respectively, compared to the same periods in 2021. The decrease was mainly due to higher contractor costs, higher incentive accruals reflecting the Company's performance and higher general operating expenses. For the nine months ended Sept. 30, 2021, adjusted EBITDA was positively impacted by the receipt of CEWS proceeds and gains on the total return swap.
For the three and nine months ended Sept. 30, 2022, sustaining capital expenditures were consistent with the same period in 2021.
TRANSALTA CORPORATION M22
Selected Quarterly Information
Our results are seasonal due to the nature of the electricity market and related fuel costs. Higher maintenance costs are often incurred in the spring and fall when electricity prices are expected to be lower, as electricity prices generally increase in the peak winter and summer months in our main markets due to increased heating and cooling loads. Margins are also typically impacted in the second quarter due to the volume of hydro production resulting from spring runoff and rainfall in the Pacific Northwest, which impacts production at Centralia. Typically, hydroelectric facilities generate most of their electricity and revenues during the spring months when melting snow starts feeding watersheds and rivers. Inversely, wind speeds are historically greater during the cold winter months and lower in the warm summer months.
| Q4 2021 | Q1 2022 | Q2 2022 | Q3 2022 | |||||||||||
| Revenues | 610 | 735 | 458 | 929 | ||||||||||
Adjusted EBITDA(1)(2) | 243 | 259 | 279 | 555 | ||||||||||
| Earnings (loss) before income taxes | (32) | 242 | (22) | 126 | ||||||||||
Cash flow (used in) from operating activities(3) | 54 | 451 | (129) | 204 | ||||||||||
FFO(1)(2) | 186 | 179 | 220 | 488 | ||||||||||
FCF(1)(2) | 79 | 108 | 145 | 393 | ||||||||||
| Net earnings (loss) attributable to common shareholders | (78) | 186 | (80) | 61 | ||||||||||
Net earnings (loss) per share attributable to common shareholders, basic and diluted(4) | (0.29) | 0.69 | (0.30) | 0.23 | ||||||||||
| Q4 2020 | Q1 2021 | Q2 2021 | Q3 2021 | |||||||||||
| Revenues | 544 | 642 | 619 | 850 | ||||||||||
Adjusted EBITDA(1)(2) | 223 | 322 | 319 | 402 | ||||||||||
| Earnings (loss) before income taxes | (168) | 21 | 72 | (441) | ||||||||||
| Cash flow from operating activities | 110 | 257 | 80 | 610 | ||||||||||
FFO(1)(2) | 150 | 223 | 267 | 318 | ||||||||||
FCF(1)(2) | 41 | 141 | 155 | 210 | ||||||||||
| Net loss attributable to common shareholders | (167) | (30) | (12) | (456) | ||||||||||
Net loss per share attributable to common shareholders, basic and diluted(4) | (0.61) | (0.11) | (0.04) | (1.68) | ||||||||||
(1) These items are not defined and have no standardized meaning under IFRS. Refer to the Additional IFRS Measures and Non-IFRS Measures section of this MD&A.
(2) The current quarter composition was updated and the previous periods have been reported to be consistent. Refer to the Additional IFRS Measures and Non-IFRS Measures section of this MD&A.
(3) The cash flow used in operating activities for the second quarter of 2022, decreased compared to prior quarters due to unfavourable changes in working capital mainly due to movements in our collateral accounts related to higher commodity prices and volatility in the markets.
(4) Basic and diluted earnings (loss) per share attributable to common shareholders is calculated each period using the weighted average common shares outstanding during the period. As a result, the sum of the earnings (loss) per share for the four quarters making up the calendar year may sometimes differ from the annual earnings (loss) per share.
TRANSALTA CORPORATION M23
Net earnings (loss) attributable to common shareholders has also been impacted by the following variations and events:
▪The continued extended outage of the Kent Hills 1 and 2 wind facilities from the fourth quarter of 2021 to the third quarter of 2022;
▪Accelerated timing of decommissioning cash flows and change in useful lives recognized in the third quarter of 2022;
▪Insurance proceeds for the single collapsed tower at Kent Hills wind facilities of $7 million recognized in the second quarter of 2022;
▪Liquidated damages payable to the Company related to the turbine availability at the Windrise wind facility were recorded at $3 million, $7 million and $1 million in the first three quarters, respectively, of 2022;
▪Lower carbon costs in 2022 related to going off coal and the utilization of renewable energy compliance credits to settle a portion of our GHG obligation in the second quarter of 2022;
▪Keephills Unit 1 being retired in the fourth quarter of 2021 and Sundance Unit 4 being retired in the first quarter of 2022;
▪Acquisition of North Carolina Solar facility in the fourth quarter of 2021;
▪The Sundance Unit 5 Repowering project was suspended in the third quarter of 2021 and Sundance Unit 5 was retired during 2021;
▪Gains relating to the sale of the Pioneer Pipeline in the second quarter of 2021 and gains on sale of Gas equipment in the third quarter of 2021;
▪The unplanned steam supply outages at the Sarnia facility in the second quarter of 2021;
▪Alberta Hydro Assets, Keephills Units 1 and 2 and Sheerness began operating on a merchant basis in the Alberta electricity market effective Jan. 1, 2021;
▪Revenues declined due to weaker market conditions in 2020;
▪Receipt of CEWS funding in 2021;
▪Accelerated plans to shut down the Highvale mine resulting in remaining future royalty payments being recognized as an onerous contract in the third quarter of 2021;
▪Sheerness going off coal resulting in the remaining coal supply payments of the existing coal supply agreement being recognized as an onerous contract in the fourth quarter of 2020;
▪Accelerated shut-down of the Highvale mine increasing mine depreciation included in the cost of coal. Coal inventory write-down incurred in the first three quarters of 2021 and fourth quarter of 2020;
▪Coal-related parts and materials inventory write-down incurred in the second and third quarters of 2021;
▪The impact of the updated provision estimates for the AESO transmission line loss ruling during the first quarter of 2021 and the fourth quarter of 2020;
▪The effects of asset impairment charges and reversals during all periods shown;
▪The effects of changes in decommissioning provisions for retired assets in all periods shown; and
▪Current and future tax expense consistently fluctuates with earnings before tax across the quarters. Future tax expense increased from 2021 mainly due to a deferred tax write down taken against part of the Canadian operations and losses on mark to market hedging.
TRANSALTA CORPORATION M24
Strategy and Capability to Deliver Results
The Corporate strategy remains unchanged from that disclosed in the 2021 Annual MD&A.
Our goal is to be a leading customer-centered electricity company, committed to a sustainable future, focused on increasing shareholder value by growing our portfolio of high-quality generation facilities with stable and predictable cash flows. Our strategy includes meeting our customer needs for clean, low-cost, reliable electricity and providing operational excellence and continuous improvement in everything we do.
The Company's enhanced focus on renewable generation and storage solutions for customers is driven largely by global decarbonization policies and the increase in demand and growth projections in the renewable sector, namely for companies to achieve their environment, social and governance ("ESG") ambitions. Refer to the ESG sections within our 2021 Annual MD&A for further details.
We expect the Company's adjusted EBITDA generated from renewable sources, including hydro, wind, solar and storage technologies, to increase from 35 per cent in 2020 to approximately 70 per cent by the end of 2025.
On Sept. 28, 2021, the Company announced the strategic targets and a five-year Clean Electricity Growth Plan that sets a focus towards investing in clean energy solutions that meets the needs of our industrial and corporate customers and communities. The Clean Electricity Growth Plan will largely be funded from current cash balances, cash generated from operations and asset-level financing.
As of Nov. 7, 2022, we have made significant progress in achieving the targets of the Clean Electricity Growth Plan.
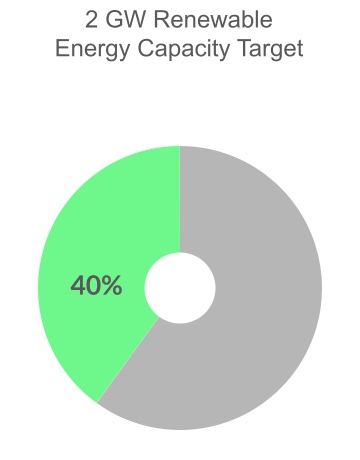
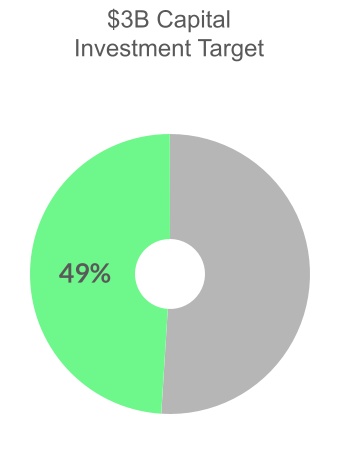
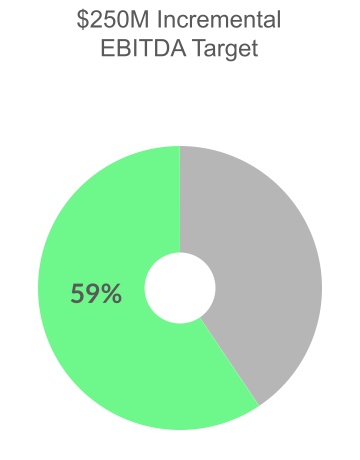

TRANSALTA CORPORATION M25
Our progress towards achieving our strategic targets is summarized below:
| Strategic Targets | |||||||||||
| Goals | Target | Results | Comments | ||||||||
| Accelerate Growth in Customer-centered Renewables and Storage | Deliver 2 GW of renewable capacity with an estimated capital investment of $3 billion by the end of 2025. | Ahead of Plan | In 2022, the Company delivered 200 MW of growth during the first quarter with the Horizon Hill wind project. We have begun construction of the Mount Keith 132kV transmission expansion in Australia. Our cumulative progress toward our plan target is 800 MW | ||||||||
| Deliver incremental average annual EBITDA of $250 million. | Ahead of Plan | The Horizon Hill wind project will add incremental EBITDA in the range of US$30 - US$33 million and the Mount Keith 132kV transmission expansion will add incremental EBITDA in the range of AU$6 - AU$7 million. Our cumulative progress towards our incremental EBITDA target is approximately $155 million. | |||||||||
| Expand the Company's development pipeline to 5 GW by 2025 to enable a two-fold increase in its renewables fleet between 2025 and 2030. | On track | The Company continues to evaluate opportunities to add new development sites to our pipeline. These include acquisitions of individual early-stage development sites, small development portfolios and prospecting of new sites. For the third quarter of 2022, we have grown our renewable development pipeline by approximately 553 MW, in the United States and Canada. | |||||||||
| Take a Targeted Approach to Diversification | Grow our asset base in our core geographies of Canada, Australia and the United States to realize diversification and value creation. | On track | The Company has successfully added new contracted renewable assets in each of its three core geographies. We have diversified within the United States market through our North Carolina Solar facility acquisition and the new Oklahoma investments which added three new investment-grade customers. | ||||||||
| Maintain Our Financial Strength and Capital Allocation Discipline | Deliver strong cash flow from our existing portfolio to allocate towards our funding priorities including growth, dividends and share buybacks. | On track | The Company had liquidity of $2.3 billion as at Sept. 30, 2022. The Company returned $34 million in share buybacks in the nine months ended Sept. 30, 2022. The Company increased the annual common share dividend by 10% to $0.22 per year effective Jan. 1, 2023. | ||||||||
| Define the Next Generation of Energy Solutions and Technologies | Meet the needs of our customers and communities through the implementation of innovative energy solutions and parallel investments in new complementary sectors by the end of 2025. | On track | The Company established an Energy Innovation team to progress our goals in this area. The team has recently completed an investment in Ekona Power Inc., an early-stage hydrogen production company, in order to pursue commercialization of low cost, net-zero aligned, hydrogen. The Company also committed to an investment in the Energy Impact Partners Investment ("EIP") Deep Decarbonization Frontier Fund 1, which provides a portfolio approach to investing in emerging technologies focused on net-zero emissions. In the second quarter of 2022, the Company made an initial investment of $7 million (US$6 million). | ||||||||
| Lead in ESG Policy Development | Actively participate in policy development to ensure the electricity we provide contributes to emissions reduction, grid reliability and competitive energy prices to enable the successful evolution of the markets in which we operate and compete. | On track | The Company is actively engaging the Government of Canada and Government of Alberta regarding the proposed federal Clean Electricity Regulation. Throughout the engagement, TransAlta continues to provide input regarding how to achieve emissions reduction while maintaining necessary reliability and affordability. | ||||||||
| Successfully Navigate through the COVID-19 Pandemic | Continue to maintain an effective response to COVID-19 and plan a safe return to our offices. | On track | Continuing to monitor local public health authority and government guidelines in all jurisdictions in which we operate to promote the health and safety of all employees and contractors with our health and safety protocols. | ||||||||
TRANSALTA CORPORATION M26
Growth
The Company announced 200 MW of new build projects in the second quarter of 2022. We have established and are continuing to grow our pipeline of potential growth projects. Our pipeline includes 322 MW of advanced stage development projects along with 3,321 to 4,421 MW of projects in earlier stages of development.
We are primarily evaluating greenfield opportunities in Alberta, Western Australia and the United States along with acquisitions in markets in which we have existing operations.
Projects Under Construction
The following projects have been approved by the Board of Directors, have executed PPAs and are currently under construction. The projects under construction will be financed through existing liquidity in the near term. We will continue to explore project financing or tax equity as a long-term financing solution on an asset-by-asset basis.
| Total project | |||||||||||||||||||||||||||||||||||||||||||||||
| Project | Type | Region | MW | Estimated spend | Spent to date | Target completion date(1) | PPA Term (2) | Average annual EBITDA(3) | Status | ||||||||||||||||||||||||||||||||||||||
| Canada | |||||||||||||||||||||||||||||||||||||||||||||||
Garden Plain(4) | Wind | AB | 130 | $190 | — | $200 | $151 | Q4 2022 | 17 | $14 - $15 | •Fully contracted •Construction underway •All wind turbine components are on site •Turbine erection and commissioning is now underway | ||||||||||||||||||||||||||||||||||||
| United States | |||||||||||||||||||||||||||||||||||||||||||||||
White Rock(5) | Wind | OK | 300 | US$470 | — | US$490 | US$154 | H2 2023 | — | US$48 - US$52 | •Long-term PPAs executed •All major equipment supply and EPC agreements executed •Detailed design and final permitting on track •Wind turbine component deliveries in-progress •Commenced site construction •On track to be completed on schedule | ||||||||||||||||||||||||||||||||||||
Horizon Hill (5) | Wind | OK | 200 | US$300 | — | US$315 | US$44 | H2 2023 | — | US$30 - US$33 | •Long-term PPA executed •All major equipment supply and EPC agreements executed •Wind turbine component deliveries in-progress •Commenced site construction •On track to be completed on schedule | ||||||||||||||||||||||||||||||||||||
| Australia | |||||||||||||||||||||||||||||||||||||||||||||||
| Northern Goldfields Solar | Hybrid Solar | WA | 48 | AU$69 | — | AU$73 | AU$53 | H1 2023 | 16 | AU$9 - AU$10 | •Construction underway •Solar panel installation is nearing completion •On track to be completed in early 2023 | ||||||||||||||||||||||||||||||||||||
| Mount Keith 132kV Expansion | Transmission | WA | n/a | AU$50 | — | AU$53 | AU$10 | H2 2023 | 15 | AU$6 - AU$7 | •EPC Agreement executed •On track to be completed on schedule | ||||||||||||||||||||||||||||||||||||
(1) H1 or H2 is defined as the first or second half of the year.
(2) The PPA term is confidential for the White Rock wind projects and Horizon Hill wind project.
(3) This item is not defined and has no standardized meaning under IFRS and is forward-looking. Please refer to the Additional IFRS measures and Non-IFRS Measures section of this MD&A for further discussion.
(4) The Garden Plain wind project PPA is fully contracted, with Pembina off-taking 100 MW of the total 130 MW capacity of the facility and the remaining 30 MW contracted to an investment-grade globally recognized customer. Refer to the Significant and Subsequent Events section of this MD&A for further details.
(5) The expected average annual EBITDA and estimated capital spending for the White Rock wind projects and Horizon Hill wind projects have been revised upwards based on the impact of the Inflation Reduction Act of 2022 ("IRA") which results in projects qualifying for 100 per cent production tax credits and incremental payments to the turbine supplier.
TRANSALTA CORPORATION M27
Advanced-stage Development
These projects have detailed engineering, advanced positions in the interconnection queue and are progressing off-take opportunities. The following table shows the pipeline of future growth projects currently under advanced-stage development:
| Project | Type | Region | Gross Installed Capacity (MW) | Estimated Spend | Average annual EBITDA(1) | ||||||||||||
| Tempest | Wind | Alberta | 100 | $210 - $230 | $20 - $23 | ||||||||||||
| SCE Capacity Expansion | Gas | Western Australia | 42 | AU$80 - AU$100 | AU$9 - AU$12 | ||||||||||||
| WaterCharger | Battery Storage | Alberta | 180 | $150 - $180 | $14 - $17 | ||||||||||||
| Australia Transmission Expansion | Transmission | Western Australia | n/a | AU$34 - AU$36 | AU$3 - AU$4 | ||||||||||||
(1) This item is not defined and has no standardized meaning under IFRS and is forward-looking. Please refer to the Additional IFRS measures and Non-IFRS Measures section of this MD&A for further discussion.
Early-stage Development
These projects are in the early stages and may or may not move ahead. Generally, these projects will have:
▪Collected meteorological data;
▪Begun securing land control;
▪Started environmental studies;
▪Confirmed appropriate access to transmission; and
▪Started preliminary permitting and other regulatory approval processes.
The following table shows the pipeline of future growth projects currently under early-stage development:
| Project | Type | Region | Gross Installed Capacity (MW) | ||||||||
| Early Stage Development | |||||||||||
| Canada | |||||||||||
| Riplinger Wind | Wind | Alberta | 300 | ||||||||
| Red Rock | Wind | Alberta | 100 | ||||||||
| Willow Creek 1 | Wind | Alberta | 70 | ||||||||
| Willow Creek 2 | Wind | Alberta | 70 | ||||||||
| Sunhills Solar | Solar | Alberta | 80 | ||||||||
| McNeil Solar | Solar | Alberta | 57 | ||||||||
| Canadian Battery Opportunity | Battery | New Brunswick | 10 | ||||||||
| Canadian Wind Opportunities | Wind | Various | 370 | ||||||||
| Brazeau Pumped Hydro | Hydro | Alberta | 300 - 900 | ||||||||
| Alberta Thermal Redevelopment | Various | Alberta | 250 - 500 | ||||||||
| Total | 1,607 - 2,457 | ||||||||||
| United States | |||||||||||
| Old Town | Wind | Illinois | 185 | ||||||||
| Trapper Valley | Wind | Wyoming | 225 | ||||||||
| Monument Road | Wind | Nebraska | 152 | ||||||||
| Dos Rios | Wind | Oklahoma | 242 | ||||||||
| Prairie Violet | Wind | Illinois | 130 | ||||||||
| Big Timber | Wind | Pennsylvania | 50 | ||||||||
| Oklahoma Solar | Solar | Oklahoma | 100 | ||||||||
| Other Wind Prospects in the United States | Wind | Various | 160 | ||||||||
| Centralia site Redevelopment | Various | Washington | 250 - 500 | ||||||||
| Total | 1,494 - 1,744 | ||||||||||
| Australia | |||||||||||
| Goldfields Expansions | Gas, Solar, Wind | Western Australia | 170 | ||||||||
| South Hedland Solar | Solar | Western Australia | 50 | ||||||||
| Total | 220 | ||||||||||
| Canada, United States and Australia | Total | 3,321 - 4,421 | |||||||||
TRANSALTA CORPORATION M28
2022 Financial Outlook
Our overall performance for the third quarter of 2022 was ahead of expectations. During the third quarter of 2022, the Company delivered significantly above financial expectations from its Alberta Electricity Portfolio, including superior revenues through sales of energy and ancillary services of the Alberta Hydro fleet. The Company has revised its guidance upwards, including raising the FCF guidance ranges by approximately $245 million at the midpoint, or 49 per cent. On Nov. 7, 2022, the Board of Directors approved an increase to the annualized dividend to $0.22 per share, beginning with the Jan. 1, 2023 dividend.
Based on results attained to date and our expectations for the balance of the year performance, the Company is revising upwards its outlook range for 2022, which is reflected in the table below:
| Measure | Updated Target 2022 | Original Target 2022 | 2021 Actual | ||||||||
Adjusted EBITDA(1)(2) | $1,380 million - $1,460 million | $1,065 million - $1,185 million | $1,286 million | ||||||||
FCF(1)(2) | $725 million - $775 million | $455 million - $555 million | $585 million | ||||||||
| Dividend | $0.20 per share annualized | $0.20 per share annualized | $0.20 per share annualized | ||||||||
(1) These items are not defined and have no standardized meaning under IFRS. Please refer to the Reconciliation of Non-IFRS Measures section of this MD&A for further discussion of these items, including, where applicable, reconciliations to measures calculated in accordance with IFRS. See also the Additional IFRS measures and Non-IFRS Measures section of this MD&A.
(2) The 2021 actual adjusted EBITDA and FCF were revised during the second quarter of 2022 to be consistent with the currently defined composition on adjusted EBITDA and FCF. Refer to the Additional IFRS Measures and Non-IFRS Measures section of this MD&A.
| Range of key 2022 power and gas price assumptions | ||||||||
| Market | Updated 2022 Expectations | Original Expectations | ||||||
| Alberta Spot ($/MWh) | $125 - $150 | $80 - $90 | ||||||
| Mid-C Spot (US$/MWh) | US$55 - US$65 | US$45 - US$55 | ||||||
| AECO Gas Price ($/GJ) | $5.00 - $6.00 | $3.60 | ||||||
Alberta spot price sensitivity: a +/- $1/MWh change in spot price is expected to have a +/- $2 million impact on adjusted EBITDA for the balance of 2022.
| Other assumptions relevant to the 2022 financial outlook | ||||||||
| Updated 2022 Expectations | Original Expectations | |||||||
| Sustaining capital | $145 million - $155 million | $150 million - $170 million | ||||||
| Energy Marketing adjusted gross margin | $145 million - $160 million | $95 million - $115 million | ||||||
Alberta Hedging
| Range of hedging assumptions | Q4 2022 | Full year 2023 | |||||||||||||||||||||
| Hedged production (GWh) | 1,850 | 5,427 | |||||||||||||||||||||
| Hedge price ($/MWh) | $95 | $78 | |||||||||||||||||||||
| Hedged gas volumes (GJ) | 19 million | 58 million | |||||||||||||||||||||
| Hedge gas prices ($/GJ) | $3.62 | $2.24 | |||||||||||||||||||||
Refer to the 2022 Financial Outlook section in our 2021 Annual MD&A for further details relating to our Outlook and related assumptions.
TRANSALTA CORPORATION M29
Operations
The following provides updates to our original assumptions included in the 2022 Financial Outlook.
Market Pricing
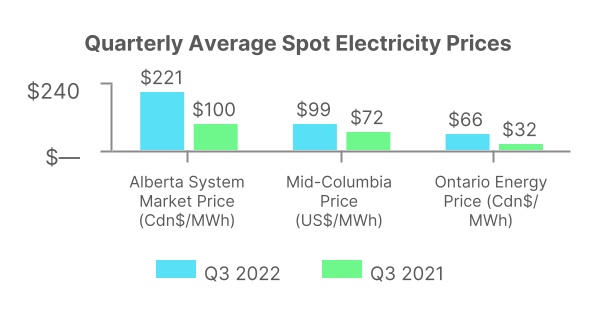
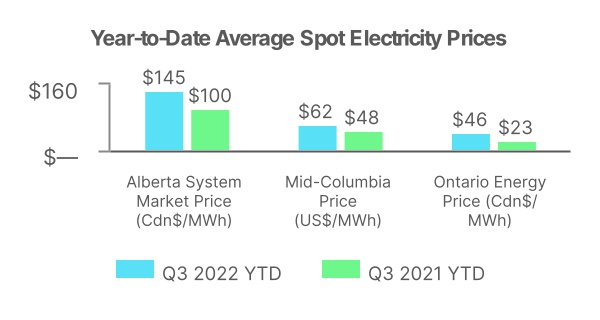
For the third quarter of 2022, strong merchant pricing levels continued in Alberta and the Pacific Northwest as a result of higher natural gas prices and robust weather-driven demand in both regions. Higher power prices in Alberta were also supported by periods of planned or unplanned outages in the province coinciding with strong demand. Prices in Alberta and the Pacific Northwest for the balance of year are now trading above last year prices primarily due to higher natural gas prices. However, actual power prices will depend on weather in the fourth quarter of 2022. Ontario power prices for both periods of 2022 were higher primarily due to higher natural gas prices.
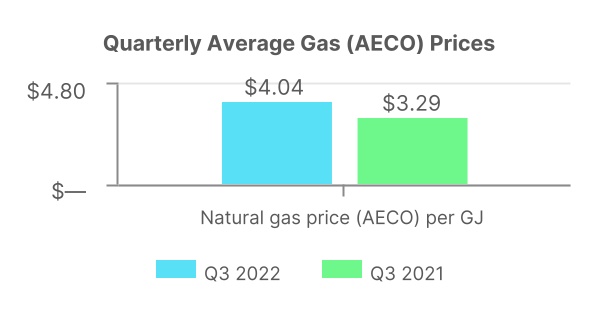
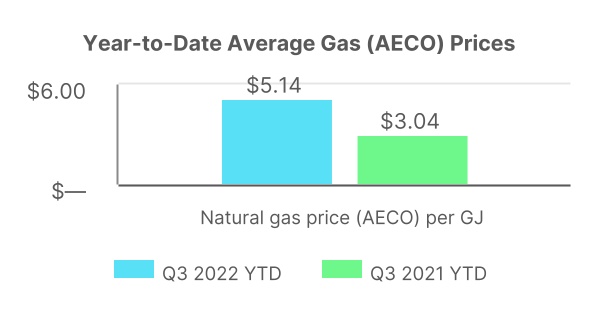
AECO natural gas prices for nine months ended Sept. 30, 2022, are approximately $2/GJ higher than for the same periods in 2021 due to overall tighter market conditions across North America.
Sustaining Capital Expenditures
Our estimate for total sustaining capital is as follows:
| Category | Spend for 3 months ended Sept. 30, 2022 | Spend to date for 9 months ended Sept. 30, 2022 | Expected spend in 2022 | ||||||||||||||||||||
| Total sustaining capital | $ | 27 | $ | 75 | $145 | - | $155 | ||||||||||||||||
The Kent Hills wind facilities rehabilitation capital expenditure has been segregated from our sustaining capital assumptions range due to the extraordinary nature of this expenditure. Refer to the Wind and Solar section of this MD&A for further details.
Liquidity and Capital Resources
We expect to maintain adequate available liquidity under our committed credit facilities, including the Term Facility (as defined below), the Company entered into during the third quarter of 2022. We currently have access to $2.3 billion in liquidity, including $0.8 billion in cash. We expect to be well-positioned to refinance the upcoming November 2022 debt maturity and the Company plans on utilizing the $400 million Term Facility for refinancing due to timing. The funds required for committed growth, Kent Hills wind facilities rehabilitation, and sustaining capital and productivity projects are not expected to be significantly impacted by the current economic environment.
TRANSALTA CORPORATION M30
Financial Position
The following table highlights significant changes in the unaudited interim condensed consolidated statements of financial position from Dec. 31, 2021 to Sept. 30, 2022:
| Assets | Sept. 30, 2022 | Dec. 31, 2021 | Increase/(decrease) | ||||||||
| Current assets | |||||||||||
| Cash and cash equivalents | 816 | 947 | (131) | ||||||||
| Trade and other receivables | 1,327 | 651 | 676 | ||||||||
| Risk management assets | 755 | 308 | 447 | ||||||||
Other current assets(1) | 318 | 291 | 27 | ||||||||
| Total current assets | 3,216 | 2,197 | 1,019 | ||||||||
| Non-current assets | |||||||||||
| Risk management assets | 226 | 399 | (173) | ||||||||
| Property, plant and equipment, net | 5,294 | 5,320 | (26) | ||||||||
Other non-current assets(2) | 1,309 | 1,310 | (1) | ||||||||
| Total non-current assets | 6,829 | 7,029 | (200) | ||||||||
| Total assets | 10,045 | 9,226 | 819 | ||||||||
| Liabilities | |||||||||||
| Current liabilities | |||||||||||
| Accounts payable and accrued liabilities | 1,279 | 689 | 590 | ||||||||
| Risk management liabilities | 854 | 261 | 593 | ||||||||
| Long-term debt and lease liabilities (current) | 722 | 844 | (122) | ||||||||
Other current liabilities(3) | 105 | 137 | (32) | ||||||||
| Total current liabilities | 2,960 | 1,931 | 1,029 | ||||||||
| Non-current liabilities | |||||||||||
| Credit facilities, long-term debt and lease liabilities | 2,487 | 2,423 | 64 | ||||||||
| Decommissioning and other provisions (long-term) | 651 | 779 | (128) | ||||||||
| Risk management liabilities (long-term) | 247 | 145 | 102 | ||||||||
| Defined benefit obligation and other long-term liabilities | 184 | 253 | (69) | ||||||||
Other non-current liabilities(4) | 1,099 | 1,102 | (3) | ||||||||
| Total non-current liabilities | 4,668 | 4,702 | (34) | ||||||||
| Total liabilities | 7,628 | 6,633 | 995 | ||||||||
| Equity | |||||||||||
| Equity attributable to shareholders | 1,538 | 1,582 | (44) | ||||||||
| Non-controlling interests | 879 | 1,011 | (132) | ||||||||
| Total equity | 2,417 | 2,593 | (176) | ||||||||
| Total liabilities and equity | 10,045 | 9,226 | 819 | ||||||||
(1) Includes restricted cash, prepaid expenses, inventory and assets held for sale.
(2) Includes investments, long-term portion of finance lease receivables, right-of-use assets, intangible assets, goodwill, deferred income tax assets and other assets.
(3) Includes current portion of decommissioning and other provisions, current portion of contract liabilities, income taxes payable and dividends payable.
(4) Includes exchangeable securities, deferred income tax liabilities and contract liabilities.
TRANSALTA CORPORATION M31
Significant changes in TransAlta's unaudited interim condensed consolidated statements of financial position were as follows:
Working Capital
The excess of current assets over current liabilities, including the current portion of long-term debt and lease liabilities, was $256 million as at Sept. 30, 2022, (Dec. 31, 2021 - $266 million). Our working capital decreased compared to the previous period mainly due to a net increase in risk management liabilities and movements in the collateral accounts. Our collateral received (included in accounts payable and accrued liabilities) is significantly higher at Sept. 30, 2022, compared to Dec. 31, 2021, and is partially offset by the collateral paid to counterparties (included in trade and other receivables). The changes in risk management assets and liabilities and collateral posted and received are largely related to high commodity prices and volatility in the markets. These decreases were partially offset by an increase in trade and other receivables due to higher revenues and the reclassification of the KH Bonds to long-term liabilities as a result of the waiver obtained in the second quarter of 2022.
Current assets increased by $1,019 million to $3,216 million as at Sept. 30, 2022, from $2,197 million as at Dec. 31, 2021, mainly due to higher trade and other receivables due to higher revenues, higher collateral posted and higher risk management assets resulting from volatility in market prices, partially offset by lower cash and cash equivalents. As at Sept. 30, 2022, the Company had provided $315 million (Dec. 31, 2021 - $55 million) of cash collateral related to derivative instruments in a net liability position.
Current liabilities increased by $1,029 million from $1,931 million as at Dec. 31, 2021, to $2,960 million as at Sept. 30, 2022, mainly due to an increase in accounts payable and accrued liabilities due to higher collateral received associated with counterparty obligations and an increase in risk management liabilities primarily due to volatility in market prices across multiple markets; partially offset by repayments of the current portion of long- term debt and the reclassification of the KH Bonds to long-term as a result of the waiver obtained. As at Sept. 30, 2022, the Company held $395 million (Dec. 31, 2021 - $18 million) of cash collateral received related to derivative instruments in a net asset position.
Non-current Assets
Non-current assets as at Sept. 30, 2022, are $6,829 million, a decrease of $200 million from $7,029 million as at Dec. 31, 2021. The decrease was primarily due to lower risk management assets due to volatility in market pricing across multiple markets and contract settlements. PP&E decreased as a result of increased discount rates on decommissioning provisions by $125 million, impairment of assets of $56 million, and depreciation, including an adjustment to the useful lives of certain gas assets which increased depreciation expense by approximately $64 million. These decreases to PP&E were partially offset by additions of $481 million primarily for the construction of the White Rock wind projects, the Garden Plain wind project, the Horizon Hill wind project, the Northern Goldfields solar project, Kent Hills rehabilitation costs and other planned major maintenance and $40 million related to change in timing of estimates for decommissioning and restoration provisions.
Non-current Liabilities
Non-current liabilities as at Sept. 30, 2022, are $4,668 million, a decrease of $34 million from $4,702 million as at Dec. 31, 2021, mainly due to an increase in discount rates driven by market benchmark rates resulting in a decrease in the long-term decommissioning provision of $227 million and a decrease in the defined benefit obligation of $46 million. In addition, these decreases were partially offset by a $90 million increase in the decommissioning provision related to revisions of estimated cash flows, a voluntary contribution of $35 million to improve the funded status of the Sunhills Mining Ltd. Pension Plan, a $64 million increase in long-term debt, net of the scheduled debt repayments, resulting from the reclassification of the KH Bonds to long-term as a result of the waiver obtained and an increase in risk management liabilities of $102 million due to the volatility in across multiple markets and new contracts.
Total Equity
As at Sept. 30, 2022, the decrease in total equity of $176 million was mainly due to net losses on cash flow hedges of $230 million, distributions to non-controlling interests of $126 million, share repurchases under the NCIB of $34 million, and common share and preferred share dividends of $27 million and $21 million, respectively, partially offset by net earnings for the period of $243 million and actuarial gains on defined benefit plans of $36 million.
TRANSALTA CORPORATION M32
Financial Capital
The Company is focused on maintaining a strong balance sheet and financial position to ensure access to sufficient financial capital.
Capital Structure
Our capital structure consists of the following components as shown below:
| Sept. 30, 2022 | Dec. 31, 2021 | |||||||||||||||||||
| $ | % | $ | % | |||||||||||||||||
| TransAlta Corporation | ||||||||||||||||||||
| Net senior unsecured debt | ||||||||||||||||||||
| Recourse debt - CAD debentures | 251 | 5 | 251 | 4 | ||||||||||||||||
| Recourse debt - US senior notes | 951 | 17 | 888 | 16 | ||||||||||||||||
| Other | 2 | — | 4 | — | ||||||||||||||||
| Less: cash and cash equivalents | (587) | (11) | (703) | (12) | ||||||||||||||||
Less: other cash and liquid assets(1) | (32) | (1) | (19) | — | ||||||||||||||||
| Net senior unsecured debt | 585 | 10 | 421 | 8 | ||||||||||||||||
| Other debt liabilities | ||||||||||||||||||||
| Exchangeable debentures | 338 | 6 | 335 | 6 | ||||||||||||||||
| Non-recourse debt | ||||||||||||||||||||
| TAPC Holdings LP bond | 96 | 2 | 102 | 2 | ||||||||||||||||
| OCP bond | 241 | 4 | 263 | 5 | ||||||||||||||||
| Lease liabilities | 81 | 2 | 78 | 1 | ||||||||||||||||
| Total net debt - TransAlta Corporation | 1,341 | 24 | 1,199 | 22 | ||||||||||||||||
| TransAlta Renewables | ||||||||||||||||||||
| Net TransAlta Renewables reported debt | ||||||||||||||||||||
| Pingston bond | 45 | 1 | 45 | 1 | ||||||||||||||||
| Melancthon Wolfe Wind bond | 219 | 4 | 235 | 4 | ||||||||||||||||
| New Richmond Wind bond | 116 | 2 | 120 | 2 | ||||||||||||||||
| Kent Hills Wind bond | 209 | 4 | 221 | 4 | ||||||||||||||||
| Windrise Wind bond | 170 | 3 | 171 | 3 | ||||||||||||||||
| Lease liabilities | 23 | — | 22 | — | ||||||||||||||||
| Less: cash and cash equivalents | (229) | (3) | (244) | (4) | ||||||||||||||||
| Debt on TransAlta Renewables Economic Investments | ||||||||||||||||||||
US tax equity financing(2) | 127 | 2 | 135 | 2 | ||||||||||||||||
South Hedland non-recourse debt(3) | 679 | 12 | 732 | 13 | ||||||||||||||||
| Total net debt - TransAlta Renewables | 1,359 | 25 | 1,437 | 25 | ||||||||||||||||
Total consolidated net debt(4)(5) | 2,700 | 49 | 2,636 | 47 | ||||||||||||||||
| Non-controlling interests | 879 | 16 | 1,011 | 18 | ||||||||||||||||
Exchangeable preferred securities(5) | 400 | 7 | 400 | 7 | ||||||||||||||||
| Equity attributable to shareholders | ||||||||||||||||||||
| Common shares | 2,879 | 52 | 2,901 | 51 | ||||||||||||||||
| Preferred shares | 942 | 17 | 942 | 17 | ||||||||||||||||
| Contributed surplus, deficit and accumulated other comprehensive income | (2,283) | (41) | (2,261) | (40) | ||||||||||||||||
| Total capital | 5,517 | 100 | 5,629 | 100 | ||||||||||||||||
(1) Includes principal portion of OCP restricted cash and fair value asset (liability) of hedging instruments on debt.
(2) TransAlta Renewables has an economic interest in the entities holding these debts.
(3) TransAlta Renewables has an economic interest in the Australia entities, which includes the AU$789 million senior secured notes.
(4) The tax equity financing for Skookumchuck wind facility, an equity accounted joint venture, is not represented in these amounts.
(5) The total consolidated net debt excludes the exchangeable preferred securities as they are considered equity with dividend payments for credit purposes.
TRANSALTA CORPORATION M33
Credit Facilities
The Company's credit facilities are summarized in the table below:
| As at Sept. 30, 2022 | Facility size | Utilized | Available capacity | Maturity date | |||||||||||||
Outstanding letters of credit(1) | Actual drawings | ||||||||||||||||
| TransAlta Corporation | |||||||||||||||||
Committed syndicated bank facility(2) | 1,250 | 753 | — | 497 | Q2 2026 | ||||||||||||
| Canadian committed bilateral credit facilities | 240 | 208 | — | 32 | Q2 2024 | ||||||||||||
| Term Facility | 400 | — | — | 400 | Q3 2024 | ||||||||||||
| TransAlta Renewables | |||||||||||||||||
Committed credit facility(2) | 700 | 102 | — | 598 | Q2 2026 | ||||||||||||
| Total | 2,590 | 1,063 | — | 1,527 | |||||||||||||
(1) TransAlta has obligations to issue letters of credit and cash collateral to secure potential liabilities to certain parties, including those related to potential environmental obligations, commodity risk management and hedging activities, pension plan obligations, construction projects and purchase obligations. As at Sept. 30, 2022, we provided cash collateral of $315 million.
(2) TransAlta has letters of credit of $154 million and TransAlta Renewables has letters of credit of $102 million issued from uncommitted demand facilities; these obligations are backstopped and reduce the available capacity on the committed credit facilities.
During the second quarter of 2022, the committed syndicated credit facilities were extended by one year to June 30, 2026, and the committed bilateral credit facilities were extended by one year to June 30, 2024.
During the third quarter of 2022, the Company closed a two-year floating rate term facility with its banking syndicate for $400 million ("Term Facility") with a maturity date of Sept. 7, 2024. The Term Facility has interest rates that vary depending on the option selected (Canadian prime and bankers' acceptances, etc.)
Non-Recourse Debt
The Melancthon Wolfe Wind LP, Pingston Power Inc., TAPC Holdings LP, New Richmond Wind LP, Kent Hills Wind LP, TEC Hedland PTY Ltd notes, Windrise Wind LP and TransAlta OCP LP non-recourse bonds are subject to customary financing conditions and covenants that may restrict the Company’s ability to access funds generated by the facilities’ operations. Upon meeting certain distribution tests, typically performed once per quarter, the funds are able to be distributed by the subsidiary entities to their respective parent entity. These conditions include meeting a debt service coverage ratio prior to distribution, which was met by these entities in the third quarter of 2022, except in relation to the KH Bonds as discussed below. The next debt service coverage ratio is calculated in the fourth quarter of 2022.
Kent Hills Wind Facilities Rehabilitation
During the second quarter of 2022, the Company obtained a waiver and entered into a supplemental indenture that facilitated the rehabilitation of the Kent Hills 1 and 2 wind facilities. Upon receipt of the waiver, the Company reclassified a portion of the carrying value outstanding for the KH Bonds to non-current liabilities with the exception of the scheduled principal repayments due within the next twelve months from June 30, 2022. In accordance with the supplemental indenture, KHLP cannot make any distributions to its partners until the foundation replacement work has been completed.
Scheduled Debt Maturities
Between 2022 and 2024, we have $877 million of debt maturing, including $548 million of recourse debt, with the balance mainly related to scheduled non-recourse debt repayments. We currently expect to refinance the maturing senior notes.
TRANSALTA CORPORATION M34
Returns to Providers of Capital
Net Interest Expense
The components of net interest expense are shown below:
| 3 months ended Sept. 30 | 9 months ended Sept. 30 | |||||||||||||
| 2022 | 2021 | 2022 | 2021 | |||||||||||
| Interest on debt | 42 | 41 | 123 | 121 | ||||||||||
| Interest on exchangeable debentures | 7 | 8 | 22 | 22 | ||||||||||
| Interest on exchangeable preferred shares | 7 | 7 | 21 | 21 | ||||||||||
| Interest income | (7) | (2) | (14) | (8) | ||||||||||
| Capitalized interest | (4) | (5) | (8) | (13) | ||||||||||
| Interest on lease liabilities | 1 | 1 | 4 | 5 | ||||||||||
| Credit facility fees, bank charges and other interest | 5 | 4 | 16 | 14 | ||||||||||
| Tax shield on tax equity financing | (1) | — | (4) | 1 | ||||||||||
| Accretion of provisions | 16 | 9 | 35 | 23 | ||||||||||
| Net interest expense | 66 | 63 | 195 | 186 | ||||||||||
Net interest expense for the three and nine months ended Sept. 30, 2022, increased mainly due to higher accretion of provisions and lower capitalized interest, partially offset by higher interest income due to favourable interest rates.
Share Capital
The following tables outline the common and preferred shares issued and outstanding:
| As at | Nov. 7, 2022 | Sept. 30, 2022 | Dec. 31, 2021 | ||||||||
Number of shares (millions) | |||||||||||
| Common shares issued and outstanding, end of period | 269.4 | 269.4 | 271.0 | ||||||||
| Preferred shares | |||||||||||
| Series A | 9.6 | 9.6 | 9.6 | ||||||||
| Series B | 2.4 | 2.4 | 2.4 | ||||||||
Series C(1) | 10.0 | 10.0 | 11.0 | ||||||||
Series D(1) | 1.0 | 1.0 | — | ||||||||
| Series E | 9.0 | 9.0 | 9.0 | ||||||||
| Series G | 6.6 | 6.6 | 6.6 | ||||||||
| Preferred shares issued and outstanding in equity, end of period | 38.6 | 38.6 | 38.6 | ||||||||
Series I - Exchangeable Securities(2) | 0.4 | 0.4 | 0.4 | ||||||||
| Preferred shares issued and outstanding, end of period | 39.0 | 39.0 | 39.0 | ||||||||
(1) During the second quarter of 2022, the Company has converted 1,044,299 of its 11,000,000 currently outstanding Series C Shares, on a one-for-one basis, into Series D Shares.
(2) Brookfield invested $400 million in consideration for redeemable, retractable, first preferred shares. For accounting purposes, these preferred shares are considered debt and disclosed as such in the audited annual consolidated financial statements.
Non-Controlling Interests
As at Sept. 30, 2022, the Company owns 60.1 per cent (Sept. 30, 2021 - 60.1 per cent) of TransAlta Renewables. TransAlta Renewables is a publicly traded company whose common shares are listed on the TSX under the symbol “RNW.” TransAlta Renewables holds a diversified, highly contracted portfolio of assets with comparatively lower carbon intensity.
The Company also own 50.01 per cent (Sept. 30, 2021 - 50.01 per cent) of TA Cogen, which owns, operates or has an interest in five natural-gas-fired facilities (Ottawa, Windsor, Fort Saskatchewan and Sheerness Unit 1 and Unit 2).
TRANSALTA CORPORATION M35
Since we own a controlling interest in TA Cogen and TransAlta Renewables, we consolidate the entire earnings, assets and liabilities in relation to those assets.
Reported earnings attributable to non-controlling interests for the three and nine months ended Sept. 30, 2022, were $24 million and $55 million, respectively, a decrease of $3 million and $33 million compared to the same periods in 2021.
Earnings from TA Cogen increased by $15 million for the three months ended Sept. 30, 2022, compared with the same period in 2021, due to higher realized pricing in Alberta, partially offset by higher gas prices, higher gas transportation costs and lower production at Sheerness. Earnings from TA Cogen decreased by $3 million for the nine months ended Sept. 30, 2022, compared to the same period in 2021 due to lower production, higher gas prices and higher transportation rates partially offset by higher realized pricing and lower coal costs.
Earnings from TransAlta Renewables for the three and nine months ended Sept. 30, 2022, decreased by $18 million and $30 million, respectively, compared with the same periods in 2021. This was primarily due to lower finance income related to subsidiaries of TransAlta, higher asset impairment charges, higher interest expense and lower foreign exchange gains. For the nine months ended Sept. 30, 2022, these were partially offset by the recognition of insurance proceeds for the replacement costs for the single collapsed tower at the Kent Hills facility, lower income tax expense and liquidated damages recognized related to turbine availability at the Windrise wind facility. Finance income related to subsidiaries of TransAlta was lower as more distributions were classified as return of capital.
Other Consolidated Analysis
Kent Hills Loan
During the nine months ended Sept. 30, 2022, the loan receivable agreement with KHLP's 17 per cent partner, Natural Forces Technologies Inc., was amended and its original maturity date of Oct. 2, 2022, was extended to October 2027. In addition, KHLP received repayment of $14 million of the KHLP loan receivable, which was required as part of the waiver and amendment made to the KH Bonds. As at Sept. 30, 2022, $41 million (Dec. 31, 2021 — $55 million) was outstanding.
Commitments
Please refer to our Other Consolidated Analysis section of the 2021 Annual MD&A for a complete listing of commitments we have incurred either directly or through interests in joint operations. The Company has entered into the following material contractual commitments, as at Sept. 30, 2022:
During the second quarter of 2022, the Company entered into an engineering, procurement and construction agreement for approximately $37 million (AU$41 million) related to the Mount Keith 132kV Expansion. In addition, the Company entered into agreements for $100 million to complete the rehabilitation at the Kent Hills 1 and 2 wind facilities in 2022.
For updates on the Company's growth projects, refer to the Strategy and Capability to Deliver Results section of this MD&A for further details.
Contingencies
For the current material outstanding contingencies, please refer to Note 36 of the 2021 audited annual consolidated financial statements. Material changes to the contingencies have been described below.
Hydro Power Purchase Arrangement ("Hydro PPA") Emission Performance Credits
The Balancing Pool is claiming entitlement to the emission performance credits ("EPCs") earned by the Alberta Hydro facilities as a result of TransAlta opting those facilities into the Carbon Competitiveness Incentive Regulation and Technology Innovation and Emissions Reduction Regulation from 2018-2020 inclusive. The Balancing Pool claims ownership of the EPCs because it believes the change-in-law provisions under the Hydro PPA require the EPCs to be passed through to the Balancing Pool. TransAlta has not received any benefit from the EPCs nor from any purported change in law and believes that the Balancing Pool has no rights to these credits. An arbitration has commenced and the hearing is scheduled for Feb. 6 to 10, 2023. TransAlta holds approximately 1,750,000 EPCs with no recorded book value that were created between 2018-2020, which are at risk as a result of the Balancing Pool's claim.
TRANSALTA CORPORATION M36
Keephills Unit 1 Stator Force Majeure
The Balancing Pool and ENMAX were seeking to set aside an arbitration award on the basis that they did not receive a fair hearing. The Alberta Court of Queen’s Bench dismissed the Balancing Pool and ENMAX’s allegations of unfairness on June 26, 2019. The Balancing Pool and ENMAX appealed this decision to the Court of Appeal, which was heard on Jan. 27, 2022.
On June 9, 2022, the Court of Appeal released a unanimous decision dismissing ENMAX and the Balancing Pool's application. The Court of Appeal upheld the Company’s claim of force majeure that arose when its Keephills Unit 1 generating unit tripped offline in 2013. As a result of the decision, the Company’s claim of force majeure remains valid and the associated costs of the force majeure event will not be reassessed against TransAlta. ENMAX and the Balancing Pool did not seek leave to appeal this decision to the Supreme Court of Canada, which concludes this matter.
Keephills Unit 2 Stator Force Majeure
After the Keephills Unit 1 stator force majeure outage in 2013, it was determined that Keephills Unit 2 could face a similar stator failure before the next planned outage. In response, the Company took Keephills Unit 2 offline between January 31, 2014, and March 15, 2014, to perform a full rewind of the generator stator and claimed force majeure. The Balancing Pool disputed this force majeure event but the dispute was held in abeyance pending the outcome of the Keephills Unit 1 stator force majeure dispute, which was recently concluded. The Company and the Balancing Pool recently settled this dispute and so both stator force majeure claims have been resolved.
Sarnia Outages
The Sarnia cogeneration facility experienced three separate events between May 19, 2021, and June 9, 2021, that resulted in steam interruptions to its industrial customers. As a result, the customers have submitted claims for liquidated damages. Steam supply disruptions of this nature are atypical and infrequent at the Sarnia cogeneration facility. A root cause failure analysis was completed for the three outages, which concluded that all three outages were within TransAlta (SC) LP’s control. As such, liquidated damages previously included in contract liabilities in the amount of $12 million have been paid by TransAlta (SC) LP during the second quarter of 2022.
There have been no other material updates to any of the contingencies in the three and nine months ended Sept. 30, 2022.
TRANSALTA CORPORATION M37
Cash Flows
The following chart highlights significant changes in the consolidated statements of cash flows:
| 9 months ended Sept. 30 | |||||||||||
| 2022 | 2021 | Increase/ (decrease) | |||||||||
| Cash and cash equivalents, beginning of period | 947 | 703 | 244 | ||||||||
| Provided by (used in): | |||||||||||
| Operating activities | 526 | 947 | (421) | ||||||||
| Investing activities | (341) | (202) | (139) | ||||||||
| Financing activities | (315) | (364) | 49 | ||||||||
| Translation of foreign currency cash | (1) | (4) | 3 | ||||||||
| Cash and cash equivalents, end of period | 816 | 1,080 | (264) | ||||||||
Cash provided by operating activities for the nine months ended Sept. 30, 2022, decreased compared with the same period in 2021 primarily due to unfavourable changes in working capital mainly from higher accounts receivable and movements in the collateral accounts related to high commodity prices and volatility in the markets.
Cash used in investing activities for the nine months ended Sept. 30, 2022, increased compared with the same period in 2021, largely due to:
▪Previous year included proceeds received on the sale of the Pioneer Pipeline ($128 million); and
▪Higher cash spend on project construction activities in PP&E ($137 million) partially offset by:
•Lower non-cash working capital related to the timing of construction payables for the assets under construction ($109 million);
•Higher loan receivable receipts ($14 million); and
•Higher restricted cash receipts related to funding principal debt repayments ($8 million).
Cash used in financing activities for the nine months ended Sept. 30, 2022, decreased compared with the same period in 2021, largely due to:
▪Lower repayments under the Company's credit facilities ($114 million); partially offset by:
•Higher repayments on long-term debt ($17 million);
•Higher common share repurchases under the NCIB ($24 million);
•Higher dividends paid on common shares and preferred shares ($6 million);
•Increased distributions paid to subsidiaries' non-controlling interests ($9 million); and
•Lower proceeds on issuances of common shares ($7 million).
Financial Instruments
Refer to Note 15 of the notes to the audited annual 2021 consolidated financial statements, and Note 11 and 12 of our unaudited interim condensed consolidated financial statements as at and for the nine months ended Sept. 30, 2022, for details on Financial Instruments.
We may enter into commodity transactions involving non-standard features for which observable market data is not available. These are defined under IFRS as Level III financial instruments. Level III financial instruments are not traded in an active market and fair value is, therefore, developed using valuation models based upon internally developed assumptions or inputs. Our Level III fair values are determined using data such as unit availability, transmission congestion, or demand profiles. Fair values are validated every quarter by using reasonably possible alternative assumptions as inputs to valuation techniques and any material differences are disclosed in the notes to the financial statements.
At Sept. 30, 2022, Level III instruments had a net liability carrying value of $611 million (Dec. 31, 2021 - net asset of $159 million), which are primarily attributable to volatility in market prices across multiple markets on both existing contracts and new contracts as well as contract settlements.
Our risk management profile and practices have not changed materially from Dec. 31, 2021.
TRANSALTA CORPORATION M38
Additional IFRS Measures and Non-IFRS Measures
An additional IFRS measure is a line item, heading or subtotal that is relevant to an understanding of the unaudited interim condensed consolidated financial statements but is not a minimum line item mandated under IFRS, or the presentation of a financial measure that is relevant to an understanding of the consolidated financial statements but is not presented elsewhere in the consolidated financial statements. We have included line items entitled gross margin and operating income (loss) in our unaudited interim condensed consolidated statements of earnings (loss) for the three and nine months ended Sept. 30, 2022, and 2021. Presenting these line items provides management and investors with a measurement of ongoing operating performance that is readily comparable from period to period.
We use a number of financial measures to evaluate our performance and the performance of our business segments, including measures and ratios that are presented on a non-IFRS basis, as described below. Unless otherwise indicated, all amounts are in Canadian dollars and have been derived from our audited annual 2021 consolidated financial statements and the unaudited interim condensed consolidated statements of earnings (loss) for the three and nine months ended Sept. 30, 2022, prepared in accordance with IFRS. We believe that these non-IFRS amounts, measures and ratios, read together with our IFRS amounts, provide readers with a better understanding of how management assesses results.
Non-IFRS amounts, measures and ratios do not have standardized meanings under IFRS. They are unlikely to be comparable to similar measures presented by other companies and should not be viewed in isolation from, or as an alternative for, or more meaningful than our IFRS results.
Non-IFRS Financial Measures
Adjusted EBITDA, FFO, FCF, total net debt, total consolidated net debt and adjusted net debt are non-IFRS measures that are presented in this MD&A. Refer to the Segmented Financial Performance and Operating Results, Selected Quarterly Information, Financial Capital and Key Financial Non-IFRS Ratios sections of this MD&A for additional information, including a reconciliation of such non-IFRS measures to the most comparable IFRS measure.
Adjusted EBITDA
In the fourth quarter of 2021, comparable EBITDA was relabeled as adjusted EBITDA to align with industry standard terminology. Each business segment assumes responsibility for its operating results measured by adjusted EBITDA. Adjusted EBITDA is an important metric for management that represents our core business profitability. In the second quarter of 2022, our adjusted EBITDA composition was adjusted to include the impact of closed positions that are effectively settled by offsetting positions with the same counterparty to reflect the performance of the assets and Energy Marketing segment in the period in which the transactions occur. Accordingly, the Company has applied this composition to all previously reported periods. Interest, taxes, depreciation and amortization are not included, as differences in accounting treatments may distort our core business results. In addition, certain reclassifications and adjustments are made to better assess results excluding those items that may not be reflective of ongoing business performance. This presentation may facilitate the readers' analysis of trends. Adjusted EBITDA is a non-IFRS measure. The following are descriptions of the adjustments made.
Adjustments to revenue
▪Certain assets we own in Canada and in Australia are fully contracted and recorded as finance leases under IFRS. We believe it is more appropriate to reflect the payments we receive under the contracts as a capacity payment in our revenues instead of as finance lease income and a decrease in finance lease receivables.
▪Adjusted EBITDA is adjusted to exclude the impact of unrealized mark-to-market gains or losses and unrealized foreign exchange gains or losses on commodity transactions.
▪Gains and losses related to closed positions effectively settled by offsetting positions with exchanges have been recorded in the period the positions are settled.
TRANSALTA CORPORATION M39
Adjustments to fuel and purchased power
▪We adjust for depreciation on our mining equipment included in fuel and purchased power.
▪We adjust for items resulting from the decision to accelerate being off-coal and accelerating the shut-down of the Highvale mine at the end of 2021 as it is not reflective of ongoing business performance. Within fuel and purchased power this included coal inventory write-downs.
▪On the commissioning of the South Hedland facility in July 2017, we prepaid approximately $74 million of electricity transmission and distribution costs. Interest income is recorded on the prepaid funds. We reclassify this interest income as a reduction in the transmission and distribution costs expensed each period to reflect the net cost to the business.
Adjustments to earnings (loss) in addition to interest, taxes, depreciation and amortization
▪Asset impairment charges are removed as these are accounting adjustments that impact depreciation and amortization and do not reflect current business performance.
▪Any gains or losses on asset sales or foreign exchange gains or losses are not included as these are not part of operating income.
Adjustments to Net Other Operating (Income) loss
▪Insurance recoveries related to the Kent Hills tower collapse are not included as these relate to investing activities and are not reflective of ongoing business performance. Refer to the Wind and Solar section of this MD&A for further details.
Adjustments for equity accounted investments
▪During the fourth quarter of 2020, we acquired a 49 per cent interest in the Skookumchuck wind facility, which is treated as an equity investment under IFRS and our proportionate share of the net earnings is reflected as equity income on the statement of earnings under IFRS. As this investment is part of our regular power-generating operations, we have included our proportionate share of the adjusted EBITDA of Skookumchuck wind facility in our total adjusted EBITDA. In addition, in the Wind and Solar segment adjusted results, we have included our proportionate share of revenues and expenses to reflect the full operational results of this investment. We have not included equity interest for the EMG International LLC ("EMG") adjusted EBITDA in our total adjusted EBITDA as it does not represent our regular power-generating operations.
Average Annual EBITDA
Average annual EBITDA is a non-IFRS financial measure that is forward-looking, used to show the average annual EBITDA that the project currently under construction is expected to generate upon completion.
Funds From Operations ("FFO")
FFO is an important metric as it provides a proxy for cash generated from operating activities before changes in working capital and provides the ability to evaluate cash flow trends in comparison with results from prior periods. FFO is a non-IFRS measure.
Adjustments to cash from operations
▪Includes FFO related to the Skookumchuck wind facility, which is treated as an equity accounted investment under IFRS and equity income, net of distributions from joint ventures is included in cash flow from operations under IFRS. As this investment is part of our regular power-generating operations, we have included our proportionate share of FFO.
▪Payments received on finance lease receivables reclassified to reflect cash from operations.
▪We adjust for items included in cash from operations related to the decision in 2020 to accelerate being off-coal and accelerating the shut-down of the Highvale mine by the end of 2021, the write-down on parts and material inventory for our coal operations and voluntary contribution made to fund the Sunhills Mining Ltd. Pension Plan (under the "Clean energy transition provisions and adjustments").
▪Cash received/paid on closed positions are reflected in the period that the position is settled.
TRANSALTA CORPORATION M40
Free Cash Flow ("FCF")
FCF is an important metric as it represents the amount of cash that is available to invest in growth initiatives, make scheduled principal repayments on debt, repay maturing debt, pay common share dividends or repurchase common shares. Changes in working capital are excluded so FFO and FCF are not distorted by changes that we consider temporary in nature, reflecting, among other things, the impact of seasonal factors and the timing of receipts and payments. FCF is a non-IFRS measure.
Non-IFRS Ratios
FFO per share, FCF per share and adjusted net debt to adjusted EBITDA are non-IFRS ratios that are presented in the MD&A. Refer to the Reconciliation of Cash Flow from Operations to FFO and FCF and Key Financial Non-IFRS Ratios sections of this MD&A for additional information.
FFO per share and FCF per share
FFO per share and FCF per share are calculated using the weighted average number of common shares outstanding during the period. FFO per share and FCF per share are a non-IFRS ratios.
Supplementary Financial Measures
Financial highlights presented on a proportional basis of TransAlta Renewables, deconsolidated adjusted EBITDA, deconsolidated FFO and deconsolidated net debt to deconsolidated adjusted EBITDA are supplementary financial measures the Company uses to present adjusted EBITDA on a deconsolidated basis and excludes the portion of TransAlta Renewables and TA Cogen that are not owned by TransAlta. Refer to the Financial Highlights on a Proportional Basis of TransAlta Renewables and Key Financial Non-IFRS Ratios sections of this MD&A for additional information.
The Alberta Electricity Portfolio metrics disclosed are also supplementary financial measures used to present the gross margin by segment within the Alberta Electricity Portfolio. Refer to the Alberta Electricity Portfolio section of this MD&A for additional information.
TRANSALTA CORPORATION M41
Reconciliation of Non-IFRS Measures on a Consolidated Basis by Segment
The following table reflects adjusted EBITDA by segment and provides reconciliation to earnings before income taxes for the three months ended Sept. 30, 2022:
| Hydro | Wind & Solar(1) | Gas(2) | Energy Transition(3) | Energy Marketing | Corporate | Total | Equity accounted investments(1) | Reclass Adjustments | IFRS Financials | |||||||||||||||||||||||
| Revenues | 265 | 14 | 372 | 231 | 54 | (4) | 932 | (3) | — | 929 | ||||||||||||||||||||||
| Reclassifications and adjustments: | ||||||||||||||||||||||||||||||||
| Unrealized mark-to-market (gain) loss | — | 53 | 47 | 6 | 46 | — | 152 | — | (152) | — | ||||||||||||||||||||||
| Realized (gain) loss on closed exchange positions | — | — | (4) | — | (38) | — | (42) | — | 42 | — | ||||||||||||||||||||||
| Decrease in finance lease receivable | — | — | 12 | — | — | — | 12 | — | (12) | — | ||||||||||||||||||||||
| Finance lease income | — | — | 4 | — | — | — | 4 | — | (4) | — | ||||||||||||||||||||||
| Adjusted revenues | 265 | 67 | 431 | 237 | 62 | (4) | 1,058 | (3) | (126) | 929 | ||||||||||||||||||||||
| Fuel and purchased power | 7 | 6 | 167 | 167 | — | 1 | 348�� | — | — | 348 | ||||||||||||||||||||||
| Reclassifications and adjustments: | ||||||||||||||||||||||||||||||||
| Australian interest income | — | — | (1) | — | — | — | (1) | — | 1 | — | ||||||||||||||||||||||
| Adjusted fuel and purchased power | 7 | 6 | 166 | 167 | — | 1 | 347 | — | 1 | 348 | ||||||||||||||||||||||
| Carbon compliance | — | — | 26 | 2 | — | (5) | 23 | — | — | 23 | ||||||||||||||||||||||
| Gross margin | 258 | 61 | 239 | 68 | 62 | — | 688 | (3) | (127) | 558 | ||||||||||||||||||||||
| OM&A | 12 | 19 | 49 | 17 | 9 | 30 | 136 | (1) | — | 135 | ||||||||||||||||||||||
| Taxes, other than income taxes | 1 | 1 | 5 | — | — | 1 | 8 | — | — | 8 | ||||||||||||||||||||||
| Net other operating income | — | (1) | (10) | — | — | — | (11) | — | — | (11) | ||||||||||||||||||||||
Adjusted EBITDA(4) | 245 | 42 | 195 | 51 | 53 | (31) | 555 | |||||||||||||||||||||||||
| Equity income | 1 | |||||||||||||||||||||||||||||||
| Finance lease income | 4 | |||||||||||||||||||||||||||||||
| Depreciation and amortization | (179) | |||||||||||||||||||||||||||||||
| Asset impairment charges | (70) | |||||||||||||||||||||||||||||||
| Net interest expense | (66) | |||||||||||||||||||||||||||||||
| Foreign exchange gain | 6 | |||||||||||||||||||||||||||||||
| Gain on sale of assets and other | 4 | |||||||||||||||||||||||||||||||
| Earnings before income taxes | 126 | |||||||||||||||||||||||||||||||
(1) The Skookumchuck wind facility has been included on a proportionate basis in the Wind and Solar segment.
(2) Includes the segments previously known as Australian Gas and North American Gas and the gas generation assets from the segment previously known as Alberta Thermal.
(3) Includes the segment previously known as Centralia and the coal generation assets from the segment previously known as Alberta Thermal.
(4) Adjusted EBITDA is not defined and has no standardized meaning under IFRS. Refer to the Additional IFRS Measures and Non-IFRS Measures section of this MD&A.
TRANSALTA CORPORATION M42
The following table reflects adjusted EBITDA by segment and provides reconciliation to loss before income taxes for the three months ended Sept. 30, 2021:
| Hydro | Wind & Solar(1) | Gas(2) | Energy Transition(3) | Energy Marketing | Corporate | Total | Equity accounted investments(1) | Reclass Adjustments | IFRS Financials | |||||||||||||||||||||||
| Revenues | 96 | 55 | 384 | 231 | 86 | 1 | 853 | (3) | — | 850 | ||||||||||||||||||||||
| Reclassifications and adjustments: | ||||||||||||||||||||||||||||||||
| Unrealized mark-to-market (gain) loss | — | 21 | (71) | (2) | (14) | — | (66) | — | 66 | — | ||||||||||||||||||||||
| Realized loss on closed exchange positions | — | — | — | — | 21 | — | 21 | — | (21) | — | ||||||||||||||||||||||
| Decrease in finance lease receivable | — | — | 10 | — | — | — | 10 | — | (10) | — | ||||||||||||||||||||||
| Finance lease income | — | — | 6 | — | — | — | 6 | — | (6) | — | ||||||||||||||||||||||
| Unrealized foreign exchange gain on commodity | — | — | (3) | — | — | — | (3) | — | 3 | — | ||||||||||||||||||||||
| Adjusted revenues | 96 | 76 | 326 | 229 | 93 | 1 | 821 | (3) | 32 | 850 | ||||||||||||||||||||||
Fuel and purchased power(4) | 4 | 4 | 129 | 190 | — | 1 | 328 | — | — | 328 | ||||||||||||||||||||||
| Reclassifications and adjustments: | ||||||||||||||||||||||||||||||||
| Australian interest income | — | — | (1) | — | — | — | (1) | — | 1 | — | ||||||||||||||||||||||
| Mine depreciation | — | — | (26) | (48) | — | — | (74) | — | 74 | — | ||||||||||||||||||||||
| Coal inventory write-down | — | — | — | (5) | — | — | (5) | — | 5 | — | ||||||||||||||||||||||
| Adjusted fuel and purchased power | 4 | 4 | 102 | 137 | — | 1 | 248 | — | 80 | 328 | ||||||||||||||||||||||
| Carbon compliance | — | — | 33 | 14 | — | — | 47 | — | — | 47 | ||||||||||||||||||||||
| Gross margin | 92 | 72 | 191 | 78 | 93 | — | 526 | (3) | (48) | 475 | ||||||||||||||||||||||
OM&A(4) | 10 | 14 | 42 | 28 | 14 | 23 | 131 | (1) | — | 130 | ||||||||||||||||||||||
| Reclassifications and adjustments: | ||||||||||||||||||||||||||||||||
| Parts and materials write-down | — | — | — | (5) | — | — | (5) | — | 5 | — | ||||||||||||||||||||||
| Adjusted OM&A | 10 | 14 | 42 | 23 | 14 | 23 | 126 | (1) | 5 | 130 | ||||||||||||||||||||||
| Taxes, other than income taxes | — | 3 | 4 | 1 | — | 1 | 9 | — | — | 9 | ||||||||||||||||||||||
| Net other operating (income) loss | — | — | (10) | 57 | — | — | 47 | — | — | 47 | ||||||||||||||||||||||
| Reclassifications and adjustments: | ||||||||||||||||||||||||||||||||
| Royalty onerous contract and contract termination penalties | — | — | — | (58) | — | — | (58) | — | 58 | — | ||||||||||||||||||||||
| Adjusted net other operating income | — | — | (10) | (1) | — | — | (11) | — | 58 | 47 | ||||||||||||||||||||||
Adjusted EBITDA(5) | 82 | 55 | 155 | 55 | 79 | (24) | 402 | |||||||||||||||||||||||||
| Equity income | 1 | |||||||||||||||||||||||||||||||
| Finance lease income | 6 | |||||||||||||||||||||||||||||||
| Depreciation and amortization | (123) | |||||||||||||||||||||||||||||||
| Asset impairment charges | (575) | |||||||||||||||||||||||||||||||
| Net interest expense | (63) | |||||||||||||||||||||||||||||||
| Foreign exchange gain | 1 | |||||||||||||||||||||||||||||||
| Gain on sale of assets and other | 23 | |||||||||||||||||||||||||||||||
| Loss before income taxes | (441) | |||||||||||||||||||||||||||||||
(1) The Skookumchuck wind facility has been included on a proportionate basis in the Wind and Solar segment.
(2) Includes the segments previously known as Australian Gas and North American Gas and the gas generation assets from the segment previously known as Alberta Thermal.
(3) Includes the segment previously known as Centralia and the coal generation assets from the segment previously known as Alberta Thermal.
(4) During the three months ended Sept. 30, 2021, $1 million related to station service costs for the Hydro segment was reclassified from OM&A to fuel and purchased power for comparative purposes. This did not impact previously reported net earnings.
(5) Adjusted EBITDA is not defined and has no standardized meaning under IFRS. Refer to the Additional IFRS Measures and Non-IFRS Measures section of this MD&A.
TRANSALTA CORPORATION M43
The following table reflects adjusted EBITDA by segment and provides reconciliation to earnings before income taxes for the 9 months ended Sept. 30, 2022:
| Hydro | Wind & Solar(1) | Gas(2) | Energy Transition(3) | Energy Marketing | Corporate | Total | Equity accounted investments(1) | Reclass Adjustments | IFRS Financials | |||||||||||||||||||||||
| Revenues | 447 | 205 | 933 | 433 | 116 | (2) | 2,132 | (10) | — | 2,122 | ||||||||||||||||||||||
| Reclassifications and adjustments: | ||||||||||||||||||||||||||||||||
| Unrealized mark-to-market (gain) loss | — | 81 | 13 | 17 | — | — | 111 | — | (111) | — | ||||||||||||||||||||||
| Realized (gain) loss on closed exchange positions | — | — | (11) | — | 27 | — | 16 | — | (16) | — | ||||||||||||||||||||||
| Decrease in finance lease receivable | — | — | 34 | — | — | — | 34 | — | (34) | — | ||||||||||||||||||||||
| Finance lease income | — | — | 15 | — | — | — | 15 | — | (15) | — | ||||||||||||||||||||||
| Adjusted revenues | 447 | 286 | 984 | 450 | 143 | (2) | 2,308 | (10) | (176) | 2,122 | ||||||||||||||||||||||
| Fuel and purchased power | 17 | 20 | 445 | 332 | — | 3 | 817 | — | — | 817 | ||||||||||||||||||||||
| Reclassifications and adjustments: | ||||||||||||||||||||||||||||||||
| Australian interest income | — | — | (3) | — | — | — | (3) | — | 3 | — | ||||||||||||||||||||||
| Adjusted fuel and purchased power | 17 | 20 | 442 | 332 | — | 3 | 814 | — | 3 | 817 | ||||||||||||||||||||||
| Carbon compliance | — | 1 | 56 | (1) | — | (5) | 51 | — | — | 51 | ||||||||||||||||||||||
| Gross margin | 430 | 265 | 486 | 119 | 143 | — | 1,443 | (10) | (179) | 1,254 | ||||||||||||||||||||||
| OM&A | 33 | 50 | 138 | 50 | 23 | 71 | 365 | (1) | — | 364 | ||||||||||||||||||||||
| Taxes, other than income taxes | 3 | 7 | 13 | 2 | — | 1 | 26 | (1) | — | 25 | ||||||||||||||||||||||
| Net other operating income | — | (18) | (30) | — | — | — | (48) | — | — | (48) | ||||||||||||||||||||||
| Reclassifications and adjustments: | ||||||||||||||||||||||||||||||||
| Insurance recovery | — | 7 | — | — | — | — | 7 | — | (7) | — | ||||||||||||||||||||||
| Adjusted net other operating income | — | (11) | (30) | — | — | — | (41) | — | (7) | (48) | ||||||||||||||||||||||
Adjusted EBITDA(4) | 394 | 219 | 365 | 67 | 120 | (72) | 1,093 | |||||||||||||||||||||||||
| Equity income | 5 | |||||||||||||||||||||||||||||||
| Finance lease income | 15 | |||||||||||||||||||||||||||||||
| Depreciation and amortization | (411) | |||||||||||||||||||||||||||||||
| Asset impairment charges | (4) | |||||||||||||||||||||||||||||||
| Net interest expense | (195) | |||||||||||||||||||||||||||||||
| Foreign exchange gain | 17 | |||||||||||||||||||||||||||||||
| Gain on sale of assets and other | 6 | |||||||||||||||||||||||||||||||
| Earnings before income taxes | 346 | |||||||||||||||||||||||||||||||
(1) The Skookumchuck wind facility has been included on a proportionate basis in the Wind and Solar segment.
(2) Includes the segments previously known as Australian Gas and North American Gas and the gas generation assets from the segment previously known as Alberta Thermal.
(3) Includes the segment previously known as Centralia and the coal generation assets from the segment previously known as Alberta Thermal.
(4) Adjusted EBITDA is not defined and has no standardized meaning under IFRS. Refer to the Additional IFRS Measures and Non-IFRS Measures section of this MD&A.
TRANSALTA CORPORATION M44
The following table reflects adjusted EBITDA by segment and provides reconciliation to loss before income taxes for the 9 months ended Sept. 30, 2021:
| Hydro | Wind & Solar(1) | Gas(2) | Energy Transition(3) | Energy Marketing | Corporate | Total | Equity accounted investments(1) | Reclass Adjustments | IFRS Financials | |||||||||||||||||||||||
| Revenues | 299 | 225 | 937 | 471 | 185 | 6 | 2,123 | (12) | — | 2,111 | ||||||||||||||||||||||
| Reclassifications and adjustments: | ||||||||||||||||||||||||||||||||
| Unrealized mark-to-market (gain) loss | — | 22 | (122) | 27 | (26) | — | (99) | — | 99 | — | ||||||||||||||||||||||
| Realized loss on closed exchange positions | — | — | 1 | — | 49 | — | 50 | — | (50) | — | ||||||||||||||||||||||
| Decrease in finance lease receivable | — | — | 30 | — | — | — | 30 | — | (30) | — | ||||||||||||||||||||||
| Finance lease income | — | — | 19 | — | — | — | 19 | — | (19) | — | ||||||||||||||||||||||
| Unrealized foreign exchange gain on commodity | — | — | (3) | — | — | — | (3) | — | 3 | — | ||||||||||||||||||||||
| Adjusted revenues | 299 | 247 | 862 | 498 | 208 | 6 | 2,120 | (12) | 3 | 2,111 | ||||||||||||||||||||||
Fuel and purchased power(4) | 13 | 11 | 347 | 411 | — | 6 | 788 | — | — | 788 | ||||||||||||||||||||||
| Reclassifications and adjustments: | ||||||||||||||||||||||||||||||||
| Australian interest income | — | — | (3) | — | — | — | (3) | — | 3 | — | ||||||||||||||||||||||
| Mine depreciation | — | — | (79) | (100) | — | — | (179) | — | 179 | — | ||||||||||||||||||||||
| Coal inventory write-down | — | — | — | (16) | — | — | (16) | — | 16 | — | ||||||||||||||||||||||
| Adjusted fuel and purchased power | 13 | 11 | 265 | 295 | — | 6 | 590 | — | 198 | 788 | ||||||||||||||||||||||
| Carbon compliance | — | — | 104 | 35 | — | — | 139 | — | — | 139 | ||||||||||||||||||||||
| Gross margin | 286 | 236 | 493 | 168 | 208 | — | 1,391 | (12) | (195) | 1,184 | ||||||||||||||||||||||
OM&A(4) | 29 | 42 | 129 | 97 | 31 | 55 | 383 | (2) | — | 381 | ||||||||||||||||||||||
| Reclassifications and adjustments: | ||||||||||||||||||||||||||||||||
| Parts and materials write-down | — | — | (2) | (28) | — | — | (30) | — | 30 | — | ||||||||||||||||||||||
| Adjusted OM&A | 29 | 42 | 127 | 69 | 31 | 55 | 353 | (2) | 30 | 381 | ||||||||||||||||||||||
| Taxes, other than income taxes | 2 | 8 | 11 | 5 | — | 1 | 27 | (1) | — | 26 | ||||||||||||||||||||||
| Net other operating (income) loss | — | — | (30) | 56 | — | — | 26 | — | — | 26 | ||||||||||||||||||||||
| Reclassifications and adjustments: | ||||||||||||||||||||||||||||||||
| Royalty onerous contract and contract termination penalties | — | — | — | (58) | — | — | (58) | — | 58 | — | ||||||||||||||||||||||
| Adjusted net other operating income | — | — | (30) | (2) | — | — | (32) | — | 58 | 26 | ||||||||||||||||||||||
Adjusted EBITDA(5) | 255 | 186 | 385 | 96 | 177 | (56) | 1,043 | |||||||||||||||||||||||||
| Equity income | 5 | |||||||||||||||||||||||||||||||
| Finance lease income | 19 | |||||||||||||||||||||||||||||||
| Depreciation and amortization | (395) | |||||||||||||||||||||||||||||||
| Asset impairment charges | (620) | |||||||||||||||||||||||||||||||
| Net interest expense | (186) | |||||||||||||||||||||||||||||||
| Foreign exchange gain | 22 | |||||||||||||||||||||||||||||||
| Gain on sale of assets and other | 56 | |||||||||||||||||||||||||||||||
| Loss before income taxes | (348) | |||||||||||||||||||||||||||||||
(1) The Skookumchuck wind facility has been included on a proportionate basis in the Wind and Solar segment.
(2) Includes the segments previously known as Australian Gas and North American Gas and the gas generation assets from the segment previously known as Alberta Thermal.
(3) Includes the segment previously known as Centralia and the coal generation assets from the segment previously known as Alberta Thermal.
(4) During the nine months ended Sept. 30, 2021, $6 million related to station service costs for the Hydro segment was reclassified from OM&A to fuel and purchased power for comparative purposes. This did not impact previously reported net earnings.
(5) Adjusted EBITDA is not defined and has no standardized meaning under IFRS. Refer to the Additional IFRS Measures and Non-IFRS Measures section of this MD&A.
TRANSALTA CORPORATION M45
The table below reconciles our cash flow from operating activities to our FFO and FCF:
| 3 months ended Sept. 30 | 9 months ended Sept. 30 | |||||||||||||
| 2022 | 2021 | 2022 | 2021 | |||||||||||
| Cash flow from operating activities | 204 | 610 | 526 | 947 | ||||||||||
| Change in non-cash operating working capital balances | 276 | (378) | 252 | (322) | ||||||||||
| Cash flow from operations before changes in working capital | 480 | 232 | 778 | 625 | ||||||||||
| Adjustments | ||||||||||||||
Share of adjusted FFO from joint venture(1) | 2 | 3 | 7 | 7 | ||||||||||
| Decrease in finance lease receivable | 12 | 10 | 34 | 30 | ||||||||||
Clean energy transition provisions and adjustments(2)(4) | 27 | 49 | 35 | 85 | ||||||||||
| Realized (gain) loss on closed exchange positions | (42) | 21 | 16 | 50 | ||||||||||
Other(3) | 9 | 3 | 17 | 11 | ||||||||||
FFO(5) | 488 | 318 | 887 | 808 | ||||||||||
| Deduct: | ||||||||||||||
Sustaining capital(1) | (27) | (44) | (75) | (144) | ||||||||||
| Productivity capital | (1) | (1) | (3) | (2) | ||||||||||
| Dividends paid on preferred shares | (11) | (9) | (31) | (29) | ||||||||||
| Distributions paid to subsidiaries’ non-controlling interests | (54) | (52) | (126) | (121) | ||||||||||
Principal payments on lease liabilities and other(1) | (2) | (2) | (6) | (6) | ||||||||||
FCF(5) | 393 | 210 | 646 | 506 | ||||||||||
| Weighted average number of common shares outstanding in the period | 271 | 271 | 271 | 271 | ||||||||||
FFO per share(5) | 1.80 | 1.17 | 3.27 | 2.98 | ||||||||||
FCF per share(5) | 1.45 | 0.77 | 2.38 | 1.87 | ||||||||||
(1) Includes our share of amounts for Skookumchuck wind facility, an equity accounted joint venture.
(2) Includes a write-down on parts and material inventory, and coal inventory for our coal operations in 2021 to net realizable value, amounts due to contractors for not proceeding with the Sundance Unit 5 repowering project and impairment of a previously recognized deferred asset, as it is no longer likely that we will incur sufficient capital or operating expenditures to utilize the remaining credit.
(3) Other consists of production tax credits which is a reduction to tax equity debt.
(4) During the third quarter of 2022, to support the employees affected by the closure of the Highvale mine and our transition off coal to cleaner sources, the Company made a voluntary special contribution of $35 million.
(5) These items are not defined and has no standardized meaning under IFRS. Refer to the Additional IFRS Measures and Non-IFRS Measures section of this MD&A.
TRANSALTA CORPORATION M46
The table below bridges our adjusted EBITDA to our FFO and FCF:
| 3 months ended Sept. 30 | 9 months ended Sept. 30 | |||||||||||||
| 2022 | 2021 | 2022 | 2021 | |||||||||||
Adjusted EBITDA(1) | 555 | 402 | 1,093 | 1,043 | ||||||||||
| Provisions | (5) | (20) | 5 | (25) | ||||||||||
| Interest expense | (47) | (50) | (151) | (149) | ||||||||||
| Current income tax expense | (11) | (23) | (36) | (58) | ||||||||||
| Realized foreign exchange gain (loss) | 3 | 5 | 18 | 2 | ||||||||||
| Decommissioning and restoration costs settled | (9) | (5) | (23) | (13) | ||||||||||
| Other non-cash items | 2 | 9 | (19) | 8 | ||||||||||
FFO(3) | 488 | 318 | 887 | 808 | ||||||||||
| Deduct: | ||||||||||||||
Sustaining capital(2) | (27) | (44) | (75) | (144) | ||||||||||
| Productivity capital | (1) | (1) | (3) | (2) | ||||||||||
| Dividends paid on preferred shares | (11) | (9) | (31) | (29) | ||||||||||
| Distributions paid to subsidiaries’ non-controlling interests | (54) | (52) | (126) | (121) | ||||||||||
Principal payments on lease liabilities and other (2) | (2) | (2) | (6) | (6) | ||||||||||
FCF(3) | 393 | 210 | 646 | 506 | ||||||||||
(1) Adjusted EBITDA is defined in the Additional IFRS Measures and Non-IFRS Measures section and reconciled to earnings (loss) before income taxes above.
(2) Includes our share of amounts for Skookumchuck wind facility, an equity accounted joint venture.
(3) These items are not defined and has no standardized meaning under IFRS. FFO and FCF are defined in the Additional IFRS Measures and Non-IFRS Measures section and reconciled to cash flow from operating activities above.
TRANSALTA CORPORATION M47
Financial Highlights on a Proportional Basis of TransAlta Renewables
The proportionate financial information below reflects TransAlta's share of TransAlta Renewables relative to TransAlta's total consolidated figures. The financial highlights presented on a proportional basis of TransAlta Renewables are supplementary financial measures to reflect TransAlta Renewables' portion of the consolidated figures.
Consolidated Results
The following table reflects the generation and summary financial information on a consolidated basis during the period:
| Actual Generation (GWh) | Adjusted EBITDA(1) | Earnings (loss) before income taxes | |||||||||||||||||||||||||||
| 3 months ended Sept. 30 | 2022 | 2021 | 2022 | 2021 | 2022 | 2021 | |||||||||||||||||||||||
| TransAlta Renewables | |||||||||||||||||||||||||||||
| Hydro | 168 | 136 | 7 | 6 | |||||||||||||||||||||||||
Wind and Solar(2) | 685 | 718 | 32 | 40 | |||||||||||||||||||||||||
Gas(2) | 836 | 862 | 54 | 60 | |||||||||||||||||||||||||
| Corporate | — | — | (5) | (4) | |||||||||||||||||||||||||
| TransAlta Renewables before adjustments | 1,689 | 1,716 | 88 | 102 | (26) | 21 | |||||||||||||||||||||||
| Less: Proportion of TransAlta Renewables not owned by TransAlta Corporation | (674) | (676) | (35) | (40) | 10 | (8) | |||||||||||||||||||||||
| Portion of TransAlta Renewables owned by TransAlta Corporation | 1,015 | 1,040 | 53 | 62 | (16) | 13 | |||||||||||||||||||||||
| Add: TransAlta Corporation's owned assets excluding TransAlta Renewables | |||||||||||||||||||||||||||||
| Hydro | 570 | 475 | 238 | 76 | |||||||||||||||||||||||||
| Wind and Solar | — | — | 10 | 15 | |||||||||||||||||||||||||
| Gas | 2,006 | 2,051 | 141 | 95 | |||||||||||||||||||||||||
| Energy Transition | 1,167 | 1,811 | 51 | 55 | |||||||||||||||||||||||||
| Energy Marketing | — | — | 53 | 79 | |||||||||||||||||||||||||
| Corporate | — | — | (26) | (20) | |||||||||||||||||||||||||
| TransAlta Corporation with Proportionate Share of TransAlta Renewables | 4,758 | 5,377 | 520 | 362 | 136 | (449) | |||||||||||||||||||||||
| Non-controlling interests | 674 | 676 | 35 | 40 | (10) | 8 | |||||||||||||||||||||||
| TransAlta Consolidated | 5,432 | 6,053 | 555 | 402 | 126 | (441) | |||||||||||||||||||||||
(1) Adjusted EBITDA is defined in the Additional IFRS Measures and Non-IFRS Measures section and reconciled to earnings (loss) before income taxes above.
(2) Wind and Solar and Gas segments include those assets that TransAlta Renewables holds an economic interest in.
TRANSALTA CORPORATION M48
| Actual Generation (GWh) | Adjusted EBITDA(1) | Earnings (loss) before income taxes | |||||||||||||||||||||||||||||||||
| 9 months ended Sept. 30 | 2022 | 2021 | 2022 | 2021 | 2022 | 2021 | |||||||||||||||||||||||||||||
| TransAlta Renewables | |||||||||||||||||||||||||||||||||||
| Hydro | 368 | 338 | 15 | 14 | |||||||||||||||||||||||||||||||
Wind and Solar(2) | 3,026 | 2,675 | 188 | 172 | |||||||||||||||||||||||||||||||
Gas(2) | 2,505 | 2,374 | 166 | 151 | |||||||||||||||||||||||||||||||
| Corporate | — | — | (16) | (15) | |||||||||||||||||||||||||||||||
| TransAlta Renewables before adjustments | 5,899 | 5,387 | 353 | 322 | 41 | 110 | |||||||||||||||||||||||||||||
| Less: Proportion of TransAlta Renewables not owned by TransAlta Corporation | (2,354) | (2,141) | (141) | (127) | (16) | (43) | |||||||||||||||||||||||||||||
| Portion of TransAlta Renewables owned by TransAlta Corporation | 3,545 | 3,246 | 212 | 195 | 25 | 67 | |||||||||||||||||||||||||||||
| Add: TransAlta Corporation's owned assets excluding TransAlta Renewables | |||||||||||||||||||||||||||||||||||
| Hydro | 1,276 | 1,187 | 379 | 241 | |||||||||||||||||||||||||||||||
| Wind and Solar | — | — | 31 | 14 | |||||||||||||||||||||||||||||||
| Gas | 5,568 | 5,996 | 199 | 234 | |||||||||||||||||||||||||||||||
| Energy Transition | 2,510 | 3,712 | 67 | 96 | |||||||||||||||||||||||||||||||
| Energy Marketing | — | — | 120 | 177 | |||||||||||||||||||||||||||||||
| Corporate | — | — | (56) | (41) | |||||||||||||||||||||||||||||||
| TransAlta Corporation with Proportionate Share of TransAlta Renewables | 12,899 | 14,141 | 952 | 916 | 330 | (391) | |||||||||||||||||||||||||||||
| Non-controlling interests | 2,354 | 2,141 | 141 | 127 | 16 | 43 | |||||||||||||||||||||||||||||
| TransAlta Consolidated | 15,253 | 16,282 | 1,093 | 1,043 | 346 | (348) | |||||||||||||||||||||||||||||
(1) Adjusted EBITDA is defined in the Additional IFRS Measures and Non-IFRS Measures section and reconciled to earnings (loss) before income taxes above.
(2) Wind and Solar and Gas segments include those assets that TransAlta Renewables holds an economic interest in.
TRANSALTA CORPORATION M49
Key Non-IFRS Financial Ratios
The methodologies and ratios used by rating agencies to assess our credit rating are not publicly disclosed. We have developed our own definitions of ratios and targets to help evaluate the strength of our financial position. These metrics and ratios are not defined and have no standardized meaning under IFRS and may not be comparable to those used by other entities or by rating agencies.
Adjusted Net Debt to Adjusted EBITDA
| Sept. 30, 2022 | Dec. 31, 2021 | ||||||||||
Period-end long-term debt(1) | 3,209 | 3,267 | |||||||||
| Exchangeable securities | 338 | 335 | |||||||||
| Less: Cash and cash equivalents | (816) | (947) | |||||||||
Add: 50 per cent of issued preferred shares and exchangeable preferred shares(2) | 671 | 671 | |||||||||
Other(3) | (32) | (19) | |||||||||
Adjusted net debt(4) | 3,370 | 3,307 | |||||||||
Adjusted EBITDA(5) | 1,336 | 1,286 | |||||||||
| Adjusted net debt to adjusted EBITDA (times) | 2.5 | 2.6 | |||||||||
(1) Consists of current and long-term portion of debt, which includes lease liabilities and tax equity financing.
(2) Exchangeable preferred shares are considered equity with dividend payments for credit-rating purposes. For accounting purposes, they are accounted for as debt with interest expense in the unaudited interim condensed consolidated financial statements. For purposes of this ratio, we consider 50 per cent of issued preferred shares, including these, as debt.
(3) Includes principal portion of TransAlta OCP restricted cash ($17 million for the nine months ended Sept. 30, 2022) and fair value of hedging instruments on debt (included in risk management assets and/or liabilities on the unaudited interim condensed consolidated statements of financial position).
(4) The tax equity financing for Skookumchuck wind facility, an equity accounted joint venture, is not represented in the amounts. Adjusted net debt is not defined and has no standardized meaning under IFRS. Presenting this item from period to period provides management and investors with the ability to evaluate earnings trends more readily in comparison with prior periods’ results. Refer to the Additional IFRS Measures and Non-IFRS Measures section of this MD&A.
(5) Last 12 months.
The Company's capital is managed internally and evaluated by management using a net debt position. We use the adjusted net debt to adjusted EBITDA ratio as a measurement of financial leverage and assess our ability to pay off debt. Our adjusted net debt to adjusted EBITDA ratio was lower as at Sept. 30, 2022 compared to 2021 as a result of debt repayments, lower cash and cash equivalents and higher adjusted EBITDA.
TRANSALTA CORPORATION M50
Deconsolidated Adjusted EBITDA by Segment
We invest in our assets directly as well as with joint venture partners. Deconsolidated financial information is a supplementary financial measure and is not intended to be, presented in accordance with IFRS.
Adjusted EBITDA is a key metric for TransAlta and TransAlta Renewables and provides management and shareholders a representation of core business profitability. Deconsolidated EBITDA is used in key planning and credit metrics and segment results highlight the operating performance of assets held directly at TransAlta that are comparable from period to period.
A reconciliation of adjusted EBITDA to deconsolidated adjusted EBITDA by segment results is set out below:
| 3 months ended Sept. 30, 2022 | 3 months ended Sept. 30, 2021 | |||||||||||||||||||
| TransAlta Consolidated | TransAlta Renewables | TransAlta Deconsolidated | TransAlta Consolidated | TransAlta Renewables | TransAlta Deconsolidated | |||||||||||||||
| Hydro | 245 | 7 | 82 | 6 | ||||||||||||||||
| Wind and Solar | 42 | 32 | 55 | 40 | ||||||||||||||||
| Gas | 195 | 54 | 155 | 60 | ||||||||||||||||
| Energy Transition | 51 | — | 55 | — | ||||||||||||||||
| Energy Marketing | 53 | — | 79 | — | ||||||||||||||||
| Corporate | (31) | (5) | (24) | (4) | ||||||||||||||||
| Adjusted EBITDA | 555 | 88 | 467 | 402 | 102 | 300 | ||||||||||||||
| Less: TA Cogen adjusted EBITDA | (70) | (41) | ||||||||||||||||||
Less: EBITDA from joint venture investments(1) | — | (2) | ||||||||||||||||||
| Add: Dividend from TransAlta Renewables | 38 | 38 | ||||||||||||||||||
| Add: Dividend from TA Cogen | 18 | 22 | ||||||||||||||||||
Deconsolidated TransAlta adjusted EBITDA(1) | 453 | 317 | ||||||||||||||||||
| 9 months ended Sept. 30, 2022 | 9 months ended Sept. 30, 2021 | ||||||||||||||||||||||||||||
| TransAlta Consolidated | TransAlta Renewables | TransAlta Deconsolidated | TransAlta Consolidated | TransAlta Renewables | TransAlta Deconsolidated | ||||||||||||||||||||||||
| Hydro | 394 | 15 | 255 | 14 | |||||||||||||||||||||||||
| Wind and Solar | 219 | 188 | 186 | 172 | |||||||||||||||||||||||||
| Gas | 365 | 166 | 385 | 151 | |||||||||||||||||||||||||
| Energy Transition | 67 | — | 96 | — | |||||||||||||||||||||||||
| Energy Marketing | 120 | — | 177 | — | |||||||||||||||||||||||||
| Corporate | (72) | (16) | (56) | (15) | |||||||||||||||||||||||||
| Adjusted EBITDA | 1,093 | 353 | 740 | 1,043 | 322 | 721 | |||||||||||||||||||||||
| Less: TA Cogen adjusted EBITDA | (99) | (104) | |||||||||||||||||||||||||||
Less: EBITDA from joint venture investments(1) | — | (9) | |||||||||||||||||||||||||||
| Add: Dividend from TransAlta Renewables | 113 | 113 | |||||||||||||||||||||||||||
| Add: Dividend from TA Cogen | 28 | 25 | |||||||||||||||||||||||||||
Deconsolidated TransAlta adjusted EBITDA(1) | 782 | 746 | |||||||||||||||||||||||||||
(1) As of the second quarter of 2021, our share of amounts for the Skookumchuck wind equity accounted joint venture is excluded from the TransAlta deconsolidated results due to the sale of an economic interest in the 137 MW Skookumchuck wind facility to TransAlta Renewables.
TRANSALTA CORPORATION M51
Deconsolidated FFO
The Company has set capital allocation targets based on deconsolidated FFO available to shareholders. Deconsolidated financial information is a supplementary financial measure and is not defined and has no standardized meaning under IFRS and may not be comparable to those used by other entities or by rating agencies. See also the Additional IFRS Measures and Non-IFRS Measures section of this MD&A for further details. Deconsolidated FFO for the periods ended Sept. 30, 2022 and 2021 is detailed below:
| 3 months ended Sept. 30, 2022 | 3 months ended Sept. 30, 2021 | |||||||||||||||||||
| TransAlta Consolidated | TransAlta Renewables | TransAlta Deconsolidated | TransAlta Consolidated | TransAlta Renewables | TransAlta Deconsolidated | |||||||||||||||
| Cash flow from operating activities | 204 | 37 | 610 | 83 | ||||||||||||||||
| Change in non-cash operating working capital balances | 276 | (4) | (378) | (23) | ||||||||||||||||
| Cash flow from operations before changes in working capital | 480 | 33 | 232 | 60 | ||||||||||||||||
| Adjustments: | ||||||||||||||||||||
| Decrease in finance lease receivable | 12 | — | 10 | — | ||||||||||||||||
Clean energy transition provisions and adjustments(1) | 27 | — | 49 | — | ||||||||||||||||
| Realized (gain) loss on closed exchange positions | (42) | — | 21 | — | ||||||||||||||||
Share of FFO from joint venture(2) | 2 | — | 3 | — | ||||||||||||||||
| Finance income - economic interests | — | (2) | — | (19) | ||||||||||||||||
FFO - economic interests(3) | — | 37 | — | 46 | ||||||||||||||||
Other(4) | 9 | — | 3 | — | ||||||||||||||||
| FFO | 488 | 68 | 420 | 318 | 87 | 231 | ||||||||||||||
| Dividend from TransAlta Renewables | 38 | 38 | ||||||||||||||||||
| Distributions to TA Cogen's Partner | (29) | (25) | ||||||||||||||||||
Less: Share of adjusted FFO from joint venture(2) | — | (3) | ||||||||||||||||||
| Deconsolidated TransAlta FFO | 429 | 241 | ||||||||||||||||||
(1) Clean energy transition adjustments during the third quarter of 2021, include write-down on parts and material inventory for the coal operations, write-down on coal inventory to net realizable value, amounts due to contractors for not proceeding with the Sundance Unit 5 repowering project and impairment of previously recognized deferred asset, as there were no sufficient capital or operating expenditures incurred to utilize the remaining credit. During the third quarter of 2022, to support the employees affected by the closure of the Highvale mine and our transition off coal to cleaner sources, the Company made a voluntary special contribution of $35 million.
(2) As of the second quarter of 2021, our share of amounts for the Skookumchuck wind equity accounted joint venture is excluded from the TransAlta deconsolidated results due to the sale of an economic interest in the 137 MW Skookumchuck wind facility to TransAlta Renewables.
(3) FFO - economic interests calculated as Free Cash Flow economic interests plus sustaining capital expenditures economic interests and tax equity distributions and plus/minus currency adjustment.
(4) Other consists of production tax credits, which is a reduction to tax equity debt, less distributions from equity accounted joint venture.
TRANSALTA CORPORATION M52
| 9 months ended Sept. 30, 2022 | 9 months ended Sept. 30, 2021 | |||||||||||||||||||
| TransAlta Consolidated | TransAlta Renewables | TransAlta Deconsolidated | TransAlta Consolidated | TransAlta Renewables | TransAlta Deconsolidated | |||||||||||||||
| Cash flow from operating activities | 526 | 168 | 947 | 265 | ||||||||||||||||
| Change in non-cash operating working capital balances | 252 | (2) | (322) | (57) | ||||||||||||||||
| Cash flow from operations before changes in working capital | 778 | 166 | 625 | 208 | ||||||||||||||||
| Adjustments: | ||||||||||||||||||||
| Decrease in finance lease receivable | 34 | — | 30 | — | ||||||||||||||||
Clean energy transition provisions and adjustments(1) | 35 | — | 85 | — | ||||||||||||||||
| Realized loss on closed exchange positions | 16 | — | 50 | — | ||||||||||||||||
Share of FFO from joint venture(2) | 7 | — | 7 | — | ||||||||||||||||
| Finance income - economic interests | — | (24) | — | (68) | ||||||||||||||||
FFO - economic interests(3) | — | 136 | — | 131 | ||||||||||||||||
Other(4) | 17 | — | 11 | — | ||||||||||||||||
| FFO | 887 | 278 | 609 | 808 | 271 | 537 | ||||||||||||||
| Dividend from TransAlta Renewables | 113 | 113 | ||||||||||||||||||
| Distributions to TA Cogen's Partner | (51) | (42) | ||||||||||||||||||
Less: Share of adjusted FFO from joint venture(2) | — | (7) | ||||||||||||||||||
| Deconsolidated TransAlta FFO | 671 | 601 | ||||||||||||||||||
(1) Clean energy transition adjustments during the third quarter of 2021, include write-down on parts and material inventory for the coal operations, write-down on coal inventory to net realizable value, amounts due to contractors for not proceeding with the Sundance Unit 5 repowering project and impairment of previously recognized deferred asset, as there were no sufficient capital or operating expenditures incurred to utilize the remaining credit. During the third quarter of 2022, to support the employees affected by the closure of the Highvale mine and our transition off coal to cleaner sources, the Company made a voluntary special contribution of $35 million.
(2) As of the second quarter of 2021, our share of amounts for the Skookumchuck wind equity accounted joint venture is excluded from the TransAlta deconsolidated results due to the sale of an economic interest in the 137 MW Skookumchuck wind facility to TransAlta Renewables.
(3) FFO - economic interests calculated as Free Cash Flow economic interests plus sustaining capital expenditures economic interests and tax equity distributions and plus/minus currency adjustment.
(4) Other consists of production tax credits, which is a reduction to tax equity debt, less distributions from equity accounted joint venture.
TRANSALTA CORPORATION M53
Deconsolidated Net Debt to Deconsolidated Adjusted EBITDA
In addition to reviewing fully consolidated ratios and results, management reviews net debt to adjusted EBITDA on a deconsolidated basis to highlight TransAlta's financial flexibility, balance sheet strength and leverage. Deconsolidated financial information is a supplementary financial measure and is not defined under IFRS and may not be comparable to those used by other entities or by rating agencies. See also the Additional IFRS Measures and Non-IFRS Measures section of this MD&A for further details.
| As at | Sept. 30, 2022 | Dec. 31, 2021 | |||||||||
Adjusted net debt(1) | 3,370 | 3,307 | |||||||||
| Add: TransAlta Renewables cash and cash equivalents | 229 | 244 | |||||||||
| Less: TransAlta Renewables long-term debt | (782) | (814) | |||||||||
Less: US tax equity financing and South Hedland debt(2) | (806) | (867) | |||||||||
| Deconsolidated net debt | 2,011 | 1,870 | |||||||||
Deconsolidated adjusted EBITDA(3)(5) | 911 | 875 | |||||||||
Deconsolidated net debt to deconsolidated adjusted EBITDA(4) (times) | 2.2 | 2.1 | |||||||||
(1) Refer to the Adjusted Net Debt to Adjusted EBITDA calculation under the Key Financial Non-IFRS Ratios section of this MD&A for the reconciliation and composition of Adjusted net debt.
(2) Relates to assets where TransAlta Renewables has economic interests.
(3) Refer to the Deconsolidated Adjusted EBITDA by Segment section of this MD&A for the reconciliation and composition of deconsolidated adjusted EBITDA and the Additional IFRS Measures and Non-IFRS Measures section of this MD&A for the composition of adjusted EBITDA.
(4) The non-IFRS ratio is not a standardized financial measure under IFRS and might not be comparable to similar financial measures disclosed by other issuers.
(5) Last 12 months.
Our deconsolidated net debt to deconsolidated adjusted EBITDA ratio for the nine months ended Sept. 30, 2022, increased compared with 2021, due to higher deconsolidated net debt and deconsolidated adjusted EBITDA. Higher deconsolidated net debt is a result of decreases in cash balances offset by scheduled repayments on corporate debt.
Critical Accounting Policies and Estimates
The preparation of unaudited interim condensed consolidated financial statements requires management to make judgments, estimates and assumptions that could affect the reported amounts of assets, liabilities, revenues, expenses and disclosures of contingent assets and liabilities during the period. These estimates are subject to uncertainty. Actual results could differ from these estimates due to factors such as fluctuations in interest rates, foreign exchange rates, inflation and commodity prices and changes in economic conditions, legislation and regulations.
Estimates to the extent to which geopolitical events such as the Russia-Ukraine conflict may, directly or indirectly, impact the Company's operations, financial results and conditions in future periods are also subject to significant uncertainty. Uncertainty related to COVID-19 and the geopolitical events has been considered in our estimates as at and for the nine months period ended Sept. 30, 2022. Refer to the Governance and Risk Management section of this MD&A for further details.
The following were material changes in estimates:
Asset Impairments
Wind and Solar
During the three and nine months ended Sept. 30, 2022, the Company recorded net impairment charges of $14 million and $35 million, respectively. During the second quarter of 2022, three wind facilities were impaired primarily as a result of an increase in discount rates. During the third quarter of 2022, two additional wind facilities and one solar facility were impaired as a result of changes in key assumptions including significant increases in discount rates and changes in estimated future cash flows.
Hydro
During the three and nine months ended Sept. 30, 2022, the Company recorded net impairment charges of $15 million and $21 million, respectively. During the second quarter of 2022, an impairment of $6 million was recorded on one of the hydro facilities primarily from an increase in discount rates. During the third quarter of 2022, two additional hydro facilities were impaired as a result of changes in key assumptions including significant increases in discount rates and changes in estimated future cash flows.
TRANSALTA CORPORATION M54
Change in Estimate - Decommissioning provision
The Company recognizes provisions for decommissioning obligations. Initial decommissioning provisions, and subsequent changes thereto, are determined using the Company’s best estimate of the required cash expenditures, adjusted to reflect the risks and uncertainties inherent in the timing and amount of settlement.
For the three months ended Sept. 30, 2022, the Company accelerated the expected timing on decommissioning and restoration for certain gas assets. This increased the decommissioning and restoration provision by $79 million resulting in an increase in PP&E of $29 million on operating assets and recognition of a $50 million impairment charge in net earnings related to retired assets. In the second quarter of 2022, an additional increase to decommissioning and restoration of $11 million was recognized in relation to an asset in the Gas segment.
For the nine months ended Sept. 30, 2022, the decommissioning and restoration provisions have decreased by $227 million due to a significant increase in discount rates, largely driven by increases in market benchmark rates. On average, discount rates increased with rates ranging from 6.8 to 9.6 per cent as at Sept. 30, 2022 (Dec. 31, 2021 — 3.6 to 6.5 per cent). This has resulted in a corresponding decrease in PP&E of $125 million on operating assets and recognition of $102 million impairment reversal in net earnings related to retired assets.
Change in Estimate - Useful Lives
During the third quarter of 2022, the Company adjusted the useful lives of certain assets included in the Gas segment to reflect changes made based on the future operating expectations of the assets. This resulted in an increase of $64 million in depreciation expense that was recognized in the Condensed Consolidated Statement of Earnings in the third quarter of 2022.
Defined Benefit Obligation
The liability for pension and post-employment benefits and associated costs included in compensation expenses are impacted by estimates related to changes in key actuarial assumptions, including discount rates. As a result of increases in discount rates, largely driven by increases in market benchmark rates, the defined benefit obligation decreased by $46 million for the nine months ended Sept. 30, 2022. A 1 per cent increase in discount rates would have a $38 million impact on the defined benefit obligation.
In addition, during the third quarter of 2022, the Company made a voluntary contribution of $35 million to further improve the funded status of the Sunhills Mining Ltd. Pension Plan and to support the employees affected by the closure of the Highvale mine and our transition off-coal to cleaner sources. This contribution reduces the amount of the Company's future funding obligations, including amounts secured by the letter of credit.
Refer to Note 2(P) of the Company’s 2021 audited annual consolidated financial statements for further details on the Significant Accounting Judgments and Key Sources of Estimation Uncertainty.
Accounting Changes
Current Accounting Policy Changes
The accounting policies adopted in the preparation of the unaudited interim condensed consolidated financial statements are consistent with those followed in the preparation of the Company’s audited annual consolidated financial statements for the year ended Dec. 31, 2021, except for the adoption of new standards effective as of Jan. 1, 2022.
Amendments to IAS 37 Provisions, Contingent Liabilities and Contingent Assets
On May 14, 2020, the International Accounting Standards Board ("IASB") issued Onerous Contracts — Cost of Fulfilling a Contract and amendments to IAS 37 Provisions, Contingent Liabilities and Contingent Assets to specify which costs to include when assessing whether a contract will be loss-making. The amendments are effective for annual periods beginning on or after Jan. 1, 2022, and the Company adopted these amendments as of Jan. 1, 2022. The amendments are effective for contracts for which an entity has not yet fulfilled all its obligations on or after the effective date. No adjustments resulted in the adoption of the amendments on Jan. 1, 2022.
TRANSALTA CORPORATION M55
Future Accounting Policy Changes
Please refer to Note 3 of the audited annual 2021 consolidated financial statements for the future accounting policies impacting the Company. In the three and nine months ended Sept. 30, 2022, no additional future accounting policy change impacting the Company were identified.
Comparative Figures
Certain comparative figures have been reclassified to conform to the current period’s presentation. These reclassifications did not impact previously reported net earnings (loss).
Governance and Risk Management
Our business activities expose us to a variety of risks and opportunities including, but not limited to, regulatory changes, rapidly changing market dynamics and increased volatility in our key commodity markets. Our goal is to manage these risks and opportunities so that we are in a position to develop our business and achieve our goals while remaining reasonably protected from an unacceptable level of risk or financial exposure. We use a multi-level risk management oversight structure to manage the risks and opportunities arising from our business activities, the markets in which we operate and the political environments and structures with which we interface.
During the three and nine months ended Sept. 30, 2022, the global economy continued to recover from the COVID-19 pandemic. On Feb. 24, 2022, the Russian government’s invasion of Ukraine set off historic policy actions and global coordination of sanctions and commitments to reduce dependency on Russian energy including natural gas. This has contributed to global supply chain disruptions, commodity price volatility and potential increases to inherent cybersecurity risk. The Company continues to mitigate inflationary and supply chain risks pertaining to current development projects by locking in the prices of key materials where possible and employing the other supply chain risk mitigation strategies described in our 2021 Annual MD&A. A prolonged conflict and recent inflationary and supply chain dynamics may impact future construction project costs with the risk of rising prices on key materials. Accordingly, as the Russia-Ukraine conflict continues to evolve and the indirect impacts of the Russia-Ukraine conflict and rising inflation rates within the global markets remain uncertain at this time, management continues to monitor and assess the impacts.
Interest Rate Risk
Interest rate risk arises as the fair value of future cash flows from a financial instrument fluctuates because of changes in market interest rates. Changes in interest rates can impact our borrowing costs. Changes in our cost of capital may also affect the feasibility of new growth initiatives.
At Sept. 30, 2022, approximately 3 per cent (Dec. 31, 2021 – 3 per cent) of our total debt portfolio was subject to changes in floating interest rates through a combination of floating rate debt and interest rate swaps. During the third quarter of 2022, the interest rate swap agreements with a notional amount of US$150 million referencing the three-month LIBOR were replaced with swap agreements referencing the Secured Overnight Financing Rate ("SOFR"). Existing interest rate swap agreements with a notional amount of US$150 million reference the US Treasury Bond yield. The maturity dates on all swap agreements have been extended.
The Company has US$400 million of debt maturing in November 2022 and we have hedged US$300 million of the underlying debt to reduce the interest rate risk.
Please refer to the Governance and Risk Management section of our 2021 Annual MD&A and Note 12 of our unaudited interim condensed consolidated financial statements for details on our risks and how we manage them. Our risk management profile and practices have not changed materially from Dec. 31, 2021.
TRANSALTA CORPORATION M56
Regulatory Updates
Refer to the Policy and Legal Risks discussion in our 2021 annual MD&A for further details that supplement the recent developments as discussed below:
Canada
Federal
The Government of Canada’s Department of Environment and Climate Change Canada (“ECCC”) continues engagement on the proposed new Clean Electricity Regulation ("CER"), originally known as the Clean Electricity Standards ("CES"), to achieve a net-zero electricity sector in Canada by 2035. ECCC is consulting on the CER design through the fall of 2022. It is expected that the draft regulation will be published in the Canada Gazette, Part I at the end of 2022 or early in 2023. Further consultation on the draft regulation will occur in 2023.
On Nov. 3, 2022, the Government of Canada announced new tax credits for renewable generation, energy storage, and hydrogen production. TransAlta will engage the Department of Finance as it finalizes the parameters of these tax credits.
Ontario
In the third quarter of 2022, the Ontario government undertook a consultation on proposed changes to its Emissions Performance Standards ("EPS") carbon pricing system in advance of the provincial submission into the federal review process. The federal review process will occur in the fourth quarter of 2022.
TransAlta has been actively involved in the consultation process and continues to advocate for an approach that supports our operations in the province. We do not anticipate any adverse impact from these policy proposals as TransAlta passes compliance costs and savings on to customers through our existing contracts.
In 2022, the IESO moved forward with procurement and planning to meet the upcoming capacity needs in the province in the short, medium and long-term. The IESO completed its medium-term RFP to procure capacity from existing generators and awarded five facilities including TransAlta's Sarnia cogeneration facility and Melancthon 1 wind facility with new contracts that will run from May 1, 2026 to April 30, 2031. It is expected that Sarnia's existing capacity contract with the IESO will be extended to the start date of the new contract. In addition, the IESO is moving forward with long-term procurement processes to secure up to 4,000 MW of capacity with commercial delivery by 2025-2027. TransAlta has qualified in the long-term procurement process. The contract awards for the procurements will be announced in 2023.
Alberta
In August 2022, the Government of Alberta launched a consultation on changes to the Technology Innovation and Emissions Reduction ("TIER") Regulation, which governs the province's carbon pricing regime. The review is meant to amend the regulations to meet the federal carbon pricing benchmark.
Key issues under consideration include aligning with the federal carbon price escalator to $170/tonne by 2030, increasing the stringency of TIER emissions performance standards and ensuring net demand for emissions credits deliver a consistent marginal price of carbon. TransAlta has been closely engaging in the consultations and continues to advocate for an approach that supports a predictable investment and operating environment.
United States
On Aug. 16, 2022, the Inflation Reduction Act of 2022 was signed into law by President Biden. This Act will invest approximately US$369 billion in Energy Security and Climate Change programs over the next 10 years. The administration estimates this funding will help reduce national carbon emissions by approximately 40 per cent by 2030, lower energy costs and increase clean energy production.
The US mid-term elections will be held on Nov. 8, 2022. Changes in Congress and the Senate could shift the focus of the government, specifically in terms of climate policy. TransAlta will continue to monitor the results of the mid-term elections along with the developments in the implementation of the IRA.
TRANSALTA CORPORATION M57
Australia
Since the Labour Party formed the government on May 21, 2022, Australia has increased its Nationally Determined Contribution ("NDC") commitment to increase the country’s 2030 emissions reduction goal to 43 per cent below 2005 levels. The government also confirmed its intent to boost renewable electricity production to 82 per cent of the electricity supply by 2030.
We continue to see state-level policy announcements focused on moving away from coal and toward greater reliance on renewables, hydrogen and energy storage. We see low risk to our existing Australian assets, but policy support for continued industrial decarbonization that may support future growth.
Disclosure Controls and Procedures
Management is responsible for establishing and maintaining adequate internal control over financial reporting (‘‘ICFR’’) and disclosure controls and procedures (“DC&P’’). During the nine months ended Sept. 30, 2022, the majority of our workforce supporting and executing our ICFR and DC&P returned to work and continue to work remotely on a hybrid basis. The Company has implemented appropriate controls and oversight for both in-office and remote work. There has been minimal impact to the design and performance of our internal controls.
ICFR is a framework designed to provide reasonable assurance regarding the reliability of financial reporting and the preparation of audited annual consolidated financial statements for external purposes in accordance with IFRS. Management has used the Internal Control – Integrated Framework issued by the Committee of Sponsoring Organizations of the Treadway Commission (2013 framework) in order to assess the effectiveness of the Company’s ICFR.
DC&P refer to controls and other procedures designed to ensure that information required to be disclosed in the reports we file or submit under securities legislation is recorded, processed, summarized and reported within the time frame specified in applicable securities legislation. DC&P include, without limitation, controls and procedures designed to ensure that information required to be disclosed by us in our reports that we file or submit under applicable securities legislation is accumulated and communicated to management, including our Chief Executive Officer and Chief Financial Officer, as appropriate, to allow timely decisions regarding our required disclosure.
Together, the ICFR and DC&P frameworks provide internal control over financial reporting and disclosure. In designing and evaluating our ICFR and DC&P, management recognizes that any controls and procedures, no matter how well designed and operated, can provide only reasonable assurance of achieving the desired control objectives and as such may not prevent or detect all misstatements and management is required to apply its judgment in evaluating and implementing possible controls and procedures. Further, the effectiveness of ICFR is subject to the risk that controls may become inadequate because of changes in conditions or that the degree of compliance with policies or procedures may change.
In accordance with the provisions of National Instrument 52-109 and consistent with U.S. Securities and Exchange Commission guidance, the scope of the evaluation did not include internal controls over financial reporting of North Carolina Solar, which the Company acquired on Nov. 5, 2021. North Carolina Solar facility was excluded from management's evaluation of the effectiveness of the Company's internal control over financial reporting as at Dec. 31, 2021, due to the proximity of the acquisition to year-end. Further details related to the acquisition are disclosed in Note 4 to the Company's audited annual consolidated financial statements for the year ended Dec. 31, 2021.
Consistent with the evaluation at Dec. 31, 2021, the scope of the evaluation does not include controls over financial reporting of the assets acquired through the North Carolina Solar facility acquisition, which the Company acquired on Nov. 5, 2021. North Carolina Solar's total and net assets represented approximately 2 per cent and 3 per cent of the Company's total and net assets and 1 per cent of the Company's total net earnings, respectively, as at Sept. 30, 2022.
Management has evaluated, with the participation of our Chief Executive Officer and Chief Financial Officer, the effectiveness of our ICFR and DC&P as of the end of the period covered by this MD&A. Based on the foregoing evaluation, our Chief Executive Officer and Chief Financial Officer have concluded that, as at Sept. 30, 2022, the end of the period covered by this MD&A, our ICFR and DC&P were effective.
TRANSALTA CORPORATION M58
Glossary of Key Terms
Alberta Electric System Operator ("AESO")
The independent system operator and regulatory authority for the Alberta Interconnected Electric System.
Alberta Hydro Assets
The Company's hydroelectric assets, owned through a wholly owned subsidiary, TransAlta Renewables Inc. These assets are located in Alberta consisting of the Barrier, Bearspaw, Cascade, Ghost, Horseshoe, Interlakes, Kananaskis, Pocaterra, Rundle, Spray, Three Sisters, Bighorn and Brazeau hydro facilities.
Ancillary Services
As defined by the Electric Utilities Act, Ancillary Services are those services required to ensure that the interconnected electric system is operated in a manner that provides a satisfactory level of service with acceptable levels of voltage and frequency.
Alberta Thermal
The business segment previously disclosed as Canadian Coal has been renamed to reflect the ongoing conversion of the boilers to burn gas in place of coal. The segment includes the legacy and converted generating units at our Sundance and Keephills sites and includes the Highvale mine.
Availability
A measure of time, expressed as a percentage of continuous operation 24 hours a day, 365 days a year, that a generating unit is capable of generating energy, regardless of whether or not it is actually generating energy.
Adjusted Availability
Availability is adjusted when economic conditions exist, such that planned routine and major maintenance activities are scheduled to minimize expenditures. In high price environments, actual outage schedules would change to accelerate the generating unit's return to service.
Balancing Pool
The Balancing Pool was established in 1999 by the Government of Alberta to help manage the transition to competition in Alberta's electric industry. Its current obligations and responsibilities are governed by the Electric Utilities Act (effective June 1, 2003) and the Balancing Pool Regulation. For more information go to www.balancingpool.ca.
Capacity
The rated continuous load-carrying ability, expressed in megawatts, of generation equipment.
Centralia
The business segment previously disclosed as US Coal has been renamed to reflect the sole asset.
Cogeneration
A generating facility that produces electricity and another form of useful thermal energy (such as heat or steam) used for industrial, commercial, heating or cooling purposes.
Disclosure Controls and Procedures ("DC&P")
Refers to controls and other procedures designed to ensure that information required to be disclosed in the reports filed by the Company or submitted under securities legislation is recorded, processed, summarized and reported within the time frame specified in applicable securities legislation. DC&P include, without limitation, controls and procedures designed to ensure that information required to be disclosed by the Company in its reports that it files or submits under applicable securities legislation is accumulated and communicated to management, including the Chief Executive Officer and Chief Financial Officer, as appropriate to allow timely decisions regarding required disclosure.
Dispatch optimization
Purchasing power to fulfill contractual obligations, when economical.
Emissions Performance Standards ("EPS")
Under the Government of Ontario, emission performance standards establish greenhouse gas (GHG) emissions limits for covered facilities.
Force Majeure
Literally means “greater force.” These clauses excuse a party from liability if some unforeseen event beyond the control of that party prevents it from performing its obligations under the contract.
Free Cash Flow ("FCF")
Represents the amount of cash that is available to invest in growth initiatives, make scheduled principal repayments on debt, repay maturing debt, pay common share dividends or repurchase common shares. Amount is calculated as cash generated by the Company through its operations (cash from operations) minus the funds used by the Company for the purchase improvement, or maintenance of the long-term assets to improve the efficiency or capacity of the Company (capital expenditures).
Funds from Operations ("FFO")
Represents a proxy for cash generated from operating activities before changes in working capital and provides the ability to evaluate cash flow trends in comparison with results from prior periods. Amount is calculated as cash flow from operating activities before changes in working capital and is adjusted for transactions and amounts that the Company believes are not representative of ongoing cash flows from operations.
TRANSALTA CORPORATION M59
Gigajoule ("GJ")
A metric unit of energy commonly used in the energy industry. One GJ equals 947,817 British Thermal Units ("Btu"). One GJ is also equal to 277.8 kilowatt hours ("kWh").
Gigawatt ("GW")
A measure of electric power equal to 1,000 megawatts.
Gigawatt hour (GWh)
A measure of electricity consumption equivalent to the use of 1,000 megawatts of power over a period of one hour.
Greenhouse Gas (GHG)
A gas that has the potential to retain heat in the atmosphere, including water vapour, carbon dioxide, methane, nitrous oxide, hydrofluorocarbons and perfluorocarbons.
IFRS
International Financial Reporting Standards.
ICFR
Internal control over financial reporting.
KH Bonds
The Kent Hills Wind LP ("KHLP") non-recourse project bonds secured by, among other things, the Kent Hills 1, 2 and 3 wind facilities.
Megawatt (MW)
A measure of electric power equal to 1,000,000 watts.
Megawatt Hour ("MWh")
A measure of electricity consumption equivalent to the use of 1,000,000 watts of power over a period of one hour.
Merchant
A term used to describe assets that are not contracted and are exposed to market pricing.
OM&A
Operations, maintenance and administration costs.
Other Hydro Assets
The Company's hydroelectric assets located in British Columbia, Ontario and assets owned by TransAlta Renewables which include the Taylor, Belly River, Waterton, St. Mary, Upper Mamquam, Pingston, Bone Creek, Akolkolex, Ragged Chute, Misema, Galetta, Appleton and Moose Rapids facilities.
Power Purchase Agreement ("PPA")
A long-term commercial agreement for the sale of electric energy to PPA buyers.
PP&E
Property, plant and equipment.
Turbine
A machine for generating rotary mechanical power from the energy of a stream of fluid (such as water, steam or hot gas). Turbines convert the kinetic energy of fluids to mechanical energy through the principles of impulse and reaction or a mixture of the two.
Planned outage
Periodic planned shutdown of a generating unit for major maintenance and repairs. Duration is normally in weeks. The time is measured from unit shutdown to putting the unit back on line.
Unplanned outage
The shutdown of a generating unit due to an unanticipated breakdown.
TRANSALTA CORPORATION M60
TransAlta Corporation
110 - 12th Avenue S.W.
Box 1900, Station “M”
Calgary, Alberta T2P 2M1
Phone
403.267.7110
Website
www.transalta.com
Computershare Trust Company of Canada
Suite 600, 530 - 8th Avenue SW
Calgary, Alberta T2P 3S8
Phone
Toll-free in North America: 1.800.564.6253
Outside North America: 514.982.7555
Fax
Toll-free in North America: 1.800.453.0330
Outside North America: 403.267.6529
Website
www.investorcentre.com
FOR MORE INFORMATION
Investor Inquiries
Phone
Toll-free in North America: 1.800.387.3598
Calgary or Outside North America: 403.267.2520
E-mail
investor_relations@transalta.com
Media Inquiries
Phone
Toll-free 1.855.255.9184
or 403.267.2540
E-mail
TA_Media_Relations@transalta.com
TRANSALTA CORPORATION M61