Exhibit 13.2
 | TransAlta Corporation First Quarter Report for 2017 |
Management’s Discussion and Analysis
This Management’s Discussion and Analysis (“MD&A”) contains forward-looking statements. These statements are based on certain estimates and assumptions and involve risks and uncertainties. Actual results may differ materially. See the Forward-Looking Statements section of this MD&A for additional information.
This MD&A should be read in conjunction with the unaudited interim condensed consolidated financial statements of TransAlta Corporation as at and for the three months ended March 31, 2017 and 2016, and should also be read in conjunction with the audited annual consolidated financial statements and MD&A contained within our 2016 Annual Integrated Report. In this MD&A, unless the context otherwise requires, “we”, “our”, “us”, the “Corporation”, and “TransAlta” refers to TransAlta Corporation and its subsidiaries. Our condensed consolidated financial statements have been prepared in accordance with International Financial Reporting Standards (“IFRS”) International Accounting Standards (“IAS”) 34 InterimFinancial Reporting for Canadian publically accountable enterprises as issued by the International Accounting Standards Board (“IASB”) and in effect at March 31, 2017. All tabular amounts in the following discussion are in millions of Canadian dollars unless otherwise noted. This MD&A is dated May 5, 2017. Additional information respecting TransAlta, including its Annual Information Form, is available on SEDAR atwww.sedar.com, on EDGAR atwww.sec.gov, and on our website atwww.transalta.com. Information on or connected to our website is not incorporated by reference herein.
Additional IFRS Measures and Non-IFRS Measures
An additional IFRS measure is a line item, heading, or subtotal that is relevant to an understanding of the financial statements but is not a minimum line item mandated under IFRS, or the presentation of a financial measure that is relevant to an understanding of the financial statements but is not presented elsewhere in the financial statements. We have included line items entitled gross margin and operating income (loss) in our Condensed Consolidated Statements of Earnings (Loss) for the three months ended March 31, 2017, and 2016. Presenting these line items provides management and investors with a measurement of ongoing operating performance that is readily comparable from period to period.
We evaluate our performance and the performance of our business segments using a variety of measures. Certain of the financial measures discussed in this MD&A are not defined under IFRS and, therefore, should not be considered in isolation or as an alternative to or to be more meaningful than net earnings attributable to common shareholders or cash flow from operating activities, as determined in accordance with IFRS, when assessing our financial performance or liquidity. These measures may not be comparable to similar measures presented by other issuers and should not be considered in isolation or as a substitute for measures prepared in accordance with IFRS. Earnings before interest, taxes, depreciation, and amortization (“EBITDA”), comparable EBITDA, Funds from Operations (“FFO”), and “Free Cash Flow” (“FCF”) are Non-IFRS Measures. See the Reconciliation of Non-IFRS Measures and, Discussion of Segmented Comparable Results sections of this MD&A for additional information.
| TRANSALTA CORPORATION /Q1 2017M1 |
Forward-Looking Statements
This MD&A, the documents incorporated herein by reference, and other reports and filings made with securities regulatory authorities include forward-looking statements or information (collectively referred to herein as “forward-looking statements”) within the meaning of applicable securities legislation. Forward-looking statements are presented for general information purposes only and not as specific investment advice. All forward-looking statements are based on our beliefs as well as assumptions based on information available at the time the assumptions were made and on management’s experience and perception of historical trends, current conditions, and expected future developments, as well as other factors deemed appropriate in the circumstances. Forward-looking statements are not facts, but only predictions and generally can be identified by the use of statements that include phrases such as “may”, “will”, “believe”, “expect”, “anticipate”, “intend”, “plan”, “project”, “forecast”, “foresee”, “potential”, “enable”, “continue”, or other comparable terminology. These statements are not guarantees of our future performance and are subject to risks, uncertainties, and other important factors that could cause our actual performance to be materially different from that projected.
In particular, this MD&A contains forward-looking statements pertaining to: our business and anticipated future financial performance; our success in executing on our growth projects; the timing of the construction and commissioning of projects under development, including major projects such as the South Hedland power project, and the conversion of our Sundance Units 3 to 6 and Keephills Units 1 and 2 from coal-fired generation to gas-fired generation, and their attendant costs and sources of funding; the retirement of Sundance Unit 1 and mothballing of Sundance Unit 2; the changes to capacity and emissions following the conversion to gas generation of Sundance Units 3 to 6 and Keephills Units 1 and 2; spending on growth and sustaining capital and productivity projects; expectations in terms of the cost of operations, capital spending, and maintenance, and the variability of those costs; expected decommissioning costs; the section titled “2017 Outlook”, the impact of certain hedges on future reported earnings and cash flows, including future reversals of unrealized gains or losses, expectations relating to the dispositions of assets and the completion of sale transactions; expectations related to future earnings and cash flow from operating and contracting activities (including estimates of full-year 2017 comparable EBITDA, FFO, FCF, and expected sustaining capital expenditures); expectations in respect of financial ratios and targets and the timing associated with meeting such targets (including FFO before interest to adjusted interest coverage, adjusted FFO to adjusted net debt, and adjusted net debt to comparable EBITDA); the Corporation’s plans and strategies relating to repositioning its capital structure and strengthening its balance sheet and the anticipated debt reductions during 2017 and beyond; expected governmental regulatory regimes, legislation (including the Government of Alberta’s Climate Leadership Plan) and proposed regulations to discontinue over time the use of technologies that our coal-fired plants currently utilize, the expected impact on us and the timing of the implementation of such regimes and regulations, as well as the cost of complying with resulting regulations and laws; the expected results and impact of the Off-Coal Agreement (“OCA”) and Memorandum of Understanding (“MOU”) with the Government of Alberta on our business and financial performance; the outcome of discussions with the Government of Canada and the Government of Alberta in relation to potential opportunities for investment in renewable and gas-fired generation; our comparative advantages over our competitors; estimates of fuel supply and demand conditions and the costs of procuring fuel; our share of offer control in the Province of Alberta after the expiry of the Power Purchase Arrangements (“PPAs”) at the end of 2020; the impact of load growth, increased capacity, and natural gas costs on power prices; expectations in respect of generation availability, capacity, and production; expectations regarding the role different energy sources will play in meeting future energy needs, including the impact of the anticipated elimination of current excess system capacity and future growth in Alberta driven by the retirement of coal units over the next 15 years; expected financing of our capital expenditures; the anticipated financial impact of increased carbon prices (including under the existing Specified Gas Emitters Regulation) (“SGER”) in Alberta; expectations in respect of our environmental initiatives; our trading strategies and the risk involved in these strategies; estimates of future tax rates, future tax expense, and the adequacy of tax provisions; accounting estimates; anticipated growth rates in our markets; our expectations regarding the outcome of existing or potential legal and contractual claims, regulatory investigations, and disputes; expectations regarding the renewal of collective bargaining agreements; expectations for the ability to access capital markets on reasonable terms; the estimated impact of changes in interest rates and the value of the Canadian dollar relative to the US dollar, the Australian dollar, and other currencies in which we do business; the monitoring of our exposure to liquidity risk; expectations regarding the impact of the general slowdown in the oil and gas sector; expectations in respect of the global economic environment and growing scrutiny by investors relating to sustainability performance; our credit practices; expected cost savings following the implementation of our efficiency and productivity initiatives; the estimated contribution of Energy Marketing activities to gross margin; expectations relating to the performance of TransAlta Renewables Inc.’s (“TransAlta Renewables”) assets; expectations regarding our continued ownership of common shares of TransAlta Renewables; the refinancing our upcoming debt maturities over the next two years by raising $700 million to $900 million of debt secured by contracted cash flows; expectations regarding our de-leveraging strategy, including applying a portion of our FCF over the next four years to reduce debt; expectations in respect of our community initiatives; impacts of future IFRS standards; and amendments or interpretations by accounting standard setters prior to initial adoption of those standards.
| M2 TRANSALTA CORPORATION / Q1 2017 |
Factors that may adversely impact our forward-looking statements include risks relating to: fluctuations in market prices and the availability of fuel supplies required to generate electricity; our ability to contract our generation for prices that will provide expected returns; the regulatory and political environments in the jurisdictions in which we operate; increasingly stringent environmental requirements and changes in, or liabilities under, these requirements; changes in general economic conditions, including interest rates; operational risks involving our facilities, including unplanned outages at such facilities; disruptions in the transmission and distribution of electricity; the effects of weather; disruptions in the source of fuels, water, sun, or wind required to operate our facilities; natural or man-made disasters; the threat of terrorism and cyberattacks and our ability to manage such attacks; equipment failure and our ability to carry out or have completed the repairs in a cost-effective or timely manner; commodity risk management; industry risk and competition; fluctuations in the value of foreign currencies and foreign political risks; the need for additional financing and the ability to access financing at a reasonable cost and on reasonable terms; our ability to fund our growth projects; our ability to maintain our investment grade credit ratings; structural subordination of securities; counterparty credit risk; our ability to recover our losses through our insurance coverage; our provision for income taxes; legal, regulatory, and contractual proceedings involving the Corporation; outcomes of investigations and disputes; reliance on key personnel; labour relations matters; development projects and acquisitions, including delays or changes in costs in the construction and commissioning of the South Hedland power project; and the satisfactory receipt of applicable regulatory approvals for existing and proposed operations and growth initiatives, including as it pertains to coal-to-gas conversions.
The foregoing risk factors, among others, are described in further detail in the Governance and Risk Management section of this MD&A and under the heading “Risk Factors” in our 2017 Annual Information Form for the fiscal year ended Dec. 31, 2016.
Readers are urged to consider these factors carefully in evaluating the forward-looking statements and are cautioned not to place undue reliance on these forward-looking statements. The forward-looking statements included in this document are made only as of the date hereof and we do not undertake to publicly update these forward-looking statements to reflect new information, future events, or otherwise, except as required by applicable laws. In light of these risks, uncertainties, and assumptions, the forward-looking events might occur to a different extent or at a different time than we have described, or might not occur. We cannot assure that projected results or events will be achieved.
| TRANSALTA CORPORATION /Q1 2017M3 |
Highlights
Consolidated Financial Highlights
| 3 months ended March 31 | ||||||||
| 2017 | 2016 | |||||||
| Revenues | 578 | 568 | ||||||
| Net earnings attributable to common shareholders | - | 62 | ||||||
| Cash flow from operating activities | 281 | 275 | ||||||
| Comparable EBITDA(1) | 274 | 279 | ||||||
| FFO(1) | 203 | 196 | ||||||
| FCF(1) | 98 | 86 | ||||||
| Net earnings per share attributable to common shareholders, basic and diluted | - | 0.22 | ||||||
| FFO per share(1) | 0.70 | 0.68 | ||||||
| FCF per share(1) | 0.34 | 0.30 | ||||||
| Dividends declared per common share | - | 0.04 | ||||||
| As at | March 31, 2017 | Dec. 31, 2016 | ||||||
| Total assets | 11,049 | 10,996 | ||||||
| Net debt(2) | 3,649 | 3,893 | ||||||
| Total long-term liabilities | 5,130 | 5,116 | ||||||
For the first quarter of 2017, comparable EBITDA was $274 million, down $5 million compared with last year. As we were expecting, gross margin at Canadian Coal was impacted by hedges rolling off and being replaced with lower priced hedges and by higher mining costs. Energy Marketing was impacted by unusual weather in the Northeast and the Pacific Northwest and delivered below expected performance in the quarter. The recognition of the expected settlement in relation to the contract indexation dispute with the Ontario Electricity Financial Corporation (“OEFC”) relating to the Ottawa and Windsor generating facilities totalling $34 million, almost fully offset the shortfall in Energy Marketing and Canadian Coal.
FFO and FCF were slightly higher than last year as lower comparable EBITDA was offset by higher realized foreign exchange gains and non-cash mark-to-market gains in 2017.
Reported net earnings attributable to common shareholders for the quarter was nil (nil per share) compared to net earnings of $62 million ($0.22 net earnings per share) in 2016 due to higher net earnings attributable to TransAlta Renewables shareholders. Last year net earnings in the first quarter was also positively impacted by the reduction of our reclamation obligation at our Centralia mine caused by a higher discount rate. This year, higher depreciation arose due to the shortening of useful lives of Keephills 3 and Genesee 3.
The decrease of $244 million in net debt is primarily due to strong free cash flows, a decrease in our working capital, the receipt of $61 million from the sale of the Wintering Hills merchant wind facility, and the impact of the weakening US dollar.
| (1) | These items are not defined under IFRS. Presenting these items from period to period provides management and investors with the ability to evaluate earnings trends more readily in comparison with prior periods’ results. Refer to the Reconciliation of Non-IFRS Measures section of this MD&A for further discussion of these items, including, where applicable, reconciliations to measures calculated in accordance with IFRS. |
| (2) | Net debt includes current portion, amounts due under credit facilities, long-term debt, tax equity, and finance lease obligations, net of cash and the fair value of economic hedging instruments on debt. See the table in the Capital Structure and Liquidity section of this MD&A for more details on the composition of net debt. |
| M4 TRANSALTA CORPORATION / Q1 2017 |
Segmented Comparable EBITDA Results
| 3 months ended March 31 | ||||||||
| 2017 | 2016 | |||||||
| Comparable EBITDA | ||||||||
| Canadian Coal | 91 | 103 | ||||||
| U.S. Coal | 10 | (4 | ) | |||||
| Canadian Gas | 88 | 65 | ||||||
| Australian Gas | 31 | 31 | ||||||
| Wind and Solar | 68 | 61 | ||||||
| Hydro | 14 | 18 | ||||||
| Energy Marketing | (4 | ) | 23 | |||||
| Corporate | (24 | ) | (18 | ) | ||||
| Total comparable EBITDA | 274 | 279 | ||||||
Significant Events
During the quarter, we continued to work on strengthening our financial flexibility, improving our operating performance, and progressing our transition to clean power generation through the following initiatives:
| § | Closed the previously announced sale of our 51 per cent interest in the Wintering Hills merchant wind facility for approximately $61 million. The sale provides us with near-term liquidity, increases our financial flexibility, and reduces our merchant exposure in Alberta. |
| § | Progressed the construction of the South Hedland power project. We expect the project to be fully commissioned in mid-2017. When fully commissioned, the project is expected to generate approximately $80 million of comparable EBITDA annually. |
| § | Continued to work on our financing initiative during the quarter. Our goal is to raise $700 to $900 million in debt secured by contracted cash flows in the next 12 to 15 months, to fund the construction of South Hedland and repay senior secured debt coming due in 2018. |
| § | Announced the acceleration of our transition to gas and renewables generation with the retirement of Sundance Unit 1, the mothballing Sundance Unit 2, and the conversion of Sundance Units 3 to 6, and Keephills Units 1 and 2 from coal-fired generation to gas-fired generation between 2021 to 2023. The retirement of Sundance Unit 1 and mothballing of Sundance Unit 2 is not expected to have a material impact on our forecasted cash flow for 2018 and 2019. |
| § | Progressed the expected settlement in relation to the contract indexation dispute with the OEFC. The settlement is expected to consist of a $34 million payment by the OEFC to TransAlta, of which $11 million has already been received. We have recognized the full $34 million amount in our results in the first quarter of 2017. The settlement is expected to be finalized during the second quarter. |
Adjusted availability and Production
Adjusted availability for the three months ended March 31, 2017 was 88.5 per cent compared to 92.3 per cent for the same period in 2016. Higher unplanned outages at Canadian and US Coal were the main cause of the decrease. Lower availability had a minimal impact on our results due to current low prices in Alberta and the Pacific Northwest.
Production for the three months ended March 31, 2017 was 9,051 gigawatt hours (“GWh”), compared to 8,867 GWh for the same period in 2016, mainly due to higher production at US Coal as a result of later economic dispatching in 2017 due to higher prices, partially offset by the cessation of operations at our Mississauga cogeneration facility, effective Jan. 1, 2017, in accordance with the terms of a new contract with Ontario’s Independent Electricity System Operator (“IESO”). We continue to receive monthly capacity payments from the IESO until Dec. 31, 2018.
| TRANSALTA CORPORATION /Q1 2017M5 |
Electricity Prices The average spot electricity prices for the three months ended March 31, 2017 increased compared to 2016 in both Alberta and the Pacific Northwest markets. Higher environmental levies and compliance costs have increased the marginal cost to producers in Alberta, while increased natural gas prices in the Pacific Northwest markets caused power prices to rise. | 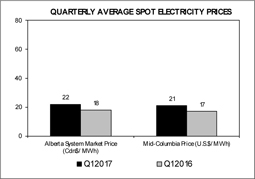 |
Reconciliation of Non-IFRS Measures
We evaluate our performance and the performance of our business segments using a variety of measures. Those discussed below, and elsewhere in this MD&A, are not defined under IFRS and, therefore, should not be considered in isolation or as an alternative to or to be more meaningful than net earnings attributable to common shareholders or cash flow from operating activities, as determined in accordance with IFRS, when assessing our financial performance or liquidity. These measures are not necessarily comparable to a similarly titled measure of another company.
Funds from Operations and Free Cash Flow
FFO is an important metric as it provides a proxy for the amount of cash generated from operating activities before changes in working capital, and provides the ability to evaluate cash flow trends more readily in comparison with results from prior periods. FCF is an important metric as it represents the amount of cash generated by our business, before changes in working capital, that is available to invest in growth initiatives, make scheduled principal repayments on debt, repay maturing debt, pay common share dividends, or repurchase common shares. Changes in working capital are excluded so as to not distort FFO and FCF with changes that we consider temporary in nature, reflecting, among other things, the impact of seasonal factors and the timing of capital projects. FFO per share and FCF per share are calculated using the weighted average number of common shares outstanding during the period.
The table below reconciles our cash flow from operating activities to our FFO and FCF.
| 3 months ended March 31 | ||||||||
| 2017 | 2016 | |||||||
| Cash flow from operating activities | 281 | 275 | ||||||
| Change in non-cash operating working capital balances | (95 | ) | (94 | ) | ||||
| Cash flow from operations before changes in working capital | 186 | 181 | ||||||
| Adjustments: | ||||||||
| Decrease in finance lease receivable | 15 | 14 | ||||||
| Mississauga recontracting provision settled | 1 | - | ||||||
| Other | 1 | 1 | ||||||
| FFO | 203 | 196 | ||||||
| Deduct: | ||||||||
| Sustaining capital | (46 | ) | (59 | ) | ||||
| Productivity capital | (2 | ) | - | |||||
| Dividends paid on preferred shares | (10 | ) | (12 | ) | ||||
| Distributions paid to subsidiaries' non-controlling interests | (47 | ) | (39 | ) | ||||
| FCF | 98 | 86 | ||||||
| Weighted average number of common shares outstanding in the period | 288 | 288 | ||||||
| FFO per share | 0.70 | 0.68 | ||||||
| FCF per share | 0.34 | 0.30 | ||||||
| M6 TRANSALTA CORPORATION / Q1 2017 |
Comparable EBITDA
EBITDA is a widely adopted valuation metric and an important metric for management that represents our core business profitability. Interest, taxes, and depreciation and amortization are not included, as differences in accounting, treatments may distort our core business results. In addition, we reclassify certain transactions to facilitate the discussion on the performance of our business: i) Certain assets we own in Canada and Australia are fully contracted and recorded as finance leases under IFRS. We believe it is more appropriate to reflect the payment we received under the contracts as a capacity payment in our revenues instead of as finance lease income and a decrease in finance lease receivables. We depreciate these assets over their expected lives. ii) We also reclassify the deprecation on our mining equipment from fuel and purchased power to reflect the actual cash cost of our business in our comparable EBITDA.
A reconciliation of reported Operating Income to EBITDA and comparable EBITDA results for the three months ended March 31, 2017 and 2016, are as follows:
| 3 months ended March 31 | ||||||||
| 2017 | 2016 | |||||||
| Operating income | 62 | 107 | ||||||
| Depreciation and amortization | 143 | 122 | ||||||
| EBITDA | 205 | 229 | ||||||
| Comparable reclassifications: | ||||||||
| Finance leases income used as a proxy for operating revenue | 16 | 16 | ||||||
| Decrease in finance lease receivables used as a proxy for operating revenue | 15 | 14 | ||||||
| Reclassification of mine depreciation from fuel and purchased power | 17 | 15 | ||||||
| Adjustments to earnings to arrive at comparable results: | ||||||||
| Impacts to revenue associated with certain de-designated and economic hedges | - | 5 | ||||||
| Impacts associated with Mississauga recontracting(1) | 21 | - | ||||||
| Comparable EBITDA | 274 | 279 | ||||||
In December 2016, we agreed to terminate our existing arrangement with the IESO relating to our Mississauga cogeneration facility in Ontario and entered into a new Non-Utility Generator (“NUG”) Contract effective Jan. 1, 2017. Under the new NUG Contract, we receive fixed monthly payments until December 31, 2018 with no delivery obligations. Under IFRS in 2016, as a result of the NUG Contract, we recognized a receivable of $207 million (discounted), a pre-tax gain of approximately $191 million net of costs to mothball the units, and accelerated depreciation of $46 million. In 2017 and 2018, on a comparable basis, we record the payments we receive as revenues as a proxy for operating income, and continue to depreciate the facility until Dec. 31, 2018.
| (1) | Impacts associated with Mississauga recontracting for the first quarter of 2017 are as follows: Revenue ($27 million), fuel and purchased power de-designated hedges ($4 million), and Operations, maintenance, and administration ($2 million). |
| TRANSALTA CORPORATION /Q1 2017M7 |
Discussion of Consolidated Financial Results
We evaluate our performance and the performance of our business segments using a variety of measures. Comparable figures are not defined under IFRS. Refer to the Reconciliation of Non-IFRS Measures section of this MD&A for further discussion of these items.
| 3 months ended March 31 | ||||||||
| 2017 | 2016 | |||||||
| Comparable EBITDA | 274 | 279 | ||||||
| Provisions | 1 | 1 | ||||||
| Interest expense | (57 | ) | (58 | ) | ||||
| Unrealized (gains) losses from risk management activities | (5 | ) | (7 | ) | ||||
| Current income tax expense | (6 | ) | (5 | ) | ||||
| Decommissioning and restoration costs settled | (4 | ) | (3 | ) | ||||
| Realized foreign exchange gain (loss) | 3 | (1 | ) | |||||
| Other non-cash items | (3 | ) | (10 | ) | ||||
| FFO | 203 | 196 | ||||||
| Deduct: | ||||||||
| Sustaining capital | (46 | ) | (59 | ) | ||||
| Productivity capital | (2 | ) | - | |||||
| Dividends paid on preferred shares | (10 | ) | (12 | ) | ||||
| Distributions paid to subsidiaries' non-controlling interests | (47 | ) | (39 | ) | ||||
| FCF | 98 | 86 | ||||||
| Weighted average number of common shares outstanding in the period | 288 | 288 | ||||||
| FFO per share | 0.70 | 0.68 | ||||||
| FCF per share | 0.34 | 0.30 | ||||||
Comparable EBITDA for the quarter totaled $274 million, down $5 million compared to last year. Even though prices in Alberta improved slightly compared to last year, the rolling off of higher priced hedges negatively impacted the results of our Canadian Coal portfolio. Also, as expected, we are facing higher coal costs in Alberta in 2017 due to an outage on one of our draglines at the mine, as well as a higher strip ratio. Our strip ratio is expected to improve as we open a new mining area in 2018. Higher levels of rainfall in the Pacific Northwest, coupled with a warmer winter in the Northeast, negatively impacted our ability to generate gross margins in our Energy Marketing business. These shortfalls in Canadian Coal and Energy Marketing were mostly offset by the expected settlement of the indexation dispute with the OEFC relating to the long-term contracts for the Ottawa and Windsor facilities.
FCF for the first quarter was up by $12 million, compared to 2016, due to higher realized foreign exchange gains, higher unrealized mark-to-market gains and, lower sustaining capital expenditures, offset by higher distributions paid to subsidiaries’ non-controlling interests as a result of the expected settlement of the indexation dispute for our long-term contracts at Ottawa and Windsor, which forms part of TransAlta Cogeneration L.P (“TA Cogen”).
Discussion of Segmented Comparable Results
Each business segment assumes responsibility for its operating results measured to comparable EBITDA. Operating income and gross margin are also useful measures as they provide management and investors with a measurement of operating performance that is readily comparable from period to period.
| M8 TRANSALTA CORPORATION / Q1 2017 |
Canadian Coal
| 3 months ended March 31 | ||||||||
| 2017 | 2016 | |||||||
| Availability (%) | 83.7 | 86.6 | ||||||
| Contract production (GWh) | 4,971 | 4,919 | ||||||
| Merchant production (GWh) | 1,003 | 909 | ||||||
| Total production (GWh) | 5,974 | 5,828 | ||||||
| Gross installed capacity (MW) | 3,791 | 3,786 | ||||||
| Revenues | 250 | 234 | ||||||
| Fuel and purchased power | 122 | 83 | ||||||
| Comparable gross margin | 128 | 151 | ||||||
| Operations, maintenance, and administration | 44 | 45 | ||||||
| Taxes, other than income taxes | 3 | 3 | ||||||
| Net other operating income | (10 | ) | - | |||||
| Comparable EBITDA | 91 | 103 | ||||||
| Depreciation and amortization | 87 | 76 | ||||||
| Comparable operating income | 4 | 27 | ||||||
| Sustaining capital: | ||||||||
| Routine capital | 5 | 2 | ||||||
| Mine capital | 3 | - | ||||||
| Finance leases | 4 | 3 | ||||||
| Productivity capital | 1 | - | ||||||
| Planned major maintenance | 17 | 37 | ||||||
| Total sustaining capital expenditures | 30 | 42 | ||||||
Production for the three months ended March 31, 2017 increased 146 GWh compared to 2016. Lower availability caused by higher unplanned outages and derates was offset by lower paid curtailments on contracted assets and lower levels of economic dispatching on our non-contracted generation as a result of slightly higher prices.
Comparable EBITDA for the three months ended March 31, 2017 decreased $12 million compared to 2016. Revenues for the quarter were positively impacted by the pass through of higher environmental compliance costs to PPA buyers. Lower hedge prices on our non-contracted generation ($7 million) and changes in our mark-to-market positions attributable to long-term financial contracts to economically hedge our future generation ($5 million) partially offset the increase in our revenues. Fuel and purchased power was impacted by lower expected production volume and a higher expected strip ratio at our mine, and higher expected environmental compliance costs in 2017. Most of the higher environmental compliance costs are offset as pass through revenue. Comparable EBITDA also includes a $10 million accrual related to Off-Coal Agreement payments included in net other operating income.
Depreciation increased mainly due to the shortening of the useful lives of the Keephills 3 and Genesee 3 facilities and on mine equipment at the Sunhills Mine. See the Accounting Changes section of this MD&A for further details.
For the first quarter, sustaining capital expenditures decreased by $13 million compared to 2016, mainly due to lower planned outage expenditures. In 2016 we executed pit stops on our Sundance 1 and 2 Units as well as a large outage on Sundance Unit 4. During the first quarter of 2017, only one planned outage was performed on Sundance Unit 6.
| TRANSALTA CORPORATION /Q1 2017M9 |
US Coal
| 3 months ended March 31 | ||||||||
| 2017 | 2016 | |||||||
| Availability (%) | 54.7 | 100.0 | ||||||
| Adjusted availability (%)(1) | 86.7 | 100.0 | ||||||
| Contract sales volume (GWh) | 905 | 915 | ||||||
| Merchant sales volume (GWh) | 959 | 402 | ||||||
| Purchased power (GWh) | (1,052 | ) | (945 | ) | ||||
| Total production (GWh) | 812 | 372 | ||||||
| Gross installed capacity (MW) | 1,340 | 1,340 | ||||||
| Revenues | 88 | 61 | ||||||
| Fuel and purchased power | 64 | 52 | ||||||
| Comparable gross margin | 24 | 9 | ||||||
| Operations, maintenance, and administration | 13 | 12 | ||||||
| Taxes, other than income taxes | 1 | 1 | ||||||
| Comparable EBITDA | 10 | (4 | ) | |||||
| Depreciation and amortization | 15 | (3 | ) | |||||
| Comparable operating loss | (5 | ) | (1 | ) | ||||
| Sustaining capital: | ||||||||
| Routine capital | - | 1 | ||||||
| Finance leases | 1 | - | ||||||
| Productivity capital | 1 | - | ||||||
| Planned major maintenance | 5 | 3 | ||||||
| Total | 7 | 4 | ||||||
Availability for the three months ended March 31, 2017 was down compared to 2016, due to a forced outage on Unit 1 in January. Both Units 1 and 2 commenced economic dispatching in February as a result of seasonally lower prices in the Pacific Northwest. The lower availability had a nominal impact on our results, as due to the low prices, contractual obligations were supplied by buying less expensive power in the market.
Production was up 440 GWh during the first quarter of 2017 compared to 2016, due mainly to the timing of economic dispatching in 2017.
Comparable EBITDA increased by $14 million compared to 2016. Gross margin was up $15 million as a result of higher prices on contracted sales, higher merchant sale volumes, favourable impacts of mark-to-market positions on certain forward financial contracts that do not qualify for hedge accounting, and a reduction in coal impairment charges. The weakened Canadian dollar also contributed to the higher comparable EBITDA during the first quarter of 2017.
Depreciation and amortization for the first quarter of 2017 increased by $18 million compared to 2016, due to an adjustment in 2016 on our future obligation caused by higher discount rates being applied to our decommissioning obligation for the Centralia mine. As the mine is in the reclamation stage, the adjustment flows directly to earnings. This adjustment reversed in the second quarter of 2016.
Sustaining capital expenditures for the first quarter of 2017 were up $2 million compared to 2016, primarily due to increased scope work on Unit 1, caused by the forced outage.
| (1) | Adjusted for economic dispatching. |
| M10 TRANSALTA CORPORATION / Q1 2017 |
Canadian Gas
| 3 months ended March 31 | ||||||||
| 2017 | 2016 | |||||||
| Availability (%) | 100.0 | 99.4 | ||||||
| Contract production (GWh) | 393 | 743 | ||||||
| Merchant production (GWh) | 44 | - | ||||||
| Total production (GWh) | 437 | 743 | ||||||
| Gross installed capacity (MW)(1) | 953 | 1,057 | ||||||
| Revenues | 146 | 122 | ||||||
| Fuel and purchased power | 43 | 42 | ||||||
| Comparable gross margin | 103 | 80 | ||||||
| Operations, maintenance, and administration | 14 | 14 | ||||||
| Taxes, other than income taxes | 1 | 1 | ||||||
| Comparable EBITDA | 88 | 65 | ||||||
| Depreciation and amortization | 29 | 28 | ||||||
| Comparable operating income | 59 | 37 | ||||||
| Sustaining capital: | ||||||||
| Planned major maintenance | 3 | 2 | ||||||
| Total | 3 | 2 | ||||||
Production for the first quarter of 2017 decreased 306 GWh compared to 2016, primarily due to the Windsor and Mississauga plant recontracting. The Windsor facility has been operating under a new capacity contract effective Dec. 1, 2016, and the Mississauga plant facility has been temporarily shut down effective Jan. 1, 2017, as we have no delivery obligations under the new NUG Contract.
Comparable EBITDA for the first quarter of 2017 increased by $23 million compared to 2016, mainly due to the expected settlement of the indexation dispute for our long-term contracts at Ottawa and Windsor, partially offset by lower realized hedge gains and higher mark-to-market losses as well as lower revenues from our Windsor facility under its new contract. Mississauga, Ottawa, and Windsor generating facilities are owned through our 51 per cent interest in TA Cogen.
| (1) | Includes production capacity for the Fort Saskatchewan power station, which has been accounted for as a finance lease. The portion of the Poplar Creek facility we continue to own and excludes the Mississauga cogeneration facility, which has been shutdown temporarily due to the recontracting in the fourth quarter of 2016. |
| TRANSALTA CORPORATION /Q1 2017M11 |
Australian Gas
| 3 months ended March 31 | ||||||||
| 2017 | 2016 | |||||||
| Availability (%) | 89.9 | 90.1 | ||||||
| Contract production (GWh) | 398 | 372 | ||||||
| Gross installed capacity (MW)(1) | 425 | 348 | ||||||
| Revenues | 40 | 42 | ||||||
| Fuel and purchased power | 2 | 5 | ||||||
| Comparable gross margin | 38 | 37 | ||||||
| Operations, maintenance, and administration | 7 | 6 | ||||||
| Comparable EBITDA | 31 | 31 | ||||||
| Depreciation and amortization | 8 | 5 | ||||||
| Comparable operating income | 23 | 26 | ||||||
| Sustaining capital: | ||||||||
| Routine capital | - | 1 | ||||||
| Planned major maintenance | 1 | - | ||||||
| Total | 1 | 1 | ||||||
Production for the first quarter of 2017 increased 26 GWh compared to 2016, mostly due to an increase in customer load. Due to the nature of our contracts, the increase did not have a significant financial impact on our results as our contracts are structured as capacity payments with a pass-through of fuel costs.
Depreciation and amortization for the first quarter of 2017 increased by $3 million compared to 2016, due mostly to the commissioning of a gas turbine at our South Hedland project in late December 2016. The two other gas and steam turbines will be commissioned by mid-2017.
| (1) | Includes production capacity for the Solomon power station, which has been accounted for as a finance lease. |
| M12 TRANSALTA CORPORATION / Q1 2017 |
Wind and Solar
| 3 months ended March 31 | ||||||||
| 2017 | 2016 | |||||||
| Availability (%) | 96.4 | 96.8 | ||||||
| Contract production (GWh) | 742 | 711 | ||||||
| Merchant production (GWh) | 313 | 420 | ||||||
| Total production (GWh) | 1,055 | 1,131 | ||||||
| Gross installed capacity (MW) | 1,363 | 1,424 | ||||||
| Revenues | 87 | 84 | ||||||
| Fuel and purchased power | 5 | 9 | ||||||
| Comparable gross margin | 82 | 75 | ||||||
| Operations, maintenance, and administration | 12 | 12 | ||||||
| Taxes, other than income taxes | 2 | 2 | ||||||
| Comparable EBITDA | 68 | 61 | ||||||
| Depreciation and amortization | 27 | 30 | ||||||
| Comparable operating income | 41 | 31 | ||||||
| Sustaining capital: | ||||||||
| Planned major maintenance | 3 | 2 | ||||||
| Total sustaining capital expenditures | 3 | 2 | ||||||
Production for the first quarter of 2017 decreased by 76 GWh compared to 2016, mainly due to lower wind resources impacting generation across Western Canada and the sale of the Wintering Hills merchant facility on March 1, 2017. This was partially offset by higher wind resources in Eastern Canada and in the US.
Comparable EBITDA for the first quarter of 2017 increased $7 million compared to 2016, primarily due to the sale of Solar Renewable Energy Credits (“SRECs”) generated from our US Solar assets. In the first quarter of 2016, the SRECs that we sold had been acquired at fair value as part of the acquisition in the fourth quarter of 2015 and recognized as inventory in 2015. In the first quarter of 2017, sales of SRECs were internally generated with no cost in inventory. Also impacting our results this quarter are slightly better prices in Alberta on our non-contracted generation and indexation of our contracts in Eastern Canada.
Depreciation and amortization was lower by $3 million in the first quarter of 2017 compared to 2016, due to the disposition of our Wintering Hills merchant wind facility, which closed on March 1, 2017.
| TRANSALTA CORPORATION /Q1 2017M13 |
Hydro
| 3 months ended March 31 | ||||||||
| 2017 | 2016 | |||||||
| Contract production (GWh) | 367 | 417 | ||||||
| Merchant production (GWh) | 8 | 4 | ||||||
| Total production (GWh) | 375 | 421 | ||||||
| Gross installed capacity (MW) | 926 | 926 | ||||||
| Revenues | 24 | 28 | ||||||
| Fuel and purchased power | 1 | 2 | ||||||
| Comparable gross margin | 23 | 26 | ||||||
| Operations, maintenance, and administration | 8 | 7 | ||||||
| Taxes, other than income taxes | 1 | 1 | ||||||
| Comparable EBITDA | 14 | 18 | ||||||
| Depreciation and amortization | 8 | 7 | ||||||
| Comparable operating income | 6 | 11 | ||||||
| Sustaining capital: | ||||||||
| Routine capital, excluding hydro life extension | 1 | - | ||||||
| Hydro life extension | - | 3 | ||||||
| Planned major maintenance | 1 | 2 | ||||||
| Total | 2 | 5 | ||||||
Production for the first quarter of 2017 decreased by 46 GWh compared to 2016, primarily due to lower water resources. Lower generation negatively impacted our results.
Comparable EBITDA for the first quarter of 2017 decreased by $4 million compared to 2016. The first quarter of 2016 results included a prior year adjustment for metering at one of our hydro power plants.
Sustaining capital for the first quarter of 2017 decreased $3 million compared to 2016, due to life extension projects at Bighorn and Brazeau last year.
Energy Marketing
| 3 months ended March 31 | ||||||||
| 2017 | 2016 | |||||||
| Revenues and comparable gross margin | 1 | 32 | ||||||
| Operations, maintenance, and administration | 5 | 9 | ||||||
| Comparable EBITDA | (4 | ) | 23 | |||||
| Depreciation and amortization | - | 1 | ||||||
| Comparable operating income | (4 | ) | 22 | |||||
For the three months ended March 31, 2017, comparable EBITDA decreased by $26 million compared to 2016, due to warm weather during the winter in the Northeast, significant precipitation in the Pacific Northwest, and reduced volume of activities in the quarter due to reduced risk taken by the traders facing uncertain conditions, and from our customer risk management activity business.
| M14 TRANSALTA CORPORATION / Q1 2017 |
Corporate
Our Corporate overhead costs of $24 million were $6 million higher in the first quarter of 2017 compared to 2016, primarily due to a reclassification of incentives for 2016 between our operational segments and corporate segment.
Key Financial Ratios
The methodologies and ratios used by rating agencies to assess our credit rating are not publicly disclosed. We have developed our own definitions of ratios and targets to help evaluate the strength of our financial position. These metrics and ratios are not defined under IFRS, and may not be comparable to those used by other entities or by rating agencies. We are focused on strengthening our financial position and flexibility and aim to meet all our target ranges by 2018.
FFO before Interest to Adjusted Interest Coverage
| As at | March 31, 2017(1) | Dec. 31, 2016 | ||||||
| FFO | 770 | 763 | ||||||
| Add: Interest on debt net of capitalized interest | 222 | 223 | ||||||
| FFO before interest | 992 | 986 | ||||||
| Interest on debt | 238 | 239 | ||||||
| Add: 50 per cent of dividends paid on preferred shares | 20 | 21 | ||||||
| Adjusted interest | 258 | 260 | ||||||
| FFO before interest to adjusted interest coverage (times) | 3.8 | 3.8 | ||||||
Our target for FFO before interest to adjusted interest coverage is four to five times. The ratio is comparable to 2016. We expect this metric to improve towards our targeted level once our South Hedland power project is commissioned in mid-2017.
Adjusted FFO to Adjusted Net Debt
| As at | March 31, 2017 | Dec. 31, 2016 | ||||||
| FFO(1) | 770 | 763 | ||||||
| Less: 50 per cent of dividends paid on preferred shares(1) | (20 | ) | (21 | ) | ||||
| Adjusted FFO(1) | 750 | 742 | ||||||
| Period-end long-term debt(2) | 4,304 | 4,361 | ||||||
| Less: Cash and cash equivalents | (504 | ) | (305 | ) | ||||
| Add: 50 per cent of issued preferred shares | 471 | 471 | ||||||
| Fair value asset of economic hedging instruments on debt(3) | (151 | ) | (163 | ) | ||||
| Adjusted net debt | 4,120 | 4,364 | ||||||
| Adjusted FFO to adjusted net debt (%) | 18.2 | 17.0 | ||||||
Our adjusted FFO to adjusted net debt ratio improved to 18.2 per cent, due to the reduction of our net debt in the first quarter. We expect this metric to improve towards our targeted level of 20 to 25 per cent once our South Hedland power project is commissioned in mid-2017.
| (1) | Last 12 months. Our target range for comparable FFO in 2017 is $765 million to $855 million. |
| (2) | Includes finance lease obligations and tax equity financing. |
| (3) | Included in risk management assets and/or liabilities on the condensed consolidated financial statements as at March 31, 2017 and Dec. 31, 2016. During the first quarter of 2017, we discontinued hedge accounting on certain US-denominated debt hedges. The foreign currency derivatives remain in place as economic hedges. See the Financial Instruments section of this MD&A for further details. |
| TRANSALTA CORPORATION /Q1 2017M15 |
Adjusted Net Debt to Comparable EBITDA
| As at | March 31, 2017 | Dec. 31, 2016 | ||||||
| Period-end long-term debt(1) | 4,304 | 4,361 | ||||||
| Less: Cash and cash equivalents | (504 | ) | (305 | ) | ||||
| Add: 50 per cent of issued preferred shares | 471 | 471 | ||||||
| Fair value asset of economic hedging instruments on debt(2) | (151 | ) | (163 | ) | ||||
| Adjusted net debt | 4,120 | 4,364 | ||||||
| Comparable EBITDA | 1,140 | 1,145 | ||||||
| Adjusted net debt to comparable EBITDA (times) | 3.6 | 3.8 | ||||||
During the first quarter of 2017, our adjusted net debt to comparable EBITDA ratio improved compared to 2016, mainly due to the significant reduction during the quarter of our net debt. Our target for adjusted net debt to comparable EBITDA is 3.0 to 3.5 times. We expect this metric to trend towards our targeted level due to the expected increase in comparable EBITDA of approximately $80 million annually from the South Hedland power project, once commissioned in mid-2017.
Significant and Subsequent Events
Transition to Clean Power in Alberta
On April 19, 2017, we announced our strategy to accelerate our transition to gas and renewables generation. The strategy includes the following steps:
| § | retirement of Sundance Unit 1 effective Jan. 1, 2018; |
| § | mothballing of Sundance Unit 2 effective Jan. 1, 2018, for a period of 2 years; and |
| § | conversion of Sundance Units 3 to 6 and Keephills Units 1 and 2 from coal-fired generation to gas-fired generation in the 2021 to 2023 timeframe, thereby extending the useful lives of these units until the mid-2030's. |
The retirement of Sundance Unit 1 and mothballing of Sundance Unit 2 reflects the limited economic viability of the units upon the expiry of their PPA due to the current oversupplied Alberta power market and low power price environment and is not expected to materially impact our forecasted cash flows for 2018 and 2019.
The benefits of converting coal-fired units to gas-fired generation include:
| § | significantly lowering carbon intensities, emissions, and carbon costs; |
| § | significantly lowering operating and sustaining capital costs; |
| § | increasing operating flexibility; and |
| § | adding between five-to-ten years of economic life to each converted unit. |
Sundance Units 1 and 2
Federal regulations stipulate that all coal plants built before 1975 must cease to operate on coal by the end of 2019, which includes Sundance Units 1 and 2. Given that Sundance Unit 1 will be shut down two years early, we intend to apply to the federal Minister of Environment to extend the life of Sundance Unit 2 from 2019 to 2021. This will provide us with flexibility to respond to the regulatory environment for coal-to-gas conversions and the new upcoming Alberta capacity market.
Sundance Units 1 and 2 collectively comprise 560 MW of the 2,141 MW at the Sundance power plants, which serves as a baseload provider for the Alberta electricity system. The PPA with the Balancing Pool relating to Sundance Units 1 and 2 expires on Dec. 31, 2017.
| (1) | Includes finance lease obligations and tax equity financing. |
| (2) | Included in risk management assets and/or liabilities on the condensed consolidated financial statements as at March 31, 2017 and Dec. 31, 2016. During the first quarter of 2017, we discontinued hedge accounting on certain US-denominated debt hedges. The foreign currency derivatives remain in place as economic hedges. See the Financial Instruments section of this MD&A for further details. |
| M16 TRANSALTA CORPORATION / Q1 2017 |
Coal-to-Gas Conversions
We expect that the capacity of Sundance Units 3 to 6 and Keephills 1 and 2 will not change following conversion, which will result in a reduction of approximately 40 per cent of carbon emissions while maintaining approximately 2,400 MWs in the Alberta power grid.
Our total capital commitment for the coal-to-gas conversions is expected to be approximately $300 million, mostly invested between 2021 to 2023. We anticipate funding the conversions with free cash flow at that time. These units are expected to provide low cost capacity and to be competitive in the upcoming capacity market auctions; we expect the first auction to occur in 2019 for 2021 and that Federal and Provincial regulations will be adopted to facilitate coal-to-gas conversions. We continue to be engaged with government in the development of the required regulatory regime.
Alberta Off-Coal Agreement
On Nov. 24, 2016, we announced that we entered into the OCA with the Government of Alberta on transition payments in exchange for the cessation of coal-fired emissions from the Keephills 3, Genesee 3, and Sheerness coal-fired plants on or before Dec. 31, 2030.
Under the terms of the OCA, we will receive annual cash payments on or before July 31 of approximately $39.9 million ($37.4 million, net to the Corporation), commencing Jan. 1, 2017 and terminating at the end of 2030. We recognize the OCA payments evenly throughout the year. Accordingly, during the three months ended March 31, 2017, approximately $10 million was recognized in Net Other Operating Income in the Condensed Consolidated Statement of Earnings. Receipt of the payments is subject to certain terms and conditions. The OCA’s main condition is the cessation of all coal-fired emissions on or before Dec. 31, 2030. The affected plants are not, however, precluded from generating electricity at any time by any method, other than the combustion of coal.
Mississauga Cogeneration Facility New Contract
On Dec. 22, 2016, we announced that we had signed a NUG Contract with the Independent Electricity System Operator for our Mississauga cogeneration facility. The NUG Contract became effective on Jan. 1, 2017, and in conjunction with the execution of the NUG Contract, we agreed to terminate effective Dec. 31, 2016, the Mississauga cogeneration facility’s pre-existing contract with the Ontario Electricity Financial Corporation, which would have otherwise terminated in December 2018. The NUG Contract provides us stable monthly payments totalling approximately $209 million until Dec. 31, 2018.
Refer to our 2016 Annual MD&A for further information regarding the Mississauga NUG Contract.
Wintering Hills Sale
On March 1, 2017, we closed the previously announced sale of our 51 per cent interest in the Wintering Hills merchant wind facility for approximately $61 million. Proceeds from the sale will be used for general corporate purposes, including reducing our debt and funding future renewables growth.
Credit Ratings Change
The Corporation maintains investment grade ratings from three credit rating agencies.
On March 15, 2017, Fitch Ratings reaffirmed our Unsecured Debt rating and Issuer Rating of BBB- and changed their outlook from negative to stable.
On April 3, 2017, DBRS Limited changed our Unsecured Debt rating and Medium-Term Notes rating from BBB to BBB (low), the Preferred Shares rating from Pfd-3 to Pfd-3 (low), and Issuer Rating BBB to BBB (low).
On April 11, 2017, Standard and Poor’s reaffirmed our Unsecured Debt rating and Issuer Rating of BBB- but changed the outlook from stable to negative.
| TRANSALTA CORPORATION /Q1 2017M17 |
Environmental Regulation Updates
Refer to the Regional Regulation and Compliance discussion in our 2016 Annual MD&A for further details that supplement the recent developments as discussed below.
Alberta
In March 2016, Alberta began development of its renewable energy procurement process design for the Alberta Electric System Operator (“AESO”) to procure a first block of renewable generation projects to be in-service by 2019. On Sept. 14, 2016, the Government of Alberta re-confirmed its commitment to achieve 30 per cent renewables in Alberta’s electricity energy mix by 2030. On March 31, 2017, the AESO launched its procurement process which requested expression of interests from qualified bidders. The successful bidders will be announced in December 2019.
Ontario
On Feb. 25, 2016, Ontario released draft regulations for its GHG cap-and-trade program that were finalized on May 19, 2016. The regulations became effective Jan. 1, 2017, and will apply to all fossil fuels used for electricity generation. The majority of our gas-fired generation in Ontario will not be significantly impacted by virtue of change-in-law provisions within existing PPAs.
Capital Structure and Liquidity
Our capital structure consists of the following components as shown below:
| March 31, 2017 | Dec. 31, 2016 | |||||||||||||||
| $ | % | $ | % | |||||||||||||
| Recourse debt - CAD debentures | 1,045 | 13 | 1,045 | 12 | ||||||||||||
| Recourse debt - U.S. senior notes | 2,116 | 26 | 2,151 | 25 | ||||||||||||
| U.S. tax equity financing | 37 | - | 39 | 1 | ||||||||||||
| Other | 15 | - | 15 | - | ||||||||||||
| Less: cash and cash equivalents | (504 | ) | (6 | ) | (305 | ) | (4 | ) | ||||||||
| Less: fair value asset of economic hedging instruments on debt(1) | (151 | ) | (2 | ) | (163 | ) | (2 | ) | ||||||||
| Net recourse debt | 2,558 | 31 | 2,782 | 32 | ||||||||||||
| Non-recourse debt | 1,023 | 12 | 1,038 | 12 | ||||||||||||
| Finance lease obligations | 68 | 1 | 73 | 1 | ||||||||||||
| Total net debt | 3,649 | 44 | 3,893 | 45 | ||||||||||||
| Non-controlling interests | 1,142 | 14 | 1,152 | 14 | ||||||||||||
| Equity attributable to shareholders | ||||||||||||||||
| Common shares | 3,094 | 37 | 3,094 | 36 | ||||||||||||
| Preferred shares | 942 | 11 | 942 | 11 | ||||||||||||
| Contributed surplus, deficit, and accumulated other comprehensive income | (499 | ) | (6 | ) | (525 | ) | (6 | ) | ||||||||
| Total capital | 8,328 | 100 | 8,556 | 100 | ||||||||||||
On Jan. 18, 2017, we filed a US base shelf prospectus that allows for the issuance of up to $2.0 billion aggregate principal amount (or its equivalent in other currencies) of common shares, first preferred shares, warrants, subscription receipts and debt securities from time to time. The specific terms of any offering of securities is to be determined at the date of issue.
| (1) | During the first quarter of 2017, we discontinued hedge accounting on certain US-denominated debt hedges. The foreign currency derivatives remain in place as economic hedges. See the Financial Instruments section of this MD&A for further details. |
| M18 TRANSALTA CORPORATION / Q1 2017 |
We continued to strengthen our financial position during the first quarter of 2017 and reduced our total net debt by $244 million, due to the higher FCF generated during the first quarter and the reduction of our working capital.
The weakening of the US dollar has decreased our long-term debt balances by $35 million compared to Dec. 31, 2016. Almost all our U.S.-denominated debt is hedged(1) either through financial contracts or net investments in our U.S. operations. During the period, these changes in our U.S.-denominated debt were offset as follows:
| As at | March 31, 2017 | Dec. 31, 2016 | ||||||
| Effects of foreign exchange on carrying amounts of U.S. operations (net investment hedge) and finance lease receivable | (18 | ) | (35 | ) | ||||
| Foreign currency economic cash flow hedges on debt | (16 | ) | (29 | ) | ||||
| Economic hedges and other | (1 | ) | (3 | ) | ||||
| Total | (35 | ) | (67 | ) | ||||
During the period through Dec. 31, 2020, we have approximately $2.5 billion of recourse and non-recourse debt maturing. We expect to refinance some of these upcoming debt maturities by raising $700 million to $900 million of debt secured by our contracted cash flows over the next 12 to 15 months. We also expect to continue our deleveraging strategy, as a significant part of our FCF over the next four years will be allocated to debt reduction.
Our credit facilities provide us with significant liquidity. At March 31, 2017, we had a total of $2.0 billion (Dec. 31, 2016 - $2.0 billion) of committed credit facilities, of which $1.4 billion (Dec. 31, 2016 - $1.4 billion) was available for use. We are in compliance with the terms of the credit facilities. At March 31, 2017, the $0.6 billion (Dec. 31, 2016 - $0.6 billion) of credit utilized under these facilities was comprised of actual drawings of nil (Dec. 31, 2016 - nil) and letters of credit of $0.6 billion (Dec. 31, 2016 - $0.6 billion). These facilities are comprised of a $1.5 billion committed syndicated bank facility expiring in 2020, one bilateral credit facility of US$200 million, expiring in 2018, and three bilateral credit facilities, totalling $240 million, expiring in 2020.
Other non-recourse debt of $830 million in total (Dec. 31, 2016 - $845 million) is subject to customary financing restrictions that restrict the Corporation’s ability to access funds generated by certain facilities’ operations. Upon meeting certain distribution tests, typically performed once per quarter, the funds are able to be distributed by the subsidiary entities to their respective parent entity. These restrictions include the ability to meet a debt service coverage ratio prior to distribution. This test was not met by one of our subsidiaries, New Richmond Wind L.P. in the first quarter of 2017, mainly due to annualization of its results for purposes of the test. The funds in this entity will remain there until the next debt service coverage ratio can be calculated in the second quarter of 2017. At March 31, 2017, $44 million (Dec. 31, 2016 - $24 million) of cash was subject to these financial restrictions.
Additionally, certain non-recourse bonds require that certain reserve accounts are established and funded through cash held on deposit and/or by providing letters of credit. As part of our cost reduction initiatives to reduce fees associated with letters of credit, we have elected to fund through cash. Accordingly, as at March 31, 2017, $16 million of cash was on deposit for certain reserves and was not available for general use.
| (1) | During the first quarter of 2017, we discontinued hedge accounting on certain US-denominated debt hedges. The foreign currency derivatives remain in place as economic hedges. See the Financial Instruments section of this MD&A for further details. |
| TRANSALTA CORPORATION /Q1 2017M19 |
Share Capital
The following tables outline the common and preferred shares issued and outstanding:
| As at | May 4, 2017 | March 31, 2017 | Dec. 31, 2016 | |||||||||
| Number of shares(millions) | ||||||||||||
| Common shares issued and outstanding, end of period | 287.9 | 287.9 | 287.9 | |||||||||
| Preferred shares | ||||||||||||
| Series A | 10.2 | 10.2 | 10.2 | |||||||||
| Series B | 1.8 | 1.8 | 1.8 | |||||||||
| Series C | 11.0 | 11.0 | 11.0 | |||||||||
| Series E | 9.0 | 9.0 | 9.0 | |||||||||
| Series G | 6.6 | 6.6 | 6.6 | |||||||||
| Preferred shares issued and outstanding, end of period | 38.6 | 38.6 | 38.6 | |||||||||
Non-Controlling Interests
As of March 31, 2017, we own 64.0 per cent (Dec. 31, 2016 – 64.0 per cent) of TransAlta Renewables. The stable and predictable cash flows generated by TransAlta Renewables’ assets has attracted favourable equity valuations from investors, allowing TransAlta to raise equity capital. We remain committed to maintaining our position as the majority shareholder and sponsor of TransAlta Renewables, with a stated goal of maintaining our interest between 60 to 80 per cent.
We also own 50.01 per cent of TransAlta Cogen which owns, operates, or has an interest in four natural-gas-fired facilities and a 50 per cent interest in a coal-fired generating facility.
Returns to Providers of Capital
Net Interest Expense
The components of net interest expense are shown below:
| 3 months ended March 31 | ||||||||
| 2017 | 2016 | |||||||
| Interest on debt | 56 | 57 | ||||||
| Interest income | (1 | ) | (1 | ) | ||||
| Capitalized interest | (3 | ) | (3 | ) | ||||
| Interest on finance lease obligations | 1 | 1 | ||||||
| Other(1) | 4 | 4 | ||||||
| Accretion of provisions | 5 | 6 | ||||||
| Net interest expense | 62 | 64 | ||||||
Net interest expense decreased during the first quarter of 2017 compared to 2016. Higher interest on long term debt was offset by favourable impacts of foreign exchange rates.
Dividends to Shareholders
On Dec. 19, 2016, the Board declared quarterly dividends per common share and preferred shares payable to shareholders relating to the period covering the first quarter of 2017. A total of $12 million and $10 million in common and preferred share dividends were paid during the quarter, respectively.
| (1) | 2016 includes interest accrued related to the Keephills 1 outage arbitration. |
| M20 TRANSALTA CORPORATION / Q1 2017 |
On April 19, 2017, we declared a dividend of $0.04 per common share, payable on July 1, 2017. We also declared a quarterly dividend of $0.16931 per share on the Series A preferred shares, $0.15645 per share on the Series B preferred shares, $0.2875 per share on the Series C preferred shares, $0.3125 per share on the Series E preferred shares, and $0.33125 per share on the Series G preferred shares, all payable on June 30, 2017.
Non-Controlling Interests
Reported earnings attributable to non-controlling interests for the first quarter of 2017 increased to $28 million from a net loss of $3 million from the first quarter of 2016, due to higher earnings at TransAlta Renewables resulting from a favourable reduction in unrealized foreign exchange losses on some of its financial interests in the Australian Assets.
Other Consolidated Analysis
Financial Position
The following chart highlights significant changes in the Condensed Consolidated Statements of Financial Position from Dec. 31, 2016 to March 31, 2017:
| Increase/ | ||||||
| Assets | (decrease) | Primary factors explaining change | ||||
| Cash and cash equivalents | 199 | Proceeds from sale of our Wintering Hills merchant wind facility, strong free cash flow, and timing of receipts and payments | ||||
| Trade and other receivables | (46 | ) | Timing of customer receipts and seasonality of revenue | |||
| Prepaid expenses | 25 | Timing of payments of insurance, deposits, and other prepayments | ||||
| Assets held for sale | (61 | ) | Closing of the sale of the Wintering Hills merchant wind facility | |||
| Risk management assets (current and long term) | 24 | Favourable market price movements, partially offset by contract settlements and unfavourable changes in foreign exchange rates | ||||
| Other assets | (30 | ) | Transfer of portion of Mississauga recontracting receivable to current assets | |||
| Other | (58 | ) | ||||
| Total decrease in assets | 53 | |||||
| Increase/ | ||||||
| Liabilities and equity | (decrease) | Primary factors explaining change | ||||
| Accounts payable and accrued liabilities | 44 | Timing of payments and accruals | ||||
| Dividends payable | (21 | ) | Timing of the declaration of common dividends | |||
| Credit facilities, long term debt, and finance lease obligations (including current portion) | (57 | ) | Favourable effects of changes in foreign exchange rates ($35 million) and repayments ($14 million) | |||
| Decommissioning and other provisions (current and long term) | 63 | Impact of lower discount rate due to shortened useful lives on certain Alberta coal assets | ||||
| Risk management liabilities (current and long term) | 21 | New contracts entered into during the period and unfavourable changes in foreign exchange rates | ||||
| Equity attributable to shareholders | 26 | Gains on cash flow hedges ($15 million), gains on translating net assets of foreign operations ($7 million), partially offset by net loss ($10 million) | ||||
| Non-controlling interests | (10 | ) | Distributions paid, partially offset by earnings | |||
| Other | (13 | ) | ||||
| Total decrease in liabilities and equity | 53 | |||||
| TRANSALTA CORPORATION /Q1 2017M21 |
Cash Flows
The following chart highlights significant changes in the Condensed Consolidated Statements of Cash Flows for the three months ended March 31, 2017 compared to the same period in 2016:
| Increase/ | ||||||||||||||
| 3 months ended March 31 | 2017 | 2016 | (decrease) | Primary factors explaining change | ||||||||||
| Cash and cash equivalents, beginning of period | 305 | 54 | 251 | |||||||||||
| Provided by (used in): | ||||||||||||||
| Operating activities | 281 | 275 | 6 | Increase in cash earnings | ||||||||||
| Investing activities | 5 | (67 | ) | 72 | Higher proceeds on disposition of facilities ($61 million), lower additions to PP&E, including assets under construction ($25 million), partially offset by unfavourable changes in investing working capital ($9 million) | |||||||||
| Financing activities | (88 | ) | (230 | ) | 142 | Lower repayment of credit facilities ($315 million) and lower dividends paid on common shares ($22 million), partially offset by lower net proceeds on sale of non-controlling interest in subsidiary ($162 million) and lower issuance of long-term debt ($17 million) | ||||||||
| Translation of foreign currency cash | 1 | (2 | ) | 3 | ||||||||||
| Cash and cash equivalents, end of period | 504 | 30 | 474 | |||||||||||
Unconsolidated Structured Entities or Arrangements
Disclosure is required of all unconsolidated structured entities or arrangements such as transactions, agreements, or contractual arrangements with unconsolidated entities, structured finance entities, special purpose entities, or variable interest entities that are reasonably likely to materially affect liquidity or the availability of, or requirements for, capital resources. We currently have no such unconsolidated structured entities or arrangements.
Guarantee Contracts
We have obligations to issue letters of credit and cash collateral to secure potential liabilities to certain parties, including those related to potential environmental obligations, commodity risk management and hedging activities, construction projects, and purchase obligations. At March 31, 2017, we provided letters of credit totalling $556 million (Dec. 31, 2016 - $566 million) and cash collateral of $86 million (Dec. 31, 2016 - $77 million). These letters of credit and cash collateral secure certain amounts included on our Condensed Consolidated Statements of Financial Position under risk management liabilities and decommissioning and other provisions.
Commitments
During the first quarter of 2017, we extended and revised our existing agreement with Alstom to provide major maintenance for our Canadian Coal facilities. The agreement relates to major maintenance projects over the 2017 through 2020 years at our Keephills plants and on some Sundance plants. Alstom will be accountable for providing its services on budget and on time with a guarantee on performance.
| M22 TRANSALTA CORPORATION / Q1 2017 |
Contingencies
I. Line Loss Rule Proceeding
TransAlta is participating in a line loss rule proceeding (the "LLRP") that is currently before the Alberta Utilities Commission (“AUC”). The AUC has determined that it has the ability to retroactively adjust line loss rates going back to 2006 and directed the Alberta Electric System Operator (the "AESO") to, among other things, perform such retroactive calculations. The various decisions by the AUC are, however, subject to appeal and challenge. TransAlta may incur additional transmission charges as a result of the LLRP. The outcome of the LLRP, however, currently remains uncertain and the total potential exposure faced by TransAlta, if any, cannot be calculated with certainty until retroactive calculations using an AUC-approved methodology are made available, and until the AUC determines what methodology will be used for retroactive calculations. The AESO expects retroactive calculations for each year using an AUC-approved methodology to begin to be available in the second quarter of 2017, at the earliest.
As a result, no provision has been recorded at this time. Further, certain PPAs for TransAlta’s facilities provide for the pass through of these types of transmission charges to TransAlta’s buyers.
Financial Instruments
Refer to Note 13 of the notes to the audited annual consolidated financial statements within our 2016 Annual Integrated Report and Note 8 of our unaudited interim condensed consolidated financial statements as at and for the three months ended March 31, 2017 for details on Financial Instruments. Refer to the Governance and Risk Management section of our 2016 Annual Integrated Report and Note 9 of our unaudited interim condensed consolidated financial statements for further details on our risks and how we manage them. Our risk management profile and practices have not changed materially from Dec. 31, 2016.
During the first quarter of 2017, we discontinued hedge accounting for certain foreign currency cash flow and fair value hedges on US$690 million and US$50 million of debt, respectively. As at March 31, 2017, cumulative gains on the cash flow hedges of approximately $3 million will continue to be deferred in Accumulated Other Comprehensive Income (“AOCI”) and will be reclassified to net earnings as the forecasted transactions (interest payments) occur. As at March 31, 2017, cumulative losses of approximately $2 million related to the fair value hedge, and recognized as part of the carrying value of the hedged debt, will be amortized to net earnings over the period to the debt’s maturity. Changes in these risk management assets and liabilities related to these discontinued hedge positions will be reflected within net earnings prospectively.
We may enter into commodity transactions involving non-standard features for which observable market data is not available. These are defined under IFRS as Level III financial instruments. Level III financial instruments are not traded in an active market and fair value is, therefore, developed using valuation models based upon internally developed assumptions or inputs. Our Level III fair values are determined using data such as unit availability, transmission congestion, or demand profiles. Fair values are validated on a quarterly basis by using reasonably possible alternative assumptions as inputs to valuation techniques, and any material differences are disclosed in the notes to the financial statements.
As at March 31, 2017, total Level III financial instruments had a net asset carrying value of $784 million (Dec. 31, 2016 - $758 million net asset). The increase during the period is primarily due to the changes in value of the long-term power sale contract designated as an all-in-one cash flow hedge, for which changes in fair value are recognized in other comprehensive income.
| TRANSALTA CORPORATION /Q1 2017M23 |
2017 Financial Outlook
The following table outlines our expectations on key financial targets for 2017:
| Measure | Target | |
| Comparable EBITDA | $1,025 million to $1,135 million | |
| Comparable FFO | $765 million to $855 million | |
| Comparable FCF | $300 million to $365 million | |
| Coal fleet availability | 86 to 88 per centt | |
| Dividend | $0.16 per common share annualized, 13 to 15 per cent payout of FCF |
Prices
For the remainder of 2017, power prices in Alberta are expected to be slightly better than 2016 as a result of higher natural gas prices and incremental carbon costs that increase the variable cost of generation year-over-year. However, prices can vary based on supply and weather conditions. In the Pacific Northwest, power prices will be lower for the second quarter due to a strong hydro season, however, for third and fourth quarters, prices are expected to be comparable to 2016.
Contractual Profile
As a result of Alberta PPAs and long-term contracts, approximately 80 per cent of our capacity is contracted over the next two years. With the announced closure of Sundance Unit 1 and the mothballing of Sundance Unit 2, this level of contracted capacity is relatively stable until the end of 2020 when the PPA’s on our Alberta coal fleet end. More than half of our non-contracted generation is sold forward 12 to 18 months ahead of time using short-term physical or financial contracts, such that on an aggregated portfolio basis, depending on market conditions, we target being up to 90 per cent contracted for the upcoming calendar year. As at the end of the first quarter of 2017, approximately 86 per cent of our 2017 capacity was contracted. The average prices of our short-term physical and financial contracts for 2017 are approximately $45 per MWh in Alberta and approximately US$45 per MWh in the Pacific Northwest.
Availability
Availability of our coal fleet is expected to be at the low end of our range of 86 to 88 per cent in 2017. Availability of our other generating assets (gas, renewables) generally exceeds 95 per cent.
Fuel Costs
As disclosed previously, the cost to mine coal at our Alberta mine is expected to increase due to a major outage of a dragline and a higher strip ratio in 2017. Seasonal variations in coal costs at our Alberta mine are minimized through the application of standard costing. Coal costs for 2017, on a standard cost per tonne basis, are expected to be approximately 12 per cent higher than 2016 unit costs. Results in the first quarter were in line with our expectations. The development of Pit 9 in 2018 is expected to improve our strip ratio.
In the Pacific Northwest, our U.S. Coal mine, adjacent to our power plant, is in the reclamation stage. Fuel at U.S. Coal has been purchased primarily from external suppliers in the Powder River Basin and delivered by rail. The delivered fuel cost will decrease slightly in 2017 primarily due to lower transportation costs resulting from lower expected natural gas prices.
Most of our generation from gas is sold under contract with pass-through provisions for fuel. For gas generation with no pass-through provision, we purchase natural gas from third parties coincident with production, thereby minimizing our risk to changes in prices.
We closely monitor the risks associated with changes in electricity and input fuel prices on our future operations and, where we consider it appropriate, use various physical and financial instruments to hedge our assets and operations from such price risks.
| M24 TRANSALTA CORPORATION / Q1 2017 |
Energy Marketing
EBITDA from our Energy Marketing segment is affected by prices and volatility in the market, overall strategies adopted, and changes in regulation and legislation. We continuously monitor both the market and our exposures to maximize earnings while still maintaining an acceptable risk profile. Our 2017 objective for Energy Marketing is for the segment to contribute between $60 million to $70 million in gross margin for the year, below our initial target of $70 million to $90 million, due to our first quarter performance.
Exposure to Fluctuations in Foreign Currencies
Our strategy is to minimize the impact of fluctuations in the Canadian dollar against the US dollar and Australian dollar by offsetting foreign-denominated assets with foreign-denominated liabilities and by entering into foreign exchange contracts. We have foreign-denominated expenses, including interest charges, which largely offset our net foreign-denominated revenues.
Net Interest Expense
Net interest expense for 2017 is expected to be higher than in 2016, largely due to lower capitalized interest. However,changes in interest rates and in the value of the Canadian dollar relative to the US dollar can affect the amount of net interest expense incurred.
Net Debt, Liquidity, and Capital Resources
We expect to maintain adequate available liquidity under our committed credit facilities. We currently have access to $2.0 billion in liquidity, and more than $500 million in cash. Our continued focus will be toward repositioning our capital structure and we expect to be well positioned to address the upcoming debt maturities in the second quarter of 2017, and 2018.
Capital Expenditures
Our major projects are focused on sustaining our current operations and supporting our growth strategy in our renewables platform.
A summary of the significant growth and major projects that are in progress is outlined below:
| Total Project | 2017 | Target | ||||||||||||||
| Estimated spend | Spent to date(1) | Estimated spend | completion date | Details | ||||||||||||
| Project | ||||||||||||||||
| South Hedland power project(2) | 576 | 356 | 210 - 230 | Q2 2017 | 150 MW combined-cycle power plant | |||||||||||
| Solomon load bank facility | 5 | 2 | 3 | Q1 2017 | Installation of 20MW load bank facility required to support the operation of the Solomon power station | |||||||||||
| Transmission | Not applicable(3) | 3 | Ongoing | Regulated transmission that receives a return on investment | ||||||||||||
| Total | 581 | 358 | 216 - 236 | |||||||||||||
Cash required to fund the construction of the South Hedland power project is expected to be partially funded by proceeds from project financing and cash generated by our business.
| (1) | Represents amounts spent as of March 31, 2017. |
| (2) | Estimated project expenditures are AUD$553 million. Total estimated project expenditures are stated in CAD$ and include estimated capital interest costs. The total estimated project expenditures may change due to fluctuations in foreign exchange rates. Approximately $155 million in project expenditures relate to infrastructure acquisition and network, water and gas access deposits, and prepayments, most of which is due to be paid on commissioning. |
| TRANSALTA CORPORATION /Q1 2017M25 |
A significant portion of our sustaining and productivity capital is planned major maintenance, which includes inspection, repair and maintenance of existing components, and the replacement of existing components. Planned major maintenance costs are capitalized as part of Property, plant and equipment (“PP&E”) and are amortized either on a straight-line basis over the term until the next major maintenance event or on a unit-of-production basis. These costs exclude amounts for day-to-day routine maintenance, unplanned maintenance activities, and minor inspections and overhauls, which are expensed as incurred.
Our estimate for total sustaining and productivity capital is allocated among the following:
| Category | Description | Spent to date(1) | Expected spend in 2017 | |||||||
| Routine capital(2) | Capital required to maintain our existing generating capacity | 9 | 85 - 90 | |||||||
| Planned major maintenance | Regularly scheduled major maintenance | 30 | 125 - 130 | |||||||
| Mine capital | Capital related to mining equipment and land purchases | 3 | 30 - 35 | |||||||
| Finance leases | Payments on finance leases | 4 | 20 - 25 | |||||||
| Total sustaining capital | 46 | 260 - 280 | ||||||||
| Productivity capital | Projects to improve power production efficiency and corporate improvement initiatives | 2 | 10 - 15 | |||||||
| Total sustaining and productivity capital | 48 | 270 - 295 | ||||||||
Significant planned major outages for 2017 include the following:
| § | six major outages, including: Sundance 6 outage which was completed on schedule and on budget in the first quarter, a major turnaround at Centralia Unit 2 which is currently in progress, a major outage at Keephills 2 which we are currently executing, a turnaround on Keephills 3 in the third quarter, Sheerness 1 in the fourth quarter, and a major overhaul to one of our draglines at our Highvale mine, |
| § | three major outages in our Canadian Gas segment related to our Sarnia and Windsor facilities, scheduled for the second and fourth quarter. |
Lost production as a result of planned major maintenance, excluding planned major maintenance for U.S. Coal, which is scheduled during a period of economic dispatching, is estimated as follows for 2017:
| Coal | Gas and Renewables | Total | Lost to date(1) | |||||||||||||
| GWh lost | 895 - 905 | 200 - 230 | 1,095 - 1,135 | 330 | ||||||||||||
Funding of Capital Expenditures
Funding for these planned capital expenditures is expected to be provided by cash flow from operating activities, existing liquidity, and capital raised from our contracted cash flows. We have access to approximately $2.0 billion in liquidity, if required. The funds required for committed growth, sustaining capital, and productivity projects are not expected to be significantly impacted by the current economic environment.
| (3) | Transmission projects are aggregated and developed on an ongoing basis. Consequently, discrete project expenditures are not available. |
| M26 TRANSALTA CORPORATION / Q1 2017 |
Accounting Changes
A. Current Accounting Changes
I. Change in Estimates – Useful Lives
As a result of the Alberta OCA described in the Significant Events section of this MD&A and in our 2016 annual consolidated financial statements, we will cease coal-fired emissions by the end of 2030. On Jan. 1, 2017, the useful lives of the PP&E and amortizable intangibles associated with some of our Alberta coal assets were reduced to 2030. As a result, depreciation expense and intangibles amortization for the three months ended March 31, 2017 increased by approximately $14 million and the full year 2017 depreciation and amortization expense are expected to increase by approximately $58 million. The useful lives may be revised or extended in compliance with our accounting policies, dependent upon future operating decisions and events.
B. Future Accounting Changes
Accounting standards that have been previously issued by the IASB but are not yet effective, and have not been applied by us, include IFRS 9Financial Instruments, IFRS 15Revenue from Contracts with Customers,and IFRS 16Leases. Refer toNote 3 of our 2016 annual consolidated financial statements for information regarding the requirements of IFRS 9, IFRS 15, and IFRS 16.
We have made progress on the implementation plan for IFRS 9 during 2016; however, it is not yet possible to make a reliable estimate of the impact of IFRS 9 on our financial statements and disclosures. Our current estimate of the time and effort necessary to complete the implementation plan for IFRS 9 extends into mid-to-late 2017.
We have created an implementation plan for IFRS 15 and are currently in the process of reviewing our various revenue streams and underlying contracts with customers to determine the impact that the adoption of IFRS 15 will have on our financial statements. Our current estimate of the time and effort necessary to complete our implementation plan for IFRS 15 extends into mid-to-late 2017. We anticipate finalizing a decision with respect to our transition method by mid-2017.
We are in the process of completing our initial scoping assessment on IFRS 16 and expect to have an implementation plan in place by mid-2017. We anticipate most the effort under the implementation plan will occur in late 2017 through mid-2018. It is not yet possible to make reliable estimates of the potential impact of IFRS 16 on our financial statements and disclosures.
| TRANSALTA CORPORATION /Q1 2017M27 |
Selected Quarterly Information
Our results are seasonal due to the nature of the electricity market and related fuel costs. Higher maintenance costs are usually incurred in the spring and fall when electricity prices are expected to be lower, as electricity prices generally increase in the peak winter and summer months in our main markets due to increased heating and cooling loads. Margins are also typically impacted in the second quarter due to the volume of hydro production resulting from spring runoff and rainfall in the Pacific Northwest, which impacts production at U.S. Coal. Typically, hydro facilities generate most of their electricity and revenues during the spring months when melting snow starts feeding watersheds and rivers. Inversely, wind speeds are historically greater during the cold winter months and lower in the warm summer months.
| Q2 2016 | Q3 2016 | Q4 2016 | Q1 2017 | |||||||||||||
| Revenues | 492 | 620 | 717 | 578 | ||||||||||||
| Comparable EBITDA | 248 | 244 | 374 | 274 | ||||||||||||
| Comparable FFO | 175 | 163 | 228 | 203 | ||||||||||||
| Net earnings (loss) attributable to common shareholders | 6 | (12 | ) | 61 | - | |||||||||||
| Net earnings (loss) per share attributable to common shareholders, basic and diluted(1) | 0.02 | (0.04 | ) | 0.21 | - | |||||||||||
| Q2 2015 | Q3 2015 | Q4 2015 | Q1 2016 | |||||||||||||
| Revenues | 438 | 641 | 595 | 568 | ||||||||||||
| Comparable EBITDA | 183 | 219 | 268 | 279 | ||||||||||||
| Comparable FFO | 160 | 126 | 243 | 196 | ||||||||||||
| Net earnings (loss) attributable to common shareholders | (131 | ) | 154 | (7 | ) | 62 | ||||||||||
| Net earnings (loss) per share attributable to common shareholders, basic and diluted(1) | (0.47 | ) | 0.55 | (0.02 | ) | 0.22 | ||||||||||
| (1) | Basic and diluted earnings per share attributable to common shareholders and comparable earnings per share are calculated each period using the weighted average common shares outstanding during the period. As a result, the sum of the earnings per share for the four quarters making up the calendar year may sometimes differ from the annual earnings per share. |
| M28 TRANSALTA CORPORATION / Q1 2017 |
Reported net earnings, comparable EBITDA, and FFO are generally higher in the first and fourth quarters due to higher demand associated with winter cold in the markets in which we operate and lower planned outages.
Net earnings attributable to common shareholders has also been impacted by the following variations and events:
| § | gain on disposal of assets, following the Poplar Creek contract restructuring in the third quarter of 2015, |
| § | U.S. Solar and Wind acquisitions in the third quarter of 2015, |
| § | settlement with the Market Surveillance Administrator in the third quarter of 2015, |
| § | a recovery of a writedown of deferred tax assets in, the third quarter of 2015, and the first and second quarters of 2016, |
| § | change in income tax rates in Alberta in the second quarter of 2015, |
| § | deferred income tax impacts of the sale of an economic interest in Australian Assets to TransAlta Renewables in the first and second quarters of 2015, |
| § | effects of unrealized losses on intercompany financial instruments that are attributable only to the non-controlling interests in the first, second, and third quarters of 2016, and unrealized gains in the first quarter of 2017, |
| § | effects of the Mississauga cogeneration facility recontracting during the fourth quarter of 2016, |
| § | effects of the Keephills 1 outage provision, and |
| § | effects of the Wintering Hills impairment charge during the fourth quarter of 2016. |
DisclosureControls and Procedures
Management has evaluated, with the participation of our Chief Executive Officer and Chief Financial Officer, the effectiveness of our disclosure controls and procedures as of the end of the period covered by this report. Disclosure controls and procedures refer to controls and other procedures designed to ensure that information required to be disclosed in the reports we file or submit under the Securities Exchange Act of 1934, as amended (“Exchange Act”) are recorded, processed, summarized, and reported within the time periods specified in the rules and forms of the U.S. Securities and Exchange Commission. Disclosure controls and procedures include, without limitation, controls and procedures designed to ensure that information required to be disclosed by us in our reports that we file or submit under the Exchange Act is accumulated and communicated to management, including our Chief Executive Officer and Chief Financial Officer, as appropriate to allow timely decisions regarding our required disclosure. In designing and evaluating our disclosure controls and procedures, management recognizes that any controls and procedures, no matter how well designed and operated, can provide only reasonable assurance of achieving the desired control objectives, and management is required to apply its judgment in evaluating and implementing possible controls and procedures.
There have been no changes in our internal control over financial reporting during the three months ended March 31, 2017 that have materially affected, or are reasonably likely to materially affect our internal control over financial reporting. Based on the foregoing evaluation, our Chief Executive Officer and Chief Financial Officer have concluded that, as at March 31, 2017, the end of the period covered by this report, our disclosure controls and procedures were effective.
| TRANSALTA CORPORATION /Q1 2017M29 |
Supplemental Information
| March 31, 2017 | Dec. 31, 2016 | |||||||||||
| Closing market price (TSX) ($) | 7.82 | 7.43 | ||||||||||
| Price range for the last 12 months (TSX) ($) | High | 8.07 | 7.54 | |||||||||
| Low | 5.17 | 3.76 | ||||||||||
| Adjusted net debt to invested capital(1)(%) | 49.5 | 51 | ||||||||||
| Adjusted net debt to invested capital excluding non-recourse debt(1) (%) | 42.4 | 44.2 | ||||||||||
| Adjusted net debt to comparable EBITDA(1, 2) (times) | 3.6 | 3.8 | ||||||||||
| Return on equity attributable to common shareholders(2)(%) | 2.5 | 5.4 | ||||||||||
| Return on capital employed(2)(%) | 4.6 | 5.3 | ||||||||||
| Earnings coverage(2)(times) | 1.4 | 1.7 | ||||||||||
| Dividend payout ratio based on FFO(1, 2, 3)(%) | 6.1 | 7.8 | ||||||||||
| Dividend coverage(2,3)(times) | 17.1 | 11.5 | ||||||||||
| Dividend yield(2,3) | 1.5 | 4.0 | ||||||||||
| Adjusted FFO to adjusted net debt(2)(%) | 18.2 | 17.0 | ||||||||||
| FFO before interest to adjusted interest coverage(2)(times) | 3.8 | 3.8 | ||||||||||
Ratio Formulas
Adjusted net debt to invested capital= long-term debt and finance lease obligations including current portion and fair value (asset) liability of hedging instruments on debt + 50 per cent issued preferred shares - cash and cash equivalents / adjusted net debt + non-controlling interests + equity attributable to shareholders - 50 per cent issued preferred shares
Adjusted net debt to comparable EBITDA= long-term debt and finance lease obligations including current portion and fair value (asset) liability of hedging instruments on debt - cash and cash equivalents + 50 per cent issued preferred shares / comparable EBITDA
Return on equity attributable to common shareholders = net earnings attributable to common shareholders / equity attributable to common shareholders excluding AOCI
Return on capital employed = earnings before non-controlling interests and income taxes + net interest expense before non-controlling interests and income taxes + net interest expense / invested capital excluding AOCI
Earnings coverage = net earnings attributable to shareholders + income taxes + net interest expense / interest on debt + 50 per cent dividends paid on preferred shares - interest income
| (1) | These ratios incorporate items that are not defined under IFRS. None of these measurements should be used in isolation or as a substitute for the Corporation’s reported financial performance or position as presented in accordance with IFRS. These ratios are useful complementary measurements for assessing the Corporation’s financial performance, efficiency, and liquidity and are common in the reports of other companies but may differ by definition and application. For a reconciliation of the non-IFRS measures used in these calculations, refer to the Additional IFRS and Non-IFRS Measures section of this MD&A. |
| (2) | Last 12 months. |
| (3) | On Jan. 14, 2016, we revised our dividend to $0.16 per common share on an annualized basis from $0.72 previously. The effect of the change is not reflected in these historical ratios. |
| M30 TRANSALTA CORPORATION / Q1 2017 |
Dividend payout ratio = dividends declared per common / FFO - 50 per cent dividends paid on preferred shares
Dividend coverage ratio = cash flow from operating activities / cash dividends paid on common shares
Dividend yield = dividend paid per common share / current period’s closing market price
Adjusted FFO to adjusted net debt = FFO - 50 per cent dividends paid on preferred shares / period end long-term debt and finance lease obligations including fair value (asset) liability of hedging instruments on debt + 50 per cent issued preferred shares - cash and cash equivalents
FFO before interest to adjusted interest coverage = FFO + interest on debt - interest income - capitalized interest / interest on debt + 50 per cent dividends paid on preferred shares - interest income
Glossary of Key Terms
Availability- A measure of the time, expressed as a percentage of continuous operation 24 hours a day, 365 days a year that a generating unit is capable of generating electricity, regardless of whether or not it is actually generating electricity.
Capacity - The rated continuous load-carrying ability, expressed in megawatts, of generation equipment.
Force Majeure-Literally means “greater force”. These clauses excuse a party from liability if some unforeseen event beyond the control of that party prevents it from performing its obligations under the contract.
Gigawatt - A measure of electric power equal to 1,000 megawatts.
Gigawatt Hour (GWh) - A measure of electricity consumption equivalent to the use of 1,000 megawatts of power over a period of one hour.
Greenhouse Gas (GHG)- Gases having potential to retain heat in the atmosphere, including water vapour, carbon dioxide, methane, nitrous oxide, hydrofluorocarbons, and perfluorocarbons.
Megawatt (MW) - A measure of electric power equal to 1,000,000 watts.
Megawatt Hour (MWh) - A measure of electricity consumption equivalent to the use of 1,000,000 watts of power over a period of one hour.
Power Purchase Arrangement (PPA)- A long-term arrangement established by regulation for the sale of electric energy from formerly regulated generating units to buyers.
Unplanned Outage - The shut down of a generating unit due to an unanticipated breakdown.
| TRANSALTA CORPORATION /Q1 2017M31 |
TransAlta Corporation
110 - 12th Avenue S.W.
Box 1900, Station “M”
Calgary, Alberta Canada T2P 2M1
Phone
403.267.7110
Website
www.transalta.com
CST Trust Company
P.O. Box 700 Station “B”
Montreal, Québec Canada H3B 3K3
Phone
Toll-free in North America: 1.800.387.0825
Toronto or outside North America: 416.682.3860
Fax
514.985.8843
inquiries@canstockta.com
Website
www.canstockta.com
FOR MORE INFORMATION
Media and Investor Inquiries
Investor Relations
Phone
1.800.387.3598 in Canada and United States
or 403.267.2520
Fax
403.267.7405
investor_relations@transalta.com
| M32 TRANSALTA CORPORATION / Q1 2017 |