Management’s Discussion and Analysis
Table of Contents
| | | | | | | | | | | |
| Forward-Looking Statements | | 2020 Financial Outlook | |
| Business Model | | Competitive Forces | |
| Corporate Strategy | | Power-Generating Portfolio Capital | |
| Highlights | | Other Consolidated Analysis | |
| Significant and Subsequent Events | | Critical Accounting Policies and Estimates | |
| Additional IFRS Measures and Non-IFRS Measures | | Accounting Changes | |
| Discussion of Consolidated Financial Results | | Financial Instruments | |
| Segmented Comparable Results | | Environment, Social and Governance | |
| Fourth Quarter | | Human Capital | |
Discussion of Consolidated Financial Results for the
Fourth Quarter | | Social and Relationship Capital | |
| | Natural Capital | |
| Selected Quarterly Information | | Intellectual Capital | |
| Key Financial Ratios | | 2019 Sustainability Performance | |
| Financial Position | | 2020 Sustainable Development Targets | |
| Cash Flows | | Governance and Risk Management | |
| Financial Capital | | Disclosure Controls and Procedures | |
| | | |
This Management’s Discussion and Analysis (“MD&A”) should be read in conjunction with our 2019 audited annual consolidated financial statements (the "consolidated financial statements") and our 2020 annual information form ("AIF"), each for the fiscal year ended Dec. 31, 2019. The consolidated financial statements have been prepared in accordance with International Financial Reporting Standards (“IFRS”) for Canadian publicly accountable enterprises as issued by the International Accounting Standards Board (“IASB”) and in effect at Dec. 31, 2019. All dollar amounts in the tables are in millions of Canadian dollars unless otherwise noted and except amounts per share, which are in whole dollars to the nearest two decimals. All other dollar amounts in this MD&A are in Canadian dollars, unless otherwise noted. This MD&A is dated Mar. 3, 2020. Additional information respecting TransAlta Corporation (“TransAlta”, “we”, “our”, “us” or the “Corporation”), including our AIF, is available on SEDAR at www.sedar.com, on EDGAR at www.sec.gov and on our website at www.transalta.com. Information on or connected to our website is not incorporated by reference herein.
Management’s Discussion and Analysis
Forward-Looking Statements
This MD&A includes "forward-looking information" within the meaning of applicable Canadian securities laws, and "forward-looking statements" within the meaning of applicable United States securities laws, including the United States Private Securities Litigation Reform Act of 1995 (collectively referred to herein as "forward-looking statements"). All forward-looking statements are based on our beliefs as well as assumptions based on information available at the time the assumption was made and on management's experience and perception of historical trends, current conditions and expected future developments, as well as other factors deemed appropriate in the circumstances. Forward-looking statements are not facts, but only predictions and generally can be identified by the use of statements that include phrases such as "may", "will", "can", "could", "would", "shall", "believe", "expect", "estimate", "anticipate", "intend", "plan", "forecast" "foresee", "potential", "enable", "continue" or other comparable terminology. These statements are not guarantees of our future performance, events or results and are subject to risks, uncertainties and other important factors that could cause our actual performance, events or results to be materially different from that set out in or implied by the forward-looking statements.
In particular, this MD&A contains forward-looking statements including, but not limited to: operating performance and transition to clean power generation, including our goal to have no generation from coal by the end of 2025; the Clean Energy Investment Plan and the benefits thereof; transitioning to 100 per cent clean electricity by 2025; the source of funding for the Clean Energy Investment Plan; our transformation, growth, capital allocation and debt reduction strategies; growth opportunities from 2020 to 2031 and beyond; potential for growth in renewables and on-site and cogeneration assets, including demand therefor and greenfield development acquisitions; the amount of capital allocated to new growth or development projects and funding thereof; our business, anticipated future financial performance and anticipated results, including our outlook and performance targets; our expectation that the $400 million second tranche of the investment by Brookfield Renewable Partners and its affiliates ("Brookfield") will close in October 2020; the benefit of the Brookfield Investment, including as it pertains to our expected success in executing on our growth projects, including expanding in the US renewable market and advancing our on-site and cogeneration business; the timing and the completion of growth and development projects, and their attendant costs; our estimated spend on growth and sustaining capital and productivity projects; expectations in terms of the cost of operations, capital spend and maintenance, and the variability of those costs; the conversion or repowering of our coal-fired units to natural gas, and the timing and costs thereof; expectations relating the benefits of the conversions and repowering; the terms of the current or any further proposed share buy back programs, including timing and number of shares to be repurchased pursuant to any normal course issuer bid and the acceptance thereof by the Toronto Stock Exchange ("TSX"); the mothballing of certain units; the impact of certain hedges on future earnings, results and cash flows; estimates of fuel supply and demand conditions and the costs of procuring fuel; expectations for demand for electricity, including for clean energy, in both the short term and long-term, and the resulting impact on electricity prices; the impact of load growth, increased capacity and natural gas and other fuel costs on power prices; expectations in respect of generation availability, capacity and production; expectations regarding the role that different energy sources will play in meeting future energy needs; expected financing of our capital expenditures; expected governmental regulatory regimes and legislation, as well as the cost of complying with resulting regulations and laws; our marketing and trading strategy and the risks involved in these strategies; estimates of future tax rates, future tax expense and the adequacy of tax provisions; changes in accounting estimates and accounting policies; the mitigation of risks and effectiveness thereof, including as it pertains to climate change risk, environmental management, cybersecurity, commodity prices and fuel supply; anticipated growth rates and competition in our markets; our expectations and obligations and anticipated liabilities relating to the outcome of existing or potential legal and contractual claims, regulatory investigations and disputes, including the litigation with Fortescue Metals Group Ltd. relating to the South Hedland facility and the Mangrove (as defined below) proceedings relating to the Brookfield investment, each discussed further below; ability to achieve 2020 ESG (as defined below) targets; expectations regarding the renewal of collective bargaining agreements; expectations for the ability to access capital markets at reasonable terms; the estimated impact of changes in interest rates and the value of the Canadian dollar relative to the US dollar and other currencies in locations where we do business; the monitoring of our exposure to liquidity risk; expectations in respect to the global economic environment and growing scrutiny by investors relating to sustainability performance; and our credit practices.
Management’s Discussion and Analysis
The forward-looking statements contained in this MD&A are based on many assumptions including, but not limited to, the following: no significant changes to applicable laws and regulations, including any tax and regulatory changes in the markets in which we operate; no material adverse impacts to the investment and credit markets; Alberta spot power price being equal to $53 to $63 per megawatt hours ("MWh") in 2020; Mid-C spot power prices equal to US$25 to US$35 per MWh in 2020; sustaining capital in 2020 being between $170 million and $200 million; productivity capital of $10 million to $15 million; discount rates; our proportionate ownership of TransAlta Renewables Inc. ("TransAlta Renewables") not changing materially; no decline in the dividends to be received from TransAlta Renewables; the expected life extension of the coal fleet and anticipated financial results generated on conversion or repowering; assumptions regarding the ability of the converted units to successfully compete in the Alberta energy market; and assumptions regarding our current strategy and priorities, including as it pertains to our current priorities relating to the coal-to-gas conversions, growing TransAlta Renewables and being able to realize the full economic benefit from the capacity, energy and ancillary services from our Alberta hydro assets once the applicable power purchase arrangement ("PPA") has expired; our being successful in defending against the claims alleged by Mangrove, discussed further below; the second $400 million tranche of the Brookfield investment closing as anticipated in October 2020; the Brookfield investment and its related arrangements with TransAlta having the expected benefits to the Corporation; and the higher adjusted EBITDA anticipated from our Alberta hydro assets subject to the Brookfield investment being realized.
Forward-looking statements are subject to a number of significant risks, uncertainties and assumptions that could cause actual plans, performance, results or outcomes to differ materially from current expectations. Factors that may adversely impact what is expressed or implied by forward-looking statements contained in this MD&A include, but are not limited to, risks relating to: fluctuations in market prices; changes in demand for electricity and capacity and our ability to contract our generation for prices that will provide expected returns and replace contracts as they expire; changes to the legislative, regulatory and political environments in the jurisdictions in which we operate; environmental requirements and changes in, or liabilities under, these requirements; changes in general economic or market conditions including interest rates; operational risks involving our facilities, including unplanned outages at such facilities; disruptions in the transmission and distribution of electricity; the effects of weather and other climate-change related risks; unexpected increases in cost structure; disruptions in the source of fuels, including natural gas required for the conversions and repowering, as well as the extent of water, solar or wind resources required to operate our facilities; failure to meet financial expectations; natural and manmade disasters, including those resulting in dam or dyke failures; the threat of domestic terrorism and cyberattacks; pandemic or epidemics and any associated impact on supply chain; equipment failure and our ability to carry out or have completed the repairs in a cost-effective manner or timely manner or at all; commodity risk management and energy trading risks; industry risk and competition; the need to engage or rely on certain stakeholder groups and third parties; fluctuations in the value of foreign currencies and foreign political risks; the need for and availability of additional financing; structural subordination of securities; counterparty credit risk; changes in credit and market conditions; changes to our relationship with, or ownership of, TransAlta Renewables; risks associated with development projects and acquisitions, including capital costs, permitting, labour and engineering risks, and delays in the construction or commissioning of projects or delays in the closing of acquisitions; increased costs or delays in the construction or commissioning of pipelines to converted units; changes in expectations in the payment of future dividends, including from TransAlta Renewables; inadequacy or unavailability of insurance coverage; downgrades in credit ratings; our provision for income taxes; legal, regulatory and contractual disputes and proceedings involving the Corporation, including as it pertains to establishing commercial operations at the South Hedland facility and in relation to the Brookfield investment; reliance on key personnel; and labour relations matters. The foregoing risk factors, among others, are described in further detail in the Governance and Risk Management section of this MD&A and the Risk Factors section in our AIF for the year ended Dec. 31, 2019.
Readers are urged to consider these factors carefully in evaluating the forward-looking statements and are cautioned not to place undue reliance on them, which reflect the Corporation's expectations only as of the date hereof. The forward-looking statements included in this document are made only as of the date hereof and we do not undertake to publicly update these forward-looking statements to reflect new information, future events or otherwise, except as required by applicable laws. In light of these risks, uncertainties and assumptions, the forward-looking statements might occur to a different extent or at a different time than we have described, or might not occur at all. We cannot assure that projected results or events will be achieved.
Management’s Discussion and Analysis
Business Model
Our Business
We are one of Canada’s largest publicly traded power generators with over 108 years of operating experience. We own, operate and manage a highly contracted and geographically diversified portfolio of assets representing 8,385 MW(1) of capacity and use a broad range of generation fuels that include coal, natural gas, water, solar and wind. Our energy marketing operations maximize margins by securing and optimizing high-value products and markets for ourselves and our customers in dynamic market conditions.
Vision and Values
Our vision is to be a leader in clean electricity – committed to a sustainable future. We apply our expertise, scale and diversified fuel mix to capitalize on opportunities in our core markets and grow in areas where our competitive advantages can be employed. Our values are grounded in safety, innovation, sustainability, integrity and respect, which together create a strong corporate culture that allows our people to work on a common ground and understanding. These values are at the heart of our success.
Strategy for Value Creation
Our goals are to deliver shareholder value by delivering solid returns through a combination of dividend yield and disciplined growth in cash flow per share. We strive for a low to moderate risk profile over the long-term while balancing capital allocation and maintaining financial strength to allow for financial flexibility. Our segmented cash flow growth is driven by optimizing and diversifying our existing assets and further expanding our overall portfolio and presence in Canada, the United States of America ("US") and Australia. We are focusing on these geographic areas as our expertise, scale and diversified fuel mix create a competitive advantage that we can leverage to capture expansion opportunities in these core markets to create shareholder value.
Material Sustainability Impacts
Sustainability means ensuring that our financial returns consider short- and long-term economics, environmental impacts and societal and community needs. This MD&A integrates our financial and sustainability or Environment, Social and Governance (“ESG”) reporting. Key elements of our sustainability disclosure are guided by our sustainability materiality assessment. To help inform discussion and provide context on how ESG affects our business, we have referenced the provincial securities commission guidance, Global Reporting Index, Sustainability Accounting Standards Board and the Task Force on Climate-related Financial Disclosures. Our content is structured following guidance on non-traditional capitals from the International Integrated Reporting Framework. In addition, we track the performance of 80 sustainability-related Key Performance Indicator ("KPIs") and have obtained a limited assurance report from Ernst & Young LLP over material KPIs.
(1) We measure capacity as net maximum capacity (see the Glossary of Key Terms for definition of this and other key terms), which is consistent with industry standards. Capacity figures represent capacity owned and in operation unless otherwise stated, and reflect the basis of consolidation of underlying assets.
Management’s Discussion and Analysis
Corporate Strategy
Our strategic focus is to invest in a disciplined manner in a range of clean and renewable technologies such as wind, hydro, solar, battery and thermal (natural gas-fired and cogeneration) that produce electricity for industrial customers and communities to deliver returns to our shareholders.
On Sept. 16, 2019, TransAlta announced its Clean Energy Investment Plan, which includes converting our existing Alberta coal assets to natural gas and advancing our leadership position in onsite generation and renewable energy. The Clean Energy Investment Plan provided further details of previously highlighted initiatives that TransAlta has been continuing to progress since early 2017. TransAlta is currently pursuing opportunities of $1.8 billion to $2.0 billion as part of this plan, including approximately $800 million of renewable energy projects either recently completed or already under construction. The implementation and execution of TransAlta's Clean Energy Investment Plan, including the acceleration of certain features of that plan, is in large part being facilitated by the $750 million strategic investment by Brookfield that we announced in March 2019 in response to feedback received from our shareholders during extensive engagement held in 2018 and 2019. The first $350 million tranche of Brookfield's investment closed in May 2019 and facilitated the acceleration of our coal-to-gas conversion plan discussed below. The second $400 million tranche of Brookfield's investment, anticipated to close in October 2020, will help further the advancement and implementation of the remainder of our Clean Energy Investment Plan, including our expected growth in renewables, while helping the Corporation maintain a strong balance sheet and financial flexibility to carry out the other pillars of our strategy discussed below. Refer to the Significant and Subsequent Events section of this MD&A for further details.
On Jan. 16, 2020, TransAlta announced near-term objectives that further support the Clean Energy Investment Plan. In addition, we announced our 2020 sustainability targets. For further details, refer to the 2020 Sustainable Development Targets section of this MD&A.
Our strategic priorities are focused on the following outcomes:
1.Successfully execute our coal-to-gas conversions
We are transitioning our Alberta thermal fleet to natural gas, as part of our Clean Energy Investment Plan. We plan to invest between $800 million to $1.0 billion to convert or repower our Alberta thermal fleet to natural gas. This will repurpose and reposition our fleet to a cleaner gas-fired fleet and advance our leadership position in onsite generation while generating attractive returns by leveraging the Corporation's existing infrastructure.
TransAlta’s Clean Energy Investment Plan includes converting three of our existing Alberta thermal units to gas in 2020 and 2021 by replacing existing coal burners with natural gas burners. The cost to convert each unit is expected to be approximately $30 to $35 million per unit.
The Clean Energy Investment Plan also includes permitting to repower the steam turbines at Sundance Unit 5 and Keephills Unit 1 by installing one or more combustion turbines and heat recovery steam generators, thereby creating highly efficient combined-cycle units. Repowered units are expected to have a 40 per cent lower capital investment when compared to a new combined-cycle facility while achieving a similar heat rate. The Clean Energy Investment Plan assumes there are no delays in securing the natural gas supply requirements, which may result from regulatory or other constraints.
The highlights of these gas conversion investments include:
▪Positioning TransAlta’s fleet as a low-cost generator in the Alberta energy-only market;
▪Generating attractive returns by leveraging the Corporation’s existing infrastructure;
▪Significantly extending the life and cash flows of our Alberta thermal assets; and
▪Significantly reducing air emissions and costs.
The following key achievements over the past year helped us advance this part of our strategy:
On Dec. 17, 2018, the Corporation exercised our option to acquire 50 per cent ownership in the Pioneer gas pipeline ("Pioneer Pipeline"). During the second quarter of 2019, the Pioneer Pipeline transported its first gas four months ahead of schedule to TransAlta's generating units at Sundance and Keephills. The Pioneer Pipeline initially had approximately 50 MMcf/day of natural gas flowing during the start-up phase where initial flows fluctuated depending on market conditions. Firm throughput of approximately 130 MMcf/day of natural gas began flowing through the Pioneer Pipeline on Nov. 1, 2019. Tidewater Midstream and Infrastructure Ltd. ("Tidewater") and TransAlta each own a 50 per cent interest in the Pioneer Pipeline, which is backstopped by a 15-year take-or-pay agreement from TransAlta at market rate tolls. The investment for TransAlta, including associated infrastructure, was approximately $100 million.
Management’s Discussion and Analysis
In 2019, we issued Full Notice to Proceed (“FNTP”) to convert Sundance Unit 6 and Keephills Unit 2 to natural gas by replacing the existing coal burners with natural gas burners. We are targeting to complete the conversion of Sundance Unit 6 by the second half of 2020 and Keephills Unit 2 by the first half of 2021.
We expect to issue Limited Notice to Proceed ("LNTP") for Keephills Unit 3 during the first half of 2020 and expect to complete the conversion of that unit during 2021. We are evaluating the potential to install dual fuel capability at Keephills Unit 3 to ensure we have optimal fuel flexibility as we transition the fleet from coal to gas, and to manage any timing delays in obtaining full gas requirements that may occur due to regulatory or other constraints.
We are currently seeking regulatory permits to repower the steam turbines at Sundance Unit 5 and Keephills Unit 1 by installing combustion turbines and heat recovery steam generators, thereby creating highly efficient combined-cycle units. Repowered units are expected to have a 40 per cent lower capital investment when compared to a new combined- cycle facility while achieving a similar heat rate.
To advance this repowering strategy, on Oct. 30, 2019, TransAlta acquired two 230 MW Siemens F-class gas turbines and related equipment for $84 million. These turbines will be redeployed to our Sundance site as part of the strategy to repower Sundance Unit 5 to a highly efficient combined-cycle unit. We expect to issue LNTP in 2020 and FNTP in 2021 for Sundance Unit 5, with an expected commercial operation date in 2023. The Sundance Unit 5 repowered combined- cycle unit will have a capacity of approximately 730 MW and is expected to cost approximately $750 million to $770 million, well below a greenfield combined-cycle project. In conjunction with the Sundance Unit 5 permitting, we are also permitting Keephills Unit 1 to maintain the option to repower Keephills Unit 1 to a combined-cycle unit, depending on market fundamentals. As part of this transaction, we also acquired a long-term PPA for capacity plus energy, including the passthrough of greenhouse gas ("GHG") costs, starting in late 2023 with Shell Energy North America (Canada).
2. Deliver growth in our renewables fleet
We are further expanding our renewables platform. We currently have over $400 million of renewable energy construction projects to be completed in 2020 and 2021. We completed and commissioned two wind farms in 2019 investing over $340 million through TransAlta Renewables. Our focus is to ensure that we solidify returns through exceptional project execution and integration where we are able to commission and operate assets within our schedule and cost objectives.
The following key achievements in 2019 helped us advance this part of our strategy:
US Wind Projects
In 2019, we completed the construction of two wind projects (collectively, the "US Wind Projects") in the Northeastern US. The Big Level wind project ("Big Level") acquired on Mar. 1, 2018, consists of a 90 MW project located in Pennsylvania that has a 15-year PPA with Microsoft Corp. The Antrim wind project ("Antrim") acquired on Mar. 28, 2019 consists of a 29 MW project located in New Hampshire with two 20-year PPAs with Partners Healthcare and New Hampshire Electric Co-op. Big Level and Antrim began commercial operations on Dec. 19, 2019, and Dec. 24, 2019, respectively. The US Wind Projects have added an additional 119 MW of generating capacity to our Wind and Solar portfolio.
Cost estimates for the US Wind Projects were reforecasted to be within the range of US$250 million to US$270 million, primarily due to construction and weather-related impacts as well as higher interconnection costs.
Windrise Wind Project
On Dec. 17, 2018, TransAlta's 207 MW Windrise wind project was selected by the Alberta Electric System Operator ("AESO") as one of the three selected projects in the third round of the Renewable Electricity Program. TransAlta and the AESO executed a Renewable Electricity Support Agreement with a 20-year term. The Windrise wind project is situated on 11,000 acres of land located in the county of Willow Creek, Alberta, and is expected to cost approximately $270 million to $285 million. The project development work is on schedule. Windrise has secured approval for the facility from the Alberta Utilities Commission ("AUC") and is currently permitting transmission lines required to connect the facility to the Alberta grid. Construction activities will start in the second quarter of 2020 and the project is on track to reach commercial operation during the first half of 2021.
Management’s Discussion and Analysis
Skookumchuck Wind Project
On Apr. 12, 2019, TransAlta signed an agreement with Southern Power to purchase a 49 per cent interest in the Skookumchuck wind project, a 136.8 MW wind project currently under construction and located in Lewis and Thurston counties near Centralia in Washington state. The project has a 20-year PPA with Puget Sound Energy. TransAlta has the option to make its investment when the facility reaches its commercial operation date, which is expected to be in the first half of 2020. TransAlta's 49 per cent interest in the total capital investment is expected to be approximately $150 million to $160 million, a portion of which is expected to be funded with tax equity financing.
WindCharger Project
During the first quarter of 2019, TransAlta approved the WindCharger project, an innovative energy storage project, which will have a nameplate capacity of 10 MW with a total storage capacity of 20 MWh. WindCharger is located in southern Alberta in the Municipal District of Pincher Creek next to TransAlta’s existing Summerview Wind Farm Substation. WindCharger will store energy produced by the nearby Summerview II Wind Farm and discharge into the Alberta electricity grid at times of peak demand. This project is expected to be the first utility-scale battery storage facility in Alberta and will be receiving co-funding support from Emissions Reduction Alberta. Regulatory applications, including a facilities application to the AUC and an interconnection application to the AESO, were submitted in 2019. AUC approval was granted in November 2019 and the AESO approval is expected by the end of the first quarter of 2020. Detailed engineering designs, as well as the procurement of long-lead equipment, has been completed. Construction is on track to begin in March 2020 with a commercial operation date expected within the second quarter of 2020. The total expected cost of the project to TransAlta is $7 million to $8 million.
3. Expand presence in the US renewables market
We are focusing our business development efforts in the renewables segment of the US market. Demand for new renewables in the US is expected to grow in the near term. We currently have 2,000 MW at different stages in our development pipeline. These opportunities are expected to grow TransAlta Renewables, utilize its excess debt capacity and deliver stable dividends back to TransAlta.
In addition to the US Wind Projects and the Skookumchuk wind project discussed above, during 2019, TransAlta acquired a portfolio of wind development projects in the US. If we decide to move forward with any of these projects, additional consideration may be payable on a project-by-project basis only in the event a project achieves commercial operations prior to Dec. 31, 2025. If a decision is made to not move forward with a project or the costs are no longer considered to be recoverable, the costs are charged to earnings. Estimated returns on these projects and similar projects are sufficient to recover costs of unsuccessful development projects.
4. Advance and expand our on-site generation and cogeneration business
We will grow our on-site and cogeneration asset base, a business segment we have deep experience in, having provided on-site cogeneration services to various customers since the early 1990s. Our current pipeline under evaluation is approximately 900 MW and our technical design, operations experience and safety culture make us a strong partner in this segment. We see this segment growing as industrial and large-scale customers are looking to find solutions to help lower costs of power production, replace aging or inefficient equipment, reduce network costs and meet their ESG objectives.
Consistent with this strategy, on Oct. 1, 2019, TransAlta and SemCAMS announced that they entered into definitive agreements to develop, construct and operate a cogeneration facility at the Kaybob South No. 3 sour gas processing plant. The Kaybob facility is strategically located in the Western Canadian Sedimentary Basin and accepts natural gas production out of the Montney and Duvernay formations. TransAlta will construct the cogeneration plant, which will be jointly owned, operated and maintained with SemCAMS. The capital cost of the new cogeneration facility is expected to be approximately $105 million to $115 million and the project is expected to deliver approximately $18 million in annual EBITDA. TransAlta will be responsible for all capital costs during construction and, subject to the satisfaction of certain conditions, SemCAMS is expected to purchase a 50 per cent interest in the new cogeneration facility as of the commercial operation date, which is targeted for late 2021.
The highly efficient cogeneration facility will have an installed capacity of 40 MW. All of the steam production and approximately half of the electricity output will be contracted to SemCAMS under a 13-year fixed price contract. The remaining electricity generation will be sold into the Alberta power market by TransAlta. The agreement contemplates an automatic seven-year extension subject to certain termination rights. The development of the cogeneration facility at Kaybob South No. 3 is expected to eliminate the need for traditional boilers and reduce annual carbon emissions of the operation by approximately 100,000 tonnes carbon dioxide equivalent ("CO2e"), which is equivalent to removing 20,000 vehicles off Alberta roads.
Management’s Discussion and Analysis
5. Maintain a strong financial position
We intend to remain disciplined in our capital investment strategy and continue to build on our already strong financial position.
We currently have access to $1.7 billion in liquidity, including $411 million in cash. During 2019, we entered into transactions to strengthen our position to execute on the Clean Energy Investment Plan including: (i) entering into an investment agreement with Brookfield providing us with $750 million in strategic financing, (ii) increasing our credit facilities by $200 million to a total of $2.2 billion and extending the maturity of the term by one year, and (iii) successfully obtaining US$126 million of tax equity financing associated with the US Wind Projects.
To further this strategy in 2020, we will repay the $400 million bond maturing in November 2020 and continue our share buyback program in an amount up to $80 million.
The Clean Energy Investment Plan will be funded from the cash raised through the strategic investment by Brookfield, cash generated from operations and raising capital through TransAlta Renewables. For further details on the Brookfield investment, refer to the Significant and Subsequent Events section of this MD&A.
In addition, we continue to execute on our multi-year Greenlight program that is focused on transforming our business and delivering TransAlta’s strategy by reducing our cost structure. The program is entering its fourth year since implementation, and with each passing year it creates a continuous improvement culture that improves the way employees work together to deliver better business results. The program is focused on creating a structure around our people that enables them to identify, develop and deliver projects that improve performance across the Corporation with an emphasis on delivering sustainable value and cash flow improvements. Through the program, we have instituted ways to optimize our assets, minimize GHG emissions, reduce capital and operating costs, improve fuel usage and streamline processes. As this approach is increasingly embedded into the Corporation it has increased the empowerment of our employees, strengthened our processes and improved our corporate culture while reducing our operating costs.
Management’s Discussion and Analysis
Growth and coal-to-gas conversion expenditures
Our growth projects are focused on sustaining our current operations and supporting our growth strategy in our Clean Energy Investment Plan. A summary of the significant growth and major projects that are in progress is outlined below:
| | | | | | | | | | | | | | | | | | | | | | | | | | | | | |
| | Total project | | | | | Estimated spend in 2020 | Target completion date | | |
| | Estimated
spend | | | Spent to date(1) | | | | | Details |
| Project | | | | | | | | | |
Big Level wind development project(2) | 225 | | - | | 240 | | 234 | | | 4 | | Commissioned | | 90 MW wind project with a 15-year PPA |
Antrim wind development project(3) | 100 | | - | | 110 | | 106 | | | — | | Commissioned | | 29 MW wind project with two 20-year PPAs |
Pioneer gas pipeline
partnership | 95 | | - | | 100 | | 100 | | | — | | Commissioned | | 50 per cent ownership in the 120 km natural gas pipeline to supply gas to Sundance and Keephills |
Skookumchuck wind development project(4,5) | 150 | | - | | 160 | | — | | | 80 | | Q2 2020 | | Option to purchase a 49 per cent ownership in the 136.8 MW wind project with a 20-year PPA |
Windrise wind development project(5) | 270 | | - | | 285 | | 49 | | | 233 | | Q2 2021 | | 207 MW wind project with a 20-year Renewable Electricity Support Agreement with AESO |
WindCharger battery(5,6) | 7 | | - | | 8 | | 1 | | | 6 | | Q2 2020 | | 10 MW/20 MWh utility-scale storage project |
| Boiler conversions | 100 | | - | | 200 | | 28 | | | 69 | | 2020 to 2022 | | Coal-to-gas conversions at Canadian Coal |
| Repowering | 750 | | - | | 770 | | 85 | | | 20 | | 2023 | | Repower the steam turbines at Sundance Unit 5 |
Kaybob cogeneration project(5) | 105 | | - | | 115 | | 17 | | | 59 | | Q4 2021 | | 40 MW cogeneration project with SemCAMS under a 13-year fixed price contract |
| Total | 1,802 | | - | | 1,988 | | 620 | | | 471 | | | | |
(1) Represents cumulative amounts spent as of Dec. 31, 2019.
(2) The numbers reflected above are in CAD but the actual cash spend on this project is in US funds and therefore these amounts will fluctuate with changes in foreign exchange rates. The estimated total spend is approximately US$173 million to US$185 million, spent to date is US$179 million and estimated remaining spend in 2020 is US$3 million. TransAlta Renewables funded a portion of the construction costs using its existing liquidity and the remaining was funded with tax equity financing.
(3) The numbers reflected above are in CAD but the actual cash spend on this project is in US funds and therefore these amounts will fluctuate with changes in foreign exchange rates. The estimated total spend is approximately US$77 million to US$85 million, spent to date is US$80 million and estimated remaining spend in 2020 is nil. TransAlta Renewables funded a portion of the construction costs using its existing liquidity and the remaining was funded with tax equity financing.
(4) The estimated spend in 2020 assumes the project will receive tax equity financing for the remainder of the total project spend.
(5) These projects will potentially be dropped down to TransAlta Renewables.
(6) Net of expected government reimbursements.
Management’s Discussion and Analysis
Highlights
Consolidated Financial Highlights
| | | | | | | | | | | |
| Year ended Dec. 31 | 2019 | 2018 | 2017 |
| Revenues | 2,347 | | 2,249 | | 2,307 | |
| Fuel, carbon compliance and purchased power | 1,086 | | 1,100 | | 1,016 | |
| Operations, maintenance and administration | 475 | | 515 | | 517 | |
| Net earnings (loss) attributable to common shareholders | 52 | | (248) | | (190) | |
| Cash flow from operating activities | 849 | | 820 | | 626 | |
Comparable EBITDA(1,2,3) | 984 | | 1,161 | | 1,030 | |
Funds from operations(1,3) | 757 | | 927 | | 804 | |
Free cash flow(1,3) | 435 | | 524 | | 328 | |
| Net earnings (loss) per share attributable to common shareholders, basic and diluted | 0.18 | | (0.86) | | (0.66) | |
Funds from operations per share(1,3) | 2.67 | | 3.23 | | 2.79 | |
Free cash flow per share(1,3) | 1.54 | | 1.83 | | 1.14 | |
| Dividends declared per common share | 0.12 | | 0.20 | | 0.12 | |
Dividends declared per preferred share(4) | 0.78 | | 1.29 | | 0.77 | |
| | | |
| As at Dec. 31 | 2019 | 2018 | 2017 |
| Total assets | 9,508 | | 9,428 | | 10,304 | |
Total consolidated net debt(1,5) | 3,110 | | 3,141 | | 3,363 | |
Total long-term liabilities(6) | 4,329 | | 4,414 | | 4,311 | |
(1) These items are not defined and have no standardized meaning under IFRS. Presenting these items from period to period provides management and investors with the ability to evaluate earnings trends more readily in comparison with prior periods’ results. Refer to the Discussion of Consolidated Financial Results section of this MD&A for further discussion of these items, including, where applicable, reconciliations to measures calculated in accordance with IFRS. See also the Additional IFRS measures and Non-IFRS Measures section of this MD&A.
(2) During the first quarter of 2019, we revised our approach to reporting adjustments to arrive at comparable EBITDA, mainly to be more comparable with other companies in the industry. Comparable EBITDA is now adjusted to exclude the impact of unrealized mark-to-market gains or losses. The current and prior period amounts have been adjusted to reflect this change.
(3) Includes $157 million received from the Balancing Pool for the early termination of Sundance B and C PPAs in the first quarter of 2018 and the remaining $56 million received on winning the arbitration against the Balancing Pool in the third quarter of 2019 ("PPA Termination Payments"). See the Significant and Subsequent Events section for further details.
(4) Weighted average of the Series A, B, C, E and G preferred share dividends declared. Dividends declared vary year over year due to timing of dividend declarations.
(5) Total consolidated net debt includes long-term debt, including current portion, amounts due under credit facilities, exchangeable securities, US tax equity financing and lease obligations, net of available cash and cash equivalents, the principal portion of restricted cash on TransAlta OCP and the fair value of economic hedging instruments on debt. See the table in the Financial Capital section of this MD&A for more details on the composition of total consolidated net debt.
(6) Certain comparative figures have been reclassified to conform to the current period’s presentation. These reclassifications did not impact previously reported net earnings.
At the end of 2018, we had a number of contracts expire, which impacted our comparable EBITDA. Through our strong performance in 2019, we recovered a significant amount of these expected declines through innovation, cost reductions and higher revenue from our Energy Marketing segment.
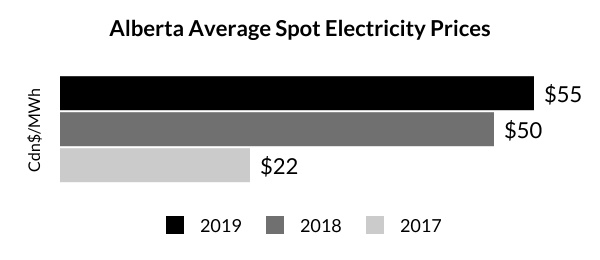
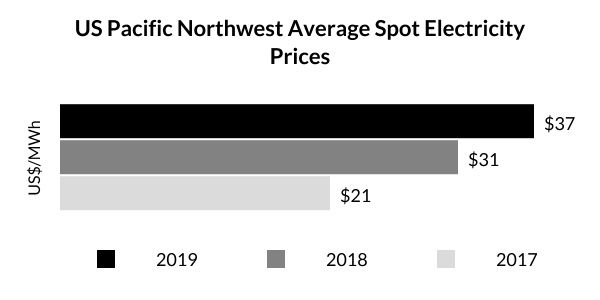
Revenues in 2019 were $2,347 million, up $98 million compared to 2018, mainly as a result of strong revenue generated from our Energy Marketing segment as well as higher production, resulting in higher revenue, within the US Coal segment due to the strong merchant pricing in the Pacific Northwest.
Comparable EBITDA decreased by $177 million compared to 2018. After adjusting for the PPA Termination Payments in 2019 and 2018, comparable EBITDA decreased by $76 million for the year ended Dec. 31, 2019, compared to 2018. This decrease was expected as a result of the expiry of the Mississauga contract and lower scheduled payments on the Poplar Creek contract. Strong performance at the Canadian Coal and Energy Marketing segments as well as lower Corporate costs have significantly offset this expected decrease. Comparable EBITDA for the year ended Dec. 31, 2019, was negatively impacted by the unplanned outage at US Coal during the first quarter of 2019.
At Canadian Coal, comparable EBITDA improved in 2019 due to the combined impact of higher realized prices as a result of greater merchant production, increased co-firing resulting in lower fuel, carbon compliance and purchased power costs, as well as lower operations, maintenance and administration ("OM&A") costs. In addition, performance from our Energy Marketing segment was stronger than 2018, particularly from US Western and Eastern markets due to continued high levels of volatility across North American power markets.
TRANSALTA CORPORATION M10
Management’s Discussion and Analysis
Free cash flow ("FCF"), one of the Corporation's key financial metrics, totalled $435 million, down $89 million compared to last year. FCF, after adjusting for the PPA Termination Payments, increased $12 million compared to last year, primarily as a result of lower sustaining and productivity capital expenditures and lower distributions paid to subsidiaries' non-controlling interests. Significant changes in segmented cash flows are highlighted in the Segmented Comparable Results within this MD&A.
OM&A expense for the year-ended Dec. 31, 2019, decreased by $40 million compared to 2018. This decline in OM&A is largely due to lower costs in our Canadian Coal and Corporate segments and ongoing streamlining of our workforce. Lower salary, contractor and materials expenses were partially offset by higher legal fees.
Fuel, carbon compliance and purchased power costs were lower in 2019 compared to 2018. This decrease was mainly due to our increased gas supply available for co-firing, as a result of the Corporation transporting natural gas on the Pioneer Pipeline earlier than expected. Co-firing, when economical, allows us to produce fewer GHG emissions than coal combustion, which lowers our GHG compliance costs.
Net earnings attributable to common shareholders for the year ended Dec. 31, 2019, were $52 million, compared to a loss of $248 million in the prior year. Increased earnings were partially driven by the Keephills 3 and Genesee 3 swap with Capital Power Corporation that closed in the fourth quarter of 2019, where we recognized a gain on termination of the coal rights contract of $88 million and a gain on the sale of Genesee 3 of $77 million, in addition to the $56 million PPA Termination Payments received during the third quarter of 2019. Excluding the PPA Termination Payments and impairment charges in both years, as well as the gains related to Keephills 3 and Genesee 3 in 2019, we have a net loss of $20 million in 2019 compared to a net loss of $174 million in 2018. Stronger earnings are attributable to stronger performance at Canadian Coal and Energy Marketing, strong Alberta pricing, the Alberta tax rate reduction, lower OM&A costs and lower interest expense, partially offset by other losses on sale of property, plant and equipment ("PP&E").
Ability to Deliver Financial Results
The metrics we use to track our performance are comparable earnings before interest, taxes, depreciation and amortization ("comparable EBITDA"), funds from operations ("FFO") and FCF. The overall performance of our portfolio was in line with our 2019 outlook. The Corporation is within the upper end of the revised FCF target of $350 million to $380 million, excluding the impact of the PPA Termination Payments. Reported FCF benefited from the receipt of $56 million from the Balancing Pool on settlement of the termination of the Sundance B and C PPA dispute.
The following table compares target to actual amounts for each of the three past fiscal years:
| | | | | | | | | | | | | | |
| Year ended Dec. 31 | | 2019 | 2018 | 2017 |
| Comparable EBITDA | Target(1) | 875-975 | 1,000-1,050 | 1,025-1,100 |
| Actual(2) | 984 | | 1,161 | | 1,030 | |
| Adjusted Actual(3) | 928 | | 1,004 | | 996 | |
| | | | |
| | | | |
| | | | |
| FCF | Target(1) | 350-380 | 300-350 | 270-310 |
| Actual | 435 | | 524 | | 328 | |
| Adjusted Actual(3) | 379 | | 367 | | 311 | |
(1) Represents our revised outlook. Due to strong results from our Canadian Coal segment, in the fourth quarter of 2019, we revised our FCF target from a range of $270 million to $330 million to a range of $350 million to $380 million. As a result of strong performance in the first quarter of 2018, we revised the following 2018 targets: comparable EBITDA from the previously announced target range of $950 million to $1,050 million to $1,000 to $1,050 million, FCF target range from $275 million to $350 million to the target range of$300 million to $350 million. In the second quarter of 2017, we reduced the following 2017 targets: Comparable EBITDA from target range of $1,025 million to $1,135 million to $1,025 to $1,100 million, FCF target range from $300 million to $365 million to the target range of $270 million to $310 million.
(2) During the first quarter of 2019, we revised our approach to reporting adjustments to arrive at comparable EBITDA, mainly to be more comparable with other companies in the industry. Comparable EBITDA is now adjusted to exclude the impact of unrealized mark-to-market gains or losses. The current and prior period amounts have been adjusted to reflect this change.
(3) 2019 and 2018 were adjusted for the PPA Termination Payments as these were not included in the targets. 2017 amounts were adjusted to remove the impact related to the Ontario Electricity Financial Corporation ("OEFC") indexation dispute: Comparable EBITDA was reduced by $34 million and FCF was reduced by $17 million.
TRANSALTA CORPORATION M11
Management’s Discussion and Analysis
Significant and Subsequent Events
Investor Day
On Sept. 16, 2019, TransAlta held our 2019 Investor Day, and announced our Clean Energy Investment Plan. See the Corporate Strategy section of this MD&A for additional 2019 significant events to advance our Clean Energy Investment Plan.
In addition, the Corporation announced that it adopted, based on TransAlta level deconsolidated cash flows, a deconsolidated Debt/EBITDA target of 2.5 to 3.0 times, and a dividend policy of returning between 10 and 15 per cent of TransAlta deconsolidated FFO to common shareholders. The credit metrics and dividend policy are being presented on a deconsolidated basis, allowing investors to understand how the dividends received from TransAlta Renewables and TransAlta Cogeneration L.P. ("TA Cogen") are either being returned or invested for TransAlta shareholders. See the Key Financial Ratios section of this MD&A for further details.
On Jan. 16, 2020, the Board declared a quarterly dividend of $0.0425 per common share payable on Apr. 1, 2020, to shareholders of record at the close of business on Mar. 2, 2020, which represents a 6.25 per cent increase in our dividend level.
Strategic Investment by Brookfield
Following extensive engagement by the Corporation with several of its shareholders, on Mar. 25, 2019, the Corporation announced it entered into an agreement (the "Investment Agreement") whereby Brookfield agreed to invest $750 million (the "Investment") in the Corporation. The Investment provides the financial flexibility to drive TransAlta's transition to 100 per cent clean electricity by 2025, recognizes the anticipated future value of TransAlta's Alberta Hydro Assets and accelerates the Corporation's plan to return capital to its shareholders. As discussed in the Corporate Strategy section of this MD&A, the Brookfield Investment was key to the implementation and advancement of the Corporation's Clean Energy Investment Plan, including facilitating or accelerating several key pillars of the Corporations' strategic plan.
Under the terms of the Investment Agreement, Brookfield agreed to invest $750 million in TransAlta through the purchase of exchangeable securities, which are exchangeable by Brookfield into an equity ownership interest in TransAlta’s Alberta Hydro Assets in the future at a value based on a multiple of the Alberta Hydro Assets’ future adjusted EBITDA.
On May 1, 2019, Brookfield invested the initial tranche of $350 million in exchange for seven per cent unsecured subordinated debentures due May 1, 2039. The remaining $400 million will be invested in October 2020 in exchange for a new series of redeemable, retractable first preferred shares, subject to the satisfaction of certain conditions being met.
Upon entering into the Investment Agreement and as required under the terms of the agreement, the Corporation paid Brookfield a $7.5 million structuring fee. A commitment fee of $15 million was also paid upon completion of the initial funding. These transaction costs were recognized as part of the carrying value of the unsecured subordinated debentures issued at that time.
In addition, subject to the exceptions in the Investment Agreement, Brookfield has committed to purchase TransAlta common shares on the open market to increase its share ownership in TransAlta to not less than nine per cent at the conclusion of the prescribed share purchase period, provided that Brookfield is not obligated to purchase any common shares at a price per share in excess of $10 per share. In connection with the Investment, Brookfield nominated and TransAlta shareholders elected two experienced officers of Brookfield, Harry Goldgut and Richard Legault, to our Board of Directors at the 2019 Annual and Special Meeting of shareholders. TransAlta and Brookfield intend to work together to complete TransAlta’s transition to clean electricity, maximize the value of the Alberta Hydro Assets and create long-term shareholder value.
In accordance with the terms of the Investment Agreement, TransAlta has formed a Hydro Assets Operating Committee
consisting of two representatives from Brookfield and two representatives from TransAlta to provide advice and recommendations in connection with the operation and maximizing the value of the Alberta Hydro Assets. In connection with this, the Corporation has committed to pay Brookfield an annual fee of $1.5 million for six years beginning May 1, 2019 (the "Brookfield Hydro Fee"), which is recognized in the OM&A expense on the statement of earnings (loss).
TransAlta has indicated that it intends to return up to $250 million of capital to shareholders through share repurchases within three years of receiving the first tranche of the Investment (which occurred on May 1, 2019).
TRANSALTA CORPORATION M12
Management’s Discussion and Analysis
Additional details about the Investment can be found in our material change report dated Mar. 26, 2019, available electronically on SEDAR at www.sedar.com and on EDGAR at www.sec.gov as well as in our AIF. Copies of the Investment Agreement, together with copies of the exchangeable debenture issued to Brookfield on May 1, 2019, the registration rights agreement entered into with Brookfield in respect of common shares held in TransAlta, and the exchange and option agreement with Brookfield governing the terms of the exchange of the exchangeable securities issued under the Investment, are also available on SEDAR and on EDGAR. Shareholders are urged to read these documents in their entirety.
On Apr. 23, 2019, The Mangrove Partners Master Fund Ltd. ("Mangrove") commenced an action in the Ontario Superior Court of Justice alleging, among other things, oppression by the Corporation and its directors and seeking to set aside the Brookfield transaction. TransAlta believes the claim is wholly lacking in merit and is taking all steps to defend against the allegations. This matter is scheduled to proceed to trial beginning Sept. 14, 2020. See the Other Consolidated Analysis section of this MD&A for additional information on the Mangrove proceedings.
Normal Course Issuer Bid
On May 27, 2019, the Corporation announced that the TSX accepted the notice filed by the Corporation to implement a Normal Course Issuer Bid ("NCIB") for a portion of its common shares. Pursuant to the NCIB, the Corporation may purchase up to a maximum of 14,000,000 common shares, representing approximately 4.92 per cent of issued and outstanding common shares as at May 27, 2019. Purchases under the NCIB may be made through open market transactions on the TSX and any alternative Canadian trading platforms on which the common shares are traded, based on the prevailing market price. Any common shares purchased under the NCIB will be cancelled.
The period during which TransAlta is authorized to make purchases under the NCIB commenced on May 29, 2019, and ends on May 28, 2020, or such earlier date on which the maximum number of common shares are purchased under the NCIB or the NCIB is terminated at the Corporation's election.
Under TSX rules, no more than 176,447 common shares (being 25 per cent of the average daily trading volume on the TSX of 705,788 common shares for the six months ended Apr. 30, 2019) can be purchased on the TSX on any single trading day under the NCIB, with the exception that one block purchase in excess of the daily maximum is permitted per calendar week.
During the year ended Dec. 31, 2019, the Corporation purchased and cancelled a total of 7,716,300 common shares at an average price of $8.80 per common share, for a total cost of $68 million.
Termination of the Alberta Sundance PPAs with the Balancing Pool
On Sept 18. 2017, the Corporation received formal notice from the Balancing Pool for the termination of the Sundance B and C PPAs effective Mar. 31, 2018. This announcement was expected and the Corporation took steps to re-take dispatch control for the units effective Mar. 31, 2018.
Pursuant to a written agreement, the Balancing Pool paid the Corporation approximately $157 million on Mar. 29, 2018. The Corporation disputed the termination payment received. The Balancing Pool excluded certain mining and corporate assets that should have been included in the net book value calculation which the Corporation pursued from the Balancing Pool through an arbitration initiated under the PPAs. On Aug. 26, 2019, the Corporation announced it was successful in the arbitration and received the full additional amount it was seeking to recover, being $56 million, plus GST and interest.
TransAlta and Capital Power Swap Non-Operating Interests in Keephills 3 and Genesee 3
On Oct. 1, 2019, the Corporation closed a transaction with Capital Power Corporation ("Capital Power") to swap TransAlta's 50 per cent ownership interest in the Genesee 3 facility for Capital Power's 50 per cent ownership interest in the Keephills 3 facility. As a result, TransAlta now owns 100 per cent of the Keephills 3 facility and Capital Power owns 100 per cent of the Genesee 3 facility.
The Keephills 3 facility is a 463 MW coal-fired generating facility located approximately 70 kilometres west of Edmonton, Alberta, adjacent to TransAlta’s existing Keephills Unit 1 and Unit 2 power plants. The Keephills 3 facility achieved commercial operation in 2011 and has been identified as a candidate for TransAlta’s intended coal-to-gas conversions.
TRANSALTA CORPORATION M13
Management’s Discussion and Analysis
The transaction price for each non-operating interest largely offset each other, resulting in a payment of approximately $10 million from Capital Power to TransAlta. Final working capital true-ups and settlements occurred in November 2019, with a net working capital difference of less than $1 million paid by TransAlta to Capital Power.
The Corporation early-adopted amendments to IFRS 3 Business Combinations, which introduce an optional fair value concentration test, that the Corporation elected to apply to its acquisition of the non-operating interest in Keephills 3. As a result, on the transaction closing of Oct. 1, 2019, the acquisition has been accounted for as an asset acquisition and the transaction price was allocated based on the relative fair values of those assets and liabilities as at the date of the acquisition. The transaction price of $301 million was allocated as follows: working capital of $11 million, PP&E of $308 million, other assets of $3 million, less other liabilities of $2 million and decommissioning and other provisions of $19 million. The net increase to our PP&E balance relating to Keephills 3 and Genesee 3 swap, including the impact of shortening the useful lives of the coal assets at Keephills 3, is estimated to increase depreciation expense in 2020 by approximately $72 million.
As a result of the sale of our interest in Genesee 3, we recognized a gain on sale of approximately $77 million in the fourth quarter.
On closing of the transaction, all of the Keephills 3 and Genesee 3 project agreements with Capital Power were terminated, including the agreement governing the supply of coal from TransAlta's Sunhills mine to the Keephills 3 facility. The Sunhills mine accounted for the revenues generated under this agreement pursuant to IFRS 15 Revenue from Contracts with Customers, which resulted in the recognition of a contract liability representing the mine’s unsatisfied performance obligations for which consideration was received in advance. Upon termination of this agreement in the fourth quarter of 2019, the Sunhills mine had no future performance obligations and accordingly, the balance of the contract liability of $88 million was recognized in earnings.
Board of Director Changes
On Jan. 16, 2020, we announced that the Board has appointed John P. Dielwart as Chair of the Board, upon his re-election as an independent director at TransAlta’s next annual shareholder meeting and immediately following Ambassador Gordon Giffin’s retirement from the Board. As previously announced, Ambassador Giffin is retiring from the Board in 2020 after serving as Chair since 2011.
Mr. Dielwart has served as an independent director on the Board since 2014, and currently serves as the Chair of the Governance, Safety and Sustainability Committee. He is also on the Investment Performance Committee of the Board and has previously served on the Audit, Finance and Risk Committee. Mr. Dielwart is a founder and director of ARC Resources Ltd. from 1996 to present and served as Chief Executive Officer of ARC Resources Ltd. from 2001 to 2013. Mr. Dielwart earned a Bachelor of Science (Distinction) in Civil Engineering from the University of Calgary, is a member of the Association of Professional Engineers and Geoscientists of Alberta and a Past-Chairman of the Board of Governors of the Canadian Association of Petroleum Producers. Mr. Dielwart is also a director and former Co-Chair of the Calgary and Area Child Advocacy Centre. In 2015, Mr. Dielwart was inducted into the Calgary Business Hall of Fame.
On Jan. 25, 2019, we also announced the retirement decision of Timothy Faithfull. In 2018, Mr. Faithfull indicated to the Board his intention to retire from the Board of Directors immediately following TransAlta's 2019 Annual Shareholders Meeting.
Management Changes
On July 18, 2019, the Corporation appointed John Kousinioris as Chief Operating Officer of TransAlta Corporation. Mr. Kousinioris previously held the roles Chief Growth Officer and Chief Legal and Compliance Officer and Corporate Secretary at TransAlta. In the role of Chief Growth Officer, Mr. Kousinioris was responsible for overseeing the areas of business development, gas and renewables operations, commercial and energy marketing. Mr. Kousinioris also remains the President of TransAlta Renewables.
On May 16, 2019, the Corporation promoted Todd Stack to Chief Financial Officer. Mr. Stack, who has served as Managing Director and Corporate Controller of the Corporation since February 2017, has been responsible for providing leadership and direction over TransAlta’s financial activities, corporate accounting, reporting, tax and corporate planning. Since joining TransAlta in 1990, Mr. Stack has acted as the Corporation's Treasurer and Corporate Controller, as well as a member of the corporate development team reviewing greenfield and acquisition opportunities. Prior to joining the finance team at TransAlta, Mr. Stack held a number of roles in the engineering team, including design, operations and project management.
TRANSALTA CORPORATION M14
Management’s Discussion and Analysis
Mothballing of Sundance Units
On Mar. 8, 2019, the Corporation announced that the AESO granted an extension to the mothballing of Sundance Units 3 and 5, which will remain mothballed until Nov. 1, 2021, extended from Apr. 1, 2020. The extensions were requested by TransAlta based on our assessment of market prices and market conditions. TransAlta has the ability to return either of the units back to full operation by providing three months’ notice to the AESO.
Financing of the US Wind Projects
TransAlta Renewables completed the acquisition of an economic interest in the US Wind Projects from a subsidiary of TransAlta Power Ltd. ("TA Power"). Pursuant to the arrangement, a TransAlta subsidiary owns the US Wind Projects directly and TA Power issued to TransAlta Renewables tracking preferred shares that pay quarterly dividends based on the pre-tax net earnings of the US Wind Projects. The tracking preferred shares have preference over the common shares of TA Power held by TransAlta, in respect of dividends and the distribution of assets in the event of the liquidation, dissolution or winding-up of TA Power. The construction and acquisition costs of the US Wind Projects were funded by tax equity financing and TransAlta Renewables. As at Dec. 31, 2019, TransAlta Renewables funded these costs by acquiring tracking preferred shares issued by TA Power or by subscribing for interest-bearing promissory notes issued by the project entity.
Big Level and Antrim began commercial operation on Dec. 19, 2019, and Dec. 24, 2019, respectively. In conjunction with reaching commercial operation, tax equity proceeds were raised to partially fund the US Wind Projects in the amount of approximately US$85 million for Big Level and approximately US$41 million for Antrim. The tax equity financing is classified as long-term debt on the statements of financial position.
Refer to the Corporate Strategy section of this MD&A for further updates on ongoing projects.
Refer to Note 4 of the consolidated financial statements within our 2019 Annual Integrated Report for significant events impacting both prior and current year results.
Additional IFRS Measures and Non-IFRS Measures
An additional IFRS measure is a line item, heading or subtotal that is relevant to an understanding of the consolidated financial statements but is not a minimum line item mandated under IFRS, or the presentation of a financial measure that is relevant to an understanding of the consolidated financial statements but is not presented elsewhere in the consolidated financial statements. We have included line items entitled gross margin and operating income (loss) in our Consolidated Statements of Earnings (Loss) for the years ended Dec. 31, 2019, 2018 and 2017. Presenting these line items provides management and investors with a measurement of ongoing operating performance that is readily comparable from period to period.
We evaluate our performance and the performance of our business segments using a variety of measures to provide management and investors with an understanding of our financial position and results. Certain financial measures discussed in this MD&A are not defined under IFRS, are not standard measures under IFRS and, therefore, should not be considered in isolation or as an alternative to or to be more meaningful than net earnings attributable to common shareholders or cash flow from operating activities, as determined in accordance with IFRS, when assessing our financial performance or liquidity. These measures may not be comparable to similar measures presented by other issuers and should not be considered in isolation or as a substitute for measures prepared in accordance with IFRS. Comparable EBITDA, deconsolidated Comparable EBITDA, FFO, deconsolidated FFO, FCF, total net debt, total consolidated net debt, adjusted net debt, deconsolidated net debt and segmented cash flow generated by the business, all as defined below, are non-IFRS measures that are presented in this MD&A. See the Discussion of Consolidated Financial Results, Segmented Comparable Results, Selected Quarterly Information, Key Financial Ratios and Financial Capital sections of this MD&A for additional information, including a reconciliation of such non-IFRS measures to the most comparable IFRS measure.
TRANSALTA CORPORATION M15
Management’s Discussion and Analysis
Discussion of Consolidated Financial Results
Each business segment assumes responsibility for its operating results measured to comparable EBITDA and cash flows generated by the business. Gross margin is also a useful measure as it provides management and investors with a measurement of operating performance that is readily comparable from period to period.
Comparable EBITDA
EBITDA is a widely adopted valuation metric and an important metric for management that represents our core business profitability. Interest, taxes, depreciation and amortization are not included, as differences in accounting treatments may distort our core business results. In addition, under comparable EBITDA we reclassify certain transactions to facilitate the discussion of the performance of our business:
▪During the first quarter of 2019, we revised our approach to reporting adjustments to arrive at comparable EBITDA, mainly to be more comparable with other companies in the industry. Comparable EBITDA is now adjusted to exclude the impact of unrealized mark-to-market gains or losses. The current and prior period amounts have been adjusted to reflect this change.
▪Any gains or losses on asset sales are not included as these are not part of ongoing operations.
▪Certain assets we own in Canada (and in Australia in 2017) are fully contracted and recorded as finance leases under IFRS. We believe it is more appropriate to reflect the payments we receive under the contracts as a capacity payment in our revenues instead of as finance lease income and a decrease in finance lease receivables. We depreciate these assets over their expected lives.
▪We also reclassify the depreciation on our mining equipment from fuel, carbon compliance and purchased power to reflect the actual cash cost of our business in our comparable EBITDA.
▪In December 2016, we agreed to terminate our existing arrangement with the Independent Electricity System Operator (“IESO”) relating to our Mississauga cogeneration facility in Ontario and entered into a new Non-Utility Generator (“NUG”) Enhanced Dispatch Contract (the “NUG Contract”) effective Jan. 1, 2017. Under the new NUG Contract, we received fixed monthly payments until Dec. 31, 2018, with no delivery obligations. Under IFRS, for our reported results in 2016, as a result of the NUG Contract, we recognized a receivable of $207 million (discounted), a pre-tax gain of approximately $191 million net of costs to mothball the units and accelerated depreciation of $46 million. In 2017 and 2018, on a comparable basis, we recorded the payments we received as revenues as a proxy for operating income, and depreciated the facility until Dec. 31, 2018.
▪On the commissioning of the South Hedland facility in July 2017, we prepaid approximately $74 million of electricity transmission and distribution costs. Interest income is recorded on the prepaid funds. We reclassify this interest income as a reduction in the transmission and distribution costs expensed each period to reflect the net cost to the business.
▪In October 2019, we acquired Capital Power's 50 per cent ownership of Keephills 3 in exchange for selling our 50 per cent ownership in the Genesee 3 facility to Capital Power, and we now own 100 per cent of the Keephills 3 facility. As a result, all of the Keephills 3 and Genesee 3 project agreements with Capital Power were terminated, including the agreement governing the supply of coal from TransAlta’s Sunhills mine to the Keephills 3 facility. Upon termination of this agreement in the fourth quarter of 2019, the Sunhills mine had no future performance obligations and accordingly, the balance of the contract liability of $88 million was recognized in earnings. On a comparable basis, we removed this gain from 2019 results.
▪Asset impairment charges (reversals) are removed to calculate comparable EBITDA as these are accounting adjustments that impact depreciation and amortization and do not reflect business performance.
TRANSALTA CORPORATION M16
Management’s Discussion and Analysis
A reconciliation of net earnings (loss) attributable to common shareholders to Comparable EBITDA results is set out below:
| | | | | | | | | | | |
| Year ended Dec. 31 | 2019 | 2018 | 2017 |
| Net earnings (loss) attributable to common shareholders | 52 | | (248) | | (190) | |
| Net earnings attributable to non-controlling interests | 94 | | 108 | | 42 | |
| Preferred share dividends | 30 | | 50 | | 30 | |
| Net earnings (loss) | 176 | | (90) | | (118) | |
| Adjustments to reconcile net income to comparable EBITDA | | | |
| Income tax expense (recovery) | 17 | | (6) | | 64 | |
| Gain on sale of assets and other | (46) | | (1) | | (2) | |
| Foreign exchange loss | 15 | | 15 | | 1 | |
| Net interest expense | 179 | | 250 | | 247 | |
| Depreciation and amortization | 590 | | 574 | | 635 | |
| Comparable reclassifications | | | |
| Decrease in finance lease receivables | 24 | | 59 | | 59 | |
| Mine depreciation included in fuel cost | 121 | | 140 | | 75 | |
| Australian interest income | 4 | | 4 | | 2 | |
| Unrealized mark-to-market (gains) losses | (33) | | 38 | | (32) | |
| Adjustments to earnings to arrive at comparable EBITDA | | | |
Impacts to revenue associated with certain de-designated and economic
hedges | — | | — | | 2 | |
Impacts associated with Mississauga recontracting(1) | — | | 105 | | 77 | |
| Gain on termination of Keephills 3 coal rights contract | (88) | | — | | — | |
Asset impairment charge(2) | 25 | | 73 | | 20 | |
| Comparable EBITDA | 984 | | 1,161 | | 1,030 | |
| Comparable EBITDA - excluding the PPA Termination Payments | 928 | | 1,004 | | 1,030 | |
(1) Impacts associated with Mississauga recontracting for the year ended Dec. 31, 2018, are as follows: revenue ($108 million) and fuel and purchased power and de-designated hedges ($3 million). Impacts associated with Mississauga recontracting for the year ended Dec. 31, 2017, are as follows: revenue ($101 million), fuel and purchased power and de-designated hedges ($12 million), operations, maintenance and administration ($3 million) and recovery related to a renegotiated land lease ($9 million).
(2) Asset impairment charges for 2019 primarily includes the $141 million increase for the decommissioning and restoration liability at the Centralia mine, the $15 million for trucks held for sale and written down to net realizable value and the $18 million write-off of project development costs, partially offset by a $151 million impairment reversal at US Coal (2018 - $38 million charge related to the retirement of Sundance Unit 2, Lakeswind and Kent Breeze impairment of $12 million and a write-off of project development costs of $23 million; 2017 - $20 million retirement of Sundance Unit 1).
Funds from Operations and Free Cash Flow
FFO is an important metric as it provides a proxy for cash generated from operating activities before changes in working capital and provides the ability to evaluate cash flow trends in comparison with results from prior periods. FCF is an important metric as it represents the amount of cash that is available to invest in growth initiatives, make scheduled principal repayments on debt, repay maturing debt, pay common share dividends or repurchase common shares. Changes in working capital are excluded so FFO and FCF are not distorted by changes that we consider temporary in nature, reflecting, among other things, the impact of seasonal factors and timing of receipts and payments. FFO per share and FCF per share are calculated using the weighted average number of common shares outstanding during the period.
TRANSALTA CORPORATION M17
Management’s Discussion and Analysis
The table below reconciles our cash flow from operating activities to our FFO and FCF:. (
| | | | | | | | | | | |
| Year ended Dec. 31 | 2019 | 2018 | 2017 |
Cash flow from operating activities(1) | 849 | | 820 | | 626 | |
| Change in non-cash operating working capital balances | (121) | | 44 | | 114 | |
| Cash flow from operations before changes in working capital | 728 | | 864 | | 740 | |
| Adjustments | | | |
| Decrease in finance lease receivable | 24 | | 59 | | 59 | |
| Other | 5 | | 4 | | 5 | |
| FFO | 757 | | 927 | | 804 | |
| Deduct: | | | |
Sustaining capital(2) | (141) | | (150) | | (218) | |
| Productivity capital | (9) | | (21) | | (24) | |
| Dividends paid on preferred shares | (40) | | (40) | | (40) | |
| Distributions paid to subsidiaries’ non-controlling interests | (111) | | (169) | | (172) | |
Payments on lease obligations(2) | (21) | | (18) | | (17) | |
| Other | — | | (5) | | (5) | |
| FCF | 435 | | 524 | | 328 | |
| Weighted average number of common shares outstanding in the year | 283 | | 287 | | 288 | |
| FFO per share | 2.67 | | 3.23 | | 2.79 | |
| FCF per share | 1.54 | | 1.83 | | 1.14 | |
(1) 2019 and 2018 amounts include the PPA Termination Payments. See the Significant and Subsequent Events section for further details.
(2) During the first quarter of 2019, we revised the way in which FFO and FCF are reconciled to reflect the payments related to lease obligations as a separate line and removed finance leases from sustaining capital. Prior period results have been revised to reflect these changes.
The table below bridges our comparable EBITDA to our FFO and FCF:
| | | | | | | | | | | |
| Year ended Dec. 31 | 2019 | 2018 | 2017 |
Comparable EBITDA(1) | 984 | | 1,161 | | 1,030 | |
| Provisions and other | 13 | | (9) | | (3) | |
| Interest expense | (174) | | (187) | | (218) | |
| Current income tax expense | (35) | | (28) | | (23) | |
| Realized foreign exchange gain (loss) | (6) | | 5 | | 15 | |
| Decommissioning and restoration costs settled | (34) | | (31) | | (19) | |
| Other cash and non-cash items | 9 | | 16 | | 22 | |
| FFO | 757 | | 927 | | 804 | |
| Deduct: | | | | |
Sustaining capital(2) | (141) | | (150) | | (218) | |
| Productivity capital | (9) | | (21) | | (24) | |
| Dividends paid on preferred shares | (40) | | (40) | | (40) | |
| Distributions paid to subsidiaries’ non-controlling interests | (111) | | (169) | | (172) | |
Payments on lease obligations(2) | (21) | | (18) | | (17) | |
| Other | — | | (5) | | (5) | |
| FCF | 435 | | 524 | | 328 | |
(1) During the first quarter of 2019, we revised comparable EBITDA to exclude the impact of unrealized mark-to-market gains or losses. The current and prior period amounts have been adjusted to reflect this change. 2019 and 2018 amounts include the PPA Termination Payments. See the Significant and Subsequent Events section for further details.
(2) During the first quarter of 2019, we revised the way in which FFO and FCF are reconciled to reflect the payments related to lease obligations as a separate line and removed finance leases from sustaining capital. Prior period results have been revised to reflect these changes.
TRANSALTA CORPORATION M18
Management’s Discussion and Analysis
| | | | | | | | | | | |
| Supplemental disclosure | 2019 | 2018 | 2017 |
| FFO - excluding the PPA Termination Payments | 701 | | 770 | | 804 | |
| FCF - excluding the PPA Termination Payments | 379 | | 367 | | 328 | |
| | | |
| FFO per share - excluding the PPA Termination Payments | 2.48 | | 2.68 | | 2.79 | |
| FCF per share - excluding the PPA Termination Payments | 1.34 | | 1.28 | | 1.14 | |
For explanations for the current period, refer to the Highlights section of this MD&A.
Higher FCF in 2018 compared to 2017 was also driven by strong cash flow from operating activities due to the receipt of the $157 million PPA Termination Payments in 2018 related to the termination of the Sundance B and C PPAs, as well as reduced sustaining and productivity capital expenditures.
Segmented Comparable Results
Segmented cash flow generated by the business measures the net cash generated by each of our segments after sustaining and productivity capital expenditures, reclamation costs, provisions and non-cash mark-to-market gains or losses. This is the cash flow available to pay our interest and cash taxes, make distributions to our non-controlling partners and pay dividends to our preferred shareholders, grow the business, pay down debt and return capital to our shareholders.
The table below shows the segmented cash flow generated by the business by each of our segments:
| | | | | | | | | | | |
| Year ended Dec. 31 | | 2019 | 2018 | 2017 |
Segmented cash flow(1) | | | |
Canadian Coal(2) | 214 | | 279 | | 175 | |
| US Coal | 54 | | 63 | | 33 | |
Canadian Gas(3) | 99 | | 228 | | 221 | |
| Australian Gas | 112 | | 136 | | 127 | |
| Wind and Solar | 206 | | 211 | | 201 | |
| Hydro | 93 | | 96 | | 61 | |
| Generation segmented cash flow | 778 | | 1,013 | | 818 | |
| Energy Marketing | 105 | | 33 | | 39 | |
| Corporate | (92) | | (107) | | (108) | |
| Total segmented cash flow | 791 | | 939 | | 749 | |
| Total segmented cash flow - excluding the PPA Termination Payments | 735 | | 782 | | 749 | |
(1) Segmented cash flow is a non-IFRS measure and has no standardized meaning under IFRS. Refer to the Additional IFRS Measures and Non-IFRS Measures section for further details.
(2) Includes $157 million received from the Balancing Pool for the early termination of Sundance B and C PPAs in the first quarter of 2018 and $56 million received on settlement of the dispute with the Balancing Pool in the third quarter of 2019. See the Significant and Subsequent Events section for further details.
(3) 2017 includes $34 million from the OEFC relating to the 2017 indexation dispute.
Segmented cash flow generated by the business, after adjusting for the PPA Termination Payments, was down $47 million in 2019 compared to 2018, mainly due to the expiry of the Mississauga NUG Contract and lower scheduled repayments on the Poplar Creek finance lease, partially offset by strong cash flow from Energy Marketing as well as lower sustaining capital expenditures. Cash flow in 2018 was $33 million higher than 2017 due to lower sustaining capital expenditures and higher Ancillary Services revenue from our hydro facilities.
TRANSALTA CORPORATION M19
Management’s Discussion and Analysis
Canadian Coal
| | | | | | | | | | | |
| Year ended Dec. 31 | 2019 | 2018 | 2017 |
| Availability (%) | 89.2 | 91.6 | | 82.0 | |
| Contract production (GWh) | 6,927 | | 8,936 | | 18,683 | |
| Merchant production (GWh) | 5,932 | | 5,304 | | 3,786 | |
| Total production (GWh) | 12,859 | | 14,240 | | 22,469 | |
Gross installed capacity (MW)(1) | 3,229 | | 3,231 | | 3,791 | |
Revenues(2) | 823 | | 901 | | 996 | |
| Fuel, carbon compliance and purchased power | 449 | | 526 | | 510 | |
| Comparable gross margin | 374 | | 375 | | 486 | |
| Operations, maintenance and administration | 138 | | 171 | | 192 | |
| Taxes, other than income taxes | 13 | | 13 | | 13 | |
| Termination of Sundance B and C PPAs | (56) | | (157) | | — | |
| Net other operating income | (40) | | (41) | | (40) | |
Comparable EBITDA(2) | 319 | | 389 | | 321 | |
| Deduct: | | | |
| Sustaining capital: | | | |
| Routine capital | 15 | | 17 | | 22 | |
| Mine capital | 23 | | 42 | | 28 | |
| Planned major maintenance | 34 | | 15 | | 54 | |
Total sustaining capital expenditures(3) | 72 | | 74 | | 104 | |
| Productivity capital | 6 | | 12 | | 12 | |
Total sustaining and productivity capital(3) | 78 | | 86 | | 116 | |
| | | |
| Provisions | (6) | | (10) | | 5 | |
Payments on lease obligations(3) | 16 | | 14 | | 14 | |
| Decommissioning and restoration costs settled | 17 | | 19 | | 11 | |
| Other | — | | 1 | | — | |
| Canadian Coal cash flow | 214 | | 279 | | 175 | |
(1) 2019 & 2018 - includes 774 MW for Sundance Units 3 and 5, which are temporarily mothballed; 2017 includes 1,334 MW for Sundance Units 1, 2, 3 and 5, which were temporarily mothballed. Sundance Unit 1 was retired on Jan. 1, 2018, and Sundance Unit 2 was retired on July 31, 2018. The Keephills 3 and Genesee 3 asset swap resulted in a net 2 MW reduction of capacity.
(2) During the first quarter of 2019, we revised comparable EBITDA to exclude the impact of unrealized mark-to-market gains or losses. The current and prior period amounts have been adjusted to reflect this change.
(3) On implementation of IFRS 16 in 2019, we removed the finance leases from sustaining capital and included principal payments on lease obligations as a separate line in arriving at segmented cash flow.
| | | | | | | | | | | |
| Supplemental disclosure | 2019 | 2018 | 2017 |
| Comparable EBITDA - excluding the PPA Termination Payments | 263 | | 232 | | 321 | |
| Canadian Coal cash flow - excluding the PPA Termination Payments | 158 | | 122 | | 175 | |
2019
Availability for the year was lower compared to 2018, due to planned outages at our Keephills 1 and Sundance 4 units, whereas 2018 only had one outage at one of our non-operated units; this was partially offset by fewer unplanned losses in 2019.
Production for the year ended Dec. 31, 2019, decreased 1,381 gigawatt hours (“GWh”) compared to 2018, primarily due to the mothballing of certain Sundance units and planned outages, partially offset by lower unplanned outages. Lower contract production was partially offset by higher merchant production.
Revenue for the year ended Dec. 31, 2019, decreased by $78 million compared to 2018, mainly due to lower production as a result of the termination of the Sundance B and C PPAs on Mar. 31, 2018.
Revenue per MWh of production rose to approximately $64 per MWh in 2019 from $63 per MWh in 2018. Revenues in the first quarter of 2018 included the Sundance B and C PPA revenue as well as the passthrough revenues associated with carbon compliance costs, which are no longer recoverable on the Sundance units as the PPAs have been terminated.
TRANSALTA CORPORATION M20
Management’s Discussion and Analysis
Fuel, carbon compliance and purchased power costs per MWh were lower in 2019 compared to 2018. Cost per MWh of production fell to approximately $35 per MWh in 2019 from $37 per MWh in 2018. Consequently, comparable gross margin per MWh for 2019 improved by approximately $3 per MWh compared to 2018.
We continued to co-fire with natural gas, when economical. Natural gas combustion produces fewer GHG emissions than coal combustion, which lowers our GHG compliance costs. In addition, fuel costs can be lower by co-firing, depending on the market price for natural gas. On Nov. 1, 2019, the firm contract to transport natural gas on the Pioneer Pipeline began, which substantially increased gas quantities available to us and increased our supply available to co-fire.
OM&A costs were lower in 2019 compared to 2018, as a result of the full year impact of cost reductions progressively implemented over the preceding year. These cost reductions arose from a combination of factors including fewer units operating, lower capacity factor operation on merchant units, co-firing with gas, and operations and maintenance work optimization.
Excluding the PPA Termination Payments, comparable EBITDA for the year ended Dec. 31, 2019, increased $31 million compared to 2018. This largely reflects lower fuel, carbon compliance, and purchased power costs, as well as lower OM&A costs.
For the year ended Dec. 31, 2019, sustaining capital expenditures decreased by $2 million compared to 2018, mainly due to less mine development work being completed in 2019, partially offset by higher spend on planned major maintenance. In 2018, there was only one planned major outage at one of our non-operating units, while during 2019 there were two planned major outages at the Keephills 1 and Sundance 4 units.
Canadian Coal cash flow for the year ended Dec. 31, 2019, increased by $36 million (excluding the PPA Termination Payments) compared to 2018, mainly due to higher comparable EBITDA and decreased sustaining and productivity capital expenditures.
2018
Availability in 2018 improved compared to 2017, mainly due to lower planned outages and unplanned outages and derates in 2018.
Production for the year ended Dec. 31, 2018, decreased by 8,229 GWh compared to 2017, primarily due to the retirement and mothballing of certain Sundance units and less dispatching, partially offset by lower planned and unplanned outages.
Revenue for the year ended Dec. 31, 2018, decreased by $95 million compared to 2017, mainly due to lower production
offset by higher prices. Revenue per MWh of production rose to approximately $63 per MWh in 2018 from $44 per MWh in 2017, which more than offset the increase in carbon compliance costs and resulted in higher gross margin per MWh in 2018.
Fuel, carbon compliance costs and purchased power costs per MWh were higher in 2018 compared to 2017. Coal costs on a dollar per MWh were higher due to fixed costs and lower tonnage. Pit development work commenced in 2018 at the Highvale mine and is expected to provide the lowest cost fuel for the remaining life of the facilities. Carbon compliance costs were higher in 2018, reflecting the regulated increase in the carbon price and due to the fact that carbon compliance costs are no longer recoverable on the Sundance units as the PPAs have been terminated. Both the fuel and carbon pricing cost increases were as expected.
During 2018, we commenced co-firing with natural gas. The combined impact of relatively low Alberta gas prices and lower GHG compliance costs made this economically viable on the merchant plants for a substantial part of the year.
OM&A costs were lower in 2018 compared to 2017. There are certain fixed and common costs that are required to maintain the remaining operational Sundance units and some one-time OM&A costs were incurred in association with the mothballing and retirement of Sundance Units 1 and 2. We continued to optimize the operations of the facility in response to the merchant market.
Comparable EBITDA for the year ended Dec. 31, 2018, increased $68 million compared to 2017, as a result of the one-time receipt of $157 million for the termination of the Sundance B and C PPAs, partially offset by higher carbon compliance costs and reduced revenue relating to the termination of the Sundance B and C PPAs.
TRANSALTA CORPORATION M21
Management’s Discussion and Analysis
For the year ended Dec. 31, 2018, sustaining capital expenditures decreased by $30 million compared to 2017, mainly due to lower planned outages and mothballing of units, partially offset by increased mine pit development work. Establishing a new pit provides the lowest cost fuel for the remaining life of the facilities. In 2017, four planned outages were performed throughout the year, while during 2018 there was only one planned major outage at one of our non-operated plants. Overall, for 2018, there were four fewer units in the fleet to maintain, which significantly reduced our sustaining capital costs.
US Coal
| | | | | | | | | | | |
| Year ended Dec. 31 | 2019 | 2018 | 2017 |
| Availability (%) | 74.0 | | 60.2 | | 66.3 | |
Adjusted availability (%)(1) | 83.5 | | 84.6 | | 86.2 | |
| Contract sales volume (GWh) | 3,329 | | 3,329 | | 3,609 | |
| Merchant sales volume (GWh) | 7,691 | | 5,704 | | 5,488 | |
| Purchased power (GWh) | (3,865) | | (3,665) | | (3,625) | |
| Total production (GWh) | 7,155 | | 5,368 | | 5,472 | |
| Gross installed capacity (MW) | 1,340 | | 1,340 | | 1,340 | |
Revenues(2) | 559 | | 471 | | 427 | |
| Fuel and purchased power | 416 | | 314 | | 293 | |
| Comparable gross margin | 143 | | 157 | | 134 | |
| Operations, maintenance and administration | 67 | | 61 | | 51 | |
| Taxes, other than income taxes | 3 | | 5 | | 4 | |
Comparable EBITDA(2) | 73 | | 91 | | 79 | |
| Deduct: | | | |
| Sustaining capital: | | | |
| Routine capital | 2 | | 2 | | 3 | |
| | | |
| Planned major maintenance | 5 | | 11 | | 29 | |
Total sustaining capital expenditures(3) | 7 | | 13 | | 32 | |
| Productivity capital | 1 | | — | | 3 | |
Total sustaining and productivity capital(3) | 8 | | 13 | | 35 | |
| | | |
| | | |
Payments on lease obligations(3) | — | | 4 | | 3 | |
| Decommissioning and restoration costs settled | 11 | | 11 | | 8 | |
| US Coal cash flow | 54 | | 63 | | 33 | |
(1) Adjusted for dispatch optimization.
(2) During the first quarter of 2019, we revised comparable EBITDA to exclude the impact of unrealized mark-to-market gains or losses. The current and prior period amounts have been adjusted to reflect this change.
(3) On implementation of IFRS 16 in 2019, we have removed the finance leases from sustaining capital and included principal payments on lease obligations as a separate line. The contractual arrangement that was accounted for as a finance lease in 2018 and prior periods is not considered a lease under IFRS 16. Accordingly, the costs are reflected in fuel and purchased power and there are no payments on lease obligations from Jan. 1, 2019.
TRANSALTA CORPORATION M22
Management’s Discussion and Analysis
2019
Adjusted availability for the year was down compared to 2018 due to higher forced outages and derates in 2019. Centralia Unit 1 operated with a derate due to blocked precipitator hoppers impacting the first half of 2019. This derate was resolved when the unit was offline during the second quarter of 2019.
Production was up 1,787 GWh in 2019 compared to 2018, due mainly to higher merchant pricing in the first half of 2019 and timing of dispatch optimization. In 2019, both Centralia units remained in service into April due to higher prices in the Pacific Northwest, whereas in 2018, both Centralia units were taken out of service in February as a result of seasonally lower prices in the Pacific Northwest. In 2018, we performed major maintenance on both units during that time.
OM&A costs were $6 million higher in 2019 compared to 2018, mainly due to higher levels of maintenance required to support a 33 per cent increase in production and as a result of higher costs to resolve precipitator blockages.
Comparable EBITDA decreased by $18 million compared to 2018, primarily due to an isolated and extreme pricing event in March. Centralia was unable to commit one of its units to physical production for day-ahead supply due to an unplanned forced outage repair.
Sustaining and productivity capital expenditures for 2019 were $5 million lower than 2018, mainly due to less planned outage work performed in 2019.
US Coal's cash flow for 2019 decreased by $9 million compared to the prior year, mainly due to lower comparable EBITDA, partially offset by lower sustaining and productivity capital spend.
2018
Availability for 2018 was down compared to 2017 due to the timing of dispatch optimization and unplanned outages and derates in the last half of 2018, slightly offset by forced outages at Centralia Unit 1 in January 2017. In 2017 and 2018, both Centralia units were taken out of service in February as a result of seasonally lower prices in the Pacific Northwest. In both 2018 and 2017, we performed major maintenance during that time.
Production was down 104 GWh in 2018 compared to 2017, due mainly to dispatch optimization and increased unplanned outages in the last half of the year.
OM&A costs were $10 million higher in 2018 compared to 2017, due to employee gainshare, annual incentive compensation and retention bonuses, as well as increased disbursements paid to the community fund.
Comparable EBITDA increased by $12 million compared to 2017, primarily due to reduced coal costs and favourable market prices.
Sustaining and productivity capital expenditures for 2018 were $22 million lower than 2017, due to lower planned outages.
US Coal's 2018 cash flow improved by $30 million compared to 2017, mainly due to stronger comparable EBITDA and lower sustaining and productivity capital spend.
TRANSALTA CORPORATION M23
Management’s Discussion and Analysis
Canadian Gas
| | | | | | | | | | | |
| Year ended Dec. 31 | 2019 | 2018 | 2017 |
| Availability (%) | 94.8 | 93.3 | 91.6 | |
| Contract production (GWh) | 1,655 | | 1,620 | | 1,504 | |
Merchant production (GWh)(1) | 170 | | 93 | | 244 | |
| Total production (GWh) | 1,825 | | 1,713 | | 1,748 | |
Gross installed capacity (MW)(2) | 945 | | 945 | | 952 | |
Revenues(3) | 238 | | 407 | | 423 | |
| Fuel and purchased power | 74 | | 99 | | 113 | |
| Comparable gross margin | 164 | | 308 | | 310 | |
| Operations, maintenance and administration | 44 | | 48 | | 53 | |
| Taxes, other than income taxes | 1 | | 1 | | 1 | |
| Net other operating income | (1) | | — | | — | |
Comparable EBITDA(3) | 120 | | 259 | | 256 | |
| Deduct: | | | |
| Sustaining capital: | | | |
| Routine capital | 10 | | 4 | | 8 | |
| Planned major maintenance | 8 | | 16 | | 22 | |
| Total sustaining capital expenditures | 18 | | 20 | | 30 | |
| Productivity capital | — | | 2 | | 2 | |
| Total sustaining and productivity capital | 18 | | 22 | | 32 | |
| | | |
| Provisions and other | — | | 9 | | 3 | |
| | | |
| Decommissioning and restoration costs settled | 3 | | — | | — | |
| Canadian Gas cash flow | 99 | | 228 | | 221 | |
(1) Includes purchased power, which is used for dispatch optimization, when economical.
(2) Excludes capacity of Mississauga, which was mothballed in early 2017. All years include production capacity for the Fort Saskatchewan facility, which has been accounted for as a finance lease. During 2015, operational control of our Poplar Creek facility was transferred to Suncor Energy. We continue to own a portion of the facility and have included our portion as a part of gross capacity measures.
(3) During the first quarter of 2019, we revised comparable EBITDA to exclude the impact of unrealized mark-to-market gains or losses. The current and prior period amounts have been adjusted to reflect this change.
TRANSALTA CORPORATION M24
Management’s Discussion and Analysis
2019
Availability for the year ended Dec. 31, 2019, increased compared to 2018, primarily due to lower planned outages at Fort Saskatchewan and Sarnia.
Production for the year increased by 112 GWh compared to 2018, mainly due to higher customer and market demand as well as lower planned outages, which was partially offset by higher unplanned outages.
Comparable EBITDA for 2019 decreased by $139 million compared to 2018, mainly due to the Mississauga contract ending Dec. 31, 2018 and lower scheduled payments from the Poplar Creek finance lease. Comparable EBITDA for the year ended Dec. 31, 2019, includes nil (2018 - $105 million) and $20 million (2018 - $57 million) from the Mississauga and Poplar Creek contracts, respectively. Additionally, comparable EBITDA benefited from lower OM&A compared to the prior year as a result of reduced overhead and operating costs.
Sustaining capital totalled $18 million in 2019, a decrease of $2 million due to lower planned outage costs, partially offset by the timing of capital spares purchases for Sarnia.
Cash flow at Canadian Gas decreased by $129 million for the year ended Dec. 31, 2019, compared to the prior year mainly due to lower comparable EBITDA.
2018
Availability for the year ended Dec. 31, 2018, increased compared to 2017, mainly due to the 2017 base cycling conversion project at Windsor and lower planned and unplanned outages at Sarnia and Windsor in 2018.
Production for the year decreased by 35 GWh compared to 2017, as lower market demand at Sarnia was partially offset by higher production at the Fort Saskatchewan, Ottawa and Windsor facilities in 2018.
Comparable EBITDA for 2018 increased by $3 million compared to 2017, mainly due to the positive impact from the Mississauga recontracting, higher realized pricing at Sarnia and cost reduction initiatives, partially offset by the retroactive contract indexation dispute settlement with the OEFC in 2017 ($34 million). The Mississauga, Ottawa, Windsor and our 60 per cent share of Fort Saskatchewan generating facilities are owned through our 50.01 per cent interest in TA Cogen. The Mississauga recontracting ended in December 2018 and was not renewed.
Sustaining capital totalled $20 million in 2018, a decrease of $10 million mainly due to higher capital spend in 2017, when we completed the scheduled maintenance at Sarnia and the base cycling conversion project at Windsor to increase its flexibility to respond to market prices.
Cash flow at Canadian Gas improved by $7 million for the year ended Dec. 31, 2018, compared to the prior year mainly due to lower sustaining capital spend in 2018, partially offset by lower EBITDA. In 2017, one-time sustaining capital expenditures were incurred for the Windsor base cycling conversion project.
TRANSALTA CORPORATION M25
Management’s Discussion and Analysis
Australian Gas
| | | | | | | | | | | |
| Year ended Dec. 31 | 2019 | 2018 | 2017 |
| Availability (%) | 90.6 | 94.0 | 93.4 | |
| Contract production (GWh) | 1,832 | | 1,814 | | 1,803 | |
Gross installed capacity (MW)(1) | 450 | | 450 | | 450 | |
| Revenues | 160 | | 165 | | 180 | |
| Fuel and purchased power | 5 | | 4 | | 12 | |
| Comparable gross margin | 155 | | 161 | | 168 | |
| Operations, maintenance and administration | 37 | | 37 | | 31 | |
| | | |
| Comparable EBITDA | 118 | | 124 | | 137 | |
| Deduct: | | | |
| Sustaining capital: | | | |
| Routine capital | 2 | | 2 | | 9 | |
| Planned major maintenance | 3 | | — | | 1 | |
| Total sustaining capital expenditures | 5 | | 2 | | 10 | |
| Productivity capital | 1 | | — | | — | |
| Total sustaining and productivity capital | 6 | | 2 | | 10 | |
| | | |
| | | |
| | | |
| | | |
| Other | — | | (14) | | — | |
| Australian Gas cash flow | 112 | | 136 | | 127 | |
(1) In 2017, Fortescue Metals Group Ltd. ("FMG") repurchased the Solomon facility and therefore it was removed from 2017 capacity, which was offset by adding capacity for the South Hedland facility, which achieved commercial operations on July 28, 2017.
2019
Availability for the year ended Dec. 31, 2019, decreased compared to 2018, mainly due to unplanned outages.
Production for 2019 was comparable to 2018. Due to the nature of our contracts, changes in production do not have a significant financial impact as our contracts are structured as capacity payments with customer supplied fuel or a passthrough of fuel costs.
Comparable EBITDA for the year ended Dec. 31, 2019, decreased by $6 million compared to 2018, due to the weakening of the Australian dollar and ongoing legal costs associated with our disputes with FMG.
Sustaining and productivity capital for 2019 increased by $4 million compared to 2018, mainly due to planned major maintenance at our Southern Cross facility.
Cash flow at Australian Gas decreased by $24 million in 2019, mainly due to lower comparable EBITDA as well as higher sustaining capital expenditures. In addition, 2018 cash flow included the collection of a long-term receivable.
2018
Availability and production for the year ended Dec. 31, 2018, increased slightly compared to 2017, mainly due to a full year of operation from the South Hedland facility, which was offset by FMG's repurchase of the Solomon facility.
Comparable EBITDA for the year decreased by $13 million compared to 2017 mainly due to FMG's repurchase of the Solomon facility, higher OM&A costs due to the addition of the South Hedland facility and ongoing legal costs associated with our disputes with FMG, which were partially offset by higher EBITDA from the South Hedland facility. Refer to the Other Consolidated Analysis section of this MD&A for further details.
Sustaining and productivity capital for 2018 decreased by $8 million compared to 2017, due to major maintenance incurred at our Southern Cross facility in August 2017 that was not required in 2018.
Cash flow at Australian Gas increased by $9 million in 2018 mainly due to lower sustaining capital requirements and an increase in cash flow from the collection of a long-term receivable, largely offset by lower EBITDA.
TRANSALTA CORPORATION M26
Management’s Discussion and Analysis
Wind and Solar
| | | | | | | | | | | |
| Year ended Dec. 31 | 2019 | 2018 | 2017 |
| Availability (%) | 95.0 | 95.4 | 95.8 | |
| Contract production (GWh) | 2,395 | | 2,363 | | 2,362 | |
| Merchant production (GWh) | 960 | | 1,005 | | 1,098 | |
| Total production (GWh) | 3,355 | | 3,368 | | 3,460 | |
Gross installed capacity (MW)(1) | 1,495 | | 1,382 | | 1,363 | |
Revenues(2) | 295 | | 302 | | 287 | |
| Fuel and purchased power | 16 | | 17 | | 17 | |
| Comparable gross margin | 279 | | 285 | | 270 | |
| Operations, maintenance and administration | 50 | | 50 | | 48 | |
| Taxes, other than income taxes | 8 | | 8 | | 8 | |
Net other operating income(3) | (10) | | (6) | | — | |
Comparable EBITDA(2) | 231 | | 233 | | 214 | |
| Deduct: | | | |
| Sustaining capital: | | | |
| Routine capital | 2 | | 5 | | 1 | |
| Planned major maintenance | 11 | | 8 | | 10 | |
| Total sustaining capital expenditures | 13 | | 13 | | 11 | |
| Productivity capital | — | | 2 | | 2 | |
| Total sustaining and productivity capital | 13 | | 15 | | 13 | |
| | | |
| | | |
Payments on lease obligations(4) | 1 | | — | | — | |
| Decommissioning and restoration costs settled | 1 | | 1 | | — | |
Other(3) | 10 | | 6 | | — | |
| Wind and Solar cash flow | 206 | | 211 | | 201 | |
(1) The 2019 installed capacity includes the addition of Big Level and Antrim in late December, partially offset by the reduction of wind turbines due to tower fires at Wyoming Wind and Summerview.
(2) During the first quarter of 2019, we revised comparable EBITDA to exclude the impact of unrealized mark-to-market gains or losses. The current and prior period amounts have been adjusted to reflect this change.
(3) Relates to insurance proceeds included in net other operating income.
(4) On implementation of IFRS 16 in 2019, we have included principal payments on lease obligations as a separate line.
2019
Availability and production for the year ended Dec. 31, 2019, was comparable to 2018, which was in line with our expectations. The Big Level and Antrim wind farms had minimal impact on 2019 availability and production due to their commercial operation occurring in late December.
Comparable EBITDA for 2019 was consistent with 2018. Higher insurance proceeds from tower fires at Wyoming Wind and Summerview were partially offset by a reduction in revenues due to the scheduled expiration of production-based incentives for three wind facilities.
Wind and Solar's cash flow decreased by $5 million for the year ended Dec. 31, 2019, compared to the prior year, mainly due to lower revenue.
2018
Availability for the year ended Dec. 31, 2018, was comparable to 2017, which was in line with our expectations.
Production for 2018 decreased by 92 GWh compared to 2017, mainly due to lower wind resources across Alberta and the US combined with the sale of the Wintering Hills merchant facility on Mar. 1, 2017. This lower production was partially offset by higher wind resources in Eastern Canada in 2018.
Comparable EBITDA for 2018 was higher than 2017, due to higher merchant prices in Alberta and insurance proceeds from the tower fire at the Wyoming Wind farm, which was partially offset by the unfavourable impact of lower wind resources.
TRANSALTA CORPORATION M27
Management’s Discussion and Analysis
Wind and Solar's cash flow improved by $10 million for the year ended Dec. 31, 2018, compared to the prior year, due mainly to higher comparable EBITDA, partially offset by the adjustment to remove the insurance proceeds from cash flow.
Hydro
| | | | | | | | | | | |
| Year ended Dec. 31 | 2019 | 2018 | 2017 |
| Production | | | |
| Energy contracted | | | |
Alberta Hydro PPA assets (GWh)(1) | 1,653 | | 1,519 | | 1,530 | |
Other hydro energy (GWh)(1) | 331 | | 306 | | 336 | |
| Energy merchant | | | |
| Other hydro energy (GWh) | 61 | | 81 | | 82 | |
| Total energy production (GWh) | 2,045 | | 1,906 | | 1,948 | |
Ancillary service volumes (GWh)(2) | 2,978 | | 3,265 | | 3,044 | |
| Gross installed capacity (MW) | 926 | | 926 | | 926 | |
| Revenues | | | |
| Alberta Hydro PPA assets energy | 101 | | 90 | | 36 | |
| Alberta Hydro PPA assets ancillary | 90 | | 104 | | 36 | |
Capacity payments received under Alberta Hydro PPA(3) | 57 | | 56 | | 54 | |
Other revenue(4) | 44 | | 41 | | 43 | |
| Total gross revenues | 292 | | 291 | | 169 | |
Net payment relating to Alberta Hydro PPA(5) | (136) | | (135) | | (48) | |
| Revenues | 156 | | 156 | | 121 | |
| | | |
| Fuel and purchased power | 7 | | 6 | | 6 | |
| Comparable gross margin | 149 | | 150 | | 115 | |
| Operations, maintenance and administration | 36 | | 38 | | 37 | |
| Taxes, other than income taxes | 3 | | 3 | | 3 | |
| | | |
| Comparable EBITDA | 110 | | 109 | | 75 | |
| Deduct: | | | |
| Sustaining capital: | | | |
| Routine capital | 7 | | 4 | | 8 | |
| Planned major maintenance | 7 | | 8 | | 5 | |
| Total sustaining capital expenditures | 14 | | 12 | | 13 | |
| Productivity capital | 1 | | 1 | | 1 | |
| Total sustaining and productivity capital | 15 | | 13 | | 14 | |
| | | |
| | | |
| | | |
| Decommissioning and restoration costs settled | 2 | | — | | — | |
| Hydro cash flow | 93 | | 96 | | 61 | |
(1) Alberta Hydro PPA assets include 13 hydro facilities on the Bow and North Saskatchewan river systems included under the PPA legislation. Other hydro facilities include our hydro facilities in BC, Ontario and the hydro facilities in Alberta not included in the legislated PPAs.
(2) Ancillary services as described in the AESO Consolidated Authoritative Document Glossary.
(3) Capacity payments include the annual capacity charge as described in the Power Purchase Arrangements Determination Regulation AR 175/2000, available from Alberta Queen's Printer. The PPA expires on Dec. 31, 2020.
(4) Other revenue includes revenues from our non-PPA hydro facilities, our transmission business and other contractual arrangements including the flood mitigation agreement with the Alberta government and black start services.
(5) The net payment relating to the Alberta Hydro PPA represents the Corporation's financial obligations for notional amounts of energy and ancillary services in accordance with the Alberta Hydro PPA which expires on Dec. 31, 2020.
TRANSALTA CORPORATION M28
Management’s Discussion and Analysis
2019
Production for 2019 increased by 139 GWh over 2018, primarily due to higher water resources.
Total gross revenues were comparable to 2018, as the Hydro business optimizes its revenue through a combination of energy sales and Ancillary Services, which allows us to maintain consistent revenues year-over-year.
Comparable EBITDA for 2019 increased by $1 million compared to 2018, as we were able to reduce OM&A due to cost- saving initiatives, while absorbing the $1.5 million Brookfield Hydro Fee. Refer to the Corporate Strategy and Significant and Subsequent Events section of this MD&A for further details.
Hydro's cash flow decreased by $3 million for 2019 compared to 2018, mainly due to higher capital expenditures and decommissioning costs related to transmission assets.
2018
Production for 2018 decreased by 42 GWh over 2017, primarily due to lower water resources.
Comparable EBITDA for 2018 increased $34 million compared to 2017. Alberta Hydro benefited from stronger energy prices and a higher demand for Ancillary Services.
Hydro's cash flow improved by $35 million for 2018, compared to 2017, due mainly to higher comparable EBITDA.
Energy Marketing
| | | | | | | | | | | |
| Year ended Dec. 31 | 2019 | 2018 | 2017 |
Revenues and comparable gross margin(1) | 119 | | 67 | | 57 | |
| Operations, maintenance and administration | 30 | | 24 | | 24 | |
Comparable EBITDA(1) | 89 | | 43 | | 33 | |
| Deduct: | | | |
| Provisions and other | (16) | | 10 | | (6) | |
| | | |
| Energy Marketing cash flow | 105 | | 33 | | 39 | |
(1) During the first quarter of 2019, we revised comparable EBITDA to exclude the impact of unrealized mark-to-market gains or losses. The current and prior period amounts have been adjusted to reflect this change.
2019
Comparable EBITDA for 2019 increased by $46 million compared to 2018 results, due to strong results from all Marketing segments, with particularly strong performance from US Western and Eastern markets due to continued high levels of volatility. OM&A increased due to higher incentives related to stronger performance. The Energy Marketing team was able to capitalize on short-term arbitrage opportunities in the markets in which we trade without materially changing the risk profile of the business unit.
Energy Marketing's cash flows for 2019 increased by $72 million compared to 2018, mainly due to higher Comparable EBITDA and other cash settlements.
2018
Comparable EBITDA for 2018, excluding unrealized mark-to-market gains or losses, was $10 million higher than 2017 due to strong results from most marketing segments, with particularly strong performance from the US Western market and year-over-year improvements in natural gas markets.
Energy Marketing's cash flows for 2018 decreased by $6 million compared to 2017, mainly due to the settlement of trading positions adversely affected by cold weather in the first quarter.
TRANSALTA CORPORATION M29
Management’s Discussion and Analysis
Corporate
| | | | | | | | | | | |
| Year ended Dec. 31 | 2019 | 2018 | 2017 |
| Operations, maintenance, and administration | | 73 | | 86 | | 84 | |
| Taxes, other than income taxes | 1 | | 1 | | 1 | |
| Net other operating loss | 2 | | — | | — | |
| Comparable EBITDA | | (76) | | (87) | | (85) | |
| Deduct: | | | | |
| Sustaining capital: | | | | |
| Routine capital | | 12 | | 16 | | 18 | |
| Total sustaining capital expenditures | | 12 | | 16 | | 18 | |
| Productivity capital | | — | | 4 | | 4 | |
| Total sustaining and productivity capital expenditures | | 12 | | 20 | | 22 | |
| | | |
| Provisions | | — | | — | | 1 | |
Payments on lease obligations(1) | 4 | | — | | — | |
| | | |
| Corporate cash flow | | (92) | | (107) | | (108) | |
(1) On implementation of IFRS 16 in 2019, we have included principal payments on lease obligations as a separate line.
2019
Our Corporate overhead costs in 2019 were $76 million, a decrease of $11 million compared to $87 million in 2018, primarily due to cost-efficiency initiatives and payments on lease obligations. In addition, we realized a net gain of $13 million from the total return swap on our share-based payment plans, which was mostly offset by higher legal fees. A portion of the settlement cost of our share-based payment plans is fixed by entering into total return swaps, which are cash settled every quarter. Corporate cash flow also benefited from lower sustaining and productivity capital spend due to higher spend in 2018 on automation and new information technology solutions implemented in prior years, which helped contribute to the cost efficiencies realized in 2019.
2018
Our Corporate overhead costs of $87 million were consistent in 2018 compared to 2017, as we realized benefits from cost-efficiency initiatives that were offset by the addition of the Supply Chain Management team, which will provide future cost savings by leveraging our buying power. Corporate cash flow also included $20 million (2017 - $22 million) in sustaining and productivity capital spend.
TRANSALTA CORPORATION M30
Management’s Discussion and Analysis
Fourth Quarter
Consolidated Financial Highlights
| | | | | | | | |
| Three months ended Dec. 31 | 2019 | 2018 |
| Revenues | 609 | | 622 | |
| Fuel, carbon compliance and purchased power | 286 | | 336 | |
| Operations, maintenance and administration | 127 | | 139 | |
| Net earnings (loss) attributable to common shareholders | 66 | | (122) | |
| Cash flow from operating activities | 181 | | 132 | |
Comparable EBITDA(1) | 243 | | 265 | |
FFO(1) | 189 | | 217 | |
FCF(1) | 121 | | 98 | |
| Net earnings (loss) per share attributable to common shareholders, basic and diluted | 0.24 | | (0.43) | |
FFO per share(1) | 0.67 | | 0.76 | |
FCF per share(1) | 0.43 | | 0.34 | |
Dividends declared per common share(3) | 0.04 | | 0.08 | |
Dividends declared per preferred share(4) | 0.26 | | 0.52 | |
(1) These items are not defined and have no standardized meaning under IFRS. Presenting these items from period to period provides management and investors with the ability to evaluate earnings trends more readily in comparison with prior periods’ results. Refer to the Discussion of Consolidated Financial Results section of this MD&A for further discussion of these items, including, where applicable, reconciliations to measures calculated in accordance with IFRS. See also the Additional IFRS measures and Non-IFRS Measures section of this MD&A.
(2) During the first quarter of 2019, we revised our approach to reporting adjustments to arrive at comparable EBITDA, mainly to be more comparable with other companies in the industry. Comparable EBITDA is now adjusted to exclude the impact of unrealized mark-to-market gains or losses. The current and prior period amounts have been adjusted to reflect this change.
(3) Dividends declared vary year over year due to timing of dividend declarations.
(4) Weighted average of the Series A, B, C, E and G preferred share dividends declared. Dividends declared vary year over year due to timing of dividend declarations.
Financial Highlights
We delivered strong results in the fourth quarter with FCF of $121 million, compared to $98 million last year, mainly due to lower sustaining capital expenditures and distributions paid to subsidiaries, partially offset by lower comparable EBITDA. FFO was $189 million, which was $28 million lower than the fourth quarter of 2018, also mainly due to lower comparable EBITDA.
Net earnings attributable to common shareholders in the fourth quarter of 2019 was $66 million ($0.24 net earnings per share) compared to a net loss of $122 million ($0.43 net loss per share) in the same period of 2018, an improvement of $188 million. This was driven partially by the Keephills 3 and Genesee 3 swap with Capital Power where we recognized a gain on termination of the coal rights contract of $88 million and a gain on the sale of Genesee 3 of $77 million (refer to the Highlights and Significant and Subsequent Events sections of this MD&A for further details). In addition, the fourth quarter showed the impact of cost-saving initiatives in OM&A, fuel, carbon compliance and purchased power costs as well as lower interest expense, partially offset by higher impairment charges, losses on sale of PP&E and higher income tax expense.
TRANSALTA CORPORATION M31
Management’s Discussion and Analysis
Segmented Cash Flow Generated by the Business and Operational Performance
Segmented cash flow generated by the business measures the net cash generated by each of our segments after sustaining and productivity capital expenditures, reclamation costs and provisions. It also excludes non-cash mark-to-market gains or losses. This is the cash flow available to pay our interest and cash taxes, distributions to our non-controlling partners, dividends to our preferred shareholders and to grow the business, pay down debt and return capital to our shareholders.
Segmented cash flow and operational performance for the business for the three months ended Dec. 31, 2019 and 2018 is as follows:
| | | | | | | | |
| Three months ended Dec. 31 | 2019 | 2018 |
Availability (%)(1) | 91.6 | | 91.5 | |
| | |
Production (GWh)(1) | 8,153 | | 8,276 | |
Segmented cash flow(2) | | |
| Canadian Coal | 37 | | 16 | |
| US Coal | 25 | | 21 | |
| Canadian Gas | 22 | | 59 | |
| Australian Gas | 25 | | 35 | |
| Wind and Solar | 72 | | 74 | |
| Hydro | 13 | | 11 | |
| Generation segmented cash flow | 194 | | 216 | |
| Energy Marketing | 31 | | 10 | |
| Corporate | (29) | | (34) | |
| Total segmented cash flow | 196 | | 192 | |
(1) Availability and production includes all generating assets under generation operations that we operate and finance leases and excludes hydro assets and equity investments. Production includes all generating assets, irrespective of investment vehicle and fuel type.
(2) This is not defined and has no standardized meaning under IFRS. Presenting this item from period to period provides management and investors with the ability to evaluate earnings trends more readily in comparison with prior periods’ results. Refer to the Discussion of Consolidated Financial Results section of this MD&A for further discussion of these items, including, where applicable, reconciliations to measures calculated in accordance with IFRS. See also the Additional IFRS measures and Non-IFRS Measures section of this MD&A.
Availability for the three months ended Dec. 31, 2019, was comparable with the same period in 2018. Lower production for the three months ended Dec. 31, 2019, compared to the same period in 2018 is primarily due to paid curtailments at Canadian Coal and lower wind resources, partially offset by higher production at US Coal.
Comparable cash flow generated by the business totalled $196 million in the fourth quarter, an increase of $4 million compared with last year’s performance. Increased cash flow is largely due to the strong performance at Canadian Coal and Energy Marketing, partially offset by lower cash flow at Canadian Gas as a result of the termination of the Mississauga contract as well as lower scheduled payments at Poplar Creek. In addition, 2018 comparable cash flow benefited from the settlement of a long-term receivable in Australian Gas.
TRANSALTA CORPORATION M32
Management’s Discussion and Analysis
Discussion of Consolidated Financial Results for the Fourth Quarter
Comparable EBITDA
A reconciliation of net earnings (loss) attributable to common shareholders to comparable EBITDA results is set out below:
| | | | | | | | |
| Three months ended Dec. 31 | 2019 | 2018 |
| Net earnings (loss) attributable to common shareholders | 66 | | (122) | |
| Net earnings attributable to non-controlling interests | 27 | | 43 | |
| Preferred share dividends | 10 | | 20 | |
| Net earnings (loss) | 103 | | (59) | |
| Adjustments to reconcile net income to comparable EBITDA | | |
| Income tax expense | 40 | | (16) | |
| Gain on sale of assets and other | (64) | | — | |
| Foreign exchange (gain) loss | (3) | | — | |
| Net interest expense | 18 | | 50 | |
| Depreciation and amortization | 154 | | 152 | |
| Comparable reclassifications | | |
| Decrease in finance lease receivables | 5 | | 15 | |
| Mine depreciation included in fuel cost | 31 | | 37 | |
| Australian interest income | 1 | | 1 | |
| Unrealized mark-to-market (gains) losses | (1) | | 32 | |
| Adjustments to earnings to arrive at comparable EBITDA | | |
| Impacts to revenue associated with certain de-designated and economic hedges | — | | — | |
Impacts associated with Mississauga recontracting(1) | — | | 30 | |
| Gain on termination of Keephills 3 coal rights contract | (88) | | — | |
Asset impairment charge(2) | 47 | | 23 | |
| Comparable EBITDA | 243 | | 265 | |
(1) Impacts associated with Mississauga recontracting for the three months ended Dec. 31, 2019, are as follows: revenue nil (2018 - $30 million).
(2) Asset impairment charges for the three months ended Dec. 31, 2019, include $32 million increase for the decommissioning and restoration liability at the Centralia mine and $15 million for trucks held for sale and written down to net realizable value (2018 - includes the write-off of project development costs of $23 million).
A summary of our comparable EBITDA by segment for the three months ended Dec. 31, 2019 and 2018 is as follows:
| | | | | | | | |
| Three months ended Dec. 31 | 2019 | 2018 |
| Comparable EBITDA | | |
| Canadian Coal | 55 | | 48 | |
| US Coal | 29 | | 24 | |
| Canadian Gas | 29 | | 74 | |
| Australian Gas | 28 | | 32 | |
| Wind and Solar | 80 | | 82 | |
| Hydro | 18 | | 17 | |
| Energy Marketing | 26 | | 16 | |
| Corporate | (22) | | (28) | |
| Total Comparable EBITDA | 243 | | 265 | |
TRANSALTA CORPORATION M33
Management’s Discussion and Analysis
Comparable EBITDA decreased by $22 million for the fourth quarter 2019, compared to 2018, primarily as a result of:
▪Our Canadian Coal results were up $7 million mainly due to lower OM&A in 2019.
▪US Coal results were up $5 million primarily due to lower fuel and purchased power costs and increased volumes.
▪Our Canadian Gas business was down $45 million mainly due to the Mississauga contract ending in 2018 and lower scheduled payments from Poplar Creek.
▪Australian Gas was down $4 million, mainly due to the weakening of the Australian dollar and slightly higher legal costs.
▪Wind and Solar results were down $2 million period-over-period mainly due to lower revenues due to the scheduled expirations of production-based incentives for wind facilities.
▪Hydro results were $1 million higher and therefore fairly consistent, which was in line with our expectations.
▪Energy Marketing’s comparable EBITDA was up $10 million, mainly due to continued high levels of volatility in the market.
▪Corporate costs decreased by $6 million in the fourth quarter mainly due to the realized net gain from the total return swap on our share-based payment plans and cost-saving efficiencies.
Funds from Operations and Free Cash Flow
FFO per share and FCF per share are calculated as follows using the weighted average number of common shares outstanding during the period. FFO, FFO per share, FCF and FCF per share are non-IFRS measures, are not defined under IFRS, and therefore, should not be considered in isolation or as an alternative to or to be more meaningful than cash flow from operating activities as determined in accordance with IFRS, when assessing our financial performance or liquidity. See the Additional IFRS Measures and Non-IFRS Measures section in this MD&A for further details.
The table below reconciles our cash flow from operating activities to our FFO and FCF for the three months ended Dec. 31, 2019 and 2018:
| | | | | | | | |
| Three months ended Dec. 31 | 2019 | 2018 |
| Cash flow from operating activities | 181 | | 132 | |
| Change in non-cash operating working capital balances | 1 | | 69 | |
| Cash flow from operations before changes in working capital | 182 | | 201 | |
| Adjustments | | | |
| Decrease in finance lease receivable | 5 | | 15 | |
| Other | 2 | | 1 | |
| FFO | 189 | | 217 | |
| Deduct: | | | |
| Sustaining capital | (30) | | (52) | |
| Productivity capital | (2) | | (9) | |
| Dividends paid on preferred shares | (10) | | (10) | |
| Distributions paid to subsidiaries’ non-controlling interests | (22) | | (43) | |
Payments on lease obligations(1) | (5) | | (4) | |
| Other | 1 | | (1) | |
| FCF | 121 | | 98 | |
| Weighted average number of common shares outstanding in the period | 280 | | 286 | |
| FFO per share | 0.67 | | 0.76 | |
| FCF per share | 0.43 | | 0.34 | |
(1) During the first quarter of 2019, we revised the way in which FFO and FCF are reconciled to reflect the payments related to lease obligations as a separate line and removed finance leases from sustaining capital. Prior period results have been revised to reflect these changes.
TRANSALTA CORPORATION M34
Management’s Discussion and Analysis
The table below provides a reconciliation of our comparable EBITDA to our FFO and FCF for the three months ended Dec. 31, 2019 and 2018:
| | | | | | | | |
| Three months ended Dec. 31 | 2019 | 2018 |
| Comparable EBITDA | 243 | | 265 | |
| Provisions | (1) | | (5) | |
| Interest expense | (41) | | (40) | |
| Current income tax expense | (7) | | (10) | |
| Realized foreign exchange gain (loss) | 1 | | 1 | |
| Decommissioning and restoration costs settled | (10) | | (8) | |
| Other non-cash items | 4 | | 14 | |
| FFO | 189 | | 217 | |
| Deduct: | | |
| Sustaining capital | (30) | | (52) | |
| Productivity capital | (2) | | (9) | |
| Dividends paid on preferred shares | (10) | | (10) | |
| Distributions paid to subsidiaries’ non-controlling interests | (22) | | (43) | |
| Payments on lease obligations | (5) | | (4) | |
| Other | 1 | | (1) | |
| Comparable FCF | 121 | | 98 | |
| Weighted average number of common shares outstanding in the period | 280 | | 286 | |
| Comparable FFO per share | 0.67 | | 0.76 | |
| Comparable FCF per share | 0.43 | | 0.34 | |
Selected Quarterly Information
Our results are seasonal due to the nature of the electricity market and related fuel costs. Higher maintenance costs are often incurred in the spring and fall when electricity prices are expected to be lower, as electricity prices generally increase in the peak winter and summer months in our main markets due to increased heating and cooling loads. Margins are also typically impacted in the second quarter due to the volume of hydro production resulting from spring runoff and rainfall in the Pacific Northwest, which impacts production at US Coal. Typically, hydro facilities generate most of their electricity and revenues during the spring months when melting snow starts feeding watersheds and rivers. Inversely, wind speeds are historically greater during the cold winter months and lower in the warm summer months.
| | | | | | | | | | | | | | |
| | Q1 2019 | Q2 2019 | Q3 2019 | Q4 2019 |
| | | | |
| Revenues | 648 | | 497 | | 593 | | 609 | |
Comparable EBITDA(1) | 221 | | 215 | | 305 | | 243 | |
| FFO | 169 | | 155 | | 244 | | 189 | |
| Net earnings (loss) attributable to common shareholders | (65) | | — | | 51 | | 66 | |
Net earnings (loss) per share attributable to common shareholders, basic and diluted(2) | (0.23) | | — | | 0.18 | | 0.24 | |
| | | | |
| | Q1 2018 | Q2 2018 | Q3 2018 | Q4 2018 |
| | | | |
| Revenues | 588 | | 446 | | 593 | | 622 | |
Comparable EBITDA(1) | 396 | | 248 | | 252 | | 265 | |
| FFO | 318 | | 188 | | 204 | | 217 | |
| Net earnings (loss) attributable to common shareholders | 65 | | (105) | | (86) | | (122) | |
Net earnings (loss) per share attributable to common shareholders, basic and diluted(2) | 0.23 | | (0.36) | | (0.30) | | (0.43) | |
(1) During the first quarter of 2019, we revised our approach to reporting adjustments to arrive at comparable EBITDA, mainly to be more comparable with other companies in the industry. Comparable EBITDA is now adjusted to exclude the impact of unrealized mark-to-market gains or losses. The current and prior period amounts have been adjusted to reflect this change.
(2) Basic and diluted earnings per share attributable to common shareholders and comparable earnings per share are calculated each period using the weighted average common shares outstanding during the period. As a result, the sum of the earnings per share for the four quarters making up the calendar year may sometimes differ from the annual earnings per share.
TRANSALTA CORPORATION M35
Management’s Discussion and Analysis
Reported net earnings, comparable EBITDA and FFO are generally higher in the first and fourth quarters due to higher demand associated with the cold winter months in the markets in which we operate and lower planned outages.
Net earnings attributable to common shareholders has also been impacted by the following variations and events:
▪Gains relating to the Keephills 3 and Genesee 3 swap in the fourth quarter of 2019;
▪Effects of impairment charges and reversals during the third and fourth quarters of 2019 and impairment charges during the second, third and fourth quarters of 2018;
▪Effects of changes in useful lives of certain assets during the third quarter of 2019;
▪Change in income tax rates in Alberta in the second quarter of 2019;
▪Lower scheduled payments commencing in January 2019 from the Poplar Creek finance lease; and
▪Recognition of the $157 million early termination payment received regarding Sundance B and C PPAs during the first quarter of 2018 and $56 million received on winning the arbitration against the Balancing Pool in the third quarter of 2019.
Key Financial Ratios
The methodologies and ratios used by rating agencies to assess our credit rating are not publicly disclosed. We have developed our own definitions of ratios and targets to help evaluate the strength of our financial position. These metrics and ratios are not defined and have no standardized meaning under IFRS and may not be comparable to those used by other entities or by rating agencies. We maintained a strong and flexible financial position in 2019.
Funds from Operations before Interest to Adjusted Interest Coverage
| | | | | | | | | | | |
| For the year ended Dec. 31 | 2019 | 2018 | 2017 |
FFO(1) | 757 | | 927 | | 804 | |
| Less: PPA Termination Payments | (56) | | (157) | | — | |
Add: Interest on debt, exchangeable securities and leases, net of interest income and
capitalized interest | 166 | | 174 | | 205 | |
| FFO before interest | 867 | | 944 | | 1,009 | |
| Interest on debt, exchangeable securities and leases, net of interest income | 172 | | 176 | | 214 | |
| Add: 50 per cent of dividends paid on preferred shares | 20 | | 20 | | 20 | |
| Adjusted interest | 192 | | 196 | | 234 | |
| FFO before interest to adjusted interest coverage (times) | 4.5 | | 4.8 | | 4.3 | |
(1) See the Discussion of Consolidated Financial Results section in this MD&A for reconciliation of cash flow from operating activities to FFO. See also the IFRS Measures and Non-IFRS Measures section for further details.
Our target for FFO before interest to adjusted interest coverage is four to five times. While all periods are within our target range, the ratio decreased slightly in 2019 compared to 2018, mainly due to lower FFO before interest.
TRANSALTA CORPORATION M36
Management’s Discussion and Analysis
Adjusted FFO to Adjusted Net Debt
| | | | | | | | | | | |
| As at Dec. 31 | 2019 | 2018 | 2017 |
FFO(1, 2) | 757 | | 927 | | 804 | |
Less: PPA Termination Payments(1) | (56) | | (157) | | — | |
Less: 50 per cent of dividends paid on preferred shares(1) | (20) | | (20) | | (20) | |
Adjusted FFO(1) | 681 | | 750 | | 784 | |
Period-end long-term debt(3) | 3,212 | | 3,267 | | 3,707 | |
| Exchangeable securities | 326 | | — | | — | |
| Less: Cash and cash equivalents | (411) | | (89) | | (314) | |
| Less: Principal portion of TransAlta OCP restricted cash | (10) | | (27) | | — | |
| Add: 50 per cent of issued preferred shares | 471 | | 471 | | 471 | |
Fair value asset of hedging instruments on debt(4) | (7) | | (10) | | (30) | |
| Adjusted net debt | 3,581 | | 3,612 | | 3,834 | |
| Adjusted FFO to adjusted net debt (%) | 19.0 | | 20.8 | | 20.4 | |
(1) Last 12 months.
(2) Refer to the Discussion of Consolidated Financial Results section of this MD&A for the reconciliation of cash flow from operating activities to FFO. See also the IFRS Measures and Non-IFRS Measures section for further details.
(3) Includes lease obligations and tax equity financing.
(4) Included in risk management assets and/or liabilities on the consolidated financial statements as at Dec. 31, 2019, Dec. 31, 2018, and Dec. 31, 2017.
Our target range for adjusted FFO to adjusted net debt is 20 to 25 per cent. Our adjusted FFO to adjusted net debt declined due to lower adjusted FFO compared with 2018, partially offset by lower adjusted net debt. We reached the low end of our target range of 20 to 25 per cent in 2017 and 2018.
Adjusted Net Debt to Comparable EBITDA
| | | | | | | | | | | |
| As at Dec. 31 | 2019 | 2018 | 2017 |
Period-end long-term debt(1) | 3,212 | | 3,267 | | 3,707 | |
| Exchangeable securities | 326 | | — | | — | |
| Less: Cash and cash equivalents | (411) | | (89) | | (314) | |
| Less: Principal portion of TransAlta OCP restricted cash | (10) | | (27) | | — | |
| Add: 50 per cent of issued preferred shares | 471 | | 471 | | 471 | |
Fair value asset of hedging instruments on debt(2) | (7) | | (10) | | (30) | |
| Adjusted net debt | 3,581 | | 3,612 | | 3,834 | |
Comparable EBITDA(3,4) | 984 | | 1,161 | | 1,030 | |
Less: PPA Termination Payments(3,4) | (56) | | (157) | | — | |
Adjusted comparable EBITDA(3,4) | 928 | | 1,004 | | 1,030 | |
| Adjusted net debt to adjusted comparable EBITDA (times) | 3.9 | | 3.6 | | 3.7 | |
(1) Includes lease obligations and tax equity financing.
(2) Included in risk management assets and/or liabilities on the consolidated financial statements as at Dec. 31, 2019, Dec. 31, 2018, and Dec. 31, 2017.
(3) Last 12 months.
(4) During the first quarter of 2019, we revised comparable EBITDA to exclude the impact of unrealized mark-to-market gains or losses. The current and prior period amounts have been adjusted to reflect this change.
Our target for adjusted net debt to comparable EBITDA is 3.0 to 3.5 times. Our adjusted net debt to comparable EBITDA ratio increased compared to 2018, mainly due to the decrease in adjusted comparable EBITDA during the year, after adjusting for the PPA Termination Payments.
TRANSALTA CORPORATION M37
Management’s Discussion and Analysis
Deconsolidated Net Debt to Deconsolidated Comparable EBITDA
In addition to reviewing fully consolidated ratios and results, management reviews net debt to adjusted comparable EBITDA on a deconsolidated basis to highlight TransAlta's financial flexibility, balance sheet strength and leverage excluding the portion of TransAlta Renewables and TA Cogen that are not owned by TransAlta. These metrics and ratios are not defined under IFRS, and may not be comparable to those used by other entities or by rating agencies. See also the IFRS Measures and Non-IFRS Measures section of this MD&A for further details.
| | | | | | | | | | | |
| As at Dec. 31 | 2019 | 2018 | 2017 |
Period-end long-term debt(1) | 3,212 | | 3,267 | | 3,707 | |
| Exchangeable securities | 326 | | — | | — | |
| Less: Cash and cash equivalents | (411) | | (89) | | (314) | |
| Less: Principal portion of TransAlta OCP restricted cash | (10) | | (27) | | — | |
| Add: 50 per cent of issued preferred shares | 471 | | 471 | | 471 | |
Fair value asset of hedging instruments on debt(2) | (7) | | (10) | | (30) | |
| Less: TransAlta Renewables long-term debt | (961) | | (932) | | (1,043) | |
Less: US tax equity financing(3) | (145) | | (28) | | (31) | |
| Deconsolidated net debt | 2,475 | | 2,652 | | 2,760 | |
Comparable EBITDA(4, 5) | 984 | | 1,161 | | 1,030 | |
Less: PPA Termination Payments(4) | (56) | | (157) | | — | |
Less: TransAlta Renewables comparable EBITDA(4) | (438) | | (430) | | (424) | |
Less: TA Cogen comparable EBITDA(4) | (80) | | (181) | | (182) | |
Add: Dividend from TransAlta Renewables(4) | 151 | | 151 | | 140 | |
Add: Dividend from TA Cogen(4) | 37 | | 86 | | 86 | |
Deconsolidated comparable EBITDA (4, 5) | 598 | | 630 | | 650 | |
Deconsolidated net debt to deconsolidated comparable EBITDA(4, 5) (times) | 4.1 | | 4.2 | | 4.2 | |
(1) Includes lease obligations and tax equity financing.
(2) Included in risk management assets and/or liabilities on the consolidated financial statements as at Dec. 31, 2019, Dec. 31, 2018, and Dec. 31, 2017.
(3) Relates to assets where TransAlta Renewables has economic interests.
(4) Last 12 months.
(5) During the first quarter of 2019, we revised comparable EBITDA to exclude the impact of unrealized mark-to-market gains or losses. The current and prior period amounts have been adjusted to reflect this change.
Our target for deconsolidated net debt to deconsolidated comparable EBITDA is 2.5 to 3.0 times. Our deconsolidated net debt to deconsolidated comparable EBITDA ratio improved slightly compared with 2018, as lower deconsolidated net debt was partially offset by lower deconsolidated comparable EBITDA.
TRANSALTA CORPORATION M38
Management’s Discussion and Analysis
Deconsolidated FFO
During the third quarter of 2019, the Corporation implemented a new dividend policy that aims to return 10 to 15 per cent of TransAlta's deconsolidated FFO to shareholders as it aligns shareholder returns to the assets held directly at TransAlta. This metric is not defined and has no standardized meaning under IFRS, and may not be comparable to those used by other entities or by rating agencies. See also the IFRS Measures and Non-IFRS Measures section of this MD&A for further details. Deconsolidated FFO for the years ended Dec. 31 is detailed below:
| | | | | | | | | | | | | | | | | | | | | | | | | | | | | |
| 2019 | | | 2018 | | | 2017 | | |
| TransAlta Consolidated | TransAlta Renewables | TransAlta Deconsolidated | TransAlta Consolidated | TransAlta Renewables | TransAlta Deconsolidated | TransAlta Consolidated | TransAlta Renewables | TransAlta Deconsolidated |
Cash flow from operating
activities | 849 | | 331 | | | 820 | | 385 | | | 626 | | 290 | | |
Change in non-cash
operating working capital
balances | (121) | | (23) | | | 44 | | 5 | | | 114 | | 17 | | |
Cash flow from operations
before changes in working
capital | 728 | | 308 | | | 864 | | 390 | | | 740 | | 307 | | |
| Adjustments: | | | | | | | | | |
Decrease in finance lease
receivable | 24 | | — | | | 59 | | — | | | 59 | | — | | |
Finance and interest
income - economic
interests | — | | (76) | | | — | | (171) | | | — | | (86) | | |
Adjusted FFO - economic
interests | — | | 146 | | | — | | 162 | | | — | | 137 | | |
| Other | 5 | | — | | | 4 | | — | | | 5 | | — | | |
| FFO | 757 | | 378 | | 379 | 927 | | 381 | | 546 | 804 | | 358 | | 446 |
Dividend from TransAlta
Renewables | | | | | 151 | | | | | | 151 | | | | | | 140 | |
Distributions to TA Cogen's
Partner | | | (37) | | | | (86) | | | | (86) | |
Less: PPA Termination
Payments | | | (56) | | | | (157) | | | | — | |
Deconsolidated
TransAlta FFO | | | 437 | | | | 454 | | | | 500 | |
TRANSALTA CORPORATION M39
Management’s Discussion and Analysis
Financial Position
The following chart highlights significant changes in the Consolidated Statements of Financial Position from Dec. 31, 2018, to Dec. 31, 2019:
| | | | | | | | | | | |
| | Increase/ | | |
| Assets | (decrease) | | Primary factors explaining change |
| Cash and cash equivalents | 322 | | | Timing of receipts and payments and cash received from the issuance of the exchangeable securities |
| Restricted cash | (34) | | | Kent Hills restricted cash was released in July 2019 ($31 million) and the restricted cash related to the TransAlta OCP bonds was paid in Feb. 2019 ($35 million), partially offset by the Off Coal Agreement payments received ($17 million) in Aug. 2019 that will be restricted until the TransAlta OCP bonds are paid in Feb. 2020 as well as new restricted cash related to the Big Level tax equity financing ($15 million) |
| Trade and other receivables | (294) | | | Timing of customer receipts |
| Finance lease receivables (long-term) | (15) | | | Principal repayments |
| PP&E | 43 | | | Depreciation for the period ($630 million), net disposals mainly related to the Genesee 3 sale and decommissioning of Mississauga ($265 million), unfavourable changes in foreign exchange rates ($58 million), and adjustments on implementation of IFRS 16 ($62 million), partially offset by additions ($522 million), acquisitions mainly related to Keephills 3 and Antrim ($439 million) and revisions to decommissioning and restoration costs ($23 million) |
| Right of use assets | 146 | | | Transfers from PP&E, intangible assets and other assets ($38 million) and new right of use assets recognized under IFRS 16 ($47 million) (see Accounting Changes section for further details), additions related to the Pioneer Pipeline ($45 million) as well as land lease and other additions ($36 million), partially offset by depreciation ($18 million) |
| Intangible assets | (55) | | | Amortization ($50 million) and net disposals mainly related to the Genesee 3 sale ($28 million), partially offset by additions ($14 million) and acquisitions mainly related to Antrim ($16 million) |
| Other assets | (36) | | | Pioneer Pipeline project development costs were reclassified to PP&E ($15 million) and the write-off of projects that will no longer proceed ($18 million) |
| Other | 3 | | | |
| Total change in assets | 80 | | | |
| | | |
| | Increase/ | | |
| Liabilities and equity | (decrease) | | Primary factors explaining change |
| Accounts payable and accrued liabilities | (83) | | | Timing of payments and accruals |
| Dividends payable | (21) | | | Timing of the declaration of common and preferred share dividends |
Credit facilities, long-term debt and lease
obligations (including current portion) | (55) | | | Repayments on the credit facilities ($119 million), repayments of long-term debt ($96 million) favourable changes in foreign exchange ($42 million), reduction due to the tax shield on tax equity financing ($35 million), derecognition of a lease obligation on implementation of IFRS 16 ($32 million) and repayments of lease obligations ($21 million) were partially offset by the issuance of the tax equity financing ($166 million) and new lease liabilities ($133 million) |
| Exchangeable securities | 326 | | | Issuance of exchangeable debentures in May 2019 to Brookfield. See the Significant and Subsequent Events section of this MD&A for further details |
Decommissioning and other provisions
(current and long-term) | 90 | | | Change in estimate for the Centralia mine ($141 million), accretion ($23 million), acquisition of liabilities ($19 million), revisions to discount rates ($16 million) and liabilities incurred ($14 million), partially offset by liabilities settled ($42 million), lower estimated cash flows at other locations ($38 million), disposition of liabilities ($32 million) and favourable changes in foreign exchange rates ($7 million). See the Accounting Changes section of this MD&A for further details |
Risk management liabilities (current and
long-term) | (21) | | | Contract settlements, partially offset by favourable market prices |
| Contract liabilities | (73) | | | The coal rights contract was terminated as part of the Keephills 3 and Genesee 3 swap ($88 million), partially offset by contract liabilities moved from defined benefit obligation and other long-term liabilities as they are no longer considered leases on the adoption of IFRS 16 ($15 million) (see the Significant and Subsequent Events and Accounting Changes sections of this MD&A for further details)
|
Defined benefit obligation and other
long-term liabilities | 14 | | | Actuarial losses before tax ($33 million) partially offset by liabilities moved to contract liabilities ($15 million) |
| Deferred income tax liabilities | (29) | | | Decrease in taxable temporary differences mainly due to the Alberta tax rate reduction (see the Other Consolidated Analysis section for further details) |
| Equity attributable to shareholders | (36) | | | Net other comprehensive loss ($28 million), common share dividends ($34 million), preferred share dividends ($30 million), shares purchased under NCIB ($68 million), partially offset by net earnings ($82 million), the effect of share-based payment plans ($33 million) and changes in non-controlling interests in TransAlta Renewables ($6 million) |
| Non-controlling interests | (36) | | | Distributions paid and payable ($135 million) and intercompany fair value through other comprehensive income investments ($17 million), partially offset by net earnings ($94 million), changes in non-controlling interests in TransAlta Renewables from share issuances under the dividend reinvestment plan ($22 million) |
| Other | 4 | | | |
| Total change in liabilities and equity | 80 | | | |
TRANSALTA CORPORATION M40
Management’s Discussion and Analysis
Cash Flows
The following chart highlights significant changes in the Consolidated Statements of Cash Flows for the years ended Dec. 31, 2018, and Dec. 31, 2017, compared to the year ended Dec. 31, 2019:
| | | | | | | | | | | | | | |
| Year ended Dec. 31 | 2019 | 2018 | Increase/ (decrease) | Primary factors explaining change |
| Cash and cash equivalents, beginning of year | 89 | | 314 | | (225) | | |
| Provided by (used in): | | | | |
| Operating activities | 849 | | 820 | | 29 | | Favourable changes in non-cash working capital ($165 million), partially offset by lower cash flow from operations before changes in working capital ($136 million) mainly due to the net impact of the PPA Termination Payments |
| Investing activities | (512) | | (394) | | (118) | | Higher additions to PP&E mainly as a result of the construction of Big Level and Antrim ($140 million), higher acquisitions mainly due to the Kineticor acquisition ($87 million), investment in the Pioneer Pipeline ($83 million), lower scheduled payments from finance lease receivables ($35 million), partially offset by a decrease in restricted cash ($69 million), a favourable change in non-cash investing working capital ($128 million) and higher cash proceeds on sale of PP&E ($11 million) |
| Financing activities | (14) | | (651) | | 637 | | Lower repayments of long-term debt ($1,083 million), issuance of the exchangeable securities ($350 million), lower proceeds on issuance of debt ($179 million) and lower distributions paid to subsidiaries' non-controlling interests ($59 million), partially offset by higher net repayments under credit facilities ($431 million), proceeds received in 2018 for the sale of TransAlta Renewables common shares ($144 million), lower realized gains on financial instruments ($48 million) and higher share buybacks under NCIB ($45 million) |
| Translation of foreign currency cash | (1) | | — | | (1) | | |
| Cash and cash equivalents, end of year | 411 | | 89 | | 322 | | |
| | | | |
| Year ended Dec. 31 | 2018 | 2017 | Increase/ (decrease) | Primary factors explaining change |
| Cash and cash equivalents, beginning of year | 314 | | 305 | | 9 | | |
| Provided by (used in): | | | | |
| Operating activities | 820 | | 626 | | 194 | | Higher cash flow from operations before working capital ($124 million) and a favourable change in non-cash working capital ($70 million) |
| Investing activities | (394) | | 87 | | (481) | | Lower proceeds on sale of the Wintering Hills wind facility and Solomon ($476 million), unfavourable change in non-cash investing capital ($153 million) and the acquisition of Big Level and Antrim ($30 million), partially offset by lower additions to PP&E ($61 million), lower tax expense relating to investing activities ($56 million), lower additions to intangibles ($31 million) and the lower issuance of loan receivable ($39 million) |
| Financing activities | (651) | | (703) | | 52 | | Increase in borrowings under credit facilities ($286 million), higher issuance of long-term debt ($85 million) and higher proceeds on the sale of non-controlling interest in a subsidiary ($144 million), partially offset by higher repayments of long-term debt ($365 million), lower realized gains on financial instruments ($58 million) and repurchase of common shares ($23 million) |
| Translation of foreign currency cash | — | | (1) | | 1 | | |
| Cash and cash equivalents, end of year | 89 | | 314 | | (225) | | |
TRANSALTA CORPORATION M41
Management’s Discussion and Analysis
Financial Capital
The Corporation is focused on strengthening our financial position and cash flow coverage ratios to ensure a strong balance sheet is maintained and sufficient financial capital is available. Credit ratings provide information relating to the Corporation's financing costs, liquidity and operations and affect the Corporation's ability to obtain short-term and long-term financing and/or the cost of such financing. Maintaining a strong balance sheet also allows our commercial team to contract the Corporation’s portfolio with a variety of counterparties on terms and prices that are favourable to the Corporation’s financial results and provides the Corporation with better access to capital markets through commodity and credit cycles.
In 2019, Moody’s reaffirmed its issuer rating of Ba1 and revised their rating outlook to stable from positive. During 2019, Fitch Ratings lowered the Corporation’s Unsecured Debt rating and Issuer Rating to BB+ with a stable outlook; DBRS Limited reaffirmed the Corporation’s Unsecured Debt rating and Medium-Term Notes rating of BBB (low), the Preferred Shares rating of Pfd-3 (low) and Issuer Rating of BBB (low) with a stable outlook; and Standard and Poor’s lowered the Corporation’s Unsecured Debt rating and Issuer Rating to BB+ with a stable outlook. Risks associated with our credit ratings are discussed in the Governance and Risk Management section of this MD&A.
Capital Structure
Our capital structure consists of the following components as shown below:
| | | | | | | | | | | | | | | | | | | | |
| As at Dec. 31 | 2019 | | 2018 | | 2017 | |
| $ | % | $ | % | $ | % |
| TransAlta Corporation | | | | | | |
| Recourse debt - CAD debentures | 647 | | 9 | | 647 | | 9 | | 1,046 | | 13 | |
| Recourse debt - US senior notes | 905 | | 13 | | 943 | | 13 | | 1,499 | | 19 | |
| Exchangeable securities | 326 | | 5 | | — | | — | | — | | — | |
| Credit facilities | — | | — | | 174 | | 2 | | — | | — | |
| Other | 9 | | — | | 11 | | — | | 13 | | — | |
| Less: cash and cash equivalents | (348) | | (5) | | (16) | | — | | (294) | | (4) | |
| Less: principal portion of restricted cash on TransAlta OCP | (10) | | — | | (27) | | — | | — | | — | |
Less: fair value asset of economic hedging instruments on debt(1) | (7) | | — | | (10) | | — | | (30) | | — | |
| Net recourse debt, excluding US tax equity financing | 1,522 | | 22 | | 1,722 | | 24 | | 2,234 | | 28 | |
| US tax equity financing | 145 | | 2 | | 28 | | — | | 31 | | — | |
| Non-recourse debt | 426 | | 6 | | 469 | | 6 | | 208 | | 3 | |
| Lease obligations | 119 | | 2 | | 63 | | 1 | | 69 | | 1 | |
| Total net debt - TransAlta Corporation | 2,212 | | 32 | | 2,282 | | 31�� | | 2,542 | | 32 | |
| TransAlta Renewables | | | | | | |
| Credit facility | 220 | | 3 | | 165 | | 2 | | 27 | | — | |
| Less: cash and cash equivalents | (63) | | (1) | | (73) | | (1) | | (20) | | — | |
| Net recourse debt | 157 | | 2 | | 92 | | 1 | | 7 | | — | |
| Non-recourse debt | 718 | | 10 | | 767 | | 11 | | 814 | | 11 | |
| Lease obligations | 23 | | — | | — | | — | | — | | — | |
| Total net debt - TransAlta Renewables | 898 | | 12 | | 859 | | 12 | | 821 | | 11 | |
| Total consolidated net debt | 3,110 | | 44 | | 3,141 | | 43 | | 3,363 | | 43 | |
| Non-controlling interests | 1,101 | | 15 | | 1,137 | | 16 | | 1,059 | | 14 | |
| Equity attributable to shareholders | | | | | | |
| Common shares | 2,978 | | 42 | | 3,059 | | 42 | | 3,094 | | 40 | |
| Preferred shares | 942 | | 13 | | 942 | | 13 | | 942 | | 12 | |
Contributed surplus, deficit and accumulated other comprehensive
income | (959) | | (14) | | (1,004) | | (14) | | (710) | | (9) | |
| Total capital | 7,172 | | 100 | | 7,275 | | 100 | | 7,748 | | 100 | |
(1) During the first quarter of 2017, we discontinued hedge accounting on certain US-denominated debt hedges. The foreign currency derivatives remain in place as economic hedges.
TRANSALTA CORPORATION M42
Management’s Discussion and Analysis
We continued strengthening our financial position during 2019 and have reduced our total consolidated net debt by $253 million since the end of 2017. Our financing strategy includes replacing our senior recourse debt with asset-level financing, including tax equity. Net recourse debt at TransAlta, excluding tax equity financing, declined by $712 million from $2,234 million in 2017 to $1,522 million in 2019. We have enhanced shareholder value by:
2019
▪Obtaining US$126 million in tax equity financing to fund the Big Level and Antrim wind facilities;
▪Entering into a strategic investment with Brookfield whereby Brookfield agreed to invest $750 million in the Corporation. On May 1, 2019, we received the initial tranche of $350 million in exchange for seven per cent unsecured subordinated debentures due May 1, 2039, which are exchangeable by Brookfield into an equity ownership interest in our Alberta Hydro Assets in the future. The remaining $400 million will be invested in Oct. 2020 in exchange for a new series of redeemable, retractable first preferred shares, subject to the satisfaction of certain conditions being met;
▪Purchasing and cancelling 7,716,300 common shares at an average price of $8.80 per share through our NCIB program, for a total cost of $68 million;
2018
▪Early redeeming our outstanding 6.650 per cent US$500 million senior notes due May 15, 2018, for approximately $617 million (US$516 million) using proceeds from the Sundance B and C PPAs termination payment and existing liquidity;
▪Early redeeming our outstanding 6.40 per cent $400 million debentures due Nov. 2019, for approximately $425 million;
▪Paying out the US$25 million non-recourse debt related to the Mass Solar projects;
▪Purchasing and cancelling 3,264,500 common shares at an average price of $7.02 per share through our NCIB program, for a total cost of $23 million;
2017
▪Making a scheduled US$400 million senior note repayment using existing liquidity. This repayment was hedged with a cross-currency swap entered into on issuance of the debt that effectively reduced our Canadian dollar repayment by approximately $107 million; and
▪Early redeeming all of Canadian Hydro Developers Inc.’s outstanding non-recourse debentures.
Between 2020 and 2022, we have approximately $1,217 million of debt maturing, comprised of approximately $920 million of recourse debt, with the balance mainly related to scheduled non-recourse debt repayments. For the debt maturing in 2020, we expect to utilize our existing cash and credit facilities and we expect to refinance the debt maturing in 2022.
The weakening of the US dollar has decreased our long-term debt balances by $42 million as at Dec. 31, 2019. Almost all our US-denominated debt is hedged either through financial contracts or net investments in our US operations. During the period, these changes in our US-denominated debt were offset as follows:
| | | | | | | | |
| As at Dec. 31 | 2019 | 2018 |
Effects of foreign exchange on carrying amounts of US operations
(net investment hedge) and finance lease receivable | (21) | | 42 | |
| Foreign currency cash flow hedges on debt | (9) | | 11 | |
| Economic hedges and other | (9) | | 21 | |
| Unhedged | (3) | | 2 | |
| Total | (42) | | 76 | |
TRANSALTA CORPORATION M43
Management’s Discussion and Analysis
Our credit facilities provide us with significant liquidity. At Dec. 31, 2019, we had $2.2 billion (2018 - $2.0 billion) of committed credit facilities, of which $1.3 billion (2018 - $0.9 billion) was available for use. We are in compliance with the terms of the credit facilities. At Dec. 31, 2019, the $0.9 billion (2018 - $1.1 billion) of credit utilized under these facilities was comprised of actual drawings of $0.2 billion (2018 - $0.3 billion) and letters of credit of $0.7 billion (2018 - $0.7 billion). These facilities are comprised of a $1.3 billion committed syndicated bank facility expiring in 2023, TransAlta Renewables $700 million committed syndicated bank credit facility expiring in 2023, and three bilateral credit facilities, totalling $240 million, expiring in 2021.
The Melancthon Wolfe Wind, Pingston, TAPC Holdings LP, New Richmond, Kent Hills Wind LP and TransAlta OCP non-recourse bonds with a carrying value of $1,143 million (Dec. 31, 2018 - $1,235 million) are subject to customary financing conditions and covenants that may restrict the Corporation’s ability to access funds generated by the facilities’ operations. Upon meeting certain distribution tests, typically performed once per quarter, the funds are able to be distributed by the subsidiary entities to their respective parent entity. These conditions include meeting a debt service coverage ratio prior to distribution, which was met by these entities in the fourth quarter of 2019. However, funds in these entities that have accumulated since the fourth quarter test will remain there until the next debt service coverage ratio can be calculated in the first quarter of 2020. At Dec. 31, 2019, $42 million (Dec. 31, 2018 -$33 million) of cash was subject to these financial restrictions.
Additionally, certain non-recourse bonds require that certain reserve accounts be established and funded through cash held on deposit and/or by providing letters of credit. The Corporation has elected to use letters of credit as at Dec. 31, 2019.
Proceeds received from the Big Level and Antrim tax equity financing in the amount of $91 million are not able to be accessed by other Corporate entities as the funds must be solely used by the project entities for the purpose of paying outstanding project development costs.
Working Capital
Including the current portion of long-term debt and lease obligations, the excess of current assets over current liabilities was $224 million as at Dec. 31, 2019 (2018 - $432 million). Our working capital decreased year over year mainly due to the $400 million debenture payable in 2020. Excluding the current portion of long-term debt and lease obligations of $513 million, the excess of current assets over liabilities was $737 million as at Dec. 31, 2019 (2018 - $580 million), an increase of $157 million, mainly due to higher cash and cash equivalents and repayments on the credit facility as a result of receiving the $350 million exchangeable debentures issued in May 2019 to Brookfield, as well as strong cash flow from operating activities.
Share Capital
Our Series C and Series E Cumulative Redeemable Rate Reset Preferred Shares failed to receive the required number of minimum votes in 2017 to give effect to conversions into Series D and Series F, respectively; accordingly, both the Series C and Series E Preferred Shares will be entitled to receive quarterly fixed cumulative preferential cash dividends, if, as and when declared by the Board. The Series G Cumulative Redeemable Rate Reset Preferred Shares also failed to receive the required number of minimum votes in 2019 to give effect to conversions into Series H. Therefore, the Series G Preferred Shares will be entitled to receive quarterly fixed cumulative preferential cash dividends, if, as and when declared by the Board.
TRANSALTA CORPORATION M44
Management’s Discussion and Analysis
The following tables outline the common and preferred shares issued and outstanding:
| | | | | | | | | | | |
| As at | Mar. 3, 2020 | Dec. 31, 2019 | Dec. 31, 2018 |
| | Number of shares (millions) | | |
| Common shares issued and outstanding, end of period | 277.0 | | 277.0 | | 284.6 | |
| Preferred shares | | | |
| Series A | 10.2 | | 10.2 | | 10.2 | |
| Series B | 1.8 | | 1.8 | | 1.8 | |
| Series C | 11.0 | | 11.0 | | 11.0 | |
| Series E | 9.0 | | 9.0 | | 9.0 | |
| Series G | 6.6 | | 6.6 | | 6.6 | |
| Preferred shares issued and outstanding, end of period | 38.6 | | 38.6 | | 38.6 | |
Non-Controlling Interests
As of Dec. 31, 2019, we own 60.4 per cent (2018 – 60.9 per cent) of TransAlta Renewables. In 2019, our ownership percent decreased due to TransAlta Renewables issuing approximately two million common shares under their Dividend Reinvestment Plan ("DRIP"). We do not participate in this plan.
TransAlta Renewables is a publicly traded company whose common shares are listed on the TSX under the symbol “RNW”. TransAlta Renewables holds a diversified, highly contracted portfolio of assets with comparatively lower carbon intensity.
We also own 50.01 per cent of TA Cogen, which owns, operates or has an interest in four natural-gas-fired facilities (Mississauga, Ottawa, Windsor and Fort Saskatchewan) and one coal-fired generating facility. Since we own a controlling interest in TA Cogen and TransAlta Renewables, we consolidate the entire earnings, assets and liabilities in relation to those assets.
Reported earnings attributable to non-controlling interests for the year ended Dec. 31, 2019, decreased by $14 million to $94 million compared to 2018. Earnings were down at TransAlta Renewables in 2019 mainly due to lower finance and interest income from subsidiaries of TransAlta, foreign exchange losses due to the weakening of the Australian dollar and higher depreciation expense, partially offset by an increase in the fair value of investments in subsidiaries of TransAlta. Earnings from TA Cogen were higher in 2019 mainly due to strong Alberta pricing and lower costs of fuel at the coal-fired generating facility.
Reported earnings attributable to non-controlling interests for the year ended Dec. 31, 2018, increased by $66 million to $108 million compared to 2017. Earnings were up at TransAlta Renewables in 2018 due to higher finance income from its investment in the Australian business and the 2017 impairment of an investment. Earnings from TA Cogen were lower in 2018 mainly due to the settlement of the contract indexation dispute with the OEFC relating to the Ottawa and Windsor facilities positively impacting 2017 earnings.
TRANSALTA CORPORATION M45
Management’s Discussion and Analysis
Returns to Providers of Capital
Net Interest Expense
The components of net interest expense are shown below:
| | | | | | | | | | | |
| Year ended Dec. 31 | 2019 | 2018 | 2017 |
| Interest on debt | 161 | | 184 | | 218 | |
| Interest on exchangeable securities | 20 | | — | | — | |
| Interest income | (13) | | (11) | | (7) | |
| Capitalized interest | (6) | | (2) | | (9) | |
| Loss on redemption of bonds | — | | 24 | | 6 | |
| Interest on finance lease obligations | 4 | | 3 | | 3 | |
| Credit facility fees, bank charges, and other interest | 15 | | 13 | | 18 | |
| Tax shield on tax equity financing | (35) | | — | | — | |
Other(1) | 10 | | 15 | | (3) | |
| Accretion of provisions | 23 | | 24 | | 21 | |
| Net interest expense | 179 | | 250 | | 247 | |
(1) In 2019, other interest expense included approximately $5 million (2018 - $7 million, 2017 - nil) for the significant financing component required under IFRS 15. In addition, in 2018, approximately $5 million of costs were expensed due to project-level financing that is no longer practicable.
Net interest expense was lower in 2019 primarily due to the $35 million credit related to the tax shield (tax benefit on tax depreciation) claimed in 2019 on the Big Level and Antrim projects and allocated to the tax equity investor. In addition, there were no prepayment premiums in 2019 as there were no early redemptions of bonds during the year, compared to 2018, which included $24 million in prepayment premiums.
Net interest expense was higher in 2018 compared to 2017, due to the $5 million prepayment premium relating to the early redemption of the US$500 million senior notes, $5 million of costs expensed in connection to a project-level financing that is no longer practicable, the $19 million prepayment premium relating to the early redemption of the $400 million debenture and lower capitalized interest. These increases were partially offset by lower interest on debt as a result of lower debt levels.
Dividends to Shareholders
The declaration of dividends is at the discretion of the Board. The following are the common and preferred shares dividends declared each quarter during 2019 and the first quarter of 2020:
| | | | | | | | | | | | | | | | | | | | | | | | | | |
| | | | Common | Preferred Series dividends per share | | | | |
| | Payable date | | dividends | | | | | |
| Declaration date | Common shares | Preferred shares | per share | A | B | C | E | G |
| Apr 15, 2019 | Jul 1, 2019 | Jun 30, 2019 | 0.0400 | | 0.16931 | | 0.23136 | | 0.25169 | | 0.32463 | | 0.33125 | |
| Jul 16, 2019 | Oct. 1, 2019 | Sept. 30, 2019 | 0.0400 | | 0.16931 | | 0.23422 | | 0.25169 | | 0.32463 | | 0.33125 | |
| Oct. 9, 2019 | Jan. 1, 2020 | Dec. 31, 2019 | 0.0400 | | 0.16931 | | 0.23113 | | 0.25169 | | 0.32463 | | 0.31175 | |
| Jan. 16, 2020 | Apr 1, 2020 | Mar 31, 2020 | 0.0425 | | 0.16931 | 0.22949 | 0.25169 | 0.32463 | 0.31175 |
TRANSALTA CORPORATION M46
Management’s Discussion and Analysis
2020 Financial Outlook
The following table outlines our expectation on key financial targets and related assumptions for 2020 and should be read in conjunction with the narrative discussion that follows and the Governance and Risk Management section of this MD&A:
| | | | | |
| Measure | Target |
| Comparable EBITDA | $925 million to $1,000 million |
| |
| FCF | $325 million to $375 million |
| Dividend | $0.17 per share annualized |
| | | | | |
| Range of key power price assumptions | |
| Market | Power Prices ($/MWh) |
| Alberta Spot | $53 to $63 |
| Mid-C Spot (US$) | $25 to $35 |
| | | | | |
| Other assumptions relevant to the 2020 financial outlook | |
| Sustaining capital | $170 million to $200 million |
Operations
Market Pricing and Hedging Strategy
For 2020, power prices in Alberta are expected to be comparable to 2019 given similar overall supply and demand conditions; however, weather and demand are major factors in actual settled prices. Pacific Northwest power prices for 2020 are expected to be lower than 2019 as 2019 prices were impacted by specific events in the first quarter that are not expected to occur in the future. Ontario power prices are expected to be comparable or higher than 2019 prices.
The objective of our portfolio management strategy is to deliver a high confidence for annual FCF that also provides for positive exposure to price volatility in Alberta. Given our cash operating costs, we can be more or less hedged in a given period, and we expect to realize our annual FCF targets through a combination of forward hedging and selling generation into the spot market.
Fuel Costs
For the Alberta thermal fleet, we expect the 2020 cash fuel costs per tonne of coal to be higher than the 2019 costs as mine volumes are declining, resulting in slightly less mine cost efficiency. Coal volumes are declining as a result of increased gas consumption in the Alberta thermal fleet. This change in fuel mix will drive lower GHG emissions and the combined effect will result in lower total fuel and GHG costs for a given volume of power production.
In the Pacific Northwest of the US, the coal mine adjacent to our Centralia power plant is in the reclamation stage. Fuel at US Coal has been purchased primarily from external suppliers in the Powder River Basin and delivered by rail. In 2017, we amended our fuel and rail contract such that our rail freight costs fluctuate partly with gas prices. The delivered fuel cost in 2020 is expected to be consistent with 2019 costs.
Most of the generation from gas turbine-based power plants is sold under contracts with passthrough provisions for fuel. For gas generation with no passthrough provisions, we purchase natural gas from outside companies coincident with production, thereby minimizing our risk to changes in prices.
We closely monitor the risks associated with changes in electricity and input fuel prices on our future operations and, where we consider it appropriate, use various physical and financial instruments to hedge our assets and operations from such price risks.
Energy Marketing
EBITDA from our Energy Marketing segment is affected by prices and volatility in the market, overall strategies adopted, and changes in regulation and legislation. We continuously monitor both the market and our exposure to maximize earnings while still maintaining an acceptable risk profile. Our 2020 objective for Energy Marketing is for the segment to contribute between $75 million to $85 million in gross margin for the year.
TRANSALTA CORPORATION M47
Management’s Discussion and Analysis
Exposure to Fluctuations in Foreign Currencies
Our strategy is to minimize the impact of fluctuations in the Canadian dollar against the US dollar and Australian dollar by offsetting foreign-denominated assets with foreign-denominated liabilities and by entering into foreign exchange contracts. We also have foreign-denominated expenses, including interest charges, which largely offset our net foreign-denominated revenues.
Net Interest Expense
Interest expense for 2020 is expected to be higher than in 2019 largely due to higher levels of debt. The increase in debt is mainly due to expected drawings on our credit facilities as we execute on our growth plans as well as the exchangeable debentures issued in May 2019 to Brookfield and the $400 million exchangeable preferred shares, which are expected to be issued to Brookfield in October 2020. In addition, changes in interest rates on variable debt, and in the value of the Canadian dollar relative to the US dollar can affect the amount of interest expense incurred.
Liquidity and Capital Resources
We expect to maintain adequate available liquidity under our committed credit facilities. We currently have access to $1.7 billion in liquidity including $411 million in cash. Our continued focus will be toward repositioning our capital structure and we expect to be well positioned to address the upcoming debt maturity in 2020 and 2022. Refer to the Corporate Strategy and Financial Capital sections of this MD&A for further details.
Sustaining and Productivity Capital Expenditures
Our estimate for total sustaining and productivity capital is allocated among the following:
| | | | | | | | | | | | | | | | | | | | |
| Category | Description | Spent in 2018 | Spent in 2019 | Expected spend in 2020 | | |
Routine capital(1) | Capital required to maintain our existing generating capacity | 50 | | 50 | | 60 | | - | | 80 | |
| Planned major maintenance | Regularly scheduled major maintenance | 58 | | 68 | | 100 | | - | | 110 | |
| Mine capital | Capital related to mining equipment and land purchases | 42 | | 23 | | 10 | | - | | 10 | |
Total sustaining capital(2) | | 150 | | 141 | | 170 | | - | | 200 | |
Insurance recoveries of sustaining
capital expenditures | Insurance proceeds - 2019 relates to the tower fires at Wyoming Wind and Summerview | (7) | | (10) | | — | | - | | — | |
| Total sustaining capital | | 143 | | 131 | | 170 | | - | | 200 | |
| Productivity capital | Projects to improve power production efficiency and corporate improvement initiatives | 21 | | 9 | | 10 | | - | | 15 | |
| Total sustaining and productivity capital | | 164 | | 140 | | 180 | | - | | 215 | |
(1) Includes hydro life extension expenditures.
(2) On implementation of IFRS 16, we reclassified payments on finance leases out of sustaining capital and now show this spend as a separate line to calculate FCF and segmented cash flow. Refer to the Accounting Changes section of this MD&A for further details.
Significant planned major outages at TransAlta's operated units for 2020 include the following:
▪One outage for major maintenance at Sundance Unit 6 within our Canadian Coal segment during the third and fourth quarters of 2020. This work will be undertaken in parallel with the coal-to-gas conversion of this unit;
▪Distributed planned maintenance expenditures across the entire hydro fleet; and
▪Distributed expenditures across our wind fleet, focusing on planned component replacements.
There is also one major planned outage at one of our non-operated units in 2020:
▪An outage for major maintenance at Sheerness Unit 2 during the first quarter of 2020. This work will be undertaken in parallel with the coal-to-gas conversion of this unit.
Lost production as a result of planned major maintenance, excluding planned major maintenance for US Coal, which is scheduled during a period of dispatch optimization, is estimated as follows for 2020:
| | | | | | | | | | | |
| | Coal | Gas and
renewables | Total |
GWh lost | 700 - 800 | 450 - 500 | 1,150 - 1,300 |
TRANSALTA CORPORATION M48
Management’s Discussion and Analysis
Funding of Capital Expenditures
Funding for these planned capital expenditures is expected to be provided by cash flow from operating activities and existing liquidity. We have access to approximately $1.7 billion in liquidity, if required. The funds required for committed growth, sustaining capital and productivity projects are not expected to be significantly impacted by the current economic environment.
A significant portion of our sustaining and productivity capital is planned major maintenance, which includes inspection, repair and maintenance of existing components, and the replacement of existing components. Planned major maintenance costs are capitalized as part of PP&E and are amortized on a straight-line basis over the term until the next major maintenance event. It excludes amounts for day-to-day routine maintenance, unplanned maintenance activities and minor inspections and overhauls, which are expensed as incurred.
Competitive Forces
Supply and demand balances are the fundamental drivers of prices for electricity. Underlying economic growth is the main driver of longer-term changes in the demand for electricity, whereas system capacity, natural gas prices, GHG pricing, government subsidies and renewable resource availability are key drivers to the supply. Growth in behind-the-fence generation for mining investments is key to developing our Australian gas segment.
Renewable capacity addition has been strong for the past several years due to government incentives. New supply in the near term and intermediate term is expected to come primarily from investment in renewable electricity as well as natural-gas-fired generation. This expectation is driven by the low prices in the natural gas market combined with public policies that favour carbon emission reductions.
We have substantial merchant capacity in Alberta and the Pacific Northwest. In those regions, we enter into contracts and business relationships with commercial and industrial customers to sell power on a long-term basis, up to our available capacity in the markets. We further reduce the portion of production not sold in advance through short-term physical and financial contracts, and we optimize production in real time against our position and market conditions.
We also compete for long-term contracted opportunities in renewable and gas power generation, including cogeneration, across Canada, the US and Australia. Our target customers in this area are incumbent utility providers and large industrial and mining operators.
Alberta
Approximately 57 per cent of our gross installed capacity is located in Alberta and approximately 42 per cent of this is subject to legislated Alberta PPAs, which were put in place in 2001 to facilitate the transition from regulated generation to the current energy market in the province. The Sundance 1 and 2 Alberta PPAs expired at the end of 2017, the Sundance 3 to 6 PPAs were terminated effective March 31, 2018, and the Keephills 1 and 2, Sheerness and hydro PPAs will expire at the end of 2020. The Balancing Pool acts as buyer for the Keephills and Sheerness PPAs as a result of the terminations in 2016 by the original buyers.
In the third quarter of 2019, we announced our Clean Energy Investment Plan, which includes converting our existing Alberta coal assets to natural gas, which will position TransAlta's fleet as a low-cost generator in Alberta. See further details in the Corporate Strategy section of this MD&A.
Coal generation sold under certain Alberta PPAs retains some exposure to market prices as we pay penalties or receive payments for production below or above, respectively, targeted availability based upon a rolling 30-day average of spot prices. We can also retain proceeds from the sale of electricity and Ancillary Services in excess of obligations on our Hydro Alberta PPAs. We enter into financial contracts to reduce our exposure to variable power prices for a significant portion of our remaining generation.
Alberta's annual demand was flat from 2018 to 2019. The average pool price increased from $50.29/MWh in 2018 to $54.88/MWh in 2019. The majority of the pool price increase was due to higher settled prices during the first quarter of 2019. The higher prices also positively impacted our merchant wind and hydro portfolio.
TRANSALTA CORPORATION M49
Management’s Discussion and Analysis
Our market share of offer control in Alberta in 2019 was approximately 21 per cent (16 per cent if the Sundance mothballed units are excluded from offer control).
In late November 2016, we announced that we entered into an Off Coal Agreement with the Government of Alberta that provides transition payments for the cessation of coal-fired emissions from the Keephills 3, Genesee 3 and Sheerness coal-fired plants on or before Dec. 31, 2030. The affected plants are not, however, precluded from generating electricity at any time by any method other than the combustion of coal.
We expect additional compliance costs as a result of the Canadian federal government’s Greenhouse Gas Pollution Pricing Act, which sets a national price on GHG emissions and each province is expected to implement a GHG policy equivalent to a carbon price of $50 per tonne by 2022. We believe that our extensive portfolio of assets provides us with brownfield development opportunities in wind, solar, hydro and gas that give us a cost advantage over competitors when constructing generation facilities that use these fuel types.
Pursuant to the Electric Utilities Act (Alberta), the Balancing Pool announced the complete termination of the Sundance B and C PPAs, effective Mar. 31, 2018. As of Apr. 1, 2018, the Sundance plant has been operated as a merchant facility. There has been no announcement yet concerning the Keephills PPA. TransAlta continues to operate the Keephills PPA generating units in their ordinary course and receives the capacity and energy payments due to TransAlta under the PPAs.
US Pacific Northwest
Our capacity in the US Pacific Northwest is represented by our 1,340 MW Centralia coal plant. Half of the plant capacity is scheduled to retire at the end of 2020 and the other half at the end of 2025. System capacity in the region is primarily comprised of hydro and gas generation, with some wind additions over the last few years in response to government programs favouring renewable generation. Demand growth in the region has been limited and further constrained by an emphasis on energy efficiency.
Our competitiveness is enhanced by our long-term contract with Puget Sound Energy for up to 380 MW over the remaining life of the facility. The contract and our hedges allow us to satisfy power requirements from the market during low-priced periods.
We maintain the right to redevelop Centralia as a gas plant after coal capacity retires, with an opportunity for expedited permitting provided for in our agreement for coal transition established with the State of Washington in 2011.
Contracted Gas and Renewables
The market for developing or acquiring gas and renewable generation facilities is highly competitive in all markets in which we operate. Our solid record as operator and developer supports our competitive position. We expect, where possible, to reduce our cost of capital and improve our competitive profile by using project financing and leveraging the lower cost of capital with TransAlta Renewables. In the US, our substantial tax attributes further increase our competitiveness.
While depressed commodity prices have reduced sectoral growth in the oil, gas and mining industries, the change is also creating opportunities for us as a service provider as some of our potential customers are more carefully evaluating non-core activities and driving for operational efficiencies. In renewables, we are primarily evaluating greenfield opportunities in Western Canada and the US along with acquisitions in markets in which we have existing operations. We maintain highly qualified and experienced development teams to identify and develop these opportunities. In co-generation, we are working with customers to evaluate behind-the-fence solutions.
Some of our older gas plants are now reaching the end of their original contract life. The plants generally have a substantial cost advantage over new builds and we have been able to add value by recontracting these plants with limited life extending capital expenditures. We have recently extended the life of our Ottawa (2033 expiry), Windsor (2031 expiry), Parkeston (2026 expiry) and Fort Saskatchewan (2030 expiry) plants in this manner.
TRANSALTA CORPORATION M50
Management’s Discussion and Analysis
Power-Generating Portfolio Capital
We monitor availability closely as a key metric to achieving our financial targets. We adjust our maintenance and sustaining capital expenditures to optimize financial returns on our investments and to align with our strategic intentions.
Availability and Production
Our availability target for our Canadian Coal fleet was 87 to 89 per cent for 2019. We achieved 89 per cent (2018 - 93 per cent, 2017 - 82 per cent) availability in Canadian Coal. Our availability target for our other generating assets (gas and renewables) was in the range of 92 to 96 per cent in 2019. Both Canadian Gas and Wind and Solar achieved the higher end of this range. Canadian Gas achieved 95 per cent (2018 - 93 per cent, 2017 - 92 per cent) and Wind and Solar achieved 95 per cent (2018 - 95 per cent, 2017 - 96 per cent). As a result of unplanned outages, Australian Gas achieved 91 per cent (2018 - 94 per cent, 2017 - 93 per cent), slightly less than the target.
Our availability for the entire fleet in 2019, after adjusting for dispatch optimization at US Coal, was 90 per cent (2018 - 91 per cent, 2017 - 87 per cent) and was slightly lower than last year. Higher planned outages at Canadian Coal, forced outages and derates at US Coal and unplanned outages at Australian Gas, were partially offset by lower planned outages at Canadian Gas.
Production for the year ended Dec. 31, 2019, increased 662 GWh compared to 2018. The increase was mainly at US Coal where production increased 1,787 GWh due to higher merchant pricing in the first half of 2019 and timing of dispatch optimization. This was partially offset by Canadian Coal where production decreased 1,381 GWh primarily due to the mothballing and retirement of certain Sundance units as well as planned outages, partially offset by lower unplanned outages.
Sustaining Capital
We are in a long-cycle, capital-intensive business that requires significant capital expenditures. Our goal is to undertake sustaining capital that ensures our facilities operate reliably and safely over a long period of time.
| | | | | | | | | | | |
| Year ended Dec. 31 | 2019 | 2018 | 2017 |
| Routine capital | 50 | | 50 | | 69 | |
| Mine capital | 23 | | 42 | | 28 | |
| Planned major maintenance | 68 | | 58 | | 121 | |
Total sustaining capital expenditures(1) | 141 | | 150 | | 218 | |
| Productivity capital | 9 | | 21 | | 24 | |
Total sustaining and productivity capital expenditures(1) | 150 | | 171 | | 242 | |
| Insurance recoveries of sustaining capital expenditures | (10) | | (7) | | — | |
| Net amount | 140 | | 164 | | 242 | |
(1) On implementation of IFRS 16, we reclassified payments on finance leases out of sustaining capital and now show this spend as a separate line to calculate FCF and segmented cash flow. See the Accounting Changes section of this MD&A for further details.
Lost production as a result of planned major maintenance is as follows:
| | | | | | | | | | | |
| Year ended Dec. 31 | 2019 | 2018 | 2017 |
GWh lost(1) | 935 | | 381 | | 1,234 | |
(1) Lost production excludes periods of planned major maintenance at US Coal, which occur during periods of dispatch optimization.
TRANSALTA CORPORATION M51
Management’s Discussion and Analysis
Total sustaining capital expenditures were $9 million lower compared to 2018 and total productivity capital was $12 million lower in 2019 compared to 2018. The productivity capital expenditures relate to the funding of some Greenlight transformation initiatives. Refer to the Corporate Strategy section of this MD&A for further details on our Greenlight program. In certain cases, payback is expected to be achieved within three years. We also completed planned major outages at Keephills Unit 1, Sundance Unit 4 and Sarnia.
Other Consolidated Analysis
Asset Impairment Charges and Reversals
As part of the Corporation’s monitoring controls, long-range forecasts are prepared for each cash-generating unit ("CGU"). The long-range forecast estimates are used to assess the significance of potential indicators of impairment and provide criteria to evaluate adverse changes in operations. The Corporation also considers the relationship between our market capitalization and our book value, among other factors, when reviewing for indicators of impairment. When indicators of impairment are present, the Corporation estimates a recoverable amount for each CGU by calculating an approximate fair value less costs of disposal using discounted cash flow projections based on the Corporation’s long-range forecasts. The valuations used are subject to measurement uncertainty based on assumptions and inputs to the Corporation’s long-range forecast, including changes to fuel costs, operating costs, capital expenditures, external power prices and useful lives of the assets extending to the last planned asset retirement in 2073.
2019
Centralia Plant
In 2012, the Corporation recorded an impairment of $347 million relating to the Centralia Plant CGU. As part of the annual impairment test, the Corporation considers possible indicators of impairment at the Centralia Plant CGU. In 2019, an internal valuation indicated the fair value less costs of disposal of the Centralia Plant CGU exceeded the carrying value, resulting in a full recoverability test in 2019. The updated fair value included sustained changes in the power price market and cost of coal due to contract renegotiations. As a result of the recoverability test an impairment reversal of $151 million was recorded in the US Coal segment.
The valuations are categorized as Level III fair value measurements and subject to measurement uncertainty based on the key assumptions outlined below, and on inputs to the Corporation’s long-range forecast, including changes to fuel costs, operating costs, capital expenses and the level of contractedness under the Memorandum of Agreement for coal transition established with the State of Washington. The valuation period includes cash flows until the decommissioning of the plant in 2025.
The Corporation utilized the Corporation's long-range forecast and the following key assumptions in 2019 compared with 2016 assumptions, which was the most recent detailed valuation:
| | | | | | | | |
| 2019 | 2016 |
| Mid-Columbia annual average power prices | US$30 to US$42 per MWh | US$22 to US$46 per MWh |
| On-highway diesel fuel on coal shipments | US$2.35 to US$2.40 per gallon | US$1.69 to US$2.09 per gallon |
| Discount rates | 5.2 to 6.4 per cent | 5.4 to 5.7 per cent |
During 2019, the Corporation adjusted the Centralia mine decommissioning and restoration provision as management no longer believes that the fine coal recovery and reclamation work will occur as originally proposed. The Corporation's current best estimate of the decommissioning and restoration provision increased by $141 million. Since the Centralia mine is no longer operating and reached the end of its useful life in 2006, this adjustment results in the immediate recognition of the full $141 million, through asset impairment charges in net earnings. Refer to Note 3 and 22 of the consolidated financial statements for further details.
Assets Held for Sale
In the fourth quarter of 2019, the Corporation identified several trucks and associated inventory to be sold within the Canadian Coal segment and accordingly wrote the assets down to net realizable value, resulting in an impairment charge of $15 million.
TRANSALTA CORPORATION M52
Management’s Discussion and Analysis
2018
Sundance Unit 2
In the third quarter of 2018, the Corporation recognized an impairment charge on Sundance Unit 2 in the amount of $38 million, due to the Corporation’s decision to retire Sundance Unit 2. Previously, the Corporation had expected Sundance Unit 2 to remain mothballed for a period of up to two years and therefore remain within the Alberta Merchant CGU. The impairment assessment was based on value in use and included the estimated future cash flows expected to be derived from the unit until its retirement on July 31, 2018. Discounting did not have a material impact.
Lakeswind and Kent Breeze
On May 31, 2018, TransAlta Renewables acquired an economic interest in Lakeswind through the subscription of tracking preferred shares of a subsidiary of the Corporation and also purchased Kent Breeze. In connection with these acquisitions, the assets were fair valued using discount rates that average approximately seven per cent. Accordingly, the Corporation has recorded an impairment charge of $12 million using the valuation in the agreement as the indicator of fair value less cost of disposal in 2018. The impairment charge had an $11 million impact on PP&E and a $1 million impact on intangible assets.
2017
Sundance Unit 1
In the second quarter of 2017, the Corporation recognized an impairment charge on Sundance Unit 1 in the amount of $20 million, due to the Corporation’s decision to early retire Sundance Unit 1. Previously, the Corporation had expected Sundance Unit 1 to operate in the merchant market in 2018 and 2019 and therefore remain within the Alberta Merchant CGU. The impairment assessment was based on value in use and included the estimated future cash flows expected to be derived from the unit until its retirement on Jan. 1, 2018. Discounting did not have a material impact.
No separate stand-alone impairment test was required for Sundance Unit 2, as mothballing the unit maintained the Corporation’s flexibility to operate the unit as part of the Corporation’s Alberta Merchant CGU to 2021.
Project Development Costs
During 2019, the Corporation wrote off $18 million (2018 - $23 million) in project development costs related to projects that are no longer proceeding.
Unconsolidated Structured Entities or Arrangements
Disclosure is required of all unconsolidated structured entities or arrangements such as transactions, agreements or contractual arrangements with unconsolidated entities, structured finance entities, special purpose entities or variable interest entities that are reasonably likely to materially affect liquidity or the availability of, or requirements for, capital resources. We currently have no such unconsolidated structured entities or arrangements.
Guarantee Contracts
We have obligations to issue letters of credit and cash collateral to secure potential liabilities to certain parties, including those related to potential environmental obligations, commodity risk management and hedging activities, pension plan obligations, construction projects and purchase obligations. At Dec. 31, 2019, we provided letters of credit totalling $690 million (2018 - $720 million) and cash collateral of $42 million (2018 - $105 million). These letters of credit and cash collateral secure certain amounts included on our Consolidated Statements of Financial Position under risk management liabilities, defined benefit obligation and other long-term liabilities and decommissioning and other provisions.
TRANSALTA CORPORATION M53
Management’s Discussion and Analysis
Commitments
Contractual commitments are as follows:
| | | | | | | | | | | | | | | | | | | | | | | |
| | 2020 | 2021 | 2022 | 2023 | 2024 | 2025 and thereafter | Total |
| Natural gas, transportation and other contracts | 125 | | 125 | | 120 | | 128 | | 131 | | 1,493 | | 2,122 | |
| Transmission | 9 | | 5 | | 4 | | 3 | | — | | — | | 21 | |
Coal supply and mining agreements(1) | 147 | | 16 | | 16 | | 16 | | 8 | | 14 | | 217 | |
| Long-term service agreements | 50 | | 22 | | 32 | | 17 | | 15 | | 14 | | 150 | |
Non-cancellable operating leases(2) | 4 | | 2 | | 2 | | 2 | | 3 | | 64 | | 77 | |
Long-term debt(3) | 494 | | 98 | | 625 | | 372 | | 105 | | 1,410 | | 3,104 | |
Exchangeable securities(4) | — | | — | | — | | — | | — | | 350 | | 350 | |
| Principal payments on lease obligations | 19 | | 14 | | 9 | | 6 | | 4 | | 90 | | 142 | |
Interest on long-term debt and lease obligations(5,6) | 161 | | 138 | | 128 | | 98 | | 87 | | 671 | | 1,283 | |
Interest on exchangeable securities(4,6) | 25 | | 25 | | 25 | | 24 | | 24 | | — | | 123 | |
| Growth | 535 | | 254 | | 196 | | 270 | | 13 | | — | | 1,268 | |
| TransAlta Energy Transition Bill | 6 | | 6 | | 6 | | 6 | | — | | — | | 24 | |
| Total | 1,575 | | 705 | | 1,163 | | 942 | | 390 | | 4,106 | | 8,881 | |
(1) Commitments related to Sheerness may be impacted by the cessation of coal-fired emissions on or before Dec. 31, 2030.
(2) Includes leases that have not yet commenced.
(3) Excludes impact of derivatives.
(4) Assumes the exchangeable debentures will be exchanged by Brookfield on Jan. 1, 2025. Refer to the Significant and Subsequent Events section of this MD&A for further details.
(5) Interest on long-term debt is based on debt currently in place with no assumption as to refinancing on maturity.
(6) Not recognized as a financial liability on the Consolidated Statements of Financial Position.
As part of the TransAlta Energy Transition Bill signed into law in the State of Washington and the subsequent Memorandum of Agreement ("MoA"), we have committed to fund US$55 million in total over the remaining life of the Centralia plant to support economic and community development, promote energy efficiency and develop energy technologies related to the improvement of the environment. The MoA contains certain provisions for termination and in the event of the termination and certain circumstances, this funding or part thereof would no longer be required. At Dec. 31, 2019, the Corporation has funded approximately US$37 million of the commitment.
Contingencies
Line Loss Rule Proceeding
The Corporation has been participating in a line loss rule proceeding before the Alberta Utilities Commission. The AUC determined that it has the ability to retroactively adjust line loss charges going back to 2006 and directed the AESO to recalculate loss factors for 2006 to 2016 and issue a single invoice charging or crediting market participants for the difference in losses charges. A more recent decision by the AUC determined the methodology to be used retroactively, which made it possible for the Corporation to estimate the total retroactive potential exposure faced by the Corporation for its non-PPA power generation. The single invoice for the historical adjustments was to be issued in April 2021, with cash settlement expected in June 2021. The current total estimate of exposure based on known data is approximately $12 million. However, the AESO recently requested the AUC approve a pay-as-you-go settlement, instead of issuing a single invoice. This form of settlement would permit the AESO to issue an invoice for each historical year as the line loss factors are recalculated, resulting in invoices being issued as early as April 2020 for settlement in June 2020, a year earlier than anticipated. The Corporation is challenging this request.
FMG Disputes
The Corporation is currently engaged in two disputes with FMG. The first dispute arose as a result of FMG’s attempted termination of the South Hedland PPA on the basis that the conditions to establishing commercial operation under the South Hedland PPA had not been met. TransAlta's view is that all conditions to establishing commercial operation under the terms of the South Hedland PPA had been satisfied in full. TransAlta initiated legal action against FMG, seeking payment of amounts invoiced and not paid under the South Hedland PPA, as well as a declaration that the PPA is valid and in force. FMG, on the other hand, seeks a declaration that the PPA was lawfully terminated. This matter is scheduled to proceed to trial beginning June 15, 2020.
The second dispute involves FMG’s claims against TransAlta related to the transfer of the Solomon facility to FMG. FMG claims certain amounts related to the condition of the facility while TransAlta claims certain outstanding costs that should be reimbursed. A trial date for this matter has not yet been scheduled but it will likely not occur until 2021.
TRANSALTA CORPORATION M54
Management’s Discussion and Analysis
Mangrove Claim
On Apr. 23, 2019, Mangrove commenced an action in the Ontario Superior Court of Justice, naming the Corporation, the incumbent members of the Board of Directors of TransAlta on such date, and Brookfield BRP Holdings (Canada), as defendants. Mangrove is alleging, among other things, oppression by the Corporation and the named directors and is seeking to set aside the 2019 Brookfield Investment. TransAlta believes the claim is wholly lacking in merit and is taking all steps to defend against the allegations. This matter is scheduled to proceed to trial beginning Sept. 14, 2020.
Keephills 1 Superheater
Keephills Unit 1 was taken offline from Mar. 17, 2015 to May 17, 2015 as a result of a large leak in the secondary superheater. TransAlta claimed force majeure under the PPA. ENMAX Energy Corporation, the purchaser under the PPA at the time, did not dispute the force majeure but the Balancing Pool is attempting to do so, seeking to recover $12 million in capacity payment charges it paid to TransAlta while the unit was offline. TransAlta denied the Balancing Pool had the right to do so. The Alberta Court of Queen’s Bench confirmed the Balancing Pool has a right under the PPA to commence an arbitration, independent of the PPA buyer. On Sept. 4, 2019, the Alberta Court of Appeal upheld the lower court’s decision. TransAlta sought permission to appeal the Alberta Court of Appeal’s decision to the Supreme Court of Canada. The application was denied and the matter will now proceed to arbitration, with a hearing potentially sometime in 2020.
Sundance A Decommissioning
TransAlta filed an application with the AUC seeking payment from the Balancing Pool for TransAlta’s decommissioning costs for Sundance A, including its proportionate share of the mine. The Balancing Pool filed a statement of intent to participate as an intervener because it disagrees that, amongst other things, the mine decommissioning costs should be included. TransAlta anticipates it will receive payment from the Balancing Pool in 2020 for its decommissioning costs; however, the amount is uncertain.
Hydro PPA Renewable Energy Credits
The Balancing Pool claims to be entitled to emissions performance credits ("EPCs"), valued at approximately $27 million, earned by the Hydro plants under the Carbon Competitiveness Incentive Regulation ("CCIR") in 2018 and 2019. The dispute is based on the ownership of the EPCs as a result of a change in law provision under the Hydro PPA and that TransAlta is benefiting from the purported change in law. TransAlta has not received any benefit from the EPCs and has not recognized any benefit from the EPCs within its financial statements. TransAlta believes that the Balancing Pool has no rights to these credits. We anticipate this dispute will be resolved by the end of 2021.
Direct Assigned Capital Deferral Account Application
AltaLink Management Ltd. ("AltaLink") filed an application before the AUC to recover its 2016-2018 direct assigned capital deferral account for the Edmonton region: 240 kV line upgrades project (the "Proceeding"). TransAlta is a secondary applicant in the Proceeding. Altalink and TransAlta seek to have their costs approved by the AUC as reasonable and prudent. The Enoch Cree Nation ("ECN") and the Consumers Coalition of Alberta are registered participants in the Proceeding. Currently Altalink, ECN and TransAlta’s interests are closely aligned. TransAlta believes it has a reasonable chance of having its costs (estimated at about $21 million) approved.
Critical Accounting Policies and Estimates
The selection and application of accounting policies is an important process that has developed as our business activities have evolved and as accounting rules and guidance have changed. Accounting rules generally do not involve a selection among alternatives, but involve an implementation and interpretation of existing rules and the use of judgment relative to the circumstances existing in the business. Every effort is made to comply with all applicable rules on or before the effective date, and we believe the proper implementation and consistent application of accounting rules is critical.
However, not all situations are specifically addressed in the accounting literature. In these cases, our best judgment is used to adopt a policy for accounting for these situations. We draw analogies to similar situations and the accounting guidelines governing them, consider foreign accounting standards and consult with our independent auditors about the appropriate interpretation and application of these policies. Each of the critical accounting policies involves complex situations and a high degree of judgment either in the application and interpretation of existing literature or in the development of estimates that impact our consolidated financial statements.
Our significant accounting policies are described in Note 2 of the consolidated financial statements. The most critical of these policies are those related to revenue recognition, financial instruments, valuation of PP&E and associated contracts, project development costs, useful life of PP&E, valuation of goodwill, leases, income taxes, employee future benefits, decommissioning and restoration provisions, other provisions and joint arrangements. Each policy involves a
TRANSALTA CORPORATION M55
Management’s Discussion and Analysis
number of estimates and assumptions to be made about matters that are uncertain at the time the estimate is made. Different estimates, with respect to key variables used for the calculations, or changes to estimates, could potentially have a material impact on our financial position or results of operations.
We have discussed the development and selection of these critical accounting estimates with our Audit, Finance and Risk Committee ("AFRC") and our independent auditors. The AFRC has reviewed and approved our disclosure relating to critical accounting estimates in this MD&A. These critical accounting estimates are described as follows:
Revenue Recognition
Revenue from Contracts with Customers
In 2018, the Corporation adopted IFRS 15 Revenue from Contracts with Customers ("IFRS 15"). Comparative information prior to 2018 was not restated and is reported under IAS 18 Revenue. The Corporation's accounting policies for the current and prior periods for revenue recognition are outlined in Note 2 of the consolidated financial statements. The significant judgments and estimates have been highlighted below.
The majority of our revenues from contracts with customers are derived from the sale of generation capacity, electricity, thermal energy, environmental attributes and byproducts of power generation. The Corporation evaluates whether the contracts it enters into meet the definition of a contract with a customer at the inception of the contract and on an ongoing basis if there is an indication of significant changes in facts and circumstances. Revenue is measured based on the transaction price specified in a contract with a customer. Revenue is recognized when control of the good or services is transferred to the customer. For certain contracts, revenue may be recognized at the invoiced amount, as permitted using the invoice practical expedient, if such amount corresponds directly with the Corporation’s performance to date. The Corporation excludes amounts collected on behalf of third parties from revenue.
Identification of Performance Obligations
Each promised good or service is accounted for separately as a performance obligation if it is distinct. The Corporation’s contracts may contain more than one performance obligation. Where contracts contain multiple promises for goods or services, management exercises judgment in determining whether goods or services constitute distinct goods or services or a series of distinct goods or services that are substantially the same and that have the same pattern of transfer to the customer. The determination of a performance obligation affects whether the transaction price is recognized at a point in time or over time. Management considers both the mechanics of the contract and the economic and operating environment of the contract in determining whether the goods or services in a contract are distinct.
Transaction Price
The Corporation allocates the transaction price in the contract to each performance obligation. Transaction price allocated to performance obligations may include variable consideration. Variable consideration is included in the transaction price for each performance obligation when it is highly probable that a significant reversal of the cumulative variable revenue will not occur. Variable consideration is assessed at each reporting period to determine whether the constraint is lifted. The consideration contained in some of the Corporation's contracts with customers is primarily variable, and may include both variability in quantity and pricing, such as: revenues can be dependent upon future production volumes that are driven by customer or market demand or by the operational ability of the plant; revenues can be dependent upon the variable cost of producing the energy; revenues can be dependent upon market prices; and revenues can be subject to various indices and escalators.
In determining the transaction price and estimates of variable consideration, management considers past history of customer usage and capacity requirements, in estimating the goods and services to be provided to the customer. The Corporation also considers the historical production levels and operating conditions for its variable generating assets.
Allocation of Transaction Price to Performance Obligations
When multiple performance obligations are present in a contract, transaction price is allocated to each performance obligation in an amount that depicts the consideration the Corporation expects to be entitled to in exchange for transferring the good or service.
The Corporation’s contracts generally outline a specific amount to be invoiced to a customer associated with each performance obligation in the contract. Where contracts do not specify amounts for individual performance obligations, the Corporation estimates the amount of the transaction price to allocate to individual performance obligations based on their standalone selling price, which is primarily estimated based on the amounts that would be charged to customers under similar market conditions.
TRANSALTA CORPORATION M56
Management’s Discussion and Analysis
Satisfaction of Performance Obligations
The satisfaction of performance obligations requires management to use judgment as to when control of the underlying good or service transfers to the customer. Determining when a performance obligation is satisfied affects the timing of revenue recognition. Management considers both customer acceptance of the good or service, and the impact of laws and regulations such as certification requirements, in determining when this transfer occurs. Management also applies judgment in determining whether the invoice practical expedient permits recognition of revenue at the invoiced amount, if that invoiced amount corresponds directly with the entity's performance to date.
The Corporation recognizes a significant financing component where the timing of payment from the customer differs from the Corporation’s performance under the contract and where that difference is the result of the Corporation financing the transfer of goods and services.
Revenue from Other Sources
Lease Revenue
In certain situations, a long-term electricity or thermal sales contract may contain, or be considered, a lease. Revenues associated with non-lease elements are recognized as goods or services revenues as outlined above. Where the terms and conditions of the contract result in the customer assuming the principal risks and rewards of ownership of the underlying asset, the contractual arrangement is considered a finance lease, which results in the recognition of finance lease income. Where we retain the principal risks and rewards, the contractual arrangement is an operating lease. Rental income, including contingent rents where applicable, is recognized over the term of the contract.
Revenue from Derivatives
Commodity risk management activities involve the use of derivatives such as physical and financial swaps, forward sales contracts, futures contracts, and options, which are used to earn revenues and to gain market information. These derivatives are accounted for using fair value accounting. The initial recognition and subsequent changes in fair value affect reported net earnings in the period the change occurs and are presented on a net basis in revenue. The fair values of instruments that remain open at the end of the reporting period represent unrealized gains or losses and are presented on the Consolidated Statements of Financial Position as risk management assets or liabilities.
The determination of the fair value of commodity risk management contracts and derivative instruments is complex and relies on judgments concerning future prices, volatility and liquidity, among other factors. Some of our derivatives are not traded on an active exchange or extend beyond the time period for which exchange-based quotes are available, requiring us to use internal valuation techniques or models described below.
Financial Instruments
The fair value of a financial instrument is the price that would be received to sell an asset or paid to transfer a liability in an orderly transaction between market participants at the measurement date. Fair values can be determined by reference to prices for instruments in active markets to which we have access. In the absence of an active market, we determine fair values based on valuation models or by reference to other similar products in active markets.
Fair values determined using valuation models require the use of assumptions. In determining those assumptions, we look primarily to external readily observable market inputs. However, if not available, we use inputs that are not based on observable market data.
Level Determinations and Classifications
The Level I, II and III classifications in the fair value hierarchy utilized by the Corporation are defined below. The fair value measurement of a financial instrument is included in only one of the three levels, the determination of which is based on the lowest level input that is significant to the derivation of the fair value.
Level I
Fair values are determined using inputs that are quoted prices (unadjusted) in active markets for identical assets or liabilities that we have the ability to access at the measurement date. In determining Level I fair values, we use quoted prices for identically traded commodities obtained from active exchanges such as the New York Mercantile Exchange.
TRANSALTA CORPORATION M57
Management’s Discussion and Analysis
Level II
Fair values are determined, directly or indirectly, using inputs that are observable for the asset or liability.
Fair values falling within the Level II category are determined through the use of quoted prices in active markets, which in some cases are adjusted for factors specific to the asset or liability, such as basis, credit valuation and location differentials. Our commodity risk management Level II financial instruments include over-the-counter derivatives with values based on observable commodity futures curves and derivatives with inputs validated by broker quotes or other publicly available market data providers. Level II fair values are also determined using valuation techniques, such as option pricing models and interpolation formulas, where the inputs are readily observable.
In determining Level II fair values of other risk management assets and liabilities, we use observable inputs other than unadjusted quoted prices that are observable for the asset or liability, such as interest rate yield curves and currency rates. For certain financial instruments where insufficient trading volume or lack of recent trades exists, we rely on similar interest or currency rate inputs and other third-party information such as credit spreads.
Level III
Fair values are determined using inputs for the asset or liability that are not readily observable.
We may enter into commodity transactions for which market-observable data is not available. In these cases, Level III fair values are determined using valuation techniques such as mark-to-forecast and mark-to-model. For mark-to-model valuations, derivative pricing models, regression-based models and historical bootstrap models may be employed. The model inputs may be based on historical data such as unit availability, transmission congestion, demand profiles for individual non-standard deals and structured products, and/or volatilities and correlations between products derived from historical price relationships. We also have various contracts with terms that extend beyond a liquid trading period. As forward market prices are not available for the full period of these contracts, the value of these contracts is derived by reference to a forecast that is based on a combination of external and internal fundamental modelling, including discounting. As a result, these contracts are classified in Level III.
Our Commodity Exposure Management Policy governs both the commodity transactions undertaken in our proprietary trading business and those undertaken to manage commodity price exposures in our generation business. This Policy defines and specifies the controls and management responsibilities associated with commodity trading activities, as well as the nature and frequency of required reporting of such activities.
Methodologies and procedures regarding commodity risk management Level III fair value measurements are determined by our risk management department. Level III fair values are calculated within our energy trading risk management system based on underlying contractual data as well as observable and non-observable inputs. Development of non-observable inputs requires the use of judgment. To ensure reasonability, system-generated Level III fair value measurements are reviewed and validated by the risk management and finance departments. Review occurs formally on a quarterly basis or more frequently if daily review and monitoring procedures identify unexpected changes to fair value or changes to key parameters.
The effect of using reasonably possible alternative assumptions as inputs to valuation techniques for contracts included in the Level III fair value measurements at Dec. 31, 2019, is an estimated total upside of $79 million (2018 - $149 million upside) and total downside of $172 million (2018 - $149 million) impact to the carrying value of the financial instruments. Fair values are stressed for volumes and prices. The amount of $46 million upside (2018 - $116 million upside) and $139 million downside (2018 - $116 million downside) in the stress values stems from a long-dated power sale contract in the Pacific Northwest that is designated as a cash flow hedge utilizing assumed power prices ranging from US$20-US$28 (Dec. 31, 2018 - US$20-US$35) for the period from 2020 to 2025, while the remaining amounts account for the rest of the portfolio. The variable volumes are stressed up and down one standard deviation from historically available production data. Prices are stressed for longer-term deals where there are no liquid market quotes using various internal and external forecasting sources to establish a high and a low price range.
In addition to the Level III fair value measurements discussed above, the Brookfield Investment Agreement allows Brookfield the option to exchange all of the outstanding exchangeable securities into an equity ownership interest of up to a maximum of 49 per cent in an entity formed to hold TransAlta’s Alberta Hydro Assets after Dec. 31, 2024. The fair value of the option to exchange is considered a Level III fair value measurement, with an estimated upside of $35 million and downside of $27 million potential impact to the carrying value of nil as at Dec. 31, 2019. The sensitivity analysis has been prepared using the Corporation’s assessment that a change in the implied discount rate of the future cash flow of 1 per cent is a reasonably possible change.
TRANSALTA CORPORATION M58
Management’s Discussion and Analysis
Valuation of PP&E and Associated Contracts
At the end of each reporting period, we assess whether there is any indication that PP&E and finite life intangible assets are impaired or whether a previously recognized impairment may no longer exist or may have decreased. Impairment exists when the carrying amount of the asset or CGU to which it belongs exceeds its recoverable amount, which is the higher of fair value less costs of disposal and value in use.
Factors that could indicate that an impairment exists include: significant underperformance relative to historical or projected operating results; significant changes in the manner in which an asset is used or in our overall business strategy; or significant negative industry or economic trends. In some cases, these events are clear. However, in many cases, a clearly identifiable event indicating possible impairment does not occur. Instead, a series of individually insignificant events occur over a period of time leading to an indication that an asset may be impaired. This can be further complicated in situations where we are not the operator of the facility. Events can occur in these situations that may not be known until a date subsequent to their occurrence.
Our operations, the market and business environment are routinely monitored, and judgments and assessments are made to determine whether an event has occurred that indicates a possible impairment. If such an event has occurred, an estimate is made of the recoverable amount of the asset or CGU to which the asset belongs. The recoverable amount is the higher of an asset’s fair value less costs of disposal and its value in use. Fair value is the price that would be received to sell an asset in an orderly transaction between market participants at the measurement date. In determining fair value less costs of disposal, information about third-party transactions for similar assets is used and if none is available, other valuation techniques, such as discounted cash flows, are used. Value in use is computed using the present value of management’s best estimates of future cash flows based on the current use and present condition of the asset. In estimating either fair value less costs of disposal or value in use using discounted cash flow methods, estimates and assumptions must be made about sales prices, cost of sales, production, fuel consumed, capital expenditures, retirement costs and other related cash inflows and outflows over the life of the facilities, which can range from 30 to 60 years. In developing these assumptions, management uses estimates of contracted and future market prices based on expected market supply and demand in the region in which the plant operates, anticipated production levels, planned and unplanned outages, changes to regulations and transmission capacity or constraints for the remaining life of the facilities.
Discount rates are determined by employing a weighted average cost of capital methodology that is based on capital structure, cost of equity and cost of debt assumptions based on comparable companies with similar risk characteristics and market data as the asset, CGU or group of CGUs subject to the test. These estimates and assumptions are susceptible to change from period to period and actual results can, and often do, differ from the estimates, and can have either a positive or negative impact on the estimate of the impairment charge, and may be material.
The impairment outcome can also be impacted by the determination of CGUs or groups of CGUs for asset and goodwill impairment testing. A CGU is the smallest identifiable group of assets that generates cash inflows that are largely independent of the cash inflows from other assets or groups of assets, and goodwill is allocated to each CGU or group of CGUs that is expected to benefit from the synergies of the acquisition from which the goodwill arose. The allocation of goodwill is reassessed upon changes in the composition of segments, CGUs or groups of CGUs. In respect of determining CGUs, significant judgment is required to determine what constitutes independent cash flows between power plants that are connected to the same system. We evaluate the market design, transmission constraints and the contractual profile of each facility, as well as our commodity price risk management plans and practices, in order to inform this determination. With regard to the allocation or reallocation of goodwill, significant judgment is required to evaluate synergies and their impacts. Minimum thresholds also exist with respect to segmentation and internal monitoring activities. We evaluate synergies with regard to opportunities from combined talent and technology, functional organization and future growth potential, and we consider our own performance measurement processes in making this determination. No changes arose in our CGUs in 2019.
Impairment charges can be reversed in future periods if circumstances improve. No assurances can be given if any reversal will occur or the amount or timing of any such reversal. As a result of our review in 2019 and other specific events, various analyses were completed to assess the significance of possible impairment indicators. Refer to the Other Consolidated Analysis section of this MD&A for further details.
TRANSALTA CORPORATION M59
Management’s Discussion and Analysis
Project Development Costs
Project development costs include external, direct and incremental costs that are necessary for completing an acquisition or construction project. These costs are recognized in operating expenses until construction of a plant or acquisition of an investment is likely to occur, there is reason to believe that future costs are recoverable, and that efforts will result in future value to us, at which time the costs incurred subsequently are included in PP&E or other assets. The appropriateness of capitalization of these costs is evaluated each reporting period, and amounts capitalized for projects no longer probable of occurring are charged to net earnings.
Useful Life of PP&E
Each significant component of an item of PP&E is depreciated over its estimated useful life. A component is a tangible asset that can be separately identified as an asset and is expected to provide a benefit of greater than one year. Estimated useful lives are determined based on current facts and past experience, and take into consideration the anticipated physical life of the asset, existing long-term sales agreements and contracts, current and forecasted demand, the potential for technological obsolescence and regulations. The useful lives of PP&E and depreciation rates used are reviewed at least annually to ensure they continue to be appropriate.
In 2019, total depreciation and amortization expense was $709 million (2018 - $710 million, 2017 - $708 million), of which $119 million (2018 - $136 million, 2017 - $73 million) relates to mining equipment and is included in fuel, carbon compliance and purchased power.
As a result of the Clean Energy Investment Plan described in the Corporate Strategy section of this MD&A, we will convert our existing Alberta coal assets to natural gas and therefore the useful lives of the PP&E and amortizable intangibles associated with some of our Alberta coal assets were updated to reflect these changes. For certain Wind and Solar PP&E we identified additional components for parts with shorter useful lives than originally estimated and revised the useful lives accordingly. See the Accounting Changes section of this MD&A for further details.
Valuation of Goodwill
We evaluate goodwill for impairment at least annually, or more frequently if indicators of impairment exist. If the carrying amount of a CGU or group of CGUs, including goodwill, exceeds the unit’s fair value, the excess represents a goodwill impairment loss.
For purposes of the 2019, 2018 and 2017 annual goodwill impairment reviews, the Corporation determined the recoverable amounts of the CGUs by calculating the fair value less costs of disposal using discounted cash flow projections based on the Corporation’s long-range forecasts for the period extending to the last planned asset retirement in 2073. The resulting fair value measurement is categorized within Level III of the fair value hierarchy.
We reviewed the carrying amount of goodwill prior to year-end and determined that the fair values of the related CGUs or groups of CGUs to which goodwill relates, based on estimates of future cash flows, exceeded their carrying amounts, and no goodwill impairments existed.
Determining the fair value of the CGUs or group of CGUs is susceptible to changes from period to period as management is required to make assumptions about future cash flows, production and trading volumes, margins, and fuel and operating costs. No reasonably possible change in the assumptions would have resulted in an impairment of goodwill.
Leases
In determining whether our contracts contain, or are, leases, management must use judgment in assessing whether the contract provides the customer with the right to substantially all of the economic benefits from the use of the asset during the lease term and whether the customer obtains the right to direct the use of the asset during the lease term. For those agreements considered to contain, or be, leases, further judgment is required to determine the lease term by assessing whether termination or extension options are reasonably certain to be exercised. Judgment is also applied in identifying in-substance fixed payments (included) and variable payments that are based on usage or performance factors (excluded) and in identifying lease and non-lease components (services that the supplier performs) of contracts and in allocating contract payments to lease and non-lease components.
TRANSALTA CORPORATION M60
Management’s Discussion and Analysis
For leases where we are a lessor, judgment is required to determine if substantially all of the significant risks and rewards of ownership are transferred to the customer or remain with us, to appropriately account for the agreement as either a finance or operating lease. These judgments can be significant and impact how we classify amounts related to the arrangement as either PP&E or as a finance lease receivable on the Consolidated Statements of Financial Position, and therefore the amount of certain items of revenue and expense are dependent upon such classifications.
Income Taxes
In accordance with IFRS, we use the liability method of accounting for income taxes. Under the liability method, deferred income tax assets and liabilities are recognized on the differences between the carrying amounts of assets and liabilities and their respective income tax basis (temporary differences). A deferred income tax asset may also be recognized for the benefit expected from unused tax credits and losses available for carryforward, to the extent that it is probable that future taxable earnings will be available against which the tax credits and losses can be applied.
Preparation of the consolidated financial statements involves determining an estimate of, or provision for, income taxes in each of the jurisdictions in which we operate. The process also involves making an estimate of taxes currently payable and income taxes expected to be payable or recoverable in future periods, referred to as deferred income taxes. Deferred income taxes result from the effects of temporary differences due to items that are treated differently for tax and accounting purposes. The tax effects of these differences are reflected in the Consolidated Statements of Financial Position as deferred income tax assets and liabilities. An assessment must also be made to determine the likelihood that our future taxable income will be sufficient to permit the recovery of deferred income tax assets. To the extent that such recovery is not probable, deferred income tax assets must be reduced. The reduction of the deferred income tax asset can be reversed if the estimated future taxable income improves. No assurances can be given if any reversal will occur or the amount or timing of any such reversal. Management must exercise judgment in its assessment of continually changing tax interpretations, regulations, and legislation to ensure deferred income tax assets and liabilities are complete and fairly presented. Differing assessments and applications than our estimates could materially impact the amount recognized for deferred income tax assets and liabilities. Our tax filings are subject to audit by taxation authorities. The outcome of some audits may change our tax liability, although we believe that we have adequately provided for income taxes in accordance with IFRS based on all information currently available. The outcome of pending audits is not known nor is the potential impact on the consolidated financial statements determinable.
A net deferred income tax liability of $454 million (2018 - $473 million) has been recorded on the Consolidated Statements of Financial Position as at Dec. 31, 2019. This primarily relates to income tax deductions in excess of related depreciation of PP&E of $828 million (2018 - $896 million), taxes on unrealized gains from risk management transactions of $141 million (2018 - $145 million), partially offset by temporary differences related to future decommissioning and restoration costs of $122 million (2018 - $113 million) and net operating loss carryforwards of $252 million (2018 - $281 million). We believe there will be sufficient taxable income that will permit the use of these loss carryforwards in the tax jurisdictions where they exist. Additional US tax losses are available for use for which no deferred income tax assets have been recognized.
Employee Future Benefits
We provide selected pension and other post-employment benefits to employees, such as health and dental benefits. The cost of providing these benefits is dependent upon many factors, including actual plan experience and estimates and assumptions about future experience.
The liabilities for pension, other post-employment benefits and associated pension costs included in annual compensation expenses are impacted by employee demographics, including age, compensation levels, employment periods, the level of contributions made to the plans and earnings on plan assets.
Changes to the provisions of the plans may also affect current and future pension costs. Pension costs may also be significantly impacted by changes in key actuarial assumptions, including, for example, the discount rates used in determining the defined benefit obligation and the net interest cost on the net defined benefit liability. The discount rate used to estimate our obligation reflects high-quality corporate fixed income securities currently available and expected to be available during the period to maturity of the pension benefits.
The plan assets are comprised primarily of equity and fixed income investments. Fluctuations in the return on plan assets as a result of actual equity market returns and changes in interest rates may result in increased or decreased pension costs in future periods.
TRANSALTA CORPORATION M61
Management’s Discussion and Analysis
Decommissioning and Restoration Provisions
We recognize decommissioning and restoration provisions for generating facilities and mine sites in the period in which they are incurred if there is a legal or constructive obligation to remove the facilities and restore the site. The amount recognized as a provision is the best estimate of the expenditures required to settle the provision. Expected values are probability weighted to deal with the risks and uncertainties inherent in the timing and amount of settlement of many decommissioning and restoration provisions. Expected values are discounted at the current market-based risk-free interest rate adjusted to reflect the market’s evaluation of our credit standing.
As at Dec. 31, 2019, the decommissioning and restoration provisions recorded on the Consolidated Statements of Financial Position were $501 million (2018 - $407 million). During 2019, we adjusted the Centralia mine decommissioning and restoration provision as management no longer believes that the fine coal recovery and reclamation work will be completed as originally proposed. Refer to the Accounting Changes section of this MD&A for further details. In addition, as a result of the changes in estimated useful lives, described in the Accounting Changes section, the discount rates used for the Canadian coal and mining operations decommissioning provisions were changed due to the change in useful life. The use of a lower inflation rate decreased the corresponding liabilities.
We estimate the undiscounted amount of cash flow required to settle the decommissioning and restoration provisions is approximately $1.3 billion, which will be incurred between 2020 and 2073. The majority of these costs will be incurred between 2020 and 2050.
Sensitivities for the major assumptions are as follows:
| | | | | | | | |
| Factor | Increase or
decrease (%) | Approximate impact
on net earnings |
| Discount rate | 1 | | 5 | |
| Undiscounted decommissioning and restoration provision | 10 | | 3 | |
Other Provisions
Where necessary, we recognize provisions arising from ongoing business activities, such as interpretation and application of contract terms, ongoing litigation and force majeure claims. These provisions, and subsequent changes thereto, are determined using our best estimate of the outcome of the underlying event and can also be impacted by determinations made by third parties, in compliance with contractual requirements. The actual amount of the provisions that may be required could differ materially from the amount recognized.
Classification of Joint Arrangements
Upon entering into a joint arrangement, the Corporation must classify it as either a joint operation or joint venture, which classification affects the accounting for the joint arrangement. In making this classification, the Corporation exercises judgment in evaluating the terms and conditions of the arrangement to determine whether the parties have rights to the assets and obligations or rights to the net assets. Factors such as the legal structure, contractual arrangements and other facts and circumstances, such as where the purpose of the arrangement is primarily for the provision of the output to the parties and when the parties are substantially the only source of cash flows for the arrangement, must be evaluated to understand the rights of the parties to the arrangement.
Accounting Changes
Current Accounting Changes
IFRS 16 Leases
We adopted IFRS 16 Leases ("IFRS 16") with an initial adoption date of Jan. 1, 2019. IFRS 16 sets out the principles for the recognition, measurement, presentation and disclosure of leases. The standard provides a single lessee accounting model, requiring lessees to recognize a right of use asset and liabilities for all in-scope leases.
We elected to apply the modified retrospective method of transition. Under this method, the comparative periods presented in the consolidated financial statements were not restated, and comparative period leases continue to be reported as recognized following IAS 17 Leases or International Financial Reporting Interpretations Committee Interpretation 4 Determining Whether an Arrangement Contains a Lease. Instead of restating prior years' results, we recognized the cumulative impact of the initial application of the standard of $3 million in deficit as at Jan. 1, 2019.
TRANSALTA CORPORATION M62
Management’s Discussion and Analysis
Impact on the financial statements
Lessee
We recognized the cumulative impact of the initial application of the standard by recording a right of use asset based on the corresponding lease obligation measured at the present value of the remaining lease payments discounted using our incremental borrowing rate (or the rate implicit in the lease) applied to the lease obligations at Jan. 1, 2019. The weighted average incremental borrowing rate applied to the lease obligations on Jan. 1, 2019, was 5.71 per cent. On Jan. 1, 2019, we recognized $83 million in lease obligations, comprised of $52 million of new lease obligations and $31 million (net of $32 million derecognized) that were previously shown as finance lease obligations.
The associated right of use assets were measured at an amount equal to the lease obligation, adjusted by the amount of any prepaid or accrued lease payments, onerous contract provisions and lease inducements. On Jan. 1, 2019, we recognized right of use assets of $85 million, including $38 million that was previously included in PP&E, intangible assets and other assets.
Applying the IFRS 16 definition of a lease to a contractual arrangement that was accounted for as a finance lease under IAS 17 but is no longer considered a lease under IFRS 16, resulted in the derecognition of a finance lease asset of $29 million and a finance lease liability of $32 million with the net impact of $3 million recorded in deficit.
Lessor
Several of the Corporation's long-term contracts at certain wind, hydro and solar facilities are no longer considered to be operating leases under IFRS 16. Revenues earned on these are now accounted for by applying IFRS 15 Revenue from Contracts with Customers. No significant change in the pattern of revenue recognition arose. The Corporation continues to account for its subleases as operating leases.
Note 2 and Note 3 of the consolidated financial statements include a more detailed discussion of our accounting policies under IFRS 16 and our adoption of IFRS 16, respectively.
Change in Estimates
Canadian Coal
As a result of the Clean Energy Investment Plan described in the Corporate Strategy section of this MD&A, we adjusted the useful lives of certain coal assets, effective Sept. 1, 2019. Assets used only for coal-burning operations were adjusted to shorten their useful lives whereas other asset lives were extended as they were identified as being used after the coal-to-gas or combined-cycle conversions. Due to the impact of shortening the lives of the coal assets, overall depreciation expense for the year ended Dec. 31, 2019, increased by approximately $16 million.
Wind and Solar
During 2019, the allocation of the costs recognized for the components of the Wind and Solar PP&E and the useful lives for these identified components were reviewed. As a result of the review, additional components were identified for parts where the useful lives are shorter than the original estimate. The useful life of each of these components was reduced from 30 years to either 15 years or 10 years. Accordingly, depreciation expense for the year ended Dec. 31, 2019, increased by approximately $11 million.
Sheerness
In 2019, we adjusted the useful life of the Sheerness coal-fired plant assets to align with the dual-fuel conversion plans. As a result, the assets used for coal-burning operations as well as the other asset lives were extended and depreciation expense for the year ended Dec. 31, 2019, decreased by approximately $8 million.
The useful lives may be revised or extended in compliance with the Corporation's accounting policies, dependent upon future operating decisions and events.
Centralia
In 2019, we adjusted the Centralia mine decommissioning and restoration provision as management no longer believes that the fine coal recovery and reclamation work will be completed as originally proposed. The Corporation's current best estimate of the decommissioning and restoration provision increased by $141 million. Since the Centralia mine is no longer operating and reached the end of its useful life in 2006, this adjustment results in the immediate recognition of the full $141 million, through asset impairment charges in net earnings.
For further details and changes in estimates relating to prior years, refer to the Other Consolidated Analysis section of this MD&A and Note 3 of the consolidated financial statements.
TRANSALTA CORPORATION M63
Management’s Discussion and Analysis
Financial Instruments
Financial instruments are used for proprietary trading purposes and to manage our exposure to interest rates, commodity prices and currency fluctuations, as well as other market risks. We may currently use physical and financial swaps, forward sale and purchase contracts, futures contracts, foreign exchange contracts, interest rate swaps and options to achieve our risk management objectives. Some of our physical commodity contracts have been entered into and are held for the purposes of meeting our expected purchase, sale, or usage requirements (“own use”) and as such, are not considered financial instruments and are not recognized as a financial asset or financial liability. Other physical commodity contracts that are not held for normal purchase or sale requirements and derivative financial instruments are recognized on the Consolidated Statements of Financial Position and are accounted for using the fair value method of accounting. The initial recognition of fair value and subsequent changes in fair value can affect reported earnings in the period the change occurs if hedge accounting is not elected. Otherwise, changes in fair value will generally not affect earnings until the financial instrument is settled.
Some of our financial instruments and physical commodity contracts qualify for, and are recorded under, hedge accounting rules. The accounting for those contracts for which we have elected to apply hedge accounting depends on the type of hedge. Our financial instruments are mainly used for cash flow hedges or non-hedges. These categories and their associated accounting treatments are explained in further detail below.
For all types of hedges, we test for effectiveness at the end of each reporting period to determine if the instruments are performing as intended and hedge accounting can still be applied. The financial instruments we enter into are designed to ensure that future cash inflows and outflows are predictable. In a hedging relationship, the effective portion of the change in the fair value of the hedging derivative does not impact net earnings, while any ineffective portion is recognized in net earnings.
We have certain contracts in our portfolio that, at their inception, do not qualify for, or we have chosen not to elect to apply, hedge accounting. For these contracts, we recognize in net earnings mark-to-market gains and losses resulting from changes in forward prices compared to the price at which these contracts were transacted. These changes in price alter the timing of earnings recognition, but do not necessarily determine the final settlement amount received. The fair value of future contracts will continue to fluctuate as market prices change.
The fair value of derivatives that are not traded on an active exchange, or extend beyond the time period for which exchange-based quotes are available, are determined using valuation techniques or models.
Cash Flow Hedges
Cash flow hedges are categorized as project, foreign exchange, interest rate or commodity hedges and are used to offset foreign exchange, interest rate and commodity price exposures resulting from market fluctuations.
Foreign currency forward contracts may be used to hedge foreign exchange exposures resulting from anticipated contracts and firm commitments denominated in foreign currencies, primarily related to capital expenditures, and currency exposures related to US-denominated debt.
Physical and financial swaps, forward sale and purchase contracts, futures contracts and options may be used primarily to offset the variability in future cash flows caused by fluctuations in electricity and natural gas prices. Foreign exchange forward contracts and cross-currency swaps may be used to offset the exposures resulting from foreign-denominated long-term debt. Interest rate swaps may be used to convert the fixed interest cash flows related to interest expense at debt to floating rates and vice versa.
In a cash flow hedge, changes in the fair value of the hedging instrument (a forward contract or financial swap, for example) are recognized in risk management assets or liabilities, and the related gains or losses are recognized in other comprehensive income ("OCI"). These gains or losses are subsequently reclassified from OCI to net earnings in the same period as the hedged forecast cash flows impact net earnings, and offset the losses or gains arising from the forecast transactions. For project hedges, the gains and losses reclassified from OCI are included in the carrying amount of the related PP&E.
Hedge accounting follows a principles-based approach for qualifying hedges, which is aligned with an entity's approach to risk management. When we do not elect hedge accounting or when the hedge is no longer effective and does not qualify for hedge accounting, the gains or losses as a result of changes in prices, interest or exchange rates related to these financial instruments are recorded in net earnings in the period in which they arise.
TRANSALTA CORPORATION M64
Management’s Discussion and Analysis
Net Investment Hedges
Foreign-denominated long-term debt is used to hedge exposure to changes in the carrying values of our net investments in foreign operations that have a functional currency other than the Canadian dollar. Our net investment hedges using US-denominated debt remain effective and in place. Gains or losses on these instruments are recognized and deferred in OCI and reclassified to net earnings on the disposal of the foreign operation. We also manage foreign exchange risk by matching foreign-denominated expenses with revenues, such as offsetting revenues from our US operations with interest payments on our US-dollar debt.
Non-Hedges
Financial instruments not designated as hedges are used for proprietary trading and to reduce commodity price, foreign exchange and interest rate risks. Changes in the fair value of financial instruments not designated as hedges are recognized in risk management assets or liabilities, and the related gains or losses are recognized in net earnings in the period in which the change occurs.
Fair Values
The majority of fair values for our project, foreign exchange, interest rate, commodity hedges and non-hedge derivatives are calculated using adjusted quoted prices from an active market or inputs validated by broker quotes. We may enter into commodity transactions involving non-standard features for which market-observable data is not available. These transactions are defined under IFRS as Level III instruments. Level III instruments incorporate inputs that are not observable from the market, and fair value is therefore determined using valuation techniques. Fair values are validated by using reasonably possible alternative assumptions as inputs to valuation techniques, and any material differences are disclosed in the notes to the consolidated financial statements. At Dec. 31, 2019, Level III instruments had a net asset carrying value of $686 million (2018 - $695 million). Refer to the Critical Accounting Policies and Estimates section of this MD&A for further details regarding valuation techniques. Our risk management profile and practices have not changed materially from Dec. 31, 2018.
TRANSALTA CORPORATION M65
Management’s Discussion and Analysis
Environment, Social and Governance ("ESG")
The Corporation places high priority on ESG or sustainability management and performance. We have reported on sustainability for over 25 years and fiscal 2019 reporting marked our fifth year of integrating financial and sustainability disclosure.
In total, we own 73 power-generating facilities across Australia, Canada and the US. We are invested in a mix of wind, solar, hydro, natural gas and coal assets for a total of approximately 8,000 MW of gross generating capacity. The following outlines material environmental and social considerations in respect of our operated facilities.
ESG at TransAlta - Environment, Social and Governance Objectives
Sustainability is a core value for the Corporation. For TransAlta, it means integrating actions into our current plans that recognize the long-term impacts of our operations on the environment and society. Our programs also ensure that we work with stakeholders in the community and use leading governance practices in our decision-making processes. We believe that integrating the three pillars of environment, social and governance is important to the long-term decisions we make for the benefit of all our stakeholders.
Our coal-to-gas conversion strategy and pursuit of strategic growth opportunities in clean electricity (renewable and natural gas) generation highlights one element of our environment pillar. By 2025 our generation portfolio will be comprised entirely of renewable and natural gas assets. Natural gas is a clean fuel that plays an important role in the electricity sector, providing low-emission baseload and peaking generation to support system demands and intermittent renewable generation. Our focus on clean electricity generation also mitigates the impact of potential adverse regulatory developments in response to emerging environmental regulation including, but not limited to, a regulated cost of carbon.
Environmental and Social Risk and Materiality
Our major environmental risk factors include weather, environmental disasters, climate change, exposure to the elements, environmental compliance risk, and current and emerging environmental regulation. Our major social risk factors include public health and safety, employee and contractor health and safety, local communities, employee retention, reputation management, and stakeholder relationships. Further guidance on our risk factors can be found in the Risk Management section of this MD&A.
Reporting Structure
Key elements of the following disclosure are guided by our sustainability materiality assessment. To help inform discussion and provide context on how ESG affects our business, we have applied components of leading ESG reporting frameworks, including Global Reporting Index, Sustainability Accounting Standards Board ("SASB") and Task Force on Climate-related Financial Disclosures ("TCFD"). Our content is structured according to guidance on non-traditional capitals from the International Integrated Reporting Framework.
TRANSALTA CORPORATION M66
Management’s Discussion and Analysis
Human Capital
Engaging our workforce, developing our employees and minimizing safety incidents are the keys to human capital value creation at TransAlta. The most material impacts on our human capital performance are having an engaged workforce and keeping our employees safe.
As of Dec. 31, 2019, we had 1,543 (2018 - 1,883) active employees. This number has decreased by 18 per cent from 2018 levels, following a reduction in positions at our coal fleet aligned to changes in the plant portfolio and from multiple initiatives across the business that used technology to reduce costs and increase efficiency.
With approximately 45 per cent of our employees being unionized, we strive to maintain open and positive relationships with union representatives and regularly meet to exchange information, listen to concerns and share ideas that further our mutual objectives. Collective bargaining is conducted in good faith, and we respect the rights of employees to participate in collective bargaining.
Organizational Culture and Structure
Our employees are central to value creation. Our corporate culture has evolved and adapted throughout our more than 100-year heritage. Our core values are safety, innovation, sustainability, respect and integrity. These five core values help provide clarity for our employees and guide our behaviour and decision making. They also provide a foundation for leadership, collaboration, community support, personal growth and work/life balance. Through corporate initiatives and support throughout all levels of leadership, we encourage our employees to maximize their potential.
Our six-level organizational structure helps facilitate effective pace and decision-making in our organization. Our business operates as a business-centric model, with Canadian Coal, US Coal, Canadian Gas, Australian Gas, Wind and Solar, and Hydro as our six generating segments. In addition, our Energy Marketing segment optimizes our asset fleet and trades electricity and other energy commodities. Our Corporate segment, including finance, legal, administrative, business development and investor relations functions, oversees our business and provides strategic alignment. The Corporation also includes a Shared Services division which oversees our information technology, supply chain, human resources, engineering and accounting functions. The consolidation and centralization of these functions has allowed us to streamline, standardize and where appropriate automate these functions while reducing costs and improving service delivery across the organization. Our operations portfolio is run by a single leadership team, which provides operational and financial synergies, enhancing our competitiveness.
TransAlta is committed to improving its internal work environment and the way that employees perceive their work and the Corporation. We track a broad number of factors to provide us insight into our progress and we use a third party to assist us in tracking our progress on an annual basis. We have made continual and notable improvements year over year and continue to target further improvements as we look forward.
Health and Safety
The safety of our people, communities and the environment is one of our core values. At TransAlta, we operate large and often complex facilities. The environments in which we work, including Canadian winters and the Australian outback, can add additional challenges to keeping our employees, contractors and visitors safe. Each year we invest significant resources into improving our safety performance, including positively enhancing our safety culture. At meetings of more than four people, we have a practice of starting the meeting with a “safety moment”, which helps share key safety learnings across the Corporation.
TransAlta's management systems underpin the delivery of safe, reliable and competitive electricity to our customers and partners. Our Total Safety Management System (TSMS) is a combination of recognized best practices in process safety, risk management, asset management, occupational health, safety and environmental management. Since expanding our Occupational Health and Safety program in 2015 to encompass Total Safety, we have transitioned from development and implementation of this framework into continuous improvement, always striving to achieve our Target Zero vision to operate our business with zero unexpected asset failures and zero environmental, health and safety incidents.
In 2019, we continued to progress our safety culture transformation and have provided employees with behavioural safety training tools and capabilities to improve both their personal safety and that of their coworkers.
In 2017, we introduced the Total Injury Frequency (TIF) metric to track the total number of injuries including minor first aids, relative to exposure hours worked.
TRANSALTA CORPORATION M67
Management’s Discussion and Analysis
In 2019, we achieved a TIF of 1.12 compared to 1.91 in 2018. This decrease was a direct result of our back-to-basics approach with respect to safety. Specifically, in 2019, we focused on hazard identification (including audits and inspections), housekeeping and improved contractor management practices across the fleet.
In addition to TIF, we are also tracking Total Recordable Injury Frequency (TRIF). TRIF tracks the number of more serious injuries and excludes minor first aids, relative to exposure hours worked. TRIF provides us with the opportunity to target and monitor our significant injuries. It is also an industry-recognized safety metric and allows us to compare and benchmark our safety performance to that of our peers. Our TRIF result for 2019 was 0.73 compared to 1.00 in 2018.
| | | | | | | | | | | |
| Safety at TransAlta (employees and contractors) | 2019 | 2018 | 2017 |
| Lost-time injuries | 5 | 1 | 6 |
| Medical aids | 7 | 12 | 15 |
| Restricted work injuries | 3 | 12 | 16 |
| First aids | 8 | 23 | 67 |
| Total TIF injuries | 23 | 48 | 104 |
| Exposure hours | 4,106,898 | | 5,014,804 | | 6,073,419 | |
| Total Injury Frequency (TIF) | 1.12 | 1.91 | 3.42 |
| Total Recordable Injury Frequency (TRIF) | 0.73 | 1.00 | 1.22 |
Gender Diversity
A number of case studies have highlighted the link between gender diversity and additional business value. TransAlta is an active supporter of gender diversity as a driver for value, but also as an ethical business practice. Our commitment to gender diversity in our business is evidenced by our female participation rates on both our executive team and Board. As of Dec. 31, 2019, women made up 50 per cent of our executive officer team and 33 per cent of our Board. These percentages are higher than our peers in Canada. Industry research highlights that the percentage of Board seats held by women from all disclosing Canadian TSX-listed companies in Canada is 18.1 per cent and the average percentage of women on executive teams is 16.9 per cent.
To further support female advancement, we have set targets to: (i) maintain equal pay for women in equivalent roles, (ii) achieve 50 per cent representation of women on our Board by 2030 and (iii) achieve 40 per cent representation of women among all employees by 2030. Currently, women employees represent 20 per cent of all employees.
In early 2020, TransAlta was one of 325 companies globally to be added to the Bloomberg Gender Equality Index. Inclusion in the index recognizes our comprehensive investment in workplace gender equality and our commitment to driving progress by developing inclusive policies and disclosing data using Bloomberg’s gender reporting framework.
Employee Retirement Savings Programs
TransAlta is an attractive employer in all three countries in which we operate. We provide compensation to our employees at levels that are competitive in relation to their respective location. We strive to be an employer of choice through our total rewards programs, which include various incentive plans designed to align performance with our annual and longer-term targets, as determined annually by the Board.
Retirement savings plans are an example of rewards we provide. We have registered pension plans in Canada and the US. The plans cover substantially all employees of the Corporation, its domestic subsidiaries and specific named employees working internationally. These plans have defined benefit (“DB”) and defined contribution (“DC”) options, and in Canada there is an additional non-registered supplemental pension plan (“SPP”) for members whose annual earnings exceed the Canadian income tax limit. The DB SPP was closed as of Dec. 31, 2015, and a new DC SPP commenced for only executive members hired after Jan. 1, 2016. Current executives as of Dec. 31, 2015, were grandfathered in the DB SPP.
The Canadian and US DB pension plans are closed to new entrants, with the exception of the Highvale mine (SunHills) pension plan acquired in 2013. The US DB pension plan was frozen effective Dec. 31, 2010. The plans are funded by the Corporation in accordance with governing regulations and actuarial valuations. In addition, in Canada, we provide some optional plans for employees to enhance their financial wellness and retirement savings, with group RRSP and TFSA plans.
TRANSALTA CORPORATION M68
Management’s Discussion and Analysis
In Australia, employees can nominate a superannuation fund for superannuation contributions. The Australian superannuation scheme is compulsory for employers with contributions required at a rate set by the government.
Other Employee Benefit Programs
TransAlta provides competitive benefit programs for most of our employees (options are dependent on the countries in which we operate). We also provide benefit programs based on negotiated union agreements in some locations.
Our flexible benefits plans provide employees and their families with choices of coverage including, among others, extended health, dental, vision, life insurance, critical illness, accident, disability and a health spending account.
We provide other health and dental benefits for disabled members and retired members, typically up to the age of 65. The Canadian retiree benefits plan was closed for all new hired employees as of Mar. 1, 2017.
Talent and Employee Development
Talent and employee development is viewed as a key pillar of organizational health. Investing in our employee development enhances employees’ skills and improves productivity and engagement. This contributes to a strong corporate culture that provides value for TransAlta.
In 2019, we launched our Leadership Development Program. This program provides 143 leaders or future leaders with fundamental leadership skills and tools. Training programs focused on a variety of leadership competencies for leaders with various years of management experience. All leaders in Canada also completed mandatory Violence in the Workplace training.
In addition, in 2019 we developed and launched our Operations Manager Development Program. This is an internally designed program to develop future plant managers and operations leaders by providing on-the-job experience and structured learning activities within multiple business units across the organization. Participants learn through an 18-month program of rotational assignments in various operational facilities (Coal, Gas, Wind and Hydro) as well as through Corporate business units (Asset Management, Commercial, Energy Trading & Marketing, Finance, Human Resources, Indigenous & Stakeholder Relations, Growth and Supply Chain). In 2019, we had seven participants in this program.
We also continued to offer our existing internal programs to employees across the organization. This includes our Elevate Program, a six-month peer-led leadership training program. This program first launched in 2017, and in 2019, we had 100 participants. Since the launch of this program, 215 leaders and future leaders have participated.
Another internal program that we continue to offer is Execution Engine. This program was designed to build capacity for our people to create an organization that is both efficient and adaptive. The training program was built on research regarding what is needed for our people to help drive and sustain change. To date, approximately 850 employees have taken this course. In December 2019, we also launched an internal leadership library that is updated monthly and gives all employees access to articles about leadership development.
Social and Relationship Capital
We strive to create shared value for our stakeholders through social and relationship value creation at TransAlta. The most material impacts on our social and relationship performance are public health and safety, anti-competitive behaviour and fostering positive relationships with Indigenous neighbours, communities, stakeholders, governments, industry and landowners in the areas where we operate.
Indigenous Relationships and Partnerships
At TransAlta, we value our relationships and partnerships with stakeholders and our Indigenous neighbours. Our Indigenous Relations team focuses on community engagement, employment, economic development and community investment. We ensure that TransAlta’s principles for engagement are upheld and that the Corporation fulfills its commitments to Indigenous communities. Efforts are focused on building and maintaining solid relationships and establishing strong communication channels that enable TransAlta to share information regarding operations and growth initiatives, gather feedback to inform project planning and understand priorities and interests from communities to better address concerns.
TRANSALTA CORPORATION M69
Management’s Discussion and Analysis
Methods of engagement include:
▪Relationship building through regular communication and in-person meetings with representatives at various levels within Indigenous community organizations;
▪Hosting company-community activities that share both business information and cultural lessons;
▪Maintaining consistent communications with each community and following appropriate community protocols and procedures;
▪Participating in community events such as powwows and blessing ceremonies; and
▪Providing both monetary and in-kind sponsorships for community initiatives.
TransAlta is proactive with initiating engagement early on in project development to allow concerns to be identified promptly and addressed, minimizing potential project delays. We conduct consultation primarily during project development and decommissioning and maintain engaged communication throughout the operation phase. We work with communities to build a relationship with a foundation of ongoing communication and mutual respect.
In 2019, TransAlta partnered with Indspire, Canada’s national Indigenous registered charity, and we were able to award 14 bursaries of $3,000 each. The Indigenous recipients were from the following communities: Aamjiwnaang First Nation, Blood Tribe, Ermineskin Cree Nation, Paul First Nation, Piikani Nation, Samson Cree Nation, Simpcw First Nation, Squamish Nation, Sunchild First Nation and Tsuut'ina Nation.
We currently hold a silver-level standing with the Canadian Council for Aboriginal Business’s Progressive Aboriginal Relations (“PAR”). Certification occurs every three years and is a comprehensive, third-party audit conducted by PAR verifiers. To support this initiative, TransAlta introduced an internal practice and knowledge centre that provides employees with resources and information to support the advancement of Indigenous relations at TransAlta.
In 2020, TransAlta continues to support Indigenous access to education through our Indigenous funding program with the Southern Alberta Institute of Technology (SAIT). TransAlta recognized a gap in federal and provincial funding for academic upgrading, which could contribute to a barrier for many Indigenous students. This program provides the critical financial support to aspiring Indigenous students applying to SAIT who require high school upgrading in order to qualify for a trade program.
In 2019, we also supported an Indigenous Leadership Program at the Banff Centre for Arts and Creativity. Approximately 300 Indigenous leaders from over 120 communities attended the leadership programs with help from TransAlta and other supporters.
Over the past five years, TransAlta’s support has provided 45 bursaries for members of Indigenous communities to attend programs and share what they have learned with their comminuties. Participants have come from communities across Alberta and British Columbia including Alexis Nakota Sioux Nation, Bearspaw First Nation, Chiniki First Nation, Enoch Cree Nation, Ermineskin Cree Nation, Fort McKay First Nation, Blood Tribe, Montana First Nation, Paul First Nation, Piikani Nation, Samson Cree Nation, Siksika Nation, Squamish Nation, Tsuut’ina Nation and Wesley First Nation.
Public Health and Safety
We seek to preserve public health and safety. It is our goal to maintain security for our employees and the peoples and communities where we operate.
We specifically look to minimize the following risks:
▪Harm to people;
▪Damage to property;
▪Operational liability; and
▪Loss of organizational reputation and integrity.
We work to prevent incidents and lower our risk by administering controls such as restricting physical access around and into our operating sites. The TransAlta Corporate Emergency Management program is in place to prepare employees for an emergency incident. Through this program, emergency preparedness training is implemented across our fleet in an all-hazards approach to public safety and emergency response. Each site also has an Emergency Response Plan and completes on-site drills and exercises specific to the incidents that could occur at each location. Our business continuity plan also helps prevent an interruption to operations. The program has corporate oversight and is supported by the Corporate Emergency Management Team in an emergency situation. The program has executive sponsorship and is focused on the protection of our people, assets, information and reputation.
TRANSALTA CORPORATION M70
Management’s Discussion and Analysis
Data and Digital Asset Protection
Our digital assets are also something we work hard to protect. Cybersecurity risks can include compromise of data integrity, hacking, social engineering, compromise of operations and infrastructure, credential breaches, attacks through third-party vendors and service providers, attacks involving artificial intelligence and machine learning, and cybersecurity staff turnover. Given the ever-evolving nature of cyber attacks, we are consistently adapting to address threats with a comprehensive cybersecurity program that consists of three pillars: technology, processes and resourcing. Each of these pillars can be reinforced independently to address specific cyber risks and threats. Through this program, TransAlta continually implements proactive controls and safeguards to mitigate the cybersecurity risks and threats posed to the organization.
Refer to the Governance and Risk Management - Cybersecurity Risk section of this MD&A for further details.
Stakeholder Relationships
Fostering relationships with our stakeholders is important to TransAlta. Driven by our values, we seek to maximize value creation for our stakeholders and TransAlta. We take a proactive approach to building relationships and understanding the impacts our business may have on local stakeholders.
TransAlta Stakeholders
To act in the best interests of the Corporation and to optimize the balance between financial, environmental and social value for both our stakeholders and TransAlta, we seek to:
▪Engage regularly with stakeholders about our operations, growth prospects and future developments;
▪Consider feedback and make changes to project designs and plans to resolve and/or accommodate concerns expressed by our stakeholders; and
▪Respond in a timely and professional manner to stakeholder inquiries and concerns and work diligently to resolve issues or complaints.
Our stakeholders are identified through stakeholder mapping exercises conducted for each facility and prospective project development or acquisition. Through decades of stakeholder relations in the areas of our facilities, we have developed a strong understanding of who our stakeholders are and have gained understanding of our stakeholders' issues and concerns.
Our principal stakeholder groups are listed in the following table.
| | | | | | | | |
| TransAlta Stakeholders | | |
| Non-governmental organizations (NGOs) | Community Associations and Organizations | Connecting Transmission Facility Operators |
| Regulators | Industry Organizations | Communities |
| Charitable Organizations/Non-profit | Standards Organizations | Retirees |
| All Levels of Government | Media | Residents/Landowners |
| Suppliers | Business Partners | Investor Organizations |
| Contractors | Unions/Labour Organizations | Financial Institutions |
| Government Agencies | Forest Associations/Industry | Mineral Rights Owners |
| System Operators | Oil & Gas Associations/Industry | Railroad Owners |
| Customers | Think Tanks | Utility Owners |
| Municipalities | Academics | PPA Buyers |
Engagement Framework
Our stakeholder engagement framework is modelled after and closely tied to the stakeholder engagement aspect of ISO 14001, which is an internationally recognized environmental management standard. This framework is a streamlined corporate-wide approach to ensure that engagement and relationship-building practices are consistent across TransAlta’s locations and types of work. Although we no longer certify under ISO 14001, we continue to operate within its established best practices.
TRANSALTA CORPORATION M71
Management’s Discussion and Analysis
Methods of Engagement
In order to run our business successfully, we maintain open communication channels with stakeholders. We commit to timely and professional resolution using values-based dialogue. We work internally and with each stakeholder to identify how to mitigate further issues.
Examples of our methods of engagement are listed in the following table.
| | | | | | | | |
| Information & Communication | Dialogue & Consultation | Relationship Building |
| Open houses, town halls and public information sessions | In-person meetings with local groups and communities | Community Advisory Bodies |
| Newsletters, telephone conversations, emails and letters | Meetings with individual stakeholders e.g. landowners and residents | Capacity Agreements |
| Websites | Targeted audience sessions | Sponsorships and donations |
| Social media postings | Tours of our facilities and sites | Hosting events |
A key focus of our work is to support the business growth through proactive engagement with stakeholders in all of our geographic operating areas in Australia, Canada and the US in order to develop and maintain relationships, assess needs and fit and to seek out collaborative and sustainable value creation opportunities. This helps ensure any stakeholder concerns are identified and can be addressed early in the development process, minimizing project delays. We conduct consultation primarily during project development and decommissioning and maintain engaged communication throughout operations. As an example, we implemented our stakeholder engagement program with stakeholders and Indigenous groups in connection with the proposed repowering at the Sundance and Keephills facilities. We filed our regulatory applications in December 2019, and our stakeholder engagement program will continue for the entire life cycle of the facilities.
Engagement Tracking and Reporting
Our Stakeholder and Indigenous Relations tracking program functions as an enterprise-wide communication recordkeeping tool, which is managed by our Stakeholder and Indigenous Relations team. This capacity fulfills our requirements for consultation with stakeholders and Indigenous groups alike, and is capable of producing regulatory reports as proof of engagement and consultation efforts. The tool can store email conversations, documents and voicemail messages related to any project, event or issue, and display them in a report format. It can also produce an array of statistical reports showing frequency and volume of engagement based on project, stakeholder, stakeholder group or keywords. This tracking program decreases the time and cost required to submit proof of engagement to government agencies.
Engagement and Board Communication
The Board believes that it is important to have constructive engagement with its shareholders and other stakeholders and has established means for the shareholders of the Corporation and other stakeholders to communicate with the Board. For example, employees and other stakeholders may communicate with the Board through the Audit, Finance and Risk Committee by writing to the AFRC or by making submissions via the Corporation’s toll-free telephone or online Ethic Helpline (see the Governance and Risk Management - Whistleblower System section in this MD&A for more details). Shareholders are also invited to communicate directly with the Board under the Corporation’s Shareholder Engagement Policy, which outlines the Corporation’s approach to proactive director-shareholder engagement at and in between the Corporation’s annual shareholders meetings. Under the Shareholder Engagement Policy, shareholders can submit questions or inquiries to the Board, to which the Corporation will respond. A copy of the Shareholder Engagement Policy is available on our website at www.transalta.com. Shareholders and other stakeholders may, at their option, communicate with the Board on an anonymous basis. In addition, the Board has adopted an annual non-binding advisory vote on the Corporation’s approach to executive compensation (say-on-pay). The Corporation is committed to ensuring continued good relations and communications with its shareholders and other stakeholders and regularly evaluates its practices in light of any new governance initiatives or developments in order to maintain sound corporate governance practices.
Throughout 2019, representatives of the Board engaged extensively with the Corporation's significant shareholders. Specifically, since Jan. 1, 2019, the Board has met with 15 shareholders representing 42 per cent of the Corporation’s total issued and outstanding common shares. In addition, in Sep. 2019, TransAlta held an Investor Day at which we provided detailed information about the Corporation’s strategies, plans, operations and past, present and expected performance. The Investor Day afforded shareholders the opportunity to engage with the Corporation’s senior management.
TRANSALTA CORPORATION M72
Management’s Discussion and Analysis
Customers
As one of the largest Alberta electricity generators providing energy services, our team serves businesses with:
▪Energy consumption and cost management solutions;
▪Market price risk and volume exposure mitigation;
▪Sustainability initiatives such as self-generated electricity and environmental attributes (such as carbon offsets); and
▪Monitoring of energy market design changes, price signals and applicable and available incentives.
The Customer Solution team at TransAlta has maintained a large portfolio of customers in Alberta across a broad range of industry segments including: commercial real estate, municipal, manufacturing, industrial, hospitality, finance and oil and gas. TransAlta is proud of the service we provide to our customers, which is evidenced by the achievement of over 90 per cent customer retention for the last three years.
We are focused on helping our customers in ways uniquely suited to achieve their sustainability goals. One example is through TransAlta’s fleet of on-site cogeneration facilities. Cogeneration is the process of generating electricity and steam simultaneously. When constructed on-site, the construction of additional transmission lines is not required, which avoids disruption to the environment. It also reduces the natural gas required for some industrial processes by using high efficiency steam production rather than boilers. Examples of industrial processes that utilize cogeneration include gas processing, steam-assisted gravity drainage oil sands extraction, chemical manufacturing, and pulp and paper production. Cogeneration is recognized by regulatory bodies for its efficiency in generating power versus traditional methods, and thus can potentially produce Emission Performance Credits that can be used to satisfy our customers' regulatory obligations or sold as additional revenue.
We provide on-site generation for large mining and industrial customers. This requires us to be continually engaged with these customers to ensure that current electricity requirements are provided safely, reliably and cost effectively, but also that their future electricity requirements be satisfied alongside the benefits of lower GHG emissions.
Another way we can contribute to our customers’ sustainability goals is through the use of environmental attributes. Environmental attributes that we have the ability to generate, trade, purchase and sell, include: EPCs, Alberta carbon offsets, Renewable Energy Credits ("RECs") and emission offsets. Alberta carbon offsets can be voluntarily generated by Alberta projects, which meet Alberta carbon offset system qualification protocols. Our Alberta wind facilities generate Alberta carbon offset credits. RECs are produced from our renewable energy assets (wind, hydro and solar) and can be traded in voluntary carbon markets or sold to customers. RECs can be used to meet regulatory requirements when a target for renewable energy generation is set by a jurisdiction or can be used to voluntarily 'green' electricity procurement. Emissions offsets are produced from voluntary projects that reduce emissions in sectors of the economy not covered by carbon reduction regulations. The optimization of environmental attributes can be used as a cost-effective way, for the Corporation or our customers, to lower compliance costs attributed to carbon policies or renewable portfolio standards, or utilized to achieve voluntary corporate sustainability or carbon reduction goals.
To learn more, please visit our website at www.transalta.com/customers.
Supply Chain
We continue to seek solutions to advance supply chain sustainability. In 2017, we optimized our global supply chain management operations by implementing a platform that supports increasing supply chain efficiency, reducing lead times, lowering costs and improving supplier performance. As we explore major projects, we assess vendors both at the evaluation stage and as part of information requests on such elements as safe work practices, environmental practices and Indigenous spend. This means, for example, getting information on:
▪Estimated value of services that will be procured though local Indigenous businesses;
▪Estimated number of local Indigenous persons that will be employed;
▪Understanding overall community spend and engagement; and
▪Understanding the state of community relations through interview processes and stakeholder work.
In early 2019, the Board of Directors adopted a Supplier Code of Conduct that applies to all vendors and suppliers of TransAlta. Under this code, suppliers of goods and services to TransAlta are required to adhere to our core values, including as it pertains to health and safety, ethical business conduct and environmental leadership. The code also allows suppliers to report ethical or legal concerns via TransAlta’s Ethics Helpline.
TRANSALTA CORPORATION M73
Management’s Discussion and Analysis
Community Investments
In 2019, TransAlta contributed approximately $2.1 million in donations and sponsorships (2018 - $2.4 million). One of our significant community investments each year is to United Way campaigns across Canada and the US. This year, TransAlta employees, retirees, contractors and the Corporation raised over $1.2 million for the United Way.
In 2019, we continued to focus our community investment on priority areas for TransAlta, including environment, education and leadership, health and human services, and arts and culture. Some of our partnerships included:
▪Indspire – Through our new partnership with Indspire in 2019, TransAlta was able to almost double the number of bursaries available for Indigenous students through Indspire’s matching program. There were 14 bursaries awarded in 2019. Formerly the National Aboriginal Achievement Foundation, Indspire is Canada’s national charity for Indigenous education;
▪Mother Earth's Children's Charter School - Located in treaty six territory, near Stony Plain, Alberta and our Alberta coal operations, Mother Earth Children’s Charter School (“MECCS”) has become an important part of TransAlta’s community investment program. MECCS offers Kindergarten to Grade 9 and is cited as Canada’s first and only Indigenous children’s charter school. The school was established in 2003 to help provide Indigenous students with an education based strongly on cultural context rather than a traditional western educational model. Approximately 95 per cent of MECCS students are of Indigenous ancestry, with students coming from Paul First Nation, Enoch Cree Nation, Alexis Nakota Sioux Nation, Alexander First Nation, Alberta Beach, Stony Plain and Edmonton. The student population is diverse and includes Métis, Cree, Nakota Sioux and Stoney. Beginning in 2014, TransAlta has made an annual $35,000 donation to the school. In addition, each year at Christmas, TransAlta staff purchase Christmas presents for the students. Volunteers from TransAlta travel to the school to deliver the gifts providing both our employees and the students the opportunity to engage with each other;
▪The Calgary Stampede – Founded in 2017, the TransAlta Performing Arts Studio at Stampede Park continues to provide a year-round facility for Calgary Stampede Foundation and Calgary’s youth performing arts groups to rehearse, train and celebrate the arts;
▪Southern Alberta Institute of Technology (“SAIT”) – Working with SAIT, TransAlta continued to support Indigenous access to education through our Indigenous funding program that addresses a gap in federal and provincial funding for Indigenous academic upgrading;
▪TransAlta Tri-Leisure Centre - TransAlta continues to be a proud sponsor of this facility. The TransAlta Tri-Leisure Centre is a sporting and recreation destination for many active and involved residents from the communities of Parkland County, Spruce Grove and Stony Plain in Alberta. At the facility, thousands of local residents, and many of our employees, participate in a wide range of sporting and cultural activities and join together in many community causes;
▪Banff Centre – TransAlta continued its financial support for the Indigenous Leadership Program at the Banff Centre for Arts and Creativity. Over the past five years, TransAlta’s support has provided 45 bursaries for members of Indigenous communities to attend programs across Alberta and British Columbia; and
▪Energy Transition Support - On July 30, 2015, in Washington State, we announced a US$55 million community investment over 10 years to support energy efficiency, economic and community development, and education and retraining initiatives. The US$55 million community investment is part of the TransAlta Energy Transition Bill passed in 2011. This bill was a historic agreement between policymakers, environmentalists, labour leaders and TransAlta to transition away from coal in Washington State by closing the Centralia facility’s two units, one in 2020 and the other in 2025. In order to invest the $55 million, three funding boards were formed: The Weatherization Board ($10 million), the Economic & Community Development Board ($20 million) and the Energy Technology Board ($25 million). To date, the Weatherization Board has invested $5.9 million, the Economic & Community Development Board $12 million and the Energy Technology Board $3.9 million. Specific projects that the boards funded in 2019 include rebuilding a playground (which included the installation of energy-efficient lighting and accessible surfaces and walkways), the construction of a training facility at Centralia College and funding Washington State’s first electric school bus.
TRANSALTA CORPORATION M74
Management’s Discussion and Analysis
Natural Capital
We continue to increase financial value from natural or environmental capital-related business activities, while reducing our environmental footprint and potential risk factors related to environmental impacts. Comparable EBITDA from renewable energy generation in 2019 was $341 million (2018 - $342 million). Our revenue in 2019 from environmental attribute sales was $27.6 million (2018 - $21.6 million). In addition, in 2019 the sale of coal byproducts and waste-related recycling generated financial value in the range of $25 million to $35 million.
| | | | | | | | | | | |
| The following are key trends in our natural capital: | | | |
| Year ended Dec. 31 | 2019 | 2018 | 2017 |
| Renewable energy comparable EBITDA | 341.0 | 342.0 | 289.0 |
| Environmental attribute sales revenue | 27.6 | 21.6 | 27.7 |
GHG emissions (million tonnes CO2e) | 20.6 | 20.8 | 29.9 |
Natural Capital Management
All energy sources used to generate electricity have some impact on the environment. While we are pursuing a business strategy that includes investing in renewable energy resources such as wind, hydro and solar, we also believe that natural gas will continue to play an important role in meeting energy needs as part of a clean electricity transition. Natural gas plays an important role in the electricity sector, providing low-emission baseload and peaking generation to support system demands and intermittent renewable generation. TransAlta operates simple and combined-cycle natural gas units and cogeneration facilities. We are planning to convert our Alberta coal units to natural gas in the 2020 to 2025 time frame, and by the end of 2025, our generation mix will be only from natural gas and renewable energy.
Regardless of the fuel type, we place significant importance on environmental compliance and continued environmental impact mitigation, while seeking to deliver low-cost and reliable electricity. The Corporation endeavours to be environmentally responsible and recognizes that the competitive pressures for economic growth and cost efficiency must be integrated with sound sustainability management, including environmental stewardship. The Corporation is subject to environmental laws and regulations that affect aspects of our operations, including air emissions, water quality, wastewater discharges and the generation, transport and disposal of waste and hazardous substances. The Corporation’s activities have the potential to impair natural habitat, damage vegetation and wildlife, or cause contamination to land or water that may require remediation under applicable laws and regulations. These laws and regulations require the Corporation to obtain and comply with a variety of environmental registrations, licenses, permits and other approvals. Both public officials and private individuals may seek to enforce environmental laws and regulations against the Corporation. Currently the most material natural or environmental capital impacts to our business are GHG emissions, air emissions (pollutants, metals) and energy use. Other material impacts that we manage and track performance on via our environmental management systems include environmental incidents and spills, land use, water use and waste management.
Environmental Governance
TransAlta's Governance, Safety and Sustainability Committee assists the Board in fulfilling its oversight responsibilities with respect to the Corporation’s monitoring of environmental, health and safety regulations and public policy changes and the establishment and adherence to environmental, health and safety practices, procedures and policies. More details on governance can be found in our Governance and Risk Management section of this MD&A.
Environmental Management Systems
All of our 73 facilities have Environmental Management Systems (“EMS”) in place, the majority of which closely align with the internationally recognized ISO 14001 EMS standard. We have operated our facilities in line with ISO 14001 for over 20 years, and our systems and knowledge of management systems are therefore mature. Only two facilities do not have ISO 14001 aligned EMS in place, although these facilities do have a comparable EMS in place. This is due to commercial arrangements (TransAlta is not the operator of those two sites). Aligning with ISO 14001 provides assurance that our systems are designed to continuously improve performance.
Environmental Performance
Reducing the environmental impact of our activities benefits not only our operations and financial results, but also the communities in which we operate. We expect that increased scrutiny will be placed on environmental management and compliance, and we therefore have a proactive approach to minimizing risks to our results. Our Board provides oversight with respect to the Corporation’s monitoring of environmental regulations and public policy changes and to the establishment and adherence to environmental practices, procedures and policies in response to legal/regulatory and industry compliance or best practices.
TRANSALTA CORPORATION M75
Management’s Discussion and Analysis
Our performance on managing environmental impacts, reducing our environmental impact and capitalizing on environmental initiatives includes the following.
Renewable Energy and Battery Storage
Since 2005, we have added approximately 1,300 MW in renewable energy capacity. We continue to operate over 900 MW of hydro energy and our experience with hydro operations spans over 100 years. In 2015, we made our first solar investment in a 21 MW solar facility in Massachusetts, and we continue to look for opportunities to develop and operate solar energy. Our production from renewable energy in 2019 offset the equivalent of approximately 1.6 million tonnes of carbon dioxide equivalent, or the removal of approximately 340,000 cars from the roads in 2019.
In 2020, we will commission the first utility-scale battery storage project in Alberta, located at our Summerview Wind Farm. The project will use Tesla battery technology and will have a capacity of 10 MW.
Natural Gas
Natural gas plays an important role in the electricity sector, providing low-emission baseload and peaking generation to support system demands and intermittent renewable generation. TransAlta operates simple cycle, combined-cycle, and cogeneration facilities in Canada and Australia. Natural gas facilities provide highly efficient electricity and, in the case of cogeneration, steam production, directly to customers and for the wholesale markets. TransAlta is a significant operator of natural gas electricity in Canada and Australia.
Coal Transition
Our coal-to-gas conversion plan in Alberta is expected to significantly reduce our environmental footprint. As a result of our coal-to-gas conversions, energy use, GHG emissions, air emissions, waste generation and water usage are expected to significantly decline. Conversion of coal-fired power generation to gas-fired generation will eliminate all mercury emissions, the majority of particulate and sulphur dioxide emissions ("SO2") as well as significantly reducing our nitrogen dioxide emissions ("NOx"). Converting GHG-intensive coal facilities to natural gas will support significant reductions in GHGs (approximately 40 per cent reduction), while supporting reliability, affordability and growth of renewable electricity in Alberta. Converted coal facilities will use lower carbon natural gas (new methane reduction regulations on flaring and venting will reduce GHG emissions for natural gas producers) while supporting our local gas producers through the use of up to 700,000 GJs of natural gas per day.
Environmental Incidents and Spills
Protecting the environment and minimizing our impact to the environment supports healthy ecosystems and mitigates our environmental compliance risk and reputational risk. We maintain procedures for environmental incidents similar to our safety practices, with tracking, analyzing and active management to minimize occurrences. With respect to biodiversity management (management of ecosystems, natural habitats and life in the areas we operate), we seek to establish robust environmental research and data collection to establish scientifically sound baselines of the natural environment around our facilities and closely monitor the air, land and water in these areas to identify and curtail potential impacts.
Environmental incidents are separated into two categories: significant environmental incidents and regulatory non-compliance environmental incidents. We define regulatory non-compliance environmental incidents as events that involved a non-compliance event but did not have an impact on the environment. For example, a technical issue with a computer system for gathering real-time data could cause us to be out of compliance with local regulation or our EMS, but there is no direct consequence for the physical environment. All other events are captured as significant environmental incidents and these are where we deem there to be a material impact to the environment. In 2019, we recorded three significant environmental incidents (2018 - one incident). We recorded six non-compliance environmental incidents in 2019 (2018 - six incidents).
Our three significant environmental incidents in 2019 occurred at two of our wind facilities in the US. At our Lakeswind wind facility in Minnesota, we discovered a bald eagle mortality. At our Wyoming wind facility, we discovered two golden eagle mortalities. Root cause analysis investigations were performed on each eagle mortality and we found no causal factors or root causes related to human behaviour or equipment failure being involved in the incidents. These incidents were unusual and we have not had an eagle mortality across our wind fleet since 2015. For all incidents we collaborated with authorities and there were no enforcement actions in respect of such mortalities. Despite inconclusive findings, in order to reduce the risks of future impacts to protected eagle species, we are working on indirect corrective actions that include reviewing the potential for an updated bird monitoring study to be conducted at Lakeswind and Wyoming wind or other at-risk sites.
TRANSALTA CORPORATION M76
Management’s Discussion and Analysis
| | | | | | | | | | | |
| The following are the significant environmental incidents by fuel types: | | | |
| Year ended Dec. 31 | 2019 | 2018 | 2017 |
| Coal | — | 1 | 1 |
| Gas and renewables | 3 | — | | 1 |
| Total significant environmental incidents | 3 | 1 | 2 |
| | | | | | | | | | | |
| The following outlines regulatory non-compliance environmental incidents by fuel types: | | | |
| Year ended Dec. 31 | 2019 | 2018 | 2017 |
| Coal | 3 | 4 | 3 |
| Gas and renewables | 3 | 2 | — |
| Total regulatory non-compliance environmental incidents | 6 | 6 | 3 |
We also continue to track and manage all non-reportable (minor) environmental incidents, which helps us identify what causes an incident. Understanding the root cause of incidents helps with incident prevention planning and education.
Typical spills that could occur at our operation sites are hydrocarbon spills. Spills generally happen in low environmental impact areas and are almost always contained and fully recovered. It is extremely rare that we experience large spills, which would adversely impact the environment and the Corporation. Spills that do occur are always addressed with a critical time factor. The estimated volume of spills in 2019 was 530 m3 (2018 - 5 m3). Spill volumes in 2019 were higher due to a 527 m3 spill at our Sarnia cogeneration facility. This was not a traditional product spill and was a wastewater effluent limit exceedance from a sump. There was no enforcement action associated with this spill.
Air Emissions
Our coal facilities emit a number of air emissions that we track, analyze and report to regulatory bodies. We also work on mitigation solutions depending on the type of air emission. We report our major air emissions from coal, which includes NOx, SO2, particulate matter and mercury. We will continue to reduce air emissions in our existing fleet through our conversion and retirement of coal units in Alberta and Washington State. We are well underway and remain on track to achieve our target of 95 per cent SO2 emission reductions over 2005 levels by 2030. Since 2005, we have reduced SO2 emissions by 77 per cent. As noted above, we are on track to achieve our SO2 target by 2025, well ahead of our 2030 goal. This allows flexibility as we convert coal facilities to natural gas and expand our natural gas fleet. We continue to model and evaluate this target to ensure a balance of growth and appropriate air emission reductions. We continue to capture 80 per cent of mercury emissions at our coal plants and by 2025, mercury emissions will be eliminated following the coal-to-gas conversions. Particulate matter and SO2 emissions will also be virtually eliminated or considered negligible.
None of our Alberta coal facilities are located within 50 kilometres of dense or urban populations, but our Centralia coal facility in Washington State is 40 kilometres from a dense or urban population. As per guidance from SASB, “a facility is considered to be located near an area of dense population if it is located within 49 kilometres of an area of dense population” (being deemed to be a "minimum population of 50,000 persons"). The Centralia facility has two units and we are retiring one unit at the end of 2020 and the additional unit at the end of 2025, at which time air emissions from our coal facilities will be eliminated.
Our gas facilities emit low levels of NOx that triggers reporting obligations to national regulatory bodies. These gas facilities also produce trace amounts of SO2 and particulate matter, but at levels that are deemed negligible and do not trigger any reporting requirements or compliance issues. Many of our gas facilities are located in very remote and unpopulated regions, away from dense urban areas. Our Sarnia, Windsor, Ottawa and Fort Saskatchewan gas facilities are our only facilities with air emissions within 49 kilometres of dense or urban environments.
Our total air emissions in 2019 decreased compared with 2018 levels. Specifically, NOx was reduced eight per cent, mercury was reduced three per cent, particulate matter was reduced one per cent and SO2 was reduced 18 per cent over 2018 levels. Reduction in most emissions were largely due to an increase in co-firing (gas and coal) at our Alberta thermal facilities. Particulate matter emissions were adjusted historically to reflect our estimation on the level of PMs from road dust at our Alberta mining operations. We continue to mature our ability to estimate this data in line with guidance from Government of Canada.
TRANSALTA CORPORATION M77
Management’s Discussion and Analysis
| | | | | | | | | | | |
| Year ended Dec. 31 | 2019 | 2018 | 2017 |
| Sulphur dioxide (tonnes) | 15,900 | | 19,300 | 36,200 | |
| Nitrogen dioxide (tonnes) | 25,800 | | 28,000 | 44,400 | |
| Particulate matter (tonnes) | 8,200 | | 8,400 | 11,400 | |
| Mercury (kilograms) | 60 | 70 | 110 |
Water
Our principal water use is for cooling and steam generation in our coal and gas plants, but our hydro operations also require water flow for operations. Water for coal and gas operations is withdrawn primarily from rivers where we hold permits to withdraw water and must adhere to regulations on the quality of water that is discharged. The difference between withdrawal and discharge, representing consumption, is due to several factors, which includes evaporation loss and steam production for customers. Typically, TransAlta withdraws in the range of 220-240 million m3 of water across our fleet. In 2019 we withdrew 286 million m3 (2018 – 245 million m3) and returned approximately 218 million m3 (2018 – 208 million m3) back to its source or 76 per cent. Overall water consumption was 68 million m3 (2018 – 37 million m3). Water withdrawal and consumption was much higher in 2019 due to increased production at our Centralia coal facility. Production was up 1,787 GWh in 2019 compared to 2018, due mainly to higher merchant pricing in the first half of 2019 and timing of dispatch optimization.
Our historical 2017 water from environment volume was revised in 2019 as a result of an adjustment to water volumes from our South Hedland facility. South Hedland began commercial operations in 2017 and water data was reported in an incorrect unit. This adjustment resulted in our 2017 water from environment changing from 213 m3 to 211 m3. Subsequently, water consumption (water from environment minus water to environment) also changed as a result and was revised from 41 m3 to 39 m3.
The following represents our total water consumption (million m3) over the last three years:
| | | | | | | | | | | |
| Year ended Dec. 31 | 2019 | 2018 | 2017 |
| Water withdrawal | 286 | 245 | 211 |
| Water discharge | 218 | 208 | 172 |
| Total water consumption | 68 | 37 | 39 |
Our largest water withdrawal and discharge occurs at our Sarnia gas cogeneration facility (which produces both electricity and steam for our customer). The facility operates as a once-through non-contact cooling system for our steam turbines. This means large amounts of water flow in and out of the system, as opposed to more advanced technology, which recycles water in cooling towers (more of a closed system). Despite large withdrawals from the adjacent St. Clair River to support our Sarnia operations, we return approximately 93 per cent of the water withdrawn. Water from this source is currently at "low risk" as per analysis from the SASB-endorsed Aqueduct Water Risk Atlas tool.
The Aqueduct Water Risk Atlas tool also highlights that water risk is high at our interior and southern Western Australia facilities due to high interannual variability in the region. Interannual variability refers to wider variations in regional water supply from year to year. Our water supply at these facilities is provided at no cost under PPAs with our mining customers, hence our risk is significantly mitigated. In addition, conservation and re-use strategies aimed at recycling water for mining operational needs have been developed. All water used in the region is sourced from scheme water, and with gas and diesel turbine water use, water wash techniques and frequency of activities are continually modified to minimize consumption and environmental impact. At the South Hedland facility in Western Australia, water risk is also high due to the risk of flooding in the region. The South Hedland facility was built above normal flood levels to mitigate potential risk from flooding. During a recent category 4 cyclone event in the area and associated flooding in the region, the South Hedland facility stayed dry and continued to generate power for the region. In addition, the South Hedland facility has developed a Water Efficiency Management Plan with Water Corporation WA, the principal supplier of water, wastewater and drainage services in Western Australia. Initiatives are aimed at reducing water consumption and costs through innovative technology and efficiencies identified through plant management.
In southern Alberta, following the flood of 2013, our hydro facilities are being used for a greater water management role than they have played in the past. In 2016, we signed a five-year agreement with the Government of Alberta to manage water on the Bow River at our Ghost reservoir facility to aid in potential flood mitigation efforts, as well as at our Kananaskis Lakes System (which includes Interlakes, Pocaterra and Barrier) for drought mitigation efforts.
TRANSALTA CORPORATION M78
Management’s Discussion and Analysis
Land Use
The largest land use associated with our operations is for surface mining of coal. Of the three mines we have operated, the Whitewood mine in Alberta is completely reclaimed and the land certification process is ongoing. Our Centralia mine in Washington State is currently in the reclamation phase and we have adopted a target to fully reclaim this mine by 2040. Our Highvale mine in Alberta is actively mined with certain sections undergoing reclamation. Our reclamation plans at Highvale are set out on a life-cycle basis and include contouring disturbed areas, re-establishing drainage, replacing topsoil and subsoil, re-vegetation and land management. Our mining practice incorporates progressive reclamation where the final end use of the land is considered at all stages of planning and development.
In 2019, we reclaimed 114.9 acres (46.5 hectares) at our Highvale mine, which was above our target of 110 acres (45 hectares). We also reclaimed 160.6 acres (65 hectares) of land at our Centralia mine.
Across our mining operations, to date we have reclaimed approximately 12,000 acres (4,800 hectares), which is approximately 38 per cent of land disturbed. Since 1991, we have planted approximately 2.5 million trees as part of this reclamation work.
Waste
In 2019 our operations generated approximately 1.5 million tonnes of primarily non-hazardous waste (2018 - 1.6 million tonnes). Only 0.1 per cent of waste volumes are hazardous materials. In 2019, only 0.1 per cent of waste was directed to landfill. From the remaining 99.9 per cent, 50 per cent was returned to the mine (ash from coal combustion), 49 per cent was reused and the remaining 0.4 per cent was recycled. Historical 2018 waste volumes were revised in 2019 due to misreported volumes of ash disposal from our Keephills facility.
Our reuse waste or byproduct waste is generally sold to third parties. Byproduct sales and associated annual revenue generation typically ranges from $25 million to $35 million. Our operating teams are diligent at not only minimizing waste, but also maximizing recoverable value from waste. Over the years, we have invested in equipment to capture byproducts from the combustion of coal, such as fly ash, bottom ash, gypsum and cenospheres, for subsequent sale. These non-hazardous materials add value to products like cement and asphalt, wallboard, paints and plastics.
Energy Use
TransAlta uses energy in a number of different ways. We burn coal, gas and diesel to generate electricity. We harness the kinetic energy of water and wind to generate electricity. We also generate electricity from the sun. In addition to combustion of fuel sources, we also track combustion of gasoline or diesel in our vehicles and the electricity use and fuel use for heating (such as natural gas) in the buildings we occupy. Knowledge of how much energy we use allows us to optimize and create energy efficiencies. As an electricity generator, we continually and consistently look for ways to optimize or create efficiencies related to the use of energy. As an example, in 2019 we supported a study conducted by Stanford University to understand how to improve wind production. The research showed that angling turbines slightly away from the wind can boost energy produced and even out variable supply. Our coal-to-gas converted plants are also expected to see a reduction in total energy use, as the utilization of these plants is expected to be lower than historical utilization levels.
The following captures our energy use (millions of gigajoules). Energy use declined by four per cent over 2018 primarily as a result of reduced power production (lower plant utilization) at Alberta thermal.
| | | | | | | | | | | |
| Year ended Dec. 31 | 2019 | 2018 | 2017 |
| Coal | 296.0 | 309.8 | 447.4 |
| Gas and renewables | 49.1 | 48.6 | 49.4 |
| Corporate | 0.1 | 0.1 | 0.1 |
| Total energy use | 345.2 | 358.5 | 496.9 |
TRANSALTA CORPORATION M79
Management’s Discussion and Analysis
Weather
Abnormal weather events can impact our operations and give rise to risks. Due to the nature of our business, our earnings are sensitive to weather variations from period to period. Variations in winter weather affect the demand for electrical heating requirements. Variations in summer weather affect the demand for electrical cooling requirements. These variations in demand translate into spot market price volatility. Variations in precipitation also affect water supplies, which in turn affect our hydroelectric assets. Also, variations in sunlight conditions can have an effect on energy production levels from our solar farm. Variations in weather may be impacted by climate change resulting in sustained higher temperatures and rising sea levels, which could have an impact on our generating assets. Ice can accumulate on wind turbine blades in the winter months. The accumulation of ice on wind turbine blades depends on a number of factors, including temperature and ambient humidity. The accumulation of ice on wind turbine blades can have a significant impact on energy yields, and could result in the wind turbine experiencing more downtime. Extreme cold temperatures can also impact the ability of wind turbines to operate effectively and this could result in more downtime and reduced production. In addition, climate change could result in increased variability to our water and wind resources.
Our generation facilities and their operations are exposed to potential damage and partial or complete loss, resulting from environmental disasters (e.g. floods, high winds, fires and earthquakes), equipment failures and other events beyond our control. Climate change can increase the frequency and severity of these extreme weather events. The occurrence of a significant event that disrupts the operation or ability of the generation facilities to produce or sell power for an extended period, including events that preclude existing customers from purchasing electricity, could have a material adverse effect on us. Our generation facilities could be exposed to effects of severe weather conditions, natural or man-made disasters and other potentially catastrophic events such as a major accident or incident at our sites. In certain cases, there is the potential that some events may not excuse us from performing our obligations pursuant to agreements with third parties. The fact that several of our generation facilities are located in remote areas may make access for repair of damage difficult. Refer to the Governance and Risk Management section of this MD&A for further discussion on weather-related risk.
During the past five years, deviations from expected weather patterns had the following impacts on our annual financial results:
▪Warm weather in Alberta in 2015 increased derates at our coal facilities due to its impact on the Sundance cooling ponds. These cooling ponds are susceptible to warm weather; however, we anticipate that decreased coal production from the retirement of Sundance Units 1 and 2, respectively, in the medium term will reduce the stress from such occurrence; and
▪Our Highvale mine in Alberta was subjected to significant rain starting in August 2016, which resulted in several weeks of flooding and threatened our coal deliveries. We focused on improving drainage infrastructure and using stockpiles to mitigate future risks.
Climate Change
We believe in open and transparent reporting on material impacts relating to climate change. Our climate change reporting is structured as per guidance from the Financial Stability Board's Task Force on Climate-Related Financial Disclosure recommendations. The following highlights our management, performance and leadership of climate-change-related impacts. For more detailed information, please visit our Climate Change Management webpage at www.transalta.com/sustainability/climate-change-management.
Key Messages
▪The GSSC includes in its mandate that it will review guidelines and practices relating to environmental protection and the Corporation's plans with respect to environmental impact;
▪Our strategy involves moving away from GHG-intensive coal and achieving 100 per cent clean energy by 2025, represented by renewables and gas;
▪Our business is showing resilience to two degrees of global warming by reducing GHG emissions – we have a target to reduce 19.7 million tonnes of CO2e by 2030 over 2015 levels. To date we have achieved 59 per cent of this target;
▪We are well positioned to build renewable energy facilities and lower-carbon gas facilities to support customer sustainability goals to decarbonize; and
▪We have reduced 21 million tonnes of CO2e since 2005, which is a 50 per cent reduction over the time period.
TRANSALTA CORPORATION M80
Management’s Discussion and Analysis
Governance
The highest level of oversight on climate-change-related business impacts is at our Board level, specifically by the GSSC and the AFRC. Macro issues and opportunities such as coal GHG emissions and the phase-out of coal power generation, cost-competitiveness of renewable energy and customer preferences toward lower carbon energy have been at the forefront of strategic discussions with our executive and Board and reflected in our actions to move away from coal, establish a 2030 GHG reduction target and grow our generation capacity from renewable energy and gas.
Our GSSC has oversight of climate-related issues as noted in the GSSC Charter. The GSSC meets on a quarterly basis. One of the mandates of the GSSC Charter is to monitor and assess climate change risks and compliance with associated legislation and public reporting. The GSSC also reviews guidelines and practices relating to environmental protection, including the mitigation of pollution and climate change and considers whether the Corporation’s policies and practices relating to the environment are being effectively implemented and advises regarding the development of policies and practices regarding climate change, greenhouse gas and other pollutants".
Strategy
TransAlta, and the electricity sector in general, is at the forefront of reducing GHG emissions, utilizing innovation with lower-carbon and zero-carbon solutions (e.g., renewable energy, natural gas, distributed power generation, battery storage etc.) and are showing a path to resiliency in a low-carbon world. In addition to climate resiliency, front of mind for TransAlta and our sector is reliability of electricity supply and affordability for customers. To support our own path to reduce our GHG footprint and ensure climate resiliency, we have a corporate goal to reduce our GHG emissions by 60 per cent by 2030 over 2015 levels, while growing renewable energy and natural gas. We believe natural gas plays a strong role in supporting grid reliability and supporting customer goals of affordability. Scenario modelling of our GHG target shows that meeting our GHG target aligns us, under many scenarios, with science-based target setting. We have not officially validated a science-based target, but continue to monitor and model our future performance with the Sectoral Decarbonization Approach from the Science Based Targets Initiative.
Our business units and operations consistently seek energy-efficiency improvements, opportunities to integrate clean combustion technologies and development of emissions offset portfolios to achieve emissions reductions at competitive costs. We seek investment in climate-change-related mitigation solutions, such as renewable energy development, where we can maximize value creation for our shareholders, local communities and the environment. Conversion of our large coal fleet to gas-fired generation highlights this approach, which will allow us to run our assets longer than the federally mandated coal retirement schedule. Our goals for undertaking such actions are to enhance value for our shareholders, ensure low-cost and reliable power and reduce our GHG impact.
Our investments and growth in renewable electricity are highlighted by our diverse portfolio of renewable energy-generating assets. We currently operate close to 2,400 MW of hydro, wind and solar power. In 2019, we completed construction and commercial operation of an additional 119 MW of wind generation in the US. Today our diversified renewable fleet makes us one of the largest renewable producers in North America, one of the largest producers of wind power in Canada and the largest producer of hydro power in Alberta. Production from renewable electricity in 2019 resulted in avoidance of approximately 1.6 million tonnes of CO2e, which is equivalent to removing over 620,000 vehicles from North American roads over the same year.
As previously noted, we seek to commoditize carbon through trading and the generation and sale of environmental attributes. Annual revenue generation from the sale of environmental attributes (Alberta carbon offsets and RECs) in 2019 was $28 million.
Risk Management
Climate change risks are monitored through our company-wide risk management processes and are actively managed. Climate change risks and opportunities are identified at the Board level, executive and management level, business unit level (coal, gas, wind, solar and hydro) and through our corporate function (e.g. government relations, regulatory, emissions trading, sustainability, commercial, customer relations and investor relations). The business unit and corporate functions work closely together and provide information on risks and opportunities to management, the executive team and the Board.
Climate change risks at the asset or business unit level are identified through our Environmental Management Systems, asset management function and systems, our energy and trading business, active monitoring, active participation/communication with stakeholders, liaison with our corporate function, active participation in working groups and more.
Our climate change risks are divided into two major categories: (1) risks related to the transition to a lower-carbon economy, and (2) risks related to the physical impacts of climate change.
TRANSALTA CORPORATION M81
Management’s Discussion and Analysis
1.Transition Risks
We seek to understand the impact on our business as the world shifts to a lower carbon society. We participate in ongoing decisions related to climate policy and regulation.
Policy and Legal Risks
Ongoing and Recently Passed Environmental Legislation
Changes in current environmental legislation do have, and will continue to have, an impact upon our operations and our business. For further details, see below and the Governance and Risk Management section of this MD&A.
Canadian Federal Government
Federal Carbon Pricing on GHG
On June 21, 2018, the Canadian federal Greenhouse Gas Pollution Pricing Act ("GGPPA") came into force. Under the GGPPA, the Canadian federal government implemented a national price on GHG emissions. The price began at $20 per tonne of CO2e emissions in 2019, and will rise by $10 per year until reaching $50 per tonne in 2022. In 2022, there will be a review of the Output-Based Pricing Standard and other aspects of the GGPPA.
On Jan. 1, 2019, the GGPPA's backstop mechanisms came into force in provinces and territories that did not have an independent carbon pricing program or where the existing program was not deemed equivalent to the federal system. These included Ontario, Manitoba, New Brunswick, Saskatchewan, Prince Edward Island, Yukon and Nunavut. The backstop mechanism has two components: a carbon levy for small emitters ("Carbon Tax") and regulation for large emitters called the Output-Based Pricing Standard ("OBPS"). The Carbon Tax sets a carbon price per tonne of GHG emissions related to transportation fuels, heating fuels and other small emission sources.
The OBPS regulates large emitters' carbon intensity by setting a sectoral performance standard (benchmark) of GHG emissions per unit of production (e.g. tonnes CO2e/MWh) for electricity generators. Emitters exceeding the benchmark generate carbon obligations and those emitters that perform below the benchmark generate emission performance credits. Emitters can meet their obligations by reducing their emission intensity, buying carbon credits from others (offsets or emission performance credits) or making compliance payment to the government.
Other jurisdictions were compliant with the GGPPA so did not have the backstop mechanism imposed in 2019. These jurisdictions must file and have their carbon pricing programs approved annually. Over future annual compliance periods, if parts or all of a province's GHG regulations fall out of compliance with the GGPPA, the federal government will impose its backstop mechanisms.
Gas Regulation
On Dec. 18, 2018, the federal government published the Regulations Limiting Carbon Dioxide Emissions from Natural Gas-fired Generation of Electricity. Under the regulations, new and significantly modified natural gas fired electricity facilities with a capacity greater than 150 MW must meet a standard of 420 tonnes CO2e per gigawatt hour ("tonnes CO2e/GWh") to operate. For units with a capacity between 25 MW and 150 MW, their standard was set at 550 tonnes CO2e/GWh. Facilities with a capacity less than 25 MW have no standard.
Under the regulations, coal-to-gas conversions will also eventually have to meet a standard of 420 tonnes CO2e/GWh. If the first year performance test after conversion meets certain emission standards it will not have to meet the 420 tonnes CO2e/GWh standard for several additional years past the end of its useful life.
Coal Regulation
On Dec. 18, 2018, amendments to the Reduction of Carbon Dioxide Emissions from Coal-Fired Generation of Electricity Regulations came into force under the Canadian Environmental Protection Act, 1999. The amended regulations will require coal units to meet an emission level of 420 tonnes CO2e/GWh by the earlier of end-of-life under the 2012 regulations or Dec. 31, 2029.
Clean Fuel Standard
In 2016, the Canadian federal government announced plans to consult on the development of a Clean Fuel Standard ("CFS") to reduce Canada’s GHG through the increased use of lower carbon fuels, energy sources and technologies. The objective of the regulation is to achieve 30 million metric tonnes of annual reductions in GHG emissions by 2030. The CFS will establish life-cycle carbon intensity requirements separately for liquid, gaseous and solid fuels that are used in transportation, industry and buildings. Under the proposed policy, coal combusted at facilities that are covered by coal-fired electricity regulations will be exempt from the regulation. Natural gas used for electricity production is currently expected to be included under the gaseous stream.
TRANSALTA CORPORATION M82
Management’s Discussion and Analysis
Consultation on the gaseous stream began in 2019 and will continue into 2020. Publication of the draft regulations for the gaseous stream will occur in late 2020 with final regulations expected in 2021. The gaseous stream regulation is currently expected to come into force by 2023. TransAlta continues to be engaged in the consultation process.
Alberta
Large Emitter Greenhouse Gas Regulations
On Jan. 1, 2018, the Alberta government transitioned from the Specified Gas Emitters Regulation ("SGER") to the Carbon Competitiveness Incentive Regulation. Under the CCIR, the regulatory compliance moved from a facility-specific compliance standard to a product or sectoral performance compliance standard. In 2019, the CCIR price was $30/tonnes CO2e, and the electricity sector performance standard was set at 0.370 tonnes CO2e/MWh and set to decline annually. All renewable assets that received offset crediting under the SGER continued to receive credits under CCIR on a one-to-one basis. All other renewable assets that did not receive offset crediting under SGER were able to "opt-in" under CCIR and received carbon crediting up to the electricity sector performance standard until CCIR's termination at the end of 2019. Once wind projects' offset crediting standard under the SGER protocol ends, these projects will also be able to opt-in under CCIR system and be credited up to the performance standard.
On Apr. 16, 2019, the United Conservative Party ("UCP") won the Alberta provincial election with a majority government. The UCP committed to move from the CCIR to a new regulation called the Technology Innovation and Emissions Reduction ("TIER") regulation. TIER replaced CCIR on Jan. 1, 2020. For the electricity sector, there were negligible changes between CCIR and TIER with renewable facilities continuing to receive crediting. The carbon prices for TIER in 2020 will remain at $30/tonnes CO2e but Alberta has not yet confirmed future price increases in line with federal requirements. The performance standard benchmark remained at 0.370 tonnes CO2e/MWh. A review of TIER is not expected until 2023.
Facilities with emissions above the set benchmark will need to comply with TIER by: i) paying into the TIER Fund; ii) making reductions at their facility; iii) remitting emission performance credits from other facilities; or iv) remitting emission offset credits.
As required by the GGPPA, the Alberta government filed the TIER program details with the federal government. TIER was passed by the Alberta government on Oct. 29, 2019 and on Dec. 6, 2019 the federal government accepted the TIER regulation as compliant with the GGPPA for 2020.
Federal Pollution Pricing Fuel Charge (Fuel Charge)
The new UCP government repealed the Alberta carbon levy on May 30, 2019. The federal government will replace the repealed carbon levy with the Fuel Charge on Jan. 1, 2020. Alberta TIER-covered facilities are exempt from the Fuel Charge.
British Columbia
Beginning Apr. 1, 2018, BC increased its carbon tax rate to $35/tonnes CO2e and committed to raise the price $5 per year until it reaches $50 per tonne in 2021.
Ontario
On Oct. 31, 2018, the Ontario government passed the Cap and Trade Cancellation Act. This Act removed all existing provincial carbon emission regulations and costs on large emitters.
Large Emitter Greenhouse Gas Regulations
The Canadian federal GGPPA requires provinces to have greenhouse gas regulations and prices in place that align with the federal GGPPA. On Oct. 23, 2019, the federal government announced that Ontario large emitters would be subject to the federal backstop OBPS regulation. All covered industry facilities with annual emissions over 50,000 tonnes CO2e are automatically covered with an opt-in provision for those emitters between 10,000 and 50,000 tonnes CO2e annually. Ontario large emitters are currently subject to the federal backstop OBPS regulation.
On July 4, 2019, the Government of Ontario released the final regulations for the provincial Greenhouse Gas EPS. The EPS establishes GHG emission limits on covered facilities. Large emitters generating over 50,000 tonnes CO2e or more per year will be covered with an opt-in provision for those emitters between 10,000 and 50,000 tonnes CO2e annually. The carbon emissions limit for electricity is set at 420 tonnes CO2e/GWh. The program also provides a method that accounts for the carbon efficiency of cogeneration units. The federal government has not accepted the EPS as compliant with the GGPPA so the OPBS remains in force for reporting purposes for 2019 obligations.
TRANSALTA CORPORATION M83
Management’s Discussion and Analysis
Facilities with emissions above the set reduction requirements can comply by: i) buying excess emission units from the regulator; ii) making reductions at their facility; or iii) using emission performance units generated by facilities emitting below their emission intensity limit. The first compliance period under the EPS will begin on Jan. 1 in the year in which Ontario is removed from the list of provinces to which the federal OBPS applies. Ontario has submitted the EPS for federal review.
Federal Pollution Pricing Fuel Charge (Fuel Charge)
The federal government replaced the repealed Ontario carbon levy with the Fuel Charge on Jan. 1, 2019. Ontario facilities covered by OBPS are exempt from the Fuel Charge.
Washington
In 2010, the Washington Governor's office and State Department of Ecology negotiated agreements with TransAlta related to the operation of Centralia’s two coal-fired electricity generating units. TransAlta agreed to retire its two Centralia coal units; one in 2020 and the other in 2025. This agreement is formally part of the state’s climate change program. We currently believe that there will be no additional GHG regulatory burden on US Coal given these commitments. The related TransAlta Energy Transition Bill was signed into law in 2011 and provides a framework to transition from coal to other forms of generation in the State of Washington.
Massachusetts
The Solar Renewable Electricity Credit I (SREC I) program carved out from Massachusetts’ Renewable Portfolio Standard (RPS) an initial quantity of 400 MW from small solar facilities of 10 MW or less. The initial SREC I program size was expanded and replaced by a lower-valued SREC II program. In 2018, the solar incentive program evolved into the current Solar Massachusetts Renewable Target Program that further reduced the incentive levels.
The initial SREC I program’s volume target was achieved, and qualified projects under SREC I continue to generate SREC I credits for their first 10 years post-Commercial Operation Date. SREC I facilities then generate Class 1 RECs under the Massachusetts RPS for the remainder of their operational life.
Under Massachusetts' net metering program, qualified facilities connect with the local utility and generate net metering credits. Net metering credits offset the delivery, supply and customer charges and can be sold to customers from remote or on-site qualifying facilities. In 2016, the net metering program was updated to reduce the value of the net metering credits by reducing the offset to only energy costs. New projects are impacted once the net metering program volume reaches 1,600 MW. Existing facilities were grandfathered and continue to receive the full, original cost offset treatment for a period of 25 years from initial commercial operation.
Australia
On Dec. 13, 2014, the Australian government enacted legislation to implement the Emissions Reduction Fund (the "ERF"). The AUD$2.55 billion ERF is the centrepiece of the Australian government's policy and provides a policy framework to cut emissions by five per cent below 2000 levels by 2020 and 26 to 28 per cent below 2005 emissions by 2030. The ERF's safeguard mechanism, commencing from July 1, 2016, is designed to ensure emissions reductions purchased by the Australian government through the ERF are not displaced by significant increases in emissions elsewhere in the economy. The ERF and its safeguard mechanism provide incentives to reduce emissions across the Australian economy.
The Australian government has also committed to develop a National Energy Productivity Plan with a target to improve Australia's energy productivity by 40 per cent between 2015 and 2030. The ERF is not expected to have a material impact on our Australian assets as a result of the Australian assets being primarily composed of gas-fired generation. In addition, on June 23, 2015, the federal Australian government also reformed the Renewable Energy Target ("RET") scheme. The RET should add at least 33,000 GWh of renewable sources by 2020. This would double the amount of large-scale renewable energy being delivered compared to current levels and result in approximately 23.5 per cent of Australia's electricity generation being sourced from renewable projects.
Technology Risks
Battery storage technology is an emerging risk to the large-scale power-generation model. Battery storage has the ability to enable greater adoption of renewables and result in a shift to a distributed power-generation model. We continue to evaluate battery storage for its financial viability, while monitoring the potential impact battery technology could have on natural gas power generation.
We have demonstrated upside in growing renewables and gas-powered generation. From 2000 to 2018, we have grown renewables capacity from approximately 900 MW to close to 2,400 MW.
TRANSALTA CORPORATION M84
Management’s Discussion and Analysis
Market Risks
Changing customer behaviour, reduced consumption and associated use of electricity could impact the demand for electricity; however, we believe this risk is mitigated somewhat by the global trend to increasingly electrify customer products, transport and more. Our low-carbon business model supports this type of future. Increased costs for natural gas supply from carbon pricing can impact us. Further discussion can be found in the Governance and Risk Management section of this MD&A. Use of renewable resources, such as the wind and sun, removes associated risk related to cost of supply.
Our Corporate function applies regionally specific carbon pricing, both current and anticipated, as a mechanism to manage future risks pertaining to uncertainty in the carbon market and as a safeguard to anticipate future impacts of regulatory changes on facilities. This information is directed to the business unit level for further integration. Identified climate change risks or opportunities and carbon pricing are recognized in the annual TransAlta long-and medium-range forecasting processes. We capture economic profit through generation of environmental attributes (such as carbon offsets and RECs) and through our emission trading function, which seeks to commoditize and profit from carbon trading.
Reputation Risks
Consumer trends appear to be moving in favour of renewable and cleaner electricity, which may make hydrocarbon options decreasingly popular. We are invested in natural gas as it provides vital support to the electricity system and is a lower-carbon fossil fuel. We already invest significantly in renewable energy and natural gas.
2. Physical Risks
As we learn more about the physical risks associated with climate change, and weather risk in general, we seek to understand further both acute and chronic risk, which could materially impact value creation from our operations.
Acute Risks
The TransAlta South Hedland facility in Western Australia was built with climate adaptation in mind. The plant is designed to withstand a category 5 cyclone, which can frequent the northwest region of Western Australia. Category 5 is the highest cyclone rating. Floods, which can occur in the area, have been mitigated by constructing the facility above the normal flood levels. In 2019, a category 4 cyclone hit this facility. Operations were not impacted and we were able to continue generating electricity through the storm, despite wide-spread flooding and shutdown of the nearby port and associated business activities.
Chronic Risks
We have not identified any chronic physical risks that could impact our operations. However, we continue to further our understanding and integration of climate modelling into our long-term planning.
Greenhouse Gas Emissions: Metrics and Targets
In 2019, we estimate that 20.6 million tonnes of GHGs with an intensity of 0.75 tonnes per MWh (2018 - 20.8 million tonnes of GHGs with an intensity of 0.77 tonnes per MWh) were emitted as a result of normal operating activities. Our reduction in GHG emissions is primarily the result of co-firing with gas and lower production volumes at our merchant Alberta coal facilities.
Our 2019 GHG data is reported to a number of different regulatory bodies throughout the year for regional compliance and as a result, may incur minor revisions as we review and report data. Any revisions would be reported historically in future reporting. As per the Kyoto Protocol, GHGs include carbon dioxide, methane, nitrous oxide, sulphur hexafluoride, nitrogen trifluoride, hydrofluorocarbons and perfluorocarbons. Our exposure is limited to carbon dioxide, methane, nitrous oxide and a small amount of sulphur hexafluoride. The majority of our estimated GHG emissions are comprised of carbon dioxide emissions from stationary combustion from coal and natural gas power generation. Emissions intensity data has been aligned with the “Setting Organizational Boundaries: Operational Control” methodology set out in The Greenhouse Gas Protocol: A Corporate Accounting and Reporting Standard developed by the World Resources Institute and the World Business Council for Sustainable Development. As per the methodology, TransAlta reports emissions on an operation control basis, which means that we report 100 per cent of emissions at facilities in which we are the operator. Emissions intensity is calculated by dividing total operational emissions by 100 per cent of production (MWh) from operated facilities, regardless of financial ownership.
TRANSALTA CORPORATION M85
Management’s Discussion and Analysis
The GHG Protocol Corporate Standard classifies a company’s GHG emissions into three scopes. Scope 1 emissions are direct emissions from owned or controlled sources. Scope 2 emissions are indirect emissions from the generation of purchased energy. Scope 3 emissions are all indirect emissions (not included in scope 2) that occur in the value chain of the reporting company, including both upstream and downstream emissions. Scope 1 emissions in 2019 were estimated to be 20.4 million tonnes CO2e and account for 99 per cent of emissions reported. All of our scope 1 emissions (100 per cent) are reported to national regulatory bodies in the country in which we operate. This includes: Australia (National Greenhouse Gas Emission Reporting), Canada (GHGPR) and the US (EPA). Scope 2 emissions were estimated to be 0.2 million tonnes CO2e. We estimate our scope 3 emissions to be in the range of six million tonnes.
The following are our GHG emissions broken down by business unit and by scope 1 and 2 in million tonnes CO2e:
| | | | | | | | | | | |
| Year ended Dec. 31 | 2019 | 2018 | 2017 |
| Coal | 18.1 | 18.3 | 27.4 |
| Gas and renewables | 2.5 | 2.5 | 2.5 |
| Total GHG emissions | 20.6 | 20.8 | 29.9 |
| | | | | | | | | | | |
| Year ended Dec. 31 | 2019 | 2018 | 2017 |
| Scope 1 | 20.4 | 20.6 | 29.7 |
| Scope 2 | 0.2 | 0.2 | 0.2 |
| Total GHG emissions | 20.6 | 20.8 | 29.9 |
All of our reported 2019 and historical GHG emissions are verified by Ernst & Young to a level of limited assurance. An assurance statement can be found in the back of this Integrated Annual report. In addition, GHG emissions are verified to a level of reasonable assurance in locations where we operate within a carbon regulatory framework. In Alberta we verify GHG emissions through the TIER program and as a result 51 per cent of our total scope 1 emissions are also verified to a level of reasonable assurance. Our GHG emissions are calculated using a number of different methodologies depending on the technologies available at our facilities.
Our target is to reduce 60 per cent or 19.7 million tonnes of GHG emissions by 2030 over 2015 levels, which is line with UN Sustainable Development Goal Goal 13, Climate Action. Since 2015 we have reduced 11.6 million tonnes, which represents a reduction of 36 per cent. By 2030, we expect to have reduced close to 30 million tonnes over 2005 levels, after adjusting for any new growth over this period.
The following highlights our GHG emission reductions since 2005 and our targeted emissions in 2030 (in line with our GHG target). The actual GHG emissions for the Corporation in 2030 will vary from that presented below depending on, among other things, the growth of the Corporation, including its on-site generation business.
| | | | | | | | | | | |
| Year ended Dec. 31 | 2030 | 2019 | 2005 |
| Total GHG emissions | 12.5 | 20.6 | 41.9 |
In 2019, TransAlta maintained its scoring on the Carbon Disclosure Project Climate Change investor request. Our overall score was a B, which places us as ahead of most companies in North America. The average CDP score for North America was a C.
TRANSALTA CORPORATION M86
Management’s Discussion and Analysis
Intellectual Capital
At TransAlta, we define intellectual capital as our knowledge-based assets. Measuring these assets serves two purposes. First, we seek to understand our knowledge-based assets to improve our management and performance of these assets. Second, we seek to understand these assets to communicate their real value. The following highlights some of our knowledge-based assets, that we believe provide us with a competitive edge and contribute to shareholder value.
Brand Recognition
Our employee culture is supported by a purpose-based, long-term and sustainable business strategy: growth in affordable and clean electricity generation. TransAlta has operated power-generation assets for over 100 years, which reflects this approach to long-term and sustainable business. A long-term commitment to business and partnerships lends itself to goodwill and brand recognition, something we value and don’t take for granted. We believe our low-cost and clean electricity strategy, supported by our internal values and sustainable approach to business, will help reinforce and continue to increase our brand recognition positively.
We are a leader in sustainability – publishing our first sustainability report in 1994. We are the first company in Alberta to combine our sustainability report with our financial report and we have been recognized by EXCEL Partnership for demonstrating best-in-class examples in sustainability reporting. Being members of working groups such as the EXCEL Partnership, the Energy Sector Sustainability Leadership Initiative, Canadian Electricity Association Steering Committee and Future-Fit provides validation and support with our sustainability strategy. We are listed on many of these organizations’ websites, which further increases awareness of our sustainability practices. In addition, in early 2020, TransAlta was one of 325 companies globally to be added to the Bloomberg Gender-Equality Index. We believe that as we continue to invest in and strengthen our sustainability initiatives, the association of the TransAlta brand with sustainability will increase.
Diversified Knowledge
The experience and acumen of our employees further enhances our capital value creation. Our business has been operating for over 100 years, and many of our employees have been with us for over 30 years.
Our experience in developing and operating power-generation technologies is highlighted below. The transition of our coal assets to natural gas is a natural fit with our operating experience. Relative to coal, natural gas operations have lower operating costs, have increased operating reliability and flexibility, require less manpower and reduce GHG and air emissions. Our trading and marketing business complements our knowledge of operating power-generation assets.
| | | | | |
| Power-Generation Type | Operating Experience (years) |
| Hydro | 108 |
| Natural Gas | 69 |
| Coal | 69 |
| Wind | 17 |
| Solar | 4 |
Innovation: Idea Generation and Project Management
As innovation continues to disrupt and advance the global marketplace, we believe that our business, employees, systems and processes must remain competitive, agile and adaptive. Project Greenlight has been a key driver in ensuring the Corporation continues to provide year-over-year improvements in these areas. The program is focused on bottom-up innovation, which means ideas are generated by employees. Emphasizing bottom-up innovation across the Corporation has resulted in a strong culture of idea generation, where employee ideas are developed and advanced into business cases, adhering to project management best practices to ensure the delivery and success of the initiative.
For further details on our investment in our workforce, please see the Talent and Employee Development discussion in the Human Capital section of this MD&A.
TRANSALTA CORPORATION M87
Management’s Discussion and Analysis
Innovation: Applied Technologies
TransAlta has been at the forefront of innovation in the power-generation sector since the early 1900s when we developed hydro assets. We have been an early adopter and developer of wind technology in Canada and are now one of the largest wind generators in the country. Today we run a Wind Control Centre that monitors, to the second, every wind turbine we operate across North America. In 2015, we made our first investment in solar technology with the purchase of a 21 MW solar facility in Massachusetts.
As we move towards our goal to be a leading clean power company in Canada by 2025, we continue to seek solutions to innovate and create value for investors, society and the environment. This is evidenced by our announcements of the accelerated coal-to-gas conversion plans, the expansion of our Kent Hills wind farm in New Brunswick, the 90 MW Big Level and 29 MW Antrim wind projects recently completed in the US and the 207 MW Windrise wind project in Alberta. We have also announced the construction of our SemCAMS Cogeneration Project. Cogeneration is recognized by regulatory bodies for its efficiency in generating power compared to traditional methods. It reduces the natural gas required for several industrial processes by using high-efficiency steam production rather than boilers. The distributed system also provides independence from the power grid and avoids the need to construct additional transmission lines.
Battery storage is another technology we are investing in. TransAlta will begin construction on Alberta’s first utility-scale lithium-ion battery storage facility in March 2020, called WindCharger. This project is unique as it will use TransAlta’s existing Summerview Wind Farm to charge the battery, allowing WindCharger to be a truly renewable battery energy storage system. The project will use Tesla technology and will have a nameplate capacity of 10 MW with a total storage capacity of 20 MWh. TransAlta will receive co-funding for this project from Emissions Reduction Alberta. Commercial Operation for WindCharger will begin in June 2020. The potential exists for the expansion of this technology, and TransAlta is continually investigating the viability of battery storage at our various wind farm locations.
Our teams continuously explore the use of applied or new technologies to find solutions to expand or adapt our fleet in an ever-changing world. This helps protect our shareholder value and maintain delivery of reliable and affordable electricity. The following are further examples of how we have developed innovative solutions to optimize and maximize value from our fleet:
Operations Diagnostic Centre
TransAlta has run its Operations Diagnostic Centre (“ODC”) since 2008. The ODC monitors coal-fired, gas-fired and wind generating assets across Canada, the US and Australia. A centralized team of engineers and operations specialists remotely monitors our power plants for emerging equipment reliability and performance issues. ODC staff are trained in the development and use of specialized equipment monitoring software and can apply their experience to power plant operations. If an equipment issue is detected, the ODC notifies plant operations to investigate and remedy the issue before there is an impact to operations. This support is critical to reliability and performance of our operations. By way of example, if a wind turbine starts to underperform compared to the others, our operation team is notified and will work to investigate and remedy the issue. The monitoring, analysis and diagnostics completed by the ODC are focused on early identification of equipment issues based on longer-term trend analysis and complements day-to-day plant operations.
Data & Innovation
TransAlta created the Data & Innovation team in 2019 for the purpose of modernizing its data infrastructure and processes to take advantage of new opportunities in analytics and artificial intelligence. The Data & Innovation team is cross-functional, composed of data architects, data scientists, data analysts, software developers, engineers, project managers, and financial and systems analysts. The team focuses its efforts on the delivery and enhancement of TransAlta’s Modern Data Architecture, the rapid delivery of data-driven applications, the design and implementation of machine learning and artificial intelligence models and the advancement of process automation through the Robotic Process Automation Centre of Excellence.
TRANSALTA CORPORATION M88
Management’s Discussion and Analysis
2019 Sustainability Performance
Sustainability Targets and Results
Sustainability targets are strategic goals that support the long-term success of our business. Targets are set in line with business unit goals to manage key areas of concern for stakeholders and ultimately improve our environmental and social performance in these areas.
| | | | | | | | | | | |
| | Human and Intellectual | Results | Comments |
| 1. Reduce safety incidents | Achieve an Injury Frequency Rate (IFR) below 0.43 | Not Achieved | In 2019, our IFR was 0.58. We did not achieve our goal in 2019, but continue to evolve our safety culture and practice. In 2020 we will move away from IFR to strengthen our safety progress. In addition to reporting on TIF, we are also tracking Total Recordable Injury Frequency (TRIF). TRIF tracks the number of more serious injuries and excludes minor first aids, relative to exposure hours worked. TRIF provides us with the opportunity to target and monitor our significant injuries. It is also an industry-recognized safety metric and allows us to compare and benchmark our safety performance to that of our peers. |
| Achieve a Total Injury Frequency (TIF) rate below 1.58 | Achieved | In 2019, we achieved a TIF of 1.12 compared to 1.91 in 2018. This decrease was a direct result of our back to basics approach with respect to safety. Specifically, we focused on hazard identification (including audits and inspections), housekeeping and improved contractor management practices across the fleet. |
| | | | |
| | Natural | Results | Comments |
| 2. Minimize fleet-wide environmental incidents | Keep recorded incidents (including spills and air infractions) below five | Not achieved | In 2019, we recorded nine environmental incidents, which was above our target. We continue to target progress in this area and have divided our environmental incident reporting for 2020 into two categories: significant environmental incidents and non-compliance environmental incidents. We define non-compliance environmental incidents as events that involved a non-compliance event but did not have an impact on the environment. In 2019 only three of our nine recorded environmental incidents had a direct environmental impact. Further information on these incidents can be found in the Environmental Incidents and Spills section in the Natural Capital section in this MD&A. |
| 3. Increase mine reclaimed acreage | Replace annual topsoil at Highvale mine at a rate of
110 acres/year | Achieved | In 2019, as part of ongoing reclamation activities at our Highvale mine, we replaced 114.9 acres of topsoil. |
TRANSALTA CORPORATION M89
Management’s Discussion and Analysis
| | | | | | | | | | | |
| 4. Reduce air emissions | Achieve a 95 per cent reduction from 2005 levels of TransAlta SO2 emissions and 50 per cent reduction in NOx emissions by 2030 | On track | We are well on track to achieve our target of 95 per cent emission reductions of SO2 and NOx by 2030. Since 2005, we have reduced NOx emissions by 61 per cent and SO2 emissions by 77 per cent. In 2019 we reduced approximately 2,000 tonnes of NOx emissions and 3,500 tonnes of SO2 emissions over 2018 levels. |
| 5. Reduce GHG emissions Our GHG goal and targets support UN Sustainable Development Goal 13: Climate Action related to ensuring “integration of climate change measures into national policies, strategies and planning" | Our goal is to reduce our total GHG emissions in 2030 to 60 per cent below 2015 levels, in line with a commitment to the UN SDGs and prevention of two degrees Celsius of global warming (our GHG and clean power targets assume reasonably anticipated growth and operating scenarios) | On track | We are well on track to achieve our target of 60 per cent GHG emission reductions by 2030. Since 2015, we have reduced GHG emissions by 36 per cent. In 2019, we reduced approximately 0.2 million tonnes of CO2e over 2018 levels. |
| | | |
| | | | |
| | Social and Relationship | Results | Comments |
| 6. Support quality education for youth Our education goal and target support UN Sustainable Development Goal 4: Quality Education related to ensuring “inclusive and equitable quality education” and related to “eliminating gender disparities in education” | Support equal access to all levels of education for youth and Indigenous peoples through financial support and employment opportunities | Achieved | Support in 2019 included: provided bursaries to high school graduates through a partnership with Indspire, funded academic upgrading programs through SAIT, supported an Indigenous Leadership Program and maintained communication on employment opportunities through various mediums to support different access options for Indigenous communities. |
| | | |
| | | | |
| | Comprehensive | Results | Comments |
| 7. TransAlta will be a leading clean power company by 2025 | Convert at least two coal units at Sundance, Alberta and three coal units at Keephills, Alberta to gas-fired generation between 2020 and 2023 | On track | Progress in 2019 included: completed construction of our Pioneer Pipeline and transported our first gas to both Sundance and Keephills; agreed to purchase two 230 MW Siemens gas turbines to repower Sundance 5; and we announced our Clean Energy Investment Plan, which includes capital investments in our coal-to-gas conversions. |
| Our clean power goal and targets support the UN Sustainable Development Goal 7: Affordable and Clean Energy related to ensuring “access to affordable, reliable, sustainable and modern energy” | Aim that by 2025, 100 per cent of our owned net generation capacity will be from clean power (renewables and gas) | On track | We continued with our coal-to-gas transition plans in 2019, while announcing new renewable energy growth projects. |
| Seek new opportunities to grow our renewable portfolio of 2,265 MW wind, hydro and solar assets | On track | In 2019, we announced an agreement to purchase a 49 per cent interest in the 136.8 MW Skookumchuk wind project |
| | | |
| | | |
TRANSALTA CORPORATION M90
Management’s Discussion and Analysis
2020 Sustainable Development Targets
Our 2020 and longer-term sustainability targets support the long-term success of our business. Targets are set in line with business unit goals to manage key areas of concern for stakeholders and ultimately improve our environmental and social performance in these areas. We continue to evolve and adapt targets to focus on anticipated key areas of materiality to stakeholders. Targets are outlined below:
| | | | | | | | |
| ESG Alignment: Environment | | |
| TransAlta Sustainability Goal | TransAlta Sustainability Target | Alignment with UN SDG Target or Future-Fit Target |
| Minimize fleet-wide environmental incidents | Keep annual significant environmental incidents below two and keep environmental regulatory non-compliance incidents below four | Future-Fit Target BE08: "Operations do not encroach on ecosystems or communities" |
| Reclaim land utilized for mining | By 2040, complete full reclamation of our Centralia coal mine in Washington State | Future-Fit Target PP13: "Ecosystems are restored" |
| Reduce air emissions | By 2030, achieve a 95% reduction of SO2 emissions and a 50% reduction of NOx emissions below 2005 levels from TransAlta coal facilities | UN SDG Target 9.4: "By 2030, upgrade infrastructure and retrofit industries to make them sustainable, with increased resource-use efficiency and greater adoption of clean and environmentally sound technologies and industrial processes" |
| Reduce GHG emissions | By 2030, achieve company-wide GHG reductions of 60% below 2015 levels, in line with a commitment to the UN SDGs and prevention of 2ºC of global warming | UN SDG Target 13.2: "Integrate climate change measures into national policies, strategies and planning" |
| ESG Alignment: Social | | |
| TransAlta Sustainability Goal | TransAlta Sustainability Target | Alignment with UN SDG Target or Future-Fit Target |
| Reduce safety incidents | Achieve a Total Injury Frequency rate below 1.17 | UN SDG Target 8.8: "Protect labour rights and promote safe and secure working environments for all workers, including migrant workers, in particular women migrants, and those in precarious employment" |
| Support prosperous Indigenous communities | Support equal access to all levels of education for youth and Indigenous peoples through financial support and employment opportunities | UN SDG Target 4.5: "By 2030, eliminate gender disparities in education and ensure equal access to all levels of education and vocational training for the vulnerable, including persons with disabilities, Indigenous peoples and children in vulnerable situations" |
| ESG Alignment: Governance | | |
| TransAlta Sustainability Goal | TransAlta Sustainability Target | Alignment with UN SDG Target or Future-Fit Target |
| Strengthen gender equality | Achieve a quota of 50 per cent female representation on the Board by 2030 | UN SDG Target 5.5: "Ensure women’s full and effective participation and equal opportunities for leadership at all levels of decision making in political, economic and public life" |
| Achieve at least 40 per cent female employment among all employees of the Corporation by 2030 | |
| Maintain equal pay for women in equivalent roles as men | |
| Demonstrate leadership on ESG reporting within financial disclosures | Maintain our position as a leader on integrated ESG disclosure through increased annual alignment with leading sustainability disclosure frameworks | UN SDG Target 12.6: "Encourage companies, especially large and transnational companies, to adopt sustainable practices and to integrate sustainability information into their reporting cycle" |
| ESG Alignment: Environment and Social | | |
TRANSALTA CORPORATION M91
Management’s Discussion and Analysis
| | | | | | | | |
| TransAlta Sustainability Goal | TransAlta Sustainability Target | Alignment with UN SDG Target or Future-Fit Target |
| Leading clean power company by 2025 | By the end of 2025, convert coal facilities to gas through boiler conversions and combined-cycle repowering | UN SDG Target 9.4: "By 2030, upgrade infrastructure and retrofit industries to make them sustainable, with increased resource-use efficiency and greater adoption of clean and environmentally sound technologies and industrial processes" |
| No further coal generation by the end of 2025 and 100% of our owned net generation capacity will be from clean electricity (renewables and gas) | UN SDG Target 7.1: "By 2030, ensure universal access to affordable, reliable and modern energy services" |
| Develop new renewable projects that support customer sustainability goals to achieve both long-term power price affordability and carbon reductions | UN SDG Target 7.2: "By 2030, increase substantially the share of renewable energy in the global energy mix" |
| | |
TRANSALTA CORPORATION M92
Management’s Discussion and Analysis
Governance and Risk Management
Our business activities expose us to a variety of risks and opportunities including, but not limited to, regulatory changes, rapidly changing market dynamics and increased volatility in our key commodity markets. Our goal is to manage these risks and opportunities so that we are in position to develop our business and achieve our goals while remaining reasonably protected from an unacceptable level of risk or financial exposure. We use a multilevel risk management oversight structure to manage the risks and opportunities arising from our business activities, the markets in which we operate and the political environments and structures with which we interface.
Governance
The key elements of our governance practices are:
▪Employees, management and the Board are committed to ethical business conduct, integrity and honesty;
▪We have established key policies and standards to provide a framework for how we conduct our business;
▪The Chair of our Board and all directors, other than our President and Chief Executive Officer (“CEO”) are independent;
▪The Board is comprised of individuals with a mix of skills, knowledge and experience that are critical for our business and our strategy;
▪The effectiveness of the Board is achieved through robust annual evaluations and continuing education of our directors; and
▪Our management and Board facilitate and foster an open dialogue with shareholders and community stakeholders.
Commitment to ethical conduct is the foundation of our corporate governance model. We have adopted the following codes of conduct to guide our business decisions and everyday business activities:
▪Corporate Code of Conduct, which applies to all employees and officers of TransAlta and its subsidiaries;
▪Directors’ Code of Conduct;
▪Supplier's Code of Conduct;
▪Finance Code of Ethics, which applies to all financial employees of the Corporation; and
▪Energy Trading Code of Conduct, which applies to all of our employees engaged in energy marketing.
Our codes of conduct outline the standards and expectations we have for our employees, officers, directors, consultants and suppliers with respect to, among other things, the protection and proper use of our assets. The codes also provide guidelines with respect to securing our assets, avoiding conflicts of interest, respect in the workplace, social responsibility, privacy, compliance with laws, insider trading, environment, health and safety, and our commitment to ethical and honest conduct. Our Corporate Code of Conduct and Directors' Code of Conduct each goes beyond the laws, rules and regulations that govern our business in the jurisdictions in which we operate; they outline the principal business practices with which all employees and directors must comply.
Our employees, officers and directors are reminded annually about the importance of ethics and professionalism in their daily work, and must certify annually that they have reviewed and understand their responsibilities as set forth in the respective codes of conduct. This certification also requires our employees, officers and directors to acknowledge that they have complied with the standards set out in the respective code during the last calendar year.
The Board provides stewardship of the Corporation and ensures that the Corporation establishes key policies and procedures for the identification, assessment and management of principal risks and strategic plans. The Board monitors and assesses the performance and progress of the Corporation’s goals through candid and timely reports from the CEO and the senior management team. We have also established an annual evaluation process whereby our directors are provided with an opportunity to evaluate the Board, Board committees, individual directors and the Chair’s performance.
In order to allow the Board to establish and manage the financial, environmental, and social elements of our governance practices, the Board has established the AFRC, the Governance, Safety and Sustainability Committee ("GSSC"), the Human Resources Committee (the “HRC”) and the Investment Performance Committee ("IPC").
The AFRC, consisting of independent members of the Board, provides assistance to the Board in fulfilling its oversight responsibility relating to the integrity of our consolidated financial statements and the financial reporting process; the systems of internal accounting and financial controls; the internal audit function; the external auditors’ qualifications and terms and conditions of appointment, including remuneration; independence; performance and reports; and the legal and risk compliance programs as established by management and the Board. The AFRC approves our Commodity and Financial Exposure Management policies and reviews quarterly Enterprise Risk Management reporting.
TRANSALTA CORPORATION M93
Management’s Discussion and Analysis
The GSSC is responsible for developing and recommending to the Board a set of corporate governance principles applicable to the Corporation and for monitoring compliance with these principles. The GSSC is also responsible for Board recruitment, succession planning and for the nomination of directors to the Board and its committees. In addition, the GSSC assists the Board in fulfilling its oversight responsibilities with respect to the Corporation’s monitoring of environmental, health and safety regulations and public policy changes and the establishment and adherence to environmental, health and safety practices, procedures and policies. The GSSC also receives an annual report on the annual codes of conduct certification process.
In regards to overseeing and seeking to ensure that the Corporation consistently achieves strong environment, health and safety (“EH&S”) performance, the GSSC undertakes a number of actions that include: i) receiving regular reports from management regarding environmental compliance, trends and TransAlta’s responses; ii) receiving reports and briefings on management’s initiatives with respect to changes in climate change legislation, policy developments as well as other draft initiatives and the potential impact such initiatives may have on our operations; iii) assessing the impact of the GHG policies implementation and other legislative initiatives on the Corporation’s business; iv) reviewing with management the EH&S policies of the Corporation; v) reviewing with management the health and safety practices implemented within the Corporation, as well as the evaluation and training processes put in place to address problem areas; vi) receiving reports from management on the near-miss reporting program and discussing with management ways to improve the EH&S processes and practices; and vi) reviewing the effectiveness of our response to EH&S issues and any new initiatives put in place to further improve the Corporation’s EH&S culture.
The HRC is empowered by the Board to review and approve key compensation and human resources policies of the Corporation that are intended to attract, recruit, retain and motivate employees of the Corporation. The HRC also makes recommendations to the Board regarding the compensation of the Corporation’s CEO, including the review and adoption of equity-based incentive compensation plans, the adoption of human resources policies that support human rights and ethical conduct, and the review and approval of executive management succession and development plans.
The IPC is empowered by the Board to oversee management's investment conclusions and the execution of major, Board-approved capital expenditure projects that further the Corporation's strategic plans. The IPC undertakes a number of actions that include: i) reviewing and considering the substantive risks, returns, financing and other key elements relating to the Corporation's major capital projects; ii) reviewing and assessing mitigation plans, expected outcomes, and implementation throughout the project life cycle with respect to substantive risks; iii) reviewing and assessing cost estimating methodologies employed throughout the project life cycle; iv) reviewing and assessing progress reports including periodic updates on the project schedule, risks and costs at key milestones as projects advance through to execution; v) reviewing post-project look-backs; and vi) reviewing and providing recommendations to the Board regarding capital expenditures associated with such capital projects.
The responsibilities of other stakeholders within our risk management oversight structure are described below:
The CEO and senior management review and report on key risks quarterly. Specific Trading Risk Management reviews are held monthly by the Commodity Risk and Compliance Committee, and weekly by the commodity risk team, the commercial managers in Trading and Marketing, and the Senior Vice-President Trading & Commercial.
The Investment Committee is chaired by our Chief Financial Officer and is comprised of the CEO, Chief Financial Officer, Chief Operating Officer and Chief Business Development Officer. It reviews and approves all major capital expenditures including growth, productivity, life extensions and major coal outages. Projects that are approved by the Committee will then be put forward for approval by the Board, if required.
The Commodity Risk & Compliance Committee is chaired by our Chief Financial Officer and is comprised of the Chief Financial Officer, Chief Legal, Regulatory & External Affairs Officer, Senior Vice-President Trading & Commercial, and Managing Director Shared Services Finance. It oversees the risk and compliance program in trading and ensures that this program is adequately resourced to monitor trading operations from a risk and compliance perspective. It also ensures the existence of appropriate controls, processes, systems and procedures to monitor adherence to policy.
The Hydro Operating Committee consists of two Brookfield members, with expertise in hydro facility management, and and two TransAlta members. This committee was formed in 2019 for the purpose of providing advice and recommendations to TransAlta's management and operational team on matters in connection with the operation, and maximizing the value, of TransAlta's Alberta Hydro Assets. It is delivering on its objectives by thoroughly reviewing the operating, maintenance, safety and environmental aspects of TransAlta's Alberta Hydro Assets and, following that
TRANSALTA CORPORATION M94
Management’s Discussion and Analysis
review, providing expert advice and recommendations to TransAlta’s hydro operational team. The Committee has an initial term of six years, which can be extended for an additional two years.
TransAlta is listed on the TSX and the New York Stock Exchange and is subject to the governance regulations, rules and standards applicable under both exchanges. Our corporate governance practices meet the following governance rules of the TSX and Canadian Securities Administrators: i) Multilateral Instrument 52-109 Certification of Disclosure in Issuers’ Annual and Interim Filings; ii) National Instrument 52-110 Audit Committees; iii) National Policy 58-201 Corporate Governance Guidelines; and iv) National Instrument 58-101 Disclosure of Corporate Governance Practices. As a “foreign private issuer” under US securities laws, we are generally permitted to comply with Canadian corporate governance requirements. Additional information regarding our governance practices can be found in our most recent management information circular.
Risk Controls
Our risk controls have several key components:
Enterprise Tone
We strive to foster beliefs and actions that are true to, and respectful of, our many stakeholders. We do this by investing in communities where we live and work, operating and growing sustainably, putting safety first and being responsible to the many groups and individuals with whom we work.
Policies
We maintain a comprehensive set of enterprise-wide policies. These policies establish delegated authorities and limits for business transactions, as well as allow for an exception approval process. Periodic reviews and audits are performed to ensure compliance with these policies. All employees and directors are required to sign a code of conduct on an annual basis.
Reporting
On a regular basis, residual risk exposures are reported to key decision-makers including the Board, the AFRC, senior management and/or the Commodity Risk & Compliance Committee, as applicable. Reporting to this latter committee includes analysis of new risks, monitoring of status to risk limits, review of events that can affect these risks and discussion and review of the status of actions to minimize risks. This monthly reporting provides for effective and timely risk management and oversight.
Whistleblower System
We have a process in place where employees, contractors, shareholders or other stakeholders may confidentially or anonymously report any potential legal or ethical concerns, including concerns relating to accounting, internal control accounting, auditing or financial matters or relating to alleged violations of our codes of conduct. These concerns can be submitted confidentially and anonymously, either directly to the AFRC or through TransAlta’s toll-free telephone or online Ethics Helpline. The AFRC Chair is immediately notified of any material complaints and, otherwise, the AFRC receives a report at every quarterly committee meeting on all findings related to any material complaints or complaints relating to accounting or financial reporting or alleged breaches in internal controls over financial reporting.
Value at Risk and Trading Positions
Value at risk (“VaR”) is one of the primary measures used to manage our exposure to market risk resulting from commodity risk management activities. VaR is calculated and reported on a daily basis. This metric describes the potential change in the value of our trading portfolio over a three-day period within a 95 per cent confidence level, resulting from normal market fluctuations.
VaR is a commonly used metric that is employed by industry to track the risk in commodity risk management positions and portfolios. Two common methodologies for estimating VaR are the historical variance/covariance and Monte Carlo approaches. We estimate VaR using the historical variance/covariance approach. An inherent limitation of historical variance/covariance VaR is that historical information used in the estimate may not be indicative of future market risk. Stress tests are performed periodically to measure the financial impact to the trading portfolio resulting from potential market events, including fluctuations in market prices, volatilities of those prices and the relationships between those prices. We also employ additional risk mitigation measures. VaR at Dec. 31, 2019, associated with our proprietary commodity risk management activities was $1 million (2018 - $2 million). Refer to the Risk Factors - Commodity Price Risk section of this MD&A below for further discussion.
TRANSALTA CORPORATION M95
Management’s Discussion and Analysis
Risk Factors
Risk is an inherent factor of doing business. The following section addresses some, but not all, risk factors that could affect our future plans, performance, results or outcomes and our activities in mitigating those risks. These risks do not occur in isolation, but must be considered in conjunction with each other. For a further discussion of these and other risk factors affecting the Corporation, readers are encouraged to read the Risk Factors section of the AIF, available on our website at www.transalta.com and under our profile on SEDAR at www.sedar.com and on EDGAR at www.edgar.gov.
A reference herein to a material adverse effect on the Corporation means such an effect on the Corporation or its business, operations, financial condition, results of operations and/or its cash flows, as the context requires.
For some risk factors we show the after-tax effect on net earnings of changes in certain key variables. The analysis is based on business conditions and production volumes in 2019. Each item in the sensitivity analysis assumes all other potential variables are held constant. While these sensitivities are applicable to the period and the magnitude of changes on which they are based, they may not be applicable in other periods, under other economic circumstances or for a greater magnitude of changes. The changes in rates should also not be assumed to be proportionate to earnings in all instances.
Volume Risk
Volume risk relates to the variances from our expected production. The financial performance of our hydro, wind and solar operations is highly dependent upon the availability of their input resources in a given year. Shifts in weather or climate patterns, seasonal precipitation and the timing and rate of melting and runoff may impact the water flow to our facilities. The strength and consistency of the wind resource at our facilities impacts production. The operation of thermal plants can also be impacted by ambient temperatures and the availability of water and fuel. Where we are unable to produce sufficient quantities of output in relation to contractually specified volumes we may be required to pay penalties or purchase replacement power in the market.
We manage volume risk by:
▪Actively managing our assets and their condition in order to be proactive in plant maintenance so that our plants are available to produce when required;
▪Monitoring water resources throughout Alberta to the best of our ability and optimizing this resource against real-time electricity market opportunities;
▪Placing our facilities in locations we believe to have adequate resources to generate electricity to meet the requirements of our contracts. However, we cannot guarantee that these resources will be available when we need them or in the quantities that we require; and
▪Diversifying our fuels and geography to mitigate regional or fuel-specific events.
The sensitivity of volumes to our net earnings is shown below:
| | | | | | | | |
| Factor | Increase or
decrease (%) | Approximate impact
on net earnings |
| Availability/production | 1 | | $8 million |
Generation Equipment and Technology Risk
There is a risk of equipment failure due to wear and tear, latent defect, design error or operator error, among other things, which could have a material adverse effect on the Corporation. Although our generation facilities have generally operated in accordance with expectations, there can be no assurance that they will continue to do so. Our plants are exposed to operational risks such as failures due to cyclic, thermal and corrosion damage in boilers, generators, and turbines, and other issues that can lead to outages and increased volume risk. If plants do not meet availability or production targets specified in their PPA or other long-term contracts, we may be required to compensate the purchaser for the loss in the availability of production or record reduced energy or capacity payments. For merchant facilities, an outage can result in lost merchant opportunities. Therefore, an extended outage could have a material adverse effect on our business, financial condition, results of operations or our cash flows.
As well, we are exposed to procurement risk for specialized parts that may have long lead times. If we are unable to procure these parts when they are needed for maintenance activities, we could face an extended period where our equipment is unavailable to produce electricity.
TRANSALTA CORPORATION M96
Management’s Discussion and Analysis
We manage our generation equipment and technology risk by:
▪Operating our facilities within defined industry standards that optimizes availability over their commercial operating life;
▪Performing preventive maintenance in accordance with applicable industry practices, major equipment supplier recommendations and our operating experience;
▪Adhering to comprehensive maintenance programs and regular turnaround schedules;
▪Adjusting maintenance plans by facility to reflect equipment type, age and commercial risk;
▪Having adequate business interruption insurance in place to cover extended forced outages;
▪Having clauses in our PPAs and other long-term contracts that allow us to declare force majeure in the event of an unforeseen failure;
▪Selecting and applying proven technology in our generating facilities, where practical;
▪Where technology is newer, ensuring service agreements with equipment suppliers include appropriate availability and performance guarantees;
▪Monitoring our fleet against industry performance to identify issues or advancements that may impact performance and adjusting our maintenance and investment programs accordingly;
▪Negotiating strategic supply agreements with selected vendors to ensure key components are readily available in the event of a significant outage;
▪Entering into long-term arrangements with our strategic supply partners to ensure availability of critical spare parts; and
▪Implementing long-term asset management strategies that optimizes the life cycles of our existing facilities and/or identifies replacement requirements for generating assets.
Commodity Price Risk
We have exposure to movements in certain commodity prices, including the market price of electricity and fuels used to produce electricity in both our electricity generation and proprietary trading businesses.
We manage the financial exposure associated with fluctuations in electricity price risk by:
▪Entering into long-term contracts that specify the price at which electricity, steam and other services are provided;
▪Maintaining a portfolio of short, medium and long-term contracts to mitigate our exposure to short-term fluctuations in commodity prices;
▪Purchasing natural gas coincident with production for merchant plants so spot market spark spreads are adequate to produce and sell electricity at a profit; and
▪Ensuring limits and controls are in place for our proprietary trading activities.
In 2019, we had approximately 90 per cent (2018 - 85 per cent) of production under short-term and long-term contracts and hedges. In the event of a planned or unplanned plant outage or other similar event, however, we are exposed to changes in electricity prices on purchases of electricity from the market to fulfil our supply obligations under these short and long-term contracts.
We manage the financial exposure to fluctuations in the cost of fuels used in production by:
▪Entering into long-term contracts that specify the price at which fuel is to be supplied to our plants;
▪Hedging emissions costs by entering into various emission trading arrangements; and
▪Selectively using hedges, where available, to set prices for fuel.
In 2019, 66 per cent (2018 - 67 per cent) of our gas consumption used in generating electricity was contractually fixed or passed through to our customers and 76 per cent (2018 - 85 per cent) of our purchased coal was contractually fixed.
Actual variations in net earnings can vary from calculated sensitivities and may not be linear due to optimization opportunities, co-dependencies and cost mitigations, production, availability and other factors.
Coal Supply Risk
Having sufficient fuel available when required for generation is essential to maintaining our ability to produce electricity under contracts and for merchant sale opportunities. At our coal-fired plants, input costs such as diesel, tires, the price and availability of mining equipment, the volume of overburden removed to access coal reserves, rail rates and the location of mining operations relative to the power plants are some of the exposures in our operations. Additionally, the ability of the mines to deliver coal to the power plants can be impacted by weather conditions and labour relations. At US Coal, interruptions at our supplier’s mine, the availability of trains to deliver coal and the financial viability of our coal suppliers could affect our ability to generate electricity.
TRANSALTA CORPORATION M97
Management’s Discussion and Analysis
We manage coal supply risk by:
▪Ensuring that the majority of the coal used in electrical generation in Alberta is from reserves permitted through coal rights we have purchased or for which we have long-term supply contracts, thereby limiting our exposure to fluctuations in the supply of coal from third parties;
▪Using longer-term mining plans to ensure the optimal supply of coal from our mines;
▪Sourcing the majority of the coal used at US Coal under a mix of contract durations and from different mine sources to ensure sufficient coal is available at a competitive cost;
▪Contracting sufficient trains to deliver the coal requirements at US Coal;
▪Ensuring coal inventories on hand at Canadian Coal and US Coal are at appropriate levels for usage requirements;
▪Ensuring efficient coal handling and storage facilities are in place so that the coal being delivered can be processed in a timely and efficient manner;
▪Monitoring and maintaining coal specifications, and carefully matching the specifications mined with the requirements of our plants;
▪Co-firing natural gas with coal;
▪Monitoring the financial viability of US coal suppliers; and
▪Hedging diesel exposure in mining and transportation costs.
Natural Gas Supply and Price Risk
Having sufficient natural gas and natural gas transportation services available so that we can blend natural gas in with coal at our Alberta thermal facilities, and for the ultimate conversion of those units to natural gas is essential to maintaining the reliability and availability of those facilities. Using natural gas at our coal-fired plants, and ultimately converting them to natural gas, allows us to reduce overall carbon emissions and costs, reduce the risk of coal opacity issues, and improves our operating and sustaining capital costs. Ensuring adequate pipeline transportation service and natural gas supply for our Alberta thermal units may be impacted by, among other things, the timing of receiving regulatory and other approvals for firm transportation commitments, weather-related events, work stoppages, system maintenance, variability in pipeline hydraulics pressure and flows, and impacts due to other naturally created events. Pricing of natural gas is driven by market supply and demand fundamentals for natural gas in North America and globally. We are exposed to changes in natural gas prices, which may impact the profitability of our facilities and how the facilities are dispatched into the market.
We manage gas supply and price risk by:
▪Ensuring that we have at least two pipelines supplying the gas used in electrical generation in Alberta;
▪Contracting for firm gas delivery and supply;
▪Monitoring the financial viability of gas producers and pipelines;
▪Hedging gas price exposure;
▪Monitoring pipelines maintenance schedules and transportation availability; and
▪Incorporating the ability to continue using coal in some of the units as the units transition from coal to 100 per cent natural gas.
Environmental Compliance Risk
Environmental compliance risks are risks to our business associated with existing and/or changes in environmental regulations. New emission reduction objectives for the power sector are being established by governments in Canada and the US. We anticipate continued and growing scrutiny by investors and other stakeholders relating to sustainability performance. These changes to regulations may affect our earnings by reducing the operating life of generating facilities, imposing additional costs on the generation of electricity, such as emission caps or tax, requiring additional capital investments in emission capture technology or requiring us to invest in offset credits. It is anticipated that these compliance costs will increase due to increased political and public attention to environmental concerns.
We manage environmental compliance risk by:
▪Seeking continuous improvement in numerous performance metrics such as emissions, safety, land and water impacts, and environmental incidents;
▪
▪Having an International Organization for Standardization and Occupational Health and Safety Assessment Series-based environmental health and safety management system in place that is designed to continuously improve performance;
▪
▪Committing significant experienced resources to work with regulators in Canada and the US to advocate that regulatory changes are well designed and cost effective;
▪
TRANSALTA CORPORATION M98
Management’s Discussion and Analysis
▪Developing compliance plans that address how to meet or surpass emission standards for GHGs, mercury, SO2, and NOx, which will be adjusted as regulations are finalized;
▪
▪Purchasing emission reduction offsets;
▪
▪Investing in renewable energy projects, such as wind, solar and hydro generation; and
▪
▪Incorporating change-in-law provisions in contracts that allow recovery of certain compliance costs from our customers.
We strive to be in compliance with all environmental regulations relating to operations and facilities. Compliance with both regulatory requirements and management system standards is regularly audited through our performance assurance policy and results are reported quarterly to the GSSC.
Credit Risk
Credit risk is the risk to our business associated with changes in the creditworthiness of entities with which we have commercial exposures. This risk results from the ability of a counterparty to either fulfil its financial or performance obligations to us or where we have made a payment in advance of the delivery of a product or service. The inability to collect cash due to us or to receive products or services may have an adverse impact upon our net earnings and cash flows.
We manage our exposure to credit risk by:
▪Establishing and adhering to policies that define credit limits based on the creditworthiness of counterparties, contract term limits and the credit concentration with any specific counterparty;
▪
▪Requiring formal sign-off on contracts that include commercial, financial, legal and operational reviews;
▪
▪Requiring security instruments, such as parental guarantees, letters of credit, and cash collateral or third-party credit insurance if a counterparty goes over its limits. Such security instruments can be collected if a counterparty fails to fulfil its obligation; and
▪
▪Reporting our exposure using a variety of methods that allow key decision-makers to assess credit exposure by counterparty. This reporting allows us to assess credit limits for counterparties and the mix of counterparties based on their credit ratings.
If established credit exposure limits are exceeded, we take steps to reduce this exposure, such as by requesting collateral, if applicable, or by halting commercial activities with the affected counterparty. However, there can be no assurances that we will be successful in avoiding losses as a result of a contract counterparty not meeting its obligations.
Our credit risk management profile and practices have not changed materially from Dec. 31, 2018. We had no material counterparty losses in 2019. We continue to keep a close watch on changes and trends in the market and the impact these changes could have on our energy trading business and hedging activities, and will take appropriate actions as required, although no assurance can be given that we will always be successful.
The following table outlines our maximum exposure to credit risk without taking into account collateral held or right of set-off, including the distribution of credit ratings, as at Dec. 31, 2019:
| | | | | | | | | | | | | | |
| Investment grade (%) | Non-investment grade (%) | Total (%) | Total
amount |
Trade and other receivables(1) | 85 | | 15 | | 100 | | 462 | |
| Long-term finance lease receivables | 100 | | — | | 100 | | 176 | |
Risk management assets(1) | 99 | | 1 | | 100 | | 806 | |
Loan receivable(2) | — | | 100 | | 100 | | 47 | |
| Total | | | | | | | 1,491 | |
(1) Letters of credit and cash and cash equivalents are the primary types of collateral held as security related to these amounts.
(2) The counterparties have no external credit ratings.
The maximum credit exposure to any one customer for commodity trading operations, including the fair value of open trading positions net of any collateral held, is $5 million (2018 - $13 million).
Currency Rate Risk
We have exposure to various currencies as a result of our investments and operations in foreign jurisdictions, the earnings from those operations, the acquisition of equipment and services and foreign-denominated commodities from foreign suppliers, and our US-denominated debt. Our exposures are primarily to the US and Australian currencies.
TRANSALTA CORPORATION M99
Management’s Discussion and Analysis
Changes in the values of these currencies in relation to the Canadian dollar may affect our earnings or the value of our foreign investments to the extent that these positions or cash flows are not hedged or the hedges are ineffective.
We manage our currency rate risk by establishing and adhering to policies that include:
▪Hedging our net investments in US operations using US-denominated debt;
▪
▪Entering into forward foreign exchange contracts to hedge future foreign-denominated expenditures including our US-denominated debt that is outside the net investment portfolio; and
▪
▪Hedging our expected foreign operating cash flows. Our target is to hedge a minimum of 60 per cent of our forecasted foreign operating cash flows over a four-year period, with a minimum of 90 per cent in the current year, 70 per cent in the next year, 50 per cent in the third year and 30 per cent in the fourth year. The US exposure will be managed with a combination of interest expense on our US-denominated debt and forward foreign exchange contracts and the Australian exposure will be managed with forward foreign exchange contracts.
The sensitivity of our net earnings to changes in foreign exchange rates has been prepared using management’s assessment that an average $0.03 increase or decrease in the US or Australian currencies relative to the Canadian dollar is a reasonable potential change over the next quarter, and is shown below:
| | | | | | | | |
| Factor | Increase or decrease | Approximate impact
on net earnings |
| Exchange rate | $0.03 | $24 million |
Liquidity Risk
Liquidity risk relates to our ability to access capital to be used to engage in trading and hedging activities, capital projects, debt refinancing and payment of liabilities, capital structure and general corporate purposes. Credit ratings facilitate these activities and changes in credit ratings may affect our ability and/or the cost of accessing capital markets, establishing normal course derivative or hedging transactions, including those undertaken by our Energy Marketing segment. Counterparties enter into certain electricity and natural gas purchase and sale contracts for the purposes of asset-backed sales and proprietary trading. The terms and conditions of these contracts require the counterparties to provide collateral when the fair value of the obligation pursuant to these contracts is in excess of any credit limits granted. Downgrades in creditworthiness by certain credit rating agencies may impact our ability to enter into these contracts or any ordinary course contract, decrease the credit limits granted and increase the amount of collateral that may have to be provided. Certain existing contracts contain credit rating contingent clauses, that, when triggered, automatically increase costs under the contract or require additional collateral to be posted. Where the contingency is based on the lowest single rating, a one-level downgrade from a credit rating agency with an originally higher rating may not, however, trigger additional direct adverse impact.
We continue to focus on maintaining our financial position and flexibility. Credit ratings issued for TransAlta, as well as the corresponding rating agency outlooks, are set out in the Financial Capital section of this MD&A. Credit ratings are subject to revision or withdrawal at any time by the rating organization, and there can be no assurance that TransAlta’s credit ratings and the corresponding outlook will not be changed, resulting in the adverse possible impacts identified above.
As at Dec. 31, 2019, we have liquidity of $1.7 billion comprised of amounts not drawn under our committed credit facilities and cash on hand that is available to draw on for projects in 2020.
We manage liquidity risk by:
▪Monitoring liquidity on trading positions;
▪Preparing and revising longer-term financing plans to reflect changes in business plans and the market availability of capital;
▪Reporting liquidity risk exposure for commodity risk management activities on a regular basis to the Commodity Risk & Compliance Committee, senior management and the AFRC;
▪Maintaining a strong balance sheet; and
▪Maintaining sufficient undrawn committed credit lines to support potential liquidity requirements.
TRANSALTA CORPORATION M100
Management’s Discussion and Analysis
Interest Rate Risk
Changes in interest rates can impact our borrowing costs and the capacity revenues we receive from our Alberta PPA plants. Changes in our cost of capital may also affect the feasibility of new growth initiatives.
We manage interest rate risk by establishing and adhering to policies that include:
▪Employing a combination of fixed and floating rate debt instruments; and
▪Monitoring the mixture of floating and fixed rate debt and adjusting to ensure efficiency.
At Dec. 31, 2019, approximately 11 per cent (2018 - 14 per cent) of our total debt portfolio was subject to changes in floating interest rates through a combination of floating rate debt and interest rate swaps.
The sensitivity of changes in interest rates upon our net earnings is shown below:
| | | | | | | | |
| Factor | Increase or
decrease (%) | Approximate impact
on net earnings |
| Interest rate | 20 | $1 million before tax |
Project Management Risk
On capital projects, we face risks associated with cost overruns, delays and performance.
We manage project risks by:
▪Ensuring all projects follow established corporate processes and policies;
▪Identifying key risks during every stage of project development and ensuring mitigation plans are factored into capital estimates and contingencies;
▪Reviewing project plans, key assumptions and returns with senior management prior to Board of Director approvals;
▪Consistently applying project management methodologies and processes;
▪Determining contracting strategies that are consistent with the project scope and scale to ensure key risks, such as labour and technology, are managed by contractors and equipment suppliers;
▪Ensuring contracts for construction and major equipment include key terms for performance, delays and quality backed by appropriate levels of liquidated damages;
▪Reviewing projects after achieving commercial operation to ensure learnings are incorporated into the next project;
▪Negotiating contracts for construction and major equipment to lock-in key terms such as price, availability of long lead equipment, foreign currency rates and warranties as much as is economically feasible before proceeding with the project; and
▪Entering into labour agreements to provide security around labour cost, supply and productivity.
Human Resource Risk
Human resource risk relates to the potential impact upon our business as a result of changes in the workplace. Human resource risk can occur in several ways:
▪Potential disruption as a result of labour action at our generating facilities;
▪Reduced productivity due to turnover in positions;
▪Inability to complete critical work due to vacant positions;
▪Failure to maintain fair compensation with respect to market rate changes; and
▪Reduced competencies due to insufficient training, failure to transfer knowledge from existing employees or insufficient expertise within current employees.
We manage this risk by:
▪Monitoring industry compensation and aligning salaries with those benchmarks;
▪Using incentive pay to align employee goals with corporate goals;
▪Monitoring and managing target levels of employee turnover; and
▪Ensuring new employees have the appropriate training and qualifications to perform their jobs.
In 2019, 46 per cent (2018 - 50 per cent) of our labour force was covered by 10 (2018 - 10) collective bargaining agreements. In 2019, four (2018 - four) agreements were renegotiated. We anticipate the successful negotiation of six collective agreements in 2020.
TRANSALTA CORPORATION M101
Management’s Discussion and Analysis
Regulatory and Political Risk
Regulatory and political risk is the risk to our business associated with potential changes to the existing regulatory structures and the political influence upon those structures. This risk can come from market regulation and re-regulation, increased oversight and control, structural or design changes in markets, or other unforeseen influences. Market rules are often dynamic and we are not able to predict whether there will be any material changes in the regulatory environment or the ultimate effect of changes in the regulatory environment on our business. This risk includes, among other things, uncertainties associated with the development of a capacity market for electricity in Ontario, potential market bid mitigation in Alberta, uncertainties associated with the development of carbon pricing policies and the qualification of our renewable facilities in Alberta to generate tradable GHG allowances as part of the transition from the Carbon Competitiveness Incentive Regulation to the Technology Innovation and Emissions Reduction regulations.
We manage these risks systematically through our Legal and Regulatory groups and our Compliance program, which is reviewed periodically to ensure its effectiveness. We work with governments, regulators, electricity system operators and other stakeholders to resolve issues as they arise. We are actively monitoring changes to market rules and market design, and we engage in industry-and government-agency-led stakeholder engagement processes. Through these and other avenues, we engage in advocacy and policy discussions at a variety of levels. These stakeholder negotiations have allowed us to engage in proactive discussions with governments and regulatory agencies over the longer term.
International investments are subject to unique risks and uncertainties relating to the political, social and economic structures of the respective country and such country’s regulatory regime. We mitigate this risk through the use of non-recourse financing and insurance.
Transmission Risk
Access to transmission lines and transmission capacity for existing and new generation is key to our ability to deliver energy produced at our power plants to our customers. The risks associated with the aging existing transmission infrastructure in markets in which we operate continue to increase because new connections to the power system are consuming transmission capacity quicker than it is being added by new transmission developments.
Reputation Risk
Our reputation is one of our most valued assets. Reputation risk relates to the risk associated with our business because of changes in opinion from the general public, private stakeholders, governments and other entities.
We manage reputation risk by:
▪Striving as a neighbour and business partner in the regions where we operate to build viable relationships based on mutual understanding leading to workable solutions with our neighbours and other community stakeholders;
▪Clearly communicating our business objectives and priorities to a variety of stakeholders on a routine and transparent basis;
▪Applying innovative technologies to improve our operations, work environment and environmental footprint;
▪Maintaining positive relationships with various levels of government;
▪Pursuing sustainable development as a longer-term corporate strategy;
▪Ensuring that each business decision is made with integrity and in line with our corporate values;
▪Communicating the impact and rationale of business decisions to stakeholders in a timely manner; and
▪Maintaining strong corporate values that support reputation risk management initiatives, including the annual Code of Conduct sign-off.
Corporate Structure Risk
We conduct a significant amount of business through subsidiaries and partnerships. Our ability to meet and service debt obligations is dependent upon the results of operations of our subsidiaries and partnerships and the payment of funds by our subsidiaries and partnerships in the form of distributions, loans, dividends or otherwise. In addition, our subsidiaries and partnerships may be subject to statutory or contractual restrictions that limit their ability to distribute cash to us.
TRANSALTA CORPORATION M102
Management’s Discussion and Analysis
Cybersecurity Risk
We rely on our information technology to process, transmit and store electronic information and data used for the safe operation of our assets. In today's ever-evolving cybersecurity landscape, any attacks or other breaches of network or information systems may cause disruptions to our business operations. Cyberattackers may use a range of techniques, from exploiting vulnerabilities within our user-base, to using sophisticated malicious code on a single or distributed basis to try to breach our network security controls. Attackers may also use a combination of techniques in their attempt to evade safeguards that we have in place such as firewalls, intrusion prevention systems and antivirus software that exist on our network infrastructure systems. A successful cyberattack may allow for the unauthorized interception, destruction, use or dissemination of our information and may cause disruptions to our business operations.
We continuously take measures to secure our infrastructure against potential cyberattacks that may damage our infrastructure, systems and data. TransAlta’s cybersecurity model consists of three pillars: technology, processes and resourcing. Each of these pillars can be reinforced independently to address specific cyber risks and threats that are confronting TransAlta. Significant cyber risks that could pose a threat to TransAlta include phishing, ransomware, social engineering, supplier chain, commodity hostage, state sponsored, artificial intelligence, machine learning attacks and a high risk of cybersecurity employee turnover. Proactive controls and safeguards to mitigate cybersecurity risk and threats posed to the organization include:
▪Leveraging in place technologies to restrict communication within TransAlta’s networks thus limiting the ability for adversaries to achieve their aim;
▪Partnering with a third-party cybersecurity specialty firm to outsource critical components of our cybersecurity program;
▪Enhancing our policies and processes through the use of periodic reviews and table-top exercises;
▪Maintaining an effective and robust cybersecurity awareness training and campaign;
▪Integrating cybersecurity into our business processes and performing robust cybersecurity risk assessments; and
▪Continuously improving our cybersecurity program to ensure it is effective in responding to and addressing cybersecurity risks.
While we have systems, policies, hardware, practices, data backups and procedures designed to prevent or limit the effect of the security breaches of our generation facilities and infrastructure and data, there can be no assurance that these measures will be sufficient or that such security breaches will not occur or, if they do occur, that they will be adequately addressed in a timely manner. We closely monitor both preventive and detective measures to manage these risks.
General Economic Conditions
Changes in general economic conditions impact product demand, revenue, operating costs, the timing and extent of capital expenditures, the net recoverable value of PP&E, financing costs, credit and liquidity risk, and counterparty risk.
Income Taxes
Our operations are complex and located in several countries. The computation of the provision for income taxes involves tax interpretations, regulations and legislation that are continually changing. Our tax filings are subject to audit by taxation authorities. Management believes that it has adequately provided for income taxes as required by IFRS, based on all information currently available.
The Corporation is subject to changing laws, treaties and regulations in and between countries. Various tax proposals in the countries we operate in could result in changes to the basis on which deferred taxes are calculated or could result in changes to income or non-income tax expense. There has recently been an increased focus on issues related to the taxation of multinational corporations. A change in tax laws, treaties or regulations, or in the interpretation thereof, could result in a materially higher income or non-income tax expense that could have a material adverse impact on the Corporation.
The sensitivity of changes in income tax rates upon our net earnings is shown below:
| | | | | | | | |
| Factor | Increase or
decrease (%) | Approximate impact
on net earnings |
| Tax rate | 1 | | $2 million | |
TRANSALTA CORPORATION M103
Management’s Discussion and Analysis
Legal Contingencies
We are occasionally named as a party in various disputes, claims and legal or regulatory proceedings that arise during the normal course of our business. We review each of these claims, including the nature of the claim, the amount in dispute or claimed, and the availability of insurance coverage. There can be no assurance that any particular dispute, claim or proceeding will be resolved in our favour or our liabilities with respect to such claims will not have a material adverse effect on us or our business, operations or financial results. Refer to the Other Consolidated Analysis section of this MD&A for further details.
Other Contingencies
We maintain a level of insurance coverage deemed appropriate by management. There were no significant changes to our insurance coverage during renewal of the insurance policies on Dec. 31, 2019. Our insurance coverage may not be available in the future on commercially reasonable terms. There can be no assurance that our insurance coverage will be fully adequate to compensate for potential losses incurred. In the event of a significant economic event, the insurers may not be capable of fully paying all claims. All insurance policies are subject to standard exclusions. Cyber coverage is not currently purchased.
Disclosure Controls and Procedures
Management is responsible for establishing and maintaining adequate internal control over financial reporting (‘‘ICFR’’) and disclosure controls and procedures (“DC&P’’). There have been no changes in our ICFR or DC&P during the year ended Dec. 31, 2019, that have materially affected, or are reasonably likely to materially affect, our ICFR or DC&P.
ICFR is a framework designed to provide reasonable assurance regarding the reliability of financial reporting and the preparation of consolidated financial statements for external purposes in accordance with IFRS. Management has used the Internal Control - Integrated Framework issued by the Committee of Sponsoring Organizations of the Treadway Commission (2013 framework) in order to assess the effectiveness of the Corporation’s ICFR.
DC&P refer to controls and other procedures designed to ensure that information required to be disclosed in the reports we file or submit under securities legislation is recorded, processed, summarized and reported within the time frame specified in applicable securities legislation. DC&P include, without limitation, controls and procedures designed to ensure that information required to be disclosed by us in our reports that we file or submit under applicable securities legislation is accumulated and communicated to management, including our Chief Executive Officer and Chief Financial Officer, as appropriate to allow timely decisions regarding our required disclosure.
Together, the ICFR and DC&P frameworks provide internal control over financial reporting and disclosure. In designing and evaluating our ICFR and DC&P, management recognizes that any controls and procedures, no matter how well designed and operated, can provide only reasonable assurance of achieving the desired control objectives and as such may not prevent or detect all misstatements, and management is required to apply its judgment in evaluating and implementing possible controls and procedures. Further, the effectiveness of ICFR is subject to the risk that controls may become inadequate because of changes in conditions or that the degree of compliance with policies or procedures may change.
Management has evaluated, with the participation of our Chief Executive Officer and Chief Financial Officer, the effectiveness of our ICFR and DC&P as of the end of the period covered by this report. Based on the foregoing evaluation, our Chief Executive Officer and Chief Financial Officer have concluded that, as at Dec. 31, 2019, the end of the period covered by this report, our ICFR and DC&P were effective.
TRANSALTA CORPORATION M104