
CATALYST PAPER CORPORATION
MANAGEMENT’S DISCUSSION AND ANALYSIS
| | 1 |  |
MANAGEMENT’S DISCUSSION AND ANALYSIS
The following management discussion and analysis (“MD&A”) should be read in conjunction with the consolidated financial statements for the years ended December 31, 2005, 2004, and 2003 and the notes thereto.
Throughout the discussion, reference is made to EBITDA, which represents earnings before interest, taxes, depreciation and amortization, and before other non-operating income and expenses. EBITDA, as defined, equates to operating earnings (loss) plus amortization. As Canadian Generally Accepted Accounting Principles (“GAAP”) do not define a method of calculating EBITDA, the measure as calculated by Catalyst Paper Corporation (“the Company”) might not be comparable to similarly-titled measures reported by other entities. EBITDA is presented because the Company believes it is a useful indicator of a company’s operating performance, and subsequently, a company’s ability to meet debt service and capital expenditure requirements. EBITDA should not be considered by an investor as an alternative to net earnings, an indicator of the financial performance of the Company, or an alternative to cash flows as a measure of liquidity. Refer to the “Non-GAAP Measures” section for a reconciliation of this non-GAAP measure to net earnings (loss).
Except for the historical information contained herein, the matters set forth in this report are forward-looking. These include, for example, statements with respect to general economic conditions in the U.S., Canada, and internationally, assessment of market conditions and demand for the Company’s products, the outlook for inventories, production and pricing, performance improvements and cost savings, expected cash flows, capital expenditures and completion of capital projects, shifts in industry capacity, fluctuations in foreign exchange and interest rates, business strategies, fluctuations in availability and cost of raw materials or energy, ability to obtain financing and other factors beyond the Company’s control. These statements reflect management’s current views and are based on certain assumptions. Such statements are subject to risks and uncertainties that may cause actual results, performance or developments to differ materially from those contained in the statements. No assurance can be given that any of the events anticipated by the forward-looking statements will occur or, if they do occur, what benefits the Company will obtain from them. The Company disclaims any intention or obligation to update or revise any forward-looking statements, whether as a result of new information, future events or otherwise.
Investors are cautioned not to place undue reliance on these forward-looking statements. No forward-looking statement is a guarantee of future results.
In accordance with industry practice, in this MD&A, the term “ton” or the symbol “ST” refers to a short ton, an imperial unit of measurement equal to 0.9072 metric tonnes, and the term “tonne” or the symbol “MT” refers to a metric tonne.
In this MD&A, unless otherwise indicated, all dollar amounts are expressed in Canadian dollars, as are the term “dollars” and the symbols “$” and “CDN$”. The term “U.S. dollars” and the symbol “US$” refer to United States dollars.
The information in this report is as at January 25, 2006. Disclosure contained in this document is current to that date, unless otherwise stated.
| | 2 | |
Table of Contents
| | 3 | |
| 1.0 | CORPORATE OVERVIEW AND HIGHLIGHTS |
| | | |
| 1.1 | Overview of the Business |
| | | |
| | The Company is the third largest North American based producer of newsprint and uncoated mechanical groundwood specialty papers, measured by production capacity. It is also the largest producer of coated and uncoated specialty papers and newsprint, and the only producer of lightweight coated paper, on the West Coast of North America. The Company is the largest producer of directory paper in the world by capacity, and operates the largest paper recycling operation in Western Canada. It also has a significant presence in most major international markets, serving customers in countries around the world. The 2005 geographical sales mix can be found on page 6 of this MD&A. |
| | | |
| | The Company’s business includes printing papers and market pulp, operating in three business segments: |
| | | |
| | Specialty Papers |
| | The specialty papers segment consists of soft-calendered and machine finished (“MF”) hi-brite uncoated, lightweight coated, directory, and kraft paper grades. These groundwood specialty paper grades are manufactured on eleven1paper machines at Crofton, Elk Falls, Port Alberni and Powell River. The specialty papers business segment has a total production capacity of 1,141,000 tonnes. |
| | | |
| | Specialty papers is the Company’s largest business segment, representing approximately 55% of 2005 consolidated sales revenue. The Company’s customer base consists primarily of retailers, magazine and catalogue publishers, commercial printers, telephone directory publishers, and corrugated box manufacturers. Specialty paper products are sold primarily through the Company’s sales and marketing personnel in North America, and through distributors and agents in other geographic markets. In 2005, approximately 88% of specialty paper sales volumes were made to customers in North America. Specialty paper is shipped by a combination of ship, barge, rail, and truck. |
| | | |
| | Newsprint |
| | Newsprint is currently produced on five1paper machines at Crofton, Elk Falls, and Powell River. The segment has a total annual production capacity of 841,000 tonnes, of which, one machine at Port Alberni, or 140,000 tonnes on a 45.0 g/m2equivalent basis is currently idled. |
| 1 | The Company has 13 paper machines. The number of machines noted in the segments above reflects the ability of the Company’s machines to switch between newsprint and specialty paper grades. |
| | 4 | |
Newsprint sales represented approximately 29% of 2005 consolidated sales revenue. The newsprint customer base consists primarily of newsprint publishers located in Western and Central North America and Asia. In 2005, approximately 88% of newsprint sales volumes were to customers in North America and Asia. Newsprint is shipped primarily by deep-sea vessel, and by a combination of ship, barge, rail, and truck for inland destinations.
Pulp
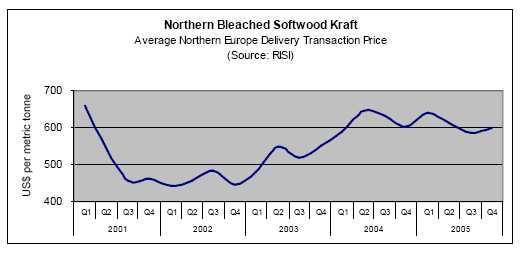
The pulp segment is comprised of sawdust-based pulp, manufactured at the Elk Falls mill, and Northern Bleached Softwood Kraft (“NBSK”) pulp, manufactured at the Crofton mill. The segment has a total production capacity of 509,000 tonnes.
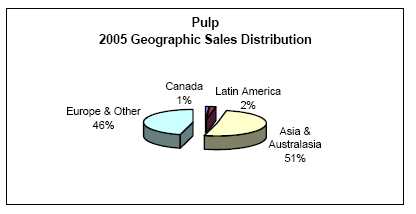
Pulp sales represented approximately 16% of 2005 consolidated sales revenue. The pulp customer base includes producers of tissue, magazine papers, woodfree printing and writing papers, and certain specialty paper products located primarily in Asia and Europe. Pulp products are sold primarily through sales and marketing personnel in Canada and Japan, and through a network of agents in locations throughout the world. In 2005, approximately 97% of pulp sales volumes were made to customers in Europe and Asia and Australasia. The Crofton and Elk Falls pulp mills are located on tidewater and have deep-sea vessel loading facilities. Pulp is shipped by both break-bulk on deep-sea vessels and container shipment.
The Company also operates the largest paper recycling operation in Western Canada, in support of its business segments. This facility has a production capacity of 148,000 air-dried equivalent tonnes of pulp per year, the majority of which is consumed internally.
| | 5 | |
The chart below illustrates the Company’s principal paper and pulp products, applications, and annual 2006 capacity.
| PRODUCT PROFILE |
| | Specialty Paper Grades | Newsprint | Pulp |
| Category | Uncoated Papers | Coated
Paper | Directory | Kraft Paper | Newsprint | Market Pulp |
Soft-
Calendered | Machine-Finished |
|
| Brand Name | Electrasoft
Electracal
Electraprime | Electrabrite
Electrastar | Electracote | Catalyst | Silverliner
Platinumliner
Chromiumliner
Bronzeliner | Marathon | Elk Prime
Crofton
Kraft |
|
|
|
|
|
|
|
|
|
| Basis Weight (g/m2) | 36.6 – 52 | 45 – 66.5 | 44.4 – 63.6 | 28 – 40 | 127 – 250 | 43 - 48.8 | n/a |
|
|
|
|
|
| Applications | Magazines,
Supplements,
Catalogues,
Inserts, Flyers,
Directories | Magazines,
Supplements, Inserts,
Flyers, Direct
mail, PR and
corporate
communication
books/manuals | Magazines,
Catalogues,
Inserts, Flyers,
Direct mail | Telephone books,
Airline schedules,
Catalogues | Packaging
applications | Newspapers,
Inserts, Flyers,
Supplements,
Directories,
Timetables | Tissue,
Freesheet,
Specialty paper,
Whitetop
linerboard |
|
|
|
|
|
|
|
|
|
|
|
|
|
|
|
|
|
| Capacity(tonnes) | 466,0002 | 223,000 | 315,0001, 2 | 137,000 | 841,0001, 2 | 509,000 |
|
|
|
|
| % of TotalCapacity | 19% | 9% | 13% | 5% | 34% | 20% |
|
|
|
| | 1 | Effective February, 2005, the Company indefinitely idled its Port Alberni paper machine No 3. This curtailment reduced the Company’s capacity of its newsprint business a further 140,000 tonnes from the amounts expressed in this table. |
| | 2 | Capacities expressed in the above table can vary as the Company is able to switch production between products, particularly newsprint, directory, and machine-finished uncoated grades. |
The Company’s diverse range of products are sold on five continents. The North American market accounts for 63% of the Company’s sales and continues to be the principal market for the Company followed by Asia and Australasia, Latin America, and Europe. The consolidated sales volume distribution for 2005 was as follows:

| | 6 | |
| | 1.2 | 2005 Overview |
| | | |
| | | Difficult business conditions for pulp and paper producers persisted throughout 2005, the strength of the Canadian dollar being a key factor in the Company’s unsatisfactory financial performance. The 2005 net loss was comparable with the prior year, as gains from the 2005 performance improvement program and higher average transaction prices for paper products were eroded by the negative impact of the strengthening Canadian dollar, lower pulp prices, and rising input costs. |
| | | |
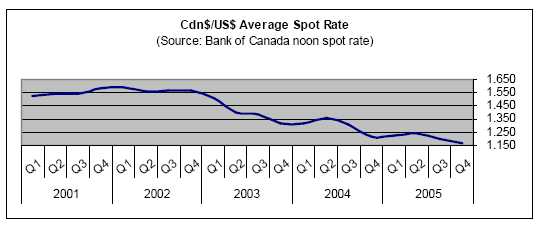
| | | For the third consecutive year, the strengthening Canadian dollar had a significant adverse impact on the Company’s earnings, as the majority of sales are denominated in U.S. dollars. During the year, the Canadian dollar strengthened 6.9% compared to the U.S. dollar, with an average spot exchange rate of CDN$1.212 compared to CDN$1.302 for 2004 and 1.402 for 2003. The strengthening Canadian dollar negatively impacted operating earnings by approximately $140 million in the current year. For further details about the Company’s sensitivity to fluctuations in foreign exchange refer to the “Sensitivity Analysis” section. |
| | | |
| | | The negative impact of the dollar’s strengthening on operating earnings was somewhat offset by a positive impact of the translation of the Company’s U.S.-dollar-denominated debt into Canadian dollars which totalled $24.7 million pre-tax for the year ended December 31, 2005. |
| | | |
| | | The chart below illustrates the movement of the CDN$/US$ spot rate over the past five years. |
Globally, the industry also continued to struggle with rising input costs, particularly with respect to increased energy and fibre prices. Due to its location in British Columbia, the Company was, to a certain extent, insulated from these effects because it benefits from lower fibre and electricity costs compared to other regions.
| | 7 | |
In addition, the Company’s relatively low use of fossil fuels, due to its ability to use lower priced alternatives, lessens its exposure to rising fuel prices. However, like other producers, the Company is exposed to rising energy prices as they significantly impact transportation and chemical costs. In addition, it is one of the few companies fully exposed to Canadian dollar fluctuations. As a result of these challenging conditions, several producers indefinitely idled or permanently closed down a number of their mill operations during the year.
Despite the various challenges facing the Company, its 2005 performance improvement program exceeded expectations, surpassing its goal by 5%. With the conclusion of the 2005 program, the Company realized $84 million in year-over-year EBITDA improvements, exceeding its $80 million target by $4 million. The “Progress on 2005 Strategic Initiatives” section includes a detailed discussion on the current year results.
The U.S. economy continued its strong performance in 2005, driven by consumer spending, industrial production, job growth, and homebuilding which offset high energy costs during the year. Despite the strong U.S. economy, market conditions for the Company’s suite of products were mixed during 2005.
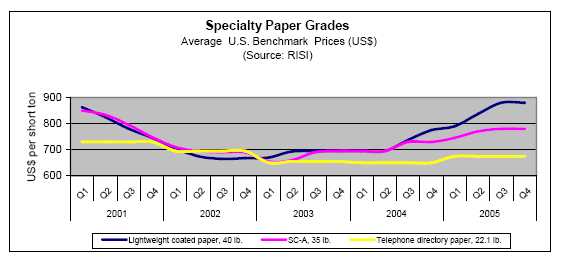
Coated mechanical markets were tight for much of the year despite weaker demand. As a result of tight market conditions, lightweight coated (“LWC”) prices in 2005 increased by approximately 17% over 2004.
Uncoated mechanical markets were strong, with job growth and consumer confidence leading to strong retail sales. Prices for super-calendered A grades (“SC-A”), a common benchmark for a number of uncoated mechanical paper grades, increased by approximately 8% in 2005. Prices for MF hi-brite and super-brite grades increased between 7% and 9% over the previous year, depending on the grade.
Directory markets were stable in 2005. Competition between traditional telephone directory publishers and independents in the yellow pages book market resulted in new publications and additional page counts in the year. Contract pricing in 2005 was up by approximately 4% from 2004.
Kraft paper markets were sluggish for much of the year, largely due to weak corrugated box shipments. A combination of falling inventories and cost pressures resulted in some improvement in market conditions late in the year. Compared to 2004, 2005 average prices for white top linerboard showed a marginal improvement.
Newsprint markets in the U.S. continued to experience declining demand and consumption due to decreases in ad lineage, circulation, and average basis weights. However, cost pressures and the strong Canadian dollar drove transaction prices higher compared to the previous year.
| | 8 | |
As a result, prices moved up slowly but steadily over the year. Average prices for 2005 were up by an average of 10% compared to 2004.
Pulp markets weakened in 2005. Despite a slight increase in global shipments compared to 2004, new capacity in Asia and South America during the year resulted in softer than anticipated pricing in Asia and Europe. In Europe NBSK pulp benchmark prices declined by approximately 1% compared to 2004; however transaction prices fared worse due to competitive pressures and generally weaker non-contract markets.
In early February 2005, the Company indefinitely idled its Port Alberni No.3 paper machine displacing 140,000 tonnes per year of the Company’s newsprint capacity. Related restructuring costs for the year were approximately $6 million.
On October 3, 2005, the Company’s shareholders voted 99.9% in favour of changing the Company’s name from Norske Skog Canada Limited to Catalyst Paper Corporation. In addition, effective October 1, 2005, the Company dissolved its U.S. marketing joint venture with Norske Skogindustrier ASA (“Norske Skog”).
| | | Ø | Changed the Company’s name, reflecting its unique identity as an independent producer of paper and pulp products that are sold globally. |
|
|
| | | | |
| | | Ø | Dissolved the Company’s U.S. marketing joint venture with Norske Skog, after which the Company returned to marketing its specialty paper products directly to North American customers. |
|
|
| | | | |
| | | Ø | Recorded the safest year in the Company’s history with the lowest medical incident rate and lost-time injury frequency. |
|
| | | | |
| | | Ø | Realized an $84 million improvement in EBITDA as a result of the Company’s 2005 performance improvement program. |
|
| | | | |
| | | Ø | Increased sales of Electraprime, the Company’s SC-A alternative product, by 56,000 tonnes to 89,000 tonnes during 2005. |
|
| | | | |
| | | Ø | Reduced the use of high-cost kraft in paper production to the lowest level in the Company’s history, resulting in savings of $18 million. |
|
| | | | |
| | | Ø | Optimized the Company’s fibre mix, including the realization of the lowest delivered chip cost since 2002. |
|
| | | | |
| | | Ø | Reduced the Company’s reliance on fossil fuels to record lows through the use of lower priced alternatives and conservation initiatives. |
|
| | | | |
| | | Ø | Received recognition for product quality, including supplier of the year from Verizon Information Services and Vertis Inc. |
|
| | 9 | |
| | | Ø | Recognized as one of the top ten companies of the decade for the Company’s amount of greenhouse gas reduction over the past ten years. By the end of 2005, the Company has reduced greenhouse gas emissions by 71% below 1990 levels. |
|
|
|
| | 1.4 | Selected Financial Information |
| (In millions of dollars, except where otherwise stated) | | | | | | | | | |
| | | 2005 | | | 2004 | | | 2003 | |
| Sales | $ | 1,823.9 | | $ | 1,878.2 | | $ | 1,820.5 | |
| Operating earnings (loss) | | (25.1 | ) | | (31.3 | ) | | (111.6 | ) |
| EBITDA1 | | 155.2 | | | 152.8 | | | 78.3 | |
| Net earnings (loss) | | (25.6 | ) | | (28.6 | ) | | (84.5 | ) |
| EBITDA margin2 | | 8.5% | | | 8.1% | | | 4.3% | |
| Net earnings (loss) per share (in dollars) – basic | | | | | | | | | |
| and diluted | | (0.12 | ) | | (0.13 | ) | | (0.41 | ) |
| Total assets | | 2,695.9 | | | 2,745.9 | | | 2,816.4 | |
| Total long-term liabilities | $ | 1,396.8 | | $ | 1,417.6 | | $ | 1,479.9 | |
| Sales (000 tonnes) | | | | | | | | | |
| Specialty papers | | 1,063.2 | | | 1,115.5 | | | 1,084.7 | |
| Newsprint | | 707.1 | | | 754.7 | | | 768.7 | |
| Total paper | | 1,770.3 | | | 1,870.2 | | | 1,853.4 | |
| Pulp | | 482.7 | | | 405.5 | | | 421.3 | |
| Total sales | | 2,253.0 | | | 2,275.7 | | | 2,274.7 | |
| Production (000 tonnes) | | | | | | | | | |
| Specialty papers | | 1,066.0 | | | 1,123.1 | | | 1,075.3 | |
| Newsprint | | 699.5 | | | 757.8 | | | 774.8 | |
| Total paper | | 1,765.5 | | | 1,880.9 | | | 1,850.1 | |
| Pulp | | 474.2 | | | 420.9 | | | 418.8 | |
| Total production | | 2,239.7 | | | 2,301.8 | | | 2,268.9 | |
| Average spot foreign exchange rate C$/US$3 | | 1.212 | | | 1.302 | | | 1.402 | |
| Period-end spot foreign exchange rate C$/US$4 | | 1.166 | | | 1.204 | | | 1.292 | |
| Effective foreign exchange rate C$/US$5 | | 1.239 | | | 1.359 | | | 1.454 | |
| Common shares (millions): | | | | | | | | | |
| At period end | | 214.6 | | | 214.6 | | | 214.6 | |
| Weighted average | | 214.6 | | | 214.6 | | | 206.6 | |
| | | 1. | EBITDA is a non-GAAP measure. Refer to “Non-GAAP Measures” for further details. |
| | | 2. | EBITDA margin is defined as EBITDA as a percentage of sales. |
| | | 3. | Average spot foreign exchange rate is the average Bank of Canada noon spot rate over the reporting period. |
| | | 4. | Period-end spot foreign exchange rate is the Bank of Canada noon spot rate. |
| | | 5. | Effective foreign exchange rate represents a blended rate which takes into account the applicable spot rates and the Company’s revenue hedging program in the reporting period. |
| | 1.5 | Strategy |
| | | |
| | | The Company’s long-term objective is to achieve higher, sustainable earnings and maximize cash flow by strengthening its position as a leading producer of value-added paper and related forest products within Western North America. |
| | | |
| | | Key Performance Drivers |
| | | The Company believes the following key performance drivers are critical in achieving its strategic goals and creating value for its investors. |
| | 10 | |
Strong Market Position
Market positioning is a significant driver of the Company’s success. As one of the largest North American based producers of newsprint and uncoated groundwood specialty papers, market penetration is important. The Company’s brand names are well recognized in the marketplace and it has worked hard to build a reputation for reliability, value and service.
Upgraded, Cost-Competitive Manufacturing
In the past five years, capital expenditures of approximately $463 million have been directed primarily towards the Company’s manufacturing facilities to shift production towards higher margin papers, reduce unit production costs, increase operating efficiency, improve product quality, increase capacity, and meet or exceed environmental regulations.
Diversified Product Mix
In recent years, the Company has introduced or expanded a number of specialty paper and differentiated product lines, including lightweight newsprint grades, coated papers, MF hi-brites, super hi-brites, soft-calendered grades, directory, sawdust-based pulp, and whitetop linerboard. These products offer improved margins over standard commodity newsprint grades. Additionally, market pulp accounts for only 20% of the Company’s manufacturing capacity, significantly limiting the Company’s relative exposure to volatile pulp markets.
Strong Supply Chain
The Company has a strong and flexible distribution network. The Company utilizes all transportation modes available to it such as truck, rail, container, and break-bulk shipping. The Company’s supply chain systems have enabled better planning and scheduling, allowing the Company to use the most cost-efficient mode of transportation on its shipments.
Production Expertise
Over the last several years, the Company has developed expertise in the production of lightweight papers. Lower basis weight papers improve the Company’s costs by reducing fibre, conversion, shipping, storage and handling costs and warehouse space required for inventories. The use of lower basis weight paper by the Company’s customers also reduces their costs. The Company’s papermaking expertise enables it to produce high quality, higher brightness uncoated groundwood grades. In addition, new product development continues to be an important focus.
The Company is also one of the few manufacturers of sawdust-based pulp in the world. This product is valued by producers of tissue and wood-free printing papers as a substitute for more costly NBSK pulp.
| | 11 | |
Skilled People
The Company’s employees act as strategic partners when tackling challenges and improving the Company’s performance. Recognizing this, the Company strives to be a top employer by providing a work environment that is safe, challenging, interesting, and rewarding.
The Company’s management team is comprised of seasoned industry professionals with experience operating through multiple business cycles in the paper and forest products industry. The Company’s executives have an average of over 16 years of industry experience and 11 years with the Company.
Sound Corporate Social Responsibility
Corporate social responsibility is one of the Company’s core values. The Company views success in this area as the health of citizens in its communities, safety and well-being of its employees, vibrancy of its communities, and sustainability of the Company’s practices with respect to their impact on the environment. For a complete description of the Company’s objectives and progress please see the Company’s 2005 Accountability Report.
Key Performance Indicators
The Company believes the following key performance indicators are meaningful indicators for measuring the Company’s progress in achieving its strategic goals and creating value for investors.
Safety
The well being of its employees is the Company’s first priority. Safety is measured in terms of the medical incident rate (“MIR”), which is the number of incidents requiring medical attention per 200,000 hours worked, and the lost-time injury frequency (“LTI”), which is the number of lost-time injuries per 200,000 hours worked. 2005 was the safest year on record for the Company, and for additional details on current year results see the Company’s 2005 Accountability Report.
EBITDA
EBITDA is widely used in the financial community to compare the profitability of corporations, and is used by management as an indicator of relative operating performance. See the “Consolidated Results of Operations”, “Segmented Results of Operations”, and the “Non-GAAP Measures” sections for further analysis and discussion of this indicator.
Performance Improvement Program
One of the characteristics of the Company’s culture is that of engaging its people in projects that challenge the status quo. The Company, for several years, has aggregated these initiatives on an annual basis into “Performance Improvement Programs”. Performance improvement initiatives challenge the Company to create innovative and cost effective business solutions.
| | 12 | |
In 2005, the Company launched its fourth consecutive performance improvement program. See “Progress on 2005 Strategic Initiatives” for a detailed summary of the 2005 Performance Improvement Program.
Average Sales Revenue per Tonne
Average sale revenue per tonne for each core business provides key insights on how the Company maximizes its market position. The main factors in revenue growth are U.S. dollar transaction prices, and the relationship between the Canadian and U.S. dollar. For details on 2005 results see “Segmented Results of Operations”.
Average Cash Costs
Reducing cash costs, while maintaining product quality is essential to sustaining profitability in each of the Company’s core businesses. The Company continually examines all areas of its business for cost reduction opportunities. For details on 2005 results see “Segmented Results of Operations”.
Debt to Capitalization
The Company’s success also depends on its liquidity and continued ability to finance its growth. The Company focuses on its total debt to total capitalization ratio, and net debt to net capitalization ratio, in order to assess its debt position. See “Liquidity and Capital Resources” for further discussion.
Greenhouse Gas Emissions (“GHG”)
The Company takes its environmental responsibility seriously and as such has invested heavily in environmental initiatives. The Company has reduced GHGs by 71% since 1990, and is well positioned to meet objectives established by the Kyoto Protocol. Emissions are measured in direct GHGs per tonne. In recognition of its progress, in 2005 the Company was named one of the top ten companies of the decade in terms of reducing greenhouse gases. For further details on current year results see the Company’s 2005 Accountability Report.
| | 13 | |
Strategic Initiatives
The Company’s strategic initiatives in 2005 and 2004 were as follows:
| (All amounts pre-tax and in millions of dollars) |
Initiative
| Performance Goal
| 2005
Goal | 2005
Achievement | 2004
Achievement |
|
| Components of Performance Improvement Programs |
i) Grade Development
and Product
Optimization | Develop new, higher-value specialty products, reduce exposure to the commodity newsprint market, and optimize product, grade and customer mix. | $16 | $19 | $ 18 |
|
|
|
|
ii) Cost Reduction
| Reduce kraft usage
Fibre optimization
Improve energy efficiencies
Freight optimization
Optimize chemical usage
Productivity improvements
Deinked pulp cost reduction
Other | 13
9
7
6
4
9
-
16 | 18
12
10
7
4
-
-
14 | 21
15
3
4
-
-
19
23 |
|
|
|
|
|
|
|
| | | 64 | 65 | 85 |
| | | $80 | $84 | $103 |
Progress on 2005 Strategic Initiatives
| | | (a) | Performance Improvement Program |
| | | | In January 2005, the Company commenced its fourth consecutive annual performance improvement program. The 2005 performance improvement program was aimed at generating $80 million in year-over-year EBITDA improvements across all areas of the Company. The Company identified improvements in the areas of grade development and product optimization, and cost reduction. In 2005, $84 million in realized savings was delivered from the Performance Improvement Program. |
|
|
|
|
|
|
| | | | |
| | | i) | Grade Development and Product Optimization |
| | | | This strategic initiative included the marketing of new high-value specialty paper products, and the reduction of the Company’s exposure to standard newsprint. In 2005, the Company realized EBITDA improvements of $19 million as a result of its various grade development and product optimization initiatives. |
|
|
|
|
| | 14 | |
| | | | In pursuit of these performance initiatives, the Company accomplished the following in 2005: |
| | | | |
| | | | Sales of Electraprime and Electrastar |
| | | | In 2003, the Company introduced Electraprime to the market. The Electraprime grade is a soft-calendered, high-brightness paper designed to compete as an alternative to SC-A grades used primarily for advertising flyers and inserts. Electraprime was well received in the market with sales of approximately 89,000 tonnes in 2005, an improvement of approximately 56,000 tonnes from the previous year. This was in excess of its goal to sell an additional 40,000 tonnes in 2005. The Company intends to continue growing its Electraprime business through 2006. |
| | | | |
| | | | The Electrastar grade was also introduced to the market in 2003 and is a super high-brightness grade designed for applications in which brightness is a desirable characteristic, such as inserts and specialty newspapers. Electrastar sales volumes were up 10% to 60,000 tonnes from the previous year, which was in line with the Company’s expectations. Potential opportunities to grow the Electrastar grade will depend, amongst other things, on its profitability relative to other MF hi-brite grades, machine capacity constraints, and competitive factors. |
| | | | |
| | | ii) | Cost Reduction |
| | | | On the Company’s initiative to reduce costs, the following was accomplished in 2005: |
| | | | |
| | | | Reduce Kraft Usage |
| | | | The Company continued to use low-cost fillers and reduced kraft input while maintaining quality and improving printability. In 2005, kraft usage was the lowest in Company history. The amount of kraft used in specialty and newsprint paper products was reduced by 2.6%, from 6.5% in 2004 to 3.9% in the current year. Approximately $18 million in savings were realized as a result of this initiative. |
| | | | |
| | | | Fibre Optimization |
| | | | The Company further optimized its fibre mix during the year. Specifically, the Company improved utilization of lower cost chips, recording the lowest delivered chip cost since 2002. In addition, the start-up of the reconfigured thermo-mechanical pulp (“TMP”) mill at Crofton resulted in higher use of lower cost TMP. This and other smaller initiatives yielded an additional $12 million in savings. |
| | 15 | |
| | | | Improve Energy Efficiencies |
| | | | The Company is a significant consumer of energy. The continuing optimization of the fuel mix in the Company’s power boilers has resulted in less reliance on fossil fuels in favour of wood waste hog fuel. In addition the Company has increased the amount of steam generated from its recovery boilers, and renegotiated delivery costs associated with a natural gas contract. These and other energy reduction initiatives resulted in additional savings of $10 million in 2005. |
| | | | | |
| | | | Freight Optimization |
| | | | The Company’s key freight initiatives included improving the destination mix to reduce volumes to high-cost markets, rationalizing routes and mode mix, and reducing container shipment costs. These and other initiatives resulted in additional savings of $7 million in the current year. |
| | | | | |
| | | | Optimize Chemical Usage |
| | | | The Company optimized its chemical mix to include more low-cost chemicals, resulting in additional savings of $4 million during the current year. |
| | | | | |
| | | | Productivity Improvements |
| | | | The Company had a number of productivity initiatives during 2005 that were focused on improved efficiency and speed. While many of the initiatives were completed, several unforeseen events such as delays with the mills returning to production after their annual shutdowns mitigated the positive impact of these improvements. Consequently, the Company did not report any net savings from these initiatives. |
| | | | | |
| | | | Other |
| | | | The Company also completed a series of smaller initiatives, primarily with respect to procurement improvements and its maintenance practices. Approximately $14 million in savings were realized as a result of these initiatives. |
| | | | | |
| | | (b) | Other Strategic Initiatives |
| | | | | |
| | | | i) | Preferred Supplier |
| | | | | |
| | | | | Quality Initiatives |
| | | | | During the year, the Company focused on advancing its preferred supplier status with key customers by continuing to improve the consistency, runnability, and reliability of its products, and on time delivery service. In addition the Company was recognized for its product quality, receiving supplier of the year from Verizon Information Services and Vertis Inc. |
| | 16 | |
| | | | Chain of Custody Certification |
| | | | During the previous year, the Company implemented the “independent chain of custody” system to certify its wood fibre supply. This is a third party audited system that identifies the source of wood fibre, and whether or not it is derived from a forest independently certified as being managed in accordance with a recognized sustainable forest certification. The independent chain of custody provides a valuable tool to assure customers that paper contains wood fibre derived from well-managed forests, and has resulted in additional sales opportunities. |
| | | | |
| | | Systems and Processes |
| | | | |
| | | As part of its ongoing initiatives to improve efficiency, the Company will further invest in improved systems and processes in 2006. The Company anticipates that an upgrade in its enterprise reporting system will be completed by the third quarter of 2006, and will cost approximately $2.5 million for capitalizable software, hardware, and consulting. |
| | | | |
| | | 2006 Performance Improvement Program |
| | | | |
| | | In January 2006, the Company announced its fifth consecutive annual performance improvement program. The Company identified further improvements in the areas of grade development and product optimization, and cost reduction. The 2006 Performance Improvement Program is aimed at generating $70 million in EBITDA improvements across all areas of the Company, year over year. |
| | | | |
| | 1.6 | Consolidated Results of Operations |
| | | | |
| | | Sales |
| | | Sales for the current year of $1,823.9 million were down 2.9%, compared to $1,878.2 million in the previous year. Higher average paper prices and an improved customer, grade, and market mix were more than offset by the negative impact of the stronger Canadian dollar, and lower sales volumes resulting from the indefinite idling of the Company’s Port Alberni No. 3 paper machine in early February 2005. |
| Sales ($ millions) |
| Year ended
December 31 |
| Total
Change | Increase (decrease) from 2004
as a result of: |
|
|
2005 |
2004 |
Volume |
Mix |
Price |
F/X |
|
Specialties
Newsprint | $ 994.7
529.1 | $1,037.2
553.1 | $(42.5)
(24.0) | $(48.6)
(34.9) | $12.0
5.5 | $ 81.6
49.9 | $ (87.5)
(44.5) |
|
Total Paper
Pulp | $1,523.8
300.1 | $1,590.3
287.9 | $(66.5)
12.2 | $(83.5)
54.8 | $17.5
2.4 | $131.5
(18.1) | $(132.0)
(26.9) |
|
| Total | $1,823.9 | $1,878.2 | $(54.3) | $(28.7) | $19.9 | $113.4 | $(158.9) |
| | 17 | |
EBITDA
EBITDA for the current year of $155.2 million was up 1.6% compared to $152.8 million in the previous year. The positive impact of higher paper prices, performance improvement benefits, and the absence of costs associated with the Elk Falls kraft mill rationalization, which occurred in the first quarter of 2004, was largely offset by the stronger Canadian dollar, and to a lesser extent, lower pulp prices. Other influences on costs included inflation on energy, inputs and services, higher levels of biannual planned maintenance and curtailment, and higher selling, general and administration (“SG&A”) costs which included costs associated with the dissolution of the Company’s U.S. marketing joint venture and the Company’s name change, along with higher audit and regulatory costs. The following table summarizes the key changes in EBITDA from the year ended December 31, 2004 to the year ended December 31, 2005:
| ($millions) | |
2004 EBITDA
Improved paper prices
Lower pulp prices
Impact of stronger Canadian dollar, net of hedging program(1)
Performance improvements
Absence of 2004 Elk Falls rationalization project
Inflation
Maintenance shutdowns and curtailment
SG&A
Other, net | $ 152.8
130.0
(15.7)
(139.9)
84.0
24.0
(36.7)
(17.9)
(7.2)
(18.2) |
|
|
|
|
|
|
|
|
|
| 2005 EBITDA | $ 155.2 |
|
| | | 1. | Includes foreign exchange impact on costs. |
Operating earnings (loss)
The Company recorded an operating loss of $25.1 million for the current year, compared to an operating loss of $31.3 million for the previous year. The decrease in operating loss was related to the $2.4 million increase in EBITDA (see EBITDA section above) and a $3.8 million reduction in amortization expense.
Net earnings (loss)
Net loss for the current year was $25.6 million ($0.12 per common share) compared to net loss of $28.6 million ($0.13 per common share) for the same period last year. The net loss for the current year included a $20.7 million ($0.10 per common share) after-tax foreign exchange gain on the translation of U.S.-dollar-denominated debt, compared to an after-tax gain of $44.0 million ($0.21 per common share) for the previous year. The decrease in net loss was largely attributable to the decrease in foreign exchange gain, which was partially offset by net favourable future income tax adjustments totalling $18.3 million ($0.09 per common share), consisting primarily of a $14.2 million positive future income tax adjustment from a decrease in the British Columbia provincial income tax rate, effective July 1, 2005.
| | 18 | |
The following table reconciles 2005 earnings (loss) to 2004:
| ($millions) | Pre-tax | After-tax |
| 2004 earnings (loss) | $ (56.7) | $ (28.6) |
| Higher EBITDA | 2.4 | 1.6 |
| Lower amortization | 3.8 | 2.5 |
| Decreased foreign exchange gain on translation of long-term debt | (28.8) | (23.8) |
| Absence of 2004 loss on repayment of long-term debt | 5.2 | 3.4 |
| Interest | (0.8) | (0.5) |
| Income tax adjustments, net | - | 18.3 |
| Non-controlling interest | (0.6) | (0.6) |
| Other, net | 3.3 | 2.1 |
| 2005 earnings (loss) | $ (72.2) | $ (25.6) |
| 2.0 | SEGMENTED RESULTS OF OPERATIONS |
| | | |
| | 2.1 | Specialty Papers |
| Summary of Selected Financial Information |
| (In millions of dollars, except where otherwisestated) | 2005 | 2004 | 2003 |
Sales
EBITDA1
Operating earnings (loss)
EBITDA margin |
$ 994.7
119.2
21.4
12.0% |
$ 1,037.2
103.4
1.9
10.0% |
$ 1,002.7
66.0
(32.5)
6.6% |
|
|
|
|
Sales (000 tonnes)
Production (000 tonnes) |
1,063.2
1,066.0 |
1,115.5
1,123.1 |
1,084.7
1,075.3 |
|
|
Average sales revenue per tonne
Average cash costs per tonne2 |
$ 936
824 |
$ 930
837 |
$ 924
864 |
|
|
SC-A paper, 35lb. (US$ per ton)3
LWC paper, No.5, 40lb (US$ per ton)3
Telephone directory paper, 22.1 lb. (US$ per
ton)3 |
769
846
675 |
713
726
650 |
675
688
654 |
|
|
|
|
| | | 1. | EBITDA is a non-GAAP measure. Refer to the “Non-GAAP Measures” section for further details. |
| | | 2. | Average cash costs per tonne for these purposes consist of cost of sales and SG&A costs. |
| | | 3. | Benchmark prices are sourced from Resource Information Systems, Inc. (“RISI”). |
| | 2.1.1 | Markets |
| | | |
| | | Coated mechanical paper markets were tight during the first half of the year before levelling off in the fall of 2005. On a year-over-year basis, demand for North American LWC paper was down 3.1% in 2005, largely |
| | 19 | |
as a result of weaker magazine circulation, flat ad pages, and some grade substitution, namely to SC-A. Despite weak demand, markets were tight for the majority of the year as a result of supply disruptions in Canada and Finland, which more than offset demand declines. As a result, average LWC benchmark prices increased by US$120 per ton compared to 2004.
North American uncoated mechanical paper markets remained strong as job growth and consumer confidence drove retail sales. As a result, demand for uncoated mechanical grades, which service the retail insert and flyer market, were up 2.3% in 2005 over the previous year. Average SC-A benchmark prices increased approximately US$56 per ton from the previous year. Average MF hi-brite and super-brite prices increased between US$50 and US$60 per tonne, depending on the grade, from the previous year.
Demand for directory grades remained steady as competition between traditional telephone directory publishers and independents in the yellow pages phone book markets resulted in new publications and additional page counts. Demand increased 1.5% year over year in 2005, and contract prices were up by 3.8%, or US$25 per ton, versus 2004. Kraft paper markets were sluggish for much of the year as weak corrugated box shipments led to a 3.1% decrease in demand in 2005. A combination of falling inventories, cost pressures, and improving corrugated box shipments resulted in some improvement in market conditions late in the year. As previously mentioned, average whitetop linerboard prices in 2005 were up slightly over 2004.
| | 20 | |
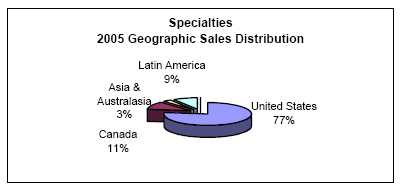
The North American economy continues to be a key driver for the Company’s specialty paper business with 88% of its product sold to this market. The Company continues to look for ways to optimize its customer mix as part of its initiatives to improve profitability.
The 2005 geographical sales distribution, based on sales volumes, is depicted in the chart below.
| | 2.1.2 | Segment Overview |
| | | |
| | | In addition to growing its sales of its Electraprime grade, the Company’s key areas of focus for specialty papers in 2005 were grade optimization, reducing grade switches resulting in longer production runs, enhancing its customer and grade mix, and shipping to more freight logical locations. |
| | | |
| | | Sales volumes for coated grades were consistent with the previous year. |
| | | |
| | | Sales volumes for uncoated mechanical grades, excluding directory, were up, in large measure due to the previously mentioned additional sales of Electraprime. The Company’s uncoated mechanical grades benefited from the strong market conditions during the year. |
| | | |
| | | Sales volumes for directory papers were lower than the previous year, due to the grade and customer rationalization. The Company’s focus continues to be the growth of its more profitable lighter basis weight directory business, and the enhancement of its customer and grade mix. The Company capitalized on stronger spot pricing in the second half of the year. |
| | | |
| | | The kraft paper business experienced sluggish market conditions for much of 2005, causing the Company to curtail its Elk Falls No.4 paper for 31 days during the year. As a result, kraft paper volumes were lower than the previous year, and prices were weaker for much of the year. The Company’s focus continued to be on optimizing business with customers producing high graphic products and more freight logical customers. |
| | 21 | |
| | 2.1.3 | Operational Performance |
| | | |
| | | The specialty papers business recorded operating earnings of $21.4 million on sales of $994.7 million in the current year, compared to operating earnings of $1.9 million on sales of $1,037.2 million for the same period last year. EBITDA of $119.2 million for the current year was $15.8 million higher than the $103.4 million recorded in the same period last year. |
| | | |
| | | Sales volume of 1,063,200 tonnes in the current period decreased 52,300 tonnes, or 4.7%. The decline from the previous year was largely due to lower directory shipments, primarily resulting from the Company’s grade and customer rationalization, which was partially offset by growth in the Company’s uncoated specialty paper business. |
| | | |
| | | Average sales revenue in the current period of $936 per tonne increased $6 per tonne compared to the previous year. Higher transaction prices across most grades, particularly for coated and uncoated mechanical grades, and an enhanced grade and customer mix driven by various performance improvement initiatives more than offset the adverse impact of the significantly stronger Canadian dollar. |
| | | |
| | | Average cash costs in the current period were $824 per tonne, an improvement of $13 per tonne compared to the previous year. Savings from performance improvements and lower fibre prices were the primary drivers of the improvement. |
| | | |
| | 2.1.4 | Outlook |
| | | |
| | | Specialty paper markets are expected to be generally stable, with some unique differences by product. |
| | | |
| | | For coated mechanical papers, demand is expected to be relatively flat due to weak magazine circulation and ad page growth. In addition, the U.S. postal rate increase of 5.4% effective January 8, 2006, is expected to have some negative impact on catalogue demand in the first half of the year. Despite flat demand, cost pressures are likely to keep prices relatively stable early in the year before gradually declining in the second half of the year as the economy slows. |
| | | |
| | | Uncoated mechanical paper demand is forecast to grow slightly as consumer spending, while weaker than 2005, is expected to remain relatively strong. Prices for MF hi-brite grades are expected to trend upwards in the first half of the year, and possibly beyond this, depending on newsprint price levels. |
| | | |
| | | Directory demand is expected to be up slightly in 2006 as a result of new independent publications and increased page counts from traditional telephone directory companies. On the supply side, directory mills are |
| | 22 | |
| | | expected to continue running at high operating rates. For directory, 2006 contract prices are expected to show a modest improvement over 2005. |
| | | |
| | | Kraft paper demand is expected to increase in 2006 due to strengthening demand for durable and non-durable goods, and inventory restocking. The improving market fundamentals should lead to increasing prices in 2006. An announced price increase of $40 per ton effective January 1, 2006, reflects the improving market conditions. |
| | | |
| | | The Company intends to continue focusing on product, customer, and geographical optimization for its specialty paper grades in 2006. |
| | | |
| | 2.2 | Newsprint |
| Summary of Selected Financial Information |
| (In millions of dollars, except where otherwise stated) | 2005 | 2004 | 2003 |
Sales
EBITDA1
Operating earnings (loss)
EBITDA margin |
$ 529.1
58.1
12.3
11.0% |
$ 553.1
45.2
(4.3)
8.2% |
$ 539.2
5.1
(56.6)
0.9% |
|
|
|
|
Sales (000 tonnes)
Production (000 tonnes) |
707.1
699.5 |
754.7
757.8 |
768.7
774.8 |
|
|
Average sales revenue per tonne
Average cash costs per tonne2 |
$ 748
666 |
$ 733
673 |
$ 701
695 |
|
|
| Newsprint 48.8 gsm, West Coast Delivery (US$ per tonne)3 | 600 | 544 | 493 |
| | | 1. | EBITDA is a non-GAAP measure. Refer to the “Non-GAAP Measures” section for further details. |
| | | 2. | Average cash costs per tonne for these purposes consist of cost of sales and SG&A costs. |
| | | 3. | Benchmark prices are sourced from RISI. |
| | 2.2.1 | Markets |
| | | |
| | | The trend in newsprint consumption decline continued throughout 2005 with U.S. consumption and demand down 5.1% and 6.3%, respectively in 2005 compared to 2004. The consumption declines are due in large part to decreases in ad lineage, circulation, and lower average basis weights. The shift to lower average basis weights accounts for 1.7% of the decline; a shift that the Company views as favourable. Cost pressures and the stronger Canadian dollar drove transaction prices higher and average benchmark prices increased US$56 per tonne compared to the previous year, ending the year at US$635 per tonne. |
| | 23 | |

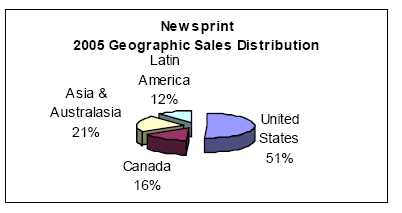
Approximately 67% of the Company’s newsprint sales were to the U.S. and Canada. The 2005 geographical sales distribution, based on sales volumes, is depicted in the chart below.
| | 2.2.2 | Segment Overview |
| | | |
| | | The primary focus areas for newsprint in 2005 were enhancing customer mix, developing specialty lighter and smoother newsprint grades, and optimizing the Company’s significant newsprint swing capacity. |
| | | |
| | | The Company continued to make progress on its drive towards lowering basis weights in 2005. In addition, successful cost reduction initiatives included freight optimization, particularly with respect to international sales, and a further reduction of kraft in its newsprint from 3.7% in 2004 to 1.3% in 2005. |
| | 24 | |
Effective early February 2005, the Company indefinitely idled its Port Alberni No.3 paper machine displacing 140,000 tonnes per year of newsprint capacity, in response to the prolonged strength of the Canadian dollar and related cost pressures.
The chart below illustrates the decline in the Company’s newsprint cash costs per tonne since 2002.

| | 2.2.3 | Operational Performance |
| | | |
| | | The newsprint business recorded operating earnings of $12.3 million on sales of $529.1 million in the current year, compared to an operating loss of $4.3 million on sales of $553.1 million for the previous year. EBITDA of $58.1 million for the current year was $12.9 million higher than the $45.2 million recorded in 2004. |
| | | |
| | | Sales volume of 707,100 tonnes in the current period was down 47,600 tonnes, or 6.3%, from the same period last year, primarily due to the indefinite idling of the Port Alberni No.3 paper machine in early February 2005. |
| | | |
| | | Average sales revenue in the current period of $748 per tonne increased $15 per tonne compared to the previous year. Higher prices and, to a lesser extent, a higher-value market, grade, and customer mix were the major factors that more than offset the adverse impact of the stronger Canadian dollar. |
| | | |
| | | Average cash costs in the current period were $666 per tonne, an improvement of $7 per tonne from the previous year. Savings from performance improvements and lower fibre prices more than offset increased SG&A costs and higher restructuring costs related to the indefinite idling of the Port Alberni No.3 paper machine. |
| | 25 | |
| | 2.2.4 | Outlook |
| | | |
| | | For newsprint, the downward consumption trend is expected to continue in 2006 due to lower circulation, ad lineage and basis weights, albeit at a lower rate of decline than 2005. The high Canadian dollar and cost pressures have prompted a US$40 per tonne price increase announcement, for effect February 1, 2006.The Company believes the decline in newsprint consumption is in part due to a shift by advertisers to uncoated specialty grades as growth in these grades has partially offset the decline in newsprint consumption. As a result, the Company believes that it is well positioned to address either further demand reductions, or a recovery in the newsprint market due to its ability to switch grades. |
| | | |
| | | Optimization of newsprint swing capacity will continue to be a priority for 2006. In addition, the Company intends to continue its drive to more profitable lighter basis weight grades, where it is widely recognized as a market leader. |
| | | |
| | 2.3 | Pulp |
| Summary of Selected Financial Information |
| (In millions of dollars, except where otherwise stated) | 2005 | 2004 | 2003 |
Sales
EBITDA1
Operating earnings (loss)
EBITDA margin | $300.1
(22.1)
(58.8)
(7.4%) | $287.9
4.2
(28.9)
1.5% | $278.6
7.2
(22.5)
2.6% |
|
|
|
Sales (000 tonnes)
Production (000 tonnes) |
482.7
474.2 |
405.5
420.9 |
421.3
418.8 |
|
|
Average sales revenue per tonne
Average cash costs per tonne2 |
$ 622
667 |
$ 710
699 |
$ 661
644 |
|
|
NBSK pulp, Northern Europe Delivery (US$ per
tonne)3 |
611 |
618 |
525 |
|
| | | 1. | EBITDA is a non-GAAP measure. Refer to the “Non-GAAP Measures” section for further details. |
| | | 2. | Average cash costs per tonne for these purposes consist of cost of sales and SG&A costs. |
| | | 3. | Benchmark prices are sourced from RISI. |
| | 2.3.1 | Markets |
| | | |
| | | Pulp markets remained sluggish throughout most of the year. Global pulp shipments increased slightly by 0.5% in 2005 compared to 2004, however the benefit was muted as new capacity came on line in 2005, which led to lower operating rates and weaker prices. Conditions improved somewhat towards the end of the year resulting in modest price improvements in most key markets. Overall, year-over-year average NBSK pulp benchmark prices decreased slightly by US$7 per tonne or 1%, to US$611 per tonne, compared to the previous year. Transaction prices fared worse |
| | 26 | |
due to competitive pressures and weak non-contract market conditions for most of the year.
The primary markets for the Company’s market pulp are Asia and Australasia and Europe. The 2005 geographical sales distribution, based on sales volumes, is depicted in the chart below.
| | 2.3.2 | Segment Overview |
| | | |
| | | In 2005, market pulp sales capacity increased signficantly through the considerable reduction of kraft pulp used in paper operations, as well as the absence of the Elk Falls kraft mill rationalization completed in early 2004. |
| | | |
| | | Cost reduction remained a key priority in 2005. In particular the segment significantly reduced its delivered chip costs, due in part to taking advantage of the abundant supply of low cost spruce, pine, and fir (“SPF”) fibre in British Columbia. This, and other performance improvement |
| | 27 | |
| | | initiatives, reduced the Company’s manufacturing costs by $25 per tonne compared to 2004. |
| | | |
| | 2.3.3 | Operational Performance |
| | | |
| | | The pulp business recorded an operating loss of $58.8 million on sales of $300.1 million in the current year, compared to an operating loss of $28.9 million on sales of $287.9 million for the previous year. Negative EBITDA of $22.1 million for the current year decreased $26.3 million from EBITDA of $4.2 million in 2004. |
| | | |
| | | Sales volume of 482,700 tonnes in the current period increased 77,200 tonnes, or 19.0%, from the same period last year due to the factors highlighted in the segment overview section. |
| | | |
| | | Average sales revenue in the current period of $622 per tonne was down $88 per tonne compared to the previous year, due primarily to the stronger Canadian dollar and lower year-over-year NBSK pulp prices. |
| | | |
| | | Average cash costs in the current year were $667 per tonne, an improvement of $32 per tonne compared to the same period last year. Savings from performance improvement initiatives,the absence of the Elk Falls rationalization noted above, and lower fibre prices offset higher SG&A costs. |
| | | |
| | 2.3.4 | Outlook |
| | | |
| | | For NBSK pulp markets, demand is expected to show modest improvement in 2006 due to anticipated increased printing and writing demand in China and Western Europe as well as inventory restocking. The Company expects prices on average to remain relatively flat in 2006, with an improvement in the first half of the year, partly offset by a decline later in the year. |
| | 28 | |
| 3.0 | FINANCIAL CONDITION |
| | |
| The following table highlights the significant changes in the consolidated balance sheets between December 31, 2005, and December 31, 2004. |
| (In millions of dollars) | 2005 | 2004 | Variance | Explanation |
| Working Capital | $ 237.1 | $ 260.0 | $ (22.9) | Decrease primarily reflects lower cash and cash equivalents and inventory levels, partially offset by lower payables. |
|
|
|
| Capital assets, net | 2,139.3 | 2,172.9 | (33.6) | Amortization expense exceeded capital asset additions and the impact of consolidating 100% of a variable interest entity in 2005 (see the “Changes in Accounting Policies” section for further details). Refer to the “Investing Activities” section for additional details on capital asset additions. |
|
|
|
|
|
|
|
|
| Other assets, net | 40.1 | 27.5 | 12.6 | Increase largely due to recording non- controlling interest as part of consolidating 100% of a variable interest entity in 2005 (see the “Changes in Accounting Policies” section for further details), partly offset by amortization of deferred financing costs. |
|
|
|
|
|
|
| Long-term debt | 861.9 | 823.6 | 38.3 | Increase primarily reflects approximately $57 million of new debt related to consolidating 100% of a variable interest entity in 2005 (see the “Changes in Accounting Policies” section for further details). Refer to the “Capital Resources” section for further details on the change in long-term debt. |
|
|
|
|
|
|
|
|
| Other long-term obligations | 209.7 | 233.6 | (23.9) | Decrease primarily relates to a reduction in the fair value of hedging instruments. |
|
|
| Future income taxes and deferred credits | 300.9 | 332.9 | (32.0) | Decrease primarily relates to the reduction in the provincial corporate tax rate and increased tax losses. |
|
|
|
| Contributed surplus | 7.3 | 4.8 | 2.5 | Increase relates to the recording of stock based compensation. |
|
|
| | 29 | |
| 4.0 | LIQUIDITY AND CAPITAL RESOURCES |
| Selected Financial Information | | | | | | | | | |
| (In millions of dollars, except where otherwise stated) | | 2005 | | | 2004 | | | 2003 | |
| Cash flows provided by operations before changes in | | | | | | | | | |
| non-cash working capital | $ | 104.5 | | $ | 88.9 | | $ | 0.1 | |
| Changes in non-cash working capital | | (11.5 | ) | | (24.4 | ) | | 22.4 | |
| Cash flows provided by operations | | 93.0 | | | 64.5 | | | 22.5 | |
| Cash flows used by investing activities | | (93.0 | ) | | (41.8 | ) | | (96.1 | ) |
| Cash flows provided (used) by financing activities | | (26.0 | ) | | 3.3 | | | 73.6 | |
| Capital spending | | 95.2 | | | 68.0 | | | 81.4 | |
| Amortization | | 180.3 | | | 184.1 | | | 189.9 | |
| Capital spending as % of amortization | | 53 | % | | 37 | % | | 43 | % |
| Total debt to total capitalization1,2 | | 46 | % | | 44 | % | | 44 | % |
| Net debt to net capitalization3,4 | | 46 | % | | 43 | % | | 44 | % |
| | | 1. | Total debt comprises long-term debt, including current portion. |
| | | 2. | Total capitalization comprises total debt and shareholders’ equity. |
| | | 3. | Net debt comprises total debt, less cash on hand. |
| | | 4. | Net capitalization comprises net debt and shareholders’ equity. |
The Company’s principal cash requirements are for working capital, capital expenditures, and interest payments on the Company’s debt. Cash flows are funded through operations and where necessary, through the revolving operating facility (the “Facility”). If necessary, liquidity requirements may be funded through the issuance of debt, equity or both. Access to current and alternative sources of financing at competitive cost is dependent upon the Company’s credit ratings and capital market conditions. The Company believes that the cash flow from operations and the Facility will be sufficient to meet its anticipated capital expenditures and debt repayment obligations in the near and intermediate term.
| | 4.1 | Operating Activities |
| | | |
| | | Cash flow provided from operating activities, after changes in non-cash working capital, in the current year was $93.0 million compared to cash provided from operating activities of $64.5 million in the previous year. The increase of $28.5 million was primarily attributed to decreased non- cash working capital requirements in the current year. The Company’s operating cash flow requirements are primarily for labour, salaries and benefits, the purchase of raw materials, energy, and distribution services. Working capital requirements in 2006 are not expected to be materially different than 2005 requirements. |
| | 30 | |
| | 4.2 | Investing Activities |
| | | |
| | | Cash flow used for investing activities in the current year totalled $93.0 million, compared to $41.8 million in the previous year. The absence of a $26.6 million purchase price adjustment, which was received in 2004, and increased capital spending in the current year were the primary drivers of the increase. |
| | | |
| | | The Company’s capital spending totalled $95.2 million, compared to $68.0 million in the previous year. Major capital investments during the year included an $8.3 million installation of sawdust screening equipment at the Elk Falls division, which is expected to increase the production of Elk Prime market pulp by approximately 17,000 tonnes annually, a $6.9 million upgrade to the Crofton division’s TMP facilities, which is expected to increase TMP production by approximately 21,000 tonnes annually, and a $5.1 million expansion of the bleaching capacity at the Powell River division. The bleaching capacity expansion will allow the Company to replace 36,000 tonnes of newsprint with higher-value uncoated specialty products. |
| | | |
| | | Capital spending levels are expected to be similar in 2006. Cash flows are expected to be generated primarily from operations and the Facility, if necessary. |
| | | |
| | 4.3 | Financing Activities |
| | | |
| | | Cash flow drawn by financing activities was $26.0 million in the current year compared to cash flow generated of $3.3 million in the previous year. The increase in cash flow drawn by financing activities of $29.3 million was primarily attributable to the absence of net proceeds on the senior note refinancing in March 2004. |
| | | |
| | 4.3.1 | Capital Resources |
| | | |
| | | The Company’s capital resources at December 31, 2005, included cash and cash equivalents along with the amount available under the Facility. The borrowing base on the Company’s $350.0 million Facility was $344.8 million. After outstanding letters of credit of $22.3 million, and a $6.5 million draw on the Facility, $316.0 million was available at year-end, compared to $318.5 million in the previous year. These resources, together with operating cash flows, are expected to enable the Company to meet the minimum payments, described in the table below. |
| | 31 | |
The following table presents the aggregate amount of future cash outflows for contractual obligations as of December 31, 2005, excluding amounts due for interest on outstanding indebtedness.
| | | Payments due by Period | |
| (In millions of dollars) | | 2006 | | | 2007 | | | 2008 | | | 2009 | | | 2010 | | | Thereafter | |
| | | | | | | | | | | | | | | | | | | |
| Long-term debt | $ | - | | $ | - | | $ | 6.5 | | $ | 75.0 | | $ | - | | $ | 780.4 | |
| | | | | | | | | | | | | | | | | | | |
| Capital lease obligations | | 0.7 | | | 0.7 | | | 0.7 | | | 0.7 | | | 0.7 | | | 3.6 | |
| | | | | | | | | | | | | | | | | | | |
| Operating leases | | 12.8 | | | 10.2 | | | 9.2 | | | 7.7 | | | 7.2 | | | 46.3 | |
| | | | | | | | | | | | | | | | | | | |
| Total | $ | 13.5 | | $ | 10.9 | | $ | 16.4 | | $ | 83.4 | | $ | 7.9 | | $ | 830.3 | |
As at December 31, 2005, the total long-term debt outstanding was $861.9 million. Principal repayments on this debt do not begin until June 2009. The Company’s net debt to net capitalization ratio as of December 31, 2005, was 46%, or 3% higher than December 31, 2004.
The following table illustrates the changes in the Company’s long-term debt during 2005.
Issue |
Carrying Value
December 31, 2004 |
Net Increase
(Decrease) | Foreign
Exchange
Impact |
Carrying Value
December 31, 2005 |
|
|
| (In millions of dollars) | | | | |
Recourse
Senior notes, 8.625% due June 2011
(US$400.0 million) |
$ 485.1 |
$ - |
$ (15.7) |
$ 469.4 |
|
|
Senior notes, 7.375% due March 2014
(US$250.0 million)1 |
300.9 |
- |
(9.4) |
291.5 |
|
Revolving operating facility of up to $350.0
million due July 2008 with interest based
on Canadian Prime/BA rates or U.S.
Base/LIBOR rates |
- |
6.5 |
- |
6.5 |
|
|
|
Non-recourse (PREI) |
|
|
|
|
|
First mortgage bonds, 6.387% due July
2009 |
37.6 |
37.42 |
- |
75.0 |
|
| Subordinated promissory notes | - | 19.52 | - | 19.5 |
| Total long-term debt | $ 823.6 | $ 63.4 | $ (25.1) | $ 861.9 |
| | 1. | US$250.0 million senior notes issued March 23, 2004. |
| | 2. | Net increase reflects approximately $57 million of new debt in 2005 due to the 100% consolidation of a variable interest entity (see the “Changes in Accounting Policies” section for further details). |
The Company is in compliance with the covenants under its Facility and senior notes indentures. The Company’s consolidated fixed charge coverage ratio (“CFCC Ratio”), as calculated under its senior notes, was at 2.0:1 for the last twelve months ended December 31, 2005 (also at 2.0:1, for the twelve months ended December 31, 2004). If this CFCC Ratio goes below 2.0:1, the Company is limited in the amount of additional debt it may incur beyond drawings under the Facility or other debt as permitted under the senior notes. Also the Company’s restricted payments basket under the senior notes was negative $69 million as at December 31, 2005 (negative $26 million as at December 31, 2004), as a result of accumulated losses in recent years.
| | 32 | |
Under the 8.625% senior notes, the Company cannot pay dividends unless the balance in this basket is positive.
Credit Ratings
Like many others in the industry, the Company’s credit ratings were downgraded during the fourth quarter.
In December 2005, Moody’s lowered its credit ratings on the Company’s corporate family rating and senior unsecured debt to B1 from Ba3, and the Company’s bank loan debt to Ba3 from Ba2, and confirmed its outlook on the Company’s debt ratings as negative. The downgrade was cited because in Moody’s view, current newsprint and related paper grade fundamentals are not likely to facilitate a significant, sustainable margin improvement.
In December 2005, Standard and Poor’s (S&P) lowered its long-term corporate credit and senior unsecured ratings to B+ from BB- and its senior secured rating to BB- from BB, and revised the outlook from negative to stable. The Company’s lower than expected profitability and cash flow generation due to the stronger Canadian dollar and higher energy costs were factors cited in the downgrade.
In October, Dominion Bond Rating Service (“DBRS”) confirmed its senior debt rating of BB and changed the outlook to negative. Growing signs that the Canadian dollar and energy costs will remain high were cited in the revision.
The following table highlights the Company’s credit ratings and outlook with Moody’s, S&P, and DBRS as of December 31, 2005, 2004, and 2003:
| | December 31, |
| | 2005 | 2004 | 2003 |
Moody’s
Outlook
Corporate family rating
Senior unsecured debt
Bank loan debt
Standard & Poor’s
Outlook
Long term corporate credit
Senior unsecured debt
Senior secured debt
Dominion Bond Rating Service
Outlook
Senior debt |
Negative
B1
B1
Ba3
Stable
B+
B+
BB-
Negative
BB |
Negative
Ba3
Ba3
Ba2
Negative
BB-
BB-
BB
Stable
BB |
Negative
Ba2
Ba2
Ba1
Negative
BB
BB
BB+
Stable
BBH |
|
|
|
|
|
|
|
|
|
|
|
|
|
|
|
|
| | 33 | |
| | | As a result of these downgrades, any future borrowings under the Facility will be at a slightly higher rate because the interest rate includes a margin that varies with the Company’s credit rating. Under current levels of borrowing, the credit rating downgrades are expected to increase the Company’s cost of borrowing under its Facility by an estimated $0.8 million per annum. These downgrades do not have any other direct impacts. However, they could negatively impact the Company’s cost of additional borrowing, and potentially its cost of capital. |
| | | |
| | 4.3.2 | Financial Instruments |
| | | |
| | | In the normal course of business, the Company is exposed to foreign currency and price risk associated with revenues and long-term debt, which are predominately in U.S. dollars, and energy costs. In accordance with its foreign exchange risk management program, the Company manages its exposure to these risks through the use of financial instruments. The Company also uses interest rate swaps to reduce its exposure to long-term fixed interest rates associated with its senior notes. The Company does not enter into financial instruments for speculative purposes. |
| | | |
| | | Revenue Risk Management Instruments |
| | | |
| | | In respect of revenues, the Company uses foreign currency options and forward contracts outstanding to sell U.S. dollars. At December 31, 2005, 67% of the options and contracts are designated as hedging instruments and the resulting foreign exchange translation gains and losses will be recognized concurrently with the hedged revenue in “Sales”. At period- end exchange rates, the net amount the Company would receive to settle the foreign currency options and forward contracts is $23.6 million, of which $13.1 million is included in “Prepaids and other”, and $7.7 million has been recognized and included in “Sales”. The hedging program improved the Company’s sales value by $32.3 million in 2005. |
| | | |
| | | At December 31, 2005 and 2004, no price hedging instruments were outstanding in respect of products sold. |
| | | |
| | | Long-term Debt Risk Management Instruments |
| | | |
| | | In respect of long-term debt, the Company has US$59.0 million in forward foreign exchange contracts to acquire U.S. dollars. These instruments are not designated as hedging instruments for accounting purposes, and are included in “Other long-term obligations” on the balance sheet at their fair value. Settlements and changes in fair value are recognized in earnings as “Foreign exchange gain on translation of long-term debt”. At period-end exchange rates, the net amount the Company would pay to settle these contracts is $24.3 million. |
| | 34 | |
Cost Risk Management Instruments
To hedge against the effect of energy cost fluctuations, the Company enters into contracts to fix the price of a portion of the Company’s oil and gas exposure. The contracts are not designated as hedging instruments for accounting purposes and are reported as “Prepaids and other” on the balance sheet at their fair value. Settlements and changes in fair value are recognized in “Cost of sales”. At period-end contract rates, the net amount the Company would receive to settle these contracts is $2.7 million, all of which is included in “Cost of sales” and “Prepaids and other”.
Interest Rate Swaps
The Company occasionally uses interest rate swap contracts to manage its net exposure to interest rate changes. At December 31, 2005, the Company has pay-floating, receive-fixed interest rate swap contracts for notional US$40 million, and has designated them as hedging instruments. At period-end rates, the net amount the Company would receive to settle these contracts is $0.4 million.
| 5.0 | RELATED PARTY TRANSACTIONS |
| | |
| The Company’s related parties include Norske Skog, a significant shareholder, together with its subsidiaries and affiliates, and Norske Skog North America LLC (“NSNALLC”), which was a joint venture between Norske Skog and the Company. |
| | |
| NSNALLC |
| | |
| The Company had an agency agreement with NSNALLC, which provided for sales of certain specialty products in the U.S. During the year the Company paid $4.4 million in commission expenses. These transactions were in accordance with normal third party trade practices. |
| | |
| In the second quarter of 2005, the shareholders of NSNALLC announced the dissolution of its U.S. marketing joint venture. The dissolution was effective October 1, 2005, after which the Company returned to marketing its specialty papers directly to North American customers. The change did not materially impact net earnings for the year ended December 31, 2005. |
| | |
| Norske Skog |
| | |
| In prior years, the Company acquired from wholly owned subsidiaries of Fletcher Challenge Limited (now subsidiaries of Norske Skog) companies with tax losses. The purchase price for these companies is subject to adjustment under certain conditions. The Company recorded a $2.4 million adjustment in the fourth quarter of 2005, reflecting a reduction to the purchase price. |
| | 35 | |
Subsidiaries and Affiliates of Norske Skog
The Company has entered into agency and distribution agreements with affiliates of Norske Skog whereby all sales of the Company’s newsprint and specialty papers in certain international markets are affected through affiliates of Norske Skog. During the year, product sales to these affiliates were $118.1 million (2004 - $121.7 million). These transactions were in accordance with normal third party trade practices.
Directors and Employees
The Company undertakes certain transactions with companies affiliated with a director of the Company. These transactions are in the normal course of business, and are on the same terms as those accorded to third parties. During 2005, the Company paid aggregate fees of approximately $nil (2004 - $0.4 million) primarily for legal services from a firm affiliated with a director of the Company. The Company has charged the costs to SG&A expense.
The Company has advanced interest-free loans to three officers of the Company. As at December 31, 2005, the balance outstanding was $0.4 million (2004 -$0.5 million). These loans were issued prior to the enactment of the United States Sarbanes-Oxley Act of 2002, which prohibits such loans effective July 30, 2002. The Company has made no loans to any of its directors or officers since that date.
| 6.0 | OFF-BALANCE SHEET ARRANGEMENTS |
| | | |
| 6.1 | Financial Instruments |
| | | |
| | The Company has ongoing programs with respect to financial instruments, for which the Company has elected to designate some as hedging instruments. The fair value of the following hedging instruments are not recorded in the financial statements: |
| | | • | Revenues – Foreign currency options and forward contracts to sell US$378 million to major financial institutions. |
|
| | | | |
| | | • | Interest Rates – Fixed to floating interest rate swaps with a major financial institution on notional US$40 million. The Company will receive a fixed rate of 7.375% and pay a floating rate averaging LIBOR plus 2.0%. |
|
|
|
Refer to financial instruments discussion within the “Liquidity and Capital Resources” section for further discussion of financial instruments.
| | 36 | |
| | 6.2 | Guarantees |
| | | |
| | | Business Dispositions |
| | | |
| | | The Company sold a portion of its operations in June 2001. In this regard, the Company provided a 10-year environmental indemnity with a maximum liability to the Company of $12.5 million. This liability has subsequently been reduced by expenditures related to certain decommissioning projects. The Company provided a tax indemnity, which continues while the relevant tax years of the indemnified parties remain open to audit. The Company also provided a general indemnity, capped at $5 million, which expired in 2004. The purchaser of the operations has advised the Company that, based on the terms of the purchase and sale agreement, it believes it may be entitled to indemnification under the general indemnity in connection with certain labour matters. The Company is unable to estimate any potential liability under these indemnities as the amounts are dependent upon the outcome of future contingent events, the nature and likelihood of which cannot be determined at this time. As such, no liability has been recorded for these potential obligations. |
| | | |
| | | Loans |
| | | |
| | | The Company has entered a building lease agreement whereby it has agreed to continue making the prescribed lease payments directly to the financial institution holding the mortgage on the building in the event the lessor is no longer able to meet its contractual obligations. At December 31, 2005, the value of the mortgage was approximately $13.0 million. This agreement does not increase the Company’s liability beyond the obligations for the building lease. |
| | | |
| | | Recycling Plant Acquisition |
| | | |
| | | In connection with the acquisition of the paper recycling business in December 2003, the Company has provided indemnities with respect to representations and warranties related to general corporate matters and to the shares that were issued to the vendors. Liability under these indemnities expires in November 2008, except that the indemnity related to title to the shares does not expire. The Company does not expect any significant claims with respect to these indemnities. The Company has also provided indemnities with respect to general environmental matters under its lease of the land and buildings. The Company has agreed to indemnify the landlord for all costs, claims and damages related to any release by the Company of any hazardous substances on the property or the breach by the Company of its environmental covenants under the lease or any environmental laws. This indemnity is indefinite and survives after the lease is terminated. The Company is not liable for pre-existing environmental conditions. |
| | 37 | |
| 7.0 | SUMMARY OF QUARTERLY RESULTS |
| | |
| The following table highlights selected financial information for the eight consecutive quarters ending December 31, 2005. For a more detailed analysis on Q4, 2005 results, see the Company’s Fourth Quarter Report. |
| (In millions of dollars) | 2004 | 2005 |
| | Q1 | Q2 | Q3 | Q4 | Q1 | Q2 | Q3 | Q4 |
| Sales | $ 454.5 | $ 479.6 | $ 466.8 | $ 477.3 | $ 462.7 | $ 439.0 | $ 450.3 | $ 471.9 |
| EBITDA1 | 7.4 | 43.8 | 56.3 | 45.3 | 33.6 | 25.4 | 47.9 | 48.3 |
| Net earnings (loss) | (46.3) | (24.0) | 28.0 | 13.7 | (21.8) | (30.0) | 34.2 | (8.0) |
| Net earnings (loss) per share | | | | | | | | |
| – basic and diluted | $ (0.22) | $ (0.11) | $ 0.13 | $ 0.06 | $ (0.10) | $ (0.14) | $ 0.16 | $ (0.04) |
| | 1. | EBITDA is a non-GAAP measure. Refer to the “Non-GAAP Measures” section for further details. |
| In Q1, 2005, the net loss increased by $35.5 million ($0.16 per common share) compared to Q4, 2004 largely due to an increase in the after-tax foreign exchange loss arising from the translation of U.S.-dollar-denominated debt of $28.3 million, the Crofton pulp annual maintenance shut down, and restructuring charges related to the curtailment of the Port Alberni No.3 paper machine. |
| | |
| In Q2, 2005, the $8.2 million ($0.04 per common share) increase in net loss compared to Q1, 2005 was primarily related to increased maintenance spending, which was partially offset by performance improvements and lower restructuring costs, and a $3.8 million increase in foreign exchange loss on the translation of U.S.-dollar-denominated debt. |
| | |
| In Q3, 2005, the $64.2 million ($0.30 per common share) improvement in net earnings compared to Q2, 2005 was largely due to an increase in the after-tax foreign exchange gain arising from the translation of U.S.-dollar-denominated debt of $38.3 million, a $14.2 million positive future tax adjustment, related to a decrease in the British Columbia provincial tax rate, which was effective July 1, 2005, and lower maintenance spending. |
| | |
| In Q4, 2005, the $42.2 million ($0.20 per common share) decrease in net earnings compared to Q3, 2005 was largely due to a decrease in the after-tax foreign exchange gain arising from the translation of U.S.-dollar-denominated debt of $34.1 million. |
| | |
| 8.0 | NON-GAAP MEASURES |
| | |
| The following measure, included in this report, does not have a standardized meaning under Canadian GAAP. |
| | |
| EBITDA (earnings before interest, income taxes, depreciation, and amortization), as defined, equates to operating earnings (loss) plus amortization. |
| | 38 | |
The Company focuses on EBITDA as the Company believes this measure enables comparison of the Company’s results between periods without regard to debt service, income taxes and capital expenditure requirements. As such, the Company believes it would be useful for investors and other users to be aware of this measure so they can better assess the Company’s operating performance. This measure should not be considered by an investor as an alternative to net income, an indicator of the financial performance of the Company or an alternative to cash flows as a measure of liquidity.
As there is no generally accepted method of calculating EBITDA, the measure as calculated by the Company might not be comparable to similarly-titled measures reported by other companies.
The following table reconciles the Company’s net earnings (loss) to EBITDA:
| (In millions of dollars) | 2005 | 2004 | 2003 |
Net earnings (loss)
Amortization
Foreign exchange gain on translation of long-term debt
Write-down of property, plant and equipment
Loss on repayment of long-term debt
Other (income) expense, net
Interest expense, net
Income tax recovery
Non-controlling interest | $ (25.6)
180.3
(24.7)
–
–
(4.5)
75.7
(46.6)
0.6 | $ (28.6)
184.1
(53.5)
–
5.2
(1.2)
74.9
(28.1)
– | $ (84.5)
189.9
(58.2)
14.2
–
3.9
75.0
(62.0)
– |
|
|
|
|
|
|
|
|
| EBITDA | $ 155.2 | $ 152.8 | $ 78.3 |
| 9.0 | CRITICAL ACCOUNTING POLICIES AND ESTIMATES |
| | |
| The preparation of financial statements in conformity with generally accepted accounting principles in Canada requires companies to establish accounting policies, and to make estimates that affect both the amount and timing of the recording of assets, liabilities, revenues and expenses. Some of these estimates require judgments about matters that are inherently uncertain. |
| | |
| Note 2 to the December 31, 2005 consolidated financial statements includes a summary of the significant accounting policies used in the preparation of those consolidated financial statements. While all of the significant accounting policies are important to the consolidated financial statements, some of these policies may be viewed as involving a high degree of judgement. On an ongoing basis, management reviews its estimates, including those related to environmental and legal liabilities, impairment of long-lived assets, pension and post-retirement benefits, provision for bad/doubtful accounts, and income taxes based upon currently available information. Actual results could differ from those estimates. |
| | 39 | |
The following accounting policies require management’s most difficult, subjective and complex judgements, and are subject to a fair degree of measurement uncertainty
| | 9.1 | Environmental and Legal Liabilities |
| | | |
| | | Environmental and legal liabilities are recorded on an undiscounted basis when it is considered probable that a liability has been incurred and the amount of the loss can be reasonably estimated. Liabilities for environmental matters require evaluations of applicable environmental regulations and estimates of remediation alternatives and the costs thereof. Provisions for liabilities relating to legal actions and claims require judgments regarding projected outcomes and the range of loss, based on such factors as historical experience and recommendations of legal counsel. |
| | | |
| | | As at December 31, 2005, the Company had a provision of $11.8 million for environmental, remedial and other obligations. In addition, the Company capitalized approximately $2.0 million, largely related to the improvement of air emissions and, to a lesser extent, other environmental compliance matters. In 2006, the Company expects capital expenditures relating to known environmental matters, including compliance issues and the assessment and remediation of the environmental condition of the Company’s properties, will total approximately $5 million in 2006. |
| | | |
| | 9.2 | Impairment of Long-Lived Assets |
| | | |
| | | The Company reviews long-lived assets, primarily plant and equipment, for impairment when events or changes in circumstances indicate that the carrying value of assets may not be recoverable. Canadian GAAP requires the Company to make certain judgments, assumptions and estimates in identifying such events and changes in circumstances, and in assessing their impact on the valuations and economic lives of the affected assets. A long-lived asset impairment is possible when an asset’s carrying value exceeds management’s estimate of its undiscounted future cash flows. Impaired assets are recorded at fair value, determined principally by using discounted future cash flows expected from their use and eventual disposition. Key assumptions in estimating the future cash flows and fair values include, for example, future product pricing over the commodity cycle, and future estimates of useful lives. |
| | | |
| | | During the fourth quarter of 2005, the Company tested the long-lived assets of both the pulp segment and the indefinitely idled Port Alberni No. 3 paper machine for recoverability. The pulp segment was reviewed due to operating losses, recent pulp prices, and foreign currency movement, while the Port Alberni No. 3 paper machine was reviewed due to its idled status. |
| | 40 | |
| | | To test the pulp assets, the Company used industry analysts’ estimates of future pulp prices and foreign exchange rate expectations, estimates of the remaining useful lives of the assets, estimates of the capital requirements as well as management’s judgment to calculate the undiscounted cash flows. Based on its test, management determined that the pulp assets’ expected undiscounted cash flows exceed the pulp assets’ carrying value. Accordingly, an impairment provision was not required. |
| | | |
| | | To test the indefinitely idled Port Alberni No. 3 paper machine (“A3”), the Company used industry analysts’ estimates of future pricing and foreign exchange rate expectations, estimates of the remaining useful lives of the assets, estimates of the capital requirements, estimates of probabilities for potential A3 operating scenarios as well as management’s judgment to calculate the weighted expected undiscounted cash flows. The estimate for potential A3 operating scenarios was based on management’s current estimate of profitability for various products that could be produced, and the feasibility of the Company being able to modify equipment, including cost considerations, as well as market acceptance for the products. Based on its test, management determined that A3’s weighted expected undiscounted cash flows exceed its carrying value. Accordingly, an impairment provision was not required. |
| | | |
| | | Long-lived assets represent approximately 79% of total assets, as at December 31, 2005. If the future were to adversely differ from management’s best estimate of key assumptions and associated cash flows, the Company could potentially experience future material impairment charges. |
| | | |
| | | Due to the numerous variables associated with judgments and assumptions relating to the valuation of assets in such situations, the precision and accuracy of estimates of related impairment charges are subject to significant uncertainties, and may change significantly as additional information becomes known. |
| | | |
| | 9.3 | Pension and Post-Retirement Benefits |
| | | |
| | | The Company maintains various employee future benefit plans, which include defined benefit pension and post-retirement benefit plans. The Company retains independent actuarial firms to perform actuarial valuations of the fair values of the Company’s defined benefit pension and post-retirement benefit plan assets and benefit obligations, and advise on the amounts to be recorded in the Company’s financial statements. This information is determined using certain assumptions, based on historical and market data that directly impact the fair value of the assets and obligations and charges disclosed in the Company’s financial statements. These assumptions include: |
| | 41 | |
| | | • | The discount rate which is used to estimate the actuarial present value of the various plan obligations. The Company, with the assistance of independent actuarial advisors, sets the discount rate assumption annually to reflect the rates available on high-quality debt instruments, with cash flows that are expected to match the timing and amount of expected benefit payments. The discount rate, as at December 31, 2005, was estimated to be 5.0%. |
|
|
|
|
|
|
| | | | |
| | | • | The long-term return on assets used to estimate the growth in the value of invested assets available to satisfy certain obligations. The Company, with the assistance of independent actuarial firms, annually sets the expected rate of return on plan assets to reflect the current view of long-term investment returns. In consultation with its independent actuarial advisors, as at December 31, 2005, a rate of return of 7.25% was determined by management. |
|
|
|
|
|
|
| | | | |
| | | • | Salary increases used to estimate the impact that future compensation increases will have on pension and other post-retirement obligations. In consultation with its independent actuarial advisors, as at December 31, 2005, the rate of compensation increase of 3.0% was determined by management. |
|
|
|
|
| | | | |
| | | • | Health care trend rates and mortality rates used to estimate the impact that future health care costs will have on pension and post- retirement obligations. In consultation with its independent actuarial advisors, as at December 31, 2005, the initial health care trend rate of 10.0% was determined by management. The initial health care trend rate is expected to decline by 1.0% annually, and the ultimate health care trend rate is estimated to be 5.0%. |
|
|
|
|
|
|
Actual experience can vary significantly from estimates, and could materially impact the estimated cost of employee benefit plans and future cash requirements.
The following table provides a sensitivity analysis of the key weighted average economic assumptions used in measuring the accrued pension benefit obligation, the accrued other employee future benefit and related net periodic benefit cost for 2005. The sensitivity analysis should be used with caution as it is hypothetical and changes in each key assumption may not be linear. The sensitivities in each key variable have been calculated independently of each other.
| | 42 | |
| | Pension Benefit Plans | Other Benefit Plans |
(In millions of dollars) | Accrued Benefit
Obligation | Net 2005
Expense | Accrued Benefit
Obligation | Net 2005
Expense |
|
Expected rate of return on assets
Impact of:
1% increase
1% decrease |
N/A
N/A |
(2.3)
2.3 |
N/A
N/A |
N/A
N/A |
|
|
|
|
Discount rate
Impact of:
1% increase
1% decrease |
(30.1)
32.7 |
(2.0)
3.7 |
(29.9)
39.7 |
(2.2)
2.7 |
|
|
|
|
Assumed overall health care cost
trend
Impact of:
1% increase
1% decrease |
N/A
N/A |
N/A
N/A |
39.7
(31.4) |
3.2
(2.4) |
|
|
|
|
|
| | 9.4 | Provision for Bad Debt and Doubtful Accounts |
| | | |
| | | The Company uses generally accepted practices in estimating required provisions for doubtful accounts and bad debt losses arising on trade and other receivable balances. The Company’s estimate of the required allowance is a matter of opinion and the actual loss eventually sustained may be more or less than that estimated. |
| | | |
| | | The Company regularly reviews the collectibility of its accounts receivable. The Company records its allowance for doubtful accounts based on its best estimate of any potentially uncollectible accounts by highlighting specific high risk accounts and then applying judgment to determine its estimate. Consideration is given to current economic conditions and specific customer circumstances to determine the amount of any bad debt expense to be recorded. While the Company has not experienced any significant bad debt expense in prior periods, declines in the economy could result in collectibility concerns. Accounts receivable balances for individual customers could potentially be material at any given time. |
| | | |
| | | As at December 31, 2005, “Accounts receivable” comprised approximately 9% of total assets. Included in this balance, the Company had a provision of approximately $7.0 million for doubtful accounts, or approximately 3.0% of accounts receivable. |
| | | |
| | 9.5 | Income Taxes |
| | | |
| | | The amounts recorded for future income tax assets and liabilities are based on various judgments, assumptions and estimates. Future tax assets and liabilities are measured using enacted or substantively enacted tax rates in which assets and liabilities are expected to be recovered or settled. For these years, a projection of taxable income and an assumption of the |
| | 43 | |
ultimate recovery or settlement period for temporary differences are required. The projection of future taxable income is based on management’s best estimate and may vary from actual to taxable income. The Company’s future tax assets are mainly composed of temporary differences in employee future benefits and loss carryforwards. Future tax liabilities are mainly composed of temporary differences pertaining to property, plant and equipment. Estimating the ultimate settlement period requires judgment and estimates. The reversal of timing differences is expected at future substantially enacted rates which could change due to changes in income tax laws or the introduction of tax changes. As a result, a change in the timing and the income tax rate at which the components will reverse could materially affect future tax expense as recorded in the consolidate statement of earnings. A one percentage point change in the Company’s reported effective income tax rate would have the effect of changing the income tax expense by approximately $8.9 million.
In addition, the Company records provisions for federal, provincial and foreign taxes based on the respective tax rules and regulations of the jurisdictions in which the Company operates and its judgment as to the allocation of income and the amount of deductions relating to those jurisdictions. Canadian, U.S. and international tax rules and regulations are subject to interpretation and the Company’s judgment may be challenged by taxation authorities. In such circumstances, the final resolution of these challenges can result in final settlements that differ from the Company’s estimated amounts.
| 10.0 | CHANGES IN ACCOUNTING POLICIES |
| | | |
| Effective fiscal 2005, the Company adopted the following new pronouncements issued by the Canadian Institute of Chartered Accountants (“CICA”): |
| | | |
| 10.1 | Accounting Guideline 15, “Consolidation of Variable Interest Entities” (“AcG-15”) |
| | | |
| | Effective January 1, 2005, the Company adopted CICA pronouncement AcG-15 on a prospective basis. AcG-15 prescribes the application of consolidation principles for entities that meet the definition of a “variable interest entity” (“VIE”). AcG-15 requires that an enterprise holding other than a voting interest in a VIE could, subject to certain conditions, be required to consolidate the VIE if it is considered its primary beneficiary whereby it would absorb the majority of the VIE’s expected losses, receive the majority of its expected residual returns, or both. |
| | | |
| | The adoption of AcG-15 resulted in the consolidation of 100% of Powell River Energy Inc. (“PREI”). PREI commenced operations February 2001, |
| | 44 | |
| | | and consists of an integrated hydroelectric power generating, transmission and distribution system which includes two hydroelectric generating stations, that provide power to the Company. The Company purchases 100% of the power generated by PREI. The Company’s 50.0% interest in PREI was previously accounted for using the proportionate consolidation method. The adoption of this new standard increased the Company’s EBITDA by $7.0 million for the year ended December 31, 2005, and had no impact on net earnings. In addition, long-term debt increased by approximately $57 million as a result of the consolidation of 100% of PREI. |
| | | |
| | 10.2 | Emerging Issues Committee Abstract Number 159, “Conditional Asset Retirement Obligations” (“EIC-159”) |
| | | |
| | | On December 6, 2005, the CICA’s Emerging Issues Committee issued EIC-159. EIC-159 is similar to the Financial Accounting Standards Board’s Interpretation No. 47, “Accounting for Conditional Asset Retirement Obligations” which was issued in March 2005 and highlighted in the Company’s interim reports. EIC-159 is effective for interim and annual reporting periods ending March 31, 2006. Effective, December 31, 2005, the Company early adopted EIC-159. |
| | | |
| | | EIC-159 clarifies that the term, “conditional asset retirement obligation”, as used in CICA Handbook Section 3110, “Asset Retirement Obligations,” refers to a legal obligation to perform an asset retirement activity in which the timing and (or) method of settlement are conditional on a future event that may or may not be within the control of the entity. EIC-159 also clarifies what constitutes sufficient information to reasonably estimate the fair value of a conditional asset retirement obligation, and that if sufficient information is not available to reasonably estimate a conditional asset retirement obligation at the time the liability is incurred that the obligation should be recognized initially in the period in which sufficient information becomes available to estimate its fair value. |
| | | |
| | | As a result of the adoption of EIC-159, the Company concluded that obligations for the proper removal and disposal of asbestos products in the Company’s mills meet the definition of a conditional asset retirement obligation. That is, the Company is subject to regulations that are in place to ensure that asbestos fibres do not become friable, or loose. The regulations require that friable asbestos be repaired, or removed in accordance with the regulations. |
| | | |
| | | The Company’s asbestos can generally be found on steam and condensate piping systems throughout its facilities, as well as in transite cladding on buildings and in building insulation. As a result of the longevity of the Company’s mills, due in part to the Company’s maintenance procedures, and the fact that the Company does not have plans for major changes |
| | 45 | |
that would require the removal of asbestos, the timing of the removal of asbestos in the Company’s mills is indeterminate as at December 31, 2005. As a result, the Company is currently unable to estimate the fair value of its asbestos removal and disposal obligation. Consequently, the adoption of EIC-159 did not have an impact on the consolidated financial statements for the year ended December 31, 2005.
| 11.0 | IMPACT OF ACCOUNTING PRONOUNCEMENTS AFFECTING FUTURE PERIODS |
| | | |
| | In April 2005, the CICA issued the following new accounting standards that impact the recognition, measurement and disclosure of financial instruments, hedges and comprehensive income. |
| | |
| | 1. | Section 1530, “Comprehensive Income” defines and establishes the reporting requirements for comprehensive income. |
| | | |
| | 2. | Section 3251, “Equity” replaces Section 3250, “Surplus”, and establishes standards for the presentation of changes in equity. |
| | | |
| | 3. | Section 3855, “Financial Instruments - Recognition and Measurement” establishes the requirements for the recognition and measurement of financial assets, financial liabilities and non-financial derivatives. |
| | | |
| | 4. | Section 3861, “Financial Instruments – Disclosure and Presentation” replaces Section 3860, “Financial Instruments – Disclosure and Presentation”, and establishes the requirements for presentation and disclosure of financial instruments and non-financial derivatives. |
| | | |
| | 5. | Section 3865, “Hedges” establishes the standards for when and how hedge accounting may be applied. |
| | | |
| | The new sections are all to be applied at the same time and are effective for interim and annual financial statements relating to fiscal years beginning on or after October 1, 2006. Early adoption is permitted, but only as of the beginning of a fiscal year ending on or after December 31, 2004. The Company is currently in the process of evaluating the impact of the new accounting standards on the Company’s financial position, results of operations, and cash flows. |
| | | |
| 12.0 | RISKS AND UNCERTAINTIES |
| | | |
| | The Company produces and markets pulp and paper products that are sold globally. The Company seeks to differentiate its product lines from those of other producers by supplying specialty products that add value for customers. However, like most companies in the forest products industry in North America, the Company faces business risks and uncertainties. These fall into the general |
| | 46 | |
business areas of markets, international commodity prices, foreign currency exchange rates, environmental issues, fibre supply, government regulation and policy, and for Canadian companies, trade barriers and Aboriginal land claims.
In order to address these risks and effectively manage them, the Company’s management has developed a process for risk management and its interrelationships with the Company’s strategic plan. Management provides regular updates to the Audit Committee, works with corporate and operational management to identify, measure and prioritize the critical risks facing the Company, and manages these risks by ensuring that they are adequately addressed through mitigating procedures where appropriate. The objectives of the risk management function include developing a common framework for understanding what constitutes principal business risks, ensuring that risk management activities are aligned with business strategies, and providing an effective mechanism for governance in the area of risk management.
A discussion of the principal uncertainties to which the Company is subject follows.
| | 12.1 | Product Prices |
| | | |
| | | The Company’s markets are commodity-based and cyclical in nature. Markets for the principal products are affected by fluctuations in supply and demand within each cycle, which in turn affects product prices. Demand has historically been determined by the level of economic growth and has been very closely tied to overall business activity and personal income. The Company’s earnings are sensitive to price changes for its principal products, with the effect of price changes on newsprint and specialty grades being the greatest. |
| | | |
| | | In addition, there is evidence to suggest the newsprint market is mature as declines in U.S. consumption have occurred in each of the last eleven quarters on a year-over-year basis. The Company believes it remains well positioned to mitigate the impact of this decline, through its ability to switch grades. |
| | | |
| | | See “Sensitivity Analysis” section for further details about the Company’s sensitivity to product price fluctuations. |
| | | |
| | 12.2 | Global Competition |
| | | |
| | | Pulp and paper markets are highly competitive global commodity markets in which producers compete primarily on the basis of price. A majority of the Company’s production is directed to markets outside Canada, where Canadian producers generally compete with American, European, and Asian producers. Many of the Company’s competitors are larger and have greater financial resources than the Company and some of the mills |
| | 47 | |
| | | operated by the Company’s competitors are lower cost producers than the mills the Company operates. To stay competitive the Company is focused on improving productivity and reducing costs. |
| | | |
| | 12.3 | International Sales |
| | | |
| | | A significant portion of the Company’s sales are outside Canada and the United States, and therefore the Company faces a number of risks including tariffs and other trade barriers, political and economic instability in foreign markets, and fluctuations in foreign currencies. |
| | | |
| | | Under the terms of agency and distribution agreements with affiliates of Norske Skog, a significant shareholder, either party on six months notice may terminate each of these contracts. If any of these contracts are terminated, the Company will be required to replace the sales agent or distributor within the six-month notice period in order to minimize disruption to sales activities in the relevant market. |
| | | |
| | 12.4 | Foreign Exchange |
| | | |
| | | The Company’s profitability is subject to fluctuations in foreign currencies, particularly the U.S. dollar, which is the currency in which most sales are denominated. Fluctuations in foreign currencies affect the Company’s competitive position in world markets. Apart from the value of the Canadian dollar relative to the U.S. dollar, the Company’s competitiveness in world markets is also affected by the relative strength of the currencies of other producing countries. The Company is also exposed to currency exchange risk on debt denominated in U.S. dollars, including its 7.375% and 8.625% senior notes. |
| | | |
| | | Under a Board-approved foreign exchange risk management program, the Company manages a portion of its currency exposure through the use of currency options and forward contracts to hedge anticipated future sales denominated in foreign currencies and U.S.-dollar-denominated debt. The Company’s hedging policy for revenues includes 33% to 67% of 12– month and 0% to 25% of 13 to 24-month U.S. dollar net exposure. The Company considers its U.S. dollar revenues to act largely as a hedge of its U.S.-dollar-denominated debt. The revenue hedge program mitigates the impact of any rapid movements in currency by 40% to 50% over the near term. |
| | | |
| | | See the “Sensitivity Analysis” section for further details about the Company’s sensitivity to foreign exchange fluctuations. |
| | | |
| | 12.5 | Fibre Supply |
| | | |
| | | Since the Company has no significant timber holdings, operations are dependent on the supply of wood fibre from third parties, over half of which is provided by five suppliers. |
| | 48 | |
| | | The Company’s fibre supply could be reduced as a result of events beyond its control, such as industrial disputes, natural disasters, material curtailments, or shutdown of operations by suppliers or the Company for market or other reasons. |
| | | |
| | | Long-term contracts with third parties are conducted at market prices or at prices determined under market-based formulas and represent approximately 70% of the Company’s pulp and paper mills’ fibre requirements. The solid wood segment of the B.C. coastal forest industry has undergone significant restructuring and downsizing. As a result, there is no assurance that the Company will continue to be able to access coastal fibre at the same levels achieved in the past. |
| | | |
| | | In addition, government regulations and aboriginal issues may also lower the supply of wood fibre. The Province of British Columbia owns approximately 95% of all timberlands and could introduce legislation to reduce wood fibre supply. Aboriginal groups have claimed aboriginal title over substantial portions of British Columbia, including areas where the forest tenures held by the Company’s suppliers are situated. Although the renewal of forest tenures held by the Company’s suppliers may be adversely impacted by claims of aboriginal title, the specific impact cannot be estimated at this time. |
| | | |
| | | The Company is also a large consumer of old newspapers and magazines. Ownership of Western Canada’s largest paper recycling facility enables the Company to secure 100% of its recycled fibre needs from the internal recovery network. While the supply remains reliable, the pricing is determined by the market and is subject to variability. |
| | | |
| | | See the “Sensitivity Analysis” section for further details about the Company’s sensitivity to fibre cost movements. |
| | | |
| | 12.6 | Aboriginal Claims |
| | | |
| | | The Company’s ability to operate its manufacturing facilities will also be affected by aboriginal groups’ claims of aboriginal title and rights. The governments of Canada and British Columbia have established a formal process to negotiate settlements with aboriginal groups throughout British Columbia in order to resolve these land claims. It is the policy of the governments that ownership of lands held in fee simple by third parties such as the Company will not be affected by treaty negotiations. In the case of the Powell River mill, the site has been included in areas to which an aboriginal group has asserted aboriginal title both through treaty negotiations with government and by commencing an action in the Supreme Court of British Columbia. While the Company and other industrial companies have been named as parties in the court proceeding along with the governments of Canada and British Columbia, counsel for |
| | 49 | |
| | | the aboriginal group has advised the Company that the plaintiffs are currently negotiating with two governments and have no intention of proceeding with the action at this time. Based on the history of similar proceedings, the Company expects that it would take many years before a final court decision could be rendered if pursued. |
| | | |
| | | Recent Supreme Court of Canada decisions have confirmed that the governments of Canada and British Columbia are obligated to consult with and, in certain circumstances, accommodate aboriginal groups whenever there is a reasonable prospect their decisions may affect aboriginal groups’ rights or title. This duty of consultation and accommodation may affect the Company’s ability to obtain or amend necessary regulatory permits on a timely basis. |
| | | |
| | 12.7 | Energy Costs |
| | | |
| | | The Company is a significant consumer of electrical power and fossil fuels. |
| | | |
| | | The Government of British Columbia regulates the Company’s electricity supply contracts and there have been few fluctuations in the terms of the contracts, as the November 2004 increase of approximately 5% was the only increase in the last 11 years. However, future changes in electricity prices could have a significant impact on the Company’s earnings. |
| | | |
| | | The provincial electricity regulator recently approved a redesigned rate structure for industrial customers that will result in the Company acquiring 90% of the electricity purchased from BC Hydro (the “Utility”) at a fixed rate that is lower than the current regulated rate, and 10% of the electricity at a rate that will approximate the price currently paid by the Utility for incremental electricity supplied by independent producers. The change in rate structure is expected to be implemented in 2006, and by design, is not expected to materially impact the Company's total cost of electricity. However, the rate structure has been designed to motivate industrial customers to reduce their electricity consumption. |
| | | |
| | | The majority of the Company’s fossil fuels, particularly oil and natural gas, are purchased on the spot market, which can fluctuate significantly depending on various external factors. |
| | | |
| | | A portion of the Company’s exposure to fluctuating fossil fuel prices is managed through the use of financial instruments and contracts, under a Board-approved energy program. The Company’s energy hedging policy is restricted to 20-70% of the net exposure for oil and gas. In addition, the Company reduces its exposure to fossil fuel prices through the use of lower priced alternatives. |
| | 50 | |
| | Freight charges comprise a significant portion of the Company’s cash costs, and are also dependent on oil and diesel fuel prices. |
| | | |
| | See the “Sensitivity Analysis” section for further details about the Company’s sensitivity to energy cost fluctuations. |
| | | |
| 12.8 | Legal Proceedings |
| | | |
| | In the ordinary course of business, the Company occasionally will become party to legal proceedings, generally related to contract disputes and employment law. As at December 31, 2005, the final results of ongoing legal proceedings, while not immediately determinable, are not expected to have a material effect on financial results. |
| | | |
| | The Company and certain of its affiliates have been named together with, a number of other paper producers, in United States class action lawsuits alleging an ongoing conspiracy to fix prices of magazine and other publication papers. These suits have been triggered by a European Commission investigation into possible anti-competitive practices by certain European paper producers. The Company believes there is no merit to the lawsuits but will nevertheless continue to incur related costs to defend itself. |
| | | |
| 12.9 | Prior Period Losses |
| | | |
| | The Company has recorded a net loss in 9 of the last 12 quarters. These losses have arisen primarily as a result of adverse market conditions. Should market conditions deteriorate to a greater extent, the Company may, over time, need to rely to a greater extent on its Facility and, if necessary, additional sources of funding. |
| | | |
| | In particular, the Company’s pulp operations, like those of other producers, have come under increasing pressure as a result of a relatively strong Canadian dollar and market conditions that do not compensate producers for rising energy costs. While under current market projections the Company expects to operate its pulp facilities, further deterioration in market conditions or unplanned capital expenditures may necessitate temporary or permanent curtailment. |
| | | |
| 12.10 | Debt |
| | | |
| | The Company has a significant amount of debt, and debt agreements contain various restrictive and financial covenants. The Company’s ability to pay interest on, and to satisfy, its debt obligations will depend upon the Company’s future operating performance and its ability to obtain additional debt or equity financing, when necessary. Prevailing economic conditions and financial, business, and other factors beyond the Company’s control may affect its ability to make these payments. |
| | 51 | |
| | | In addition, the Company’s debt level may limit its ability to obtain additional financing and increase its vulnerability to interest rate fluctuations. Should the challenging market conditions continue, the Company may, over time, have to rely to a greater extent on its Facility and, if necessary, additional sources of funding. |
| | | |
| | 12.11 | Environmental Regulation |
| | | |
| | | The Company’s operations are subject to a wide range of general and industry specific environmental laws and regulations related to waste management. The costs of compliance with such laws and regulations can be significant. The Company continually monitors its environmental performance, and believes that its facilities are operating in substantial compliance with environmental laws and regulations. |
| | | |
| | 12.12 | Labour Disruptions |
| | | |
| | | Many of the Company’s suppliers and service providers are unionized. Strikes or work stoppages by members of those unions could result in a significant disruption of operations or higher operating costs, which could have a material adverse effect on the business. |
| | | |
| | | The majority of the Company’s pulp and paper mill employees are members of the Communications, Energy & Paperworkers Union of Canada, or the Pulp, Paper and Woodworkers of Canada unions. Collective agreements with these unions expire in April 2008. The Company believes its labour relations are good and does not anticipate labour disruptions in its operations. |
| 13.0 | SENSITIVITY ANALYSIS |
| | |
| The Company’s earnings are sensitive to fluctuations in: |
| | |
| Product Price |
| | |
| The Company’s products are commodity-based and cyclical in nature. As a result, earnings are sensitive to price changes, with the effect of price changes on specialty grades and newsprint being the greatest. |
| | |
| Foreign Exchange |
| | |
| The Company’s products are primarily sold in Canada, the United States, Asia and Australasia, Latin America, and Europe. The majority of sales are denominated in foreign currencies, principally the U.S. dollar. As a result, the Company is exposed to foreign currency market risk on accounts receivable and future sales. |
| | |
| Energy Costs |
| | 52 | |
The Company’s earnings could be significantly impacted by changes in the prices and terms of energy supply contracts as the Company is a significant consumer of electrical power, fossil fuels, and inputs whose pricing are highly correlated to energy.
Fibre Costs
The Company’s supply of fibre is reliable although it is subject to market influences and has some degree of variability. Fibre includes supply of wood chips, logs and old newspapers (“ONP”).
The Company’s annual EBITDA, net earnings and earnings per share is estimated to be impacted by changes in product prices, foreign exchange, and input costs as follows:
(In millions of dollars, except per share amounts) |
EBITDA5 |
Net earnings1 | Earnings
per share |
|
| Product prices2 | | | |
| A US$10 per tonne change in the sales price of: | | | |
| Specialties | $ 13.3 | $ 8.7 | $ 0.04 |
| Newsprint | 9.8 | 6.4 | 0.03 |
| Pulp | 4.3 | 2.8 | 0.01 |
| Foreign exchange3 | | | |
| A US$0.01 change in the U.S. dollar relative value of the | | | |
| Canadian dollar | $ 15.8 | $ 9.8 | $ 0.05 |
| Energy cost sensitivity4 | | | |
| A 5% change in the price of: | | | |
| Natural gas and oil – direct purchases | $ 2.4 | $ 1.8 | $ 0.01 |
| Electricity – direct purchases | 8.8 | 6.5 | 0.03 |
| Fibre sensitivity4 | | | |
| A 5% change in the price of: | | | |
| Wood chips and sawdust | $ 13.5 | $ 10.0 | $ 0.05 |
| ONP | 1.3 | 1.0 | 0.01 |
| | 1. | Based on an expected tax rate of 35%. |
| | 2. | Based of full 2006 capacities. |
| | 3. | Based on a movement from US$0.81 to US$0.82, and excludes the Company’s hedging program and the impact of the Company’s translation of U.S.-dollar-denominated debt. |
| | 4. | Based on 2005 consumption levels. |
| | 5. | EBITDA is a non-GAAP measure. Refer to the “Non-GAAP Measures” section for further details. |
| 14.0 | OUTLOOK |
| | |
| | U.S. economic conditions are expected to remain stable at least through the first half of 2006. The effects of rising energy and fibre costs continue to present challenges for the industry, and the strength of the Canadian dollar remains a major concern. These challenges are expected to continue to result in upward pressure on paper pricing. In contrast to other regions, the favourable economic environment in British Columbia, particularly with respect to stable electricity prices, along with the Company’s limited reliance on fossil fuels in its |
|
|
|
|
|
|
| | 53 | |
| manufacturing processes, are expected to help create a competitive advantage for the Company. However, a continued strengthening of the Canadian dollar could offset the Company’s progress on earnings improvement initiatives. The Company estimates that approximately one quarter of its cash costs are based on U.S.-dollar-denominated inputs, and approximately 90% of its revenues are denominated in U.S. dollars. |
| | |
| In 2006, the Company expects to spend approximately $100 million on capital projects, including approximately $7 million related to PREI, much of which will be directed toward rapid return projects in support of the Company’s performance improvement program. With respect to its annual planned maintenance, the Company expects spending to be more evenly distributed throughout each quarter of the year. |
| | |
| 15.0 | DISCLOSURE CONTROLS AND INTERNAL CONTROL OVER FINANCIAL REPORTING |
| | |
| The Company’s Audit Committee, as part of its oversight role, has reviewed and recommended the approval of this MD&A to the Board of Directors. The Board of Directors have read and approved this MD&A. The Board of Directors and the Audit Committee have satisfied themselves that management has implemented the necessary disclosure controls through discussions with management. |
| | |
| Certification of Disclosure Controls |
| | |
| In 2004, the Canadian Securities Administrators’ (“CSA”) issued Multilateral Instrument 52-109, “Certification of Disclosure in Issuers’ Annual and Interim Filings.” Effective for fiscal years ending on or after March 31, 2005, CEOs and CFOs (“certifying officers”) are required to certify that they are responsible for establishing and maintaining disclosure controls, ensuring the disclosure controls are designed to provide reasonable assurance that material information is made known to them, they have evaluated the effectiveness of the issuer’s disclosure controls, and have disclosed their conclusions about their effectiveness at the end of the period covered by the annual filings. |
| | |
| The Company’s certifying officers have evaluated the effectiveness of the Company’s disclosure controls, as of the Company’s year ended December 31, 2005, and as a result of that evaluation have concluded that the Company’s disclosure controls are effective for the year ended December 31, 2005. While the Company’s certifying officers believe that the Company’s disclosure controls and procedures provide a reasonable level of assurance that they are effective, they do not expect that the disclosure controls and procedures or internal controls over financial reporting will prevent all errors and fraud. A control system, no matter how well designed and operated, can provide only a reasonable, not absolute, level of assurance that the control objectives are met. |
| | 54 | |
Internal Controls
In February 2005, the CSA issued proposed Multilateral Instrument 52-111, “Reporting on Internal Control Over Financial Reporting” (“MI 52-111”). MI 52-111 is very similar in its requirements to those found in Section 404 of the United States Sarbanes-Oxley Act, “Management Assessment of Internal Controls,” (“Section 404”). Both MI 52-111 and Section 404 require that companies maintain an effective system of internal controls, report on the effectiveness of those internal controls annually and have the independent auditor report on management’s assessment of internal controls over financial reporting.
It is expected that the Company will have to comply with MI 52-111 by the end of its fiscal year ended December 31, 2007.
During the first quarter of 2005, the United States Securities and Exchange Commission extended the Section 404 compliance dates for foreign private issuers. The Company is now expected to comply with Section 404 by the end of its fiscal year ended December 31, 2006.
In order to comply with Section 404, the Company has undertaken a project to update and formalize its internal controls, and to test and document the effectiveness of the internal controls upon which management is relying. To this end, the Company has engaged a third party advisor to assist in the project (the “Internal Control Project”).
The Internal Control Project has been ongoing and as of the end of the Company’s fiscal year ended December 31, 2005, the Company has completed the documentation of its internal controls, and has tested the majority of controls upon which management is relying. For the most part the Company is beginning to move away from a project approach towards sustainability of the internal control reporting process. However, remediation work is ongoing with respect to some of the Company’s systems, and the Company continues to refine its internal control documentation. Based on the work done to date, the Company expects that it will be able to comply with Section 404 and with MI 52-111 when it is finalized.
| 16.0 | OUTSTANDING SHARE DATA |
| | |
| | At January 25, 2006, the Company had 214,604,120 common shares issued and outstanding. |
|
| | |
| | Additional information about the Company including the 2005 Annual Information Form is available on the Company’s websitewww.catalystpaper.com, or the Canadian Securities Administrator’s electronic filing websitewww.sedar.com. |
|
|
|
| | 55 | |