CATALYST PAPER CORPORATION
FIRST QUARTER INTERIM REPORT
FOR THE THREE MONTHS ENDED MARCH 31, 2016
PRESIDENT'S MESSAGE
In spite of falling prices, we effectively reduced costs, improved product mix and accelerated new product development to position Catalyst for the future.
Financial Results
Adjusted earnings before tax, depreciation and amortization (EBITDA) was $17.1 million and adjusted EBITDA before specific items was $17.7 million in the first quarter, compared to adjusted EBITDA of $15.1 million and adjusted EBITDA before specific items of $19.8 million in the fourth quarter of 2015.
In the first quarter, the company reported $16.9 million in net earnings and a net loss before specific items of $5.1 million, compared to a net loss of $26.3 million and a net loss of $10.0 million before specific items in the fourth quarter of 2015.
First quarter earnings benefited from a $22.6 million foreign exchange gain on the translation of U.S. dollar denominated debt. Catalyst's free cash flow was negative $1.7 million, an improvement from negative $11.4 million in the previous quarter. We ended the first quarter with liquidity of $84.0 million.
Operational Performance
Operating results benefited from cost savings driven primarily by Revitalization Programs even though we were challenged by maintenance-related issues in the quarter. Our Revitalization Programs were successfully implemented at three of our mill locations in 2015. The program has now been extended to our two remaining mills and our corporate group to ensure this program is as an enterprise-wide initiative.
Production on Rumford's No. 12 Paper Machine resumed in the quarter after being indefinitely curtailed on September 1, 2015. This decision reflects proactive action by management to more fully leverage integrated capabilities at Rumford. The machine will be dedicated to the production of coated paper and Rumford Offset, a newly developed uncoated free sheet product.
Our progress in safety in the first quarter was overshadowed by the employee fatality that occurred at the Crofton mill in January. We remain diligently focused on improving our performance, and strengthening our safety culture and behaviours.
Market Conditions
Market demand for traditional printing and writing papers continues to decline. Reduced paper use, driven by the proliferation of digital options and resulting oversupply, has led to lower prices and demand across almost all grades, with coated groundwood and directory grades experiencing the severest declines.
Despite challenging market conditions, we are successfully generating strong sales volume in the company's targeted market niches. In the first quarter, sales volume of coated freesheet products increased by 20 per cent, compared to the same quarter in the previous year.
Our efforts in entering higher-value markets has been driven by improved brand recognition, consistent product quality, an unmatched environmental pedigree and superior customer service.
Increase to Asset Based Credit Facility
On May 9, 2016, we amended our revolving asset based loan facility (ABL Facility). The amendment included an increase of the maximum revolving credit commitments by $25.0 million to $250.0 million. The ABL Facility lenders are CIBC as Administrative Agent, Wells Fargo Capital Finance Corporation of Canada, Export Development Canada and Bank of Montreal.
Sustainability Reporting
In the first quarter, we published our 2015 Sustainability Report, which highlights the choices we make every day to demonstrate our leadership and commitment to environmental stewardship and sustainability. Throughout the publication, we share the progress we have made in key areas, such as reducing greenhouse gas emissions and increasing our use of renewable energy. We believe our Report, which is produced according to the Global Reporting Index, is one of the industry's most transparent and detailed, and we encourage our stakeholders to review the material to assess our progress.
Outlook
In the second quarter, we expect continued demand and pricing pressure in all grades with the exception of newsprint and NBSK pulp that are benefiting from recent price increases. Energy costs in our British Columbia mills will increase as a result of a four per cent hydroelectricity rate increase in British Columbia, effective April 1, 2016. We will continue to be innovative in ways to mitigate this increase. We also face the continued imposition of countervailing duties on the export to the United States of supercalendered paper and are working through the U.S. Department of Commerce's expedited review process.
We believe the Revitalization Programs' focus on cost reduction, combined with our efforts to optimize product mix and increase new specialty paper sales, will serve to lessen the effects of these external pressures.
Planned second quarter maintenance outages at Crofton and Powell River, combined with the impact of the main waterline breach at the Crofton mill in mid-April, will negatively impact maintenance and production costs in the second quarter.
We will continue to focus on driving down costs and growing the top line as the foundation for future transformation.
Joe Nemeth
President & Chief Executive Officer
| MANAGEMENT'S DISCUSSION AND ANALYSIS | 4 |
| 1. | OVERVIEW AND HIGHLIGHTS | 6 |
| 2. | SEGMENTED RESULTS | 13 |
| 3. | LIQUIDITY AND CAPITAL RESOURCES | 21 |
| 4. | CONTINGENCIES | 23 |
| 5. | SUMMARY OF QUARTERLY RESULTS | 24 |
| 6. | NON-GAAP MEASURES | 24 |
| 7. | CRITICAL ACCOUNTING POLICIES AND ESTIMATES | 26 |
| 8. | CHANGES IN ACCOUNTING POLICIES | 27 |
| 9. | IMPACT OF ACCOUNTING PRONOUNCEMENTS AFFECTING FUTURE PERIODS | 27 |
| 10. | RISKS AND UNCERTAINTIES | 28 |
| 11. | SENSITIVITY ANALYSIS | 28 |
| 12. | OUTLOOK | 29 |
| 13. | DISCLOSURE CONTROLS AND INTERNAL CONTROL OVER FINANCIAL REPORTING | 30 |
| CONSOLIDATED FINANCIAL STATEMENTS | 31 |
MANAGEMENT'S DISCUSSION AND ANALYSIS
The following management's discussion and analysis (MD&A) of Catalyst Paper Corporation (the company, we, us, and our) should be read in conjunction with our interim consolidated financial statements for the three month periods ended March 31, 2016 and March 31, 2015 and our audited annual consolidated financial statements for the year ended December 31, 2015 and the notes thereto, which have been prepared in accordance with generally accepted accounting principles (GAAP) in the United States (U.S.). Additional information about the company, including our most recent Annual Information Form is available on our website at www.catalystpaper.com, or the Canadian Securities Administrator's electronic filing website at www.sedar.com.
Throughout this discussion, references are made to certain measures that are not measures of performance under U.S. GAAP, including operating earnings, adjusted EBITDA, adjusted EBITDA before specific items, average delivered cash costs per tonne before specific items, net earnings (loss) before specific items, net earnings (loss) per share before specific items, free cash flow and cash flows provided (used) by operations before changes in non-cash working capital. We believe that these non-GAAP measures are useful in evaluating our performance. These non-GAAP measures are defined and reconciled to their nearest GAAP measure in section 6, Non-GAAP measures.
In this MD&A, unless otherwise indicated, all dollar amounts are expressed in Canadian dollars. The term "dollars" and the symbols "$" and "CDN$" refer to Canadian dollars and the term "U.S. dollars" and the symbol "US$" refer to United States dollars.
In this MD&A, the term "tonne" and the symbol "MT" refer to a metric tonne and the term "ton" or the symbol "ST" refer to a short ton, a measure of weight equal to 0.9072 metric tonne. Use of these symbols is in accordance with industry practice.
The information in this report is as of May 9, 2016 which is the date of filing in conjunction with our press release announcing our results for the first quarter of 2016. Disclosure contained in this document is current to May 9, 2016 unless otherwise stated.
CAUTIONARY STATEMENT REGARDING FORWARD-LOOKING STATEMENTS
Certain statements and information in this MD&A are not based on historical facts and constitute forward-looking statements or forward-looking information within the meaning of Canadian securities laws and the U.S. Private Securities Litigation Reform Act of 1995 (forward-looking statements), including but not limited to, statements about our strategy, plans, future operating performance, contingent liabilities and outlook.
Forward-looking statements:
| · | Are statements that address or discuss activities, events or developments that we expect or anticipate may occur in the future; |
| · | Can be identified by the use of words such as "believe", "expect", "anticipate", "intend", "plan", "likely", "predicts", "estimates", "forecasts", and similar words or phrases or the negative of such words or phrases; |
| · | Reflect our current beliefs, intentions or expectations based on certain assumptions and estimates, including those identified below, which could prove to be significantly incorrect: |
| – | Our ability to develop, manufacture and sell new products and services that meet the needs of our customers and gain commercial acceptance; |
| – | Our ability to continue to sell our products and services in the expected quantities at the expected prices and expected times; |
| – | Our ability to successfully obtain cost savings from our cost reduction initiatives; |
| – | Our ability to implement business strategies and pursue opportunities; |
| – | Expected cost of goods sold; |
| – | Expected component supply costs and constraints; |
| – | Expected foreign exchange and tax rates. |
| · | While considered reasonable by management, are inherently subject to known and unknown risks and uncertainties and other factors that could cause actual results or events to differ from historical or anticipated results or events. These risk factors and others are discussed in the MD&A. Certain of these risks are: |
| – | The impact of general economic conditions in the countries in which we do business; |
| – | Conditions in the capital markets and our ability to obtain financing and refinance existing debt; |
| – | Market conditions and demand for our products (including declines in advertising and circulation); |
| – | The implementation of trade restrictions in jurisdictions where our products are marketed; |
| – | Fluctuations in foreign exchange or interest rates; |
| – | Raw material prices (including wood fibre, chemicals and energy); |
| – | The effect of, or change in, environmental and other governmental regulations; |
| – | Uncertainty relating to labour relations; |
| – | The availability of qualified personnel; |
| – | The effects of competition from domestic and foreign producers; |
| – | The risk of natural disaster and other factors many of which are beyond our control. |
As a result, no assurance can be given that any of the events or results anticipated by such forward-looking statements will occur or, if they do occur, what benefit they will have on our operations or financial condition. Readers are cautioned not to place undue reliance on these forward-looking statements. We disclaim any intention or obligation to update or revise any forward-looking statements, whether as a result of new information, future events or otherwise, except as required by law.
| 1. | OVERVIEW AND HIGHLIGHTS |
BUSINESS OVERVIEW
We are the largest producer of mechanical printing papers in western North America and the largest producer of coated groundwood paper in North America. Our business is comprised of four business segments: coated paper, uncoated paper, newsprint, and pulp. Coated paper includes coated freesheet (CFS), coated groundwood (CGW), and coated one-sided specialty (C1S) paper. Uncoated paper includes uncoated mechanical (UM), directory paper and uncoated free sheet (UFS). We are the only producer of CGW paper and soft calender (SC) paper in western North America. We operate three paper mills in British Columbia (B.C.) in Crofton, Port Alberni, and Powell River and two paper mills in the U.S. in Rumford, Maine and Biron, Wisconsin.
Our Crofton and Rumford mills each include two-line kraft pulp operations. Our Crofton mill produces kraft pulp primarily to market and sell into the Asian market, while our Rumford mill produces kraft pulp primarily as furnish used to manufacture the mill's coated paper products.
More information about our business segments, product profile and our geographic sales distribution is provided on pages 7 to 9 of our 2015 Annual Report. Our production capacity by mill and product line is summarized in the following chart:
2016 Capacity by Mill Location and Product Line1 | |
| | | | | | Coated Paper 1 | | | Uncoated Paper 1 | | | Newsprint 1 | | | Market Pulp | | | Total | |
Mill Location | | Number Of Paper Machines | | | CFS | | | CGW | | | | C1S | | | UM | | | UFS | | | Directory | | | Newsprint | | | Market Pulp | | | | |
Crofton, B.C. 4 | | | 2 | | | | – | | | | – | | | | – | | | | – | | | | – | | | | – | | | | 350,000 | | | | 377,000 | 2 | | | 727,000 | |
Port Alberni, B.C. | | | 2 | | | | – | | | | 224,000 | | | | – | | | | – | | | | – | | | | 116,000 | | | | – | | | | – | | | | 340,000 | |
Powell River, B.C. 5 | | | 2 | | | | – | | | | – | | | | – | | | | 350,000 | | | | – | | | | – | | | | – | | | | – | | | | 350,000 | |
Rumford, ME 6 | | | 3 | | | | 237,000 | | | | 154,000 | | | | 47,000 | | | | – | | | | 24,000 | | | | – | | | | | | | | 105,000 | 3 | | | 567,000 | |
Biron, WI | | | 2 | | | | – | | | | 335,000 | | | | – | | | | – | | | | – | | | | – | | | | – | | | | – | | | | 335,000 | |
Total capacity (tonnes) | | | 11 | | | | 237,000 | | | | 713,000 | | | | 47,000 | | | | 350,000 | | | | 24,000 | | | | 116,000 | | | | 350,000 | | | | 482,000 | | | | 2,319,000 | |
% of total capacity | | | | | | | 10 | % | | | 31 | % | | | 2 | % | | | 15 | % | | | 1 | % | | | 5 | % | | | 15 | % | | | 21 | % | | | 100 | % |
| 1 | Capacities expressed in the above tables can vary as we are able to switch production between products, particularly CGW, CFS, C1S and machine-finished uncoated grades. |
| 2 | Total pulp capacity at Crofton is 407,000 tonnes, of which 377,000 tonnes are designated as market pulp with the remaining 30,000 tonnes being consumed internally. |
| 3 | Total pulp capacity at Rumford is 485,000 tonnes, of which 105,000 tonnes are designated as market pulp with the remaining 380,000 tonnes being consumed internally. |
| 4 | No. 1 paper machine at Crofton remains indefinitely curtailed since 2010. |
| 5 | No. 9 paper machine at Powell River remains indefinitely curtailed since 2014. |
| 6 | No. 12 paper machine at Rumford resumed production in the quarter on an intermittent basis after being indefinitely curtailed on September 1, 2015. |
FIRST QUARTER OVERVIEW
Business Overview
Our operating results benefited from strong sales volumes, favourable sales mix, cost savings realized under our revitalization initiatives and a weaker average Canadian dollar in the quarter. This was offset by lower pulp and paper prices and reduced productivity in the quarter.
While our focus on product mix optimization through increased market share of higher margin products and reduced basis weight of our paper grades contributed positively to revenues, this was overshadowed in the quarter by declining market prices for paper and pulp and the continued impact of countervailing duties on our U.S. exports of SC paper. Productivity was negatively impacted by a number of unforeseen maintenance events and reliability issues that negatively impacted our paper machines and pulp operations.
Financial Performance
We recorded net earnings of $16.9 million and a net loss before specific items of $5.1 million in Q1. This compared to a net loss of $26.3 million and a net loss before specific items of $10.0 million, respectively, in Q4. Significant specific items in Q1 included professional fees and duties related to the countervailing action, insurance proceeds related to the Crofton oxygen plant outage and a foreign exchange gain on the translation of U.S. dollar denominated debt. Significant specific items in the prior quarter included professional fees and duties related to the countervailing action, restructuring costs, and a foreign exchange loss on the translation of U.S. dollar denominated debt.
CATALYST PAPER 2016 FIRST QUARTER REPORT │ MANAGEMENT'S DISCUSSION AND ANALYSIS
Adjusted EBITDA was $17.1 million and adjusted EBITDA before specific items was $17.7 million in Q1 compared to adjusted EBITDA of $15.1 million and adjusted EBITDA before specific items of $19.8 million in Q4. Refer to section 6, Non-GAAP measures, for additional information on specific items in the reported financial results.
SELECTED FINANCIAL INFORMATION
| | | 2016 | | | 2015 | |
(In millions of Canadian dollars, except
where otherwise stated) | | | Q1 | | | Total | | | | Q4 | | | | Q3 | | | | Q2 | | | | Q1 | |
Sales | | $ | 510.4 | | | $ | 1,991.1 | | | $ | 510.8 | | | $ | 542.6 | | | $ | 458.4 | | | $ | 479.3 | |
Operating earnings (loss) | | | 2.7 | | | | (12.7 | ) | | | (2.2 | ) | | | 23.8 | | | | (34.0 | ) | | | (0.3 | ) |
Depreciation and amortization | | | 14.4 | | | | 61.4 | | | | 17.3 | | | | 15.0 | | | | 14.8 | | | | 14.3 | |
Adjusted EBITDA 1 | | | 17.1 | | | | 48.7 | | | | 15.1 | | | | 38.8 | | | | (19.2 | ) | | | 14.0 | |
– before specific items 1 | | | 17.7 | | | | 86.7 | | | | 19.8 | | | | 41.2 | | | | 9.7 | | | | 16.0 | |
| Net earnings (loss) | | | 16.9 | | | | (49.4 | ) | | | (26.3 | ) | | | (12.9 | ) | | | (32.4 | ) | | | 22.2 | |
– before specific items 1 | | | (5.1 | ) | | | (28.0 | ) | | | (10.0 | ) | | | 8.4 | | | | (13.8 | ) | | | (12.6 | ) |
Adjusted EBITDA margin 1 | | | 3.3 | % | | | 2.4 | % | | | 3.0 | % | | | 7.2 | % | | | (4.2 | %) | | | 2.9 | % |
– before specific items 1 | | | 3.5 | % | | | 4.4 | % | | | 3.9 | % | | | 7.6 | % | | | 2.1 | % | | | 3.3 | % |
| Net earnings (loss) per share (in dollars) | | | | | | | | | | | | | | | | | | | | | | | | |
– basic and diluted | | $ | 1.17 | | | $ | (3.41 | ) | | $ | (1.82 | ) | | $ | (0.89 | ) | | $ | (2.23 | ) | | $ | 1.53 | |
– before specific items 1 | | | (0.35 | ) | | | (1.93 | ) | | | (0.69 | ) | | | 0.58 | | | | (0.95 | ) | | | (0.87 | ) |
| (In thousands of tonnes) | | | | | | | | | | | | | | | | | | | | | | | | |
| Sales | | | 542.8 | | | | 2,134.3 | | | | 541.9 | | | | 570.8 | | | | 511.1 | | | | 510.5 | |
| Production | | | 533.7 | | | | 2,136.8 | | | | 545.6 | | | | 558.2 | | | | 494.8 | | | | 538.2 | |
| 1 | Refer to section 6, Non-GAAP measures. |
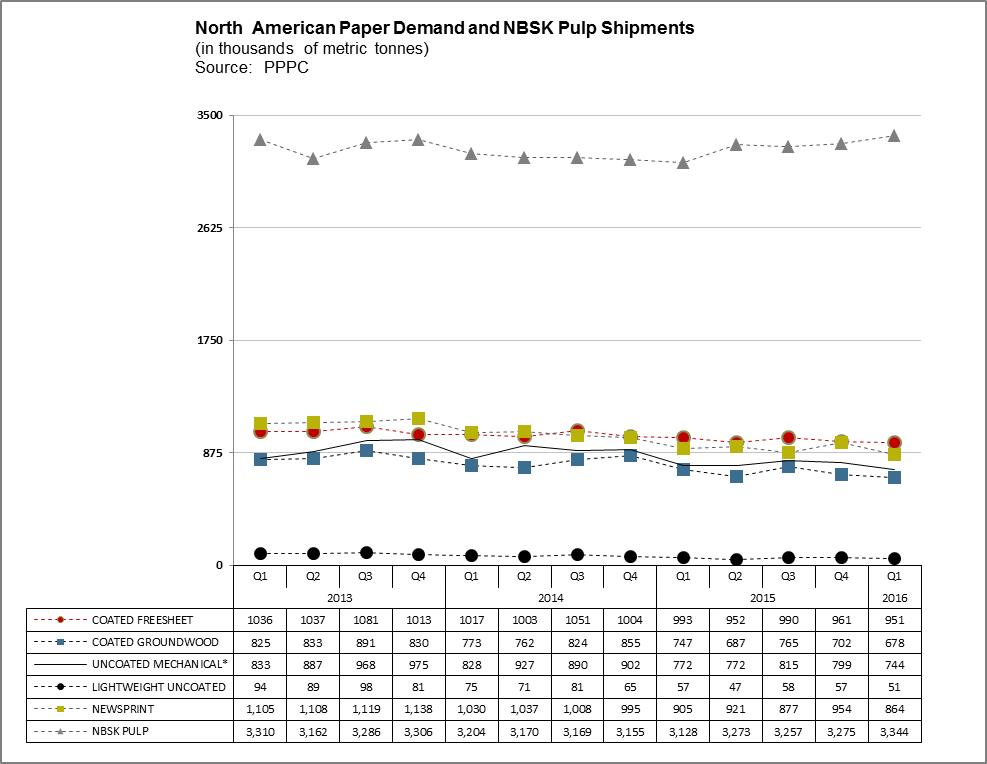
Market Overview
* Uncoated mechanical is comprised of high-gloss and standard grades.
Overall, market conditions remained challenging in the first quarter of 2016. North American demand for our paper grades decreased from the first quarter of 2015 and inventory levels rose from Q4 levels. The decline in demand was most severe for CGW at 9.2% and directory at 10.5%. Benchmark prices declined for coated and uncoated paper compared to Q4 2015, with North American operating rates being negatively impacted by increased imports, declining demand and extremely competitive market dynamics. Newsprint prices increased due to the implementation of previously announced price increases in the quarter.
NBSK pulp shipments increased 6.9% compared to the first quarter of 2015. Pulp benchmark prices for China decreased slightly in the first quarter of 2016.
Increase to Asset Based Credit Facility
On May 9, 2016, we amended our revolving asset based loan facility (ABL Facility). The amendment included an increase of the maximum revolving credit commitments by $25.0 million to $250.0 million. The ABL Facility lenders are CIBC as Administrative Agent, Wells Fargo Capital Finance Corporation of Canada, Export Development Canada and Bank of Montreal.
Production on Rumford's No. 12 Paper Machine Resumes
Production on Rumford's No. 12 Paper Machine resumed in the quarter after being indefinitely curtailed on September 1, 2015. The machine will be dedicated to the production of coated paper and Rumford Offset, a newly developed UFS product.
Operating Issues at Crofton Mill
On April 12, 2016, the Crofton mill was impacted by a breach of the mill's main water supply line. The breach caused a mill wide water outage and resulting in production losses of approximately 5,500 tonnes of pulp and 5,200 tonnes of paper. We incurred incremental costs and lost contribution of approximately $3.5 million due to the outage.
We recorded $2.7 million in insurance proceeds in the quarter related to the oxygen plant outage that occurred at the Crofton mill in the second quarter of 2015.
Imposition of Countervailing Duties
On July 28, 2015, the U.S. Department of Commerce (DOC) issued its Preliminary Determination to impose countervailing duties on Canadian imports of SC Paper from Catalyst Paper and three other Canadian SC paper producers. Catalyst was assigned an "all-others" countervailing duty rate of 11.19%, the simple average of the preliminary rates assigned to Port Hawkesbury Paper and Resolute Forest Products.
On October 13, 2015, the DOC issued its final determination to impose countervailing duties on Canadian imports of SC Paper, assigning a final "all-others" rate of 18.85% based on a weighted average of the final rates assigned to Port Hawkesbury Paper and Resolute Forest Products, the two companies for whom individual investigations were conducted. Based on our current sales mix, the duty has been imposed on approximately 4% of our total sales.
On November 18, 2015, the U.S. International Trade Commission (ITC) reached an affirmative determination on the countervailing duties, and on December 10, 2015, the DOC issued its final countervailing duty order. On December 15, 2015, the company filed a request for the DOC to initiate an expedited review pursuant to which the DOC would examine the countervailing duty order on SC Paper specifically with respect to Catalyst. On February 8, 2016, the DOC published its notice initiating the requested expedited review on the initial subsidy allegations. On March 18, 2016, Catalyst filed its initial questionnaire response with the DOC in respect of the initial subsidy allegations as part of the expedited review. On April 18, 2016, the DOC issued a determination to initiate a review on certain additional subsidy allegations submitted by the original petitioners of the initial subsidy allegations. It is not yet determined whether the DOC will permit other additional allegations to become part of the expedited review at this stage of the process.
The financial impact of the countervailing duties and related professional fees on adjusted EBITDA from Q2 2015 to March 31, 2016 was $11.0 million, of which $3.3 million was incurred in Q1 2016 (see section 6, Non-GAAP Measures).
Fatality at Crofton Mill
On January 27, 2016, a mill employee was fatally injured at the Crofton mill as a result of an industrial vehicle roll-over. The mill activated its Emergency Response Plan, and the RCMP and WorkSafeBC were promptly contacted to launch an investigation of the incident. WorkSafeBC is leading the investigation into the circumstances surrounding the incident to determine cause. The RCMP and Coroner's Office are also investigating and the company is fully supporting the investigations.
STRATEGY UPDATE
Our objective is to return to profitability and maximize cash flows by focusing on reducing manufacturing costs and optimizing our brands and customer base. Additional information related to our corporate strategy, including key performance drivers and indicators, can be found on pages 14 to 21 of our 2015 Annual Report.
2016 Key Objectives
The following is an update on our first quarter progress towards our 2016 key objectives:
Social:
| · | Safety: reduce medical incident rate by a minimum of 20% compared to the prior year |
| – | LTI frequency was 0.75 in the quarter, an improvement of 40% compared to the prior year average of 1.24. |
| – | MIR of 2.56 in the quarter was flat compared to the prior year average of 2.52. |
| · | Improve employee performance through adoption of incentive pay plans for both hourly and salaried employees that are aligned to company objectives |
| – | Incentive payment of $426 per employee paid to over 1,900 hourly employees in accordance with our OFI program for the significant productivity and service improvements in 2015. |
| · | Implement a new performance management system for salaried employees |
| ̶ | New performance management system fully implemented for all salaried employees. |
| · | Design and implement a new operator technical training program to support learning and higher productivity |
| ̶ | Project launched to overhaul operator technical training. |
| · | Utilize change management techniques and enhanced internal communications to increase employee awareness, alignment and move further forward to a culture of ownership and accountability |
| ̶ | Communications audit in progress to assess effectiveness of internal communications tools, channels, processes and messages. Outputs will inform internal communications strategy to support employee alignment to business priorities and a strong focus on driving performance and results. |
Financial:
| · | Deliver positive free cash flow results by increasing operating earnings, reducing overhead costs, and further optimizing our capital structure |
| – | Adjusted EBITDA was $17.1 million, free cash flow was negative $1.7 million, and liquidity decreased by $9.8 million in the quarter to $84.0 million as of March 31, 2016. |
| – | Liquidity was negatively impacted in the quarter by the generation of negative free cash and by a net increase in non-cash working capital of $5.1 million. |
| – | Capital expenditures in the current quarter of $5.1 million were primarily invested in profit adding investments and maintenance of business. |
| – | We increased our maximum borrowing base under our ABL Facility by $25.0 million to $250.0 million. |
| · | Increase the value of benefits realized under the company's OFI program from the prior year |
| – | Savings realized in the quarter under our OFI program were offset by the cost and productivity impact of a number of unforeseen maintenance events. |
| – | We have sharpened our focus on addressing these maintenance issues and improving the efficiency and reliability of our paper machines. |
| · | Improve cost competitiveness and productivity through revitalization of our five mills |
| – | We are tracking ahead of schedule realizing identified savings under our revitalization program at our U.S. paper mills. |
| – | We launched revitalization at the Crofton and Port Alberni mills in the quarter. |
| – | We further extended revitalization to corporate functions, thereby making the revitalization program an enterprise performance improvement initiative. |
| · | Develop and execute a debt refinancing plan |
| – | Our Term Loan and ABL Facility are due in July 2017, and our Senior secured notes are due in October 2017, unless previously refinanced. Given that substantially all of our long-term debt matures in 2017, we are evaluating options to address such upcoming maturities. |
Commercial:
| · | Optimize our product mix by increasing our market share of higher-margin coated freesheet and coated one-sided specialty paper, and reducing the basis weight of our other paper grades |
| – | We achieved strong sales volumes for our CFS and CGW papers. In spite of significant industry market declines in the quarter, our CFS sales were 19.6% higher than Q1 2015 and exceeded our Q1 growth targets. |
| – | Sales growth of C1S paper is tracking ahead of target at a sales run rate exceeding 4,000 tonnes per month. |
| – | We continue to benefit from optimizing our CGW product offering through basis weight reduction at the Biron mill and grade mix optimization at the Port Alberni mill. |
| – | We achieved supply chain savings of $1.5 million in the quarter by improving carrier mix, lowering negotiated freight rates and realizing savings at our warehouses. |
| – | We initiated work in the quarter to streamline our order management processes and present one face to our customers through systems training and optimizing the location of customer accounts. |
| – | We've initiated a global supply chain integration project to align the vision, goals and organization of the U.S. and Canadian supply chain teams. |
| · | Expand our product offering through new product development by commercializing and growing market share in a variety of specialty paper products |
| – | We successfully developed and launched our new UFS product in the quarter called Rumford Offset. |
| – | We increased our market share of label and liner, our highest-margin C1S product offering, with sales exceeding our Q1 growth target. |
Environmental / Corporate Social Responsibility:
| · | Work with community stakeholders to identify and implement strategic initiatives that mutually benefit our mills and the communities they operate in |
| – | Filed and awaiting approval of protective measures for the Cowichan River. |
| – | Projects underway at most mills which will improve their emissions profile. |
| · | Develop and implement a Corporate Social Responsibility (CSR) strategy |
| – | Strategy is now completed and approved. Implementation will be completed by the third quarter. |
| · | Strengthen Catalyst's standing with mill communities and with First Nations |
| – | We are developing programs at the community level including a First Nations outreach approach. |
| · | Adhere to high international standards for transparency and reporting of performance on social, governance and environmental factors |
| – | Released 2015 Sustainability Reporting using improved metrics for fibre and self-generated electricity. |
| – | Completed data sharing on Environmental Paper Assessment Tool with GreenBlue. |
CONSOLIDATED RESULTS OF OPERATIONS
Sales
Q1 2016 vs. Q4 2015
Sales revenues were flat compared to the previous quarter with the positive impact of a weaker Canadian dollar being offset by lower transaction prices for pulp and paper. Total sales volumes were slightly higher in the quarter, reflecting higher pulp sales mostly offset by lower sales volumes for all paper grades.
Q1 2016 vs. Q1 2015
Sales revenues increased by 6.5% due to the positive impact of a weaker Canadian dollar and higher sales volumes for coated paper and pulp reflecting a full quarter of sales for the U.S. mills compared to Q1 2015 that included sales from the date of acquisition of January 7, 2015, and the timing of major maintenance spending, with a recovery boiler shut completed at the Crofton mill in Q1 2015. This was partially offset by lower transaction prices for pulp and paper and lower sales volumes for newsprint and uncoated paper.
Adjusted EBITDA
The following table provides variances between periods for adjusted EBITDA:
| (In millions of Canadian dollars) | | | Q4 2015 | | | | Q1 2015 | |
Adjusted EBITDA in comparative period 1 | | $ | 15.1 | | | $ | 14.0 | |
| Paper prices | | | (8.5 | ) | | | (27.1 | ) |
| Pulp prices | | | (3.1 | ) | | | (17.1 | ) |
| Impact of Canadian dollar | | | 5.4 | | | | 18.2 | |
| Volume and mix | | | (5.4 | ) | | | (0.3 | ) |
| Distribution costs | | | 1.6 | | | | 5.0 | |
| Furnish and other conversion costs | | | (4.1 | ) | | | 11.1 | |
| Power and fuel costs | | | 2.7 | | | | 2.8 | |
| Labour costs | | | (4.0 | ) | | | 4.2 | |
| Maintenance costs | | | 10.9 | | | | 5.4 | |
| Selling, general and administrative costs | | | 5.1 | | | | 2.4 | |
| Lower of cost or market on inventory, net of inventory change | | | (1.5 | ) | | | (3.5 | ) |
| Inventory valuation | | | 3.6 | | | | 0.4 | |
| Power generation | | | 0.1 | | | | 1.7 | |
| Other, net | | | (0.8 | ) | | | (0.1 | ) |
Adjusted EBITDA in Q1 2016 1 | | $ | 17.1 | | | $ | 17.1 | |
| 1 | Refer to section 6, Non-GAAP measures. |
Operating Earnings (Loss)
Q1 2016 vs. Q4 2015
Operating earnings increased by $4.9 million due to higher adjusted EBITDA of $2.0 million and lower depreciation of $2.9 million. The reduction in depreciation reflects the adjustment to the estimated remaining economic life of fixed assets, effective December 31, 2015, as discussed in Section 7 Critical Accounting Policies and Estimates.
Q1 2016 vs. Q1 2015
Operating earnings increased by $3.0 million due to higher adjusted EBITDA of $3.1 million, partially offset by higher depreciation and amortization expense of $0.1 million.
Net Earnings (Loss)
Q1 2016 vs. Q4 2015
Net earnings increased by $43.2 million primarily due to higher after-tax operating earnings of $4.9 million and an after-tax foreign exchange gain on the translation of U.S. dollar denominated debt of $22.6 million compared to a loss in the prior quarter of $11.6 million.
Q1 2016 vs. Q1 2015
Net earnings decreased by $5.3 million primarily due to an after-tax bargain purchase gain in Q1 2015 related to the acquisition of the U.S. paper mills of $39.3 million and an income tax recovery in Q1 2015 related to the reduction of a valuation allowance and recognition of deferred tax benefits of $25.3 million, partly offset by higher after-tax operating earnings of $3.0 million, an increase in other income after tax of $5.9 million and an after-tax foreign exchange gain on the translation of U.S. dollar denominated debt of $22.6 million compared to a loss in Q1 2015 of $27.6 million.
The pulp segment continues to consist of NBSK pulp that we produce at our Crofton mill. The kraft pulp that we produce at our Rumford mill is used primarily in the production of specialty paper at Rumford, while our Canadian pulp is produced primarily to be marketed and sold into Asia. The revenue and cost related to market pulp produced at Rumford will therefore not be reported under the pulp operating segment, and will be treated as a corporate adjustment outside of our segmented results.
COATED PAPER
| | | Three months
ended March 31, | |
| (In millions of Canadian dollars, except where otherwise stated) | | 2016 | | | 2015 | | | Change | |
| Sales | | $ | 269.7 | | | $ | 244.2 | | | $ | 25.5 | |
| Operating earnings (loss) | | | 6.1 | | | | (10.7 | ) | | | 16.8 | |
| Depreciation and amortization | | | 5.2 | | | | 5.5 | | | | (0.3 | ) |
Adjusted EBITDA 1 | | | 11.3 | | | | (5.2 | ) | | | 16.5 | |
– before specific items 1 | | | 11.3 | | | | (3.8 | ) | | | 15.1 | |
Adjusted EBITDA margin 1 | | | 4.2 | % | | | (2.1 | %) | | | 6.3 | % |
– before specific items 1 | | | 4.2 | % | | | (1.6 | %) | | | 5.8 | % |
| (In thousands of tonnes) | | | | | | | | | | | | |
| Sales | | | 237.9 | | | | 225.9 | | | | 12.0 | |
| Production | | | 238.5 | | | | 247.2 | | | | (8.7 | ) |
| 1 | Refer to section 6, Non-GAAP measures. |
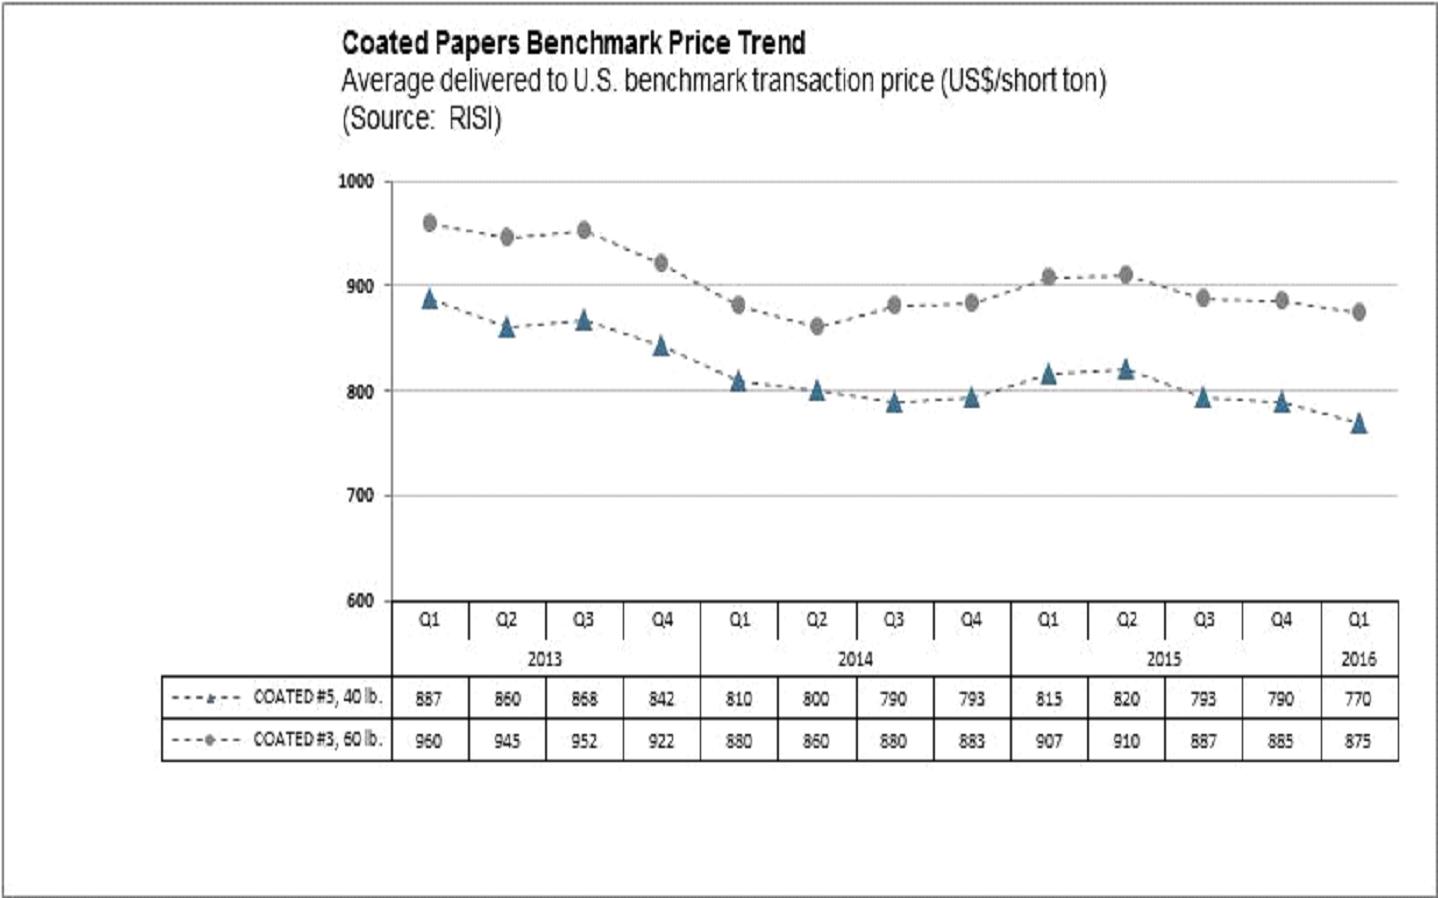
Segment Overview
North American demand for CGW decreased by 9.2% and for CFS decreased by 4.2% from the first quarter of 2015 due to reduced advertising pages in magazines and a decrease in catalogues being mailed out. In addition to falling demand, operating rates were unfavourably impacted by increased imports and extremely competitive market conditions. The average benchmark prices for coated no. 5 paper decreased by 2.5% to US$770 per short ton, and decreased for coated No.3 paper by 1.1% to US$875 per short ton compared to the previous quarter.
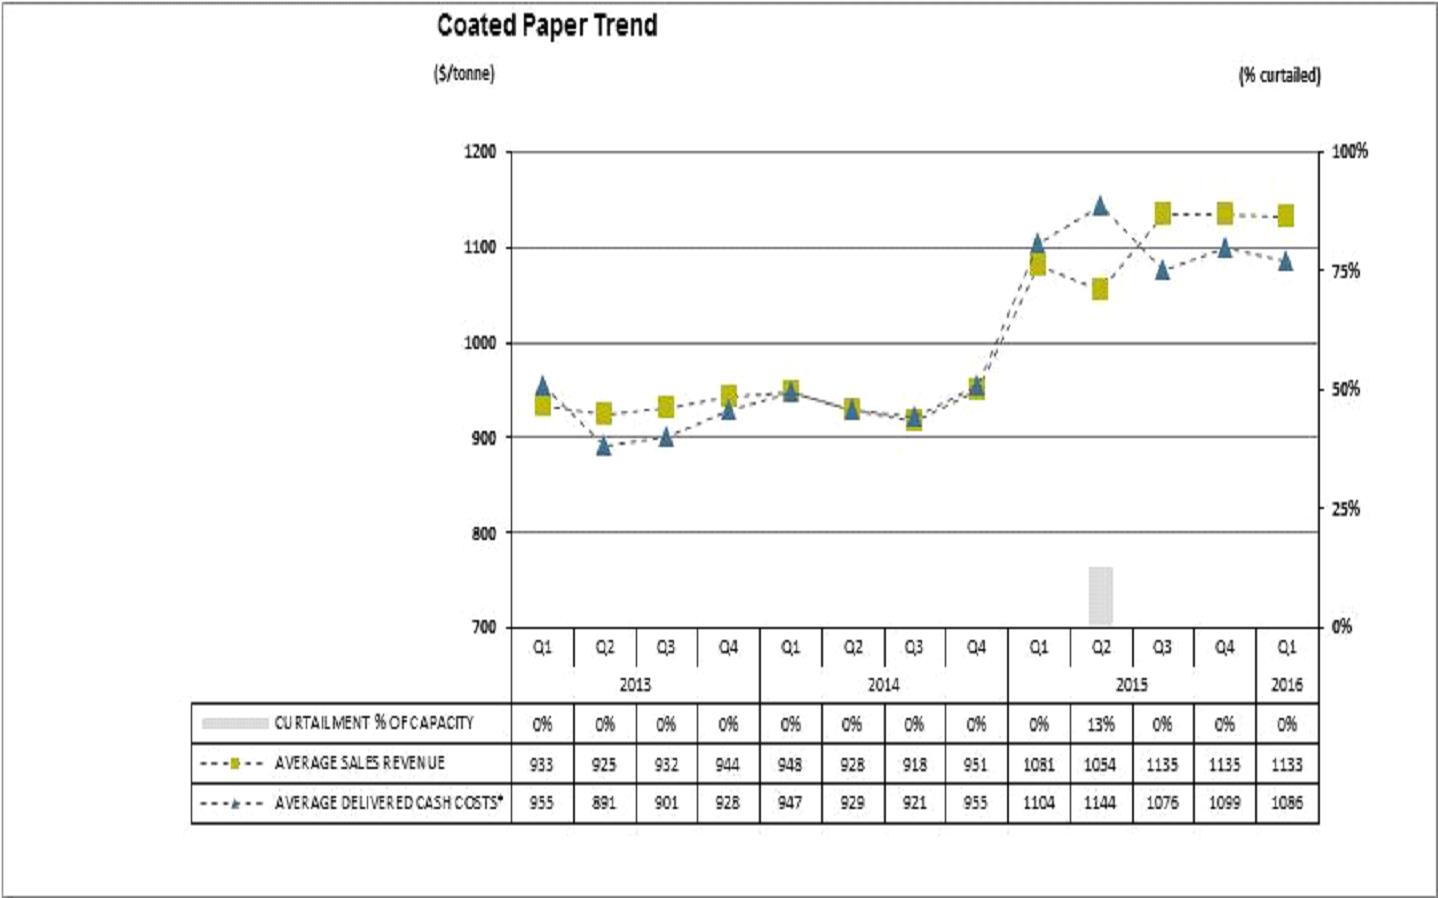
Operational Performance
The following chart summarizes the operating performance of our coated papers segment:
| * | Average delivered cash costs per tonne consist of cost of sales, excluding depreciation and amortization, and including the impact of SG&A and restructuring costs. |
Q1 2016 vs. Q1 2015
| · | Sales volume increased by 12,000 tonnes primarily due to the inclusion of a full quarter of sales for the U.S. paper mills compared to Q1 2015 that included sales from the date of acquisition of January 7, 2015. |
| · | Average sales revenue increased by $52 per tonne due to the positive impact of a weaker Canadian dollar, partially offset by lower average transaction prices. |
| · | Average delivered cash costs decreased by $18 per tonne due to lower fibre, kraft pulp, steam fuel, maintenance and labour costs. The U.S. paper mills are the primary producers of our coated paper products, and their cost structures are benefitting from lower fibre prices, milder winter conditions compared to the first quarter of 2015, and savings realized to date under our mill revitalization program. |
UNCOATED PAPER
| | | Three months
ended March 31, | |
| (In millions of Canadian dollars, except where otherwise stated) | | 2016 | | | 2015 | | | Change | |
| Sales | | $ | 87.9 | | | $ | 94.3 | | | $ | (6.4 | ) |
| Operating earnings (loss) | | | (4.1 | ) | | | 4.2 | | | | (8.3 | ) |
| Depreciation and amortization | | | 6.3 | | | | 6.4 | | | | (0.1 | ) |
Adjusted EBITDA 1 | | | 2.2 | | | | 10.6 | | | | (8.4 | ) |
– before specific items 1 | | | 5.5 | | | | 11.2 | | | | (5.7 | ) |
Adjusted EBITDA margin 1 | | | 2.5 | % | | | 11.2 | % | | | (8.7 | %) |
– before specific items 1 | | | 6.3 | % | | | 11.9 | % | | | (5.6 | %) |
| (In thousands of tonnes) | | | | | | | | | | | | |
| Sales | | | 98.9 | | | | 103.0 | | | | (4.1 | ) |
| Production | | | 102.0 | | | | 110.7 | | | | (8.7 | ) |
| 1 | Refer to section 6, Non-GAAP measures. |
Segment Overview
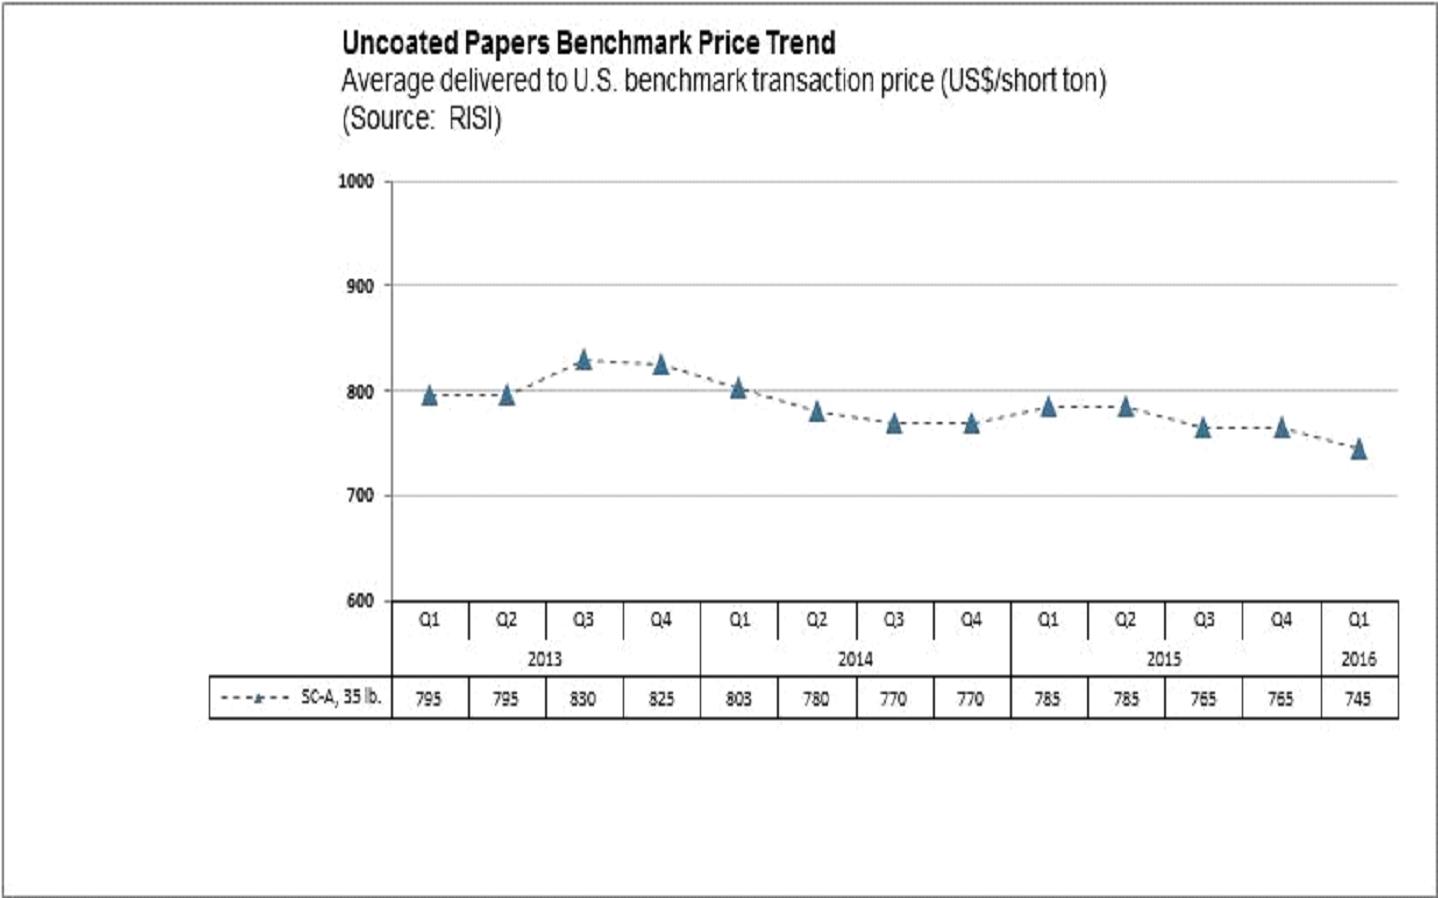
North American demand for UM paper decreased by 3.6% compared to the first quarter of 2015 and inventories rose from the prior quarter. UM paper demand continues to be negatively impacted by reduced advertising and page count in the retail sector. The average benchmark prices for soft-calendered A grade (SC-A) decreased 2.6% to US$745 per short ton compared to the previous quarter. North American directory demand fell 10.5% in Q1 compared to the prior year due to ongoing pressure to reduce or eliminate white pages, smaller books, lower circulation, and the continued migration from printed books to the Internet. Effective February 1, 2016, RISI discontinued reporting an average benchmark price for directory paper.
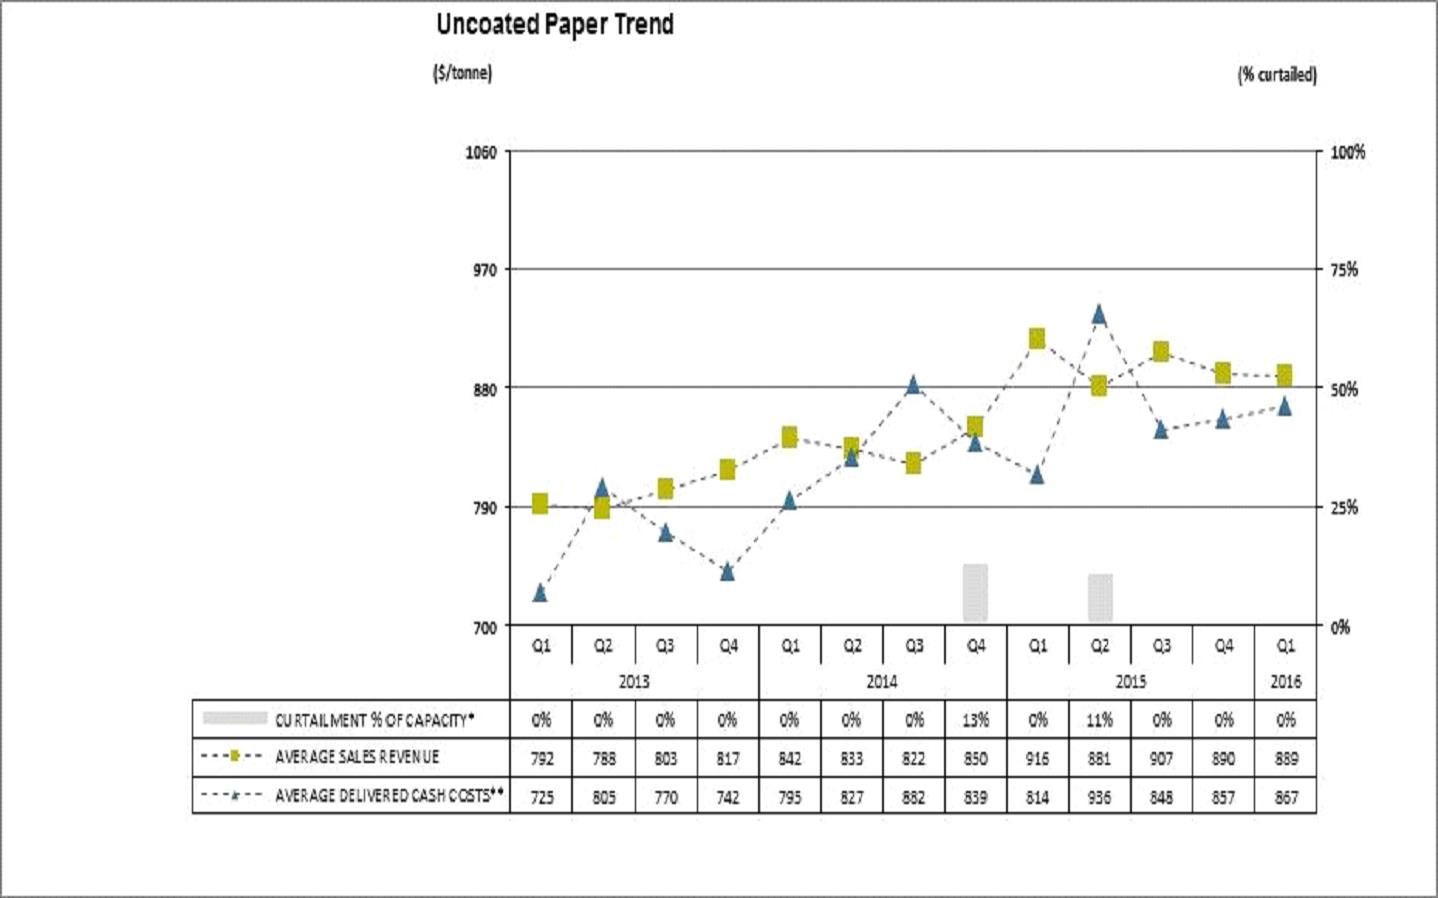
Operational Performance
The following chart summarizes the operating performance of our uncoated papers segment:
| * | Although P9 remains indefinitely curtailed it is not included in our 2015 capacity table. |
| ** | Average delivered cash costs per tonne consist of cost of sales, excluding depreciation and amortization, and including the impact of SG&A and restructuring costs. |
Q1 2016 vs. Q1 2015
| · | Sales volume decreased by 4,100 tonnes due to reduced production in the quarter. |
| · | Average sales revenue decreased by $27 per tonne due to lower average transaction prices, partially offset by the positive impact of a weaker Canadian dollar. Transaction prices were negatively impacted by the imposition of countervailing duties on U.S. exports of SC Paper. |
| · | Average delivered cash costs increased by $53 per tonne due to higher steam fuel, maintenance and labour costs resulting from a number of unforeseen maintenance issues that negatively impacted productivity and costs. Electric power costs were higher, reflecting the 6% energy cost rate increase, effective April 1, 2015. |
NEWSPRINT
| | | Three months
ended March 31, | |
| (In millions of Canadian dollars, except where otherwise stated) | | 2016 | | | 2015 | | | Change | |
| Sales | | $ | 56.3 | | | $ | 58.0 | | | $ | (1.7 | ) |
| Operating earnings (loss) | | | (4.0 | ) | | | 1.4 | | | | (5.4 | ) |
| Depreciation and amortization | | | 1.8 | | | | 1.5 | | | | 0.3 | |
Adjusted EBITDA 1 | | | (2.3 | ) | | | 2.9 | | | | (5.2 | ) |
– before specific items 1 | | | (3.3 | ) | | | 2.9 | | | | (6.2 | ) |
Adjusted EBITDA margin 1 | | | (4.1 | %) | | | 5.0 | % | | | (9.1 | %) |
– before specific items 1 | | | (5.9 | %) | | | 5.0 | % | | | (10.9 | %) |
| (In thousands of tonnes) | | | | | | | | | | | | |
| Sales | | | 80.5 | | | | 81.6 | | | | (1.1 | ) |
| Production | | | 81.5 | | | | 83.7 | | | | (2.2 | ) |
| 1 | Refer to section 6, Non-GAAP measures. |
Segment Overview
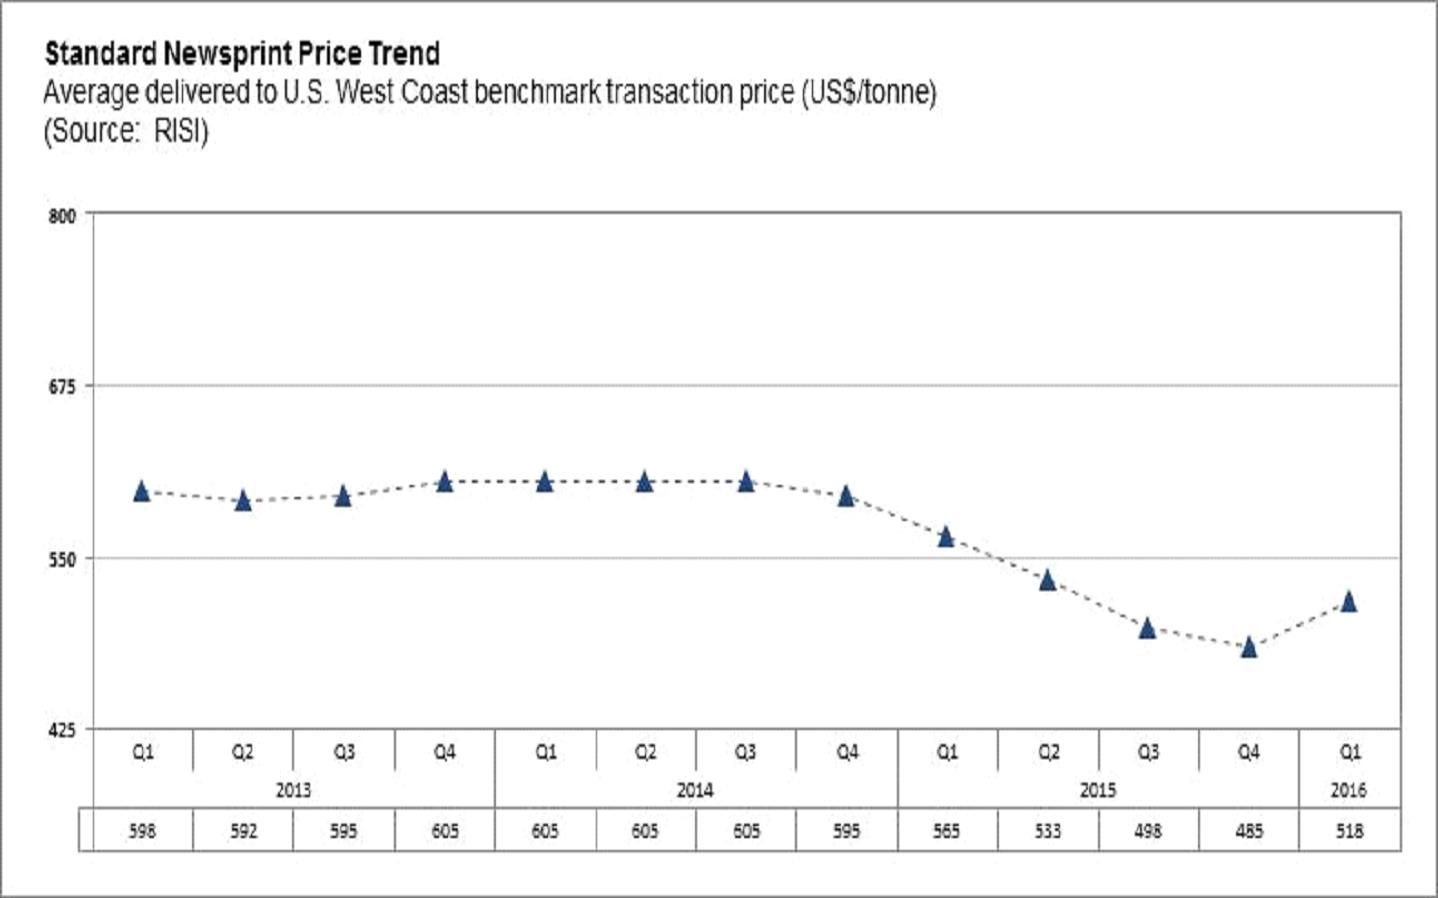
Total North American demand for newsprint was down 4.5% in Q1 year over year in part due to lower newspaper print advertising and declining circulation. The average Q1 North American newsprint benchmark price increased by 6.8% to US$518 per tonne compared to Q4 2015, reflecting the implementation of previously announced price increases in the USA and Canada in the quarter.
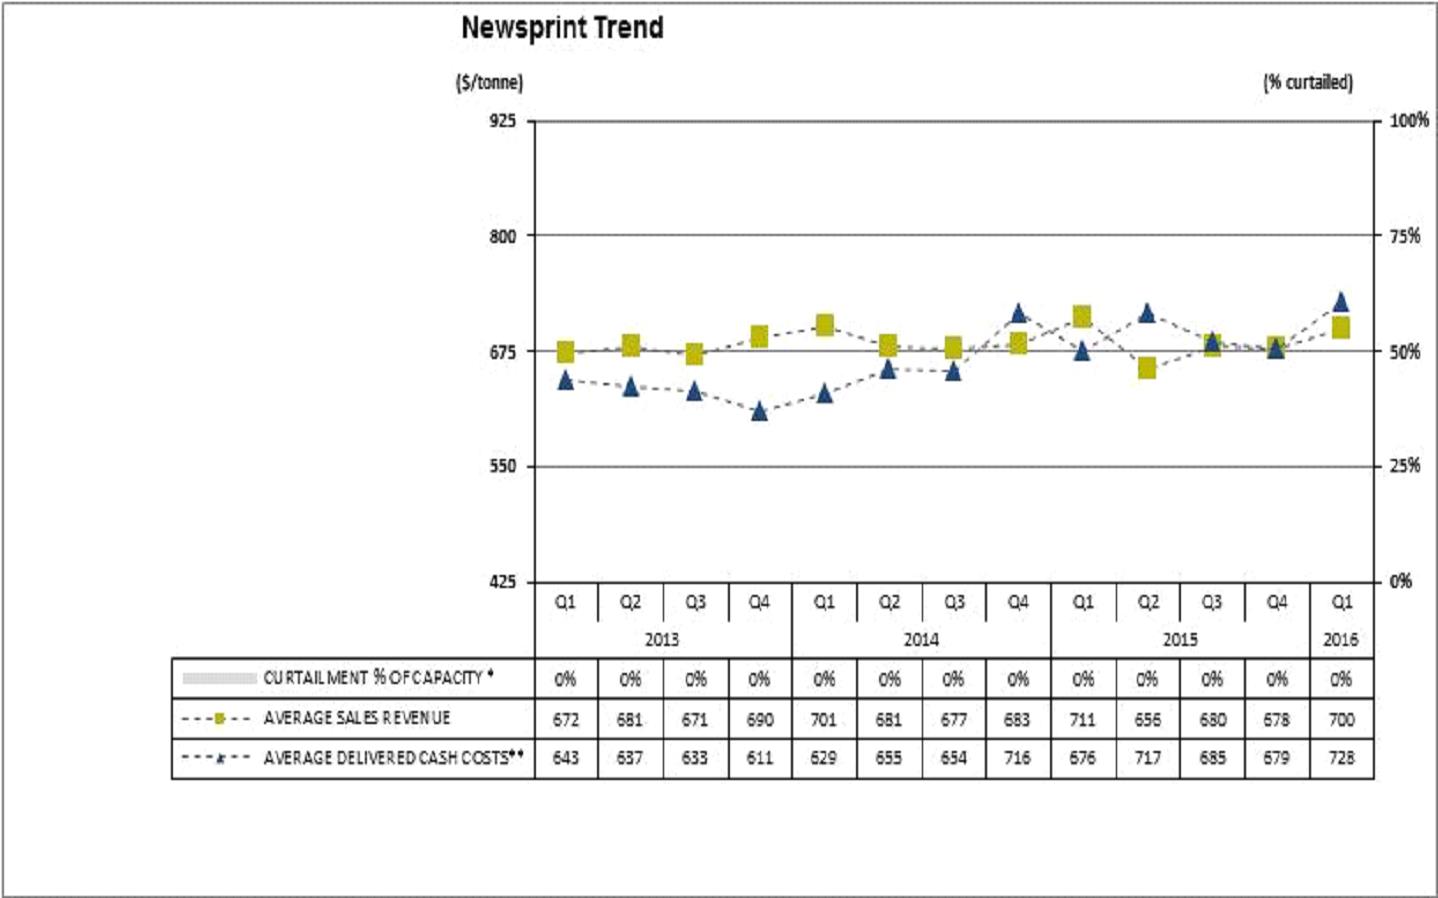
Operational Performance
The following chart summarizes the operating performance of our newsprint segment:
| * | Although C1 remains indefinitely curtailed it is not included in our 2015 capacity table. |
| ** | Average delivered cash costs per tonne consist of cost of sales, excluding depreciation and amortization, and including the impact of SG&A and restructuring costs. |
Q1 2016 vs. Q1 2015
| · | Sales volume decreased by 1,100 tonnes due to reduced production in the quarter. |
| · | Average sales revenue decreased $11 per tonne due to lower average transaction prices, partially offset by the positive impact of a weaker Canadian dollar. |
| · | Average delivered cash costs increased $52 per tonne due primarily to increased cost of chemicals, electric power and steam fuel, as well as higher maintenance and labour spending. This was partially offset by lower outbound freight costs resulting from a more favourable customer destination mix. The increase in maintenance and steam fuel costs was due in part to a scheduled power boiler shut at the Crofton mill in the quarter. |
CATALYST PAPER 2016 FIRST QUARTER REPORT │ MANAGEMENT'S DISCUSSION AND ANALYSIS
PULP
| | | Three months
ended March 31, | |
| (In millions of Canadian dollars, except where otherwise stated) | | 2016 | | | 2015 | | | Change | |
| Sales | | $ | 70.4 | | | $ | 70.5 | | | $ | (0.1 | ) |
| Operating earnings (loss) | | | 10.8 | | | | 7.3 | | | | 3.5 | |
| Depreciation and amortization | | | 0.7 | | | | 0.7 | | | | – | |
Adjusted EBITDA 1 | | | 11.4 | | | | 8.0 | | | | 3.4 | |
– before specific items 1 | | | 9.7 | | | | 8.0 | | | | 1.7 | |
Adjusted EBITDA margin 1 | | | 16.2 | % | | | 11.3 | % | | | 4.9 | % |
– before specific items 1 | | | 13.8 | % | | | 11.3 | % | | | 2.5 | % |
| (In thousands of tonnes) | | | | | | | | | | | | |
| Sales | | | 89.8 | | | | 84.9 | | | | 4.9 | |
| Production | | | 87.0 | | | | 80.3 | | | | 6.7 | |
| 1 | Refer to section 6, Non-GAAP measures |
| 2 | Excludes the results related to market pulp produced at our Rumford mill; revenue and cost related to this pulp are included in our results as a corporate adjustment. |
Segment Overview
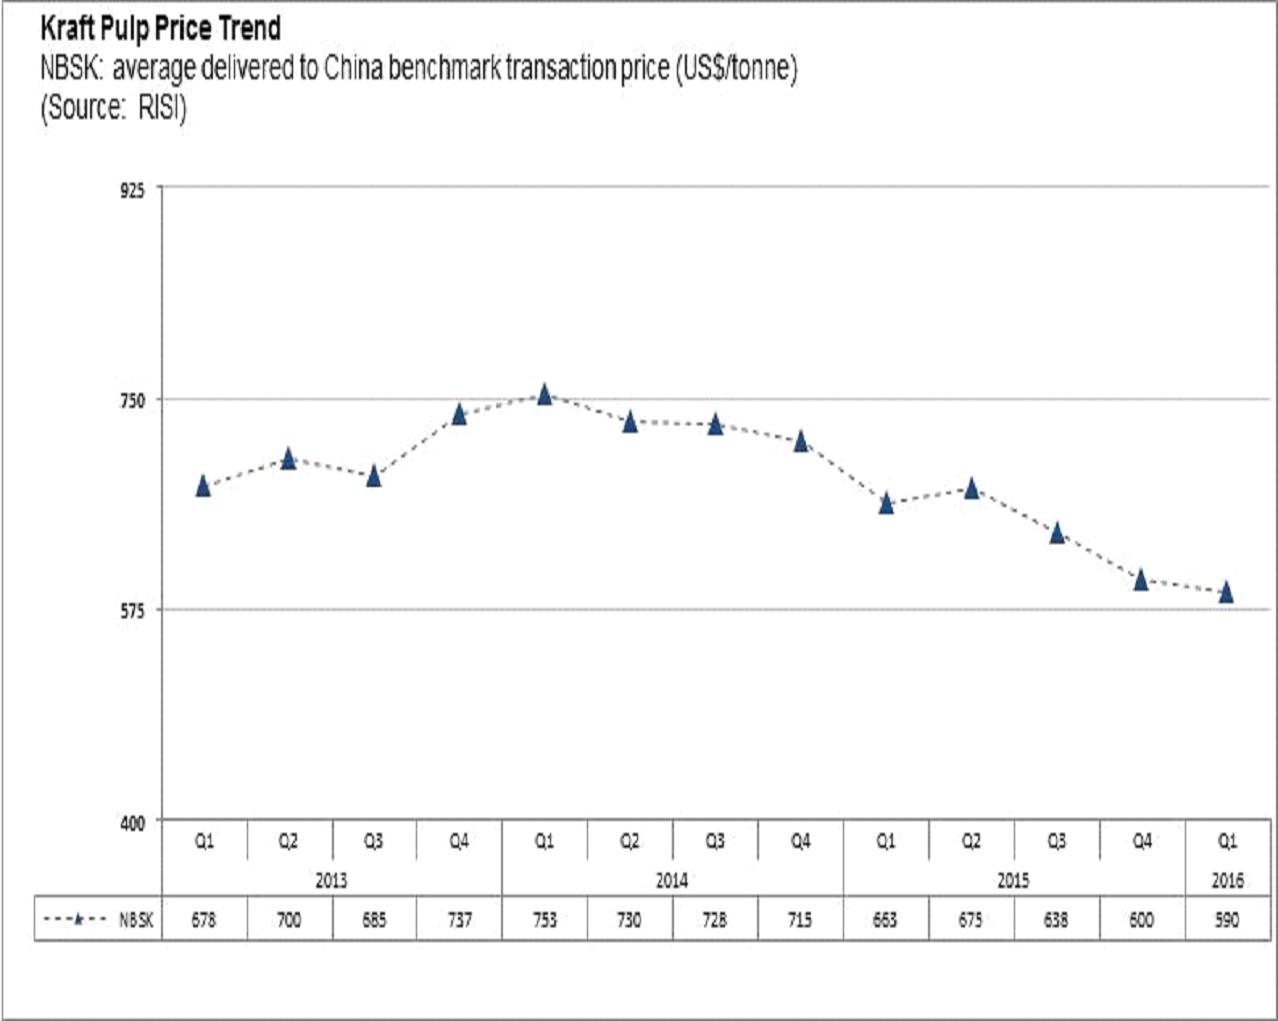
Global NBSK demand increased 6.9% from the first quarter in 2015. The average NBSK benchmark pulp price for China decreased slightly by 1.7% to US$590 per tonne quarter over quarter.
CATALYST PAPER 2016 FIRST QUARTER REPORT │ MANAGEMENT'S DISCUSSION AND ANALYSIS
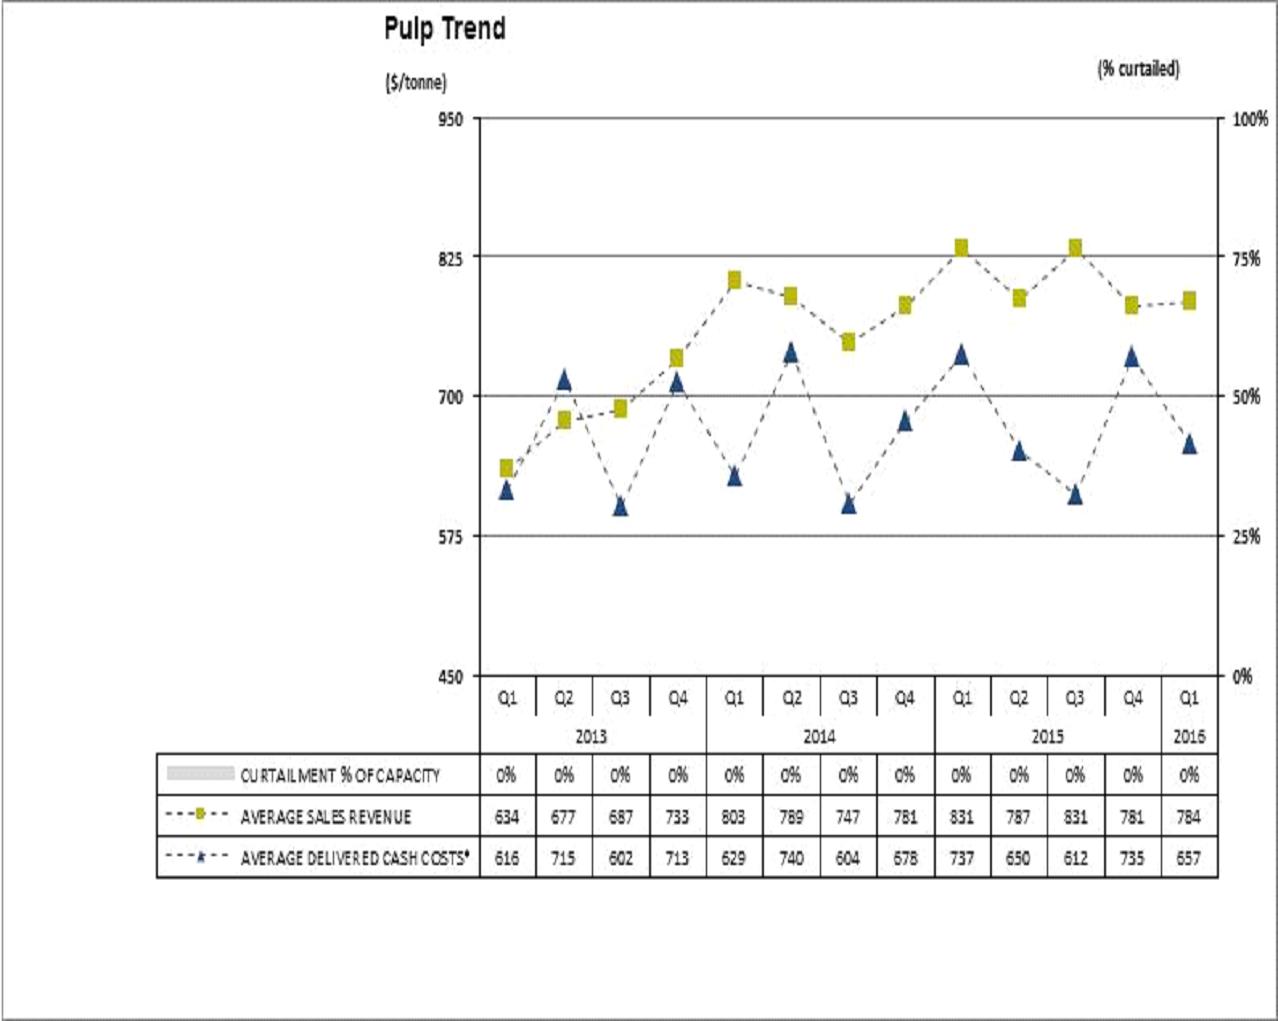
Operational Performance
The following chart summarizes the operating performance of our pulp segment:
| * | Average delivered cash costs per tonne consist of cost of sales, excluding depreciation and amortization, and including the impact of SG&A and restructuring costs. |
Q1 2016 vs. Q1 2015
| · | Sales volume increased by 4,900 tonnes due to increased production in the quarter. Production in Q1 2015 was lower due to a recovery boiler shut at the Crofton mill. |
| · | Average sales revenue decreased $47 per tonne due to lower average transaction prices, partly offset by the positive impact of a weaker Canadian dollar. |
| · | Average delivered cash costs decreased by $80 per tonne due to lower maintenance and labour costs and higher production, reflecting the timing of major maintenance work with a recovery boiler shut completed at our Crofton mill in Q1 2015. |
| 3. | LIQUIDITY AND CAPITAL RESOURCES |
SELECTED FINANCIAL INFORMATION
| | | Three months
ended March 31, | |
| (In millions of Canadian dollars, except where otherwise stated) | | 2016 | | | 2015 | | | Change | |
Cash flows provided (used) by operations before changes in
non‑cash working capital | | $ | 3.3 | | | $ | 0.5 | | | $ | 2.8 | |
| Changes in non-cash working capital | | | (5.1 | ) | | | (21.9 | ) | | | 16.8 | |
| Cash flows provided (used) by | | | | | | | | | | | | |
| Operations | | | (1.8 | ) | | | (21.4 | ) | | | 19.6 | |
| Investing activities | | | (5.2 | ) | | | (83.8 | ) | | | 78.6 | |
| Financing activities | | | 7.1 | | | | 104.2 | | | | (97.1 | ) |
| Capital spending | | | 5.1 | | | | 10.4 | | | | (5.3 | ) |
| Depreciation and amortization | | | 14.4 | | | | 14.3 | | | | 0.1 | |
| Capital spending as % of depreciation and amortization | | | 35 | % | | | 73 | % | | | (38 | %) |
Net debt to net capitalization at March 311 | | | 129 | % | | | 119 | % | | | 10 | % |
| 1 | Net debt ratio equals net debt (total debt less cash) divided by net capitalization (shareholders' equity attributable to the company and total debt less cash). |
Refer to pages 39 to 41 of our 2015 Annual Report for a discussion of the nature and sources of funding for our principal cash requirements.
OPERATING ACTIVITIES
Cash flows from operating activities increased by $19.6 million from Q1 2015 primarily due to increased adjusted EBITDA of $3.1 million and a reduction in the unfavourable change in non-cash working capital of $16.8 million. The unfavourable change in non-cash working capital in Q1 2016 related to an increase in prepaids and accounts receivable and a reduction in accounts payable, partially offset by a decrease in inventories.
INVESTING ACTIVITIES
Cash used by investing activities decreased by $78.6 million due to the acquisition of the U.S. paper mills in Q1 2015 for $73.9 million and decreased spending on capital additions of $5.3 million.
FINANCING ACTIVITIES
Cash provided by financing activities in Q1 was $7.1 million compared to $104.2 million in Q1 2015. Cash provided in the current quarter included a $7.9 million net draw on the ABL Facility. Cash provided in Q1 2015 included a net draw on the ABL Facility of $81.9 million, used in part to acquire the U.S. paper mills, and the issuance of secured notes for proceeds of $23.7 million.
CAPITAL RESOURCES
Availability on the ABL Facility and total liquidity is summarized in the following table:
| | 2016 | | | 2015 | |
| (In millions of Canadian dollars) | | | Q1 | | | | Q4 | | | | Q3 | | | | Q2 | | | | Q1 | |
| Borrowing base | | $ | 225.0 | 1 | | $ | 225.0 | | | $ | 225.0 | | | $ | 212.7 | | | $ | 225.0 | |
| Letters of credit | | | (24.4 | ) | | | (22.4 | ) | | | (22.1 | ) | | | (21.8 | ) | | | (22.0 | ) |
| Amount drawn, net | | | (125.0 | ) | | | (117.1 | ) | | | (121.7 | ) | | | (114.0 | ) | | | (111.3 | ) |
Availability 2 | | | 75.6 | | | | 85.5 | | | | 81.2 | | | | 76.9 | | | | 91.7 | |
| Cash on hand | | | 8.4 | | | | 8.3 | | | | 5.0 | | | | 8.7 | | | | 9.9 | |
| Total liquidity | | $ | 84.0 | | | $ | 93.8 | | | $ | 86.2 | | | $ | 85.6 | | | $ | 101.6 | |
| 1 | Borrowing base is reduced by reserves of $1.4 million for pension, $3.2 million for credit insurance deductibles, $2.8 million for landlord waivers, $1.5 million for employee source deductions and $0.3 million related to WorkSafeBC. |
| 2 | Our ABL Facility is subject to certain financial covenants as disclosed in our interim consolidated financial statements for the three months ended March 31, 2016 in note 11, Long-term debt. |
Our total liquidity decreased by $17.6 million from the same quarter last year primarily due to the generation of negative free cash flow over the last four quarters. Liquidity decreased from the previous quarter by $9.8 million, reflecting an increase in the amount withdrawn on the ABL Facility and to our letters of credit.
The $25.0 million increase to our maximum borrowing base, effective May 9, 2016, is not reflected in total liquidity in the table above.
At May 9, 2016 the company had 14,527,571 common shares issued and outstanding. Our common shares have no par value and an unlimited number of shares are authorized for future issuance.
FINANCIAL INSTRUMENTS
Our financial instruments consist primarily of cash and cash equivalents, accounts receivable, accounts payable and accrued liabilities, long-term debt, and derivatives. Derivatives are used primarily to reduce exposure to currency risk on revenues, or occasionally debt, as well as price risk associated with revenue and energy costs.
For a description of the nature and extent of risk to the company from our financial instruments, as well as our respective accounting treatment of financial instruments, refer to our annual consolidated financial statements for the year ended December 31, 2015 note 26, Financial instruments. For the methods and assumptions we use to determine the fair value of financial instruments, refer to note 25, Fair value measurement, of those statements. Our methods and assumptions for determining the fair value of financial instruments have not changed materially since those used in the preparation of our consolidated financial statements for the year ended December 31, 2015.
At March 31, 2016 the company had foreign currency options and forward contracts with a notional principal of US$112.5 million with major financial institutions. At March 31, 2016 period-end exchange rates, these instruments were reported at their fair value of $3.2 million.
The following table reconciles the average spot exchange rate to our effective exchange rate:
US$/CDN$ FOREIGN EXCHANGE
| | 2016 | | | 2015 | |
| | | | Q1 | | | | Q4 | | | | Q3 | | | | Q2 | | | | Q1 | |
| Average Bank of Canada noon spot rate | | | 0.728 | | | | 0.749 | | | | 0.768 | | | | 0.813 | | | | 0.806 | |
| Average effective rate included in adjusted EBITDA | | | 0.728 | | | | 0.749 | | | | 0.763 | | | | 0.813 | | | | 0.805 | |
(Favourable)/unfavourable impact of derivatives, other than
those designated as effective hedges for accounting
purposes, included in other expenses 1 | | | (0.011 | ) | | | 0.006 | | | | 0.008 | | | | (0.004 | ) | | | 0.017 | |
Foreign exchange (gain)/loss, on working capital balances, included in other expenses 2 | | | 0.004 | | | | (0.004 | ) | | | 0.001 | | | | 0.004 | | | | (0.012 | ) |
Average effective rate in net earnings/(loss) before
income taxes 3 | | | 0.721 | | | | 0.751 | | | | 0.772 | | | | 0.813 | | | | 0.810 | |
| (In millions of Canadian dollars) | | | | | | | | | | | | | | | | | | | | |
1 Favourable/(unfavourable) impact of derivatives included
in other expenses | | $ | 6.2 | | | $ | (2.8 | ) | | $ | (4.9 | ) | | $ | 1.8 | | | $ | (8.0 | ) |
2 Foreign exchange gain/(loss) on working capital balances included
in other expenses | | | (2.3 | ) | | | 2.1 | | | | (0.1 | ) | | | (2.1 | ) | | | 5.9 | |
3 Excludes foreign exchange gain/(loss) on long term debt and
$US interest expense | | | | | | | | | | | | | | | | | | | | |
Two Lawsuits Filed by Halalt First Nation
On January 22, 2016, Catalyst Paper was served with two Notices of Civil Claim by the Halalt First Nation and its business partners. The company intends to vigorously defend itself against both claims. The first claim, filed jointly by the Halalt, Sunvault Energy Inc. and Aboriginal Power Corp. alleges that the company disclosed certain confidential information pertaining to a proposed anaerobic digester facility in breach of a confidentiality agreement. The plaintiffs are seeking, among other things, approximately $100 million in damages from Catalyst in connection with the alleged breach of contract and a permanent injunction restraining Catalyst Paper from constructing, owning or operating an anaerobic digester facility. The second claim, filed by the Halalt and its members, alleges that the company illegally trespassed on, and caused damages to, the Halalt's asserted territories and fisheries resources through the operation of its Crofton Mill since 1957. The Halalt is seeking an interim and permanent injunction restraining the company from conducting its operations at the Crofton Mill and are also seeking approximately $2 billion in damages. Catalyst filed a Response to Civil Claim in respect of the first claim on April 29, 2016 and filed a Response to Civil Claim in respect of the second claim on May 6, 2016.
Appeal of Sales Tax Ruling
On October 21, 2015, Catalyst sought leave to appeal at the Supreme Court of Canada the judgment of the BC Court of Appeal made February 4, 2015 with respect to Catalyst's action against the Province of British Columbia involving a reassessment of the amount of sales tax payable under the Social Services Tax Act on electricity purchased from Powell River Energy Inc. in 2001 through 2010. On April 14, 2016, the Supreme Court of Canada released its decision dismissing the leave to appeal.
| 5. | SUMMARY OF QUARTERLY RESULTS |
The following table highlights selected financial information for the eight consecutive quarters ending March 31, 2016:
| | 2016 | | | 2015 | | | 2014 | |
(In millions of Canadian dollars,
except per share amounts) | | | Q1 | | | | Q4 | | | | Q3 | | | | Q2 | | | | Q1 | | | | Q4 | | | | Q3 | | | | Q2 | |
| Sales | | $ | 510.4 | | | $ | 510.8 | | | $ | 542.6 | | | $ | 458.4 | | | $ | 479.3 | | | $ | 279.9 | | | $ | 272.0 | | | $ | 283.5 | |
Adjusted EBITDA 1 | | | 17.1 | | | | 15.1 | | | | 38.8 | | | | (19.2 | ) | | | 14.0 | | | | 6.8 | | | | 8.0 | | | | 7.1 | |
| Net earnings (loss) | | | 16.9 | | | | (26.3 | ) | | | (12.9 | ) | | | (32.4 | ) | | | 22.2 | | | | (39.7 | ) | | | (22.5 | ) | | | (6.3 | ) |
| Net earnings (loss) per share | | | | | | | | | | | | | | | | | | | | | | | | | | | | | | | | |
– basic and diluted | | $ | 1.17 | | | $ | (1.82 | ) | | $ | (0.89 | ) | | $ | (2.23 | ) | | $ | 1.53 | | | $ | (2.75 | ) | | $ | (1.55 | ) | | $ | (0.43 | ) |
| 1 | Refer to section 6, Non-GAAP measures. |
Refer to section 1, Overview and highlights, and the discussion on Consolidated results of operations, for details of Q1 2016 results compared to Q4 2015.
Management uses certain measures that are not defined by U.S. GAAP to evaluate our performance and, as a result, the measures as employed by management may not be comparable to similarly titled measures reported by other entities. These non-GAAP measures should not be considered by an investor as an alternative to their nearest respective GAAP measure. Our non-GAAP measures include adjusted EBITDA (earnings before interest, taxes, depreciation and amortization, impairment and other closure costs, and before other non-operating income and expenses), adjusted EBITDA before specific items, adjusted EBITDA margin, adjusted EBITDA margin before specific items, average delivered cash costs per tonne, net earnings (loss) attributable to the company before specific items, net earnings (loss) per share attributable to the company's common shareholders before specific items, and free cash flow.
Specific items are items that do not arise from the company's day-to-day operating, investing and financing activities, or items that are subject to material volatility based on factors outside of management's control. Specific items include: foreign exchange gain or loss on long-term debt; gain or loss on cancellation of long-term debt; asset-impairment and other closure costs; restructuring costs; unusual non-recurring items; and certain income tax adjustments.
ADJUSTED EBITDA AND ADJUSTED EBITDA BEFORE SPECIFIC ITEMS
Adjusted EBITDA as defined equates to operating earnings (loss) plus depreciation and amortization and impairment and other closure costs. Adjusted EBITDA margin and adjusted EBITDA margin before specific items are defined as adjusted EBITDA and adjusted EBITDA before specific items as a percentage of sales.
These measures enable comparison of consolidated and segment operating results between periods without regard to debt service, income taxes, capital expenditure requirements, and specific items. These measures are provided to improve comparability between periods by eliminating the impact of financing (interest) and accounting (depreciation) items on our results.
Reconciliation to Net Earnings (Loss):
| | | 2016 | | | 2015 | |
| (In millions of dollars) | | | Q1 | | | Total | | | | Q4 | | | | Q3 | | | | Q2 | | | | Q1 | |
| Net earnings (loss) | | | 16.9 | | | | (49.4 | ) | | | (26.3 | ) | | | (12.9 | ) | | | (32.4 | ) | | | 22.2 | |
| Depreciation and amortization | | | 14.4 | | | | 61.4 | | | | 17.3 | | | | 15.0 | | | | 14.8 | | | | 14.3 | |
| Foreign exchange (gain) loss on long-term debt | | | (22.6 | ) | | | 57.7 | | | | 11.6 | | | | 24.0 | | | | (5.5 | ) | | | 27.6 | |
| Bargain purchase gain | | | – | | | | (43.9 | ) | | | – | | | | (1.7 | ) | | | (2.9 | ) | | | (39.3 | ) |
| Other (income) expense, net | | | (3.7 | ) | | | 0.9 | | | | (1.2 | ) | | | 2.5 | | | | (2.6 | ) | | | 2.2 | |
| Interest expense, net | | | 12.1 | | | | 49.4 | | | | 12.3 | | | | 13.5 | | | | 11.3 | | | | 12.3 | |
| Income tax expense (recovery) | | | – | | | | (27.4 | ) | | | 1.4 | | | | (1.6 | ) | | | (1.9 | ) | | | (25.3 | ) |
| Adjusted EBITDA | | $ | 17.1 | | | $ | 48.7 | | | $ | 15.1 | | | $ | 38.8 | | | $ | (19.2 | ) | | $ | 14.0 | |
| Specific items | | | | | | | | | | | | | | | | | | | | | | | | |
| Restructuring costs | | | – | | | | 1.8 | | | | 0.2 | | | | 0.3 | | | | 0.7 | | | | 0.6 | |
| Market curtailment | | | – | | | | 11.7 | | | | – | | | | – | | | | 11.7 | | | | – | |
| Crofton oxygen plant outage (insurance recovery) | | | (2.7 | ) | | | 4.4 | | | | – | | | | – | | | | 4.4 | | | | – | |
| Rumford recovery boiler upgrade | | | – | | | | 11.0 | | | | – | | | | – | | | | 11.0 | | | | – | |
| Professional fees and duties on countervailing action | | | 3.3 | | | | 7.7 | | | | 4.5 | | | | 2.1 | | | | 1.1 | | | | – | |
| Acquisition costs related to U.S. paper mills | | | – | | | | 1.4 | | | | – | | | | – | | | | – | | | | 1.4 | |
| Total specific items | | | 0.6 | | | | 38.0 | | | | 4.7 | | | | 2.4 | | | | 28.9 | | | | 2.0 | |
| Adjusted EBITDA before specific items | | $ | 17.7 | | | $ | 86.7 | | | $ | 19.8 | | | $ | 41.2 | | | $ | 9.7 | | | $ | 16.0 | |
NET EARNINGS (LOSS) BEFORE SPECIFIC ITEMS
Specific items are defined previously, and the exclusion of such items from net earnings (loss) facilitates the comparison of financial results between periods.
Reconciliation to Net Earnings (Loss):
| | 2016 | | | 2015 | |
| (In millions of Canadian dollars and after-taxes, except where otherwise stated) | | | Q1 | | | Total | | | | Q4 | | | | Q3 | | | | Q2 | | | | Q1 | |
| Net earnings (loss) | | $ | 16.9 | | | $ | (49.4 | ) | | $ | (26.3 | ) | | $ | (12.9 | ) | | $ | (32.4 | ) | | $ | 22.2 | |
| Specific items: | | | | | | | | | | | | | | | | | | | | | | | | |
| Foreign exchange (gain) loss on long-term debt | | | (22.6 | ) | | | 57.7 | | | | 11.6 | | | | 24.0 | | | | (5.5 | ) | | | 27.6 | |
| Bargain purchase gain | | | – | | | | (43.9 | ) | | | – | | | | (1.7 | ) | | | (2.9 | ) | | | (39.3 | ) |
| Market curtailment | | | – | | | | 11.7 | | | | – | | | | – | | | | 11.7 | | | | – | |
| Crofton oxygen plant outage (insurance recovery) | | | (2.7 | ) | | | 4.4 | | | | – | | | | – | | | | 4.4 | | | | – | |
| Rumford recovery boiler upgrade | | | – | | | | 11.0 | | | | – | | | | – | | | | 11.0 | | | | – | |
| Professional fees and duties on countervailing action | | | 3.3 | | | | 7.7 | | | | 4.5 | | | | 2.1 | | | | 1.1 | | | | – | |
| Reduction of deferred tax asset valuation allowance | | | – | | | | (30.4 | ) | | | – | | | | (3.4 | ) | | | (1.9 | ) | | | (25.1 | ) |
| Acquisition costs related to U.S. paper mills | | | – | | | | 1.4 | | | | – | | | | – | | | | – | | | | 1.4 | |
| Restructuring costs | | | – | | | | 1.8 | | | | 0.2 | | | | 0.3 | | | | 0.7 | | | | 0.6 | |
| Net earnings (loss) before specific items | | $ | (5.1 | ) | | $ | (28.0 | ) | | $ | (10.0 | ) | | $ | 8.4 | | | $ | (13.8 | ) | | $ | (12.6 | ) |
| Net earnings (loss) per share: | | | | | | | | | | | | | | | | | | | | | | | | |
| As reported | | $ | 1.17 | | | $ | (3.41 | ) | | $ | (1.82 | ) | | $ | (0.89 | ) | | $ | (2.23 | ) | | $ | 1.53 | |
| Before specific items | | | (0.35 | ) | | | (1.93 | ) | | | (0.69 | ) | | | 0.58 | | | | (0.95 | ) | | | (0.87 | ) |
FREE CASH FLOW
Free cash flow excludes working capital and certain other sources and uses of cash, which are disclosed in the consolidated statements of cash flows. This measure allows us to assess our ability to generate funds to repay debt and assists in cash flow forecasting.
Reconciliation to Cash Provided by Operating Activities less Cash Used by Investing Activities:
| | | 2016 | | | 2015 | |
| (In millions of Canadian dollars) | | | Q1 | | | Total | | | | Q4 | | | | Q3 | | | | Q2 | | | | Q1 | |
| Cash provided (used) by operating activities | | $ | (1.8 | ) | | $ | (6.6 | ) | | $ | 19.4 | | | $ | (12.9 | ) | | $ | 8.3 | | | $ | (21.4 | ) |
| Cash provided (used) by investing activities | | | (5.2 | ) | | | (103.4 | ) | | | (10.7 | ) | | | 2.2 | | | | (11.1 | ) | | | (83.8 | ) |
| Proceeds from the sale of property, plant and equipment and other assets | | | – | | | | (5.0 | ) | | | – | | | | (5.0 | ) | | | – | | | | – | |
| Other investing activities | | | 0.1 | | | | – | | | | 0.6 | | | | (0.1 | ) | | | – | | | | (0.5 | ) |
| Non-cash working capital changes except change in taxes and interest | | | 5.1 | | | | (13.0 | ) | | | (44.0 | ) | | | 33.3 | | | | (33.2 | ) | | | 30.9 | |
| Other | | | 0.1 | | | | 90.4 | | | | 23.3 | | | | 5.9 | | | | (5.5 | ) | | | 66.7 | |
| Free cash flow | | $ | (1.7 | ) | | $ | (37.6 | ) | | $ | (11.4 | ) | | $ | 23.4 | | | $ | (41.5 | ) | | $ | (8.1 | ) |
Management's Calculation of Free Cash Flow:
| | | 2016 | | | 2015 | |
| (In millions of Canadian dollars) | | | Q1 | | | Total | | | | Q4 | | | | Q3 | | | | Q2 | | | | Q1 | |
| Adjusted EBITDA | | $ | 17.1 | | | $ | 48.7 | | | $ | 15.1 | | | $ | 38.8 | | | $ | (19.2 | ) | | $ | 14.0 | |
| Interest expense, excluding amortization | | | (11.0 | ) | | | (45.1 | ) | | | (11.1 | ) | | | (12.4 | ) | | | (10.2 | ) | | | (11.4 | ) |
| Capital expenditures | | | (5.1 | ) | | | (34.5 | ) | | | (10.1 | ) | | | (2.9 | ) | | | (11.1 | ) | | | (10.4 | ) |
Employee future benefits, expense under
cash contributions 1 | | | (2.7 | ) | | | (6.7 | ) | | | (5.3 | ) | | | (0.1 | ) | | | (1.0 | ) | | | (0.3 | ) |
| Free cash flow | | $ | (1.7 | ) | | $ | (37.6 | ) | | $ | (11.4 | ) | | $ | 23.4 | | | $ | (41.5 | ) | | $ | (8.1 | ) |
| 1 | Free cash flow is adjusted to reflect the cash impact of employee future benefits rather than the accounting expense which is included in adjusted EBITDA. |
| 7. | CRITICAL ACCOUNTING POLICIES AND ESTIMATES |
The preparation of financial statements in conformity with U.S. GAAP requires companies to establish accounting policies and to make estimates that affect both the amount and timing of recording of assets, liabilities, revenues and expenses. Some of these estimates require judgments about matters that are inherently uncertain and actual results could differ from estimates.
On an ongoing basis, we review our estimates based upon currently available information. The discussion on the accounting policies that require management's most difficult, subjective and complex judgments, and which are subject to a fair degree of measurement uncertainty can be found on pages 47 to 52 of the company's 2015 Annual Report.
Pension and Post-Retirement Benefits
Effective January 1, 2016, the company elected to refine the approach for determining the service cost and interest cost components of the net defined benefit cost that will be recognized on pension and other post-retirement benefit programs. Historically, the company had estimated the service and interest cost components by applying a single weighted-average discount rate derived from the yield curve used to measure the benefit obligation at the beginning of the period. The company has elected to utilize a full yield curve approach to estimate these components by applying specific spot rates along the yield curve used in the determination of the benefit obligation to the relevant projected cash flows. The company made this change to improve the correlation between projected benefit cash flows and the corresponding yield curve spot rates and to provide a more precise measurement of interest costs. This change does not affect the measurement of total benefit obligations as the change in interest cost is completely offset in the actuarial loss reported in the period. The company has accounted for this change as a change in estimates and, accordingly, has accounted for it prospectively beginning in the first quarter of 2016. Based on current economic conditions, we estimate the service cost and interest cost for those plans will be reduced by approximately $3.8 million in 2016 as a result of the change
Property, Plant and Equipment
We adjusted the estimated remaining economic life of certain assets as of December 31, 2015, based on a review of the physical condition and expected future operational and commercial lives of our major classes of assets. The estimated impact on annual depreciation from the adjustment is a $6.0 million reduction.
| 8. | CHANGES IN ACCOUNTING POLICIES |
In April 2015, FASB updated standard No. 2015-03 Interest – Imputation of Interest (Subtopic 835-30) to simplify the presentation of debt issuance costs. The company has adopted the new standard in its financial statements for the annual period beginning on January 1, 2016. As a result the company has netted $3.0 million in deferred financing costs, which was previously disclosed in other assets, against long-term debt (December 31, 2015 - $3.6 million).
In February 2015, FASB updated standard No. 2015-02 – Consolidation (Topic 810) which affects reporting entities that are required to evaluate whether they should consolidate certain legal entities. The company has adopted the new standard in its financial statements for the annual period beginning on January 1, 2016. There was no material impact to the company's financials as a result of this adoption.
On January 7, 2015, the company's foreign subsidiary acquired the assets of the Biron and Rumford paper mills in Wisconsin and Maine, respectively. As a result, the company has a foreign subsidiary that is considered to be a distinct and separable operation that is integrated within its foreign jurisdiction, and accordingly, uses the U.S. dollar as its functional currency. Foreign exchange gains and losses arising from the translation of the foreign subsidiary's accounts into Canadian dollars (CDN$) are reported as a component of other comprehensive income (loss).
| 9. | IMPACT OF ACCOUNTING PRONOUNCEMENTS AFFECTING FUTURE PERIODS |
In May 2014, FASB issued a new standard on revenue recognition ASC Topic 606 Revenue from Contracts with Customers. The company intends to adopt the new standard in its financial statements for the annual period beginning on January 1, 2018. The extent of the impact of adoption of the standard has not yet been determined.
In February 2016, FASB issued ASU 2016-02 Leases which, among other things, requires lessees to recognize most leases on-balance sheet. The company intends to adopt the new standard in its financial statements for the annual period beginning on January 1, 2019. The extent of the impact of adoption of the standard has not yet been determined.
In March 2016, FASB issued ASU 2016-09 Improvements to Employee Share-Based Payment Accounting, which is intended to improve the accounting for share-based payment transactions as part of the FASB's simplification initiative. The company intends to adopt the new standard in its financial statements for the annual period beginning on January 1, 2017. The extent of the impact of adoption of the standard has not yet been determined.
There were no other new pronouncements issued by the FASB that may materially impact the company's consolidated financial statements for future periods.
| 10. | RISKS AND UNCERTAINTIES |
We face risks and uncertainties which fall into the general business areas of markets, international commodity prices, currency exchange rates, environmental issues, fibre supply, government regulation and policy, and for Canadian companies, trade barriers and potential impacts of aboriginal rights, including unresolved aboriginal land claims in B.C.
In order to address these risks and effectively manage them, we have developed a process for managing risk and the interrelationship between risks and our strategic plan. We provide regular updates to the Audit Committee, work with corporate and operational management to identify, measure, and prioritize the critical risks facing the company, and manage these risks by ensuring that they are adequately addressed through mitigating procedures where appropriate. The objectives of the risk-management function include developing a common framework for understanding what constitutes principal business risks, ensuring that risk management activities are aligned with business strategies, and providing an effective mechanism for governance in the area of risk management.
A description of our risks and uncertainties can be found on pages 52 to 61 of our 2015 Annual Report and such description is incorporated by reference into this MD&A.
Our earnings are sensitive to fluctuations in product prices, foreign exchange, energy and fibre costs as described on page 62 to 63 of our 2015 Annual Report and summarized in the following table:
| (In millions of Canadian dollars, except per share amounts) | | Adjusted EBITDA1 | | | Net
Earnings2 | | | Earnings
per Share | |
Product prices 3 | | | | | | | | | |
| A US$10 per tonne change in the sales price of: | | | | | | | | | |
| Uncoated Paper | | $ | 5 | | | $ | 4 | | | $ | 0.26 | |
| Coated Paper | | | 13 | | | | 10 | | | | 0.67 | |
| Newsprint | | | 4 | | | | 3 | | | | 0.23 | |
| Pulp | | | 5 | | | | 4 | | | | 0.25 | |
Foreign exchange 4 | | | | | | | | | | | | |
| A US$0.01 change in the U.S. dollar relative to the Canadian dollar | | | 11 | | | | 8 | | | | 0.54 | |
Energy cost sensitivity 5 | | | | | | | | | | | | |
| A 5% change in the price of: | | | | | | | | | | | | |
| Natural gas and oil – direct purchases | | | 2 | | | | 1 | | | | 0.10 | |
| Electricity – direct purchases | | | 8 | | | | 6 | | | | 0.40 | |
Coal – direct purchases | | | 2 | | | | 1 | | | | 0.10 | |
| Freight cost sensitivity | | | | | | | | | | | | |
| A US$5/bbl change in the price of West Texas Int. (WTI) Oil | | | 2 | | | | 1 | | | | 0.10 | |
Fibre sensitivity 5 | | | | | | | | | | | | |
| A US$5 per unit change in the price of: | | | | | | | | | | | | |
| Wood chips (Bdt) | | | 18 | | | | 13 | | | | 0.90 | |
| 1 | Refer to section 6, Non-GAAP measures. |
| 2 | Based on an expected tax rate of 26%. |
| 3 | Based on annualized sales of Q1 2016 and foreign exchange rate of US$0.73. |
| 4 | Based on Q1 2016 annualized net cash flows and a movement to US$0.74 from US$0.73 and excluding our hedging program and the impact of the translation of U.S. dollar-denominated debt. |
| 5 | Based on Q1 2016 annualized consumption levels and an exchange rate of US$0.73. |
Markets
The market for printing and writing papers in North America continues to be under pressure. Competition among both domestic and offshore producers, ongoing electronic substitution and paper conservation moves by publishers contribute to the challenging market conditions. We expect that declining demand, increased imports into North America and extremely competitive market conditions will negatively impact operating rates and further drive down coated and uncoated paper prices, with the exception of C1S. For newsprint and pulp, we expect to realize the benefits of recent price increases.
Operations
Although we anticipate continued savings in the second quarter under our revitalization and OFI programs, we expect this to be more than offset by higher power costs for our Canadian operations due to an announced hydroelectricity rate increase of 4%, effective April 1, 2016, and maintenance spending related to the water line breach at the Crofton mill, a scheduled total mill outage and recovery boiler shut at our Crofton mill and a power boiler shut at our Powell River mill.
The following table summarizes major planned maintenance shutdown costs and related production downtime for 2016:
| | | 2016 |
| | | Q1 | | Q2 | | Q3 | | Q4 | | Total |
| Mill Location | | Tonnage
Impact | Mtce
Cost
($mm) | | Tonnage
Impact | Mtce
Cost
($mm) | | Tonnage
Impact | Mtce
Cost
($mm) | | Tonnage
Impact | Mtce
Cost ($mm) | | Tonnage
Impact | Mtce
Cost
($mm) |
| Alberni | | | | | | | | | | | | | | | |
| Other | | – | – | | – | – | | – | 0.2 | | – | – | | – | 0.2 |
| Boilers | | – | – | | – | – | | – | 0.6 | | – | 1.0 | | – | 1.6 |
| Crofton | | | | | | | | | | | | | | | |
| TMO | | – | – | | 4,800 | 2.5 | | – | – | | – | – | | 4,800 | 2.5 |
| Capital | | – | – | | 3,400 | – | | – | – | | – | – | | 3,400 | – |
| Pulp | | – | – | | 9,600 | 5.7 | | – | – | | – | – | | 9,600 | 5.7 |
| Boilers | | – | 3.8 | | – | – | | – | – | | – | – | | – | 3.8 |
| Powell | | | | | | | | | | | | | | | |
| Boilers | | – | 0.2 | | – | 2.8 | | – | – | | – | – | | – | 3.0 |
| Biron | | | | | | | | | | | | | | | |
| Boilers | | – | – | | – | – | | – | | | – | 0.3 | | – | 0.3 |
| Rumford | | | | | | | | | | | | | | | |
| Pulp | | – | – | | – | – | | – | – | | 2,400 | 7.9 | | 2,400 | 7.9 |
| Boilers | | – | – | | – | – | | – | 3.9 | | – | 3.7 | | – | 7.6 |
| Total | | – | 4.0 | | 17,800 | 11.0 | | – | 4.7 | | 2,400 | 12.9 | | 20,200 | 32.6 |
Capital spending is expected to be in the $25 to $35 million range in 2016.
Liquidity, Debt Maturities and Covenants
We do not currently anticipate any significant uses of cash in Q2 other than for our operations, working capital fluctuations, interest payments and pension funding contributions.
| 13. | DISCLOSURE CONTROLS AND INTERNAL CONTROL
OVER FINANCIAL REPORTING |
A summary of our regulatory requirements for the evaluation of internal controls and subsequent reporting of the results of that evaluation can be found on page 66 of our 2015 Annual Report. Based on an evaluation of the design and operation of the company's disclosure controls and procedures conducted under the supervision and with the participation of management, our chief executive officer and chief financial officer concluded that such disclosure controls and procedures (as defined in Canada under National Instrument 52-109 and in Rules 13a-15(e) and 15d-15(e) under the United States Securities Exchange Act of 1934), were effective as at December 31, 2015.
We did not make any changes in internal controls over financial reporting during the most recent three month period ended March 31, 2016 that have materially affected, or are reasonably likely to materially affect, our internal control over financial reporting.
The company's Audit Committee, as part of its oversight role, has reviewed and recommended the approval of this MD&A to the Board of Directors. The Board of Directors has read and approved this MD&A.
CATALYST PAPER CORPORATION
FINANCIAL STATEMENTS
FOR THE THREE MONTHS ENDED MARCH 31, 2016
CONSOLIDATED BALANCE SHEETS
| | | March 31, | | | December 31, | |
| (Unaudited and in millions of Canadian dollars) | | 2016 | | | 2015 | |
| | | | | | | |
| Assets | | | | | | |
| Current assets | | | | | | |
| Cash and cash equivalents | | $ | 8.4 | | | $ | 8.3 | |
| Accounts receivable (note 5) | | | 186.0 | | | | 185.1 | |
| Inventories (note 6) | | | 251.8 | | | | 256.2 | |
| Prepaids and other (note 7) | | | 7.9 | | | | 5.5 | |
| Assets held for sale | | | 1.1 | | | | 1.5 | |
| | | | 455.2 | | | | 456.6 | |
| Property, plant and equipment (note 8) | | | 441.2 | | | | 456.9 | |
| Other assets (note 9) | | | 2.6 | | | | 2.0 | |
| | | $ | 899.0 | | | $ | 915.5 | |
| Liabilities | | | | | | | | |
| Current liabilities | | | | | | | | |
| Accounts payable and accrued liabilities (note 10) | | $ | 238.5 | | | $ | 244.5 | |
| Current portion of long-term debt (note 11) | | | 3.2 | | | | 3.2 | |
| | | | 241.7 | | | | 247.7 | |
| Long-term debt (note 11) | | | 476.6 | | | | 491.0 | |
| Employee future benefits (note 12) | | | 263.5 | | | | 267.1 | |
| Other long-term obligations (note 13) | | | 23.8 | | | | 26.4 | |
| | | | 1,005.6 | | | | 1,032.2 | |
| Deficiency | | | | | | | | |
| Shareholders' deficiency | | | | | | | | |
Common stock: no par value; unlimited shares authorized; issued
and outstanding: 14,527,571 shares
(December 31, 2015 – 14,527,571 shares) | | | 144.9 | | | | 144.9 | |
Preferred stock: par value determined at time of issue; authorized
100,000,000 shares; issued and outstanding: nil shares | | | – | | | | – | |
| Deficit | | | (267.6 | ) | | | (284.5 | ) |
| Accumulated other comprehensive income | | | 16.1 | | | | 22.9 | |
| | | | (106.6 | ) | | | (116.7 | ) |
| | | $ | 899.0 | | | $ | 915.5 | |
Subsequent events (note 11)
Contingencies (note 18)
The accompanying notes are an integral part of the unaudited interim consolidated financial statements.
| On behalf of the Board: | |
| |
| Joe Nemeth | Walter Jones |
| Director | Director |
CONSOLIDATED STATEMENTS OF EARNINGS
| | | Three months
ended March 31, | |
| (Unaudited and in millions of Canadian dollars, except where otherwise stated) | | 2016 | | | 2015 | |
| Sales | | $ | 510.4 | | | $ | 479.3 | |
| Operating expenses | | | | | | | | |
| Cost of sales, excluding depreciation and amortization | | | 480.2 | | | | 449.8 | |
| Depreciation and amortization | | | 14.4 | | | | 14.3 | |
| Selling, general and administrative | | | 13.1 | | | | 14.9 | |
| Restructuring | | | – | | | | 0.6 | |
| | | | 507.7 | | | | 479.6 | |
| Operating earnings (loss) | | | 2.7 | | | | (0.3 | ) |
| Interest expense, net | | | (12.1 | ) | | | (12.3 | ) |
| Foreign exchange gain (loss) on long-term debt | | | 22.6 | | | | (27.6 | ) |
| Other income, net (note 14) | | | 3.7 | | | | 37.1 | |
| Earnings (loss) before income taxes | | | 16.9 | | | | (3.1 | ) |
| Income tax recovery (note 15) | | | – | | | | (25.3 | ) |
| Net earnings | | $ | 16.9 | | | $ | 22.2 | |
| Basic and diluted net gain per share (in dollars) | | $ | 1.17 | | | $ | 1.53 | |
| Weighted average number of company common shares outstanding (in millions) | | | 14.5 | | | | 14.5 | |
The accompanying notes are an integral part of the unaudited interim consolidated financial statements
CONSOLIDATED STATEMENTS OF COMPREHENSIVE INCOME
| | | Three months
ended March 31, | |
| (Unaudited and in millions of Canadian dollars) | | 2016 | | | 2015 | |
| Net earnings | | $ | 16.9 | | | $ | 22.2 | |
| Other comprehensive income (loss), net of tax (expense) recovery: | | | | | | | | |
| Reclassification of amortization of employee future benefits | | | | | | | | |
| Gross amount | | | – | | | | 0.1 | |
| Tax (expense) recovery | | | – | | | | – | |
| Net amount | | | – | | | | 0.1 | |
| Foreign currency translation adjustments | | | | | | | | |
| Gross amount | | | (6.8 | ) | | | 1.9 | |
| Tax (expense) recovery | | | – | | | | – | |
| Net amount | | | (6.8 | ) | | | 1.9 | |
| Other comprehensive income (loss), net of tax | | | (6.8 | ) | | | 2.0 | |
| Comprehensive income | | $ | 10.1 | | | $ | 24.2 | |
The accompanying notes are an integral part of the unaudited interim consolidated financial statements.
CONSOLIDATED STATEMENTS OF EQUITY (DEFICIENCY)
| | | Equity (deficiency) | |
| | | Common stock | | | | | | | | | | | | | |
| (Unaudited and in millions of Canadian dollars) | | Number
of shares | | | | | | $ | | | | Deficit | | | Accumulated other
comprehensive income (loss) | | | Total | |
| Balance as at December 31, 2014 | | | 14,527,571 | | | $ | 144.9 | | | | | | | $ | (235.1 | ) | | $ | (5.4 | ) | | $ | (95.6 | ) |
| Net loss | | | – | | | | – | | | | | | | | (49.4 | ) | | | – | | | | (49.4 | ) |
| Other comprehensive income, net of tax | | | – | | | | – | | | | | | | | – | | | | 28.3 | | | | 28.3 | |
| Balance as at December 31, 2015 | | | 14,527,571 | | | $ | 144.9 | | | | | | | $ | (284.5 | ) | | $ | 22.9 | | | $ | (116.7 | ) |
| Net earnings | | | – | | | | – | | | | | | | | 16.9 | | | | – | | | | 16.9 | |
| Other comprehensive loss, net of tax | | | – | | | | – | | | | | | | | – | | | | (6.8 | ) | | | (6.8 | ) |
| Balance as at March 31, 2016 | | | 14,527,571 | | | $ | 144.9 | | | | | | | $ | (267.6 | ) | | $ | 16.1 | | | $ | (106.6 | ) |
The accompanying notes are an integral part of the unaudited interim consolidated financial statements.
CONSOLIDATED STATEMENTS OF CASH FLOWS
| | | Three months
ended March 31, | |
| (Unaudited and in millions of Canadian dollars) | | 2016 | | | 2015 | |
Cash flows provided (used) by: | | | | | | |
Operations | | | | | | |
| Net earnings | | $ | 16.9 | | | $ | 22.2 | |
| Items not requiring (providing) cash | | | | | | | | |
| Depreciation and amortization | | | 14.4 | | | | 14.3 | |
| Foreign exchange (gain) loss on long-term debt | | | (22.6 | ) | | | 27.6 | |
| Deferred income taxes | | | – | | | | (25.1 | ) |
| Employee future benefits, expense under cash contributions | | | (2.7 | ) | | | (0.3 | ) |
| Increase (decrease) in other long-term obligations | | | (1.8 | ) | | | 2.1 | |
| (Gain) on purchase of U.S. mills (note 4) | | | – | | | | (39.3 | ) |
| Other | | | (0.9 | ) | | | (1.0 | ) |
| Changes in non-cash working capital | | | | | | | | |
| Accounts receivable | | | (0.9 | ) | | | (19.0 | ) |
| Inventories | | | 4.5 | | | | (50.4 | ) |
| Prepaids and other | | | (2.5 | ) | | | (3.7 | ) |
| Accounts payable and accrued liabilities | | | (6.2 | ) | | | 51.2 | |
Cash flows used by operating activities | | $ | (1.8 | ) | | $ | (21.4 | ) |
Investing | | | | | | | | |
| Additions to property, plant and equipment | | | (5.1 | ) | | | (10.4 | ) |
| (Increase) decrease in other assets | | | (0.1 | ) | | | 0.5 | |
| Purchase of U.S. mills (note 4) | | | – | | | | (73.9 | ) |
Cash flows used by investing activities | | $ | (5.2 | ) | | $ | (83.8 | ) |
Financing | | | | | | | | |
| Increase in revolving loan (note 11) | | | 7.9 | | | | 81.9 | |
| Proceeds on issuance of senior secured notes (note 11) | | | – | | | | 23.7 | |
| Repayments on secured term loan | | | (0.5 | ) | | | (0.5 | ) |
| Deferred financing costs (note 11) | | | – | | | | (0.8 | ) |
| Decrease in other long-term debt | | | (0.3 | ) | | | (0.1 | ) |
Cash flows provided by financing activities | | $ | 7.1 | | | $ | 104.2 | |
Cash and cash equivalents, increase (decrease) in the period | | | 0.1 | | | | (1.0 | ) |
| Cash and cash equivalents, beginning of the period | | | 8.3 | | | | 10.9 | |
Cash and cash equivalents, end of the period | | $ | 8.4 | | | $ | 9.9 | |
Supplemental disclosures: | | | | | | | | |
| Income taxes paid | | $ | – | | | $ | 0.5 | |
| Net interest | | | 11.0 | | | | 11.4 | |
| | |
The accompanying notes are an integral part of the unaudited interim consolidated financial statements.
CONSOLIDATED BUSINESS SEGMENTS
(Unaudited and in millions of Canadian dollars)
The accompanying notes are an integral part of the unaudited interim consolidated financial statements.
NOTES TO THE UNAUDITED INTERIM CONSOLIDATED FINANCIAL STATEMENTS
(Unaudited and in millions of Canadian dollars, except where otherwise stated)
TABLE OF CONTENTS | |
Note 1 | Basis of Presentation | 38 |
Note 2 | Segmented Information | 38 |
Note 3 | Significant Accounting Policies | 38 |
Note 4 | Purchase of U.S. Paper Mills | 39 |
Note 5 | Accounts Receivable | 40 |
Note 6 | Inventories | 40 |
Note 7 | Prepaids and Other | 41 |
Note 8 | Property, Plant and Equipment | 41 |
Note 9 | Other Assets | 41 |
Note 10 | Accounts Payable and Accrued Liabilities | 42 |
42 Note 11 | Long-Term Debt | 42 |
Note 12 | Employee Future Benefits | 44 |
Note 13 | Other Long-Term Obligations | 45 |
Note 14 | Other Income, Net | 45 |
Note 15 | Income Taxes | 45 |
Note 16 | Fair Value Measurement | 46 |
Note 17 | Financial Instruments | 47 |
Note 18 | Contingencies | 48 |
Note 19 | Comparative Figures | 48 |
1. BASIS OF PRESENTATION
The consolidated financial statements include the accounts of Catalyst Paper Corporation and, from their respective dates of acquisition of control or formation, its controlled subsidiaries and partnerships (collectively, the "company"). All inter-company transactions and amounts have been eliminated on consolidation.
The accompanying unaudited interim consolidated financial statements have been prepared in accordance with United States generally accepted accounting principles (U.S. GAAP), on a basis consistent with those followed in the December 31, 2015 audited annual consolidated financial statements. These unaudited interim consolidated financial statements do not include all information and note disclosures required by U.S. GAAP for annual financial statements, and, therefore, should be read in conjunction with the December 31, 2015 audited consolidated financial statements and the notes thereto. In the opinion of the company, the unaudited interim consolidated financial statements contained herein contain all the information and note disclosures necessary to fairly present the results of the interim periods included. The results for the periods included herein may not be indicative of the results for the entire year.
2. SEGMENTED INFORMATION
The company is the largest producer of mechanical printing papers in western North America. Our operating segments are:
Coated papers | – Manufacture and sale of coated free sheet, coated groundwood and one-sided specialty coated paper |
Uncoated papers | – Manufacture and sale of uncoated mechanical and directory printing papers |
Newsprint | – Manufacture and sale of newsprint |
Pulp | – Manufacture and sale of long-fibre Northern Bleached Softwood Kraft (NBSK) |
The company owns and operates five manufacturing facilities, three in the province of British Columbia (B.C.), Canada, one in Rumford, Maine, U.S. and one in Biron, Wisconsin, U.S. The primary market for the company's paper products is North America. The primary markets for the company's pulp products are Asia and Australasia.
3. SIGNIFICANT ACCOUNTING POLICIES
Recently implemented accounting changes
In April 2015, FASB updated standard No. 2015-03 Interest – Imputation of Interest (Subtopic 835-30) to simplify the presentation of debt issuance costs. The company has adopted the new standard in its financial statements for the annual period beginning on January 1, 2016. As a result the company has netted $3.0 million in deferred financing costs, which was previously disclosed in other assets, against long-term debt (December 31, 2015 - $3.6 million).
In February 2015, FASB updated standard No. 2015-02 – Consolidation (Topic 810) which affects reporting entities that are required to evaluate whether they should consolidate certain legal entities. The company has adopted the new standard in its financial statements for the annual period beginning on January 1, 2016. There was no material impact to the company's financials as a result of this adoption.
On January 7, 2015, the company's foreign subsidiary acquired the assets of the Biron and Rumford paper mills in Wisconsin and Maine, respectively. As a result, the company has a foreign subsidiary that is considered to be a distinct and separable operation that is integrated within its foreign jurisdiction, and accordingly, uses the U.S. dollar as its functional currency. Foreign exchange gains and losses arising from the translation of the foreign subsidiary's accounts into Canadian dollars (CDN$) are reported as a component of other comprehensive income (loss).
Changes in future accounting standards
In May 2014, FASB issued a new standard on revenue recognition ASC Topic 606 Revenue from Contracts with Customers. The company intends to adopt the new standard in its financial statements for the annual period beginning on January 1, 2018. The extent of the impact of adoption of the standard has not yet been determined.
In February 2016, FASB issued ASU 2016-02 Leases which, among other things, requires lessees to recognize most leases on-balance sheet. The company intends to adopt the new standard in its financial statements for the annual period beginning on January 1, 2019. The extent of the impact of adoption of the standard has not yet been determined.
In March 2016, FASB issued ASU 2016-09 Improvements to Employee Share-Based Payment Accounting, which is intended to improve the accounting for share-based payment transactions as part of the FASB's simplification initiative. The company intends to adopt the new standard in its financial statements for the annual period beginning on January 1, 2017. The extent of the impact of adoption of the standard has not yet been determined.
There were no other new pronouncements issued by the FASB that may materially impact the company's consolidated financial statements for future periods.
4. PURCHASE OF U.S. PAPER MILLS
On January 7, 2015, the company acquired, through a wholly owned subsidiary, the Biron paper mill located in Wisconsin, U.S. and the Rumford pulp and paper mill located in Maine, U.S. for consideration of $73.9 million (US$62.4 million). The acquisition was financed through advances under the company's ABL Facility, which was amended to increase the maximum amount of credit available thereunder from $175.0 million to $225.0 million. The company also completed a US$25.0 million offering of its PIK Toggle Senior Notes ("Offered Notes") thereby increasing the principal amount of its outstanding 2017 Notes to US$260.5 million. The Offered Notes were issued at a 20% discount to face value with the company receiving gross proceeds of US$20.0 million. The acquisition price of US$62.4 million is subject to potential adjustment based on the final statement of net working capital as of January 7, 2015 to be mutually agreed to between Catalyst Paper and Verso Corporation.
We account for this business combination using the acquisition method and the results of the Biron and Rumford mills have been included in the consolidated earnings of the company since its date of acquisition on January 7, 2015.
The final allocation to the assets acquired and liabilities assumed on the basis of their respective fair values as at January 7, 2015 is as follows:
| | | January 7, 2015 | |
Assets acquired: | | | |
| Accounts receivable | | $ | 56.1 | |
| Inventories | | | 80.8 | |
| Prepaids and other | | | 0.9 | |
| Property, plant and equipment | | | 91.7 | |
| Long-term assets | | | 0.2 | |
| | | | 229.7 | |
Liabilities assumed: | | | | |
| Accounts payable and accruals | | $ | 65.6 | |
| Long-term environmental remedial obligations | | | 4.6 | |
| Long-term employee future benefits | | | 10.0 | |
| Other long-term liabilities | | | 5.0 | |
| Deferred income tax liability | | | 26.7 | |
| | | | 111.9 | |
| Fair value of acquired net assets | | $ | 117.8 | |
| Consideration paid | | $ | 73.9 | |
The excess of the fair value assigned to the net assets acquired over the purchase price has been recognized in other income as a gain of $43.9 million. The company realized a gain on the asset purchase as it was a forced agreement. Verso Corporation sold the Biron and Rumford mills to comply with an antitrust settlement with the U.S. Department of Justice whereby the pending merger of Verso Corporation and NewPage was made conditional on the sale of the U.S. paper mills.
5. ACCOUNTS RECEIVABLE
The components of accounts receivable were as follows:
| | | March 31,
2016 | | | December 31,
2015 | |
| Trade receivables | | $ | 171.9 | | | $ | 170.9 | |
| Less: allowance for doubtful accounts | | | (4.6 | ) | | | (4.5 | ) |
| | | | 167.3 | | | | 166.4 | |
| Sales taxes receivable | | | 2.9 | | | | 5.6 | |
| Other receivables | | | 15.8 | | | | 13.1 | |
| | | $ | 186.0 | | | $ | 185.1 | |
6. INVENTORIES
The components of inventories were as follows:
| | | March 31,
2016 | | | December 31,
2015 | |
| Finished goods | | | | | | |
| Coated paper | | $ | 52.3 | | | $ | 53.9 | |
| Uncoated paper | | | 20.6 | | | | 19.2 | |
| Newsprint | | | 13.1 | | | | 12.4 | |
| Pulp | | | 1.3 | | | | 10.6 | |
| Total finished goods | | | 87.3 | | | | 96.1 | |
| Work-in-progress | | | 1.4 | | | | 2.3 | |
| Raw materials – wood chips, pulp logs and other | | | 54.5 | | | | 48.5 | |
| Operating and maintenance supplies and spare parts | | | 108.6 | | | | 109.3 | |
| | | $ | 251.8 | | | $ | 256.2 | |
At March 31, 2016, the company had applied write-downs of $2.9 million to finished goods inventory (December 31, 2015 – $1.1 million) and $1.6 million to raw materials inventory (December 31, 2015 – $0.6 million).
Inventories are pledged as collateral against the long-term debt of the company. See note 11, Long-term debt, for detailed disclosure of the collateral arrangements of the company.
7. PREPAIDS AND OTHER
The components of prepaids and other were as follows:
| | | March 31,
2016 | | | December 31,
2015 | |
| Property taxes, insurance and licenses | | $ | 1.8 | | | $ | 2.6 | |
| Derivative assets | | | 3.2 | | | | – | |
| Other | | | 2.9 | | | | 2.9 | |
| | | $ | 7.9 | | | $ | 5.5 | |
Prepaids and other assets are pledged as collateral against the long-term debt of the company. See note 11, Long-term debt, for detailed disclosure of the collateral arrangements of the company.
8. PROPERTY, PLANT AND EQUIPMENT
The components of property, plant and equipment were as follows:
| | | March 31,
2016 | | | December 31,
2015 | |
| Cost | | $ | 660.4 | | | $ | 663.1 | |
| Accumulated depreciation, amortization and impairment | | | 219.2 | | | | 206.2 | |
| Net book value | | $ | 441.2 | | | $ | 456.9 | |
Property, plant and equipment are pledged as collateral against the long-term debt of the company. See note 11, Long-term debt, for detailed disclosure of the collateral arrangements of the company.
We adjusted the estimated remaining economic life of certain assets as of December 31, 2015, based on a review of the physical condition and expected future operational and commercial lives of our major classes of assets. The estimated impact on annual depreciation from the adjustment is a $6.0 million reduction.
9. OTHER ASSETS
The components of other assets were as follows:
| | | March 31,
2016 | | | December 31,
2015 | |
| Deferred charges and other | | $ | 2.2 | | | $ | 1.6 | |
| Accrued benefit asset - pension plan (note 12) | | | 0.4 | | | | 0.4 | |
| | | $ | 2.6 | | | $ | 2.0 | |
Other assets are pledged as collateral against the long-term debt of the company. See note 11, Long-term debt, for detailed disclosure of the collateral arrangements of the company.
In April 2015, FASB updated standard No. 2015-03 Interest – Imputation of Interest (Subtopic 835-30) to simplify the presentation of debt issuance costs. The company has adopted the new standard in its financial statements for the annual period beginning on January 1, 2016. As a result the company has netted $3.0 million in deferred financing costs, which was previously disclosed in other assets, against long-term debt (December 31, 2015 - $3.6 million). Comparative figures have been reclassified accordingly.
10. ACCOUNTS PAYABLE AND ACCRUED LIABILITIES
The components of accounts payable and accrued liabilities are were follows:
| | | March 31,
2016 | | | December 31,
2015 | |
| Trade payables | | $ | 148.3 | | | $ | 156.2 | |
| Accrued payroll and related liabilities | | | 41.8 | | | | 43.5 | |
| Accrued interest | | | 16.0 | | | | 7.1 | |
| Accrued benefit obligation – pension plan (note 12) | | | 8.3 | | | | 8.3 | |
| Accrued benefit obligation – other employee future benefit plans (note 12) | | | 6.4 | | | | 6.4 | |
| Property taxes | | | 4.3 | | | | 0.9 | |
| Payables related to capital projects | | | 1.3 | | | | 1.6 | |
| Derivative liabilities | | ─ | | | | 4.5 | |
| Other | | | 12.1 | | | | 16.0 | |
| | | $ | 238.5 | | | $ | 244.5 | |
11. LONG-TERM DEBT
The components of long-term debt were as follows:
| | | March 31,
2016 | | | December 31,
2015 | |
| Term loan, due July 2017 | | $ | 15.5 | | | $ | 16.0 | |
Senior secured notes, 11.0% due October 2017 (US$260.5 million; December 31, 2015 – US$260.5 million) | | | 333.7 | | | | 355.6 | |
| | | | 349.2 | | | | 371.6 | |
Revolving asset based loan facility of up to $225.0 million (December 31,
2015 – $225.0 million) due July 2017 | | | 123.4 | | | | 115.1 | |
| Capital lease obligations | | | 7.2 | | | | 7.5 | |
| Total debt | | | 479.8 | | | | 494.2 | |
| Less: current portion | | | (3.2 | ) | | | (3.2 | ) |
| Total long-term debt | | $ | 476.6 | | | $ | 491.0 | |
2016
Significant changes to long-term debt in 2016
On May 9, 2016, the company amended its revolving asset based loan facility (ABL Facility). The amendment included an increase of the maximum revolving credit commitments by $25.0 million to $250.0 million. The ABL Facility lenders are CIBC as Administrative Agent, Wells Fargo Capital Finance Corporation of Canada, Export Development Canada and Bank of Montreal.
In April 2015, FASB updated standard No. 2015-03 Interest – Imputation of Interest (Subtopic 835-30) to simplify the presentation of debt issuance costs. The company has adopted the new standard in its financial statements for the annual period beginning on January 1, 2016. As a result the company has netted $3.0 million in deferred financing costs, which was previously disclosed in other assets, against long-term debt (December 31, 2015 - $3.6 million). Comparative figures have been reclassified accordingly.
2015
Significant changes to long-term debt in 2015
In September 2015, the company entered into six capital leases on equipment. The capital lease obligation with respect to these leases is $0.5 million as at December 31, 2015.
On January 7, 2015, the company amended the asset based loan facility (ABL Facility) to increase the maximum amount of credit available thereunder from $175.0 million to $225.0 million to finance the acquisition of the Biron paper mill and the Rumford pulp and paper mill. The company also completed an offering of US$25.0 million of PIK Toggle Senior Secured Notes ("Offered Notes") due 2017. The Offered Notes were issued at a 20% discount to face value with the company receiving gross proceeds of US$20.0 million to be used to finance part of the costs associated with the acquisition. See note 4, Purchase of U.S. Paper Mills.
Significant terms, conditions and covenants
The indentures governing the company's Term Loan and PIK Toggle Senior Secured Notes due October 2017 ("2017 Notes") contain customary restrictive covenants, including restrictions on incurring additional indebtedness, certain restricted payments, including dividends and investments in other persons, the creation of liens, sale and leaseback transactions, certain amalgamations, mergers, consolidations and the use of proceeds arising from certain sales of assets and certain transactions with affiliates.
The Term Loan is secured by a first charge on substantially all of the fixed assets and real property of the company that ranks senior to the lien securing the 2017 Notes. The Term Loan is also secured by a second charge over the company's current assets. Collateral provided on the 2017 Notes consists of a charge on substantially all of the assets of the company, other than (i) a senior collateral charge on the Term Loan, and (ii) the ABL Charge Collateral, as described below (2017 Notes Charge Collateral), and a charge on the senior collateral charge on the Term Loan and the ABL Charge Collateral. The indentures governing the Term Loan and 2017 Notes limit the ability of the company to incur debt, other than permitted debt, while the company's fixed charge coverage ratio is below 2.0:1.0 for the 2017 Notes and is at or below 1.0:1.0 for the Term Loan. The company's fixed charge coverage ratio under the 2017 Notes, calculated on a 12-month trailing average, was 0.9:1.0 at March 31, 2016 (December 31, 2015 – 0.9:1.0) and under the Term Loan was 0.5:1.0 at March 31, 2016 (December 31, 2015 – 0.5:1.0).
The company cannot make any restricted payments including paying any dividends, except to the extent the balance in its restricted payments basket is positive. The restricted payments basket under the 2017 Notes was negative $116.5 million as at March 31, 2016 (December 31, 2015 – $107.1 million).
The security for the ABL Facility consists of a charge on accounts receivable, inventory and cash of the company (ABL Charge Collateral) and a charge on the 2017 Notes Charge Collateral. The interest rate on the ABL Facility is determined by the current market rate for that type of loan in addition to a spread that is based on the average availability for the prior fiscal quarter. Availability under the ABL Facility is determined by a borrowing base calculated primarily on eligible accounts receivable and eligible inventory, less certain reserves. The borrowing base at March 31, 2016, is reduced by reserves for a landlord waiver reserve in respect of rent of approximately $2.8 million, a pension reserve not exceeding the sum of normal cost pension contributions, special and catch-up payments and any other payments in respect of a Canadian pension plan that are past due of approximately $1.4 million, a reserve for credit insurance deductibles of $3.2 million, a reserve of $1.5 million for employee source deductions and a reserve of $0.3 million for workers' compensation costs. On March 31, 2016 the company had $75.6 million available under the ABL Facility after deducting outstanding drawings of $125.0 million and outstanding letters of credit of $24.4 million, before potential application of the springing fixed charge coverage ratio.
The company was in compliance with its covenants under the ABL Facility, the Term Loan and under each of the indentures governing its outstanding senior notes on March 31, 2016.
The company's long-term debt is recorded at amortized cost. The following table provides information about management's best estimate of the fair value of the company's debt:
| | March 31, 2016 | | December 31, 2015 | |
| | Carrying
Value | | Fair
Value | | Carrying
Value | | Fair
Value | |
| Total debt | | $ | 479.8 | | | $ | 386.4 | | | $ | 494.2 | | | $ | 416.0 | |
The fair value of the company's long-term debt related to its senior notes is determined based on quoted market prices (level 1 fair value measurement). The fair value of the company's debt related to the ABL Facility is measured by discounting the respective cash flows at quoted market rates for similar debt having the same maturity (level 2 fair value measurements). In measuring fair value, the company incorporates credit valuation adjustments to reflect its own non-performance risk, where applicable.
12. EMPLOYEE FUTURE BENEFITS
The company maintains pension benefit plans for all salaried employees, which include defined benefit and defined contribution segments. Employees hired subsequent to January 1, 1994 enroll in the defined contribution segment. Effective January 1, 2010, employees in the defined benefit plan ceased to accrue benefits under the defined benefit segment of the plan and began to participate in the defined contribution segment of the plan. The company also maintains pension benefits for former hourly employees that are not covered by union pension plans. Unionized employees of the company are members of multi-employer industry-wide pension plans to which the company contributes a predetermined amount per hour worked by an employee.
The company provides other benefit plans consisting of provincial medical plan premiums, extended health care and dental benefits to employees. A description of changes to pension and other benefit plans can be found on pages 95 to 102 of the company's 2015 Annual Report.
Employees hired pursuant to the purchase of the U.S. mills (note 4, Purchase of US Paper Mills) continue to be covered under the employee future benefit plans that existed prior to acquisition. Pension plans include defined benefit and defined contribution segments. The defined benefit plan is available to hourly employees hired before 2013. The defined contribution segment consists of a 401k plan and a profit share plan and is available to salaried and hourly employees.
For the three months ended March 31, 2016, the company incurred total post-retirement benefit costs of $7.0 million (three months ended March 31, 2015 – $8.0 million).
For the three months ended March 31, 2016, the company contributed $9.7 million (three months ended March 31, 2015 - $9.2 million) for employee future benefits which included cash contributed to the company's funded pension plans, cash payments directly to beneficiaries for its unfunded benefit plans, cash contributions to its defined contribution plans and cash contributed to its multi-employer industry-wide pension plans.
Components of net periodic benefit cost recognized in the period were as follows:
| | | Three months
ended March 31, | |
| Pension benefit plans | | 2016 | | | 2015 | |
| Defined benefit plan | | | | | | |
| Service cost for the period | | $ | 1.2 | | | $ | 1.2 | |
| Interest cost | | | 2.3 | | | | 3.1 | |
| Expected return on assets | | | (3.5 | ) | | | (3.2 | ) |
| | | | – | | | | 1.1 | |
| Defined contribution plan | | | | | | | | |
| Service cost for the period | | | 2.7 | | | | 2.5 | |
Multi-employer industry-wide pension plan service
cost for the period | | | 2.3 | | | | 2.1 | |
| Net periodic benefit cost for pension benefit plans | | $ | 5.0 | | | $ | 5.7 | |
| | Three months
ended March 31, | |
| Other post-retirement benefit plans | 2016 | | 2015 | |
| Service cost for the period | | $ | 0.6 | | | $ | 0.6 | |
| Interest cost | | | 1.4 | | | | 1.7 | |
| Net periodic benefit cost for other benefit plans | | $ | 2.0 | | | $ | 2.3 | |
Effective January 1, 2016, the company elected to refine the approach for determining the service cost and interest cost components of the net defined benefit cost that will be recognized on pension and other post-retirement benefit programs. Historically, the company had estimated the service and interest cost components by applying a single weighted-average discount rate derived from the yield curve used to measure the benefit obligation at the beginning of the period. The company has elected to utilize a full yield curve approach to estimate these components by applying specific spot rates along the yield curve used in the determination of the benefit obligation to the relevant projected cash flows. The company made this change to improve the correlation between projected benefit cash flows and the corresponding yield curve spot rates and to provide a more precise measurement of interest costs. This change does not affect the measurement of total benefit obligations as the change in interest cost is completely offset in the actuarial loss reported in the period. The company has accounted for this change as a change in estimates and, accordingly, has accounted for it prospectively beginning in the first quarter of 2016. Based on current economic conditions, we estimate the service cost and interest cost for those plans will be reduced by approximately $3.8 million in 2016 as a result of the change.
13. OTHER LONG-TERM OBLIGATIONS
The components of other long-term obligations were as follows:
| | | March 31,
2016 | | | December 31,
2015 | |
| Environmental and remedial | | $ | 10.0 | | | $ | 10.7 | |
| Snowflake union pension liability | | | 9.1 | | | | 9.9 | |
| Accrued workers' compensation costs | | | 4.3 | | | | 4.6 | |
| Other | | | 0.4 | | | | 1.2 | |
| | | $ | 23.8 | | | $ | 26.4 | |
14. OTHER INCOME, NET
The components of other income, net were as follows:
| | | Three months
ended March 31, | |
| | | 2016 | | | 2015 | |
| Gain (loss) on derivative financial instruments | | $ | 6.2 | | | $ | (8.0 | ) |
| Foreign exchange gain (loss) on working capital balances | | | (2.3 | ) | | | 5.9 | |
| Bargain purchase gain on acquisition of Biron and Rumford mills, net of tax (note 4) | | ─ | | | | 39.3 | |
| Other | | | (0.2 | ) | | | (0.1 | ) |
| | | $ | 3.7 | | | $ | 37.1 | |
15. INCOME TAXES
As at March 31, 2016, the company has a valuation allowance on its deferred tax assets of $263.7 million (December 31, 2015 - $262.2 million). The effective rate for the quarter ended March 31, 2016 was 0% which was impacted by the recognition of a valuation allowance on deferred tax assets. A description of the company's income taxes can be found on pages 103 to 105 of the company's 2015 Annual Report.
16. FAIR VALUE MEASUREMENT
An established fair value hierarchy requires the company to maximize the use of observable inputs and minimize the use of unobservable inputs when measuring fair value. A financial instrument's categorization within the fair value hierarchy is based upon the lowest level of input that is available and significant to the fair value measurement. There are three levels of inputs that may be used to measure fair value.
Level 1
Quoted prices in active markets for identical assets or liabilities.
Level 2
Observable inputs other than quoted prices in active markets for identical assets and liabilities, such as quoted prices for identical or similar assets or liabilities in markets that are not active, or other inputs that are observable or can be corroborated by observable market data for substantially the full term of the assets or liabilities.
Level 3
Inputs that are generally unobservable and are supported by little or no market activity and that are significant to the fair value determination of the assets or liabilities.
The following table presents information about the fair value of the company's derivative financial instruments measured at fair value on a recurring basis:
| | March 31, 2016 | | December 31, 2015 | | Fair value hierarchy | | Balance sheet
classification |
Assets Currency contracts | $ | 3.2 | | $ | ─ | | 2 (1) | | Prepaids and other |
Liabilities | | | | | | | | | |
Currency contracts | $ | ─ | | $ | 4.5 | | 2 (1) | | Accounts payable and accrued liabilities |
Fair value of the company's derivatives are classified under Level 2 as they are measured as follows:
| (1) | The fair value of forward currency contracts is measured using the discounted difference between contractual rates and market future rates. Interest rates, forward market rates, and volatility are used as inputs for such valuation techniques. The company incorporates credit valuation adjustments to appropriately reflect both its own non-performance risk and the counterparty's non-performance risk in the fair value measurements. |
The fair value of the company's long-term debt and level within the fair value hierarchy is disclosed in note 11.
The following table presents information about the effects of the company's derivative financial instruments not designated as hedging instruments on the company's consolidated financial statements for the three months ended March 31:
| | March 31, 2016 | | March 31, 2015 | | Classification on statements of earnings (loss) |
Currency contracts related to revenue hedges (note 14) | $ | 6.2 | | $ | (8.0) | | Other income, net |
The carrying value of the company's other financial instruments, namely cash and cash equivalents, accounts receivable, accounts payable and accrued liabilities approximate their fair values because of the short-term maturity of these instruments.
17. FINANCIAL INSTRUMENTS
| (a) | Financial Risk Management |
Financial instruments of the company consist primarily of cash and cash equivalents, accounts receivable, accounts payable and accrued liabilities and long-term debt. Financial instruments of the company also include derivatives which the company uses to reduce its exposure to currency and price risk associated with its revenues, energy costs and long-term debt.
The company has exposure to risk from its financial instruments, specifically credit risk, market risk (including currency, price and interest rate risk) and liquidity risk. A summary of the company's financial risk management objectives can be found on page 110 to 113 of the company's 2015 Annual Report.
The company is exposed to credit risk on accounts receivable from its customers who are mainly in the newspaper publishing, commercial printing businesses and paper manufacturing businesses. Aging of receivables were as follows:
| | | March 31,
2016 | | | December 31,
2015 | |
Trade receivables | | | | | | |
Current | | $ | 154.5 | | | $ | 149.4 | |
Past due 1-30 days | | | 7.4 | | | | 14.0 | |
Past due 31-90 days | | | 6.6 | | | | 3.5 | |
Past due over 90 days | | | 3.4 | | | | 4.0 | |
| | | | 171.9 | | | | 170.9 | |
Allowance for doubtful accounts | | | (4.6 | ) | | | (4.5 | ) |
Trade receivables, net | | | 167.3 | | | | 166.4 | |
Other receivables, including sales tax recoverables | | | 18.7 | | | | 18.7 | |
Accounts receivable (note 5) | | $ | 186.0 | | | $ | 185.1 | |
The movement in the allowance for doubtful accounts in respect of trade receivables was as follows:
| | | March 31,
2016 | | | December 31,
2015 | |
Balance, beginning of period | | $ | 4.5 | | | $ | 2.3 | |
Increase in provision | | | 0.1 | | | | 2.2 | |
Balance, end of period | | $ | 4.6 | | | $ | 4.5 | |
| (b) | Revenue Risk Management Instruments |
Foreign currency options and forward contracts outstanding to sell U.S. dollars were as follows:
| | Options |
| | Purchased US$ put | | Sold US$ call |
Term | Notional amount | | Average rate
US$/CDN$ | | Notional amount | Average rate
US$/CDN$ |
As at March 31, 2016 | | | | | | | |
0 to 9 months | $ | 112.5 | | 0.7689 | | $ | 112.5 | 0.7066 |
At period-end exchange rates, the net amount the company would receive to settle the above contracts and options is $3.2 million (December 31, 2015 – negative $4.5 million). At March 31, 2016, purchased U.S. dollar put options and sold US dollar call options are marked to market, and the related gains and losses are recognized in other income.
At March 31, 2016 and December 31, 2015, the company did not have any commodity swap agreements or commodity options outstanding.
18. CONTINGENCIES
Two Lawsuits Filed by Halalt First Nation
On January 22, 2016, Catalyst Paper was served with two Notices of Civil Claim by the Halalt First Nation and its business partners. The company intends to vigorously defend itself against both claims. The first claim, filed jointly by the Halalt, Sunvault Energy Inc. and Aboriginal Power Corp. alleges that the company disclosed certain confidential information pertaining to a proposed anaerobic digester facility in breach of a confidentiality agreement. The plaintiffs are seeking, among other things, approximately $100 million in damages from Catalyst in connection with the alleged breach of contract and a permanent injunction restraining Catalyst Paper from constructing, owning or operating an anaerobic digester facility. The second claim, filed by the Halalt and its members, alleges that the company illegally trespassed on, and caused damages to, the Halalt's asserted territories and fisheries resources through the operation of its Crofton Mill since 1957. The Halalt is seeking an interim and permanent injunction restraining the company from conducting its operations at the Crofton Mill and are also seeking approximately $2 billion in damages. Catalyst filed a Response to Civil Claim in respect of the first claim on April 29, 2016 and filed a Response to Civil Claim in respect of the second claim on May 6, 2016.
Appeal of Sales Tax Ruling
On October 21, 2015, Catalyst sought leave to appeal at the Supreme Court of Canada the judgment of the BC Court of Appeal made February 4, 2015 with respect to Catalyst's action against the Province of British Columbia involving a reassessment of the amount of sales tax payable under the Social Services Tax Act on electricity purchased from Powell River Energy Inc. in 2001 through 2010. On April 14, 2016, the Supreme Court of Canada released its decision dismissing the leave to appeal.
19. COMPARATIVE FIGURES
Certain comparative figures presented in the interim consolidated financial statements have been reclassified to conform to the current period presentation.