CATALYST PAPER CORPORATION
MANAGEMENT’S DISCUSSION AND ANALYSIS
MANAGEMENT’S DISCUSSION AND ANALYSIS
The following management discussion and analysis (“MD&A”) should be read in conjunction with the consolidated financial statements for the years ended December 31, 2006, 2005, and 2004, and the notes thereto.
Throughout the discussion, reference is made to EBITDA, which represents earnings before interest, taxes, depreciation and amortization, and before other non-operating income and expenses. EBITDA, as defined, equates to operating earnings (loss) plus amortization. Canadian Generally Accepted Accounting Principles (“GAAP”) do not define a method of calculating EBITDA, therefore the measure as calculated by Catalyst Paper Corporation (“the Company”) might not be comparable to similarly titled measures reported by other entities. EBITDA is presented because the Company believes it is a useful indicator of a company’s operational performance, and subsequently, a company’s ability to meet debt service and capital expenditure requirements. EBITDA should not be considered by an investor as an alternative to net earnings, an indicator of the financial performance of the Company, or an alternative to cash flows as a measure of liquidity. Refer to the “Non-GAAP Measures” section for a reconciliation of this non-GAAP measure to net earnings (loss).
In accordance with industry practice, the term “ton” or the symbol “ST” in this MD&A refers to a short ton, which is an imperial unit of measurement equal to 0.9072 metric tonnes, and the term “tonne” or the symbol “MT” refers to a metric tonne.
In this MD&A, unless otherwise indicated, all dollar amounts are expressed in Canadian dollars. The term “dollars” and the symbols “$” and “CDN$” refer to Canadian dollars. The term “U.S. dollars” and the symbol “US$” refer to United States dollars.
The information in this report is as at February 13, 2007. Disclosure contained in this document is current to that date, unless otherwise stated.
CAUTIONARY STATEMENT REGARDING FORWARD-LOOKING STATEMENTS
This MD&A contains forward-looking statements. Forward-looking statements are statements, other than statements of historical fact, that address or discuss activities, events or developments that the Company expects or anticipates may occur in the future. These forward-looking statements can be identified by the use of words such as “anticipate”, “could”, “expect”, “seek”, “may”, “likely”, “intend”, “will”, “believe” and similar expressions or the negative thereof. These forward-looking statements reflect management’s current views and are based on certain assumptions including assumptions as to future economic conditions and courses of action, as well as other factors management believes are appropriate in the circumstances. Such forward-looking statements are subject to risks and uncertainties and no assurance can be given that any of the events anticipated by such statements will occur or, if they do occur, what benefit the Company will derive from them. A number of factors could cause actual results, performance or developments to differ materially from those expressed or implied by such forward-looking statements, including the general economic conditions in the United States (“U.S.”), Canada and internationally, market conditions and demand for the Company’s products, the outlook for inventories, production and pricing, the Company’s ability to successfully obtain performance improvements and cost savings, expected cash flows, capital expenditures and completion of capital projects, shifts in industry capacity, fluctuations in foreign exchange and interest rates, fluctuations in availability and cost of raw materials or energy, the Company’s ability to obtain financing and other factors beyond the Company’s control. Additional information concerning these and other factors can be found in section 13 of this MD&A under the heading "Risks and Uncertainties". The Company disclaims any intention or obligation to update or revise any forward-looking statements, whether as a result of new information, future events or otherwise.
Investors are cautioned not to place undue reliance on these forward-looking statements. No forward-looking statement is a guarantee of future results.
| | | Page | | | | Page |
| | 4 | | | | 36 |
| | | 4 | | | | 36 |
| | | 7 | | | | 37 |
| | | 10 | | | | 37 |
| | | 11 | | | | 37 39 |
| | | 13 | | | | |
| | | 18 | | | | 40 |
| | | | | | | |
| | 21 | | | | 41 |
| | | 21 | | | | 41 |
| | | 21 | | | | 41 |
| | | 22 | | | | |
| | | 23 | | | | 42 |
| | | 23 | | | | |
| | | 24 | | | | 43 |
| | | 24 | | | | |
| | | 25 | | | | 43 |
| | | 25 | | | | 44 |
| | | 26 | | | | 44 |
| | | 26 | | | | 46 |
| | | 27 | | | | |
| | | 28 | | | accounts | 47 |
| | | 28 | | | | 47 |
| | | 28 | | | | |
| | | | | | | 48 |
| | 30 | | | | |
| | | | | | | |
| | | | | | affecting future periods | 48 |
| | | 31 | | | | |
| | | 31 | | | | 49 49 |
| | | | | | | 50 |
| | - specialty papers | 31 | | | | 50 |
| | | | | | | 50 |
| | - newsprint | 32 | | | | 51 |
| | | | | | | 51 |
| | - pulp | 32 | | | | 52 |
| | 2006 compared to three months | | | | | 53 54 |
| | ended December 31, 2005 | 33 | | | | 54 |
| | | | | | | 54 |
| | operations | 33 | | | | 54 |
| | - specialty papers | 33 | | | | 55 |
| | | | | | | |
| | - newsprint | 34 | | | | 56 |
| | | | | | | |
| | - pulp | 34 | | | | |
| | | | | | financial reporting | 57 |
| | 35 | | | | |
| | | | | | | 58 |
1.0 | CORPORATE OVERVIEW AND HIGHLIGHTS |
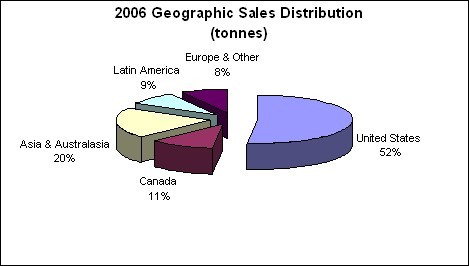
| | The Company is the fourth largest North America-based producer of newsprint and uncoated mechanical groundwood specialty papers, measured by production capacity. It is also the largest producer of coated and uncoated specialty papers and newsprint and the only producer of lightweight coated paper on the West Coast of North America. The Company is the largest producer of directory paper in the world by capacity and operates the largest paper recycling operation in Western Canada. It also has a significant presence in most major international markets, serving customers around the world. The 2006 geographic sales distribution can be found at the end of this section. |
The Company’s business includes printing papers and market pulp, operating in three business segments:
| | The specialty papers segment consists of soft-calendered (“SC”) and machine-finished (“MF”) hi-brite uncoated, lightweight coated (“LWC”) and directory paper grades. These groundwood specialty paper grades are manufactured on 101 paper machines in British Columbia at Crofton, Elk Falls, Port Alberni and Powell River. The specialty papers business segment has a total production capacity of 1,100,000 tonnes. |
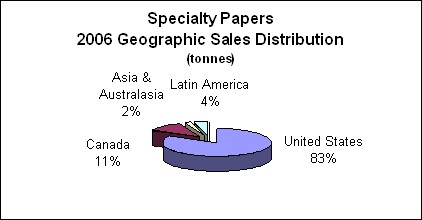
| | Specialty paper represents the Company’s largest business segment, generating approximately 49% of 2006 consolidated sales revenue. The Company’s customer base consists primarily of retailers, magazine and catalogue publishers, commercial printers and telephone directory publishers. Specialty paper products are sold primarily through the Company’s sales and marketing personnel in North America, and through distributors and agents in other geographic markets. In 2006, approximately 94% of specialty paper sales volumes were with customers in North America. Specialty papers are shipped by ship, barge, rail or truck or by a combination of some or all of these transportation modes. |
Newsprint
| | Newsprint is currently produced on five1 paper machines at Crofton, Elk Falls and Powell River. The newsprint segment has a total annual production capacity of 617,000 tonnes. During the first quarter (“Q1”) of 2006, the Company permanently closed its Port Alberni No. 3 (“A3”) paper machine, representing 140,000 tonnes of equivalent newsprint production capacity. |
| 1 | The Company has 11 paper machines. The number of machines noted in the segments above reflects the ability of the Company’s machines to switch between newsprint and specialty paper grades. |
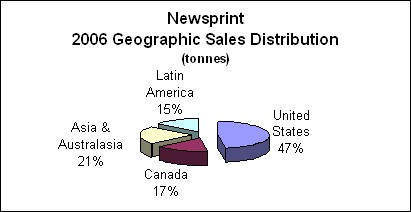
| | Newsprint sales represented approximately 28% of 2006 consolidated sales revenue. The newsprint customer base consists primarily of newsprint publishers located in Western and Central North America and in Asia. In 2006, approximately 85% of newsprint sales volumes were with customers in North America and Asia. Newsprint is shipped overseas by deep-sea vessel and inland by ship, barge, rail or truck or a combination of some or all of these modes. |
| | The pulp segment includes sawdust-based pulp and containerboard (formerly referred to as “kraft paper”) manufactured at the Elk Falls mill, and northern bleached softwood kraft (“NBSK”) pulp manufactured at the Crofton mill. The segment has a total market production capacity of 638,000 tonnes. |
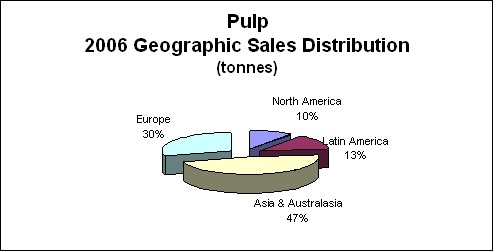
| | Pulp and containerboard sales represented approximately 23% of 2006 consolidated sales revenue. The pulp customer base is located primarily in Asia and Europe and includes producers of tissue, magazine papers, woodfree printing and writing papers and certain specialty paper products. The containerboard customer base consists primarily of corrugated box manufacturers. Pulp and containerboard products are sold primarily through sales and marketing personnel in Canada, and through a network of agents in locations throughout the world. In 2006, approximately 77% of pulp and containerboard sales volumes were with customers in Europe, Asia and Australasia. The Crofton and Elk Falls pulp mills are located on tidewater and have deep-sea vessel loading facilities. Pulp and containerboard are shipped by both break-bulk and container deep-sea vessels. |
| | The Company also has the largest paper recycling operation in Western Canada. Operated in support of its business segments, the recycling facility has a production capacity of 148,000 air-dried equivalent tonnes of pulp per year, the majority of which is consumed internally. After a project planned for mid-2007 is completed, this facility will increase production capacity to 160,000 air-dried equivalent tonnes of pulp per year. |
The chart below illustrates the Company’s principal paper and pulp products, applications, and annual 2007 capacity.
PRODUCT PROFILE |
| | Specialty paper grades | Newsprint | Pulp |
Category | Uncoated papers | Coated paper | Directory | Newsprint | Containerboard | Market pulp |
Soft-calendered | Machine-finished | | | | | |
Brand names | Electrasoft Electracal Electraprime | Electrabrite Electrastar | Electracote | Catalyst | Marathon | Silverliner Platinumliner Chromiumliner Bronzeliner | Elk Prime Crofton Kraft |
Basis weight (g/m2) | 36.6 - 52 | 45 - 66.5 | 44.4 - 63.6 | 28 - 40 | 43 - 48.8 | 127 - 270 | n/a |
Applications | Magazines, Supplements, Catalogues, Inserts, Flyers, Directories | Magazines, Supplements, Inserts, Flyers, Direct mail, PR and corporate communication books/manuals | Magazines, Catalogues, Inserts, Flyers, Direct mail | Telephone books, Airline schedules, Catalogues | Newspapers, Inserts, Flyers, Supplements, Directories, Timetables | Packaging applications | Tissue, Freesheet, Specialty papers, White-top linerboard |
Capacity (tonnes) | 531,0001 | 231,000 | 338,0001 | 617,0001 | 127,000 | 511,0002 |
% of total capacity | 23% | 10% | 14% | 26% | 5% | 22% |
| | 1 | Capacities expressed in the above table can vary as the Company is able to switch production between products, particularly newsprint, directory and machine-finished uncoated grades. |
| | The Company’s products are sold on five continents. The North American market, which accounts for 63% of sales, continues to be the Company’s principal market, followed by Asia and Australasia, Europe and Latin America. The consolidated sales volume distribution for 2006 was as follows: |
| | The Company delivered improved operational performance in 2006, recording operating earnings of $3.9 million despite the strength of the Canadian dollar against the U.S. dollar. This compares to an operating loss of $25.1 million in 2005. |
| | The Company improved operational performance in 2006 by focusing on machine efficiency, asset care, product quality and sharing cross-mill best practices. By making high-return investments through its Performance Improvement Program, the Company improved asset efficiency, which resulted in a significant increase in the Company’s production volume, and an overall improvement in machine efficiency of 3%, compared to 2005. Tight supply chain management and optimizing the mix of major inputs also helped control costs. |
| | The steady U.S. economy, particularly retail sales, resulted in higher prices for most paper products. The Company’s improved operating results in 2006 were also supported both by strong pulp prices, which hit their highest level since 1995, and reduced pulp costs. The Company’s performance improvement initiatives exceeded expectations, but rising fibre prices and the strong Canadian dollar kept the Company from delivering a better financial performance in 2006. |
| | In 2006, the Company and the industry in which it operates continued to experience an environment of rising input costs, most notably increasing energy and fibre costs. The Company benefits from relatively low fibre and electricity costs due to the location of its production facilities. In addition, the Company’s ability to use lower-priced energy alternatives helps mitigate rising prices. Nonetheless, the Company’s fibre costs increased late in the year due to regional supply limitations and their impact on market prices. Fibre supplies were constrained by curtailed sawmill activity and harsh West Coast weather conditions throughout the year. |
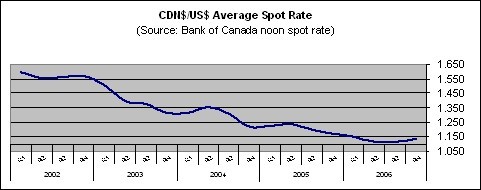
| | The majority of the Company’s sales are denominated in U.S. dollars. As a result, the strengthening Canadian dollar had a significant negative impact on the Company’s earnings for the fourth consecutive year. The average spot rate for 2006 was CDN$1.134 compared to CDN$1.212 for 2005 and CDN$1.302 for 2004. The “Sensitivity Analysis” section provides further details on the Company’s sensitivity to fluctuations in foreign exchange. |
| | The chart below illustrates the movement of the CDN$/US$ spot rate over the past five years. |
| | The Company’s 2006 Performance Improvement Program exceeded its goal of $70 million by 6% realizing $74 million in year-over-year EBITDA improvements. A discussion of the 2006 Performance Improvement Program’s results is provided under “Progress on 2006 Strategic Initiatives” in the “Strategy” section. |
| | Market conditions for the Company’s products were mixed in 2006, despite the positive effect of the steady U.S. economy. |
| | Coated mechanical demand was essentially flat for the year due to weak magazine and catalogue demand. Coated mechanical demand strengthened in the second half of the year, but only enough to offset the weakness in the first half of 2006. Flat demand and high mill inventories led to weak LWC prices for most of the year. The average LWC benchmark price decreased 1.3% in 2006, compared to 2005. |
| | Uncoated mechanical demand remained stable for most grades in 2006. Demand for high-gloss grades was down due to grade switching resulting from supply disruptions. Pricing remained firm during the year, increasing at the beginning of the third quarter (“Q3”) of 2006 before falling slightly at the end of the year. Overall, the average soft-calendered A grade (“SC-A”) benchmark price increased 2.5% over the previous year. |
| | Directory demand was strong in 2006 due to the increase in large publisher and independent books printed. The average benchmark price was up 6.8% over 2005. |
| | Newsprint demand and U.S. consumption were weak during 2006, but benchmark prices were up due to cost pressures and the strong Canadian dollar. The average newsprint benchmark price increased 8.2% over 2005, but decreased 1.4% in the fourth quarter (“Q4”) of 2006 from the preceding quarter. |
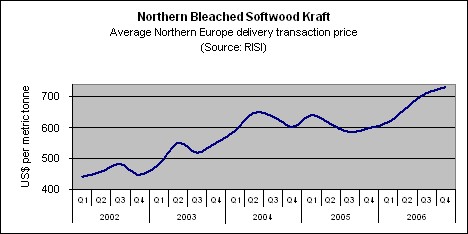
| | Pulp demand was strong and NBSK supply continued to decline because of the closure of several uncompetitive North American mills. The combination of strong demand and tight supply resulted in prices increasing to their highest level since 1995. The average Northern Europe benchmark price in 2006 increased 11.6% over 2005, and increased 2.8% in Q4, 2006 over the preceding quarter. |
| | Containerboard demand was steady in 2006 because of strong U.S. box shipments, which were driven by steady demand for non-durable goods and processed foods, and low mill and box inventories in the first half of 2006. The steady demand led to the average white-top linerboard benchmark price increasing 10.7% in 2006, compared to 2005. |
| | Effective February 16, 2006, Norske Skogindustrier ASA (“Norske Skog”) sold its 29.4% shareholding in the Company. Concurrently, the three directors from Norske Skog resigned from the Company’s board of directors. Norske Skog had not been involved in the management of the Company since 2001, and the shareholder transaction has not affected the Company’s operations or its current distribution agreement with Norske Skog in Asia. The Company did not receive any proceeds related to this transaction. |
| | During Q1, 2006, the Company permanently closed its Port Alberni A3 paper machine, which had been indefinitely idled since February 2005. The permanent closure has been assumed to be effective January 1, 2006, and accordingly, 140,000 tonnes of previously idled equivalent newsprint capacity has been removed from the Company’s total capacity. The permanent closure resulted in a $19.1 million impairment loss in 2006, of which $1.5 million was recorded in Q4 upon completion of a detailed review of the assets. The impairment losses were recorded in the newsprint segment in amortization expense. |
| | During Q3, 2006, the Company announced the temporary idling of its Port Alberni groundwood pulp mill, effective September 30, 2006, and the replacement of high-cost groundwood pulp with recycled fibre. In Q4, 2006, the Company determined that this closure was permanent due to the successful transition to recycled fibre and wrote off approximately $0.8 million of ancillary assets to cost of sales in the specialty segment in Q4. |
The Company also recorded an additional $4.3 million of impairment losses in Q4 on assets that had been previously idled because the Company determined that these assets would not be brought back into service. The impairment losses were recorded in amortization expense, $0.5 million in the specialty segment and $3.8 million in the pulp segment, respectively. More details on these impairment losses are provided in the “Critical Accounting Policies and Estimates” section.
| | On October 23, 2006, Third Avenue Management, LLC (“TAM”) increased its holdings in the Company on behalf of certain client accounts to 37.97%. On December 1, 2006, the Company appointed four new directors to its board of directors at TAM’s request and accepted the resignations of two directors. |
| | On January 15, 2007, the Company’s board of directors accepted the resignations of President and Chief Executive Officer Russell J. Horner and Vice-President, Finance and Chief Financial Officer Ralph Leverton, both of whom elected to exercise their rights under change-of-control agreements. |
| Ø | Realized a $74 million improvement in year-over-year EBITDA as a result of the Company’s 2006 Performance Improvement Program. |
| Ø | Achieved significant improvements in production levels, compared to 2005, by increasing machine speed and efficiency, focusing on asset reliability and product quality and sharing best practices across mills. |
| Ø | Set sales volume records for pulp, containerboard, and total pulp and paper (500,900 tonnes, 125,300 tonnes and 2,315,500 tonnes, respectively). |
| Ø | Achieved highest EBITDA since 2000. |
| Ø | Reduced the use of high-cost kraft pulp in paper production to the lowest level in the Company’s history in 2005 and sustained low kraft levels in 2006. |
| Ø | Formed a joint venture company with the Tla’Amin First Nation and the City of Powell River to allow its partners to develop surplus mill land around the Company’s Powell River Division. |
| Ø | Registered Crofton paper and pulp mill to the PricewaterhouseCoopers (“PwC”) certified chain-of-custody standard, the last of the Company’s mills to be registered, and achieved Forest Stewardship Council chain-of-custody certification for the de-inked pulp produced by the Paper Recycling Division. |
| Ø | Received third-party recognition through the BC Export Award in the primary products and resources category and selected as a finalist for the 2006 Metafore Innovation Award for developing the Electraprime and Electrastar grades. |
| Ø | Received social responsibility recognition as recipient of the Ethics in Action Award for environmental excellence and as one of 25 companies for greenhouse gas reductions in the Carbon Disclosure Project - Canada 280 Report. |
| Ø | Received the Canadian Institute of Chartered Accountants Award of Excellence for Corporate Reporting in the forestry products category, and ranked 50th out of more than 200 companies in the Globe and Mail newspaper’s Report on Business corporate governance rankings, up from 89th in 2005. |
| | 1.4 | Selected annual financial information |
(In millions of dollars, except where otherwise stated) | |
| | | 2006 | | 2005 | | 2004 | |
| Sales | | $ | 1,882.5 | | $ | 1,823.9 | | $ | 1,878.2 | |
| Operating earnings (loss) | | | 3.9 | | | (25.1 | ) | | (31.3 | ) |
EBITDA1 | | | 211.0 | | | 155.2 | | | 152.8 | |
| Net earnings (loss) | | | (15.9 | ) | | (25.6 | ) | | (28.6 | ) |
EBITDA margin1,2 | | | 11.2 | % | | 8.5 | % | | 8.1 | % |
| Net earnings (loss) per share (in dollars) - basic and diluted | | $ | (0.07 | ) | $ | (0.12 | ) | $ | (0.13 | ) |
| Total assets | | | 2,637.7 | | | 2,695.9 | | | 2,745.9 | |
| Total long-term liabilities | | | 1,338.6 | | | 1,396.8 | | | 1,417.6 | |
Sales (000 tonnes)3 | | | | | | | | | | |
Specialty papers | | | 990.2 | | | 942.9 | | | 993.7 | |
Newsprint | | | 699.1 | | | 707.1 | | | 754.7 | |
Total paper | | | 1,689.3 | | | 1,650.0 | | | 1,748.4 | |
Pulp | | | 626.2 | | | 603.0 | | | 527.3 | |
Total sales | | | 2,315.5 | | | 2,253.0 | | | 2,275.7 | |
Production (000 tonnes) 3 | | | | | | | | | | |
Specialty papers | | | 983.7 | | | 949.3 | | | 1,000.0 | |
Newsprint | | | 703.7 | | | 699.5 | | | 757.8 | |
Total paper | | | 1,687.4 | | | 1,648.8 | | | 1,757.8 | |
Pulp | | | 624.3 | | | 590.9 | | | 544.0 | |
| Total production | | | 2,311.7 | | | 2,239.7 | | | 2,301.8 | |
Average spot foreign exchange rate C$/US$4 | | | 1.134 | | | 1.212 | | | 1.302 | |
Period-end spot foreign exchange rate C$/US$5 | | | 1.165 | | | 1.166 | | | 1.204 | |
Effective foreign exchange rate C$/US$6 | | | 1.146 | | | 1.239 | | | 1.359 | |
| Common shares (millions) | | | | | | | | | | |
At period end | | | 214.6 | | | 214.6 | | | 214.6 | |
Weighted average | | | 214.6 | | | 214.6 | | | 214.6 | |
| 1 | EBITDA is a non-GAAP measure. Refer to “Non-GAAP Measures” for further details. |
| 2 | EBITDA margin is defined as EBITDA as a percentage of sales. |
| 3 | Effective January 1, 2006, the Company reclassified containerboard out of its specialty paper segment into its pulp segment. Prior period comparatives have been reclassified to reflect this change. |
| 4 | Average spot foreign exchange rate is the average Bank of Canada noon spot rate over the reporting period. |
| 5 | Period-end spot foreign exchange rate is the Bank of Canada noon spot rate. |
| 6 | Effective foreign exchange rate represents a blended rate which takes into account the applicable spot rates and the Company’s revenue hedging program in the reporting period. |
Selected quarterly financial information
(In millions of dollars, except where otherwise stated) | |
| | | 2006 | | 2005 | |
| | | Q1 | | Q2 | | Q3 | | Q4 | | Q1 | | Q2 | | Q3 | | Q4 | |
| Sales | | $ | 456.3 | | $ | 469.6 | | $ | 486.0 | | $ | 470.6 | | $ | 462.7 | | $ | 439.0 | | $ | 450.3 | | $ | 471.9 | |
| Operating earnings (loss) | | | (15.9 | ) | | 6.1 | | | 17.0 | | | (3.3 | ) | | (10.7 | ) | | (19.5 | ) | | 2.8 | | | 2.3 | |
EBITDA1 | | | 47.3 | | | 52.4 | | | 62.8 | | | 48.5 | | | 33.6 | | | 25.4 | | | 47.9 | | | 48.3 | |
| Net earnings (loss) | | | (23.6 | ) | | 42.4 | | | 2.5 | | | (37.2 | ) | | (21.8 | ) | | (30.0 | ) | | 34.2 | | | (8.0 | ) |
EBITDA margin1,2 | | | 10.4 | % | | 11.2 | % | | 12.9 | % | | 10.3 | % | | 7.3 | % | | 5.8 | % | | 10.6 | % | | 10.2 | % |
| Net earnings (loss) per share (in dollars) - basic and diluted | | $ | (0.11 | ) | $ | 0.20 | | $ | 0.01 | | $ | (0.17 | ) | $ | (0.10 | ) | $ | (0.14 | ) | $ | 0.16 | | $ | (0.04 | ) |
Sales (000 tonnes) 3 | | | | | | | | | | | | | | | | | | | | | | | | | |
| Specialty papers | | | 235.1 | | | 237.8 | | | 264.6 | | | 252.7 | | | 238.0 | | | 219.9 | | | 235.0 | | | 250.0 | |
| Newsprint | | | 181.1 | | | 178.4 | | | 169.5 | | | 170.1 | | | 180.7 | | | 169.2 | | | 169.9 | | | 187.3 | |
| Total paper | | | 416.2 | | | 416.2 | | | 434.1 | | | 422.8 | | | 418.7 | | | 389.1 | | | 404.9 | | | 437.3 | |
| Pulp | | | 153.4 | | | 171.4 | | | 155.9 | | | 145.5 | | | 150.6 | | | 150.3 | | | 157.7 | | | 144.4 | |
| Total sales | | | 569.6 | | | 587.6 | | | 590.0 | | | 568.3 | | | 569.3 | | | 539.4 | | | 562.6 | | | 581.7 | |
Production (000 tonnes) 3 | | | | | | | | | | | | | | | | | | | | | | | | | |
| Specialty papers | | | 235.7 | | | 244.2 | | | 254.8 | | | 249.0 | | | 237.5 | | | 228.6 | | | 242.3 | | | 240.9 | |
| Newsprint | | | 183.9 | | | 179.6 | | | 170.0 | | | 170.2 | | | 176.7 | | | 167.4 | | | 167.9 | | | 187.5 | |
| Total paper | | | 419.6 | | | 423.8 | | | 424.8 | | | 419.2 | | | 414.2 | | | 396.0 | | | 410.2 | | | 428.4 | |
| Pulp | | | 153.1 | | | 155.6 | | | 162.8 | | | 152.8 | | | 142.3 | | | 141.4 | | | 157.1 | | | 150.1 | |
| Total production | | | 572.7 | | | 579.4 | | | 587.6 | | | 572.0 | | | 556.5 | | | 537.4 | | | 567.3 | | | 578.5 | |
| | | | | | | | | | | | | | | | | | | | | | | | | | |
Average spot foreign exchange rate C$/US$4 | | | 1.155 | | | 1.121 | | | 1.121 | | | 1.139 | | | 1.227 | | | 1.244 | | | 1.201 | | | 1.173 | |
Period-end spot foreign exchange rate C$/US$5 | | | 1.167 | | | 1.115 | | | 1.115 | | | 1.165 | | | 1.210 | | | 1.226 | | | 1.161 | | | 1.166 | |
Effective foreign exchange rate C$/US$6 | | | 1.172 | | | 1.147 | | | 1.129 | | | 1.139 | | | 1.265 | | | 1.267 | | | 1.221 | | | 1.206 | |
| Common shares (millions) | | | | | | | | | | | | | | | | | | | | | | | | | |
| At period end | | | 214.6 | | | 214.6 | | | 214.6 | | | 214.6 | | | 214.6 | | | 214.6 | | | 214.6 | | | 214.6 | |
| Weighted average | | | 214.6 | | | 214.6 | | | 214.6 | | | 214.6 | | | 214.6 | | | 214.6 | | | 214.6 | | | 214.6 | |
| 1 | EBITDA is a non-GAAP measure. Refer to the “Non-GAAP Measures” section for further details. |
2 EBITDA margin is defined as EBITDA as a percentage of sales.
3 Effective January 1, 2006, the Company reclassified containerboard out of its specialty paper segment into its pulp segment. Prior period comparatives have been reclassified to reflect this change
4 Average spot foreign exchange rate is the average Bank of Canada noon spot rate over the reporting period.
5 Period-end spot foreign exchange rate is the Bank of Canada noon spot rate.
6 Effective foreign exchange rate represents a blended rate which takes account of the applicable spot rates and the Company’s revenue hedging program in the period.
| | The Company’s long-term objective is to achieve higher sustainable earnings and maximize cash flow by strengthening its position as a leading producer of value-added paper. |
| | The Company believes the following key performance drivers are critical to achieving its strategic goals and creating value for its investors. |
| | Market position is a significant driver of the Company’s success. As one of the largest North America-based producers of uncoated groundwood specialty papers and newsprint, market penetration is important. The Company’s brand names are well recognized in the marketplace and it has built a reputation for reliability, value and service. |
| | Upgraded, cost-competitive manufacturing |
| | In the past five years, capital expenditures of approximately $419 million have been directed primarily towards the Company’s manufacturing facilities to shift production towards higher-margin papers, reduce unit production costs, increase machine productivity, improve product quality, increase capacity, and meet or exceed environmental regulations. |
| | In recent years, the Company has introduced or expanded a number of specialty paper and differentiated product lines, including lightweight newsprint grades, coated papers, MF hi-brites, super hi-brites, soft-calendered grades, directory, sawdust-based pulp, and white-top linerboard. These products offer improved margins over standard commodity newsprint grades. In addition, market pulp further diversifies the product mix. |
| | The Company has a strong and flexible distribution network. The Company utilizes all transportation modes available to it, such as truck, rail, and container and break-bulk shipping. The Company’s supply chain systems have enabled better planning and scheduling, allowing the Company to use the most cost-efficient means of transportation to ship its products. |
| | Over the last several years, the Company has developed expertise in the production of lightweight papers. Lower basis weight papers reduce the Company’s costs by decreasing fibre, conversion, shipping, storage and handling expenses, and reducing warehouse space required for inventories, thus creating a competitive advantage. The use of lower basis weight paper by the Company’s customers also reduces their costs. The Company’s paper-making expertise enables it to produce high-quality, high-brightness uncoated groundwood grades. In addition, new product development continues to be an important focus. |
| | The Company is also one of the few manufacturers of sawdust-based pulp in the world. This product is valued by producers of tissue and wood-free printing papers as a substitute for more costly NBSK pulp. |
| | The Company’s employees act as strategic partners when tackling challenges and improving the Company’s performance. Recognizing this, the Company strives to be a top employer by providing a work environment that is safe, challenging, interesting and rewarding. |
| | Sound corporate social responsibility |
| | Corporate social responsibility is one of the Company’s core values. The Company judges success in this area through the health of citizens in its communities, the safety and well-being of its employees, the vibrancy of its communities, and the sustainability of the Company’s practices with respect to their impact on the environment. A complete description of the Company’s objectives and progress in corporate social responsibility will be provided in the Company’s 2006 Sustainability Report, which will be released in April 2007. |
| | Key performance indicators |
| | The Company believes the following key performance indicators are meaningful for measuring the Company’s progress in achieving its strategic goals and creating value for investors. |
| | The Company’s first priority is the well-being of its employees. Safety is measured in terms of the medical incident rate (“MIR”), which is the number of incidents requiring medical attention per 200,000 hours worked, and the lost-time injury frequency (“LTI”), which is the number of lost-time injuries per 200,000 hours worked. The Company achieved its safest year on record in 2005 and set even higher safety goals for 2006. However, 2006 was disappointing in that the Company’s safety record slipped, compared to 2005. Additional details on 2006 safety results will be provided in the Company’s 2006 Sustainability Report, which will be released in April 2007. |
| | EBITDA is widely used in the financial community to compare the profitability of corporations, and is used by management as an indicator of relative operating performance. Further analysis and discussion of this indicator is provided in all discussions of operations and the “Non-GAAP Measures” section. |
| | Performance Improvement Program |
| | One of the characteristics of the Company’s culture is that of engaging its people in projects that challenge the status quo. The Company has for several years aggregated these initiatives on an annual basis into a Performance Improvement Program. Performance improvement initiatives challenge the Company to create innovative and cost-effective business solutions. In addition, the Company focuses on significant capital projects to improve the quality of products and improve machine efficiency. In 2006, the Company launched its fifth consecutive Performance Improvement Program. A detailed summary of the 2006 Performance Improvement Program results is available in this section under “Progress on 2006 Strategic Initiatives”. |
| | Average sales revenue per tonne |
| | Average sales revenue per tonne for each core business provides key insights into how the Company maximizes its market position. The main factors in revenue growth are U.S. dollar transaction prices, and the relationship between the Canadian and U.S. dollar. Details on 2006 results are provided in the “Annual Segmented Results of Operations” and “Quarterly Segmented Results of Operations” sections. |
| | Reducing cash costs while maintaining product quality is essential to sustaining profitability in each of the Company’s core businesses. The Company continually examines all areas of its business for cost reduction opportunities. Details on 2006 results are provided in the “Annual Segmented Results of Operations” and “Quarterly Segmented Results of Operations” sections. |
| | The Company’s success also depends on its liquidity and continued ability to finance its growth. The Company focuses on its total-debt to total-capitalization ratio and on its net-debt to net-capitalization ratio in order to assess its debt position. Further discussion is provided in the “Liquidity and Capital Resources” section. |
| | Greenhouse gas emissions (“GHG”) |
| | The Company takes its environmental responsibility seriously and, as such, has invested heavily in environmental initiatives. The Company has had a 70% absolute reduction of GHGs and a 69% intensity reduction of GHGs since 1990, and is well positioned to meet objectives established by the Kyoto Protocol. Emissions are measured in direct GHGs per tonne. In recognition of its progress in 2006, the Company was one of 25 companies recognized for reducing greenhouse gases in the Carbon Disclosure Project - Canada 280 Report. Further details will be provided in the Company’s 2006 Sustainability Report, which will be released in April 2007. |
The Company’s strategic initiative achievements in 2006 and 2005 were as follows:
(All amounts pre-tax and in millions of dollars) | |
Initiative | | Performance goal | | 2006 Goal | | 2006 Achievement | | 2005 Achievement | |
Components of Performance Improvement Programs | |
i) Grade development and product optimization | | | Develop new, higher-value specialty products, reduce exposure to the commodity newsprint market, and optimize product, grade and customer mix | | $ | 9 | | $ | 11 | | $ | 19 | |
ii) Cost Reduction | | | Improve productivity | | | 24 | | | 20 | | | - | |
| | | | Optimize fibre | | | 8 | | | 12 | | | 12 | |
| | | | Improve energy efficiencies | | | 6 | | | 12 | | | 10 | |
| | | | Optimize freight | | | 4 | | | 5 | | | 7 | |
| | | | Optimize chemical usage | | | 6 | | | 5 | | | 4 | |
| | | | Reduce kraft usage | | | 2 | | | (1 | ) | | 18 | |
| | | | Other | | | 11 | | | 10 | | | 14 | |
| | | | | | | 61 | | | 63 | | | 65 | |
| | | | | | $ | 70 | | $ | 74 | | $ | 84 | |
| | Progress on 2006 strategic initiatives |
| | (a) | Performance Improvement Program |
| | In January 2006, the Company commenced its fifth consecutive annual Performance Improvement Program. The 2006 Performance Improvement Program was aimed at generating $70 million in year-over-year EBITDA improvements across all areas of the Company. Improvements were targeted in the areas of grade development and product optimization and cost reduction. In 2006, the program delivered $74 million in realized improvements. |
| | | i) | Grade development and product optimization |
| | This strategic initiative included the marketing of new high-value specialty paper products, and the reduction of the Company’s exposure to standard newsprint. In 2006, the Company realized EBITDA improvements of $11 million as a result of its various grade development and product optimization initiatives. |
| | In pursuit of these performance initiatives, the Company accomplished the following in 2006: |
| | Sales of Electraprime and Electrastar |
In 2003, the Company introduced Electraprime to the market. The Electraprime grade is a soft-calendered, high-brightness paper designed to compete as an alternative to SC-A grades used primarily for advertising flyers and inserts. Electraprime was well received in the market with sales of approximately 103,000 tonnes in 2006, an improvement of approximately 14,000 tonnes, or 15.7%, from 2005, and 70,000 tonnes, or 212.1%, from 2004. The Company intends to continue growing its Electraprime business through 2007.
The Electrastar grade was also introduced to the market in 2003 and is a super-high brightness grade designed for applications in which brightness is a desirable characteristic, such as inserts and specialty newspapers. Electrastar sales volumes in 2006 were up 36% to 82,000 tonnes, compared to 2005. The growth was in line with the Company’s expectations.
ii) Cost reduction
| | The Company’s cost-reduction initiatives produced the following key results in 2006: |
The Company’s productivity improvement initiatives in 2006 were focused mainly on increasing asset reliability, improving machine speed and efficiency by cutting operating and maintenance-related downtime, and reducing dry-end paper losses. These and other initiatives resulted in savings of $20 million in 2006.
| | The Company continued to optimize its furnish mix during the year by using lower-cost chips and optimizing the use of other lower-cost furnishes. These and other initiatives resulted in savings of $12 million in 2006. |
| | Improve energy efficiencies |
| | The Company is a significant consumer of steam and electrical energy. The overall reduction in steam usage and the continuing optimization of the fuel mix in the Company’s power boilers resulted in less reliance on fossil fuels in favour of wood waste hog fuel. In addition, the Company focused on a number of electrical energy initiatives that reduced overall electrical consumption. These and other energy reduction initiatives resulted in additional savings of $12 million in 2006. |
The Company’s key freight initiatives included improvements on rail, truck and container shipment yields as well as initiatives to reduce barge costs. These and other initiatives resulted in additional savings of $5 million in 2006.
| | The Company had a number of initiatives to reduce the usage and costs of bleaching and additive chemicals during the year. These and other initiatives resulted in additional savings of $5 million in 2006. |
| | The Company also completed a series of smaller initiatives, primarily with respect to manpower reductions, procurement improvements and its maintenance practices. Approximately $10 million in savings were realized as a result of these initiatives. |
| | (b) | Other strategic initiatives |
In 2006, the Company focused further on advancing its preferred supplier status with key customers by continuing to improve the consistency, runnability and reliability of its products, and its on-time delivery service. As a result, there were significant reductions in 2006 quality claims.
| | Chain-of-custody certification |
| | The Company has implemented over the 2004-to-2006 period an “independent chain-of-custody” system to certify its wood fibre supply. The PwC standard is a third-party audited system that identifies the source of wood fibre and whether it is derived from a forest independently certified as being managed in accordance with a recognized sustainable forest certification system. By 2006, all the Company’s paper and pulp mills were certified under the PwC standard. The independent chain-of-custody system tracks the fibre from source to finished product and provides a valuable tool to assure customers that paper contains wood fibre derived from well-managed forests. It is expected to continue to result in additional sales opportunities. |
| | As part of its ongoing initiatives to improve efficiency, the Company intends to further invest in improved systems and processes in 2007. In the second quarter (“Q2”) of 2006, the Company completed an upgrade in its enterprise business system with the primary focus on improving order visibility. In 2007, the Company expects to undertake a project to expand the use of its enterprise business system to locations currently using a legacy system. |
| | 2007 Performance Improvement Program |
| | The 2007 Performance Improvement Program is currently under review with the expectation that there will be identified improvements across all areas of the Company similar to those of previous years. |
| | 1.6 | Consolidated results of operations |
| | Year ended December 31, 2006 compared to year ended December 31, 2005 |
| | Sales were $1,882.5 million in 2006, an increase of $58.6 million, or 3.2%, compared to $1,823.9 million in 2005. The positive impact on sales from improved prices across most paper and pulp grades together with higher sales volumes for most grades more than offset the negative impact from the stronger Canadian dollar. |
| | The following table highlights the factors that affected the Company’s sales by segment: |
| Sales ($ millions) | |
| | | Year ended December 31, | | | | Increase (decrease) from 2005 as a result of | |
| | | 2006 | | 2005 | | Total change | | Volume | | Mix | | Price | | F/X | |
| Specialty papers | | $ | 918.4 | | $ | 900.5 | | $ | 17.9 | | $ | 45.1 | | $ | 5.2 | | $ | 34.1 | | $ | (66.5 | ) |
| Newsprint | | | 529.8 | | | 529.1 | | | 0.7 | | | (5.9 | ) | | 2.1 | | | 39.0 | | | (34.5 | ) |
| Total paper | | $ | 1,448.2 | | $ | 1,429.6 | | $ | 18.6 | | $ | 39.2 | | $ | 7.3 | | $ | 73.1 | | $ | (101.0 | ) |
| Pulp | | | 434.3 | | | 394.3 | | | 40.0 | | | 15.2 | | | (1.0 | ) | | 62.8 | | | (37.0 | ) |
| Total | | $ | 1,882.5 | | $ | 1,823.9 | | $ | 58.6 | | $ | 54.4 | | $ | 6.3 | | $ | 135.9 | | $ | (138.0 | ) |
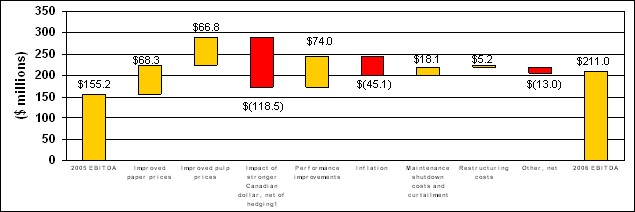
| | EBITDA was $211.0 million in 2006, an increase of $55.8 million, or 36.0%, compared to $155.2 million in the previous year. The positive impact of higher transaction prices, performance improvements, primarily reflecting productivity improvements, lower planned maintenance shutdown costs and lower restructuring costs more than offset the negative impact of the stronger Canadian dollar and inflationary impacts including chip prices. |
| | The following table summarizes the key changes in EBITDA from the year ended December 31, 2005, to the year ended December 31, 2006: |
1 Includes foreign exchange impact on costs.
| | Operating earnings (loss) |
| | The Company recorded operating earnings of $3.9 million in 2006, compared to an operating loss of $25.1 million for the previous year. The improvement was mainly related to the $55.8 million increase in EBITDA noted above, partially offset by $23.4 million of impairment losses related to the permanent closure of the A3 paper machine and other asset impairments. More details are provided in the “Critical Accounting Policies and Estimates” section. |
| | Net loss in 2006 was $15.9 million ($0.07 per common share), compared to a net loss of $25.6 million ($0.12 per common share) in 2005. The 2006 net loss included a $0.2 million (less than $0.01 per common share) after-tax foreign exchange loss on the translation of U.S.-dollar-denominated debt, compared to an after-tax gain of $20.7 million ($0.10 per common share) in the previous year. Net loss in 2006 also included an after-tax impairment loss of $15.4 million ($0.07 per common share), a $22.9 million ($0.11 per common share) release of future income taxes related to the reduction in the federal corporate income tax rate, a net $4.0 million ($0.02 per common share) favourable future income tax provision adjustment, and $2.2 million ($0.01 per common share) of after-tax advisory costs resulting from a tender offer initiated by TAM. Net loss in 2005 included net favourable future income tax adjustments totalling $18.3 million ($0.09 per common share), which consisted primarily of a $14.2 million ($0.07 per common share) favourable future income tax adjustment related to a decrease in the British Columbia provincial income tax rate. |
| | Net loss before the abovementioned items in 2006 was $25.0 million ($0.12 per common share), compared to a net loss of $64.6 million ($0.30 per common share) in the previous year. |
| | The following table reconciles 2006 earnings (loss) to 2005: |
($millions) | | Pre-tax | | After-tax | |
2005 earnings (loss) | | $ | (72.2 | ) | $ | (25.6 | ) |
Higher EBITDA | | | 55.8 | | | 36.8 | |
Higher amortization expense | | | (3.4 | ) | | (2.2 | ) |
Impairment loss | | | (23.4 | ) | | (15.4 | ) |
Decreased foreign exchange gain on translation of long-term debt | | | (25.0 | ) | | (20.9 | ) |
Lower other income, net | | | (2.7 | ) | | (1.7 | ) |
Lower interest expense | | | 1.9 | | | 1.3 | |
| Income tax adjustments, net | | | - | | | 12.7 | |
Non-controlling interest | | | (0.9 | ) | | (0.9 | ) |
2006 earnings (loss) | | $ | (69.9 | ) | $ | (15.9 | ) |
2.0 | ANNUAL SEGMENTED RESULTS OF OPERATIONS |
| Summary of Selected Financial Information | |
(In millions of dollars, except where otherwise stated) | | 2006 | | 20051 | | 20041 | |
| Sales | | $ | 918.4 | | $ | 900.5 | | $ | 935.3 | |
EBITDA2 | | | 104.8 | | | 115.8 | | | 95.6 | |
| Operating earnings (loss) | | | 9.7 | | | 24.8 | | | 1.0 | |
EBITDA margin2, 3 | | | 11.4 | % | | 12.9 | % | | 10.2 | % |
| Sales (000 tonnes) | | | 990.2 | | | 942.9 | | | 993.7 | |
| Production (000 tonnes) | | | 983.7 | | | 949.3 | | | 1,000.0 | |
| Average sales revenue per tonne | | $ | 928 | | $ | 955 | | $ | 941 | |
Average delivered cash costs per tonne4 | | | 822 | | | 832 | | | 846 | |
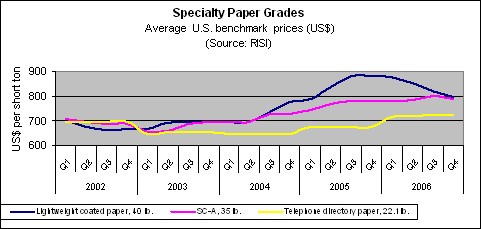
SC-A paper, 35lb. (US$/ton)5 | | | 788 | | | 769 | | | 713 | |
LWC paper, No.5, 40lb (US$/ton)5 | | | 836 | | | 847 | | | 726 | |
Telephone directory paper, 22.1 lb. (US$/ton)5 | | | 721 | | | 675 | | | 650 | |
| 1 | Effective January 1, 2006, the Company reclassified containerboard out of its specialty paper segment into its pulp segment. Prior period comparatives have been reclassified to reflect this change. |
| 2 | EBITDA is a non-GAAP measure. Refer to the “Non-GAAP Measures” section for further details. |
| 3 | EBITDA margin is defined as EBITDA as a percentage of sales. |
| 4 | Average cash costs per tonne for these purposes consist of cost of sales and Sales, general and administrative (“SG&A”) costs, including delivery costs. |
| 5 | Benchmark selling prices are sourced from Resource Information Systems, Inc. (“RISI”). |
| | During 2006, market conditions for specialty paper products were mixed. |
| | Coated mechanical markets were weak for most of the year due to flat demand, which was caused by high North American mill inventories and weak catalogue and magazine demand. Demand in 2006 was up 0.6% over 2005, as demand in the second half of the year offset the weakness in the first six months. Nevertheless, prices continued to fall in 2006, and spot prices faced pressure due to strong competition and weak order books. The average LWC benchmark price in 2006 was down US$11 per ton, or 1.3%, compared to the previous year. |
| | Demand for uncoated mechanical grades was down 0.3% in 2006. The demand for high gloss and MF grades decreased 2.3% and 2.0%, respectively, due to grade switching as a result of supply disruptions and slightly lower insert circulation. Pricing remained firm throughout 2006 due to strong operating rates on a supply adjusted basis, with a slight decline in prices near the end of the year. The average benchmark price for SC-A in 2006 increased US$19 per ton, or 2.5%, over 2005. |
| | Directory demand was strong in 2006, up 10.3% year-over-year. The growth was driven by an increase in the number of large publisher and independent books, and increased circulation, which contributed to an 8.2% increase in large publisher yellow pages in North America. In addition, a shift to lighter basis weights also contributed to a higher demand for the Company's paper. The average benchmark price for 2006 was up US$46 per ton, or 6.8%, over the previous year. |
| | The North American economy is a key driver for the Company’s specialty paper business with 94% of its product sold to this market. Among its initiatives to improve profitability, the Company continues to look for ways to optimize its customer mix. |
The 2006 geographic sales distribution, based on sales volumes, is depicted in the chart below.
| | The Company focused on growing its specialty paper grades in addition to grade optimization, enhancing its customer and grade mix, and shipping to more low-cost freight locations. |
| | Sales volumes for coated mechanical grades in 2006 were up 5.8% from the previous year. The growth matched the increased production in 2006 from the Company’s coated mechanical machine. |
| | Sales volumes for uncoated mechanical grades in 2006 increased 14.5% over 2005 due to significant growth in the Company’s Electraprime, Electrastar and Electrabrite grades. |
| | In a strategic move, the Company reduced directory sales volumes in 2006 by 9.1% to take advantage of relatively strong newsprint and uncoated mechanical prices in 2006. |
| | The specialty papers business recorded operating earnings of $9.7 million on sales of $918.4 million in 2006, compared to operating earnings of $24.8 million on sales of $900.5 million in 2005. EBITDA of $104.8 million in 2006 was $11.0 million lower than the $115.8 million recorded in the previous year. |
| | Sales volume of 990,200 tonnes in 2006 increased 47,300 tonnes, or 5.0%, compared to the previous year. The increase was largely due to the significant growth of the Company’s uncoated specialty grades. |
| | Average sales revenue of $928 per tonne in 2006 was down $27 per tonne compared to the previous year. The negative impact of the stronger Canadian dollar on revenues more than offset higher average transaction prices across most grades, improvements in customer and grade mix, and a favourable adjustment to allowance for doubtful accounts. |
| | Average cash costs in 2006 were $822 per tonne, an improvement of $10 per tonne, compared to $832 recorded in 2005. Savings from performance improvements more than offset higher chip costs, rising energy prices, increased labour expense and the impact of inflation. |
| | Market conditions are expected to remain mixed for specialty paper products in 2007. |
| | Coated mechanical paper demand is expected to remain relatively flat, reflecting an anticipated slowing of magazine and catalogue demand and a switch to SC-A grade. Recent capacity closures in Western Europe as well as the rising Euro are expected to result in lower imports to North America, which should help stabilize the North American coated market. In addition, rising chip, pulp, and energy costs are expected to increase the cash-cost floor thereby preventing significant price erosion. Benchmark prices are expected to fall in Q1, 2007, matching the seasonally slower first quarter before stabilizing in the second half of the year. |
| | Markets for uncoated mechanical grades are expected to remain relatively stable in 2007. Demand for high-gloss paper is expected to grow due to grade switching from coated mechanical and lower-gloss grades, but excess capacity and European imports are expected to keep operating rates low. Demand for MF grades is expected to be stable in 2007. Benchmark prices for high-gloss grades are expected to weaken in the seasonally slower first quarter and remain flat for the remainder of the year. |
| | Directory demand is expected to be solid through 2007 as large and independent publishers continue to print more books. In addition, benchmark prices are expected to increase in 2007, compared to 2006. |
| Summary of Selected Financial Information | |
(In millions of dollars, except where otherwise stated) | | 2006 | | 2005 | | 2004 | |
| Sales | | $ | 529.8 | | $ | 529.1 | | $ | 553.1 | |
EBITDA1 | | | 71.8 | | | 58.1 | | | 45.2 | |
| Operating earnings (loss) | | | 6.9 | | | 12.3 | | | (4.3 | ) |
EBITDA margin1, 2 | | | 13.6 | % | | 11.0 | % | | 8.2 | % |
| Sales (000 tonnes) | | | 699.1 | | | 707.1 | | | 754.7 | |
| Production (000 tonnes) | | | 703.7 | | | 699.5 | | | 757.8 | |
| Average sales revenue per tonne | | $ | 758 | | $ | 748 | | $ | 733 | |
Average delivered cash costs per tonne3 | | | 655 | | | 666 | | | 673 | |
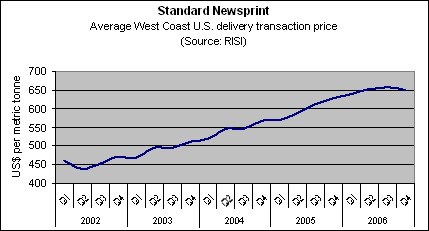
Newsprint, 48.8 gsm, West Coast delivery (US$/tonne)4 | | | 649 | | | 600 | | | 544 | |
| 1 | EBITDA is a non-GAAP measure. Refer to the “Non-GAAP Measures” section for further details. |
| 2 | EBITDA margin is defined as EBITDA as a percentage of sales. |
| 3 | Average cash costs per tonne for these purposes consist of cost of sales and SG&A costs, including delivery costs. |
| 4 | Benchmark selling prices are sourced from RISI. |
| | Newsprint demand continued to decline in 2006 with total U.S. consumption down 6.3% year-over-year. The decline was due mainly to daily newspapers employing a number of conservation measures to reduce paper consumption. Despite falling demand, operating rates were strong for most of the year, resulting in higher benchmark prices. The average newsprint benchmark price in 2006 was up US$49 per tonne, or 8.2%, compared to 2005. Continued weakness in U.S. consumption and lower operating rates resulted in prices softening late in 2006. |
| | Approximately 85% of the Company’s newsprint sales volumes were to North America and Asia. The 2006 geographical sales distribution, based on sales volumes, is depicted in the chart below. |
| | The Company reduced newsprint sales volumes in 2006 by 1.1% in a strategic move to optimize swing machine capacity to meet the higher demand for its specialty grades and to improve productivity. The Company continued to shift to lighter basis weights and increased its volume of value-added newsprint during the year, while also continuing to focus on freight optimization and customer mix. |
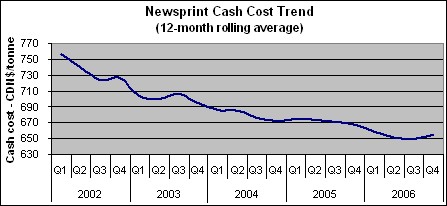
| | The chart below illustrates the decline in the Company’s newsprint cash costs per tonne since 2002, which has been driven primarily by the Company’s Performance Improvement Programs. |
| | The newsprint business recorded operating earnings of $6.9 million on sales of $529.8 million in 2006, compared to operating earnings of $12.3 million on sales of $529.1 million in 2005. EBITDA of $71.8 million in 2006 was $13.7 million higher than the $58.1 million recorded in 2005. The decline in operating earnings was primarily due to $19.1 million of impairment losses recorded on the Company’s A3 paper machine. Further details are provided in the “Critical Accounting Policies and Estimates” section. |
| | Sales volumes were 699,100 tonnes in 2006, down 8,000 tonnes, or 1.1%, from the previous year, primarily due to the Company’s strategic decision to optimize its swing machine capacity to meet higher demand for its specialty grades. |
| | Average sales revenue was $758 per tonne in 2006, an increase of $10 per tonne compared to the previous year. Higher transaction prices outweighed the impact of the stronger Canadian dollar. |
| | Average cash costs in 2006 were $655 per tonne, an improvement of $11 per tonne from the previous year. Savings from performance improvements and lower shutdown and restructuring costs more than offset higher maintenance spending and higher prices for fibre, energy and fuel, and the impact of inflation. |
| | The Company expects the newsprint market to continue to soften in 2007 due to decreases in ad lineage, circulation, average basis weights, and increased publisher conservation. The downward trend in newsprint consumption and lower expected operating rates in 2007 are expected to negatively impact prices. West Coast benchmark newsprint prices, which have risen for the last four years, are expected to weaken in 2007. Despite the downward trend in newsprint consumption, the Company believes it is well positioned to address further demand reductions due to its ability to switch grades. |
| Summary of Selected Financial Information | |
(In millions of dollars, except where otherwise stated) | | 2006 | | 20051 | | 20041 | |
| Sales | | $ | 434.3 | | $ | 394.3 | | $ | 389.8 | |
EBITDA2 | | | 34.4 | | | (18.7 | ) | | 12.0 | |
| Operating earnings (loss) | | | (12.7 | ) | | (62.2 | ) | | (28.0 | ) |
EBITDA margin2, 3 | | | 7.9 | % | | (4.7 | %) | | 3.1 | % |
| Sales (000 tonnes) | | | 626.2 | | | 603.0 | | | 527.3 | |
| Production (000 tonnes) | | | 624.3 | | | 590.9 | | | 544.0 | |
| Average sales revenue per tonne$ | | $ | 693 | | $ | 654 | | $ | 739 | |
Average delivered cash costs per tonne4 | | | 638 | | | 684 | | | 716 | |
NBSK pulp, Northern Europe delivery (US$/tonne)5 | | | 681 | | | 610 | | | 618 | |
White-top linerboard, 42 lb., Eastern U.S. delivery (US$/tonne)5 | | | 673 | | | 608 | | | 591 | |
| 1 | Effective January 1, 2006, the Company reclassified containerboard out of its specialty paper segment into its pulp segment. Prior period comparatives have been reclassified to reflect this change. |
| 2 | EBITDA is a non-GAAP measure. Refer to the “Non-GAAP Measures” section for further details. |
| 3 | EBITDA margin is defined as EBITDA as a percentage of sales. |
| 4 | Average cash costs per tonne for these purposes consist of cost of sales and SG&A costs, including delivery costs. |
| 5 | Benchmark selling prices are sourced from RISI. |
| | Pulp markets were strong throughout 2006 with global pulp shipments up 3.9% year-over-year. The closure of a number of uncompetitive North American mills in 2006, coupled with relatively strong global paper and tissue demand resulted in multiple pulp price increases during the year. This helped push the European benchmark pulp price to its highest level since 1995. The average Northern Europe NBSK benchmark price for 2006 was up US$71 per tonne, or 11.6%, compared to the previous year. |
| | U.S. containerboard consumption remained steady in 2006, up 1.8% from the previous year, as U.S. box shipments increased with the relatively steady demand for non-durable goods and processed foods, and mill and box inventories were low for most of the year. Benchmark white-top linerboard prices increased in 2006 by US$65 per tonne, or 10.7%, compared to 2005. Prices in the second half of 2006 were relatively stable. |
| | The primary markets for the Company’s market pulp are Asia and Australasia and Europe. The 2006 geographical sales distribution, based on sales volumes, is depicted in the chart below. |
Market pulp sales volumes improved in 2006 by 3.8%, compared with 2005, due to higher production at the Company’s mills. The Company continued to increase its mix of contract business and optimize sales to customers in its major pulp markets.
Containerboard sales volumes in 2006 were 4.2% higher than in the previous year, as stronger markets allowed the Company to run its machine at full capacity. The Company continued to focus on stronger margins and improving its customer mix by targeting customers that are low-cost freight and value the Company’s high-graphic white-top linerboard product.
The pulp business recorded an operating loss of $12.7 million on sales of $434.3 million in 2006, compared to an operating loss of $62.2 million on sales of $394.3 million in the previous year. EBITDA of $34.4 million in 2006 increased $53.1 million from negative EBITDA of $18.7 million in 2005, which was the primary reason for the operating earnings improvement noted above. However, the improvement in operating earnings was partially offset by impairment losses recorded on the Company’s pulp assets. Further details are provided in the “Critical Accounting Policies and Estimates” section. The significant improvement in EBITDA was driven by both price increases and the Company’s cost-reduction initiatives.
Sales volumes were 626,200 tonnes in 2006, an increase of 23,200 tonnes, or 3.8%, from the previous year. The growth was due largely to improved pulp production.
Average sales revenue was $693 per tonne in 2006, up $39 per tonne compared to the previous year, due primarily to higher pulp and containerboard transaction prices, which more than offset the negative impact of the stronger Canadian dollar.
Average cash costs in 2006 were $638 per tonne, an improvement of $46 per tonne compared to 2005. Savings from performance improvements, lower maintenance spending and reduced shutdowns were the primary factors accounting for the reduction in average cash costs. The savings more than offset higher energy prices and chip costs and the impact of inflation.
Demand for NBSK pulp is expected to remain steady during the first half of 2007, with the expectation that benchmark prices will increase modestly in early 2007 and weaken in the second half of the year. Higher consumption by China is expected to be offset by weaker demand from paper markets in the U.S. and Europe, which is expected to limit overall growth in demand in 2007. New hardwood capacity coming on line in 2007 is expected to have a negative impact on operating rates, while chip scarcity and high energy costs could result in additional mill closures in North America and Europe. A price increase of US$30 per tonne in Europe and US$20 per tonne in North America has been announced for NBSK pulp, effective January 1, 2007.
| | The Company is expecting that demand and prices for containerboard will remain flat in 2007 as a result of the weakening U.S. economy. A US$40 per tonne increase for containerboard and white-top linerboard has been announced by a number of suppliers, effective January 1, 2007. |
Summary of Selected Financial Information (In millions of dollars, except where otherwise stated) | |
| | | 2006 | | 2005 | |
Specialty Papers1 | | Q1 | | Q2 | | Q3 | | Q4 | | Q1 | | Q2 | | Q3 | | Q4 | |
| Sales | | $ | 220.8 | | $ | 218.6 | | $ | 245.0 | | $ | 234.0 | | $ | 226.1 | | $ | 211.7 | | $ | 223.9 | | $ | 238.8 | |
EBITDA2 | | | 29.1 | | | 25.7 | | | 31.6 | | | 18.4 | | | 25.5 | | | 24.5 | | | 33.7 | | | 32.1 | |
| Operating earnings (loss) | | | 6.6 | | | 2.8 | | | 6.9 | | | (6.6 | ) | | 2.5 | | | 2.1 | | | 10.9 | | | 9.3 | |
EBITDA margin2, 3 | | | 13.2 | % | | 11.8 | % | | 12.9 | % | | 7.9 | % | | 11.3 | % | | 11.6 | % | | 15.1 | % | | 13.4 | % |
| | | | | | | | | | | | | | | | | | | | | | | | | | |
| Sales (000 tonnes) | | | 235.1 | | | 237.8 | | | 264.6 | | | 252.7 | | | 238.0 | | | 219.9 | | | 235.0 | | | 250.0 | |
| Production (000 tonnes) | | | 235.7 | | | 244.2 | | | 254.8 | | | 249.0 | | | 237.5 | | | 228.6 | | | 242.3 | | | 240.9 | |
| | | | | | | | | | | | | | | | | | | | | | | | | | |
| Average sales revenue per tonne | | $ | 939 | | $ | 920 | | $ | 926 | | $ | 927 | | $ | 950 | | $ | 963 | | $ | 953 | | $ | 956 | |
Average delivered cash costs per tonne4 | | | 815 | | | 811 | | | 806 | | | 853 | | | 843 | | | 852 | | | 809 | | | 827 | |
| | | | | | | | | | | | | | | | | | | | | | | | | | |
SC-A paper, 35 lb. (US$/ton)5 | | | 780 | | | 785 | | | 800 | | | 787 | | | 745 | | | 770 | | | 780 | | | 780 | |
LWC paper, No. 5, 40 lb. (US$/ton)5 | | | 875 | | | 852 | | | 820 | | | 798 | | | 790 | | | 837 | | | 880 | | | 880 | |
Telephone directory paper, 22.1 lb. (US$/ton)5 | | | 715 | | | 720 | | | 725 | | | 725 | | | 675 | | | 675 | | | 675 | | | 675 | |
| Newsprint | | | | | | | | | | | | | | | | | | | | | | | | | |
| Sales | | $ | 137.2 | | $ | 135.4 | | $ | 128.8 | | $ | 128.4 | | $ | 133.0 | | $ | 127.1 | | $ | 127.1 | | $ | 141.9 | |
EBITDA2 | | | 19.8 | | | 19.3 | | | 18.2 | | | 14.5 | | | 9.9 | | | 12.7 | | | 14.7 | | | 20.8 | |
Operating earnings (loss) | | | (9.9 | ) | | 7.4 | | | 7.5 | | | 1.9 | | | (0.9 | ) | | 1.4 | | | 3.4 | | | 8.4 | |
EBITDA margin2, 3 | | | 14.4 | % | | 14.3 | % | | 14.1 | % | | 11.3 | % | | 7.4 | % | | 10.0 | % | | 11.6 | % | | 14.7 | % |
| | | | | | | | | | | | | | | | | | | | | | | | | | |
| Sales (000 tonnes) | | | 181.1 | | | 178.4 | | | 169.5 | | | 170.1 | | | 180.7 | | | 169.2 | | | 169.9 | | | 187.3 | |
| Production (000 tonnes) | | | 183.9 | | | 179.6 | | | 170.0 | | | 170.2 | | | 176.7 | | | 167.4 | | | 167.9 | | | 187.5 | |
| | | | | | | | | | | | | | | | | | | | | | | | | | |
| Average sales revenue per tonne | | $ | 758 | | $ | 759 | | $ | 761 | | $ | 754 | | $ | 736 | | $ | 752 | | $ | 748 | | $ | 758 | |
Average delivered cash costs per tonne4 | | | 647 | | | 651 | | | 653 | | | 669 | | | 682 | | | 677 | | | 662 | | | 647 | |
| | | | | | | | | | | | | | | | | | | | | | | | | | |
Newsprint 48.8 gsm, West Coast delivery (US$/tonne)5 | | | 640 | | | 651 | | | 658 | | | 649 | | | 571 | | | 589 | | | 612 | | | 627 | |
Pulp1 | | | | | | | | | | | | | | | | | | | | | | | | | |
| Sales | | $ | 98.3 | | $ | 115.6 | | $ | 112.2 | | $ | 108.2 | | $ | 103.6 | | $ | 100.2 | | $ | 99.3 | | $ | 91.2 | |
EBITDA2 | | | (1.6 | ) | | 7.4 | | | 13.0 | | | 15.6 | | | (1.8 | ) | | (11.8 | ) | | (0.5 | ) | | (4.6 | ) |
| Operating earnings (loss) | | | (12.6 | ) | | (4.1 | ) | | 2.6 | | | 1.4 | | | (12.3 | ) | | (23.0 | ) | | (11.5 | ) | | (15.4 | ) |
EBITDA margin2, 3 | | | (1.6 | %) | | 6.4 | % | | 11.6 | % | | 14.4 | % | | (1.7 | %) | | (11.8 | %) | | (0.5 | %) | | (5.0 | %) |
| | | | | | | | | | | | | | | | | | | | | | | | | | |
| Sales (000 tonnes) | | | 153.4 | | | 171.4 | | | 155.9 | | | 145.5 | | | 150.6 | | | 150.3 | | | 157.7 | | | 144.4 | |
| Production (000 tonnes) | | | 153.1 | | | 155.6 | | | 162.8 | | | 152.8 | | | 142.3 | | | 141.4 | | | 157.1 | | | 150.1 | |
| | | | | | | | | | | | | | | | | | | | | | | | | | |
| Average sales revenue per tonne | | $ | 641 | | $ | 674 | | $ | 720 | | $ | 744 | | $ | 688 | | $ | 666 | | $ | 630 | | $ | 632 | |
Average delivered cash costs per tonne4 | | | 652 | | | 630 | | | 637 | | | 636 | | | 699 | | | 745 | | | 633 | | | 664 | |
NBSK pulp, Northern Europe delivery (US$/tonne)5 | | | 618 | | | 665 | | | 710 | | | 730 | | | 640 | | | 613 | | | 587 | | | 600 | |
White-top linerboard, 42 lb., Eastern U.S. delivery (US$/tonne)5 | | | 650 | | | 680 | | | 680 | | | 680 | | | 620 | | | 620 | | | 583 | | | 610 | |
| 1 | Effective January 1, 2006, the Company reclassified containerboard out of its specialty paper segment into its pulp segment. Prior period comparatives have been reclassified to reflect this change. |
| 2 | EBITDA is a non-GAAP measure. Refer to the “Non-GAAP Measures” section for further details. |
| 3 | EBITDA margin is defined as EBITDA as a percentage of sales. |
| 4 | Average cash costs per tonne for these purposes consist of cost of sales and SG&A costs, including delivery costs. |
| 5 | Benchmark selling prices are sourced from RISI. |
| | 3.1 | Three months ended December 31, 2006 compared to three months ended |
| | EBITDA in Q4, 2006 was $48.5 million, a decrease of $14.3 million, or 22.8%, from $62.8 million in Q3, 2006. The reduction was caused by the negative impact of higher fibre prices, higher maintenance costs and poor weather conditions, which more than offset the positive impact of the weaker Canadian dollar, the absence of the tender offer advisory costs recorded in the previous quarter, and higher pulp and paper prices. |
| | The following table summarizes the key changes in EBITDA from Q3, 2006 to Q4, 2006: |
($ millions) | | | |
Q3, 2006 EBITDA | | $ | 62.8 | |
| Pulp and paper prices | | | 0.7 | |
| Impact of weaker Canadian dollar, net of hedging program | | | 4.2 | |
| Fibre prices | | | (5.2 | ) |
| Maintenance and other operating costs | | | (6.0 | ) |
| Energy costs | | | (2.6 | ) |
| Impact of poor weather conditions | | | (4.6 | ) |
| Non-recurring tender offer advisory and other related costs | | | 3.4 | |
| Other, net | | | (4.2 | ) |
Q4, 2006 EBITDA | | $ | 48.5 | |
| | Net loss in Q4, 2006 was $37.2 million ($0.17 per common share), compared to net earnings of $2.5 million ($0.01 per common share) in the previous quarter. Net loss in Q4 included a $26.2 million ($0.12 per common share) after-tax foreign exchange loss on the translation of U.S.-dollar-denominated debt, compared to a $0.1 million (less than $0.01 per common share) after-tax foreign exchange gain on the translation of U.S.-dollar-denominated debt in the previous quarter. Net loss in Q4 also included an after-tax impairment loss of $3.8 million ($0.02 per common share). Net earnings in the previous period also included a net $4.0 million ($0.02 per common share) favourable future income tax provision adjustment and $2.2 million ($0.01 per common share) of after-tax costs resulting from a tender offer initiated by TAM. |
| | Net loss before the abovementioned items in Q4 was $7.2 million ($0.03 per common share), compared to net earnings before the abovementioned items of $0.6 million (less than $0.01 per common share) in the previous quarter. |
| | 3.1.2 | Operational performance - specialty papers |
| | The specialty papers business recorded an operating loss of $6.6 million on sales of $234.0 million in Q4, 2006, compared to operating earnings of $6.9 million on sales of $245.0 million in Q3, 2006. EBITDA in Q4 was $18.4 million, a $13.2 million decrease from $31.6 million recorded in the previous quarter. The primary reasons for the decreases are discussed below. |
| | Sales volume of 252,700 tonnes in Q4 decreased 11,900 tonnes, or 4.5%, from the previous quarter when the Company shipped record-high coated and uncoated specialty sales volumes. |
| | Average sales revenue in Q4 of $927 per tonne remained consistent with the $926 per tonne recorded in Q3. |
| | Average cash costs in Q4 were $853 per tonne, an increase of $47 per tonne compared to the previous quarter. Higher maintenance spending and fibre prices, increased usage of fossil fuel and one-time closure costs for the Port Alberni groundwood pulp mill more than offset savings from performance improvements. |
| | The newsprint business recorded operating earnings of $1.9 million on sales of $128.4 million in Q4, 2006, compared to operating earnings of $7.5 million on sales of $128.8 million in Q3, 2006. EBITDA in Q4 was $14.5 million, a $3.7 million decrease from $18.2 million recorded in the previous quarter. The primary reasons for the decreases are discussed below. The decline in operating earnings was also partially due to impairment losses of $1.5 million recorded on the Company’s A3 paper machine in Q4. Further details are provided in the “Critical Accounting Policies and Estimates” section. |
| | Sales volume of 170,100 tonnes in Q4 was consistent with the previous quarter. |
| | Average sales revenue in Q4 of $754 per tonne decreased $7 per tonne compared to the previous quarter, with weaker transaction prices being the primary factor for the decrease. |
| | Average cash costs in Q4 were $669 per tonne, an increase of $16 per tonne from the previous quarter. Higher maintenance spending and fibre prices and increased usage of fossil fuel more than offset savings from performance improvements. |
| | The pulp business recorded operating earnings of $1.4 million on sales of $108.2 million in Q4, 2006, compared to operating earnings of $2.6 million on sales of $112.2 million in Q3, 2006. EBITDA in Q4 was $15.6 million, a $2.6 million increase from $13.0 million recorded in the previous quarter. The primary reasons for the movements are discussed below. The decline in operating earnings was also due in part to impairment losses of $3.8 million recorded on the Company’s assets in Q4. Further details are provided in the “Critical Accounting Policies and Estimates” section. |
| | Sales volume of 145,500 tonnes in Q4 decreased by 10,400 tonnes, or 6.7%, from the previous quarter, reflecting primarily the timing of pulp shipments to Asia. |
| | Average sales revenue in Q4 was $744 per tonne, an increase of $24 per tonne from the previous quarter, primarily due to higher pricing for pulp. |
Average cash costs in Q4 were $636 per tonne, which was consistent with the previous quarter. Higher fibre and energy prices, increased steam usage, and higher regular maintenance spending were offset mainly by lower scheduled maintenance shutdown costs and the impact of an eight-day curtailment in Q4.
| | 3.2 | Three months ended December 31, 2006 compared to three months ended |
| | EBITDA in Q4, 2006 was $48.5 million, up $0.2 million, or 0.4%, from $48.3 million in Q4, 2005. Higher product prices across most paper and pulp grades and further performance improvements were offset by the negative impacts of the stronger Canadian dollar and inflation, and by higher costs. |
| | The following table summarizes the key changes in EBITDA from Q4, 2005 to Q4, 2006: |
($ millions) | | | |
Q4 2005 EBITDA | | $ | 48.3 | |
| Improved pulp prices | | | 22.9 | |
| Improved paper prices | | | 9.2 | |
| Impact of stronger Canadian dollar, net of hedging program | | | (20.9 | ) |
| Inflation | | | (15.4 | ) |
| Other, net | | | 4.4 | |
Q4 2006 EBITDA | | $ | 48.5 | |
| | Net loss in Q4, 2006 was $37.2 million ($0.17 per common share), compared to a net loss of $8.0 million ($0.04 per common share) in Q4, 2005. Net loss in Q4, 2006 included a $26.2 million ($0.12 per common share) after-tax foreign exchange loss on the translation of U.S.-dollar-denominated debt, compared to an after-tax foreign exchange loss of $2.2 million ($0.01 per common share) in Q4, 2005. Net loss in Q4, 2006 also included an after-tax impairment loss of $3.8 million ($0.02 per common share). Net loss in Q4, 2005 also included favourable income tax adjustments of $5.0 million ($0.02 per common share). |
| | Net loss before the abovementioned items in Q4, 2006 was $7.2 million ($0.03 per common share), compared to a net loss before the abovementioned items of $10.8 million ($0.05 per common share) in the same period of 2005. |
| | The specialty papers business recorded an operating loss of $6.6 million on sales of $234.0 million in Q4, 2006, compared to operating earnings of $9.3 million on sales of $238.8 million in the same quarter of 2005. EBITDA in Q4, 2006 was $18.4 million, a $13.7 million decrease from $32.1 million recorded in the same quarter last year. The primary reasons for the decreases are discussed below. |
| | Sales volume of 252,700 tonnes in Q4, 2006 was in line with the same quarter last year. |
| | Average sales revenue in Q4, 2006 was $927 per tonne, a decrease of $29 per tonne from Q4, 2005. The decrease was due to the negative impact of the significantly stronger Canadian dollar and, to a lesser extent, weaker coated prices, which together more than offset stronger prices for uncoated and directory grades, and an improved customer and grade mix. |
| | Average cash costs in Q4, 2006 were $853 per tonne, an increase of $26 per tonne from the same quarter of 2005. Higher maintenance spending and shutdowns in addition to increased fibre and energy prices more than offset savings from performance improvements. |
| | The newsprint business recorded operating earnings of $1.9 million on sales of $128.4 million in Q4, 2006, compared to operating earnings of $8.4 million on sales of $141.9 million in the same quarter of 2005. EBITDA of $14.5 million in Q4, 2006 was down $6.3 million from $20.8 million recorded in Q4, 2005. The primary reasons for the decreases are noted below. The decline in operating earnings was also partially due to impairment losses of $1.5 million recorded on the Company’s A3 paper machine in Q4, 2006. Further details are provided in the “Critical Accounting Policies and Estimates” section. |
| | Sales volume of 170,100 tonnes in Q4, 2006 was down 17,200 tonnes, or 9.2%, from Q4, 2005, due primarily to the Company optimizing its swing machine capacity to meet the higher demand for other grades. |
| | Average sales revenue of $754 per tonne in Q4, 2006 decreased $4 per tonne from the same period of 2005, with the negative impact of the stronger Canadian dollar more than offsetting higher transaction prices and a favourable market, grade and customer mix. |
| | Average cash costs in Q4, 2006 were $669 per tonne, an increase of $22 per tonne from the same quarter of 2005. Higher fibre costs and fossil fuel usage, increased maintenance spending and the impact of inflation more than offset the savings from performance improvements. |
| | The pulp business recorded operating earnings of $1.4 million on sales of $108.2 million in Q4, 2006, compared to an operating loss of $15.4 million on sales of $91.2 million in Q4, 2005. EBITDA was $15.6 million in Q4, 2006, an increase of $20.2 million from negative EBITDA of $4.6 million recorded in the same quarter last year. The primary reasons for the movements are discussed below. The increase in operating earnings was offset by impairment losses of $3.8 million recorded on the Company’s assets in Q4, 2006. Further details are provided in the “Critical Accounting Policies and Estimates” section. |
| | Sales volume of 145,500 tonnes in Q4, 2006 was consistent with the same period of 2005. |
| | Average sales revenue in Q4, 2006 was $744 per tonne, up $112 per tonne from Q4, 2005, due largely to stronger transaction prices, which more than offset the negative impact of the stronger Canadian dollar. |
| | Average cash costs in Q4, 2006 were $636 per tonne, an improvement of $28 per tonne from the same quarter of 2005, with savings from performance improvements more than offsetting higher fibre costs and the impact of inflation. |
| | The following table highlights the significant changes between the consolidated balance sheets as at December 31, 2006, and December 31, 2005. |
(In millions of dollars) | | 2006 | | 2005 | | Variance | | Comment | |
Working capital | | $ | 280.5 | | $ | 237.1 | | $ | 43.4 | | | Increase primarily reflects higher cash and cash equivalents, receivable levels, and reclasses of short-term liabilities to long-term liabilities. The increase was partially offset by higher payables. | |
Capital assets | | | 2,023.1 | | | 2,139.3 | | | (116.2 | ) | | Amortization expense including impairment losses of $23.4 million exceeded capital asset additions. Refer to the “Investing Activities” section for additional details on capital asset additions. | |
Other assets | | | 40.8 | | | 40.1 | | | 0.7 | | | Increase mostly reflects the increase in long-term receivables partly offset by the amortization of deferred financing costs. | |
Long-term debt | | | 854.5 | | | 861.9 | | | (7.4 | ) | | Decrease primarily reflects the $6.5 million repayment of revolving debt. Refer to the “Capital Resources” section for further details on the change in long-term debt. | |
Other long-term obligations | | | 214.7 | | | 209.7 | | | 5.0 | | | Increase primarily relates to higher employee future benefits and reclasses of short-term liabilities to long-term liabilities. This was partly offset by the reduction in fair value of hedging instruments. | |
Future income taxes and deferred credits | | | 269.4 | | | 325.2 | | | (55.8 | ) | $ | 22.9 million of the decrease relates to the reduction in the federal corporate tax rate. The balance of the reduction primarily relates to the future income tax on the 2006 losses. | |
Contributed surplus | | | 9.3 | | | 7.3 | | | 2.0 | | | Increase relates to the recording of stock based compensation. | |
| Selected Annual Financial Information | |
(In millions of dollars, except where otherwise stated) | | 2006 | | 2005 | | 2004 | |
| Cash flows provided by operations before changes in non-cash working capital | | $ | 170.0 | | $ | 104.5 | | $ | 88.9 | |
| Changes in non-cash working capital | | | (8.6 | ) | | (11.5 | ) | | (24.4 | ) |
| Cash flows provided by operations | | | 161.4 | | | 93.0 | | | 64.5 | |
| Cash flows used by investing activities | | | (85.8 | ) | | (93.0 | ) | | (41.8 | ) |
| Cash flows provided (used) by financing activities | | | (40.1 | ) | | (26.0 | ) | | 3.3 | |
| Capital spending | | | 93.2 | | | 95.2 | | | 68.0 | |
Amortization1 | | | 207.1 | | | 180.3 | | | 184.1 | |
| Capital spending as % of amortization | | | 45 | % | | 53 | % | | 37 | % |
Total debt to total capitalization2,3 | | | 46 | % | | 46 | % | | 44 | % |
Net debt to net capitalization4,5 | | | 45 | % | | 46 | % | | 43 | % |
| 1 | 2006 amortization expense includes a $19.1 million impairment loss related to the permanent closure of the A3 paper machine, and $4.3 million in other asset impairments. |
| 2 | Total debt comprises long-term debt, including current portion. |
| 3 | Total capitalization comprises total debt and shareholders’ equity. |
| 4 | Net debt comprises total debt, less cash on hand. |
| 5 | Net capitalization comprises net debt and shareholders’ equity. |
| Selected Quarterly Financial Information | |
(In millions of dollars) | | 2006 | | 2005 | |
| | | Q1 | | Q2 | | Q3 | | Q4 | | Q1 | | Q2 | | Q3 | | Q4 | |
| Cash provided (used) by operations (before changes in non-cash working capital) | | $ | 43.3 | | $ | 28.4 | | $ | 48.6 | | $ | 49.7 | | $ | 26.0 | | $ | 15.4 | | $ | 17.5 | | $ | 45.6 | |
| Changes in non-cash working capital | | | (1.9 | ) | | 18.2 | | | (27.4 | ) | | 2.5 | | | 5.2 | | | 16.3 | | | (39.3 | ) | | 6.3 | |
| Cash provided (used) by operations | | | 41.4 | | | 46.6 | | | 21.2 | | | 52.2 | | | 31.2 | | | 31.7 | | | (21.8 | ) | | 51.9 | |
| Capital spending | | | 11.8 | | | 17.5 | | | 22.9 | | | 41.0 | | | 11.4 | | | 34.5 | | | 23.8 | | | 25.5 | |
| | The Company’s principal cash requirements are for interest payments on its debt and for capital expenditures and working capital fluctuations. Cash flows are funded through operations and, where necessary, through the revolving operating facility (the “Facility”). If necessary, liquidity requirements may be funded through the issuance of debt, equity or both. Access to current and alternative sources of financing at competitive cost is dependent upon the Company’s credit ratings and capital market conditions. The Company believes that the cash flow from operations and the Facility will be sufficient to meet its anticipated capital expenditures and debt repayment obligations in the near and intermediate term. |
| | Cash flow provided by operating activities, after changes in non-cash working capital, was $161.4 million in 2006, compared to $93.0 million in the previous year. The increase of $68.4 million was primarily attributed to higher EBITDA and decreased non-cash working capital requirements in 2006. The Company’s operating cash flow requirements are primarily for labour, salaries and benefits, and the purchase of raw materials, energy and distribution services. Working capital requirements in 2007 are not expected to be materially different than those of 2006. |
| | Cash used for investing activities in 2006 totalled $85.8 million, compared to $93.0 million in the previous year. The Company’s capital spending in 2006 totalled $93.2 million, compared to $95.2 million in 2005. Major capital investments in 2006 included a $5.6 million project to bypass a primary clarifier and a $3.1 million project on a paper machine ventilation improvement, both at the Powell River division. In addition, there were various small-investment, high-return capital projects, including a number of projects to increase product quality. |
| | The Company anticipates that cash flows will be generated primarily from operations and the Facility. |
| | Cash used by financing activities was $40.1 million in 2006, compared to $26.0 million in the previous year. The increase of $14.1 million was primarily attributable to the absence of drawings on the Company’s revolving loan in 2006 and the repayment of the $6.5 million owing at the end of 2005. |
| | The Company’s capital resources at December 31, 2006 included cash and cash equivalents along with the amount available under the Facility. The Company’s $350.0 million Facility was undrawn. After outstanding letters of credit of $26.4 million, $323.6 million was available to be drawn at year-end 2006, compared to $316.0 million at year-end 2005. These resources, together with operating cash flows, are expected to enable the Company to meet its minimum payments. |
| | The following table presents the aggregate amount of future cash outflows for contractual obligations as of December 31, 2006, excluding amounts due for interest on outstanding indebtedness. |
| | | Payments Due by Period | |
(In millions of dollars) | | 2007 | | 2008 | | 2009 | | 2010 | | 2011 | | Thereafter | |
| Long-term debt | | $ | - | | $ | - | | $ | 75.0 | | $ | - | | $ | 468.7 | | $ | 310.8 | |
| Capital lease obligations | | | 0.7 | | | 0.7 | | | 0.7 | | | 0.7 | | | 0.7 | | | 1.9 | |
| Operating leases | | | 13.1 | | | 11.3 | | | 10.1 | | | 9.2 | | | 8.8 | | | 39.5 | |
| Other commitments | | | 1.6 | | | 1.6 | | | 1.6 | | | 1.6 | | | 1.6 | | | 0.5 | |
| Total | | $ | 15.4 | | $ | 13.6 | | $ | 87.4 | | $ | 11.5 | | $ | 479.8 | | $ | 352.7 | |
| | As at December 31, 2006, the total long-term debt outstanding was $854.5 million. Principal repayments on this debt do not begin until July 2009. The Company’s net-debt to net-capitalization ratio at December 31, 2006, was 45%, or 1% lower than December 31, 2005. |
| | The following table illustrates the changes in the Company’s long-term debt during 2006: |
Issue | | Carrying value December 31, 2006 | | Net increase (decrease) | | Foreign exchange | | Carrying value December 31, 2005 | |
(In millions of dollars) | | | | | | | | | |
Recourse Senior notes, 8.625% due June 2011 (US$400.0 million) | | $ | 468.7 | | $ | - | | $ | (0.7 | ) | $ | 469.4 | |
| Senior notes, 7.375% due March 2014 (US$250.0 million) | | | 291.3 | | | - | | | (0.2 | ) | | 291.5 | |
| Revolving operating facility of up to $350.0 million due July 2009 with interest based on Canadian Prime/BA rates or U.S. Base/LIBOR rates | | | - | | | (6.5 | ) | | - | | | 6.5 | |
Non-recourse (PREI) | | | | | | | | | | | | | |
| First mortgage bonds, 6.387% due July 2009 | | | 75.0 | | | - | | | - | | | 75.0 | |
| Subordinated promissory notes | | | 19.5 | | | - | | | - | | | 19.5 | |
Total long-term debt | | $ | 854.5 | | $ | (6.5 | ) | $ | (0.9 | ) | $ | 861.9 | |
| | The Company is in compliance with the covenants under its Facility and senior notes indentures. The Company’s Consolidated Fixed Charge Coverage Ratio (“CFCC Ratio”) under the senior note indentures calculated on a 12-month trailing average, was 3.0:1 as at December 31, 2006 (2.0:1 as at December 31, 2005). In the event that the CFCC Ratio is below 2.0:1, the Company is limited in the amount of additional debt it may incur beyond drawings under the Facility or other debt as permitted under the senior notes. Also, the Company’s restricted payments basket under the 8.625% and 7.375% senior notes was negative $72.5 million and negative $47.5 million, respectively, as at December 31, 2006 (negative $69.1 million and negative $44.1 million, respectively, as at December 31, 2005), as a result of the accumulation of losses in recent years. Under the senior note covenants, the Company is restricted from making certain payments, including the payment of dividends, unless the balances in these baskets are positive. |
| | In August 2006, Moody’s Investors Services, Inc. (“Moody's”) changed its outlook on the Company’s debt ratings to stable from negative. In September 2006, Moody's supplemented its rating methodology to incorporate "probability of default ratings" for its speculative-grade corporate families and "loss given default assessments" on its individual-rated debt issues. On the introduction of the enhanced rating methodology, Moody's raised its credit ratings on the Company’s secured revolving operating facility to Ba1 from Ba3 and lowered its credit ratings on the unsecured senior notes to B2 from B1. These changes are not expected to significantly affect the Company’s interest costs or its cost of capital. |
| | The following table highlights the Company’s credit ratings and outlook with Moody’s, Standard and Poor’s Corporation and Dominion Bond Rating Service as at December 31, 2006, 2005, and 2004: |
| | December 31, |
| | 2006 | 2005 | 2004 |
Moody’s | | | |
| Outlook | Stable | Negative | Negative |
| Corporate family rating | B1 | B1 | Ba3 |
| Senior unsecured debt | B2 | B1 | Ba3 |
| Senior secured credit facility | Ba1 | Ba3 | Ba2 |
| | | | |
| | | | |
Standard & Poor’s | | | |
| Outlook | Stable | Stable | Negative |
| Long-term corporate credit | B+ | B+ | BB- |
| Senior unsecured debt | B+ | B+ | BB- |
| Senior secured debt | BB- | BB- | BB |
| | | | |
| | | | |
Dominion Bond Rating Service | | | |
| Outlook | Negative1 | Negative | Stable |
| Senior unsecured debt | BB | BB | BB |
| 1 | Effective January 18, 2007, Dominion Bond Rating Service changed the Outlook to stable from negative. |
| | In the normal course of business, the Company is exposed to foreign currency and price risk associated with revenues, which are predominately in U.S. dollars, and to energy costs and long-term debt. In accordance with its foreign exchange risk management program, the Company manages its exposure to these risks through the use of financial instruments. The Company also uses interest rate swaps to reduce its exposure to long-term fixed interest rates associated with its senior notes. The Company does not enter into financial instruments for speculative purposes. |
| | Revenue risk management instruments |
| | In respect of revenues, the Company uses foreign currency options and forward contracts to sell U.S. dollars. At December 31, 2006, 61% of the options and contracts were designated as hedging instruments and the resulting foreign exchange translation gains and losses will be recognized concurrently with the hedged revenue in “Sales”. At period-end exchange rates, the net amount the Company would pay to settle the foreign currency options and forward contracts is $3.8 million, of which $6.0 million is included in “Prepaids and other”, $3.0 million is included in “Accounts payable and accrued liabilities”, and negative $6.8 million is not yet recorded in the financial statements. The hedging program improved the Company’s sales value by $14.3 million in 2006. |
| | At December 31, 2006, commodity swap agreements were outstanding to fix the sales price on NBSK pulp for 8,800 metric tonnes within the next 12 months at a weighted average PIX price of US$702 per tonne. These contracts are not designated as hedging instruments for accounting purposes and are reported at their fair value, which was negative $0.3 million at the end of 2006. |
| | Long-term debt risk management instruments |
| | In respect of long-term debt, the Company is party to US$23.0 million in forward foreign exchange contracts and options to acquire U.S. dollars over a five-year period. These instruments are not designated as hedging instruments for accounting purposes, and are included in “Other long-term obligations” on the balance sheet at their fair value. Settlements and changes in fair value are recognized in earnings as “Foreign exchange gain (loss) on translation of long-term debt”. At period-end exchange rates, the net amount the Company would pay to settle these contracts is $4.0 million. |
| | Cost risk management instruments |
| | To hedge against the effect of energy cost fluctuations, the Company enters into contracts to fix the price of a portion of the Company’s oil and gas exposure. The contracts are not designated as hedging instruments for accounting purposes and are reported as “Accounts payable and accrued liabilities” on the balance sheet at their fair value. Settlements and changes in fair value are recognized in “Cost of sales”. At period-end contract rates, the net amount the Company would pay to settle these contracts is $0.6 million, all of which is included in “Accounts payable and accrued liabilities” and has been recognized in “Cost of sales”. |
| | The Company occasionally uses interest rate swap contracts to manage its net exposure to interest rate changes. At December 31, 2006, the Company had pay-floating, receive-fixed interest rate swap contracts for notional US$100.0 million, and has designated them as hedging instruments. At period-end swap rates, the net amount the Company would receive to settle these contracts is $1.2 million. |
6.0 | RELATED PARTY TRANSACTIONS |
| | Effective February 16, 2006, Norske Skog sold its 29.4% shareholding in the Company. Concurrently, the three directors from Norske Skog resigned from the Company’s board of directors. Norske Skog had not been involved in the management of the Company since 2001, and the shareholder transaction has not impacted the Company’s operations or its current distribution agreement with Norske Skog in Asia. The Company did not receive any proceeds related to this transaction. |
| | Effective October 23, 2006, TAM increased its shareholdings in the Company on behalf of certain client accounts to 37.97% and as a result, became a significant shareholder together with its subsidiaries and affiliates. The Company did not undertake any transactions with TAM during the year ended December 31, 2006. |
| | The Company undertakes certain transactions with companies affiliated with a director of the Company. These transactions are in the normal course of business and are on the same terms as those accorded to third parties. During 2006, the Company paid aggregate fees of approximately $0.4 million (2005 - nil) primarily for legal services to a firm affiliated with a director of the Company. The Company has charged the costs to SG&A expense. In 2006, the Company also paid $3.9 million (2005 - $1.8 million) primarily for chemicals used in the manufacturing process to a company affiliated with an officer and director of the Company. The Company charged these costs to “Cost of sales”. |
| | The Company has advanced interest-free loans to officers of the Company. As at December 31, 2006, the balance outstanding was $0.1 million (2005 - $0.4 million). These loans were issued prior to the enactment of the United States Sarbanes-Oxley Act of 2002, which prohibits such loans, effective July 30, 2002. The Company has made no loans to any of its directors or officers since that date. |
7.0 | OFF-BALANCE SHEET ARRANGEMENTS |
| | The Company has ongoing programs with respect to financial instruments, for which it has elected to designate some as hedging instruments. The fair value of the following designated hedging instruments is not recorded in the financial statements: |
| § | Sales - Foreign currency options and forward contracts having a notional principal of US$385 million with major financial institutions. |
| § | Interest Rates - Fixed to floating interest rate swaps having a principal amount of US$100 million with major financial institutions. The Company will receive a fixed rate of 7.375%, and pay a floating rate averaging U.S. six-month LIBOR plus 2.0%. |
| | Further discussion of financial instruments is provided under “Financial Instruments” in the “Liquidity and Capital Resources” section. |
| | The Company sold a portion of its operations in June 2001. In this regard, the Company provided a 10-year environmental indemnity with a maximum liability to the Company of $12.5 million. This liability has subsequently been reduced by expenditures related to certain decommissioning projects. The Company provided a tax indemnity, which continues while the relevant tax years of the indemnified parties remain open to audit. The Company also provided a general indemnity capped at $5 million, which expired in 2004. The purchaser of the operations has advised the Company that, based on the terms of the purchase and sale agreement, it believes it may be entitled to indemnification under the general indemnity in connection with certain labour matters. The Company is unable to estimate any potential liability under these indemnities as the amounts are dependent upon the outcome of future contingent events, the nature and likelihood of which cannot be determined at this time. As such, no liability has been recorded for these potential obligations. |
| | The Company has entered into a building lease agreement whereby it will continue to make the prescribed lease payments directly to the financial institution holding the mortgage on the building in the event the lessor is no longer able to meet its contractual obligations. At December 31, 2006, the value of the mortgage was $11.9 million. This agreement does not increase the Company’s liability beyond the obligations for the building lease. |
| | Recycling plant acquisition |
| | In connection with the acquisition of the paper recycling business in December 2003, the Company has provided indemnities with respect to representations and warranties related to general corporate matters and to the shares that were issued to the vendors. Liability under these indemnities expires in November 2008, except that the indemnity related to title to the shares does not expire. The Company does not expect any significant claims with respect to these indemnities. The Company has also provided indemnities with respect to general environmental matters under its lease of the land and buildings. The Company has agreed to indemnify the landlord for all costs, claims and damages related to any release by the Company of any hazardous substances on the property or the breach by the Company of its environmental covenants under the lease or any environmental laws. This indemnity is indefinite and survives after the lease is terminated. The Company is not liable for pre-existing environmental conditions. |
8.0 | SUMMARY OF QUARTERLY RESULTS |
| | The following table highlights selected financial information for the eight consecutive quarters through to December 31, 2006. A more detailed analysis of Q4, 2006 results is provided in the “Quarterly Segmented Results of Operations” section. |
(In millions of dollars, except per share amounts) | | 2006 | | 2005 | |
| | | Q1 | | Q2 | | Q3 | | Q4 | | Q1 | | Q2 | | Q3 | | Q4 | |
| Sales | | $ | 456.3 | | $ | 469.6 | | $ | 486.0 | | $ | 470.6 | | $ | 462.7 | | $ | 439.0 | | $ | 450.3 | | $ | 471.9 | |
EBITDA1 | | | 47.3 | | | 52.4 | | | 62.8 | | | 48.5 | | | 33.6 | | | 25.4 | | | 47.9 | | | 48.3 | |
| Net earnings (loss) | | | (23.6 | ) | | 42.4 | | | 2.5 | | | (37.2 | ) | | (21.8 | ) | | (30.0 | ) | | 34.2 | | | (8.0 | ) |
| Net earnings (loss) per share - basic and diluted | | $ | (0.11 | ) | $ | 0.20 | | $ | 0.01 | | $ | (0.17 | ) | $ | (0.10 | ) | $ | (0.14 | ) | $ | 0.16 | | $ | (0.04 | ) |
| 1 | EBITDA is a non-GAAP measure. Refer to the “Non-GAAP Measures” section for further details. |
| | In Q1, 2006, the net loss increased by $15.6 million ($0.07 per common share), compared to Q4, 2005, due largely to an $11.6 million after-tax impairment loss, which was partially offset by a $1.9 million decrease in the after-tax foreign exchange loss arising from the translation of U.S.-dollar-denominated debt. |
| | In Q2, 2006, the $66.0 million ($0.31 per common share) improvement in net earnings, compared to Q1, 2006, was related primarily to a $26.5 million increase in foreign exchange gain on the translation of U.S.-dollar-denominated debt, a $22.9 million release of future income taxes related to the reduction in the federal corporate income tax rate, and the absence of the $11.6 million after-tax impairment loss recorded in the previous quarter. |
| | In Q3, 2006, the $39.9 million ($0.19 per common share) decrease in net earnings, compared to Q2, 2006, was due largely to a decrease in the after-tax foreign exchange gain arising from the translation of U.S.-dollar-denominated debt of $26.1 million, and the absence of the $22.9 million release of future income taxes recorded in the previous quarter. |
| | In Q4, 2006, the $39.7 million ($0.18 per common share) increase in net loss, compared to Q3, 2006, was due largely to an increase in the after-tax foreign exchange loss arising from the translation of U.S.-dollar-denominated debt of $26.3 million and an after-tax impairment loss of $3.8 million. |
| | The following measure, included in this report, does not have a standardized meaning under Canadian GAAP. |
| | EBITDA (earnings before interest, income taxes, depreciation and amortization), as defined, equates to operating earnings (loss) plus amortization. The Company focuses on EBITDA as the Company believes this measure enables comparison of the Company’s results between periods without regard to debt service, income taxes and capital expenditure requirements. As such, the Company believes it would be useful for investors and other users to be aware of this measure so they can better assess the Company’s operating performance. This measure should not be considered by an investor as an alternative to net income, an indicator of the financial performance of the Company or an alternative to cash flows as a measure of liquidity. |
| | As there is no generally accepted method of calculating EBITDA, the measure as calculated by the Company might not be comparable to similarly titled measures reported by other companies. |
| | The following table reconciles the Company’s net earnings (loss) to EBITDA: |
(In millions of dollars) | | 2006 | | 2005 | | 2004 | |
| Net earnings (loss) | | $ | (15.9 | ) | $ | (25.6 | ) | $ | (28.6 | ) |
| Amortization | | | 183.7 | | | 180.3 | | | 184.1 | |
| Impairment loss on property, plant and equipment | | | 23.4 | | | - | | | - | |
| Foreign exchange (gain) loss on translation of long-term debt | | | 0.3 | | | (24.7 | ) | | (53.5 | ) |
| Loss on repayment of long-term debt | | | - | | | - | | | 5.2 | |
| Other (income) expense, net | | | (1.8 | ) | | (4.5 | ) | | (1.2 | ) |
| Interest expense, net | | | 73.8 | | | 75.7 | | | 74.9 | |
| Income tax recovery | | | (54.0 | ) | | (46.6 | ) | | (28.1 | ) |
| Non-controlling interest | | | 1.5 | | | 0.6 | | | - | |
| EBITDA | | $ | 211.0 | | $ | 155.2 | | $ | 152.8 | |
10.0 | CRITICAL ACCOUNTING POLICIES AND ESTIMATES |
| | The preparation of financial statements in conformity with Canadian GAAP requires companies to establish accounting policies and to make estimates that affect both the amount and timing of recording of assets, liabilities, revenues and expenses. Some of these estimates require judgments about matters that are inherently uncertain. |
| | Note 2 to the December 31, 2006 consolidated financial statements includes a summary of the significant accounting policies used in their preparation. While all of the significant accounting policies are important to the consolidated financial statements, some of these policies may be viewed as involving a high degree of judgement. On an ongoing basis using currently available information, management reviews its estimates, including those related to environmental and legal liabilities, impairment of long-lived assets, pension and post-retirement benefits, provision for bad and doubtful accounts, and income taxes. Actual results could differ from these estimates. |
| | The following accounting policies require management’s most difficult, subjective and complex judgements, and are subject to a fair degree of measurement uncertainty. |
| | 10.1 | Environmental and legal liabilities |
| | Environmental and legal liabilities are recorded on an undiscounted basis when it is considered probable that a liability has been incurred and the amount of the loss can be reasonably estimated. Liabilities for environmental matters require evaluations of applicable environmental regulations and estimates of remediation alternatives and the costs thereof. Provisions for liabilities relating to legal actions and claims require judgments regarding projected outcomes and the range of loss, based on such factors as historical experience and recommendations of legal counsel. |
| | As at December 31, 2006, the Company had a provision of approximately $23 million for environmental, remedial and other obligations. In addition, the Company capitalized approximately $7 million, related largely to the improvement of air emission. The Company expects capital expenditures relating to known environmental matters, including compliance issues and the assessment and remediation of the environmental condition of the Company’s properties, will total approximately $2 million in 2007. |
| | The Company reviews long-lived assets, which are primarily plant and equipment, for impairment when events or changes in circumstances indicate that the carrying value of these assets may not be recoverable. Canadian GAAP requires the Company to make certain judgments, assumptions and estimates in identifying such events and changes in circumstances, and in assessing their impact on the valuations and economic lives of the affected assets. A long-lived asset impairment is possible when an asset’s carrying value exceeds management’s estimate of its undiscounted future cash flows. Impaired assets are recorded at fair value, determined principally by using discounted future cash flows expected from their use and eventual disposition. Key assumptions used in estimating the future cash flow and fair value include, for example, future product pricing over the commodity cycle, foreign exchange rates, and future estimates of useful life. |
| | In Q1, 2006, after undertaking an operational review of the A3 paper machine, the Company determined that the previously announced indefinite closure of this machine would be permanent. Accordingly, the Company tested the long-lived assets of the permanently closed paper machine for impairment. This impairment test required making estimates of the fair value of the long-lived assets that the Company expected would not continue to be used on other paper machines in its inventory. The fair value was based on management’s estimates of the value of used paper machine equipment. As a result of this test, the Company recorded a $17.6 million impairment loss in Q1, 2006. |
| | In Q4, 2006, the Company completed a thorough review of the A3 paper machine long-lived assets that were expected to be used on other paper machines in its inventory. This review was primarily done by the mill’s engineering group, and included a feasibility analysis, consideration of future capital spending plans, and determination of maintenance requirements. Through the review, the Company determined that it would not be desirable to use on other paper machines some of the long-lived assets it originally expected could be used. The Company then made estimates of the fair value of these long-lived assets. Similar to the impairment exercise in Q1, 2006, the fair value of the long-lived assets that weren’t going to be used on other paper machines was based on management’s estimate of the value of used paper machine equipment. Accordingly, the Company increased its estimate of the A3 paper machine impairment loss by $1.5 million in Q4. In total, the A3 paper machine impairment loss was $19.1 million, which was booked in the newsprint segment. |
| | In Q3, 2006, the Company announced it was indefinitely idling its Port Alberni groundwood pulp mill, effective September 30, 2006, and was planning to replace the high-cost groundwood pulp with recycled fibre from the Company’s recycling division. At that time, it was uncertain whether this strategy would negatively affect the Company’s ability to fibre its mills because the fourth and first quarters are traditionally high fibre-usage periods. It was determined late in Q4, 2006 that the recycled fibre strategy was effective and, as a result, the Company concluded that the groundwood mill closure was permanent. Accordingly, the Company determined which long-lived assets would be retained for alternate uses. The Company then made an estimate of the fair value of the long-lived assets that were not going to be retained. Fair value was based on management’s estimate of the value of the used pulp mill equipment. Due to the age of the long-lived assets that were not going to be retained, the carrying cost of these assets was low and, as a result, the impairment loss recorded in Q4, 2006 was less than $0.1 million. The impairment loss was recorded in the specialty papers segment in “Cost of sales”. |
| | As part of its annual review of long-lived assets, the Company in Q4, 2006 identified certain long-lived assets that had been previously idled and determined that these assets would not be brought back into service. Accordingly, the Company made an estimate of the fair value of these assets based on scrap metal prices, net of removal costs and recorded an impairment loss of $4.3 million in Q4, 2006. The impairment loss was recorded in the pulp and specialty papers segments, $3.8 million and $0.5 million, respectively. |
| | Long-lived assets represented approximately 77% of total assets as at December 31, 2006. If future developments were to differ adversely from management’s best estimate of key assumptions and associated cash flows, the Company could potentially experience future material impairment charges. |
| | Due to the numerous variables associated with judgments and assumptions relating to the valuation of assets in such situations, the precision and accuracy of estimates of related impairment charges are subject to significant uncertainties and may change significantly as additional information becomes known. |
| | 10.3 | Pension and post-retirement benefits |
| | The Company maintains various employee future benefit plans, which include defined benefit pension and post-retirement benefit plans. The Company retains independent actuarial firms to perform actuarial valuations of the fair value of the Company’s defined benefit pension and post-retirement benefit plan assets and benefit obligations, and advise on the amounts to be recorded in the Company’s financial statements. This information is determined using certain assumptions, based on historical and market data that directly impact the fair value of the assets and obligations as well as the charges disclosed in the Company’s financial statements. These assumptions include: |
| · | The discount rate which is used to estimate the actuarial present value of the various plan obligations. The Company, assisted by independent actuarial advisors, sets the discount rate assumption annually to reflect the rates available on high-quality debt instruments, with cash flows that are expected to match the timing and amount of expected benefit payments. The discount rate, as at December 31, 2006, was estimated to be 5.0%. |
| · | The long-term return on assets used to estimate the growth in the value of invested assets available to satisfy certain obligations. The Company, with the assistance of independent actuarial firms, annually sets the expected rate of return on plan assets to reflect the current view of long-term investment returns. As at December 31, 2006, a rate of return of 7.0% was determined by management in consultation with its independent actuarial advisors. |
| · | Salary increases used to estimate the impact that future compensation increases will have on pension and other post-retirement obligations. As at December 31, 2006, the rate of compensation increase of 3.0% was determined by management in consultation with its independent actuarial advisors. |
| · | Health care trend rates and mortality rates used to estimate the impact that future health care costs will have on pension and post-retirement obligations. As at December 31, 2006, an initial health care trend rate of 9.0% was determined by management in consultation with its independent actuarial advisors. The initial health care trend rate is expected to decline by 1.0% annually, and the ultimate health care trend rate is estimated to be 5.0%. |
| | Actual experience can vary significantly from estimates and could materially impact the estimated cost of employee benefit plans and future cash requirements. |
| | The following table provides a sensitivity analysis of the key weighted average economic assumptions used in measuring the accrued pension benefit obligation, and the accrued other employee future benefit and related net periodic benefit cost for 2006. This sensitivity analysis should be used with caution as it is hypothetical and changes in each key assumption may not be linear. The sensitivities in each key variable have been calculated independently of each other. |
| | Pension benefit plans | Other benefit plans |
(In millions of dollars) | Accrued benefit obligation | Net 2006 expense | Accrued benefit obligation | Net 2006 expense |
| Expected rate of return on assets | | | | |
| Impact of: | | | | |
1% increase | N/A | (2.4) | N/A | N/A |
1% decrease | N/A | 2.4 | N/A | N/A |
| Discount rate | | | | |
| Impact of: | | | | |
1% increase | (34.8) | (3.8) | (31.6) | (2.7) |
1% decrease | 38.4 | 3.7 | 36.9 | 2.9 |
| Assumed overall health care cost trend | | | | |
| Impact of: | | | | |
1% increase | N/A | N/A | 41.6 | 6.1 |
1% decrease | N/A | N/A | (33.0) | (4.8) |
| | The Company uses generally accepted practices in estimating required provisions for doubtful accounts and bad-debt losses arising on trade and other receivable balances. The Company’s estimate of the required allowance is a matter of opinion and the actual loss eventually sustained may be more or less than estimated. |
| | The Company regularly reviews the collectibility of its accounts receivable. The Company records its allowance for doubtful accounts based on its best estimate of any potentially uncollectible accounts by highlighting those that are specifically high risk and applying judgement to determine its estimate. Consideration is given to current economic conditions and specific customer circumstances to determine the amount of any bad-debt expense to be recorded. While the Company has not experienced any significant bad-debt expense in prior periods, declines in the economy could result in collectibility concerns. Accounts receivable balances for individual customers could potentially be material at any given time. |
| | In September 2006, the Company strengthened its accounts receivable insurance coverage by purchasing account receivable put options on selected accounts receivable balances. As a result of adding this form of insurance coverage, the Company reassessed its allowance for doubtful accounts and reduced its allowance for doubtful accounts by $3.3 million. As at December 31, 2006, “Accounts receivable” comprised approximately 11% of total assets. Included in this balance was a provision of approximately $3.1 million for doubtful accounts, or approximately 1.1% of accounts receivable (as at December 31, 2005, approximately $7.0 million for doubtful accounts, or approximately 2.8% of accounts receivable). |
| | The amounts recorded for future income tax assets and liabilities are based on various judgments, assumptions and estimates. Future tax assets and liabilities are measured using enacted or substantively enacted tax rates for the years in which assets and liabilities are expected to be recovered or settled. For these years, a projection is made of taxable income and estimates made of the ultimate recovery or settlement of temporary differences. The projection of future taxable income is based on management’s best estimate and may vary from actual. |
| | The Company’s future tax assets are mainly composed of temporary differences relating to employee future benefits and loss carryforwards. Future tax liabilities are mainly composed of temporary differences pertaining to property, plant and equipment. Estimating the ultimate settlement period for these temporary differences requires judgment. The reversal of these temporary differences is expected to be at future substantially enacted rates which could change due to changes in income tax laws. As a result, a change in the timing of reversal or in the income tax rate could materially affect the future tax expense recorded in the consolidated statement of earnings. A one-percentage-point change in the Company’s reported effective income tax rate would have the effect of changing the income tax expense by approximately $8.1 million. |
| | In addition, the Company records provisions for federal, provincial and foreign taxes based on the respective tax laws of the jurisdictions in which the Company operates and its judgment as to the appropriate allocation of income and deductions to those jurisdictions. Canadian, U.S. and international tax laws are subject to interpretation and the Company’s judgment may be challenged by taxation authorities. In such circumstances, the final resolution of these challenges can result in settlements that differ from the Company’s estimated amounts. |
11.0 | CHANGES IN ACCOUNTING POLICIES |
| | The Company did not adopt any new accounting standards or change any accounting policies in 2006. |
12.0 | IMPACT OF ACCOUNTING PRONOUNCEMENTS AFFECTING FUTURE PERIODS |
| | In April 2005, the Canadian Institute of Chartered Accountants issued the following new accounting standards, which impact the recognition, measurement and disclosure of financial instruments, hedges and comprehensive income: |
1. Section 1530, “Comprehensive Income”, defines and establishes the reporting requirements for comprehensive income.
2. Section 3251, “Equity”, replaces Section 3250, “Surplus”, and establishes standards for the presentation of changes in equity.
3. Section 3855, “Financial Instruments - Recognition and Measurement”, establishes the requirements for the recognition and measurement of financial assets, financial liabilities and non-financial derivatives.
4. Section 3861, “Financial Instruments - Disclosure and Presentation”, replaces Section 3860, “Financial Instruments - Disclosure and Presentation”, and establishes the requirements for presentation and disclosure of financial instruments and non-financial derivatives.
| | | 5. | Section 3865, “Hedges”, establishes the standards for when and how hedge accounting may be applied. |
| | The new sections are all to be applied at the same time and are effective for interim and annual financial statements relating to fiscal years beginning on or after October 1, 2006. Early adoption is permitted, but only as of the beginning of a fiscal year ending on or after December 31, 2004. The Company is currently in the process of evaluating the impact of the new accounting standards on its financial position, results of operations, and cash flows. |
| | The Company produces and markets pulp and paper products that are sold globally. The Company seeks to differentiate its product lines from those of other producers by supplying specialty products that add value for customers. However, like most companies in the forest products industry in North America, the Company faces business risks and uncertainties. These fall into the general business areas of markets, international commodity prices, currency exchange rates, environmental issues, fibre supply, government regulation and policy, and for Canadian companies, trade barriers and potential impacts of Aboriginal rights, including unresolved Aboriginal land claims in British Columbia. |
| | In order to address these risks and effectively manage them, the Company’s management has developed a process for managing risk and the interrelationships risks have with the Company’s strategic plan. Management provides regular updates to the Audit Committee, works with corporate and operational management to identify, measure and prioritize the critical risks facing the Company, and manages these risks by ensuring that they are adequately addressed through mitigating procedures where appropriate. The objectives of the risk management function include developing a common framework for understanding what constitutes principal business risks, ensuring that risk management activities are aligned with business strategies, and providing an effective mechanism for governance in the area of risk management. |
| | A discussion of the principal uncertainties to which the Company is subject follows. |
| | The Company’s markets are commodity-based and cyclical in nature. Markets for the principal products are affected by fluctuations in supply and demand within each cycle, which in turn affect product prices. Demand has historically been determined by the level of economic growth and has been very closely tied to overall business activity and personal income. The Company’s earnings are sensitive to price changes for its principal products, with the effect of price changes on specialty and newsprint grades being the greatest. |
| | The newsprint market is mature, but the Company believes it remains well positioned to mitigate the impact of this decline through its ability to switch grades. |
| | The “Sensitivity Analysis” section provides further details about the Company’s sensitivity to product price fluctuations. |
| | Pulp and paper markets are highly competitive global commodity markets in which producers compete primarily on the basis of price. A majority of the Company’s production is directed to markets outside Canada, where Canadian producers generally compete with American, European and Asian producers. Many of the Company’s competitors are larger and have greater financial resources than the Company and some of the mills operated by the Company’s competitors are lower cost producers than the mills the Company operates. The Company is focused on improving productivity and reducing costs to stay competitive. |
| | A significant portion of the Company’s sales are outside Canada and the United States. Therefore, the Company faces a number of risks including tariffs and other trade barriers, political and economic instability in foreign markets, and fluctuations in foreign currencies. |
| | Under the terms of the Company’s distribution agreement with an affiliate of Norske Skogindustrier ASA, either party on six months notice may terminate the agreement. If the agreement is terminated, the Company will be required to replace the distributor within the six-month notice period in order to minimize disruption to sales activities in the relevant market. |
| | The Company’s profitability is subject to fluctuations in foreign currencies, particularly the U.S. dollar, which is the currency in which most sales are denominated. Fluctuations in foreign currencies affect the Company’s competitive position in world markets. Apart from the value of the Canadian dollar relative to the U.S. dollar, the Company’s competitiveness in world markets is affected by the relative strength of the currencies of other producing countries. The Company is also exposed to currency exchange risk on debt denominated in U.S. dollars, including its 7.375% and 8.625% senior notes. |
| | Under a Board-approved foreign exchange risk management program, the Company manages a portion of its currency exposure through the use of currency options and forward contracts to hedge anticipated future sales denominated in foreign currencies and U.S.-dollar-denominated debt. The Company’s hedging policy for revenues includes 33% to 67% of 0- to 12-month and 0% to 25% of 13 to 24-month U.S. dollar net exposure. The Company considers its U.S. dollar revenues to act largely as a hedge of its U.S.-dollar-denominated debt. The revenue hedge program mitigates the impact of any rapid movements in currency by 40% to 50% over the near term. |
| | The “Sensitivity Analysis” section provides further details about the Company’s sensitivity to foreign exchange fluctuations. |
| | Since the Company has no significant timber holdings, operations are dependent on the supply by third parties of wood fibre, over half of which is provided by three suppliers. The Company’s fibre supply could be reduced as a result of events beyond its control, such as industrial disputes, natural disasters, material curtailments, and shutdown of operations by suppliers or the Company for market or other reasons. Market-related curtailments or shutdowns can be influenced by both seasonal and cyclical factors such as raw material availability, finished goods inventory levels, or interest rates and underlying demand for lumber in key markets. |
| | Long-term fibre contracts with third parties are conducted at market prices or at prices determined under market-based formulas and represent approximately 70% of the Company’s pulp and paper mills’ wood fibre requirements. The solid wood segment of British Columbia’s forest industry has undergone significant consolidation and downsizing. As a result, there is no assurance that the Company will continue to be able to access wood fibre at the same levels achieved in the past; therefore, costs may be negatively impacted. |
| | The Company is currently monitoring the impacts of the softwood lumber agreement and the weakening U.S. housing market to determine British Columbia’s lumber producers’ ability to maintain production levels. The Company’s cost of wood fibre could be negatively impacted if its wood fibre suppliers are forced to alter their operations such that they are not able to supply wood fibre to the Company at current levels or from cost-effective locations or due to increased market prices. |
| | In addition, government regulations and aboriginal issues may also lower the supply of wood fibre. The Province of British Columbia owns approximately 95% of all timberlands and could introduce legislation to reduce wood fibre supply. Aboriginal groups have claimed aboriginal title over substantial portions of British Columbia, including areas where the forest tenures held by the Company’s suppliers are located. Although the renewal of forest tenures held by the Company’s suppliers may be adversely impacted by claims of aboriginal title, the specific impact cannot be estimated at this time. |
| | The Company is also a large consumer of old newspapers and magazines. Ownership of Western Canada’s largest paper recycling facility enables the Company to secure 100% of its recycled fibre needs from this facility. While the supply remains reliable, the pricing is determined by the market and is subject to variability. |
| | The “Sensitivity Analysis” section provides further details about the Company’s sensitivity to fibre cost movements. |
| | The Company’s ability to operate its manufacturing facilities may also be affected by aboriginal groups’ claims of aboriginal title and rights. The governments of Canada and British Columbia have established a formal process to negotiate settlements with aboriginal groups throughout British Columbia in order to resolve these land claims. It is the policy of the governments that ownership of lands held in fee simple by third parties such as the Company will not be affected by treaty negotiations. In the case of the Powell River mill, the site has been included in areas to which an aboriginal group has asserted aboriginal title both through treaty negotiations with government and by commencing an action in the Supreme Court of British Columbia. While the Company and other industrial companies have been named as parties in the court proceeding along with the two governments of Canada and British Columbia, counsel for the aboriginal group has advised the Company that the plaintiffs are currently negotiating with two governments and have no intention of proceeding with the action at this time. Based on the history of similar proceedings, the Company expects that it would take many years before a final court decision could be rendered if the court proceeding were pursued. |
| | Recent Supreme Court of Canada decisions have confirmed that the governments of Canada and British Columbia are obligated to consult with and, in certain circumstances, accommodate aboriginal groups whenever there is a reasonable prospect their decisions, such as the decision to issue or amend a regulatory permit, may affect aboriginal groups’ rights or title. This duty of consultation and accommodation may affect the Company’s ability to obtain or amend necessary regulatory permits on a timely basis and may influence the conditions set out in such permits. In mid-2005 the Government of British Columbia initiated a “new relationship” policy related to Aboriginal interests that recognizes the need to find pre-treaty solutions to advance the consultation process and to reconcile governmental interests and Aboriginal interests. This new relationship policy is directed, in part, at improving decision-making affecting land and resource use. It is unclear what, if any, impact the new relationship policy will have on governmental decision making as it affects the Company. |
| | The Company is a significant consumer of electrical power. |
| | The Company’s electricity supply contracts are provincially regulated, and historically pricing has been very stable. In April 2004 there was a rate increase of approximately 5%, the first increase in 11 years. In early 2006, BC Hydro (the “Utility”) announced an interim rate increase of 4.65%, effective July 1, 2006, subject to regulatory approval in late 2006. In November 2006, after a negotiated settlement process, the Utility regulatory commission approved a final rate increase of 1.54%, effective July 1, 2006 to January 31, 2007. The higher rate increase will remain in effect until the end of January 2007. In March 2007, the Utility plans to issue a refund to customers based on the difference between the interim 4.65% increase and the final 1.54% rate increase for the period July 1, 2006 to January 31, 2007. In addition, the Utility regulatory commission approved a further increase of 1.64% over the Utilities rate prior to July 2006, effective February 1, 2007 and will also charge an additional rate rider of 2% on all customer bills for the period February 1, 2007 to March 31, 2008. The Company has recorded a $2.8 million receivable for the refund applicable for the period July 1, 2006 to December 31, 2006. The Company believes that the Province’s electricity rates will continue to be low relative to other regions in North America, but going forward the Utility will be requesting rate increases on a more regular basis than in the past should the cost of electricity sources continue to rise. Consequently, future changes in electricity prices could have a significant impact on the Company’s earnings. |
| | Effective April 1, 2006, the Utility implemented its redesigned rate structure for industrial customers. The new rate structure has resulted in the Company acquiring 90% of the electricity purchased from the Utility at an annual rate that is lower than the previous regulated rate, and 10% of the electricity at an annual rate that approximates the long-term acquisition costs paid by the Utility for incremental electricity. The change in rate structure, by design, is not expected to materially impact the Company's total cost of electricity, assuming no change to the Company’s electricity consumption, but it has been designed to motivate industrial customers to reduce their electricity consumption. Consequently, the new rate structure has provided substantial, but yet to be quantified, opportunity for cost reductions. |
| | The majority of the Company’s fossil fuels, particularly oil and natural gas, are purchased on the spot market, which can fluctuate significantly depending on various external factors. |
| | A portion of the Company’s exposure to fluctuating fossil fuel prices is managed through the use of financial instruments and physical supply contracts, under a Board-approved energy program. The Company’s energy hedging policy is restricted to 20-70% of the net exposure for oil and gas. In addition, the Company reduces its exposure to fossil fuel prices through the use of lower priced alternatives. |
| | Freight charges and chemical expenses also vary with oil and diesel fuel prices. |
| | The “Sensitivity Analysis” section provides further details about the Company’s sensitivity to energy cost fluctuations. |
| | In the ordinary course of business, the Company occasionally will become party to legal proceedings, which are generally related to contract disputes and employment law. As at December 31, 2006, the final results of currently ongoing legal proceedings, while not immediately determinable, are not expected to have a material effect on financial results. |
| | In early 2004, the European Commission began an investigation into possible anti-competitive practices by certain European paper producers. Shortly after the investigation was announced, the Company and certain of its affiliates were named, together with a number of other paper producers, in several United States class action lawsuits brought by direct and indirect purchasers alleging an ongoing conspiracy to fix prices of magazine and other publication papers. In late 2006, the European Commission reportedly completed its investigation and the Company was also conditionally dismissed from the class action brought by direct purchasers. The Company remains a defendant in class actions brought by indirect purchasers. The Company believes there is no merit to the lawsuits with respect to the Company, but will nonetheless continue to incur related costs to defend itself. |
| | The Company has recorded a net loss in seven of the last 12 quarters. These losses have arisen primarily as a result of the strengthening Canadian dollar and, to a lesser extent, market conditions. Should market conditions deteriorate to a greater extent, the Company may, over time, need to rely to a greater extent on its Facility and, if necessary, additional sources of funding. |
| | In particular, the Company’s pulp operations, like those of other producers, have recently been under pressure as a result of the relatively strong Canadian dollar and market conditions that do not compensate producers for rising energy costs. While under current market projections the Company expects to operate its pulp facilities, deterioration in market conditions or unplanned capital expenditures may necessitate temporary or permanent curtailment. |
| | The Company has a significant amount of debt, and its debt agreements contain various restrictive and financial covenants. The Company’s ability to pay interest on and satisfy its debt obligations will depend on its future operating performance and ability to obtain additional debt or equity financing when necessary. Prevailing economic conditions and financial, business and other factors beyond the Company’s control may affect its ability to make these payments. In addition, the Company’s debt level may limit its ability to obtain additional financing and increase its vulnerability to interest rate fluctuations. Should the challenging market conditions continue, the Company may, over time, have to rely to a greater extent on its Facility and, if necessary, additional sources of funding. |
| | The Company’s operations are subject to a wide range of general and industry-specific environmental laws and regulations related to waste management. The costs of compliance with such laws and regulations can be significant. The Company continually monitors its environmental performance and believes that its facilities are operating in substantial compliance with environmental laws and regulations. |
| | Many of the Company’s suppliers and service providers are unionized. Strikes or work stoppages by members of those unions could result in a significant disruption of operations or higher operating costs, which could have a material adverse effect on the business. |
| | The majority of the Company’s wood fibre supplier employees are members of the United Steelworkers of Canada whose contract is set to expire on June 15, 2007. The Company believes that the union and the employees will be able to come to terms without a work stoppage. However, should a work stoppage occur, the Company’s wood fibre supply could be negatively impacted both in terms of volume and cost. Contingency plans have been developed to mitigate against a supply disruption resulting from a potential labour impasse. |
| | The majority of the Company’s pulp and paper mill employees are members of the Communications, Energy & Paperworkers Union of Canada (“CEP”), the Pulp, Paper and Woodworkers of Canada (“PPWC”) or the Canadian Office and Professional Employees Union (“COPE”) unions. Distribution centre employees are members of the Christian Labour Association of Canada (CLAC). Collective agreements with the CEP and PPWC unions expire in April 2008. During Q1, 2006, the Company negotiated a new collective agreement with COPE, the smallest of the three unions, that expires on April 30, 2012. The collective agreement with CLAC expires April 2012. The Company believes its labour relations are strong and does not anticipate labour disruptions in its operations. |
| | The Company’s earnings are sensitive to fluctuations in: |
| | The Company’s products are commodity-based and cyclical in nature. As a result, earnings are sensitive to price changes, with the effect of price changes on specialty paper grades and newsprint being the greatest. |
| | The Company’s products are primarily sold in Canada, the United States, Asia and Australasia, Latin America and Europe. The majority of sales are denominated in foreign currencies, principally the U.S. dollar. As a result, the Company is exposed to foreign currency market risk on accounts receivable and future sales. |
| | The Company’s earnings could be significantly impacted by changes in prices and terms of energy supply contracts, as the Company is a significant consumer of electrical power, fossil fuels, and inputs whose pricing is highly correlated to energy. |
| | The Company’s supply of fibre is reliable, although it is subject to market influences and has some degree of variability. Fibre supply includes wood chips, logs and old newspapers (“ONP”). |
| | The Company’s annual EBITDA, net earnings and earnings per share are estimated to be impacted by changes in product prices, foreign exchange and input costs as follows: |
(In millions of dollars, except per-share amounts) | | EBITDA5 | | Net earnings1 | | Earnings per share | |
Product prices2 | | | | | | | |
| A US$10 per tonne change in the sales price of: | | | | | | | |
Specialty papers | | $ | 12.8 | | $ | 8.5 | | $ | 0.04 | |
Newsprint | | | 7.2 | | | 4.7 | | | 0.02 | |
Pulp | | | 5.8 | | | 3.9 | | | 0.02 | |
Foreign exchange3 | | | | | | | | | | |
| A US$0.01 change in the U.S. dollar relative value of the Canadian dollar | | $ | 14.0 | | $ | 9.2 | | $ | 0.04 | |
Energy cost sensitivity4 | | | | | | | | | | |
| A 5% change in the price of: | | | | | | | | | | |
Natural gas and oil - direct purchases | | $ | 3.6 | | $ | 2.3 | | $ | 0.01 | |
Electricity - direct purchases | | | 8.6 | | | 5.7 | | | 0.03 | |
Fibre sensitivity4 | | | | | | | | | | |
| A 5% change in the price of: | | | | | | | | | | |
Wood chips and sawdust | | $ | 13.9 | | $ | 9.2 | | $ | 0.04 | |
ONP | | | 1.3 | | | 0.8 | | | Less than $0.01 | |
| 1 | Based on an expected tax rate of 34%. |
| 2 | Based on full 2007 capacities. |
| 3 | Based on a movement from US$0.86 to US$0.87, and excludes the Company’s hedging program and the impact of the Company’s translation of U.S.-dollar-denominated debt. |
| 4 | Based on 2006 consumption levels. |
| 5 | EBITDA is a non-GAAP measure. Refer to the “Non-GAAP Measures” section for further details. |
2007 is shaping up to be a challenging year for the Company and industry. At the forefront, the U.S. economy is expected to weaken in 2007. As well, fibre prices continue to increase because of regional market price increases and supply limitations, putting additional pressure on the Company’s margins.
Labour disruption may arise between four tugboat and barging operators and the Canadian Merchant Services Guild. These operators are responsible for the transportation of fibre through the Fraser River as well as berthing at Crofton. Contingency plans have been established to ensure a continuity of supply should a disruption arise, but the Company may incur additional costs as a result of this disruption.
Canadian National Railway is in negotiations with the United Transportation Union, the union representing its train conductors and yard service crews. The union has commenced strike action. A strike could potentially affect inbound deliveries of materials to the Company’s mills and outbound distribution of the Company’s products. Contingency plans are in place, but the Company may incur additional costs if a strike occurs.
The Company’s 2007 Performance Improvement Program, which is currently under review, is expected to drive additional EBITDA benefits. In 2007, the Company is anticipating performance improvements through efforts in all areas, but there is a focus on manpower reductions.
Exchange rates are moving in the Company's favour with the weaker Canadian dollar assisting on the operating revenue side and the strong Euro putting cost pressures on European specialty paper producers.
Capital spending is expected to continue to be directed toward high-return projects. Unlike the previous year when annual planned maintenance was evenly distributed through each quarter, the Company currently expects its 2007 annual planned maintenance on its pulp and paper facilities to be more heavily weighted toward the first half of the year.
16.0 | DISCLOSURE CONTROLS AND INTERNAL CONTROL OVER |
FINANCIAL REPORTING
| | The Company conducted an evaluation under the supervision and with the participation of the Company’s management, including the chief executive officer and chief financial officer, as of December 31, 2006, of the effectiveness of the design and operation of the Company’s disclosure controls and procedures. Based on this evaluation, the Company’s chief executive officer and chief financial officer concluded that such disclosure controls and procedures are effective to ensure that information required to be disclosed by the Company in reports it files or submits under applicable Canadian securities laws is (a) recorded, processed, summarized and reported within the time periods specified in the rules and forms of the Canadian securities regulatory authorities and (b) accumulated and communicated to the Company’s management including the Company’s chief executive officer and chief financial officer, or persons performing similar functions, as appropriate, to allow timely decisions regarding required disclosure. It should be noted that while the Company’s chief executive officer and chief financial officer believe that the Company’s disclosure controls and procedures provide a reasonable level of assurance that they are effective, they do not expect that the Company’s disclosure controls and procedures or internal control over financial reporting will prevent all errors and fraud. A control system, no matter how well conceived or operated, can provide only reasonable, not absolute, assurance that the objectives of the control system are met. |
| | There have been no changes in the Company’s internal control over financial reporting that occurred during the most recent interim period ended December 31, 2006, that have materially affected, or are reasonably likely to materially affect, the Company’s internal control over financial reporting. |
| | The Company’s Audit Committee, as part of its oversight role, has reviewed and recommended the approval of this MD&A to the board of directors. The board of directors has read and approved this MD&A. Through discussions with management, the board of directors and the Audit Committee have satisfied themselves that management has implemented the necessary disclosure controls. |
| | On March 10, 2006, the Canadian Securities Administrators issued Notice 52-313, “Status of Proposed MI 52-111 Reporting on Internal Control over Financial Reporting and Proposed Amended and Restated MI 52-109 Certification of Disclosure in Issuers’ Annual and Interim Findings,” (“Notice 52-313”). Notice 52-313 advised market participants that proposed Multilateral Instrument 52-111, “Reporting on Internal Control over Financial Reporting”, will be dropped, and that Multilateral Instrument 52-109, “Certification of Disclosure in Issuers’ Annual and Interim Findings”, will be modified to require: |
| · | Annual Chief Executive Officer (“CEO”) and Chief Financial Officer (“CFO”) certifications stating that they have evaluated the effectiveness of the issuer’s internal control over financial reporting as of the end of the financial year, and caused the issuer to disclose in its annual management’s discussion and analysis their conclusions about the effectiveness of internal control over financial reporting as at the end of the financial year based on their evaluations. |
| · | The issuer will not be required to obtain from its independent auditors an internal control audit opinion concerning management’s assessment of the effectiveness of internal control over financial reporting. |
| · | These requirements will apply to all reporting issuers, other than investment funds, in all Canadian jurisdictions. |
| · | The earliest these requirements will apply is in respect of financial years ending on or after December 31, 2007. |
| | As a result of the changes highlighted in Notice 52-313, the Company’s CEO and CFO are required to certify as to the design of the Company’s internal control over financial reporting for the fiscal year ended December 31, 2006, and the certification as to the effectiveness of internal control over financial reporting will be added for the fiscal year ended December 31, 2007. |
| | Section 404 of the United States Sarbanes-Oxley Act, “Management Assessment of Internal Controls” (“Section 404”), continues to require that management assess and report on the effectiveness of internal control over financial reporting annually. The Company was required to comply with Section 404 by the end of its fiscal year ended December 31, 2006. |
| | On August 9, 2006, the Securities and Exchange Commission (“SEC”) proposed that certain foreign private issuers would continue to be required to include management’s report on internal control over financial reporting, but would be granted relief from the independent auditors’ attestation requirements until fiscal years ending on or after July 15, 2007. On December 15, 2006, the SEC adopted this extension substantially as proposed. The SEC added a requirement for a company’s management to disclose that its assessment of internal control over financial reporting has not been attested to by the independent auditor, if the company is only providing management’s report during its first year of compliance. While not required, the Company has included the attestation of internal control over financial reporting within the scope of the independent auditors’ December 31, 2006, year-end audit. As a result, the independent auditors have expressed an opinion on management’s assessment of internal control over financial reporting as at December 31, 2006. |
| | At February 13, 2007, the Company had 214,604,120 common shares issued and outstanding. |
| | Additional information about the Company including the 2006 Annual Information Form is available on the Company’s website at www.catalystpaper.com, or the Canadian Securities Administrator’s electronic filing website at www.sedar.com. |