CATALYST PAPER CORPORATION
MANAGEMENT’S DISCUSSION AND ANALYSIS
MANAGEMENT’S DISCUSSION AND ANALYSIS
The following management discussion and analysis (“MD&A”) of Catalyst Paper Corporation (the “Company”) should be read in conjunction with the consolidated financial statements for the years ended December 31, 2007, 2006, and 2005, and the notes thereto.
Throughout this discussion, reference is made to EBITDA, which represents earnings before interest, taxes, depreciation and amortization, and before other non-operating income and expenses, EBITDA before specific items, average delivered cash costs per tonne before specific items, net earnings (loss) before specific items, net earnings (loss) per share before specific items, and free cash flow. Management believes these measures are useful to evaluate the performance of the Company and its business segments. As Canadian Generally Accepted Accounting Principles (“GAAP”) do not define a method of calculating these measures, securities regulations require that non-GAAP measures be clearly defined and qualified, and reconciled with their nearest GAAP measure. The definition, calculation, and reconciliation of these non-GAAP measures is provided in Section 9: “Non-GAAP Measures”.
In accordance with industry practice, in this MD&A, the term “tonne” or the symbol “MT” refers to a metric tonne and the term “ton” or the symbol “ST” refers to a short ton, an imperial unit of measurement equal to 0.9072 metric tonnes.
In this MD&A, unless otherwise indicated, all dollar amounts are expressed in Canadian dollars, as are the term “dollars” and the symbols “$” and “CDN$”. The term “U.S. dollars” and the symbol “US$” refer to United States dollars.
The information in this report is as at February 13, 2008, which is the date of filing in conjunction with the Company’s press release announcing its results for the fourth quarter and twelve months ended December 31, 2007. Disclosure contained in this document is current to that date, unless otherwise stated.
CAUTIONARY STATEMENT REGARDING FORWARD-LOOKING STATEMENTS
This MD&A contains forward-looking statements. Forward-looking statements are statements, other than statements of historical fact, that address or discuss activities, events or developments that the Company expects or anticipates may occur in the future. These forward-looking statements can be identified by the use of words such as “anticipate”, “could”, “expect”, “seek”, “may”, “likely”, “intend”, “will”, “believe” and similar expressions or the negative thereof. These forward-looking statements reflect management’s current views and are based on certain assumptions including assumptions as to future economic conditions and courses of action, as well as other factors management believes are appropriate in the circumstances. Such forward-looking statements are subject to risks and uncertainties and no assurance can be given that any of the events anticipated by such statements will occur or, if they do occur, what benefit the Company will derive from them. A number of factors could cause actual results, performance or developments to differ materially from those expressed or implied by such forward-looking statements, including the general economic conditions in the U.S., Canada and internationally, market conditions and demand for the Company’s products, the outlook for inventories, production and pricing, the Company’s ability to successfully obtain performance improvements and cost savings from its cost reduction initiatives, expected cash flows, capital expenditures and completion of capital projects, shifts in industry capacity, fluctuations in foreign exchange and interest rates, fluctuations in availability and cost of raw materials or energy, the implementation of environmental legislation requiring capital for operational changes, the Company’s ability to obtain financing and other factors beyond the Company’s control. Additional information concerning these and other factors can be found in Section 13 of this MD&A under the heading "Risks and Uncertainties". The Company disclaims any intention or obligation to update or revise any forward-looking statements, whether as a result of new information, future events or otherwise.
Investors are cautioned not to place undue reliance on these forward-looking statements. No forward-looking statement is a guarantee of future results.
| | | Page |
| | | |
| Overview and highlights | 4 |
| Segmented results – Annual | 21 |
| Segmented results – Quarterly | 30 |
| Financial condition | 36 |
| Liquidity and capital resources | 37 |
| Related party transactions | 43 |
| Off-balance sheet arrangements | 43 |
| Summary of quarterly results | 44 |
| Non-GAAP measures | 45 |
| Critical accounting policies and estimates | 49 |
| Changes in accounting policies | 53 |
| Impact of accounting pronouncements affecting future periods | 54 |
| Risks and uncertainties | 54 |
| Sensitivity analysis | 61 |
| Outlook | 62 |
| Disclosure controls and internal control over financial reporting | 64 |
| Outstanding share data | 65 |
| | 1.1 | Overview of the business |
Catalyst is a leading producer of specialty printing papers and newsprint in North America. The Company also produces market kraft pulp and white top containerboard and owns Western Canada’s largest paper recycling facility. With five mills located within a 160-kilometre radius on the south coast of British Columbia, Catalyst has a combined annual capacity of 2,403,000 tonnes of product. The Company is headquartered in Richmond, B.C.
The Company is the largest producer of specialty printing papers and newsprint in Western North America. Catalyst’s specialty printing papers include lightweight coated, uncoated mechanical papers (soft-calendered and machine-finished hi-brites and super-brites) and directory paper. The Company is one of the largest producers of directory paper in the world and the only producer of lightweight coated paper in Western North America.
The Company’s business is comprised of three business segments: specialty paper, newsprint, and pulp. The split of production capacity between the three business segments is as follows:
Specialty paper
The specialty paper segment consists of lightweight coated (“LWC”), uncoated mechanical papers such as soft-calendered (“SC”) and machine-finished (“MF”) hi-brites and super-brites, and directory. These specialty printing paper grades are manufactured on ten1 paper machines in British Columbia at Crofton, Elk Falls, Port Alberni and Powell River. The specialty paper business segment has a total production capacity of 1,123,000 million tonnes.
Specialty paper represents the Company’s largest business segment, generating 54% of 2007 consolidated sales revenue. The Company’s customer base consists primarily of retailers, magazine and catalogue publishers, commercial printers and telephone directory publishers. Specialty printing paper products are sold primarily through the Company’s sales and marketing personnel in North America, and through distributors and agents in other geographic markets. In 2007, 90% of specialty paper sales volumes were with customers in North America. Specialty paper is shipped by ship, barge, rail or truck, or by a combination of some or all of these transportation modes.
Newsprint
Newsprint is currently manufactured on five1 paper machines at Crofton, Elk Falls and Powell River. The newsprint business segment has a total annual production capacity of 606,000 tonnes. Effective September 1, 2007 the Port Alberni No. 4 paper machine (“A4”) was indefinitely idled, displacing 134,000 tonnes of newsprint on a 45.0 g/m2 basis.
Newsprint sales generated 20% of 2007 consolidated sales revenue. The newsprint customer base consists primarily of newsprint publishers located in Western and Central North America and in Asia. In 2007, 82% of newsprint sales volumes were with customers in North America, Asia and Australasia. Newsprint is shipped overseas by deep-sea vessel and inland by ship, barge, rail or truck, or by a combination of some or all of these transportation modes.
Pulp
The pulp segment consists of Northern Bleached Softwood Kraft (“NBSK”) pulp manufactured at the Crofton mill and sawdust-based pulp and containerboard manufactured at the Elk Falls mill. The pulp business segment has a total market production capacity of 674,000 tonnes.
Pulp and containerboard sales generated 26% of 2007 consolidated sales revenue. The pulp customer base is located primarily in Europe and Asia and includes producers of tissue, magazine papers, woodfree printing and writing papers and certain specialty paper products. The containerboard customer base consists primarily of corrugated box manufacturers. Pulp and containerboard products are sold primarily through sales and marketing personnel in Canada, and through a network of agents in locations throughout the world. In 2007, 79% of pulp and containerboard sales volumes were with customers in Europe, Asia and Australasia. The Crofton and Elk Falls pulp mills are located on tidewater and have deep-sea vessel loading facilities. Pulp and containerboard are shipped by both break-bulk and container deep-sea vessels.
The Company also owns the largest paper recycling facility in Western Canada. Operated in support of the business segments described above, the recycling facility has an annual production capacity of 175,000 air-dried equivalent tonnes of pulp per year, the majority of which is consumed internally.
| | 1 | The Company has 11 paper machines. The number of machines noted in the segments above reflects the ability of the Company’s machines to switch between newsprint and specialty paper grades. |
The chart below illustrates the Company’s principal paper and pulp products, their applications, and annual 2008 production capacity:
| PRODUCT PROFILE |
| Segment | Specialty paper | Newsprint | Pulp |
| Category | Uncoated mechanical | Lightweight Coated | Directory | Newsprint | Containerboard | Market pulp |
| Soft-calendered | Machine-finished |
Brand names | Electrasoft Electracal Electraprime | Electrabrite Electrastar | Electracote | Catalyst | Marathon | Silverliner Platinumliner Chromiumliner Bronzeliner | Elk Prime Crofton Kraft |
Basis weight (g/m2) | 45 – 52 | 45 – 66.5 | 44.4 – 63.6 | 28 – 40 | 43 – 48.8 | 127 – 270 | n/a |
Applications | Magazines, Supplements, Catalogues, Inserts, Flyers, Direct mail, Directories | Magazines, Supplements, Inserts, Flyers, Direct mail, PR and corporate communication books/manuals | Magazines, Catalogues, Inserts, Flyers, Direct mail | Telephone books, Airline schedules, Catalogues | Newspapers, Inserts, Flyers, Supplements, Directories, Timetables | Packaging applications | Tissue, Freesheet, Specialty paper, White-top linerboard |
| Total capacity (tonnes) | 540,0001 | 231,000 | 352,0001 | 606,0001,2 | 131,000 | 543,000 |
| % of total capacity | 22% | 10% | 15% | 25% | 5% | 23% |
| | 1 | Capacities expressed in the above table can vary as the Company is able to switch production between products - particularly newsprint, directory and machine-finished uncoated grades. |
| | 2 | The Company indefinitely curtailed A4 effective September 1, 2007, displacing the equivalent of 134,000 tonnes of the Company’s annual newsprint production. The capacity noted in the table above has not been adjusted to reflect this indefinite curtailment. |
The chart below illustrates the annual 2008 production capacity by mill and product line:
| CAPACITY BY MILL LOCATION AND PRODUCT LINE |
| | | Specialty paper | Newsprint | Pulp |
Mill location | Number of Paper machines | Uncoated mechanical | Lightweight Coated | Directory | Newsprint | Containerboard | Market pulp |
Crofton, B.C. | 3 | - | - | 246,000 | 150,000 | - | 343,000 |
| Elk Falls, B.C. | 3 | 153,000 | - | - | 373,000 | 131,000 | 200,000 |
| Port Alberni, B.C. | 22 | - | 231,000 | 106,000 | - | - | - |
| Powell River, B.C. | 3 | 387,000 | - | - | 83,000 | - | - |
Total capacity (tonnes) | | 540,0001 | 231,000 | 352,0001 | 606,0001,2 | 131,000 | 543,000 |
| | 1 | Capacities expressed in the above table can vary as the Company is able to switch production between products - particularly newsprint, directory and machine-finished uncoated grades. |
| | 2 | The Company indefinitely curtailed A4 effective September 1, 2007, displacing the equivalent of 134,000 tonnes of the Company’s annual newsprint production. The capacity and number of machines noted in the table above have not been adjusted to reflect this indefinite curtailment. |
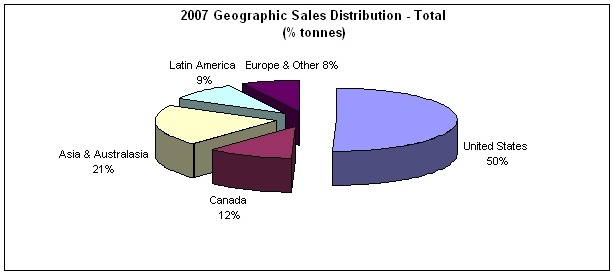
Geographic Sales Distribution
The Company’s products are sold on five continents. At 62% of sales, the North American market continues to be the Company’s principal market, and is followed in significance by Asia and Australasia, Latin America, and Europe. The consolidated sales volume distribution for 2007 was as follows:
The paper sales volume distribution for 2007 was as follows:
The pulp sales volume distribution for 2007 was as follows:

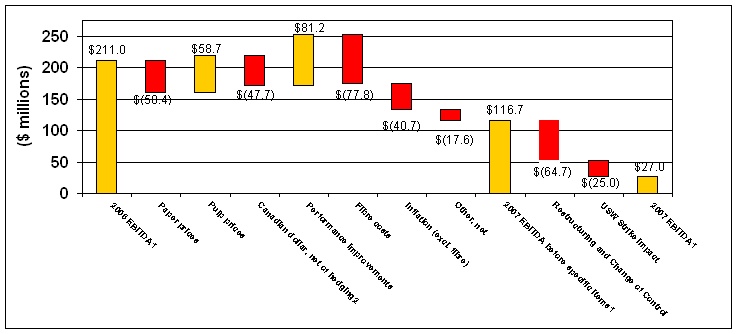
After four consecutive years of improvement in operating earnings, 2007 was a particularly challenging environment for the Company, resulting in the Company’s earnings declining versus their prior year. A Canadian dollar that reached 50 year record highs against the U.S. dollar in 2007, a price downcycle for most of our paper products, a constrained fibre supply, and the impact of a strike further affecting coastal fibre supply in the third and fourth quarters, all combined to create significant headwinds. However, on the positive side pulp prices increased rapidly during the year and towards the end of the year most groundwood paper products started to see positive price momentum. In addition, the Company took action to improve profitability through the indefinite closure of newsprint capacity and the reduction of approximately 15% of the workforce through the Company’s restructuring program, which contributed the largest part of another successful Performance Improvement Program that delivered $81 million of benefit to operating earnings and EBITDA in 2007.
The Company recorded a net loss of $31.6 million, compared to a net loss of $15.9 million in 2006. EBITDA was $27.0 million, compared to $211.0 million in 2006. The Company’s results in 2007 included restructuring and change-of-control costs of $64.7 million and were also negatively impacted by $25.0 million related to a disruption in fibre supply resulting from the United Steelworkers of Canada union (“USW”) work stoppage. EBITDA before these specific items was $116.7 million, compared to $211.0 million in 2006.
Restructuring Initiatives and Change-of-Control
The Company announced and implemented, in phases during 2007, a restructuring program to eliminate approximately 565 positions across the Company, relocate the corporate office, and centralize certain mill administrative functions. This program was substantially completed during the year and is expected to deliver total annualized cost savings of approximately $67 million. In 2007, total restructuring costs for this program were $58.3 million, including $3.0 million of capital expenditures.
The Company indefinitely curtailed operations of A4 on September 1, 2007. Production of directory paper made on A4 was moved to Crofton and displaced the equivalent of 134,000 tonnes per year of the Company’s least profitable newsprint business. The curtailment also reduced the Company’s highest cost fibre and power requirements.
Significant management changes occurred during 2007. Richard Garneau joined the Company as the President and Chief Executive Officer and David Smales, formerly Vice-President of Strategy, was appointed Vice-President, Finance and Chief Financial Officer replacing former President and Chief Executive Officer and former Vice-President, Finance and Chief Financial Officer, respectively, after they exercised their rights under change-of-control agreements and left the Company during the first quarter of 2007. The Company recorded $8.3 million in severance, pension-benefit and stock-compensation expenses related to these change-of-control agreements plus $1.1 million relating to certain employee retention agreements.
Performance Improvements
The Company continued to deliver on its performance improvement objectives, including the restructuring program, and realized a year-over-year operating earnings and EBITDA increase of $81 million from performance improvements. A discussion of the 2007 Performance Improvement Program’s results is provided under “Progress on 2007 Strategic Initiatives” in Section 1.5, “Strategy”.
Canadian Dollar
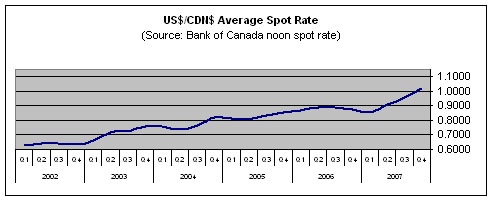
The majority of the Company’s sales are denominated in U.S. dollars. As a result, the strengthening Canadian dollar, which reached its highest value against the U.S. dollar in more than 50 years during 2007, had a significant negative impact on the Company’s operating earnings for the year. The average spot rate for 2007 was US$0.930 compared to US$0.882 for 2006 and US$0.825 for 2005. Despite the mitigation provided by the Company’s hedging program, the currency movement in 2007 reduced EBITDA by $48 million when compared to 2006.
The chart below illustrates the movement of the US$/CDN$ spot rate over the past six years:
Product Demand and Pricing
Market conditions for the Company’s products were mixed in 2007.
Coated mechanical demand was higher in the year largely due to substitution of coated mechanical grades for coated woodfree. Supply in the coated market tightened late in 2007, primarily due to significant North American mill closures in the latter half of the year combined with lower mill inventories. These factors led to improving LWC prices in the second half of the year. In December 2007, the Company announced a third consecutive US$60 per ton price increase for its LWC paper grades, bringing the total announced increases by the end of the year to $180 per ton since July 1, 2007. Despite the recent upward pricing momentum, the average LWC benchmark price was 6% lower in 2007, compared to 2006.
Overall uncoated mechanical demand remained flat. The increased demand for high-gloss grades offset the decrease in demand for standard grades. Prices softened during the first half of the year, but started to reverse in the fourth quarter. The average soft-calendered A grade (“SC-A”) benchmark price was 4% lower than the previous year.
After robust growth in 2006, directory demand was steady in 2007 due to slower growth in the number of independent books printed and flat total page and book circulation for incumbent publishers. The average directory benchmark price was 3% higher than in 2006.
Newsprint demand continued to weaken at a significant rate during 2007, leading to an average newsprint benchmark price decrease of 11% from 2006. Prices began to stabilize late in the year as capacity closures reduced supply and a US$25 per tonne price increase was implemented in December 2007 in the U.S.
Pulp demand continued to be strong in 2007. The combination of strong demand and tight supply resulted in US$ prices increasing to their highest level since 1995. The average NBSK benchmark price in 2007 was 17% higher than in 2006.
For containerboard markets, supply and demand remained in balance, with low inventory and healthy export levels despite flat demand. The 2007 benchmark price was 4% higher than in 2006.
Fibre Costs and Supply
A combination of factors made 2007 a difficult year with respect to fibre supply. Coming into 2007 low inventory levels throughout the fibre supply chain, due to lower log volume harvested in the fourth quarter of 2006, was made more challenging by continued poor weather in Q1, 2007. This resulted in higher fibre prices in the first half of the year. Although harvesting conditions returned to normal by mid-2007, the three month USW strike that began in late July and reduced sawmill activity as a result of poor market conditions for lumber kept fibre prices high all year. Overall, increased fibre costs and the total impact of the USW strike had a negative impact of $103 million on EBITDA in 2007 when compared to 2006.
Fibre lost to Catalyst during the USW strike was 284,000 bone dry tonnes, although the impact was partially mitigated through higher than expected logging activity and increased supply from other suppliers. This loss of fibre led to production curtailments in the third and fourth quarters of 106,100 tonnes of paper and 44,200 tonnes of pulp and containerboard at the Elk Falls mill; and 10,500 tonnes of pulp at the Crofton mill.
Liquidity and Capital assets
The Company’s available liquidity was $241 million at the end of 2007, compared to $324 million at the end of 2006. Of the $83 million decrease, $41 million was due to a reduction in borrowing base on the Company’s revolving operating facility as a result of lower accounts receivable and inventory following curtailment related to the reduced fibre availability in Q4, and the indefinite closure of A4 in September, 2007. Lower EBITDA, in large part due to restructuring and change-of-control costs and the impact of the USW strike, further reduced the Company’s liquidity.
In September 2007, the Company sold the Port Alberni No. 3 (“A3”) paper machine and ancillary assets. The Company received proceeds of $1.3 million and recorded a loss on disposal of $7.5 million.
| Ø | Realized year-over-year operating earnings and EBITDA benefits of $81 million from the Company’s 2007 Performance Improvement Program, of which $29 million was related to workforce reductions. |
| Ø | Implemented a restructuring program which is expected to deliver annualized cost savings of approximately $67 million through: |
| o | total workforce reductions of 565; |
| o | relocation of the corporate office from Vancouver, B.C. to lower cost premises in Richmond, B.C., and |
| o | centralization of certain mill administrative functions in Nanaimo, B.C. |
| Ø | Indefinitely curtailed A4, displacing 134,000 tonnes of the Company’s least profitable newsprint production. |
| Ø | Made high-return capital investments totalling $56.5 million, including $8.1 million to facilitate receipt of de-inked pulp (“DIP”) in more efficient crumb form at the Crofton mill. |
| Ø | Received a national energy efficiency stewardship award from CIPEC, an organization founded by the federal government in conjunction with business, to promote energy efficiency. |
| Ø | Recognized for environmental and social responsibility programs including: |
| o | Launched Catalyst Cooled, a product line whose manufacture results in no net carbon emissions – on which Rolling Stone magazine prints and for which the Company received the Metafore Innovation Award in the products category. |
| o | Recognized as the only forest-products company on the Conference Board of Canada’s Carbon Disclosure Leadership Index (CDLI), in recognition of transparency regarding emissions and reduction efforts. |
| o | Received – “Gift to the Earth” recognition from the WWF, in connection with the conservation and management agreement reached for the Great Bear Rainforest. |
| o | Recognized by the United Way (BC Lower Mainland) for 15 consecutive years of “gold level” employee giving, calculated as 80% of an organization’s one-day payroll. |
| Ø | Received the Canadian Institute of Chartered Accountants award of excellence for financial and corporate reporting in the forest products category. |
| | 1.4 | Selected annual financial information |
| (In millions of dollars, except where otherwise stated) | |
| | | 2007 | | | 2006 | | | 2005 | |
Sales | | $ | 1,714.6 | | | $ | 1,882.5 | | | $ | 1,823.9 | |
| Operating earnings (loss) | | | (149.4 | ) | | | 3.9 | | | | (25.1 | ) |
EBITDA1 | | | 27.0 | | | | 211.0 | | | | 155.2 | |
EBITDA before specific items1 | | | 116.7 | | | | 211.0 | | | | 161.9 | |
| Net earnings (loss) | | | (31.6 | ) | | | (15.9 | ) | | | (25.6 | ) |
Net earnings (loss) before specific items1 | | | (89.3 | ) | | | (25.0 | ) | | | (64.6 | ) |
| Total assets | | | 2,453.4 | | | | 2,637.7 | | | | 2,695.9 | |
| Total long-term liabilities | | | 1,195.4 | | | | 1,338.6 | | | | 1,396.8 | |
EBITDA margin1,2 | | | 1.6 | % | | | 11.2 | % | | | 8.5 | % |
EBITDA margin before specific items1,2 | | | 6.8 | % | | | 11.2 | % | | | 8.9 | % |
| Net earnings (loss) per share (in dollars) – basic and diluted | | $ | (0.15 | ) | | $ | (0.07 | ) | | $ | (0.12 | ) |
Net earnings (loss) per share before specific items (in dollars) – basic and diluted1 | | | (0.42 | ) | | | (0.12 | ) | | | (0.30 | ) |
| Sales (000 tonnes) | | | | | | | | | | | | |
Specialty paper | | | 1,054.8 | | | | 990.2 | | | | 942.9 | |
Newsprint | | | 496.3 | | | | 699.1 | | | | 707.1 | |
Total paper | | | 1,551.1 | | | | 1,689.3 | | | | 1,650.0 | |
Pulp | | | 603.2 | | | | 626.2 | | | | 603.0 | |
Total sales | | | 2,154.3 | | | | 2,315.5 | | | | 2,253.0 | |
| Production (000 tonnes) | | | | | | | | | | | | |
Specialty paper | | | 1,055.4 | | | | 983.7 | | | | 949.3 | |
Newsprint | | | 472.8 | | | | 703.7 | | | | 699.5 | |
Total paper | | | 1,528.2 | | | | 1,687.4 | | | | 1,648.8 | |
Pulp | | | 601.8 | | | | 624.3 | | | | 590.9 | |
Total production | | | 2,130.0 | | | | 2,311.7 | | | | 2,239.7 | |
| US$/CDN$ foreign exchange | | | | | | | | | | | | |
Average spot rate3 | | | 0.930 | | | | 0.882 | | | | 0.825 | |
Period-end spot rate4 | | | 1.012 | | | | 0.858 | | | | 0.858 | |
Effective rate5 | | | 0.917 | | | | 0.872 | | | | 0.807 | |
| Common shares (millions) | | | | | | | | | | | | |
At period end | | | 214.7 | | | | 214.6 | | | | 214.6 | |
Weighted average | | | 214.7 | | | | 214.6 | | | | 214.6 | |
| 1 | EBITDA, EBITDA before specific items, EBITDA margin, EBITDA margin before specific items, net earnings (loss) before specific items, and net earnings (loss) per share before specific items are non-GAAP measures. Refer to Section 9, “Non-GAAP Measures” for further details. |
| 2 | EBITDA margin and EBITDA margin before specific items are defined as EBITDA and EBITDA before specific items, as a percentage of sales and adjusted sales, respectively. Refer to Section 9, “Non-GAAP Measures” for further details. |
| 3 | Average spot rate is the average Bank of Canada noon spot rate over the reporting period. |
| 4 | Period-end spot rate is the Bank of Canada noon spot rate on December 31. |
| 5 | Effective rate represents a blended rate which takes account of the applicable spot rates, the Company’s revenue hedging program in the period, and translation of US$-denominated working capital at period opening and closing rates. See Section 9, “Summary of Quarterly Results” for further details. |
The Company’s long-term objective is to achieve higher sustainable earnings and maximize cash flow by strengthening its position as a leading producer of groundwood printing papers, including specialty printing paper grades and newsprint.
Key performance drivers
The Company believes the following key performance drivers are critical to achieving its strategic goals and creating value for its investors.
Market position
Market position is a significant driver of the Company’s success. As one of the largest producers of specialty printing papers in North America, market penetration and diversification is important. The Company’s brand names are well recognized in the marketplace and it has built a reputation for reliability, value and service.
Product mix
In recent years, the Company has expanded the number of grades manufactured in the market. The Company has introduced new product lines which include Electraprime (an “SCA” alternative), Electrastar (a super-brite), Electrabrite Lite (a lightweight hi-brite), Silverliner (a kraft paper whitetop), and Elk Prime (a sawdust-based pulp). These newer and more specialized products generally provide higher margins than standard commodity grades. The Company also manages fluctuations in demand for its products through its ability to switch production capacity between products, particularly newsprint, directory, and machine-finished uncoated mechanical grades. In addition, market pulp, sawdust-based pulp, and white-top linerboard further diversify the product mix.
Supply chain
Distribution costs have a significant impact on net sales realizations. The Company’s strong and flexible distribution network optimizes all transportation modes available to it, such as truck, rail, and container and break-bulk shipping.
The mill sites directly ship break bulk paper and pulp to offshore customers via regularly scheduled vessels. The Company operates a central distribution centre in Surrey, B.C. which receives volumes from its four manufacturing sites and then ships via rail, truck and container to its customers. This allows the Company to choose the most cost effective transportation mode in conjunction with customer requirements.
The Company leases 980 rail cars to ensure damage free, on time delivery to its rail customers and the Company leases five paper barges which it uses to transport its products to the Surrey distribution centre. Controlling key elements of its supply chain have allowed the Company to achieve a high on time performance and low damage level. Combined with its focus on lowering costs and the reduction of inventory levels, the Company improved its service delivery business processes and further centralized its organization in 2007 to provide cost-efficient and reliable transportation to customers.
Cost-competitive manufacturing
The Company’s manufacturing costs are key to being competitive over the long term, particularly with respect to fibre, energy, and labour costs and the Company is focused on reducing these costs and improving margins. Over the past five years, capital expenditures of approximately $423 million have been directed primarily towards shifting production towards higher-margin printing papers, reducing unit production costs, increasing machine productivity, improving product quality, increasing capacity, and meeting or exceeding environmental regulations.
In addition, over the last several years, the Company has developed expertise in the production of lightweight papers. Lower basis weight papers reduce the Company’s costs by decreasing fibre, shipping, and storage and handling expenses.
Production and capacity utilization
The ability to increase production rates and minimize production downtime impacts the Company’s per unit cash costs. Over the last several years the Company has been focused on improving machine productivity through several initiatives such as implementing an asset reliability program, operator technical training, and increasing focus on reducing machine dry end losses. These and other initiatives from the Company’s Performance Improvement Program have been instrumental in improving machine productivity.
Corporate social responsibility
Corporate social responsibility is one of the Company’s core values. The Company judges success in this area through the safety and well-being of its employees, the vibrancy of its communities, and the sustainability of the Company’s practices with respect to their impact on the environment. A complete description of the Company’s commitments and progress in corporate social responsibility is provided in the Company’s 2007 Sustainability Report, produced concurrently with the Company’s 2007 annual report.
Key performance indicators
The Company believes the following key performance indicators are meaningful for measuring the Company’s progress in achieving its strategic goals and creating value for investors:
Safety
The Company’s first priority is the well-being of its employees. Key metrics include the medical incident rate (“MIR”), which is the number of incidents requiring medical attention per 200,000 hours worked, and the lost-time injury frequency (“LTI”), which is the number of lost-time injuries per 200,000 hours worked. The Company’s overall safety performance declined on these and other key safety measures during 2007. Additional details on 2007 safety results are provided in the Company’s 2007 Sustainability Report, produced concurrently with the Company’s 2007 annual report.
Performance Improvement Program
One of the characteristics of the Company’s culture is that of engaging its people in projects that challenge the status quo. The Company has for several years aggregated these initiatives on an annual basis into a Performance Improvement Program. Performance improvement initiatives challenge the Company to create innovative and cost-effective business solutions. In 2007, the Company launched its sixth consecutive Performance Improvement Program, which included the 2007 restructuring program. A detailed summary of the 2007 Performance Improvement Program results is available in this section under “Progress on 2007 Strategic Initiatives”.
EBITDA and EBITDA before specific items
EBITDA and EBITDA before specific items are widely used in the financial community to compare the profitability of corporations, and are used by management as an indicator of relative operating performance. Further analysis and discussion of these indicators are provided in all discussions of operations and in the “Non-GAAP Measures” section.
Average sales revenue per tonne
Average sales revenue per tonne for each core business provides key insights into how the Company maximizes its market position and product mix. The main factors in revenue growth are U.S. dollar transaction prices, and the relationship between the Canadian and U.S. dollar. Details on 2007 results are provided in the “Segmented Results - Annual” and “Segmented Results - - Quarterly” sections.
Average delivered cash costs per tonne and average delivered cash costs per tonne before specific items
Reducing cash costs while maintaining product quality is essential to sustaining profitability in each of the Company’s core businesses. The Company continually examines all areas of its business for cost reduction opportunities. Details on 2007 results are provided in the “Segmented Results - Annual” and “Segmented Results - Quarterly” sections.
Free cash flow
Free cash flow is a measure of cash that is generated by operations and available after capital expenditures, but before changes in working capital items and proceeds from divested assets. Further analysis and discussion of this indicator is provided in the “Non-GAAP Measures” section.
Leverage and interest coverage
The Company’s success also depends on its liquidity and continued ability to finance its growth. The Company focuses on total-debt to total-capitalization, net-debt to net-capitalization, net-debt to EBITDA, and EBITDA to interest ratios in order to assess its debt position. Further analysis and discussion of these indicators are provided in the “Liquidity and Capital Resources” section.
Greenhouse gas emissions (“GHG”)
The Company takes its environmental compliance seriously and focuses on continuous improvement of its performance through operational efficiency and process innovation. The Company has achieved a 69% absolute and intensity reduction of GHGs since 1990 (as measured by direct emissions), and management believes the Company is well positioned to meet emerging regulatory objectives and market expectations. The Company received third-party recognition for the transparency and depth of its reporting on greenhouse gases in 2007, and launched a manufactured carbon-neutral product line. Further details are provided in the Company’s 2007 Sustainability Report, produced concurrently with the Company’s 2007 annual report.
Progress on 2007 strategic initiatives
| | (a) | Performance Improvement Program |
The Company’s achievements relating to specific performance improvements in 2007, 2006, and 2005 were as follows:
| Performance Improvement Program Initiatives | |
| (All amounts are pre-tax and in millions of dollars) | | 2007 Realized | | | 2006 Realized | | | 2005 Realized | |
Workforce reduction | | $ | 29 | | | $ | - | | | $ | - | |
| Product, grade, and customer optimization | | | 21 | | | | 11 | | | | 19 | |
| Productivity improvements | | | 6 | | | | 20 | | | | - | |
| Reduce energy consumption | | | 6 | | | | 12 | | | | 10 | |
| Furnish costs | | | 5 | | | | 12 | | | | 12 | |
| Optimize chemical usage | | | 2 | | | | 5 | | | | 4 | |
| Other | | | 12 | | | | 14 | | | | 39 | |
Total Performance Improvement Program | | $ | 81 | | | $ | 74 | | | $ | 84 | |
Early in 2007, the Company commenced its sixth consecutive annual Performance Improvement Program. Improvements were targeted in the areas of workforce reductions, product, grade, and customer optimization, and other cost reduction initiatives. In 2007, the program delivered $81 million in realized improvements by the following means:
Workforce reduction
Workforce reductions related to the 2007 restructuring program resulted in savings of $29 million. The Company reduced its workforce positions from 3,673 on January 1, 2007 to 3,038 on January 1, 2008. The reduction to date includes 551, or 98%, of the 565 positions targeted for elimination, in addition to employees laid off as a result of the indefinite closure of the A4 paper machine.
Product, grade, and customer optimization
This strategic initiative involved the marketing of higher-value specialty printing paper products, allowing margin optimization compared to standard grades. In 2007, the Company realized EBITDA improvements of $21 million as a result of its various product, grade, and customer optimization initiatives.
Sales of Electraprime were of particular relevance in 2007. This is a soft-calendered high-brite paper grade designed to compete as an alternative to SC-A grades and is used primarily for advertising flyers, inserts and direct mail. It continued to be well received in the market with sales of approximately 125,000 tonnes in 2007, an improvement of approximately 22,000 tonnes, or 21%, from 2006. Electraprime was introduced to the market in 2003 and the Company intends to continue growing this business.
In addition the Company sold approximately 57,200 tonnes of additional directory paper in 2007 versus 2006 and reduced newsprint volume to take advantage of stronger directory pricing and weaker newsprint pricing in 2007.
Productivity Improvements
The Company’s productivity improvement initiatives in 2007 were focused mainly on increasing asset reliability, improving machine speed and efficiency by cutting operating and maintenance-related downtime, and reducing dry-end paper losses. These and other initiatives resulted in savings of $6 million in 2007.
Reduce energy consumption
The Company is a significant consumer of electrical energy. The Company focused on a number of electrical energy initiatives that reduced overall electrical consumption which included a demand management program with B.C. Hydro. This and other energy reduction initiatives resulted in savings of $6 million in 2007.
Furnish costs
The Company continued to optimize its furnish mix during the year by substituting lower-cost furnishes. These and other initiatives resulted in savings of $5 million in 2007.
Optimize chemical usage
The Company had a number of initiatives to reduce the usage and costs of bleaching and additive chemicals during the year. These and other initiatives resulted in savings of $2 million in 2007.
Other
The Company also completed a series of smaller initiatives, primarily with respect to freight, procurement improvements and its maintenance practices. Approximately $12 million in savings were realized as a result of these initiatives.
| | (b) | Other strategic initiatives |
Preferred supplier
Quality initiatives
In 2007, the Company focused further on advancing its preferred supplier status with key customers by continuing to improve the consistency, runnability and reliability of its products, and its on-time delivery service. As a result, the Company was able to maintain low quality claims in 2007.
Catalyst Cooled
In 2007, the Company launched “Catalyst Cooled”, a product line whose manufacture results in no net carbon emissions – on which Rolling Stone magazine prints. The product is designed for customers who do not want their paper to contribute to carbon emissions. The Company intends to keep growing this product.
Chain-of-custody certification
The Company has implemented an “independent chain-of-custody” system to certify its wood fibre supply. The PricewaterhouseCoopers standard is a third-party audited system that verifies fibre is derived from a forest managed in accordance with the requirements of a major sustainability certification program. The independent chain-of-custody system tracks the fibre from source to finished product and provides a valuable tool to assure customers that paper contains fibre originating from well-managed forests. It is expected to continue to result in additional sales opportunities.
| | 1.6 | Consolidated results of operations |
Year ended December 31, 2007 compared to year ended December 31, 2006
Sales
Sales in 2007 decreased $167.9 million, or 8.9%. The decline in sales was due to lower sales volumes due to curtailment relating to the USW strike and curtailment of the A4 paper machine in September 2007, the strong Canadian dollar, and lower transaction prices across most paper grades, particularly newsprint and LWC. The decrease in sales was partially offset by the positive impact of average transaction prices for pulp and a more favourable product mix.
The following table highlights the factors that affected the Company’s sales by segment:
| Sales ($ millions) | |
| | | Year ended December 31, | | | | | | Increase (decrease) from 2006 as a result of | |
| | | 2007 | | | 2006 | | | Total change | | | Volume1 | | | Price | | | Mix | | | | F/X | |
Specialty paper | | $ | 919.6 | | | $ | 918.4 | | | $ | 1.2 | | | $ | 61.8 | | | $ | (21.4 | ) | | $ | 4.8 | | | $ | (44.0 | ) |
| Newsprint | | | 338.0 | | | | 529.8 | | | | (191.8 | ) | | | (154.6 | ) | | | (29.0 | ) | | | 3.1 | | | | (11.3 | ) |
| Total paper | | | 1,257.6 | | | | 1,448.2 | | | | (190.6 | ) | | | (92.8 | ) | | | (50.4 | ) | | | 7.9 | | | | (55.3 | ) |
| Pulp | | | 457.0 | | | | 434.3 | | | | 22.7 | | | | (16.0 | ) | | | 58.7 | | | | 1.8 | | | | (21.8 | ) |
Total | | $ | 1,714.6 | | | $ | 1,882.5 | | | $ | (167.9 | ) | | $ | (108.8 | ) | | $ | 8.3 | | | $ | 9.7 | | | $ | (77.1 | ) |
| 1 | Decrease in volume is due to curtailment of certain assets in the third and fourth quarters related to the USW strike and curtailment of the A4 paper machine effective September 1, 2007. |
EBITDA
EBITDA before specific items was $116.7 million, a decrease of $94.3 million in 2007 compared to 2006. The negative impact of higher fibre costs, weaker newsprint and LWC prices, inflation, and the stronger Canadian dollar, more than offset higher transaction prices for pulp products, and the realization of benefits from the Performance Improvement Program. Including the impact of restructuring and change-of-control costs, and USW strike related costs, EBITDA decreased $184.0 million in 2007 compared to 2006.
The following table summarizes the key changes in EBITDA1 and EBITDA before specific items1 from the year ended December 31, 2006 to year ended December 31, 2007:
| | 1 | EBITDA and EBITDA before specific items are non-GAAP measures. Refer to Section 9, "Non-GAAP Measures" for further details. |
| | 2 | Includes foreign exchange impact on costs. |
Operating earnings (loss)
The Company recorded an operating loss of $149.4 million in 2007, compared to operating earnings of $3.9 million for the previous year. The decrease was mainly related to the $184.0 million decrease in EBITDA noted above, offset by the $23.4 million impairment loss recorded in the previous year.
Net earnings (loss)
Net loss of $31.6 million ($0.15 per common share) increased $15.7 million compared to a net loss of $15.9 million ($0.07 per common share) in 2006. After adjusting for certain specific items, net loss before specific items in 2007 was $89.3 million ($0.42 per common share), a decrease of $64.3 million from net loss before specific items of $25.0 million ($0.12 per common share) in the previous year. Refer to Section 9, “Non-GAAP Measures” for details on net earnings (loss) before specific items.
The following table reconciles 2007 net earnings (loss) to 2006:
| ($millions) | | Pre-tax | | | After-tax | |
2006 net earnings (loss) | | $ | (69.9 | ) | | $ | (15.9 | ) |
Lower EBITDA before specific items | | | (94.3 | ) | | | (62.2 | ) |
Restructuring and change-of-control costs | | | (64.7 | ) | | | (42.7 | ) |
Impact of the USW strike | | | (25.0 | ) | | | (16.5 | ) |
Lower amortization expense | | | 7.3 | | | | 4.8 | |
Lower impairment loss | | | 23.4 | | | | 15.4 | |
| Loss on disposal of A3 paper machine | | | (7.5 | ) | | | (4.9 | ) |
Increase in foreign exchange gain on long-term debt | | | 104.2 | | | | 86.5 | |
Lower other income, net | | | (9.6 | ) | | | (6.3 | ) |
Lower interest expense | | | 3.1 | | | | 2.0 | |
Income tax adjustments, net | | | - | | | | 6.8 | |
Non-controlling interest | | | 1.4 | | | | 1.4 | |
2007 net earnings (loss) | | $ | (131.6 | ) | | $ | (31.6 | ) |
| SEGMENTED RESULTS - ANNUAL |
| (In millions of dollars, except where otherwise stated) | |
| | | 2007 | | | 2006 | | | 2005 | |
Sales | | $ | 919.6 | | | $ | 918.4 | | | $ | 900.5 | |
EBITDA1 | | | 26.2 | | | | 104.8 | | | | 115.8 | |
EBITDA before specific items1 | | | 73.4 | | | | 104.8 | | | | 116.3 | |
| Operating earnings (loss) | | | (75.1 | ) | | | 9.7 | | | | 24.8 | |
EBITDA margin1,2 | | | 2.8 | % | | | 11.4 | % | | | 12.9 | % |
EBITDA margin before specific items1,2 | | | 8.0 | % | | | 11.4 | % | | | 12.9 | % |
| | | | | | | | | | | | | |
| Sales (000 tonnes) | | | 1,054.8 | | | | 990.2 | | | | 942.9 | |
| Production (000 tonnes) | | | 1,055.4 | | | | 983.7 | | | | 949.3 | |
Curtailment (000 tonnes)3 | | | 7.2 | | | | - | | | | - | |
| | | | | | | | | | | | | |
| Average sales revenue per tonne | | $ | 872 | | | $ | 928 | | | $ | 955 | |
Average delivered cash costs per tonne4 | | | 847 | | | | 822 | | | | 832 | |
Average delivered cash costs per tonne before specific items1,4 | | | 802 | | | | 822 | | | | 832 | |
| | | | | | | | | | | | | |
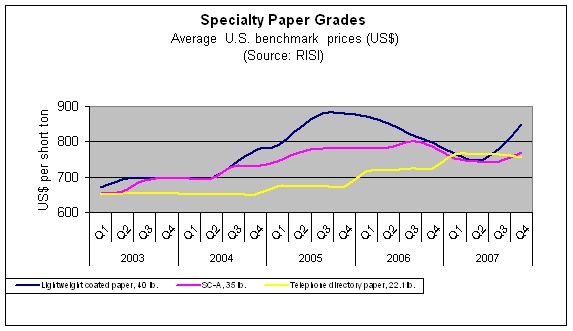
| Benchmark prices | | | | | | | | | | | | |
SC-A paper, 35 lb. (US$/ton)5 | | | 753 | | | | 788 | | | | 769 | |
LWC paper, No. 5, 40 lb. (US$/ton)5 | | | 786 | | | | 836 | | | | 847 | |
Telephone directory paper, 22.1 lb. (US$/ton)5 | | | 740 | | | | 721 | | | | 675 | |
| 1 | EBITDA, EBITDA before specific items, EBITDA margin, EBITDA margin before specific items, and average delivered cash costs per tonne before specific items are non-GAAP measures. Refer to Section 9, “Non-GAAP Measures” for further details. |
| 2 | EBITDA margin and EBITDA margin before specific items are defined as EBITDA and EBITDA before specific items as a percentage of sales and adjusted sales, respectively. Refer to Section 9, “Non-GAAP Measures” for further details. |
| 3 | Curtailment consists of downtime related to the USW strike. |
| 4 | Average delivered cash costs per tonne consist of cost of sales, including the impact of the USW strike, selling, general and administration (“SG&A”) costs, and restructuring and change-of-control costs. |
| 5 | Benchmark selling prices are sourced from Resource Information Systems, Inc. (“RISI”). |
During 2007, market conditions for most of our specialty printing paper products were challenging.
Coated mechanical demand was 5% higher in 2007 compared to 2006 largely due to substitution of coated mechanical grades for coated woodfree. Supply in the coated market tightened during 2007, primarily due to significant North American mill closures in the latter half of the year and lower mill inventories. Combined, these factors led to stronger LWC prices in the second half of the year. In December 2007, the Company announced a third consecutive US$60 per ton price increase for its LWC paper grades, bringing the total announced increases by the end of the year to $180 per ton since July 1, 2007. Despite the recent upward pricing momentum, the average LWC benchmark price was 6% lower in 2007 compared to 2006.
Demand for uncoated mechanical grades was up slightly in 2007. The demand for high gloss grades increased 4.9%, due to grade switching from coated mechanical, offsetting the decrease in demand in standard grades of 3.5%. SC-A pricing was weak throughout most of 2007, however, a US$30 per ton price increase was implemented in the fourth quarter. The average benchmark price for SC-A in 2007 decreased US$35 per ton, or 4%, over 2006.
Directory demand remained steady in 2007. Limited growth was due to slower growth of independent publishers and flat total page and book circulation for incumbent publishers. The average benchmark price for 2007 increased US$19 per ton.
The 2007 specialty paper product grade distribution, based on sales volumes, is depicted in the chart below.
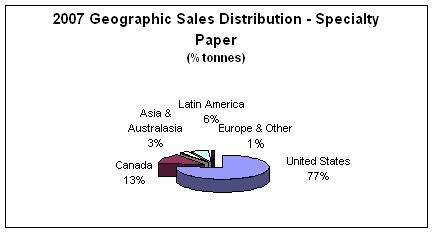
The 2007 geographic sales distribution, based on sales volumes, is depicted in the chart below.
The North American economy is a key driver for the Company’s specialty paper business with 90% of its product sold to this market. Among its initiatives to improve profitability, the Company continues to look for ways to optimize its product, customer and geographic mix.
Sales volumes for lightweight coated in 2007 were down 13,900 tonnes or 6% from the previous year as a result of lower production volume in 2007.
Sales volumes for uncoated mechanical grades in 2007 increased 21,300 tonnes or 4% from 2006. The growth in uncoated mechanical was due to the growth of Electraprime and Electrabrite into the retail insert market, which was offset by a decrease in demand for standard grades.
Sales volumes for directory in 2007 increased 57,200 tonnes or 21% compared to 2006. The growth was due to switching production to directory from newsprint to match increased sales volume opportunities to take advantage of stronger directory pricing.
| | 2.1.3 | Operational performance |
The specialty paper business made an operating loss of $75.1 million in 2007 compared to operating earnings of $9.7 million in 2006. 2007 EBITDA before specific items of $73.4 million, was $31.4 million lower compared to an EBITDA before specific items of $104.8 million in 2006.
Sales volumes increased 64,600 tonnes, or 6.5%, compared to the previous year. The increase was largely due to the increased production of directory grades. Average sales revenue was down $56 per tonne compared to the previous year primarily due to the stronger Canadian dollar and weaker average transaction prices across most grades other than directory.
Average delivered cash costs increased $25 per tonne compared to 2006. Higher fibre costs, the impact of restructuring, and USW strike costs more than offset performance improvements. Before the impact of specific items, average delivered cash costs were $802 per tonne, an improvement of $20 per tonne from the previous year.
Conditions are expected to improve for specialty printing paper products in 2008. Although demand across most grades is expected to be relatively flat, supply dynamics are leading to tighter market conditions.
Coated mechanical paper demand is expected to be flat, due to an anticipated slowing of magazine and catalogue circulation and increasing coated mechanical paper prices which will continue to encourage users to switch to SC-A grades. Recent capacity closures in Western Europe as well as the rising Euro are expected to result in lower imports to North America, which should cause the North American coated market to remain relatively tight in 2008. Benchmark prices are expected to increase in 2008.
Markets for uncoated mechanical grades are expected to remain relatively stable in 2008. Demand for high-gloss paper is expected to grow due to grade switching from coated mechanical and lower-gloss grades. Reduced imports from Europe as a result of the strong Euro and increased ocean freight costs, and reduced capacity in North America should keep North American operating rates high. Demand for machine-finished grades is expected to be stable in 2008. Benchmark prices for high-gloss grades are expected to strengthen throughout the year.
Directory demand is expected to be stable through 2008. Benchmark prices are expected to be flat. Contracts are in place for the upcoming year and price increases are estimated to average 1%.
| (In millions of dollars, except where otherwise stated) | |
| | | 2007 | | | 2006 | | | 2005 | |
Sales | | $ | 338.0 | | | $ | 529.8 | | | $ | 529.1 | |
EBITDA1 | | | (23.7 | ) | | | 71.8 | | | | 58.1 | |
EBITDA before specific items1 | | | (4.4 | ) | | | 71.8 | | | | 64.3 | |
| Operating earnings (loss) | | | (56.9 | ) | | | 6.9 | | | | 12.3 | |
EBITDA margin1,2 | | | (7.0 | )% | | | 13.6 | % | | | 11.0 | % |
EBITDA margin before specific items1,2 | | | (1.2 | )% | | | 13.6 | % | | | 12.2 | % |
| Sales (000 tonnes) | | | 496.3 | | | | 699.1 | | | | 707.1 | |
| Production (000 tonnes) | | | 472.8 | | | | 703.7 | | | | 699.5 | |
Curtailment (000 tonnes)3 | | | 98.9 | | | | - | | | | - | |
| Average sales revenue per tonne | | $ | 681 | | | $ | 758 | | | $ | 748 | |
Average delivered cash costs per tonne4 | | | 729 | | | | 655 | | | | 666 | |
Average delivered cash costs per tonne before specific items1,4 | | | 674 | | | | 655 | | | | 657 | |
| Benchmark prices | | | | | | | | | | | | |
Newsprint 48.8 gsm, West Coast delivery (US$/tonne)5 | | | 579 | | | | 649 | | | | 600 | |
| 1 | EBITDA, EBITDA before specific items, EBITDA margin, EBITDA margin before specific items, and average delivered cash costs per tonne before specific items are non-GAAP measures. Refer to Section 9, “Non-GAAP Measures” for further details. |
| 2 | EBITDA margin and EBITDA margin before specific items are defined as EBITDA and EBITDA before specific items as a percentage of sales and adjusted sales, respectively. Refer to Section 9, “Non-GAAP Measures” for further details. |
| 3 | Curtailment consists of downtime related to the USW strike. |
| 4 | Average delivered cash costs per tonne consist of cost of sales, including the impact of the USW strike, SG&A costs, and restructuring and change-of-control costs. |
| 5 | Benchmark selling prices are sourced from RISI. |
Newsprint demand in North America continued to decline in 2007 with total U.S. consumption down 10.5% year-over-year. The decline was due to reduced ad lineage, circulation, reduced web widths, lower basis weights and increased conservation measures by publishers. The falling demand resulted in lower benchmark prices. The average newsprint benchmark price in 2007 was US$579 per tonne, down US$70 per tonne or 11%, compared to 2006. Relatively strong demand overseas compared to weakness in U.S. consumption resulted in an increase in exports outside North America, but did not prevent prices from decreasing in 2007.
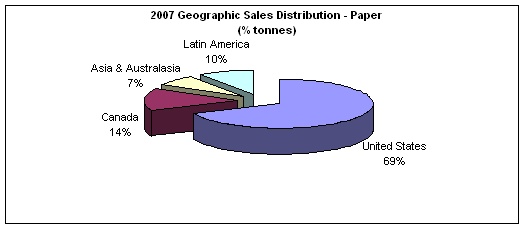
Approximately 82% of the Company’s newsprint sales volumes were to North America, Asia and Australasia. The 2007 geographical sales distribution, based on sales volumes, is depicted in the chart below.
In response to challenging newsprint market conditions, the Company continued its drive to optimize product mix in 2007 as it shifted production from newsprint to specialty paper grades, primarily directory. Overall, newsprint production decreased by approximately 231,000 tonnes in 2007:
| o | The Company indefinitely curtailed the A4 paper machine in Port Alberni on September 1, 2007, displacing the equivalent of 134,000 tonnes per year of the Company’s least profitable newsprint business. Management estimates this reduced the Company’s newsprint production by approximately 44,700 tonnes in 2007. |
| o | The Company utilized its ability to swing machine capacity between different grades to reduce newsprint and increase production of directory and certain uncoated specialty paper grades. |
| o | In addition to these initiatives, management estimates newsprint production was also reduced by 98,900 tonnes during the year as a result of the USW strike and related fibre supply disruptions. |
| | 2.2.3 | Operational performance |
The newsprint business made an operating loss of $56.9 million in 2007 compared to operating earnings of $6.9 million in 2006. 2007 EBITDA before specific items of negative $4.4 million was $76.2 million lower compared to an EBITDA before specific items of $71.8 million in 2006.
Sales volumes decreased 202,800 tonnes, or 29%, from the previous year, primarily due to the USW strike related fibre shortage, the flexibility to swing machine production to increase directory production, and the indefinite closure of the A4 paper machine in 2007. Average sales revenue decreased $77 per tonne compared to the previous year, largely due to lower transaction prices and the negative impact of the stronger Canadian dollar.
Average delivered cash costs increased $74 per tonne from the previous year. Savings from performance improvements were more than offset by the restructuring costs, higher fibre costs, and the impact of the USW strike. Before the impact of specific items, average delivered cash costs were $674 per tonne, an increase of $19 per tonne from the previous year.
The Company expects the newsprint market to tighten in 2008 due to significant capacity closures announced by North American producers. Approximately 5% of North American capacity is expected to shut down in the first quarter of 2008. As a result, newsprint prices have started to improve following the announcement of a US$25 per tonne increase effective November 1, 2007 and an announced price increase of US$60 per tonne to be phased in equally over January, February, and March 2008. The average benchmark newsprint price is expected to increase significantly in 2008.
Pulp
| (In millions of dollars, except where otherwise stated) | |
| | | 2007 | | | 2006 | | | 2005 | |
Sales | | $ | 457.0 | | | $ | 434.3 | | | $ | 394.3 | |
EBITDA1 | | | 24.5 | | | | 34.4 | | | | (18.7 | ) |
EBITDA before specific items1 | | | 47.7 | | | | 34.4 | | | | (18.7 | ) |
| Operating earnings (loss) | | | (17.4 | ) | | | (12.7 | ) | | | (62.2 | ) |
EBITDA margin1,2 | | | 5.4 | % | | | 7.9 | % | | | (4.7 | %) |
EBITDA margin before specific items1,2 | | | 9.8 | % | | | 7.9 | % | | | (4.7 | %) |
| | | | | | | | | | | | | |
| Sales (000 tonnes) | | | 603.2 | | | | 626.2 | | | | 603.0 | |
| Production (000 tonnes) | | | 601.8 | | | | 624.3 | | | | 590.9 | |
Curtailment (000 tonnes)3 | | | 54.7 | | | | - | | | | - | |
| | | | | | | | | | | | | |
| Average sales revenue per tonne | | $ | 757 | | | $ | 693 | | | $ | 654 | |
Average delivered cash costs per tonne4 | | | 717 | | | | 638 | | | | 684 | |
Average delivered cash costs per tonne before specific items1,4 | | | 679 | | | | 638 | | | | 684 | |
| | | | | | | | | | | | | |
| Benchmark prices | | | | | | | | | | | | |
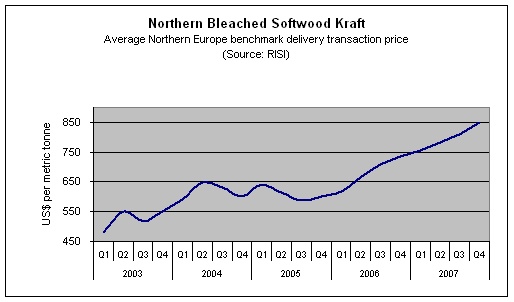
NBSK pulp, Northern Europe delivery (US$/tonne)5 | | | 800 | | | | 681 | | | | 610 | |
White-top linerboard, 42 lb., Eastern U.S. delivery (US$/ton)5 | | | 697 | | | | 673 | | | | 608 | |
| 1 | EBITDA, EBITDA before specific items, EBITDA margin, EBITDA margin before specific items, and average delivered cash costs per tonne before specific items are non-GAAP measures. Refer to Section 9, “Non-GAAP Measures” for further details. |
| 2 | EBITDA margin and EBITDA margin before specific items are defined as EBITDA and EBITDA before specific items as a percentage of sales and adjusted sales, respectively. Refer to Section 9, “Non-GAAP Measures” for further details. |
| 3 | Curtailment consists of downtime related to the USW strike. |
| 4 | Average delivered cash costs per tonne consist of cost of sales, including the impact of the USW strike, SG&A costs, and restructuring and change-of-control costs. |
| 5 | Benchmark selling prices are sourced from RISI. |
Pulp markets were strong throughout 2007 with global pulp shipments up 3% year-over-year and low world producer and consumer inventories during the year. Good demand and low inventories provided support for a number of price increases during the year and brought the Northern Europe benchmark price to US$870 per tonne at the end of 2007. The average Northern Europe NBSK benchmark price for 2007 was up US$119 per tonne, or 17%, compared to the previous year.
The U.S. containerboard market remained balanced in the year. U.S. producers took advantage of stronger currencies against the US$ to increase their export volume, which resulted in the average 2007 benchmark white-top linerboard price increasing US$24 per ton, or 4%, compared to 2006.
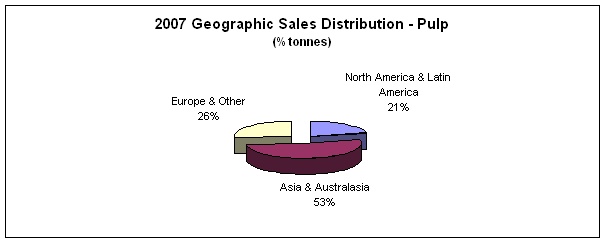
The primary markets for the Company’s market pulp are Asia and Europe. The 2007 geographical sales distribution, based on sales volumes, is depicted in the chart below.
Pulp and containerboard sales volumes decreased in 2007 by 3.7%, compared to 2006, due to production curtailment related to the fibre supply shortage as a result of the USW strike. However, the Company was able to take advantage of strong pulp markets to continue to increase its mix of contract business and optimize sales to customers in its major pulp markets.
Containerboard sales volumes in 2007 were 8.7% lower than in the previous year, due to the USW strike. The Company continued to focus on improving its customer mix by targeting North American customers that are more freight logical.
As a result of the USW strike and related fibre supply disruptions in the second half of the year, the Company temporarily curtailed its Elk Falls pulp mill and containerboard machine for 50 days and its Crofton pulp mill for 9 days. Management estimates pulp and containerboard production was reduced by 54,700 tonnes in the year as a result of these curtailments.
| | 2.3.3 | Operational performance |
The pulp and containerboard business made an operating loss of $17.4 million in 2007 compared to an operating loss of $12.7 million in 2006. 2007 EBITDA before specific items of $47.7 million was $13.3 million higher compared to an EBITDA before specific items of $34.4 million in 2006.
Sales volumes decreased 23,000 tonnes from the previous year. The decrease was due to decreased pulp production as a result of the USW strike related fibre shortage. Average sales revenue improved $64 per tonne compared to the previous year, due primarily to higher pulp prices, which more than offset the negative impact of the stronger Canadian dollar.
Average delivered cash costs increased $79 per tonne in 2007 compared to 2006. Savings from performance improvements were more than offset by costs associated with the USW strike, higher fibre costs, and restructuring costs. Before specific items, average delivered cash costs were $679 per tonne, comparable to the previous year.
Demand for NBSK pulp is expected to remain steady during the first half of 2008, with the expectation that benchmark prices will increase modestly in early 2008 followed by potentially softer pulp prices in the second half of the year. Higher consumption by China is expected to be offset by weaker demand from markets in the U.S. and Europe, which is expected to limit overall growth in demand in 2008.
The Company is expecting that demand and prices for containerboard will remain flat in 2008 as North American producers are expected to continue to access export markets because of the slower U.S. economy.
| SEGMENTED RESULTS - QUARTERLY |
Selected quarterly financial information
| (In millions of dollars, except where otherwise stated) | |
| | | 2007 | | | 2006 | |
| | | TOTAL | | | | Q4 | | | | Q3 | | | | Q2 | | | | Q1 | | | TOTAL | | | | Q4 | | | | Q3 | | | | Q2 | | | | Q1 | |
Sales | | $ | 1,714.6 | | | $ | 381.0 | | | $ | 413.7 | | | $ | 441.8 | | | $ | 478.1 | | | $ | 1,882.5 | | | $ | 470.6 | | | $ | 486.0 | | | $ | 469.6 | | | $ | 456.3 | |
| Operating earnings (loss) | | | (149.4 | ) | | | (27.7 | ) | | | (44.3 | ) | | | (46.7 | ) | | | (30.7 | ) | | | 3.9 | | | | (3.3 | ) | | | 17.0 | | | | 6.1 | | | | (15.9 | ) |
EBITDA 1 | | | 27.0 | | | | 15.1 | | | | (0.3 | ) | | | (1.9 | ) | | | 14.1 | | | | 211.0 | | | | 48.5 | | | | 62.8 | | | | 52.4 | | | | 47.3 | |
EBITDA before specific items 1 | | | 116.7 | | | | 28.8 | | | | 37.4 | | | | 17.4 | | | | 33.1 | | | | 211.0 | | | | 48.5 | | | | 62.8 | | | | 52.4 | | | | 47.3 | |
| Net earnings (loss) | | | (31.6 | ) | | | 12.4 | | | | (18.6 | ) | | | 0.2 | | | | (25.6 | ) | | | (15.9 | ) | | | (37.2 | ) | | | 2.5 | | | | 42.4 | | | | (23.6 | ) |
Net earnings (loss) before specific items 1 | | | (89.3 | ) | | | (20.9 | ) | | | (16.9 | ) | | | (31.8 | ) | | | (19.7 | ) | | | (25.0 | ) | | | (7.2 | ) | | | 0.6 | | | | (6.7 | ) | | | (11.7 | ) |
EBITDA margin 1,2 | | | 1.6 | % | | | 4.0 | % | | | (0.1 | %) | | | (0.4 | %) | | | 2.9 | % | | | 11.2 | % | | | 10.3 | % | | | 12.9 | % | | | 11.2 | % | | | 10.4 | % |
EBITDA margin before specific items 1,2 | | | 6.5 | % | | | 6.6 | % | | | 8.5 | % | | | 3.9 | % | | | 6.9 | % | | | 11.2 | % | | | 10.3 | % | | | 12.9 | % | | | 11.2 | % | | | 10.4 | % |
| Net earnings (loss) per share (in dollars) – basic and diluted | | $ | (0.15 | ) | | $ | 0.06 | | | $ | (0.09 | ) | | $ | 0.00 | | | $ | (0.12 | ) | | $ | (0.07 | ) | | $ | (0.17 | ) | | $ | 0.01 | | | $ | 0.20 | | | $ | (0.11 | ) |
Net earnings (loss) per share before specific items (in dollars) – basic and diluted 1 | | $ | (0.42 | ) | | $ | (0.10 | ) | | | (0.08 | ) | | | (0.15 | ) | | | (0.09 | ) | | | (0.12 | ) | | | (0.03 | ) | | | 0.00 | | | | (0.03 | ) | | | (0.06 | ) |
| Sales (000 tonnes) | | | | | | | | | | | | | | | | | | | | | | | | | | | | | | | | | | | | | | | | |
| Specialty paper | | | 1,054.8 | | | | 279.3 | | | | 261.1 | | | | 259.2 | | | | 255.2 | | | | 990.2 | | | | 252.7 | | | | 264.6 | | | | 237.8 | | | | 235.1 | |
| Newsprint | | | 496.3 | | | | 70.7 | | | | 119.8 | | | | 157.1 | | | | 148.7 | | | | 699.1 | | | | 170.1 | | | | 169.5 | | | | 178.4 | | | | 181.1 | |
| Total paper | | | 1,551.1 | | | | 350.0 | | | | 380.9 | | | | 416.3 | | | | 403.9 | | | | 1,689.3 | | | | 422.8 | | | | 434.1 | | | | 416.2 | | | | 416.2 | |
| Pulp | | | 603.2 | | | | 136.1 | | | | 151.8 | | | | 147.4 | | | | 167.9 | | | | 626.2 | | | | 145.5 | | | | 155.9 | | | | 171.4 | | | | 153.4 | |
| Total sales | | | 2,154.3 | | | | 486.1 | | | | 532.7 | | | | 563.7 | | | | 571.8 | | | | 2,315.5 | | | | 568.3 | | | | 590.0 | | | | 587.6 | | | | 569.6 | |
| Production (000 tonnes) | | | | | | | | | | | | | | | | | | | | | | | | | | | | | | | | | | | | | | | | |
| Specialty paper | | | 1,055.4 | | | | 265.8 | | | | 262.6 | | | | 270.4 | | | | 256.6 | | | | 983.7 | | | | 249.0 | | | | 254.8 | | | | 244.2 | | | | 235.7 | |
| Newsprint | | | 472.8 | | | | 60.9 | | | | 110.9 | | | | 148.9 | | | | 152.1 | | | | 703.7 | | | | 170.2 | | | | 170.0 | | | | 179.6 | | | | 183.9 | |
| Total paper | | | 1,528.2 | | | | 326.7 | | | | 373.5 | | | | 419.3 | | | | 408.7 | | | | 1,687.4 | | | | 419.2 | | | | 424.8 | | | | 423.8 | | | | 419.6 | |
| Pulp | | | 601.8 | | | | 144.7 | | | | 143.2 | | | | 157.1 | | | | 156.8 | | | | 624.3 | | | | 152.8 | | | | 162.8 | | | | 155.6 | | | | 153.1 | |
| Total production | | | 2,130.0 | | | | 471.4 | | | | 516.7 | | | | 576.4 | | | | 565.5 | | | | 2,311.7 | | | | 572.0 | | | | 587.6 | | | | 579.4 | | | | 572.7 | |
| US$/CDN$ foreign exchange | | | | | | | | | | | | | | | | | | | | | | | | | | | | | | | | | | | | | | | | |
Average spot rate 3 | | | 0.930 | | | | 1.019 | | | | 0.957 | | | | 0.911 | | | | 0.854 | | | | 0.882 | | | | 0.878 | | | | 0.892 | | | | 0.892 | | | | 0.866 | |
Period-end spot rate 4 | | | 1.012 | | | | 1.012 | | | | 1.004 | | | | 0.940 | | | | 0.867 | | | | 0.858 | | | | 0.858 | | | | 0.897 | | | | 0.897 | | | | 0.857 | |
Effective rate 5 | | | 0.917 | | | | 0.970 | | | | 0.935 | | | | 0.916 | | | | 0.860 | | | | 0.872 | | | | 0.878 | | | | 0.886 | | | | 0.872 | | | | 0.853 | |
| Common shares (millions) | | | | | | | | | | | | | | | | | | | | | | | | | | | | | | | | | | | | | | | | |
| At period-end | | | 214.7 | | | | 214.7 | | | | 214.7 | | | | 214.7 | | | | 214.6 | | | | 214.6 | | | | 214.6 | | | | 214.6 | | | | 214.6 | | | | 214.6 | |
| Weighted average | | | 214.7 | | | | 214.7 | | | | 214.7 | | | | 214.7 | | | | 214.6 | | | | 214.6 | | | | 214.6 | | | | 214.6 | | | | 214.6 | | | | 214.6 | |
| 1 | EBITDA, EBITDA before specific items, EBITDA margin, EBITDA margin before specific items, net earnings (loss) before specific items, and net earnings (loss) per share before specific items are non-GAAP measures. Refer to Section 9, “Non-GAAP Measures” for further details. |
| 2 | EBITDA margin and EBITDA margin before specific items are defined as EBITDA and EBITDA before specific items, as a percentage of sales and adjusted sales, respectively. Refer to Section 9, “Non-GAAP Measures” for further details. |
| 3 | Average spot rate is the average Bank of Canada noon spot rate over the reporting period. |
| 4 | Period-end spot rate is the Bank of Canada noon spot rate. |
| 5 | Effective rate represents a blended rate which takes account of the applicable spot rates, the Company’s revenue hedging program in the period, and translation of US$-denominated working capital at period opening and closing rates. See Section 8, “Summary of Quarterly Results” for further details. |
Summary of selected segmented financial information
| (In millions of dollars, except where otherwise stated) | |
| | | 2007 | | | 2006 | |
| Specialty paper | | TOTAL | | | | Q4 | | | | Q3 | | | | Q2 | | | | Q1 | | | TOTAL | | | | Q4 | | | | Q3 | | | | Q2 | | | | Q1 | |
Sales | | $ | 919.6 | | | $ | 234.3 | | | $ | 222.1 | | | $ | 225.1 | | | $ | 238.1 | | | $ | 918.4 | | | $ | 234.0 | | | $ | 245.0 | | | $ | 218.6 | | | $ | 220.8 | |
EBITDA1 | | | 26.2 | | | | 12.5 | | | | 0.0 | | | | 4.1 | | | | 9.6 | | | | 104.8 | | | | 18.4 | | | | 31.6 | | | | 25.7 | | | | 29.1 | |
EBITDA before specific items1 | | | 73.4 | | | | 16.1 | | | | 17.6 | | | | 17.0 | | | | 22.7 | | | | 104.8 | | | | 18.4 | | | | 31.6 | | | | 25.7 | | | | 29.1 | |
| Operating earnings (loss) | | | (75.1 | ) | | | (13.5 | ) | | | (26.3 | ) | | | (21.1 | ) | | | (14.2 | ) | | | 9.7 | | | | (6.6 | ) | | | 6.9 | | | | 2.8 | | | | 6.6 | |
EBITDA margin1, 2 | | | 2.8 | % | | | 5.3 | % | | | 0.0 | % | | | 1.8 | % | | | 4.0 | % | | | 11.4 | % | | | 7.9 | % | | | 12.9 | % | | | 11.8 | % | | | 13.2 | % |
EBITDA margin before specific items1, 2 | | | 8.0 | % | | | 6.9 | % | | | 8.0 | % | | | 7.6 | % | | | 9.5 | % | | | 11.4 | % | | | 7.9 | % | | | 12.9 | % | | | 11.8 | % | | | 13.2 | % |
| Sales (000 tonnes) | | | 1,054.8 | | | | 279.3 | | | | 261.1 | | | | 259.2 | | | | 255.2 | | | | 990.2 | | | | 252.7 | | | | 264.6 | | | | 237.8 | | | | 235.1 | |
| Production (000 tonnes) | | | 1,055.4 | | | | 265.8 | | | | 262.6 | | | | 270.4 | | | | 256.6 | | | | 983.7 | | | | 249.0 | | | | 254.8 | | | | 244.2 | | | | 235.7 | |
Curtailment (000 tonnes)3 | | | 7.2 | | | | 4.0 | | | | 3.2 | | | | - | | | | - | | | | - | | | | - | | | | - | | | | - | | | | - | |
| | | | | | | | | | | | | | | | | | | | | | | | | | | | | | | | | | | | | | | | | |
| Average sales revenue per tonne | | $ | 872 | | | $ | 839 | | | $ | 850 | | | $ | 868 | | | $ | 933 | | | $ | 928 | | | $ | 927 | | | $ | 926 | | | $ | 920 | | | $ | 939 | |
Average delivered cash costs per tonne4 | | | 847 | | | | 794 | | | | 849 | | | | 852 | | | | 896 | | | | 822 | | | | 853 | | | | 806 | | | | 811 | | | | 815 | |
Average delivered cash costs per tonne before specific items4 | | | 802 | | | | 783 | | | | 781 | | | | 802 | | | | 845 | | | | 822 | | | | 853 | | | | 806 | | | | 811 | | | | 815 | |
SC-A paper, 35 lb. (US$/ton)5 | | | 753 | | | | 770 | | | | 745 | | | | 745 | | | | 752 | | | | 788 | | | | 787 | | | | 800 | | | | 785 | | | | 780 | |
LWC paper, No. 5, 40 lb. (US$/ton)5 | | | 786 | | | | 848 | | | | 782 | | | | 748 | | | | 767 | | | | 836 | | | | 798 | | | | 820 | | | | 852 | | | | 875 | |
Telephone directory paper, 22.1 lb. (US$/ton)5 | | | 740 | | | | 740 | | | | 740 | | | | 740 | | | | 740 | | | | 721 | | | | 725 | | | | 725 | | | | 720 | | | | 715 | |
| Newsprint | | | | | | | | | | | | | | | | | | | | | | | | | | | | | | | | | | | | | | | | |
| Sales | | $ | 338.0 | | | $ | 44.2 | | | $ | 77.8 | | | $ | 106.7 | | | $ | 109.3 | | | $ | 529.8 | | | $ | 128.4 | | | $ | 128.8 | | | $ | 135.4 | | | $ | 137.2 | |
EBITDA1 | | | (23.7 | ) | | | (8.3 | ) | | | (8.1 | ) | | | (4.2 | ) | | | (3.1 | ) | | | 71.8 | | | | 14.5 | | | | 18.2 | | | | 19.3 | | | | 19.8 | |
EBITDA before specific items1 | | | (4.4 | ) | | | (4.4 | ) | | | (0.4 | ) | | | (0.2 | ) | | | 0.6 | | | | 71.8 | | | | 14.5 | | | | 18.2 | | | | 19.3 | | | | 19.8 | |
| Operating earnings (loss) | | | (56.9 | ) | | | (14.5 | ) | | | (15.6 | ) | | | (13.5 | ) | | | (13.3 | ) | | | 6.9 | | | | 1.9 | | | | 7.5 | | | | 7.4 | | | | (9.9 | ) |
EBITDA margin1, 2 | | | (7.0 | %) | | | (18.8 | %) | | | (10.4 | %) | | | (3.9 | %) | | | (2.8 | %) | | | 13.6 | % | | | 11.3 | % | | | 14.1 | % | | | 14.3 | % | | | 14.4 | % |
EBITDA margin before specific items1, 2 | | | (1.2 | %) | | | (5.5 | %) | | | (0.8 | %) | | | 0.0 | % | | | 0.0 | % | | | 13.6 | % | | | 11.3 | % | | | 14.1 | % | | | 14.3 | % | | | 14.4 | % |
| Sales (000 tonnes) | | | 496.3 | | | | 70.7 | | | | 119.8 | | | | 157.1 | | | | 148.7 | | | | 699.1 | | | | 170.1 | | | | 169.5 | | | | 178.4 | | | | 181.1 | |
| Production (000 tonnes) | | | 472.8 | | | | 60.9 | | | | 110.9 | | | | 148.9 | | | | 152.1 | | | | 703.7 | | | | 170.2 | | | | 170.0 | | | | 179.6 | | | | 183.9 | |
Curtailment (000 tonnes)3 | | | 98.9 | | | | 65.8 | | | | 33.1 | | | | - | | | | - | | | | - | | | | - | | | | - | | | | - | | | | - | |
| | | | | | | | | | | | | | | | | | | | | | | | | | | | | | | | | | | | | | | | | |
| Average sales revenue per tonne | | $ | 681 | | | $ | 625 | | | $ | 650 | | | $ | 679 | | | $ | 735 | | | $ | 758 | | | $ | 754 | | | $ | 761 | | | $ | 759 | | | $ | 758 | |
Average delivered cash costs per tonne4 | | | 729 | | | | 742 | | | | 720 | | | | 706 | | | | 756 | | | | 655 | | | | 669 | | | | 653 | | | | 651 | | | | 647 | |
Average delivered cash costs per tonne before specific items4 | | | 674 | | | | 636 | | | | 646 | | | | 681 | | | | 731 | | | | 655 | | | | 669 | | | | 653 | | | | 651 | | | | 647 | |
Newsprint 48.8 gsm, West Coast delivery (US$/tonne)5 | | | 579 | | | | 565 | | | | 561 | | | | 584 | | | | 606 | | | | 649 | | | | 649 | | | | 658 | | | | 651 | | | | 640 | |
| Pulp | | | | | | | | | | | | | | | | | | | | | | | | | | | | | | | | | | | | | | | | |
| Sales | | $ | 457.0 | | | $ | 102.5 | | | $ | 113.8 | | | $ | 110.0 | | | $ | 130.7 | | | $ | 434.3 | | | $ | 108.2 | | | $ | 112.2 | | | $ | 115.6 | | | $ | 98.3 | |
EBITDA1 | | | 24.5 | | | | 10.9 | | | | 7.8 | | | | (1.8 | ) | | | 7.6 | | | | 34.4 | | | | 15.6 | | | | 13.0 | | | | 7.4 | | | | (1.6 | ) |
EBITDA before specific items1 | | | 47.7 | | | | 17.1 | | | | 20.2 | | | | 0.6 | | | | 9.8 | | | | 34.4 | | | | 15.6 | | | | 13.0 | | | | 7.4 | | | | (1.6 | ) |
| Operating earnings (loss) | | | (17.4 | ) | | | 0.3 | | | | (2.4 | ) | | | (12.1 | ) | | | (3.2 | ) | | | (12.7 | ) | | | 1.4 | | | | 2.6 | | | | (4.1 | ) | | | (12.6 | ) |
EBITDA margin1, 2 | | | 5.4 | % | | | 10.6 | % | | | 6.9 | % | | | (1.6 | %) | | | 5.8 | % | | | 7.9 | % | | | 14.4 | % | | | 11.6 | % | | | 6.4 | % | | | (1.6 | %) |
EBITDA margin before specific items1, 2 | | | 9.8 | % | | | 14.2 | % | | | 16.2 | % | | | 0.5 | % | | | 7.5 | % | | | 7.9 | % | | | 14.4 | % | | | 11.6 | % | | | 6.4 | % | | | (1.6 | %) |
| Sales (000 tonnes) | | | 603.2 | | | | 136.1 | | | | 151.8 | | | | 147.4 | | | | 167.9 | | | | 626.2 | | | | 145.5 | | | | 155.9 | | | | 171.4 | | | | 153.4 | |
| Production (000 tonnes) | | | 601.8 | | | | 144.7 | | | | 143.2 | | | | 157.1 | | | | 156.8 | | | | 624.3 | | | | 152.8 | | | | 162.8 | | | | 155.6 | | | | 153.1 | |
Curtailment (000 tonnes)3 | | | 54.7 | | | | 26.8 | | | | 27.9 | | | | - | | | | - | | | | - | | | | - | | | | - | | | | - | | | | - | |
| | | | | | | | | | | | | | | | | | | | | | | | | | | | | | | | | | | | | | | | | |
| Average sales revenue per tonne | | $ | 757 | | | $ | 753 | | | $ | 750 | | | $ | 746 | | | $ | 778 | | | $ | 693 | | | $ | 744 | | | $ | 720 | | | $ | 674 | | | $ | 641 | |
Average delivered cash costs per tonne4 | | | 717 | | | | 672 | | | | 699 | | | | 759 | | | | 732 | | | | 638 | | | | 636 | | | | 637 | | | | 630 | | | | 652 | |
Average delivered cash costs per tonne before specific items4 | | | 679 | | | | 637 | | | | 622 | | | | 743 | | | | 719 | | | | 638 | | | | 636 | | | | 637 | | | | 630 | | | | 652 | |
NBSK pulp, Northern Europe delivery (US$/tonne)5 | | | 800 | | | | 850 | | | | 810 | | | | 783 | | | | 757 | | | | 681 | | | | 737 | | | | 710 | | | | 665 | | | | 618 | |
White-top linerboard, 42 lb., Eastern U.S.delivery (US$/ton)5 | | | 697 | | | | 720 | | | | 707 | | | | 680 | | | | 680 | | | | 673 | | | | 680 | | | | 680 | | | | 680 | | | | 650 | |
| | 1 | EBITDA, EBITDA before specific items, EBITDA margin, EBITDA margin before specific items, and average delivered cash costs per tonne before specific items are non-GAAP measures. Refer to Section 9, “Non-GAAP Measures” for further details. |
| | 2 | EBITDA margin and EBITDA margin before specific items are defined as EBITDA and EBITDA before specific items as a percentage of sales and adjusted sales, respectively. Refer to Section 9, “Non-GAAP Measures” for further details. |
| | 3 | Curtailment consists of downtime related to the USW strike. |
| | 4 | Average delivered cash costs per tonne consist of cost of sales, including the impact of the USW strike, SG&A costs, and restructuring and change of-control costs. |
| | 5 | Benchmark selling prices are sourced from RISI. |
Fourth quarter overview
The strengthening Canadian dollar continued to adversely impact the Company’s results in the fourth quarter. Despite this, net earnings were positive in the fourth quarter (“Q4”), primarily due to favourable income tax adjustments. The Company recorded net earnings of $12.4 million in Q4, compared to a net loss of $18.6 million in the third quarter (“Q3”). EBITDA was $15.1 million in Q4, compared to negative $0.3 million in Q3.
The Company’s results included restructuring and change-of-control costs of $2.0 million and $24.4 million for Q4 and Q3, respectively. Management estimates the results were negatively impacted by $11.7 million and $13.3 million for Q4 and Q3, respectively, due to the USW strike. This strike resulted in the Company’s production decreasing by approximately 96,600 and 64,200 tonnes in Q4 and Q3, respectively. Production continued to be curtailed at Elk Falls No. 1 (“E1”) paper machine throughout Q4, and the Elk Falls No. 2 (“E2”) and Elk Falls No. 5 (“E5”) paper machines were down 9 days and 44 days, respectively. In addition, production was curtailed at the Crofton pulp mill for 9 days during Q4.
Q4 EBITDA before specific items of $28.8 million declined $8.6 million compared to EBITDA before specific items of $37.4 million in Q3. This decrease was mainly a result of the Canadian dollar continuing to strengthen.
| | 3.1 | Three months ended December 31, 2007 compared to three months ended September 30, 2007 |
Consolidated results of operations
Sales
Sales in Q4, 2007 decreased $32.7 million compared to Q3, 2007. The decrease in sales was largely due to curtailment of newsprint and pulp production in Q3 and Q4 reducing Q4 sales volumes, and the stronger Canadian dollar more than offsetting the positive impact of higher average transaction prices for pulp and paper products.
EBITDA and EBITDA before specific items
| ($ millions) | | EBITDA(1) | | | EBITDA before Specific Items(1) | |
Q3, 2007 | | $ | (0.3 | ) | | $ | 37.4 | |
| Paper prices | | | 3.3 | | | | 3.3 | |
| Pulp prices | | | 4.8 | | | | 4.8 | |
| Impact of Canadian dollar, net of hedging | | | (7.6 | ) | | | (7.6 | ) |
| USW strike impact | | | 1.6 | | | | - | |
| Restructuring and change-of-control costs | | | 22.4 | | | | - | |
| Other, net | | | (9.1 | ) | | | (9.1 | ) |
Q4, 2007 | | $ | 15.1 | | | $ | 28.8 | |
| 1 | EBITDA and EBITDA before specific items are non-GAAP measures. Refer to Section 9, “Non-GAAP Measures” for further details. |
Operating earnings (loss)
The Company’s operating loss improved by $16.6 million in Q4, compared to Q3, 2007, and was primarily related to the $15.4 million increase in EBITDA noted above.
Net earnings (loss)
Net earnings in Q4, 2007 of $12.4 million ($0.06 per common share) increased $31.0 million compared to a net loss of $18.6 million ($0.09 per common share) in Q3, 2007. Net earnings for the current quarter included a release of future income taxes related to the reduction in the federal corporate income tax rate and the tax uncertainties resolved with the conclusion of an examination by the Canada Revenue Agency in the amounts of $21.0 million and $14.0 million, respectively. After adjusting these and other specific items, net loss before specific items in Q4, 2007 was $20.9 million ($0.10 per common share), compared to a net loss before specific items of $16.9 million ($0.08 per common share) in the previous quarter. Refer to Section 9, “Non-GAAP Measures” for details on net earnings (loss) before specific items.
Operational performance – specialty paper
The specialty paper business operating loss decreased $12.8 million in Q4, compared to Q3, 2007.
Sales volumes increased 18,200 tonnes from Q3, 2007 due to an increase in uncoated paper and directory shipments. Average sales revenue decreased $11 per tonne from the previous quarter, due to the stronger Canadian dollar which more than offset higher transaction prices in Q4, 2007.
Average delivered cash costs improved $55 per tonne compared to Q3, 2007, due primarily to lower restructuring costs. Before the impact of specific items, average cash costs were $783 per tonne, an increase of $2 per tonne from the previous quarter.
Operational performance – newsprint
The newsprint business operating loss decreased by $1.1 million from the previous quarter.
Sales volumes decreased 49,100 tonnes compared to Q3, 2007, primarily due to the USW strike and the indefinite closure of the A4 paper machine. Average sales revenue decreased $25 per tonne from Q3, 2007, due primarily to the stronger Canadian dollar.
Average delivered cash costs increased $22 per tonne from Q3, 2007. Performance improvements and lower restructuring costs were more than offset by the impact of seasonally higher energy costs and costs associated with the USW strike. Before specific items, average delivered cash costs were $636 per tonne, an improvement of $10 per tonne from the previous quarter.
Operational performance – pulp
The pulp and containerboard business operating earnings increased in Q4 by $2.7 million from the previous quarter.
Sales volumes decreased 15,700 tonnes from Q3, 2007, as a result of the USW strike and related fibre supply disruptions. Average sales revenue increased $3 per tonne from Q3, 2007, with higher pulp prices more than offsetting the stronger Canadian dollar.
Average delivered cash costs of $672 per tonne decreased by $27 per tonne compared to Q3, 2007, primarily due to lower restructuring costs and performance improvements outweighing seasonally higher energy costs and costs associated with a maintenance shutdown and the USW strike related curtailment taken at the Crofton mill. Before specific items, average delivered cash costs were $637 per tonne, an increase of $15 per tonne from the previous quarter.
| | 3.2 | Three months ended December 31, 2007 compared to three months ended December 31, 2006 |
Sales
Sales decreased by $89.6 million in Q4, 2007 compared to sales in Q4, 2006. The negative impact of lower sales volumes, primarily related to the USW strike, and the curtailment of the A4 paper machine, the stronger Canadian dollar, and weaker paper prices for the majority of the Company’s paper grades more than offset improved average transaction prices for the Company’s pulp products.
EBITDA and EBITDA before Specific Items
| ($ millions) | | EBITDA(1) | | | EBITDA before Specific Items(1) | |
Q4, 2006 | | $ | 48.5 | | | $ | 48.5 | |
| Paper prices | | | (9.7 | ) | | | (9.7 | ) |
| Pulp prices | | | 10.9 | | | | 10.9 | |
| Impact of Canadian dollar, net of hedging | | | (21.9 | ) | | | (21.9 | ) |
| Restructuring and change-of-control costs | | | (2.0 | ) | | | - | |
| USW strike impact | | | (11.7 | ) | | | - | |
| Workforce reductions | | | 12.2 | | | | 12.2 | |
| Fibre costs | | | (16.6 | ) | | | (16.6 | ) |
| Other, net | | | 5.4 | | | | 5.4 | |
Q4, 2007 | | $ | 15.1 | | | $ | 28.8 | |
| 1 | EBITDA and EBITDA before specific items are non-GAAP measures. Refer to Section 9, “Non-GAAP Measures” for further details. |
EBITDA before specific items decreased by $19.7 million in Q4, 2007 compared to the same period in 2006. The negative impact of the stronger Canadian dollar, weaker average paper prices, and higher fibre costs were the primary drivers of the decrease and more than offset improved average transaction prices for the Company’s pulp products and the realization of benefits from performance improvements, particularly from workforce reductions. Including the impact of the USW strike and restructuring and change-of-control costs, EBITDA decreased by $33.4 million in Q4, 2007 compared to the same period in 2006.
Operating earnings (loss)
Operating loss increased by $24.4 million in Q4, 2007 compared to the same period in 2006. The increase in operating loss from the comparative period was primarily related to the $33.4 million decrease in EBITDA noted above, which was partially offset by a $9.0 million decrease in amortization expense. Q4, 2006 amortization expense included an impairment loss of $4.3 million related to assets that had been previously idled and $1.5 million related to the permanent closure of the A3 paper machine.
Net earnings (loss)
Net earnings were $12.4 million ($0.06 per common share) in Q4, 2007, an increase of $49.6 million from the comparative period in 2006. Net earnings for the current quarter included a release of future income taxes related to the reduction in the federal corporate income tax rate and tax uncertainties resolved with the conclusion of an examination by the Canada Revenue Agency in the amounts of $21.0 million and $14.0 million, respectively. Net loss before these and other specific items in Q4 was $20.9 million ($0.10 per common share) compared to a net loss before specific items of $7.2 million ($0.03 per common share) in Q4, 2006. Refer to Section 9, “Non-GAAP Measures” for details on net earnings (loss) before specific items.
Operational performance – specialty paper
The specialty paper business operating loss increased $6.9 million in Q4, 2007, compared to the same period in 2006.
Sales volumes increased 26,600 tonnes, from the comparative period in 2006. The increase from Q4, 2006 was largely due to switching machine production to specialty paper grades from newsprint. Average sales revenue decreased by $88 per tonne, due primarily to the stronger Canadian dollar and, to a lesser extent, weaker prices across most paper grades.
Average delivered cash costs decreased $59 per tonne, from the comparative period in 2006. This was primarily due to performance improvements which more than offset the impact of higher fibre costs and restructuring costs. Before the impact of specific items, average delivered cash costs were $783 per tonne, a decrease of $70 per tonne from the comparative period in 2006.
Operational performance – newsprint
The newsprint business operating loss increased $16.4 million in Q4, 2007, compared to the same period in 2006.
Sales volumes decreased 99,400 tonnes from the comparable period, primarily due to the flexibility to swing machine production to increase directory and specialty paper production in 2007, the USW strike, and the indefinite closure of the A4 paper machine in September 2007. Average sales revenue decreased $129 per tonne due to lower transaction prices and the negative impact of the stronger Canadian dollar.
Average delivered cash costs increased $73 per tonne from the comparative period in 2006. The impact of costs associated with the USW strike, higher fibre costs and restructuring costs more than offset cost savings from performance improvements. Before the impact of specific items, average delivered cash costs were $636 per tonne, a decrease of $33 per tonne from the comparative period in 2006.
Operational performance - pulp
The pulp and containerboard business operating earnings decreased by $1.1 million in Q4, 2007, compared to the same period in 2006.
Sales volumes decreased 9,400 tonnes from the comparative period, primarily due to the curtailment of production in Q4, 2007 due to the USW strike. Average sales revenue increased $9 per tonne with higher average transaction prices outpacing the strengthening Canadian dollar.
Average delivered cash costs increased $36 per tonne, from the comparative period as significantly increased pulp fibre costs and costs associated with the USW strike more than offset performance improvements. Before the impact of specific items, average delivered cash costs were $637 per tonne, an increase of $1 per tonne, from the comparative period in 2006.
The following table highlights the significant changes between the consolidated balance sheets as at December 31, 2007, and December 31, 2006:
(In millions of dollars) | 2007 | 2006 | Variance | Comment |
Working capital | $ 221.3 | $ 282.3 | $(61.0) | Decrease reflects lower cash and cash equivalents, and receivables, partly offset by increase in current other assets as a result of adoption of CICA Section 3855 “Financial Instruments – Recognition and Measurement” and lower payables levels before back-out of non-cash items. Lower receivables and payables primarily due to curtailment in Q4, 2007. |
Capital assets | 1,912.8 | 2,023.1 | (110.3) | Amortization expense exceeded capital asset additions. Refer to the “Investing Activities” section for additional details on capital asset additions. |
Other assets | 51.1 | 40.8 | 10.3 | Increase reflects higher long-term pension asset and long-term derivative financial instruments , partly offset by the reclassification of deferred financing costs to long-term debt pursuant to CICA Section 3855 “Financial Instruments – Recognition and Measurement” guidelines. |
Total debt | 785.8 | 860.5 | (74.7) | Decrease reflects the stronger Canadian dollar, the reclassification of deferred financing costs to long-term debt, partly offset by increased utilization of our revolving operating facility. |
Employee future benefits | 211.7 | 187.2 | 24.5 | Increase reflects a number of early retirements as part of the Company’s restructuring initiative, the change in underlying actuarial assumptions, and a reclassification from other long term obligations. |
Other long-term obligations | 26.9 | 23.3 | 3.6 | Increase reflects liabilities related to the Company’s restructuring initiative, partly offset by reclassification to employee future benefits. |
Future income taxes and deferred credits | 172.2 | 269.4 | (97.2) | Decrease includes $22.4 million related to a reduction in corporate income tax rates and $14.0 million favourable outcome on an outstanding issue. The balance of the reduction primarily relates to future income taxes on 2007 losses. |
Contributed surplus | 12.1 | 9.3 | 2.8 | Increase relates to the recording of stock-based compensation. |
| 5.0 | LIQUIDITY AND CAPITAL RESOURCES |
Selected annual financial information
| (In millions of dollars, except where otherwise stated) | |
| | | 2007 | | | 2006 | | | 2005 | |
Cash flows (used) provided by operations before changes in non-cash working capital | | $ | (52.8 | ) | | $ | 136.8 | | | $ | 72.2 | |
| Changes in non-cash working capital | | | 50.1 | | | | (9.6 | ) | | | (11.5 | ) |
| Cash flows (used) provided by | | | | | | | | | | | | |
Operations | | | (2.7 | ) | | | 127.2 | | | | 60.7 | |
Investing activities | | | (83.7 | ) | | | (85.8 | ) | | | (93.0 | ) |
Financing activities | | | 50.9 | | | | (5.9 | ) | | | 6.3 | |
| Capital spending | | | 85.8 | | | | 93.2 | | | | 95.2 | |
Amortization1 | | | 176.4 | | | | 207.1 | | | | 180.3 | |
| Capital spending as % of amortization | | | 49 | % | | | 45 | % | | | 53 | % |
Total debt to total capitalization2,3 | | | 44 | % | | | 46 | % | | | 46 | % |
Net debt to net capitalization4,5 | | | 44 | % | | | 45 | % | | | 46 | % |
Net debt to EBITDA4,6 | | | 29.1 | | | | 3.9 | | | | 5.6 | |
EBITDA to interest6 | | | 0.4 | | | | 2.9 | | | | 2.1 | |
1 2006 amortization expense includes a $19.1 million impairment loss related to the permanent closure of the A3 paper machine, and $4.3 million in other asset impairments.
2 Total debt comprises long-term debt, including current portion.
3 Total capitalization comprises total debt and shareholders’ equity.
4 Net debt comprises total debt, less cash on hand.
5 Net capitalization comprises net debt and shareholders’ equity.
6 EBITDA is a non-GAAP measure. Refer to Section 9, "Non-GAAP measures" for further details.
Selected quarterly financial information
| (In millions of dollars, except where otherwise stated) | |
| | | 2007 | | | 2006 | |
| | | TOTAL | | | | Q4 | | | | Q3 | | | | Q2 | | | | Q1 | | | TOTAL | | | | Q4 | | | | Q3 | | | | Q2 | | | | Q1 | |
Cash flows (used) provided by operationsbefore changes in non-cash operating working capital | | $ | (52.8 | ) | | $ | 3.1 | | | $ | (18.1 | ) | | $ | (29.2 | ) | | $ | (8.6 | ) | | $ | 136.8 | | | $ | 41.6 | | | $ | 40.3 | | | $ | 20.2 | | | $ | 34.7 | |
| Changes in non-cash working capital | | | 50.1 | | | | 30.4 | | | | (15.8 | ) | | | 25.9 | | | | 9.6 | | | | (9.6 | ) | | | 1.5 | | | | (27.4 | ) | | | 18.2 | | | | (1.9 | ) |
| Cash flows provided (used) by | | | | | | | | | | | | | | | | | | | | | | | | | | | | | | | | | | | | | | | | |
Operations | | | (2.7 | ) | | | 33.5 | | | | (33.9 | ) | | | (3.3 | ) | | | 1.0 | | | | 127.2 | | | | 43.1 | | | | 12.9 | | | | 38.4 | | | | 32.8 | |
Investing activities | | | (83.7 | ) | | | (17.8 | ) | | | (23.7 | ) | | | (22.2 | ) | | | (20.0 | ) | | | (85.8 | ) | | | (39.6 | ) | | | (18.8 | ) | | | (16.8 | ) | | | (10.6 | ) |
Financing activities | | | 50.9 | | | | (15.7 | ) | | | 57.6 | | | | 9.0 | | | | – | | | | (5.9 | ) | | | 0.9 | | | | (0.1 | ) | | | (0.1 | ) | | | (6.6 | ) |
| Capital spending | | | 85.8 | | | | 17.5 | | | | 25.0 | | | | 23.0 | | | | 20.3 | | | | 93.2 | | | | 41.0 | | | | 22.9 | | | | 17.5 | | | | 11.8 | |
Amortization1 | | | 176.4 | | | | 42.8 | | | | 44.0 | | | | 44.8 | | | | 44.8 | | | | 207.1 | | | | 51.8 | | | | 45.8 | | | | 46.3 | | | | 63.2 | |
| Capital spending as % of amortization | | | 49 | % | | | 41 | % | | | 57 | % | | | 51 | % | | | 45 | % | | | 45 | % | | | 79 | % | | | 50 | % | | | 38 | % | | | 19 | % |
Total debt to total capitalization2,3 | | | 44 | % | | | 44 | % | | | 45 | % | | | 44 | % | | | 46 | % | | | 46 | % | | | 46 | % | | | 44 | % | | | 44 | % | | | 46 | % |
Net debt to net capitalization4,5 | | | 44 | % | | | 44 | % | | | 45 | % | | | 44 | % | | | 46 | % | | | 45 | % | | | 45 | % | | | 43 | % | | | 43 | % | | | 46 | % |
Net debt to EBITDA4,6 | | | 29.1 | | | | 52.0 | | | | n/a | | | | n/a | | | | 58.3 | | | | 3.9 | | | | 17.0 | | | | 12.7 | | | | 15.1 | | | | 17.9 | |
EBITDA to interest6 | | | 0.4 | | | | 1.0 | | | | n/a | | | | n/a | | | | 0.8 | | | | 2.9 | | | | 2.7 | | | | 3.4 | | | | 2.8 | | | | 2.6 | |
| | 1 | Quarter 1, 2006 amortization expense includes a $17.6 million impairment loss related to the permanent closure of the A3 paper machine. Quarter 4, 2006 amortization expense includes a $1.5 million impairment loss related to the permanent closure of the A3 paper machine and $4.3 million in other asset impairments. |
| | 2 | Total debt comprises long-term debt, including current portion. |
| | 3 | Total capitalization comprises total debt and shareholders’ equity. |
| | 4 | Net debt comprises total debt, less cash on hand. |
| | 5 | Net capitalization comprises net debt and shareholders’ equity. |
| | 6 | EBITDA is a non-GAAP measure. Refer to Section 9, "Non-GAAP measures" for further details. |
The Company’s principal cash requirements are for interest payments on its debt and for capital expenditures and working capital fluctuations. Cash flows are funded through operations and, where necessary, through the revolving operating facility (the “Facility”). If necessary, liquidity requirements may be funded through the issuance of debt, equity or both. Access to current and alternative sources of financing at competitive cost is dependent upon the Company’s credit ratings and capital market conditions. The Company believes that the cash flow from operations and the Facility will be sufficient to meet its anticipated capital expenditures and debt service obligations in the near and intermediate term.
Cash used by operating activities in 2007 was $2.7 million, compared to cash provided of $127.2 million in the previous year. The decrease of $129.9 million from the previous year is primarily related to $184.0 million decrease in EBITDA. This was partially offset by reductions in accounts receivable.
Cash used for investing activities in 2007 was $83.7 million, compared to $85.8 million in the previous year. Investing activities are largely comprised of capital spending. Consequently, movements in cash flows are primarily due to changes in capital spending.
Capital spending for 2007 was $85.8 million. Major capital investments during the year included $8.1 million of the $10.8 million Crumb DIP project, which is expected to reduce the Company’s DIP costs, a $4.2 million dryer upgrade to Crofton’s No. 1 paper machine, a $5.1 million product distribution initiative at the Elk Falls division, and various other high-return capital projects.
Cash provided by financing activities in 2007 was $50.9 million, compared to cash used of $5.9 million in the previous year. The increase from the comparative period was primarily due to borrowing on the Facility of $47.5 million related to the decrease in operating cash flow.
The Company’s capital resources at December 31, 2007 included the amount available under the Facility. The Facility, together with operating cash flows, is expected to enable the Company to meet its minimum payments.
The following table presents the aggregate amount of future cash outflows for contractual obligations as of December 31, 2007, excluding amounts due for interest on outstanding indebtedness.
| | | Payments Due by Period | |
| (In millions of dollars) | | 2008 | | | 2009 | | | 2010 | | | 2011 | | | 2012 | | | Thereafter | |
Total debt | | $ | 1.2 | | | $ | 122.5 | | | $ | 0.7 | | | $ | 389.7 | | | $ | 0.8 | | | $ | 270.9 | |
| Operating leases | | | 10.1 | | | | 9.0 | | | | 8.0 | | | | 7.5 | | | | 5.6 | | | | 32.0 | |
| Other commitments | | | 2.2 | | | | 2.2 | | | | 2.2 | | | | 2.2 | | | | 0.7 | | | | - | |
Total | | $ | 13.5 | | | $ | 133.7 | | | $ | 10.9 | | | $ | 399.4 | | | $ | 7.1 | | | $ | 302.9 | |
Availability on the Company’s $350 million Facility at period-end is summarized in the following table:
| (In millions of dollars) | |
| | | 2007 | | | 2006 | |
| | | | Q4 | | | | Q3 | | | | Q2 | | | | Q1 | | | | Q4 | | | | Q3 | | | | Q2 | | | | Q1 | |
Borrowing base | | $ | 309.0 | | | $ | 326.9 | | | $ | 350.0 | | | $ | 350.0 | | | $ | 350.0 | | | $ | 350.0 | | | $ | 335.1 | | | $ | 345.5 | |
| Letters of credit | | | 20.7 | | | | 20.7 | | | | 20.7 | | | | 22.8 | | | | 26.4 | | | | 22.7 | | | | 22.7 | | | | 22.3 | |
| Amount drawn, net | | | 47.5 | | | | 67.1 | | | | 9.4 | | | | - | | | | - | | | | - | | | | - | | | | - | |
Available to be drawn | | $ | 240.8 | | | $ | 239.1 | | | $ | 319.9 | | | $ | 327.2 | | | $ | 323.6 | | | $ | 327.3 | | | $ | 312.4 | | | $ | 323.2 | |
As of December 31, 2007, the Company had $240.8 million available on its $350 million Facility. The amount drawn on the Facility increased by $47.5 million in the year and the Company’s available liquidity decreased by $82.8 million. Of this decrease, $41.0 million was due to a reduction in borrowing base on the Company’s Facility as a result of lower accounts receivable and inventory following curtailment related to the USW strike and the indefinite closure of the A4 paper machine in September, 2007. The Company also spent $85.8 million related to its capital expenditure program and $23.6 million related to the ongoing restructuring program. Availability under the Facility is determined by a borrowing base, which is calculated based on accounts receivable and inventory balances. At December 31, 2007 the Company is in compliance with the covenants under its Facility, which includes covenants to maintain the funded debt/capitalization ratio below 60%, secured debt/capitalization ratio below 30%, and shareholders’ equity above $779.3 million. At December 31, 2007, as calculated under the Facility, the Company’s funded debt/capitalization ratio was 42% (December 31, 2006 – 44%), secured debt/capitalization ratio was 4% (December 31, 2006 – 2%), and shareholders’ equity was $988.6 million (December 31, 2006 – $1,005.8 million).
Total long-term debt outstanding as at December 31, 2007 was $785.8 million. The Company’s net debt to net capitalization ratio as at December 31, 2007, was 44%, or 1% lower than December 31, 2006.
The following table illustrates the changes in the Company’s long-term debt for the year ended December 31, 2007:
| Issue | | January 1, 20071 | | | Net increase (decrease) | | | Foreign exchange | | | December 31, 2007 | |
| (In millions of dollars) | | | | | | | | | | | | |
Recourse | | | | | | | | | | | | |
Senior notes, 8.625% due June 2011 (US$400.0 million) | | $ | 459.3 | | | $ | 0.5 | | | $ | (70.9 | ) | | $ | 388.9 | |
Senior notes, 7.375% due March 2014 (US$250.0 million) | | | 288.8 | | | | 2.1 | | | | (44.3 | ) | | | 246.6 | |
Revolving operating facility of up to $350.0 million due July 2009 with interest based on Canadian Prime/BA rates or U.S. Base/LIBOR rates | | | – | | | | 47.1 | | | | - | | | | 47.1 | |
Capital lease obligation | | | 5.0 | | | | 3.6 | | | | - | | | | 8.6 | |
| Non-recourse (PREI) | | | | | | | | | | | | | | | | |
First mortgage bonds, 6.387% due July 2009 | | | 74.5 | | | | 0.1 | | | | - | | | | 74.6 | |
Subordinated promissory notes | | | 19.5 | | | | - | | | | - | | | | 19.5 | |
Loan payable | | | 1.0 | | | | (0.5 | ) | | | - | | | | 0.5 | |
| Less current portion | | | (1.8 | ) | | | 0.6 | | | | | | | | (1.2 | ) |
Total long-term debt | | $ | 846.3 | | | $ | 53.5 | | | $ | (115.2 | ) | | $ | 784.6 | |
| | 1 | Effective January 1, 2007, the Company adopted the CICA Sections “Comprehensive Income”, 3251 “Equity”, 3855 “Financial Instruments – Recognition and Measurement”, 3861 “Financial Instruments – Disclosure and Presentation”, and 3865 “Hedges”. |
The Company is in compliance with the covenants under its senior notes indentures. The Company’s Fixed Charge Coverage Ratio (“FCC Ratio”) under the senior notes indentures calculated on a 12-month trailing average was 0.8:1 as at December 31, 2007 (3.0:1 as at December 31, 2006). While the FCC Ratio is below 2.0:1, the Company is limited in the amount of additional debt it may incur to “permitted debt” under the senior notes. Under the indenture of the 8.625% senior notes, “permitted debt” includes a) the existing 8.625% and 7.375% senior notes, b) a credit facility basket in an amount equal to the greater of i) $725 million, and ii) the sum of 75% of the book value of the Company’s accounts receivable, 50% of the book value of the Company’s inventory, and $290 million, against which in either case utilization under the Company’s $350 million Facility is applied, c) purchase money debt and capital lease obligations in an amount equal to 5% of consolidated tangible assets, d) a $40 million general basket, and e) a $5 million basket for accommodation guarantees, trade or standby letters of credit, performance bonds, bankers’ acceptances and surety notes. The indenture for the 7.375% notes contains larger debt baskets, but while the 8.625% notes remain outstanding the Company is bound by their more restrictive provisions.
Also under the senior note covenants, the Company is restricted from making certain payments, including the payment of dividends, unless the balances in its restricted payments baskets are positive. The Company’s restricted payments baskets under the 8.625% and 7.375% senior notes were negative $189.0 million and negative $164.0 million, respectively, as at December 31, 2007 (negative $72.5 million and negative $47.5 million, respectively, as at December 31, 2006), as a result of the accumulation of losses in recent years.
Credit Rating
In June 2007, Moody’s Investors Services, Inc. (“Moody’s”) revised the outlook on the Company’s debt ratings to negative from stable due to an expectation that with weak industry conditions and currency related pressures, the Company’s profitability and cash flow would decline during the year.
In June 2007, Standard & Poor’s Rating Services (“S&P”) lowered outlook to negative from stable and in October 2007 its long-term corporate credit and senior unsecured ratings to B from B+. The strong Canadian currency and weak newsprint prices were the primary factors cited in the downgrade.
In January 2008, Dominion Bond Rating Service (“DBRS”) confirmed its senior unsecured debt rating as BB and the outlook as negative.
The following table highlights the Company’s credit ratings and outlook with Moody’s, S&P and DBRS as at December 31, 2007, 2006, and 2005:
| | December 31, |
| | 2007 | 2006 | 2005 |
Moody’s | | | |
| Outlook | Negative | Stable | Negative |
| Corporate family rating | B1 | B1 | B1 |
| Senior unsecured debt | B2 | B2 | B1 |
| Senior secured credit facility | Ba1 | Ba1 | Ba3 |
| | | | |
| | | | |
| Standard & Poor’s | | | |
| Outlook | Negative | Stable | Stable |
| Long-term issuer credit | B | B+ | B+ |
| Senior unsecured debt | B | B+ | B+ |
| Senior secured debt | BB- | BB- | BB- |
| | | | |
| | | | |
| Dominion Bond Rating Service | | | |
| Outlook | Negative | Negative | Negative |
| Senior unsecured debt | BB | BB | BB |
| | 5.3.3 | Financial instruments |
In the normal course of business, the Company is exposed to foreign currency and price risk associated with revenues and long-term debt, which are predominately in U.S. dollars, and energy costs. In accordance with its foreign exchange risk management program, the Company manages its exposure to these risks through the use of financial instruments. The Company also uses interest rate swaps to reduce its exposure to long-term fixed interest rates associated with its senior notes. The Company does not enter into financial instruments for speculative purposes.
On January 1, 2007, the Company adopted the Canadian Institute of Chartered Accountants (“CICA”) Handbook Section 3855, Financial Instruments – Recognition and Measurement, and Section 3865, Hedges. Under these new guidelines the Company records all derivatives in its balance sheet at fair value. For further details, refer to Section 11.0, “Changes in Accounting Policies”.
Revenue risk management instruments
In respect of revenues, the Company uses foreign currency options and forward contracts to sell U.S. dollars. At December 31, 2007, the Company had foreign currency options and forward contracts with a notional principal of US$581 million with major financial institutions. Changes in the fair values of derivatives that qualify and are designated as cash flow hedges are deferred and recorded as a component of “Accumulated other comprehensive income” (“AOCI”) until the underlying transaction is recorded in earnings. When the hedged item affects earnings, the gain or loss is reclassified from “AOCI” to “Sales”. Any ineffective portion of a hedging derivative’s change in fair value and the portion that is excluded from the assessment of hedge effectiveness is recognized immediately in “Sales”. At December 31, 2007, instruments having a notional principal of US$404 million are designated as hedging instruments. At year-end exchange rates, these instruments are reported at their fair value, which was $32.9 million at the end of 2007.
At December 31, 2007, commodity swap agreements were outstanding to fix the sales price on NBSK pulp and containerboard for 23,500 metric tonnes, and 1,750 short tons, respectively, within the next 12 months at a weighted average PIX price of US$823 per tonne and US$580 per ton. These contracts are not designated as hedging instruments for accounting purposes and are reported at their fair value, which was negative $1.0 million at the end of 2007.
Long-term debt risk management instruments
In respect of long-term debt, the Company is party to US$228 million at December 31, 2007, in forward foreign exchange contracts and options to acquire U.S. dollars over a seven-year period. These instruments are not designated as hedging instruments for accounting purposes, and are included in “Other long-term obligations” on the balance sheet at their fair value. Settlements and changes in fair value are recognized in earnings as “Foreign exchange gain (loss) on long-term debt”. At period-end exchange rates, these instruments are reported at their fair value, which was negative $5.4 million at the end of 2007.
Energy cost risk management instruments
To hedge against the effect of energy cost fluctuations, the Company enters into contracts to fix the price of a portion of the Company’s oil and gas requirements. The contracts are not designated as hedging instruments for accounting purposes and are reported on the balance sheet at their fair value. Settlements and changes in fair value are recognized in “Cost of sales”. At period-end contract rates, these instruments are reported at their fair value, which was negative $0.2 million at the end of 2007.
Interest rate swaps
The Company occasionally uses interest rate swap contracts to manage its net exposure to interest rate changes. At December 31, 2007, the Company had pay-floating, receive-fixed interest rate swap contracts for notional US$80 million, and has designated them as hedging instruments. These derivatives are recorded on the balance sheet at their fair value. The effective portion of changes in the fair value of the derivatives is netted in “Long-term debt” and the ineffective portion is recognized in “Interest expense, net”. The Company will receive a fixed rate of 7.375%, and pay a floating rate averaging U.S. six-month LIBOR plus 2.0%. At period-end swap rates, these instruments are reported at their fair value, which was $4.1 million at the end of 2007.
| 6.0 | RELATED PARTY TRANSACTIONS |
Effective October 23, 2006, Third Avenue Management LLC (“TAM”) became a significant shareholder together with its subsidiaries and affiliates. The Company did not undertake any transactions with TAM during the year ended December 31, 2007.
Directors and employees
The Company undertakes certain transactions with companies affiliated with its directors. These transactions are in the normal course of business and are on the same terms as those accorded to third parties. During 2007, the Company paid aggregate fees of approximately $8.7 million (2006 - $0.4 million) primarily for obligations under a building lease, for services related to trucking chips and sawdust, and other consulting services to companies affiliated with directors of the Company. In 2007, the Company also paid $0.7 million (2006 - $3.9 million) primarily for chemicals used in the manufacturing process to a company affiliated with a former officer and director of the Company. The Company charged these costs to “Cost of sales”.
The Company has advanced interest-free loans to a now former officer of the Company. As at December 31, 2007, the balance outstanding was $0.1 million (2006 - $0.1 million). These loans were issued prior to the enactment of the United States Sarbanes-Oxley Act of 2002, which prohibits such loans, effective July 30, 2002. The Company has made no loans to any of its directors or officers since that date.
| 7.0 | OFF-BALANCE SHEET ARRANGEMENTS |
Guarantees
Business dispositions
The Company sold a portion of its operations in June 2001. In this regard, the Company provided a 10-year environmental indemnity with a maximum liability to the Company of $12.5 million. This liability has subsequently been reduced by expenditures related to certain decommissioning projects. The Company provided a tax indemnity, which continues while the relevant tax years of the indemnified parties remain open to audit. The Company also provided a general indemnity capped at $5 million, which expired in 2004. The purchaser of the operations has advised the Company that, based on the terms of the purchase and sale agreement, it believes it may be entitled to indemnification under the general indemnity in connection with certain labour matters. The Company is unable to estimate any potential liability under these indemnities as the amounts are dependent upon the outcome of future contingent events, the nature and likelihood of which cannot be determined at this time. As such, no liability has been recorded for these potential obligations.
Loans
The Company has entered into a building lease agreement whereby it will continue to make the prescribed lease payments directly to the financial institution holding the mortgage on the building in the event the lessor is no longer able to meet its contractual obligations. At December 31, 2007, the value of the mortgage was $10.6 million. This agreement does not increase the Company’s liability beyond the obligations for the building lease.
Recycling plant acquisition
In connection with the acquisition of the paper recycling business in December 2003, the Company has provided indemnities with respect to representations and warranties related to general corporate matters and to the shares that were issued to the vendors. Liability under these indemnities expires in November 2008, except that the indemnity related to title to the shares does not expire. The Company does not expect any significant claims with respect to these indemnities. The Company has also provided indemnities with respect to general environmental matters under its lease of the land and buildings. The Company has agreed to indemnify the landlord for all costs, claims and damages related to any release by the Company of any hazardous substances on the property or the breach by the Company of its environmental covenants under the lease or any environmental laws. This indemnity is indefinite and survives after the lease is terminated. The Company is not liable for pre-existing environmental conditions.
The following table highlights selected financial information for the eight consecutive quarters ending December 31, 2007:
| (In millions of dollars, except per share amounts) | |
| | | 2007 | | | 2006 | |
| | | | Q4 | | | | Q3 | | | | Q2 | | | | Q1 | | | | Q4 | | | | Q3 | | | | Q2 | | | | Q1 | |
Sales | | $ | 381.0 | | | $ | 413.7 | | | $ | 441.8 | | | $ | 478.1 | | | $ | 470.6 | | | $ | 486.0 | | | $ | 469.6 | | | $ | 456.3 | |
EBITDA 1 | | | 15.1 | | | | (0.3 | ) | | | (1.9 | ) | | | 14.1 | | | | 48.5 | | | | 62.8 | | | | 52.4 | | | | 47.3 | |
| Net earnings (loss) | | | 12.4 | | | | (18.6 | ) | | | 0.2 | | | | (25.6 | ) | | | (37.2 | ) | | | 2.5 | | | | 42.4 | | | | (23.6 | ) |
| Net earnings (loss) per share – basic and diluted | | $ | 0.06 | | | $ | (0.09 | ) | | $ | 0.00 | | | $ | (0.12 | ) | | $ | (0.17 | ) | | $ | 0.01 | | | $ | 0.20 | | | $ | (0.11 | ) |
| | 1 | EBITDA is a non-GAAP measure. Refer to Section 9, “Non-GAAP Measures” for further details. |
In Q1, 2007, the net loss improved by $11.6 million ($0.05 per common share), compared to Q4, 2006, due largely to a $32.8 million increase in the after-tax foreign exchange gain arising from the translation of U.S.-dollar-denominated debt, and due to the absence of a $3.8 million after-tax impairment loss recorded in the previous quarter. These improvements were offset by $12.5 million in after-tax restructuring and change-of-control costs.
In Q2, 2007, the $25.8 million ($0.12 per common share) improvement in net earnings, compared to Q1, 2007, was related primarily to a $37.5 million increase in the after-tax foreign exchange gain on the translation of U.S.-dollar-denominated debt, and a $1.4 million release of future income taxes related to the reduction in the federal corporate income tax rate, which was partially offset by an increase of $0.2 million in after-tax restructuring and change-of-control costs and $0.8 million in after-tax finance related fees.
In Q3, 2007, the $18.8 million ($0.09 per common share) decrease in net earnings, compared to Q2, 2007, was due largely to a $16.0 million decrease in the after-tax foreign exchange gain arising from the translation of U.S.-dollar-denominated debt, a negative impact of $8.8 million in after-tax costs related to the USW strike, an after-tax loss of $4.9 million on the sale of the A3 paper machine, and a $3.4 million after-tax increase in restructuring and change-of-control costs.
In Q4, 2007, the $31.0 million ($0.15 per common share) improvement in net earnings, compared to Q3, 2007, was due largely to a $35.0 million release of future income taxes, of which $21.0 million related to the reduction in the federal corporate income tax rate, and $14.0 million related to tax uncertainties resolved with the conclusion of an examination by the Canada Revenue Agency and a decrease of $14.7 million in after-tax and change-of-control costs in Q4.
The following table reconciles the average spot exchange rate to the Company’s effective rate for the eight consecutive quarters ending December 31, 2007:
| US$/CDN$ foreign exchange | | 2007 | | | 2006 | |
| | | | Q4 | | | | Q3 | | | | Q2 | | | | Q1 | | | | Q4 | | | | Q3 | | | | Q2 | | | | Q1 | |
Average spot rate | | | 1.019 | | | | 0.957 | | | | 0.911 | | | | 0.854 | | | | 0.878 | | | | 0.892 | | | | 0.892 | | | | 0.866 | |
Revaluation of U.S. dollar working capital | | | 0.008 | | | | 0.040 | | | | 0.051 | | | | 0.006 | | | | (0.023 | ) | | | (0.001 | ) | | | 0.022 | | | | (0.001 | ) |
Impact of hedging | | | (0.059 | ) | | | (0.053 | ) | | | (0.035 | ) | | | (0.002 | ) | | | 0.018 | | | | (0.006 | ) | | | (0.037 | ) | | | (0.010 | ) |
Other | | | 0.002 | | | | (0.009 | ) | | | (0.011 | ) | | | 0.002 | | | | 0.005 | | | | 0.001 | | | | (0.005 | ) | | | (0.002 | ) |
Effective rate | | | 0.970 | | | | 0.935 | | | | 0.916 | | | | 0.860 | | | | 0.878 | | | | 0.886 | | | | 0.872 | | | | 0.853 | |
EBITDA (earnings before interest, taxes, depreciation and amortization and before other non-operating income and expenses), as defined equates to operating earnings (loss) plus amortization. As Canadian GAAP does not define a method of calculating EBITDA, the measure as calculated by the Company might not be comparable to similarly-titled measures reported by other entities. The Company focuses on EBITDA, as the Company believes this measure enables comparison of its results between periods without regard to debt service, income taxes, and capital expenditure requirements. As such, the Company believes it would be useful for investors and other users to be aware of this measure so they can better assess the Company’s operating performance. EBITDA should not be considered by an investor as an alternative to net earnings, an indicator of the financial performance of the Company, or an alternative to cash flows as a measure of liquidity.
The Company incurred some specific items in 2007 and 2006 that adversely or positively affected its average delivered cash costs per tonne, EBITDA, operating earnings (loss), and net earnings (loss), making the comparison of results difficult from period to period. The Company believes it is useful for readers to be aware of these items as it provides an indication of performance and comparative trends, excluding these specific items. Specific items include foreign exchange gain or loss on long-term debt, asset impairments, restructuring and change-of-control costs, financing related fees, income tax adjustments, the impact of significant labour disruptions, and other significant items of an unusual or non-recurring nature. The Company believes this is useful supplemental information, however, the Company’s measures excluding specific items have no standardized meaning under Canadian GAAP and might not be comparable to similarly-titled measures reported by other entities. Readers should be cautioned that average delivered cash costs per tonne before specific items, EBITDA before specific items, EBITDA margin before specific items, net earnings (loss) before specific items and net earnings (loss) per share before specific items should not be confused with or used as an alternative to measures prescribed by Canadian GAAP.
The Company has reported free cash flow because management believes it would be useful for investors and other users to be aware of this measure so they can better assess the Company’s operating performance. Free cash flow excludes certain working capital changes and other sources and uses of cash, which are disclosed in the consolidated statements of cash flows. As Canadian GAAP does not define a method of calculating free cash flow, the measure as calculated by the Company might not be comparable to similarly-titled measures reported by other entities and should not be considered an alternative to the consolidated statements of cash flows. While the closest GAAP measure is cash provided by operating activities less cash used by investing activities, free cash flow generated by operations is cash available after capital expenditures, but before proceeds from divested assets and changes in certain working capital items.
Refer to the tables below for a reconciliation of net earnings (loss) to EBITDA and EBITDA before specific items, the impact of specific items by segment, net earnings (loss) as reported to net earnings (loss) before specific items, and reconciliation of free cash flow with cash provided by operating activities less cash used by investing activities and management’s calculation of free cash flow.
Reconciliation of net earnings (loss) to EBITDA and EBITDA before specific items
| (In millions of dollars) | | 2007 | | | 2006 | | | 2005 | |
Net earnings (loss) | | $ | (31.6 | ) | | $ | (15.9 | ) | | $ | (25.6 | ) |
| Amortization | | | 176.4 | | | | 183.7 | | | | 180.3 | |
| Impairment loss | | | - | | | | 23.4 | | | | - | |
| Foreign exchange (gain) loss on translation of long-term debt | | | (103.9 | ) | | | 0.3 | | | | (24.7 | ) |
| Other (income) expense, net | | | 15.3 | | | | (1.8 | ) | | | (4.5 | ) |
| Interest expense, net | | | 70.7 | | | | 73.8 | | | | 75.7 | |
| Income tax recovery | | | (100.0 | ) | | | (54.0 | ) | | | (46.6 | ) |
| Non-controlling interest | | | 0.1 | | | | 1.5 | | | | 0.6 | |
EBITDA | | $ | 27.0 | | | $ | 211.0 | | | $ | 155.2 | |
| Specific items: | | | | | | | | | | | | |
Restructuring costs | | | 55.3 | | | | – | | | | 6.7 | |
Change-of-control costs | | | 9.4 | | | | – | | | | - | |
Impact of USW strike | | | 25.0 | | | | – | | | | - | |
| Total specific items | | | 89.7 | | | | – | | | | 6.7 | |
EBITDA before specific items | | $ | 116.7 | | | $ | 211.0 | | | $ | 161.9 | |
Reconciliation of net earnings (loss) to EBITDA and EBITDA before specific items by quarter
| (In millions of dollars) | | 2007 | | | 2006 | |
| | | Total | | | | Q4 | | | | Q3 | | | | Q2 | | | | Q1 | | | Total | | | | Q4 | | | | Q3 | | | | Q2 | | | | Q1 | |
Net earnings (loss) | | $ | (31.6 | ) | | $ | 12.4 | | | $ | (18.6 | ) | | $ | 0.2 | | | $ | (25.6 | ) | | $ | (15.9 | ) | | $ | (37.2 | ) | | $ | 2.5 | | | $ | 42.4 | | | $ | (23.6 | ) |
| Amortization | | | 176.4 | | | | 42.8 | | | | 44.0 | | | | 44.8 | | | | 44.8 | | | | 183.7 | | | | 46.0 | | | | 45.8 | | | | 46.3 | | | | 45.6 | |
| Impairment loss | | | - | | | | - | | | | - | | | | - | | | | - | | | | 23.4 | | | | 5.8 | | | | - | | | | - | | | | 17.6 | |
| Foreign exchange (gain) loss on long-term debt | | | (103.9 | ) | | | (8.9 | ) | | | (33.9 | ) | | | (53.2 | ) | | | (7.9 | ) | | | 0.3 | | | | 31.6 | | | | (0.1 | ) | | | (31.6 | ) | | | 0.4 | |
| Other (income) expense, net | | | 15.3 | | | | 6.6 | | | | 7.2 | | | | 1.8 | | | | (0.3 | ) | | | (1.8 | ) | | | (1.7 | ) | | | 0.4 | | | | (0.5 | ) | | | - | |
| Interest expense, net | | | 70.7 | | | | 15.4 | | | | 18.4 | | | | 18.4 | | | | 18.5 | | | | 73.8 | | | | 18.3 | | | | 18.4 | | | | 18.7 | | | | 18.4 | |
| Income tax expense (recovery) | | | (100.0 | ) | | | (53.2 | ) | | | (17.4 | ) | | | (14.2 | ) | | | (15.2 | ) | | | (54.0 | ) | | | (13.8 | ) | | | (4.4 | ) | | | (24.4 | ) | | | (11.4 | ) |
| Non-controlling interest | | | 0.1 | | | | 0.0 | | | | 0.0 | | | | 0.3 | | | | (0.2 | ) | | | 1.5 | | | | (0.5 | ) | | | 0.2 | | | | 1.5 | | | | 0.3 | |
| EBITDA | | | 27.0 | | | | 15.1 | | | | (0.3 | ) | | | (1.9 | ) | | | 14.1 | | | | 211.0 | | | | 48.5 | | | | 62.8 | | | | 52.4 | | | | 47.3 | |
| Specific items: | | | | | | | | | | | | | | | | | | | | | | | | | | | | | | | | | | | | | | | | |
Restructuring costs | | | 55.3 | | | | 1.4 | | | | 24.1 | | | | 19.0 | | | | 10.8 | | | | - | | | | - | | | �� | - | | | | - | | | | - | |
Change-of-control costs | | | 9.4 | | | | 0.6 | | | | 0.3 | | | | 0.3 | | | | 8.2 | | | | - | | | | - | | | | - | | | | - | | | | - | |
Impact of USW strike | | | 25.0 | | | | 11.7 | | | | 13.3 | | | | - | | | | - | | | | - | | | | - | | | | - | | | | - | | | | - | |
| Total specific items | | | 89.7 | | | | 13.7 | | | | 37.7 | | | | 19.3 | | | | 19.0 | | | | - | | | | - | | | | - | | | | - | | | | - | |
EBITDA before specific items | | $ | 116.7 | | | $ | 28.8 | | | $ | 37.4 | | | $ | 17.4 | | | $ | 33.1 | | | $ | 211.0 | | | $ | 48.5 | | | $ | 62.8 | | | $ | 52.4 | | | $ | 47.3 | |
Impact of specific items by segment in 2007 by quarter
| (In millions of dollars, except where otherwise stated) | | | |
| | | 2007 | |
| | | Total | | | | Q4 | | | | Q3 | | | | Q2 | | | | Q1 | |
Specific items: | | | | | | | | | | | | | | | | | | | |
| Sales | | $ | (80.7 | ) | | $ | (55.0 | ) | | $ | (25.7 | ) | | $ | - | | | $ | - | |
Cost of sales | | | 55.7 | | | | 43.3 | | | | 12.4 | | | | - | | | | - | |
Impact of the USW strike1 | | | (25.0 | ) | | | (11.7 | ) | | | (13.3 | ) | | | - | | | | - | |
Restructuring costs | | | (55.3 | ) | | | (1.4 | ) | | | (24.1 | ) | | | (19.0 | ) | | | (10.8 | ) |
Change-of-control costs | | | (9.4 | ) | | | (0.6 | ) | | | (0.3 | ) | | | (0.3 | ) | | | (8.2 | ) |
EBITDA impact of specific items | | $ | (89.7 | ) | | $ | (13.7 | ) | | $ | (37.7 | ) | | $ | (19.3 | ) | | $ | (19.0 | ) |
| | | | | | | | | | | | | | | | | | | | | |
| Segment EBITDA favourable (unfavourable) impact of specific items | | | | | | | | | | | | | | | | | | | | |
Specialty paper | | $ | (47.2 | ) | | $ | (3.6 | ) | | $ | (17.6 | ) | | $ | (12.9 | ) | | $ | (13.1 | ) |
Newsprint | | | (19.3 | ) | | | (3.9 | ) | | | (7.7 | ) | | | (4.0 | ) | | | (3.7 | ) |
Pulp | | | (23.2 | ) | | | (6.2 | ) | | | (12.4 | ) | | | (2.4 | ) | | | (2.2 | ) |
Total | | $ | (89.7 | ) | | $ | (13.7 | ) | | $ | (37.7 | ) | | $ | (19.3 | ) | | $ | (19.0 | ) |
| Segment EBITDA favourable (unfavourable) impact of restructuring and change-of-control costs only | | | | | | | | | | | | | | | | | | | | |
Specialty paper | | $ | (42.2 | ) | | $ | (1.8 | ) | | $ | (14.4 | ) | | $ | (12.9 | ) | | $ | (13.1 | ) |
Newsprint | | | (12.9 | ) | | | (0.4 | ) | | | (4.8 | ) | | | (4.0 | ) | | | (3.7 | ) |
Pulp | | | (9.6 | ) | | | 0.2 | | | | (5.2 | ) | | | (2.4 | ) | | | (2.2 | ) |
Total | | $ | (64.7 | ) | | $ | (2.0 | ) | | $ | (24.4 | ) | | $ | (19.3 | ) | | $ | (19.0 | ) |
| Lost sales due to USW strike (000 tonnes) | | | | | | | | | | | | | | | | | | | | |
Specialty paper | | | 3.2 | | | | 0.4 | | | | 2.8 | | | | - | | | | - | |
Newsprint | | | 82.8 | | | | 62.2 | | | | 20.6 | | | | - | | | | - | |
Pulp | | | 44.0 | | | | 26.8 | | | | 17.2 | | | | - | | | | - | |
Total | | | 130.0 | | | | 89.4 | | | | 40.6 | | | | - | | | | - | |
| Curtailed production due to USW strike (000 tonnes) | | | | | | | | | | | | | | | | | | | | |
Specialty paper | | | 7.2 | | | | 4.0 | | | | 3.2 | | | | - | | | | - | |
Newsprint | | | 98.9 | | | | 65.8 | | | | 33.1 | | | | - | | | | - | |
Pulp | | | 54.7 | | | | 26.8 | | | | 27.9 | | | | - | | | | - | |
Total | | | 160.8 | | | | 96.6 | | | | 64.2 | | | | - | | | | - | |
| | | | | | | | | | | | | | | | | | | | | |
| 1 | The impact of the USW strike is based on management estimates. There were no significant restructuring and change-of-control costs or USW strike related costs in 2006. |
Reconciliation of net earnings (loss) as reported to net earnings (loss) before specific items
| (In millions of dollars and after-tax, except where otherwise stated) | |
| | | 2007 | | | 2006 | | | 2005 | |
Net earnings (loss) as reported | | $ | (31.6 | ) | | $ | (15.9 | ) | | $ | (25.6 | ) |
| Specific items (after taxes): | | | | | | | | | | | | |
Foreign exchange loss (gain) on long-term debt | | | (86.2 | ) | | | 0.2 | | | | (20.7 | ) |
Impairment and loss on disposal | | | 4.9 | | | | 15.4 | | | | - | |
Restructuring and change-of-control costs | | | 42.7 | | | | - | | | | - | |
USW strike impact | | | 16.5 | | | | - | | | | - | |
Third Avenue Management tender offer | | | – | | | | 2.2 | | | | - | |
Financing related fees | | | 0.8 | | | | - | | | | - | |
Income tax adjustments | | | (36.4 | ) | | | (26.9 | ) | | | (18.3 | ) |
| Net earnings (loss) before specific items | | $ | (89.3 | ) | | $ | (25.0 | ) | | $ | (64.6 | ) |
Net earnings (loss) per share in dollars: As reported | | $ | (0.15 | ) | | $ | (0.07 | ) | | $ | (0.12 | ) |
Before specific items | | $ | (0.42 | ) | | $ | (0.12 | ) | | $ | (0.30 | ) |
Reconciliation of net earnings (loss) as reported to net earnings (loss) before specific items by quarter
| (In millions of dollars and after-tax, except where otherwise stated) | |
| | | 2007 | | | 2006 | |
| | | TOTAL | | | | Q4 | | | | Q3 | | | | Q2 | | | | Q1 | | | TOTAL | | | | Q4 | | | | Q3 | | | | Q2 | | | | Q1 | |
Net earnings (loss) as reported | | $ | (31.6 | ) | | $ | 12.4 | | | $ | (18.6 | ) | | $ | 0.2 | | | $ | (25.6 | ) | | $ | (15.9 | ) | | $ | (37.2 | ) | | $ | 2.5 | | | $ | 42.4 | | | $ | (23.6 | ) |
| Specific items (after taxes): | | | | | | | | | | | | | | | | | | | | | | | | | | | | | | | | | | | | | | | | �� |
Foreign exchange loss (gain) on long-term debt | | | (86.2 | ) | | | (7.4 | ) | | | (28.1 | ) | | | (44.1 | ) | | | (6.6 | ) | | | 0.2 | | | | 26.2 | | | | (0.1 | ) | | | (26.2 | ) | | | 0.3 | |
Impairment and loss on disposal | | | 4.9 | | | | - | | | | 4.9 | | | | - | | | | - | | | | 15.4 | | | | 3.8 | | | | - | | | | - | | | | 11.6 | |
Restructuring and change-of-control costs | | | 42.7 | | | | 1.4 | | | | 16.1 | | | | 12.7 | | | | 12.5 | | | | - | | | | - | | | | - | | | | - | | | | - | |
USW strike impact | | | 16.5 | | | | 7.7 | | | | 8.8 | | | | - | | | | - | | | | - | | | | - | | | | - | | | | - | | | | - | |
Third Avenue Management tender offer | | | - | | | | - | | | | - | | | | - | | | | - | | | | 2.2 | | | | - | | | | 2.2 | | | | - | | | | - | |
Financing related fees | | | 0.8 | | | | - | | | | - | | | | 0.8 | | | | - | | | | - | | | | - | | | | - | | | | - | | | | - | |
Income tax adjustments | | | (36.4 | ) | | | (35.0 | ) | | | - | | | | (1.4 | ) | | | - | | | | (26.9 | ) | | | - | | | | (4.0 | ) | | | (22.9 | ) | | | - | |
| Net earnings (loss) before specific items | | $ | (89.3 | ) | | $ | (20.9 | ) | | $ | (16.9 | ) | | $ | (31.8 | ) | | $ | (19.7 | ) | | $ | (25.0 | ) | | $ | (7.2 | ) | | $ | 0.6 | | | $ | (6.7 | ) | | $ | (11.7 | ) |
Net earnings (loss) per share in dollars: As reported | | $ | (0.15 | ) | | $ | 0.06 | | | $ | (0.09 | ) | | $ | 0.00 | | | $ | (0.12 | ) | | $ | (0.07 | ) | | $ | (0.17 | ) | | $ | 0.01 | | | $ | 0.20 | | | $ | (0.11 | ) |
Before specific items | | $ | (0.42 | ) | | $ | (0.10 | ) | | $ | (0.08 | ) | | $ | (0.15 | ) | | $ | (0.09 | ) | | $ | (0.12 | ) | | $ | (0.03 | ) | | $ | 0.00 | | | $ | (0.03 | ) | | $ | (0.06 | ) |
The following reconciles free cash flow with cash provided by operating activities less cash used by investing activities:
| Years ended December 31 (in millions) | | 2007 | | | 2006 | | | 2005 | |
Cash provided by operating activities | | $ | (2.7 | ) | | $ | 127.2 | | | $ | 60.7 | |
| Cash used by investing activities | | | (83.7 | ) | | | (85.8 | ) | | | (93.0 | ) |
| Proceeds from the sale of property and other assets | | | (6.5 | ) | | | (3.5 | ) | | | (3.5 | ) |
| Other investing activities | | | 4.4 | | | | (3.9 | ) | | | 1.3 | |
| Non-cash working capital changes except changes in taxes and interest | | | (30.3 | ) | | | 9.0 | | | | 12.6 | |
Other1 | | | 32.4 | | | | 0.6 | | | | 2.7 | |
Free Cash Flow | | $ | (86.4 | ) | | $ | 43.6 | | | $ | (19.2 | ) |
| 1 | 2007 includes restructuring expenses, net of payments, in "Employee future benefits" and "Other long-term obligations" of $11.4 million and $8.1 million, respectively, on the balance sheet. |
The following shows management’s calculation of free cash flow:
| Years ended December 31 (in millions) | | 2007 | | | 2006 | | | 2005 | |
EBITDA | | $ | 27.0 | | | $ | 211.0 | | | $ | 155.2 | |
| Cash interest paid, net | | | (67.8 | ) | | | (71.5 | ) | | | (75.3 | ) |
| Capital expenditures | | | (85.8 | ) | | | (93.2 | ) | | | (95.2 | ) |
| Income taxes paid | | | (0.5 | ) | | | (2.7 | ) | | | (3.9 | ) |
| Restructuring cost expense, over payments | | | 40.7 | | | | - | | | | - | |
Free Cash Flow | | $ | (86.4 | ) | | $ | 43.6 | | | $ | (19.2 | ) |
| 10.0 | CRITICAL ACCOUNTING POLICIES AND ESTIMATES |
The preparation of financial statements in conformity with Canadian GAAP requires companies to establish accounting policies and to make estimates that affect both the amount and timing of recording of assets, liabilities, revenues and expenses. Some of these estimates require judgments about matters that are inherently uncertain.
Note 2 to the December 31, 2007 consolidated financial statements includes a summary of the significant accounting policies used in their preparation. While all of the significant accounting policies are important to the consolidated financial statements, some of these policies may be viewed as involving a high degree of judgement. On an ongoing basis using currently available information, management reviews its estimates, including those related to environmental and legal liabilities, impairment of long-lived assets, pension and post-retirement benefits, provision for bad and doubtful accounts, and income taxes. Actual results could differ from these estimates.
The following accounting policies require management’s most difficult, subjective and complex judgements, and are subject to a fair degree of measurement uncertainty.
| | 10.1 | Environmental and legal liabilities |
Environmental and legal liabilities are recorded on an undiscounted basis when it is considered probable that a liability has been incurred and the amount of the loss can be reasonably estimated. Liabilities for environmental matters require evaluations of applicable environmental regulations and estimates of remediation alternatives and the costs thereof. Provisions for liabilities relating to legal actions and claims require judgments regarding projected outcomes and the range of loss, based on such factors as historical experience and recommendations of legal counsel.
As at December 31, 2007, the Company had a provision of approximately $13 million for environmental, remedial and other obligations. The Company expects capital expenditures relating to known environmental matters, including compliance issues and the assessment and remediation of the environmental condition of the Company’s properties, will total approximately $1 million in 2008.
| | 10.2 | Impairment of long-lived assets |
The Company reviews long-lived assets, primarily plant and equipment, for impairment when events or changes in circumstances indicate that the carrying value of these assets may not be recoverable. The Company tests for impairment using a two-step methodology:
| (i) | Testing for impairment is accomplished by determining whether the projected undiscounted future cash flows from operations exceed the net carrying amount of the assets as of the assessment date, and |
| (ii) | If assets are determined to be impaired in step (i), then such impaired assets are written down to their fair value, determined principally by using discounted future cash flows expected from their use and eventual disposition. |
| | Estimates of future cash flows and fair value require judgements, assumptions and estimates and may change over time. Due to the variables associated with judgments and assumptions used in these tests, the precision and accuracy of estimates of impairment charges are subject to significant uncertainties and may change significantly as additional information becomes known. Long-lived assets represented approximately 78% of total assets as at December 31, 2007. If future developments were to differ adversely from management’s best estimate of key assumptions and associated cash flows, the Company could potentially experience future material impairment charges. |
In the fourth quarter of 2007, as a result of rapid strengthening of the Canadian dollar and the decline in North American consumption of newsprint, the Company conducted step (i) impairment tests on its paper and pulp assets. Estimates of future cash flows used to test the recoverability of long-lived assets included key assumptions related to foreign exchange rates, forecast prices, estimated useful life of the long-lived assets, production levels, production costs, market supply and demand, inflation, weighted average cost of capital, and capital spending. The assumptions are derived from information generated internally, independent industry research firms, and other external published reports and forecasts. The useful life of the Company’s assets was estimated at 20 years for paper assets and 5 to10 years for pulp assets. Product sales prices and foreign exchange assumptions for years 2008 to 2012 were based on forecasts prepared by Resource Information Systems Inc. (“RISI”), an independent external firm. The foreign exchange assumption was CDN$1.00=US$1.015 in 2008 declining to CDN$1.00=US$0.8512 by 2012. Product sales prices and foreign exchange rate assumptions for 2013 and subsequent years were estimated by management based on long-term trend pricing for product sales prices and a long term expected foreign exchange rate of CDN$=US$0.8800. The Company concluded that an impairment charge for the pulp and paper assets was not required in 2007 as the estimated undiscounted cash flows exceeded the carrying values.
| | 10.3 | Pension and post-retirement benefits |
The Company maintains various employee future benefit plans, which include defined benefit pension and post-retirement benefit plans. The Company retains independent actuarial firms to perform actuarial valuations of the fair value of the Company’s defined benefit pension and post-retirement benefit plan assets and benefit obligations, and advise on the amounts to be recorded in the Company’s financial statements. This information is determined using certain assumptions, based on historical and market data that directly impact the fair value of the assets and obligations as well as the charges disclosed in the Company’s financial statements. These assumptions include:
| · | The discount rate which is used to estimate the actuarial present value of the various plan obligations. The Company, assisted by independent actuarial advisors, sets the discount rate assumption annually to reflect the rates available on high-quality debt instruments, with cash flows that are expected to match the timing and amount of expected benefit payments. The discount rate, as at December 31, 2007, was estimated to be 5.25%. |
| · | The long-term return on assets used to estimate the growth in the value of invested assets available to satisfy certain obligations. The Company, with the assistance of independent actuarial firms, annually sets the expected rate of return on plan assets to reflect the current view of long-term investment returns. As at December 31, 2007, a rate of return of 7.0% was determined by management in consultation with its independent actuarial advisors. |
| · | Salary increases used to estimate the impact that future compensation increases will have on pension and other post-retirement obligations. As at December 31, 2007, the rate of compensation increase of 2.5% was determined by management in consultation with its independent actuarial advisors. |
The following table provides a sensitivity analysis of the key weighted average economic assumptions used in measuring the accrued pension benefit obligation, and the accrued other employee future benefit and related net periodic benefit cost for 2007. This sensitivity analysis should be used with caution as it is hypothetical and changes in each key assumption may not be linear. The sensitivities in each key variable have been calculated independently of each other.
| | | Pension benefit plans | | | Other benefit plans | |
| (In millions of dollars) | | Accrued benefit obligation | | | Net 2007 expense | | | Accrued benefit obligation | | | Net 2007 expense | |
Expected rate of return on assets | | | | | | | | | | | | |
| Impact of: | | | | | | | | | | | | |
1% increase | | NA | | | | (2.7 | ) | | NA | | | NA | |
1% decrease | | NA | | | | 2.7 | | | NA | | | NA | |
| Discount rate | | | | | | | | | | | | | |
| Impact of: | | | | | | | | | | | | | |
1% increase | | | (34.5 | ) | | | (1.5 | ) | | | (30.7 | ) | | | (4.4 | ) |
1% decrease | | | 37.9 | | | | 4.7 | | | | 35.7 | | | | 5.0 | |
| Assumed overall health care cost trend | | | | | | | | | | | | | | | | |
| Impact of: | | | | | | | | | | | | | | | | |
1% increase | | NA | | | NA | | | | 39.7 | | | | 6.3 | |
1% decrease | | NA | | | NA | | | | (31.0 | ) | | | (5.1 | ) |
| | 10.4 | Provision for bad debt and doubtful accounts |
The Company uses generally accepted practices in estimating required provisions for doubtful accounts and bad-debt losses arising on trade and other receivable balances. The Company’s estimate of the required allowance is a matter of judgement and the actual loss eventually sustained may be more or less than estimated.
The Company regularly reviews the collectibility of its accounts receivable. The Company records its allowance for doubtful accounts based on its best estimate of any potentially uncollectible accounts by highlighting those that are specifically high risk and applying judgement to determine its estimate. Consideration is given to current economic conditions and specific customer circumstances to determine the amount of any bad-debt expense to be recorded. While the Company has not experienced any significant bad-debt expense in prior periods, declines in the economy could result in collectibility concerns. Accounts receivable balances for individual customers could potentially be material at any given time. The Company manages its credit risk principally through credit policies, which include the analysis of the financial position of its customers and the regular review of their credit limits. The Company also subscribes to credit insurance for a majority of its receivables, periodically purchases accounts receivable puts on certain customers, and obtains bank letters of credit for some export markets or customers.
As at December 31, 2007, “Accounts receivable” comprised 8.7% of total assets. Included in this balance was a provision of $2.8 million for doubtful accounts, or 1.3% of accounts receivable (as at December 31, 2006, $3.1 million for doubtful accounts, or 1.1% of accounts receivable).
In January 2008, one of the Company's larger customers, QuebecorWorld (less than 5% of sales), filed for bankruptcy protection in both Canada and the U.S. This customer continues to operate under the Canadian and U.S. bankruptcy laws, and continues to purchase from the Company under certain terms and conditions. Based on the estimated recoveries from this customer and the Company's credit insurer, the Company believes its allowance for doubtful accounts as at December 31, 2007 is adequate to provide for probable losses existing in accounts receivable as at December 31, 2007.
The amounts recorded for future income tax assets and liabilities are based on various judgments, assumptions and estimates. Future tax assets and liabilities are measured using enacted or substantively enacted tax rates for the years in which assets and liabilities are expected to be recovered or settled. For these years, a projection is made of taxable income and estimates made of the ultimate recovery or settlement of temporary differences. The projection of future taxable income is based on management’s best estimate and may vary from actual.
The Company’s future tax assets are mainly composed of temporary differences relating to employee future benefits and loss carryforwards. Future tax liabilities are mainly composed of temporary differences pertaining to property, plant and equipment. Estimating the ultimate settlement period for these temporary differences requires judgment. The reversal of these temporary differences is expected to be at future substantially enacted rates which could change due to changes in income tax laws. As a result, a change in the timing of reversal or in the income tax rate could materially affect the future tax expense recorded in the consolidated statement of earnings. A one-percentage-point change in the Company’s reported effective income tax rate would have the effect of changing the income tax expense by approximately $5.8 million.
In addition, the Company records provisions for federal, provincial and foreign taxes based on the respective tax laws of the jurisdictions in which the Company operates and its judgment as to the appropriate allocation of income and deductions to those jurisdictions. Canadian, U.S. and international tax laws are subject to interpretation and the Company’s judgment may be challenged by taxation authorities. In such circumstances, the final resolution of these challenges can result in settlements that differ from the Company’s estimated amounts.
On January 1, 2007, the Company adopted the new recommendations of the CICA Handbook Section 3855, “Financial Instruments - Recognition and Measurement”, Section 1530, “Comprehensive Income”, Section 3865, “Hedges”, Section 3861, “Financial Instruments – Disclosure and Presentation”, and Section 3251, “Equity”. These standards introduce new requirements for recognition, measurement and disclosure of financial instruments, when and how hedge accounting may be applied, establishes the concept of comprehensive income and rules for reporting it and establishes rules for the presentation of equity and changes in equity. Prior period financial statements are not revised for the adoption of these new standards.
The adoption of these standards resulted in the Company recording on its balance sheet, at fair value, certain revenue and interest rate derivative financial instruments that were previously off balance sheet and the reclassification of its deferred financing costs against long-term debt. The detailed adjustments are provided in note 2(c) in the Company’s 2007 annual consolidated financial statements.
| 12.0 | IMPACT OF ACCOUNTING PRONOUNCEMENTS AFFECTING FUTURE PERIODS |
The new recommendations of the CICA Handbook Section 3031, “Inventories” provides significantly more guidance on the measurement of inventory and requires enhanced disclosures. This standard is effective for interim and annual financial statements for fiscal years beginning on or after January 1, 2008. The transitional rules for this standard require retrospective application at the beginning of the fiscal year. While the Company is currently assessing the impact of these new recommendations on its consolidated financial statements, it does not expect the recommendations to have a significant impact on its consolidated earnings.
The new recommendations of the CICA Handbook Section 1535, “Capital Disclosures” requires entities to provide additional disclosures relating to the Company’s objectives, policies and processes for managing capital. This standard is effective for interim and annual financial statements for fiscal years beginning on or after October 1, 2007.
The CICA has released two new Handbook sections related to financial instruments: Section 3862, “Financial Instruments – Disclosures” and Section 3863, “Financial Instruments – Presentation”. These standards enhance existing disclosures in previously issued Section 3861, “Financial Instruments – Disclosures and Presentation”. The new recommendations under Section 3862, “Financial Instruments – Disclosures” require additional disclosures, relative to those currently required, with an emphasis on risks associated with both recognized and unrecognized financial instruments to which an entity is exposed during the period and at the balance sheet date, and how the entity manages those risks. This standard is effective for interim and annual financial statements for fiscal years beginning on or after October 1, 2007.
The Company produces and markets pulp and paper products that are sold globally. The Company seeks to differentiate its product lines from those of other producers by supplying specialty products that add value for customers. However, like most companies in the forest products industry in North America, the Company faces business risks and uncertainties. These fall into the general business areas of markets, international commodity prices, currency exchange rates, environmental issues, fibre supply, government regulation and policy, and for Canadian companies, trade barriers and potential impacts of Aboriginal rights, including unresolved Aboriginal land claims in British Columbia.
In order to address these risks and effectively manage them, the Company’s management has developed a process for managing risk and the interrelationships risks have with the Company’s strategic plan. Management provides regular updates to the Audit Committee, works with corporate and operational management to identify, measure and prioritize the critical risks facing the Company, and manages these risks by ensuring that they are adequately addressed through mitigating procedures where appropriate. The objectives of the risk management function include developing a common framework for understanding what constitutes principal business risks, ensuring that risk management activities are aligned with business strategies, and providing an effective mechanism for governance in the area of risk management.
A discussion of the principal uncertainties to which the Company is subject follows.
| | 13.1 | Fluctuations in Markets and Prices |
The Company’s markets are commodity-based and cyclical in nature. Markets for the principal products are affected by fluctuations in supply and demand within each cycle, which in turn affect product prices. Demand has historically been determined by the level of economic growth and has been very closely tied to overall business activity and personal income and the strength of print media advertising. The Company has limited influence over the timing and extent of price changes for its products. See Section 14.0, "Sensitivity Analysis" for further details regarding the Company’s sensitivity to product price fluctuations.
The North American and global economies and the market for the Company’s products has weakened significantly over a period of several years and market conditions are expected to continue to be challenging over the next year. North American newsprint consumption declined in 2007 by 10.5% from 2006, and by 6.3% in 2006 from 2005. The Company believes this decline in newsprint demand will continue, although it has been able to mitigate the impact in part through its ability to switch grades. Adverse effects on the demand for our products may decrease our sales, operating earnings and cash flows.
Trends in advertising, electronic data transmission and storage, and the internet could have further adverse effects on traditional print media including our products and those of our customers. Our newspaper, telephone directory and retail customers may make increasing use of other forms of media and advertising instead of newsprint, uncoated groundwood and coated papers made by us. The extent to which the use of other media sources will reduce demand for our products, and the timing of any such reduction, is unknown.
Pulp and paper markets are highly competitive global commodity markets in which producers compete primarily on the basis of price. A majority of the Company’s production is directed to markets outside Canada, where Canadian producers generally compete with American, European and Asian producers. Many of the Company’s competitors are larger and have greater financial resources than the Company and some of the mills operated by the Company’s competitors are lower cost producers than the mills the Company operates.
A significant portion of the Company’s sales are outside Canada and the United States. Therefore, the Company faces a number of risks including tariffs and other trade barriers, unfavourable business conditions or political and economic instability in certain foreign markets, fluctuations in foreign currencies, and difficulty in obtaining distribution and support.
Under the terms of the Company’s distribution agreement relating to the sale of paper in certain international markets, either party on six-months’ notice may terminate the agreement. If the agreement is terminated, the Company will be required to replace the distributor within the six-month notice period in order to minimize disruption to sales activities in the relevant market.
The Company’s profitability is subject to fluctuations in foreign currencies, particularly the U.S. dollar. Nearly all of the Company’s sales are in U.S. dollars, while a substantial portion of the Company’s costs and expenses are incurred, and results of operations and financial conditions are reported, in Canadian dollars. The value of the Canadian dollar in relation to the U.S. dollar has increased significantly in recent years. Further increases in the value of the Canadian dollar relative to the U.S. dollar would reduce the amount of revenue in Canadian dollar terms realized by the Company on sales made in U.S. dollars.
Fluctuations in foreign currencies affect the Company’s competitive position in world markets. Apart from the value of the Canadian dollar relative to the U.S. dollar, the Company’s competitiveness in world markets is affected by the relative strength of the currencies of other producing countries. The Company is also exposed to currency exchange risk on debt denominated in U.S. dollars, including its 7.375% and 8.625% senior notes.
Under a Board-approved foreign exchange risk management program, the Company manages a portion of its currency exposure through the use of currency options and forward contracts to hedge anticipated future sales denominated in foreign currencies and U.S.-dollar-denominated debt. The Company’s hedging policy for revenues includes 33% to 67% of 0- to 12–month and 0% to 25% of 13- to 24-month U.S. dollar net exposure. The revenue hedge program mitigates the impact of any rapid movements in currency by 20% to 40% over the near term. In addition, the Company considers future U.S. dollar revenues to provide a partial natural hedge for its U.S.-dollar-denominated debt.
Since the Company has no significant timber holdings, operations are dependent on the supply by third parties of wood fibre. Approximately 48% of the Company’s fibre needs are provided by five suppliers. The Company’s fibre supply could be reduced as a result of events beyond its control, such as industrial disputes, natural disasters, material curtailments, and shutdown of operations by suppliers or the Company for market or other reasons. Market-related curtailments or shutdowns can be influenced by both seasonal and cyclical factors such as raw material availability, finished goods inventory levels, or interest rates and underlying demand for lumber in key markets.
Long-term fibre contracts with third parties are conducted at market prices or at prices determined under market-based formulas and represent approximately 69% of the Company’s pulp and paper mills’ wood fibre requirements. The solid wood segment of British Columbia’s forest industry has undergone significant consolidation and downsizing. As a result, there is no assurance that the Company will continue to be able to access wood fibre at the same levels achieved in the past; therefore, costs may be negatively impacted.
In 2007, U.S. housing starts declined 25% from 2006. The weak U.S. housing markets and the decline in other market conditions have caused British Columbia’s lumber producers to reduce their operations. The result is that such producers are not currently able to supply the Company with wood fibre at historical levels or prices. In early 2008 the Corporation announced curtailments of some of its operations as a result of its inability to obtain sufficient fibre at cost effective prices to enable it to run at full capacity. Further curtailments may be required if market conditions continue to decline.
The current infestation of the mountain pine beetle in the interior of British Columbia is expected to affect the long-term fibre supply in that region. The beetle attacks lodgepole pine forests and once attacked, pine trees typically die within the year. Approximately 30% of the Company’s fibre supply comes from the British Columbia interior and it is used primarily by the Powell River paper mill and Crofton kraft pulp mill. In three to five year���s time, the infestation could have a significant impact on the availability and cost of fibre used by those mills.
In addition, government regulations and aboriginal issues may also lower the supply of wood fibre. The Province of British Columbia owns approximately 95% of all timberlands and could introduce legislation to reduce wood fibre supply. Aboriginal groups have claimed aboriginal title over substantial portions of British Columbia’s timberlands, including areas where the forest tenures held by the Company’s suppliers are located. Although the renewal of forest tenures held by the Company’s suppliers may be adversely impacted by claims of aboriginal title, the specific impact cannot be estimated at this time.
The Company is also a large consumer of old newspapers and magazines. Ownership of Western Canada’s largest paper recycling facility enables the Company to secure 100% of its recycled fibre needs from this facility. While the supply remains reliable, the pricing is determined by the market and is subject to variability. Demand and prices for old newspapers have been increasing in recent periods due primarily to increased export demand.
The “Sensitivity Analysis” section provides further details about the Company’s sensitivity to fibre cost movements.
Approximately three quarters of the Company’s pulp and paper mill employees are members of the Communications, Energy & Paperworkers Union of Canada (“CEP”), the Pulp, Paper and Woodworkers of Canada (“PPWC”) or the Canadian Office and Professional Employees Union (“COPE”) unions. Collective agreements with the CEP and PPWC unions expire in April 2008. The CEP Local 592 maintenance workers and Local 686 paperworkers in the Company’s Port Alberni mill have voted to accept a 5-year tentative agreement subject to the re-start of A4. Negotiations with the other Locals are ongoing. If an agreement is not reached, a strike or work stoppage by the CEP or PPWC could have a material adverse effect on the Company’s operations. The Company’s collective agreement with COPE, the smallest of the three unions, expires on April 30, 2012. Distribution centre employees are members of the Christian Labour Association of Canada (“CLAC”) and nine employees at the Port Alberni operations are members of the Office and Technical Employees Union (“OTEU”). The collective agreement with CLAC and OTEU both expire in April 2012.
The Company believes its labour relations are strong and does not anticipate labour disruptions in its operations. However, the Company may not be able to negotiate an acceptable contract with any of the Company’s unions upon expiration of these existing contracts. This could result in a strike or work stoppage by the affected workers. Renewal of contracts could result in higher wages or benefits paid to union members. Therefore, the Company could experience a significant disruption of its operations or higher ongoing labour costs, which could have a material adverse effect on the business, financial condition, results of operations and cash flow.
Many of the Company’s suppliers and service providers are unionized. Strikes or work stoppages by members of those unions could result in a significant disruption of operations or higher operating costs, which could have a material adverse effect on the business.
Negotiations between the B.C. Maritimes Employers’ Association (“BCMEA”) and the International Longshoreman Workers’ Union (“ILWU”) are ongoing. In 2007, the Company’s sales to international customers were not impacted as there was no work stoppage associated with these negotiations. In the event where the parties fail to reach a labour agreement and a work stoppage occurs, there would be an interruption to the Company’s sales to international customers.
The Company’s ability to operate its manufacturing facilities may be affected by aboriginal groups’ claims of aboriginal title and rights. The governments of Canada and British Columbia have established a formal process to negotiate settlements with aboriginal groups throughout British Columbia in order to resolve these land claims. It is the policy of the governments that ownership of lands held in fee simple by third parties such as the Company will not be affected by treaty negotiations. In the case of the Powell River mill, the site has been included in areas to which an aboriginal group has asserted aboriginal title both through treaty negotiations with government and by commencing an action in the Supreme Court of British Columbia. While the Company and other industrial companies have been named as parties in the court proceeding along with the two governments of Canada and British Columbia, counsel for the aboriginal group has advised the Company that the plaintiffs are currently negotiating with the two governments and have no intention of proceeding with the action at this time. Based on the history of similar proceedings, the Company expects that it would take many years before a final court decision could be rendered if the court proceeding were pursued.
Recent Supreme Court of Canada decisions have confirmed that the governments of Canada and British Columbia are obligated to consult with and, in certain circumstances, accommodate aboriginal groups whenever there is a reasonable prospect their decisions, such as the decision to issue or amend a regulatory permit, may affect aboriginal groups’ rights or title. This duty of consultation and accommodation may affect the Company’s ability to obtain or amend necessary regulatory permits on a timely basis and may influence the conditions set out in such permits. In mid-2005 the Government of British Columbia initiated a “new relationship” policy related to Aboriginal interests that recognizes the need to find pre-treaty solutions to advance the consultation process and to reconcile governmental interests and Aboriginal interests. This new relationship policy is directed, in part, at improving decision-making affecting land and resource use. It is unclear what, if any, impact the new relationship policy will have on governmental decision making as it affects the Company.
The Company is a significant consumer of electrical power.
The Company’s electricity supply contracts are provincially regulated, and historically pricing has been very stable. The regulatory commission of the British Columbia Hydro and Power Authority (“BC Hydro”), approved an increase of 1.64% over BC Hydro’s rate prior to July 2006, effective February 1, 2007 and is charging an additional rate rider of 2% on all customer bills for the period February 1, 2007 to March 31, 2008. During Q4, BC Hydro proposed rate adjustments for industrial customers under its Stepped Rates program. Under the proposal, the Tier 2 rate would rise from $54.00 to $74.00, and will be accompanied by a proportionate downward adjustment of the Tier 1 rate. For the current BC Hydro fiscal year, the Company is not expected to consume any Tier 2 power. BC Hydro also is proposing a general increase for all customers, intended to take affect April 1, 2008. While the amount of the proposed increases is uncertain, the Company expects BC Hydro rate increases to be more significant in the future in response to a new B.C. energy policy mandating self-sufficiency by 2016. The Company believes that the Province’s electricity rates will continue to be low relative to other regions in North America, although future changes in electricity prices could have a significant impact on the Company’s earnings.
The majority of the Company’s fossil fuels, particularly oil and natural gas, are purchased on the spot market, which can fluctuate significantly depending on various external factors.
A portion of the Company’s exposure to fluctuating fossil fuel prices is managed through the use of financial instruments and physical supply contracts, under a Board-approved energy program. The Company’s energy hedging policy is restricted to 20-70% of the net exposure for oil and gas. In addition, the Company reduces its exposure to fossil fuel prices through the use of lower priced alternatives.
Freight charges and chemical expenses also vary with oil and diesel fuel prices.
The “Sensitivity Analysis” section provides further details about the Company’s sensitivity to energy cost fluctuations.
In the ordinary course of business, the Company occasionally will become party to legal proceedings, which are generally related to contract disputes and employment law. As at December 31, 2007, the final results of currently ongoing legal proceedings, while not immediately determinable, are not expected to have a material effect on financial results.
The Company has recorded a net loss in 7 of the last 12 quarters. These losses have arisen primarily as a result of the strengthening Canadian dollar and, to a lesser extent, market conditions. Should the Canadian dollar continue to strengthen, or should market conditions deteriorate to a greater extent, the Company may, over time, need to rely to a greater extent on its Facility and, if necessary, additional sources of funding.
In particular, the Company’s pulp operations face significant challenges with the strong Canadian dollar and the cost and availability of fibre. Based on current projections the Company expects to operate its pulp facilities, but deterioration in market conditions or unplanned major capital expenditures may necessitate temporary or permanent curtailment.
The Company has a significant amount of debt, and its debt agreements contain various restrictive and financial covenants. The Company’s ability to pay interest on and satisfy its debt obligations will depend on its future operating performance and ability to obtain additional debt or equity financing when necessary. Prevailing economic conditions and financial, business and other factors beyond the Company’s control may affect its ability to make these payments. In addition, the Company’s debt level may limit its ability to obtain additional financing and increase its vulnerability to interest rate fluctuations. Should the challenging market conditions continue, the Company may, over time, have to rely to a greater extent on its Facility and, if necessary, additional sources of funding.
| | 13.12 | Environmental matters |
The Company’s operations are subject to a wide range of general and industry-specific environmental laws and regulations related to waste management. The costs of compliance with such laws and regulations can be significant. The Company could also incur significant costs, such as civil or criminal fines, sanctions and enforcement actions (including orders requiring remedial actions) and third party claims for property damage and personal injury, as a result of violations of, or liabilities under, environmental laws and regulations. The Company continually monitors its environmental performance and believes that its facilities are operating in substantial compliance with environmental laws and regulations.
The federal government has recently indicated its intent to regulate priority air pollutants and greenhouse gases under the Clean Air Act. The forest products sector is named as one of the targeted sectors for regulation. The impact and associated cost of any such regulation is currently unknown, although it is anticipated that the government will consult with industry before finalizing any regulations.
The province of British Columbia is a signatory to the Western Climate Initiative, an organization of nine western provinces and states, whose mandate is to obtain a 15% reduction in greenhouse gases among member entities by 2020. In addition, the British Columbia government has announced a goal of reducing the provincial inventory of greenhouse gases by 33% by 2020. These organizations are in the early stages of developing policies to achieve their goals. It is too early to determine what their policies will be, the impact on the Company and whether the Company will have a deficit or surplus of carbon credits under any relevant regulatory scheme.
The Company’s earnings are sensitive to fluctuations in:
Product price
The Company’s products are commodity-based and cyclical in nature. As a result, earnings are sensitive to price changes, with the effect of price changes on specialty paper grades and newsprint being the greatest.
Foreign exchange
The Company’s products are primarily sold in Canada, the United States, Asia and Australasia, Latin America and Europe. The majority of sales are denominated in foreign currencies, principally the U.S. dollar. As a result, the Company is exposed to foreign currency risk on accounts receivable and future sales.
Energy costs
The Company’s earnings could be significantly impacted by changes in prices and terms of energy supply contracts, as the Company is a significant consumer of electrical power, fossil fuels, and inputs whose pricing is highly correlated to energy.
Fibre
The Company’s supply of fibre is subject to market influences and has some degree of variability. Fibre supply includes wood chips, logs, sawdust and old newspapers (“ONP”).
The Company’s annual EBITDA, net earnings and earnings per share are estimated to be impacted by changes in product prices, foreign exchange and input costs as follows:
| (In millions of dollars, except per-share amounts) | | EBITDA5 | | | Net earnings1 | | | Earnings per share | |
Product prices2 | | | | | | | | | |
| A US$10 per tonne change in the sales price of: | | | | | | | | | |
Specialty paper | | $ | 10.9 | | | $ | 7.2 | | | $ | 0.03 | |
Newsprint | | | 6.1 | | | | 4.0 | | | | 0.02 | |
Pulp | | | 5.0 | | | | 3.3 | | | | 0.02 | |
Foreign exchange3 | | | | | | | | | | | | |
| A US$0.01 change in the U.S. dollar relative to the Canadian dollar | | $ | 10.8 | | | $ | 6.8 | | | $ | 0.03 | |
Energy cost sensitivity4 | | | | | | | | | | | | |
| A 5% change in the price of: | | | | | | | | | | | | |
Natural gas and oil – direct purchases | | $ | 2.9 | | | $ | 1.9 | | | $ | 0.01 | |
Electricity – direct purchases | | | 7.5 | | | | 4.9 | | | | 0.02 | |
Fibre sensitivity4 | | | | | | | | | | | | |
| A 5% change in the price of: | | | | | | | | | | | | |
Wood chips and sawdust | | $ | 16.3 | | | $ | 10.8 | | | $ | 0.05 | |
ONP | | | 1.4 | | | | 0.9 | | | Less than $0.01 | |
1 Based on an expected tax rate of 34%.
2 Based on full 2007 capacities.
3 Based on a movement from US$1.01 to US$1.02, and excludes the Company’s hedging program and the impact of the Company’s translation of U.S.-dollar-denominated debt.
4 Based on 2007 consumption levels.
| 5 | EBITDA is a non-GAAP measure. Refer to Section 9, “Non-GAAP Measures” section for further details. |
2008 is likely to be impacted by a number of significant factors. A slowing U.S. economy and the possibility of a U.S. recession will result in challenging market conditions for our paper products in North America, although supply factors will also play a key role. Challenging U.S. lumber markets are likely to continue to impact the level of sawmill activity with a corresponding impact on fibre availability and cost for pulp and paper producers.
Fibre costs and supply
Weak log markets and a lack of road development due to the USW strike have contributed to a slower start-up of coastal logging operations in 2008. U.S. lumber market fundamentals are expected to remain weak in 2008 as the housing market continues to decline. Lumber prices continued to deteriorate in early 2008 and the amount of sawmill curtailment in B.C. and across North America is expected to increase. The Company’s Elk Falls E1 paper machine is currently curtailed, equivalent to 38,200 tonnes of newsprint production in Q1, as a result of the current shortage of virgin fibre. Based on the level of sawmill curtailment going forward, further curtailment of the Company’s operations could be required.
On February 7, 2008, TimberWest announced the permanent closure of its Campbell River sawmill, to be effective from May 9, 2008. The Company’s Elk Falls pulp and paper mill is adjacent to this sawmill and receives all the chips, sawdust and hog fuel that it produces. As an alternative, TimberWest has agreed to supply logs to the Company to replace a portion of the lost chip supply that will occur once the sawmill is shut. However, these logs are unlikely to be converted into chips until lumber market conditions improve and sawmill activity increases. Unless a cost effective replacement for the TimberWest fibre supply can be obtained (which the Company does not believe is likely in the short term), the Company expects to lose the equivalent of approximately 60,000 tonnes of paper production or 35,000 tonnes of pulp production (depending on the allocation of remaining fibre supplies) in the second half of 2008 as a result of this closure.
Demand and pricing
The Company expects price increases for most paper grades, despite flat demand for these grades, due to recent capacity closures and relatively low paper inventory. Fibre supply challenges are also expected to contribute to upward price pressure. Demand for NBSK pulp is expected to remain steady during the first half of 2008, with the expectation that benchmark prices will increase modestly in early 2008 and potentially soften in the latter half of the year due to increased capacity in the market.
In addition, net European paper exports to North America are expected to be lower in 2008 due to the strong Euro and reduced European paper capacity compared to previous years.
Labour negotiations
Approximately three quarters of the Company’s pulp and paper mill employees are members of various local Unions. Collective agreements with the CEP and PPWC unions expire in April 2008. Negotiations with these unions are ongoing and currently the CEP Local 592 maintenance workers and Local 686 paperworkers in the Company’s Port Alberni mill have voted to accept a 5-year tentative agreement subject to the re-start of A4. At this time, the Company is not anticipating a work stoppage will result from 2008 labour negotiations.
CDN/US$ exchange rates
Although the Canadian dollar has weakened slightly in early 2008, it is expected to remain strong due to a relatively strong labour market, strong global commodity markets, high energy prices and lower U.S. interest rates due to a weaker U.S. economy.
Capital spending
The Company’s program of high return capital projects was largely completed in 2007 and capital spending is expected to decline closer to basic maintenance levels of approximately $35 million in 2008.
Acquisition in 2008
On February 11, 2008, the Company announced that it has entered into a definitive agreement with a subsidiary of AbitibiBowater to acquire its Snowflake Arizona recycled newsprint mill for cash consideration of US$161 million. The purchase price excludes trade receivables of approximately US$19 million that are being retained by AbitibiBowater. The acquisition will be financed through a combination of the Company’s revolving credit facilities and a proposed $125 million rights offering. The acquisition will increase the Company’s total newsprint production capacity to approximately 980,000 metric tonnes.
| 16.0 | DISCLOSURE CONTROLS AND INTERNAL CONTROL OVER FINANCIAL REPORTING |
The Company conducted an evaluation under the supervision and with the participation of the Company’s management, including the chief executive officer and chief financial officer, as of December 31, 2007, of the effectiveness of the design and operation of the Company’s disclosure controls and procedures. Based on this evaluation, the Company’s chief executive officer and chief financial officer concluded that such disclosure controls and procedures, as defined in Canada by Multilateral Instrument 52-109, Certification of Disclosure in Issuers’ Annual and Interim filings, and in Rules13a-15(e) and 15d-15(e) promulgated under the United States Securities Exchange Act of 1934, as amended (“the U.S. Exchange Act”), are effective to ensure that information required to be disclosed by the Company in reports it files or submits under applicable Canadian and U.S. securities laws is (a) recorded, processed, summarized and reported within the time periods specified in the rules and forms of the Canadian and U.S. securities regulatory authorities and (b) accumulated and communicated to the Company’s management including the Company’s chief executive officer and chief financial officer, or persons performing similar functions, as appropriate, to allow timely decisions regarding required disclosure. It should be noted that while the Company’s disclosure controls and procedures are designed to provide a reasonable level of assurance of achieving their objectives, the Company’s chief executive officer and chief financial officer do not expect that the Company’s disclosure controls and procedures or internal control over financial reporting will prevent all errors and fraud. A control system, no matter how well conceived or operated, can provide only reasonable, not absolute, assurance that the objectives of the control system are met.
There have been no changes in the Company’s internal control over financial reporting that occurred during the period ended December 31, 2007, that have materially affected, or are reasonably likely to materially affect, the Company’s internal control over financial reporting.
Section 404 of the United States Sarbanes-Oxley Act, “Management Assessment of Internal Controls” (“Section 404”), continues to require that management (a) have the responsibility for establishing and maintaining an adequate internal control structure and procedure for financial reporting, and (b) assess and report on the effectiveness of internal control over financial reporting annually. As of December 31, 2007, management has assessed the effectiveness of the Company’s internal control over financial reporting. Based on this assessment, management has determined the Company’s internal control over financial reporting was effective as of December 31, 2007, and issued Management’s Report on Financial Statements and Assessment of Internal Control over Financial Statements dated February 5, 2008 to that effect.
The Company’s Audit Committee, as part of its oversight role, has reviewed and recommended the approval of this MD&A to the board of directors. The board of directors has read and approved this MD&A. Through discussions with management, the board of directors and the Audit Committee have satisfied themselves that management has implemented the necessary disclosure controls.
At February 13, 2008, the Company had 214,684,129 common shares issued and outstanding.
Additional information about the Company including its most recent Annual Information Form is available on the Company’s website at www.catalystpaper.com, or the Canadian Securities Administrator’s electronic filing website at www.sedar.com.