Exhibit 99.1
| MANAGEMENT’S DISCUSSION AND ANALYSIS | | 2 |
Table of Contents
| 1 | Overview and highlights | 4 |
| 2 | Segmented results | 12 |
| 3 | Liquidity and capital resources | 19 |
| 4 | Contingent liabilities | 21 |
| 5 | Summary of quarterly results | 22 |
| 6 | Non-GAAP measures | 22 |
| 7 | Critical accounting policies and estimates | 25 |
| 8 | Changes in accounting policies | 26 |
| 9 | Impact of accounting pronouncements affecting future periods | 26 |
| 10 | Risks and uncertainties | 26 |
| 11 | Sensitivity analysis | 28 |
| 12 | Outlook | 29 |
| 13 | Disclosure controls and internal control over financial reporting | 30 |
| CONSOLIDATED FINANCIAL STATEMENTS | 31 |
| CATALYST PAPER 2011 THIRD QUARTER REPORT │ MANAGEMENT’S DISCUSSION AND ANALYSIS | | 1 |
MANAGEMENT’S DISCUSSION AND ANALYSIS
The following management’s discussion and analysis (MD&A) of Catalyst Paper Corporation (the company, we, us, and our) should be read in conjunction with our interim consolidated financial statements for the three month and nine month periods ended September 30, 2011 and September 30, 2010, and our audited annual consolidated financial statements for the year ended December 31, 2010 and the notes thereto, which have been prepared in accordance with generally accepted accounting principles (GAAP) in the United States (U.S.). Additional information about the company, including our most recent Annual Information Form is available on our website at www.catalystpaper.com, or the Canadian Securities Administrator’s electronic filing website at www.sedar.com.
Throughout this discussion, references are made to certain measures that are not measures of performance under U.S. GAAP, including operating earnings, EBITDA, EBITDA before restructuring costs, average delivered cash costs per tonne before specific items, net earnings (loss) attributable to the company before specific items, net earnings (loss) per share attributable to the company’s common shareholders before specific items, and free cash flow. We believe that these non-GAAP measures are useful in evaluating our performance. These non-GAAP measures are defined and reconciled to their nearest GAAP measure in section 6, Non-GAAP measures.
In this MD&A, unless otherwise indicated, all dollar amounts are expressed in Canadian dollars. The term “dollars” and the symbols “$” and “CDN$” refer to Canadian dollars and the term “U.S. dollars” and the symbol “US$” refer to United States dollars.
In this MD&A, the term “tonne” and the symbol “MT” refer to a metric tonne and the term “ton” or the symbol “ST” refer to a short ton, a measure of weight equal to 0.9072 metric tonne. Use of these symbols is in accordance with industry practice.
The information in this report is as of November 14, 2011, which is the date of filing in conjunction with our press release announcing our results for the third quarter of 2011. Disclosure contained in this document is current to November 14, 2011, unless otherwise stated.
| CATALYST PAPER 2011 THIRD QUARTER REPORT │ MANAGEMENT’S DISCUSSION AND ANALYSIS | | 2 |
CAUTIONARY STATEMENT REGARDING FORWARD-LOOKING STATEMENTS
Certain statements and information in this MD&A are not based on historical facts and constitute forward-looking statements or forward-looking information within the meaning of Canadian securities laws and the U.S. Private Securities Litigation Reform Act of 1995 (forward-looking statements), including but not limited to, statements about our strategy, plans, future operating performance, contingent liabilities and outlook.
Forward-looking statements:
| • | Are statements that address or discuss activities, events or developments that we expect or anticipate may occur in the future; |
| • | Can be identified by the use of words such as “believe”, “expect”, “anticipate”, “intend”, “plan”, “likely”, “predicts”, “estimates”, “forecasts”, and similar words or phrases or the negative of such words or phrases; |
| • | Reflect our current beliefs, intentions or expectations based on certain assumptions and estimates, including those identified below, which could prove to be significantly incorrect: |
| | • | Our ability to develop, manufacture and sell new products and services that meet the needs of our customers and gain commercial acceptance; |
| | • | Our ability to continue to sell our products and services in the expected quantities at the expected prices and expected times; |
| | • | Our ability to successfully obtain cost savings from our cost reduction initiatives; |
| | • | Our ability to implement business strategies and pursue opportunities; |
| | • | Expected cost of goods sold; |
| | • | Expected component supply costs and constraints; |
| | • | Expected foreign exchange and tax rates. |
| • | While considered reasonable by management, are inherently subject to known and unknown risks and uncertainties and other factors that could cause actual results or events to differ from historical or anticipated results or events. These risk factors and others are discussed in the MD&A. Certain of these risks are: |
| | • | The impact of general economic conditions in the countries in which we do business; |
| | • | Conditions in the capital markets and our ability to obtain financing and refinance existing debt; |
| | • | Market conditions and demand for our products (including declines in advertising and circulation); |
| | • | The implementation of trade restrictions in jurisdictions where our products are marketed; |
| | • | Fluctuations in foreign exchange or interest rates; |
| | • | Raw material prices (including wood fibre, chemicals and energy); |
| | • | The effect of, or change in, environmental and other governmental regulations; |
| | • | Uncertainty relating to labour relations; |
| | • | The availability of qualified personnel; |
| | • | The effects of competition from domestic and foreign producers; |
| | • | The risk of natural disaster and other factors many of which are beyond our control. |
As a result, no assurance can be given that any of the events or results anticipated by such forward-looking statements will occur or, if they do occur, what benefit they will have on our operations or financial condition. Readers are cautioned not to place undue reliance on these forward-looking statements. We disclaim any intention or obligation to update or revise any forward-looking statements, whether as a result of new information, future events or otherwise, except as required by law.
| CATALYST PAPER 2011 THIRD QUARTER REPORT │ MANAGEMENT’S DISCUSSION AND ANALYSIS | | 3 |
1.OVERVIEW AND HIGHLIGHTS
BUSINESS OVERVIEW
We are the largest producer of mechanical printing papers in western North America. We also produce NBSK pulp which is marketed primarily in Asia. Our business is comprised of three business segments: specialty printing papers, newsprint, and pulp. Specialty printing papers include coated mechanical, uncoated mechanical, and directory paper. We are the only producer of coated mechanical paper and soft calender (SC) paper in western North America. We operate four paper mills, three of which are located in British Columbia (B.C.) in Crofton, Port Alberni, and Powell River, and one in Snowflake, Arizona, which produces 100% recycled-content paper. Our Crofton mill includes a two-line kraft pulp operation.
More information about our business segments, product profile and our geographic sales distribution is provided on pages 7 to 9 of our 2010 Annual Report. Our production capacity by mill and product line is summarized in the following chart:
2011 Capacity by Mill Location and Product Line 1 | | |
| | | | Specialty printing papers 1 | | | Newsprint 1 | | | Pulp 2 | | | | | |
| Mill location | | Number of paper machines | | | Uncoated mechanical | | | Coated mechanical | | | Directory | | | Newsprint | | | NBSK pulp | | | Total | | |
Crofton, B.C. 3 | | | 3 | | | | - | | | | - | | | | 145,000 | | | | 291,000 | | | | 310,000 | 4 | | | 746,000 | |
| Port Alberni, B.C. | | | 2 | | | | - | | | | 223,000 | | | | 115,000 | | | | - | | | | - | | | | 338,000 | |
| Powell River, B.C. | | | 3 | | | | 449,000 | | | | - | | | | - | | | | 30,000 | | | | - | | | | 479,000 | |
| Snowflake, Arizona | | | 2 | | | | 48,000 | | | | - | | | | - | | | | 289,000 | | | | - | | | | 337,000 | |
| Total capacity (tonnes) | | | 10 | | | | 497,000 | | | | 223,000 | | | | 260,000 | | | | 610,000 | | | | 310,000 | | | | 1,900,000 | |
| % of total capacity | | | | | | | 26 | % | | | 12 | % | | | 14 | % | | | 32 | % | | | 16 | % | | | 100 | % |
| 1 | Capacities expressed in the above table can vary as we are able to switch production between products, particularly newsprint, directory and machine-finished uncoated grades. |
| 2 | A plan was approved to expand total pulp capacity by approximately 25,000 tonnes by 2012. This projected capacity expansion has not been reflected in the table above. |
| 3 | We have indefinitely curtailed the No. 1 paper machine at Crofton, removing the equivalent of 140,000 tonnes of newsprint production on an annualized basis. The capacity and number of machines noted in the above table have not been adjusted to reflect this indefinite curtailment. |
| 4 | Total pulp capacity at Crofton is 370,000 tonnes, of which 310,000 tonnes are designated as market pulp with the remainder of 60,000 tonnes being consumed internally. |
THIRD QUARTER OVERVIEW
Our results for the third quarter were negatively impacted by an impairment charge of $151.0 million related to our Snowflake mill. Excluding this impairment charge, our operating results improved from the previous quarter due to increased sales volumes, higher paper prices, the positive foreign exchange impact of a weakening Canadian dollar and productivity gains. The previous quarter’s results were heavily impacted by fires and extended maintenance outages at our Snowflake and Powell River mills.
Demand for mechanical paper products increased in the third quarter compared to the second quarter. Transaction prices were higher for coated and uncoated mechanical paper grades while newsprint and directory transaction prices were similar to the previous quarter. The Canadian dollar weakened in Q3 and ended the quarter below par. The market for NBSK pulp softened in the current quarter as inventories increased in part due to weakening paper demand which resulted in lower pulp prices.
| CATALYST PAPER 2011 THIRD QUARTER REPORT │ MANAGEMENT’S DISCUSSION AND ANALYSIS | | 4 |
Financial Performance
We recorded a net loss attributable to the company of $205.7 million and a net loss attributable to the company before specific items of $14.1 million in Q3. This compared to a net loss of $47.4 million and $46.9 million, respectively, in Q2. Significant specific items in Q3 included an impairment charge on certain assets of our Snowflake mill and a foreign exchange loss on the translation of U.S. dollar denominated debt. Significant specific items in the prior quarter included a foreign exchange gain on the translation of U.S. dollar denominated debt and losses sustained from fires at our Snowflake and Powell River mills.
EBITDA was $26.8 million in Q3 compared to negative $3.9 million in Q2. Refer to section 6, Non-GAAP measures, for additional information on specific items in the reported financial results.
SELECTED FINANCIAL INFORMATION
| | 2011 | | | 2010 | |
(In millions of Canadian dollars, except where otherwise stated) | YTD | | | | Q3 | | | | Q2 | | | | Q1 | | | YTD | | | | Q3 | | | | Q2 | | | | Q1 | |
Sales | | $ | 941.7 | | | $ | 340.3 | | | $ | 297.8 | | | $ | 303.6 | | | $ | 895.0 | | | $ | 322.3 | | | $ | 299.4 | | | $ | 273.3 | |
Operating earnings (loss) | | | (193.1 | ) | | | (151.6 | ) | | | (30.6 | ) | | | (10.9 | ) | | | (367.7 | ) | | | 5.1 | | | | (323.9 | ) | | | (48.9 | ) |
| Depreciation and amortization | | | 81.6 | | | | 27.8 | | | | 27.0 | | | | 26.8 | | | | 92.1 | | | | 28.2 | | | | 31.2 | | | | 32.7 | |
EBITDA 1 | | | 38.8 | | | | 26.8 | | | | (3.9 | ) | | | 15.9 | | | | 17.6 | | | | 34.2 | | | | (0.4 | ) | | | (16.2 | ) |
- before restructuring costs 1 | | | 38.8 | | | | 26.8 | | | | (3.9 | ) | | | 15.9 | | | | 42.9 | | | | 34.5 | | | | 10.5 | | | | (2.1 | ) |
Net earnings (loss) attributable to the company | | | (266.0 | ) | | | (205.7 | ) | | | (47.4 | ) | | | (12.9 | ) | | | (406.5 | ) | | | 6.0 | | | | (368.4 | ) | | | (44.1 | ) |
- before specific items 1 | | | (84.6 | ) | | | (14.1 | ) | | | (46.9 | ) | | | (23.6 | ) | | | (91.1 | ) | | | (9.6 | ) | | | (43.9 | ) | | | (37.6 | ) |
EBITDA margin 1 | | | 4.1 | % | | | 7.9 | % | | | (1.3 | %) | | | 5.2 | % | | | 2.0 | % | | | 10.6 | % | | | (0.1 | %) | | | (5.9 | %) |
- before restructuring costs 1 | | | 4.1 | % | | | 7.9 | % | | | (1.3 | %) | | | 5.2 | % | | | 4.8 | % | | | 10.7 | % | | | 3.5 | % | | | (0.8 | %) |
| Net earnings (loss) per share attributable to the company’s common shareholders (in dollars) | | | | | | | | | | | | | | | | | | | | | | | | | | | | | | | | |
| - basic and diluted | | $ | (0.70 | ) | | $ | (0.54 | ) | | $ | (0.13 | ) | | $ | (0.03 | ) | | $ | (1.06 | ) | | $ | 0.02 | | | $ | (0.96 | ) | | $ | (0.12 | ) |
- before specific items 1 | | | (0.22 | ) | | | (0.04 | ) | | | (0.12 | ) | | | (0.06 | ) | | | (0.24 | ) | | | (0.03 | ) | | | (0.11 | ) | | | (0.10 | ) |
| (In thousands of tonnes) | | | | | | | | | | | | | | | | | | | | | | | | | | | | | | | | |
| Sales | | | 1,232.2 | | | | 439.8 | | | | 393.0 | | | | 399.4 | | | | 1,200.8 | | | | 412.1 | | | | 404.5 | | | | 384.2 | |
| Production | | | 1,234.8 | | | | 428.3 | | | | 396.1 | | | | 410.4 | | | | 1,195.9 | | | | 417.7 | | | | 403.0 | | | | 375.2 | |
| 1 | Refer to section 6, Non-GAAP measures. |
| CATALYST PAPER 2011 THIRD QUARTER REPORT │ MANAGEMENT’S DISCUSSION AND ANALYSIS | | 5 |
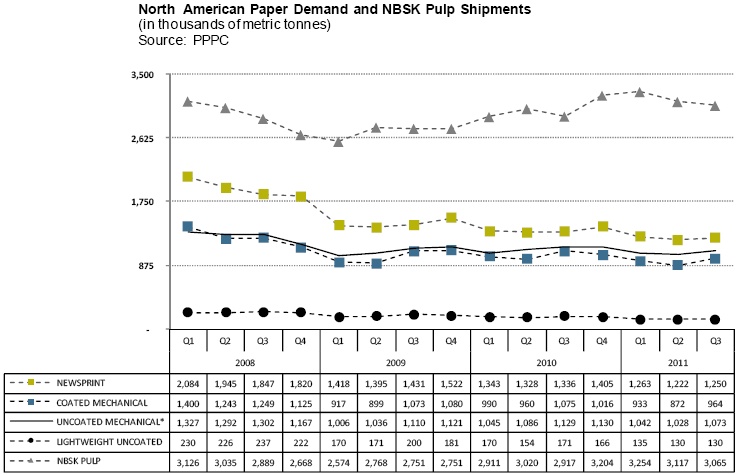
Market Overview
| * | Uncoated mechanical is comprised of high-gloss and standard grades. |
Overall, market conditions remained challenging in the quarter compared to the same quarter last year. North American demand for all paper grades decreased and inventory levels for most paper grades increased. Operating rates for most paper grades remained at similar levels as recent mill curtailments and closures helped to offset lower demand. North American demand for uncoated mechanical grades was down slightly compared to levels of a year ago while demand decreases for coated mechanical, directory paper and newsprint were more substantial. Directory, coated and uncoated mechanical benchmark prices increased during the quarter while the benchmark price for newsprint was down slightly.
Global pulp shipments increased for the quarter compared to last year as pulp shipments to China increased during the quarter offsetting lower shipments to Europe and North America. NBSK pulp shipments increased 5.1% year over year led by very strong shipments to China. NBSK pulp benchmark prices for China decreased during the quarter due to heavy shipments and rising inventory levels.
British Columbia Harmonized Sales Tax Extinguished
Elections B.C. announced on August 26, 2011 that British Columbia voters, via a mail-in ballot, defeated the Harmonized Sales Tax (HST) in a binding British Columbia sales tax referendum conducted in June and July of 2011. The elimination of the HST will have a significant negative impact on our future results. The HST had replaced the separate Provincial Sales Tax (PST) and federal Goods and Services Tax (GST) on July 1, 2010. The Province will revert back to the previous PST regime on a future date that will be no earlier than April 1, 2013. If the previous PST regime is implemented the cost impact will be approximately $10.5 million annually, based on actual 2011
annualized expenditures.
| CATALYST PAPER 2011 THIRD QUARTER REPORT │ MANAGEMENT’S DISCUSSION AND ANALYSIS | | 6 |
Impairment of Snowflake Assets
We recorded an impairment charge of $151.0 million (US$145.3 million) on certain assets of our Snowflake mill in the current quarter. The charge was comprised of a full write-down of the net book value of building, machinery and equipment of US$135.6 million and maintenance supplies and spare parts inventory of US$9.7 million. The impairment includes the assets of The Apache Railway Company, a subsidiary of Catalyst Paper (Snowflake) Inc.
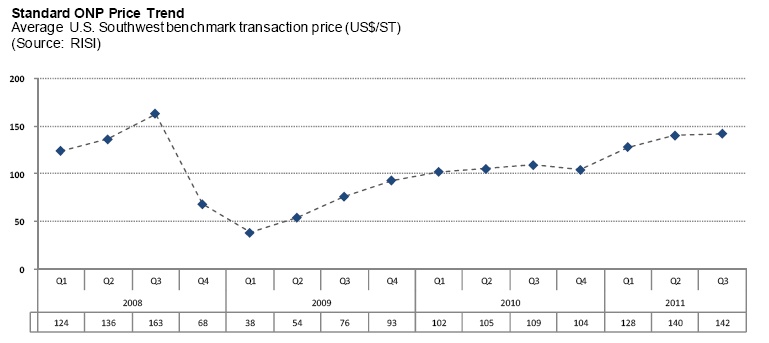
Significant changes to the economic and market environment in which the Snowflake mill operates have had an adverse effect on the mill’s operating results. The profitability of the Snowflake mill’s recycled newsprint operation has been, and will continue to be, negatively impacted by reduced North American demand for newsprint due to declining circulation, ongoing conservation and migration to electronic media. This reduction in demand has resulted in excess newsprint capacity and very competitive conditions in the marketplace that continue to limit our ability to successfully implement price increases to reflect increases to our cost structure.
Recycled newsprint is derived from recovered old newsprint (ONP), and continued demand from China for recycled paper has resulted in increased input costs and therefore deteriorating operating margins. Although there has been a recent decline in the price of ONP the global market is forecasted to remain strong, and this will continue to place significant supply and price pressure on ONP in the future.
Given these deteriorating conditions of depressed newsprint demand and pricing as well as continued upward pressure on our input costs, full impairment of the specified assets in the quarter has become appropriate in accordance with United States generally accepted accounting principles (U.S. GAAP). The assets continue to be owned by the company and are still in use.
Capital Structure Review
On June 20, 2011, the company announced that it is reviewing alternatives to address its capital structure with the goal of improving its balance sheet. In particular, the company has identified reduction of the company’s indebtedness as a priority given current business and economic conditions and is accordingly reviewing alternatives regarding both its 7.375% unsecured senior notes due 2014 and its 11.0% senior secured notes due 2016. The company recently engaged Perella Weinberg Partners as its financial advisor to assist in this process and discussions are ongoing with certain holders of these notes and/or their representatives.
| CATALYST PAPER 2011 THIRD QUARTER REPORT │ MANAGEMENT’S DISCUSSION AND ANALYSIS | | 7 |
STRATEGY UPDATE
Our objective is to return to profitability and maximize cash flows by focusing on reducing manufacturing costs and optimizing our brands and customer base. Additional information related to our corporate strategy, including key performance drivers and indicators, can be found on pages 16 to 21 of our 2010 Annual Report.
2011 Key Objectives
The following is an update on our third quarter progress towards our 2011 key objectives:
Social:
| • | Significantly improve safety performance |
| | • | Our lost-time injury frequency in Q3 of 0.71 was an improvement from Q2 levels of 1.37 and was below our target of 1.60. As well, our medical incident rate improved from 4.10 in Q2 to 3.79 in Q3 but was above our target of 3.20. |
| • | Enhance employee communication |
| | • | A multi-faceted safety awareness program began in February and a semi-annual employee engagement tracking survey has been introduced. |
| • | Continue to seek competitive business conditions in B.C., including joint municipal infrastructure agreements |
| | • | Discussions continued with B.C. municipalities and the provincial government. |
| | • | In September 2011, the City of Powell River adopted the Revitalization Tax Exemption Program Bylaw, extending the tax exemption for a further four years provided the annual application requirements are met. This will maintain the annual major industry property taxes we pay to the City of Powell River. The services arrangements under which we would use our effluent system to treat the City’s liquid waste and dispose of the City’s bio-solids in the mill’s wood waste boiler will be decided by a referendum. |
Financial:
| • | Continue to focus on cash flows, liquidity and cost reductions |
| | • | Free cash flow for the quarter was $1.4 million and total liquidity decreased by $10.5 million from Q2. This was due to a reduction in cash on hand primarily due to the annual payment of property taxes for 2011 of $18.1 million, the payment of outstanding property taxes for a prior year of $4.1 million, a one-time pension contribution of US$5.1 million to wind-up a US defined benefit pension plan and a general increase in working capital requirements. |
| | • | Capital expenditures in the current quarter of $5.6 million were primarily invested in maintenance of business. |
| | • | On track to realize annual fixed cost savings of approximately $13 million in 2011 in connection with the permanent closure of the Elk Falls mill and the Coquitlam paper recycling facility. |
| • | Improve capital structure |
| | • | As discussed in the Overview, we are presently reviewing alternatives for our US$250 million of 7.375% senior unsecured notes which mature March 1, 2014 and our US$390 million of 11.0% senior secured notes which mature December 15, 2016. |
| • | Continue to innovate and diversify product line |
| | • | Completed the development of our uncoated book grades to provide a full range of caliper-controlled paper for book publishers, including initial trials of recycled book paper from our Snowflake mill. |
| | • | Increased our capability to supply uncoated high bright grades to the retail insert market by expanding the production of our lightest weight grades at Crofton and Snowflake. |
| | • | Despite a declining demand for our grades, Catalyst continues to gain market share in all grade categories. New products such as Pacificote, our coated four grade, and Electrabrite Book Sage have contributed to this growth. |
| | • | Renewed annual contracts with all our largest telephone directory customers at higher prices. |
| CATALYST PAPER 2011 THIRD QUARTER REPORT │ MANAGEMENT’S DISCUSSION AND ANALYSIS | | 8 |
Environmental:
| • | Capital upgrade of $5 million at Port Alberni mill to improve combustion efficiency and environmental performance of its biomass boiler and a $13 million upgrade at Powell River mill to increase the electrical generation from the existing generator and biomass boiler |
| | • | Each of these projects is in process and scheduled to complete in advance of the March 31, 2012 spending deadline for the Pulp and Paper Green Transformation Program. Completion of these projects is expected to result in annual EBITDA improvement of $5.0 million. |
| • | Completed close to $2 million worth of improvements to Robertson Creek dam at Port Alberni. |
| | • | The new dam meets all current provincial safety guidelines and protects the federal fish hatchery and properties downstream. |
| • | Implement Forest Stewardship Council chain of custody certification at all Canadian mills |
| | • | With the Forest Stewardship Council (FSC) chain of custody system implemented at the company’s B.C. coastal mills, sourcing of FSC fibre from coastal, interior and ONP suppliers continues to support targeted sales and marketing campaigns. |
| • | Achieve conservation targets in water and energy |
| | • | Water audits completed at our Port Alberni and Crofton mills to verify usage, associated energy costs, and identify conservation opportunities through improved processes. |
| CATALYST PAPER 2011 THIRD QUARTER REPORT │ MANAGEMENT’S DISCUSSION AND ANALYSIS | | 9 |
CONSOLIDATED RESULTS OF OPERATIONS
Sales
Q3 2011 vs. Q2 2011
Sales revenues increased by 14.3% as a result of higher sales volumes achieved for pulp and paper as well as higher transaction prices for uncoated and coated mechanical papers. This was partially offset by a reduction in transaction prices for pulp in the third quarter. Prior quarter sales volumes were adversely impacted by fires and extended maintenance outages at our Snowflake and Powell River mills.
Q3 2011 vs. Q3 2010
Sales revenues increased by 5.6% due to higher sales volumes, both for pulp and paper, as well as higher transaction prices in the current quarter for all paper grades and pulp. These factors were partially offset by the negative impact of a stronger Canadian dollar in the current quarter.
2011 YTD vs. 2010 YTD
Sales revenues increased by 5.2% due to higher transaction prices for our paper and pulp products, and higher overall sales volumes as increased pulp and specialty sales volumes more than offset lower newsprint sales. This was partially offset by the negative impact of the stronger Canadian dollar.
EBITDA and EBITDA before Restructuring Costs
The following table provides variances between periods for EBITDA and EBITDA before restructuring costs:
| (In millions of Canadian dollars) | | | Q2 2011 | | | | Q3 2010 | | | 2010 YTD | |
EBITDA in comparative period 1 | | $ | (3.9 | ) | | $ | 34.2 | | | $ | 17.6 | |
| Restructuring costs | | | - | | | | 0.3 | | | | 25.3 | |
EBITDA before restructuring costs in comparative period 1 | | | (3.9 | ) | | | 34.5 | | | | 42.9 | |
| Paper prices | | | 4.6 | | | | 15.6 | | | | 66.9 | |
| Pulp prices | | | (2.3 | ) | | | 0.5 | | | | 15.4 | |
| Impact of Canadian dollar | | | 3.2 | | | | (14.4 | ) | | | (44.1 | ) |
| Volume and mix | | | 9.2 | | | | 7.5 | | | | 23.0 | |
| Furnish mix and costs | | | (1.8 | ) | | | (12.4 | ) | | | (32.8 | ) |
| Power and fuel costs | | | 1.9 | | | | (1.7 | ) | | | 3.2 | |
| Maintenance costs | | | 5.9 | | | | (0.6 | ) | | | (18.0 | ) |
| Labour costs | | | 3.5 | | | | (0.8 | ) | | | (7.7 | ) |
| Selling, general and administrative | | | (0.1 | ) | | | 1.3 | | | | 2.3 | |
| Lower of cost or market impact on inventory, net of inventory change | | | 6.9 | | | | 1.1 | | | | (5.6 | ) |
| Other, net | | | (0.3 | ) | | | (3.8 | ) | | | (6.7 | ) |
EBITDA before restructuring costs in the current period 1 | | | 26.8 | | | | 26.8 | | | | 38.8 | |
| Restructuring costs | | | - | | | | - | | | | - | |
EBITDA in the current period 1 | | $ | 26.8 | | | $ | 26.8 | | | $ | 38.8 | |
| 1 | Refer to section 6, Non-GAAP measures. |
| CATALYST PAPER 2011 THIRD QUARTER REPORT │ MANAGEMENT’S DISCUSSION AND ANALYSIS | | 10 |
Operating Earnings (Loss)
Q3 2011 vs. Q2 2011
Operating earnings decreased by $121.0 million primarily due to a $151.0 million impairment charge related to our Snowflake mill and an increase to depreciation and amortization expense of $0.8 million, partially offset by higher EBITDA in the current quarter of $30.7 million.
Q3 2011 vs. Q3 2010
Operating earnings deteriorated by $156.7 million due to increased impairment and closure costs of $149.7 million and a reduction in EBITDA of $7.4 million, partially offset by a reduction in depreciation and amortization expense of $0.4 million. The $149.7 million increase in impairment and other closure costs consists of the Snowflake impairment charge of $151.0 million, offset by a $0.4 million credit adjustment related to the permanent closure of the Coquitlam paper recycling facility and $0.9 million recognized as impairment expense in Q3 2010.
2011 YTD vs. 2010 YTD
Operating earnings improved by $174.6 million due to a reduction in impairment and other closure costs of $142.9 million, higher EBITDA of $21.2 million and lower depreciation and amortization expense of $10.5 million. Impairment and other closure costs of $293.2 million were recognized in 2010 related to the closure of the Elk Falls mill and Coquitlam paper recycling facility.
Net Earnings (Loss) Attributable to the Company
Q3 2011 vs. Q2 2011
Net earnings attributable to the company decreased by $158.3 million. This was primarily due to lower after-tax operating earnings of $121.0 million and an after-tax foreign exchange loss on translation of U.S. dollar denominated debt of $41.0 million compared to an after-tax foreign exchange gain of $4.5 million in the second quarter. This was partially offset by after-tax losses incurred in Q2 on fires at our Snowflake mill of $4.1 million and our Powell River mill of $1.2 million.
Q3 2011 vs. Q3 2010
Net earnings attributable to the company decreased by $211.7 million primarily due to reduced after-tax operating earnings of $156.7 million and an after-tax foreign exchange loss on the translation of U.S. dollar denominated debt of $41.0 million compared to an after-tax foreign exchange gain of $16.3 million in Q3 2010.
2011 YTD vs. 2010 YTD
Net earnings attributable to the company improved by $140.5 million primarily due to increased after-tax operating earnings of $161.3 million and increased other income of $16.2 million. This was partially offset by an after-tax foreign exchange loss on the translation of U.S. dollar denominated debt of $25.8 million compared to an after-tax foreign exchange gain of $6.7 million in 2010 YTD.
| CATALYST PAPER 2011 THIRD QUARTER REPORT │ MANAGEMENT’S DISCUSSION AND ANALYSIS | | 11 |
2.SEGMENTED RESULTS
SPECIALTY PRINTING PAPERS
| | | Three months ended September 30 | | | Nine months ended September 30 |
(In millions of Canadian dollars, except where otherwise stated) | | 2011 | | | 2010 | | | Change | | | 2011 | | | 2010 | | | Change |
| Sales | | $ | 187.9 | | | $ | 181.8 | | | $ | 6.1 | | | $ | 515.9 | | | $ | 511.0 | | | $ | 4.9 | |
| Operating earnings (loss) | | | (26.7 | ) | | | (1.8 | ) | | | (24.9 | ) | | | (63.2 | ) | | | (142.2 | ) | | | 79.0 | |
| Depreciation and amortization | | | 19.6 | | | | 20.8 | | | | (1.2 | ) | | | 56.9 | | | | 61.1 | | | | (4.2 | ) |
EBITDA 1 | | | 12.6 | | | | 19.5 | | | | (6.9 | ) | | | 13.3 | | | | 22.7 | | | | (9.4 | ) |
- before restructuring costs 1 | | | 12.6 | | | | 19.6 | | | | (7.0 | ) | | | 13.3 | | | | 30.9 | | | | (17.6 | ) |
EBITDA margin 1 | | | 6.7 | % | | | 10.7 | % | | | (4.0 | %) | | | 2.6 | % | | | 4.4 | % | | | (1.8 | %) |
- before restructuring costs 1 | | | 6.7 | % | | | 10.8 | % | | | (4.1 | %) | | | 2.6 | % | | | 6.0 | % | | | (3.4 | %) |
(In thousands of tonnes) | | | | | | | | | | | | | | | | | | | | | | | | |
| Sales | | | 229.8 | | | | 220.6 | | | | 9.2 | | | | 639.3 | | | | 635.7 | | | | 3.6 | |
| Production | | | 230.0 | | | | 226.6 | | | | 3.4 | | | | 645.2 | | | | 647.9 | | | | (2.7 | ) |
| 1 | Refer to section 6, Non-GAAP measures. |
| CATALYST PAPER 2011 THIRD QUARTER REPORT │ MANAGEMENT’S DISCUSSION AND ANALYSIS | | 12 |
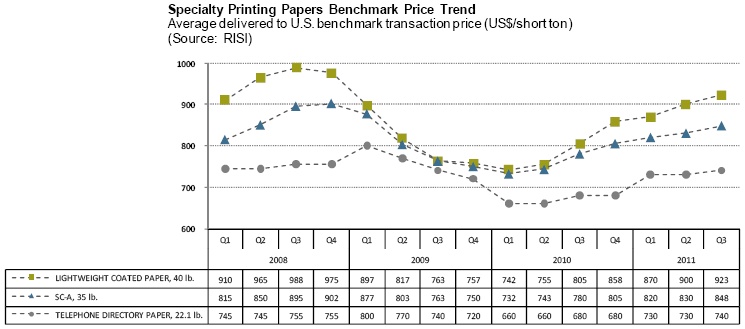
Segment Overview
North American demand for coated mechanical and uncoated mechanical (high-gloss and standard grades) decreased 10.3% and 4.9% respectively, from the same quarter last year due to continued weakness in print advertising. Coated mechanical inventories increased while uncoated mechanical inventories were lower year over year. Adjusted operating rates continued to remain steady as mill and machine closures and curtailment offset lower demand. Our sales volumes rebounded in the third quarter after the second quarter extended maintenance outage and fire at Powell River. During the quarter, we partially implemented the July 1, 2011 US$30 per short ton price increase for our coated mechanical and SC grades and the June 1, 2011 US$40 per short ton price increase on our high bright and super bright paper grades. In addition, we announced a US$30 per short ton price increase for our high bright grades effective October 1, 2011. During the quarter the benchmark prices for these grades improved modestly from Q2. The average lightweight coated benchmark price increased 2.6% to US$923 per ton while the average soft-calendered A grade (SC-A) increased 2.2% to US$848 per ton compared to the previous quarter.
North American directory demand fell 24.0% in Q3 compared to the prior year due to ongoing pressure to reduce or eliminate white pages, smaller books, lower circulation, and the continued migration from printed books to the Internet. Market conditions improved during the quarter compared to the previous quarter as operating rates increased due to the closure of a competitor’s mill. During the quarter we implemented the July 1, 2011 US$70 per ton increase on our non-contract customers. The majority of our directory pricing is largely fixed for the year based on 2011 contract pricing.
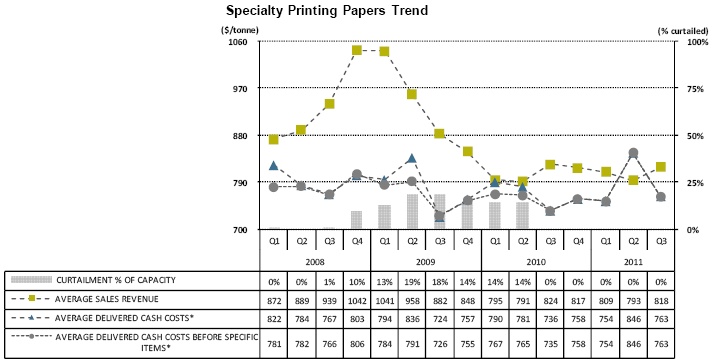
Operational Performance
The following chart summarizes the operating performance of our specialty printing papers segment:
| * | Average delivered cash costs per tonne consist of cost of sales, excluding depreciation and amortization, and including the impact of SG&A and restructuring costs. Average delivered cash costs per tonne before specific items consist of cost of sales, excluding depreciation and amortization, and including the impact of SG&A, but excluding the impact of restructuring costs. |
| CATALYST PAPER 2011 THIRD QUARTER REPORT │ MANAGEMENT’S DISCUSSION AND ANALYSIS | | 13 |
| | • | Sales volume increased by 9,200 tonnes due to higher sales volumes in uncoated mechanical and coated mechanical, partially offset by lower sales volumes in directory. |
| | • | Average sales revenue decreased $6 per tonne due to the negative impact of the stronger Canadian dollar, partially offset by higher average transaction prices for directory, uncoated and lightweight coated papers. |
| | • | Average delivered cash costs increased $27 per tonne primarily due to increased maintenance, labour, and furnish as well as increases to the cost of electric power, chemicals and operating supplies. |
2011 YTD vs. 2010 YTD
| | • | Sales volume increased by 3,600 tonnes due to higher sales volumes in coated mechanical, partially offset by lower sales of directory paper and uncoated mechanical paper. The reduction in sales of uncoated paper was due primarily to the extended maintenance outage and fire at our Powell River mill in the second quarter of 2011. |
| | • | Average sales revenue increased $3 per tonne due to higher average transaction prices, mostly offset by the negative impact of the stronger Canadian dollar. |
| | • | Average delivered cash costs increased $18 per tonne due to increased maintenance, labour, and furnish costs, partially offset by the absence of restructuring costs in the current year. |
NEWSPRINT
| | | Three months ended September 30 | | | Nine months ended September 30 | |
(In millions of Canadian dollars, except where otherwise stated) | | 2011 | | | 2010 | | | Change | | | 2011 | | | 2010 | | | Change | |
| Sales | | $ | 77.0 | | | $ | 79.7 | | | $ | (2.7 | ) | | $ | 223.9 | | | $ | 222.3 | | | $ | 1.6 | |
| Operating earnings (loss) | | | (136.4 | ) | | | (1.1 | ) | | | (135.3 | ) | | | (153.6 | ) | | | (239.2 | ) | | | 85.6 | |
| Depreciation and amortization | | | 4.1 | | | | 3.7 | | | | 0.4 | | | | 13.3 | | | | 20.4 | | | | (7.1 | ) |
EBITDA 1 | | | (1.4 | ) | | | 3.0 | | | | (4.4 | ) | | | (9.6 | ) | | | (29.4 | ) | | | 19.8 | |
- before restructuring costs 1 | | | (1.4 | ) | | | 3.1 | | | | (4.5 | ) | | | (9.6 | ) | | | (13.3 | ) | | | 3.7 | |
EBITDA margin 1 | | | (1.8 | %) | | | 3.8 | % | | | (5.6 | %) | | | (4.3 | %) | | | (13.2 | %) | | | 8.9 | % |
- before restructuring costs 1 | | | (1.8 | %) | | | 3.9 | % | | | (5.7 | %) | | | (4.3 | %) | | | (6.0 | %) | | | 1.7 | % |
| (In thousands of tonnes) | | | | | | | | | | | | | | | | | | | | | | | | |
| Sales | | | 117.8 | | | | 122.3 | | | | (4.5 | ) | | | 346.0 | | | | 368.5 | | | | (22.5 | ) |
| Production | | | 111.6 | | | | 120.1 | | | | (8.5 | ) | | | 348.1 | | | | 358.3 | | | | (10.2 | ) |
| 1 | Refer to section 6, Non-GAAP measures. |
| CATALYST PAPER 2011 THIRD QUARTER REPORT │ MANAGEMENT’S DISCUSSION AND ANALYSIS | | 14 |
Segment Overview
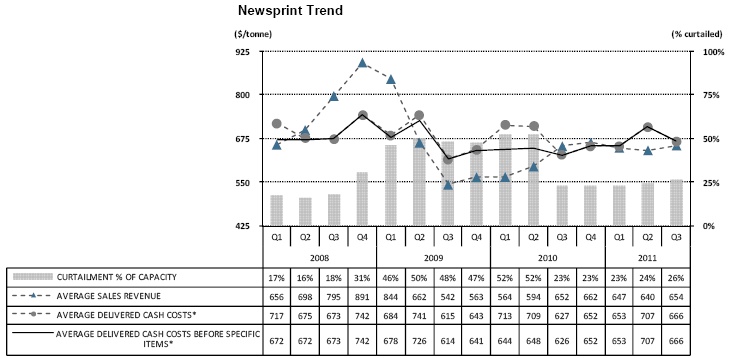
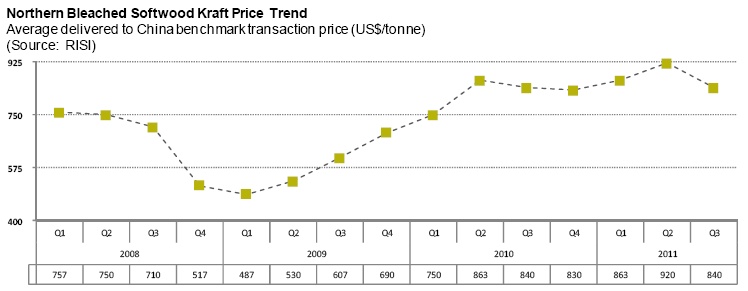
Total North American demand for newsprint was down 6.4% in Q3, year over year in part due to lower newspaper print advertising. In Q3, year over year, North American shipments were down 3.3% as a 2.5% increase in exports partially offset weak North American demand during the quarter. Operating rates were similar to the previous year. The average Q3 North American Newsprint benchmark price decreased slightly by 0.3% to US$620 per tonne compared to the previous quarter. Our sales volume increased 6,000 tonnes from the previous quarter as increased sales from Snowflake after the second quarter outage were offset by lower sales volumes in our B.C. operations in large part due to higher specialty volumes. The Crofton No. 1 paper machine remained indefinitely curtailed throughout the quarter, resulting in a reduction of 35,300 tonnes, or 23% of newsprint production capacity in Q3, based on our 2011 annualized production capacity.
Strong demand from China has fueled an upward trend in ONP prices since the start of 2009. This price pressure has had a significant impact on the profitability of the Snowflake mill’s recycled newsprint operation. For the nine months ended September 2011, the Snowflake mill produced approximately 54% of all newsprint produced during that period.
| CATALYST PAPER 2011 THIRD QUARTER REPORT │ MANAGEMENT’S DISCUSSION AND ANALYSIS | | 15 |
Operational Performance
The following chart summarizes the operating performance of our newsprint segment:
| * | Average delivered cash costs per tonne consist of cost of sales, excluding depreciation and amortization, and including the impact of SG&A and restructuring costs. Average delivered cash costs per tonne before specific items consist of cost of sales, excluding depreciation and amortization, and including the impact of SG&A, but excluding the impact of restructuring costs. |
Q3 2011 vs. Q3 2010
| | • | Sales volume decreased by 4,500 tonnes primarily due to a shift to more specialty volume and a four-day planned maintenance outage at our Snowflake mill in September. |
| | • | Average sales revenue increased $2 per tonne due to the higher average transaction prices, partially offset by negative impact of the stronger Canadian dollar. |
| | • | Average delivered cash costs increased $39 per tonne, due primarily to higher ONP prices. |
2011 YTD vs. 2010 YTD
| | • | Sales volume decreased by 22,500 tonnes due to lower production largely resulting from the extended maintenance outage at our Snowflake mill during the second quarter of 2011 as well as a shift to more specialty volume. |
| | • | Average sales revenue increased $44 per tonne due to higher average transaction prices, offset in part by the negative impact of the stronger Canadian dollar. |
| | • | Average delivered cash costs decreased $8 per tonne due to the absence of restructuring costs in the current year, partially offset by higher ONP prices and increased maintenance costs due to the extended maintenance outage at Snowflake during the second quarter of 2011. |
| CATALYST PAPER 2011 THIRD QUARTER REPORT │ MANAGEMENT’S DISCUSSION AND ANALYSIS | | 16 |
PULP
| | | Three months ended September 30 | | | Nine months ended September 30 | |
(In millions of Canadian dollars, except where otherwise stated) | | 2011 | | | 2010 | | | Change | | | 2011 | | | 2010 | | | Change | |
| Sales | | $ | 75.4 | | | $ | 60.8 | | | $ | 14.6 | | | $ | 201.9 | | | $ | 161.7 | | | $ | 40.2 | |
| Operating earnings (loss) | | | 11.5 | | | | 8.0 | | | | 3.5 | | | | 23.7 | | | | 13.7 | | | | 10.0 | |
| Depreciation and amortization | | | 4.1 | | | | 3.7 | | | | 0.4 | | | | 11.4 | | | | 10.6 | | | | 0.8 | |
EBITDA 1 | | | 15.6 | | | | 11.7 | | | | 3.9 | | | | 35.1 | | | | 24.3 | | | | 10.8 | |
- before restructuring costs 1 | | | 15.6 | | | | 11.8 | | | | 3.8 | | | | 35.1 | | | | 25.3 | | | | 9.8 | |
EBITDA margin 1 | | | 20.7 | % | | | 19.2 | % | | | 1.5 | % | | | 17.4 | % | | | 15.0 | % | | | 2.4 | % |
- before restructuring costs 1 | | | 20.7 | % | | | 19.4 | % | | | 1.3 | % | | | 17.4 | % | | | 15.6 | % | | | 1.8 | % |
| (In thousands of tonnes) | | | | | | | | | | | | | | | | | | | | | | | | |
| Sales | | | 92.2 | | | | 69.2 | | | | 23.0 | | | | 246.9 | | | | 196.6 | | | | 50.3 | |
| Production | | | 86.7 | | | | 71.0 | | | | 15.7 | | | | 241.5 | | | | 189.7 | | | | 51.8 | |
| 1 | Refer to section 6, Non-GAAP measures. |
Segment Overview
NBSK pulp markets weakened in Q3 as global paper demand weakened and pulp inventories rose. Global NBSK shipments increased 5.1% from the same quarter last year due to increased shipments to China which was up 83.2%. The average NBSK benchmark pulp price for China decreased 8.7% to US$840 per tonne compared to the previous quarter.
A plan was approved earlier this year to expand our total pulp capacity by 25,000 tonnes. We are on track to increase our total capacity to 1,120 tonnes per day (tpd) by the end of 2011.
| CATALYST PAPER 2011 THIRD QUARTER REPORT │ MANAGEMENT’S DISCUSSION AND ANALYSIS | | 17 |
Operational Performance
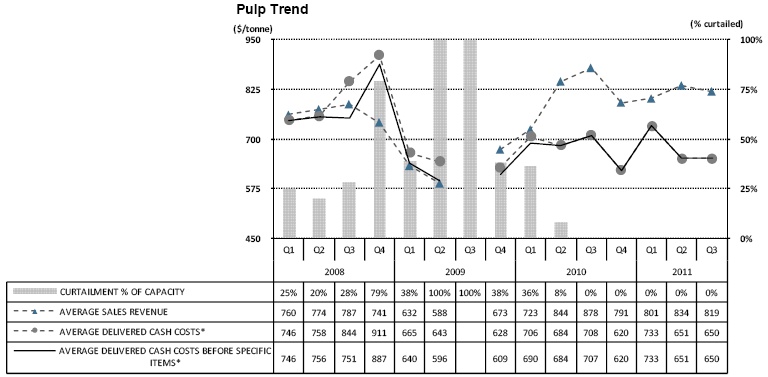
The following chart summarizes the operating performance of our pulp segment:
| * | Average delivered cash costs per tonne consist of cost of sales, excluding depreciation and amortization, and including the impact of SG&A and restructuring costs. Average delivered cash costs per tonne before specific items consist of cost of sales, excluding depreciation and amortization, and including the impact of SG&A, but excluding the impact of restructuring costs. |
Q3 2011 vs. Q3 2010
| | • | Sales volume increased by 23,000 tonnes compared to the same quarter last year due to improved production and strong demand for NBSK pulp from China. |
| | • | Average sales revenue decreased $59 per tonne due to the negative impact of the stronger Canadian dollar, partially offset by higher average transaction prices in the current quarter. |
| | • | Average delivered cash costs decreased by $58 per tonne due to lower fuel, maintenance and labour costs in the current quarter. |
2011 YTD vs. 2010 YTD
| | • | Sales volume increased by 50,300 tonnes due to strong demand from China as well as the fact that pulp production was fully operational throughout the first nine months of 2011, compared to being partially curtailed throughout the same period of 2010. |
| | • | Average sales revenue decreased $4 per tonne due to the negative impact of the stronger Canadian dollar, partially offset by higher average transaction prices. |
| | • | Average delivered cash costs decreased by $23 per tonne due to the absence of restructuring costs in the current year, lower fuel costs and lower maintenance costs, offset in part by increases in the cost of chips and chemicals. |
| CATALYST PAPER 2011 THIRD QUARTER REPORT │ MANAGEMENT’S DISCUSSION AND ANALYSIS | | 18 |
3.LIQUIDITY AND CAPITAL RESOURCES
SELECTED FINANCIAL INFORMATION
| | | Three months ended September 30 | | | Nine months ended September 30 | |
(In millions of Canadian dollars, except where otherwise stated) | | 2011 | | | 2010 | | | Change | | | 2011 | | | 2010 | | | Change | |
Cash flows provided (used) by operations before changes in non-cash working capital | | $ | 5.7 | | | $ | 11.3 | | | $ | (5.6 | ) | | $ | (30.2 | ) | | $ | (43.7 | ) | | $ | 13.5 | |
| Changes in non-cash working capital | | | (44.5 | ) | | | (16.7 | ) | | | (27.8 | ) | | | (37.3 | ) | | | (16.4 | ) | | | (20.9 | ) |
| Cash flows provided (used) by | | | | | | | | | | | | | | | | | | | | | | | | |
| Operations | | | (38.8 | ) | | | (5.4 | ) | | | (33.4 | ) | | | (67.5 | ) | | | (60.1 | ) | | | (7.4 | ) |
| Investing activities | | | (4.9 | ) | | | (3.4 | ) | | | (1.5 | ) | | | (12.7 | ) | | | (1.8 | ) | | | (10.9 | ) |
| Financing activities | | | 31.3 | | | | (9.7 | ) | | | 41.0 | | | | 2.6 | | | | 61.1 | | | | (58.5 | ) |
| Capital spending | | | 5.6 | | | | 2.4 | | | | 3.2 | | | | 13.5 | | | | 8.4 | | | | 5.1 | |
| Depreciation and amortization | | | 27.8 | | | | 28.2 | | | | (0.4 | ) | | | 81.6 | | | | 92.1 | | | | (10.5 | ) |
| Impairment (recovery) and other closure costs | | | 150.6 | | | | 0.9 | | | | 149.7 | | | | 150.3 | | | | 293.2 | | | | (142.9 | ) |
Capital spending as % of depreciation and amortization | | | 20 | % | | | 9 | % | | | 11 | % | | | 17 | % | | | 9 | % | | | 8 | % |
Net debt to net capitalization at September 301 | | | 84 | % | | | 64 | % | | | 20 | % | | | 84 | % | | | 64 | % | | | 20 | % |
| 1 | Net debt ratio equals net debt (total debt less cash) divided by net capitalization (shareholder’s equity attributable to the company and total debt less cash). |
Refer to page 38 of our 2010 Annual Report for a discussion of the nature and sources of funding for our principal cash requirements.
OPERATING ACTIVITIES
Cash flows from operating activities decreased by $33.4 million in Q3 from the same quarter in the previous year, primarily due to an unfavourable change in non-cash working capital of negative $44.5 million compared to negative $16.7 million during the third quarter of 2010 as well as a reduction in EBITDA of $7.4 million. The increase in working capital in Q3 2011 was primarily due to an increase in trade accounts receivable of $37.5 million and a decrease in accounts payable and accrued liabilities of $8.4 million.
INVESTING ACTIVITIES
Cash used by investing activities was $4.9 million in Q3 compared to cash used of $3.4 million in the same quarter last year. This increase was largely due to higher fixed asset additions in the current quarter. Capital spending in the current period related primarily to maintenance of business projects.
FINANCING ACTIVITIES
Cash provided by financing activities in Q3 was $31.3 million compared to cash used of $9.7 million in the same quarter last year. This was primarily due to a net draw on our asset based loan facility (ABL facility) of $31.5 million in the current quarter compared to the purchase of US$9.5 million of our 8.625% senior notes for US$8.9 million in Q3 2010.
| CATALYST PAPER 2011 THIRD QUARTER REPORT │ MANAGEMENT’S DISCUSSION AND ANALYSIS | | 19 |
CAPITAL RESOURCES
Availability on the ABL Facility and total liquidity is summarized in the following table:
| | | 2011 | | | 2010 | |
| (In millions of Canadian dollars) | | | Q3 | | | | Q2 | | | | Q1 | | | | Q4 | | | | Q3 | | | | Q2 | | | | Q1 | |
Borrowing base 1 | | $ | 167.3 | | | $ | 134.3 | | | $ | 174.1 | | | $ | 152.4 | | | $ | 161.7 | | | $ | 167.8 | | | $ | 144.8 | |
| Letters of credit | | | (27.7 | ) | | | (28.1 | ) | | | (25.5 | ) | | | (23.4 | ) | | | (25.1 | ) | | | (25.3 | ) | | | (24.0 | ) |
| Amount drawn, net | | | (31.5 | ) | | | - | | | | - | | | | - | | | | - | | | | - | | | | (25.0 | ) |
| Minimum excess availability | | | - | | | | - | | | | (35.0 | ) | | | (35.0 | ) | | | (35.0 | ) | | | (35.0 | ) | | | (35.0 | ) |
Availability 2 | | | 108.1 | | | | 106.2 | | | | 113.6 | | | | 94.0 | | | | 101.6 | | | | 107.5 | | | | 60.8 | |
| Cash on hand | | | 17.8 | | | | 30.2 | | | | 53.8 | | | | 95.4 | | | | 82.3 | | | | 100.8 | | | | 58.7 | |
| Total liquidity | | $ | 125.9 | | | $ | 136.4 | | | $ | 167.4 | | | $ | 189.4 | | | $ | 183.9 | | | $ | 208.3 | | | $ | 119.5 | |
| 1 | The borrowing base at September 30, 2011 includes a reserve of $0.4 million for unpaid property taxes and associated penalties (Q2 2011 - $4.5 million, Q1 2011 - $4.4 million). |
| 2 | Our ABL Facility is subject to certain financial covenants as disclosed in our interim consolidated financial statements for the three and nine months ended September 30, 2011 in note 11, Long-term debt. |
Our total liquidity decreased by $58.0 million from the same quarter last year primarily due to a decrease in cash on hand, partially offset by an increase in availability under the amended ABL facility. Liquidity decreased by $10.5 million compared to the previous quarter largely due to a decrease in cash on hand resulting from the annual payment of property taxes for 2011 of $18.1 million, the payment of outstanding property taxes for a prior year of $4.1 million, a one-time pension contribution of US$5.1 million to wind-up a U.S. defined benefit pension plan and a general increase in working capital requirements. This was partially offset by a higher borrowing base in the current quarter of $33.0 million.
At November 14, 2011, the company had 381,900,450 common shares issued and outstanding and 2,159,691 stock options for 2,159,691 common shares that, at November 14, 2011, were exercisable.
FINANCIAL INSTRUMENTS
Our financial instruments consist primarily of cash and cash equivalents, accounts receivable, accounts payable and accrued liabilities, long-term debt, and derivatives. Derivatives are used primarily to reduce exposure to currency risk on revenues, or occasionally debt, as well as price risk associated with revenue and energy costs.
For a description of the nature and extent of risk to the company from our financial instruments, as well as our respective accounting treatment of financial instruments, refer to our annual consolidated financial statements for the year ended December 31, 2010, note 26, Financial instruments. For the methods and assumptions we use to determine the fair value of financial instruments, refer to note 25, Fair value measurement, of those statements. Our methods and assumptions for determining the fair value of financial instruments have not changed materially since those used in the preparation of our consolidated financial statements for the year ended December 31, 2010.
At September 30, 2011, we had foreign currency options and forward contracts with a notional principal of US$191.4 million with major financial institutions. At September 30, 2011 period-end exchange rates, these instruments were reported at their fair value of $3.2 million.
The following table reconciles the average spot exchange rate to our effective exchange rate and provides the impact to EBITDA related to the cash flow hedges that were in place as at June 30, 2010 and were designated as hedging instruments at that time:
| CATALYST PAPER 2011 THIRD QUARTER REPORT │ MANAGEMENT’S DISCUSSION AND ANALYSIS | | 20 |
US$/CDN$ FOREIGN EXCHANGE
| | | 2011 | | | 2010 | |
| | | | Q3 | | | | Q2 | | | | Q1 | | | | Q4 | | | | Q3 | | | | Q2 | | | | Q1 | |
| Average Bank of Canada noon spot rate | | | 1.020 | | | | 1.033 | | | | 1.015 | | | | 0.987 | | | | 0.962 | | | | 0.973 | | | | 0.961 | |
(Favourable)/unfavourable impact of derivatives designated as effective hedges for accounting purposes1 | | | - | | | | (0.001 | ) | | | (0.004 | ) | | | (0.005 | ) | | | (0.014 | ) | | | (0.024 | ) | | | (0.023 | ) |
| Average effective rate included in EBITDA | | | 1.020 | | | | 1.032 | | | | 1.011 | | | | 0.982 | | | | 0.948 | | | | 0.949 | | | | 0.938 | |
(Favourable)/unfavourable impact of derivatives, other than those designated as effective hedges for accounting purposes, included in other expenses2 | | | 0.023 | | | | (0.002 | ) | | | (0.011 | ) | | | (0.016 | ) | | | (0.019 | ) | | | 0.051 | | | | 0.004 | |
Foreign exchange (gain)/loss, on working capital balances, included in other expenses3 | | | (0.043 | ) | | | 0.006 | | | | 0.007 | | | | 0.010 | | | | 0.008 | | | | (0.029 | ) | | | 0.000 | |
Average effective rate in net earnings/(loss) before income taxes4 | | | 1.000 | | | | 1.036 | | | | 1.007 | | | | 0.976 | | | | 0.937 | | | | 0.971 | | | | 0.942 | |
| (In millions of dollars) | | | | | | | | | | | | | | | | | | | | | | | | | | | | |
| 1Favourable/(unfavourable) impact of derivatives designated as effective hedges for accounting purposes included in EBITDA | | $ | 0.2 | | | $ | 0.3 | | | $ | 0.9 | | | $ | 1.3 | | | $ | 3.8 | | | $ | 5.2 | | | $ | 4.9 | |
| 2Favourable/(unfavourable) impact of derivatives other than those designated as effective hedges for accounting purposes included in other expenses | | | (5.8 | ) | | | 0.3 | | | | 2.5 | | | | 4.2 | | | | 4.9 | | | | (11.3 | ) | | | (0.8 | ) |
| 3Foreign exchange gain/(loss) on working capital balances included in other expenses | | | 10.9 | | | | (1.2 | ) | | | (1.6 | ) | | | (2.5 | ) | | | (2.1 | ) | | | 6.2 | | | | (0.1 | ) |
| 4Excludes foreign exchange gain/(loss) on long term debt and $US interest expense | | | | | | | | | | | | | | | | | | | | | | | | | | | | |
4.CONTINGENT LIABILITIES
The company’s contingent liabilities at December 31, 2010 are described on page 43 of our 2010 Annual Report. For additional and updated information regarding the company’s contingent liabilities, refer to our interim consolidated financial statements for the three and nine months ended September 30, 2011 note 20, Contingent liabilities. An update to these contingencies is noted below:
In September, 2011, we settled the claim by Quebecor World (USA)’s (Quebecor) litigation trustee against us under the U.S. Bankruptcy Code seeking the return of approximately $18.8 million of alleged preferential payments made to us by Quebecor in the ordinary course of our trade relationship during the 90-day period preceding Quebecor’s Chapter 11 filing in 2007. The net amount payable by the Company in respect of the settlement was not material and is covered by our allowance for doubtful accounts.
| CATALYST PAPER 2011 THIRD QUARTER REPORT │ MANAGEMENT’S DISCUSSION AND ANALYSIS | | 21 |
5.SUMMARY OF QUARTERLY RESULTS
The following table highlights selected financial information for the eight consecutive quarters ending September 30, 2011:
| | | 2011 | | | 2010 | | | | 2009 | 1 |
(In millions of Canadian dollars, except per share amounts) | | | Q3 | | | | Q2 | | | | Q1 | | | | Q4 | | | | Q3 | | | | Q2 | | | | Q1 | | | | Q4 | |
| Sales | | $ | 340.3 | | | $ | 297.8 | | | $ | 303.6 | | | $ | 333.6 | | | $ | 322.3 | | | $ | 299.4 | | | $ | 273.3 | | | $ | 295.0 | |
EBITDA 2 | | | 26.8 | | | | (3.9 | ) | | | 15.9 | | | | 28.7 | | | | 34.2 | | | | (0.4 | ) | | | (16.2 | ) | | | 14.1 | |
| Net earnings (loss) attributable to the company | | | (205.7 | ) | | | (47.4 | ) | | | (12.9 | ) | | | 9.6 | | | | 6.0 | | | | (368.4 | ) | | | (44.1 | ) | | | (35.8 | ) |
| Net earnings (loss) per share attributable to the company’s common shareholders | | | | | | | | | | | | | | | | | | | | | | | | | | | | | | | | |
| - basic and diluted | | $ | (0.54 | ) | | $ | (0.13 | ) | | $ | (0.03 | ) | | $ | 0.02 | | | $ | 0.02 | | | $ | (0.96 | ) | | $ | (0.12 | ) | | $ | (0.09 | ) |
| 1 | Refer to section 8, Changes in accounting policies, for a discussion of the change in our policy with respect to classification of gains and losses on certain of our derivative financial instruments and translation of foreign currency-denominated working capital balances effective January 1, 2010. Prior period comparative information has been restated. |
| 2 | Refer to section 6, Non-GAAP measures. |
Refer to section 1, Overview and highlights, and the discussion on Consolidated results of operations, for details of Q3 results compared to Q2 2011.
For summary financial information about Powell River Energy Inc., a variable interest entity for which we are the primary beneficiary, refer to note 4, Variable interest entities, of our interim consolidated financial statements for the three and nine months ended September 30, 2011.
6.NON-GAAP MEASURES
Management uses certain measures that are not defined by U.S. GAAP to evaluate our performance and, as a result, the measures as employed by management may not be comparable to similarly titled measures reported by other entities. These non-GAAP measures should not be considered by an investor as an alternative to their nearest respective GAAP measure. Our non-GAAP measures include operating earnings (loss), EBITDA (earnings before interest, taxes, depreciation and amortization, impairment and other closure costs, and before other non-operating income and expenses), EBITDA before restructuring costs, EBITDA margin, EBITDA margin before restructuring costs, average delivered cash costs per tonne before specific items, net earnings (loss) attributable to the company before specific items, net earnings (loss) per share attributable to the company’s common shareholders before specific items, and free cash flow.
Specific items are items of an unusual or non-recurring nature, or items that are subject to material volatility based on factors outside of management’s control. Specific items include: foreign exchange gain or loss on long-term debt, gain or loss on cancellation of long-term debt, asset-impairment and other closure costs, restructuring costs, unusual non-recurring items, and certain income tax adjustments.
| CATALYST PAPER 2011 THIRD QUARTER REPORT │ MANAGEMENT’S DISCUSSION AND ANALYSIS | | 22 |
EBITDA AND EBITDA BEFORE RESTRUCTURING COSTS
EBITDA as defined equates to operating earnings (loss) plus depreciation and amortization and impairment and other closure costs. EBITDA margin and EBITDA margin before restructuring costs are defined as EBITDA and EBITDA before restructuring costs as a percentage of sales. These measures enable comparison of consolidated and segment operating results between periods without regard to debt service, income taxes, capital expenditure requirements, and specific items.
Reconciliation to Net Earnings (Loss) Attributable to the Company:
| | 2011 | | | 2010 | |
| (In millions of Canadian dollars) | YTD | | | | Q3 | | | | Q2 | | | | Q1 | | | Total | | | | Q4 | | | | Q3 | | | | Q2 | | | | Q1 | |
Net earnings (loss) attributable to the company | | $ | (266.0 | ) | | $ | (205.7 | ) | | $ | (47.4 | ) | | $ | (12.9 | ) | | $ | (396.9 | ) | | $ | 9.6 | | | $ | 6.0 | | | $ | (368.4 | ) | | $ | (44.1 | ) |
Net earnings (loss) attributable to non-controlling interest | | | (0.3 | ) | | | - | | | | (0.3 | ) | | | - | | | | (1.3 | ) | | | (0.6 | ) | | | (0.4 | ) | | | 0.3 | | | | (0.6 | ) |
Net earnings (loss) | | | (266.3 | ) | | | (205.7 | ) | | | (47.7 | ) | | | (12.9 | ) | | | (398.2 | ) | | | 9.0 | | | | 5.6 | | | | (368.1 | ) | | | (44.7 | ) |
Depreciation and amortization | | | 81.6 | | | | 27.8 | | | | 27.0 | | | | 26.8 | | | | 119.3 | | | | 27.2 | | | | 28.2 | | | | 31.2 | | | | 32.7 | |
Impairment (recovery) and other closure costs | | | 150.3 | | | | 150.6 | | | | (0.3 | ) | | | - | | | | 294.5 | | | | 1.3 | | | | 0.9 | | | | 292.3 | | | | - | |
Gain on cancellation of long-term debt | | | - | | | | - | | | | - | | | | - | | | | (0.6 | ) | | | - | | | | (0.6 | ) | | | - | | | | - | |
Foreign exchange (gain) loss on long-term debt | | | 23.7 | | | | 41.0 | | | | (5.1 | ) | | | (12.2 | ) | | | (27.6 | ) | | | (19.0 | ) | | | (16.3 | ) | | | 21.3 | | | | (13.6 | ) |
Loss on Snowflake fire | | | 4.1 | | | | - | | | | 4.1 | | | | - | | | | - | | | | - | | | | - | | | | - | | | | - | |
Loss on Powell River fire | | | 1.6 | | | | - | | | | 1.6 | | | | - | | | | - | | | | - | | | | - | | | | - | | | | - | |
Other (income) expense | | | (4.4 | ) | | | (5.6 | ) | | | 0.7 | | | | 0.5 | | | | 3.2 | | | | (2.4 | ) | | | (2.8 | ) | | | 4.9 | | | | 3.5 | |
Interest expense, net | | | 55.0 | | | | 19.0 | | | | 18.7 | | | | 17.3 | | | | 72.0 | | | | 18.2 | | | | 19.0 | | | | 18.0 | | | | 16.8 | |
Income tax expense (recovery) | | | (6.8 | ) | | | (0.3 | ) | | | (2.9 | ) | | | (3.6 | ) | | | (16.3 | ) | | | (5.6 | ) | | | 0.2 | | | | - | | | | (10.9 | ) |
EBITDA | | $ | 38.8 | | | $ | 26.8 | | | $ | (3.9 | ) | | $ | 15.9 | | | $ | 46.3 | | | $ | 28.7 | | | $ | 34.2 | | | $ | (0.4 | ) | | $ | (16.2 | ) |
Restructuring costs | | | | | | | | | | | | | | | | | | | | | | | | | | | | | | | | | | | | |
Specialty printing papers | | | - | | | | - | | | | - | | | | - | | | | 8.2 | | | | - | | | | 0.1 | | | | 3.3 | | | | 4.8 | |
Newsprint | | | - | | | | - | | | | - | | | | - | | | | 16.1 | | | | - | | | | 0.1 | | | | 7.5 | | | | 8.5 | |
Pulp | | | - | | | | - | | | | - | | | | - | | | | 1.0 | | | | - | | | | 0.1 | | | | 0.1 | | | | 0.8 | |
Total restructuring costs | | | - | | | | - | | | | - | | | | - | | | | 25.3 | | | | - | | | | 0.3 | | | | 10.9 | | | | 14.1 | |
EBITDA before restructuring costs | | $ | 38.8 | | | $ | 26.8 | | | $ | (3.9 | ) | | $ | 15.9 | | | $ | 71.6 | | | $ | 28.7 | | | $ | 34.5 | | | $ | 10.5 | | | $ | (2.1 | ) |
| CATALYST PAPER 2011 THIRD QUARTER REPORT │ MANAGEMENT’S DISCUSSION AND ANALYSIS | | 23 |
NET EARNINGS (LOSS) ATTRIBUTABLE TO THE COMPANY BEFORE SPECIFIC ITEMS
Specific items are defined previously, and the exclusion of such items from net earnings (loss) attributable to the company facilitates the comparison of financial results between periods.
Reconciliation to Net Earnings (Loss) Attributable to the Company:
| (In millions of Canadian dollars and after-taxes, except where otherwise stated) | 2011 | | 2010 |
| YTD | | | Q3 | | | Q2 | | | Q1 | | | Total | | | Q4 | | | Q3 | | | Q2 | | | Q1 | |
| Net earnings (loss) attributable | | | | | | | | | | | | | | | | | | | | | | | | | |
| to the company | | $ | (266.0 | ) | | $ | (205.7 | ) | | $ | (47.4 | ) | | $ | (12.9 | ) | | $ | (396.9 | ) | | $ | 9.6 | | | $ | 6.0 | | | $ | (368.4 | ) | | $ | (44.1 | ) |
Specific items: | | | | | | | | | | | | | | | | | | | | | | | | | | | | | | | | | | | | |
Gain on cancellation of long-term debt | | | - | | | | - | | | | - | | | | - | | | | (0.5 | ) | | | - | | | | (0.5 | ) | | | - | | | | - | |
Foreign exchange loss (gain) on long-term debt | | | 25.8 | | | | 41.0 | | | | (4.5 | ) | | | (10.7 | ) | | | (24.2 | ) | | | (17.5 | ) | | | (16.3 | ) | | | 21.3 | | | | (11.7 | ) |
Loss on Snowflake fire | | | 4.1 | | | | - | | | | 4.1 | | | | - | | | | - | | | | - | | | | - | | | | - | | | | - | |
Loss on Powell River fire | | | 1.2 | | | | - | | | | 1.2 | | | | - | | | | - | | | | - | | | | - | | | | - | | | | - | |
Impairment (recovery) and other closure costs | | | 150.3 | | | | 150.6 | | | | (0.3 | ) | | | - | | | | 291.4 | | | | (1.8 | ) | | | 0.9 | | | | 292.3 | | | | - | |
Restructuring costs | | | - | | | | - | | | | - | | | | - | | | | 21.3 | | | | - | | | | 0.3 | | | | 10.9 | | | | 10.1 | |
Notes exchange costs | | | - | | | | - | | | | - | | | | - | | | | 5.9 | | | | - | | | | - | | | | - | | | | 5.9 | |
Income tax adjustments | | | - | | | | - | | | | - | | | | - | | | | 16.0 | | | | 13.8 | | | | - | | | | - | | | | 2.2 | |
Net earnings (loss) attributable to the company before |
specific items | | $ | (84.6 | ) | | $ | (14.1 | ) | | $ | (46.9 | ) | | $ | (23.6 | ) | | $ | (87.0 | ) | | $ | 4.1 | | | $ | (9.6 | ) | | $ | (43.9 | ) | | $ | (37.6 | ) |
Net earnings (loss) per share attributable to the company’s common shareholders in dollars: | | | | | | | | | | | | | | | | | | | | | | | | | | | | | | | | | | |
| As reported | | $ | (0.70 | ) | | $ | (0.54 | ) | | $ | (0.13 | ) | | $ | (0.03 | ) | | $ | (1.04 | ) | | $ | 0.02 | | | $ | 0.02 | | | $ | (0.96 | ) | | $ | (0.12 | ) |
| Before specific items | | | (0.22 | ) | | | (0.04 | ) | | | (0.12 | ) | | | (0.06 | ) | | | (0.23 | ) | | | 0.01 | | | | (0.03 | ) | | | (0.11 | ) | | | (0.10 | ) |
| CATALYST PAPER 2011 THIRD QUARTER REPORT │ MANAGEMENT’S DISCUSSION AND ANALYSIS | | 24 |
FREE CASH FLOW
Free cash flow excludes working capital and certain other sources and uses of cash, which are disclosed in the consolidated statements of cash flows. This measure allows us to assess our ability to generate funds to repay debt and assists in cash flow forecasting.
Reconciliation to Cash Provided by Operating Activities less Cash Used by Investing Activities:
| | | 2011 | | | 2010 | |
| (In millions of Canadian dollars) | | YTD | | | | Q3 | | | | Q2 | | | | Q1 | | | Total | | | | Q4 | | | | Q3 | | | | Q2 | | | | Q1 | |
| Cash provided (used) by operating activities | | $ | (67.5 | ) | | $ | (38.8 | ) | | $ | (15.7 | ) | | $ | (13.0 | ) | | $ | (44.1 | ) | | $ | 16.0 | | | $ | (5.4 | ) | | $ | (24.9 | ) | | $ | (29.8 | ) |
| Cash provided (used) by investing activities | | | (12.7 | ) | | | (4.9 | ) | | | (5.2 | ) | | | (2.6 | ) | | | (4.5 | ) | | | (2.7 | ) | | | (3.4 | ) | | | (1.8 | ) | | | 3.4 | |
| Proceeds from the sale of property, plant and equipment and other assets | | | (0.8 | ) | | | (0.7 | ) | | | (0.1 | ) | | | - | | | | (7.9 | ) | | | (0.7 | ) | | | (0.2 | ) | | | (0.2 | ) | | | (6.8 | ) |
| Other investing activities | | | - | | | | - | | | | (0.3 | ) | | | 0.3 | | | | 1.2 | | | | 0.6 | | | | 1.2 | | | | (0.8 | ) | | | 0.2 | |
| Non-cash working capital changes except change in taxes and interest | | | 43.1 | | | | 50.2 | | | | (18.7 | ) | | | 11.6 | | | | 12.9 | | | | (9.5 | ) | | | 21.8 | | | | 10.1 | | | | (9.5 | ) |
| Other | | | 5.5 | | | | (4.4 | ) | | | 11.7 | | | | (1.8 | ) | | | 2.0 | | | | 3.4 | | | | (3.0 | ) | | | (4.3 | ) | | | 5.9 | |
| Free cash flow | | $ | (32.4 | ) | | $ | 1.4 | | | $ | (28.3 | ) | | $ | (5.5 | ) | | $ | (40.4 | ) | | $ | 7.1 | | | $ | 11.0 | | | $ | (21.9 | ) | | $ | (36.6 | ) |
Management’s Calculation of Free Cash Flow:
| | | 2011 | | | 2010 | |
| (In millions of Canadian dollars) | | YTD | | | | Q3 | | | | Q2 | | | | Q1 | | | Total | | | | Q4 | | | | Q3 | | | | Q2 | | | | Q1 | |
| EBITDA | | $ | 38.8 | | | $ | 26.8 | | | $ | (3.9 | ) | | $ | 15.9 | | | $ | 46.3 | | | $ | 28.7 | | | $ | 34.2 | | | $ | (0.4 | ) | | $ | (16.2 | ) |
| Interest expense, excluding amortization | | | (54.2 | ) | | | (19.0 | ) | | | (17.6 | ) | | | (17.6 | ) | | | (72.7 | ) | | | (18.5 | ) | | | (19.2 | ) | | | (18.5 | ) | | | (16.5 | ) |
| Capital expenditures | | | (13.5 | ) | | | (5.6 | ) | | | (5.6 | ) | | | (2.3 | ) | | | (11.2 | ) | | | (2.8 | ) | | | (2.4 | ) | | | (2.8 | ) | | | (3.2 | ) |
| Income taxes received (paid) | | | 0.1 | | | | 0.5 | | | | (0.1 | ) | | | (0.3 | ) | | | (0.4 | ) | | | (0.2 | ) | | | (0.4 | ) | | | 0.1 | | | | 0.1 | |
Employee future benefits, expense over (under) cash contributions 1 | | | (3.6 | ) | | | (1.3 | ) | | | (1.1 | ) | | | (1.2 | ) | | | (2.4 | ) | | | (0.1 | ) | | | (1.2 | ) | | | (0.3 | ) | | | (0.8 | ) |
| Free cash flow | | $ | (32.4 | ) | | $ | 1.4 | | | $ | (28.3 | ) | | $ | (5.5 | ) | | $ | (40.4 | ) | | $ | 7.1 | | | $ | 11.0 | | | $ | (21.9 | ) | | $ | (36.6 | ) |
| 1 | Free cash flow is adjusted to reflect the cash impact of employee future benefits rather than the accounting expense which is included in EBITDA. |
7.CRITICAL ACCOUNTING POLICIES AND ESTIMATES
The preparation of financial statements in conformity with U.S. GAAP requires companies to establish accounting policies and to make estimates that affect both the amount and timing of recording of assets, liabilities, revenues and expenses. Some of these estimates require judgments about matters that are inherently uncertain and actual results could differ from estimates.
On an ongoing basis, we review our estimates based upon currently available information. The discussion on the accounting policies that require management's most difficult, subjective and complex judgments, and which are subject to a fair degree of measurement uncertainty can be found on pages 51 to 54 of the company's 2010 Annual Report. There were no significant changes in Q3 2011.
| CATALYST PAPER 2011 THIRD QUARTER REPORT │ MANAGEMENT’S DISCUSSION AND ANALYSIS | | 25 |
8.CHANGES IN ACCOUNTING POLICIES
There were no new pronouncements issued by the Financial Accounting Standards Board (FASB) that impacted our consolidated financial statements in Q3 2011.
Effective January 1, 2010, we changed our policy on the classification of foreign exchange gains and losses on the ineffective portion of our derivative financial instruments, on the portion that is excluded from the assessment of hedge effectiveness, and on translation of monetary assets and liabilities denominated in foreign currencies. The respective foreign exchange gains and losses previously recognized in Sales are now recognized in Other income (expense). We continue to classify the effective portion of gains or losses on our currently designated U.S. dollar revenue risk management instruments in Sales, the same income statement line item in which the hedged item is classified.
In addition, we changed our policy on the classification of changes in the fair value of all derivative commodity swap agreements not designated as hedges for accounting purposes that were previously recognized in Sales and Cost of sales, excluding depreciation and amortization. The changes in the fair value related to these instruments are now recognized in Other income (expense).
| 9. | | IMPACT OF ACCOUNTING PRONOUNCEMENTS AFFECTING FUTURE PERIODS |
There were no new pronouncements issued by the FASB that may impact our consolidated financial statements for future periods.
10.RISKS AND UNCERTAINTIES
We face risks and uncertainties which fall into the general business areas of markets, international commodity prices, currency exchange rates, environmental issues, fibre supply, government regulation and policy, and for Canadian companies, trade barriers and potential impacts of aboriginal rights, including unresolved aboriginal land claims in B.C.
In order to address these risks and effectively manage them, we have developed a process for managing risk and the interrelationship between risks and our strategic plan. We provide regular updates to the Audit Committee, work with corporate and operational management to identify, measure, and prioritize the critical risks facing the company, and manage these risks by ensuring that they are adequately addressed through mitigating procedures where appropriate. The objectives of the risk-management function include developing a common framework for understanding what constitutes principal business risks, ensuring that risk management activities are aligned with business strategies, and providing an effective mechanism for governance in the area of risk management.
A description of our risks and uncertainties can be found on pages 55 to 61 of our 2010 Annual Report. Our update as of November 14, 2011 can be found below:
Long-term debt
The company’s debt of $840.1 million at September 30, 2011 as compared to $783.9 million at December 31, 2010 is summarized in note 11, Long-term debt, of our interim consolidated financial statements for the three and nine months ended September 30, 2011. A description of our risks and uncertainties at December 31, 2010 referenced our total debt or our individual debt instruments as of that date and are summarized in our consolidated financial statements for the year ended December 31, 2010 in note 14, Long-term debt. These risks and uncertainties also apply to the total debt and the individual debt instruments outstanding at September 30, 2011. These risks and uncertainties include those under the following headings in our 2010 Annual Report: Our substantial debt may impair our financial and operating flexibility; We are subject to exchange rate fluctuations; and, A change in our legal control could be materially adverse.
| CATALYST PAPER 2011 THIRD QUARTER REPORT │ MANAGEMENT’S DISCUSSION AND ANALYSIS | | 26 |
The company has withheld payment of a portion of the assessed property taxes
With the payment of all of our outstanding 2010 property taxes and applicable penalties and interest to North Cowichan, the risk and uncertainties associated with the non-payment of the 2010 property taxes to North Cowichan identified under this heading in the Risks and Uncertainties section of our 2010 Annual Report are no longer applicable.
We do however owe $0.4 million, including the 10% penalty for late payment, for unpaid 2011 property taxes in dispute related to North Cowichan as at November 14, 2011. Therefore the risks and uncertainties associated with non-payment of 2011 property taxes are the same as those identified in the Risk and Uncertainties section of our 2010 Annual Report with respect to the non-payment of 2010 property taxes. If any 2011 taxes remain unpaid on September 26, 2013, the municipality must proceed to a tax sale but, in that event, we would have until September 26, 2014 to redeem the property by paying all outstanding taxes, penalties, and interest to the date of redemption.
On October 18, 2011, the Supreme Court of Canada heard our appeal on the 2009 property taxes of North Cowichan. A decision is anticipated in six to twelve months.
Our substantial debt may impair our financial and operating flexibility
As of September 30, 2011, we had $727.3 million of outstanding recourse debt on a consolidated basis, excluding non-recourse debt of $113.8 million owed by PREI.
Our ABL facility, which had excess availability of $108.1 million and a withdrawn credit balance of $31.5 million on September 30, 2011, is subject to a financial covenant to maintain a minimum fixed charge coverage ratio of 1.1/1.0, which comes into effect if excess availability under the ABL Facility falls below $22 million.
As discussed in the Overview, the company is reviewing alternatives regarding both its 7.375% unsecured senior notes due 2014 and its 11.0% senior secured notes due 2016. Should we be unable to implement appropriate alternatives to reduce our indebtedness, our level of debt, substantial debt service requirements, and the terms and conditions of our debt agreements could negatively impact our financial condition, operating results and business.
Labour disruptions could have a negative impact on our business
The collective agreement with the United Transportation Union covering 3 hourly employees at Apache Railway expires at the end of 2011. The collective agreement with the Christian Labour Association of Canada covering our hourly employees at our Surrey Distribution Center expires March 31, 2012. The collective agreements with the Communications, Energy and Paperworkers Union (CEP) and the Pulp and Paper Workers of Canada at our Crofton and Powell River mills expire on April 30, 2012. Agreements with the CEP at Port Alberni expire April 30 2013. We do not anticipate labour disruptions in our operations in 2011.
The company is subject to significant environmental regulation
It was expected that the Province of B.C. would issue regulations in Q2, 2011 for its previously announced cap and trade program for greenhouse gases (GHGs). These regulations were not issued in Q2, 2011 and it is now expected that implementation of cap and trade will be delayed until 2012 or 2013. It is too early to determine the impact on the company under a cap and trade program. Under a worst case scenario, the increased costs to the company could be approximately $2 million per year beginning in 2012 and increasing to $9 million per year in 2020.
The U.S. Environmental Protection Agency (EPA) published the Maximum Achievable Control Technology (MACT) rules for industrial boilers on March 20, 2011. This is a program that sets emission limits for stationary industrial boilers and process heaters. The standards address numerous pollutants and have suggested considerable reductions in emission limits. The EPA has asked the Federal Courts for additional time to further evaluate the standards which are required in order to meet legal obligations under the Clean Air Act. The current timetable allows for comments to be submitted by October 31, 2011 and the final standards to be issued by April 2012. A preliminary impact assessment of these rules and potential future changes to Snowflake’s emission control requirements has been completed with estimated costs in the $8 million to $10 million range.
| CATALYST PAPER 2011 THIRD QUARTER REPORT │ MANAGEMENT’S DISCUSSION AND ANALYSIS | | 27 |
Elimination of British Columbia Harmonized Sales Tax will negatively impact our future financial results
Elections B.C. confirmed the elimination of the British Columbia Harmonized Sales Tax. The Province will revert back to the previous provincial sales tax regime on a date no earlier than April 1, 2013, and we estimate that the additional annualized cost to our business from that date onward will be approximately $10.5 million, based on actual 2011 annualized expenditures.
11.SENSITIVITY ANALYSIS
Our earnings are sensitive to fluctuations in product prices, foreign exchange, energy and fibre costs as described on pages 62 to 63 of our 2010 Annual Report and summarized in the following table:
| (In millions of Canadian dollars, except per share amounts) | EBITDA1 | Net Earnings2 | Earnings per Share |
Product prices 3 | | | |
| A US$10 per tonne change in the sales price of: | | | |
| Specialty printing papers | | $ | 9 | | | $ | 7 | | | $ | 0.02 | |
| Newsprint | | | 5 | | | | 4 | | | | 0.01 | |
| Pulp | | | 4 | | | | 3 | | | | 0.01 | |
Foreign exchange 4 | | | | | | | | | | | | |
| A US$0.01 change in the U.S. dollar relative to the Canadian dollar | | | 7 | | | | 5 | | | | 0.01 | |
Energy cost sensitivity 5 | | | | | | | | | | | | |
| A 5% change in the price of: | | | | | | | | | | | | |
| Natural gas and oil - direct purchases | | | 1 | | | | 1 | | | | 0.00 | |
| Electricity - direct purchases | | | 6 | | | | 5 | | | | 0.01 | |
| Coal | | | 1 | | | | 1 | | | | 0.00 | |
| Freight cost sensitivity | | | | | | | | | | | | |
| A US$5/bbl change in the price of West Texas Int. (WTI) Oil | | | 3 | | | | 2 | | | | 0.01 | |
Fibre sensitivity 5 | | | | | | | | | | | | |
| A US$5 per unit change in the price of: | | | | | | | | | | | | |
| Wood chips (Bdt) | | | 8 | | | | 6 | | | | 0.02 | |
| ONP (ST) | | | 2 | | | | 1 | | | | 0.00 | |
| 1 | Refer to section 6, Non-GAAP measures. |
| 2 | Based on an expected tax rate of 25%. |
| 3 | Based on annualized sales of Q3 2011 and foreign exchange rate of US$1.02 |
| 4 | Based on Q3 2011 annualized net cash flows and a movement to US$1.03 from US$1.02 and excluding our hedging program and the impact of the translation of U.S. dollar-denominated debt. |
| 5 | Based on Q3 2011 annualized consumption levels and an exchange rate of US$1.02. |
| CATALYST PAPER 2011 THIRD QUARTER REPORT │ MANAGEMENT’S DISCUSSION AND ANALYSIS | | 28 |
12.OUTLOOK
Economy
The weaker global economy and debt issues in Europe and North America have created significant currency and commodity volatility. The U.S. economy is expected to continue its slow recovery in Q4 although the rate of growth will depend on consumer spending, consumer confidence and employment recovery. U.S. housing markets and consumer debt remain risks to the U.S. economy. Continued volatility of the Canadian dollar may significantly impact our operating and net earnings, as well as cash flow and liquidity in Q4.
Markets
Underlying demand for print advertising continues to be challenging. Newsprint and directory demand will continue to be negatively affected by declining circulation, ongoing conservation and migration to electronic media. Demand for coated and uncoated mechanical is expected to remain steady in the seasonally strong Q4 period before slowing in the first half of 2012. We announced a US$30 per short ton price increase for our high bright grades effective October 1, 2011. Newsprint pricing will depend on the supply and demand balance in Q4.
Demand for NBSK pulp is expected to slow in Q4 and prices are expected to be under significant pressure during the quarter due to a slowdown in Chinese buying and an increase in global pulp inventories.
Operations
Price pressure is expected on commodity inputs, including fossil fuel, power, fibre and some chemicals. Lower demand from China for recycled paper is expected to reduce the price pressure on ONP in Q4. ONP prices for November are expected to be US$45 per ton lower based on the recent Official Board Markets publication. This is expected to improve the cost structure of the Snowflake mill in the short-term.
We expect maintenance costs to increase in Q4 compared to Q3 as we will have a boiler outage at our Port Alberni mill and a 12-day pulp shut on the RDH pulp line and recovery boiler #4 during the quarter. Pulp costs in Q4 should be similar to Q1 which had a shutdown on the other pulp line and recovery boiler.
The Crofton No. 1 paper machine will continue to be indefinitely curtailed in Q4 representing approximately 35,300 tonnes of newsprint at our Crofton mill, or 23% of our newsprint capacity.
Capital spending in 2011, net of credits received through the Pulp and Paper Green Transformation Program, is forecasted to be approximately $20 million. Capital projects that qualified for funding through the utilization of the Green Transformation Program were approved by the federal government in Q1, and we expect that the majority of the expenditures will be incurred in 2011 and are expected to result in annual EBITDA of $5.0 million starting in 2012.
Liquidity, Debt Maturities and Covenants
We currently do not anticipate any significant use of cash in Q4 other than for our operations, scheduled interest payments, pension plan funding and working capital fluctuations.
The company has applied for a further extension for funding relief in respect of the solvency deficit under the company sponsored defined benefit pension plans. The funding relief would extend the time period required in order to fund the solvency deficit under these plans. If the company’s request for funding relief is not accepted, an incremental contribution of up to $9 million will be required in Q4 2011 for the first three quarters of 2011 in respect of the solvency deficit under these pension plans.
The company believes that its capital structure is too highly leveraged given current business and economic conditions. As discussed in the Overview, the company is reviewing alternatives regarding both its 7.375% unsecured senior notes due 2014 and its 11.0% senior secured notes due 2016 and expects to incur additional advisory and legal costs in Q4 in connection with its recapitalization efforts. If the company is unable to implement appropriate alternatives to reduce its indebtedness, its level of debt, substantial debt service requirements, and the terms and conditions of its debt agreements could negatively impact its financial condition, operating results and business.
2011 Key Objectives
We remain focused on reducing our cost base, conserving cash, and improving our product mix. Our progress to-date on our key priorities for 2011 is provided in section 1, Overview and highlights, and these remain the main focus moving forward.
| CATALYST PAPER 2011 THIRD QUARTER REPORT │ MANAGEMENT’S DISCUSSION AND ANALYSIS | | 29 |
| 13. | DISCLOSURE CONTROLS AND INTERNAL CONTROL OVER FINANCIAL REPORTING |
A summary of our regulatory requirements for the evaluation of internal controls and subsequent reporting of the results of that evaluation can be found on page 65 of our 2010 Annual Report. Based on an evaluation of the design and operation of the company’s disclosure controls and procedures conducted under the supervision and with the participation of management, our chief executive officer and chief financial officer concluded that such disclosure controls and procedures (as defined in Canada under National Instrument 52-109 and in Rules 13a-15(e) and 15d-15(e) under the United States Securities Exchange Act of 1934), were effective as at December 31, 2010.
We did not make any significant changes in internal controls over financial reporting during the most recent three month and nine month periods ended September 30, 2011 that have materially affected, or are reasonably likely to materially affect, our internal control over financial reporting. Management has limited the scope of the design and maintenance of adequate disclosure controls and procedures and internal control over financial reporting to exclude controls, policies and procedures of Powell River Energy Inc., a variable interest entity in which we are the primary beneficiary.
The company's Audit Committee, as part of its oversight role, has reviewed and recommended the approval of this MD&A to the Board of directors. The Board of directors has read and approved this MD&A.
| CATALYST PAPER 2011 THIRD QUARTER REPORT │ MANAGEMENT’S DISCUSSION AND ANALYSIS | | 30 |
CONSOLIDATED BALANCE SHEETS
| | | September 30, | | | December 31, | |
| (In millions of Canadian dollars) | | 2011 | | | 2010 | |
| | | (unaudited) | | | | |
Assets Current assets | | | | | | |
| Cash and cash equivalents | | $ | 17.8 | | | $ | 95.4 | |
| Accounts receivable (note 5) | | | 156.0 | | | | 120.6 | |
| Inventories (note 6) | | | 142.4 | | | | 139.9 | |
| Prepaids and other (note 7) | | | 24.5 | | | | 27.7 | |
| | | | 340.7 | | | | 383.6 | |
| Property, plant and equipment (note 8) | | | 1,082.9 | | | | 1,285.6 | |
| Other assets (note 9) | | | 26.6 | | | | 27.0 | |
| | | $ | 1,450.2 | | | $ | 1,696.2 | |
Liabilities Current liabilities | | | | | | | | |
| Accounts payable and accrued liabilities (note 10) | | $ | 177.7 | | | $ | 171.6 | |
| Current portion of long-term debt (note 11) | | | 1.0 | | | | 27.0 | |
| | | | 178.7 | | | | 198.6 | |
| Long-term debt (note 11) | | | 840.1 | | | | 783.9 | |
| Employee future benefits (note 12) | | | 263.9 | | | | 269.1 | |
| Other long-term obligations | | | 17.9 | | | | 20.2 | |
| Future income taxes | | | 4.4 | | | | 11.4 | |
| Deferred credits | | | 9.6 | | | | 9.6 | |
| | | | 1,314.6 | | | | 1,292.8 | |
| Equity | | | | | | | | |
| Shareholders’ equity | | | | | | | | |
Common stock:no par value; unlimited shares authorized; issued and outstanding: 381,900,450 shares (December 31, 2010 - 381,753,490 shares) | | | 1,035.2 | | | | 1,035.0 | |
Preferred stock:par value determined at time of issue; authorized 100,000,000 shares; issued and outstanding: nil shares | | | - | | | | - | |
| Additional paid-in capital | | | 16.6 | | | | 16.6 | |
| Deficit | | | (848.0 | ) | | | (582.0 | ) |
| Accumulated other comprehensive loss (note 13) | | | (47.2 | ) | | | (46.1 | ) |
| | | | 156.6 | | | | 423.5 | |
| Non-controlling interest (deficit) (note 4) | | | (21.0 | ) | | | (20.1 | ) |
| | | | 135.6 | | | | 403.4 | |
| | | $ | 1,450.2 | | | $ | 1,696.2 | |
Contingent liabilities (note 20)
The accompanying notes are an integral part of the consolidated financial statements.
| On behalf of the Board: | |
| |
| | |
| Kevin J. Clarke | Thomas S. Chambers |
| Director | Director |
| CATALYST PAPER 2011 THIRD QUARTER REPORT │ MANAGEMENT’S DISCUSSION AND ANALYSIS | | 31 |
CONSOLIDATED STATEMENTS OF EARNINGS (LOSS)
| | | Three months ended September 30 | | | Nine months ended September 30 | |
| (Unaudited and in millions of Canadian dollars, except where otherwise stated) | | 2011 | | | 2010 | | | 2011 | | | 2010 | |
| Sales | | $ | 340.3 | | | $ | 322.3 | | | $ | 941.7 | | | $ | 895.0 | |
| Operating expenses | | | | | | | | | | | | | | | | |
| Cost of sales, excluding depreciation and amortization | | | 304.1 | | | | 277.1 | | | | 874.1 | | | | 820.6 | |
| Depreciation and amortization | | | 27.8 | | | | 28.2 | | | | 81.6 | | | | 92.1 | |
| Selling, general and administrative | | | 9.4 | | | | 10.7 | | | | 28.8 | | | | 31.5 | |
| Restructuring (note 14) | | | – | | | | 0.3 | | | | – | | | | 25.3 | |
| Impairment and other closure costs (note 15) | | | 150.6 | | | | 0.9 | | | | 150.3 | | | | 293.2 | |
| | | | 491.9 | | | | 317.2 | | | | 1,134.8 | | | | 1,262.7 | |
| Operating earnings (loss) | | | (151.6 | ) | | | 5.1 | | | | (193.1 | ) | | | (367.7 | ) |
| Interest expense, net | | | (19.0 | ) | | | (19.0 | ) | | | (55.0 | ) | | | (53.8 | ) |
| Foreign exchange gain (loss) on long-term debt | | | (41.0 | ) | | | 16.3 | | | | (23.7 | ) | | | 8.6 | |
| Other income (expense) (note 16) | | | 5.6 | | | | 3.4 | | | | (1.3 | ) | | | (5.0 | ) |
| Earnings (loss) before income taxes | | | (206.0 | ) | | | 5.8 | | | | (273.1 | ) | | | (417.9 | ) |
| Income tax expense (recovery) (note 17) | | | (0.3 | ) | | | 0.2 | | | | (6.8 | ) | | | (10.7 | ) |
| Net earnings (loss) | | | (205.7 | ) | | | 5.6 | | | | (266.3 | ) | | | (407.2 | ) |
| Net loss attributable to non-controlling interest | | | – | | | | 0.4 | | | | 0.3 | | | | 0.7 | |
| Net earnings (loss) attributable to the company | | $ | (205.7 | ) | | $ | 6.0 | | | $ | (266.0 | ) | | $ | (406.5 | ) |
| Basic and diluted net earnings (loss) per share attributable to the company’s common shareholders (in dollars) | | $ | (0.54 | ) | | $ | 0.02 | | | $ | (0.70 | ) | | $ | (1.06 | ) |
| Weighted average number of company common shares outstanding (in millions) | | | 381.9 | | | | 381.8 | | | | 381.8 | | | | 381.8 | |
The accompanying notes are an integral part of the consolidated financial statements.
| CATALYST PAPER 2011 THIRD QUARTER REPORT │ MANAGEMENT’S DISCUSSION AND ANALYSIS | | 32 |
CONSOLIDATED STATEMENTS OF COMPREHENSIVE INCOME (LOSS)
| | | Three months ended September 30 | | | Nine months ended September 30 | |
| (Unaudited and in millions of Canadian dollars) | | 2011 | | | 2010 | | | 2011 | | | 2010 | |
| Net earnings (loss) | | $ | (205.7 | ) | | $ | 5.6 | | | $ | (266.3 | ) | | $ | (407.2 | ) |
| Other comprehensive income (loss), net of tax (expense) recovery: | | | | | | | | | | | | | | | | |
| Employee future benefits liability adjustment | | | | | | | | | | | | | | | | |
| Gross amount | | | – | | | | – | | | | – | | | | 31.0 | |
| Tax (expense) recovery | | | – | | | | – | | | | – | | | | (7.7 | ) |
| Net amount | | | – | | | | – | | | | – | | | | 23.3 | |
| Reclassification of amortization of employee future benefits | | | | | | | | | | | | | | | | |
| Gross amount | | | 0.6 | | | | 0.8 | | | | 1.8 | | | | 2.3 | |
| Tax (expense) recovery | | | (0.2 | ) | | | (0.3 | ) | | | (0.5 | ) | | | (0.8 | ) |
| Net amount | | | 0.4 | | | | 0.5 | | | | 1.3 | | | | 1.5 | |
| Unrealized net gain on cash flow revenue hedges | | | | | | | | | | | | | | | | |
| Gross amount | | | – | | | | – | | | | – | | | | 5.8 | |
| Tax (expense) recovery | | | – | | | | – | | | | – | | | | (1.6 | ) |
| Net amount | | | – | | | | – | | | | – | | | | 4.2 | |
| Reclassification of net (gain) loss on cash flow revenue hedges | | | | | | | | | | | | | | | | |
| Gross amount | | | (0.2 | ) | | | (3.8 | ) | | | (1.4 | ) | | | (13.9 | ) |
| Tax (expense) recovery | | | 0.1 | | | | 1.0 | | | | 0.4 | | | | 3.9 | |
| Net amount | | | (0.1 | ) | | | (2.8 | ) | | | (1.0 | ) | | | (10.0 | ) |
Foreign currency translation adjustments, net of related hedging activities | | | | | | | | | | | | | | | | |
| Gross amount | | | (0.8 | ) | | | (0.1 | ) | | | (1.9 | ) | | | (0.2 | ) |
| Tax (expense) recovery | | | 0.9 | | | | (0.6 | ) | | | 0.5 | | | | (0.5 | ) |
| Net amount | | | 0.1 | | | | (0.7 | ) | | | (1.4 | ) | | | (0.7 | ) |
| Unrealized gain (loss) on interest rate hedges | | | | | | | | | | | | | | | | |
| Gross amount | | | – | | | | 0.1 | | | | – | | | | 0.2 | |
| Tax (expense) recovery | | | – | | | | – | | | | – | | | | – | |
| Net amount | | | – | | | | 0.1 | | | | – | | | | 0.2 | |
| Other comprehensive income (loss), net of taxes | | | 0.4 | | | | (2.9 | ) | | | (1.1 | ) | | | 18.5 | |
| Total comprehensive income (loss) | | | (205.3 | ) | | | 2.7 | | | | (267.4 | ) | | | (388.7 | ) |
| Comprehensive loss attributable to non-controlling interest: | | | | | | | | | | | | | | | | |
| Net loss | | | – | | | | 0.4 | | | | 0.3 | | | | 0.7 | |
| Other comprehensive income, net of taxes | | | – | | | | – | | | | – | | | | (0.1 | ) |
| Comprehensive loss attributable to non-controlling interest | | | – | | | | 0.4 | | | | 0.3 | | | | 0.6 | |
| Comprehensive income (loss) attributable to the company | | $ | (205.3 | ) | | $ | 3.1 | | | $ | (267.1 | ) | | $ | (388.1 | ) |
The accompanying notes are an integral part of the consolidated financial statements.
| CATALYST PAPER 2011 THIRD QUARTER REPORT │ MANAGEMENT’S DISCUSSION AND ANALYSIS | | 33 |
CONSOLIDATED STATEMENTS OF EQUITY
| | | Equity attributable to the Company | | | | | | | |
| | | Common stock | | | | | | | | | | | | | | | | |
| (In millions of Canadian dollars) | | Number of shares | | | $ | | | Additional paid-in capital | | | Retained earnings (deficit) | | | Accumulated other comprehensive income (loss) | | | Non-controlling interest (deficit) | | | Total | |
| | | | | | | | | | | | | | | | | | | | | | |
| Balance as at December 31, 2009 | | | 381,753,490 | | | $ | 1,035.0 | | | $ | 16.4 | | | $ | (185.1 | ) | | $ | (52.7 | ) | | $ | (18.0 | ) | | $ | 795.6 | |
| Stock option compensation expense | | | – | | | | – | | | | 0.2 | | | | – | | | | – | | | | – | | | | 0.2 | |
| Net loss | | | – | | | | – | | | | – | | | | (396.9 | ) | | | – | | | | (1.3 | ) | | | (398.2 | ) |
| Distributions to non-controlling interest | | | – | | | | – | | | | – | | | | – | | | | – | | | | (0.9 | ) | | | (0.9 | ) |
| Other comprehensive income, net of tax | | | – | | | | – | | | | – | | | | – | | | | 6.6 | | | | 0.1 | | | | 6.7 | |
| Balance as at December 31, 2010 | | | 381,753,490 | | | $ | 1,035.0 | | | $ | 16.6 | | | $ | (582.0 | ) | | $ | (46.1 | ) | | $ | (20.1 | ) | | $ | 403.4 | |
| | | | | | | | | | | | | | | | | | | | | | | | | | | | | |
| Common shares issued | | | 146,960 | | | | 0.2 | | | | – | | | | – | | | | – | | | | – | | | | 0.2 | |
| Stock option compensation expense | | | – | | | | – | | | | – | | | | – | | | | – | | | | – | | | | – | |
| Net loss | | | – | | | | – | | | | – | | | | (266.0 | ) | | | – | | | | (0.3 | ) | | | (266.3 | ) |
| Distributions to non-controlling interest | | | – | | | | – | | | | – | | | | – | | | | – | | | | (0.6 | ) | | | (0.6 | ) |
| Other comprehensive loss, net of tax | | | – | | | | – | | | | – | | | | – | | | | (1.1 | ) | | | – | | | | (1.1 | ) |
| Balance as at September 30, 2011 (unaudited) | | | 381,900,450 | | | $ | 1,035.2 | | | $ | 16.6 | | | $ | (848.0 | ) | | $ | (47.2 | ) | | $ | (21.0 | ) | | $ | 135.6 | |
The accompanying notes are an integral part of the consolidated financial statements.
| CATALYST PAPER 2011 THIRD QUARTER REPORT │ MANAGEMENT’S DISCUSSION AND ANALYSIS | | 34 |
CONSOLIDATED STATEMENTS OF CASH FLOWS
| | | Three months ended September 30 | | | Nine months ended September 30 | |
(Unaudited and in millions of Canadian dollars) | | 2011 | | | 2010 | | | | 2011 | | | 2010 | |
| Cash flows provided (used) by: | | | | | | | | | | | | | |
| | | | | | | | | | | | | | |
| Operations | | | | | | | | | | | | | |
| Net earnings (loss) | | $ | (205.7 | ) | | $ | 5.6 | | | | $ | (266.3 | ) | | $ | (407.2 | ) |
| Items not requiring (providing) cash | | | | | | | | | | | | | | | | | |
| Depreciation and amortization | | | 27.8 | | | | 28.2 | | | | | 81.6 | | | | 92.1 | |
| Impairment and other closure costs (note 15) | | | 150.6 | | | | 0.9 | | | | | 150.3 | | | | 293.2 | |
| Future income taxes | | | (0.5 | ) | | | – | | | | | (6.9 | ) | | | (10.9 | ) |
| Foreign exchange (gain) loss on long-term debt | | | 41.0 | | | | (16.3 | ) | | | | 23.7 | | | | (8.6 | ) |
| Gain on cancellation of long-term debt | | | – | | | | (0.6 | ) | | | | – | | | | (0.6 | ) |
| Employee future benefits, expense over (under) cash contributions | | | (1.3 | ) | | | (1.2 | ) | | | | (3.6 | ) | | | (2.3 | ) |
| Decrease in other long-term obligations | | | (1.6 | ) | | | (1.0 | ) | | | | (2.9 | ) | | | (3.1 | ) |
| Gain on disposal of property, plant and equipment | | | (0.2 | ) | | | (0.5 | ) | | | | (0.1 | ) | | | (6.5 | ) |
| Other | | | (4.4 | ) | | | (3.8 | ) | | | | (6.0 | ) | | | 10.2 | |
| Changes in non-cash working capital | | | | | | | | | | | | | | | | | |
| Accounts receivable | | | (37.5 | ) | | | (1.9 | ) | | | | (35.4 | ) | | | (14.8 | ) |
| Inventories | | | 1.7 | | | | 0.6 | | | | | (12.6 | ) | | | 12.6 | |
| Prepaids and other | | | (0.3 | ) | | | (7.1 | ) | | | | 3.1 | | | | (4.6 | ) |
| Accounts payable and accrued liabilities | | | (8.4 | ) | | | (8.3 | ) | | | | 7.6 | | | | (9.6 | ) |
| Cash flows used by operations | | | (38.8 | ) | | | (5.4 | ) | | | | (67.5 | ) | | | (60.1 | ) |
| Investing | | | | | | | | | | | | | | | | | |
| Additions to property, plant and equipment | | | (5.6 | ) | | | (2.4 | ) | | | | (13.5 | ) | | | (8.4 | ) |
| Proceeds from sale of property, plant and equipment | | | 0.7 | | | | 0.2 | | | | | 0.8 | | | | 7.2 | |
| Increase in other assets | | | – | | | | (1.2 | ) | | | | – | | | | (0.6 | ) |
| Cash flows used by investing activities | | | (4.9 | ) | | | (3.4 | ) | | | | (12.7 | ) | | | (1.8 | ) |
| Financing | | | | | | | | | | | | | | | | | |
| Increase (decrease) in revolving loan and loan payable | | | 31.5 | | | | – | | | | | 31.5 | | | | (14.5 | ) |
| Redemption of senior notes (note 11) | | | – | | | | – | | | | | (25.8 | ) | | | – | |
| Proceeds on issuance of Class B senior secured notes (note 11) | | | – | | | | – | | | | | – | | | | 98.4 | |
| Deferred financing costs | | | 0.1 | | | | (0.2 | ) | | | | (2.4 | ) | | | (4.5 | ) |
| Note exchange costs | | | – | | | | – | | | | | – | | | | (8.3 | ) |
| Settlement on purchase of debt securities | | | – | | | | (9.2 | ) | | | | – | | | | (9.2 | ) |
| Decrease in other long-term debt | | | (0.3 | ) | | | (0.3 | ) | | | | (0.7 | ) | | | (0.8 | ) |
| Cash flows provided (used) by financing activities | | $ | 31.3 | | | $ | (9.7 | ) | | | $ | 2.6 | | | $ | 61.1 | |
| Cash and cash equivalents, decrease in the period | | | (12.4 | ) | | | (18.5 | ) | | | | (77.6 | ) | | | (0.8 | ) |
| Cash and cash equivalents, beginning of the period | | | 30.2 | | | | 100.8 | | | | | 95.4 | | | | 83.1 | |
| Cash and cash equivalents, end of the period | | $ | 17.8 | | | $ | 82.3 | | | | $ | 17.8 | | | $ | 82.3 | |
| Supplemental disclosures: | | | | | | | | | | | | | | | | | |
| Income taxes paid (received) | | $ | (0.5 | ) | | $ | 0.4 | | | | $ | (0.1 | ) | | $ | 0.2 | |
| Net interest paid | | | 19.0 | | | | 14.2 | | | | | 54.2 | | | | 49.4 | |
| Non-cash exchange of 8.625% senior notes | | | – | | | | – | | | | | – | | | | (327.1 | ) |
| Non-cash issuance of 11.0% senior notes | | | – | | | | – | | | | | – | | | | 287.2 | |
| Non-cash difference in carrying value of senior notes on modification | | | – | | | | – | | | | | – | | | | 39.9 | |
The accompanying notes are an integral part of the consolidated financial statements.
| CATALYST PAPER 2011 THIRD QUARTER REPORT │ MANAGEMENT’S DISCUSSION AND ANALYSIS | | 35 |
CONSOLIDATED BUSINESS SEGMENTS
(Unaudited and in millions of Canadian dollars)
| Three months ended September 30, 2011 | | Specialty Printing Papers | | | Newsprint | | | Pulp | | | Corporate Adjustments | | | Total | |
| Sales to external customers | | $ | 187.9 | | | $ | 77.0 | | | $ | 75.4 | | | $ | – | | | $ | 340.3 | |
| Inter-segment sales | | | – | | | | – | | | | 9.8 | | | | (9.8 | ) | | | – | |
| Depreciation and amortization | | | 19.6 | | | | 4.1 | | | | 4.1 | | | | – | | | | 27.8 | |
| Impairment and other closure costs (note 15) | | | 19.7 | | | | 130.9 | | | | – | | | | – | | | | 150.6 | |
| Operating earnings (loss) | | | (26.7 | ) | | | (136.4 | ) | | | 11.5 | | | | – | | | | (151.6 | ) |
| Additions to property, plant and equipment | | | 2.9 | | | | 1.1 | | | | 1.6 | | | | – | | | | 5.6 | |
| Three months ended September 30, 2010 | | | | | | | | | | | | | | | |
| Sales to external customers | | $ | 181.8 | | | $ | 79.7 | | | $ | 60.8 | | | $ | – | | | $ | 322.3 | |
| Inter-segment sales | | | – | | | | – | | | | 7.4 | | | | (7.4 | ) | | | – | |
| Depreciation and amortization | | | 20.8 | | | | 3.7 | | | | 3.7 | | | | – | | | | 28.2 | |
| Restructuring | | | 0.1 | | | | 0.1 | | | | 0.1 | | | | – | | | | 0.3 | |
| Impairment and other closure costs (note 15) | | | 0.5 | | | | 0.4 | | | | – | | | | – | | | | 0.9 | |
| Operating earnings (loss) | | | (1.8 | ) | | | (1.1 | ) | | | 8.0 | | | | – | | | | 5.1 | |
| Additions to property, plant and equipment | | | 1.7 | | | | 0.7 | | | | – | | | | – | | | | 2.4 | |
| Nine months ended September 30, 2011 | | Specialty Printing Papers | | | Newsprint | | | Pulp | | | Corporate Adjustments | | | Total | |
| Sales to external customers | | $ | 515.9 | | | $ | 223.9 | | | $ | 201.9 | | | $ | – | | | $ | 941.7 | |
| Inter-segment sales | | | – | | | | – | | | | 28.6 | | | | (28.6 | ) | | | – | |
| Depreciation and amortization | | | 56.9 | | | | 13.3 | | | | 11.4 | | | | – | | | | 81.6 | |
| Impairment and other closure costs (note 15) | | | 19.6 | | | | 130.7 | | | | – | | | | – | | | | 150.3 | |
| Operating earnings (loss) | | | (63.2 | ) | | | (153.6 | ) | | | 23.7 | | | | – | | | | (193.1 | ) |
| Additions to property, plant and equipment | | | 7.0 | | | | 4.6 | | | | 1.9 | | | | – | | | | 13.5 | |
| Nine months ended September 30, 2010 | | | | | | | | | | | | | | | |
| Sales to external customers | | $ | 511.0 | | | $ | 222.3 | | | $ | 161.7 | | | $ | – | | | $ | 895.0 | |
| Inter-segment sales | | | – | | | | – | | | | 14.5 | | | | (14.5 | ) | | | – | |
| Depreciation and amortization | | | 61.1 | | | | 20.4 | | | | 10.6 | | | | – | | | | 92.1 | |
| Restructuring | | | 8.2 | | | | 16.1 | | | | 1.0 | | | | – | | | | 25.3 | |
| Impairment and other closure costs (note 15) | | | 103.8 | | | | 189.4 | | | | – | | | | – | | | | 293.2 | |
| Operating earnings (loss) | | | (142.2 | ) | | | (239.2 | ) | | | 13.7 | | | | – | | | | (367.7 | ) |
| Additions to property, plant and equipment | | | 6.9 | | | | 1.3 | | | | 0.2 | | | | – | | | | 8.4 | |
The accompanying notes are an integral part of the consolidated financial statements.
| CATALYST PAPER 2011 THIRD QUARTER REPORT │ MANAGEMENT’S DISCUSSION AND ANALYSIS | | 36 |
NOTES TO CONSOLIDATED FINANCIAL STATEMENTS
(Unaudited and in millions of Canadian dollars, except where otherwise stated)
| Table of Contents | |
| | | |
| Note 1 | Basis of Presentation | 38 |
| Note 2 | Segmented Information | 38 |
| Note 3 | Significant Accounting Policies | 38 |
| Note 4 | Variable Interest Entities | 40 |
| Note 5 | Accounts Receivable | 41 |
| Note 6 | Inventories | 41 |
| Note 7 | Prepaids and Other | 42 |
| Note 8 | Property, Plant and Equipment | 42 |
| Note 9 | Other Assets | 42 |
| Note10 | Accounts Payable and Accrued Liabilities | 42 |
| Note 11 | Long-Term Debt | 43 |
| Note 12 | Employee Future Benefits | 44 |
| Note 13 | Accumulated Other Comprehensive Loss | 45 |
| Note 14 | Restructuring | 46 |
| Note 15 | Impairment and Other Closure Costs | 46 |
| Note 16 | Other Income (Expense) | 47 |
| Note 17 | Income Taxes | 47 |
| Note 18 | Fair Value Measurement | 47 |
| Note 19 | Financial Instruments | 50 |
| Note 20 | Contingent Liabilities | 52 |
| Note 21 | Comparative Figures | 52 |
| CATALYST PAPER 2011 THIRD QUARTER REPORT │ MANAGEMENT’S DISCUSSION AND ANALYSIS | | 37 |
NOTES TO CONSOLIDATED FINANCIAL STATEMENTS
(Unaudited and in millions of Canadian dollars, except where otherwise stated)
The consolidated financial statements include the accounts of the company and, from their respective dates of acquisition of control or formation, its wholly owned subsidiaries and partnerships. In addition, the consolidated financial statements include the accounts of the company's joint venture, Powell River Energy Inc. (PREI), a variable interest entity (VIE). All inter-company transactions and amounts have been eliminated on consolidation.
The accompanying unaudited interim consolidated financial statements have been prepared in accordance with United States generally accepted accounting principles (U.S. GAAP), on a basis consistent with those followed in the December 31, 2010 audited annual consolidated financial statements. Since the December 31, 2010 audited financial statements, we have adopted the government grant policy outlined in note 3. These unaudited interim consolidated financial statements do not include all information and note disclosures required by U.S. GAAP for annual financial statements, and therefore should be read in conjunction with the December 31, 2010 audited consolidated financial statements and the notes thereto. In the opinion of the company, the unaudited interim consolidated financial statements contained herein contain all the information and note disclosures necessary to fairly present the results of the interim periods included. The results for the periods included herein may not be indicative of the results for the entire year.
Catalyst Paper Corporation, together with its subsidiaries and partnerships (collectively, the company) is a significant specialty mechanical printing papers and newsprint producer in North America. The company operates in three business segments:
| Specialty printing papers | – Manufacture and sale of mechanical specialty printing papers |
| | |
| Newsprint | – Manufacture and sale of newsprint |
| | |
| Pulp | – Manufacture and sale of long-fibre Northern Bleached Softwood Kraft (NBSK) pulp |
The company owns and operates four manufacturing facilities, three of which are located in the province of British Columbia (B.C.), Canada and one in Arizona, U.S.A. Two other facilities, including a paper recycling facility, were permanently shut down during 2010 (note 5 on page 82 of the company’s 2010 Annual Report). Inter-segment sales consist of pulp transfers at market prices.
The primary market for the company’s paper products is North America. The primary markets for the company’s pulp products are Asia and Australasia.
| 3. | SIGNIFICANT ACCOUNTING POLICIES |
Going concern
The company and the Canadian paper industry in general have been adversely affected by the challenging economic conditions in the United States and globally over the past three years and the trend away from certain paper products to electronic media. The result has been overcapacity in the industry resulting in lower prices, higher costs due to production curtailments and a strong Canadian dollar which ultimately lowers revenues to the company. The company has permanently shut capacity in order to balance supply with demand and has worked with key stakeholders including suppliers, unions and municipalities to lower costs. The ability of the company to continue as a going concern in the long term will be dependent on the company’s ability to achieve profitable operations that are sustainable and on the company’s ability to renew long term debt and credit facilities as they become due. Based on management’s future projections, the company expects its operations to be profitable in the future. However, these projections include assumptions for pulp and paper demand and prices, the Canadian dollar, input costs and other economic factors, many of which are beyond the company’s control. The company is currently reviewing alternatives to address its capital structure. Should those alternatives fail to address our capital structure our substantial debt may impair our financial and operating flexibility.
| CATALYST PAPER 2011 THIRD QUARTER REPORT │ MANAGEMENT’S DISCUSSION AND ANALYSIS | | 38 |
NOTES TO CONSOLIDATED FINANCIAL STATEMENTS
(Unaudited and in millions of Canadian dollars, except where otherwise stated)
Government grants
Government grants are recognized at fair value when there is reasonable assurance that the company will comply with the conditions attached to them and that the grants will be received. Government grants related to additions or betterments to property, plant and equipment are recognized as credits against the carrying values of the related assets, and subsequently recognized in net earnings over the useful lives of the related assets as reductions to the resulting depreciation expense.
Government grants were awarded to the company by the Canadian Forest Service (CFS) to invest in specified capital upgrades to property, plant and equipment. These government grants, called Green Transformation Credits, were awarded in accordance with CFS’s Pulp and Paper Green Transformation Program.
Recently implemented accounting changes
There were no recent amendments by the Financial Accounting Standards Board (FASB) to the Accounting Standards Codification that materially impacted the company’s consolidated financial statements or disclosures.
Changes in future accounting standards
There were no new pronouncements issued by the FASB that may materially impact the company’s consolidated financial statements for future periods.
| CATALYST PAPER 2011 THIRD QUARTER REPORT │ MANAGEMENT’S DISCUSSION AND ANALYSIS | | 39 |
NOTES TO CONSOLIDATED FINANCIAL STATEMENTS
(Unaudited and in millions of Canadian dollars, except where otherwise stated)
| 4. | VARIABLE INTEREST ENTITIES |
The company has a 50.001% interest in PREI and consolidates 100% of it, as PREI is a VIE in which the company is the primary beneficiary. PREI consists of an integrated hydroelectric power generating, transmission and distribution system which includes two hydroelectric stations in B.C. with installed capacity of 83 Megawatts. The company purchases 100% of the power generated by PREI.
The company has limited access to PREI’s financial assets, which generally take the form of interest on loans, management fees and earnings distributions based on the company’s interest in PREI. In addition, creditors of PREI have recourse limited to the assets in PREI.
Effective January 1, 2011, PREI changed their financial reporting framework from Canadian generally accepted accounting principles (Canadian GAAP) to International Financial Reporting Standards (IFRS). The condensed financial information presented below has been prepared in accordance with U.S. GAAP.
Condensed financial information with respect to PREI is as follows:
| | | Three months ended September 30 | | | Nine months ended September 30 | |
| | | 2011 | | | 2010 | | | 2011 | | | 2010 | |
| Condensed statements of earnings (loss) | | | | | | | | | | | | |
Sales – affiliate 1 | | $ | 6.0 | | | $ | 4.8 | | | $ | 17.1 | | | $ | 15.7 | |
| Cost of sales, excluding depreciation and amortization | | | 1.7 | | | | 1.7 | | | | 5.0 | | | | 4.4 | |
| Depreciation and amortization | | | 1.8 | | | | 1.8 | | | | 5.5 | | | | 5.5 | |
| | | | 3.5 | | | | 3.5 | | | | 10.5 | | | | 9.9 | |
| Operating earnings | | | 2.5 | | | | 1.3 | | | | 6.6 | | | | 5.8 | |
| Interest expense | | | (2.2 | ) | | | (2.3 | ) | | | (6.7 | ) | | | (6.7 | ) |
Interest expense – affiliate 1 | | | (0.6 | ) | | | (0.4 | ) | | | (1.8 | ) | | | (1.6 | ) |
| Other income (expense) | | | – | | | | 0.1 | | | | – | | | | 0.1 | |
| Income tax recovery | | | 0.3 | | | | 0.5 | | | | 1.3 | | | | 1.0 | |
| Net earnings (loss) | | | – | | | | (0.8 | ) | | | (0.6 | ) | | | (1.4 | ) |
| Other comprehensive income (loss) | | | – | | | | 0.1 | | | | – | | | | 0.2 | |
Total comprehensive income (loss) 2 | | $ | – | | | $ | (0.7 | ) | | $ | (0.6 | ) | | $ | (1.2 | ) |
| | 1 | Balances with Catalyst Paper Corporation. |
| | 2 | 50% is included in the company’s non-controlling interest (deficit) balances. |
| | | September 30, 2011 | | | December 31, 2010 | |
| Condensed balance sheets | | | | | | |
| Current assets | | | | | | |
| Cash and cash equivalents | | $ | 5.4 | | | $ | 3.4 | |
| Other | | | 2.7 | | | | 2.6 | |
| Property, plant and equipment | | | 103.1 | | | | 108.1 | |
| | | $ | 111.2 | | | $ | 114.1 | |
| Current liabilities | | | | | | | | |
| Accounts payable and accrued liabilities | | $ | 4.1 | | | $ | 4.1 | |
| Long-term debt (note 11) | | | 113.8 | | | | 113.8 | |
Long-term debt – affiliate 1 | | | 20.8 | | | | 20.8 | |
| Future income taxes | | | 14.5 | | | | 15.7 | |
Equity 2 | | | (42.0 | ) | | | (40.3 | ) |
| | | $ | 111.2 | | | $ | 114.1 | |
| | 1 | Balances with Catalyst Paper Corporation. |
| | 2 | 50% is included in the company’s non-controlling interest (deficit) balances. |
| CATALYST PAPER 2011 THIRD QUARTER REPORT │ MANAGEMENT’S DISCUSSION AND ANALYSIS | | 40 |
NOTES TO CONSOLIDATED FINANCIAL STATEMENTS
(Unaudited and in millions of Canadian dollars, except where otherwise stated)
The company has identified one other potential VIE, but has not been able to obtain the financial information necessary to evaluate whether the entity is a VIE, or, if the entity is a VIE, whether the company is the primary beneficiary. The company has entered into a building lease agreement with this potential VIE whereby the company has agreed to continue making the prescribed lease payments directly to the financial institution holding the mortgage on the building in the event the lessor is no longer able to meet its contractual obligations. As at September 30, 2011, the principal amount of the mortgage was $5.2 million (December 31, 2010 - $6.4 million). This agreement does not increase the company’s liability beyond the obligation under the building lease.
The components of accounts receivable were as follows:
| | | September 30, 2011 | | | December 31, 2010 | |
| Trade receivables | | $ | 142.8 | | | $ | 112.7 | |
| Less allowance for doubtful accounts | | | (2.2 | ) | | | (3.0 | ) |
| Trade receivables, net | | | 140.6 | | | | 109.7 | |
| Sales tax receivable | | | 6.0 | | | | 5.7 | |
| Other receivables | | | 9.4 | | | | 5.2 | |
| | | $ | 156.0 | | | $ | 120.6 | |
The components of inventories were as follows:
| | | September 30, 2011 | | | December 31, 2010 |
| Finished goods | | | | | |
| Specialty printing papers | | $ | 29.9 | | | $ | 24.4 | |
| Newsprint | | | 6.8 | | | | 5.7 | |
| Pulp | | | 1.2 | | | | 4.6 | |
| Total finished goods | | | 37.9 | | | | 34.7 | |
| Work-in-progress | | | 1.0 | | | | 0.9 | |
| Raw materials – wood chips, pulp logs and other | | | 29.0 | | | | 23.7 | |
| Operating and maintenance supplies and spare parts | | | 74.5 | | | | 80.6 | |
| | | $ | 142.4 | | | $ | 139.9 | |
At September 30, 2011, the company had applied write-downs of $0.5 million to finished goods inventory (December 31, 2010 – $0.2 million) and $1.3 million to raw materials inventory (December 31, 2010 – $0.4 million).
An inventory of maintenance supplies and spare parts were written off as part of an impairment charge in the quarter. These inventory items of maintenance supplies and spare parts are located at the company’s mill in Snowflake, Arizona and are still in use (note 15).
| CATALYST PAPER 2011 THIRD QUARTER REPORT │ MANAGEMENT’S DISCUSSION AND ANALYSIS | | 41 |
NOTES TO CONSOLIDATED FINANCIAL STATEMENTS
(Unaudited and in millions of Canadian dollars, except where otherwise stated)
The components of prepaids and other were as follows:
| | | September 30, 2011 | | | December 31, 2010 | |
| Property taxes, insurance and licenses | | $ | 6.9 | | | $ | 2.3 | |
| Derivative financial instruments | | | – | | | | 8.0 | |
| Future income tax assets (note 17) | | | 13.9 | | | | 14.3 | |
| Other | | | 3.7 | | | | 3.1 | |
| | | $ | 24.5 | | | $ | 27.7 | |
| 8. | PROPERTY, PLANT AND EQUIPMENT |
The components of property, plant and equipment were as follows:
| | | September 30, 2011 | | | December 31, 2010 | |
| Cost | | $ | 4,236.9 | | | $ | 4,217.7 | |
| Accumulated depreciation, amortization and impairment | | | (3,154.0 | ) | | | (2,932.1 | ) |
| Net book value | | $ | 1,082.9 | | | $ | 1,285.6 | |
Building, plant and equipment with cost of $173.0 million, accumulated depreciation of $32.1 million and net book value of $140.9 million on September 30, 2011 were written-off as part of an impairment charge in the quarter. These long-lived assets are located at the company’s mill in Snowflake, Arizona and are still in use (note 15).
The components of other assets were as follows:
| | | September 30, 2011 | | | December 31, 2010 | |
| Deferred financing costs | | $ | 12.5 | | | $ | 13.0 | |
| Deferred charges and other | | | 10.7 | | | | 10.7 | |
| Derivative financial instruments | | | 3.2 | | | | 3.1 | |
| Accrued benefit asset – pension plan (note 12) | | | 0.2 | | | | 0.2 | |
| | | $ | 26.6 | | | $ | 27.0 | |
| 10. | ACCOUNTS PAYABLE AND ACCRUED LIABILITIES |
The components of accounts payable and accrued liabilities were as follows:
| | | September 30, 2011 | | | December 31, 2010 | |
| Trade payables | | $ | 102.8 | | | $ | 87.3 | |
| Accrued payroll and related liabilities | | | 30.7 | | | | 35.4 | |
| Accrued interest | | | 16.9 | | | | 11.1 | |
| Accrued benefit obligation – pension plan | | | 6.9 | | | | 11.7 | |
| Accrued benefit obligation – other employee future benefit plans | | | 6.9 | | | | 6.9 | |
| Restructuring (note 14) | | | 0.2 | | | | 3.1 | |
| Property taxes | | | 0.5 | | | | 0.2 | |
| Property taxes in arrears, interest and related penalties | | | 0.4 | | | | 4.4 | |
| Lease obligation – paper recycling – current portion | | | 1.5 | | | | 2.7 | |
| Payables related to capital projects | | | 4.1 | | | | 1.5 | |
| Other | | | 6.8 | | | | 7.3 | |
| | | $ | 177.7 | | | $ | 171.6 | |
| CATALYST PAPER 2011 THIRD QUARTER REPORT │ MANAGEMENT’S DISCUSSION AND ANALYSIS | | 42 |
NOTES TO CONSOLIDATED FINANCIAL STATEMENTS
(Unaudited and in millions of Canadian dollars, except where otherwise stated)
| Recourse | | September 30, 2011 | | | December 31, 2010 | |
Senior notes, 8.625% due June 2011 (US$ nil; December 31, 2010 – US$26.0 million) | | $ | – | | | $ | 25.9 | |
| Senior notes, 7.375% due March 2014 (US$250.0 million) | | | 262.0 | | | | 251.6 | |
| Senior secured notes, 11.0% due December 2016 (US$280.4 million) | | | 291.3 | | | | 278.9 | |
| Modification – difference in carrying value of 8.625% and 11.0% senior secured notes (US$38.3 million) on exchange | | | 32.5 | | | | 36.2 | |
| Class B senior secured notes, 11.0% due December 2016 (US$110.0 million) | | | 100.5 | | | | 94.3 | |
| | | | 686.3 | | | | 686.9 | |
| Revolving asset based loan facility of up to $175.0 million due May 2016 | | | 31.5 | | | | – | |
| Capital lease obligations | | | 9.5 | | | | 10.2 | |
| | | | 727.3 | | | | 697.1 | |
| Non-recourse | | | | | | | | |
| First mortgage bonds, 6.447% due July 2016 | | | 95.0 | | | | 95.0 | |
| Subordinated promissory notes | | | 18.8 | | | | 18.8 | |
| | | | 113.8 | | | | 113.8 | |
| Total debt | | | 841.1 | | | | 810.9 | |
| Less: Current portion | | | (1.0 | ) | | | (27.0 | ) |
| Total long-term debt | | $ | 840.1 | | | $ | 783.9 | |
On February 11, 2011, the company redeemed the outstanding 8.625% senior unsecured notes of US$26.0 million, due June 2011.
The indentures governing the 7.375% senior notes, due March 2014, (2014 Notes) and both the 11.0% senior secured notes, due December 2016 and the 11.0% Class B senior secured notes due December 15, 2016 (collectively, 2016 Notes), limit the ability of the company to incur debt, other than permitted debt, while the company cannot meet a fixed charge coverage ratio of 2.0:1. The company’s fixed charge coverage ratio under its senior and senior secured notes, calculated on a 12-month trailing average, was 0.7:1 at September 30, 2011 (December 31, 2010 – 0.4:1). The company cannot make any restricted payments, including paying dividends, except to the extent the balance in its restricted payments baskets is positive. The restricted payments baskets under the 2014 Notes and 2016 Notes were negative $388.7 million and negative $148.3 million, respectively, as at September 30, 2011, as a result of accumulated losses in recent years (December 31, 2010 – negative $302.2 million and negative $86.2 million, respectively).
On May 31, 2011, the company amended its revolving asset based loan facility (the ABL Facility) reducing the size of the Facility to $175 million, from $330 million, in part due to working capital levels which have been lower since the closure of the Elk Falls mill. The maturity date was extended to May 31, 2016, from August 13, 2013. In addition the fixed assets of the Snowflake mill are no longer part of the borrowing base and become first lien security under the company’s 2016 notes thereby increasing the first lien basket under those notes by $60 million. A financial covenant requires the company to maintain a minimum fixed charge coverage ratio of 1.1/1.0 if excess availability under the Facility is below $22 million; at September 30, 2011 the fixed charge coverage ratio was 0.5/1.0 for purposes of this covenant. This springing fixed charge financial covenant replaces the previous three financial covenants on (a) minimum shareholders’ equity; (b) minimum excess availability; and (c) maximum capital expenditure in a fiscal year.
Availability under the amended ABL Facility is determined by a borrowing base calculated primarily on eligible accounts receivable and eligible inventory less certain reserves. The borrowing base at September 30, 2011 includes a reserve of $0.4 million for unpaid property taxes and associated penalties. A reserve of $3.5 million may also be imposed for vacation pay obligations if availability (as defined in the ABL Facility) is below $50.0 million. As at September 30, 2011, the borrowing base under the ABL Facility was $167.3 million. After deducting outstanding drawings of $31.5 and outstanding letters of credit of $27.7 million, $108.1 million was available under the ABL Facility, before potential application of the springing fixed charge coverage ratio. The company also had an additional $17.8 million of cash on hand at September 30, 2011.
| CATALYST PAPER 2011 THIRD QUARTER REPORT │ MANAGEMENT’S DISCUSSION AND ANALYSIS | | 43 |
NOTES TO CONSOLIDATED FINANCIAL STATEMENTS
(Unaudited and in millions of Canadian dollars, except where otherwise stated)
At September 30, 2011, the company was in compliance with its covenants under the ABL Facility and under each of the indentures governing its outstanding senior notes.
The company’s long-term debt is recorded at amortized cost. The following table contains information about management’s best estimate of the fair value of the company’s debt:
| | September 30, 2011 | | December 31, 2010 | |
| | Carrying Value | | Fair Value | | Carrying Value | | Fair Value | |
| Recourse | | $ | 727.3 | | | $ | 377.0 | | | $ | 697.1 | | | $ | 585.5 | |
| Non-recourse | | | 113.8 | | | | 124.1 | | | | 113.8 | | | | 120.1 | |
The fair value of the company’s long-term recourse debt related to its senior notes is determined based on quoted market prices of identical debt instruments. The fair value of the company’s recourse debt related to the ABL Facility and non-recourse debt related to the first mortgage bonds is measured by discounting the respective cash flows at quoted market rates for similar debt having the same maturity. In measuring fair value, the company incorporates credit valuation adjustments to reflect its own non-performance risk, where applicable.
| 12. | EMPLOYEE FUTURE BENEFITS |
The company maintains pension benefit plans for all salaried employees, which include defined benefit and defined contribution segments. Employees hired subsequent to January 1, 1994 enroll in the defined contribution segment. Effective January 1, 2010, employees in the defined benefit plan ceased to accrue benefits under the defined benefit segment of the plan and began to participate in the defined contribution segment of the plan. The company also maintains pension benefits for former hourly employees that are not covered by union pension plans. Unionized employees of the company are members of multi-employer industry-wide pension plans to which the company contributes a predetermined amount per hour worked by an employee.
The company provides other benefit plans consisting of provincial medical plan premiums, extended health care and dental benefits to employees. A description of changes to pension and other benefit plans can be found on page 91 of the company’s 2010 Annual Report.
For the three and nine months ended September 30, 2011, the company incurred total post-retirement benefit costs of $6.6 million and $20.8 million, respectively (three and nine months ended September 30, 2010 – $9.0 million and $26.2 million).
In December 2009, the Company announced changes to its pension and post-retirement benefit plans to active employees. In July 2011, the final true up contribution for the closure of our U.S. sales company’s benefit pension plan was made for US$5.1 million.
For the three and nine months ended September 30, 2011, the company contributed $13.3 million and $29.6 million, respectively (three and nine months ended September 30, 2010 - $10.2 million and $28.8 million) for employee future benefits which include cash contributed to the company’s funded pension plans, cash payments directly to beneficiaries for its unfunded benefit plans, cash contributions to its defined contribution plans and cash contributed to its multi-employer industry-wide pension plans. Cash contributions for 2010 have been restated to include the multi-employer industry-wide pension plans.
The company measures the fair value of plan assets and the projected benefit obligations for accounting purposes as at December 31 of each year. The most recent actuarial valuation of the majority of pension plans for funding purposes as of December 31, 2010 was filed on September 27, 2011.
| CATALYST PAPER 2011 THIRD QUARTER REPORT │ MANAGEMENT’S DISCUSSION AND ANALYSIS | | 44 |
NOTES TO CONSOLIDATED FINANCIAL STATEMENTS
(Unaudited and in millions of Canadian dollars, except where otherwise stated)
Components of net periodic benefit cost recognized in the period were as follows:
| | | Three months ended September 30 | | | Nine months ended September 30 | |
| Pension benefit plans | | 2011 | | | 2010 | | | 2011 | | | 2010 | |
| Defined benefit plan | | | | | | | | | | | | |
| Service cost for the period | | $ | 0.3 | | | $ | 0.4 | | | $ | 0.9 | | | $ | 1.3 | |
| Interest cost | | | 4.4 | | | | 5.2 | | | | 13.4 | | | | 15.6 | |
| Expected return on assets | | | (4.1 | ) | | | (4.1 | ) | | | (12.3 | ) | | | (12.3 | ) |
| Amortization of unrecognized items: | | | | | | | | | | | | | | | | |
| Actuarial losses | | | 1.3 | | | | 1.6 | | | | 3.9 | | | | 4.7 | |
| Prior service costs | | | 0.1 | | | | 0.1 | | | | 0.3 | | | | 0.3 | |
| | | | 2.0 | | | | 3.2 | | | | 6.2 | | | | 9.6 | |
| Defined contribution plan | | | | | | | | | | | | | | | | |
| Service cost for the period | | | 0.8 | | | | 0.8 | | | | 2.6 | | | | 2.6 | |
Multi-employer industry-wide pension plan service cost for the period | | | 2.4 | | | | 2.8 | | | | 7.8 | | | | 7.5 | |
| Net periodic benefit cost for pension benefit plans | | $ | 5.2 | | | $ | 6.8 | | | $ | 16.6 | | | $ | 19.7 | |
| | | Three months ended September 30 | | | Nine months ended September 30 | |
| Other post-retirement benefit plans | | 2011 | | | 2010 | | | 2011 | | | 2010 | |
| Service cost for the period | | $ | 0.3 | | | $ | 0.5 | | | $ | 1.0 | | | $ | 1.5 | |
| Interest cost | | | 1.9 | | | | 2.5 | | | | 5.7 | | | | 7.5 | |
| Amortization of unrecognized items: | | | | | | | | | | | | | | | | |
| Actuarial losses | | | 0.1 | | | | 0.1 | | | | 0.3 | | | | 0.2 | |
| Prior service credits | | | (0.9 | ) | | | (0.9 | ) | | | (2.8 | ) | | | (2.7 | ) |
| Net periodic benefit cost for other benefit plans | | $ | 1.4 | | | $ | 2.2 | | | $ | 4.2 | | | $ | 6.5 | |
| 13. | ACCUMULATED OTHER COMPREHENSIVE LOSS |
The following table contains information about the accumulated other comprehensive loss (AOCI) of the company, net of taxes:
| | | September 30, 2011 | | | December 31, 2010 | |
| Unrecognized pension and other post-retirement benefits costs | | $ | (45.1 | ) | | | $ | (46.4 | ) |
| Unrecognized gains on cash flow revenue hedges | | | – | | | | | 1.0 | |
Foreign currency translation adjustments, net of related hedging activities1 | | | (1.6 | ) | | | | (0.2 | ) |
| Unrecognized loss on interest rate hedges | | | (0.5 | ) | | | | (0.5 | ) |
| | | $ | (47.2 | ) | | | $ | (46.1 | ) |
| | 1 | The accumulated net adjustment is comprised of non-taxable translation of $nil million (2010 – $2.6 million loss), and a net revaluation of long-term debt designated as a net investment hedge of $1.6 million loss (2010 – $2.4 million gain), net of tax of $nil million (2010 – $0.6 million expense). |
| CATALYST PAPER 2011 THIRD QUARTER REPORT │ MANAGEMENT’S DISCUSSION AND ANALYSIS | | 45 |
NOTES TO CONSOLIDATED FINANCIAL STATEMENTS
(Unaudited and in millions of Canadian dollars, except where otherwise stated)
| | The following table provides the activity in the restructuring liability: |
| | | As at September 30, 2011 | | | As at December 31, 2010 | |
| Balance, beginning of period | | $ | 3.3 | | | $ | 6.8 | |
| Expensed in period | | | – | | | | 25.3 | |
| Disbursements | | | (2.9 | ) | | | (28.8 | ) |
| Balance, end of period | | $ | 0.4 | | | $ | 3.3 | |
| Classification: | | | | | | | | |
| Accounts payable and accrued liabilities (note 10) | | $ | 0.2 | | | $ | 3.1 | |
| Other long-term obligations | | | 0.2 | | | | 0.2 | |
| | | $ | 0.4 | | | $ | 3.3 | |
The following table provides restructuring liability by year of initiative:
| | | September 30, 2011 | | | December 31, 2010 | |
| 2008 and prior initiatives | | $ | 0.3 | | | $ | 0.6 | |
| 2009 initiatives | | | – | | | | 0.7 | |
| 2010 initiatives | | | 0.1 | | | | 2.0 | |
| | | $ | 0.4 | | | $ | 3.3 | |
During the three and nine months ended September 30, 2011, the company did not record any restructuring costs.
| 15. | IMPAIRMENT AND OTHER CLOSURE COSTS |
During the quarter, the company recorded a $151.0 million impairment charge on assets located at its mill in Snowflake, Arizona. The carrying value of the assets were written-off on September 30, 2011. Current and historical operating and cash flow losses plus forecasted continuing losses indicated probable impairment of these assets. A recoverability analysis was performed, and on the basis of this analysis, the carrying value of these assets was fully impaired. The assets continue to be held by the company and are still in use.
During the quarter, the company recorded a $0.4 million impairment recovery associated with the permanent closure of the paper recycling operation. The recovery represents a change in estimated utility charges, insurance and water lot tax from what was originally anticipated in 2010. For the nine months ended September 30, 2011, a $0.7 million impairment recovery has been recorded in respect of the paper recycling operation.
The following table provides the components of the impairment (recovery) for the nine months ended September 30, 2011:
| | | Nine months ended September 30, 2011 | |
| Classification in consolidated balance sheet: | | | |
| Property, plant and equipment (note 8) | | $ | 140.9 | |
| Operating and maintenance supplies and spare parts inventory (note 6) | | | 10.1 | |
| | | $ | 151.0 | |
| Other closure costs – operating lease at paper recycling operation | | | (0.7 | ) |
| Total | | $ | 150.3 | |
| Classification in consolidated statement of earnings (loss): | | | | |
| Impairment and other closure cost | | $ | 150.3 | |
| CATALYST PAPER 2011 THIRD QUARTER REPORT │ MANAGEMENT’S DISCUSSION AND ANALYSIS | | 46 |
NOTES TO CONSOLIDATED FINANCIAL STATEMENTS
(Unaudited and in millions of Canadian dollars, except where otherwise stated)
| 16. | OTHER INCOME (EXPENSE) |
The components of other income (expense) were as follows:
| | | Three months ended September 30 | | | Nine months ended September 30 | |
| | | 2011 | | | 2010 | | | 2011 | | | 2010 | |
| Gain (loss) on derivative financial instruments | | $ | (5.5 | ) | | $ | 4.7 | | | $ | (4.3 | ) | | $ | (7.4 | ) |
| Foreign exchange gain (loss) on working capital balances | | | 10.9 | | | | (2.1 | ) | | | 8.1 | | | | 4.0 | |
| Fees related to bond exchange | | | – | | | | – | | | | – | | | | (8.3 | ) |
| Property tax penalty | | | – | | | | (0.4 | ) | | | – | | | | (0.4 | ) |
| Gain on disposal of property, plant and equipment | | | 0.2 | | | | 0.5 | | | | 0.1 | | | | 6.5 | |
| Gain on cancellation of long-term debt | | | – | | | | 0.6 | | | | – | | | | 0.6 | |
| Loss on fires | | | – | | | | – | | | | (5.7 | ) | | | – | |
| Other | | | – | | | | 0.1 | | | | 0.5 | | | | – | |
| | | $ | 5.6 | | | $ | 3.4 | | | $ | (1.3 | ) | | $ | (5.0 | ) |
As at September 30, 2011 the company has provided for a cumulative valuation allowance on its future tax assets of $189.4 million ($103.0 million at December 31, 2010). The effective rate for the quarter ended September 30, 2011 was 0.1%. The effective rate is less than the statutory rate primarily due to non-recognition of the tax benefit of the losses for the quarter. A description of the company’s income taxes can be found on pages 97 to 100 of the company’s 2010 Annual Report.
| 18. | FAIR VALUE MEASUREMENT |
An established fair value hierarchy requires the company to maximize the use of observable inputs and minimize the use of unobservable inputs when measuring fair value. A financial instrument’s categorization within the fair value hierarchy is based upon the lowest level of input that is available and significant to the fair value measurement. There are three levels of inputs that may be used to measure fair value.
Level 1
Quoted prices in active markets for identical assets or liabilities.
Level 2
Observable inputs other than quoted prices in active markets for identical assets and liabilities, such as quoted prices for identical or similar assets or liabilities in markets that are not active, or other inputs that are observable or can be corroborated by observable market data for substantially the full term of the assets or liabilities.
Level 3
Inputs that are generally unobservable and are supported by little or no market activity and that are significant to the fair value determination of the assets or liabilities.
As at September 30, 2011 the company did not have any currency or commodity contracts which have been designated as hedging instruments.
| CATALYST PAPER 2011 THIRD QUARTER REPORT │ MANAGEMENT’S DISCUSSION AND ANALYSIS | | 47 |
NOTES TO CONSOLIDATED FINANCIAL STATEMENTS
(Unaudited and in millions of Canadian dollars, except where otherwise stated)
The following table presents information about the fair value of the company’s derivative and non-derivative financial instruments not designated as hedging instruments and measured at fair value on a recurring basis:
| | | September 30, 2011 | | | December 31, 2010 | | | Fair value hierarchy | | Balance sheet classification |
| Assets | | | | | | | | | | |
| Currency contracts | | $ | – | | | $ | 7.9 | | | | 2 | 1 | Prepaids and other |
| Currency contracts | | | 3.2 | | | | 3.1 | | | | 2 | 1 | Other assets |
| Commodity contracts | | | – | | | | 0.1 | | | | 2 | 2 | Prepaids and other |
| | | $ | 3.2 | | | $ | 11.1 | | | | | | |
| Liabilities | | | | | | | | | | | | | |
| Commodity contracts | | $ | 0.1 | | | $ | 0.1 | | | | 2 | 2 | Accounts payable and accrued liabilities |
Fair value of the company’s derivatives are classified under Level 2 as they are measured as follows:
| | 1 | The fair value of forward currency contracts is measured using the discounted difference between contractual rates and market future rates. Interest rates, forward market rates, and volatility are used as inputs for such valuation techniques. The company incorporates credit valuation adjustments to appropriately reflect both its own non-performance risk and the counterparty’s non-performance risk in the fair value measurements. |
| | 2 | The fair value of commodity swap contracts is measured using the discounted difference between contractual rates and market rates. The fair value of natural gas commodity options is measured using techniques derived from the Black-Scholes pricing model. The company incorporates credit valuation adjustments to appropriately reflect both its own non-performance risk and the counterparty’s non-performance risk in the fair value measurements. |
The Company no longer designates its U.S. dollar revenue risk management instruments as cash flow hedges for accounting purposes effective April 1, 2010. For cash flow hedges that were in place as at March 31, 2010, the effective portion of changes in the fair value accumulated as at March 31, 2010 have been deferred and recorded in Accumulated other comprehensive loss. When the hedge item is recorded in earnings, the corresponding gain or loss on the hedge will be reclassified from Accumulated other comprehensive loss to Sales.
| CATALYST PAPER 2011 THIRD QUARTER REPORT │ MANAGEMENT’S DISCUSSION AND ANALYSIS | | 48 |
NOTES TO CONSOLIDATED FINANCIAL STATEMENTS
(Unaudited and in millions of Canadian dollars, except where otherwise stated)
The following table presents information about the effects of the company’s derivative instruments previously designated as cash flow hedges until April 1, 2010 when hedge accounting was discontinued. It also presents the effect of long-term debt designated as a hedge of the company’s net investment in the Snowflake mill on the company’s consolidated financial statements:
| | Gain (loss) recognized in AOCI 1 | | (Gain) loss reclassified from AOCI 1 | | | Classification on statement of earnings (loss) reclassified from AOCI 1 | | Gain (loss) recognized in income 2 | |
Three months ended September 30 | 2011 | | 2010 | | 2011 | | 2010 | | | | | 2011 | | 2010 | |
| Derivatives designated as cash flow hedges | | | | | | | | | | | | | | | | | | | | |
| Currency contracts | | $ | – | | | $ | – | | | $ | (0.1 | ) | | $ | (2.8 | ) | | Other income (expense) | | $ | – | | | $ | – | |
Long-term debt designated as hedges of net investment | | $ | (4.8 | ) | | $ | 3.5 | | | $ | (1.0 | ) | | $ | 0.4 | | | Foreign exchange gain (loss) on long-term debt | | $ | – | | | $ | – | |
| | Gain (loss) recognized in AOCI 1 | | (Gain) loss reclassified from AOCI 1 | | | Classification on statement of earnings (loss) reclassified from AOCI 1 | | Gain (loss) recognized in income 2 | |
Nine months ended September 30 | 2011 | | 2010 | | 2011 | | 2010 | | | | | 2011 | | 2010 | |
| Derivatives designated as cash flow hedges | | | | | | | | | | | | | | | | | | | | |
| Currency contracts | | $ | – | | | $ | 4.2 | | | $ | (1.0 | ) | | $ | (10.0 | ) | | Other income (expense) | | $ | – | | | $ | (1.8 | ) |
Long-term debt designated as hedges of net investment | | $ | (2.0 | ) | | $ | 1.0 | | | $ | (2.0 | ) | | $ | 1.4 | | | Foreign exchange gain (loss) on long-term debt | | $ | – | | | $ | – | |
| | 1 | The gain (loss) recognized, or (gain) loss reclassified from AOCI relates to the effective portion of the hedge. |
| | 2 | The gain (loss) recognized in income relates to the ineffective portion of the hedge and the amount excluded from effectiveness testing. |
As U.S. dollar denominated revenues are recognized over the next 12 months subsequent to September 30, 2011, the company estimates that a net gain of $nil million, or an after-tax net gain of $nil million, will be reclassified from Accumulated other comprehensive loss to Sales.
The carrying value of the company’s other financial instruments, namely cash and cash equivalents, accounts receivable, accounts payable and accrued liabilities approximate their fair values because of the short-term maturity of these instruments.
| CATALYST PAPER 2011 THIRD QUARTER REPORT │ MANAGEMENT’S DISCUSSION AND ANALYSIS | | 49 |
NOTES TO CONSOLIDATED FINANCIAL STATEMENTS
(Unaudited and in millions of Canadian dollars, except where otherwise stated)
| | (a) | Financial Risk Management |
Financial instruments of the company consist primarily of cash and cash equivalents, accounts receivable, accounts payable and accrued liabilities and long-term debt. Financial instruments of the company also include derivatives which the company uses to reduce its exposure to currency and price risk associated with its revenues, energy costs and long-term debt.
The company has exposure to risk from its financial instruments, specifically credit risk, market risk (including currency, price and interest rate risk) and liquidity risk. A summary of the company’s financial risk management objectives can be found on pages 108 to 110 of the company’s 2010 Annual Report.
The company is exposed to credit risk on accounts receivable from its customers who are mainly in the newspaper publishing and commercial printing businesses. Aging of receivables were as follows:
| | | September 30, 2011 | | | December 31, 2010 | |
| Trade receivables | | | | | | |
| Current | | $ | 132.6 | | | $ | 106.0 | |
| Past due 1-30 days | | | 8.7 | | | | 4.7 | |
| Past due 31-90 days | | | (0.5 | ) | | | 1.4 | |
| Past due over 90 days | | | 2.0 | | | | 0.6 | |
| | | | 142.8 | | | | 112.7 | |
| Less allowance for doubtful accounts | | | (2.2 | ) | | | (3.0 | ) |
| Trade receivables, net | | $ | 140.6 | | | $ | 109.7 | |
The movement in the allowance for doubtful accounts in respect of trade receivables was as follows:
| | | September30, 2011 | | | December 31, 2010 | |
| Balance, beginning of period | | $ | 3.0 | | | $ | 3.7 | |
| Increase (decrease) in provision | | | (0.8 | ) | | | (0.7 | ) |
| Balance, end of period | | $ | 2.2 | | | $ | 3.0 | |
| CATALYST PAPER 2011 THIRD QUARTER REPORT │ MANAGEMENT’S DISCUSSION AND ANALYSIS | | 50 |
NOTES TO CONSOLIDATED FINANCIAL STATEMENTS
(Unaudited and in millions of Canadian dollars, except where otherwise stated)
| | (b) | Revenue Risk Management Instruments |
Foreign currency options and forward contracts outstanding to sell U.S. dollars were as follows:
| | Options | | | | |
| | Purchased US$ put | | | Sold US$ call | | | Forward contracts | |
| Term | US$millions | | | Average rate US$/CDN$ | | | US$millions | | | Average rate US$/CDN$ | | | US$millions | | | Average rate US$/CDN$ | |
| As at September 30, 2011 | | | | | | | | | | | | | | | | | | |
| 0 to 12 months | | $ | 67 | | | | 0.9920 | | | $ | 40 | | | | 0.9103 | | | $ | 14 | | | | 0.9918 | |
| 13 to 24 months | | | 110 | | | | 1.0252 | | | | – | | | | – | | | | – | | | | – | |
| | | $ | 177 | | | | 1.0125 | | | $ | 40 | | | | 0.9103 | | | $ | 14 | | | | 0.9918 | |
| As at December 31, 2010 | | | | | | | | | | | | | | | | | | | | | | | | |
| 0 to 12 months | | $ | 253 | | | | 0.9878 | | | $ | 249 | | | | 0.8953 | | | $ | 13 | | | | 0.9761 | |
| 13 to 24 months | | | 55 | | | | 0.9898 | | | | 5 | | | | 0.8786 | | | | – | | | | – | |
| | | $ | 308 | | | | 0.9882 | | | $ | 254 | | | | 0.8949 | | | $ | 13 | | | | 0.9761 | |
At period-end exchange rates, the net amount the company would receive to settle the above contracts and options is $3.2 million (December 31, 2010 – $11.0 million).
At September 30, 2011, instruments having a notional principal of US$191 million are marked to market, where the related gains and losses are recognized as Other income (expense), except for the portion still deferred in Accumulated other comprehensive loss.
At September 30, 2011, commodity swap agreements are outstanding to fix the sales price of 11,000 metric tonnes of NBSK pulp within the next nine months. These contracts are not designated as hedging instruments for accounting purposes and are reported at their fair value, which was $0.0 million at September 30, 2011 (December 31, 2010 – negative $0.1 million), with related gains and losses recognized in Other income (expense).
| | (c) | Cost Risk Management Instruments |
At September 30, 2011, the company was party to commodity options to hedge the purchase price of natural gas for 0.9 million gigajoules (GJ) (December 31, 2010 – 0.7 million GJ) within the next 21 months at rates averaging $4.50 per GJ. These instruments were not designated as hedging instruments for accounting purposes and were reported at fair value, with related gains and losses recognized in Other income (expense). At period-end contract rates, the fair value of these contracts was negative $0.1 million (December 31, 2010 - $0.1 million).
| CATALYST PAPER 2011 THIRD QUARTER REPORT │ MANAGEMENT’S DISCUSSION AND ANALYSIS | | 51 |
NOTES TO CONSOLIDATED FINANCIAL STATEMENTS
(Unaudited and in millions of Canadian dollars, except where otherwise stated)
| 20. | CONTINGENT LIABILITIES |
A description of the company's contingent liabilities as at December 31, 2010 can be found on page 113 of the company's 2010 Annual Report. An update as at September 30, 2011 is outlined below:
| | (a) | Claim for Return of Payments Made to Quebecor World (USA) |
In September, 2011 we settled the claim by Quebecor World (USA)’s (Quebecor) litigation trustee against us under the U.S. Bankruptcy Code seeking the return of approximately $18.8 million of alleged preferential payments made to us by Quebecor in the ordinary course of our trade relationship during the 90-day period preceding Quebecor’s Chapter 11 filing in 2007. The net amount payable by the Company in respect of the settlement was not material and is covered by our allowance for bad debts.
| | (b) | Claim for Certain Post-Retirement Benefits |
The Communications, Energy and Paperworkers Union of Canada Locals 1, 76, 592 and 686 (the “Locals”), representing hourly employees at the company’s Powell River and Port Alberni mills, applied to the Labour Relations Board of B.C. for a declaration that the company is responsible for certain post-retirement medical and extended health benefits for some retired employees who were represented by the Locals and who retired from MacMillan Bloedel Limited (“MB”), now doing business as Weyerhaeuser Company Ltd. (“Weyerhaeuser”). Pacifica Papers Inc. (“Pacifica”) acquired the Powell River and Port Alberni mills from MB in 1998, and it was agreed as part of that transaction that MB would remain responsible for any benefits for eligible employees who retired prior to the acquisition by Pacifica of the mills. The company subsequently amalgamated with Pacifica in 2001. The Locals claim that the contractual relationships between the company, Pacifica and MB do not absolve the company (as successor to Pacifica) from any obligations which may exist in respect of certain post-retirement benefits and that the successorship provisions of the Labour Relations Code imposed any such possible obligations on Pacifica at the time Pacifica acquired the mills. The Labour Relations Board declined to rule on the Locals’ application or the company’s defense to the claim on the basis that this matter is a dispute under the collective agreement and, accordingly, a matter to be determined by arbitration. All four Locals filed grievances claiming that the company is responsible for these post-retirement benefits. The company does not agree with the Locals’ positions and has contested or will be contesting the grievances. Local 76’s claim was dismissed by an arbitrator on December 23, 2010. Local 686 advised the company on March 29, 2011 that Local 686 was withdrawing its claim. The other two grievances are at a preliminary stage and, as at November 14, 2011 have not been scheduled. Although the extent of the company’s liability for the remaining two claims remains unknown at this time, the company estimates that it would incur costs of between $1.0 million and $2.0 million annually to provide these additional benefits. In that case, it would seek indemnification from Weyerhaeuser.
| | (c) | Short-term Incentive Plan and Benefits Claim |
In May 2010, a salaried employee of the company commenced an action against the company in the Supreme Court of B.C. seeking a payment under the company's 2009 Short-term Incentive Plan and damages in connection with the reduction of certain employee benefits announced in November 2009 and certification of the action as a class proceeding on behalf of all salaried employees who were entitled to Short-term Incentive Plan payments and affected by the reduction in benefits. The action was certified as a class proceeding on March 21, 2011 but only on behalf of those employees and former employees who have not provided the company with releases of the claims. The company intends to vigorously defend this action. Most of the company’s employees and applicable former employees have provided the company with written releases of these claims, leaving only a small number of employees and former employees who have not done so. Although it is not possible to determine the likelihood and extent of any potential liability for the remaining claims, the company does not expect to incur any additional material liability in connection with this claim.
Certain comparative figures presented in the interim consolidated financial statements have been reclassified to conform to the current period presentation.
| CATALYST PAPER 2011 THIRD QUARTER REPORT │ MANAGEMENT’S DISCUSSION AND ANALYSIS | | 52 |