catalyst paper corporation

MANAGEMENT’S DISCUSSION AND ANALYSIS
Management’s Discussion and Analysis
The following management’s discussion and analysis (MD&A) of Catalyst Paper Corporation (the company, we, us, and our) should be read in conjunction with our consolidated financial statements for the years ended December 31, 2011, 2010 and 2009, and the notes thereto, which have been prepared in accordance with generally accepted accounting principles (GAAP) in the United States (U.S.). Additional information about the company, including our most recent Annual Information Form is available on our website atwww.catalystpaper.com, or the Canadian Securities Administrators’ electronic filing website atwww.sedar.com.
Throughout this discussion, references are made to certain measures that are not measures of performance under U.S. GAAP, including operating earnings, EBITDA, EBITDA before restructuring costs, average delivered cash costs per tonne before specific items, net earnings (loss) attributable to the company before specific items, net earnings (loss) per share attributable to the company’s common shareholders before specific items, and free cash flow. We believe that these non-GAAP measures are useful in evaluating our performance. These non-GAAP measures are defined and reconciled to their nearest GAAP measure in section 13, Non-GAAP Measures.
In this MD&A, unless otherwise indicated, all dollar amounts are expressed in Canadian dollars. The term “dollars” and the symbols “$” and “CDN$” refer to Canadian dollars and the term “U.S. dollars” and the symbol “US$” refer to United States dollars.
In this MD&A, the term “tonne” and the symbol “MT” refer to a metric tonne and the term “ton” or the symbol “ST” refer to a short ton, a measure of weight equal to 0.9072 metric tonne. Use of these symbols is in accordance with industry practice.
The information in this report is as at February 29, 2012, which is the date of filing in conjunction with our press release announcing our results for the fourth quarter of 2011 and 12 months ended December 31, 2011. Disclosure contained in this document is current to February 29, 2012, unless otherwise stated.
| 2 Management’s Discussion and Analysis - February 29, 2012 |
CAUTIONARY STATEMENT REGARDING FORWARD-LOOKING STATEMENTS
Certain statements and information in this MD&A are not based on historical facts and constitute forward-looking statements or forward-looking information within the meaning of Canadian securities laws and the U.S. Private Securities Litigation Reform Act of 1995 (forward-looking statements), including but not limited to, statements about our strategy, plans, future operating performance, contingent liabilities and outlook as well as statements about our creditor protection proceedings, debtor in possession financing, reorganization process and debt restructuring.
Forward-looking statements:
| · | Are statements that address or discuss activities, events or developments that we expect or anticipate may occur in the future; |
| · | Can be identified by the use of words such as “believe”, “expect”, “anticipate”, “intend”, “plan”, “likely”, “predicts”, “estimates”, “forecasts”, and similar words or phrases or the negative of such words or phrases; |
| · | Reflect our current beliefs, intentions or expectations based on certain assumptions and estimates, including those identified below, which could prove to be significantly incorrect: |
| | | |
| o | Our ability to develop, manufacture and sell new products and services that meet the needs of our customers and gain commercial acceptance; |
| o | Our ability to continue to sell our products and services in the expected quantities at the expected prices and expected times; |
| o | Our ability to successfully obtain cost savings from our cost reduction initiatives; |
| o | Our ability to implement business strategies and pursue opportunities; |
| o | Expected cost of goods sold; |
| o | Expected component supply costs and constraints; |
| o | Expected foreign exchange and tax rates. |
| · | While considered reasonable by management, are inherently subject to known and unknown risks and uncertainties and other factors that could cause actual results or events to differ from historical or anticipated results or events. These risk factors and others are discussed in this MD&A. Certain of these risks are: |
| | | |
| o | The impact of general economic conditions in the countries in which we do business; |
| o | Conditions in the capital markets and our ability to obtain financing and refinance existing debt; |
| o | Market conditions and demand for our products (including declines in advertising and circulation); |
| o | The implementation of trade restrictions in jurisdictions where our products are marketed; |
| o | Fluctuations in foreign exchange or interest rates; |
| o | Raw material prices (including wood fibre, chemicals and energy); |
| o | The effect of, or change in, environmental and other governmental regulations; |
| o | Uncertainty relating to labour relations; |
| o | The availability of qualified personnel; |
| o | The effects of competition from domestic and foreign producers; |
| o | The risk of natural disaster and other factors many of which are beyond our control. |
| o | Risks and uncertainties relating to our creditor protection proceedings, including our ability to continue as a going concern and ability to implement a debt restructuring. |
As a result, no assurance can be given that any of the events or results anticipated by such forward-looking statements will occur or, if they do occur, what benefit they will have on our operations or financial condition. Readers are cautioned not to place undue reliance on these forward-looking statements. We disclaim any intention or obligation to update or revise any forward-looking statements, whether as a result of new information, future events or otherwise, except as required by law.
| 3 Management’s Discussion and Analysis - February 29, 2012 |
Table of Contents
| 1 | | Company profile | | 5 |
| 2 | | Annual overview - 2011 | | 7 |
| 3 | | Strategy | | 15 |
| 4 | | Consolidated results - annual | | 24 |
| 5 | | Segmented results - annual | | 25 |
| 6 | | Consolidated and segmented results - quarterly | | 34 |
| 7 | | Financial condition | | 40 |
| 8 | | Liquidity and capital resources | | 41 |
| 9 | | Related party transactions | | 45 |
| 10 | | Contingent liabilities | | 46 |
| 11 | | Off-balance sheet arrangements | | 47 |
| 12 | | Summary of quarterly results | | 48 |
| 13 | | Non-GAAP measures | | 49 |
| 14 | | Critical accounting policies and estimates | | 53 |
| 15 | | Changes in accounting policies | | 57 |
| 16 | | Impact of accounting pronouncements affecting future periods | | 58 |
| 17 | | Risks and uncertainties | | 59 |
| 18 | | Governance and management systems | | 70 |
| 19 | | Sensitivity analysis | | 72 |
| 20 | | Outlook | | 73 |
| 21 | | Disclosure controls and internal control over financial reporting | | 76 |
| 4 Management’s Discussion and Analysis - February 29, 2012 |  |
We are the largest producer of mechanical printing papers in western North America. We also produce NBSK pulp which is marketed primarily in Asia. Our business is comprised of three business segments: specialty printing papers, newsprint, and pulp. Specialty printing papers include coated mechanical, uncoated mechanical and directory paper. We are the only producer of coated mechanical paper and soft-calender (SC) paper in western North America. We operate four paper mills, three of which are located in British Columbia (B.C.) in Crofton, Port Alberni and Powell River, and one in Snowflake, Arizona, which produces 100% recycled-content paper. Our Crofton mill includes a two-line kraft pulp operation.
Our products are sold by our sales and marketing personnel in North America and through distributors and agents in other geographic markets. These products are shipped by a combination of rail, truck, and barge for customers located in North America and by break-bulk and deep-sea container vessels for customers located overseas.
Specialty printing papers
Our largest business segment is specialty printing papers, which generated 57% of 2011 consolidated sales revenue; our papers are sold to a diversified customer base consisting of retailers, magazine and catalogue publishers, commercial printers and telephone directory publishers. In 2011, 89% of specialty printing papers sales volume was sold to customers in North America.
Newsprint
Newsprint sales generated 23% of 2011 consolidated sales revenue. The newsprint customer base consists primarily of newspaper publishers located in western and central North America, Asia and Latin America. In 2011, 71% of newsprint sales volume was sold to customers in North America.
Pulp
Pulp sales generated 20% of 2011 consolidated sales revenue. The pulp customer base is located primarily in Asia and includes producers of tissue, magazine papers, wood-free printing and writing papers, and certain specialty printing paper products. In 2011, 98% of pulp sales volume was sold to customers in Asia. The Crofton pulp mill is located on tidewater and has a deep-sea vessel loading facility, which enables direct-from-mill shipments to international buyers.
| 5 Management’s Discussion and Analysis - February 29, 2012 | |
| 2012PRODUCT APPLICATIONS |
| Segment | Specialty printing papers | Newsprint | Market pulp |
| Category | Uncoated mechanical | Coated
mechanical | Directory | Newsprint | NBSK pulp |
| Soft-calendered | Machine-finished |
| Brand names | Electracal
Electraprime | Electrabrite
Electrabrite Lite Electrastar
Electrastar Max | Electracote
Electracote Brite
Pacificote | Catalyst | Marathon | Crofton Kraft
|
| Basis weight (g/m2) | 45 – 52 | 45 – 74 | 47.3-74 | 29 – 40 | 43 – 48.8 | n/a |
| Applications | retail inserts,
magazines,
catalogues,
flyers, direct mail, directories | retail inserts,
magazines,
supplements, flyers, direct mail, books, corporate communication
books/manuals | retail inserts,
magazines,
catalogues,
direct mail
| telephone books,
catalogues | newspapers,
retail inserts, flyers,
supplements,
directories
| tissue,
printing and writing papers,
specialty paper products,
containerboard |
| Total capacity (tonnes) | 540,0001 | 223,000 | 226,0001 | 471,0001 | 335,0002 |
| % of total capacity | 30% | 12% | 13% | 26% | 19% |
| 2012 CAPACITY BY MILL LOCATION AND PRODUCT LINE1 |
| | | Specialty printing papers1 | Newsprint1 | Market
pulp | Total |
| Mill location | Number of
paper machines | Uncoated
mechanical | Coated
mechanical | Directory | Newsprint | NBSK
pulp | |
| Crofton, B.C. 3 | 2 | - | - | 111,000 | 194,000 | 335,0002 | 640,000 |
| Port Alberni, B.C. | 2 | - | 223,000 | 115,000 | - | - | 338,000 |
| Powell River, B.C. | 3 | 480,000 | - | - | - | - | 480,000 |
| Snowflake, Arizona | 2 | 60,000 | - | - | 277,000 | - | 337,000 |
| Total capacity (tonnes) | 9 | 540,000 | 223,000 | 226,000 | 471,000 | 335,000 | 1,795,000 |
| % of total capacity | | 30% | 12% | 13% | 26% | 19% | 100% |
| 1 | Capacities expressed in the above tables can vary as we are able to switch production between products, particularly newsprint, directory and machine-finished uncoated grades. |
| 2 | Total pulp capacity at Crofton is 395,000 tonnes, of which 335,000 tonnes are designated as market pulp with the remainder 60,000 tonnes being consumed internally. A plan was approved to expand total pulp capacity by approximately 25,000 tonnes by 2012. |
| 3 | No. 1 paper machine at Crofton remains indefinitely curtailed. If this machine were to be restarted we do not expect it would produce newsprint. |
| 6 Management’s Discussion and Analysis - February 29, 2012 | |
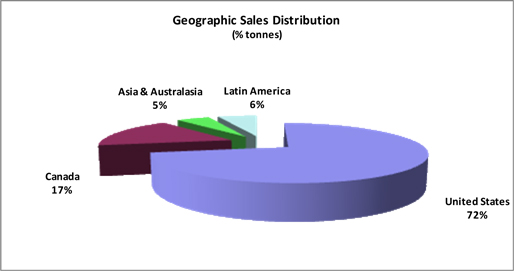
Geographic sales distribution

Our products are sold globally. North America continues to be our principal market, comprising 68% of consolidated sales volume for 2011.
Creditor Protection and Restructuring Process
Following extensive discussions and negotiations in 2011 and early 2012 with certain holders of our 7.375% senior unsecured notes due 2014 (2014 Notes) and our 11.0% senior secured notes due 2016 (2016 Notes) in an effort to implement a recapitalization transaction that would reduce our indebtedness and improve the company’s capital structure, the Board of directors and management determined it was necessary to pursue a restructuring under court supervision.
On January 31, 2012 we obtained an initial order from the Supreme Court of British Columbia under the Companies’ Creditors Arrangement Act (CCAA) staying creditor proceedings during our restructuring process under the CCAA and on February 3, 2012 obtained an amended order from the Court approving debtor-in possession (DIP) financing (as described below) that the DIP lender has agreed to provide to Catalyst during the restructuring process. The Canadian court order under the CCAA has been recognized under chapter 15 of title 11 of the US Bankruptcy Code. A further order confirming the initial order was obtained from the Canadian court on February 14, 2012. PricewaterhouseCoopers Inc. was appointed by the court as the monitor under the CCAA process.
The company arranged for a $175 million debtor-in possession facility (DIP Facility) as part of the CCAA proceedings. The DIP Facility has an 18-month maturity and is expected to provide for ongoing working capital, capital expenditure requirements as well as for general corporate purposes during the restructuring process under the CCAA. Collateral consists of a super-priority charge over accounts receivable, inventories, cash and certain other property of the company. For further details on the DIP Facility, refer to the Terms of DIP Financing section described in note 30,Subsequent event, in our annual consolidated financial statements for the year ended December 31, 2011.
| 7 Management’s Discussion and Analysis - February 29, 2012 | |
The company believes that restructuring under the CCAA will best facilitate the completion of a restructuring transaction that will deliver the improvements to our liquidity and capital structure necessary to place the company on a more firm financial and competitive footing. The company’s operating revenue combined with the DIP Credit Facility are expected to provide sufficient liquidity to meet ongoing obligations to employees and suppliers and ensure that normal operations continue during the restructuring process.
We had previously announced in June 2011that we would be reviewing alternatives to address our capital structure with the goal of improving our balance sheet. We identified the reduction of our indebtedness as a priority given current business and economic conditions. We commenced discussions on recapitalization alternatives in respect of both our 2014 Notes and 2016 Notes and engaged Perella Weinberg Partners as our financial advisor to assist in this process in October, 2011. For 2011, we incurred restructuring costs of $5.9 million on this recapitalization initiative, consisting of legal and consulting fees.
On December 15, 2011, we withheld an interest payment of approximately US$21 million due on December 15, 2011 on our 2016 Notes, electing to take advantage of a 30 day grace period that applied to that interest payment. The decision to withhold this interest payment was driven by our debt restructuring discussions with various holders of our 2014 Notes and 2016 Notes.
On January 14, 2012 we entered into a restructuring and support agreement with holders of our 2016 Notes holding approximately 53% of the total outstanding 2016 Notes and holders of our 2014 Notes holding approximately 25% of the total outstanding 2014 Notes to proceed with a proposed recapitalization transaction under theCanada Business Corporations Act(CBCA). Waivers of the December 15, 2011 interest payment by the holders of the 2016 Notes were included in this agreement and an order was obtained from the Supreme Court of British Columbia under the CBCA staying any proceedings in respect of that interest payment. An order was also obtained from the United States court recognizing the Canadian CBCA order under Chapter 15 in the United States.
The recapitalization transaction under the CBCA was subject to two conditions being met by January 31, 2012: (a) a new labour agreement ratified by all six union locals at the company’s BC mills and (b) two-thirds support of both the holders of the 2014 Notes and holders of the 2016 Notes. Neither of these conditions was met. The failure to meet those conditions coupled with declining liquidity led to the CCAA filing.
Listing and trading of our common shares
On February 1, 2012 we received notice from the Toronto Stock Exchange (TSX) that it had determined to immediately suspend the trading of our common shares on the TSX. The TSX advised that its decision was based on the commencement of our proceedings under the CCAA. The last day that our shares traded on the TSX was January 31, 2012. In addition, the TSX has advised that it intends to delist our common shares effective March 8, 2012. We do not intend to take any action to appeal this decision and therefore we expect that our common shares will be delisted on March 8, 2012.
Third Avenue Management LLC (TAM) advised us in February 2012 that, as at February 16, 2012, all common shares of the company owned by client accounts managed by TAM were disposed of. The disposition was over-the-counter sales transactions implemented after our CCAA filing.
| 8 Management’s Discussion and Analysis - February 29, 2012 | |
Repudiation of operating lease at paper recycling operation
On February 22, 2012, we gave notice that we no longer intend to meet our contractual obligations as lessee under an operating leaseat the paper recycling operation we shut down in 2010 (refer to note 5,Measurement uncertainty – impairment of long-lived assets, in our annual consolidated financial statements for the year ended December 31, 2011). The operating lease was scheduled to expire on November 30, 2023. Per the terms of the 30 day notice, a final lease payment will be made on March 1, 2012 for the 23 day period ending March 23, 2012. Any future claims arising from this operating lease are automatically stayed while the CCAA Order is in effect.
Business overview
2011 was a challenging year for our company and the pulp and paper industry in general. The global economic recovery lost most of its momentum, resulting in reduced North American demand, lower export shipments and higher inventory levels for most paper grades. Operating earnings were negatively impacted by a strong Canadian dollar for most of the year, increased recovered old newsprint (ONP) cost and general inflationary pressure.
Fires and extended maintenance outages at our Snowflake and Powell River mills during the second quarter resulted in significant production losses and higher maintenance spending. Declining demand in our newsprint and directory markets, lower pulp prices in the fourth quarter and significantly reduced long-term pulp and paper price estimates resulted in a $660.2 million impairment charge to our Canadian operations. Our Snowflake mill’s disappointing historical performance and challenging future outlook resulted in an impairment charge of $161.8 million. After giving effect to these impairment changes, the company’s liabilities exceeded the book value of its assets by $617.3 million as at December 31, 2011.
The NBSK pulp market remained solid in 2011 due to strong demand from China, with shipments and benchmark prices increasing for most of the year. By the fourth quarter inventory levels in China were very high, resulting in reduced demand and a significant decline in benchmark prices.
Financial performance
We recorded a net loss attributable to the company of $974.0 million and a net loss attributable to the company before specific items of $126.3 million in 2011. This compared to losses of $396.9 million and $87.0 million, respectively, in 2010. Significant specific items in 2011 included an impairment charge on the pulp and paper assets of our Canadian operations, an impairment charge on certain assets of our Snowflake mill, losses sustained due to fires at our Snowflake and Powell River mills, restructuring costs incurred on capital structure negotiations and a foreign exchange loss on the translation of U.S. dollar denominated debt. Significant specific items in the prior year included impairment and other closure costs related to the Elk Falls and paper recycling operations, restructuring costs, a foreign exchange gain on the translation of U.S. dollar denominated debt, note exchange costs, and an unfavourable tax adjustment.
| 9 Management’s Discussion and Analysis - February 29, 2012 | |
Selected annual financial information
| (In millions of dollars, except where otherwise stated) |
| | | 2011 | | | 2010 | | | 20091 | |
| | | | | | | | | | |
| Sales | | $ | 1,261.5 | | | $ | 1,228.6 | | | $ | 1,223.5 | |
| Operating earnings (loss) | | | (894.4 | ) | | | (367.5 | ) | | | (40.8 | ) |
| Depreciation and amortization | | | 112.4 | | | | 119.3 | | | | 146.6 | |
| EBITDA2 | | | 41.6 | | | | 46.3 | | | | 123.2 | |
| – before restructuring costs2 | | | 47.5 | | | | 71.6 | | | | 141.1 | |
| Net earnings (loss) attributable to the company | | | (974.0 | ) | | | (396.9 | ) | | | (4.4 | ) |
| – before specific items2 | | | (126.3 | ) | | | (87.0 | ) | | | (58.8 | ) |
| Total assets | | | 737.6 | | | | 1,696.2 | | | | 2,090.8 | |
| Total long-term liabilities | | | 713.6 | | | | 1,094.2 | | | | 1,120.9 | |
| | | | | | | | | | | | | |
| EBITDA margin2 | | | 3.3 | % | | | 3.8 | % | | | 10.1 | % |
| – before restructuring costs2 | | | 3.8 | % | | | 5.8 | % | | | 11.5 | % |
| Net earnings (loss) per share attributable to the company’s common shareholders (in dollars) | | | | | | | | | | | | |
| – basic and diluted | | $ | (2.55 | ) | | $ | (1.04 | ) | | $ | (0.01 | ) |
| – before specific items | | | (0.33 | ) | | | (0.23 | ) | | | (0.15 | ) |
| | | | | | | | | | | | | |
| (In thousands of tonnes) | | | | | | | | | | | | |
| Sales | | | 1,638.8 | | | | 1,634.9 | | | | 1,494.9 | |
| Production | | | 1,655.8 | | | | 1,625.7 | | | | 1,475.4 | |
| | | | | | | | | | | | | |
| Common shares (millions) | | | | | | | | | | | | |
| At period-end | | | 381.9 | | | | 381.8 | | | | 381.8 | |
| Weighted average | | | 381.9 | | | | 381.8 | | | | 381.8 | |
| 1 | Refer to section 15,Changes in accounting policies, for a discussion of the change in our policy with respect to classification of gains and losses on certain of our derivative financial instruments and translation of foreign currency-denominated working capital balances effective January 1, 2010. Prior period comparative information has been restated. |
| 2 | Refer to section 13, Non-GAAP measures. |
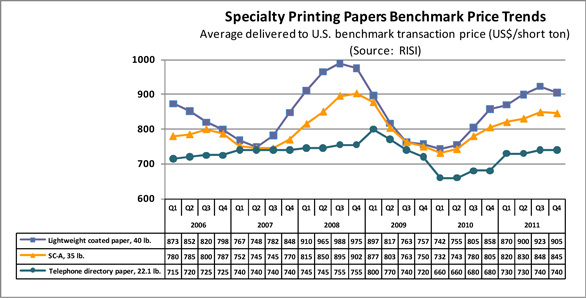
Market Overview
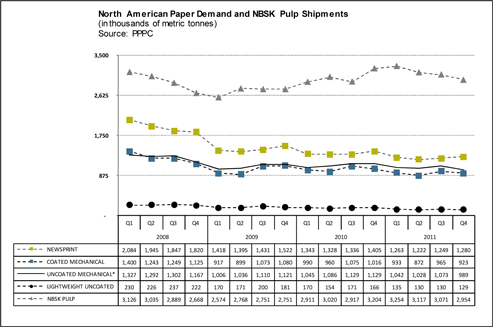
* Uncoated mechanical is comprised of high-gloss and standard grades.
| 10 Management’s Discussion and Analysis - February 29, 2012 | |
North American demand for all paper grades decreased in 2011 and inventory levels for most paper grades increased. Recent mill curtailments and closures helped to offset lower demand and support price momentum. North American demand for uncoated mechanical grades declined slightly in the year while demand reductions for coated mechanical, directory paper and newsprint were more significant. Benchmark prices for directory, coated, uncoated mechanical and newsprint increased for the year.
The global market for NBSK pulp increased due to very strong demand from China which more than offset declining demand in Europe and North America. NBSK pulp benchmark prices increased for most of the year due to the strong Asian market. Shipments slipped and prices declined significantly in the fourth quarter due to excess pulp inventory and reduced demand in China.
Impairment of Canadian Operations
We recorded an impairment charge of $660.2 million on the buildings, plant and equipment of our Canadian operations. Continuing declines in demand for newsprint and directory, economic slowdown in the United States and globally and the strengthening of the Canadian dollar for most of the year were all indications of possible impairment. A reduction in pulp prices in the fourth quarter of 2011 was a further indication of possible impairment of our pulp assets. In February 2012, a leading information provider for the global pulp and paper industry released their latest 5-year forecast for pulp and paper prices and future exchange rates. This new forecast reflected significantly lower future price estimates for pulp and paper than what had been previously forecasted. These indicators triggered a comprehensive impairment analysis of the company’s Canadian operations. The impairment reduced the carrying value of our pulp assets by $83.5 million and our paper assets by $576.7 million. Refer to note 5,Measurement uncertainty – impairment of long-lived assets, in our annual consolidated financial statements for the year ended December 31, 2011 for a description of the assumptions and estimates used to calculate this impairment charge. The table below illustrates the reduction in future price estimates for pulp and paper:
| RISI 5-Year Forecast - September 2011 | | | | | | | | | | | | | | | |
| RISI Benchmark Price (US$/MT) | | | 2012 | | | | 2013 | | | | 2014 | | | | 2015 | | | | Trend | |
| Newsprint | | | 677 | | | | 714 | | | | 765 | | | | 796 | | | | 738 | |
| Directory | | | 860 | | | | 882 | | | | 934 | | | | 971 | | | | 912 | |
| Uncoated | | | 976 | | | | 1,011 | | | | 1,039 | | | | 1,073 | | | | 1,025 | |
| LWC | | | 1,025 | | | | 1,074 | | | | 1,120 | | | | 1,156 | | | | 1,094 | |
| Pulp | | | 810 | | | | 783 | | | | 778 | | | | 926 | | | | 824 | |
| | | | | | | | | | | | | | | | | | | | | |
| RISI 5-Year Forecast - February 2012 | | | | | | | | | | | | | | | | | | | | |
| RISI Benchmark Price (US$/MT) | | | 2012 | | | | 2013 | | | | 2014 | | | | 2015 | | | | Trend | |
| Newsprint | | | 639 | | | | 669 | | | | 700 | | | | 714 | | | | 681 | |
| Directory | | | 849 | | | | 860 | | | | 899 | | | | 918 | | | | 882 | |
| Uncoated | | | 920 | | | | 969 | | | | 1,028 | | | | 1,045 | | | | 991 | |
| LWC | | | 962 | | | | 1,025 | | | | 1,096 | | | | 1,114 | | | | 1,049 | |
| Pulp | | | 717 | | | | 800 | | | | 852 | | | | 829 | | | | 799 | |
| | | | | | | | | | | | | | | | | | | | | |
| Variance (US$/MT) | | | 2012 | | | | 2013 | | | | 2014 | | | | 2015 | | | | Trend | |
| Newsprint | | | (38 | ) | | | (45 | ) | | | (65 | ) | | | (82 | ) | | | (58 | ) |
| Directory | | | (11 | ) | | | (22 | ) | | | (35 | ) | | | (53 | ) | | | (30 | ) |
| Uncoated | | | (56 | ) | | | (42 | ) | | | (11 | ) | | | (28 | ) | | | (34 | ) |
| LWC | | | (63 | ) | | | (49 | ) | | | (24 | ) | | | (42 | ) | | | (44 | ) |
| Pulp | | | (93 | ) | | | 17 | | | | 74 | | | | (97 | ) | | | (25 | ) |
| 11 Management’s Discussion and Analysis - February 29, 2012 | |
After giving effect to these charges and the impairment charges relating to the Snowflake assets described below, the company’s liabilities exceeded the book value of its assets by $617.3 million as at December 31, 2011.
Impairment of Snowflake Assets
We impaired the assets of our Snowflake mill by $161.8 million (US$155.9 million). In the third quarter, the net book value of building, machinery and equipment of US$135.6 million and maintenance supplies and spare parts inventory of US$9.7 million were written off. In the fourth quarter, land was impaired by US$10.6 million. These impairment charges included the assets of The Apache Railway Company, a subsidiary of Catalyst Paper (Snowflake) Inc.
The third quarter impairment was triggered by poor operating results and cash flow losses at our Snowflake mill that management projects will continue in the future. These losses are due primarily to deteriorating newsprint pricing and demand as well as tight market conditions for ONP resulting in higher input costs. We continue to own and use the impaired assets in our operations.
The fourth quarter impairment of land was based on an appraisal obtained from an independent third party real estate appraiser, dated January 3, 2012, that valued the Snowflake land at US$6.6 million. Refer to note 5,Measurement uncertainty – impairment of long-lives assets,in our annual consolidated financial statements for the year ended December 31, 2011 for a description of the assumptions and estimates used to calculate this impairment charge.
British Columbia Harmonized Sales Tax Extinguished
Elections B.C. announced on August 26, 2011 that provincial voters, via a mail-in ballot, defeated the Harmonized Sales Tax (HST) in a binding British Columbia sales tax referendum conducted in June and July of 2011. The elimination of the HST will have a significant negative impact on our future results. The HST had replaced the separate Provincial Sales Tax (PST) and federal Goods and Services Tax (GST) on July 1, 2010. The Province will revert back to a PST regime on April 1, 2013. Although we are not aware at this time of the details of the new PST regime, the cost impact would be approximately $11 million annually, based on actual 2011 expenditures if the previous PST regime is implemented.
Maintenance Outages and Fires
Our results were negatively impacted by fires and extended maintenance outages in the second quarter. At the Snowflake mill, a recovered paper storage yard fire, a market curtailment, and a five-day extension to a planned annual mill maintenance outage resulted in production downtime of 15 days or 8,400 tonnes of lost production. The fire at Snowflake destroyed approximately 11,000 tonnes of recovered ONP and resulted in losses of $4.4 million. At the Powell River mill, a five-day planned mill maintenance outage was extended to 10 days to address unexpected findings in the mill’s steam supply system, resulting in 14,000 tonnes of lost production. Also in the quarter at Powell River, an electrical cable equipment fire idled the mill’s No. 9 paper machine for five days and the No. 10 paper machine for 14 days and resulted in losses of $2.4 million and 8,700 tonnes of lost production.
| 12 Management’s Discussion and Analysis - February 29, 2012 | |
The losses incurred on the fires were not covered by insurance as the losses were below our policy deductible of $2 million per occurrence and our annual aggregate of $6 million with a per occurrence contribution not to exceed $3 million.
Property Tax Dispute
We paid $22.2 million of property taxes in 2011. This payment included $18.1 million municipal and provincial property taxes levied by our B.C. municipalities for 2011 as well as $4.1 million to North Cowichan for 2010 property taxes and interest. Pursuant to statutory requirements, the payment to North Cowichan was applied firstly to pay outstanding 2010 property taxes, penalties and interest in full and secondly to 2011 property taxes. As a result there are unpaid property taxes owing to North Cowichan for 2011, together with the 10% penalty for late payment, of $0.4 million at December 31, 2011. Our property tax expense and liability has been recorded based on the full amount of property taxes levied for 2011.
Our appeal to the Supreme Court of Canada regarding North Cowichan’s 2009 property taxes was dismissed on January 20, 2012. Shortly after that ruling we discontinued our proceedings disputing the 2010 and 2011 property taxes assessed by North Cowichan and as at February 29, 2012 have paid all of our unpaid property taxes and penalties owing to North Cowichan for 2011. We also discontinued our appeal in respect of the Strathcona Regional District portion of the property taxes levied by the City of Campbell River for 2010. We continue to press for a fair and sustainable level of municipal property taxes for major industry in the B.C. communities in which we operate.
Amendment and Extension of Asset Based Loan (ABL) Facility
On May 31, 2011 we amended our $330.0 million revolving asset based loan facility (ABL Facility), by reducing the amount of the facility to $175.0 million, extending the maturity date from August 13, 2013 to May 31, 2016 and removing the fixed assets of the Snowflake mill from the borrowing base under the ABL Facility. For further details on the ABL Facility amendment, refer to note 13,Long-term debt, in our annual consolidated financial statements for the year ended December 31, 2011. The ABL Facility was replaced by the DIP Facility as part of our CCAA proceedings.
| 13 Management’s Discussion and Analysis - February 29, 2012 | |
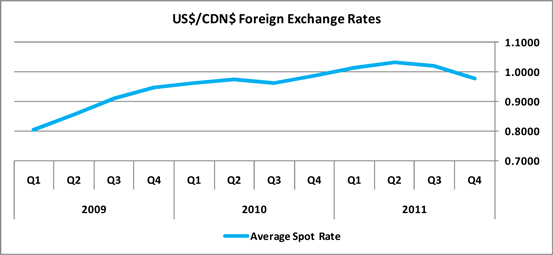
Canadian dollar
The chart below illustrates the movement of the US$/CDN$ average spot rate over the past three years:
| US$/CDN$ Exchange |
| | 2009 | 2010 | 2011 |
| | Q1 | Q2 | Q3 | Q4 | Q1 | Q2 | Q3 | Q4 | Q1 | Q2 | Q3 | Q4 |
| Average spot rate | 0.803 | 0.857 | 0.911 | 0.947 | 0.961 | 0.973 | 0.962 | 0.987 | 1.015 | 1.033 | 1.020 | 0.977 |
| Average effective rate | 0.832 | 0.860 | 0.906 | 0.934 | 0.938 | 0.949 | 0.948 | 0.982 | 1.011 | 1.032 | 1.020 | 0.977 |
| Period-end spot rate | 0.794 | 0.860 | 0.933 | 0.956 | 0.985 | 0.943 | 0.971 | 1.005 | 1.029 | 1.037 | 0.963 | 0.983 |
The majority of our sales are denominated in U.S. dollars. During 2011, the Canadian dollar strengthened significantly against the U.S. dollar for most of the year. The unfavourable movement in the average year-over-year spot rate was slightly offset by the favourable impact of our hedge positions, which helped lower our average effective exchange rate in 2011. Overall the US$/CDN$ exchange rate movements had a negative impact of $63.1 million on revenue and a negative impact of $40.5 million on EBITDA. The increase in the year-end spot rate resulted in an after-tax foreign exchange loss of $11.8 million on the translation of U.S. dollar denominated debt in 2011, compared to an after-tax foreign exchange gain of $24.2 million in 2010. We have a program in place to hedge a portion of our anticipated U.S. dollar sales, although, effective April 1, 2010, we no longer designate the positions as hedges for accounting purposes. At December 31, 2011, the notional principal of the foreign currency options and forward contracts was US$148.0 million. Refer to our annual consolidated financial statements for the year ended December 31, 2011, note 25,Financial instruments, for additional details.
| 14 Management’s Discussion and Analysis - February 29, 2012 | |
Our goal is to return to profitability and maximize cash flows through capital restructuring, reducing manufacturing costs and optimizing our brands and customer base.
PERFORMANCE METRICS
The following performance drivers are key to achieving our strategic goals and creating value for our investors:
| 1) | Financial performance and flexibility |
Our success depends on adequate liquidity and an appropriate capital structure. The ability to generate sufficient cash to maintain our operations, finance growth and service our debt and other obligations is critical.
Cash flows, liquidity and capital structure
| – | Continue to focus on cash flows, liquidity and cost reductions |
| – | Improve capital structure |
| Ø | Key performance indicators |
Key metrics to measure our ability to generate operating income and free cash flow include:
| – | EBITDA and EBITDA before restructuring costs |
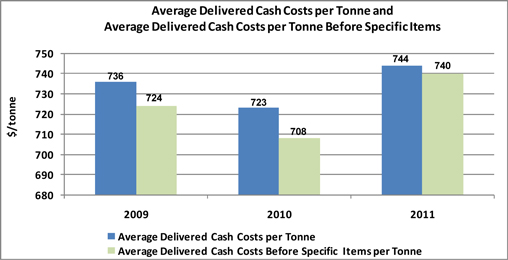
| – | Average delivered cash costs per tonne and average delivered cash costs per tonne before specific items. |
Refer to section 13,Non-GAAP measures, for definitions of these measures.
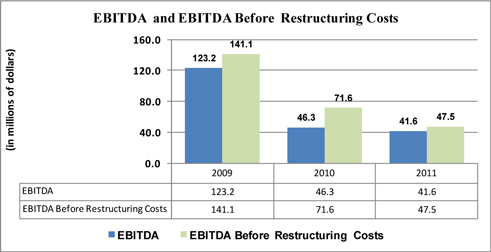
| – | EBITDA declined in 2011 mostly due to a strong Canadian dollar for most of the year, rising ONP prices, production losses due to fires and extended maintenance outages and increased maintenance spending. |
| 15 Management’s Discussion and Analysis - February 29, 2012 | |
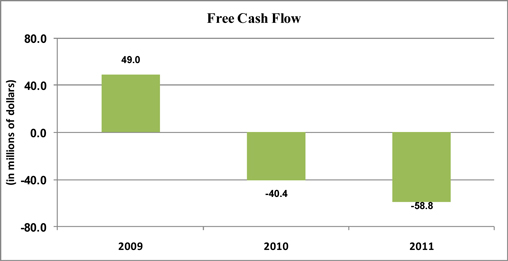
| – | Free cash flow for the year was negative $58.8 million. EBITDA of $41.6 million was more than offset by interest expense (excluding non-cash amortization) of $72.6 million, capital expenditures of $19.7 million and cash contributions to pensions and other post employment benefits in excess of the recorded expense of $8.0 million. |
| – | In February 2011 we redeemed the 8.625% senior notes that were due June 2011 for US$26.0 million. |
| – | We successfully renegotiated our ABL Facility, thereby extending the maturity date from 2013 to 2016 and reducing the amount of the Facility from $330.0 million to $175.0 million. |
| – | Inflationary pressure resulted in increases to our cost structure. The cost of chips, coating and chemicals increased significantly in 2011. |
| – | Realized annual fixed cost savings of approximately $13 million in 2011 in connection with the permanent closure of the Elk Falls mill and the Coquitlam paper recycling facility. |
| 16 Management’s Discussion and Analysis - February 29, 2012 | |
| – | Capital spending for the year was $19.7 million which included $12.9 million for maintenance of business. Prior year capital spending of $11.2 million included $6.7 million for maintenance of business. |
| 2) | Product mix and positioning |
Shifting our production mix to higher value grades, capturing a bigger share of the market, penetrating new markets and diversifying our product mix to manage fluctuations in demand to ensure that we remain competitive in a challenging marketplace.
Product mix
Continue to innovate and diversify product lines
| Ø | Key performance indicators |
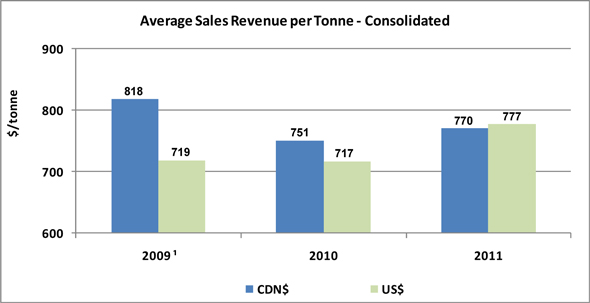
Key metrics include average sales revenue per tonne. Further details on 2011 results are provided in section 4,Consolidated results – annual,section 5,Segmented results – annual,and section 6,Consolidated and segmented results – quarterly.
| 1 | Refer to section 15,Changes in accounting policies, for a discussion of the change in our policy with respect to classification of gains and losses on certain of our derivative financial instruments and translation of foreign currency-denominated working capital balances effective January 1, 2010. Prior period comparative information has been restated. |
| – | Produced uncoated freesheet paper under trial conditions achieving generally positive results. |
| – | Completed the development of our uncoated book grades to provide a full range of caliper-controlled paper for book publishers, including initial trials of recycled book paper from our Snowflake mill. |
| – | Increased our capability to supply uncoated high bright grades to the retail insert market by expanding the production of our lightest weight grades at Crofton and Snowflake. |
| 17 Management’s Discussion and Analysis - February 29, 2012 | |
| – | Expanded capability of Snowflake to include the production of directory paper. Catalyst is now able to produce 100% recycled, FSC certified directory paper to better satisfy the demands of the largest directory publishers. |
Market position
Grow market share.
| Ø | Key performance indicators |
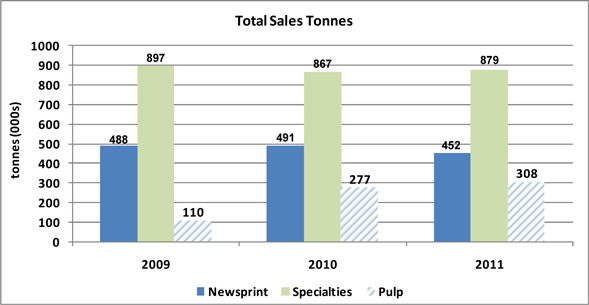
Key metrics include total sales tonnes. Further details on 2011 results are provided in section 4,Consolidated results – annual,section 5,Segmented results – annual,and section 6,Consolidated and segmented results – quarterly.
| – | Despite declining demand for most paper grades, Catalyst continued to gain market share in all of our pulp and specialty papers grade categories. New products such as Pacificote, our coated mechanical four grade, and Electrabrite Book Sage have contributed to this growth. |
| – | Renewed annual contracts with all our largest telephone directory customers at higher prices. Consolidated our position as the largest, most reliable directory producer in North America. |
| 3) | Corporate Social Responsibility |
Corporate social responsibility is a core value. We are focused on improving workplace safety, promoting better communication with employees and following conservation practices that reduce our environmental impact.
| 18 Management’s Discussion and Analysis - February 29, 2012 | |
Safety
Significantly improve safety performance. Safety is our first operating priority and was an area of renewed focus in 2011.
| Ø | Key performance indicators |
Key metrics include the medical incident rate (MIR) which is the number of incidents requiring medical attention per 200,000 hours worked, and the lost-time injury frequency (LTI) which is the number of lost-time injuries per 200,000 hours worked.

| – | Compared to historical results, there was a significant improvement in safety in 2011 though targets for the year were narrowly missed. |
| – | Safety initiatives were implemented through the year including a field hazard assessment process, a company-wide safety improvement team, and a high-impact employee safety awareness program. |
Employee communication
Enhance employee communication to promote a productive, safe and customer-focused operating environment and effective internal controls.
| Ø | Key performance indicators |
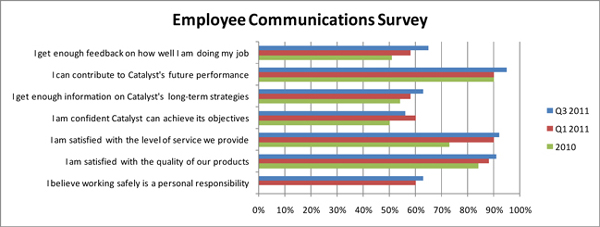
A key metric to evaluate the results of our internal communication programs is our bi-annual employee communications survey.
| 19 Management’s Discussion and Analysis - February 29, 2012 | |
| – | A number of programs were initiated in 2011 to strengthen employee communication and engagement. |
| – | Employee communications survey results showed improvements in all but one indicator as uncertainly over the future of the pulp-and-paper industry and the company’s capital structure took a toll on employee confidence in the business. |
Competitive Business Conditions
Continue to seek competitive business conditions in B.C., including joint municipal infrastructure agreements.
| Ø | Key performance indicators |
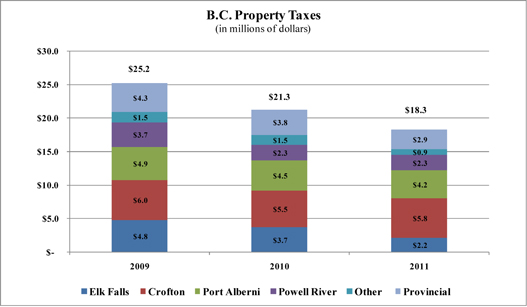
A key measure to evaluate our success in establishing more favourable business conditions is the level of municipal and provincial property taxes levied in respect of our operations in British Columbia.
| 20 Management’s Discussion and Analysis - February 29, 2012 | |
| – | Reduction in total property tax is due primarily to facility closures in 2010. Our agreement with the City of Powell River also yielded reduced property taxes. Property tax rates levied on our other B.C. facilities have not changed significantly since 2009. |
| – | Continued to implement the agreement in principle with the City of Powell River including settling service arrangements under which the City’s municipal waste would be treated using the mill’s effluent system and disposed of in the mill’s wood waste boiler. |
| – | In September 2011, the City of Powell River adopted the Revitalization Tax Exemption Program Bylaw, maintaining the mill’s annual tax payment at the agreed level for a further four years provided the annual application requirements are met. |
Capital upgrades to reduce environmental impact
Capital upgrade of $5 million at Port Alberni mill to improve combustion efficiency and environmental performance of its biomass boiler and a $13 million upgrade at Powell River mill to increase the electrical generation of the existing generator.
| Ø | Key performance indicators |
We track the progress of these upgrades based on capital and other costs incurred, the portion of these costs we get reimbursed for, environmental impact, EBITDA savings to date and anticipated EBITDA savings.

| – | We received the Green Transformation Program funding approval for these projects in February 2011. |
| – | Each of these projects is in process and scheduled to complete in advance of the March 31, 2012 spending deadline for the Pulp and Paper Green Transformation Program. Completion of these projects is expected to result in annual EBITDA improvement of $5.0 million. |
| 21 Management’s Discussion and Analysis - February 29, 2012 | |
| – | Completed close to $2 million worth of improvements to Robertson Creek dam at Port Alberni. The new dam meets all current provincial safety guidelines and protects the federal fish hatchery and properties downstream. |
Conservation practices and processes
| – | Achieve conservation targets in water and energy. |
| – | Implement Forest Stewardship Council chain of custody certification at all Canadian mills. |
| Ø | Key performance indicators |
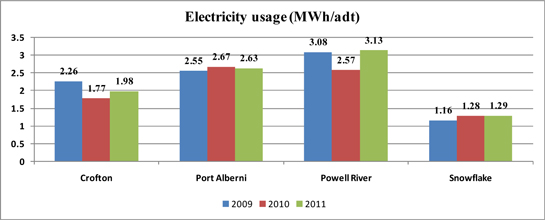
Key performance metrics include water, electricity and fuel usage. Water usage is measured as cubic meter per air-dried tonne (m3/adt). Electricity usage is measured in megawatt-hours per air-dried tonne (MWh/adt) and includes all purchased and self-generated electricity. Fuel energy usage is measured in gigajoules per air-dried tonne (GJ/adt) and includes all purchased fuels and self-generated biomass (black liquor).
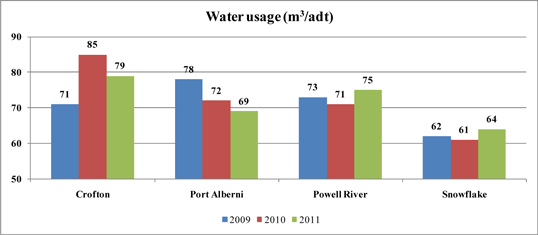
| – | Water audits completed at our Port Alberni and Crofton mills to verify usage, associated energy costs, and identify conservation opportunities through improved processes. |
| 22 Management’s Discussion and Analysis - February 29, 2012 | |
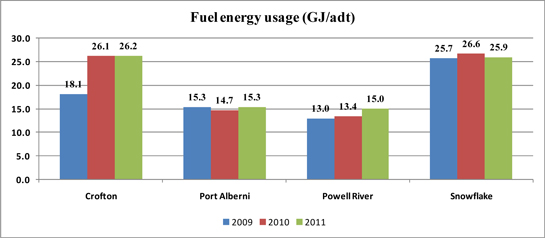
| – | Usage of both fuel energy and electricity per tonne of production were up modestly in 2011. Intensity of energy use was impacted in recent years by production curtailments and product mix. Reduced pulp production in 2009, for example, resulted in relatively low fuel-energy intensity and increased electricity intensity. |
| – | A new Energy Improvement Team is streamlining the process of moving from conservation ideas to implementation, and developing usage benchmarks and analysis based on current mill configurations. |
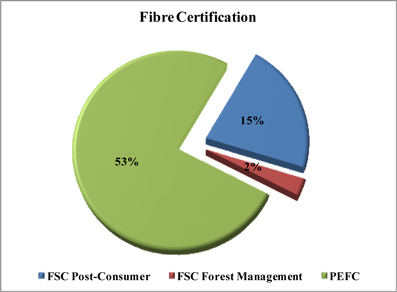
| – | 70% of our overall fibre supply is certified to a recognized standard. In addition to the Programme for the Endorsement of Forest Certification (PEFC) chain of custody, the company implemented the Forest Stewardship Council (FSC) chain of custody system at its B.C. mills to support targeted sales and marketing campaigns. The Snowflake recycled paper mill is also FSC chain of custody certified. |
See section 20,Outlook, for details of our key priorities for 2012.
| 23 Management’s Discussion and Analysis - February 29, 2012 | |
| 4 | CONSOLIDATED RESULTS - ANNUAL |
| | Consolidated results of operations |
Year ended December 31, 2011 compared to year ended December 31, 2010
Sales
Sales increased by $32.9 million in 2011 as the favourable impact of higher transaction prices for pulp and paper and increased sales volumes for pulp were partially offset by lower paper sales and the unfavourable impact of the stronger Canadian dollar.
| | The following table highlights the factors that affected our sales by segment: |
| (In millions of dollars) |
| | | Year ended December 31, | | | | | | Increase (decrease) from 2010 as a result of | |
| Sales | | 2011 | | | 2010 | | | Total
change | | | Volume | | | Price1 | | | Foreign
exchange | |
| Specialty printing papers | | $ | 718.7 | | | $ | 700.1 | | | $ | 18.6 | | | $ | 9.2 | | | $ | 44.2 | | | $ | (34.8 | ) |
| Newsprint | | | 294.8 | | | | 303.5 | | | | (8.7 | ) | | | (24.4 | ) | �� | | 28.7 | | | | (13.0 | ) |
| Total paper | | | 1,013.5 | | | | 1,003.6 | | | | 9.9 | | | | (15.2 | ) | | | 72.9 | | | | (47.8 | ) |
| Pulp | | | 248.0 | | | | 225.0 | | | | 23.0 | | | | 26.0 | | | | 12.3 | | | | (15.3 | ) |
| Total | | $ | 1,261.5 | | | $ | 1,228.6 | | | $ | 32.9 | | | $ | 10.8 | | | $ | 85.2 | | | $ | (63.1 | ) |
| 1 | Price is inclusive of sales mix. |
EBITDA and EBITDA before restructuring costs
The following table provides variances between periods for EBITDA and EBITDA before restructuring costs:
| (In millions of dollars) | | EBITDA 1 | | | EBITDA before restructuring costs1 | |
| 2010 | | $ | 46.3 | | | $ | 71.6 | |
| Paper prices | | | 72.9 | | | | 72.9 | |
| Pulp prices | | | 12.3 | | | | 12.3 | |
| Impact of Canadian dollar | | | (40.5 | ) | | | (40.5 | ) |
| Volume and mix | | | 20.5 | | | | 20.5 | |
| Furnish mix and costs | | | (41.4 | ) | | | (41.4 | ) |
| Power and fuel costs | | | (0.5 | ) | | | (0.5 | ) |
| Labour costs | | | (6.7 | ) | | | (6.7 | ) |
| Maintenance costs | | | (21.1 | ) | | | (21.1 | ) |
| Lower of cost or market impact on inventory, net of inventory change | | | (10.6 | ) | | | (10.6 | ) |
| Selling, general and administrative costs | | | 2.6 | | | | 2.6 | |
| Restructuring costs | | | 19.4 | | | | – | |
| Other, net | | | (11.6 | ) | | | (11.6 | ) |
| 2011 | | $ | 41.6 | | | $ | 47.5 | |
| 1 | Refer to section 13, Non-GAAP measures, for further details. |
Operating earnings (loss)
Operating earnings dropped by $526.9 million due to an increase in impairment and other closure costs of $529.1 and lower EBITDA of $4.7 million, partially offset by a reduction in depreciation and amortization expense of $6.9 million. Impairment and other closure costs totalled $823.6 million for 2011, consisting mostly of the impairment of the pulp and paper assets of our Canadian operations as well as the impairment of Snowflake’s assets, while $294.5 million was recognized in 2010 on the closure of the Elk Falls mill and Coquitlam paper recycling facility.
| 24 Management’s Discussion and Analysis - February 29, 2012 | |
Net earnings (loss) attributable to the company
Net loss attributable to the company increased by $577.1 million. This was primarily due to lower after-tax operating earnings driven by a $532.2 million after-tax increase in impairment and other closure costs, $6.4 million in after-tax losses we incurred on the fires at our Snowflake and Powell River mills and an after-tax foreign exchange loss on the translation of our U.S. dollar denominated debt of $11.8 million compared to an after-tax gain of $24.2 million in the previous year.
The following table reconciles 2011 net earnings (loss) attributable to the company to 2010:
| (In millions of dollars) | | Pre-tax | | | After-tax | |
| 2010 net earnings (loss) attributable to the company | | $ | (413.2 | ) | | $ | (396.9 | ) |
| Lower EBITDA before restructuring costs | | | (24.1 | ) | | | (5.6 | ) |
| Lower restructuring costs | | | 19.4 | | | | 15.4 | |
| Lower depreciation and amortization expense | | | 6.9 | | | | (22.9 | ) |
| Higher impairment charge in 2011 | | | (529.1 | ) | | | (532.2 | ) |
| Change in foreign exchange gain (loss) on long-term debt | | | (37.3 | ) | | | (36.0 | ) |
| Gain on cancellation of long-term debt in 2010 | | | (0.6 | ) | | | (0.5 | ) |
| Loss on Snowflake fire in 2011 | | | (4.4 | ) | | | (4.4 | ) |
| Loss on Powell River fire in 2011 | | | (2.4 | ) | | | (2.0 | ) |
| Lower other expense, net | | | 3.5 | | | | 3.0 | |
| Higher interest expense | | | (1.4 | ) | | | (9.2 | ) |
| Lower income tax recovery | | | – | | | | 16.0 | |
| Change in net earnings (loss) attributable to non-controlling interest | | | 1.3 | | | | 1.3 | |
| 2011 net earnings (loss) attributable to the company | | $ | (981.4 | ) | | $ | (974.0 | ) |
| 5 | SEGMENTED RESULTS - ANNUAL |
Specialty printing papers
| (In millions of dollars, except where otherwise stated) |
| | | 2011 | | | 2010 | | | 20091 | |
| Sales | | $ | 718.7 | | | $ | 700.1 | | | $ | 832.3 | |
| Operating earnings (loss) | | | (585.7 | ) | | | (147.5 | ) | | | 41.1 | |
| Depreciation and amortization | | | 81.9 | | | | 79.6 | | | | 93.8 | |
| EBITDA2 | | | 24.1 | | | | 36.5 | | | | 134.9 | |
| – before restructuring costs2 | | | 27.6 | | | | 44.7 | | | | 146.6 | |
| EBITDA margin2 | | | 3.4 | % | | | 5.2 | % | | | 16.2 | % |
| – before restructuring costs2 | | | 3.8 | % | | | 6.4 | % | | | 17.6 | % |
| | | | | | | | | | | | | |
| (In thousands of tonnes) | | | | | | | | | | | | |
| Sales | | | 878.6 | | | | 867.0 | | | | 896.5 | |
| Production | | | 883.4 | | | | 873.3 | | | | 890.6 | |
| | | | | | | | | | | | | |
| 1 | Refer to section 15,Changes in accounting policies, for a discussion of the change in our policy with respect to classification of gains and losses on certain of our derivative financial instruments and translation of foreign currency-denominated working capital balances effective January 1, 2010. Prior period comparative information has been restated. |
| 2 | Refer to section 13,Non-GAAP measures. |
| 25 Management’s Discussion and Analysis - February 29, 2012 | |
Segment Overview
| | North American demand for coated mechanical decreased 8.6% for the year due to a slowdown in the economic recovery in 2011 that resulted in reduced advertising pages in magazines and a decrease in catalogues being mailed out. While inventories increased for the year, adjusted operating rates continued to remain steady due to mill closures and other capacity shuts. The average benchmark price for lightweight coated paper (LWC) increased to US$900 per short ton from US$790 per short ton in 2010. The LWC benchmark price peaked in the third quarter of 2011 and has been dropping since that time. |
| | North American uncoated mechanical demand (high-gloss and standard grades) decreased 5.8% due to declines in print advertising and lower circulation and page counts for retail inserts. Our sales volumes rebounded in the second half of the year after the second quarter extended maintenance outage and fire at Powell River. Average benchmark prices for super-calendered A grade (SC-A) delivered to the U.S. of US$836 per short ton in 2011 increased by9.3% compared to the previous year. A series of machine closuresin the USA and Europe kept the uncoated mechanical market tight despite weak demand. |
| | We partially implemented a number of announced price increases for the year, including increases of US$40 per short ton effective April 1, 2011 and US$30 per short ton effective July 1, 2011 on all coated and high gloss grades. Additionally, we successfully implemented the majority of the June 1 US$40 per short ton and partially implemented the October 1 US$30 per short ton increase for standard uncoated mechanical grades. |
| | North American directory demand decreased 20.8% in 2011 from the prior year. Factors contributing to the precipitous decline include a reduction in the publication of white pages, smaller book sizes, lower circulation, and the continued migration from printed directory books to the Internet. Market conditions improved in the second half of the year due to the closure of significant competitive capacity in North America. At US$735 per short ton, the average directory benchmark price for the current year increased by9.7% compared to the prior year reflecting higher 2011 contract prices. We implemented a July 1, 2011 US$70 per ton price increase on our non-contract customers. The majority of our directory pricing was largely fixed for the year based on 2011 contract pricing. |
| 26 Management’s Discussion and Analysis - February 29, 2012 | |
Operational performance
The following chart summarizes the operating performance of our specialty printing papers segment:
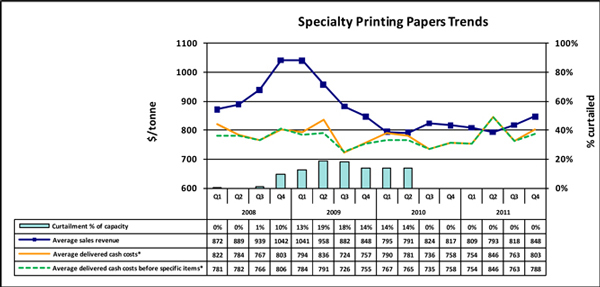
| * | Average delivered cash costs per tonne consist of cost of sales, excluding depreciation and amortization, and including the impact of SG&A and restructuring costs. Average delivered cash costs per tonne before specific items consist of cost of sales, excluding depreciation and amortization, and including the impact of SG&A, but excluding the impact of restructuring costs. |
| | The 2011 specialty printing papers product-grade distribution, based on sales volume, is depicted in the chart below: |
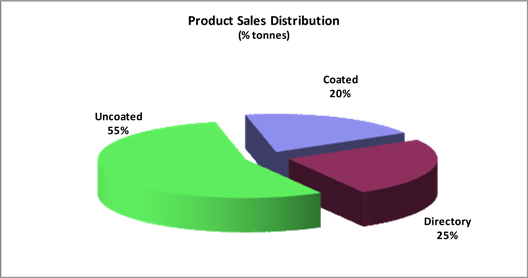
| 27 Management’s Discussion and Analysis - February 29, 2012 | |
The 2011 specialty printing papers geographic sales distribution, based on sales volume, is depicted in the chart below.
| · | Sales volume increased by 11,600 tonnes due to higher coated and uncoated sales volumes, partially offset by slightly lower directory sales volumes for the year. |
| · | Average sales revenue increased $11 per tonne, reflecting higher average transaction prices that were partially offset by the negative impact of a stronger Canadian dollar. |
| · | Average delivered cash costs increased $26 per tonne due to increased maintenance, labour, chemicals and electric power costs as well as higher furnish cost mostly due to increased cost of chips and coating. This was partially offset by a reduction in restructuring costs. |
Newsprint
| | (In millions of dollars, except where otherwise stated) |
| | | | 2011 | | | 2010 | | | 20091 | |
| | Sales | | $ | 294.8 | | | $ | 303.5 | | | $ | 320.6 | |
| | Operating earnings (loss) | | | (239.9 | ) | | | (243.7 | ) | | | (70.3 | ) |
| | Depreciation and amortization | | | 15.5 | | | | 25.4 | | | | 44.5 | |
| | EBITDA2 | | | (12.2 | ) | | | (28.2 | ) | | | (8.4 | ) |
| | – before restructuring costs2 | | | (10.7 | ) | | | (12.1 | ) | | | (5.4 | ) |
| | EBITDA margin2 | | | (4.1 | %) | | | (9.3 | %) | | | (2.6 | %) |
| | – before restructuring costs2 | | | (3.6 | %) | | | (4.0 | %) | | | (1.7 | %) |
| | | | | | | | | | | | | | |
| | (In thousands of tonnes) | | | | | | | | | | | | |
| | Sales | | | 451.7 | | | | 491.3 | | | | 488.2 | |
| | Production | | | 457.4 | | | | 479.0 | | | | 497.3 | |
| | | | | | | | | | | | | | |
| 1 | Refer to section 15,Changes in accounting policies, for a discussion of the change in our policy with respect to classification of gains and losses on certain of our derivative financial instruments and translation of foreign currency-denominated working capital balances effective January 1, 2010. Prior period comparative information has been restated. |
| 2 | Refer to section 13,Non-GAAP Measures. |
| 28 Management’s Discussion and Analysis - February 29, 2012 | |
Segment Overview
| | North American newsprint shipments were down by 6.4% in 2011. Exports fell by 5.5% as demand for newsprint around the world cooled off. North American demand declined 7.4% due to weak advertising and declining circulation. Operating rates remained similar to the prior year as North American newsprint capacity was shut at a rate to compensate for declining demand. |
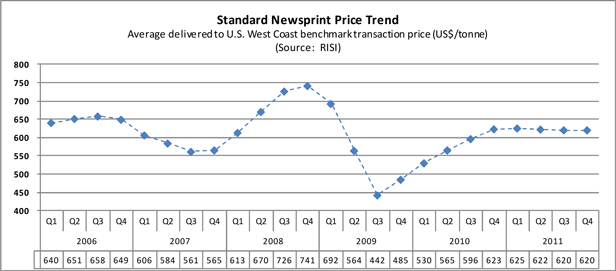
| | The average North American Newsprint benchmark price increased to US$622 per metric tonne or 7.6% compared to the previous year. No price increases were announced for 2011. |
| | The Crofton No. 1 paper machine, originally curtailed in January 2010, remained indefinitely curtailed throughout 2011, resulting in 140,000 tonnes of curtailment on an annualized basis or 23% of our 2011 newsprint capacity. |
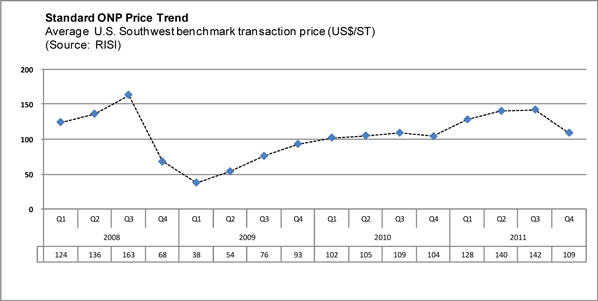
| | Strong demand from China has fuelled an upward trend in ONP prices since 2009. This price pressure has had a significant impact on the profitability of the Snowflake mill’s recycled newsprint operation. Snowflake accounted for approximately 54% of the company’s newsprint output in 2011. ONP prices peaked in the third quarter and the average Southwest benchmark price has decreased to US$109 per short ton for Q4 compared to US$142 per short ton for Q3. The recent weakening in ONP prices is primarily due to excess inventories and reduced demand from China. |
| 29 Management’s Discussion and Analysis - February 29, 2012 | |
Operational performance
The following chart summarizes the operating performance of our newsprint segment:
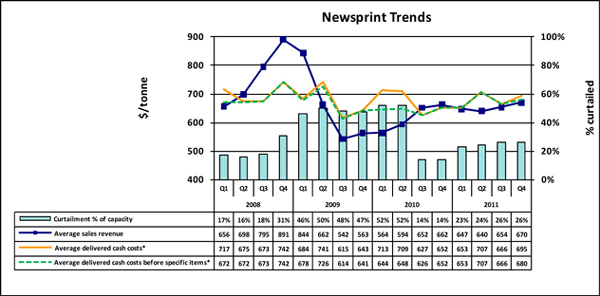
| * | Average delivered cash costs per tonne consist of cost of sales, excluding depreciation and amortization, and including the impact of SG&A and restructuring costs. Average delivered cash costs per tonne before specific items consist of cost of sales, excluding depreciation and amortization, and including the impact of SG&A, but excluding the impact of restructuring costs. |
| 30 Management’s Discussion and Analysis - February 29, 2012 | |
The 2011 newsprint geographic sales distribution, based on sales volume, is depicted in the chart below:
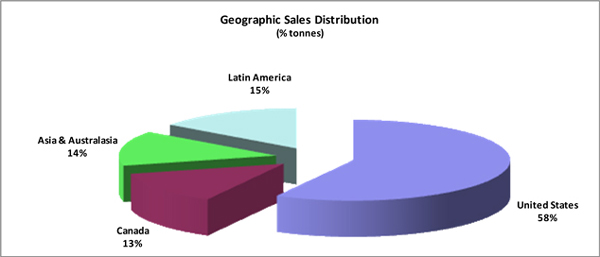
| · | Sales volume decreased by 39,600 tonnes due to declining newsprint demand, lower production resulting from the extended maintenance outage at our Snowflake mill during the second quarter of 2011 and our conversion to produce more specialty printing papers. |
| · | Average sales revenue increased $35 per tonne due to higher transaction prices, partially offset by the negative impact of the stronger Canadian dollar. |
| · | Average delivered cash costs increased $5 per tonne due to higher ONP prices and increased maintenance costs due in part to the extended maintenance outage at Snowflake, partially offset by reduced restructuring costs in the current year. |
Pulp
| | (In millions of dollars, except where otherwise stated) |
| | | | 2011 | | | 2010 | | | 20091 | |
| | Sales | | $ | 248.0 | | | $ | 225.0 | | | $ | 70.6 | |
| | Operating earnings (loss) | | | (68.8 | ) | | | 23.7 | | | | (11.6 | ) |
| | Depreciation and amortization | | | 15.0 | | | | 14.3 | | | | 8.3 | |
| | EBITDA2 | | | 29.7 | | | | 38.0 | | | | (3.3 | ) |
| | – before restructuring costs2 | | | 30.6 | | | | 39.0 | | | | (0.1 | ) |
| | EBITDA margin2 | | | 12.0 | % | | | 16.9 | % | | | (4.7 | %) |
| | – before restructuring costs2 | | | 12.3 | % | | | 17.3 | % | | | (0.1 | %) |
| | | | | | | | | | | | | | |
| | (In thousands of tonnes) | | | | | | | | | | | | |
| | Sales | | | 308.5 | | | | 276.6 | | | | 110.2 | |
| | Production | | | 315.0 | | | | 273.4 | | | | 87.5 | |
| | | | | | | | | | | | | | |
| 1 | Refer to section 15,Changes in accounting policies, for a discussion of the change in our policy with respect to classification of gains and losses on certain of our derivative financial instruments and translation of foreign currency-denominated working capital balances effective January 1, 2010. Prior period comparative information has been restated. |
| 2 | Refer to section 13,Non-GAAP measures. |
| 31 Management’s Discussion and Analysis - February 29, 2012 | |

Segment Overview
| | Global shipments of NBSK pulp grew 4.8% in 2011 compared to the previous year, driven primarily by increased demand from China which increased its demand by 30.5%. NBSK pulp markets weakened in the second half of the year as global inventories rose and demand from China weakened. The rapid increase in pulp prices seen in recent years continued in the first half of 2011 with the average NBSK benchmark price for China peaking in the second quarter at US$920 per tonne. This price declined to US$713 per tonne in Q4 due to the slowdown in Chinese buying and increase in global pulp inventories. The average benchmark price for the year of US$834 per tonne was 1.6% higher than 2010. |
| | We expanded Crofton’s pulp capacity by 25,000 tonnes to 1,120 tonnes per day (tpd) based on a plan that was approved in May. |
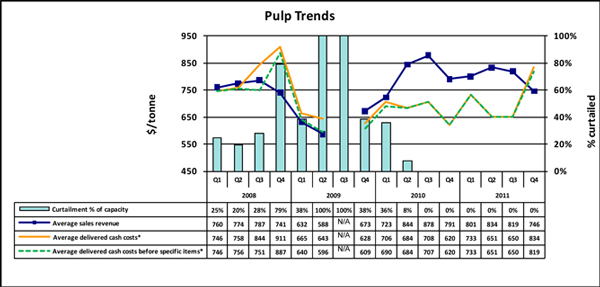
Operational performance
The following chart summarizes the operating performance of our pulp segment:
| 32 Management’s Discussion and Analysis - February 29, 2012 | |
| * | Average delivered cash costs per tonne consist of cost of sales, excluding depreciation and amortization, and including the impact of SG&A and restructuring costs. Average delivered cash costs per tonne before specific items consist of cost of sales, excluding depreciation and amortization, and including the impact of SG&A, but excluding the impact of restructuring costs. |
| | The primary market for our market pulp is Asia. The 2011 pulp geographic sales distribution, based on sales volume, is depicted in the chart below: |
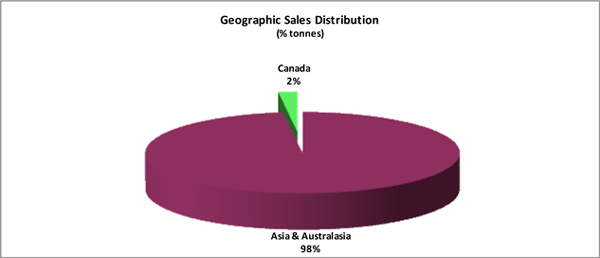
| · | Sales volume increased by 31,900 tonnes due to increased shipments to China for most of the year as well as the fact that pulp production was fully operational throughout the current year while being partially curtailed in 2010. |
| · | Average sales revenue decreased by $9 per tonne due to the negative impact of the stronger Canadian dollar that more than offset higher average transaction prices for the year. |
| · | Average delivered cash costs increased by $31 per tonne due to a write-down on pulp inventories to net realizable value as well as cost increases to freight, chips, chemicals and operating supplies. |
| 33 Management’s Discussion and Analysis - February 29, 2012 | |
| 6 | CONSOLIDATED AND SEGMENTED RESULTS - QUARTERLY |
Selected quarterly financial information
| | (In millions of dollars, except where otherwise stated) |
| | | | 2011 | | | 2010 | |
| | | | TOTAL | | | Q4 | | | Q3 | | | Q2 | | | Q1 | | | TOTAL | | | Q4 | | | Q3 | | | Q2 | | | Q1 | |
| | | | | | | | | | | | | | | | | | | | | | | | | | | | | | | | | | | | | | | | | | |
| | Sales | | $ | 1,261.5 | | | $ | 319.8 | | | $ | 340.3 | | | $ | 297.8 | | | $ | 303.6 | | | $ | 1,228.6 | | | $ | 333.6 | | | $ | 322.3 | | | $ | 299.4 | | | $ | 273.3 | |
| | | | | | | | | | | | | | | | | | | | | | | | | | | | | | | | | | | | | | | | | | |
| | Operating earnings (loss) | | | (894.4 | ) | | | (701.3 | ) | | | (151.6 | ) | | | (30.6 | ) | | | (10.9 | ) | | | (367.5 | ) | | | 0.2 | | | | 5.1 | | | | (323.9 | ) | | | (48.9 | ) |
| | | | | | | | | | | | | | | | | | | | | | | | | | | | | | | | | | | | | | | | | | |
| | Depreciation and amortization | | | 112.4 | | | | 30.8 | | | | 27.8 | | | | 27.0 | | | | 26.8 | | | | 119.3 | | | | 27.2 | | | | 28.2 | | | | 31.2 | | | | 32.7 | |
| | | | | | | | | | | | | | | | | | | | | | | | | | | | | | | | | | | | | | | | | | |
| | EBITDA1 | | | 41.6 | | | | 2.8 | | | | 26.8 | | | | (3.9 | ) | | | 15.9 | | | | 46.3 | | | | 28.7 | | | | 34.2 | | | | (0.4 | ) | | | (16.2 | ) |
| | – before restructuring costs1 | | | 47.5 | | | | 8.7 | | | | 26.8 | | | | (3.9 | ) | | | 15.9 | | | | 71.6 | | | | 28.7 | | | | 34.5 | | | | 10.5 | | | | (2.1 | ) |
| | | | | | | | | | | | | | | | | | | | | | | | | | | | | | | | | | | | | | | | | | |
| | Net earnings (loss) attributable to the company | | | (974.0 | ) | | | (708.0 | ) | | | (205.7 | ) | | | (47.4 | ) | | | (12.9 | ) | | | (396.9 | ) | | | 9.6 | | | | 6.0 | | | | (368.4 | ) | | | (44.1 | ) |
| | – before specific items1 | | | (126.3 | ) | | | (41.7 | ) | | | (14.1 | ) | | | (46.9 | ) | | | (23.6 | ) | | | (87.0 | ) | | | 4.1 | | | | (9.6 | ) | | | (43.9 | ) | | | (37.6 | ) |
| | | | | | | | | | | | | | | | | | | | | | | | | | | | | | | | | | | | | | | | | | |
| | EBITDA margin1 | | | 3.3 | % | | | 0.9 | % | | | 7.9 | % | | | (1.3 | %) | | | 5.2 | % | | | 3.8 | % | | | 8.6 | % | | | 10.6 | % | | | (0.1 | %) | | | (5.9 | %) |
| | – before restructuring costs1 | | | 3.8 | % | | | 2.7 | % | | | 7.9 | % | | | (1.3 | %) | | | 5.2 | % | | | 5.8 | % | | | 8.6 | % | | | 10.7 | % | | | 3.5 | % | | | (0.8 | %) |
| | | | | | | | | | | | | | | | | | | | | | | | | | | | | | | | | | | | | | | | | | |
| | Net earnings (loss) per share attributable to the company’s common shareholders (in dollars)
– basic and diluted | | $ | (2.55 | ) | | $ | (1.85 | ) | | $ | (0.54 | ) | | $ | (0.13 | ) | | $ | (0.03 | ) | | $ | (1.04 | ) | | $ | 0.02 | | | $ | 0.02 | | | $ | (0.96 | ) | | $ | (0.12 | ) |
| | – before specific items1 | | | (0.33 | ) | | | (0.11 | ) | | | (0.04 | ) | | | (0.12 | ) | | | (0.06 | ) | | | (0.23 | ) | | | 0.01 | | | | (0.03 | ) | | | (0.11 | ) | | | (0.10 | ) |
| | (In thousands of tonnes) | | | | | | | | | | | | | | | | | | | | | | | | | | | | | | |
| | | | | | | | | | | | | | | | | | | | | | | | | | | | | | | | | | | | | | | | | | |
| | Sales (000 tonnes) | | | | | | | | | | | | | | | | | | | | | | | | | | | | | | | | | | | | | | | | |
| | Specialty printing papers | | | 878.6 | | | | 239.3 | | | | 229.8 | | | | 202.8 | | | | 206.7 | | | | 867.0 | | | | 231.3 | | | | 220.6 | | | | 208.9 | | | | 206.2 | |
| | Newsprint | | | 451.7 | | | | 105.7 | | | | 117.8 | | | | 111.8 | | | | 116.4 | | | | 491.3 | | | | 122.8 | | | | 122.3 | | | | 123.1 | | | | 123.1 | |
| | Total paper | | | 1,330.3 | | | | 345.0 | | | | 347.6 | | | | 314.6 | | | | 323.1 | | | | 1,358.3 | | | | 354.1 | | | | 342.9 | | | | 332.0 | | | | 329.3 | |
| | Pulp | | | 308.5 | | | | 61.6 | | | | 92.2 | | | | 78.4 | | | | 76.3 | | | | 276.6 | | | | 80.0 | | | | 69.2 | | | | 72.5 | | | | 54.9 | |
| | Total sales | | | 1,638.8 | | | | 406.6 | | | | 439.8 | | | | 393.0 | | | | 399.4 | | | | 1,634.9 | | | | 434.1 | | | | 412.1 | | | | 404.5 | | | | 384.2 | |
| | | | | | | | | | | | | | | | | | | | | | | | | | | | | | | | | | | | | | | | | | |
| | Production (000 tonnes) | | | | | | | | | | | | | | | | | | | | | | | | | | | | | | | | | | | | | | | | |
| | Specialty printing papers | | | 883.4 | | | | 238.2 | | | | 230.0 | | | | 200.9 | | | | 214.3 | | | | 873.3 | | | | 225.4 | | | | 226.6 | | | | 209.1 | | | | 212.2 | |
| | Newsprint | | | 457.4 | | | | 109.3 | | | | 111.6 | | | | 111.7 | | | | 124.8 | | | | 479.0 | | | | 120.7 | | | | 120.1 | | | | 124.5 | | | | 113.7 | |
| | Total paper | | | 1,340.8 | | | | 347.5 | | | | 341.6 | | | | 312.6 | | | | 339.1 | | | | 1,352.3 | | | | 346.1 | | | | 346.7 | | | | 333.6 | | | | 325.9 | |
| | Pulp | | | 315.0 | | | | 73.5 | | | | 86.7 | | | | 83.5 | | | | 71.3 | | | | 273.4 | | | | 83.7 | | | | 71.0 | | | | 69.4 | | | | 49.3 | |
| | Total production | | | 1,655.8 | | | | 421.0 | | | | 428.3 | | | | 396.1 | | | | 410.4 | | | | 1,625.7 | | | | 429.8 | | | | 417.7 | | | | 403.0 | | | | 375.2 | |
| | | | | | | | | | | | | | | | | | | | | | | | | | | | | | | | | | | | | | | | | | |
| | Common shares (millions) | | | | | | | | | | | | | | | | | | | | | | | | | | | | | | | | | | | | | | | | |
| | At period-end | | | 381.9 | | | | 381.9 | | | | 381.9 | | | | 381.8 | | | | 381.8 | | | | 381.8 | | | | 381.8 | | | | 381.8 | | | | 381.8 | | | | 381.8 | |
| | Weighted average | | | 381.9 | | | | 381.9 | | | | 381.9 | | | | 381.8 | | | | 381.8 | | | | 381.8 | | | | 381.8 | | | | 381.8 | | | | 381.8 | | | | 381.8 | |
| 1 | Refer to section 13, Non-GAAP measures. |
| 34 Management’s Discussion and Analysis - February 29, 2012 | |
Summary of selected segmented quarterly financial information
| | (In millions of dollars, except where otherwise stated) |
| | | | 2011 | | | 2010 | |
| | Specialty printing papers | | TOTAL | | | Q4 | | | Q3 | | | Q2 | | | Q1 | | | TOTAL | | | Q4 | | | Q3 | | | Q2 | | | Q1 | |
| | | | | | | | | | | | | | | | | | | | | | | | | | | | | | | | | | | | | | | | | | |
| | Sales | | $ | 718.7 | | | $ | 202.8 | | | $ | 187.9 | | | $ | 160.9 | | | $ | 167.1 | | | $ | 700.1 | | | $ | 189.1 | | | $ | 181.8 | | | $ | 165.1 | | | $ | 164.1 | |
| | Operating earnings (loss) | | | (585.7 | ) | | | (522.5 | ) | | | (26.7 | ) | | | (29.3 | ) | | | (7.2 | ) | | | (147.5 | ) | | | (5.3 | ) | | | (1.8 | ) | | | (120.1 | ) | | | (20.3 | ) |
| | Depreciation and amortization | | | 81.9 | | | | 25.0 | | | | 19.6 | | | | 18.8 | | | | 18.5 | | | | 79.6 | | | | 18.5 | | | | 20.8 | | | | 19.0 | | | | 21.3 | |
| | EBITDA1 | | | 24.1 | | | | 10.8 | | | | 12.6 | | | | (10.6 | ) | | | 11.3 | | | | 36.5 | | | | 13.8 | | | | 19.5 | | | | 2.2 | | | | 1.0 | |
| | – before restructuring costs1 | | | 27.6 | | | | 14.3 | | | | 12.6 | | | | (10.6 | ) | | | 11.3 | | | | 44.7 | | | | 13.8 | | | | 19.6 | | | | 5.5 | | | | 5.8 | |
| | EBITDA margin1 | | | 3.4 | % | | | 5.3 | % | | | 6.7 | % | | | (6.6 | %) | | | 6.8 | % | | | 5.2 | % | | | 7.3 | % | | | 10.7 | % | | | 1.3 | % | | | 0.6 | % |
| | – before restructuring costs1 | | | 3.8 | % | | | 7.1 | % | | | 6.7 | % | | | (6.6 | %) | | | 6.8 | % | | | 6.4 | % | | | 7.3 | % | | | 10.8 | % | | | 3.3 | % | | | 3.5 | % |
| | Sales (000 tonnes) | | | 878.6 | | | | 239.3 | | | | 229.8 | | | | 202.8 | | | | 206.7 | | | | 867.0 | | | | 231.3 | | | | 220.6 | | | | 208.9 | | | | 206.2 | |
| | Production (000 tonnes) | | | 883.4 | | | | 238.2 | | | | 230.0 | | | | 200.9 | | | | 214.3 | | | | 873.3 | | | | 225.4 | | | | 226.6 | | | | 209.1 | | | | 212.2 | |
| | Curtailment (000 tonnes)2 | | | – | | | | – | | | | – | | | | – | | | | – | | | | 76.7 | | | | – | | | | – | | | | 38.0 | | | | 38.7 | |
| | | | | | | | | | | | | | | | | | | | | | | | | | | | | | | | | | | | | | | | | | |
| | | | | | | | | | | | | | | | | | | | | | | | | | | | | | | | | | | | | | | | | | |
| | Newsprint | | | | | | | | | | | | | | | | | | | | | | | | | | | | | | | | | | | | | | | | |
| | Sales | | $ | 294.8 | | | $ | 70.9 | | | $ | 77.0 | | | $ | 71.5 | | | $ | 75.4 | | | $ | 303.5 | | | $ | 81.2 | | | $ | 79.7 | | | $ | 73.1 | | | $ | 69.5 | |
| | Operating earnings (loss) | | | (239.9 | ) | | | (86.3 | ) | | | (136.4 | ) | | | (11.9 | ) | | | (5.3 | ) | | | (243.7 | ) | | | (4.5 | ) | | | (1.1 | ) | | | (211.8 | ) | | | (26.3 | ) |
| | Depreciation and amortization | | | 15.5 | | | | 2.2 | | | | 4.1 | | | | 4.5 | | | | 4.7 | | | | 25.4 | | | | 5.0 | | | | 3.7 | | | | 8.6 | | | | 8.1 | |
| | EBITDA1 | | | (12.2 | ) | | | (2.6 | ) | | | (1.4 | ) | | | (7.6 | ) | | | (0.6 | ) | | | (28.2 | ) | | | 1.2 | | | | 3.0 | | | | (14.2 | ) | | | (18.2 | ) |
| | – before restructuring costs1 | | | (10.7 | ) | | | (1.1 | ) | | | (1.4 | ) | | | (7.6 | ) | | | (0.6 | ) | | | (12.1 | ) | | | 1.2 | | | | 3.1 | | | | (6.7 | ) | | | (9.7 | ) |
| | EBITDA margin1 | | | (4.1 | %) | | | (3.7 | %) | | | (1.8 | %) | | | (10.6 | %) | | | (0.8 | %) | | | (9.3 | %) | | | 1.5 | % | | | 3.8 | % | | | (19.4 | %) | | | (26.2 | %) |
| | – before restructuring costs1 | | | (3.6 | %) | | | (1.6 | %) | | | (1.8 | %) | | | (10.6 | %) | | | (0.8 | %) | | | (4.0 | %) | | | 1.5 | % | | | 3.9 | % | | | (9.2 | %) | | | (14.0 | %) |
| | Sales (000 tonnes) | | | 451.7 | | | | 105.7 | | | | 117.8 | | | | 111.8 | | | | 116.4 | | | | 491.3 | | | | 122.8 | | | | 122.3 | | | | 123.1 | | | | 123.1 | |
| | Production (000 tonnes) | | | 457.4 | | | | 109.3 | | | | 111.6 | | | | 111.7 | | | | 124.8 | | | | 479.0 | | | | 120.7 | | | | 120.1 | | | | 124.5 | | | | 113.7 | |
| | Curtailment (000 tonnes)2 | | | 150.3 | | | | 39.7 | | | | 39.8 | | | | 36.3 | | | | 34.5 | | | | 327.5 | | | | 35.3 | | | | 35.3 | | | | 128.0 | | | | 128.9 | |
| | | | | | | | | | | | | | | | | | | | | | | | | | | | | | | | | | | | | | | | | | |
| | | | | | | | | | | | | | | | | | | | | | | | | | | | | | | | | | | | | | | | | | |
| | Pulp | | | | | | | | | | | | | | | | | | | | | | | | | | | | | | | | | | | | | | | | |
| | Sales | | $ | 248.0 | | | $ | 46.1 | | | $ | 75.4 | | | $ | 65.4 | | | $ | 61.1 | | | $ | 225.0 | | | $ | 63.3 | | | $ | 60.8 | | | $ | 61.2 | | | $ | 39.7 | |
| | Operating earnings (loss) | | | (68.8 | ) | | | (92.5 | ) | | | 11.5 | | | | 10.6 | | | | 1.6 | | | | 23.7 | | | | 10.0 | | | | 8.0 | | | | 8.0 | | | | (2.3 | ) |
| | Depreciation and amortization | | | 15.0 | | | | 3.6 | | | | 4.1 | | | | 3.7 | | | | 3.6 | | | | 14.3 | | | | 3.7 | | | | 3.7 | | | | 3.6 | | | | 3.3 | |
| | EBITDA1 | | | 29.7 | | | | (5.4 | ) | | | 15.6 | | | | 14.3 | | | | 5.2 | | | | 38.0 | | | | 13.7 | | | | 11.7 | | | | 11.6 | | | | 1.0 | |
| | – before restructuring costs1 | | | 30.6 | | | | (4.5 | ) | | | 15.6 | | | | 14.3 | | | | 5.2 | | | | 39.0 | | | | 13.7 | | | | 11.8 | | | | 11.7 | | | | 1.8 | |
| | EBITDA margin1 | | | 12.0 | % | | | (11.7 | %) | | | 20.7 | % | | | 21.9 | % | | | 8.5 | % | | | 16.9 | % | | | 21.6 | % | | | 19.2 | % | | | 19.0 | % | | | 2.5 | % |
| | – before restructuring costs1 | | | 12.3 | % | | | (9.8 | %) | | | 20.7 | % | | | 21.9 | % | | | 8.5 | % | | | 17.3 | % | | | 21.6 | % | | | 19.4 | % | | | 19.1 | % | | | 4.5 | % |
| | Sales (000 tonnes) | | | 308.5 | | | | 61.6 | | | | 92.2 | | | | 78.4 | | | | 76.3 | | | | 276.6 | | | | 80.0 | | | | 69.2 | | | | 72.5 | | | | 54.9 | |
| | Production (000 tonnes) | | | 315.0 | | | | 73.5 | | | | 86.7 | | | | 83.5 | | | | 71.3 | | | | 273.4 | | | | 83.7 | | | | 71.0 | | | | 69.4 | | | | 49.3 | |
| | Curtailment (000 tonnes)2 | | | – | | | | – | | | | – | | | | – | | | | – | | | | 37.9 | | | | – | | | | – | | | | 7.2 | | | | 30.7 | |
| | | | | | | | | | | | | | | | | | | | | | | | | | | | | | | | | | | | | | | | | | |
| 1 | Refer to section 13,Non-GAAP measures. |
| 2 | Curtailment consists of downtime related to market demand. |
| 35 Management’s Discussion and Analysis - February 29, 2012 | |
Fourth quarter overview
| | Demand for the quarter was down year-over-year for most paper grades but seasonal strength, low inventories, and high operating rates resulted in similar pricing compared to Q3. Directory and newsprint benchmark prices remained stable quarter-over-quarter while benchmark prices declined for coated and uncoated mechanical. Market conditions for pulp deteriorated significantly in the fourth quarter due to excess inventory and declining demand from China, with benchmark prices decreasing 15% to US$713 per tonne from US$840 per tonne in Q3. |
| | The positive impact of a weakening Canadian dollar was more than offset by a significant decline in pulp transaction prices, and lower pulp and paper shipments quarter-over-quarter. The weaker Canadian dollar resulted in a foreign exchange loss on the translation of our U.S. dollar denominated debt which negatively impacted our net earnings compared to the preceding quarter. |
| | We recorded a net loss attributable to the company of $708.0 million and a net loss attributable to the company before specific items of $41.7 million in Q4. This compared to a net loss attributable to the company of $205.7 million and a net loss attributable to the company before specific items of $14.1 million, respectively, in Q3. Specific items in Q4 included impairment and other closure costs, restructuring costs and a foreign exchange gain on the translation of U.S. dollar denominated debt. The impairment charge consisted of impairment of the pulp and paper assets of our Canadian operations, impairment of Snowflake’s land, closure costs associated with the permanent closure of the paper recycling operation and an increase to the present value of estimated future landfill rehabilitation costs in respect of our discontinued Elk Falls mill. Significant specific items in the prior quarter included an impairment charge on certain assets of our Snowflake mill and a foreign exchange loss on the translation of U.S. dollar denominated debt. As at December 31, 2011, the company’s liabilities exceeded the book value of its assets by $617.3 million. |
| | EBITDA was $2.8 million and EBITDA before restructuring costs was $8.7 million in Q4 compared to $26.8 million for both EBITDA and EBITDA before restructuring costs in Q3. Refer to section 13,Non-GAAP measures,for additional information on specific items in the reported financial results. |
| | Crofton No. 1 paper machine remained curtailed throughout Q4 and represented 23% of our 2011 newsprint capacity and 9% of paper capacity. |
Consolidated Results of Operations
Sales
Q4 2011 vs. Q3 2011
| | Sales revenues decreased by 6.0% primarily due to substantially lower sales volumes and transaction prices for pulp. Sales volumes for paper also declined. This was partially offset by the positive impact of a weaker Canadian dollar and increased transaction prices for paper. Increased prices for directory and uncoated were partially offset by declining prices for newsprint and coated. Increased sales volumes for our specialty grades were more than offset by a reduction in newsprint sales. |
| 36 Management’s Discussion and Analysis - February 29, 2012 | |
Q4 2011 vs. Q4 2010
| | Sales revenues decreased by 4.1% due to lower sales volumes and transaction prices for pulp and lower sales volumes for paper. This was partially offset by higher transaction prices for paper and the positive impact of a weaker Canadian dollar. Average transaction prices were higher for all of our paper grades. Increased sales volumes for our specialty grades were more than offset by declining newsprint sales. |
| | EBITDA and EBITDA before Restructuring Costs |
| | The following table provides variances between periods for EBITDA and EBITDA before restructuring costs: |
| (In millions of dollars) | | Q3 2011 | | | Q4 2010 | |
| | | | | | | |
| EBITDAin comparative period1 | | $ | 26.8 | | | $ | 28.7 | |
| Specific items: restructuring costs | | | – | | | | – | |
| EBITDAbefore restructuring costs in comparative period1 | | | 26.8 | | | | 28.7 | |
| Paper prices | | | (0.6 | ) | | | 7.0 | |
| Pulp prices | | | (6.3 | ) | | | (2.9 | ) |
| Impact of Canadian dollar | | | 6.4 | | | | 2.3 | |
| Volume and mix | | | (2.6 | ) | | | (2.1 | ) |
| Furnish mix and costs | | | 2.7 | | | | (8.7 | ) |
| Power and fuel costs | | | (3.4 | ) | | | (3.0 | ) |
| Labour costs | | | (2.2 | ) | | | 1.0 | |
| Maintenance costs | | | (4.2 | ) | | | (3.1 | ) |
| Lower of cost or market impact on inventory, net of inventory change | | | (8.5 | ) | | | (5.1 | ) |
| Selling, general and administrative | | | (2.0 | ) | | | 0.3 | |
| Other, net | | | 2.6 | | | | (5.7 | ) |
| EBITDAbefore restructuring costs in the current period1 | | | 8.7 | | | | 8.7 | |
| Specific items: restructuring costs | | | (5.9 | ) | | | (5.9 | ) |
| EBITDAin the current period1 | | $ | 2.8 | | | $ | 2.8 | |
| 1 | Refer to section 13,Non-GAAP measures. |
| | Operating Earnings (Loss) |
Q4 2011 vs. Q3 2011
Operating earnings decreased by $549.7 million primarily due to fourth quarter impairments of $660.2 million on the pulp and paper assets of our Canadian operations and $10.8 million on Snowflake's land, increased depreciation and amortization expense of $3.0 million and a reduction in EBITDA of $24.0 million, partially offset by $151.0 million impairment charge recognized in the third quarter on our Snowflake mill.
Q4 2011 vs. Q4 2010
Operating earnings declined by $701.5 million due to a decline in EBITDA of $25.9 million, increased depreciation and amortization expense of $3.6 million and increased impairment expense of $672.0 million.
| 37 Management’s Discussion and Analysis - February 29, 2012 | |
| | Net Earnings (Loss) Attributable to the Company |
Q4 2011 vs. Q3 2011
Net earnings attributable to the company declined $502.3 million primarily due to lower after-tax operating earnings of $549.7 million, the incurrence of additional expenses in respect of the fires at Snowflake and Powell River in Q2 and an after-tax foreign exchange loss of $4.9 million on the revaluation of our foreign currency denominated working capital balances, partially offset by an after-tax foreign exchange gain on the translation of long-term debt of $14.0 million compared to an after-tax loss of $41.0 million in Q3.
Q4 2011 vs. Q4 2010
Net earnings attributable to the company declined by $717.6million primarily due to decreased after-tax operating earnings of $704.2 million, a reduction in the after-tax foreign exchange gain on the translation of long-term debt of $3.5 million, additional costs related to the mill fires in Q2 and an after-tax foreign exchange loss on the revaluation of our foreign currency denominated working capital balances of $4.9 million.
| | Operational performance – Specialty Printing Papers |
Q4 2011 vs. Q3 2011
| · | Sales volume increased by 9,500 tonnes due to higher shipments of all our specialty grades. The increase was mostly attributable to uncoated mechanical which increased by 7,600 tonnes. |
| · | Average sales revenue increased $30 per tonne, reflecting an increase in average transaction prices for directory and uncoated and the positive impact of a weaker Canadian dollar. There was a moderate decline in transaction prices for coated in the current quarter. |
| · | Average delivered cash costs increased $40per tonne largely due to higher cost of steam fuel, fillers and coating, higher selling, general & administrative expenses and restructuring costs recognized in Q4 related to ongoing debt restructuring negotiations. |
Q4 2011 vs. Q4 2010
| · | Sales volume increased by 8,000 tonnes due to higher sales volumes for all specialty paper grades. |
| · | Average sales revenue increased $31 per tonne, reflecting an increase in average transaction prices for all specialty grades and the positive impact of a weaker Canadian dollar. |
| · | Average delivered cash costs increased $45 per tonne primarily due to increases in the cost of chips, fillers, coating, chemicals, electric power and steam fuel, higher selling, general & administrative expenses and restructuring costs in the fourth quarter. |
| | Operational performance – Newsprint |
Q4 2011 vs. Q3 2011
| · | Sales volumes decreased by 12,100 tonnes in the current quarter mostly due to a 5 day market curtailment over Christmas at our Snowflake mill and a shift to specialties production on our swing machines. The market curtailment was implemented to realign production and inventory levels with market demand. |
| · | Average sales revenue increased $16 per tonne due to the positive impact of a weaker Canadian dollar, partially offset by lower average transaction prices in the current quarter. |
| 38 Management’s Discussion and Analysis - February 29, 2012 | |
| · | Average delivered cash costs increased $29 per tonne due to increased maintenance spending, higher selling, general & administrative expenses and restructuring costs in the fourth quarter, partially offset by reduced ONP prices. |
Q4 2011 vs. Q4 2010
| · | Sales volumes declined by 17,100 tonnes due to a 5 day market curtailment over Christmas at our Snowflake mill, a shift to specialties production on our swing machines and a general decline in North American newsprint demand. |
| · | Average sales revenue increased $8 per tonne due to higher average transaction prices and the positive impact of a weaker Canadian dollar. |
| · | Average delivered cash costs increased $43 per tonne primarily due to increased cost of ONP, starch, electric power and operating supplies, higher selling, general & administrative expenses and restructuring costs in Q4. |
| | Operational performance – Pulp |
Q4 2011 vs. Q3 2011
| · | Sales volume decreased by 30,600 tonnes in the current quarter due to excess inventory and declining demand in China, and due to the delay of a ship that sailed in January rather than December. |
| · | Average sales revenue decreased by $73 per tonne due to significantly lower average transaction prices, partially offset by the positive impact of a weaker Canadian dollar. The lower price reflects the recent decline in China’s demand for NBSK pulp. |
| · | Average delivered cash costs increased $184 per tonne due to an inventory write-down to net realizable value, increased maintenance and labour spending due to a scheduled maintenance shut and restructuring costs in Q4. |
Q4 2011 vs. Q4 2010
| · | Sales volume decreased by 18,400 tonnes due to declining shipments to China in the current quarter. |
| · | Average sales revenue decreased $45 per tonne due to lower average transaction prices. |
| · | Average delivered cash costs increased by $214 per tonne due to an inventory write-down to net realizable value, higher chips prices, increased maintenance and labour spending and restructuring costs in the fourth quarter. |
| 39 Management’s Discussion and Analysis - February 29, 2012 | |
| | The following table highlights the significant changes between the consolidated balance sheets as at December 31, 2011, and December 31, 2010: |
| (In millions of dollars) | | | | 2011 | | | | 2010 | | | | Variance | | | Comments |
| Working capital | | | $ | 152.4 | | | $ | 212.0 | | | $ | (59.6 | ) | | Reduction reflects a $70.3 million reduction in cash on hand, a $7.7 million reduction in prepaids and a $2.9 million increase in accounts payable and accrued liabilities, partially offset by a $14.3 million increase in accounts receivable and a $7.0 million increase in inventories. The reduction in cash on hand was mostly due to negative free cash flow of $58.8million and the redemption of the remaining 2011 notes for US$26.0 million. The increase in accounts receivable was partly due to a moderate deterioration in average collections days from 32 days to 34 days as well as a foreign exchange gain on the revaluation of our foreign currency denominated receivables. Inventories increased mostly due to the delay of a pulp shipment into January, partly offset by the $10.1 million impairment of Snowflake’s maintenance supplies and spare parts inventory in Q3. |
| Property, plant and equipment | | | | 386.3 | | | | 1,285.6 | | | | (899.3 | ) | | Decrease mainly due to impairment and other closure costs of $660.2 million related to our Canadian operations and $151.7 million related to our Snowflake mill, depreciation and amortization in excess of capital expenditures in 2011 of $92.7 million, offset by foreign currency translation gain of $6.4 million related to the Snowflake mill prior to impairment. |
| Other assets | | | | 24.4 | | | | 27.0 | | | | (2.6 | ) | | Decrease mainly reflects a reduction in deferred employee relocation charges of $1.7 million and a $1.2 million reduction attributable to amortization of deferred financing costs, partially offset by deferred financing costs capitalized in respect of our amended ABL Facility. |
| Total debt | | | | 842.3 | | | | 810.9 | | | | 31.4 | | | Debt with a balance of $462.9 million was reclassified from long-term to current on December 31, 2011, consisting of $414.9 million outstanding on our 2016 Notes and $48.0 balance drawn on our ABL Facility. Refer to variance analysis in the table in “Debt” in section 8,Liquidity and capital resources. |
| Employee future benefits | | | | 305.7 | | | | 269.1 | | | | 36.6 | | | Increase reflects 2011 actuarial losses that increased our pension deficit by $43.4 million and our OPEB obligation by $5.5 million, partially offset by a US$5.1 million one-time pension contribution to wind-up a US defined benefit pension plan and an incremental pension contribution of $4.8 million in December toward funding the solvency deficit under the company’s sponsored defined benefit pension plans |
| Other long-term obligations | | | | 19.2 | | | | 20.2 | | | | (1.0 | ) | | Reflects reclassification from long-term to short-term for certain provisions. These provisions include current and future demolition projects at our Port Alberni mill and our lease obligation related to the impairment of our paper recycling facility. This is partly offset by an increase to the present value of future landfill rehabilitation expense in respect of our discontinued Elk Falls mill. |
| Future income taxes and deferred credits | | | | 13.2 | | | | 21.0 | | | | (7.8 | ) | | Change consists primarily of the $7.6 million future tax recovery on current year losses generated in Canada excluding the impairment charges. |
| 40 Management’s Discussion and Analysis - February 29, 2012 | |
| 8 | LIQUIDITY AND CAPITAL RESOURCES |
| | Selected annual financial information |
| (In millions of dollars, except where otherwise stated) |
| | | 2011 | | | 2010 | | | 20091 | |
| | | | | | | | | | |
| Cash flows provided (used) by operations before changes in non-cash working capital | | $ | (51.5 | ) | | $ | (31.6 | ) | | $ | 38.1 | |
| Changes in non-cash working capital | | | (20.0 | ) | | | (12.5 | ) | | | 65.5 | |
| Cash flows provided (used) by | | | | | | | | | | | | |
| Operations | | | (71.5 | ) | | | (44.1 | ) | | | 103.6 | |
| Investing activities | | | (17.7 | ) | | | (4.5 | ) | | | (2.9 | ) |
| Financing activities | | | 18.9 | | | | 60.9 | | | | (22.6 | ) |
| Capital spending | | | 19.7 | | | | 11.2 | | | | 11.5 | |
| Depreciation and amortization | | | 112.4 | | | | 119.3 | | | | 146.6 | |
| Impairment and other closure costs | | | 823.6 | | | | 294.5 | | | | 17.4 | |
| Capital spending as % of depreciation and amortization | | | 18 | % | | | 9 | % | | | 8 | % |
| Net debt to net capitalization at period-end2 | | | 366 | % | | | 63 | % | | | 46 | % |
| | | | | | | | | | | | | |
| 1 | Refer to section 15,Changes in accounting policies, for a discussion of the change in our policy with respect to classification of gains and losses on certain of our derivative financial instruments and translation of foreign currency-denominated working capital balances effective January 1, 2010. Prior period comparative information has been restated. |
| 2 | Net debt ratio equals net debt (total debt less cash) divided by net capitalization (shareholder’s equity attributable to the company and total debt less cash). |
| | Selected quarterly financialinformation |
| | (In millions of dollars, except where otherwise stated) |
| | | | 2011 | | | 2010 | |
| | | | TOTAL | | | Q4 | | | Q3 | | | Q2 | | | Q1 | | | TOTAL | | | Q4 | | | Q3 | | | Q2 | | | Q1 | |
| | | | | | | | | | | | | | | | | | | | | | | | | | | | | | | | |
| | Cash flows provided (used) by operations before changes in non-cash working capital | | $ | (51.5 | ) | | $ | (21.3 | ) | | $ | 5.7 | | | $ | (30.1 | ) | | $ | (5.8 | ) | | $ | (31.6 | ) | | $ | 12.1 | | | $ | 11.3 | | | $ | (20.5 | ) | | $ | (34.5 | ) |
| | Changes in non-cash working capital | | | (20.0 | ) | | | 17.3 | | | | (44.5 | ) | | | 14.4 | | | | (7.2 | ) | | | (12.5 | ) | | | 3.9 | | | | (16.7 | ) | | | (4.4 | ) | | | 4.7 | |
| | Cash flows provided (used) by | | | | | | | | | | | | | | | | | | | | | | | | | | | | | | | | | | | | | | | | |
| | Operations | | | (71.5 | ) | | | (4.0 | ) | | | (38.8 | ) | | | (15.7 | ) | | | (13.0 | ) | | | (44.1 | ) | | | 16.0 | | | | (5.4 | ) | | | (24.9 | ) | | | (29.8 | ) |
| | Investing activities | | | (17.7 | ) | | | (5.0 | ) | | | (4.9 | ) | | | (5.2 | ) | | | (2.6 | ) | | | (4.5 | ) | | | (2.7 | ) | | | (3.4 | ) | | | (1.8 | ) | | | 3.4 | |
| | Financing activities | | | 18.9 | | | | 16.3 | | | | 31.3 | | | | (2.7 | ) | | | (26.0 | ) | | | 60.9 | | | | (0.2 | ) | | | (9.7 | ) | | | 68.8 | | | | 2.0 | |
| | Capital spending | | | 19.7 | | | | 6.2 | | | | 5.6 | | | | 5.6 | | | | 2.3 | | | | 11.2 | | | | 2.8 | | | | 2.4 | | | | 2.8 | | | | 3.2 | |
| | Depreciation and amortization | | | 112.4 | | | | 30.8 | | | | 27.8 | | | | 27.0 | | | | 26.8 | | | | 119.3 | | | | 27.2 | | | | 28.2 | | | | 31.2 | | | | 32.7 | |
| | Impairment | | | 823.6 | | | | 673.3 | | | | 150.6 | | | | (0.3 | ) | | | – | | | | 294.5 | | | | 1.3 | | | | 0.9 | | | | 292.3 | | | | – | |
| | Capital spending as % of depreciation and amortization | | | 18 | % | | | 20 | % | | | 20 | % | | | 21 | % | | | 9 | % | | | 9 | % | | | 10 | % | | | 9 | % | | | 9 | % | | | 10 | % |
| | Net debt to net capitalization at period-end1 | | | 366 | % | | | 366 | % | | | 84 | % | | | 67 | % | | | 64 | % | | | 63 | % | | | 63 | % | | | 64 | % | | | 65 | % | | | 47 | % |
| | | | | | | | | | | | | | | | | | | | | | | | | | | | | | | | | | | | | | | | | | |
| 1 | Net debt ratio equals net debt (total debt less cash) divided by net capitalization (shareholder’s equity attributable to the company and total debt less cash). |
| | Our principal cash requirements are for ongoing operating costs, working capital fluctuations, and capital expenditures as well as interest and principal payments on debt. During the CCAA proceedings, we anticipate that future operating cash requirements can be funded through internally generated cash flows from operations and advances under our DIP Facility. Additional details are provided in “Capital resources” and in “Debt” below and in section 17,Risks and uncertainties, in the discussion on “We may be unable to meet our cash requirements for operations or to pay or refinance our outstanding debts as they mature, and may be unable to secure additional funding sources”. |
| 41 Management’s Discussion and Analysis - February 29, 2012 | |
| | Cash flows from operating activities in 2011 decreased $27.4 million compared to 2010 due to lower EBITDA, the losses incurred on the fires at our Snowflake and Powell River mills and an increase in working capital requirements. The $20.0 million change in non-cash working capital in the current year consisted of an increase in accounts receivable of $14.3 million and an increase in inventories of $17.1 million, partially offset by a decrease in prepaids of $7.6 million and an increase in accounts payable and accrued liabilities of $3.8million. The change in inventories excludes the impact of the third quarter impairment of Snowflake’s maintenance supplies and spare parts inventory. |
| | Cash used by investing activities was higher in 2011 by $13.2 million compared to the previous year. The increase was largely due to increased fixed asset additions and a reduction in proceeds from the sale of property, plant and equipment. Fixed asset additions in the current year related primarily to maintenance of the business. |
| | Capital spending in 2011 wassignificantly higher than 2010 levels. The components are provided below: |
| (In millions of dollars) | | 2011 | | | 2010 | |
| | | | | | | | | |
| Safety | | $ | 0.6 | | | $ | 0.8 | |
| Environment | | | 2.5 | | | | 0.3 | |
| Maintenance of business | | | 12.9 | | | | 6.7 | |
| Profit adding | | | 3.7 | | | | 3.4 | |
| Total | | $ | 19.7 | | | $ | 11.2 | |
| | Cash provided by financing activities in 2011 were$42.0 million less than 2010. This was primarily due to the issuance of Class B 11% senior secured notes in the previous year for proceeds of $98.4 million and the redemption of US$26.0 million 8.625% notes in the current year, partially offset by a net draw on the company’s amended ABL Facility of $48.0million in the current year compared to a $14.5 million reduction to our ABL Facility in the previous year and a $9.2 million outflow in 2010 to repurchase a portion of our 2011 notes. |
| | Our capital resources include cash on hand and availability on our ABL Facility, with total liquidity at period-end summarized in the following table. |
| (In millions of dollars) | | 2011 | | | 2010 | |
| | | Q4 | | | Q3 | | | Q2 | | | Q1 | | | Q4 | | | Q3 | | | Q2 | | | Q1 | |
| | | | | | | | | | | | | | | | | | | | | | | | | |
| Borrowing base1 | | $ | 151.8 | | | $ | 167.3 | | | $ | 134.3 | | | $ | 174.1 | | | $ | 152.4 | | | $ | 161.7 | | | $ | 167.8 | | | $ | 144.8 | |
| Letters of credit | | | (32.2 | ) | | | (27.7 | ) | | | (28.1 | ) | | | (25.5 | ) | | | (23.4 | ) | | | (25.1 | ) | | | (25.3 | ) | | | (24.0 | ) |
| Amount drawn, net | | | (48.0 | ) | | | (31.5 | ) | | | – | | | | – | | | | – | | | | – | | | | – | | | | (25.0 | ) |
| Minimum excess availability | | | – | | | | – | | | | – | | | | (35.0 | ) | | | (35.0 | ) | | | (35.0 | ) | | | (35.0 | ) | | | (35.0 | ) |
| Available to be drawn2 | | | 71.6 | | | | 108.1 | | | | 106.2 | | | | 113.6 | | | | 94.0 | | | | 101.6 | | | | 107.5 | | | | 60.8 | |
| Cash on hand | | | 25.1 | | | | 17.8 | | | | 30.2 | | | | 53.8 | | | | 95.4 | | | | 82.3 | | | | 100.8 | | | | 58.7 | |
| Total liquidity | | $ | 96.7 | | | $ | 125.9 | | | $ | 136.4 | | | $ | 167.4 | | | $ | 189.4 | | | $ | 183.9 | | | $ | 208.3 | | | $ | 119.5 | |
| 1 | The borrowing base at December 31, 2011 includes a reserve of $0.4 million for unpaid property taxes and associated penalties (Q3 2011 - $0.4 million, Q2 2011 - $4.5 million, Q1 2011 - $4.4 million). |
| 2 | Our ABL Facility is subject to certain financial covenants as disclosed in our annual consolidated financial statements for the year ended December 31, 2011, in note 13,Long-term debt. |
| 42 Management’s Discussion and Analysis - February 29, 2012 | |
Our total liquidity decreased by $92.7 million in 2011 due to a reduction in cash on hand and reduced availability under our amended ABL Facility. Reasons for the decline in cash on hand included the redemption of the US$26.0 million that remained of our 8.625% senior unsecured notes, incremental costs associated with fires and extended maintenance outages at our Snowflake and Powell River mills, $5.0 restructuring costs paid in respect of our debt restructuring negotiations, the payment of property taxes outstanding for 2010 of $4.1 million levied by North Cowichan in addition to 2011 property taxes of $18.1 million levied by B.C municipalities, a one-time pension contribution of US$5.1 million to wind-up a U.S. defined benefit pension plan, incremental pension contributions in December of $4.8 million to contribute toward funding the solvency deficit under the company’s sponsored defined benefit pension plans and higher working capital requirements. Working capital requirements increased in December partly due to the interest deferral on our 2016 Notes that negatively impacted vendor payment terms and resulted in a reduction to trade payables.
For information related to the computation of our borrowing base and availability on the ABL Facility, refer to our annual consolidated financial statements for the year ended December 31, 2011, note 13,Long-term debt.
At February 29, 2012, we had 381,900,450 common shares issued and outstanding and 2,159,690 stock options for 2,159,690common shares that, at February 29, 2012, were exercisable.
| | The following table illustrates the changes in our long-term debt for the year ended December 31, 2011: |
| Issue | | January 1,
2011 | | | Net increase
(decrease) | | | Foreign
exchange | | | December 31,
2011 | |
| (In millions of dollars) | | | | | | | | | | | | |
| Recourse | | | | | | | | | | | | | | | | |
| Senior notes, 8.625% due June 2011 (US$nil million; December 31, 2010 – US$26.0 million) | | $ | 25.9 | | | $ | (25.8 | ) | | $ | (0.1 | ) | | $ | - | |
| Senior notes, 7.375% due March 2014 (US$250.0 million; December 31, 2010 – US$250.0 million) | | | 251.6 | | | | (0.8 | ) | | | 5.6 | | | | 256.4 | |
| Senior secured notes, 11.0% due December 2016 (US$280.4 million) | | | 278.9 | | | | - | | | | 6.3 | | | | 285.2 | |
| Modification – difference in carrying value of 8.625% and 11.0% senior secured notes (US$38.3 million) on exchange | | | 36.2 | | | | (5.0 | ) | | | - | | | | 31.2 | |
| Class B senior secured notes, 11.0% due December 2016 (US$110.0 million) | | | 94.3 | | | | 1.7 | | | | 2.5 | | | | 98.5 | |
| Revolving asset-based loan facility of up to $175.0 million due May 2016 | | | - | | | | 48.0 | | | | - | | | | 48.0 | |
| Capital lease obligations | | | 10.2 | | | | (1.0 | ) | | | - | | | | 9.2 | |
| Non-recourse (PREI) | | | | | | | | | | | | | | | | |
| First mortgage bonds, 6.447% due July 2016 | | | 95.0 | | | | - | | | | - | | | | 95.0 | |
| Subordinated promissory notes | | | 18.8 | | | | - | | | | - | | | | 18.8 | |
| Total debt | | $ | 810.9 | | | $ | 17.1 | | | $ | 14.3 | | | $ | 842.3 | |
| Less: current portion | | | 27.0 | | | | 431.1 | | | | 8.7 | | | | 466.8 | |
| Total long-term debt | | $ | 783.9 | | | $ | (414.0 | ) | | $ | 5.6 | | | $ | 375.5 | |
We withheld an interest payment of approximately US$21 million that was due on December 15, 2011 on our 2016 Notes as described in section 2,Annual overview – 2011, under the headingCreditor protection and restructuring process. The interest deferral represented a covenant violation under the indentures that govern our 2016 Notes that had to be cured in 30 days to avoid default. The covenant violation on the 2016 Notes would have resulted in a cross-default under the terms of the ABL Facility had it not been for a 30 day waiver obtained from the ABL lenders.
| 43 Management’s Discussion and Analysis - February 29, 2012 | |
The covenant violation, which remained uncured on the date of the commencement of the creditor protection proceedings on January 31, 2012, resulted in a reclassification of the $414.9 million outstanding on the 2016 Notes and the $48.0 million balance drawn on the ABL Facility on December 31, 2011 as current debt.
As described in section 2,Annual overview – 2011, under the headingAmendment and Extension of Asset Based Loan (ABL) Facility, a DIP Facility replaced our ABL Facility as part of the CCAA proceedings. Refer to note 30,Subsequent events,in our annual consolidated financial statements for the year ended December 31, 2011for a description of the terms of the DIP Credit Facility. On May 31, 2011, the company amended its ABL Facility. In February 2011 we redeemed the 8.625% senior unsecured notes of US$26.0 million, due June 2011. For further details on amendments to the company’s debt and covenant compliance, refer to note 13,Long-term debt in our annual consolidated financial statements for the year ended December 31, 2011.
The following table presents the aggregate amount of future cash outflows for contractual obligations as of December 31, 2011, excluding amounts due for interest on outstanding indebtedness.
Payments due by period (In millions of dollars) | | 2012 | | | 2013 | | | 2014 | | | 2015 | | | 2016 | | | Thereafter | |
| Total debt, excluding capital lease obligations | | $ | 445.1 | | | $ | – | | | $ | 254.3 | | | $ | - | | | $ | 95.0 | | | $ | 18.8 | |
| Capital lease obligations | | | 3.9 | | | | 3.6 | | | | 1.7 | | | | - | | | | - | | | | - | |
| Operating leases | | | 8.0 | | | | 7.0 | | | | 6.0 | | | | 4.7 | | | | 4.7 | | | | 23.3 | |
| Other commitments | | | 0.5 | | | | – | | | | – | | | | - | | | | - | | | | - | |
| Total | | $ | 457.5 | | | $ | 10.6 | | | $ | 262.0 | | | $ | 4.7 | | | $ | 99.7 | | | $ | 42.1 | |
| | From time to time, we may purchase our debt securities in the open market. |
Credit rating
| | The table below highlights our credit ratings and outlook with Moody’s Investors Service (Moody’s), Standard & Poor’s (S&P), and Dominion Bond Rating Service (DBRS) at December 31: |
| | December 31, |
| | 2011 | 2010 | 2009 |
| | | | |
| Moody’s Investors Service | | | |
| Outlook | Under Review - Negative | Negative | Negative |
| Corporate family rating | Caa3 | Caa1 | B3 |
| Senior secured debt | Caa2 | B3 | – |
| Senior unsecured debt | Ca | Caa2 | Caa3 |
| Speculative grade liquidity | SGL-4 | SGL-4 | SGL-3 |
| Standard & Poor’s | | | |
| Outlook | Credit Watch – Negative | Stable | Credit Watch – Negative |
| Long-term corporate credit rating | SD | CCC+ | CC |
| Senior secured debt | D | CCC+ | – |
| Senior unsecured debt | C | CCC- | C |
| Dominion Bond Rating Service | | | |
| Outlook | Under Review - Negative | Negative | Under Review – Negative |
| Long-term issuer rating | C | CCCH | BL |
| Senior secured debt | CCL | BH | – |
| Senior unsecured debt | CL | CCC | CCC |
| 44 Management’s Discussion and Analysis - February 29, 2012 | |
| | Our financial instruments consist primarily of cash and cash equivalents, accounts receivable, accounts payable and accrued liabilities, long-term debt, and derivatives. Derivatives are used primarily to reduce exposure to currency risk on revenues, or occasionally debt, as well as price risk associated with revenue and energy costs.In accordance with our financial risk management program, we manage our exposure to risks through the use of financial instruments with counterparties that are of strong credit quality, normally being major financial institutions. We do not enter into financial instruments for speculative purposes. |
| | At December 31, 2011, we had foreign currency options and forward contracts with a notional principal of US$148.0 million with major financial institutions. At December 31, 2011 period-end exchange rates, these instruments were reported at their fair value of $4.5 million. |
| | For a description of the nature and extent of risk to the company from our financial instruments, as well as our respective accounting treatment of financial instruments, refer to our annual consolidated financial statements for the year ended December 31, 2011, note 25,Financial instruments, and in section 15,Changes in accounting policies,of this MD&A. For the methods and assumptions we use to determine the fair value of financial instruments, refer to note 24,Fair value measurement, of those statements. |
| | The following table reconciles the average spot exchange rate to our effective exchange rate for sales and operating expenses including the impact from cash flow hedges that were in place as at March 31, 2010 and were designated as hedging instruments at that time: |
US$/CDN$ FOREIGN EXCHANGE
| | 2011 | | | 2010 | |
| | | YTD | | | Q4 | | | Q3 | | | Q2 | | | Q1 | | | YTD | | | Q4 | | | Q3 | | | Q2 | | | Q1 | |
| | | | | | | | | | | | | | | | | | | | | | | | | | | | | | | |
| Average Bank of Canada noon spot rate | | | 1.011 | | | | 0.977 | | | | 1.020 | | | | 1.033 | | | | 1.015 | | | | 0.971 | | | | 0.987 | | | | 0.962 | | | | 0.973 | | | | 0.961 | |
| (Favourable)/unfavourable impact of derivatives designated as effective hedges for accounting purposes1 | | | (0.001 | ) | | | – | | | | – | | | | (0.001 | ) | | | (0.004 | ) | | | (0.016 | ) | | | (0.005 | ) | | | (0.014 | ) | | | (0.024 | ) | | | (0.023 | ) |
| Average effective rate included in EBITDA | | | 1.010 | | | | 0.977 | | | | 1.020 | | | | 1.032 | | | | 1.011 | | | | 0.955 | | | | 0.982 | | | | 0.948 | | | | 0.949 | | | | 0.938 | |
| (Favourable)/unfavourable impact of derivatives, other than those designated as effective hedges for accounting purposes, included in other expenses2 | | | 0.002 | | | | (0.004 | ) | | | 0.023 | | | | (0.002 | ) | | | (0.011 | ) | | | 0.003 | | | | (0.016 | ) | | | (0.019 | ) | | | 0.051 | | | | 0.004 | |
| Foreign exchange (gain)/loss, on working capital balances, included in other expenses3 | | | (0.003 | ) | | | 0.020 | | | | (0.043 | ) | | | 0.006 | | | | 0.007 | | | | (0.001 | ) | | | 0.010 | | | | 0.008 | | | | (0.029 | ) | | | 0.000 | |
| | | | | | | | | | | | | | | | | | | | | | | | | | | | | | | | | | | | | | | | | |
| Average effective rate in net earnings/(loss) before income taxes4 | | | 1.009 | | | | 0.993 | | | | 1.000 | | | | 1.036 | | | | 1.007 | | | | 0.957 | | | | 0.976 | | | | 0.937 | | | | 0.971 | | | | 0.942 | |
| | | | | | | | | | | | | | | | | | | | | | | | | | | | | | | | | | | | | | | | | |
| (In millions of dollars) | | | | | | | | | | | | | | | | | | | | | | | | | | | | | | | | | | | | | | | | |
| 1 Favourable/(unfavourable) impact of derivatives designated as effective hedges for accounting purposes included in EBITDA | | $ | 1.5 | | | | 0.1 | | | $ | 0.2 | | | $ | 0.3 | | | $ | 0.9 | | | $ | 15.2 | | | $ | 1.3 | | | $ | 3.8 | | | $ | 5.2 | | | $ | 4.9 | |
| 2 Favourable/(unfavourable) impact of derivatives other than those designated as effective hedges for accounting purposes included in other expenses | | | (2.1 | ) | | | 0.9 | | | | (5.8 | ) | | | 0.3 | | | | 2.5 | | | | (3.0 | ) | | | 4.2 | | | | 4.9 | | | | (11.3 | ) | | | (0.8 | ) |
| 3 Foreign exchange gain/(loss) on working capital balances included in other expenses | | | 3.2 | | | | (4.9 | ) | | | 10.9 | | | | (1.2 | ) | | | (1.6 | ) | | | 1.5 | | | | (2.5 | ) | | | (2.1 | ) | | | 6.2 | | | | (0.1 | ) |
| 4 Excludes foreign exchange gain/(loss) on long term debt and $US interest expense | | | | | | | | | | | | | | | | | | | | | | | | | | | | | | | | | | | | | | | | |
| 9 | RELATED PARTY TRANSACTIONS |
TAM, together with its subsidiaries and affiliates, was a significant shareholder in the company as at December 31, 2011. We did not undertake any transactions with TAM during the year ended December 31, 2011.
| 45 Management’s Discussion and Analysis - February 29, 2012 | |
On February 16, 2012, Third Avenue Management LLC disposed of its entire investment in the company, thereby ceasing to have control or direction or beneficial ownership of any shares of the company. Refer to Note 30,Subsequent events, in our annual consolidated financial statements for the year ended December 31, 2011 for further details regarding this transaction.
Directors and employees
| | We undertake certain transactions with companies affiliated with our directors. These transactions are in the normal course of business and are on the same terms as those accorded to third parties. During 2011, we paid aggregate fees of $4.3 million to companies affiliated with our directors, primarily for the purchasing of chips and hog fuel. |
Claims for return of payments made to Quebecor World (USA)
In September, 2011, we settled the claim by Quebecor World (USA)’s (Quebecor) litigation trustee against us under the U.S. Bankruptcy Code seeking the return of approximately $18.8 million of alleged preferential payments made to us by Quebecor in the ordinary course of our trade relationship during the 90-day period preceding Quebecor’s Chapter 11 filing in 2007. The net amount paid by the Company in respect of the settlement was not material.
Claims Regarding Certain Post-Retirement Benefits
The Communications, Energy and Paperworkers Union of Canada Locals 1, 76, 592 and 686 (the “Locals”), representing hourly employees at our Powell River and Port Alberni mills, applied to the Labour Relations Board of B.C. for a declaration that we are responsible for certain post-retirement medical and extended health benefits for some retired employees who were represented by the Locals and who retired from MacMillan Bloedel Limited (MB), now doing business as Weyerhaeuser Company Ltd. (Weyerhaeuser). Pacifica Papers Inc. (Pacifica) acquired the Powell River and Port Alberni mills from MB in 1998, and it was agreed as part of that transaction that MB would remain responsible for any benefits for eligible employees who retired prior to the acquisition by Pacifica of the mills. We subsequently amalgamated with Pacifica in 2001. The Locals claim that the contractual relationships between the company, Pacifica and MB do not absolve us (as successor to Pacifica) from any obligations which may exist in respect of certain post-retirement benefits and that the successorship provisions of the Labour Relations Code imposed any such possible obligations on Pacifica at the time Pacifica acquired the mills. The Labour Relations Board declined to rule on the Locals’ application or our defense to the claim on the basis that this matter is a dispute under the collective agreement and, accordingly, a matter to be determined by arbitration. All four Locals filed grievances claiming that we are responsible for these post-retirement benefits. We do not agree with the Locals’ positions and have contested or will be contesting the grievances. Local 76’s claim was dismissed by an arbitrator on December 23, 2010. Local 686 advised us on March 29, 2011 that Local 686 was withdrawing its claim. The other two grievances are at a preliminary stage and, as at November 14, 2011 have not been scheduled. Although the extent of our liability for the remaining two claims remains unknown at this time, we estimate that the company would incur costs of between $1.0 million and $2.0 million annually to provide these additional benefits. In that case, we would seek indemnification from Weyerhaeuser.
| 46 Management’s Discussion and Analysis - February 29, 2012 | |
Short-term Incentive Plan and Benefits Claim
| In May 2010, one of our salaried employees commenced an action against us in the Supreme Court of B.C. seeking a payment under the company's 2009 Short-term Incentive Plan and damages in connection with the reduction of certain employee benefits announced in November 2009 and certification of the action as a class proceeding on behalf of all salaried employees who were entitled to Short-term Incentive Plan payments and affected by the reduction in benefits. The action was certified as a class proceeding on March 21, 2011 but only on behalf of those employees and former employees who have not provided us with releases of the claims. We intend to vigorously defend this action. Most of our employees and applicable former employees have provided us with written releases of these claims, leaving only a small number of employees and former employees who have not done so. Although it is not possible to determine the likelihood and extent of any potential liability for the remaining claims, we do not expect to incur any additional material liability in connection with this claim. This proceeding has been stayed under the terms of the court order we obtained under the CCAA on January 31, 2012. |
| | |
| For additional information, refer to our annual consolidated financial statements for the year ended December 31, 2011 note 29,Contingent liabilities. |
| 11 | OFF-BALANCESHEETARRANGEMENTS |
| | We entered into a building lease agreement in 2001 under which we would continue to make the prescribed lease payments directly to the financial institution holding the mortgage on the building in the event the lessor was no longer able to meet its contractual obligations. At December 31, 2011, the principal amount of the mortgage was $4.8 million. The agreement does not increase our liability beyond the obligations under the building lease. |
| Paper recycling plantacquisition |
| | |
| In connection with our acquisition of the paper recycling plant in Coquitlam, B.C. in December 2003, we provided an indemnity in respect of the shares that were issued to the vendors as part of the purchase price. We do not expect any claim related to this indemnity. We also provided indemnities with respect to environmental matters (other than pre-existing environmental conditions) under our lease of the land and buildings for all costs, claims and damages if we release any hazardous substances on the property or breach any of the environmental covenants under the lease or any environmental laws. This indemnity is indefinite and survives after the lease is terminated. |
| 47 Management’s Discussion and Analysis - February 29, 2012 | |
| 12 | SUMMARY OF QUARTERLY RESULTS |
| | The following table highlights selected financial information for the eight consecutive quarters ended December 31, 2011: |
| (In millions of dollars, except per share amounts) |
| | | 2011 | | | 2010 | |
| | | Q4 | | | Q3 | | | Q2 | | | Q1 | | | Q4 | | | Q3 | | | Q2 | | | Q1 | |
| | | | | | | | | | | | | | | | | | | | | | | | | |
| Sales | | $ | 319.8 | | | $ | 340.3 | | | $ | 297.8 | | | $ | 303.6 | | | $ | 333.6 | | | $ | 322.3 | | | $ | 299.4 | | | $ | 273.3 | |
| EBITDA 1 | | | 2.8 | | | | 26.8 | | | | (3.9 | ) | | | 15.9 | | | | 28.7 | | | | 34.2 | | | | (0.4 | ) | | | (16.2 | ) |
| Net earnings (loss) attributable to the company | | | (708.0 | ) | | | (205.7 | ) | | | (47.4 | ) | | | (12.9 | ) | | | 9.6 | | | | 6.0 | | | | (368.4 | ) | | | (44.1 | ) |
Net earnings (loss) per share attributable
to the company’s common shareholders
– basic and diluted | | $ | (1.85 | ) | | $ | (0.54 | ) | | $ | (0.13 | ) | | $ | (0.03 | ) | | $ | 0.02 | | | $ | 0.02 | | | $ | (0.96 | ) | | $ | (0.12 | ) |
| 1 | Refer to section 13, Non-GAAP measures. |
| | In Q1 2011, the net loss attributable to the company increased $22.5million, or $0.05 per common share, from Q4 2010, duelargely to an increase in after-tax operating loss of $13.2 million and an after-tax foreign exchange gain of $10.7 million on the translation of long-term debt in Q1, compared to an after-tax foreign exchange gain of $17.5 million in Q4 2010. |
| | In Q2 2011, net loss attributable to the company increased $34.5 million, or $0.10 per common share, from Q1. The increase was primarily related to an increase in after-tax operating loss of $20.3 million, after-tax losses on fires during the second quarter at Snowflake and Powell River of $5.3 million, increased after-tax interest expense of $2.6 million and an after-tax foreign exchange gain on the translation of long-term debt of $4.5 million in Q2 compared to an after-tax foreign exchange gain of $10.7 million in Q1. |
| | In Q3 2011, net loss attributable to the company increased $158.3 million, or $0.41 per common share from Q2, due largely to an after-tax impairment charge of $151.0 million on our Snowflake assets, increased after-tax interest expense of $3.0 million and an after-tax foreign exchange loss of $41.0 million on the translation of long-term debt compared to an after-tax foreign exchange gain of $4.5 million in Q2. This was partially offset by other income, net of tax of $5.6 million compared to negative $0.6 million in Q2, the $5.3 million after-tax losses on fires sustained in Q2 and improved operating performance that resulted in a decrease in after-tax operating loss of $29.9 million, excluding the impact of impairment and other closure cost. |
| | In Q4 2011, net loss attributable to the company increased $502.3 million, or $1.31 per common share, from Q3. This was due primarily to after-tax impairment and other closure costs of $673.3 million in the fourth quarter, consisting mostly of an impairment charge on the pulp and paper assets of our Canadian operations and an impairment charge on Snowflake’s land, after-tax restructuring costs of $5.9 million in Q4 as well as reduced after-tax operating results, excluding the impact of impairment and other closure costs, of $27.0 million. This was partially offset by a $151.0 million after-tax impairment charge on Snowflake in Q3 and an after-tax foreign exchange gain of $14.0 million on the translation of long-term debt compared to an after-tax foreign exchange loss of $41.0 million in Q3. |
| | | |
| | For summarized financial information about Powell River Energy Inc., a variable interest entity for which we are the primary beneficiary, refer to note 6,Variable interest entities, of our annual consolidated financial statements for the year ended December 31, 2011. |
| 48 Management’s Discussion and Analysis - February 29, 2012 | |
| | Management uses certain measures that are not defined by U.S. GAAP to evaluate our performance and, as a result, the measures as employed by management may not be comparable to similarly titled measures reported by other entities. These non-GAAP measures should not be considered by an investor as an alternative to their nearest respective GAAP measure. Our non-GAAP measures include operating earnings (loss), EBITDA (earnings before interest, taxes, depreciation and amortization, impairment and other closure costs, and before other non-operating income and expenses), EBITDA before restructuring costs, EBITDA margin, EBITDA margin before restructuring costs, average delivered cash costs per tonne before specific items, net earnings (loss) attributable to the company before specific items, net earnings (loss) per share attributable to the company’s common shareholders before specific items, and free cash flow. |
| | Specific items are items of an unusual or non-recurring nature, or items that are subject to material volatility based on factors outside of management’s control. Specific items include: foreign exchange gain or loss on long-term debt, gain or loss on cancellation of long-term debt, asset impairment and other closure costs, restructuring costs, unusual non-recurring items, and certain income tax adjustments. |
| 49 Management’s Discussion and Analysis - February 29, 2012 | |
| | EBITDA and EBITDA before Restructuring Costs |
| | EBITDA as defined equates to operating earnings (loss) plus depreciation and amortization and impairment and other closure costs. EBITDA margin and EBITDA margin before restructuring costs are defined as EBITDA and EBITDA before restructuring costs as a percentage of sales. These measures enable comparison of consolidated and segment operating results between periods without regard to debt service, income taxes, capital expenditure requirements, and specific items. |
| | Reconciliation of net earnings (loss) attributable to the company by year |
| (In millions of dollars) | | 2011 | | | 2010 | | | 20091 | |
| | | | | | | | | | |
| Net earnings (loss) attributable to the company as reported | | $ | (974.0 | ) | | $ | (396.9 | ) | | $ | (4.4 | ) |
| Net earnings (loss) attributable to non-controlling interest | | | (2.6 | ) | | | (1.3 | ) | | | (1.2 | ) |
| Net earnings (loss) | | | (976.6 | ) | | | (398.2 | ) | | | (5.6 | ) |
| Depreciation and amortization | | | 112.4 | | | | 119.3 | | | | 146.6 | |
| Impairment | | | 823.6 | | | | 294.5 | | | | 17.4 | |
| (Gain) loss on cancellation of long-term debt | | | – | | | | (0.6 | ) | | | (30.7 | ) |
| Foreign exchange (gain) loss on long-term debt | | | 9.7 | | | | (27.6 | ) | | | (75.3 | ) |
| Loss on Snowflake fire | | | 4.4 | | | | – | | | | – | |
| Loss on Powell River fire | | | 2.4 | | | | – | | | | – | |
| Other (income) expense, net | | | (0.3 | ) | | | 3.2 | | | | 29.1 | |
| Interest expense, net | | | 73.4 | | | | 72.0 | | | | 69.3 | |
| Income tax recovery | | | (7.4 | ) | | | (16.3 | ) | | | (27.6 | ) |
| EBITDA | | $ | 41.6 | | | $ | 46.3 | | | $ | 123.2 | |
| Restructuring costs | | | 5.9 | | | | 25.3 | | | | 17.9 | |
| EBITDA before restructuring costs | | $ | 47.5 | | | $ | 71.6 | | | $ | 141.1 | |
| 1 | Refer to section 15,Changes in accounting policies, for a discussion of the change in our policy with respect to classification of gains and losses on certain of our derivative financial instruments and translation of foreign currency-denominated working capital balances effective January 1, 2010. Prior period comparative information has been restated. |
| | Reconciliation to net earnings (loss) attributable to the company by quarter: |
| (In millions of dollars) | | 2011 | | | 2010 | |
| | | Total | | | Q4 | | | Q3 | | | Q2 | | | Q1 | | | Total | | | Q4 | | | Q3 | | | Q2 | | | Q1 | |
| | | | | | | | | | | | | | | | | | | | | | | | | | | | | | | |
| Net earnings (loss) attributable to the company | | $ | (974.0 | ) | | $ | (708.0 | ) | | $ | (205.7 | ) | | $ | (47.4 | ) | | $ | (12.9 | ) | | $ | (396.9 | ) | | $ | 9.6 | | | $ | 6.0 | | | $ | (368.4 | ) | | $ | (44.1 | ) |
| Net earnings (loss) attributable to non-controlling interest | | | (2.6 | ) | | | (2.3 | ) | | | – | | | | (0.3 | ) | | | – | | | | (1.3 | ) | | | (0.6 | ) | | | (0.4 | ) | | | 0.3 | | | | (0.6 | ) |
| Net earnings (loss) | | | (976.6 | ) | | | (710.3 | ) | | | (205.7 | ) | | | (47.7 | ) | | | (12.9 | ) | | | (398.2 | ) | | | 9.0 | | | | 5.6 | | | | (368.1 | ) | | | (44.7 | ) |
| Depreciation and amortization | | | 112.4 | | | | 30.8 | | | | 27.8 | | | | 27.0 | | | | 26.8 | | | | 119.3 | | | | 27.2 | | | | 28.2 | | | | 31.2 | | | | 32.7 | |
| Impairment | | | 823.6 | | | | 673.3 | | | | 150.6 | | | | (0.3 | ) | | | – | | | | 294.5 | | | | 1.3 | | | | 0.9 | | | | 292.3 | | | | – | |
| (Gain) loss on cancellation of long-term debt | | | – | | | | – | | | | – | | | | – | | | | – | | | | (0.6 | ) | | | – | | | | (0.6 | ) | | | – | | | | – | |
| Foreign exchange (gain) loss on long-term debt | | | 9.7 | | | | (14.0 | ) | | | 41.0 | | | | (5.1 | ) | | | (12.2 | ) | | | (27.6 | ) | | | (19.0 | ) | | | (16.3 | ) | | | 21.3 | | | | (13.6 | ) |
| Loss on Snowflake fire | | | 4.4 | | | | 0.3 | | | | – | | | | 4.1 | | | | – | | | | – | | | | – | | | | – | | | | – | | | | – | |
| Loss on Powell River fire | | | 2.4 | | | | 0.8 | | | | – | | | | 1.6 | | | | – | | | | – | | | | – | | | | – | | | | – | | | | – | |
| Other (income) expense, net | | | (0.3 | ) | | | 4.1 | | | | (5.6 | ) | | | 0.7 | | | | 0.5 | | | | 3.2 | | | | (2.4 | ) | | | (2.8 | ) | | | 4.9 | | | | 3.5 | |
| Interest expense, net | | | 73.4 | | | | 18.4 | | | | 19.0 | | | | 18.7 | | | | 17.3 | | | | 72.0 | | | | 18.2 | | | | 19.0 | | | | 18.0 | | | | 16.8 | |
| Income tax expense (recovery) | | | (7.4 | ) | | | (0.6 | ) | | | (0.3 | ) | | | (2.9 | ) | | | (3.6 | ) | | | (16.3 | ) | | | (5.6 | ) | | | 0.2 | | | | – | | | | (10.9 | ) |
| EBITDA | | $ | 41.6 | | | $ | 2.8 | | | $ | 26.8 | | | $ | (3.9 | ) | | $ | 15.9 | | | $ | 46.3 | | | $ | 28.7 | | | $ | 34.2 | | | $ | (0.4 | ) | | $ | (16.2 | ) |
| Restructuring costs | | | | | | | | | | | | | | | | | | | | | | | | | | | | | | | | | | | | | | | | |
| Specialty printing papers | | | 3.5 | | | | 3.5 | | | | – | | | | – | | | | – | | | | 8.2 | | | | – | | | | 0.1 | | | | 3.3 | | | | 4.8 | |
| Newsprint | | | 1.5 | | | | 1.5 | | | | – | | | | – | | | | – | | | | 16.1 | | | | – | | | | 0.1 | | | | 7.5 | | | | 8.5 | |
| Pulp | | | 0.9 | | | | 0.9 | | | | – | | | | – | | | | – | | | | 1.0 | | | | – | | | | 0.1 | | | | 0.1 | | | | 0.8 | |
| Total restructuring costs | | | 5.9 | | | | 5.9 | | | | – | | | | – | | | | – | | | | 25.3 | | | | – | | | | 0.3 | | | | 10.9 | | | | 14.1 | |
| EBITDA before restructuring costs | | $ | 47.5 | | | $ | 8.7 | | | $ | 26.8 | | | $ | (3.9 | ) | | $ | 15.9 | | | $ | 71.6 | | | $ | 28.7 | | | $ | 34.5 | | | $ | 10.5 | | | $ | (2.1 | ) |
| 50 Management’s Discussion and Analysis - February 29, 2012 | |
Net Earnings (Loss) Attributable to the Company before Specific Items
Specific items are defined previously, and the exclusion of such items from net earnings (loss) attributable to the company facilitates the comparison of financial results between periods.
Reconciliation to Net Earnings (Loss) Attributable to the Company by year:
| (In millions of dollars and after-taxes, except where otherwise stated) |
| | | 2011 | | | 2010 | | | 2009 | |
| | | | | | | | | | |
| Net earnings (loss) attributable to the company as reported | | $ | (974.0 | ) | | $ | (396.9 | ) | | $ | (4.4 | ) |
| | | | | | | | | | | | | |
| Specific items: | | | | | | | | | | | | |
| (Gain) loss on cancellation of long-term debt | | | – | | | | (0.5 | ) | | | (26.1 | ) |
| Foreign exchange loss (gain) on long-term debt | | | 11.8 | | | | (24.2 | ) | | | (64.0 | ) |
| Loss on Snowflake fire | | | 4.4 | | | | – | | | | – | |
| Loss on Powell River fire | | | 2.0 | | | | – | | | | – | |
| Impairment and loss on disposal | | | 823.6 | | | | 291.4 | | | | 13.1 | |
| Restructuring and change-of-control costs | | | 5.9 | | | | 21.3 | | | | 12.5 | |
| Note exchange costs | | | – | | | | 5.9 | | | | 1.5 | |
| Income tax adjustments | | | – | | | | 16.0 | | | | 8.6 | |
| | | | | | | | | | | | | |
| Net earnings (loss) attributable to the company before specific items | | $ | (126.3 | ) | | $ | (87.0 | ) | | $ | (58.8 | ) |
| | | | | | | | | | | | | |
| Net earnings (loss) per share attributable to the company’s common shareholders in dollars: | | | | | | | | | | | | |
| As reported | | $ | (2.55 | ) | | $ | (1.04 | ) | | $ | (0.01 | ) |
| Before specific items | | | (0.33 | ) | | | (0.23 | ) | | | (0.15 | ) |
Reconciliation to Net Earnings (Loss) Attributable to the Company by quarter:
| (In millions of Canadian dollars and after-taxes, except where otherwise stated) |
| | | 2011 | | | 2010 | |
| | | Total | | | Q4 | | | Q3 | | | Q2 | | | Q1 | | | Total | | | Q4 | | | Q3 | | | Q2 | | | Q1 | |
| | | | | | | | | | | | | | | | | | | | | | | | | | | | | | | |
| Net earnings (loss) attributable to the company | | $ | (974.0 | ) | | $ | (708.0 | ) | | $ | (205.7 | ) | | $ | (47.4 | ) | | $ | (12.9 | ) | | $ | (396.9 | ) | | $ | 9.6 | | | $ | 6.0 | | | $ | (368.4 | ) | | $ | (44.1 | ) |
| | | | | | | | | | | | | | | | | | | | | | | | | | | | | | | | | | | | | | | | | |
| Specific items: | | | | | | | | | | | | | | | | | | | | | | | | | | | | | | | | | | | | | | | | |
| (Gain) loss on cancellation of long-term debt | | | – | | | | – | | | | – | | | | – | | | | – | | | | (0.5 | ) | | | – | | | | (0.5 | ) | | | – | | | | – | |
| Foreign exchange loss (gain) on long-term debt | | | 11.8 | | | | (14.0 | ) | | | 41.0 | | | | (4.5 | ) | | | (10.7 | ) | | | (24.2 | ) | | | (17.5 | ) | | | (16.3 | ) | | | 21.3 | | | | (11.7 | ) |
| Loss on Snowflake fire | | | 4.4 | | | | 0.3 | | | | – | | | | 4.1 | | | | – | | | | – | | | | – | | | | – | | | | – | | | | – | |
| Loss on Powell River fire | | | 2.0 | | | | 0.8 | | | | – | | | | 1.2 | | | | – | | | | – | | | | – | | | | – | | | | – | | | | – | |
| Impairment and loss on disposal | | | 823.6 | | | | 673.3 | | | | 150.6 | | | | (0.3 | ) | | | – | | | | 291.4 | | | | (1.8 | ) | | | 0.9 | | | | 292.3 | | | | – | |
| Restructuring costs | | | 5.9 | | | | 5.9 | | | | – | | | | – | | | | – | | | | 21.3 | | | | – | | | | 0.3 | | | | 10.9 | | | | 10.1 | |
| Notes exchange costs | | | – | | | | – | | | | – | | | | – | | | | – | | | | 5.9 | | | | – | | | | – | | | | – | | | | 5.9 | |
| Income tax adjustments | | | – | | | | – | | | | – | | | | – | | | | – | | | | 16.0 | | | | 13.8 | | | | – | | | | – | | | | 2.2 | |
| | | | | | | | | | | | | | | | | | | | | | | | | | | | | | | | | | | | | | | | | |
| Net earnings (loss) attributable to the company before specific items | | $ | (126.3 | ) | | $ | (41.7 | ) | | $ | (14.1 | ) | | $ | (46.9 | ) | | $ | (23.6 | ) | | $ | (87.0 | ) | | $ | 4.1 | | | $ | (9.6 | ) | | $ | (43.9 | ) | | $ | (37.6 | ) |
| | | | | | | | | | | | | | | | | | | | | | | | | | | | | | | | | | | | | | | | | |
| Net earnings (loss) per share attributable to the company’s common shareholders in dollars: | | | | | | | | | | | | | | | | | | | | | | | | | | | | | | | | | | | | | | | | |
| As reported | | $ | (2.55 | ) | | $ | (1.85 | ) | | $ | (0.54 | ) | | $ | (0.13 | ) | | $ | (0.03 | ) | | $ | (1.04 | ) | | $ | 0.02 | | | $ | 0.02 | | | $ | (0.96 | ) | | $ | (0.12 | ) |
| Before specific items | | | (0.33 | ) | | | (0.11 | ) | | | (0.04 | ) | | | (0.12 | ) | | | (0.06 | ) | | | (0.23 | ) | | | 0.01 | | | | (0.03 | ) | | | (0.11 | ) | | | (0.10 | ) |
| 51 Management’s Discussion and Analysis - February 29, 2012 | |
Free Cash Flow
Free cash flow excludes working capital and certain other sources and uses of cash, which are disclosed in the consolidated statements of cash flows. This measure allows us to assess our ability to generate funds to repay debt and assists in cash flow forecasting.
Reconciliation to Cash Provided by Operating Activities less Cash Used by Investing Activities by year:
| (In millions of dollars) | | 2011 | | | 2010 | | | 20091 | |
| | | | | | | | | | | | | |
| Cash provided (used) by operating activities | | $ | (71.5 | ) | | $ | (44.1 | ) | | $ | 103.6 | |
| Cash used by investing activities | | | (17.7 | ) | | | (4.5 | ) | | | (2.9 | ) |
| Proceeds from the sale of property, plant and equipment and other assets | | | (1.2 | ) | | | (7.9 | ) | | | (4.5 | ) |
| Other investing activities | | | (0.8 | ) | | | 1.2 | | | | (4.1 | ) |
| Non-cash working capital changes except changes in taxes and interest | | | 42.0 | | | | 12.9 | | | | (66.6 | ) |
| Other | | | (9.6 | ) | | | 2.0 | | | | 23.5 | |
| Free cash flow | | $ | (58.8 | ) | | $ | (40.4 | ) | | $ | 49.0 | |
| 1 | Refer to section 15,Changes in accounting policies, for a discussion of the change in our policy with respect to classification of gains and losses on certain of our derivative financial instruments and translation of foreign currency-denominated working capital balances effective January 1, 2010. Prior period comparative information has been restated. |
Reconciliation to Cash Provided by Operating Activities less Cash Used by Investing Activities by Quarter:
| (In millions of dollars) | | | | | | | | | | | | | | | | | | | | | | | | | | | | | | |
| | | 2011 | | | 2010 | |
| | | Total | | | Q4 | | | Q3 | | | Q2 | | | Q1 | | | Total | | | Q4 | | | Q3 | | | Q2 | | | Q1 | |
| | | | | | | | | | | | | | | | | | | | | | | | | | | | | | | |
| Cash provided (used) by operating activities | | $ | (71.5 | ) | | $ | (4.0 | ) | | $ | (38.8 | ) | | $ | (15.7 | ) | | $ | (13.0 | ) | | $ | (44.1 | ) | | $ | 16.0 | | | $ | (5.4 | ) | | $ | (24.9 | ) | | $ | (29.8 | ) |
| Cash provided (used) by investing activities | | | (17.7 | ) | | | (5.0 | ) | | | (4.9 | ) | | | (5.2 | ) | | | (2.6 | ) | | | (4.5 | ) | | | (2.7 | ) | | | (3.4 | ) | | | (1.8 | ) | | | 3.4 | |
| Proceeds from the sale of property, plant and equipment and other assets | | | (1.2 | ) | | | (0.4 | ) | | | (0.7 | ) | | | (0.1 | ) | | | – | | | | (7.9 | ) | | | (0.7 | ) | | | (0.2 | ) | | | (0.2 | ) | | | (6.8 | ) |
| Other investing activities | | | (0.8 | ) | | | (0.8 | ) | | | – | | | | (0.3 | ) | | | 0.3 | | | | 1.2 | | | | 0.6 | | | | 1.2 | | | | (0.8 | ) | | | 0.2 | |
| Non-cash working capital changes except change in taxes and interest | | | 42.0 | | | | (1.1 | ) | | | 50.2 | | | | (18.7 | ) | | | 11.6 | | | | 12.9 | | | | (9.5 | ) | | | 21.8 | | | | 10.1 | | | | (9.5 | ) |
| Other | | | (9.6 | ) | | | (15.1 | ) | | | (4.4 | ) | | | 11.7 | | | | (1.8 | ) | | | 2.0 | | | | 3.4 | | | | (3.0 | ) | | | (4.3 | ) | | | 5.9 | |
| Free cash flow | | $ | (58.8 | ) | | $ | (26.4 | ) | | $ | 1.4 | | | $ | (28.3 | ) | | $ | (5.5 | ) | | $ | (40.4 | ) | | $ | 7.1 | | | $ | 11.0 | | | $ | (21.9 | ) | | $ | (36.6 | ) |
Management’s Calculation of Free Cash Flow by Year:
| (In millions of dollars) | | 2011 | | | 2010 | | | 20091 | |
| | | | | | | | | | | | | |
| EBITDA2 | | $ | 41.6 | | | $ | 46.3 | | | $ | 123.2 | |
| Interest expense, excluding amortization | | | (72.6 | ) | | | (72.7 | ) | | | (66.5 | ) |
| Capital expenditures | | | (19.7 | ) | | | (11.2 | ) | | | (11.5 | ) |
| Income taxes paid | | | (0.1 | ) | | | (0.4 | ) | | | (0.5 | ) |
| Employee future benefits, expense over (under) cash contributions3 | | | (8.0 | ) | | | (2.4 | ) | | | 4.3 | |
| Free cash flow | | $ | (58.8 | ) | | $ | (40.4 | ) | | $ | 49.0 | |
| 1 | Refer to section 15,Changes in accounting policies, for a discussion of the change in our policy with respect to classification of gains and losses on certain of our derivative financial instruments and translation of foreign currency-denominated working capital balances effective January 1, 2010. Prior period comparative information has been restated. |
| 2 | Refer to section 13, Non-GAAP measures. |
| 3 | Free cash flow is adjusted to reflect the cash impact of employee future benefits rather than the accounting expense which is included in EBITDA. |
| 52 Management’s Discussion and Analysis - February 29, 2012 | |
Management’s Calculation of Free Cash Flow by Quarter:
| (In millions of dollars) |
| | | 2011 | | | 2010 | |
| | | Total | | | Q4 | | | Q3 | | | Q2 | | | Q1 | | | Total | | | Q4 | | | Q3 | | | Q2 | | | Q1 | |
| | | | | | | | | | | | | | | | | | | | | | | | | | | | | | | | | | | | | | | | | |
| EBITDA | | $ | 41.6 | | | $ | 2.8 | | | $ | 26.8 | | | $ | (3.9 | ) | | $ | 15.9 | | | $ | 46.3 | | | $ | 28.7 | | | $ | 34.2 | | | $ | (0.4 | ) | | $ | (16.2 | ) |
| Interest expense, excluding amortization | | | (72.6 | ) | | | (18.4 | ) | | | (19.0 | ) | | | (17.6 | ) | | | (17.6 | ) | | | (72.7 | ) | | | (18.5 | ) | | | (19.2 | ) | | | (18.5 | ) | | | (16.5 | ) |
| Capital expenditures | | | (19.7 | ) | | | (6.2 | ) | | | (5.6 | ) | | | (5.6 | ) | | | (2.3 | ) | | | (11.2 | ) | | | (2.8 | ) | | | (2.4 | ) | | | (2.8 | ) | | | (3.2 | ) |
| Income taxes received (paid) | | | (0.1 | ) | | | (0.2 | ) | | | 0.5 | | | | (0.1 | ) | | | (0.3 | ) | | | (0.4 | ) | | | (0.2 | ) | | | (0.4 | ) | | | 0.1 | | | | 0.1 | |
| Employee future benefits, expense over (under) cash contributions1 | | | (8.0 | ) | | | (4.4 | ) | | | (1.3 | ) | | | (1.1 | ) | | | (1.2 | ) | | | (2.4 | ) | | | (0.1 | ) | | | (1.2 | ) | | | (0.3 | ) | | | (0.8 | ) |
| Free cash flow | | $ | (58.8 | ) | | $ | (26.4 | ) | | $ | 1.4 | | | $ | (28.3 | ) | | $ | (5.5 | ) | | $ | (40.4 | ) | | $ | 7.1 | | | $ | 11.0 | | | $ | (21.9 | ) | | $ | (36.6 | ) |
| 1 | Free cash flow is adjusted to reflect the cash impact of employee future benefits rather than the accounting expense which is included in EBITDA. |
| 14 | CRITICAL ACCOUNTING POLICIES AND ESTIMATES |
The preparation of financial statements in conformity with U.S. GAAP requires companies to establish accounting policies and to make estimates that affect both the amount and timing of recording of assets, liabilities, revenues and expenses. Some of these estimates require judgments about matters that are inherently uncertain.
Note 2,Summary of significant accounting policies, in the December 31, 2011 consolidated financial statements includes a summary of the significant accounting policies used in their preparation. While all of the significant accounting policies are important to the annual consolidated financial statements, some of these policies may be viewed as involving a high degree of judgment. On an ongoing basis using currently available information, management reviews its estimates, including those related to environmental and legal liabilities, impairment of long-lived assets, pension and post-retirement benefits, provision for bad and doubtful accounts, fair value measurement, and income taxes. Actual results could differ from these estimates.
The following accounting policies require management’s most difficult, subjective and complex judgments, and are subject to measurement uncertainty.
Environmental and legal liabilities
Environmental and legal liabilities are recorded when it is considered probable that a liability has been incurred and the amount of the loss can be reasonably estimated. Liabilities for environmental matters require evaluation of applicable environmental regulations and estimates of remediation alternatives and the costs thereof. Provisions for liabilities relating to legal actions and claims require judgments about projected outcomes and the range of loss, based on such factors as historical experience and recommendations of legal counsel.
As at December 31, 2011, we had a provision of $8.0million for environmental, remedial and other obligations. We expect capital expenditures relating to known environmental matters, including compliance issues and the assessment and remediation of the environmental condition of the company’s properties, will total approximately $1 million in 2012.
As at December 31, 2011, we had contingent liabilities related to an application to the Labour Relations Board for certain post-retirement benefits as well as a short-term incentive plan benefit claim. We have not recorded a liability with respect to contingent severances as the likelihood, timing and extent of any potential liability is not determinable.
| 53 Management’s Discussion and Analysis - February 29, 2012 | |
Impairment of long-lived assets
We review long-lived assets, primarily plant and equipment, for impairment when events or changes in circumstances indicate that the carrying value of these assets may not be recoverable. We test for impairment using a two-step methodology as follows:
| (i) | Determine whether the projected undiscounted future cash flows from operations exceed the net carrying amount of the assets as of the assessment date; and |
| (ii) | If assets are determined to be impaired in step (i), then such impaired assets are written down to their fair value, determined principally by using discounted future cash flows expected from their use and eventual disposition. |
| | Estimates of future cash flows and fair value require judgments, assumptions and estimates and may change over time. Due to the variables associated with judgments and assumptions used in these tests, the precision and accuracy of estimates of impairment charges are subject to significant uncertainties and may change significantly as additional information becomes known. The carrying value of long-lived assets represented approximately 52% of total assets as at December 31, 2011. If future developments were to differ adversely from management’s best estimate of key assumptions and associated cash flows, we could potentially experience future material impairment charges. |
Pension and post-retirement benefits
We maintain various employee future benefit plans, which include defined benefit pension and post-retirement benefit plans. The company retains independent actuarial firms to perform actuarial valuations of the fair value of our defined benefit pension and post-retirement benefit plan assets and benefit obligations, and to advise on the amounts to be recorded in our financial statements. This information is determined using certain assumptions, based on historical and market data that have a direct impact on the fair value of the assets and obligations and on the charges disclosed in our financial statements. These assumptions include:
| · | The discount rate, which is used to estimate the actuarial present value of the various plan obligations. The company, assisted by independent actuarial advisors, sets the discount rate assumption annually to reflect the rates available on high-quality debt instruments, with cash flows that are expected to match the timing and amount of expected benefit payments. As at December 31, 2011, a discount rate of 4.4% per year was determined by us in consultation with our independent actuarial advisors. |
| | | |
| · | The long-term return on assets used to estimate the growth in the value of invested assets available to satisfy certain obligations. The company, with the assistance of independent actuarial firms, sets the expected rate of return on plan assets annually to reflect the current view of long-term investment returns. For 2011, a rate of return of 7.0% per year was determined by management in consultation with our independent actuarial advisors. |
| | | |
| · | Salary increases used to estimate the impact that future compensation increases would have on pension and other post-retirement obligations. As at December 31, 2011, a rate of compensation increase of 2.0% per year was determined by management in consultation with our independent actuarial advisors. |
| 54 Management’s Discussion and Analysis - February 29, 2012 | |
| · | Health care trend rates and mortality rates used to estimate the impact that future health care costs would have on pension and post-retirement obligations. As at December 31, 2011, a health care trend rate of 6.0% per year was determined by management in consultation with our independent actuarial advisors. The health care trend rate is assumed to decline by 0.5% annually, and the ultimate health care trend rate is assumed to be 4.5%. |
Actual experience can vary significantly from estimates and could have a material impact on the estimated cost of employee benefit plans and future cash requirements.
The following table provides a sensitivity analysis of the assumed overall health care cost trend rate used in measuring the net pension benefit obligation, and the net obligation for other employee future benefits and related net periodic benefit cost for 2011. This sensitivity analysis should be used with caution as it is hypothetical and changes in the health care cost trend rate may not be linear.
| | | Pension benefit plans | | | Other benefit plans | |
| | | Net benefit | | | Net 2011 | | | Net benefit | | | Net 2011 | |
| (In millions of dollars) | | obligation | | | expense | | | obligation | | | Expense | |
| | | | | | | | | | | | | | | | | |
| Assumed overall health care cost trend | | | | | | | | | | | | | | | | |
| Impact of: | | | | | | | | | | | | | | | | |
| 1% increase | | | N/A | | | | N/A | | | | 19.6 | | | | 1.4 | |
| 1% decrease | | | N/A | | | | N/A | | | | (16.7 | ) | | | (2.2 | ) |
Provision for bad debts and allowance for doubtful accounts
We regularly review the collectability of our accounts receivable. We record our allowance for doubtful accounts based on our best estimate of any potentially uncollectible accounts by highlighting those that are specifically high risk and applying judgment to arrive at an estimate. Consideration is given to current economic conditions and specific customer circumstances to determine the amount of any bad debt expense to be recorded. Accounts receivable balances for individual customers could potentially be material at any given time. We manage our credit risk principally through credit policies, which include the analysis of the financial position of our customers and the regular review of their credit limits and payment terms. We also subscribe to credit insurance for a majority of our receivables, periodically purchase accounts receivable puts on certain customers, and obtain bank letters of credit for some export markets and customers. Our estimate of the required allowance is a matter of judgment and the actual loss eventually sustained may be more or less than estimated.
We recorded bad debt recovery of $1.0 million (2010 – $0.7 million recovery) for the year ended December 31, 2011. As at December 31, 2011,Accounts receivable comprised 18.3% of total assets. Included in this balance was a provision of $2.0 million for doubtful accounts, or 1.5% of accounts receivable (as at December 31, 2010 - $3.0 million for doubtful accounts, or 2.5% of accounts receivable). We believe our allowance for doubtful accounts as at December 31, 2011 is adequate to provide for probable losses existing in accounts receivable.
| 55 Management’s Discussion and Analysis - February 29, 2012 | |
We measure our derivative and non-derivative financial instruments at fair value, defined as the price that would be received from selling an asset or that would be paid to transfer a liability in an orderly transaction between market participants at the measurement date. When determining fair value measurements, we consider the principal or most advantageous market in which it would transact and consider assumptions that market participants would use when pricing the asset or liability, such as inherent risk, transfer restrictions and risk of non-performance.
An established fair value hierarchy requires the company to maximize the use of observable inputs and minimize the use of unobservable inputs when measuring fair value. A financial instrument’s categorization within the fair value hierarchy is based upon the lowest level of input that is both available and significant to the fair value measurement. Three levels of inputs may be used to measure fair value:
| | Level 1 | – | Quoted prices in active markets for identical assets or liabilities. |
| | | | |
| | Level 2 | – | Observable inputs other than quoted prices in active markets for identical assets and liabilities, such as quoted prices for identical or similar assets or liabilities in markets that are not active, or other inputs that are observable or can be corroborated by observable market data for substantially the full term of the assets or liabilities. |
| | | | |
| | Level 3 | – | Inputs that are generally unobservable and are supported by little or no market activity and that are significant to the fair value determination of the assets or liabilities. |
The determination of fair valuerequires judgments, assumptions and estimates and may change over time.
The following table presents information about the fair value of our derivative and non-derivative financial instruments not designated as hedging instruments and measured on a recurring basis at December 31:
| | | 2011 | | 2010 | | Fair value
hierarchy | | Balance sheet classification |
| | | | | | | | | | | | | | | | | |
| Assets | | | | | | | | | | | | | | | | |
| Currency contracts | | $ | 2.0 | | | $ | 7.9 | | | | 21 | | | | Prepaids and other | |
| Currency contracts | | | 2.5 | | | | 3.1 | | | | 21 | | | | Other assets | |
| Commodity contracts | | | 0.5 | | | | 0.1 | | | | 22 | | | | Prepaids and other | |
| | | $ | 5.0 | | | $ | 11.1 | | | | | | | | | |
| | | | | | | | | | | | | | | | | |
| Liabilities | | | | | | | | | | | | | | | | |
| Commodity contracts | | $ | 0.4 | | | $ | 0.1 | | | | 22 | | | | Accounts payable and accrued liabilities | |
| Commodity contracts | | | 0.2 | | | $ | – | | | | 22 | | | | Other long-term obligations | |
| | | $ | 0.6 | | | $ | 0.1 | | | | | | | | | |
Fair values of our derivatives are classified under Level 2 as they are measured as follows:
| 1 | The fair value of forward currency contracts is measured using the discounted difference between contractual rates and market future rates. Interest rates, forward market rates, and volatility are used as inputs for such valuation techniques. We incorporate credit valuation adjustments to appropriately reflect both our own non-performance risk and the counterparty’s non-performance risk in the fair value measurements. |
| 2 | The fair value of commodity swap contracts is measured using the discounted difference between contractual rates and market rates. The fair value of natural gas commodity options is measured using techniques derived from the Black-Scholes pricing model. We incorporate credit valuation adjustments to appropriately reflect both our own non-performance risk and the counterparty’s non-performance risk in the fair value measurements. |
| 56 Management’s Discussion and Analysis - February 29, 2012 | |
We no longer designate U.S. dollar revenue risk management instruments as cash flow hedges for accounting purposes effective April 1, 2010. For cash flow hedges that were in place as at March 31, 2010, the effective portion of changes in the fair value accumulated as at March 31, 2010 have been deferred and recorded inAccumulated other comprehensive loss. When the hedge item is recorded in earnings, the corresponding gain or loss on the hedge will be reclassified fromAccumulated other comprehensive losstoSales.
Income taxes
| | The amounts recorded for future income tax assets and liabilities are based on various judgments, assumptions and estimates. Future tax assets and liabilities are measured using enacted tax rates for the years in which assets and liabilities are expected to be recovered or settled. A projection of taxable income and estimates of the ultimate recovery or settlement of temporary differences are made for these years. The projection of future taxable income is based on management’s best estimate and may vary from actual. |
| | Our future tax assets are mainly composed of temporary differences relating to employee future benefits, loss carry-forwards and property, plant and equipment. Estimating the ultimate realization of the benefit of these temporary differences requires judgment. The reversal of these temporary differences is expected to be at future substantially enacted rates which could change due to changes in income tax laws. As a result, a change in the timing of reversal or in the income tax rate could materially affect the future tax expense or recovery recorded in the consolidated statement of earnings. A one-percentage-point change in our reported effective income tax rate would have minimal effect on our income tax expense or recovery. |
| | | |
| | In addition, we record provisions for federal, provincial and foreign taxes based on the respective tax laws of the jurisdictions in which we operate and on our judgment as to the appropriate allocation of income and deductions to these jurisdictions. Canadian, U.S. and international tax laws are subject to interpretation, and our judgment may be challenged by taxation authorities. In such circumstances, the final resolution can result in settlements that differ from our estimated amounts. |
| 15 | CHANGES IN ACCOUNTING POLICIES |
| | Effective January 1, 2010, we changed our policy on the classification of foreign exchange gains and losses on the ineffective portion of our derivative financial instruments, on the portion that is excluded from the assessment of hedge effectiveness, and on translation of monetary assets and liabilities denominated in foreign currencies. The respective foreign exchange gains and losses previously recognized inSalesare now recognized inOther expense, net. We continue to classify the effective portion of gains or losses on our currently designated U.S. dollar revenue risk management instruments inSales, the same income statement line item in which the hedged item is classified. |
| | In addition, we changed our policy on the classification of changes in the fair value of all derivative commodity swap agreements not designated as hedges for accounting purposes that were previously recognized inSalesandCost of sales, excluding depreciation and amortization. |
| 57 Management’s Discussion and Analysis - February 29, 2012 | |
| | The changes in the fair value related to these instruments are now recognized inOther expense, net. |
| | During 2011, we adopted the following new pronouncements issued by the Financial Accounting Standards Board (FASB): |
| · | In May 2011, the FASB issued an update on fair value measurements called Accounting Standards Update (ASU) 2011-04 to achieve convergence in this area with the International Accounting Standards Board (IASB). The update, which requires prospective adoption for annual periods beginning after December 15, 2011, requires additional quantitative disclosure of significant unobservable inputs used for level 3 fair value measurements, additional qualitative sensitivity disclosure related to measurement uncertainty for level 3 fair value measurements, removes the concepts of “highest and best use” and “valuation premise” in the measurement of financial instruments and provides greater guidance surrounding premiums and discounts. The new guidance states that premiums and discounts may be considered in the fair value measurement of level 2 and level 3 financial instruments if certain conditions are met, including that market participants would consider these premiums or discounts when transacting for the asset or liability and that application of the premium or discount is consistent with the characteristics of the asset or liability being measured. The update had no impact on our consolidated financial statements or disclosures. |
| | | |
| · | In September 2011, the FASB issued an update on multi-employer plans called ASU 2011-09. The update, which requires retrospective adoption for annual periods beginning after December 15, 2011, prescribes additional disclosure for multi-employer plans to enhance the transparency and quality of information regarding a reporting entity’s participation in such plans and the commitments and risks involved. The update has no impact on the accounting treatment of multi-employer plans other than requiring additional disclosure. We adopted ASU 2011-09 in our consolidated financial statements for the year ended December 31, 2011 and provided the additional disclosure in note 14,Employee Future Benefits. |
| 16 | IMPACT OF ACCOUNTING PRONOUNCEMENTS AFFECTING FUTURE PERIODS |
| | | |
| | There were no new pronouncements issued by the FASB that may materially impact our consolidated financial statements for future periods. |
| 58 Management’s Discussion and Analysis - February 29, 2012 | |
| 17 | RISKS AND UNCERTAINTIES |
| | We face risks and uncertainties which fall into the general business areas of markets, international commodity prices, currency exchange rates, environmental issues, fibre supply, government regulation and policy and, for Canadian companies, trade barriers and potential impacts of Aboriginal rights, including unresolved Aboriginal land claims in B.C. In addition, our proceedings under the CCAA will have a direct impact on our business. Our risks have been separated into two categories, risks relating to our restructuring process under the CCAA and risks relating to our business. |
Risks Relating to our Restructuring Process under the CCAA
We are subject to proceedings under the CCAA. Our business, operations and financial position are subject to risks and uncertainties associated with such proceedings.
During the CCAA process, our business, operations and financial condition will be subject to the risks and uncertainties associated with such proceedings, including without limitation, risks associated with our ability to:
| · | stabilize and preserve the business, develop and implement a restructuring plan in an appropriate time frame, resolve issues with creditors and other parties affected by the CCAA proceedings, obtain requisite court approvals and creditor and other required approvals for a restructuring plan and obtain any necessary court approval for sales of business units or other assets; |
| | | |
| · | generate cash from operations sufficient, together with amounts available under the DIP Facility to fund operations, operate within the restrictions and limitations of the DIP Facility, obtain sufficient exit financing to permit a satisfactory exit from the CCAA process and to realize fair value of any business units or other assets sold under the CCAA process; |
| | | |
| · | retain customers during the CCAA process, avoid reduction, delay or suspension of customer orders, maintain market share, operate our business effectively, retain key employees, attract new employees and avoid labour disputes, retain or replace major suppliers on acceptable terms, avoid disruption in sourcing goods and services required for operations, maintain suitable relationship with customers, suppliers and trade creditors and to communicate and respond in an appropriate manner to events and perceptions associated with our CCAA process; |
| | | |
| · | obtain court orders or approvals for our proposed actions, including extensions of stays of proceedings and timely approval of assets sale or other transactions outside the ordinary course of business, resolve and compromise creditor claims and other claims made against us in our CCAA proceeding, prevent third parties from obtaining court orders adverse to our interest, disclaim or terminate contracts. |
No assurance can be made as to the values that will be allocated to our pre CCAA liabilities or currently outstanding common shares. It should be recognized that our current common shares may have no value and may be cancelled under any restructuring plan or other restructuring process under our CCAA proceeding. The value of our pre CCAA liabilities and common shares is accordingly highly speculative. As at December 31, 2011, the company’s liabilities exceeded the book value of its assets by $617.3 million.
| 59 Management’s Discussion and Analysis - February 29, 2012 | |
Our proceedings under the CCAA raise significant doubt regarding our ability to continue as a going concern.
Due to the risks and uncertainties associated with proceedings under the CCAA, we cannot predict the final outcome of the restructuring process or the potential impact on our business, financial condition or results of operations. Although our CCAA proceedings and DIP financing arrangements allow us to stabilize our operations, it is not possible to predict the outcome of these proceedings or to have any assurance that we will be successful in the restructuring process. Accordingly, there is significant doubt as to whether we will be able to continue as a going concern. Our ability to continue as a going concern is dependent on market conditions and our ability to successfully develop and implement a restructuring plan, obtain alternate financing to replace the DIP Facility and restructure our obligations in a manner that allows us to obtain court approval under the CCAA. Even if the company is able to emerge from the CCAA proceedings, there can be no assurance as to the long term viability of all or any part of the enterprise or our ability to continue as a going concern. Operating under the CCAA for an extended period may restrict our ability to pursue our business strategies and increase the required payment of restructuring costs associated with operating under the CCAA beyond our available liquidity.
Our common shares are no longer traded on a securities exchange and may have no value.
On February 1, 2012 we were advised by the TSX that trading of our common shares on the TSX would be suspended immediately. In addition the TSX advised us on February 8, 2012 that our common shares would be delisted effective March 8, 2012. We can provide no assurance that we will be able to re-list our common shares on any securities exchange. Delisting of our common shares may have other negative implications, including potential loss of confidence in us by our suppliers, customers and employees.
In addition, it should be recognized that our common shares may have no value and may be cancelled for no consideration under the CCAA proceeding. As at December 31, 2011, the company’s liabilities exceeded the book value of its assets by $617.3 million.
We may not be able to successfully develop, obtain the necessary approvals or implement a restructuring plan. Failure to do so within the time periods granted under the CCAA proceeding could result in the liquidation of all of our assets.
In order to successfully emerge from the CCAA, it will be necessary to develop, obtain the necessary approvals for and implement a restructuring plan. Implementation of a restructuring plan or other restructuring process under the CCAA may result in the sale or divestiture of assets or businesses. There can be no assurance that it will be possible to complete any sale or divestiture of assets or businesses on acceptable terms or at all.
We must obtain court and creditor approvals to complete the restructuring process. If we do not obtain such approvals and even if such approvals are obtained, a dissenting holder of a claim against us may challenge and delay the final approval and implementation of a comprehensive restructuring plan.
| 60 Management’s Discussion and Analysis - February 29, 2012 | |
If we are not successful in developing a restructuring plan, or if the requisite approvals are not obtained, we may not be able to reorganize our business. Should the stay of proceedings under the CCAA not be sufficient to develop a restructuring plan or should such plan not be approved by creditors and the courts, or should the stay of proceedings against us lapse for any reason, our debt obligations will become due and payable immediately which would likely lead to the liquidation of all of our assets.
We may be unable to meet our liquidity requirements for operations.
There can be no assurance that the amounts of cash from operations together with amounts available under the DIP Facility will be sufficient to fund our operations during our proceedings under the CCAA and the restructuring costs associated with operating under the CCAA. If these amounts are insufficient to meet our liquidity requirements, we may have to seek additional financing. There can be no assurance that such additional financing would be available or, if available, offered on acceptable terms. Failure to secure any necessary additional financing would have a material adverse impact on our operations.
Our ability to maintain acceptable credit terms with our suppliers may become further impaired during the restructuring process under the CCAA. We may be required to pay cash in advance to certain suppliers and may experience restrictions on the availability of trade credit which could reduce our liquidity. Liquidity problems could materially and adversely affect our ability to source key products and services. In addition, suppliers may be reluctant to enter into long term agreements with us due to our financial condition.
The restructuring process will divert management’s attention from the operations of the business.
The restructuring process will require senior management to spend a significant amount of time developing a restructuring plan and dealing with restructuring matters, instead of focusing exclusively on the operation of the business. This could have a negative impact on the business of the company.
Risks Relating to Our Business
In order to address our business risks and effectively manage them, we have developed a process for managing risk and the interrelationship risks have with our strategic plan. We provide regular updates to the Audit Committee, work with corporate and operational management to identify, measure, and prioritize the critical risks facing the company and manage these risks by ensuring that they are adequately addressed through mitigating procedures where appropriate. The objectives of the risk-management function include developing a common framework for understanding what constitutes principal business risks, ensuring that risk management activities are aligned with business strategies, and providing an effective mechanism for governance in the area of risk management.
Our business is of a cyclical nature and demand for our products may fluctuate significantly.
The markets for pulp and paper products are highly cyclical and are characterized by periods of excess product supply due to many factors, including additions to industry capacity, increased industry production, structural changes in the industry, periods of weak demand due to weak general economic activity or other causes, and reduced inventory levels maintained by customers.
| 61 Management’s Discussion and Analysis - February 29, 2012 | |
| | Demand for forest products generally correlates to global economic conditions. Demand for pulp and paper products in particular is driven primarily by levels of advertising. In periods of economic weakness, reduced spending by consumers and businesses results in decreased demand for forest products, causing lower product prices and possible manufacturing downtime. The North American newsprint and directory paper market is mature with demand for newsprint declining significantly in the last four years. |
| | We believe these declines in newsprint and directory paper demand will continue long term, although we have the ability to partially mitigate the impact by switching production from newsprint and directory paper to other paper grades. Demand for our products is traditionally weaker in the first half of the year. |
| | As at December 31, 2011, one of the paper machines at our Crofton mill has been indefinitely curtailed. Should demand for our products weaken, additional indefinite or periodic production curtailments may be required, which could have an adverse impact on our financial condition and ability to generate sufficient cash flows to satisfy our operational needs and debt service requirements. |
| | We operate in a commodity market where prices may fluctuate significantly. |
| | The pulp and paper industry is a commodity market in which producers compete primarily on the basis of price. Prices for our products have fluctuated significantly in the past and may fluctuate significantly in the future, principally as a result of market conditions of supply and demand, as well as changes in exchange rates. Our earnings are sensitive to price changes for our principal products, with the effect of price changes on newsprint and mechanical specialty printing paper grades being the greatest. Market prices for our products typically are not directly affected by input costs or other costs of sales and, consequently, we have limited ability to pass through increases in operating costs to our customers without an increase in market prices. Even though our costs may increase, our customers may not accept price increases for our products or the prices for our products may decline. As our financial performance is principally dependent on the prices we receive for our products, prolonged periods of low prices, customer refusal to accept announced price increases, or significant cost increases that cannot be passed on in product prices may be materially adverse to us. |
| | Media trends may lead to long-term declines in demand for our products. |
| | Trends in advertising, Internet use and electronic data transmission and storage can have adverse effects on traditional print media. As our newsprint, telephone directory and retail customers increase their use of other forms of media and advertising, demand for our newsprint, uncoated mechanical and coated mechanical papers may decline on a long-term basis. |
| | We are subject to exchange rate fluctuations. |
| | Nearly all of our sales are based upon prices set in U.S. dollars, while a substantial portion of our costs and expenses are incurred in Canadian dollars and our results of operations and financial condition are reported in Canadian dollars. The value of the Canadian dollar in relation to the U.S. dollar has increased significantly in recent years. Increases in the value of the Canadian dollar relative to the U.S. dollar reduce the amount of revenue in Canadian dollar terms from sales made in U.S. dollars, and would reduce cash flow available to fund operations and debt service obligations. |
| 62 Management’s Discussion and Analysis - February 29, 2012 | |
| | Since we have debt denominated in U.S. dollars, including our 2014 senior unsecured notes and 2016 senior secured notes, our reported earnings could fluctuate materially as a result of exchange rates given that changes in the value of the Canadian dollar against the U.S. dollar during a given financial reporting period result in a foreign currency gain or loss on the translation of U.S. dollar cash and debt into Canadian currency. |
| | We manage a part of our currency exposure through the use of currency options and forward contracts to hedge anticipated future sales denominated in foreign currencies and U.S. dollar denominated debt. However, no assurance can be made that we will engage in any hedging transactions or, if we decide to engage in any such transactions, that we will be successful in eliminating or mitigating currency exchange risks. |
We face significant global competition.
| | We compete with American, European and Asian producers in highly competitive global markets. Some of our competitors are larger and can accordingly achieve greater economies of scale, some have greater financial resources and some operate mills in locations that have lower energy, furnish or labour costs or have less stringent environmental and governmental regulations than the locations where we operate. |
| | Our ability to compete is affected by a number of these factors as well as the quality of our products and customer service and our ability to maintain high plant efficiencies and operating rates and to control our manufacturing costs. If we were unable to compete effectively, there may be a materially adverse impact on our business. |
| | We face risks related to our international sales. |
| | A significant portion of our sales are outside of Canada and the United States - 98% of our pulp sales and 17% of our paper sales in 2011. These international sales result in additional risks including restrictive government actions (including trade quotas, tariffs and other trade barriers and currency restrictions), local labour laws and regulations affecting our ability to hire, retain or dismiss employees, the need to comply with multiple and potentially conflicting laws and regulations, unfavourable national or regional business conditions or political or economic instability in some of these jurisdictions, higher transportation costs and difficulty in obtaining distribution and sales support. |
We are exposed to fluctuations in the cost and supply of wood fibre.
| | We have no significant timber holdings and are dependent on third parties for the supply of wood fibre required for our paper manufacturing operations. |
Approximately 69% of our fibre is provided by five suppliers. Our fibre supply could be reduced as a result of events beyond our control, including industrial disputes, natural disasters and material curtailments and shutdown of operations by suppliers for market or other reasons. Market-related curtailments or shutdowns can be influenced by both seasonal and cyclical factors, such as raw material availability, finished goods inventory levels, interest rates and demand for lumber. Continued weakness in the U.S. housing market could lead to production curtailment for B.C. lumber producers and result in a reduction in residual fibre supply available to us.
| 63 Management’s Discussion and Analysis - February 29, 2012 | |
We source a significant quantity of our fibre from the interior of B.C. The current mountain pine beetle infestation in the B.C. interior is expected to reduce the long-term fibre supply in the B.C. interior and could have a significant impact on the availability, quality and cost of fibre.
| | Approximately 72% of our fibre is sourced under long-term fibre agreements with third parties with pricing based on market prices or on prices determined under market-based formulas. Given that the market price for fibre varies due to external factors, there is a risk that we will not continue to have access to wood fibre at previous levels or pricing. |
Aboriginal groups have claimed aboriginal title over substantial portions of B.C.’s timberlands, including areas where the forest tenures held by our suppliers are located. Although the renewal of forest tenures held by our suppliers may be adversely affected by claims of aboriginal title, the specific impact cannot be estimated at this time.
Our Snowflake mill makes 100% recycled newsprint from old newsprint (ONP). There is a risk that sufficient quantities of ONP will not be available to us to support full operations at Snowflake or that an increase in ONP prices will adversely affect the profitability of the mill. The price of ONP may be impacted by a number of factors, such as export demand, recovery rates and other factors beyond our control.
| | We are dependent on the supply of certain raw materials. |
| | In addition to wood fibre and ONP, we are dependent on the supply of certain chemicals and raw materials used in our manufacturing processes. Any material disruption in the supply of these chemicals or raw materials could affect our ability to meet customer demand in a timely manner and harm our reputation, and any material increase in the cost of these chemicals or other raw materials could negatively affect our business and the results of our operations. |
Our substantial debt may impair our financial and operating flexibility.
| | The terms and conditions of our DIP Facility could potentially impact our financial condition, operating results and business, including: |
| · | limiting our ability to obtain additional financing to fund our growth strategy, working capital, capital expenditures, debt service requirements or other purposes; |
| · | limiting our ability to use operating cash flows for operations, capital expenditures, or other business purposes and opportunities, due to required debt servicing payments; |
| · | increasing our exposure to interest rate fluctuations since borrowings under the DIP Facility are at variable interest rates; |
| · | limiting our ability to compete with companies that have less debt and/or more flexibility in the use of their cash flow; and |
| · | limiting our ability to react to changing market conditions, changes in the industry and economic downturns. |
| | A significant or prolonged downturn in general business and economic conditions may affect our ability to comply with debt covenants in the future and could result in the company being in default under our DIP Facility, which, if not cured or waived, could result in funding under the DIP Facility ceasing to be available. There is no assurance that we could cure an event of default or obtain a waiver of such a default. |
| 64 Management’s Discussion and Analysis - February 29, 2012 | |
We have incurred losses in recent periods and may incur losses in the future that may affect liquidity and ongoing operations.
| | As of December 31, 2011, we had recorded net losses in eight of the last 12 quarters. These losses were driven by reduced prices, weak market demand, production curtailments, general inflationary pressure and increased ONP cost in particular and the strong Canadian dollar. Should we be unable to return to sustained profitability, cash generated through operations may be insufficient to meet operating cash requirements, requiring increased reliance on the DIP Facility to fund operating costs. If sufficient funding is not available under the DIP Facility, then additional funding sources may be required and there is no assurance that we will be able to access additional funding sources on favourable terms or at all to meet our cash requirements. The failure to obtain such funding could adversely affect our operations and our ability to maintain compliance with covenants under the DIP Facility. |
Labour disruptions could have a negative impact on our business.
Approximately three-quarters of our hourly employees in Canada are members of trade unions. Collective agreements with the CEP and PPWC locals at Crofton and Powell River expire in April 2012 and the collective agreement with the CEP locals at Port Alberni expires in April 2013. The collective agreement at the Surrey Distribution Centre with the Christian Labour Association of Canada expires in April 2012. The collective agreements with our Snowflake unions were extended in 2011 and now expire in 2014. We do not anticipate labour disruptions in our operations in 2012.
| | Claims of aboriginal title and rights in Canada may affect our operations. |
| | The ability to operate our mills in Canada may be affected by claims of aboriginal rights and title by aboriginal groups. The governments of Canada and B.C. have established a formal process to negotiate settlements with aboriginal groups throughout B.C. in order to resolve these land claims. It is the policy of the governments that ownership of lands held in fee simple by third parties (such as us) will not be affected by treaty negotiations. The Powell River mill site has been included in areas to which an aboriginal group has asserted aboriginal title both through treaty negotiations with government and by commencing an action in 2005 in the Supreme Court of B.C. While we and other industrial companies have been named as parties in the court proceeding along with the governments of Canada and B.C., counsel for the aboriginal group has advised us that the plaintiffs are currently negotiating with these two governments and have no intention of proceeding with the action at this time. Based on the history of similar proceedings, we expect that it would be many years before a final court decision could be rendered if the proceeding were pursued. |
Recent Supreme Court of Canada decisions have confirmed that the governments of Canada and B.C. are obligated to consult with and, in certain circumstances, accommodate aboriginal groups whenever there is a reasonable prospect decision, such as a decision to issue or amend a regulatory permit, which may affect aboriginal groups’ rights or title. This duty of consultation and accommodation may affect our ability to obtain or amend necessary regulatory permits on a timely basis and may influence the conditions set out in such permits.
| | Increases in energy costs could have a negative impact on our business. |
Our operations consume a significant amount of electricity, natural gas and fuel oil. Increases in prices for these commodities can increase manufacturing costs and have an adverse impact on our business and results of our operations.
| 65 Management’s Discussion and Analysis - February 29, 2012 | |
Although our electricity supply agreements are provincially regulated and pricing has historically been stable, B.C. Hydro and Power Authority (“B.C. Hydro”) in recent years has sought, and to some extent achieved, rate increases above historical levels. B.C. Hydro raised its rates by 9.3% on an interim basis in April 2010 and a subsequent Negotiated Settlement Process resulted in the approval of a final effective rate increase of 7.3% on November 18, 2010. The difference between the interim and final approved rate increase will be refunded through a credit on energy purchases in Q1 2011. The introduction of the Harmonized Sales Tax (“HST”) on July 1, 2010 substantially eliminated the 7% provincial sales tax on electricity, which reduced some of the impact of the rate increase. B.C. Hydro has expressed its intention to seek approval from the utilities commission to increase its rates in the range of 10% for the next three years in response to infrastructure maintenance and B.C. energy policy that includes mandating self-sufficiency by 2016, feed in tariffs, and the implementation of Smart Metering. Increases in electricity prices could significantly impact our earnings. B.C. Hydro announced a 5.4% interim rate increase, effective April 1, 2012, subject to final approval by the British Columbia Utilities Commission (BCUC) later in the year. We have mitigated some of the impact of rate increases through reductions in usage at the highest incremental power rate and intend to further mitigate rate increases by implementing energy conservation projects and increasing our capacity to self-generate electricity, but there can be no assurance that we will be able to eliminate the effect of all such rate increases.
| | Since oil and natural gas are purchased on spot markets, their prices fluctuate significantly due to various external factors. We manage our exposure to the price volatility for these fuels through the use of financial instruments and physical supply agreements under a hedging program and also by using lower priced alternatives where feasible. There is, however, no assurance that we will be successful in eliminating or mitigating exposure to price volatility for these fuels. |
| | We are subject to significant environmental regulation. |
| | We are subject to extensive environmental laws and regulations that impose stringent requirements on our operations, including, among other things, air emissions, liquid effluent discharges, the storage, handling and disposal of hazardous materials and wastes, remediation of contaminated sites and landfill operation and closure obligations. It may be necessary for us to incur substantial costs to comply with such environmental laws and regulations. |
Some of our operations are subject to stringent permitting requirements and from time to time we face opposition to construction or expansion of proposed facilities, such as landfills. We may discover currently unknown environmental liabilities in relation to our past or present operations or at our current or former facilities, or we may be faced with difficulty in obtaining project approvals in the future. These occurrences may (i) require site or other remediation costs to maintain compliance or correct violations of environmental laws and regulations, (ii) result in denial of required permits, (iii) result in government or private claims for damage to person, property or the environment, or (iv) result in civil or criminal fines and penalties or other sanctions.
We permanently closed our Elk Falls paper mill in 2010. We may be required to conduct investigations and take remedial action for contaminated areas. We have a reserve for the estimated costs of decommissioning the landfills at Elk Falls but we may incur significant expenditures to comply with applicable environmental laws and regulations in connection with decommissioning the landfills or other remediation of the Elk Falls mill site that exceed the amount of the reserve. We also permanently closed our paper recycling division in 2010 but do not currently expect any significant expenditures in respect of remediation of that site.
| 66 Management’s Discussion and Analysis - February 29, 2012 | |
Our operations may be affected by the regulation of greenhouse gases (GHG) in Canada and the United States. In Canada:
| · | The federal government has indicated its intent to regulate priority air pollutants, including particulate matter and sulphur oxides (SOx), and GHGs under theCanada Clean Air Act and theCanadian Environmental ProtectionAct. Under proposed targets, our Crofton mill may be required to reduce SOx emissions. The cost of making any such reductions is estimated between $4 and $8 million. The new standards are expected to be in place in 2012 with compliance required within three to five years. In January 2010, the federal government, as part of its commitment to the Copenhagen Accord, announced a GHG reduction target of 17% by 2020 based on 2005 emissions. It is unknown what the federal government’s final position on these initiatives will be, as none have been enacted into law. |
| · | B.C. is a signatory to the Western Climate Initiative, a collaboration of four provinces and currently only one U.S. state (California), whose mandate is to achieve a 15% reduction in GHGs below 2005 levels among member entities by 2020. In addition, the B.C. government has announced its goal of reducing the provincial release of GHGs by 33% by 2020, based on 2007 levels, with interim reduction targets of 6% by 2012 and 18% by 2016. Quebec and California have initiated their regulatory processes in connection with implementation of a cap and trade system. Although it was expected that B.C. would issue regulations for its cap and trade program for GHGs in 2011, it has not done so as B.C. is reviewing its climate change and clean energy policies. It is now expected that implementation of a cap and trade scheme by B.C. will be delayed beyond 2012.It is too early to determine the impact on the company under any such cap and trade scheme. |
| · | Effective January 1, 2010, a GHG reporting regulation was brought into effect by the B.C. government which affects our three paper mills in B.C. The regulation includes requirements for calculating and reporting GHG emissions from facilities that release 10,000 tonnes or more of GHGs per year plus third-party verification at facilities that release 25,000 tonnes or more per year. The first reports and verification audits were successfully completed in 2011. |
The finalization of Canadian federal and provincial climate change regulation may depend on regulatory initiatives undertaken in the U.S.
| | The United States has indicated its intention to introduce more stringent environmental regulation and implement policies designed to reduce GHG emissions through the Clean Air Act but the timing of the implementation of any national limits is uncertain. When limits are developed, it is expected that they will focus on the electricity generating sector. |
The U.S. Environmental Protection Agency (EPA) published the new Maximum Achievable Control Technology (MACT) rules for industrial boilers on December 2, 2011. This is a program that sets emission limits for stationary industrial boilers and process heaters. The standards address numerous pollutants and have suggested considerable reductions in emission limits. The final rules are expected to be issued by mid-2012 with compliance required within three to five years.
| 67 Management’s Discussion and Analysis - February 29, 2012 | |
The EPA has asked the Federal Courts for additional time to further evaluate the standards which are required in order to meet legal obligations under the Clean Air Act. The current timetable allowed for comments to be submitted up to October 31, 2011 and the final standards to be issued by April 2012.
A preliminary impact assessment of these rules and potential future changes to Snowflake’s emission control requirements has been completed with estimated costs in the $8 million to $10 million range.
| | Effective July 1, 2011, the carbon tax rates under the B.C. government’s carbon tax on fossil fuels increased by 25% and will increase again July 1, 2012 by 25%. The impact of these increases on the company depends on our ability to decrease the use of fossil fuel. For the year ended December 31, 2011, we paid $4.1 million in carbon taxes on our fossil fuel purchases. |
| | Additional regulatory initiatives may be implemented in other jurisdictions to address GHG emissions and other climate change-related concerns. If, to the extent we operate or offer our products for sale in such jurisdictions, we may be required to incur additional capital expenditures, operating costs or mitigating expenses, such as carbon taxes, to comply with any such initiatives. |
Elimination of British Columbia Harmonized Sales Tax will negatively impact our future financial results.
Elections B.C. confirmed the elimination of the British Columbia Harmonized Sales Tax. The Province will revert back to the previous provincial sales tax regime on April 1, 2013, and we estimate that the additional annualized cost to our business from that date onward will be approximately $11 million, based on actual 2011 expenditures.
Equipment failures and the need to increase capital and maintenance expenditures could have a negative impact on our business.
| | Our business is capital intensive. Our annual capital expenditure requirements vary due to differing requirements for current maintenance, expansion, business capital and environmental compliance and future projects. We regularly carry out maintenance on our manufacturing equipment but key components may still require repair or replacement. The costs associated with such maintenance and capital expenditures or our inability to source the necessary funds to enable us to maintain or upgrade our facilities as required could have an adverse effect on our business and operations. |
In addition, we may from time to time temporarily suspend operations at one or more facilities to perform necessary maintenance or carry out capital projects. These temporary suspensions could affect the ability to meet customer demand in a timely manner and adversely affect our business.
| | We may be subject to litigation which could result in unexpected costs and expenditure of time and resources. |
We may from time to time be subject to claims and litigation proceedings generally associated with commercial and employment law issues. Given that these claims are subject to many uncertainties and the inability to predict with any certainty their outcomes and financial impacts, there is no guarantee that actions that may be brought against us in the future will be resolved in our favour or covered by our insurance. Any losses from settlements or adverse judgments arising out of these claims could be materially adverse to our operations and business.
| 68 Management’s Discussion and Analysis - February 29, 2012 | |
The Snowflake mill sources water from groundwater wells in the vicinity of the Little Colorado River for its process requirements. The Little Colorado River Adjudication, filed in 1978, is pending in the Superior Court of Arizona, Apache County. The purpose of this adjudication is to determine the nature, extent and relative priority, if applicable, of the water rights of all claimants to the Little Colorado River system and sources.
There are more than 3,500 participants, including Snowflake. Native American tribes and the United States government contend that Snowflake’s withdrawal and use of groundwater impermissibly interferes with water rights to the Little Colorado River. We dispute this contention. However, an adverse determination could restrict Snowflake’s access to water and may be materially adverse to us.
| | In addition, securities class-action litigation often has been brought against public companies following periods of volatility in the market price of their securities. It is possible that we could be the target of similar litigation in future. Securities litigation could result in substantial costs and damages and divert management’s attention and resources. |
We extend trade credit to our customers and they may not pay us promptly or in full.
| | We extend trade credit to many purchasers of our products and rely on their creditworthiness. Some of these customers operate in highly competitive, mature, cyclical or low-margin businesses and some are highly leveraged financially or are experiencing negative cash flows which may result in them needing to refinance, restructure or file for bankruptcy protection or bankruptcy. We will typically have a greater number of such customers during economic downturns. The failure of such customers to pay us promptly and in full under the credit terms we extend to them could have a material adverse impact on our operating cash flows. |
We are dependent upon certain of our management personnel.
The success of our operations is influenced to a significant degree by our ability to attract and retain senior management with relevant industry experience. Successful implementation of our business strategy is dependent on our ability to attract and retain our executive officers and management team. The unexpected loss of services of any key management personnel or the inability to recruit and retain qualified personnel in the future could have an adverse effect on our business and financial results.
Consumer boycotts or increases in costs due to chain-of-custody programs may adversely affect demand for our products.
Some of our customers are sensitive to issues associated with harvesting of old growth forests and require us to supply products that are not produced from these forests. A growing number of customers want to purchase products that originate from sustainable managed forests as validated by certification programs. We have implemented The Forest Stewardship Council chain-of-custody system to verify that select paper products at our Crofton, Port Alberni and Powell River mills contain 100% certified wood fibre, but we may be required to implement additional or more stringent chain-of-custody certification programs with increased costs to meet our customers’ demands. Demand for our products may be adversely affected if we don’t implement such programs or if we become subject to organized boycotts or similar actions by environmental or other groups.
| 69 Management’s Discussion and Analysis - February 29, 2012 | |
Our insurance has limitations and exclusions.
| | We maintain insurance coverage that we believe would ordinarily be maintained by an operator of facilities similar to our own. The insurance policies are subject to limits and exclusions. Damage to or destruction of our facilities could accordingly exceed the limits of our policies or be subject to policy exclusions. |
Our mills are located in seismically active areas.
| | Three of our operating mills are situated adjacent to the ocean on the south coast of B.C. This is a seismically active area and these mills and the surrounding transportation infrastructure are accordingly susceptible to risk of damage or destruction caused by earthquakes and tsunamis. Our insurance may not cover the total losses associated with damage or destruction caused by an earthquake or tsunami, and this insurance is subject to limits and deductibles in respect of such damage that may limit the amount recoverable. |
| | Post-retirement plan obligations may affect our financial condition. |
| | We maintain defined benefit pension plans and other post-retirement benefit plans for retired employees. As at December 31, 2011, the underfunded liability associated with the defined benefit pension plans was $156.9 million and the underfunded liability associated with the other post-retirement benefit plans was $162.3 million. Funding requirements for these plans are dependent on various factors, including interest rates, asset returns, regulatory requirements for funding purposes, and changes to plan benefits. In 2012, we are required to contribute $11.7 million in addition to our normal annual pension contribution to satisfy a portion of the underfunded liability of the defined benefit pension plan. Although we expect to continue to make contributions to fund post-retirement plan obligations and to meet legal funding obligations for the defined benefit pension plan, no assurance can be made that the underfunded liability under these plans will not be materially adverse to us in the future. |
As described in section 10 -Contingent liabilities, claims regarding certain post-retirement benefits, there are outstanding grievances against us filed by the Communications, Energy and Paperworkers Union of Canada Locals 1 and 592 claiming that we are obligated to provide post-retirement benefits for certain retired employees of another company.If these grievance claims were successful, we estimate that we could incur between $1.0 million to $2.0 million in additional costs.
| 18 | GOVERNANCE AND MANAGEMENT SYSTEMS |
Corporate governance
| | Our senior governing body is made up of a ten-member Board of directors and four Board committees. The accomplished individuals who make up our Board and serve on our committees provide high-level stewardship, supervise corporate management, and ensure our information-disclosure requirements are met. One of our directors resigned in February 2012 and it is unlikely that this vacancy will be filled during the Company’s restructuring process under the CCAA. |
| | Our corporate directors are responsible for increasing and preserving shareholder value and fostering our long-term success, while considering the interests of a range of shareholders. This involves assessing risks and performance relating to both financial and non-financial measures. |
| 70 Management’s Discussion and Analysis - February 29, 2012 | |
Board committees
| | Our four permanent Board committees consist of an audit, environment, governance, and health and safety committee. They establish principles, evaluate compliance and monitor performance in these areas. Designated executives and senior operational leaders report to these committees quarterly. |
| | The governance committee is responsible for best-practices monitoring, annual board effectiveness evaluations, and director development. |
| | As of the end of 2011, nine of 10 directors, including the Board chair and excepting only the president and CEO, were independent. |
| | Risk and management systems |
| | We recognize the importance of good risk and management systems. We maintain a comprehensive inventory of major risks and management responses, including probability and severity assessments, which is reviewed by our Board’s audit committee every year. |
| | We have a Code of Corporate Ethics and Behaviour that applies to directors, executives and employees, and is reviewed and committed to by salaried employees each year. Breaches of this code can be reported through an anonymous phone line or other methods, but no reports were received in 2011. |
| | Our governance practices meet or exceed the effective governance guidelines of our listing stock exchange. For more information on our governance, visithttp://catalystpaper.com/about/governance. |
| 71 Management’s Discussion and Analysis - February 29, 2012 | |
| | Our earnings are sensitive to fluctuations in: |
| | Our products are commodity-based and cyclical in nature. As a result, earnings are sensitive to price changes, with price changes on specialty printing paper grades and newsprint having the greatest effect. |
| | Our products are primarily sold in Canada, the United States, Asia and Australasia, Latin America and Europe. The majority of sales are denominated in foreign currencies, principally the U.S. dollar. As a result, we are exposed to foreign currency risk on accounts receivable and future sales. |
| | Our earnings could be significantly affected by changes in prices and terms of energy-supply contracts, as we are a significant consumer of electrical power, fossil fuels and input materials whose pricing is highly correlated to energy costs. |
| | Our earnings could be significantly affected by changes in the cost of freight, which is highly corrected with fuel prices. Fuel prices fluctuate significantly and are sensitive to general economic factors such as supply shocks and global economic growth. |
| | Our supply of fibre is subject to market influences and has some degree of variability. Fibre supply includes wood chips, logs, hog fuel and ONP. |
| | Our EBITDA, net earnings and earnings per share are estimated to be affected by changes in product prices, foreign exchange and input costs as follows: |
| (In millions of dollars, except per share amounts) | | EBITDA1 | | | Net earnings2 | | | Earnings
per share | |
| | | | | | | | | | |
| Product prices3 | | | | | | | | | | | | |
| A US$10 per tonne change in the sales price of: | | | | | | | | | | | | |
| Specialty printing papers | | $ | 10 | | | $ | 7 | | | $ | 0.02 | |
| Newsprint | | | 4 | | | | 3 | | | | 0.01 | |
| Pulp | | | 3 | | | | 2 | | | | 0.01 | |
| | | | | | | | | | | | | |
| Foreign exchange4 | | | | | | | | | | | | |
| A US$0.01 change in the U.S. dollar relative to the Canadian dollar | | | 6 | | | | 5 | | | | 0.01 | |
| | | | | | | | | | | | | |
| Energy cost sensitivity5 | | | | | | | | | | | | |
| A 5% change in the price of: | | | | | | | | | | | | |
| Natural gas and oil – direct purchases | | | 2 | | | | 1 | | | | 0.00 | |
| Electricity – direct purchases | | | 7 | | | | 5 | | | | 0.01 | |
| Coal | | | 1 | | | | 1 | | | | 0.00 | |
| | | | | | | | | | | | | |
| Freight cost sensitivity | | | | | | | | | | | | |
| A US$5/bbl change in the price of West Texas Int. (WTI) Oil | | | 3 | | | | 2 | | | | 0.01 | |
| | | | | | | | | | | | | |
| Fibre sensitivity5 | | | | | | | | | | | | |
| A US$5 per unit change in the price of: | | | | | | | | | | | | |
| Wood chips (bone dry tonnes ) | | | 8 | | | | 6 | | | | 0.02 | |
| ONP (ST) | | | 2 | | | | 1 | | | | 0.00 | |
| 1 | Refer to section 13,Non-GAAP measures. |
| 2 | Based on an expected long-term tax rate of 25%. |
| 3 | Based on annualized sales of Q4 2011 and foreign exchange rate of US$0.98. |
| 4 | Based on Q4 2011 annualized net cash flows and a movement to US$0.99 from US$0.98 and excluding our hedging program and the impact of the translation of U.S. dollar denominated debt. |
| 5 | Based on Q4 2011 annualized consumption levels and an exchange rate of US$0.98. |
| 72 Management’s Discussion and Analysis - February 29, 2012 | |
Economy
| | The economic recovery slowed significantly in 2011 due to a host of factors including the sovereign debt issues affecting Europe and North America, continued weakness in the U.S. economy and housing market and reduced economic growth forecasts for China. These factors resulted in significant volatility in the currency and commodity markets in the second half of the year. The U.S. economy is expected to continue its slow recovery in 2011, but the rate of growth will depend on consumer spending, consumer confidence and employment recovery. Continued volatility of the Canadian dollar may significantly impact our operating and net earnings, cash flow and liquidity. |
Markets
| | Specialty printing paper markets are expected to remain challenging in 2012. Demand for coated and uncoated mechanical paper is expected to slow down for the first half of 2012 before recovering in the second half of the year. With falling demand, operating rates for coated and uncoated are expected to decline unless, of course, the drop in demand is offset by additional mill closures and capacity shuts. Prices for coated and uncoated grades will be under pressure as operating rates fall. Demand for directory paper will likely continue to decline albeit at a slower rate than 2011 due to paper conservation moves by publishers and migration to electronic media. Despite poor demand conditions, current operating rates for directory paper are very strong, and as such, contract directory prices for 2012 will be higher than 2011. |
Newsprint demand in 2012 is expected to contract further due to declining circulation, page count reductions, conservation measures by publishers and continued migration of information and advertising to the Internet. Moderate declines are also expected in export shipments due to a slowdown in demand in a number of important international markets. The potential for newsprint price increases in 2012 are uncertain and will depend on the supply and demand balance in the year.
| | The decline in demand for NBSK pulp in the fourth quarter is expected to continue for the first half of 2012 due to a slowdown in Chinese demand. Chinese buying patterns and requirements are expected to continue to drive the market in 2012. Excessive levels of end-user inventories will continue to put significant pressure on pulp prices for the first half of 2012. |
| | Operations and capital spending |
| | Price pressure is expected on commodity inputs, including fossil fuel, power, fibre and some chemicals. Lower demand from China for recycled paper will carry over into 2012, continuing to reduce the price pressure on ONP. This will improve the cost structure of the Snowflake mill in the short-term. |
| | We expect maintenance costs for 2012 to be moderately lower than 2011 levels primarily due to the impact of the extended maintenance outages at Snowflake and Powell River on total maintenance cost in 2011. |
| | We anticipate that the Crofton No. 1 machine will remain indefinitely curtailed due to weak markets and high costs, removing approximately 140,000 tonnes on an annualized basis or 23% of our newsprint capacity. We will continue to match production to our orders for all grades. |
| 73 Management’s Discussion and Analysis - February 29, 2012 | |
| | Capital spending, net of credits received through the Pulp and Paper Green Transformation Program, is expected to be approximately $25 million in 2012. Capital projects that qualified for funding through the utilization of the Green Transformation Program were approved by the federal government in Q1, and the majority of the expenditures have been incurred in 2011. These projects are expected to result in annual EBITDA of $5.0 million in 2012. |
| | Liquidity, debt maturities and covenants |
| | We do not currently anticipate any significant uses of cash in 2012 other than for our operations, working capital fluctuations, reorganization costs in respect of the CCAA proceedings we entered into on January 31, 2012, and pension plan funding. |
| | Our application for a further extension for funding relief in respect of the solvency deficit under the company sponsored defined benefit pension plan was approved by FICOM in the fourth quarter. In addition to our regular pension contributions, an incremental contribution of $4.8 million was made in Q4. |
We commenced proceedings under the CCAA in order to protect the Company’s business and operations while we attempt to restructure our indebtedness to its creditors. The company’s operating revenue combined with the DIP Facility are expected to provide sufficient liquidity to conduct our operations and to meet our obligations to employees and suppliers in the ordinary course during the restructuring process.
| | In 2012, we will focus on objectives and initiatives in four areas: |
Social
| · | Continue the progress made in 2011 in significantly improving our overall safety performance. Targeted reductions in Lost Time Incidents are 29% |
| · | Continue to seek competitive business conditions in B.C., including joint municipal infrastructure agreements |
| · | Work creatively with each of our municipalities to find “value based” opportunities to reduce/avoid costs which will result in reduced operating costs for Catalyst Paper and our municipalities |
Financial
| · | Continue to focus on cash flows, liquidity and cost reductions |
| · | Implement a restructuring process or other reorganization under the CCAA that will significantly improve our capital structure, liquidity and competitive footing |
| · | Evaluate every existing physical asset to maximize financial contributions, product flexibility and capital structure |
| · | Achieve a new collective labour agreement with all six local B.C. unions that is market competitive and innovative to help positively position Catalyst Paper for the future |
| 74 Management’s Discussion and Analysis - February 29, 2012 | |
| · | Continue to expand sales reach into new markets and increase market share with capital segments |
| · | Expand geographic reach of Catalyst Paper into emerging world markets of Latin America, India and Asia |
| · | Achieve conservation targets in water and energy |
| · | Maintain international disclosure standards as set out in the UN Global Compact |
| · | Retain sales-supporting relationships with leading environmental groups |
| 75 Management’s Discussion and Analysis - February 29, 2012 | |
| 21 | DISCLOSURE CONTROLS AND INTERNAL CONTROL OVER FINANCIAL REPORTING |
| | We conducted an evaluation of the effectiveness of the design and operation of our disclosure controls and procedures. The evaluation was conducted under the supervision and with the participation of management, including the chief executive officer and chief financial officer, as of December 31, 2011. Based on the evaluation, our chief executive officer and chief financial officer concluded that such disclosure controls and procedures – as defined in Canada under National Instrument 52-109, Certification of Disclosure in Issuers’ Annual and Interim Filings, and in Rules 13a-15(e) and 15d-15(e) promulgated under theUnited States Securities Exchange Act of 1934, as amended (theU.S. Exchange Act) – are effective as at December 31, 2011. |
| | It should be noted that while our disclosure controls and procedures are designed to provide a reasonable level of assurance of achieving their objectives, our chief executive officer and chief financial officer do not expect that our disclosure controls and procedures or internal control over financial reporting will prevent all errors and fraud. A control system, no matter how well conceived or operated, can provide only reasonable, not absolute, assurance that the objectives of the control system are met. |
| | There were no changes in our internal control over financial reporting during the period ended December 31, 2011 that materially affected or are reasonably likely to materially affect our internal control over financial reporting. Management has limited the scope of the design and maintenance of adequate disclosure controls and procedures and internal control over financial reporting to exclude controls, policies and procedures of Powell River Energy Inc., a variable interest entity in which we are the primary beneficiary. |
| | Section 404 of the United StatesSarbanes-Oxley Act, Management Assessment of Internal Controls (Section 404), continues to require that management (a) has the responsibility for establishing and maintaining an adequate internal control structure and procedure for financial reporting, and (b) assesses and reports on the effectiveness of internal control over financial reporting annually. As of December 31, 2011, management has assessed the effectiveness of the company’s internal control over financial reporting. Based on this assessment, management has determined the company’s internal control over financial reporting was effective as of December 31, 2011, and issued Management’s Report on Financial Statements and Assessment of Internal Control over Financial Statements datedFebruary 29, 2012 to that effect. |
| | The Board of directors’ Audit Committee, as part of its oversight role, has reviewed and recommended the approval of this MD&A to the Board of directors. The Board of directors has read and approved this MD&A. Through discussions with management, the Board of directors and the Audit Committee have satisfied themselves that management has implemented the necessary disclosure controls. |
Additional information about the company, including our most recent Annual Information Form, is available on our website atwww.catalystpaper.com, or on the Canadian Securities Administrators’ electronic filing website atwww.sedar.com.
| 76 Management’s Discussion and Analysis - February 29, 2012 | |