
CATALYST PAPER 2012 SECOND QUARTER REPORT
For the three months ended June 30, 2012

PRESIDENT’S MESSAGE
Creditors approve reorganization plan; company prepares to emerge from CCAA
Our second quarter was dominated by actions that led to creditor approval on June 25th of the second amended plan of arrangement, Supreme Court of British Columbia verification of the creditor vote on June 28th and confirmation under Chapter 15 by the US Court in Delaware on July 27th. These milestones were reached only five months after Catalyst Paper entered creditor protection on January 31, 2012 under theCompanies’ Creditors Arrangement Act (CCAA). A key priority for 2012 was to put our business on better financial footing and we have focused relentlessly on navigating the complex CCAA process with that objective in mind. We reduced our debt by nearly 60 per cent, significantly improved liquidity and reduced operating costs with the support of our workforce and community stakeholders. As importantly, we held our position with customers and gained entry to new market segments for our products. Other highlights marking our steady progress through creditor protection included:
| — | arranging debtor-in-possession (DIP) financing to provide assurance of liquidity while in creditor protection; |
| — | reaching new competitive five-year labour agreements in B.C. to help reposition the business; |
| — | achieving lower property tax rates for all three B.C. mills as host municipalities took supportive steps; |
| — | provincial approval of our application for funding relief on our salaried pension plan solvency deficit resulting in estimated annual cash savings of $7 million; and |
| — | disposal of surplus assets in the second quarter, generating $7.4 million in proceeds. |
The following table shows how our financial structure has been strengthened through reorganization.
| (in millions) | | Pre-restructuring | | | Post-restructuring | | | Change | |
| Debt notes (non-recourse) | | US$ | 640.4 | | | US$ | 250.0 | | | US$ | 390.4 | |
| | | | | | | | | | | | | |
| Annual cash interest expense* | | US$ | 61.4 | | | Cash: US$ | 27.5 | | | Cash: US$ | 33.9 | |
| | | | | | | PIK: US$ | 18.8 | | | PIK: US$ | 42.6 | |
| Annual property tax expense | | $ | 18.3 | | | $ | 12.2 | | | $ | 6.1 | |
| | | | | | | | | | | | | |
| Annual labour expense | | $ | 158.0 | | | $ | 139.0 | | | $ | 19.0 | |
| | | | | | | | | | | | | |
| Annual pension funding obligations | | $ | 11.0 | | | $ | 4.0 | | | $ | 7.0 | |
| | | | | | | | | | | | | |
| Annual retiree extended health benefits | | $ | 2.4 | | | $ | 1.2 | | | $ | 1.2 | |
| | | | | | | | | | | | | |
| Annual PRD lease savings | | $ | 2.4 | | | $ | 0.0 | | | $ | 2.4 | |
| * | Interest on the newly issued debt notes will be payable semi-annually in cash at an annual interest rate of 11% or, at the option of the company, interest may be partially paid in kind, at an annual rate of 13% with 7.5% being paid in cash and 5.5% being paid in kind through the issuance of additional secured notes. |
Subsequent to the end of the quarter and despite extensive efforts to improve the financial performance of our Snowflake recycle paper mill in Arizona, we announced that the facility would be permanently closed effective September 30, 2012. We regret the difficult impact within the Snowflake community and surrounding region created by the mill closure and I want to acknowledge and thank employees, unions and public officials who have given the mill unwavering support and cooperation as we battle to overcome market challenges and input cost pressures. However with the newsprint demand down more than 10% annually since the end of 2008, ONP quality deterioration and higher freight costs as procurement and sales have been forced further afield to source recycled paper supply and secure product orders, there was no reasonable prospect that mill profitability could be restored and stakeholders needed the certainty that our decision now provides.
Turning to our financial results for the second quarter of 2012, we recorded a net loss of $11.7 million ($0.03 per common share) on sales of $312.8 million. This compares to a net loss of $25.6 million ($0.07 per common share) on sales of $315.8 million in the first quarter and a net loss of $47.4 million ($0.13 per common share) on sales of $297.8 million in Q2 2011. Significant specific items in the quarter included a net reorganization credit resulting from the CCAA proceedings of $6.0 million and a foreign exchange loss on the translation of U.S. dollar denominated debt of $12.8 million. This compared to prior quarter specific items of $5.2 million in restructuring costs incurred prior to entering protection, net reorganization expenses from the CCAA proceedings of $22.4 million, and a foreign exchange gain on the translation of U.S. dollar denominated debt of $11.6 million.
| CATALYST PAPER 2012 SECOND QUARTER REPORT | ~ 2 ~ |
EBITDA of $14.6 million and operating earnings of $7.0 million in the second quarter compared to EBITDA of $18.1 million and operating earnings of $10.2 million in Q1 2012. We achieved a substantial improvement from negative $3.9 million in EBITDA and an operating loss of $30.6 million in Q2 2011. Operating results this year were positively impacted by the weaker Canadian dollar and substantial cost reductions that included savings from the new labour agreements that took effect May 1st, and lower maintenance costs due to the deferral of certain maintenance projects to save cash during the CCAA proceedings.
On the paper side, sales volumes increased compared to the prior year, both for the second quarter and on a year-to-date basis as all mills ran without interruption. Sales of newsprint and uncoated specialty were negatively impacted in the second quarter of 2011 by fires and extended maintenance outages at our Snowflake and Powell River mills. Average transaction prices increased for directory and uncoated in the quarter compared to Q2 2011, partially offset by lower average transaction prices for lightweight coated and newsprint.
Pulp sales volumes were down in the quarter compared to Q2 2011 due to a maintenance outage originally scheduled for March that was deferred to April 2012. On a year-to-date basis, sales volumes were 14,900 tonnes above 2011 levels, however average transaction prices for pulp continued to trend down in Q2 2012 due to soft demand and excess inventory in China.
Operations ran well and daily production volumes have improved. We continued to monitor inventory levels closely and with the support of our vendors, shipments flowed smoothly and customer orders were delivered without interruption through the quarter. Safety performance took a step back in the second quarter, though we made progress in reducing frequency and severity of incidents compared with the prior year as field hazard assessments, investigation of near misses and personal accountability for prevention of incidents become standard practices across all operations.
We continued to incur significant reorganization costs under the CCAA proceedings in the quarter, mostly consisting of consulting and legal fees. We recognized significant non-cash reorganization credits in the quarter to adjust the book values of certain compromised liabilities to the amounts allowed as valid claims against the company by the Supreme Court of British Columbia.
Our liquidity improved in the second quarter due to an increase in our borrowing base and a decrease in the amount drawn on our DIP Facility. Our DIP Credit Agreement was amended in the quarter requiring excess availability on the Facility be maintained at no less than $21.9 million.
Looking to the latter half of 2012, we anticipate an orderly emergence from CCAA protection within the next several weeks once exit financing and a new asset-based loan facility (ABL Facility) is in place. We expect the company’s operating revenue combined with the current DIP Facility to provide sufficient liquidity to run operations and meet vendor obligations through the remainder of the CCAA protection period.
Against the backdrop of global economic challenges, industry consolidation and highly competitive markets for our products, we made considerable headway in the first half of this year to address the financial requirements that will enable Catalyst to secure a stronger business position for the future. Our focus on safety and operational performance and our organizational ability to innovate, lead, adapt and resolve stakeholder issues became increasingly clear in the first half of 2012 and we will leverage this momentum as we emerge from creditor protection with a stronger balance sheet, more competitive operating costs and improved capacity to participate in the ongoing transformation of the paper and pulp industry worldwide.

Kevin J. Clarke
President & Chief Executive Officer
| CATALYST PAPER 2012 SECOND QUARTER REPORT | ~ 3 ~ |

catalyst paper corporation
MANAGEMENT’S DISCUSSION AND ANALYSIS
| CATALYST PAPER 2012 SECOND QUARTER REPORT | MANAGEMENT’S DISCUSSION AND ANALYSIS | ~ 1 ~ |
| MANAGEMENT’S DISCUSSION AND ANALYSIS | 3 |
| | |
| 1 | Overview and highlights | 5 |
| | | |
| 2 | Segmented results | 12 |
| | | |
| 3 | Liquidity and capital resources | 18 |
| | | |
| 4 | Contingent liabilities | 20 |
| | | |
| 5 | Summary of quarterly results | 21 |
| | | |
| 6 | Non-GAAP measures | 21 |
| | | |
| 7 | Critical accounting policies and estimates | 23 |
| | | |
| 8 | Changes in accounting policies | 23 |
| | | |
| 9 | Impact of accounting pronouncements affecting future periods | 24 |
| | | |
| 10 | Risks and uncertainties | 24 |
| | | |
| 11 | Sensitivity analysis | 26 |
| | | |
| 12 | Outlook | 27 |
| | | |
| 13 | Disclosure controls and internal control over financial reporting | 28 |
| | | |
| CONSOLIDATED FINANCIAL STATEMENTS | 29 |
| CATALYST PAPER 2012 SECOND QUARTER REPORT | MANAGEMENT’S DISCUSSION AND ANALYSIS | ~ 2 ~ |
MANAGEMENT’S DISCUSSION AND ANALYSIS
The following management’s discussion and analysis (MD&A) of Catalyst Paper Corporation (the company, we, us, and our) should be read in conjunction with our interim consolidated financial statements for the three month and six month periods ended June 30, 2012 and June 30, 2011 and our audited annual consolidated financial statements for the year ended December 31, 2011 and the notes thereto, which have been prepared in accordance with generally accepted accounting principles (GAAP) in the United States (U.S.). Additional information about the company, including our most recent Annual Information Form is available on our website atwww.catalystpaper.com, or the Canadian Securities Administrator’s electronic filing website atwww.sedar.com.
Throughout this discussion, references are made to certain measures that are not measures of performance under U.S. GAAP, including operating earnings, EBITDA, EBITDA before restructuring costs, average delivered cash costs per tonne before specific items, net earnings (loss) attributable to the company before specific items, net earnings (loss) per share attributable to the company’s common shareholders before specific items, and free cash flow. We believe that these non-GAAP measures are useful in evaluating our performance. These non-GAAP measures are defined and reconciled to their nearest GAAP measure in section 6, Non-GAAP measures.
In this MD&A, unless otherwise indicated, all dollar amounts are expressed in Canadian dollars. The term “dollars” and the symbols “$” and “CDN$” refer to Canadian dollars and the term “U.S. dollars” and the symbol “US$” refer to United States dollars.
In this MD&A, the term “tonne” and the symbol “MT” refer to a metric tonne and the term “ton” or the symbol “ST” refer to a short ton, a measure of weight equal to 0.9072 metric tonne. Use of these symbols is in accordance with industry practice.
The information in this report is as of August 1, 2012 which is the date of filing in conjunction with our press release announcing our results for the second quarter of 2012. Disclosure contained in this document is current to August 1, 2012 unless otherwise stated.
| CATALYST PAPER 2012 SECOND QUARTER REPORT | MANAGEMENT’S DISCUSSION AND ANALYSIS | ~ 3 ~ |
CAUTIONARY STATEMENT REGARDING FORWARD-LOOKING STATEMENTS
Certain statements and information in this MD&A are not based on historical facts and constitute forward-looking statements or forward-looking information within the meaning of Canadian securities laws and the U.S. Private Securities Litigation Reform Act of 1995 (forward-looking statements), including but not limited to, statements about our strategy, plans, future operating performance, contingent liabilities and outlook as well as statements about our creditor protection proceedings, debtor-in possession financing, reorganization process and debt restructuring.
Forward-looking statements:
| — | Are statements that address or discuss activities, events or developments that we expect or anticipate may occur in the future; |
| — | Can be identified by the use of words such as “believe”, “expect”, “anticipate”, “intend”, “plan”, “likely”, “predicts”, “estimates”, “forecasts”, and similar words or phrases or the negative of such words or phrases; |
| — | Reflect our current beliefs, intentions or expectations based on certain assumptions and estimates, including those identified below, which could prove to be significantly incorrect: |
| – | Our ability to develop, manufacture and sell new products and services that meet the needs of our customers and gain commercial acceptance; |
| – | Our ability to continue to sell our products and services in the expected quantities at the expected prices and expected times; |
| – | Our ability to successfully obtain cost savings from our cost reduction initiatives; |
| – | Our ability to implement business strategies and pursue opportunities; |
| – | Expected cost of goods sold; |
| – | Expected component supply costs and constraints; |
– Expected foreign exchange and tax rates.
| — | While considered reasonable by management, are inherently subject to known and unknown risks and uncertainties and other factors that could cause actual results or events to differ from historical or anticipated results or events. These risk factors and others are discussed in the MD&A. Certain of these risks are: |
| – | The impact of general economic conditions in the countries in which we do business; |
| – | Conditions in the capital markets and our ability to obtain financing and refinance existing debt; |
| – | Market conditions and demand for our products (including declines in advertising and circulation); |
| – | The implementation of trade restrictions in jurisdictions where our products are marketed; |
| – | Fluctuations in foreign exchange or interest rates; |
| – | Raw material prices (including wood fibre, chemicals and energy); |
| – | The effect of, or change in, environmental and other governmental regulations; |
| – | Uncertainty relating to labour relations; |
| – | The availability of qualified personnel; |
| – | The effects of competition from domestic and foreign producers; |
| – | The risk of natural disaster and other factors many of which are beyond our control; |
| – | Risks and uncertainties relating to our creditor protection proceedings, including our ability to continue as a going concern and ability to implement a debt restructuring. |
As a result, no assurance can be given that any of the events or results anticipated by such forward-looking statements will occur or, if they do occur, what benefit they will have on our operations or financial condition. Readers are cautioned not to place undue reliance on these forward-looking statements. We disclaim any intention or obligation to update or revise any forward-looking statements, whether as a result of new information, future events or otherwise, except as required by law.
| CATALYST PAPER 2012 SECOND QUARTER REPORT | MANAGEMENT’S DISCUSSION AND ANALYSIS | ~ 4 ~ |
| 1. | OVERVIEW AND HIGHLIGHTS |
BUSINESS OVERVIEW
We are the largest producer of mechanical printing papers in western North America. We also produce NBSK pulp which is marketed primarily in Asia. Our business is comprised of three business segments: specialty printing papers; newsprint; and pulp. Specialty printing papers include coated mechanical, uncoated mechanical, and directory paper. We are the only producer of coated mechanical paper and soft calender (SC) paper in western North America. We operate four paper mills, three of which are located in British Columbia (B.C.) in Crofton, Port Alberni, and Powell River, and one in Snowflake, Arizona, which produces 100% recycled-content paper. Our Crofton mill includes a two-line kraft pulp operation.
More information about our business segments, product profile and our geographic sales distribution is provided on pages 4 to 6 of our 2011 Annual Report. Our production capacity by mill and product line is summarized in the following chart:
2012 Capacity by Mill Location and Product Line1
| | | Specialty printing papers 1 | | | Newsprint 1 | | | Pulp 2 | | | | |
| Mill location | | Number of
paper
machines | | | Uncoated
mechanical | | | Coated
mechanical | | | Directory | | | Newsprint | | | NBSK
pulp | | | Total | |
| Crofton, B.C.3 | | | 2 | | | | – | | | | – | | | | 111,000 | | | | 194,000 | | | | 335,000 | 2 | | | 640,000 | |
| Port Alberni, B.C. | | | 2 | | | | – | | | | 223,000 | | | | 115,000 | | | | – | | | | – | | | | 338,000 | |
| Powell River, B.C. | | | 3 | | | | 480,000 | | | | – | | | | – | | | | – | | | | – | | | | 480,000 | |
| Snowflake, Arizona | | | 2 | | | | 60,000 | | | | – | | | | – | | | | 277,000 | | | | – | | | | 337,000 | |
| Total capacity (tonnes) | | | 9 | | | | 540,000 | | | | 223,000 | | | | 226,000 | | | | 471,000 | | | | 335,000 | | | | 1,795,000 | |
| % of total capacity | | | | | | | 30 | % | | | 12 | % | | | 13 | % | | | 26 | % | | | 19 | % | | | 100 | % |
| 1 | Capacities expressed in the above table can vary as we are able to switch production between products, particularly newsprint, directory and machine-finished uncoated grades. |
| 2 | Total pulp capacity at Crofton is 395,000 tonnes, of which 335,000 tonnes are designated as market pulp with the remainder 60,000 tonnes being consumed internally. |
| 3 | No. 1 paper machine at Crofton remains indefinitely curtailed. If this machine were to be restarted we do not expect it would produce newsprint. |
SECOND QUARTER OVERVIEW
Creditor Protection and Restructuring Process
On January 31, 2012 we obtained an Initial Order from the Supreme Court of British Columbia under the Companies’ Creditors Arrangement Act (CCAA) staying creditor proceedings during our restructuring process under the CCAA. The Canadian Court Order under the CCAA was recognized under chapter 15 of title 11 of the US Bankruptcy Code. PricewaterhouseCoopers Inc. was appointed by the court as the monitor under the CCAA.
We arranged for a $175 million debtor-in possession facility (DIP Facility) as part of the CCAA proceedings. The DIP Facility has an 18-month maturity and is expected to provide for ongoing working capital, capital expenditure requirements as well as for general corporate purposes during the restructuring process under the CCAA. For further details on the DIP Facility, refer to note 14,Long-term debt, in our interim consolidated financial statements for the three months and six months ended June 30, 2012.
On March 9, 2012 the company entered into a restructuring and support agreement (RSA) with certain holders of our 11% senior secured notes due 2016 (2016 Notes) and our 7.375% notes due 2014 (2014 Notes) to proceed with a proposed recapitalization transaction to be implemented by way of a plan of arrangement under the CCAA. The original terms of the plan of arrangement as contemplated in the RSA are disclosed in our interim consolidated financial statements for the three months ended March 31, 2012.
On May 15, 2012 we announced amendments to the proposed plan of arrangement. This amended plan of arrangement was voted on by the company’s secured and unsecured creditors on May 23, 2012 but was not approved by the required voting threshold. With the amended plan of arrangement not being approved, the company commenced a sale process in accordance with court approved sale and investor solicitation procedures (SISP).
| CATALYST PAPER 2012 SECOND QUARTER REPORT | MANAGEMENT’S DISCUSSION AND ANALYSIS | ~ 5 ~ |
Approval of Plan of Arrangement
On June 14, 2012 we announced further amendments to the proposed plan of arrangement by way of a second amended plan of arrangement. The second amended plan of arrangement incorporated the principal changes in the first amended plan of arrangement, including:
| – | reduction of the principal amount of 11.0% secured notes to be issued to holders of 2016 Notes from US$325.0 million to US$250.0 million; |
| – | elimination of the new secured coupon notes contemplated in the original plan of arrangement in exchange for unpaid interest on the 2016 Notes (approximately US$45 million); |
| – | distribution of 50.0% of the net proceeds from the sale of our interest in Powell River Energy Inc. and Powell River Energy Limited Partnership (PREI) to unsecured creditors who do not make a cash election or equity election (see below); and |
| – | 100.0% of new shares to be issued to holders of 2016 Notes subject to dilution by those unsecured creditors who make an equity election to acquire up to 600,000 new common shares (4.0%) of the company; |
and, in addition, provided for the compromise of certain extended health benefits plans for former salaried employees. The company also obtained government approval of proposed modifications to the company’s defined benefit pension plan for salaried employees providing for a special portability election option and funding relief in respect of the solvency deficiency of the pension plan which, when implemented, would result in estimated annual savings of approximately $7 million.
Under the proposed recapitalization transaction under the second amended plan of arrangement:
| – | Holders of 2016 Notes will receive, in exchange for their US$390.4 million of notes plus accrued and unpaid interest: |
| Ø | US$250.0 million secured notes due in 2017 that bear interest, at the option of the company, of 11% cash or 7.5% cash plus 5.5% payment-in-kind (PIK); and |
| Ø | 100.0% of the company’s new common stock, subject to dilution for (i) the issuance of common shares of up to 4.0% to unsecured creditors who make an equity election, and (ii) a new management incentive plan. |
| | | |
| – | Holders of 2014 Notes will receive, in exchange for their US$250.0 million of notes plus accrued and unpaid interest: |
| Ø | the PREI proceeds pool (see above) subject to dilution for general creditors who make the PREI cash election; or |
| Ø | if an equity election is made, 4.0% of the company’s new common stock, subject to dilution for (i) general creditors who make an equity election, and (ii) a new management incentive plan. |
| | | |
| – | General creditors will receive, in exchange for their general unsecured claims: |
| Ø | their pro rata share of the PREI proceeds pool; or |
| Ø | if an equity election is made, their pro rata share of 4.0% new common stock, subject to dilution for a new management incentive plan; or |
| Ø | if a valid cash election is made, cash in an amount equal to 50.0% of the creditor’s claim, provided that the aggregate amount of cash payable to all such holders does not exceed $2.5 million. |
| – | Existing common shares of the company will be cancelled. |
On June 25, 2012 the second amended plan of arrangement received the necessary creditor approval through positive votes of approximately 99% of the secured creditors and 99% of the unsecured creditors who voted on the plan. The second amended plan of arrangement was subsequently approved by the British Columbia Supreme Court on June 28, 2012 and by the United States Court in Delaware under Chapter 15 of title 11 of the US Bankruptcy Code on July 27, 2012. The SISP process was suspended effective June 28, 2012 except in respect of PREI.
The British Columbia Supreme Court has approved an extension of the Company’s CCAA protection to September 30, 2012. Implementation of the second amended plan of arrangement is conditional on the company securing a new asset-based loan facility (ABL Facility) and/or other exit loan facility. This condition must be met before the company can exit the CCAA process.
| CATALYST PAPER 2012 SECOND QUARTER REPORT | MANAGEMENT’S DISCUSSION AND ANALYSIS | ~ 6 ~ |
Permanent closure of Snowflake recycle paper mill
On July 30, 2012 we announced the permanent closure of our Snowflake recycle mill operations. The mill, which is located in northeastern Arizona, will be permanently shut on September 30, 2012. The decision to close the mill was driven by continued financial losses resulting from intense supply input and market pressures. Snowflake has generated negative EBITDA since 2009, and a $161.8 million impairment charge was recorded on its assets under U.S. GAAP in the third quarter of 2011.
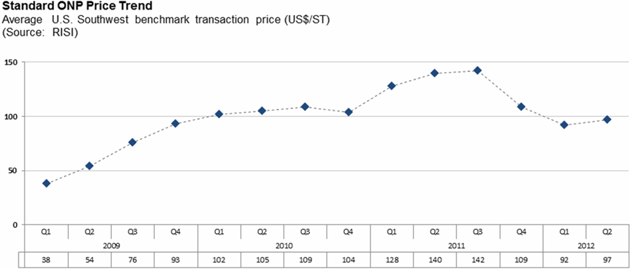
The company implemented a number of measures since acquiring the Snowflake operation in 2008 to address these market and input cost pressures, including the production of higher-value specialty paper grades at what was formerly a newsprint-only mill, capital investment, full leverage of the mill’s environmental attributes, competitive labour agreements, as well as productivity, quality and service improvements. However, with newsprint demand down more than 10% annually since the end of 2008, old newsprint (ONP) prices approximately 163% higher since 2009, and higher freight costs resulting from procurement and sales being forced to go further afield to source ONP and secure product orders, the mill could not be restored to profitability. The mill’s paper products are derived from ONP, and a US$5 per ton increase in ONP price has a negative impact of approximately US$2.0 million on EBITDA and approximately US$1.0 million on net earnings.
The mill closure, which will result in certain initial cash costs of approximately US$5.0 million which we expect to recoup from working capital and the sale of mill assets in 2013, is expected to result in the elimination of future operating losses associated with the mill and savings of annualized selling, general and administrative expenses.
Business Overview
Operating earnings for the quarter were down from the previous quarter due to reduced sales volumes, lower sales prices and higher maintenance spending, partially offset by the positive impact of a weaker Canadian dollar and labour savings that reflected the impact of the new labour deal.
While paper sales volumes increased, average transaction prices declined for all paper segments. Sales volumes for NBSK pulp declined and average transaction prices increased in the quarter. Manufacturing costs increased in the quarter primarily due to higher electric power and maintenance costs, partially offset by labour savings. The increase in maintenance costs was mostly due to a maintenance outage taken on our pulp assets that had originally been scheduled for the first quarter.
We continued to incur significant reorganization costs under the CCAA proceedings in the quarter, mostly consisting of professional fees for legal and consulting services. These reorganization charges were offset in the quarter by significant non-cash reorganization credits to adjust the historical book values of certain compromised liabilities to their allowed claims amounts as confirmed by the second amended plan of arrangement.
Financial Performance
We recorded a net loss attributable to the company of $11.7 million and a net loss attributable to the company before specific items of $5.0 million in Q2. This compared to a net loss of $25.6 million and $9.6 million, respectively, in Q1. Significant specific items in Q2 included a net reorganization credit resulting from the CCAA proceedings, and a foreign exchange loss on the translation of U.S. dollar denominated debt. Significant specific items in the prior quarter included restructuring costs incurred prior to entering into the CCAA proceedings, net reorganization expenses resulting from the CCAA proceedings, and a foreign exchange gain on the translation of U.S. dollar denominated debt.
EBITDA was $14.6 million and EBITDA before restructuring costs was $14.5 million in Q2 compared to EBITDA of $18.1 million and EBITDA before restructuring costs of $23.3 million in Q1. Refer to section 6,Non-GAAP measures, for additional information on specific items in the reported financial results.
| CATALYST PAPER 2012 SECOND QUARTER REPORT | MANAGEMENT’S DISCUSSION AND ANALYSIS | ~ 7 ~ |
SELECTED FINANCIAL INFORMATION
| | | 2012 | | 2011 |
(In millions of Canadian dollars, except where
otherwise stated) | | YTD | | Q2 | | Q1 | | Total | | Q4 | | Q3 | | Q2 | | Q1 |
| Sales | | $ | 628.6 | | | $ | 312.8 | | | $ | 315.8 | | | $ | 1,261.5 | | | $ | 319.8 | | | $ | 340.3 | | | $ | 297.8 | | | $ | 303.6 | |
| | | | | | | | | | | | | | | | | | | | | | | | | | | | | | | | | |
| Operating earnings (loss) | | | 17.2 | | | | 7.0 | | | | 10.2 | | | | (894.4 | ) | | | (701.3 | ) | | | (151.6 | ) | | | (30.6 | ) | | | (10.9 | ) |
| | | | | | | | | | | | | | | | | | | | | | | | | | | | | | | | | |
| Depreciation and amortization | | | 15.5 | | | | 7.6 | | | | 7.9 | | | | 112.4 | | | | 30.8 | | | | 27.8 | | | | 27.0 | | | | 26.8 | |
| | | | | | | | | | | | | | | | | | | | | | | | | | | | | | | | | |
| EBITDA1 | | | 32.7 | | | | 14.6 | | | | 18.1 | | | | 41.6 | | | | 2.8 | | | | 26.8 | | | | (3.9 | ) | | | 15.9 | |
| – before restructuring costs1 | | | 37.8 | | | | 14.5 | | | | 23.3 | | | | 47.5 | | | | 8.7 | | | | 26.8 | | | | (3.9 | ) | | | 15.9 | |
| | | | | | | | | | | | | | | | | | | | | | | | | | | | | | | | | |
| Net earnings (loss) attributable to the company | | | (37.3 | ) | | | (11.7 | ) | | | (25.6 | ) | | | (974.0 | ) | | | (708.0 | ) | | | (205.7 | ) | | | (47.4 | ) | | | (12.9 | ) |
| – before specific items1 | | | (14.6 | ) | | | (5.0 | ) | | | (9.6 | ) | | | (126.3 | ) | | | (41.7 | ) | | | (14.1 | ) | | | (46.9 | ) | | | (23.6 | ) |
| | | | | | | | | | | | | | | | | | | | | | | | | | | | | | | | | |
| EBITDA margin1 | | | 5.2 | % | | | 4.7 | % | | | 5.7 | % | | | 3.3 | % | | | 0.9 | % | | | 7.9 | % | | | (1.3 | %) | | | 5.2 | % |
| – before restructuring costs1 | | | 6.0 | % | | | 4.6 | % | | | 7.4 | % | | | 3.8 | % | | | 2.7 | % | | | 7.9 | % | | | (1.3 | %) | | | 5.2 | % |
| | | | | | | | | | | | | | | | | | | | | | | | | | | | | | | | | |
| Net earnings (loss) per share attributable to the company’s common shareholders (in dollars) | | | | | | | | | | | | | | | | | | | | | | | | | | | | | | | | |
| – basic and diluted | | $ | (0.10 | ) | | $ | (0.03 | ) | | $ | (0.07 | ) | | $ | (2.55 | ) | | $ | (1.85 | ) | | $ | (0.54 | ) | | $ | (0.13 | ) | | $ | (0.03 | ) |
| – before specific items1 | | | (0.04 | ) | | | (0.01 | ) | | | (0.03 | ) | | | (0.33 | ) | | | (0.11 | ) | | | (0.04 | ) | | | (0.12 | ) | | | (0.06 | ) |
| | | | | | | | | | | | | | | | | | | | | | | | | | | | | | | | | |
| (In thousands of tonnes) | | | | | | | | | | | | | | | | | | | | | | | | | | | | | | | | |
| Sales | | | 848.1 | | | | 421.0 | | | | 427.1 | | | | 1,638.8 | | | | 406.6 | | | | 439.8 | | | | 393.0 | | | | 399.4 | |
| Production | | | 854.5 | | | | 428.4 | | | | 426.1 | | | | 1,655.8 | | | | 421.0 | | | | 428.3 | | | | 396.1 | | | | 410.4 | |
| 1 | Refer to section 6, Non-GAAP measures. |
Market Overview
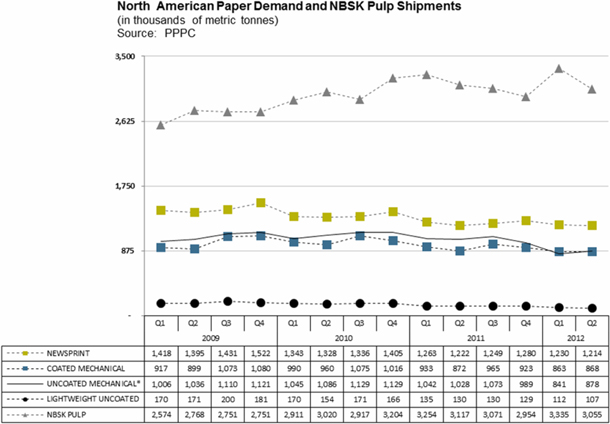
* Uncoated mechanical is comprised of high-gloss and standard grades.
| CATALYST PAPER 2012 SECOND QUARTER REPORT | MANAGEMENT’S DISCUSSION AND ANALYSIS | ~ 8 ~ |
Overall, market conditions remained challenging in the second quarter of 2012. North American demand for all paper grades decreased compared to the second quarter of 2011. North American demand for uncoated mechanical declined significantly compared to Q2 2011. Demand for lightweight coated paper declined slightly compared to levels of a year ago, and demand for newsprint and directory paper fell by 0.7% and 17.7%. Benchmark prices in the second quarter for coated and newsprint were down from the first quarter, while uncoated mechanical and directory prices remained flat.
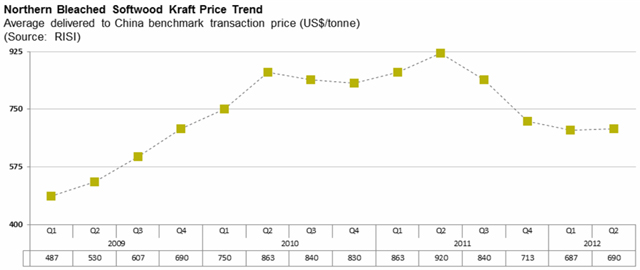
NBSK pulp shipments were 2.0% lower year over year due to declining demand and excess inventory in China. NBSK pulp benchmark prices for China strengthened compared to the first quarter.
STRATEGY UPDATE
Our objective is to return to profitability and maximize cash flows by focusing on reducing manufacturing costs and optimizing our brands and customer base. Additional information related to our corporate strategy, including key performance drivers and indicators, can be found on pages 12 to 21 of our 2011 Annual Report.
2012 Key Objectives
The following is an update on our second quarter progress towards our 2012 key objectives:
Social:
| — | Continue the progress made in 2011 to significantly improve our overall safety performance |
| – | We took a step back in the quarter on safety, with our lost-time injury frequency in Q2 2012 increasing to 2.15 compared to 0.22 in Q1 and our target of 1.10. Our medical incident rate increased to 4.94 in Q2 compared to 1.97 in Q1 and our target of 2.26. |
| — | Continue to seek competitive business conditions in B.C., including joint municipal infrastructure agreements and “value based” opportunities which will reduce operating costs for Catalyst Paper and municipalities |
| – | Reductions in the Class 4 municipal tax rate were confirmed for all three B.C. mills and total annual property taxes paid on July 3, 2012 were reduced by approximately $6.1 million to $12.2 million. |
| – | The joint infrastructure and tax agreement with the City of Powell River was finalized to transfer certain non-core interests, certain defined services under a long-term agreement, settle the mortgage receivable from PRSC Limited Partnership and sell the company’s interest in PRSC Land Developments Ltd., with proceeds expected in the third quarter. |
Financial:
| — | Continue to focus on cash flows, liquidity and cost reductions |
| – | Liquidity increased by $3.9 million from Q1 due to the increase in borrowing base and a decrease in the amount drawn on our DIP Facility. Free cash flow for the quarter was negative $4.8 million. |
| – | Cash on hand declined in the quarter primarily due to the payment of reorganization costs and pension contributions that were applied against the solvency deficit on our pension plans. |
| – | Capital spending was held at $3.0 million in the current quarter and directed primarily to maintenance of business. |
| — | Implement a restructuring process or other reorganization under the CCAA that will significantly improve our capital structure, liquidity and competitive footing |
| – | A second amended plan of arrangement received creditor approval on June 25, 2012 and was sanctioned by the B.C. Court on June 28, 2012 reducing debt by US$390.4 million, interest expense by US$33.9 million with more than $35.0 million expected in other annual cash savings once the company emerges from creditor protection. |
| — | Evaluate every existing physical asset to maximize financial contributions, product flexibility and capital structure |
| – | Total proceeds from the sale of non-core fixed assets for the six months ended June 30, 2012 was $7.9 million, with $7.4 million generated in the second quarter. |
| – | The sale of scrap metal / equipment components from the shuttered mill at Elk Falls is expected to take approximately five months and achieve approximately $8.0 million in proceeds. |
| CATALYST PAPER 2012 SECOND QUARTER REPORT | MANAGEMENT’S DISCUSSION AND ANALYSIS | ~ 9 ~ |
| — | Achieve a new collective labour agreement with all six local B.C. unions that is market competitive and innovative to help positively position Catalyst Paper for the future |
| – | New five-year labour agreements took effect on May 1, 2012 and are expected to deliver annual labour savings of $18 to $20 million. The new agreements include a 10% reduction in hourly wages and amended work rules, and provide for no wage inflation for the first three years with 2% increases in years four and five. |
Commercial:
| — | Continue to expand sales reach into new markets and increase market share with capital segments |
| – | We continue to grow sales of our book paper which has been positively received by book publishers. In addition, we have developed a 40 gram newsprint product that is helping us grow our sales while providing newspaper publishers with economic and environmental benefits. |
| — | Expand geographic reach of Catalyst Paper into emerging world markets of Latin America, India and Asia |
| – | We grew sales of all grades in key international markets that we are able to serve cost effectively from British Columbia and Arizona. We signed long-term contracts for telephone directory paper with a number of large publishers in Latin America. |
Environmental:
| — | Achieve conservation targets in water and energy |
| – | Data collection and water mapping in the baseline water usage audit at Powell River mill began in Q2 and supports a company-wide water usage conservation program associated with energy efficiency to be developed in the latter half of 2012. |
| — | Maintain international disclosure standards as set out in the UN Global Compact |
| – | Catalyst’s environmental, social and governance performance, and its reporting of progress on non-financial measures, earned the company a place during Q2 on the Corporate Knights list of Canada’s 50 Best Corporate Citizens for the sixth consecutive year. |
| — | Retain sales-supporting relationships with leading environmental groups |
| – | The company is actively engaged with a variety of recognized environmental groups including GreenBlue which has initiated development of Guidelines for Sustainable Paper Products as a collaborative market education project designed to inform and improve existing procurement policies and systems. |
CONSOLIDATED RESULTS OF OPERATIONS
Sales
Q2 2012 vs. Q1 2012
Sales revenues decreased by 0.9% as a result of reduced sales volumes for newsprint and pulp, and lower transaction prices for all paper segments, partially offset by the positive impact of a weaker Canadian dollar, higher sales volumes on the paper side for all specialty grades and higher average transaction prices for pulp.
Q2 2012 vs. Q2 2011
Sales revenues increased by 5.0% due to higher sales volumes for all paper segments except directory, the positive impact of a weaker Canadian dollar and higher average transaction prices in the current quarter for directory and uncoated mechanical paper. These factors were partially offset by reduced sales volumes for pulp and directory, and lower average transaction prices for pulp, newsprint and lightweight coated. Sales volumes for newsprint and uncoated mechanical paper were negatively impacted in Q2 2011 by fires and extended maintenance outages at our Snowflake and Powell River mills.
2012 YTD vs. 2011 YTD
Sales revenues increased by 4.5% due to the positive impact of a weaker Canadian dollar, higher sales volumes for pulp and all paper segments except directory, and higher average transaction prices for directory and uncoated mechanical paper. This was partially offset by reduced sales volumes for directory and lower average transaction prices for pulp, newsprint and lightweight coated paper.
| CATALYST PAPER 2012 SECOND QUARTER REPORT | MANAGEMENT’S DISCUSSION AND ANALYSIS | ~ 10 ~ |
EBITDA and EBITDA before Restructuring Costs
The following table provides variances between periods for EBITDA and EBITDA before restructuring costs:
| (In millions of Canadian dollars) | | Q1 2012 | | | Q2 2011 | | | 2011 YTD | |
| EBITDA in comparative period1 | | $ | 18.1 | | | $ | (3.9 | ) | | $ | 12.0 | |
| Restructuring costs | | | 5.2 | | �� | | – | | | | – | |
| EBITDA before restructuring costs in comparative period1 | | | 23.3 | | | | (3.9 | ) | | | 12.0 | |
| Paper prices | | | (4.4 | ) | | | (0.6 | ) | | | 3.1 | |
| Pulp prices | | | 0.5 | | | | (15.3 | ) | | | (30.6 | ) |
| Impact of Canadian dollar | | | 2.0 | | | | 7.2 | | | | 10.3 | |
| Volume and mix | | | 1.3 | | | | 4.6 | | | | 7.8 | |
| Distribution costs | | | (0.5 | ) | | | (0.9 | ) | | | (4.8 | ) |
| Furnish mix and costs | | | 2.0 | | | | 9.4 | | | | 12.3 | |
| Power and fuel costs | | | 0.2 | | | | 1.0 | | | | (2.7 | ) |
| Labour costs | | | 3.3 | | | | 5.3 | | | | 4.9 | |
| Maintenance costs | | | (4.6 | ) | | | 5.6 | | | | 12.7 | |
| Property taxes, licenses and insurance | | | 1.4 | | | | 1.9 | | | | 2.3 | |
| Selling, general and administrative | | | 0.5 | | | | 0.4 | | | | 1.3 | |
| Lower of cost or market impact on inventory, net of inventory change | | | (7.1 | ) | | | 2.4 | | | | 10.4 | |
| Other, net | | | (3.4 | ) | | | (2.6 | ) | | | (1.2 | ) |
| EBITDA before restructuring costs in the current period1 | | | 14.5 | | | | 14.5 | | | | 37.8 | |
| Restructuring costs | | | 0.1 | | | | 0.1 | | | | (5.1 | ) |
| EBITDA in the current period1 | | $ | 14.6 | | | $ | 14.6 | | | $ | 32.7 | |
| 1 | Refer to section 6,Non-GAAP measures. |
Operating Earnings (Loss)
Q2 2012 vs. Q1 2012
Operating earnings decreased by $3.2 million primarily due to lower EBITDA of $3.5 million.
Q2 2012 vs. Q2 2011
Operating earnings increased by $37.6 million due to increased EBITDA of $18.5 million and lower depreciation and amortization expense of $19.4 million due to the lower depreciable asset base resulting from impairment of property, plant and equipment in the fourth quarter of 2011.
2012 YTD vs. 2011 YTD
Operating earnings increased by $58.7 million due to increased EBITDA of $20.7 million and lower depreciation and amortization expense of $38.3 million.
Net Earnings (Loss) Attributable to the Company
Q2 2012 vs. Q1 2012
Net loss attributable to the company decreased by $13.9 million. This was mostly due to a $6.0 million after-tax credit to reorganization items in the quarter compared to an after-tax reorganization charge of $22.4 million in the prior quarter, an after-tax gain on the disposal of fixed assets of $6.6 million in the quarter compared to $0.5 million in Q1 2012, and an after-tax foreign exchange gain on the revaluation of U.S dollar denominated working capital of $3.9 million compared to an after-tax loss of $4.0 million in the prior quarter. This was partially offset by lower after-tax operating earnings of $3.2 million, higher after-tax interest expense of $2.3 million and an after-tax foreign exchange loss on translation of U.S. dollar denominated debt of $12.8 million compared to an after-tax gain of $11.6 million in the first quarter.
Q2 2012 vs. Q2 2011
Net loss attributable to the company decreased by $35.7 million primarily due to higher after-tax operating earnings of $37.6 million, a $6.0 million after-tax credit to reorganization items in the quarter, an after-tax loss on fires of $5.3 million in Q2 2011, an after-tax gain on the disposal of fixed assets of $6.6 million, and an after-tax foreign exchange gain on the revaluation of U.S dollar denominated working capital of $3.9 million compared to an after-tax loss of $1.1 million in Q2 2011, partially offset by higher after-tax interest expense of $7.1 million and an after-tax foreign exchange loss on translation of U.S. dollar denominated debt of $12.8 million compared to an after-tax gain of $4.5 million in Q2 2011.
| CATALYST PAPER 2012 SECOND QUARTER REPORT | MANAGEMENT’S DISCUSSION AND ANALYSIS | ~ 11 ~ |
2012 YTD vs. 2011 YTD
Net loss attributable to the company decreased by $23.0 million primarily due to higher after-tax operating earnings of $58.1 million, an after-tax loss on fires of $5.3 million in 2011, and an after-tax gain on the disposal of fixed assets of $7.1 million, partially offset by a year-to-date after-tax reorganization charge of $16.4 million, higher after-tax interest expense of $14.6 million and an after-tax foreign exchange loss on translation of U.S. dollar denominated debt of $1.2 million compared to an after-tax gain of $15.2 million in 2011.
SPECIALTY PRINTING PAPERS
| | | Three months
ended June 30, | | | Six months
ended June 30, | |
| (In millions of Canadian dollars, except where otherwise stated) | | 2012 | | | 2011 | | | Change | | | 2012 | | | 2011 | | | Change | |
| Sales | | $ | 179.1 | | | $ | 160.9 | | | $ | 18.2 | | | $ | 349.0 | | | $ | 328.0 | | | $ | 21.0 | |
| | | | | | | | | | | | | | | | | | | | | | | | | |
| Operating earnings (loss) | | | 7.7 | | | | (29.3 | ) | | | 37.0 | | | | 12.8 | | | | (36.5 | ) | | | 49.3 | |
| | | | | | | | | | | | | | | | | | | | | | | | | |
| Depreciation and amortization | | | 6.2 | | | | 18.8 | | | | (12.6 | ) | | | 12.4 | | | | 37.3 | | | | (24.9 | ) |
| | | | | | | | | | | | | | | | | | | | | | | | | |
| EBITDA1 | | | 13.9 | | | | (10.6 | ) | | | 24.5 | | | | 25.2 | | | | 0.7 | | | | 24.5 | |
| – before restructuring costs1 | | | 13.8 | | | | (10.6 | ) | | | 24.4 | | | | 27.5 | | | | 0.7 | | | | 26.8 | |
| | | | | | | | | | | | | | | | | | | | | | | | | |
| EBITDA margin1 | | | 7.8 | % | | | (6.6 | %) | | | 14.4 | % | | | 7.2 | % | | | 0.2 | % | | | 7.0 | % |
| – before restructuring costs1 | | | 7.7 | % | | | (6.6 | %) | | | 14.3 | % | | | 7.9 | % | | | 0.2 | % | | | 7.7 | % |
| | | | | | | | | | | | | | | | | | | | | | | | | |
| (In thousands of tonnes) | | | | | | | | | | | | | | | | | | | | | | | | |
| Sales | | | 216.3 | | | | 202.8 | | | | 13.5 | | | | 420.1 | | | | 409.5 | | | | 10.6 | |
| Production | | | 219.9 | | | | 200.9 | | | | 19.0 | | | | 429.5 | | | | 415.2 | | | | 14.3 | |
| 1 | Refer to section 6,Non-GAAP measures. |
Segment Overview
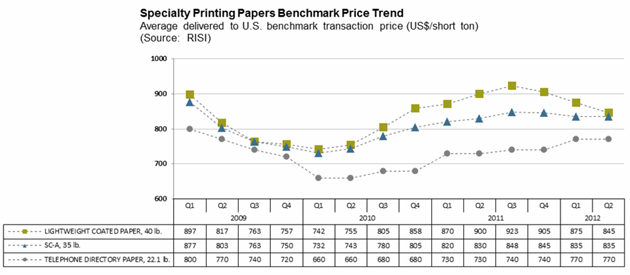
North American demand for coated mechanical and uncoated mechanical (high-gloss and standard grades) decreased 0.5% and 14.6% respectively, from the same quarter last year due to continued weakness in print advertising and significant SC capacity reductions. Coated mechanical inventories were lower year over year, while inventory levels for uncoated mechanical inventories remained flat. Adjusted operating rates continued to remain steady as mill and machine closures and curtailment offset lower demand. The average lightweight coated benchmark price decreased 3.4% to US$845 per short ton while the average benchmark price for soft-calendered A grade (SC-A) remained unchanged at US$835 per short ton compared to the previous quarter.
| CATALYST PAPER 2012 SECOND QUARTER REPORT | MANAGEMENT’S DISCUSSION AND ANALYSIS | ~ 12 ~ |
North American directory demand fell 17.7% in Q2 compared to the prior year due to ongoing pressure to reduce or eliminate white pages, smaller books, lower circulation, and the continued migration from printed books to the Internet. The average Q2 directory benchmark price remained unchanged at US$770 per short ton compared to the previous quarter. Operating rates for directory paper remain strong despite declining demand due to continued capacity reduction in the directory marketplace.
Operational Performance
The following chart summarizes the operating performance of our specialty printing papers segment:
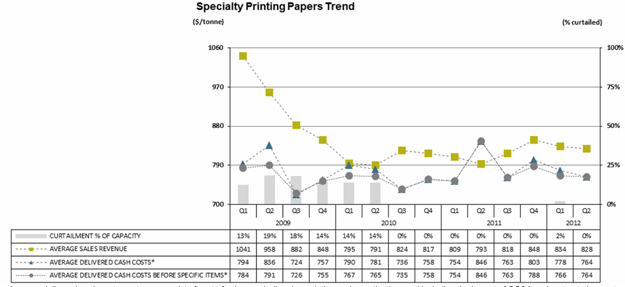
| * | Average delivered cash costs per tonne consist of cost of sales, excluding depreciation and amortization, and including the impact of SG&A and restructuring costs. Average delivered cash costs per tonne before specific items consist of cost of sales, excluding depreciation and amortization, and including the impact of SG&A, but excluding the impact of restructuring costs. |
Q2 2012 vs. Q2 2011
| — | Sales volume increased by 13,500 tonnes due to higher sales volumes for uncoated mechanical and lightweight coated paper, partially offset by lower sales for directory paper. Production and sales of uncoated mechanical in Q2 2011 was negatively impacted by an extended maintenance outage and fire at our Powell River mill. |
| — | Average sales revenue increased $35 per tonne due to the positive impact of a weaker Canadian dollar and higher average transaction prices for directory and uncoated mechanical, partially offset by lower average transaction prices for lightweight coated. |
| — | Average delivered cash costs decreased $82 per tonne primarily due to lower maintenance and labour cost, partially offset by increased distribution cost. The lower labour cost in the quarter was mostly due to the positive impact of the new labour deal that went into effect on May 1, 2012. Maintenance cost was lower due to the deferral of certain maintenance projects during the CCAA proceedings and due to an extended maintenance outage and fire at our Powell River mill in Q2 2011. |
2012 YTD vs. 2011 YTD
| — | Sales volume increased by 10,600 tonnes due to higher sales volumes for all specialty grades except directory paper. |
| — | Average sales revenue increased $30 per tonne due to the positive impact of a weaker Canadian dollar and higher average transaction prices for all specialty grades excluding lightweight coated paper. |
| — | Average delivered cash costs decreased by $28 per tonne primarily due to lower maintenance, labour and kraft costs, partially offset by higher chemicals and electric power costs and the incurrence of restructuring costs in 2012. |
| CATALYST PAPER 2012 SECOND QUARTER REPORT | MANAGEMENT’S DISCUSSION AND ANALYSIS | ~ 13 ~ |
Newsprint
| | | Three months
ended June 30, | | | Six months
ended June 30, | |
| (In millions of Canadian dollars, except where otherwise stated) | | 2012 | | | 2011 | | | Change | | | 2012 | | | 2011 | | | Change | |
| Sales | | $ | 83.2 | | | $ | 71.5 | | | $ | 11.7 | | | $ | 168.7 | | | $ | 146.9 | | | $ | 21.8 | |
| | | | | | | | | | | | | | | | | | | | | | | | | |
| Operating earnings (loss) | | | 2.3 | | | | (11.9 | ) | | | 14.2 | | | | 4.0 | | | | (17.2 | ) | | | 21.2 | |
| | | | | | | | | | | | | | | | | | | | | | | | | |
| Depreciation and amortization | | | 0.8 | | | | 4.5 | | | | (3.7 | ) | | | 2.0 | | | | 9.2 | | | | (7.2 | ) |
| | | | | | | | | | | | | | | | | | | | | | | | | |
| EBITDA1 | | | 3.1 | | | | (7.6 | ) | | | 10.7 | | | | 6.0 | | | | (8.2 | ) | | | 14.2 | |
| – before restructuring costs1 | | | 3.1 | | | | (7.6 | ) | | | 10.7 | | | | 7.5 | | | | (8.2 | ) | | | 15.7 | |
| | | | | | | | | | | | | | | | | | | | | | | | | |
| EBITDA margin1 | | | 3.7 | % | | | (10.6 | %) | | | 14.3 | % | | | 3.6 | % | | | (5.6 | %) | | | 9.2 | % |
| – before restructuring costs1 | | | 3.7 | % | | | (10.6 | %) | | | 14.3 | % | | | 4.4 | % | | | (5.6 | %) | | | 10.0 | % |
| | | | | | | | | | | | | | | | | | | | | | | | | |
| (In thousands of tonnes) | | | | | | | | | | | | | | | | | | | | | | | | |
| Sales | | | 128.2 | | | | 111.8 | | | | 16.4 | | | | 258.4 | | | | 228.2 | | | | 30.2 | |
| Production | | | 130.8 | | | | 111.7 | | | | 19.1 | | | | 261.8 | | | | 236.5 | | | | 25.3 | |
| 1 | Refer to section 6,Non-GAAP measures. |
Segment Overview
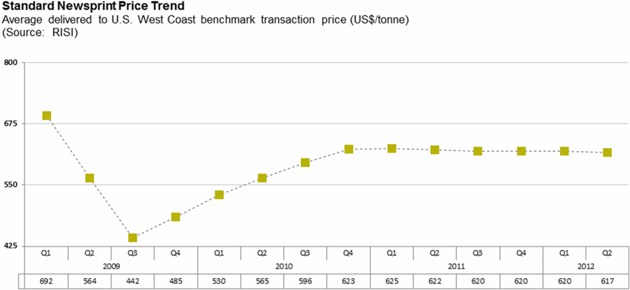
Total North American demand for newsprint was down 0.7% in Q2 year over year reflecting lower newspaper print advertising and circulation. Operating rates were similar to the previous year due to North American newsprint capacity being reduced at a rate to compensate for declining demand. The average Q2 North American newsprint benchmark price declined slightly to US$617 per tonne compared to the previous quarter.
The Crofton No.1 paper machine remained indefinitely curtailed throughout the quarter and, if it were restarted on an unspecified future date, we do not expect that it would produce newsprint.
The price of ONP strengthened in Q2 compared to Q1, and challenges surrounding the quality of supply, lack of price stability, and limited availability in cost effective locations near our Snowflake facility continued to be a concern.
| CATALYST PAPER 2012 SECOND QUARTER REPORT | MANAGEMENT’S DISCUSSION AND ANALYSIS | ~ 14 ~ |
Operational Performance
The following chart summarizes the operating performance of our newsprint segment:

| * | Although C1 remains indefinitely curtailed it isn’t included in our 2012 capacity table. |
| ** | Average delivered cash costs per tonne consist of cost of sales, excluding depreciation and amortization, and including the impact of SG&A and restructuring costs. Average delivered cash costs per tonne before specific items consist of cost of sales, excluding depreciation and amortization, and including the impact of SG&A, but excluding the impact of restructuring costs. |
Q2 2012 vs. Q2 2011
| — | Sales volume increased by 16,400 tonnes as a result of increased production in the current quarter. Production and sales in Q2 2011 were negatively impacted by an extended maintenance outage, fire and market curtailment at our Snowflake mill. |
| — | Average sales revenue increased $9 per tonne due to the positive impact of a weaker Canadian dollar, partially offset by lower average transaction prices. |
| CATALYST PAPER 2012 SECOND QUARTER REPORT | MANAGEMENT’S DISCUSSION AND ANALYSIS | ~ 15 ~ |
| — | Average delivered cash costs decreased $83 per tonne due primarily to the lower cost of ONP and reduced maintenance and labour spending. Labour cost was lower due to the impact of the new labour deal and maintenance cost was lower due to the deferral of certain maintenance projects during the CCAA proceedings and due to an extended maintenance outage at our Snowflake mill in Q2 2011. |
2012 YTD vs. 2011 YTD
| — | Sales volume increased by 30,200 tonnes due to stronger production in 2012 and the impact of a maintenance outage, fire and market curtailment at the Snowflake mill on the prior year’s results. |
| — | Average sales revenue increased by $9 per tonne due to the positive impact of a weaker Canadian dollar, partially offset by lower average transaction prices. |
| — | Average delivered cash costs decreased $50 per tonne primarily due to lower ONP, maintenance and labour costs, partially offset by higher electric power costs and the incurrence of restructuring costs in 2012. |
Pulp
| | | Three months
ended June 30, | | | Six months
ended June 30, | |
| (In millions of Canadian dollars, except where otherwise stated) | | 2012 | | | 2011 | | | Change | | | 2012 | | | 2011 | | | Change | |
| Sales | | $ | 50.5 | | | $ | 65.4 | | | $ | (14.9 | ) | | $ | 110.9 | | | $ | 126.5 | | | $ | (15.6 | ) |
| | | | | | | | | | | | | | | | | | | | | | | | | |
| Operating earnings (loss) | | | (3.0 | ) | | | 10.6 | | | | (13.6 | ) | | | 0.4 | | | | 12.2 | | | | (11.8 | ) |
| | | | | | | | | | | | | | | | | | | | | | | | | |
| Depreciation and amortization | | | 0.6 | | | | 3.7 | | | | (3.1 | ) | | | 1.1 | | | | 7.3 | | | | (6.2 | ) |
| | | | | | | | | | | | | | | | | | | | | | | | | |
| EBITDA1 | | | (2.4 | ) | | | 14.3 | | | | (16.7 | ) | | | 1.5 | | | | 19.5 | | | | (18.0 | ) |
| – before restructuring costs1 | | | (2.4 | ) | | | 14.3 | | | | (16.7 | ) | | | 2.8 | | | | 19.5 | | | | (16.7 | ) |
| | | | | | | | | | | | | | | | | | | | | | | | | |
| EBITDA margin1 | | | (4.8 | %) | | | 21.9 | % | | | (26.7 | %) | | | 1.4 | % | | | 15.4 | % | | | (14.0 | %) |
| – before restructuring costs1 | | | (4.8 | %) | | | 21.9 | % | | | (26.7 | %) | | | 2.5 | % | | | 15.4 | % | | | (12.9 | %) |
| | | | | | | | | | | | | | | | | | | | | | | | | |
| (In thousands of tonnes) | | | | | | | | | | | | | | | | | | | | | | | | |
| Sales | | | 76.5 | | | | 78.4 | | | | (1.9 | ) | | | 169.6 | | | | 154.7 | | | | 14.9 | |
| Production | | | 77.7 | | | | 83.5 | | | | (5.8 | ) | | | 163.2 | | | | 154.8 | | | | 8.4 | |
| 1 | Refer to section 6,Non-GAAP measures. |
| CATALYST PAPER 2012 SECOND QUARTER REPORT | MANAGEMENT’S DISCUSSION AND ANALYSIS | ~ 16 ~ |
Segment Overview
NBSK pulp markets remained weak in the second quarter due to weak demand and excess end-user inventory in China. Global NBSK shipments declined by 2.0% from the same quarter last year. The average NBSK benchmark pulp price for China increased to US$690 per tonne compared to the previous quarter.
Operational Performance
The following chart summarizes the operating performance of our pulp segment:

| * | Average delivered cash costs per tonne consist of cost of sales, excluding depreciation and amortization, and including the impact of SG&A and restructuring costs. Average delivered cash costs per tonne before specific items consist of cost of sales, excluding depreciation and amortization, and including the impact of SG&A, but excluding the impact of restructuring costs. |
Q2 2012 vs. Q2 2011
| — | Sales volume decreased by 1,900 tonnes compared to the same quarter last year. |
| — | Average sales revenue decreased $173 per tonne due to lower average transaction prices in the current quarter, partially offset by the positive impact of a weaker Canadian dollar. Weak pulp prices in 2012 reflect soft demand and excess inventory in China. |
| — | Average delivered cash costs increased by $41 per tonne due to higher maintenance spending and a lower-of-cost-or-market (LCM) adjustment to inventory in the quarter, partially offset by lower chip prices. The higher maintenance spending reflected a maintenance outage originally scheduled for the first quarter that was delayed and taken in the second quarter of 2012. |
2012 YTD vs. 2011 YTD
| —· | Sales volume increased by 14,900 tonnes due to increased production and the inclusion of an 8,000 tonne shipment in current year that was delayed in December 2011. |
| — | Average sales revenue decreased $164 per tonne due to lower average transaction prices, partially offset by the positive impact of a weaker Canadian dollar. |
| — | Average delivered cash costs decreased $47 per tonne due to lower chip prices and labour costs, partially offset by the incurrence of restructuring costs in 2012. |
| CATALYST PAPER 2012 SECOND QUARTER REPORT | MANAGEMENT’S DISCUSSION AND ANALYSIS | ~ 17 ~ |
| 3. | LIQUIDITY AND CAPITAL RESOURCES |
Selected Financial Information
| | | Three months
ended June 30, | | | Six months
ended June 30, | |
| (In millions of Canadian dollars, except where otherwise stated) | | 2012 | | | 2011 | | | Change | | | 2012 | | | 2011 | | | Change | |
| Cash flows provided (used) by operations before changes in non-cash working capital | | $ | (3.2 | ) | | $ | (30.1 | ) | | $ | 26.9 | | | $ | (3.4 | ) | | $ | (35.9 | ) | | $ | 32.5 | |
| | | | | | | | | | | | | | | | | | | | | | | | | |
| Changes in non-cash working capital | | | (5.0 | ) | | | 14.4 | | | | (19.4 | ) | | | (19.5 | ) | | | 7.2 | | | | (26.7 | ) |
| Cash flows provided (used) by | | | | | | | | | | | | | | | | | | | | | | | | |
| Operations | | | (8.2 | ) | | | (15.7 | ) | | | 7.5 | | | | (22.9 | ) | | | (28.7 | ) | | | 5.8 | |
| Investing activities | | | 14.2 | | | | (5.2 | ) | | | 19.4 | | | | (2.8 | ) | | | (7.8 | ) | | | 5.0 | |
| Financing activities | | | (7.5 | ) | | | (2.7 | ) | | | (4.8 | ) | | | 18.4 | | | | (28.7 | ) | | | 47.1 | |
| Capital spending | | | 3.0 | | | | 5.6 | | | | (2.6 | ) | | | 4.9 | | | | 7.9 | | | | (3.0 | ) |
| Depreciation and amortization | | | 7.6 | | | | 27.0 | | | | (19.4 | ) | | | 15.5 | | | | 53.8 | | | | (38.3 | ) |
| Impairment (recovery) and other closure costs | | | – | | | | (0.3 | ) | | | 0.3 | | | | – | | | | (0.3 | ) | | | 0.3 | |
| Capital spending as % of depreciation and amortization | | | 39 | % | | | 21 | % | | | 18 | % | | | 32 | % | | | 15 | % | | | 17 | % |
| | | | | | | | | | | | | | | | | | | | | | | | | |
| Net debt to net capitalization at June 301 | | | 417 | % | | | 67 | % | | | 350 | % | | | 417 | % | | | 67 | % | | | 350 | % |
| 1 | Net debt ratio equals net debt (total debt less cash) divided by net capitalization (shareholder’s equity attributable to the company and total debt less cash). |
Refer to page 37 of our 2011 Annual Report for a discussion of the nature and sources of funding for our principal cash requirements.
Operating Activities
Cash flows from operating activities increased by $7.5 million in Q2 from the same quarter in the previous year, primarily due to an increase in EBITDA of $18.5 million and lower cash interest paid in the quarter, partially offset by reorganization expenses paid in the quarter, and an increase in non-cash working capital primarily due to increased accounts receivable and reduced accounts payable.
Investing Activities
Cash provided by investing activities was $14.2 million in Q2 compared to cash used of $5.2 million in the same quarter last year. This increase was largely due to reduced capital spending, a decrease in restricted cash and increased proceeds from the sale of fixed assets in the current quarter. Capital spending in the current period related primarily to maintenance of business projects.
Financing Activities
Cash used by financing activities in Q2 was $7.5 million compared to cash used of $2.7 million in the same quarter last year. This was primarily due to a $7.3 million repayment on our DIP Facility in the current quarter.
| CATALYST PAPER 2012 SECOND QUARTER REPORT | MANAGEMENT’S DISCUSSION AND ANALYSIS | ~ 18 ~ |
Capital Resources
Availability on the DIP Facility (ABL Facility for pre-filing periods) and total liquidity is summarized in the following table:
| | | DIP Facility | | | ABL Facility | |
| | | 2012 | | | 2011 | |
| (In millions of Canadian dollars) | | Q2 | | | Q1 | | | Q4 | | | Q3 | | | Q2 | | | Q1 | |
| | | | | | | | | | | | | | | | | | | |
| Borrowing base | | $ | 159.6 | 1 | | $ | 142.1 | 1 | | $ | 151.8 | 2 | | $ | 167.3 | 2 | | $ | 134.3 | 2 | | $ | 174.1 | 2 |
| | | | | | | | | | | | | | | | | | | | | | | | | |
| Letters of credit | | | (19.6 | ) | | | (17.8 | ) | | | (32.2 | ) | | | (27.7 | ) | | | (28.1 | ) | | | (25.5 | ) |
| | | | | | | | | | | | | | | | | | | | | | | | | |
| Amount drawn, net | | | (70.5 | ) | | | (77.8 | ) | | | (48.0 | ) | | | (31.5 | ) | | | – | | | | – | |
| | | | | | | | | | | | | | | | | | | | | | | | | |
| Minimum excess availability | | | (21.9) | 3 | | | – | | | | – | | | | – | | | | – | | | | (35.0 | ) |
| | | | | | | | | | | | | | | | | | | | | | | | | |
| Availability | | | 47.6 | | | | 46.5 | 4 | | | 71.6 | 4 | | | 108.1 | 4 | | | 106.2 | 4 | | | 113.6 | |
| | | | | | | | | | | | | | | | | | | | | | | | | |
| Cash on hand | | | 17.8 | | | | 19.3 | | | | 25.1 | | | | 17.8 | | | | 30.2 | | | | 53.8 | |
| | | | | | | | | | | | | | | | | | | | | | | | | |
| Restricted cash5 | | | 6.4 | | | | 2.1 | | | | – | | | | – | | | | – | | | | – | |
| | | | | | | | | | | | | | | | | | | | | | | | | |
| Total liquidity | | $ | 71.8 | | | $ | 67.9 | | | $ | 96.7 | | | $ | 125.9 | | | $ | 136.4 | | | $ | 167.4 | |
| 1 | Borrowing base for the DIP Facility includes reserves of $2.7 million for pension, $3.6 million for employees, $2.0 million for landlord waivers, $1.5 million for insured receivables dilution, $2.0 million for credit insurance deductibles, and $1.5 million for CCAA charges in priority to DIP charge. |
| 2 | Borrowing base for the ABL Facility included a reserve of $0.4 million at December 31, 2011 for unpaid property taxes and associated penalties (Q3 2011 - $0.4 million, Q2 2011 - $4.5 million, Q1 2011 - $4.4 million). |
| 3 | The DIP Facility is subject to an excess availability condition as disclosed in our interim consolidated financial statements for the three and six months ended June 30, 2012 in note 14,Long-term debt. |
| 4 | Requirement to maintain a minimum fixed charge coverage ratio of 1.1/1.0 if excess availability falls below $21.9 million. |
| 5 | Restricted cash consists of $6.4 million in frozen proceeds on the sale of certain assets at our discontinued Elk Falls paper mill, our discontinued paper recycling operation and poplar plantation land. |
We had restricted cash on June 30, 2012 of $9.0 million, which included $2.6 million collateral against letters of credit, and $6.4 million in frozen proceeds on the sale of certain assets. Asset sales included $1.8 million at our discontinued Elk Falls paper mill, $1.0 million at our discontinued paper recycling operation, and $3.6 million poplar plantation land. The $2.6 million cash collateral, held at a rate of 105% of letters of credit formerly recognized under our ABL Facility but not presently recognized under our DIP Facility, is netted against letters of credit in the liquidity table above.
As disclosed in note 14,Long-term debt, in our interim consolidated financial statements for the three and six months ended June 30, 2012 the DIP Credit Agreement was amended in the quarter to include a new condition to maintain excess availability of no less than $21.9 million, replacing the former financial covenant that required us to maintain a minimum fixed charge coverage ratio of 1.1/1.0 if excess availability under the Facility fell below $21.9 million.
Our total liquidity decreased by $64.6 million from the same quarter last year primarily due to reduced cash on hand, the excess availability requirement under the DIP Facility (discussed above), and the significant amount drawn on our DIP Facility, partially offset by an increase in our borrowing base. Liquidity increased by $3.9 million compared to the previous quarter largely due to an increase in our borrowing base, and a decrease in the amount drawn on our DIP Facility, partially offset by the excess availability requirement in the current quarter. The borrowing base increased in the current quarter due to increased working capital levels at the end of June. The reduction in cash on hand was attributable primarily to the payment of reorganization costs and pension contributions that were applied against the solvency deficit on our pension plans.
At August 1, 2012 the company had 381,900,450 common shares issued and outstanding and 7,148,807 stock options for 7,148,807 common shares that at August 1, 2012 were exercisable.All existing common shares, options, warrants, rights and similar instruments of the company will be cancelled on emergence from the CCAA process.
| CATALYST PAPER 2012 SECOND QUARTER REPORT | MANAGEMENT’S DISCUSSION AND ANALYSIS | ~ 19 ~ |
Financial Instruments
Our financial instruments consist primarily of cash and cash equivalents, accounts receivable, accounts payable and accrued liabilities, long-term debt, and derivatives. Derivatives are used primarily to reduce exposure to currency risk on revenues, or occasionally debt, as well as price risk associated with revenue and energy costs.
For a description of the nature and extent of risk to the company from our financial instruments, as well as our respective accounting treatment of financial instruments, refer to our annual consolidated financial statements for the year ended December 31, 2011 note 25,Financial instruments. For the methods and assumptions we use to determine the fair value of financial instruments, refer to note 24,Fair value measurement, of those statements. Our methods and assumptions for determining the fair value of financial instruments have not changed materially since those used in the preparation of our consolidated financial statements for the year ended December 31, 2011.
We settled our foreign currency options in the quarter for proceeds of $2.4 million. At June 30, 2012 the company did not have any foreign currency or commodity contracts outstanding.
The following table reconciles the average spot exchange rate to our effective exchange rate and provides the impact to EBITDA related to the cash flow hedges that were in place as at March 31, 2010 and were designated as hedging instruments at that time:
US$/CDN$ FOREIGN EXCHANGE
| | | 2012 | | | 2011 | |
| | | Q2 | | | Q1 | | | Q4 | | | Q3 | | | Q2 | | | Q1 | |
| Average Bank of Canada noon spot rate | | | 0.990 | | | | 0.999 | | | | 0.977 | | | | 1.020 | | | | 1.033 | | | | 1.015 | |
| (Favourable)/unfavourable impact of derivatives designated as effective hedges for accounting purposes1 | | | – | | | | – | | | | – | | | | – | | | | (0.001 | ) | | | (0.004 | ) |
| | | | | | | | | | | | | | | | | | | | | | | | | |
| Average effective rate included in EBITDA | | | 0.990 | | | | 0.999 | | | | 0.977 | | | | 1.020 | | | | 1.032 | | | | 1.011 | |
| | | | | | | | | | | | | | | | | | | | | | | | | |
| (Favourable)/unfavourable impact of derivatives, other than those designated as effective hedges for accounting purposes, included in other expenses2 | | | 0.001 | | | | 0.004 | | | | (0.004 | ) | | | 0.023 | | | | (0.002 | ) | | | (0.011 | ) |
| Foreign exchange (gain)/loss, on working capital balances, included in other expenses3 | | | (0.017 | ) | | | 0.017 | | | | 0.020 | | | | (0.043 | ) | | | 0.006 | | | | 0.007 | |
| Average effective rate in net earnings/(loss) before income taxes4 | | | 0.974 | | | | 1.020 | | | | 0.993 | | | | 1.000 | | | | 1.036 | | | | 1.007 | |
| | | | | | | | | | | | | | | | | | | | | | | | | |
| (In millions of dollars) | | | | | | | | | | | | | | | | | | | | | | | | |
| 1 Favourable/(unfavourable) impact of derivatives designated as effective hedges for accounting purposes included in EBITDA | | $ | – | | | $ | – | | | $ | 0.1 | | | $ | 0.2 | | | $ | 0.3 | | | $ | 0.9 | |
| 2 Favourable/(unfavourable) impact of derivatives other than those designated as effective hedges for accounting purposes included in other expenses | | | (0.2 | ) | | | (0.9 | ) | | | 0.9 | | | | (5.8 | ) | | | 0.3 | | | | 2.5 | |
| 3 Foreign exchange gain/(loss) on working capital balances included in other expenses | | | 3.9 | | | | (4.0 | ) | | | (4.9 | ) | | | 10.9 | | | | (1.2 | ) | | | (1.6 | ) |
| 4 Excludes foreign exchange gain/(loss) on long term debt and $US interest expense | | | | | | | | | | | | | | | | | | | | | | | | |
The company’s contingent liabilities at December 31, 2011 are described on page 41 of our 2011 Annual Report. For additional and updated information regarding the company’s contingent liabilities, refer to our interim consolidated financial statements for the three and six months ended June 30, 2012 note 22,Contingent liabilities. There were no significant changes in Q2 2012.
| CATALYST PAPER 2012 SECOND QUARTER REPORT | MANAGEMENT’S DISCUSSION AND ANALYSIS | ~ 20 ~ |
| 5. | SUMMARY OF QUARTERLY RESULTS |
The following table highlights selected financial information for the eight consecutive quarters ending June 30, 2012:
| | | 2012 | | | 2011 | | | 2010 | |
| (In millions of Canadian dollars, except per share amounts) | | Q2 | | | Q1 | | | Q4 | | | Q3 | | | Q2 | | | Q1 | | | Q4 | | | Q3 | |
| Sales | | $ | 312.8 | | | $ | 315.8 | | | $ | 319.8 | | | $ | 340.3 | | | $ | 297.8 | | | $ | 303.6 | | | $ | 333.6 | | | $ | 322.3 | |
| | | | | | | | | | | | | | | | | | | | | | | | | | | | | | | | | |
| EBITDA1 | | | 14.6 | | | | 18.1 | | | | 2.8 | | | | 26.8 | | | | (3.9 | ) | | | 15.9 | | | | 28.7 | | | | 34.2 | |
| Net earnings (loss) attributable to the company | | | (11.7 | ) | | | (25.6 | ) | | | (708.0 | ) | | | (205.7 | ) | | | (47.4 | ) | | | (12.9 | ) | | | 9.6 | | | | 6.0 | |
| | | | | | | | | | | | | | | | | | | | | | | | | | | | | | | | | |
| Net earnings (loss) per share attributable to the company’s common shareholders | | | | | | | | | | | | | | | | | | | | | | | | | | | | | | | | |
| – basic and diluted | | $ | (0.03 | ) | | $ | (0.07 | ) | | $ | (1.85 | ) | | $ | (0.54 | ) | | $ | (0.13 | ) | | $ | (0.03 | ) | | $ | 0.02 | | | $ | 0.02 | |
| 1 | Refer to section 6,Non-GAAP measures. |
Refer to section 1,Overview and highlights, and the discussion onConsolidated results of operations,for details of Q2 2012 results compared to Q1 2012.
For summary financial information about Powell River Energy Inc., a variable interest entity for which we are the primary beneficiary, refer to note 6,Variable interest entities, of our interim consolidated financial statements for the three and six months ended June 30, 2012.
Management uses certain measures that are not defined by U.S. GAAP to evaluate our performance and, as a result, the measures as employed by management may not be comparable to similarly titled measures reported by other entities. These non-GAAP measures should not be considered by an investor as an alternative to their nearest respective GAAP measure. Our non-GAAP measures include operating earnings (loss), EBITDA (earnings before interest, taxes, depreciation and amortization, impairment and other closure costs, and before other non-operating income and expenses), EBITDA before restructuring costs, EBITDA margin, EBITDA margin before restructuring costs, average delivered cash costs per tonne before specific items, net earnings (loss) attributable to the company before specific items, net earnings (loss) per share attributable to the company’s common shareholders before specific items, and free cash flow.
Specific items are items of an unusual or non-recurring nature, or items that are subject to material volatility based on factors outside of management’s control. Specific items include: foreign exchange gain or loss on long-term debt; gain or loss on cancellation of long-term debt; asset-impairment and other closure costs; restructuring costs; unusual non-recurring items; and certain income tax adjustments.
| CATALYST PAPER 2012 SECOND QUARTER REPORT | MANAGEMENT’S DISCUSSION AND ANALYSIS | ~ 21 ~ |
EBITDA and EBITDA before restructuring costs
EBITDA as defined equates to operating earnings (loss) plus depreciation and amortization and impairment and other closure costs. EBITDA margin and EBITDA margin before restructuring costs are defined as EBITDA and EBITDA before restructuring costs as a percentage of sales. These measures enable comparison of consolidated and segment operating results between periods without regard to debt service, income taxes, capital expenditure requirements, and specific items.
Reconciliation to Net Earnings (Loss) Attributable to the Company:
| | | 2012 | | | 2011 | |
| (In millions of Canadian dollars) | | YTD | | | Q2 | | | Q1 | | | Total | | | Q4 | | | Q3 | | | Q2 | | | Q1 | |
| Net earnings (loss) attributable to the company | | $ | (37.3 | ) | | $ | (11.7 | ) | | $ | (25.6 | ) | | $ | (974.0 | ) | | $ | (708.0 | ) | | $ | (205.7 | ) | | $ | (47.4 | ) | | $ | (12.9 | ) |
| Net earnings (loss) attributable to non-controlling interest | | | (0.8 | ) | | | (0.6 | ) | | | (0.2 | ) | | | (2.6 | ) | | | (2.3 | ) | | | – | | | | (0.3 | ) | | | – | |
| Net earnings (loss) | | | (38.1 | ) | | | (12.3 | ) | | | (25.8 | ) | | | (976.6 | ) | | | (710.3 | ) | | | (205.7 | ) | | | (47.7 | ) | | | (12.9 | ) |
| Depreciation and amortization | | | 15.5 | | | | 7.6 | | | | 7.9 | | | | 112.4 | | | | 30.8 | | | | 27.8 | | | | 27.0 | | | | 26.8 | |
| Impairment (recovery) and other closure costs | | | – | | | | – | | | | – | | | | 823.6 | | | | 673.3 | | | | 150.6 | | | | (0.3 | ) | | | – | |
| Foreign exchange (gain) loss on long-term debt | | | 1.2 | | | | 12.8 | | | | (11.6 | ) | | | 9.7 | | | | (14.0 | ) | | | 41.0 | | | | (5.1 | ) | | | (12.2 | ) |
| Loss on Snowflake fire | | | – | | | | – | | | | – | | | | 4.4 | | | | 0.3 | | | | – | | | | 4.1 | | | | – | |
| Loss on Powell River fire | | | – | | | | – | | | | – | | | | 2.4 | | | | 0.8 | | | | – | | | | 1.6 | | | | – | |
| Other (income) expense | | | (5.6 | ) | | | (10.3 | ) | | | 4.7 | | | | (0.3 | ) | | | 4.1 | | | | (5.6 | ) | | | 0.7 | | | | 0.5 | |
| Interest expense, net | | | 44.0 | | | | 23.4 | | | | 20.6 | | | | 73.4 | | | | 18.4 | | | | 19.0 | | | | 18.7 | | | | 17.3 | |
| Income tax expense (recovery) | | | (0.7 | ) | | | (0.6 | ) | | | (0.1 | ) | | | (7.4 | ) | | | (0.6 | ) | | | (0.3 | ) | | | (2.9 | ) | | | (3.6 | ) |
| Reorganization items, net | | | 16.4 | | | | (6.0 | ) | | | 22.4 | | | | – | | | | – | | | | – | | | | – | | | | – | |
| EBITDA | | $ | 32.7 | | | $ | 14.6 | | | $ | 18.1 | | | $ | 41.6 | | | $ | 2.8 | | | $ | 26.8 | | | $ | (3.9 | ) | | $ | 15.9 | |
| | | | | | | | | | | | | | | | | | | | | | | | | | | | | | | | | |
| Restructuring costs | | | | | | | | | | | | | | | | | | | | | | | | | | | | | | | | |
| Specialty printing papers | | | 2.3 | | | | (0.1 | ) | | | 2.4 | | | | 3.5 | | | | 3.5 | | | | – | | | | – | | | | – | |
| Newsprint | | | 1.5 | | | | – | | | | 1.5 | | | | 1.5 | | | | 1.5 | | | | – | | | | – | | | | – | |
| Pulp | | | 1.3 | | | | – | | | | 1.3 | | | | 0.9 | | | | 0.9 | | | | – | | | | – | | | | – | |
| Total restructuring costs | | | 5.1 | | | | (0.1 | ) | | | 5.2 | | | | 5.9 | | | | 5.9 | | | | – | | | | – | | | | – | |
| | | | | | | | | | | | | | | | | | | | | | | | | | | | | | | | | |
| EBITDA before restructuring costs | | $ | 37.8 | | | $ | 14.5 | | | $ | 23.3 | | | $ | 47.5 | | | $ | 8.7 | | | $ | 26.8 | | | $ | (3.9 | ) | | $ | 15.9 | |
Net Earnings (Loss) Attributable to the Company Before Specific Items
Specific items are defined previously, and the exclusion of such items from net earnings (loss) attributable to the company facilitates the comparison of financial results between periods.
Reconciliation to Net Earnings (Loss) Attributable to the Company:
| | | 2012 | | | 2011 | |
(In millions of Canadian dollars and after-taxes, except where
otherwise stated) | | YTD | | | Q2 | | | Q1 | | | Total | | | Q4 | | | Q3 | | | Q2 | | | Q1 | |
| Net earnings (loss) attributable to the company | | $ | (37.3 | ) | | $ | (11.7 | ) | | $ | (25.6 | ) | | $ | (974.0 | ) | | $ | (708.0 | ) | | $ | (205.7 | ) | | $ | (47.4 | ) | | $ | (12.9 | ) |
| Specific items: | | | | | | | | | | | | | | | | | | | | | | | | | | | | | | | | |
| Foreign exchange loss (gain) on long-term debt | | | 1.2 | | | | 12.8 | | | | (11.6 | ) | | | 11.8 | | | | (14.0 | ) | | | 41.0 | | | | (4.5 | ) | | | (10.7 | ) |
| Loss on Snowflake fire | | | – | | | | – | | | | – | | | | 4.4 | | | | 0.3 | | | | – | | | | 4.1 | | | | – | |
| Loss on Powell River fire | | | – | | | | – | | | | – | | | | 2.0 | | | | 0.8 | | | | – | | | | 1.2 | | | | – | |
| Impairment (recovery) and other closure costs | | | – | | | | – | | | | – | | | | 823.6 | | | | 673.3 | | | | 150.6 | | | | (0.3 | ) | | | – | |
| Restructuring costs | | | 5.1 | | | | (0.1 | ) | | | 5.2 | | | | 5.9 | | | | 5.9 | | | | – | | | | – | | | | – | |
| Reorganization items, net | | | 16.4 | | | | (6.0 | ) | | | 22.4 | | | | – | | | | – | | | | – | | | | – | | | | – | |
| Net earnings (loss) attributable to the company before specific items | | $ | (14.6 | ) | | $ | (5.0 | ) | | $ | (9.6 | ) | | $ | (126.3 | ) | | $ | (41.7 | ) | | $ | (14.1 | ) | | $ | (46.9 | ) | | $ | (23.6 | ) |
| Net earnings (loss) per share attributable to the company’s common shareholders in dollars: | | | | | | | | | | | | | | | | | | | | | | | | | | | | | | | | |
| As reported | | $ | (0.10 | ) | | $ | (0.03 | ) | | $ | (0.07 | ) | | $ | (2.55 | ) | | $ | (1.85 | ) | | $ | (0.54 | ) | | $ | (0.13 | ) | | $ | (0.03 | ) |
| Before specific items | | | (0.04 | ) | | | (0.01 | ) | | | (0.03 | ) | | | (0.33 | ) | | | (0.11 | ) | | | (0.04 | ) | | | (0.12 | ) | | | (0.06 | ) |
| CATALYST PAPER 2012 SECOND QUARTER REPORT | MANAGEMENT’S DISCUSSION AND ANALYSIS | ~ 22 ~ |
Free Cash Flow
Free cash flow excludes working capital and certain other sources and uses of cash, which are disclosed in the consolidated statements of cash flows. This measure allows us to assess our ability to generate funds to repay debt and assists in cash flow forecasting.
Reconciliation to Cash Provided by Operating Activities less Cash Used by Investing Activities:
| | | 2012 | | | 2011 | |
| (In millions of Canadian dollars) | | YTD | | | Q2 | | | Q1 | | | Total | | | Q4 | | | Q3 | | | Q2 | | | Q1 | |
| Cash provided (used) by operating activities | | $ | (22.9 | ) | | $ | (8.2 | ) | | $ | (14.7 | ) | | $ | (71.5 | ) | | $ | (4.0 | ) | | $ | (38.8 | ) | | $ | (15.7 | ) | | $ | (13.0 | ) |
| Cash provided (used) by investing activities | | | (2.8 | ) | | | 14.2 | | | | (17.0 | ) | | | (17.7 | ) | | | (5.0 | ) | | | (4.9 | ) | | | (5.2 | ) | | | (2.6 | ) |
| Proceeds from the sale of property, plant and equipment and other assets | | | (7.9 | ) | | | (7.4 | ) | | | (0.5 | ) | | | (1.2 | ) | | | (0.4 | ) | | | (0.7 | ) | | | (0.1 | ) | | | – | |
| Other investing activities | | | (3.2 | ) | | | (3.6 | ) | | | 0.4 | | | | (0.8 | ) | | | (0.8 | ) | | | – | | | | (0.3 | ) | | | 0.3 | |
| | | | | | | | | | | | | | | | | | | | | | | | | | | | | | | | | |
| Non-cash working capital changes except change in taxes and interest | | | 21.1 | | | | 7.3 | | | | 13.8 | | | | 42.0 | | | | (1.1 | ) | | | 50.2 | | | | (18.7 | ) | | | 11.6 | |
| Other | | | 7.4 | | | | (7.1 | ) | | | 14.5 | | | | (9.6 | ) | | | (15.1 | ) | | | (4.4 | ) | | | 11.7 | | | | (1.8 | ) |
| Free cash flow | | $ | (8.3 | ) | | $ | (4.8 | ) | | $ | (3.5 | ) | | $ | (58.8 | ) | | $ | (26.4 | ) | | $ | 1.4 | | | $ | (28.3 | ) | | $ | (5.5 | ) |
Management’s Calculation of Free Cash Flow:
| | | 2012 | | | 2011 | |
| (In millions of Canadian dollars) | | YTD | | | Q2 | | | Q1 | | | Total | | | Q4 | | | Q3 | | | Q2 | | | Q1 | |
| EBITDA | | $ | 32.7 | | | $ | 14.6 | | | $ | 18.1 | | | $ | 41.6 | | | $ | 2.8 | | | $ | 26.8 | | | $ | (3.9 | ) | | $ | 15.9 | |
| Interest expense, excluding amortization | | | (7.0 | ) | | | (3.7 | ) | | | (3.3 | ) | | | (72.6 | ) | | | (18.4 | ) | | | (19.0 | ) | | | (17.6 | ) | | | (17.6 | ) |
| Capital expenditures | | | (4.9 | ) | | | (3.0 | ) | | | (1.9 | ) | | | (19.7 | ) | | | (6.2 | ) | | | (5.6 | ) | | | (5.6 | ) | | | (2.3 | ) |
| Reorganization costs | | | (23.0 | ) | | | (9.5 | ) | | | (13.5 | ) | | | – | | | | – | | | | – | | | | – | | | | – | |
| Income taxes received (paid) | | | – | | | | – | | | | – | | | | (0.1 | ) | | | (0.2 | ) | | | 0.5 | | | | (0.1 | ) | | | (0.3 | ) |
| Employee future benefits, expense over (under) cash contributions1 | | | (6.1 | ) | | | (3.2 | ) | | | (2.9 | ) | | | (8.0 | ) | | | (4.4 | ) | | | (1.3 | ) | | | (1.1 | ) | | | (1.2 | ) |
| Free cash flow | | $ | (8.3 | ) | | $ | (4.8 | ) | | $ | (3.5 | ) | | $ | (58.8 | ) | | $ | (26.4 | ) | | $ | 1.4 | | | $ | (28.3 | ) | | $ | (5.5 | ) |
| 1 | Free cash flow is adjusted to reflect the cash impact of employee future benefits rather than the accounting expense which is included in EBITDA. |
| 7. | CRITICAL ACCOUNTING POLICIES AND ESTIMATES |
The preparation of financial statements in conformity with U.S. GAAP requires companies to establish accounting policies and to make estimates that affect both the amount and timing of recording of assets, liabilities, revenues and expenses. Some of these estimates require judgments about matters that are inherently uncertain and actual results could differ from estimates.
On an ongoing basis, we review our estimates based upon currently available information. The discussion on the accounting policies that require management's most difficult, subjective and complex judgments, and which are subject to a fair degree of measurement uncertainty can be found on pages 47 to 50 of the company's 2011 Annual Report. There were no significant changes in Q2 2012.
| 8. | CHANGES IN ACCOUNTING POLICIES |
There were no recent amendments by the Financial Accounting Standards Board (FASB) to the Accounting Standards Codification (ASC) that materially impacted the company’s consolidated financial statements or disclosures. FASB ASC 852,Reorganizations, adopted as a result of the CCAA proceedings, was applied in Q2 2012 and will continue to be applied until the effective exit date from CCAA protection. This standard requires that financial statements distinguish transactions and events that are directly associated with the reorganization from the ongoing operations of the business. Pre-petition obligations incurred prior to the Initial Order under CCAA that may be impaired by the reorganization process must be classified asLiabilities subject to compromise in the balance sheet at the amounts expected to be allowed as claims by the Court.
| CATALYST PAPER 2012 SECOND QUARTER REPORT | MANAGEMENT’S DISCUSSION AND ANALYSIS | ~ 23 ~ |
| 9. | IMPACT OF ACCOUNTING PRONOUNCEMENTS AFFECTING FUTURE PERIODS |
There were no new pronouncements issued by the FASB that may impact our consolidated financial statements for future periods.
| 10. | RISKS AND UNCERTAINTIES |
We face risks and uncertainties which fall into the general business areas of markets, international commodity prices, currency exchange rates, environmental issues, fibre supply, government regulation and policy, and for Canadian companies, trade barriers and potential impacts of aboriginal rights, including unresolved aboriginal land claims in B.C. In addition, our proceedings under the CCAA will have a direct impact on our business.
In order to address these risks and effectively manage them, we have developed a process for managing risk and the interrelationship between risks and our strategic plan. We provide regular updates to the Audit Committee, work with corporate and operational management to identify, measure, and prioritize the critical risks facing the company, and manage these risks by ensuring that they are adequately addressed through mitigating procedures where appropriate. The objectives of the risk-management function include developing a common framework for understanding what constitutes principal business risks, ensuring that risk management activities are aligned with business strategies, and providing an effective mechanism for governance in the area of risk management.
A description of our risks and uncertainties can be found on pages 51 to 58 of our 2011 Annual Report. Our update as of August 1, 2012 can be found below. Our risks have been separated into two categories, risks relating to our restructuring process under the CCAA and risks relating to our business.
RISKS RELATING TO OUR RESTRUCTURING PROCESS UNDER THE CCAA
| — | We are subject to proceedings under the CCAA. Our business, operations and financial position are subject to risks and uncertainties associated with such proceedings. |
Our business, operations and financial condition continue to be subjected to the risks and uncertainties associated with the CCAA proceedings. These risks include, among other things, our ability to (i) develop and successfully implement a restructuring plan, (ii) obtain requisite court and creditor approvals supporting a restructuring plan, (iii) obtain requisite court approvals for selling business units and other assets, repudiating on contacts and undertaking any other action to reorganize our business pursuant to the CCAA proceedings, (iv) maintain sufficient liquidity to fund our ongoing operations and pay the restructuring costs resulting from the CCAA proceedings, (v) retain customers and market share during the CCAA process and, (vi) retain our employees including executive and other key staff members during the CCAA process.
| — | We may not be able to successfully develop, obtain the necessary approvals or implement a restructuring plan. Failure to do so within the time periods granted under the CCAA proceedings could result in the liquidation of all of our assets. |
In order to successfully emerge from the CCAA, it will be necessary to develop, obtain the necessary approvals for and implement a restructuring plan. After announcing on May 23, 2012 that the company had not received the necessary creditor approval for its amended plan of arrangement, a second amended plan of arrangement was announced on June 14, 2012. The second amended plan of arrangement received creditor approval on June 25, 2012, was sanctioned by the B.C. Court on June 28, 2012 and was confirmed under Chapter 15 by the US Court in Delaware in a confirmation hearing on July 27, 2012. Implementation of the second amended plan of arrangement is conditional on the company securing exit financing by entering into agreements with respect to a new asset-based loan facility (ABL Facility) and exit facility, if any. This condition must be met before the company may exit CCAA protection.
| — | We may be unable to meet our liquidity requirements for operations. |
There can be no assurance that the amounts of cash from operations together with amounts available under the DIP Facility will be sufficient to fund our operations during our proceedings under the CCAA and the restructuring costs associated with operating under the CCAA.
| CATALYST PAPER 2012 SECOND QUARTER REPORT | MANAGEMENT’S DISCUSSION AND ANALYSIS | ~ 24 ~ |
RISKS RELATING TO OUR BUSINESS
The company’s debt of $845.7 million at June 30, 2012 as compared to $842.3 million at December 31, 2011 is summarized in note 14,Long-term debt, of our interim consolidated financial statements for the three and six months ended June 30, 2012. A description of our risks and uncertainties at December 31, 2011 referenced our total debt or our individual debt instruments as of that date and are summarized in our consolidated financial statements for the year ended December 31, 2011 in note 13,Long-term debt. These risks and uncertainties also apply to the total debt and the individual debt instruments outstanding at June 30, 2012. These risks and uncertainties include those under the following headings in our 2011 Annual Report:Our substantial debt may impair our financial and operating flexibility; and, We are subject to exchange rate fluctuations.
Our substantial debt may impair our financial and operating flexibility
Our DIP facility, which had excess availability of $47.6 million and a withdrawn credit balance of $70.5 million on June 30, 2012 is subject to a condition to maintain excess availability of no less than $21.9 million, replacing the former financial covenant that required us to maintain a minimum fixed charge coverage ratio of 1.1/1.0 if excess availability under the Facility fell below $21.9 million.
The terms and conditions of our DIP Facility could potentially impact our financial condition, operating results and business, including limiting our ability to obtain additional financing, limiting our ability to use operating cash flows for operations due to required debt service payments and increasing our exposure to interest rate fluctuations since borrowings under the DIP Facility are at variable interest rates.
| — | Labour disruptions could have a negative impact on our business |
New 5-year labour agreements were entered into with unions representing more than 1,000 paper and pulp workers at the company’s Crofton, Port Alberni and Powell River mills. The new contracts, entered into with CEP locals 1, 76, 592, 686 and 1132 and PPWC local 2, went into effect at the expiry of the current collective labour contacts on April 30, 2012 and expire on April 30, 2017. We do not anticipate labour disruptions in our operations in 2012.
| — | The company is subject to significant environmental regulation |
The province of British Columbia is presently reviewing its climate change and clean energy policies, and it is currently expected that implementation of a cap and trade scheme by B.C. will be delayed beyond 2012. It is too early to determine the impact on the company under any such cap and trade scheme.
The U.S. Environmental Protection Agency (EPA) published the new Maximum Achievable Control Technology (MACT) rules for industrial boilers on December 2, 2011. This program sets emission limits for stationary industrial boilers and process heaters, and sets standards that suggest considerable reductions in emission limits. The final rules are expected to be issued by mid-2012 with compliance required within three to five years.
The carbon tax rates under the B.C. government’s carbon tax on fossil fuels increased by 25% on July 1, 2012. The impact of these increases on the company depends on our ability to decrease the use of fossil fuel.
| — | Elimination of British Columbia Harmonized Sales Tax will negatively impact our future financial results |
Elections B.C. confirmed the elimination of the British Columbia Harmonized Sales Tax. The Province will revert back to the previous provincial sales tax regime on April 1, 2013, and we estimate that the additional annualized cost to our business from that date onward will be approximately $11 million, based on actual 2011 expenditures.
| CATALYST PAPER 2012 SECOND QUARTER REPORT | MANAGEMENT’S DISCUSSION AND ANALYSIS | ~ 25 ~ |
Our earnings are sensitive to fluctuations in product prices, foreign exchange, energy and fibre costs as described on pages 59 to 60 of our 2011 Annual Report and summarized in the following table:
| (In millions of Canadian dollars, except per share amounts) | | EBITDA1 | | | Net
Earnings2 | | | Earnings
per Share | |
| Product prices3 | | | | | | | | | | | | |
| A US$10 per tonne change in the sales price of: | | | | | | | | | | | | |
| Specialty printing papers | | $ | 9 | | | $ | 7 | | | $ | 0.02 | |
| Newsprint | | | 5 | | | | 4 | | | | 0.01 | |
| Pulp | | | 3 | | | | 2 | | | | 0.01 | |
| | | | | | | | | | | | | |
| Foreign exchange4 | | | | | | | | | | | | |
| A US$0.01 change in the U.S. dollar relative to the Canadian dollar | | | 6 | | | | 5 | | | | 0.01 | |
| | | | | | | | | | | | | |
| Energy cost sensitivity5 | | | | | | | | | | | | |
| A 5% change in the price of: | | | | | | | | | | | | |
| Natural gas and oil – direct purchases | | | 1 | | | | 1 | | | | 0.00 | |
| Electricity – direct purchases | | | 7 | | | | 5 | | | | 0.01 | |
| Coal | | | 1 | | | | 1 | | | | 0.00 | |
| | | | | | | | | | | | | |
| Freight cost sensitivity | | | | | | | | | | | | |
| A US$5/bbl change in the price of West Texas Int. (WTI) Oil | | | 3 | | | | 2 | | | | 0.01 | |
| | | | | | | | | | | | | |
| Fibre sensitivity5 | | | | | | | | | | | | |
| A US$5 per unit change in the price of: | | | | | | | | | | | | |
| Wood chips (Bdt) | | | 8 | | | | 6 | | | | 0.02 | |
| ONP (ST) | | | 2 | | | | 2 | | | | 0.00 | |
| 1 | Refer to section 6,Non-GAAP measures. |
| 2 | Based on an expected tax rate of 25%. |
| 3 | Based on annualized sales of Q2 2012 and foreign exchange rate of US$0.99 |
| 4 | Based on Q2 2012 annualized net cash flows and a movement to US$1.00 from US$0.99 and excluding our hedging program and the impact of the translation of U.S. dollar-denominated debt. |
| 5 | Based on Q2 2012 annualized consumption levels and an exchange rate of US$0.99. |
| CATALYST PAPER 2012 SECOND QUARTER REPORT | MANAGEMENT’S DISCUSSION AND ANALYSIS | ~ 26 ~ |
Economy
Economic growth in the second quarter of 2012 continued to be constrained by pessimism over the U.S. economic recovery and weakness in the global economy. The Canadian dollar is expected to continue to trade close to parity with the U.S. dollar. The U.S and global economies are expected to continue to grow moderately during the third quarter of 2012.
Markets
Specialty printing paper markets are expected to remain challenging in the third quarter. Slumping demand and declining operating rates for coated and uncoated paper that was experienced in the first half of the year are expected to rebound in the second half of the year. In anticipation of improving demand for coated mechanical in the second half of the year, the company announced a US$40 per short ton price increase for North America, implemented on August 1, 2012.
Newsprint demand is expected to decline in the third quarter due to declining circulation, page count reductions, conservation measures by publishers and continued migration of information and advertising to the Internet. Price movement for newsprint in the third quarter will depend on the supply and demand balance in the quarter.
Demand for NBSK pulp is expected to decline in the third quarter due to weak demand from China and excess levels of end-user inventory in China. We expect that pulp prices will continue to trend down in the third quarter as the inventory overhang in the Chinese market is worked down.
Operations
Prices are expected to remain neutral for commodity inputs, including fossil fuel, power, fibre and some chemicals. Lower demand from China for recycled paper is expected to continue easing price pressure on ONP in Q3, improving the cost structure of the Snowflake mill in the short-term.
We expect that maintenance costs in Q3 will continue to be well below normal levels as we continue to preserve cash during the CCAA proceedings.
The Crofton No. 1 paper machine will continue to be indefinitely curtailed in Q3.
Capital spending in 2012 is forecasted to be approximately $25.0 million. Capital projects that qualified for funding through the utilization of the Green Transformation Program are substantially complete and are expected to result in annual EBITDA of $5.0 million in 2012.
Liquidity, Debt Maturities and Covenants
We currently do not anticipate any significant use of cash in Q3 other than for our operations, the payment of 2012 property taxes, reorganization costs in respect of the ongoing CCAA proceedings, pension plan funding and working capital fluctuations.
As discussed in section 1, Overview and highlights, our application for additional funding relief in respect of our salaried pension plan’s solvency deficit received regulatory approval in the quarter. Estimated annual savings of $7 million will go into effect in the fourth quarter of 2012.
The company’s operating revenue combined with the DIP Facility are expected to provide sufficient liquidity while operating under the CCAA proceedings to conduct our operations and meet our obligations to employees and suppliers as they arise in the ordinary course of business. However, compressed vendor credit terms in response to the creditor protection proceedings are expected to continue to put pressure on available liquidity and cash flow.
Restructuring Process
The company is currently negotiating with third party lenders for a new ABL Facility and is working toward an anticipated exit from the CCAA process in the third quarter under the second amended plan of arrangement. Implementation of the second amended plan of arrangement would result in the company emerging from the CCAA process with expected annual cost reductions in the range of $65.0 million to $70.0 million, reduction in long term debt of approximately US$390.4 million and an improved capital structure. The company is obliged under the second amended plan of arrangement to use commercially reasonable efforts to sell its interest in PREI but implementation of the second amended plan of arrangement would result in the termination of the court approved SISP process with respect to the operating business of the company. All existing common shares, options, warrants, rights and similar instruments of the company will be cancelled and a new Board of Directors will be appointed on emergence from the CCAA process.
| CATALYST PAPER 2012 SECOND QUARTER REPORT | MANAGEMENT’S DISCUSSION AND ANALYSIS | ~ 27 ~ |
Permanent Closure of Snowflake Mill
Subsequent to the announcement on July 30, 2012 that the Snowflake mill will be permanently closed, a closure plan was communicated to employees and union representatives at the Snowflake mill operations. The mill, which will be permanently shut on September 30, 2012, will be decommissioned, the equipment will be sold, and the site will be prepared for sale and repurposing. Customer contracts will be fulfilled during the remaining 60 days before closure, including pre-running orders. The company will honor its obligations to employees at the Snowflake operations and will work closely with suppliers, customers and regulators through the wind-down of operations.
2012 Key Objectives
We remain focused on reducing our cost base, conserving cash, and improving our product mix. Our progress to-date on our key priorities for 2012 is provided in section 1,Overview and highlights, and these remain the main focus moving forward.
| 13. | DISCLOSURE CONTROLS AND INTERNAL CONTROL OVER FINANCIAL REPORTING |
A summary of our regulatory requirements for the evaluation of internal controls and subsequent reporting of the results of that evaluation can be found on page 62 of our 2011 Annual Report. Based on an evaluation of the design and operation of the company’s disclosure controls and procedures conducted under the supervision and with the participation of management, our chief executive officer and chief financial officer concluded that such disclosure controls and procedures (as defined in Canada under National Instrument 52-109 and in Rules 13a-15(e) and 15d-15(e) under theUnited States Securities Exchange Act of 1934), were effective as at December 31, 2011.
We did not make any significant changes in internal controls over financial reporting during the most recent three month and six month periods ended June 30, 2012 that have materially affected, or are reasonably likely to materially affect, our internal control over financial reporting. Management has limited the scope of the design and maintenance of adequate disclosure controls and procedures and internal control over financial reporting to exclude controls, policies and procedures of Powell River Energy Inc., a variable interest entity in which we are the primary beneficiary.
The company's Audit Committee, as part of its oversight role, has reviewed and recommended the approval of this MD&A to the Board of Directors. The Board of Directors has read and approved this MD&A.
| CATALYST PAPER 2012 SECOND QUARTER REPORT | MANAGEMENT’S DISCUSSION AND ANALYSIS | ~ 28 ~ |
CONSOLIDATED BALANCE SHEETS
(Under Creditor Protection Proceedings as of January 31, 2012 – Notes 2 and 5)
| | | June 30, | | | December 31, | |
| (In millions of Canadian dollars) | | 2012 | | | 2011 | |
| | | (unaudited) | | | | |
| Assets | | | | | | | | |
| | | | | | | | | |
| Current assets | | | | | | | | |
| Cash and cash equivalents | | $ | 17.8 | | | $ | 25.1 | |
| Restricted cash (note 7) | | | 9.0 | | | | – | |
| Accounts receivable (note 8) | | | 158.5 | | | | 134.9 | |
| Inventories (note 9) | | | 142.0 | | | | 146.9 | |
| Prepaids and other (note 10) | | | 20.9 | | | | 20.0 | |
| | | | 348.2 | | | | 326.9 | |
| Property, plant and equipment (note 11) | | | 375.0 | | | | 386.3 | |
| Other assets (note 12) | | | 7.5 | | | | 24.4 | |
| | | $ | 730.7 | | | $ | 737.6 | |
| Liabilities | | | | | | | | |
| | | | | | | | | |
| Liabilities not subject to compromise | | | | | | | | |
| Current liabilities | | | | | | | | |
| Accounts payable and accrued liabilities (note 13) | | $ | 100.9 | | | $ | 174.5 | |
| Current portion of long-term debt (note 14) | | | 6.8 | | | | 466.8 | |
| | | | 107.7 | | | | 641.3 | |
| Long-term debt (note 14) | | | 186.2 | | | | 375.5 | |
| Employee future benefits (note 15) | | | 274.7 | | | | 305.7 | |
| Other long-term obligations | | | 11.3 | | | | 19.2 | |
| Future income taxes (note 19) | | | 0.4 | | | | 3.6 | |
| Deferred credits | | | 9.6 | | | | 9.6 | |
| Total liabilities not subject to compromise | | | 589.9 | | | | 1,354.9 | |
| Liabilities subject to compromise (note 5) | | | 794.7 | | | | – | |
| Total liabilities | | | 1,384.6 | | | | 1,354.9 | |
| Deficiency | | | | | | | | |
| Shareholders’ deficiency | | | | | | | | |
| Common stock: no par value; unlimited shares authorized; issued and outstanding: 381,900,450 shares (December 31, 2011 – 381,900,450 shares) | | | 1,035.2 | | | | 1,035.2 | |
| Preferred stock: par value determined at time of issue; authorized 100,000,000 shares; issued and outstanding: nil shares | | | – | | | | – | |
| | | | | | | | | |
| Additional paid-in capital | | | 16.7 | | | | 16.6 | |
| Deficit | | | (1,593.3 | ) | | | (1,556.0 | ) |
| Accumulated other comprehensive loss (note 16) | | | (87.8 | ) | | | (89.4 | ) |
| | | | (629.2 | ) | | | (593.6 | ) |
| Non-controlling deficit (note 6) | | | (24.7 | ) | | | (23.7 | ) |
| | | | (653.9 | ) | | | (617.3 | ) |
| | | $ | 730.7 | | | $ | 737.6 | |
Contingent liabilities (note 22)
Subsequent events (note 23)
The accompanying notes are an integral part of the consolidated financial statements.
| On behalf of the Board: | |
 |  |
| Kevin J. Clarke | Thomas S. Chambers |
| Director | Director |
| CATALYST PAPER 2012 SECOND QUARTER REPORT | CONSOLIDATED FINANCIAL STATEMENTS | ~ 29 ~ |
CONSOLIDATED STATEMENTS OF LOSS
(Under Creditor Protection Proceedings as of January 31, 2012 – Notes 2 and 5)
| | | Three months
ended June 30, | | | Six months
ended June 30, | |
| (Unaudited and in millions of Canadian dollars, except where otherwise stated) | | 2012 | | | 2011 | | | 2012 | | | 2011 | |
| Sales | | $ | 312.8 | | | $ | 297.8 | | | $ | 628.6 | | | $ | 601.4 | |
| Operating expenses | | | | | | | | | | | | | | | | |
| Cost of sales, excluding depreciation and amortization | | | 289.5 | | | | 292.5 | | | | 572.7 | | | | 570.0 | |
| Depreciation and amortization | | | 7.6 | | | | 27.0 | | | | 15.5 | | | | 53.8 | |
| Selling, general and administrative | | | 8.8 | | | | 9.2 | | | | 18.1 | | | | 19.4 | |
| Restructuring (note 17) | | | (0.1 | ) | | | – | | | | 5.1 | | | | – | |
| Impairment (recovery) and other closure costs | | | – | | | | (0.3 | ) | | | – | | | | (0.3 | ) |
| | | | 305.8 | | | | 328.4 | | | | 611.4 | | | | 642.9 | |
| Operating earnings (loss) | | | 7.0 | | | | (30.6 | ) | | | 17.2 | | | | (41.5 | ) |
| Interest expense, net | | | (23.4 | ) | | | (18.7 | ) | | | (44.0 | ) | | | (36.0 | ) |
| Foreign exchange gain (loss) on long-term debt | | | (12.8 | ) | | | 5.1 | | | | (1.2 | ) | | | 17.3 | |
| Other income (expense) (note 18) | | | 10.3 | | | | (6.4 | ) | | | 5.6 | | | | (6.9 | ) |
| | | | | | | | | | | | | | | | | |
| Loss before reorganization items and income taxes | | | (18.9 | ) | | | (50.6 | ) | | | (22.4 | ) | | | (67.1 | ) |
| Reorganization items, net (note 5) | | | 6.0 | | | | – | | | | (16.4 | ) | | | – | |
| | | | | | | | | | | | | | | | | |
| Loss before income taxes | | | (12.9 | ) | | | (50.6 | ) | | | (38.8 | ) | | | (67.1 | ) |
| Income tax recovery (note 19) | | | (0.6 | ) | | | (2.9 | ) | | | (0.7 | ) | | | (6.5 | ) |
| | | | | | | | | | | | | | | | | |
| Net loss | | | (12.3 | ) | | | (47.7 | ) | | | (38.1 | ) | | | (60.6 | ) |
| Net loss attributable to non-controlling deficit (note 6) | | | 0.6 | | | | 0.3 | | | | 0.8 | | | | 0.3 | |
| | | | | | | | | | | | | | | | | |
| Net loss attributable to the company | | $ | (11.7 | ) | | $ | (47.4 | ) | | $ | (37.3 | ) | | $ | (60.3 | ) |
| | | | | | | | | | | | | | | | | |
| Basic and diluted net loss per share attributable to the company’s common shareholders (in dollars) | | $ | (0.03 | ) | | $ | (0.13 | ) | | $ | (0.10 | ) | | $ | (0.16 | ) |
| Weighted average number of company common shares outstanding (in millions) | | | 381.9 | | | | 381.8 | | | | 381.9 | | | | 381.8 | |
The accompanying notes are an integral part of the consolidated financial statements.
| CATALYST PAPER 2012 SECOND QUARTER REPORT | CONSOLIDATED FINANCIAL STATEMENTS | ~ 30 ~ |
CONSOLIDATED STATEMENTS OF COMPREHENSIVE LOSS
(Under Creditor Protection Proceedings as of January 31, 2012 – Notes 2 and 5)
| | | Three months
ended June 30, | | | Six months
ended June 30, | |
| (Unaudited and in millions of Canadian dollars) | | 2012 | | | 2011 | | | 2012 | | | 2011 | |
| | | | | | | | | | | | | |
| Net loss | | $ | (12.3 | ) | | $ | (47.7 | ) | | $ | (38.1 | ) | | $ | (60.6 | ) |
| | | | | | | | | | | | | | | | | |
| Other comprehensive income (loss), net of tax (expense) recovery: | | | | | | | | | | | | | | | | |
| | | | | | | | | | | | | | | | | |
| Reclassification of amortization of employee future benefits | | | | | | | | | | | | | | | | |
| Gross amount | | | 1.3 | | | | 0.6 | | | | 2.6 | | | | 1.2 | |
| Tax (expense) recovery | | | (0.3 | ) | | | (0.1 | ) | | | (0.6 | ) | | | (0.3 | ) |
| Net amount | | | 1.0 | | | | 0.5 | | | | 2.0 | | | | 0.9 | |
| | | | | | | | | | | | | | | | | |
| Reclassification of net gain on cash flow revenue hedges | | | | | | | | | | | | | | | | |
| Gross amount | | | – | | | | (0.3 | ) | | | – | | | | (1.2 | ) |
| Tax (expense) recovery | | | – | | | | 0.1 | | | | – | | | | 0.3 | |
| Net amount | | | – | | | | (0.2 | ) | | | – | | | | (0.9 | ) |
| | | | | | | | | | | | | | | | | |
| Foreign currency translation adjustments, net of related hedging activities | | | | | | | | | | | | | | | | |
| Gross amount | | | (2.6 | ) | | | (1.1 | ) | | | (0.4 | ) | | | (1.1 | ) |
| Tax (expense) recovery | | | – | | | | – | | | | – | | | | (0.4 | ) |
| Net amount | | | (2.6 | ) | | | (1.1 | ) | | | (0.4 | ) | | | (1.5 | ) |
| | | | | | | | | | | | | | | | | |
| Other comprehensive income (loss), net of taxes | | | (1.6 | ) | | | (0.8 | ) | | | 1.6 | | | | (1.5 | ) |
| | | | | | | | | | | | | | | | | |
| Total comprehensive income (loss) | | | (13.9 | ) | | | (48.5 | ) | | | (36.5 | ) | | | (62.1 | ) |
| | | | | | | | | | | | | | | | | |
| Comprehensive loss attributable to non-controlling interest: | | | | | | | | | | | | | | | | |
| Net loss | | | 0.6 | | | | 0.3 | | | | 0.8 | | | | 0.3 | |
| | | | | | | | | | | | | | | | | |
| Comprehensive loss attributable to non-controlling interest | | | 0.6 | | | | 0.3 | | | | 0.8 | | | | 0.3 | |
| | | | | | | | | | | | | | | | | |
| Comprehensive loss attributable to the company | | $ | (13.3 | ) | | $ | (48.2 | ) | | $ | (35.7 | ) | | $ | (61.8 | ) |
The accompanying notes are an integral part of the consolidated financial statements.
| CATALYST PAPER 2012 SECOND QUARTER REPORT | CONSOLIDATED FINANCIAL STATEMENTS | ~ 31 ~ |
CONSOLIDATED STATEMENTS OF EQUITY (DEFICIENCY)
(Under Creditor Protection Proceedings as of January 31, 2012 – Notes 2 and 5)
| | | Equity (Deficiency) attributable to the Company | | | | | | | |
| | | Common stock | | | | | | | | | | | | | | | | |
| (In millions of Canadian dollars) | | Number
of shares | | | $ | | | Additional
paid-in
capital | | | Deficit | | | Accumulated
other
comprehensive
income (loss) | | | Non-
controlling
deficit | | | Total | |
| | | | | | | | | | | | | | | | | | | | | | |
| Balance as at December 31, 2010 | | | 381,753,490 | | | $ | 1,035.0 | | | $ | 16.6 | | | $ | (582.0 | ) | | $ | (46.1 | ) | | $ | (20.1 | ) | | $ | 403.4 | |
| Common shares issued | | | 146,960 | | | | 0.2 | | | | (0.2 | ) | | | – | | | | – | | | | – | | | | – | |
| Stock option compensation expense | | | – | | | | – | | | | 0.2 | | | | – | | | | – | | | | – | | | | 0.2 | |
| Net loss | | | – | | | | – | | | | – | | | | (974.0 | ) | | | – | | | | (2.6 | ) | | | (976.6 | ) |
| Distributions to non-controlling interest | | | – | | | | – | | | | – | | | | – | | | | – | | | | (1.0 | ) | | | (1.0 | ) |
| Other comprehensive income (loss), net of tax | | | – | | | | – | | | | – | | | | – | | | | (43.3 | ) | | | – | | | | (43.3 | ) |
| | | | | | | | | | | | | | | | | | | | | | | | | | | | | |
| Balance as at December 31, 2011 | | | 381,900,450 | | | $ | 1,035.2 | | | $ | 16.6 | | | $ | (1,556.0 | ) | | $ | (89.4 | ) | | $ | (23.7 | ) | | $ | (617.3 | ) |
| Stock option compensation expense | | | – | | | | – | | | | 0.1 | | | | – | | | | – | | | | – | | | | 0.1 | |
| Net loss | | | – | | | | – | | | | – | | | | (37.3 | ) | | | – | | | | (0.8 | ) | | | (38.1 | ) |
| Distributions to non-controlling interest | | | – | | | | – | | | | – | | | | – | | | | – | | | | (0.2 | ) | | | (0.2 | ) |
| Other comprehensive income (loss), net of tax | | | – | | | | – | | | | – | | | | – | | | | 1.6 | | | | – | | | | 1.6 | |
| | | | | | | | | | | | | | | | | | | | | | | | | | | | | |
| Balance as at June 30, 2012 (unaudited) | | | 381,900,450 | | | $ | 1,035.2 | | | $ | 16.7 | | | $ | (1,593.3 | ) | | $ | (87.8 | ) | | $ | (24.7 | ) | | $ | (653.9 | ) |
The accompanying notes are an integral part of the consolidated financial statements.
| CATALYST PAPER 2012 SECOND QUARTER REPORT | CONSOLIDATED FINANCIAL STATEMENTS | ~ 32 ~ |
CONSOLIDATED STATEMENTS OF CASH FLOWS
(Under Creditor Protection Proceedings as of January 31, 2012 – Notes 2 and 5)
| | | Three months
ended June 30, | | | Six months
ended June 30, | |
| (Unaudited and in millions of Canadian dollars) | | 2012 | | | 2011 | | | 2012 | | | 2011 | |
| | | | | | | | | | | | | |
| Cash flows provided (used) by: | | | | | | | | | | | | | | | | |
| | | | | | | | | | | | | | | | | |
| Operations | | | | | | | | | | | | | | | | |
| Net loss | | $ | (12.3 | ) | | $ | (47.7 | ) | | $ | (38.1 | ) | | $ | (60.6 | ) |
| Items not requiring (providing) cash | | | | | | | | | | | | | | | | |
| Depreciation and amortization | | | 7.6 | | | | 27.0 | | | | 15.5 | | | | 53.8 | |
| Impairment (recovery) and other closure costs | | | – | | | | (0.3 | ) | | | – | | | | (0.3 | ) |
| Future income taxes | | | (0.7 | ) | | | (2.9 | ) | | | (0.7 | ) | | | (6.4 | ) |
| Foreign exchange (gain) loss on long-term debt | | | 12.8 | | | | (5.1 | ) | | | 1.2 | | | | (17.3 | ) |
| Non-cash reorganization items | | | (15.5 | ) | | | – | | | | (6.6 | ) | | | – | |
| Non-cash interest on compromised notes | | | 19.9 | | | | – | | | | 37.0 | | | | – | |
| Employee future benefits, expense under cash contributions | | | (3.2 | ) | | | (1.1 | ) | | | (6.1 | ) | | | (2.3 | ) |
| Decrease in other long-term obligations | | | – | | | | – | | | | – | | | | (1.3 | ) |
| (Gain) loss on disposal of property, plant and equipment | | | (6.6 | ) | | | – | | | | (7.1 | ) | | | 0.1 | |
| Other | | | (5.2 | ) | | | – | | | | 1.5 | | | | (1.6 | ) |
| Changes in non-cash working capital | | | | | | | | | | | | | | | | |
| Accounts receivable | | | (7.5 | ) | | | 14.5 | | | | (23.6 | ) | | | 2.1 | |
| Inventories | | | (4.7 | ) | | | (6.2 | ) | | | 4.9 | | | | (14.3 | ) |
| Prepaids and other | | | 0.6 | | | | 2.8 | | | | (0.9 | ) | | | 3.4 | |
| Accounts payable and accrued liabilities | | | 6.6 | | | | 3.3 | | | | 0.1 | | | | 16.0 | |
| Cash flows used by operations | | | (8.2 | ) | | | (15.7 | ) | | | (22.9 | ) | | | (28.7 | ) |
| | | | | | | | | | | | | | | | | |
| Investing | | | | | | | | | | | | | | | | |
| Additions to property, plant and equipment | | | (3.0 | ) | | | (5.6 | ) | | | (4.9 | ) | | | (7.9 | ) |
| Proceeds from sale of property, plant and equipment | | | 7.4 | | | | 0.1 | | | | 7.9 | | | | 0.1 | |
| Decrease (increase) in restricted cash | | | 6.2 | | | | – | | | | (9.0 | ) | | | – | |
| Decrease in other assets | | | 3.6 | | | | 0.3 | | | | 3.2 | | | | – | |
| Cash flows provided (used) by investing activities | | | 14.2 | | | | (5.2 | ) | | | (2.8 | ) | | | (7.8 | ) |
| | | | | | | | | | | | | | | | | |
| Financing | | | | | | | | | | | | | | | | |
| Decrease in revolving loan and loan payable | | | – | | | | – | | | | (48.0 | ) | | | – | |
| Increase (decrease) in DIP Financing | | | (7.3 | ) | | | – | | | | 70.6 | | | | – | |
| Redemption of senior notes | | | – | | | | – | | | | – | | | | (25.8 | ) |
| Deferred financing costs | | | – | | | | (2.5 | ) | | | – | | | | (2.5 | ) |
| DIP financing costs | | | – | | | | – | | | | (3.7 | ) | | | – | |
| Decrease in other long-term debt | | | (0.2 | ) | | | (0.2 | ) | | | (0.5 | ) | | | (0.4 | ) |
| Cash flows provided (used) by financing activities | | $ | (7.5 | ) | | $ | (2.7 | ) | | $ | 18.4 | | | $ | (28.7 | ) |
| Cash and cash equivalents, decrease in the period | | | (1.5 | ) | | | (23.6 | ) | | | (7.3 | ) | | | (65.2 | ) |
| Cash and cash equivalents, beginning of the period | | | 19.3 | | | | 53.8 | | | | 25.1 | | | | 95.4 | |
| | | | | | | | | | | | | | | | | |
| Cash and cash equivalents, end of the period | | $ | 17.8 | | | $ | 30.2 | | | $ | 17.8 | | | $ | 30.2 | |
| | | | | | | | | | | | | | | | | |
| Supplemental disclosures: | | | | | | | | | | | | | | | | |
| Income taxes paid | | $ | – | | | $ | 0.1 | | | $ | – | | | $ | 0.4 | |
| Net interest paid | | | 3.7 | | | | 17.6 | | | | 7.0 | | | | 35.2 | |
The accompanying notes are an integral part of the consolidated financial statements.
| CATALYST PAPER 2012 SECOND QUARTER REPORT | CONSOLIDATED FINANCIAL STATEMENTS | ~ 33 ~ |
CONSOLIDATED BUSINESS SEGMENTS
(Under Creditor Protection Proceedings as of January 31, 2012 – Notes 2 and 5)
(Unaudited and in millions of Canadian dollars)
| Three months ended June 30, 2012 | | Specialty
Printing
Papers | | | Newsprint | | | Pulp | | | Corporate
Adjustments | | | Total | |
| Sales to external customers | | $ | 179.1 | | | $ | 83.2 | | | $ | 50.5 | | | $ | – | | | $ | 312.8 | |
| Inter-segment sales | | | – | | | | – | | | | 7.1 | | | | (7.1 | ) | | | – | |
| Depreciation and amortization | | | 6.2 | | | | 0.8 | | | | 0.6 | | | | – | | | | 7.6 | |
| Operating earnings (loss) | | | 7.7 | | | | 2.3 | | | | (3.0 | ) | | | – | | | | 7.0 | |
| Additions to property, plant and equipment | | | 2.1 | | | | – | | | | 0.9 | | | | – | | | | 3.0 | |
| | | | | | | | | | | | | | | | | | | | | |
| Three months ended June 30, 2011 | | | | | | | | | | | | | | | | | | | | |
| Sales to external customers | | $ | 160.9 | | | $ | 71.5 | | | $ | 65.4 | | | $ | – | | | $ | 297.8 | |
| Inter-segment sales | | | – | | | | – | | | | 8.0 | | | | (8.0 | ) | | | – | |
| Impairment (recovery) and other closure costs | | | (0.1 | ) | | | (0.2 | ) | | | – | | | | – | | | | (0.3 | ) |
| Depreciation and amortization | | | 18.8 | | | | 4.5 | | | | 3.7 | | | | – | | | | 27.0 | |
| Operating earnings (loss) | | | (29.3 | ) | | | (11.9 | ) | | | 10.6 | | | | – | | | | (30.6 | ) |
| Additions to property, plant and equipment | | | 2.7 | | | | 2.6 | | | | 0.3 | | | | – | | | | 5.6 | |
| Six months ended June 30, 2012 | | Specialty
Printing
Papers | | | Newsprint | | | Pulp | | | Corporate
Adjustments | | | Total | |
| Sales to external customers | | $ | 349.0 | | | $ | 168.7 | | | $ | 110.9 | | | $ | – | | | $ | 628.6 | |
| Inter-segment sales | | | – | | | | – | | | | 15.0 | | | | (15.0 | ) | | | – | |
| Depreciation and amortization | | | 12.4 | | | | 2.0 | | | | 1.1 | | | | – | | | | 15.5 | |
| Operating earnings (loss) | | | 12.8 | | | | 4.0 | | | | 0.4 | | | | – | | | | 17.2 | |
| Additions to property, plant and equipment | | | 3.3 | | | | 0.2 | | | | 1.4 | | | | – | | | | 4.9 | |
| | | | | | | | | | | | | | | | | | | | | |
| Six months ended June 30, 2011 | | | | | | | | | | | | | | | | | | | | |
| Sales to external customers | | $ | 328.0 | | | $ | 146.9 | | | $ | 126.5 | | | $ | – | | | $ | 601.4 | |
| Inter-segment sales | | | – | | | | – | | | | 18.8 | | | | (18.8 | ) | | | – | |
| Impairment (recovery) and other closure costs | | | (0.1 | ) | | | (0.2 | ) | | | – | | | | – | | | | (0.3 | ) |
| Depreciation and amortization | | | 37.3 | | | | 9.2 | | | | 7.3 | | | | – | | | | 53.8 | |
| Operating earnings (loss) | | | (36.5 | ) | | | (17.2 | ) | | | 12.2 | | | | – | | | | (41.5 | ) |
| Additions to property, plant and equipment | | | 4.1 | | | | 3.5 | | | | 0.3 | | | | – | | | | 7.9 | |
The accompanying notes are an integral part of the consolidated financial statements.
| CATALYST PAPER 2012 SECOND QUARTER REPORT | CONSOLIDATED FINANCIAL STATEMENTS | ~ 34 ~ |
NOTES TO CONSOLIDATED FINANCIAL STATEMENTS
Under Creditor Protection Proceedings as of January 31, 2012 – Notes 2 and 5
(Unaudited and in millions of Canadian dollars, except where otherwise stated) |
| Note 1 | | Basis of Presentation and Going Concern | 36 |
| | | | |
| Note 2 | | Creditor Protection Proceedings | 37 |
| | | | |
| Note 3 | | Segmented Information | 39 |
| | | | |
| Note 4 | | Significant Accounting Policies | 39 |
| | | | |
| Note 5 | | Creditor Protection Proceedings Related Disclosures | 39 |
| | | | |
| Note 6 | | Variable Interest Entities | 44 |
| | | | |
| Note 7 | | Restricted Cash | 45 |
| | | | |
| Note 8 | | Accounts Receivable | 45 |
| | | | |
| Note 9 | | Inventories | 45 |
| | | | |
| Note 10 | | Prepaids and Other | 46 |
| | | | |
| Note 11 | | Property, Plant and Equipment | 46 |
| | | | |
| Note 12 | | Other Assets | 46 |
| | | | |
| Note13 | | Accounts Payable and Accrued Liabilities | 46 |
| | | | |
| Note 14 | | Long-Term Debt | 47 |
| | | | |
| Note 15 | | Employee Future Benefits | 48 |
| | | | |
| Note 16 | | Accumulated Other Comprehensive Loss | 49 |
| | | | |
| Note 17 | | Restructuring | 50 |
| | | | |
| Note 18 | | Other Income (Expense) | 50 |
| | | | |
| Note 19 | | Income Taxes | 50 |
| | | | |
| Note 20 | | Fair Value Measurement | 51 |
| | | | |
| Note 21 | | Financial Instruments | 53 |
| | | | |
| Note 22 | | Contingent Liabilities | 54 |
| | | | |
| Note 23 | | Subsequent Events | 55 |
| | | | |
| Note 24 | | Comparative Figures | 55 |
| CATALYST PAPER 2012 SECOND QUARTER REPORT | CONSOLIDATED FINANCIAL STATEMENTS | ~ 35 ~ |
NOTES TO CONSOLIDATED FINANCIAL STATEMENTS
Under Creditor Protection Proceedings as of January 31, 2012 – Notes 2 and 5
(Unaudited and in millions of Canadian dollars, except where otherwise stated) |
| 1. | Basis of presentation AND GOING CONCERN |
Basis of Presentation
The consolidated financial statements include the accounts of Catalyst Paper Corporation and, from their respective dates of acquisition of control or formation, its wholly owned subsidiaries and partnerships (collectively, the “company”). In addition, the consolidated financial statements include the accounts of the company's joint venture, Powell River Energy Inc. (PREI), a variable interest entity (VIE). All inter-company transactions and amounts have been eliminated on consolidation.
The accompanying unaudited interim consolidated financial statements have been prepared in accordance with United States generally accepted accounting principles (U.S. GAAP), on a basis consistent with those followed in the December 31, 2011 audited annual consolidated financial statements. Since the December 31, 2011 audited financial statements, the company adopted the Financial Accounting Standards Board (FASB) Accounting Standards Codification (ASC) 852, Reorganizations, effective from the date of the commencement of the CCAA proceedings, as outlined in note 4,Significant accounting policies.
These unaudited interim consolidated financial statements do not include all information and note disclosures required by U.S. GAAP for annual financial statements, and therefore should be read in conjunction with the December 31, 2011 audited consolidated financial statements and the notes thereto. In the opinion of the company, the unaudited interim consolidated financial statements contained herein contain all the information and note disclosures necessary to fairly present the results of the interim periods included. The results for the periods included herein may not be indicative of the results for the entire year.
Creditor Protection Proceedings
On January 31, 2012, Catalyst Paper Corporation and certain of its subsidiaries obtained an Initial Order from the Supreme Court of British Columbia (the Court) under the Companies’ Creditors Arrangement Act (CCAA). The company applied for recognition of the Initial Order under chapter 15 of title 11 of the US Bankruptcy Code. The company entered into a Debtor-In-Possession (DIP) Credit Agreement, pursuant to which a DIP Credit Facility of approximately $175 million was confirmed by the Court. For additional information on the creditor protection proceedings, see note 2,Creditor protection proceedings.
Going Concern Basis
The company’s unaudited interim consolidated financial statements have been prepared on a going concern basis, which contemplates the realization of assets and satisfaction of liabilities in the normal course of business. However, the commencement of the creditor protection proceedings, discussed further in note 2,Creditor protection proceedings, raises substantial doubt about the company’s ability to continue as a going concern.
The creditor protection proceedings and DIP Credit Facility provide the company with a period of time to develop a comprehensive restructuring plan. Management believes that these actions make the going concern basis of presentation appropriate. However, it is not possible to predict the outcome of these proceedings and as such, the realization of assets and discharge of liabilities are each subject to significant uncertainty.
The company and the Canadian paper industry in general have been adversely affected by the economic downturn in the United States over the past three years and the trend away from certain paper products to electronic media. The result has been overcapacity in the industry resulting in lower prices, higher costs due to production curtailments and a strong Canadian dollar which ultimately lowers revenues to the company. Further, the company’s financial position has been adversely affected by its significant debt burden, substantial debt service requirements and the terms and conditions of its debt agreements.
| CATALYST PAPER 2012 SECOND QUARTER REPORT | CONSOLIDATED FINANCIAL STATEMENTS | ~ 36 ~ |
NOTES TO CONSOLIDATED FINANCIAL STATEMENTS
Under Creditor Protection Proceedings as of January 31, 2012 – Notes 2 and 5
(Unaudited and in millions of Canadian dollars, except where otherwise stated) |
The consolidated financial statements do not reflect adjustments that would be necessary if the going concern basis were not appropriate. If the going concern basis were not appropriate, material adjustments would be required to the carrying values of assets and liabilities, reported revenue and expenses and balance sheet classifications used. The appropriateness of the going concern basis is dependent upon, among other things, developing and implementing a comprehensive restructuring plan that will improve profitability, reducing the company’s current debt burden and improving liquidity.
It will further depend on the company securing continued sources of liquidity while under creditor protection, either by renewing or extending its current DIP financing arrangement, or obtaining alternative financing to replace its DIP financing arrangement.
| 2. | CREDITOR PROTECTION PROCEEDINGS |
As discussed in note 1,Basis of presentation and going concern, Catalyst Paper Corporation and certain of its subsidiaries obtained an Initial Order on January 31, 2012 from the Court under the CCAA. The company applied for recognition of the Initial Order under chapter 15 of title 11 of the US Bankruptcy Code. The company arranged financing pursuant to a DIP Credit Agreement of approximately $175 million of available capital during the CCAA proceedings. The company’s operating revenue combined with the DIP Credit Facility are expected to provide sufficient liquidity to meet ongoing obligations to employees and suppliers and ensure that normal operations continue during the restructuring process.
Refer to the interim consolidated financial statements for the three months ended March 31, 2012 for a discussion of the reorganization process. In June 2012 the Court approved a further extension of the CCAA protection to September 30, 2012.
Creditors Approve Second Amended Plan of Arrangement
On March 9, 2012, the company entered into a Restructuring and Support Agreement (RSA) with certain holders of its 11% senior secured notes due 2016 (2016 Notes) and its 7.375% notes due 2014 (2014 Notes) that outlined a plan of arrangement under the CCAA. On May 15, 2012, the company announced that the original terms of the plan of arrangement, as disclosed in the interim consolidated financial statements for the three months ended March 31, 2012, had been amended.
On May 23, 2012, the company announced that it did not receive the necessary creditor approval for its amended plan of arrangement. Approval of not less than 66 2/3% of the principal amount of each creditor class voting on the plan was required. While 99.5% of the principal amount of the secured creditor class voted in favour of the plan, only 64% of the principal amount of the unsecured creditor class voted in favour. With the amended plan of arrangement not being approved, the company was required to commence a sales process in accordance with certain agreed sale and investor solicitation procedures (SISP).
On June 14, 2012, the company announced a second amended plan of arrangement after receiving consent from a requisite number of holders of 2016 Notes to move forward to a vote. The second amended plan of arrangement included proposed changes regarding the compromise of certain extended health benefits, modifications to the salaried pension plan and application for additional solvency deficit funding relief; the terms of these changes are described below.
Specific terms of the second amended plan of arrangement include:
| a) | Catalyst Paper’s US$390.4 million aggregate principal amount of outstanding 2016 Notes plus accrued and unpaid interest will be exchanged for: |
| - | US$250.0 million aggregate principal amount of new 11% first lien notes (New Notes), the terms of which are described below; and |
| - | 100.0% of the company’s new common shares, subject to dilution for the issuance of up to 4.0% common shares to unsecured creditors who make an equity election and a new management incentive plan. |
| CATALYST PAPER 2012 SECOND QUARTER REPORT | CONSOLIDATED FINANCIAL STATEMENTS | ~ 37 ~ |
NOTES TO CONSOLIDATED FINANCIAL STATEMENTS
Under Creditor Protection Proceedings as of January 31, 2012 – Notes 2 and 5
(Unaudited and in millions of Canadian dollars, except where otherwise stated) |
| b) | Catalyst Paper’s US$250.0 million aggregate principal amount of 2014 Notes plus accrued and unpaid interest will be exchanged for: |
| - | 50% of the net proceeds from the sale of the company’s interest in Powell River Energy Inc. and Powell River Energy Limited Partnership (PREI), subject to dilution for general creditors who make the PREI cash election; or |
| - | if an equity election is made, 4.0% of the company’s new common shares, subject to dilution for general creditors who make an equity election and a new management incentive plan. |
| c) | General creditors will exchange their general unsecured claims for: |
| - | their pro rata share of the PREI proceeds pool (see above); or |
| - | if an equity election is made, their pro rata share of 4.0% of the company’s new common shares, subject to dilution for a new management incentive plan; or |
| - | if a valid cash election is made, cash in an amount equal to 50.0% of the creditor’s claim provided that the aggregate amount of cash payable to all such holders not exceed $2.5 million. |
| d) | All existing common shares, as well as options, warrants, rights or similar instruments, will be cancelled and extinguished for no consideration. |
| e) | Salaried pensioners agreed under the second amended plan of arrangement that certain extended health benefits with an actuarial value of $22.4 million be compromised and treated as general unsecured claims. |
| f) | Modifications to the salaried pension plan to provide for a special portability election option and additional funding relief in respect of the solvency deficit that will result in estimated annual savings of 7.0 million. |
| g) | A new Board of Directors will be appointed as part of the transaction. |
The New Notes will have substantially the same terms and conditions as the company’s existing 2016 Notes with certain exceptions including:
| - | the maturity date of the New Notes will be October 31, 2017; |
| - | interest on the New Notes will be payable semi-annually in cash at an annual interest rate of 11% or, at the option of company, interest may be partially paid in kind, but if that option is taken for any semi-annual interest payment, interest for that payment will be calculated at an annual rate of 13% with 7.5% being paid in cash and 5.5% being paid in kind through the issuance of additional New Notes; |
| - | the New Notes will have an annual cash flow sweep, subject to a minimum liquidity threshold. Any amounts paid to holders of the New Notes from the cash flow sweep will be used to pay down the principal amount of the New Notes at par value; |
| - | the company will be able to issue up to an additional US$75.0 million in principal amount of New Notes, subject to the consent of holders of 75.0% in principal amount of New Notes if the company’s secured debt to EBITDA ratio, pro forma for the issuance of the additional New Notes, exceeds 3.0 times; and |
| - | the company will be able to repurchase the New Notes for 103% of their principal amount until December 15, 2013 and 100% thereafter. |
On June 25, 2012 the company announced that it had received the necessary creditor approval for the second amended plan of arrangement. Approval of more than 99% of secured and unsecured creditors was received. The company also received confirmation of regulatory approval by provincial order in council of the proposed modifications to the salaried pension plan and the application for additional funding relief. The Court sanctioned the second amended plan of arrangement on June 28, 2012 and the US Court in Delaware confirmed the plan under the Chapter 15 process in a confirmation hearing on July 27, 2012.
Implementation of the second amended plan of arrangement is conditional on the company securing a new asset-based loan facility (ABL Facility) and/or other exit loan facility. This condition must be met before the company can exit the CCAA process.
| CATALYST PAPER 2012 SECOND QUARTER REPORT | CONSOLIDATED FINANCIAL STATEMENTS | ~ 38 ~ |
NOTES TO CONSOLIDATED FINANCIAL STATEMENTS
Under Creditor Protection Proceedings as of January 31, 2012 – Notes 2 and 5
(Unaudited and in millions of Canadian dollars, except where otherwise stated) |
Catalyst Paper Corporation, together with its subsidiaries and partnerships (collectively, the company) is a significant specialty mechanical printing papers and newsprint producer in North America. The company operates in three business segments:
| Specialty printing papers | – | Manufacture and sale of mechanical specialty printing papers |
| | | |
| Newsprint | – | Manufacture and sale of newsprint |
| | | |
| Pulp | – | Manufacture and sale of long-fibre Northern Bleached Softwood Kraft (NBSK) pulp |
The company owns and operates four manufacturing facilities, three of which are located in the province of British Columbia (B.C.), Canada and one in Arizona, U.S.A.
The primary market for the company’s paper products is North America. The primary market for the company’s pulp products is China.
| 4. | Significant accounting policies |
Recently Implemented Accounting Changes
There were no recent amendments by the FASB to the Accounting Standards Codification that materially impacted the company’s consolidated financial statements or disclosures. FASB ASC 852,Reorganizations, adopted as a result of the CCAA proceedings, was applied in Q2 2012 and will continue to be applied until the effective exit date from CCAA protection. This standard requires that financial statements distinguish transactions and events that are directly associated with the reorganization from the ongoing operations of the business. Pre-petition obligations incurred prior to the Initial Order under CCAA that may be impaired by the reorganization process must be classified asLiabilities subject to compromise in the balance sheet at the amounts expected to be allowed as claims by the Court.
Changes in Future Accounting Standards
There were no new pronouncements issued by the FASB that may materially impact the company’s consolidated financial statements for future periods.
| 5. | CredItOr Protection Proceedings RelateD Disclosures |
Reorganization Items, Net
Expenses (including professional fees), realized gains and losses, and provisions for losses resulting from reorganization activities are reported separately from ongoing operations of the business in the consolidated statement of loss asreorganization items, net. Interest expense isn’t a reorganization item. As discussed in note 2,Creditor protection proceedings, a second amended plan of arrangement was approved by creditors and sanctioned by the Court in the second quarter. Liabilities subject to compromise are recorded at the allowed claims amount, defined as the amount allowed by the Court as a claim against the company’s estate. The allowed claims amounts were confirmed by the Court sanction of the second amended plan of arrangement, and resulted in adjustments in the quarter to certain liabilities included inLiabilities subject to compromise to adjust these liability balances from historical book values to allowed claims amounts. These adjustments, which included the write-off of the unamortized debt discount, modification and financing costs on the company’s 2014 Notes and 2016 Notes, were recognized in the company’s consolidated statement of loss underReorganization items, net.
| CATALYST PAPER 2012 SECOND QUARTER REPORT | CONSOLIDATED FINANCIAL STATEMENTS | ~ 39 ~ |
NOTES TO CONSOLIDATED FINANCIAL STATEMENTS
Under Creditor Protection Proceedings as of January 31, 2012 – Notes 2 and 5
(Unaudited and in millions of Canadian dollars, except where otherwise stated) |
The components of reorganization items, net on June 30, 2012 were as follows:
| Reorganization items, net | | Three months
ended June 30, 2012 | | | Six months
ended June 30, 2012 | |
| Professional fees ¹ | | $ | 9.3 | | | $ | 19.1 | |
| DIP financing costs ² | | | – | | | | 3.7 | |
| Acceleration of ABL financing costs ³ | | | – | | | | 3.3 | |
| Provision for repudiated lease contract4 | | | 1.4 | | | | 7.0 | |
| Write-off of debt discount, modification and issuance costs 5 | | | (11.0 | ) | | | (11.0 | ) |
| Adjustment to pre-petition accounts payable6 | | | (5.9 | ) | | | (5.9 | ) |
| Other | | | 0.2 | | | | 0.2 | |
| Total | | $ | (6.0 | ) | | $ | 16.4 | |
| 1 | Professional fees directly related to the creditor protection proceedings, ongoing monitoring and establishment of a reorganization plan, including legal, consulting and other professional fees. |
| 2 | DIP financing costs incurred in connection with entering into the DIP Credit Agreement, including commitment fees. |
| 3 | Pursuant to the creditor protection proceedings the ABL Facility was replaced by the DIP Credit Facility which resulted in the acceleration of the remaining deferred unamortized financing costs on the ABL Facility to the consolidated statement of loss. |
| 4 | The company repudiated on a lease contract at its paper recycling operation which was closed in 2010. In Q1 2012, the estimated balance of the compromised lease obligation was adjusted by $5.6 million due to the removal of a future sublease assumption no longer applicable after the repudiation. In Q2 2012, a $1.4 million adjustment was booked to adjust the balance of the lease obligation to the allowed claims amount. |
| 5 | The company’s secured and unsecured pre-petition debt balances were adjusted to the allowed claims amounts, defined as the outstanding principal plus accrued and unpaid interest, which resulted in the write-off of the unamortized discount, modification and debt issue costs on the 2014 Notes and 2016 Notes. |
| 6 | The company’s pre-petition accounts payable were adjusted to the allowed claims amount. |
The reorganization’s impact on cash flows for the three months ended June 30, 2012 was an $8.2 million reduction in cash flows from operations for professional fees paid. Accrued, unpaid professional fees as of June 30, 2012 will be paid in the ordinary course.
Liabilities Subject to Compromise
Liabilities subject to compromise include unsecured pre-petition obligations of the entities subject to the creditor protection proceedings (Debtors), as well as secured pre-petition obligations of the Debtors that are under-secured, that will be subject to impairment under a plan of reorganization. Generally, actions to enforce or otherwise effect payment of pre-petition liabilities are stayed. The liabilities of the company’s subsidiaries that are not subject to the creditor protection proceedings (Non-Debtors) are excluded from liabilities subject to compromise.
Pre-petition liabilities that may be subject to compromise are reported at the allowed claims amounts, even if they may be settled for lesser amounts. These liabilities represent the amounts allowed by the Court as claims during the creditor protection proceedings, and remain subject to future potentially material adjustments arising from negotiated settlements, actions of the Courts, further developments with respect to disputed claims, repudiation of contracts and the determination of the secured status of certain claims, as well as the value of collateral securing the claims.
As disclosed in note 2,Creditor protection proceedings, the Courts have granted approval for our Debtors to, among other things, make payments relating to certain employee’s pre-petition wages, salaries and benefit programs in the ordinary course, ensure the continuation of existing cash management systems, honour certain ongoing customer obligations, enter into DIP financing arrangements, retain legal and financial professionals and to make other payments in the ordinary course.
Liabilities subject to compromise do not include:
| - | liabilities held by Non-Debtors; |
| - | liabilities incurred after the commencement of the creditor protection proceedings; |
| - | pre-petition liabilities that the Debtors expect to pay in full, even though certain of these amounts may not be paid until a plan of reorganization is approved. |
| CATALYST PAPER 2012 SECOND QUARTER REPORT | CONSOLIDATED FINANCIAL STATEMENTS | ~ 40 ~ |
NOTES TO CONSOLIDATED FINANCIAL STATEMENTS
Under Creditor Protection Proceedings as of January 31, 2012 – Notes 2 and 5
(Unaudited and in millions of Canadian dollars, except where otherwise stated) |
The classification of liabilities as subject to compromise versus not subject to compromise is based on currently available information and analysis. The allowed claims amounts were confirmed by the Court sanction of the second amended plan of arrangement, and resulted in adjustments in the quarter to certain liabilities included inLiabilities subject to compromise to adjust these liability balances from historical book values to allowed claims amounts. It also resulted in the reclassification of pension and other postretirement projected benefit obligations, other than extended health benefits with an actuarial value of $22.4 million, that were compromised by the second amended plan of arrangement, out ofLiabilities subject to compromise as these obligations were not compromised by the second amended plan of arrangement.
As the creditor protection proceedings continue, additional information and analysis are completed and the Courts rule on relevant matters, the classification of amounts between these two categories may change, and the amount of any such change could be significant.
Liabilities subject to compromise by the CCAA proceedings on June 30, 2012 were comprised of the following:
| Liabilities subject to compromise | | June 30,
2012 | |
| Unsecured pre-petition debt (note 14) ¹ | | $ | 254.8 | |
| Secured pre-petition debt (note 14) ² | | | 397.9 | |
| Accrued interest on unsecured pre-petition debt3 | | | 15.9 | |
| Accrued interest on secured pre-petition debt4 | | | 51.1 | |
| Accounts payable and accrued liabilities, excluding accrued interest on secured and unsecured pre-petition debt5 | | | 35.0 | |
| Pension and other postretirement projected benefit obligations (note 15)6 | | | 22.4 | |
| Rejected leases and contracts7 | | | 17.6 | |
| Total | | $ | 794.7 | |
| 1 | Unsecured pre-petition debt was compromised under the second amended plan of arrangement and the debt balance was adjusted to the allowed claims amount of US$250.0 million. |
| 2 | Secured pre-petition debt was compromised under the second amended plan of arrangement and the debt balance was adjusted to the allowed claims amount of US$390.4 million. |
| 3 | Accrued interest on unsecured pre-petition debt consists of accrued interest up to June 30, 2012. Under the second amended plan of arrangement, accrued interest on the unsecured pre-petition debt is an unsecured general claim. |
| 4 | Accrued interest on secured pre-petition debt consists of accrued interest up to June 30, 2012. Under the second amended plan of arrangement, accrued interest on the secured pre-petition debt is a secured claim. |
| 5 | Pre-petition accounts payable were compromised under the second amended plan of arrangement and the balance was adjusted to the allowed claims amount of $35.0 million. |
| 6 | Extended health benefits with an actuarial value of $22.4 million were compromised under the second amended plan of arrangement and treated as an unsecured general claim. |
| 7 | The repudiated lease contract at the company’s paper recycling operation was compromised under the second amended plan of arrangement and the balance was adjusted to the allowed claims amount of $17.6 million. |
Condensed combined financial statements of debtors
The following unaudited condensed combined financial statements represent the financial statements of the Debtors. The subsidiaries of the company that comprise the Non-Debtors as defined previously are not consolidated in these condensed combined financial statements, and therefore, their net loss has been included inEquity in net earnings of Non-Debtors, net of tax in the condensed combined statement of operations and their net assets have been included asInvestment in and advances to Non-Debtorsin the condensed combined balance sheet. Intercompany transactions between the Debtors and Non-Debtors have been eliminated in these statements.
| CATALYST PAPER 2012 SECOND QUARTER REPORT | CONSOLIDATED FINANCIAL STATEMENTS | ~ 41 ~ |
NOTES TO CONSOLIDATED FINANCIAL STATEMENTS
Under Creditor Protection Proceedings as of January 31, 2012 – Notes 2 and 5
(Unaudited and in millions of Canadian dollars, except where otherwise stated) |
CONDENSED COMBINED BALANCE SHEETS - DEBTORS
| | | June 30, | |
| (In millions of Canadian dollars) | | 2012 | |
| | | (unaudited) | |
| Assets | | | | |
| Current assets | | | | |
| Cash and cash equivalents | | $ | 9.7 | |
| Restricted cash | | | 9.0 | |
| Accounts receivable | | | 158.3 | |
| Inventories | | | 142.0 | |
| Prepaids and other | | | 20.7 | |
| | | | 339.7 | |
| Property, plant and equipment | | | 278.3 | |
| Investments in and advances to Non-Debtors | | | (26.4 | ) |
| Future income taxes | | | 11.7 | |
| Other assets | | | 6.9 | |
| | | $ | 610.2 | |
| | | | | |
| Liabilities | | | | |
| Liabilities not subject to compromise | | | | |
| Current liabilities | | | | |
| Accounts payable and accrued liabilities | | $ | 94.6 | |
| Current portion of long-term debt | | | 6.8 | |
| | | | 101.4 | |
| Long-term debt | | | 72.4 | |
| Employee future benefits | | | 274.7 | |
| Other long-term obligations | | | 11.3 | |
| Deferred credits | | | 9.6 | |
| Total liabilities not subject to compromise | | | 469.4 | |
| Liabilities subject to compromise | | | 794.7 | |
| Total liabilities | | | 1,264.1 | |
| Deficiency | | | | |
| Shareholders’ deficiency | | | (629.2 | ) |
| Non-controlling deficit | | | (24.7 | ) |
| | | | (653.9 | ) |
| Total liabilities and deficit | | $ | 610.2 | |
| CATALYST PAPER 2012 SECOND QUARTER REPORT | CONSOLIDATED FINANCIAL STATEMENTS | ~ 42 ~ |
NOTES TO CONSOLIDATED FINANCIAL STATEMENTS
Under Creditor Protection Proceedings as of January 31, 2012 – Notes 2 and 5
(Unaudited and in millions of Canadian dollars, except where otherwise stated) |
CONDENSED COMBINED STATEMENTS OF LOSS - DEBTORS
| (Unaudited and in millions of Canadian dollars, except where otherwise stated) | | Three months
ended June 30, 2012 | | | Six months
ended June 30, 2012 | |
| Sales | | $ | 312.8 | | | $ | 628.6 | |
| | | | | | | | | |
| Operating expenses | | | | | | | | |
| Cost of sales, excluding depreciation and amortization | | | 292.8 | | | | 579.7 | |
| Depreciation and amortization | | | 6.4 | | | | 12.8 | |
| Selling, general and administrative | | | 8.8 | | | | 18.1 | |
| Restructuring | | | (0.1 | ) | | | 5.1 | |
| Impairment and other closure costs | | | – | | | | – | |
| | | | 307.9 | | | | 615.7 | |
| | | | | | | | | |
| Operating earnings | | | 4.9 | | | | 12.9 | |
| Interest expense, net | | | (19.6 | ) | | | (37.4 | ) |
| Foreign exchange loss on long-term debt | | | (12.8 | ) | | | (1.2 | ) |
| Other income | | | 7.8 | | | | 3.1 | |
| Loss before reorganization items, income taxes and equity in net earnings of Non-Debtors | | | (19.7 | ) | | | (22.6 | ) |
| Reorganization items, net | | | 6.0 | | | | (16.4 | ) |
| | | | | | | | | |
| Loss before income taxes and equity in net earnings of Non-Debtors | | | (13.7 | ) | | | (39.0 | ) |
| Income tax recovery | | | (0.1 | ) | | | – | |
| | | | | | | | | |
| Net loss before equity in net earnings of Non-Debtors | | | (13.6 | ) | | | (39.0 | ) |
| Equity in net earnings of Non-Debtors, net of tax | | | 1.9 | | | | 1.7 | |
| | | | | | | | | |
| Net loss attributable to Catalyst Paper Corporation | | $ | (11.7 | ) | | $ | (37.3 | ) |
CONDENSED COMBINED STATEMENTS OF CASH FLOWS - DEBTORS
| (Unaudited and in millions of Canadian dollars) | | Three months
ended June 30, 2012 | | | Six months
ended June 30, 2012 | |
| | | | | | | |
| Cash flows provided (used) by: | | | | | | |
| | | | | | | |
| Operations | | | | | | |
| Net cash used by operating activities | | $ | (8.8 | ) | | $ | (24.5 | ) |
| | | | | | | | | |
| Investing | | | | | | | | |
| Additions to property, plant and equipment | | | (2.4 | ) | | | (3.6 | ) |
| Proceeds from sale of property, plant and equipment | | | 4.1 | | | | 4.6 | |
| (Increase) decrease in restricted cash | | | 6.2 | | | | (9.0 | ) |
| Decrease in other assets | | | 3.6 | | | | 3.2 | |
| Cash flows provided (used) by investing activities | | | 11.5 | | | | (4.8 | ) |
| | | | | | | | | |
| Financing | | | | | | | | |
| Decrease in revolving loan and loan payable | | | – | | | | (48.0 | ) |
| Increase (decrease) in DIP financing | | | (7.3 | ) | | | 70.6 | |
| DIP financing costs | | | – | | | | (3.7 | ) |
| Decrease in other long-term debt | | | (0.2 | ) | | | (0.5 | ) |
| Distribution received | | | 0.4 | | | | 0.4 | |
| Increase in advances from related companies | | | 1.4 | | | | 1.3 | |
| Cash flows provided (used) by financing activities | | $ | (5.7 | ) | | $ | 20.1 | |
| Cash and cash equivalents, decrease in the period | | | (3.0 | ) | | | (9.2 | ) |
| Cash and cash equivalents, beginning of the period | | | 12.7 | | | | 18.9 | |
| | | | | | | | | |
| Cash and cash equivalents, end of the period | | $ | 9.7 | | | $ | 9.7 | |
| CATALYST PAPER 2012 SECOND QUARTER REPORT | CONSOLIDATED FINANCIAL STATEMENTS | ~ 43 ~ |
NOTES TO CONSOLIDATED FINANCIAL STATEMENTS
Under Creditor Protection Proceedings as of January 31, 2012 – Notes 2 and 5
(Unaudited and in millions of Canadian dollars, except where otherwise stated) |
| 6. | Variable interest entities |
The company has a 50.001% interest in PREI and consolidates 100% of it, as PREI is a VIE in which the company is the primary beneficiary. PREI consists of an integrated hydroelectric power generating, transmission and distribution system which includes two hydroelectric stations in B.C. with installed capacity of 83 Megawatts. The company purchases 100% of the power generated by PREI.
The company has limited access to PREI’s financial assets, which generally take the form of interest on loans, management fees and earnings distributions based on the company’s interest in PREI. In addition, creditors of PREI have recourse limited to the assets in PREI.
As disclosed in note 23,Subsequent events, PREI met the criteria of a component held for sale on July 27, 2012, and will be reported as a discontinued operation subsequent to that date. On June 30, 2012, PREI continued to be classified as held and used.
Condensed financial information with respect to PREI is as follows:
| | | Three months
ended June 30, | | | Six months
ended June 30, | |
| | | 2012 | | | 2011 | | | 2012 | | | 2011 | |
| Condensed statements of loss | | | | | | | | | | | | |
| Sales – affiliate1 | | $ | 5.1 | | | $ | 5.5 | | | $ | 10.4 | | | $ | 11.1 | |
| Cost of sales, excluding depreciation and amortization | | | 1.8 | | | | 2.1 | | | | 3.4 | | | | 3.3 | |
| Depreciation and amortization | | | 1.2 | | | | 1.9 | | | | 2.7 | | | | 3.7 | |
| | | | 3.0 | | | | 4.0 | | | | 6.1 | | | | 7.0 | |
| Operating earnings | | | 2.1 | | | | 1.5 | | | | 4.3 | | | | 4.1 | |
| Interest expense | | | (2.7 | ) | | | (2.3 | ) | | | (4.9 | ) | | | (4.5 | ) |
| Interest expense – affiliate1 | | | (1.1 | ) | | | (0.6 | ) | | | (1.7 | ) | | | (1.2 | ) |
| Income tax recovery | | | 0.5 | | | | 0.8 | | | | 0.7 | | | | 1.0 | |
| Net loss | | | (1.2 | ) | | | (0.6 | ) | | | (1.6 | ) | | | (0.6 | ) |
| Other comprehensive income | | | 0.1 | | | | – | | | | 0.1 | | | | – | |
| Total comprehensive loss 2 | | $ | (1.1 | ) | | $ | (0.6 | ) | | $ | (1.5 | ) | | $ | (0.6 | ) |
| 1 | Balances with Catalyst Paper Corporation. |
| 2 | 50% is included in the company’s non-controlling deficit balances. |
| | | June 30,
2012 | | | December 31,
2011 | |
| Condensed balance sheets | | | | | | | | |
| Current assets | | | | | | | | |
| Cash and cash equivalents | | $ | 7.9 | | | $ | 6.0 | |
| Other | | | 3.2 | | | | 3.1 | |
| Property, plant and equipment | | | 94.1 | | | | 95.5 | |
| | | $ | 105.2 | | | $ | 104.6 | |
| Current liabilities | | | | | | | | |
| Accounts payable and accrued liabilities | | $ | 7.9 | | | $ | 4.7 | |
| Long-term debt (note 14) | | | 113.8 | | | | 113.8 | |
| Long-term debt – affiliate1 | | | 20.8 | | | | 20.8 | |
| Future income taxes | | | 12.1 | | | | 12.7 | |
| Deficit2 | | | (49.4 | ) | | | (47.4 | ) |
| | | $ | 105.2 | | | $ | 104.6 | |
| 1 | Balances with Catalyst Paper Corporation. |
| 2 | 50% is included in the company’s non-controlling deficit balances. |
| CATALYST PAPER 2012 SECOND QUARTER REPORT | CONSOLIDATED FINANCIAL STATEMENTS | ~ 44 ~ |
NOTES TO CONSOLIDATED FINANCIAL STATEMENTS
Under Creditor Protection Proceedings as of January 31, 2012 – Notes 2 and 5
(Unaudited and in millions of Canadian dollars, except where otherwise stated) |
The company has identified one other potential VIE, but has not been able to obtain the financial information necessary to evaluate whether the entity is a VIE, or, if the entity is a VIE, whether the company is the primary beneficiary. The company has entered into a building lease agreement with this potential VIE whereby the company has agreed to continue making the prescribed lease payments directly to the financial institution holding the mortgage on the building in the event the lessor is no longer able to meet its contractual obligations. As at June 30, 2012 the principal amount of the mortgage was $3.9 million (December 31, 2011 - $4.8 million). This agreement does not increase the company’s liability beyond the obligation under the building lease.
| | Restricted cash includes $2.6 million collateral held against letters of credit. Cash collateral is held at a rate of 105% of letters of credit. These letters of credit were formerly recognized under the ABL Facility and were subtracted from the balance available to be withdrawn, but aren’t presently recognized under the DIP Credit Agreement in the calculation of the available balance under the DIP Credit Facility. Restricted cash also includes $6.4 million in proceeds, frozen by the DIP lender, on the sale of redundant poplar plantation land in Washington State and certain assets at the company’s discontinued Elk Falls mill and paper recycling operation. |
The components of accounts receivable were as follows:
| | | June 30,
2012 | | | December 31,
2011 | |
| Trade receivables | | $ | 131.2 | | | $ | 115.1 | |
| Less allowance for doubtful accounts | | | (2.1 | ) | | | (2.0 | ) |
| Trade receivables, net | | | 129.1 | | | | 113.1 | |
| Sales taxes receivable | | | 19.5 | | | | 7.5 | |
| Pulp and Paper Green Transformation Program receivable | | | 1.8 | | | | 6.9 | |
| Other receivables | | | 8.1 | | | | 7.4 | |
| | | $ | 158.5 | | | $ | 134.9 | |
The components of inventories were as follows:
| | | June 30,
2012 | | | December 31,
2011 | |
| Finished goods | | | | | | | | |
| Specialty printing papers | | $ | 32.9 | | | $ | 28.6 | |
| Newsprint | | | 9.8 | | | | 9.1 | |
| Pulp | | | 4.0 | | | | 7.8 | |
| Total finished goods | | | 46.7 | | | | 45.5 | |
| Work-in-progress | | | 1.0 | | | | 1.1 | |
| Raw materials – wood chips, pulp logs and other | | | 23.5 | | | | 26.3 | |
| Operating and maintenance supplies and spare parts | | | 70.8 | | | | 74.0 | |
| | | $ | 142.0 | | | $ | 146.9 | |
At June 30, 2012 the company had applied write-downs of $0.2 million to finished goods inventory (December 31, 2011 – $2.1 million) and $0.8 million to raw materials inventory (December 31, 2011 – $4.5 million).
| CATALYST PAPER 2012 SECOND QUARTER REPORT | CONSOLIDATED FINANCIAL STATEMENTS | ~ 45 ~ |
NOTES TO CONSOLIDATED FINANCIAL STATEMENTS
Under Creditor Protection Proceedings as of January 31, 2012 – Notes 2 and 5
(Unaudited and in millions of Canadian dollars, except where otherwise stated) |
The components of prepaids and other were as follows:
| | | June 30,
2012 | | | December 31,
2011 | |
| Property taxes, insurance and licenses | | $ | 2.9 | | | $ | 2.0 | |
| Derivative financial instruments | | | – | | | | 2.5 | |
| Future income tax assets (note 19) | | | 9.9 | | | | 13.1 | |
| Other | | | 8.1 | | | | 2.4 | |
| | | $ | 20.9 | | | $ | 20.0 | |
| 11. | PROPERTY, PLANT AND EQUIPMENT |
The components of property, plant and equipment were as follows:
| | | June 30,
2012 | | | December 31,
2011 | |
| Cost | | $ | 4,213.9 | | | $ | 4,214.8 | |
| Accumulated depreciation, amortization and impairment | | | 3,838.9 | | | | 3,828.5 | |
| Net book value | | $ | 375.0 | | | $ | 386.3 | |
The components of other assets were as follows:
| | | June 30,
2012 | | | December 31,
2011 | |
| Deferred financing costs | | $ | 0.6 | | | $ | 11.8 | |
| Deferred charges and other | | | 6.7 | | | | 9.9 | |
| Derivative financial instruments | | | – | | | | 2.5 | |
| Accrued benefit asset – pension plan (note 15) | | | 0.2 | | | | 0.2 | |
| | | $ | 7.5 | | | $ | 24.4 | |
| 13. | Accounts payable and accrued liabilities |
The components of accounts payable and accrued liabilities are listed below. These balances exclude the pre-petition liabilities that were compromised by the CCAA proceedings and reclassified toLiabilities subject to compromise(note 5).
| | | June 30,
2012 | | | December 31,
2011 | |
| Trade payables | | $ | 36.7 | | | $ | 81.7 | |
| Accrued payroll and related liabilities | | | 25.3 | | | | 32.7 | |
| Accrued interest | | | 4.8 | | | | 33.2 | |
| Accrued benefit obligation – pension plan | | | 6.9 | | | | 6.9 | |
| Accrued benefit obligation – other employee future benefit plans | | | 6.8 | | | | 6.8 | |
| Restructuring (note 17) | | | 0.2 | | | | 1.2 | |
| Property taxes, including taxes in arrears, interest and related penalties | | | 6.2 | | | | 0.7 | |
| Lease obligation – paper recycling – current portion | | | – | | | | 2.3 | |
| Payables related to capital projects | | | 0.4 | | | | 3.7 | |
| Other | | | 13.6 | | | | 5.3 | |
| | | $ | 100.9 | | | $ | 174.5 | |
| CATALYST PAPER 2012 SECOND QUARTER REPORT | CONSOLIDATED FINANCIAL STATEMENTS | ~ 46 ~ |
NOTES TO CONSOLIDATED FINANCIAL STATEMENTS
Under Creditor Protection Proceedings as of January 31, 2012 – Notes 2 and 5
(Unaudited and in millions of Canadian dollars, except where otherwise stated) |
| Recourse | | June 30,
2012 | | | December 31,
2011 | |
| Senior notes, 7.375% due March 2014 (US$250.0 million) | | $ | 254.8 | | | $ | 256.4 | |
| Senior secured notes, 11.0% due December 2016 (US$280.4 million) | | | 285.8 | | | | 285.2 | |
| Modification – difference in carrying value of 8.625% and 11.0% senior secured notes (US$38.3 million) on exchange | | | – | | | | 31.2 | |
| Class B senior secured notes, 11.0% due December 2016 (US$110.0 million) | | | 112.1 | | | | 98.5 | |
| | | | 652.7 | | | | 671.3 | |
| Revolving asset based loan facility of up to $175.0 million due May 2016 | | | – | | | | 48.0 | |
| Debtor-in-possession loan facility of up to $175.0 million due August 2013 | | | 70.5 | | | | – | |
| Capital lease obligations | | | 8.7 | | | | 9.2 | |
| | | | 731.9 | | | | 728.5 | |
| Non-recourse | | | | | | | | |
| First mortgage bonds, 6.447% due July 2016 | | | 95.0 | | | | 95.0 | |
| Subordinated promissory notes | | | 18.8 | | | | 18.8 | |
| | | | 113.8 | | | | 113.8 | |
| Total debt | | | 845.7 | | | | 842.3 | |
| Less: Current portion | | | (6.8 | ) | | | (466.8 | ) |
| Less: Debt classified as Liabilities subject to compromise (note 5) | | | (652.7 | ) | | | – | |
| Total long-term debt | | $ | 186.2 | | | $ | 375.5 | |
The commencement of the creditor protection proceedings on January 31, 2012 constituted an event of default under substantially all of the company’s debt and the majority of those debt obligations became automatically and immediately due and payable. Any actions to enforce such payment obligations were stayed as a result of the creditor protection order. The company’s secured and unsecured pre-petition debt were potentially compromised by the CCAA proceedings, resulting in the reclassification of the principal amounts plus accrued and unpaid interest on the 2014 Notes and 2016 Notes toLiabilities subject to compromise.
A second amended plan of arrangement was approved by creditors and sanctioned by the Court in the second quarter. The principal amounts plus accrued and unpaid interest on the 2016 Notes and 2014 Notes were compromised under this plan. Refer to note 2,Creditor protection proceedings,for disclosure of the specific terms of the second amended plan of arrangement. As discussed in note 5,Creditor protection proceedings related disclosures, the debt balances on the 2014 Notes and 2016 Notes were adjusted in the quarter to the allowed claims amounts.
As disclosed in note 13,Long-term debt, in the annual consolidated financial statements for the year ended December 31, 2011, the principal outstanding on the 2016 Notes and the balance outstanding on the ABL Facility were reclassified from long-term debt to current debt on December 31, 2011 due to a covenant violation.
The DIP Credit Facility has an 18-month maturity and has a maximum draw of approximately $175 million. Maximum availability is subject to certain terms and conditions that the DIP lenders have agreed to provide to Catalyst during the CCAA proceedings. The security for the DIP Credit Facility consists of a first charge on the accounts receivable, inventory and cash of the company (collectively, the DIP First Charge Collateral) and a second charge on the 2016 Notes First Charge Collateral.
| CATALYST PAPER 2012 SECOND QUARTER REPORT | CONSOLIDATED FINANCIAL STATEMENTS | ~ 47 ~ |
NOTES TO CONSOLIDATED FINANCIAL STATEMENTS
Under Creditor Protection Proceedings as of January 31, 2012 – Notes 2 and 5
(Unaudited and in millions of Canadian dollars, except where otherwise stated) |
Availability under the DIP Credit Facility is determined by a borrowing base calculated primarily on eligible accounts receivable and eligible inventory, less certain reserves. These reserves include availability reserves, permitted priority charges and other reserves. Availability reserves include (a) a landlord waiver reserve in respect of rent of approximately $2.0 million; (b) a reserve in respect of wages and vacation pay obligations of approximately $3.6 million; (c) a pension reserve not exceeding the sum of normal cost pension contributions, special and catch-up payments and any other payments in respect of a Canadian pension plan that are past due of approximately $2.7 million; and (d) an immaterial sales tax reserve. Permitted priority charges include an administration charge of approximately $1.5 million. Other reserves include credit insurance deductibles of approximately $2.0 million and approximately $1.5 million for insured receivables dilution. As at June 30, 2012, the borrowing base under the DIP Credit Facility was $159.6 million. After deducting outstanding drawings of $70.5 million and outstanding letters of credit of $19.6 million, and the $21.9 million availability block (refer to next paragraph), $47.6 million was available under the DIP Credit Facility. The company also had an additional $17.8 million of cash on hand and $9.0 million in restricted cash on June 30, 2012.
The DIP Credit Agreement includes a condition that requires the company to maintain excess availability under the Facility of not less than $21.9 million, replacing the former financial covenant that required the company to maintain a minimum fixed charge coverage ratio of 1.1/1.0 if excess availability under the Facility fell below $21.9 million.
At June 30, 2012, the company was in compliance with its covenants under the DIP Credit Facility.
The company’s long-term debt is recorded at amortized cost.Liabilities subject to compromise are recorded at the allowable claims amount as determined by the creditor protection proceedings. As discussed in note 5,Creditor protection proceedings related disclosure, the unamortized discount on the Class B senior secured notes, the unamortized modification, and unamortized financing costs on the company’s 2014 Notes and 2016 Notes were written off in the quarter to adjust the carrying value of these Notes to the allowable claims amounts. The following table contains information about management’s best estimate of the fair value of the company’s debt, including the principal outstanding on the 2014 Notes and 2016 Notes presented asLiabilities subject to compromise:
| | | June 30, 2012 | | | December 31, 2011 | |
| | | Carrying
Value | | | Fair
Value | | | Carrying
Value | | | Fair
Value | |
| Recourse | | $ | 731.9 | | | $ | 283.8 | | | $ | 728.5 | | | $ | 279.5 | |
| Non-recourse | | | 113.8 | | | | 123.0 | | | | 113.8 | | | | 124.7 | |
The fair value of the company’s long-term recourse debt related to its senior notes is determined based on quoted market prices of identical debt instruments. The fair value of the company’s recourse debt related to the DIP Credit Facility on June 30, 2012 (and the ABL Facility on December 31, 2011) and non-recourse debt related to the first mortgage bonds is measured by discounting the respective cash flows at quoted market rates for similar debt having the same maturity. In measuring fair value, the company incorporates credit valuation adjustments to reflect its own non-performance risk, where applicable.
| 15. | Employee future benefits |
The company maintains pension benefit plans for all salaried employees, which include defined benefit and defined contribution segments. Employees hired subsequent to January 1, 1994 enroll in the defined contribution segment. Effective January 1, 2010 employees in the defined benefit plan ceased to accrue benefits under the defined benefit segment of the plan and began to participate in the defined contribution segment of the plan. The company also maintains pension benefits for former hourly employees that are not covered by union pension plans. Unionized employees of the company are members of multi-employer industry-wide pension plans to which the company contributes a predetermined amount per hour worked by an employee.
The company provides other benefit plans consisting of provincial medical plan premiums, extended health care and dental benefits to employees. A description of changes to pension and other benefit plans can be found on page 89 of the company’s 2011 Annual Report.
| CATALYST PAPER 2012 SECOND QUARTER REPORT | CONSOLIDATED FINANCIAL STATEMENTS | ~ 48 ~ |
NOTES TO CONSOLIDATED FINANCIAL STATEMENTS
Under Creditor Protection Proceedings as of January 31, 2012 – Notes 2 and 5
(Unaudited and in millions of Canadian dollars, except where otherwise stated) |
For the three and six months ended June 30, 2012 the company incurred total post-retirement benefit costs of $7.6 million and $15.0 million, respectively (three and six months ended June, 30, 2011 – $7.6 million and $14.2 million).
For the three and six months ended June 30, 2012 the company contributed $10.9 million and $21.1 million, respectively (three and six months ended June 30, 2011 - $8.5 million and 16.3 million) for employee future benefits which include cash contributed to the company’s funded pension plans, cash payments directly to beneficiaries for its unfunded benefit plans, cash contributions to its defined contribution plans and cash contributed to its multi-employer industry-wide pension plans.
Components of net periodic benefit cost recognized in the period were as follows:
| | | Three months
ended June 30, | | | Six months
ended June 30, | |
| Pension benefit plans | | 2012 | | | 2011 | | | 2012 | | | 2011 | |
| Defined benefit plan | | | | | | | | | | | | | | | | |
| Service cost for the period | | $ | 0.3 | | | $ | 0.3 | | | $ | 0.6 | | | $ | 0.6 | |
| Interest cost | | | 4.1 | | | | 4.6 | | | | 8.2 | | | | 9.0 | |
| Expected return on assets | | | (3.7 | ) | | | (4.1 | ) | | | (7.4 | ) | | | (8.2 | ) |
| Amortization of unrecognized items: | | | | | | | | | | | | | | | | |
| Actuarial losses | | | 2.1 | | | | 1.3 | | | | 4.2 | | | | 2.6 | |
| Prior service costs | | | 0.1 | | | | 0.1 | | | | 0.2 | | | | 0.2 | |
| | | | 2.9 | | | | 2.2 | | | | 5.8 | | | | 4.2 | |
| Defined contribution plan | | | | | | | | | | | | | | | | |
| Service cost for the period | | | 0.8 | | | | 1.0 | | | | 1.7 | | | | 1.8 | |
| Multi-employer industry-wide pension plan service cost for the period | | | 2.7 | | | | 3.0 | | | | 5.1 | | | | 5.4 | |
| Net periodic benefit cost for pension benefit plans | | $ | 6.4 | | | $ | 6.2 | | | $ | 12.6 | | | $ | 11.4 | |
| | | Three months
ended June 30, | | | Six months
ended June 30, | |
| Other post-retirement benefit plans | | 2012 | | | 2011 | | | 2012 | | | 2011 | |
| Service cost for the period | | $ | 0.3 | | | $ | 0.4 | | | $ | 0.6 | | | $ | 0.7 | |
| Interest cost | | | 1.8 | | | | 1.9 | | | | 3.6 | | | | 3.8 | |
| Amortization of unrecognized items: | | | | | | | | | | | | | | | | |
| Actuarial losses | | | – | | | | 0.1 | | | | – | | | | 0.2 | |
| Prior service credits | | | (0.9 | ) | | | (1.0 | ) | | | (1.8 | ) | | | (1.9 | ) |
| Net periodic benefit cost for other benefit plans | | $ | 1.2 | | | $ | 1.4 | | | $ | 2.4 | | | $ | 2.8 | |
| 16. | ACCUMULATED OTHER COMPREHENSIVE LOSS |
The following table contains information about the accumulated other comprehensive loss (AOCI) of the company, net of taxes:
| | | June 30,
2012 | | | December 31,
2011 | |
| Unrecognized pension and other post-retirement benefits costs | | $ | (87.6 | ) | | $ | (89.6 | ) |
| Foreign currency translation adjustments, net of related hedging activities1 | | | 0.3 | | | | 0.7 | |
| Unrecognized loss on interest rate hedges | | | (0.5 | ) | | | (0.5 | ) |
| | | $ | (87.8 | ) | | $ | (89.4 | ) |
| 1 | The accumulated net adjustment is comprised of non-taxable translation gain of $1.9 million (2011 – $2.3 million gain), and a net revaluation of long-term debt designated as a net investment hedge of $1.6 million loss (2011 – $1.6 million loss), net of tax of $nil million (2011 – $nil million expense). Effective October 1, 2011, the company no longer designates the net revaluation of long-term debt as a net investment hedge. |
| CATALYST PAPER 2012 SECOND QUARTER REPORT | CONSOLIDATED FINANCIAL STATEMENTS | ~ 49 ~ |
NOTES TO CONSOLIDATED FINANCIAL STATEMENTS
Under Creditor Protection Proceedings as of January 31, 2012 – Notes 2 and 5
(Unaudited and in millions of Canadian dollars, except where otherwise stated) |
The following table provides the activity in the restructuring liability:
| | | As at
June 30,
2012 | | | As at
December 31,
2011 | |
| Balance, beginning of period | | $ | 1.3 | | | $ | 3.3 | |
| Expensed in period | | | 5.1 | | | | 5.9 | |
| Disbursements | | | (6.2 | ) | | | (7.9 | ) |
| Balance, end of period | | $ | 0.2 | | | $ | 1.3 | |
| Classification: | | | | | | | | |
| Accounts payable and accrued liabilities (note 13) | | $ | 0.2 | | | $ | 1.2 | |
| Other long-term obligations | | | – | | | | 0.1 | |
| | | $ | 0.2 | | | $ | 1.3 | |
The following table provides restructuring liability by year of initiative:
| | | June 30,
2012 | | | December 31,
2011 | |
| 2009 and prior initiatives | | $ | 0.2 | | | $ | 0.2 | |
| 2010 initiatives | | | – | | | | 0.1 | |
| 2011 initiatives | | | – | | | | 1.0 | |
| | | $ | 0.2 | | | $ | 1.3 | |
| 18. | Other INCOME (expense) |
The components of other income (expense) were as follows:
| | | Three months
ended June 30, | | | Six months
ended June 30, | |
| | | 2012 | | | 2011 | | | 2012 | | | 2011 | |
| Gain (loss) on derivative financial instruments | | $ | (0.2 | ) | | $ | 0.4 | | | $ | (1.2 | ) | | $ | 1.2 | |
| Foreign exchange gain (loss) on working capital balances | | | 3.9 | | | | (1.2 | ) | | | (0.1 | ) | | | (2.8 | ) |
| Gain (loss) on disposal of property, plant and equipment | | | 6.6 | | | | – | | | | 7.1 | | | | (0.1 | ) |
| Loss on fires | | | – | | | | (5.7 | ) | | | – | | | | (5.7 | ) |
| Other | | | – | | | | 0.1 | | | | (0.2 | ) | | | 0.5 | |
| | | $ | 10.3 | | | $ | (6.4 | ) | | $ | 5.6 | | | $ | (6.9 | ) |
As at June 30, 2012 the company has provided for a cumulative valuation allowance on its future tax assets of $388.2 million ($380.3 million at December 31, 2011). The effective rate for the quarter ended June 30, 2012 was 4.0%. The effective rate is less than the statutory rate primarily due to non-recognition of the tax benefit of the losses for the quarter. A description of the company’s income taxes can be found on pages 97 to 99 of the company’s 2011 Annual Report.
| CATALYST PAPER 2012 SECOND QUARTER REPORT | CONSOLIDATED FINANCIAL STATEMENTS | ~ 50 ~ |
NOTES TO CONSOLIDATED FINANCIAL STATEMENTS
Under Creditor Protection Proceedings as of January 31, 2012 – Notes 2 and 5
(Unaudited and in millions of Canadian dollars, except where otherwise stated) |
| 20. | Fair value measurement |
An established fair value hierarchy requires the company to maximize the use of observable inputs and minimize the use of unobservable inputs when measuring fair value. A financial instrument’s categorization within the fair value hierarchy is based upon the lowest level of input that is available and significant to the fair value measurement. There are three levels of inputs that may be used to measure fair value.
Level 1
Quoted prices in active markets for identical assets or liabilities.
Level 2
Observable inputs other than quoted prices in active markets for identical assets and liabilities, such as quoted prices for identical or similar assets or liabilities in markets that are not active, or other inputs that are observable or can be corroborated by observable market data for substantially the full term of the assets or liabilities.
Level 3
Inputs that are generally unobservable and are supported by little or no market activity and that are significant to the fair value determination of the assets or liabilities.
As at June 30, 2012 the company did not have any currency or commodity contracts which have been designated as hedging instruments, or which are not designated as hedging instruments.
The following table presents information about the fair value of the company’s derivative and non-derivative financial instruments not designated as hedging instruments and measured at fair value on a recurring basis:
| | June 30,
2012 | | December 31,
2011 | | Fair value
hierarchy | | Balance sheet
classification |
| Assets | | | | | | | | | |
| Currency contracts | $ | – | | $ | 2.0 | | 21 | | Prepaids and other |
| Currency contracts | | – | | | 2.5 | | 21 | | Other assets |
| Commodity contracts | | – | | | 0.5 | | 22 | | Prepaids and other |
| | $ | – | | | 5.0 | | | | |
| Liabilities | | | | | | | | | |
| Commodity contracts | $ | – | | | 0.4 | | 22 | | Accounts payable
and accrued liabilities |
| Commodity contracts | | – | | | 0.2 | | 22 | | Other long-term obligations |
| | $ | – | | $ | 0.6 | | | | |
Fair value of the company’s derivatives are classified under Level 2 as they are measured as follows:
| 1 | The fair value of forward currency contracts is measured using the discounted difference between contractual rates and market future rates. Interest rates, forward market rates, and volatility are used as inputs for such valuation techniques. The company incorporates credit valuation adjustments to appropriately reflect both its own non-performance risk and the counterparty’s non-performance risk in the fair value measurements. |
| 2 | The fair value of commodity swap contracts is measured using the discounted difference between contractual rates and market rates. The fair value of natural gas commodity options is measured using techniques derived from the Black-Scholes pricing model. The company incorporates credit valuation adjustments to appropriately reflect both its own non-performance risk and the counterparty’s non-performance risk in the fair value measurements. |
The Company no longer designates its U.S. dollar revenue risk management instruments as cash flow hedges for accounting purposes effective April 1, 2010. For cash flow hedges that were in place as at March 31, 2010 the effective portion of changes in the fair value accumulated as at March 31, 2010 were deferred and recorded inAccumulated other comprehensive loss. When the hedge item was recorded in earnings, the corresponding gain or loss on the hedge was reclassified fromAccumulated other comprehensive loss toSales. As of December 31, 2011 all deferred amounts on these cash flow hedges had been recognized inSales and circulated out ofAccumulated other comprehensive loss.
| CATALYST PAPER 2012 SECOND QUARTER REPORT | CONSOLIDATED FINANCIAL STATEMENTS | ~ 51 ~ |
NOTES TO CONSOLIDATED FINANCIAL STATEMENTS
Under Creditor Protection Proceedings as of January 31, 2012 – Notes 2 and 5
(Unaudited and in millions of Canadian dollars, except where otherwise stated) |
The following table presents information about the effects of the company’s derivative instruments previously designated as cash flow hedges until April 1, 2010 when hedge accounting was discontinued. It also presents the effect of long-term debt designated as a hedge of the company’s net investment in the Snowflake mill on the company’s consolidated financial statements:
| | | Gain (loss)
recognized in
AOCI1 | | | (Gain) loss
reclassified
from AOCI1 | | | Classification on
statement
of earnings (loss)
reclassified from AOCI1 | | Gain (loss)
recognized
in income2 | |
Three months
ended June 30, | | 2012 | | | 2011 | | | 2012 | | | 2011 | | | | | 2012 | | | 2011 | |
| Derivatives designated as cash flow hedges | | | | | | | | | | | | | | | | | | | | |
| Currency contracts | | $ | – | | | $ | – | | | $ | – | | | $ | (0.2 | ) | | Other income (expense) | | $ | – | | | $ | – | |
Long-term debt designated as
hedges of net investment | | $ | – | | | $ | 0.6 | | | $ | – | | | $ | (0.9 | ) | | Foreign exchange gain (loss) on long-term debt | | $ | – | | | $ | – | |
| | | Gain (loss)
recognized in
AOCI1 | | | (Gain) loss
reclassified
from AOCI1 | | | Classification on
statement
of earnings (loss)
reclassified from AOCI1 | | Gain (loss)
recognized
in income2 | |
Six months
ended June 30, | | 2012 | | | 2011 | | | 2012 | | | 2011 | | | | | 2012 | | | 2011 | |
| Derivatives designated as cash flow hedges | | | | | | | | | | | | | | | | | | | | |
| Currency contracts | | $ | – | | | $ | – | | | $ | – | | | $ | (0.9 | ) | | Other income (expense) | | $ | – | | | $ | – | |
Long-term debt designated as
hedges of net investment | | $ | – | | | $ | 5.5 | | | $ | – | | | $ | (1.0 | ) | | Foreign exchange gain (loss) on long-term debt | | $ | – | | | $ | – | |
| 1 | The gain (loss) recognized, or (gain) loss reclassified from AOCI relates to the effective portion of the hedge. |
| 2 | The gain (loss) recognized in income relates to the ineffective portion of the hedge and the amount excluded from effectiveness testing. |
The carrying value of the company’s other financial instruments, namely cash and cash equivalents, accounts receivable, accounts payable and accrued liabilities approximate their fair values because of the short-term maturity of these instruments.
| CATALYST PAPER 2012 SECOND QUARTER REPORT | CONSOLIDATED FINANCIAL STATEMENTS | ~ 52 ~ |
NOTES TO CONSOLIDATED FINANCIAL STATEMENTS
Under Creditor Protection Proceedings as of January 31, 2012 – Notes 2 and 5
(Unaudited and in millions of Canadian dollars, except where otherwise stated) |
| (a) | Financial Risk Management |
Financial instruments of the company consist primarily of cash and cash equivalents, accounts receivable, accounts payable and accrued liabilities and long-term debt. Financial instruments of the company also include derivatives which the company uses to reduce its exposure to currency and price risk associated with its revenues, energy costs and long-term debt.
The company has exposure to risk from its financial instruments, specifically credit risk, market risk (including currency, price and interest rate risk) and liquidity risk. A summary of the company’s financial risk management objectives can be found on pages 107 to 108 of the company’s 2011 Annual Report.
The company is exposed to credit risk on accounts receivable from its customers who are mainly in the newspaper publishing and commercial printing businesses. Aging of receivables were as follows:
| | | June 30,
2012 | | | December 31,
2011 | |
| Trade receivables | | | | | | | | |
| Current | | $ | 119.2 | | | $ | 100.9 | |
| Past due 1-30 days | | | 9.9 | | | | 13.6 | |
| Past due 31-90 days | | | 1.3 | | | | 0.3 | |
| Past due over 90 days | | | 0.8 | | | | 0.3 | |
| | | | 131.2 | | | | 115.1 | |
| Less allowance for doubtful accounts | | | (2.1 | ) | | | (2.0 | ) |
| Trade receivables, net | | $ | 129.1 | | | $ | 113.1 | |
The movement in the allowance for doubtful accounts in respect of trade receivables was as follows:
| | | June 30,
2012 | | | December 31,
2011 | |
| Balance, beginning of period | | $ | 2.0 | | | $ | 3.0 | |
| Increase (decrease) in provision | | | 0.1 | | | | (1.0 | ) |
| Balance, end of period | | $ | 2.1 | | | $ | 2.0 | |
| (b) | Revenue Risk Management Instruments |
At June 30, 2012 the company did not have any foreign currency or commodity contracts outstanding.
Foreign currency options and forward contracts are no longer designated as hedging instruments and are reported at their fair value, which was $nil million at June 30, 2012 (December 31, 2011 - $4.5 million), with related gains and losses recognized inOther income (expense).
Commodity swap agreements are not designated as hedging instruments and are reported at their fair value which was $nil at June 30, 2012 (December 31, 2011 - $0.5 million) with related gains and losses recognized inOther income (expense).
| (c) | Cost Risk Management Instruments |
At June 30, 2012 the company did not have any commodity contracts outstanding.
| CATALYST PAPER 2012 SECOND QUARTER REPORT | CONSOLIDATED FINANCIAL STATEMENTS | ~ 53 ~ |
NOTES TO CONSOLIDATED FINANCIAL STATEMENTS
Under Creditor Protection Proceedings as of January 31, 2012 – Notes 2 and 5
(Unaudited and in millions of Canadian dollars, except where otherwise stated) |
| 22. | CONTINGENT LIABILITIES |
A description of the company's contingent liabilities as at December 31, 2011 can be found on page 111 of the company's 2011 Annual Report. An update as at June 30, 2012 is outlined below:
| (a) | Claim for Certain Post-retirement Benefits |
The Communications, Energy and Paperworkers Union of Canada Locals 1, 76, 592 and 686 (the Locals), representing hourly employees at the company’s Powell River and Port Alberni mills, applied to the Labour Relations Board of B.C. for a declaration that the company is responsible for certain post-retirement medical and extended health benefits for some retired employees who were represented by the Locals and who retired from MacMillan Bloedel Limited (MB), now doing business as Weyerhaeuser Company Ltd. (Weyerhaeuser). Pacifica Papers Inc. (Pacifica) acquired the Powell River and Port Alberni mills from MB in 1998, and it was agreed as part of that transaction that MB would remain responsible for any benefits for eligible employees who retired prior to the acquisition by Pacifica of the mills. The company subsequently amalgamated with Pacifica in 2001. The Locals claim that the contractual relationships between the company, Pacifica and MB do not absolve the company (as successor to Pacifica) from any obligations which may exist in respect of certain post-retirement benefits and that the successorship provisions of the Labour Relations Code imposed any such possible obligations on Pacifica at the time Pacifica acquired the mills. The Labour Relations Board declined to rule on the Locals’ application or the company’s defense to the claim on the basis that this matter is a dispute under the collective agreement and, accordingly, a matter to be determined by arbitration. All four Locals filed grievances claiming that the company is responsible for these post-retirement benefits. The company does not agree with the Locals’ positions and has contested or will be contesting the grievances. Local 76’s claim was dismissed by an arbitrator on December 23, 2010. Local 686 advised the company on March 29, 2011 that Local 686 was withdrawing its claim. Local 592 withdrew its claim on May 26, 2011. The remaining grievance is at a preliminary stage and, as at August 1, 2012 has not been scheduled. Although the extent of the company’s liability for the remaining claim remains unknown at this time, the company estimates that it would incur costs of between $350,000 and $700,000 annually to provide these additional benefits. In that case, it would seek indemnification from Weyerhaeuser.
| (b) | Short-term Incentive Plan and Benefits Claim |
In May 2010, a salaried employee of the company commenced an action against the company in the Court seeking a payment under the company's 2009 Short-term Incentive Plan and damages in connection with the reduction of certain employee benefits announced in November 2009 and certification of the action as a class proceeding on behalf of all salaried employees who were entitled to Short-term Incentive Plan payments and affected by the reduction in benefits. The action was certified as a class proceeding on March 21, 2011 but only on behalf of those employees and former employees who have not provided the company with releases of the claims. The company intends to vigorously defend this action. Most of the company’s employees and applicable former employees have provided the company with written releases of these claims, leaving only a small number of employees and former employees who have not done so. Although it is not possible to determine the likelihood and extent of any potential liability for the remaining claims, the company does not expect to incur any additional material liability in connection with this claim.
| CATALYST PAPER 2012 SECOND QUARTER REPORT | CONSOLIDATED FINANCIAL STATEMENTS | ~ 54 ~ |
NOTES TO CONSOLIDATED FINANCIAL STATEMENTS
Under Creditor Protection Proceedings as of January 31, 2012 – Notes 2 and 5
(Unaudited and in millions of Canadian dollars, except where otherwise stated) |
Permanent closure of Snowflake recycle paper mill
On July 30, 2012, the company announced the permanent closure of its Snowflake recycle mill operations. The mill, which is located in northeastern Arizona, will be permanently shut on September 30, 2012. The decision to close the mill was driven by continued financial losses resulting from intense supply input and market pressures. Since acquiring the Snowflake operation in 2008, profitability has been negatively impacted by declining newsprint demand, higher old newsprint (ONP) prices, and higher freight costs resulting from procurement and sales being forced to go further afield to source ONP and secure product orders. The mill closure, which will result in certain initial cash costs which the company expects to recoup from working capital and the sale of mill assets in 2013, is expected to result in the elimination of future operating losses associated with the mill and savings of annualized selling, general and administrative expenses. The company has indicated that it will honor its obligations to employees at the Snowflake operations. Although the closure of the Snowflake mill may have a significant impact on the company’s future financial position, earnings and profitability, as well as on its income tax assets and liabilities, it is impossible at this time for the company to quantify what the impact will be.
Classification of PREI as discontinued operation
The company has initiated an active program to locate a buyer for PREI pursuant to the second amended plan of arrangement, the terms of which contemplate the company disposing of its 50.001% interest in PREI. PREI met the criteria of a component held for sale on July 27, 2012 when the US Court in Delaware confirmed the second amended plan of arrangement under the Chapter 15 process. PREI will be treated as a discontinued operation from July 27, 2012, and it is expected that the company will complete the disposition of its interest in PREI within twelve months of that date. As a discontinued operation, the assets and liabilities of PREI will be presented separately on the balance sheet as held for sale. A summary of PREI’s major classes of assets and liabilities as of June 30, 2012 that will be classified as held for sale is disclosed in note 6,Variable interest entities.
Certain comparative figures presented in the interim consolidated financial statements have been reclassified to conform to the current period presentation.
| CATALYST PAPER 2012 SECOND QUARTER REPORT | CONSOLIDATED FINANCIAL STATEMENTS | ~ 55 ~ |