PRESIDENT’S MESSAGE
Newsprint sales held relatively steady during this quarter, and we benefited from a stronger pulp business, although this was offset by particularly tough conditions in specialty paper markets. We nevertheless posted improved EBITDA performance and significantly pared back our loss over the prior quarter.
We recorded a net loss this quarter of $9.8 million ($0.89 per common share), and $11.6 million before specific items. That compares with a net loss in the fourth quarter of 2012 of $35.2 million ($1.55 per common share), and $15.7 million before specific items. Adjusted earnings before interest, tax, depreciation and amortization (adjusted EBITDA) this quarter were $11.2 million, up from $7.2 million in the final quarter of 2012.
These results leave us some distance short of where we ultimately need to be, but they illustrate the benefit of the improved cost and capital-structure achieved through last year’s restructuring. Two new product launches during the quarter – including a lighter weight newsprint grade that has already achieved traction in key target markets – further demonstrate Catalyst’s capacity to innovate and capture market share.
Moving Further Forward
This was the second full quarter following the completion of our restructuring. On January 7 new shares were listed under the symbol CYT on the Toronto Stock Exchange. We marked this highly satisfying milestone later in the month by initiating the opening siren with representatives of investors and other stakeholders in attendance.
Over the balance of the quarter we implemented the major outstanding measures laid out in the plan of arrangement through which we exited creditor protection, including two asset sales. Sale of the assets of the Snowflake mill and shares of the Apache Railway in Arizona completed on January 30 for US$13.5 million and other non-monetary consideration.
Sale of our 50% interest in Powell River Energy Inc. (PREI) completed on March 20 for $33.0 million and we distributed approximately $12.7 million from the net proceeds to unsecured creditors who had not elected to receive shares in settlement of their claims. This satisfied the last outstanding creditor claims under the plan of arrangement through which Catalyst exited creditor protection last September.
On March 26 we used additional PREI proceeds to make an offer to purchase US$20.0 million of our floating rate senior secured notes due 2016, at par plus accrued and unpaid interest. Holders of US$15.6 million of these notes accepted this offer prior to its expiry. Catalyst will continue to purchase electricity produced by PREI, under an agreement expiring in 2016 with one-year renewal terms extending to 2021 at Catalyst’s option.
Market Conditions
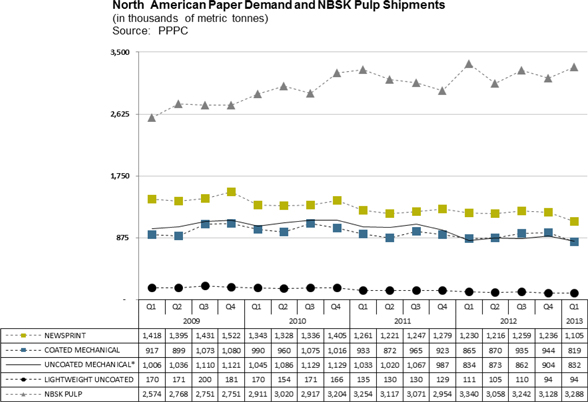
We were confronted this quarter with lower North American demand and declining benchmark prices for all paper grades. Year-over-year demand declined by 5.3% for lightweight coated while remaining flat for uncoated mechanical grades. Directory demand was down significantly at 15.3%, while newsprint demand declined by 10.2%. Our sales volumes were up for newsprint, in contrast to specialty grades, resulting in part from the launch of our new newsprint grade. Lower sales volumes for paper were partly due to a production shortfall resulting from certain unforeseen maintenance events in the quarter.
Pulp was the most noteworthy bright spot during the quarter, as a rebounding Chinese economy drove global Northern Bleached Softwood Kraft (NBSK) shipments up by 5.1% compared to the fourth quarter, while the benchmark price rose 2.4% over the prior quarter. There was, however, excess inventory build-up in China during the quarter.
First quarter market conditions underscore the vital importance of continued innovation and aggressive pursuit of a larger market share. Our new Marathon Lite newsprint grade pushes the boundaries further on basis weights while maintaining strong pressroom performance, and has attracted interest and commitment among Latin America newspaper publishers.
We also introduced Ascent to the market – a new coated three grade and now the highest value paper we produce. We will continue and extend its rollout in the current quarter and beyond, with a particular focus on the commercial printing segment.
| CATALYST PAPER 2013 FIRST QUARTER REPORT │ PRESIDENT’S MESSAGE | 1 |
Looking Ahead
The outlook for global growth has improved in light of modest recovery in China and the United States during the first quarter. The Canadian dollar is also expected to weaken slightly going forward.
Further demand decline for coated mechanical grades is expected while a slight increase in uncoated demand in the second quarter is possible. However, the restart of uncoated capacity in late 2012 could put downward pressure on operating rates. Price improvement for specialty paper is not expected until later in the third quarter. The demand and price outlook is weak for newsprint, while NBSK markets are expected to strengthen modestly.
With the elimination of the harmonized sales tax implemented in 2010 and a return to the provincial sales tax on April 1, we cannot recover taxes paid on business inputs. This is expected to add direct annualized costs of approximately $12 million, most of which relates to electricity purchases. British Columbia is an outlier in applying provincial sales tax to industrial electricity purchases, and we are advocating for policy change on this matter.
As previously announced, I will be stepping down as president and CEO at the end of June. With the restructuring complete, it is a logical time for succession, and I am looking forward to returning to my home and family in New York State. The board has initiated a search for a successor.
It has been tremendously rewarding to lead this organization over the last three years. I am grateful for the support of employees, investors, customers, senior management, communities, unions and countless other stakeholders. Catalyst is guided by a robust operating philosophy, and I am confident the company will continue to adapt and leverage its unique competitive strengths, and to navigate a steady course through the ongoing paper industry transformation.
 | |
| Kevin J. Clarke | |
| President and Chief Executive Officer | |
| 2 | CATALYST PAPER 2013 FIRST QUARTER REPORT │ PRESIDENT’S MESSAGE |

catalyst paper corporation
MANAGEMENT’S DISCUSSION AND ANALYSIS
| CATALYST PAPER 2013 FIRST QUARTER REPORT │ MANAGEMENT’S DISCUSSION AND ANALYSIS | 3 |
| MANAGEMENT’S DISCUSSION AND ANALYSIS | 5 |
| | |
| 1 | | Overview and highlights | 7 |
| | | | |
| 2 | | Segmented results | 13 |
| | | | |
| 3 | | Liquidity and capital resources | 19 |
| | | | |
| 4 | | Contingent liabilities | 21 |
| | | | |
| 5 | | Summary of quarterly results | 22 |
| | | | |
| 6 | | Non-GAAP measures | 22 |
| | | | |
| 7 | | Critical accounting policies and estimates | 24 |
| | | | |
| 8 | | Changes in accounting policies | 25 |
| | | | |
| 9 | | Impact of accounting pronouncements affecting future periods | 25 |
| | | | |
| 10 | | Risks and uncertainties | 25 |
| | | | |
| 11 | | Sensitivity analysis | 26 |
| | | | |
| 12 | | Outlook | 26 |
| | | | |
| 13 | | Disclosure controls and internal control over financial reporting | 27 |
| | | | |
| CONSOLIDATED FINANCIAL STATEMENTS | 28 |
| 4 | CATALYST PAPER 2013 FIRST QUARTER REPORT │ MANAGEMENT’S DISCUSSION AND ANALYSIS |
MANAGEMENT’S DISCUSSION AND ANALYSIS
The following management’s discussion and analysis (MD&A) of Catalyst Paper Corporation (the company, we, us, and our) should be read in conjunction with our interim consolidated financial statements for the three month periods ended March 31, 2013 and March 31, 2012 and our audited annual consolidated financial statements for the year ended December 31, 2012 and the notes thereto, which have been prepared in accordance with generally accepted accounting principles (GAAP) in the United States (U.S.). Additional information about the company, including our most recent Annual Information Form is available on our website atwww.catalystpaper.com, or the Canadian Securities Administrator’s electronic filing website atwww.sedar.com.
Throughout this discussion, references are made to certain measures that are not measures of performance under U.S. GAAP, including operating earnings, adjusted EBITDA, adjusted EBITDA before restructuring costs, average delivered cash costs per tonne before specific items, net earnings (loss) attributable to the company before specific items, net earnings (loss) per share attributable to the company’s common shareholders before specific items, and free cash flow. We believe that these non-GAAP measures are useful in evaluating our performance. These non-GAAP measures are defined and reconciled to their nearest GAAP measure in section 6, Non-GAAP measures.
In this MD&A, unless otherwise indicated, all dollar amounts are expressed in Canadian dollars. The term “dollars” and the symbols “$” and “CDN$” refer to Canadian dollars and the term “U.S. dollars” and the symbol “US$” refer to United States dollars.
In this MD&A, the term “tonne” and the symbol “MT” refer to a metric tonne and the term “ton” or the symbol “ST” refer to a short ton, a measure of weight equal to 0.9072 metric tonne. Use of these symbols is in accordance with industry practice.
The information in this report is as of May 6, 2013 which is the date of filing in conjunction with our press release announcing our results for the first quarter of 2013. Disclosure contained in this document is current to May 6, 2013 unless otherwise stated.
| CATALYST PAPER 2013 FIRST QUARTER REPORT │ MANAGEMENT’S DISCUSSION AND ANALYSIS | 5 |
CAUTIONARY STATEMENT REGARDING FORWARD-LOOKING STATEMENTS
Certain statements and information in this MD&A are not based on historical facts and constitute forward-looking statements or forward-looking information within the meaning of Canadian securities laws and the U.S. Private Securities Litigation Reform Act of 1995 (forward-looking statements), including but not limited to, statements about our strategy, plans, future operating performance, contingent liabilities and outlook.
Forward-looking statements:
| · | Are statements that address or discuss activities, events or developments that we expect or anticipate may occur in the future; |
| · | Can be identified by the use of words such as “believe”, “expect”, “anticipate”, “intend”, “plan”, “likely”, “predicts”, “estimates”, “forecasts”, and similar words or phrases or the negative of such words or phrases; |
| · | Reflect our current beliefs, intentions or expectations based on certain assumptions and estimates, including those identified below, which could prove to be significantly incorrect: |
| – | Our ability to develop, manufacture and sell new products and services that meet the needs of our customers and gain commercial acceptance; |
| – | Our ability to continue to sell our products and services in the expected quantities at the expected prices and expected times; |
| – | Our ability to successfully obtain cost savings from our cost reduction initiatives; |
| – | Our ability to implement business strategies and pursue opportunities; |
| – | Expected cost of goods sold; |
| – | Expected component supply costs and constraints; |
| – | Expected foreign exchange and tax rates. |
| · | While considered reasonable by management, are inherently subject to known and unknown risks and uncertainties and other factors that could cause actual results or events to differ from historical or anticipated results or events. These risk factors and others are discussed in the MD&A. Certain of these risks are: |
| – | The impact of general economic conditions in the countries in which we do business; |
| – | Conditions in the capital markets and our ability to obtain financing and refinance existing debt; |
| – | Market conditions and demand for our products (including declines in advertising and circulation); |
| – | The implementation of trade restrictions in jurisdictions where our products are marketed; |
| – | Fluctuations in foreign exchange or interest rates; |
| – | Raw material prices (including wood fibre, chemicals and energy); |
| – | The effect of, or change in, environmental and other governmental regulations; |
| – | Uncertainty relating to labour relations; |
| – | The availability of qualified personnel; |
| – | The effects of competition from domestic and foreign producers; |
| – | The risk of natural disaster and other factors many of which are beyond our control. |
As a result, no assurance can be given that any of the events or results anticipated by such forward-looking statements will occur or, if they do occur, what benefit they will have on our operations or financial condition. Readers are cautioned not to place undue reliance on these forward-looking statements. We disclaim any intention or obligation to update or revise any forward-looking statements, whether as a result of new information, future events or otherwise, except as required by law.
| 6 | CATALYST PAPER 2013 FIRST QUARTER REPORT │ MANAGEMENT’S DISCUSSION AND ANALYSIS |
| 1. | OVERVIEW AND HIGHLIGHTS |
BUSINESS OVERVIEW
We are the largest producer of mechanical printing papers in western North America. We also produce NBSK pulp which is marketed primarily in Asia. Our business is comprised of three business segments: specialty printing papers, newsprint, and pulp. Specialty printing papers include coated mechanical, uncoated mechanical, and directory paper. We are the only producer of coated mechanical paper and soft calender (SC) paper in western North America. We operate three paper mills in British Columbia (B.C.) in Crofton, Port Alberni, and Powell River. Our Crofton mill includes a two-line kraft pulp operation.
More information about our business segments, product profile and our geographic sales distribution is provided on pages 6 to 8 of our 2012 Annual Report. Our production capacity by mill and product line is summarized in the following chart:
| 2013 Capacity by Mill Location and Product Line1 |
| |
| | | Specialty printing papers1 | | | Newsprint1 | | | Pulp2 | | | Total | |
| Mill location | | | Number of
paper
machines | | | Uncoated
mechanical | | | Coated
mechanical | | | Directory | | | Newsprint | | | NBSK
pulp | | | | |
| Crofton, B.C.3 | | | 2 | | | | – | | | | – | | | | 57,000 | | | | 270,000 | | | | 350,000 | | | | 677,000 | |
| Port Alberni, B.C. | | | 2 | | | | – | | | | 224,000 | | | | 116,000 | | | | – | | | | – | | | | 340,000 | |
| Powell River, B.C. | | | 3 | | | | 469,000 | | | | – | | | | – | | | | – | | | | – | | | | 469,000 | |
| Total capacity (tonnes) | | | 7 | | | | 469,000 | | | | 224,000 | | | | 173,000 | | | | 270,000 | | | | 350,000 | | | | 1,486,000 | |
| % of total capacity | | | | | | | 32 | % | | | 15 | % | | | 12 | % | | | 18 | % | | | 23 | % | | | 100 | % |
| 1 | Capacities expressed in the above table can vary as we are able to switch production between products, particularly newsprint, directory and machine-finished uncoated grades. |
| 2 | Total pulp capacity at Crofton is 393,000 tonnes, of which 350,000 tonnes are designated as market pulp with the remainder 43,000 tonnes being consumed internally. |
| 3 | No. 1 paper machine at Crofton remains indefinitely curtailed. |
FIRST QUARTER OVERVIEW
Business Overview
Our results for the first quarter of 2013 showed an improvement to the previous quarter due to the positive impact of a weaker Canadian dollar and increased sales volumes and transaction prices for pulp as the Chinese economy continued to rebound. Transaction prices were down for all paper segments and sales volumes were lower for all specialty grades, partially offset by increased sales volumes for newsprint.
Cost reductions in the quarter included reduced maintenance spending, partially offset by increased labour spending and higher fibre cost. Labour spending increased partly due to higher statutory deductions in the first half of the year as well as a number of unforeseen maintenance events in the quarter.
Our net income for the quarter reflected a gain on the sale of the assets of the Snowflake facility and the shares of Apache Railway on January 30, 2013, and a gain on the sale of our interest in Powell River Energy Inc. and Powell River Energy Limited Partnership (Powell River Energy) on March 20, 2013.
| CATALYST PAPER 2013 FIRST QUARTER REPORT │ MANAGEMENT’S DISCUSSION AND ANALYSIS | 7 |
Financial Performance
We recorded a net loss attributable to the company of $9.8 million and a net loss attributable to the company before specific items of $11.6 million in Q1. This compared to a net loss of $35.2 million and $15.7 million, respectively, in Q4. Significant specific items in Q1 included reorganization costs related to finalizing the creditor protection proceedings, gains on the sale of the Snowflake mill and our interest in Powell River Energy and a foreign exchange loss on the translation of U.S. dollar denominated debt. Significant specific items in the prior quarter included reorganization costs, closure costs related to Snowflake, restructuring costs related to the Snowflake sales effort, and a foreign exchange loss on the translation of U.S. dollar denominated debt.
Adjusted EBITDA and adjusted EBITDA before restructuring costs was $11.2 million in Q1 compared to adjusted EBITDA and adjusted EBITDA before restructuring costs of $7.2 million in Q4. Refer to section 6,Non-GAAP measures, for additional information on specific items in the reported financial results.
SELECTED FINANCIAL INFORMATION
| | | 2013 | | | 2012 | |
| (In millions of Canadian dollars, except where otherwise stated) | | Q1 | | | Total | | | Q4 | | | Q3 | | | Q2 | | | Q1 | |
| Sales2 | | $ | 247.1 | | | $ | 1,058.2 | | | $ | 260.5 | | | $ | 265.7 | | | $ | 264.8 | | | $ | 267.2 | |
| Operating earnings (loss)2 | | | (1.2 | ) | | | 19.1 | | | | (5.7 | ) | | | 5.9 | | | | 9.3 | | | | 9.6 | |
| Depreciation and amortization2 | | | 12.4 | | | | 36.3 | | | | 12.9 | | | | 7.9 | | | | 7.7 | | | | 7.8 | |
| Adjusted EBITDA1, 2 | | | 11.2 | | | | 55.4 | | | | 7.2 | | | | 13.8 | | | | 17.0 | | | | 17.4 | |
| – before restructuring costs1, 2 | | | 11.2 | | | | 60.7 | | | | 7.2 | | | | 14.0 | | | | 16.9 | | | | 22.6 | |
| Net earnings (loss) attributable to the company | | | (9.8 | ) | | | 583.2 | | | | (35.2 | ) | | | 655.7 | | | | (11.7 | ) | | | (25.6 | ) |
| – before specific items1 | | | (11.6 | ) | | | (37.8 | ) | | | (15.7 | ) | | | (7.5 | ) | | | (5.0 | ) | | | (9.6 | ) |
| Adjusted EBITDA margin1, 2 | | | 4.5 | % | | | 5.2 | % | | | 2.8 | % | | | 5.2 | % | | | 6.4 | % | | | 6.5 | % |
| – before restructuring costs1, 2 | | | 4.5 | % | | | 5.7 | % | | | 2.8 | % | | | 5.3 | % | | | 6.4 | % | | | 8.5 | % |
| Net earnings (loss) per share attributable to the company’s common shareholders (in dollars) | | | | | | | | | | | | | | | | | | | | | | | | |
| – basic and diluted from continuing operations3 | | $ | (0.89 | ) | | $ | 41.65 | | | $ | (1.55 | ) | | $ | 1.73 | | | $ | (0.03 | ) | | $ | (0.07 | ) |
| – basic and diluted from discontinued operations3 | | | 0.21 | | | | (1.15 | ) | | | (0.89 | ) | | | (0.01 | ) | | | – | | | | – | |
| – before specific items1, 3 | | | (0.80 | ) | | | (2.62 | ) | | | (1.09 | ) | | | (0.02 | ) | | | (0.01 | ) | | | (0.03 | ) |
| | | | | | | | | | | | | | | | | | | | | | | | | |
| (In thousands of tonnes) | | | | | | | | | | | | | | | | | | | | | | | | |
| Sales2 | | | 329.6 | | | | 1,401.4 | | | | 347.6 | | | | 356.6 | | | | 346.4 | | | | 350.8 | |
| Production2 | | | 336.3 | | | | 1,388.6 | | | | 333.3 | | | | 353.4 | | | | 352.4 | | | | 349.5 | |
| | 1 | Refer to section 6, Non-GAAP measures. |
| | | 2 | Numbers exclude the Snowflake mill’s results from operations which have been reclassified as discontinued operations; earnings from discontinued operations, net of tax, are shown separately from continuing operations in the consolidated statements of earnings (loss) in our interim consolidated financial statements for the three months ended March 31, 2013. |
| 3 | Earnings per share data for periods ending on and subsequent to September 30, 2012 were based on our weighted average common shares issued pursuant to our reorganization under CCAA. Earnings per share data for periods prior to September 30, 2012 were based on our weighted average common shares outstanding prior to emergence from the CCAA proceedings. These shares were cancelled on September 13, 2012. |
| 8 | CATALYST PAPER 2013 FIRST QUARTER REPORT │ MANAGEMENT’S DISCUSSION AND ANALYSIS |
Market Overview
| * | Uncoated mechanical is comprised of high-gloss and standard grades. |
Overall, market conditions remained challenging in the first quarter of 2013. North American demand for our paper grades decreased from the first quarter of 2012, and inventory levels rose compared to Q4 2012. The decline in demand was most notable for newsprint at 10.2% and directory paper at 15.3%, while lightweight coated declined by 5.3% and demand for uncoated mechanical remained flat. Reduced demand and rising inventories resulted in weaker operating rates, with benchmark prices declining for all paper grades in the quarter.
NBSK pulp shipments declined 1.6% compared to the first quarter of 2012, but increased 5.1% compared to fourth quarter shipments. NBSK pulp benchmark prices for China continued to improve moderately in the first quarter of 2013.
Sale of Interest in Powell River Energy
On March 20, 2013 we completed the sale of our 50% interest in Powell River Energy for $33.0 million. Electricity generated by Powell River Energy will continue to be sold to the company under the existing power purchase agreement which expires in 2016 with extension to 2021 in one-year renewal term increments at the option of the company.
Approximately $12.7 million of the net proceeds of the sale were distributed to unsecured creditors who, pursuant to our restructuring under theCompanies’ Creditors Arrangement Act(CCAA), did not elect to receive shares in settlement of their claims.
On March 26, 2013 the company made an offer to purchase US$20.0 million of its floating rate senior secured notes due 2016 (Exit Notes) at par plus accrued and unpaid interest with the balance of the net proceeds. Noteholders representing US$15.6 million of Exit Notes accepted the offer. The offer expired on April 24, 2013 and the company completed its purchase of the US$15.6 million of Exit Notes on April 29, 2013. We are in discussions with certain bondholders of the remaining Exit Notes with a view to obtaining a waiver of the terms of the indenture governing the Exit Notes to permit the company to repurchase our PIK Toggle Senior Secured Notes due 2017 while Exit Notes are outstanding.
| CATALYST PAPER 2013 FIRST QUARTER REPORT │ MANAGEMENT’S DISCUSSION AND ANALYSIS | 9 |
Sale of Snowflake Mill
On January 30, 2013 we completed the U.S. Court approved sale of the assets of the Snowflake facility and the shares of Apache Railway to a third party for US$13.5 million and other non-monetary consideration. The sale process for the Snowflake mill and its associated assets was conducted in accordance with United States Court approved sale and investor solicitation procedures. The transaction was supported by the Town of Snowflake and various local interests.
Return to Provincial Sales Tax
On April 1, 2013 the Province of British Columbia reverted back to a provincial sales tax (PST) regime. We estimate that the additional direct annualized cost to our business will be approximately $12 million, based on actual 2012 expenditures. Approximately $8 million of this increase relates to purchased electric power.
Listing of New Common Shares
On January 7, 2013 our new common shares were listed on the Toronto Stock Exchange (TSX) under the symbol “CYT”. The company initiated a small shareholder selling program that commenced on January 7, 2013 and ended February 28, 2013 that gave shareholders who held 99 or fewer new common shares the opportunity to sell their shares without incurring commission charges. The program was entirely voluntary and no recommendations were made by the company or its Board of Directors in respect of the sale of shares pursuant to the program.
Resignation of President and Chief Executive Officer
President and Chief Executive Officer, Kevin J. Clarke, has advised that he will be leaving the company at the end of June 2013 to return to his home in New York State. A search for his successor is underway.
STRATEGY UPDATE
Our objective is to return to profitability and maximize cash flows by focusing on reducing manufacturing costs and optimizing our brands and customer base. Additional information related to our corporate strategy, including key performance drivers and indicators, can be found on pages 16 to 24 of our 2012 Annual Report.
2013 Key Objectives
The following is an update on our first quarter progress towards our 2013 key objectives:
Social:
| · | Significantly improve safety results reducing medical incidents by 50% and lost time injuries by 41% to achieve 2nd quartile or better industry ranking |
| – | Lost-time injury frequency of 1.82 improved from Q4 level of 1.87 but did not meet the target of 1.12. |
| – | Medical incident rate of 5.46 was up from 4.67 in Q4 2012 and significantly over the target of 2.18. |
| · | Establish Catalyst Paper as an employer-of-choice, and further strengthen linkages with training institutions and other recruitment-supporting initiatives |
| – | Implemented a 2013 profit-sharing program for full-time permanent employees excluding executives and EBITDA threshold of $70M. |
| – | Continued to expand employee engagement process with pilot leadership workshop for supervisors and survey of new employees to be introduced in Q2. |
| · | Continue to seek competitive business conditions in B.C. including reductions in hydro and taxation rates and work with municipalities to achieve joint cost-saving service and infrastructure agreements |
| – | Progressed in finalizing agreements-in-principle reached with Port Alberni in 2012 to sell the wastewater treatment facility for $5.8 million and with Powell River to transfer our interest in PRSC Land Development Ltd. for approximately $3.0 million. |
| 10 | CATALYST PAPER 2013 FIRST QUARTER REPORT │ MANAGEMENT’S DISCUSSION AND ANALYSIS |
Financial:
| · | Complete outstanding restructuring items and use proceeds of asset sales to pay down debt |
| – | Completed $33.0 million sale of interest in Powell River Energy and distributed $12.7 million to certain unsecured creditors to settle the last outstanding creditor claims pursuant to our plan of arrangement under the CCAA. |
| – | Initiated offer to purchase US$20.0 million of our Exit Notes with the balance of the net proceeds, as required under the terms of our US$35.0 million secured exit financing facility. |
| · | Reduce operating costs, and focus on generating positive free cash flow |
| – | Free cash flow for the quarter was negative $8.8 million. Liquidity increased by $42.9 million from Q4 2012 due to an increase in the borrowing base, a decrease in the amount drawn on the ABL Facility, and an increase in restricted cash, partially offset by a reduction in cash on hand. |
| – | Operating costs in the quarter were negatively impacted by an unforeseen maintenance event at the Crofton mill that resulted in lost production time and incremental maintenance expenditure on the mill’s no.3 paper machine. |
| – | Capital expenditures in the current quarter of $5.9 million were primarily invested in maintenance of business. |
| · | Complete special portability option program developed to deal with the salaried pension deficit |
| – | A portion of the plan assets of the salaried pension plan was redeemed from the plan’s existing asset categories and invested in liquid short-term investments based on the percentage of elections received from plan members. |
| – | Members who have elected to receive a one-time reduced lump-sum payment option as full settlement of their entitlements under the plan have until June 30, 2013 to revoke such elections in favour of continuing to receive monthly pension payments. |
Commercial:
| · | Expand geographic reach of Catalyst Paper into emerging world markets of Latin America and Asia |
| – | Launched Marathon Lite worldwide migrating 25% of newsprint volume to this new grade. |
| – | Grew market share in Latin America. |
| · | Gain market share and expand sales reach into new markets with new products |
| – | Increased coated market share. |
| · | Increase breadth of product range and solidify position as the most flexible and diverse producer and marketer of paper in the West |
| – | Launched Ascent, the newest addition to our coated product line. Ascent is a coated three paper, the highest value grade we now produce. |
| – | Continued to penetrate the higher value range of the machine-finished high bright market segment with our Electrastar Max, our highest bright, highest value uncoated grade. |
Environmental:
| · | Work with community stakeholders to identify and implement sustainable watershed management solutions |
| – | Discussions underway with community partners and conservation groups on design of three grassroots engagement programs. |
| · | Adhere to high international standards for transparency and reporting of performance on social, governance and environmental factors |
| – | 2012 sustainability report published coincident with annual financial report and review of current corporate responsibility programs begun. |
| · | Support revision of the B.C. Forest Stewardship Council standard to achieve increased access to FSC fibre |
| – | Industry working group formed to review FSC B.C. standard, implementation challenges and opportunities for streamlining. |
| CATALYST PAPER 2013 FIRST QUARTER REPORT │ MANAGEMENT’S DISCUSSION AND ANALYSIS | 11 |
CONSOLIDATED RESULTS OF OPERATIONS
Sales
Q1 2013 vs. Q4 2012
Sales revenues decreased by 5.1% as a result of lower transaction prices for all paper segments, and lower sales volumes of specialty papers. This was partly offset by the positive impact of a weaker Canadian dollar, higher sales volumes achieved for pulp and newsprint and higher transaction prices for pulp.
Q1 2013 vs. Q1 2012
Sales revenues decreased by 7.5% due to lower transaction prices for pulp and all paper segments except lightweight coated, and lower sales volumes for directory, uncoated mechanical and pulp, partially offset by the positive impact of a weaker Canadian dollar, higher transaction prices for lightweight coated and increased sales volumes for newsprint and lightweight coated.
Adjusted EBITDA and adjusted EBITDA before Restructuring Costs
The following table provides variances between periods for adjusted EBITDA and adjusted EBITDA before restructuring costs:
| (In millions of Canadian dollars) | | Q4 2012 | | | Q1 2012 | |
| Adjusted EBITDAin comparative period1 | | $ | 7.2 | | | $ | 17.4 | |
| Restructuring costs | | | – | | | | 5.2 | |
| Adjusted EBITDAbefore restructuring costs in comparative period1 | | | 7.2 | | | | 22.6 | |
| Paper prices | | | (1.7 | ) | | | (3.9 | ) |
| Pulp prices | | | 1.5 | | | | (1.5 | ) |
| Impact of Canadian dollar | | | 3.0 | | | | 1.3 | |
| Volume and mix | | | (2.1 | ) | | | (4.2 | ) |
| Distribution costs | | | (1.0 | ) | | | 0.1 | |
| Furnish mix and costs | | | (0.4 | ) | | | 5.1 | |
| Power and fuel costs | | | 0.5 | | | | (2.9 | ) |
| Labour costs | | | (2.1 | ) | | | 2.8 | |
| Maintenance costs | | | 6.1 | | | | (5.6 | ) |
| Selling, general and administrative | | | (0.6 | ) | | | 1.0 | |
| Lower of cost or market impact on inventory, net of inventory change | | | (0.5 | ) | | | (4.6 | ) |
| Other, net | | | 1.3 | | | | 1.0 | |
| Adjusted EBITDAbefore restructuring costs in the current period1 | | | 11.2 | | | | 11.2 | |
| Restructuring costs | | | – | | | | – | |
| Adjusted EBITDAin the current period1 | | $ | 11.2 | | | $ | 11.2 | |
| 1 | Refer to section 6,Non-GAAP measures. |
Operating Earnings (Loss)
Q1 2013 vs. Q4 2012
Operating earnings increased by $4.5 million due to higher adjusted EBITDA of $4.0 million and lower depreciation and amortization expense of $0.5 million.
Q1 2013 vs. Q1 2012
Operating earnings decreased by $10.8 million due to lower adjusted EBITDA of $6.2 million and higher depreciation and amortization expense of $4.6 million.
| 12 | CATALYST PAPER 2013 FIRST QUARTER REPORT │ MANAGEMENT’S DISCUSSION AND ANALYSIS |
Net Earnings (Loss) Attributable to the Company
Q1 2013 vs. Q4 2012
Net earnings attributable to the company increased by $25.4 million primarily due to higher after-tax operating earnings of $4.5 million, an after-tax gain on the sale of the Snowflake mill of $4.1 million, an after-tax gain on the sale of our interest in Powell River Energy of $5.3 million, and severance and other closure costs, net of tax, related to the Snowflake closure incurred in the prior quarter of $11.0 million.
Q1 2013 vs. Q1 2012
Net earnings attributable to the company increased by $15.8 million primarily due to after-tax gains on the sale of the Snowflake mill and our interest in Powell River Energy of $9.4 million, a decrease in after-tax interest expense of $9.5 million, and after-tax reorganization costs of $22.4 million incurred in Q1 2012, partially offset by lower after-tax operating earnings of $10.8 million, and an after-tax foreign exchange loss on translation of U.S. dollar denominated debt of $5.9 million compared to an after-tax gain of $11.6 million in Q1 2012.
SPECIALTY PRINTING PAPERS
| | | Three months
ended March 31, | |
| (In millions of Canadian dollars, except where otherwise stated) | | 20132 | | | 20122 | | | Change | |
| Sales | | $ | 149.6 | | | $ | 163.2 | | | $ | (13.6 | ) |
| Operating earnings (loss) | | | (2.9 | ) | | | 3.6 | | | | (6.5 | ) |
| Depreciation and amortization | | | 10.6 | | | | 6.3 | | | | 4.3 | |
| Adjusted EBITDA1 | | | 7.7 | | | | 9.9 | | | | (2.2 | ) |
| – before restructuring costs1 | | | 7.7 | | | | 12.7 | | | | (5.0 | ) |
| Adjusted EBITDA margin1 | | | 5.1 | % | | | 6.1 | % | | | (1.0 | )% |
| – before restructuring costs1 | | | 5.1 | % | | | 7.8 | % | | | (2.7 | )% |
| (In thousands of tonnes) | | | | | | | | | | | | |
| Sales | | | 180.0 | | | | 194.7 | | | | (14.7 | ) |
| Production | | | 185.3 | | | | 199.9 | | | | (14.6 | ) |
| 1 | Refer to section 6,Non-GAAP measures. |
| 2 | Numbers exclude the Snowflake mill’s results from operations which have been reclassified as discontinuing operations in the consolidated statements of earnings (loss) in the interim consolidated financial statements for the three months ended March 31, 2013. |
| CATALYST PAPER 2013 FIRST QUARTER REPORT │ MANAGEMENT’S DISCUSSION AND ANALYSIS | 13 |
Segment Overview
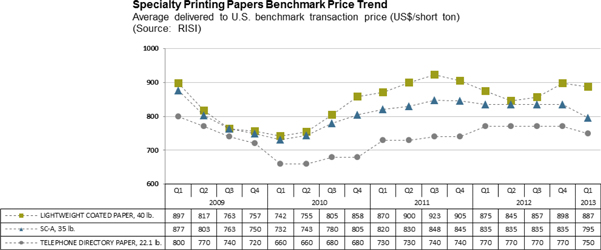
North American demand for coated mechanical decreased by 5.3% from the first quarter of 2012 due to reduced advertising pages in magazines and a decrease in catalogues being mailed out. Demand for uncoated mechanical remained flat. Uncoated mechanical demand was buoyed by increased demand for high-gloss grades as customers sought lower cost alternatives to coated mechanical. Operating rates were lower in the seasonally slower first quarter of 2013, and as a result, average benchmark prices for lightweight coated decreased 1.2% to US$887 per short ton, and for soft-calendered A grade (SC-A) decreased 4.8% to US$795 per short ton compared to the previous quarter.
North American directory demand fell 15.3% in Q1 compared to the prior year due to ongoing pressure to reduce or eliminate white pages, smaller books, lower circulation, and the continued migration from printed books to the Internet. The average Q1 directory benchmark price decreased 2.6% to US$750 per short ton compared to the previous quarter. Operating rates for directory paper remain strong despite declining demand due to continued capacity reduction in the directory marketplace.
Operational Performance
The following chart summarizes the operating performance of our specialty printing papers segment:
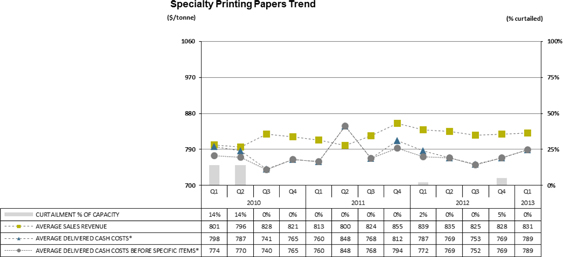
| * | Average delivered cash costs per tonne consist of cost of sales, excluding depreciation and amortization, and including the impact of SG&A and restructuring costs. Average delivered cash costs per tonne before specific items consist of cost of sales, excluding depreciation and amortization, and including the impact of SG&A, but excluding the impact of restructuring costs. |
Q1 2013 vs. Q1 2012
| · | Sales volume decreased by 14,700 tonnes due to lower sales volumes in directory and uncoated mechanical, partially offset by higher sales volumes in lightweight coated. |
| · | Average sales revenue decreased $8 per tonne due to lower average transaction prices for directory and uncoated mechanical, partially offset by higher average transaction prices for lightweight coated and the positive impact of a weaker Canadian dollar. |
| · | Average delivered cash costs remained flat, with increased maintenance spending and cost increases in coating and electric power offset by reduced labour and fibre cost and the incurrence of restructuring costs in Q1 2012. |
| 14 | CATALYST PAPER 2013 FIRST QUARTER REPORT │ MANAGEMENT’S DISCUSSION AND ANALYSIS |
Newsprint
| | | Three months
ended March 31, | |
| (In millions of Canadian dollars, except where otherwise stated) | | 20132 | | | 20122 | | | Change | |
| Sales | | $ | 46.6 | | | $ | 43.6 | | | $ | 3.0 | |
| Operating earnings (loss) | | | 0.7 | | | | 3.2 | | | | (2.5 | ) |
| Depreciation and amortization | | | 1.4 | | | | 1.0 | | | | 0.4 | |
| Adjusted EBITDA1 | | | 2.1 | | | | 4.2 | | | | (2.1 | ) |
| – before restructuring costs1 | | | 2.1 | | | | 5.0 | | | | (2.9 | ) |
| Adjusted EBITDA margin1 | | | 4.5 | % | | | 9.6 | % | | | (5.1 | )% |
| – before restructuring costs1 | | | 4.5 | % | | | 11.5 | % | | | (7.0 | )% |
| | | | | | | | | | | | | |
| (In thousands of tonnes) | | | | | | | | | | | | |
| Sales | | | 69.3 | | | | 63.0 | | | | 6.3 | |
| Production | | | 71.5 | | | | 64.1 | | | | 7.4 | |
| 1 | Refer to section 6,Non-GAAP measures. |
| 2 | Numbers exclude the Snowflake mill’s results from operations which have been reclassified as discontinuing operations in the consolidated statements of earnings (loss) in the interim consolidated financial statements for the three months ended March 31, 2013. |
| CATALYST PAPER 2013 FIRST QUARTER REPORT │ MANAGEMENT’S DISCUSSION AND ANALYSIS | 15 |
Segment Overview
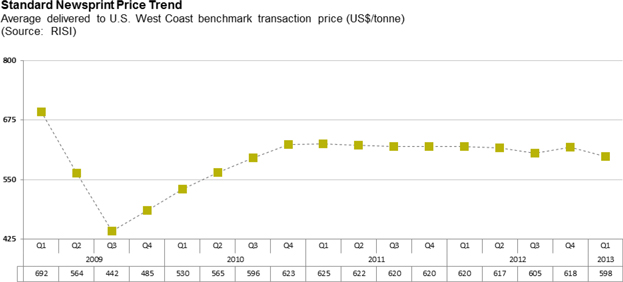
Total North American demand for newsprint was down 10.2% in Q1 year over year in part due to lower newspaper print advertising and declining circulation. Inventory levels were higher than the previous quarter and the average Q1 North American newsprint benchmark price declined 3.2% to US$598 per tonne compared to Q4 2012.
Operational Performance
The following chart summarizes the operating performance of our newsprint segment:
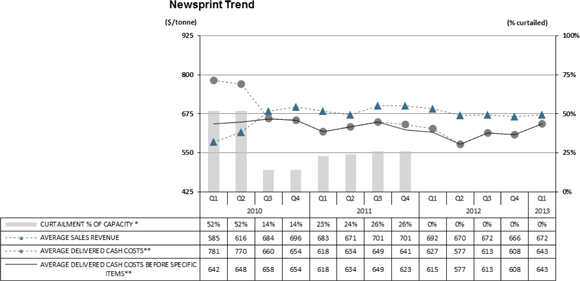
| * | Although C1 remains indefinitely curtailed it is not included in our 2013 capacity table. |
| ** | Average delivered cash costs per tonne consist of cost of sales, excluding depreciation and amortization, and including the impact of SG&A and restructuring costs. Average delivered cash costs per tonne before specific items consist of cost of sales, excluding depreciation and amortization, and including the impact of SG&A, but excluding the impact of restructuring costs. |
Q1 2013 vs. Q1 2012
| · | Sales volume increased by 6,300 tonnes primarily due to increased newsprint production which offset lower directory production in Q1 2013. Substantial customer interest in Marathon Lite, especially in Latin America, also contributed to newsprint growth. |
| · | Average sales revenue decreased $20 per tonne due to lower average transaction prices in the quarter partially offset by the positive impact of a weaker Canadian dollar. |
| · | Average delivered cash costs increased $16 per tonne due primarily to increases in maintenance, operating supplies and electric power cost, partly offset by the incurrence of restructuring costs in Q1 2012. |
| 16 | CATALYST PAPER 2013 FIRST QUARTER REPORT │ MANAGEMENT’S DISCUSSION AND ANALYSIS |
Pulp
| | | Three months
ended March 31, | |
| (In millions of Canadian dollars, except where otherwise stated) | | 20132 | | | 20122 | | | Change | |
| Sales | | $ | 50.9 | | | $ | 60.4 | | | $ | (9.5 | ) |
| Operating earnings (loss) | | | 1.0 | | | | 2.8 | | | | (1.8 | ) |
| Depreciation and amortization | | | 0.4 | | | | 0.5 | | | | (0.1 | ) |
| Adjusted EBITDA1 | | | 1.4 | | | | 3.3 | | | | (1.9 | ) |
| – before restructuring costs1 | | | 1.4 | | | | 4.9 | | | | (3.5 | ) |
| Adjusted EBITDA margin1 | | | 2.8 | % | | | 5.5 | % | | | (2.7 | )% |
| – before restructuring costs1 | | | 2.8 | % | | | 8.1 | % | | | (5.3 | )% |
| | | | | | | | | | | | | |
| (In thousands of tonnes) | | | | | | | | | | | | |
| Sales | | | 80.3 | | | | 93.1 | | | | (12.8 | ) |
| Production | | | 79.5 | | | | 85.5 | | | | (6.0 | ) |
| 1 | Refer to section 6,Non-GAAP measures. |
| 2 | Numbers exclude the Snowflake mill’s results from operations which have been reclassified as discontinuing operations in the consolidated statements of earnings (loss) in the interim consolidated financial statements for the three months ended March 31, 2013. |
Segment Overview
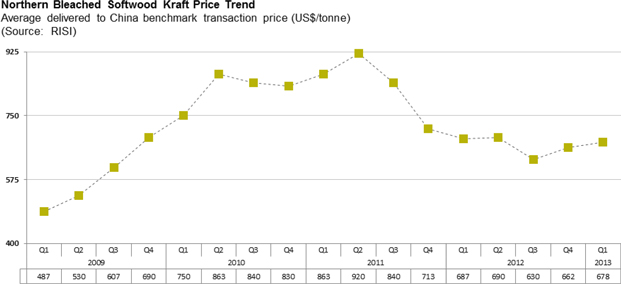
NBSK pulp markets continued to recover in the first quarter as demand improved in Western Europe and North America. Global NBSK demand slipped by 1.6% from a strong first quarter in 2012, but increased from fourth quarter shipments. The average NBSK benchmark pulp price for China increased 2.4% to US$678 per tonne compared to the previous quarter.
| CATALYST PAPER 2013 FIRST QUARTER REPORT │ MANAGEMENT’S DISCUSSION AND ANALYSIS | 17 |
Operational Performance
The following chart summarizes the operating performance of our pulp segment:
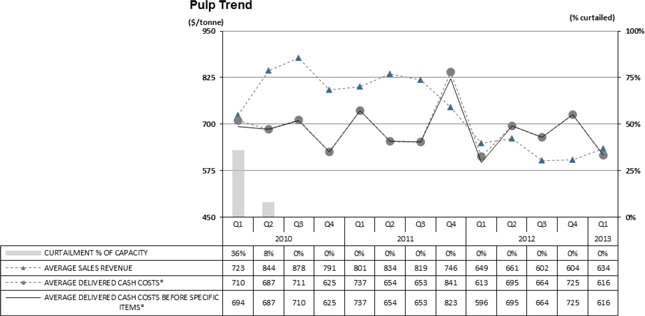
| * | Average delivered cash costs per tonne consist of cost of sales, excluding depreciation and amortization, and including the impact of SG&A and restructuring costs. Average delivered cash costs per tonne before specific items consist of cost of sales, excluding depreciation and amortization, and including the impact of SG&A, but excluding the impact of restructuring costs. |
Q1 2013 vs. Q1 2012
| · | Sales volume decreased by 12,800 tonnes compared to the same quarter last year partly due to the inclusion of an 8,000 tonne delayed shipment in Q1 2012 results and due to lower production in Q1 2013. |
| · | Average sales revenue decreased $15 per tonne due to lower average transaction prices in the current quarter partly offset by the positive impact of a weaker Canadian dollar. |
| · | Average delivered cash costs increased by $3 per tonne due to increased maintenance spending and an increase in the cost of chemicals, partly offset by a reduction in the cost of fibre and the incurrence of restructuring costs in Q1 2012. |
| 18 | CATALYST PAPER 2013 FIRST QUARTER REPORT │ MANAGEMENT’S DISCUSSION AND ANALYSIS |
| 3. | LIQUIDITY AND CAPITAL RESOURCES |
Selected Financial Information
| | | Three months
ended March 31, | |
| (In millions of Canadian dollars, except where otherwise stated) | | 2013 | | | 2012 | | | Change | |
| Cash flows provided (used) by operations before changes in non-cash working capital | | $ | (2.2 | ) | | $ | (0.2 | ) | | $ | (2.0 | ) |
| Changes in non-cash working capital | | | 1.0 | | | | (14.5 | ) | | | 15.5 | |
| Cash flows provided (used) by Operations | | | (1.2 | ) | | | (14.7 | ) | | | 13.5 | |
| Investing activities | | | 16.4 | | | | (17.0 | ) | | | 33.4 | |
| Financing activities | | | (19.6 | ) | | | 25.9 | | | | (45.5 | ) |
| Capital spending | | | 5.9 | | | | 1.9 | | | | 4.0 | |
| Depreciation and amortization | | | 12.4 | | | | 7.9 | | | | 4.5 | |
| Capital spending as % of depreciation and amortization | | | 48 | % | | | 24 | % | | | 24 | % |
| Net debt to net capitalization at March 311 | | | 73 | % | | | 375 | % | | | (302 | )% |
| 1 | Net debt ratio equals net debt (total debt less cash) divided by net capitalization (shareholder’s equity attributable to the company and total debt less cash). |
Refer to page 43 of our 2012 Annual Report for a discussion of the nature and sources of funding for our principal cash requirements.
Operating Activities
Cash flows from operating activities increased by $13.5 million in Q1 from the same quarter in the previous year, primarily due to a favourable change in non-cash working capital of $1.0 million compared to negative $14.5 million in Q1 2012 and a reduction in cash reorganization expense of $12.9 million, partially offset by reduced EBITDA of $6.2 million and an increase in cash interest of $7.3 million.
Investing Activities
Cash provided by investing activities was $16.4 million in Q1 compared to cash used of $17.0 million in the same quarter last year. This increase was largely due to proceeds from the sale of the Snowflake mill and our interest in Powell River Energy for $37.5 million, partially offset by an increase in capital additions of $4.0 million and an increase in restricted cash in the current quarter of $17.2 million compared to $15.2 million in Q1 2012.
Financing Activities
Cash used by financing activities in Q1 was $19.6 million compared to cash provided of $25.9 million in the same quarter last year. Cash used in the current quarter included net repayment on our ABL Facility of $19.3 million. Cash provided in Q1 2012 included a net draw on the company’s debtor-in-possession facility (DIP Facility) of $77.9 million, partially offset by repayment of our former ABL Facility of $48.0 million.
| CATALYST PAPER 2013 FIRST QUARTER REPORT │ MANAGEMENT’S DISCUSSION AND ANALYSIS | 19 |
Capital Resources
Availability on the ABL Facility and total liquidity is summarized in the following table:
| | | ABL Facility | | | ABL Facility | | | DIP Facility | |
| | | 2013 | | | 2012 | |
| (In millions of Canadian dollars) | | Q1 | | | Q4 | | | Q3 | | | Q2 | | | Q1 | |
| Borrowing base | | $ | 133.5 | 1 | | $ | 125.2 | | | $ | 164.0 | | | $ | 159.6 | | | $ | 142.1 | |
| Letters of credit | | | (22.1 | ) | | | (22.3 | ) | | | (17.8 | ) | | | (19.6 | ) | | | (17.8 | ) |
| Amount drawn, net | | | (4.7 | ) | | | (24.0 | ) | | | (64.0 | ) | | | (70.5 | ) | | | (77.8 | ) |
| Minimum excess availability | | | – | | | | – | | | | – | | | | (21.9 | )3 | | | – |
| Availability2 | | | 106.7 | | | | 78.9 | | | | 82.2 | | | | 47.6 | | | | 46.5 | |
| Cash on hand | | | 14.1 | | | | 18.5 | | | | 12.6 | | | | 17.8 | | | | 19.3 | |
| Restricted cash4 | | | 20.0 | | | | 0.5 | | | | 2.0 | | | | 6.4 | | | | 2.1 | |
| Total liquidity | | $ | 140.8 | | | $ | 97.9 | | | $ | 96.8 | | | $ | 71.8 | | | $ | 67.9 | |
| 1 | Borrowing base included reserves of $1.1 million for pension, $2.0 million for creditor insurance deductibles, $2.3 million for landlord waivers, $1.3 million for employee source deductions, $0.3 million related to WCB, and $0.2 million purchasing card reserve. |
| 2 | Our ABL Facility is subject to certain financial covenants as disclosed in our interim consolidated financial statements for the three months ended March 31, 2013 in note 14,Long-term debt. |
| 3 | The DIP Facility was subject to an excess availability condition. |
| 4 | Restricted cash consists of $20.0 million in cash held in trust related to the offer to purchase Exit Notes. |
We had restricted cash on March 31, 2013 of $20.2 million, which included $20.0 million held in trust in accordance with our debt indentures pursuant to our offer to purchase US$20.0 million Exit Notes, and $0.2 million cash collateral held against letters of credit.
Our total liquidity increased by $72.9 million from the same quarter last year primarily due to the sale of our interest in Powell River Energy and our Snowflake mill and improved vendor payment terms since emerging from creditor protection. A year-over-year reduction in the amount drawn on our ABL Facility and an increase in restricted cash was partially offset by a lower borrowing base, an increase in letters of credit and lower cash on hand. Liquidity increased by $42.9 million compared to the previous quarter, with an increase in borrowing base, a decrease in the amount drawn on the ABL Facility, and an increase in restricted cash, partially offset by a reduction in cash on hand. The borrowing base increased mostly due to an increase in inventories.
At March 31, 2013 the aggregate amount of future cash outflows were reduced to $474.2 million compared to $625.3 million at December 31, 2012 due to the de-recognition of our non-recourse debt of $113.8 million with the sale of our interest in Powell River Energy.
Payments due by period
| (In millions of dollars) | | 20132 | | | 2014 | | | 2015 | | | 2016 | | | 2017 | | | Thereafter | |
| Total debt, excluding capital lease obligations | | $ | ─ | | | $ | ─ | | | $ | ─ | | | $ | 35.5 | | | $ | 258.6 | | | $ | ─ | |
| Capital lease obligations | | | 0.7 | | | | 2.0 | | | | 0.5 | | | | 0.5 | | | | 2.3 | | | | 1.9 | |
| Operating leases | | | 5.8 | | | | 4.3 | | | | 1.7 | | | | 1.7 | | | | 1.6 | | | | 0.7 | |
| Interest payments on long-term debt1 | | | 32.3 | | | | 32.4 | | | | 32.3 | | | | 31.7 | | | | 27.7 | | | | ─ | |
| Other commitments | | | ─ | | | | ─ | | | | ─ | | | | ─ | | | | ─ | | | | ─ | |
| Total | | $ | 38.8 | | | $ | 38.7 | | | $ | 34.5 | | | $ | 69.4 | | | $ | 290.2 | | | $ | 2.6 | |
| 1 | Based on 11% cash interest on the 2017 Notes and no drawings on the ABL facility. |
| 2 | Future cash outflows from April 1, 2013 to December 31, 2013. |
At May 6, 2013 the company had 14,527,571 common shares issued and outstanding. Our common shares have no par value and an unlimited number of shares are authorized for future issuance.
| 20 | CATALYST PAPER 2013 FIRST QUARTER REPORT │ MANAGEMENT’S DISCUSSION AND ANALYSIS |
Financial Instruments
Our financial instruments consist primarily of cash and cash equivalents, accounts receivable, accounts payable and accrued liabilities, and long-term debt. Derivatives are used primarily to reduce exposure to currency risk on revenues, or occasionally debt, as well as price risk associated with revenue and energy costs.
For a description of the nature and extent of risk to the company from our financial instruments, as well as our respective accounting treatment of financial instruments, refer to our annual consolidated financial statements for the year ended December 31, 2012 note 30,Financial instruments. For the methods and assumptions we use to determine the fair value of financial instruments, refer to note 29,Fair value measurement, of those statements. Our methods and assumptions for determining the fair value of financial instruments have not changed materially since those used in the preparation of our consolidated financial statements for the year ended December 31, 2012.
At March 31, 2013 the company did not have any foreign currency or commodity contracts outstanding.
The following table reconciles the average spot exchange rate to our effective exchange rate:
US$/CDN$ FOREIGN EXCHANGE
| | | 2013 | | | 2012 | |
| | | Q1 | | | Q4 | | | Q3 | | | Q2 | | | Q1 | |
| Average Bank of Canada noon spot rate | | | 0.992 | | | | 1.009 | | | | 1.005 | | | | 0.990 | | | | 0.999 | |
| (Favourable)/unfavourable impact of derivatives designated as effective hedges for accounting purposes1 | | | – | | | | – | | | | – | | | | – | | | | – | |
| Average effective rate included in adjusted EBITDA | | | 0.992 | | | | 1.009 | | | | 1.005 | | | | 0.990 | | | | 0.999 | |
| (Favourable)/unfavourable impact of derivatives, other than those designated as effective hedges for accounting purposes, included in other expenses2 | | | – | | | | – | | | | – | | | | 0.001 | | | | 0.004 | |
| Foreign exchange (gain)/loss, on working capital balances, included in other expenses3 | | | (0.005 | ) | | | (0.002 | ) | | | 0.035 | | | | (0.017 | ) | | | 0.017 | |
| Average effective rate in net earnings/(loss) before income taxes4 | | | 0.987 | | | | 1.007 | | | | 1.040 | | | | 0.974 | | | | 1.020 | |
| (In millions of dollars) | | | | | | | | | | | | | | | | | | | | |
| 1 Favourable/(unfavourable) impact of derivatives designated as effective hedges for accounting purposes included in adjusted EBITDA | | $ | – | | | $ | – | | | $ | – | | | $ | – | | | $ | – | |
| 2 Favourable/(unfavourable) impact of derivatives other than those designated as effective hedges for accounting purposes included in other expenses | | | – | | | | – | | | | – | | | | (0.2 | ) | | | (1.0 | ) |
| 3 Foreign exchange gain/(loss) on working capital balances included in other expenses | | | 0.8 | | | | 0.4 | | | | (7.8 | ) | | | 3.9 | | | | (4.0 | ) |
| 4 Excludes foreign exchange gain/(loss) on long term debt and $US interest expense | | | | | | | | | | | | | | | | | | | | |
The company’s contingent liabilities at December 31, 2012 are described on page 47 of our 2012 Annual Report. We are not aware of any significant contingent liabilities outstanding as of May 6, 2013.
| CATALYST PAPER 2013 FIRST QUARTER REPORT │ MANAGEMENT’S DISCUSSION AND ANALYSIS | 21 |
| 5. | SUMMARY OF QUARTERLY RESULTS |
The following table highlights selected financial information for the eight consecutive quarters ending March 31, 2013:
| (In millions of Canadian dollars, | | 2013 | | | 2012 | | | 2011 | |
| except per share amounts) | | Q1 | | | Q4 | | | Q3 | | | Q2 | | | Q1 | | | Q4 | | | Q3 | | | Q2 | |
| Sales2 | | $ | 247.1 | | | $ | 260.5 | | | $ | 265.7 | | | $ | 264.8 | | | $ | 267.2 | | | $ | 272.2 | | | $ | 292.2 | | | $ | 257.4 | |
| Adjusted EBITDA1 2 | | | 11.2 | | | | 7.2 | | | | 13.8 | | | | 17.0 | | | | 17.4 | | | | 6.9 | | | | 30.2 | | | | 7.0 | |
| Net earnings (loss) attributable to the company | | | (9.8 | ) | | | (35.2 | ) | | | 655.7 | | | | (11.7 | ) | | | (25.6 | ) | | | (708.0 | ) | | | (205.7 | ) | | | (47.4 | ) |
| Net earnings (loss) per share attributable to the company’s common shareholders | | | | | | | | | | | | | | | | | | | | | | | | | | | | | | | | |
| – basic and diluted from continuing operations | | $ | (0.89 | ) | | $ | (1.55 | ) | | $ | 1.73 | | | $ | (0.03 | ) | | $ | (0.07 | ) | | $ | (1.81 | ) | | $ | (0.13 | ) | | $ | (0.08 | ) |
| – basic and diluted from discontinued operations | | | 0.21 | | | | (0.89 | ) | | | (0.01 | ) | | | – | | | | – | | | | (0.04 | ) | | | (0.41 | ) | | | (0.05 | ) |
| 1 | Refer to section 6,Non-GAAP measures. |
| 2 | Numbers exclude the Snowflake mill’s results from operations which have been reclassified as discontinued operations in the consolidated statements of earnings (loss) in the interim consolidated financial statements for the three months ended March 31, 2013. |
Refer to section 1,Overview and highlights, and the discussion onConsolidated results of operations,for details of Q1 2013 results compared to Q4 2012.
For summary financial information about Powell River Energy, a variable interest entity for which we were the primary beneficiary up to the sale of our interest on March 20, 2013 refer to note 5,Variable interest entities, of our interim consolidated financial statements for the three months ended March 31, 2013.
Management uses certain measures that are not defined by U.S. GAAP to evaluate our performance and, as a result, the measures as employed by management may not be comparable to similarly titled measures reported by other entities. These non-GAAP measures should not be considered by an investor as an alternative to their nearest respective GAAP measure. Our non-GAAP measures include operating earnings (loss), adjusted EBITDA (earnings before interest, taxes, depreciation and amortization, impairment and other closure costs, and before other non-operating income and expenses), adjusted EBITDA before restructuring costs, adjusted EBITDA margin, adjusted EBITDA margin before restructuring costs, average delivered cash costs per tonne before specific items, net earnings (loss) attributable to the company before specific items, net earnings (loss) per share attributable to the company’s common shareholders before specific items, and free cash flow.
Specific items are items that do not arise from the company’s day-to-day operating, investing and financing activities, or items that are subject to material volatility based on factors outside of management’s control. Specific items include: foreign exchange gain or loss on long-term debt; gain or loss on cancellation of long-term debt; asset-impairment and other closure costs; restructuring costs; unusual non-recurring items; and certain income tax adjustments.
ADjusted EBITDA and adjusted EBITDA before restructuring costs
Adjusted EBITDA as defined equates to operating earnings (loss) plus depreciation and amortization and impairment and other closure costs. Adjusted EBITDA margin and adjusted EBITDA margin before restructuring costs are defined as adjusted EBITDA and adjusted EBITDA before restructuring costs as a percentage of sales.
These measures enable comparison of consolidated and segment operating results between periods without regard to debt service, income taxes, capital expenditure requirements, and specific items. These measures are provided to improve comparability between periods by eliminating the impact of financing (interest) and accounting (depreciation) items on our results.
| 22 | CATALYST PAPER 2013 FIRST QUARTER REPORT │ MANAGEMENT’S DISCUSSION AND ANALYSIS |
Reconciliation to Net Earnings (Loss) Attributable to the Company:
| | | 2013 | | | 2012 | |
| (In millions of Canadian dollars) | | Q1 | | | Total | | | Q4 | | | Q3 | | | Q2 | | | Q1 | |
| Net earnings (loss) attributable to the company | | $ | (9.8 | ) | | $ | 583.2 | | | $ | (35.2 | ) | | $ | 655.7 | | | $ | (11.7 | ) | | $ | (25.6 | ) |
| Net earnings (loss) attributable to non-controlling interest | | | 0.3 | | | | 30.4 | | | | (1.5 | ) | | | 32.7 | | | | (0.6 | ) | | | (0.2 | ) |
| Net earnings (loss) | | | (9.5 | ) | | | 613.6 | | | | (36.7 | ) | | | 688.4 | | | | (12.3 | ) | | | (25.8 | ) |
| Depreciation and amortization1 | | | 12.4 | | | | 36.3 | | | | 12.9 | | | | 7.9 | | | | 7.7 | | | | 7.8 | |
| Foreign exchange (gain) loss on long-term debt1 | | | 5.9 | | | | (20.8 | ) | | | 3.2 | | | | (25.2 | ) | | | 12.8 | | | | (11.6 | ) |
| Other (income) expense1 | | | (6.8 | ) | | | 2.5 | | | | (0.1 | ) | | | 8.2 | | | | (10.4 | ) | | | 4.8 | |
| Interest expense, net1 | | | 11.1 | | | | 71.9 | | | | 11.6 | | | | 16.3 | | | | 23.4 | | | | 20.6 | |
| Income tax expense (recovery) 1 | | | – | | | | (0.9 | ) | | | 0.2 | | | | (1.6 | ) | | | 0.5 | | | | – | |
| Reorganization items, net1 | | | 1.2 | | | | (663.7 | ) | | | 3.2 | | | | (685.3 | ) | | | (4.0 | ) | | | 22.4 | |
| (Earnings) loss from discontinued operations net of tax | | | (3.1 | ) | | | 16.5 | | | | 12.9 | | | | 5.1 | | | | (0.7 | ) | | | (0.8 | ) |
| Adjusted EBITDA | | $ | 11.2 | | | $ | 55.4 | | | $ | 7.2 | | | $ | 13.8 | | | $ | 17.0 | | | $ | 17.4 | |
| Restructuring costs | | | | | | | | | | | | | | | | | | | | | | | | |
| Specialty printing papers | | | – | | | | 2.9 | | | | – | | | | 0.2 | | | | (0.1 | ) | | | 2.8 | |
| Newsprint | | | – | | | | 0.8 | | | | – | | | | – | | | | – | | | | 0.8 | |
| Pulp | | | – | | | | 1.6 | | | | – | | | | – | | | | – | | | | 1.6 | |
| Total restructuring costs | | | – | | | | 5.3 | | | | – | | | | 0.2 | | | | (0.1 | ) | | | 5.2 | |
| Adjusted EBITDA before restructuring costs | | $ | 11.2 | | | $ | 60.7 | | | $ | 7.2 | | | $ | 14.0 | | | $ | 16.9 | | | $ | 22.6 | |
| 1 | Numbers exclude the Snowflake mill’s results from operations which have been reclassified as discontinued operations in the consolidated statements of earnings (loss) in the interim consolidated financial statements for the three months ended March 31, 2013. |
Net Earnings (Loss) Attributable to the Company Before Specific Items
Specific items are defined previously, and the exclusion of such items from net earnings (loss) attributable to the company facilitates the comparison of financial results between periods.
Reconciliation to Net Earnings (Loss) Attributable to the Company:
| (In millions of Canadian dollars and after-taxes, | | 2013 | | | 2012 | |
| except where otherwise stated) | | Q1 | | | Total | | | Q4 | | | Q3 | | | Q2 | | | Q1 | |
| Net earnings (loss) attributable to the company | | $ | (9.8 | ) | | $ | 583.2 | | | $ | (35.2 | ) | | $ | 655.7 | | | $ | (11.7 | ) | | $ | (25.6 | ) |
| Specific items: | | | | | | | | | | | | | | | | | | | | | | | | |
| Foreign exchange loss (gain) on long-term debt | | | 5.9 | | | | (20.8 | ) | | | 3.2 | | | | (25.2 | ) | | | 12.8 | | | | (11.6 | ) |
| Impairment (recovery) and other closure costs1 | | | 0.2 | | | | 19.7 | | | | 11.0 | | | | 8.7 | | | | – | | | | – | |
| Restructuring costs1 | | | 0.4 | | | | 6.4 | | | | 1.1 | | | | 0.2 | | | | (0.1 | ) | | | 5.2 | |
| Reorganization items, net2 | | | 1.1 | | | | (667.5 | ) | | | 4.2 | | | | (688.1 | ) | | | (6.0 | ) | | | 22.4 | |
| Gain on sale of Snowflake mill1 | | | (4.1 | ) | | | – | | | | – | | | | – | | | | – | | | | – | |
| Gain on sale of interest in Powell River Energy | | | (5.3 | ) | | | – | | | | – | | | | – | | | | – | | | | – | |
| Fair market adjustment to non-controlling interest | | | – | | | | 41.2 | | | | – | | | | 41.2 | | | | – | | | | – | |
| Net earnings (loss) attributable to the company before specific items | | $ | (11.6 | ) | | $ | (37.8 | ) | | $ | (15.7 | ) | | $ | (7.5 | ) | | $ | (5.0 | ) | | $ | (9.6 | ) |
| Net earnings (loss) per share attributable to the company’s common shareholders in dollars: | | | | | | | | | | | | | | | | | | | | | | | | |
| As reported (continuing operations) | | $ | (0.89 | ) | | $ | 41.65 | | | $ | (1.55 | ) | | $ | 1.73 | | | $ | (0.03 | ) | | | (0.07 | ) |
| Before specific items | | | (0.80 | ) | | | (2.62 | ) | | | (1.09 | ) | | | (0.02 | ) | | | (0.01 | ) | | | (0.03 | ) |
| 1 | Included in discontinued operations, net of tax in the consolidated statements of earnings (loss) in the interim consolidated financial statements for the three months ended March 31, 2013. |
| 2 | Included $1.2 million reorganization expense included in continuing operations and $0.1 million reorganization credit included in discontinued operations in the interim consolidated financial statements for the three months ended March 31, 2013. |
| CATALYST PAPER 2013 FIRST QUARTER REPORT │ MANAGEMENT’S DISCUSSION AND ANALYSIS | 23 |
Free Cash Flow
Free cash flow excludes working capital and certain other sources and uses of cash, which are disclosed in the consolidated statements of cash flows. This measure allows us to assess our ability to generate funds to repay debt and assists in cash flow forecasting.
Reconciliation to Cash Provided by Operating Activities less Cash Used by Investing Activities:
| | | 2013 | | | 2012 | |
| (In millions of Canadian dollars) | | Q1 | | | Total | | | Q4 | | | Q3 | | | Q2 | | | Q1 | |
| Cash provided (used) by operating activities | | $ | (1.2 | ) | | $ | 8.1 | | | $ | 52.1 | | | $ | (21.1 | ) | | $ | (8.2 | ) | | $ | (14.7 | ) |
| Cash provided (used) by investing activities | | | 16.4 | | | | (9.6 | ) | | | (6.2 | ) | | | (0.6 | ) | | | 14.2 | | | | (17.0 | ) |
| Proceeds from the sale of property, plant and equipment and other assets | | | (38.3 | ) | | | (12.3 | ) | | | (0.8 | ) | | | (3.6 | ) | | | (7.4 | ) | | | (0.5 | ) |
| Other investing activities | | | (1.2 | ) | | | (3.7 | ) | | | – | | | | (0.5 | ) | | | (3.6 | ) | | | 0.4 | |
| Non-cash working capital changes except change in taxes and interest | | | (0.2 | ) | | | (31.8 | ) | | | (58.8 | ) | | | 5.9 | | | | 7.3 | | | | 13.8 | |
| Other | | | 15.7 | | | | 2.1 | | | | (10.1 | ) | | | 4.8 | | | | (7.1 | ) | | | 14.5 | |
| Free cash flow | | $ | (8.8 | ) | | $ | (47.2 | ) | | $ | (23.8 | ) | | $ | (15.1 | ) | | $ | (4.8 | ) | | $ | (3.5 | ) |
Management’s Calculation of Free Cash Flow:
| | | 2013 | | | 2012 | |
| (In millions of Canadian dollars) | | Q1 | | | Total | | | Q4 | | | Q3 | | | Q2 | | | Q1 | |
| Adjusted EBITDA | | $ | 11.2 | | | $ | 55.4 | | | $ | 7.2 | | | $ | 13.8 | | | $ | 17.0 | | | $ | 17.4 | |
| Interest expense, excluding amortization | | | (10.6 | ) | | | (22.7 | ) | | | (11.0 | ) | | | (4.7 | ) | | | (3.7 | ) | | | (3.3 | ) |
| Capital expenditures | | | (5.9 | ) | | | (22.6 | ) | | | (10.4 | ) | | | (7.3 | ) | | | (3.0 | ) | | | (1.9 | ) |
| Reorganization costs | | | (0.6 | ) | | | (37.5 | ) | | | (1.8 | ) | | | (12.7 | ) | | | (9.5 | ) | | | (13.5 | ) |
| Income taxes received (paid) | | | – | | | | 0.2 | | | | – | | | | 0.2 | | | | – | | | | – | |
| Employee future benefits, expense over (under) cash contributions1 | | | (1.9 | ) | | | (11.8 | ) | | | (3.4 | ) | | | (2.3 | ) | | | (3.2 | ) | | | (2.9 | ) |
| Net operating cash flow from discontinued operations | | | (1.0 | ) | | | (8.2 | ) | | | (4.4 | ) | | | (2.1 | ) | | | (2.4 | ) | | | 0.7 | |
| Free cash flow | | $ | (8.8 | ) | | $ | (47.2 | ) | | $ | (23.8 | ) | | $ | (15.1 | ) | | $ | (4.8 | ) | | $ | (3.5 | ) |
| 1 | Free cash flow is adjusted to reflect the cash impact of employee future benefits rather than the accounting expense which is included in adjusted EBITDA. |
| 7. | CRITICAL ACCOUNTING POLICIES AND ESTIMATES |
The preparation of financial statements in conformity with U.S. GAAP requires companies to establish accounting policies and to make estimates that affect both the amount and timing of recording of assets, liabilities, revenues and expenses. Some of these estimates require judgments about matters that are inherently uncertain and actual results could differ from estimates.
On an ongoing basis, we review our estimates based upon currently available information. The discussion on the accounting policies that require management's most difficult, subjective and complex judgments, and which are subject to a fair degree of measurement uncertainty can be found on pages 55 to 58 of the company's 2012 Annual Report.
Variable interest entities
On March 20, 2013 the company sold its 50.001% interest in Powell River Energy for proceeds of $33.0 million. Up to the date of sale, we consolidated 100% of Powell River Energy’s balances in our consolidated results as Powell River Energy was a variable interest entity in which the company was the primary beneficiary. The sale did not affect existing operating arrangements between the company and Powell River Energy, including the power purchase agreement, and we will continue to purchase 100% of the power generated by its two hydroelectric stations.
| 24 | CATALYST PAPER 2013 FIRST QUARTER REPORT │ MANAGEMENT’S DISCUSSION AND ANALYSIS |
The company is no longer the primary beneficiary of Powell River Energy subsequent to the sale of its equity interest and the settlement of its affiliate loans. Although the power purchase arrangement continues, we do not control Powell River Energy’s equity and Board of directors, and do not direct Powell River Energy’s activities and operations to ensure that the terms of the power purchase agreement are met.
Subsequent to the sale of our interest the power purchase agreement will be treated as an operating lease arrangement for accounting purposes. See note 3,Significant accounting policiesin our interim consolidated financial statements for the three months ended March 31, 2013 for a description of the lease determination.
The balances and accounts of Powell River Energy and the 50% included in non-controlling interest were therefore derecognized on the date of sale, a gain on sale was recognized in the consolidated statement of earnings (loss) for the difference between the net proceeds on sale after settlement of the affiliate loans and the book value of assets and liabilities derecognized, and future operating lease payments will be included in the consolidated statement of earnings (loss) as a component of energy cost.
| 8. | CHANGES IN ACCOUNTING POLICIES |
There were no new pronouncements issued by the FASB that impacted our consolidated financial statements in Q1 2013.
| 9. | IMPACT OF ACCOUNTING PRONOUNCEMENTS AFFECTING FUTURE PERIODS |
There were no new pronouncements issued by the FASB that may impact our consolidated financial statements for future periods.
| 10. | RISKS AND UNCERTAINTIES |
We face risks and uncertainties which fall into the general business areas of markets, international commodity prices, currency exchange rates, environmental issues, fibre supply, government regulation and policy, and for Canadian companies, trade barriers and potential impacts of aboriginal rights, including unresolved aboriginal land claims in B.C. In addition, our proceedings under the CCAA will have a direct impact on our business.
In order to address these risks and effectively manage them, we have developed a process for managing risk and the interrelationship between risks and our strategic plan. We provide regular updates to the Audit Committee, work with corporate and operational management to identify, measure, and prioritize the critical risks facing the company, and manage these risks by ensuring that they are adequately addressed through mitigating procedures where appropriate. The objectives of the risk-management function include developing a common framework for understanding what constitutes principal business risks, ensuring that risk management activities are aligned with business strategies, and providing an effective mechanism for governance in the area of risk management.
A description of our risks and uncertainties can be found on pages 59 to 65 of our 2012 Annual Report.
The following updates to risks and uncertainties under the headings “Increases in Energy Costs could have a Negative Impact on our Business” and “A Change in our Legal Control could be materially adverse” in our 2012 Annual Report are noted below:
Increases in energy costs could have a negative impact on our business
The rate increase effective April 1, 2012 was confirmed by the British Columbia Utilities Commission and was made up of a 3.9% rate increase together with a rate rider increase of 2.5%. A further 1.5% rate increase was approved commencing April 1, 2013. There remains a potential for further increases subject to rate review and approval by the British Columbia Utilities Commission.
| CATALYST PAPER 2013 FIRST QUARTER REPORT │ MANAGEMENT’S DISCUSSION AND ANALYSIS | 25 |
Our earnings are sensitive to fluctuations in product prices, foreign exchange, energy and fibre costs as described on pages 66 to 67 of our 2012 Annual Report and summarized in the following table:
| (In millions of Canadian dollars, except per share amounts) | | Adjusted
EBITDA1 | | | Net
Earnings2 | | | Earnings
per Share | |
| Product prices3 | | | | | | | | | | | | |
| A US$10 per tonne change in the sales price of: | | | | | | | | | | | | |
| Specialty printing papers | | $ | 7 | | | $ | 5 | | | $ | 0.37 | |
| Newsprint | | | 3 | | | | 2 | | | | 0.14 | |
| Pulp | | | 3 | | | | 2 | | | | 0.14 | |
| Foreign exchange4 | | | | | | | | | | | | |
| A US$0.01 change in the U.S. dollar relative to the Canadian dollar | | | 6 | | | | 4 | | | | 0.28 | |
| Energy cost sensitivity5 | | | | | | | | | | | | |
| A 5% change in the price of: | | | | | | | | | | | | |
| Natural gas and oil – direct purchases | | | 1 | | | | 1 | | | | 0.06 | |
| Electricity – direct purchases | | | 6 | | | | 4 | | | | 0.28 | |
| Freight cost sensitivity | | | | | | | | | | | | |
| A US$5/bbl change in the price of West Texas Int. (WTI) Oil | | | 3 | | | | 2 | | | | 0.14 | |
| Fibre sensitivity5 | | | | | | | | | | | | |
| A US$5 per unit change in the price of: | | | | | | | | | | | | |
| Wood chips (Bdt) | | | 8 | | | | 6 | | | | 0.42 | |
| 1 | Refer to section 6,Non-GAAP measures. |
| 2 | Based on an expected tax rate of 25%. |
| 3 | Based on annualized sales of Q1 2013 and foreign exchange rate of US$0.99. |
| 4 | Based on Q1 2013 annualized net cash flows and a movement to US$1.00 from US$0.99 and excluding our hedging program and the impact of the translation of U.S. dollar-denominated debt. |
| 5 | Based on Q1 2013 annualized consumption levels and an exchange rate of US$0.99. |
Economy
The U.S. economy improved in the first quarter of 2013, led by increased employment, strong stock market performance and a recovering housing market. Looking to the second quarter, the global economy is expected to continue to grow, led by economic growth in the U.S. and increased demand from China as their economy rebounds. A mix of a strengthening U.S. economy and a weakening Canadian economy may result in a weakening Canadian dollar.
Markets
Specialty printing paper markets are expected to remain challenging in the second quarter with the continued migration to electronic media. Demand for coated mechanical is expected to continue to decline while demand for uncoated mechanical is expected to increase slightly due to the restart of additional uncoated mechanical capacity in Q4, 2012. This additional capacity will lead to some grade switching from coated to uncoated mechanical. Operating rates for coated and uncoated mechanical are expected to decline unless the drop in demand is offset by additional mill closures and capacity reductions. Prices for coated mechanical grades will continue to be under pressure in the second quarter as a result of these lower operating rates before rebounding in the second half of the year. Price increases for uncoated mechanical high gloss grades ranging from $50-60 per ton effective July 1 have been announced. We expect these increases to be implemented throughout the third quarter. Demand for directory paper will continue to decline due to paper conservation moves by publishers and migration to electronic media.
Newsprint demand is expected to contract further due to declining circulation, page count reductions, conservation measures by publishers, and continued migration of information and advertising to the Internet. Additional newsprint capacity resulted in price weakness in the first quarter that is expected to continue in the second quarter.
| 26 | CATALYST PAPER 2013 FIRST QUARTER REPORT │ MANAGEMENT’S DISCUSSION AND ANALYSIS |
The NBSK market improvement in the first quarter is expected to continue into Q2 as the Chinese economy recovers from slower growth in 2012. Improved demand for pulp for woodfree paper and tissue are expected to increase demand and support higher prices for NBSK.
Operations
Price pressure for key inputs is expected to be marginal with the exception of power that will be impacted by the return of PST on April 1 and by expected rate increases from BC Hydro. Maintenance costs for the second quarter will be impacted by a total mill outage at Crofton in Q2 which will include a pulp outage.
The Crofton No. 1 machine will continue to be indefinitely curtailed in Q2.
Capital spending is expected to be approximately $25 million in 2013; however, capital will be managed to balance cash flow.
Liquidity, Debt Maturities and Covenants
We do not currently anticipate any significant uses of cash in Q2 other than for our operations, working capital fluctuations, interest payments, pension funding of the Salaried DB Plan, and the purchase of Exit Notes.
The implementation of PST on April 1, 2013 will result in an increase in annualized cost of approximately $12 million.
| 13. | DISCLOSURE CONTROLS AND INTERNAL CONTROL OVER FINANCIAL REPORTING |
A summary of our regulatory requirements for the evaluation of internal controls and subsequent reporting of the results of that evaluation can be found on page 69 of our 2012 Annual Report. Based on an evaluation of the design and operation of the company’s disclosure controls and procedures conducted under the supervision and with the participation of management, our chief executive officer and chief financial officer concluded that such disclosure controls and procedures (as defined in Canada under National Instrument 52-109 and in Rules 13a-15(e) and 15d-15(e) under theUnited States Securities Exchange Act of 1934), were effective as at December 31, 2012.
We did not make any significant changes in internal controls over financial reporting during the most recent three month period ended March 31, 2013 that have materially affected, or are reasonably likely to materially affect, our internal control over financial reporting. Management has limited the scope of the design and maintenance of adequate disclosure controls and procedures and internal control over financial reporting to exclude controls, policies and procedures of Powell River Energy, a variable interest entity in which we were the primary beneficiary up to the sale of our interest on March 20, 2013.
The company's Audit Committee, as part of its oversight role, has reviewed and recommended the approval of this MD&A to the Board of directors. The Board of directors has read and approved this MD&A.
| CATALYST PAPER 2013 FIRST QUARTER REPORT │ MANAGEMENT’S DISCUSSION AND ANALYSIS | 27 |
CONSOLIDATED BALANCE SHEETS
| | | Successor | |
| | | March 31, | | | December 31, | |
| (In millions of Canadian dollars) | | 2013 | | | 2012 | |
| | | (unaudited) | | | | |
| Assets | | | | | | | | |
| Current assets | | | | | | | | |
| Cash and cash equivalents | | $ | 14.1 | | | $ | 16.6 | |
| Restricted cash (note 7) | | | 20.2 | | | | 0.7 | |
| Accounts receivable (note 8) | | | 112.4 | | | | 114.0 | |
| Inventories (note 9) | | | 131.9 | | | | 125.0 | |
| Prepaids and other (note 10) | | | 6.0 | | | | 8.9 | |
| Assets held for sale (note 6) | | | 20.8 | | | | 34.3 | |
| | | | 305.4 | | | | 299.5 | |
| Property, plant and equipment (note 11) | | | 459.6 | | | | 611.6 | |
| Goodwill | | | 56.7 | | | | 56.7 | |
| Other assets (note 12) | | | 10.3 | | | | 11.0 | |
| | | $ | 832.0 | | | $ | 978.8 | |
| Liabilities | | | | | | | | |
| Current liabilities | | | | | | | | |
| Accounts payable and accrued liabilities (note 13) | | $ | 127.6 | | | $ | 113.8 | |
| Current portion of long-term debt (note 14) | | | 1.0 | | | | 6.6 | |
| Liabilities associated with assets held for sale (note 6) | | | – | | | | 15.2 | |
| | | | 128.6 | | | | 135.6 | |
| Long-term debt (note 14) | | | 300.2 | | | | 422.0 | |
| Employee future benefits (note 15) | | | 287.8 | | | | 289.7 | |
| Other long-term obligations | | | 8.9 | | | | 8.9 | |
| | | | 725.5 | | | | 856.2 | |
| Equity | | | | | | | | |
| Shareholders’ equity | | | | | | | | |
Common stock: no par value; unlimited shares authorized; issued
and outstanding: 14,527,571 shares
(December 31, 2012 – 14,527,571 shares) | | | 144.9 | | | | 144.9 | |
Preferred stock: par value determined at time of issue; authorized
100,000,000 shares; issued and outstanding: nil shares | | | – | | | | – | |
| Deficit | | | (45.0 | ) | | | (35.2 | ) |
| Accumulated other comprehensive income | | | 6.6 | | | | 6.6 | |
| | | | 106.5 | | | | 116.3 | |
| Non-controlling interest (note 5) | | | – | | | | 6.3 | |
| | | | 106.5 | | | | 122.6 | |
| | | $ | 832.0 | | | $ | 978.8 | |
Subsequent events (note 14)
The accompanying notes are an integral part of the consolidated financial statements.
On behalf of the Board: | |
|  |
| Kevin J. Clarke | Walter Jones |
| Director | Director |
| 28 | CATALYST PAPER 2013 FIRST QUARTER REPORT │ CONSOLIDATED FINANCIAL STATEMENTS |
CONSOLIDATED STATEMENTS OF LOSS
| | | Successor | | | Predecessor | |
| | | Three months
ended March 31, | | | Three months
ended March 31, | |
| (Unaudited and in millions of Canadian dollars, except where otherwise stated) | | 2013 | | | 2012 | |
| Sales | | $ | 247.1 | | | $ | 267.2 | |
| | | | | | | | | |
| Operating expenses | | | | | | | | |
| Cost of sales, excluding depreciation and amortization | | | 227.6 | | | | 235.3 | |
| Depreciation and amortization | | | 12.4 | | | | 7.8 | |
| Selling, general and administrative | | | 8.3 | | | | 9.3 | |
| Restructuring | | | – | | | | 5.2 | |
| | | | 248.3 | | | | 257.6 | |
| Operating earnings (loss) | | | (1.2 | ) | | | 9.6 | |
| Interest expense, net | | | (11.1 | ) | | | (20.6 | ) |
| Foreign exchange gain (loss) on long-term debt | | | (5.9 | ) | | | 11.6 | |
| Other income (expense), net (note 18) | | | 6.8 | | | | (4.8 | ) |
| Loss before reorganization items and income taxes | | | (11.4 | ) | | | (4.2 | ) |
| Reorganization items, net (note 4) | | | (1.2 | ) | | | (22.4 | ) |
| Loss before income taxes | | | (12.6 | ) | | | (26.6 | ) |
| Income tax expense (recovery) (note 19) | | | – | | | | – | |
| Loss from continuing operations | | | (12.6 | ) | | | (26.6 | ) |
| Earnings from discontinued operations net of tax (note 6) | | | 3.1 | | | | 0.8 | |
| Net loss | | | (9.5 | ) | | | (25.8 | ) |
| Net (earnings) loss attributable to non-controlling interest | | | (0.3 | ) | | | 0.2 | |
| Net loss attributable to the company | | $ | (9.8 | ) | | $ | (25.6 | ) |
| Basic and diluted net loss per share from continuing operations attributable to the company’s common shareholders (in dollars) | | $ | (0.89 | ) | | $ | (0.07 | ) |
| Basic and diluted net earnings per share from discontinued operations attributable to the company’s common shareholders (in dollars) | | | 0.21 | | | | – | |
| Weighted average number of company common shares outstanding (in millions) | | | 14.5 | | | | 381.9 | |
The accompanying notes are an integral part of the consolidated financial statements.
| CATALYST PAPER 2013 FIRST QUARTER REPORT │ CONSOLIDATED FINANCIAL STATEMENTS | 29 |
CONSOLIDATED STATEMENTS OF COMPREHENSIVE LOSS
| | | Successor | | | Predecessor | |
| | | Three months
ended March 31, | | | Three months
ended March 31, | |
| (Unaudited and in millions of Canadian dollars) | | 2013 | | | 2012 | |
| Net loss | | $ | (9.5 | ) | | $ | (25.8 | ) |
| Other comprehensive income (loss), net of tax (expense) recovery: | | | | | | | | |
| Reclassification of amortization of employee future benefits | | | | | | | | |
| Gross amount | | | – | | | | 1.3 | |
| Tax (expense) recovery | | | – | | | | (0.3 | ) |
| Net amount | | | – | | | | 1.0 | |
| Other comprehensive income from continuing operations, net of tax | | | – | | | | 1.0 | |
| Foreign currency translation adjustments, net of related hedging activities | | | | | | | | |
| Gross amount | | | – | | | | 2.2 | |
| Tax (expense) recovery | | | – | | | | – | |
| Net amount | | | – | | | | 2.2 | |
| Other comprehensive income from discontinued operations, net of tax | | | – | | | | 2.2 | |
| Total comprehensive loss | | | (9.5 | ) | | | (22.6 | ) |
| Comprehensive (income) loss attributable to non-controlling interest: | | | | | | | | |
| Net (income) loss | | | (0.3 | ) | | | 0.2 | |
| Other comprehensive income, net of taxes | | | – | | | | – | |
| Comprehensive (income) loss attributable to non-controlling interest | | | (0.3 | ) | | | 0.2 | |
| Comprehensive loss attributable to the company | | $ | (9.8 | ) | | $ | (22.4 | ) |
The accompanying notes are an integral part of the consolidated financial statements.
| 30 | CATALYST PAPER 2013 FIRST QUARTER REPORT │ CONSOLIDATED FINANCIAL STATEMENTS |
CONSOLIDATED STATEMENTS OF EQUITY (DEFICIENCY)
| | | Equity (Deficiency) attributable to the Company | | | | | | | |
| | | Common stock | | | | | | | | | | | | | | | | |
| (In millions of Canadian dollars) | | Number
of shares | | | $ | | | Additional
paid-in
capital | | | Deficit | | | Accumulated
other
comprehensive
income (loss) | | | Non-
controlling
interest
(deficit) | | | Total | |
| Balance as at December 31, 2011 (predecessor) | | | 381,900,450 | | | $ | 1,035.2 | | | $ | 16.6 | | | $ | (1,556.0 | ) | | $ | (89.4 | ) | | $ | (23.7 | ) | | $ | (617.3 | ) |
| Stock option compensation expense | | | – | | | | – | | | | 0.1 | | | | – | | | | – | | | | – | | | | 0.1 | |
| Net earnings | | | – | | | | – | | | | – | | | | 618.4 | | | | – | | | | 31.9 | | | | 650.3 | |
| Distributions to non-controlling interest | | | – | | | | – | | | | – | | | | – | | | | – | | | | (0.3 | ) | | | (0.3 | ) |
| Other comprehensive loss, net of tax | | | – | | | | – | | | | – | | | | – | | | | (24.7 | ) | | | – | | | | (24.7 | ) |
| Common shares issued | | | 14,400,000 | | | | 144.9 | | | | – | | | | – | | | | – | | | | – | | | | 144.9 | |
| Cancellation of Predecessor equity (deficiency) | | | (381,900,450 | ) | | | (1,035.2 | ) | | | (16.7 | ) | | | 937.6 | | | | 114.1 | | | | – | | | | (0.2 | ) |
| Balance as at September 30, 2012 (successor) | | | 14,400,000 | | | $ | 144.9 | | | $ | – | | | $ | – | | | $ | – | | | $ | 7.9 | | | $ | 152.8 | |
| Common shares issued | | | 127,571 | | | | – | | | | – | | | | – | | | | – | | | | – | | | | – | |
| Net loss | | | – | | | | – | | | | – | | | | (35.2 | ) | | | – | | | | (1.5 | ) | | | (36.7 | ) |
| Distributions to non-controlling interest | | | – | | | | – | | | | – | | | | – | | | | – | | | | (0.1 | ) | | | (0.1 | ) |
| Other comprehensive income, net of tax | | | – | | | | – | | | | – | | | | – | | | | 6.6 | | | | – | | | | 6.6 | |
| Balance as at December 31, 2012 (successor) | | | 14,527,571 | | | $ | 144.9 | | | $ | – | | | $ | (35.2 | ) | | $ | 6.6 | | | $ | 6.3 | | | $ | 122.6 | |
| Net earnings (loss) | | | – | | | | – | | | | – | | | | (9.8 | ) | | | – | | | | 0.3 | | | | (9.5 | ) |
| De-recognition of non-controlling interest (note 5) | | | – | | | | – | | | | – | | | | – | | | | – | | | | (6.6 | ) | | | (6.6 | ) |
| Balance as at March 31, 2013 (successor, unaudited) | | | 14,527,571 | | | $ | 144.9 | | | $ | – | | | $ | (45.0 | ) | | $ | 6.6 | | | $ | – | | | $ | 106.5 | |
The accompanying notes are an integral part of the consolidated financial statements.
| CATALYST PAPER 2013 FIRST QUARTER REPORT │ CONSOLIDATED FINANCIAL STATEMENTS | 31 |
CONSOLIDATED STATEMENTS OF CASH FLOWS
| | | Successor | | | Predecessor | |
| | | Three months
ended March 31, | | | Three months
ended March 31, | |
| (Unaudited and in millions of Canadian dollars) | | 2013 | | | 2012 | |
| Cash flows provided (used) by: | | | | | | | | |
| Operations | | | | | | | | |
| Net loss | | $ | (9.5 | ) | | $ | (25.8 | ) |
| Items not requiring (providing) cash | | | | | | | | |
| Depreciation and amortization | | | 12.4 | | | | 7.9 | |
| Deferred income taxes | | | – | | | | – | |
| Foreign exchange loss (gain) on long-term debt | | | 5.9 | | | | (11.6 | ) |
| Non-cash reorganization items | | | 0.5 | | | | 8.9 | |
| Non-cash interest on compromised notes | | | – | | | | 17.1 | |
| Employee future benefits, expense under cash contributions | | | (1.9 | ) | | | (2.9 | ) |
| Gain on disposal of property, plant and equipment | | | (0.7 | ) | | | (0.5 | ) |
| Gain on disposal of Snowflake mill and interest in Powell River Energy Inc. | | | (9.4 | ) | | | – | |
| Other | | | 0.5 | | | | 6.7 | |
| Changes in non-cash working capital | | | | | | | | |
| Accounts receivable | | | 0.6 | | | | (16.1 | ) |
| Inventories | | | (6.4 | ) | | | 9.6 | |
| Prepaids and other | | | 2.1 | | | | (1.5 | ) |
| Accounts payable and accrued liabilities | | | 4.7 | | | | (6.5 | ) |
| Cash flows used by operations | | | (1.2 | ) | | | (14.7 | ) |
| Investing | | | | | | | | |
| Additions to property, plant and equipment | | | (5.9 | ) | | | (1.9 | ) |
| Proceeds from sale of property, plant and equipment | | | 0.8 | | | | 0.5 | |
| Proceeds from sale of Snowflake mill and interest in Powell River Energy Inc. | | | 37.5 | | | | – | |
| Increase in restricted cash | | | (17.2 | ) | | | (15.2 | ) |
| Decrease (increase) in other assets | | | 1.2 | | | | (0.4 | ) |
| Cash flows provided (used) by investing activities | | | 16.4 | | | | (17.0 | ) |
| Financing | | | | | | | | |
| Decrease in revolving loan | | | (19.3 | ) | | | (48.0 | ) |
| Increase in debtor-in-possession (DIP) financing | | | – | | | | 77.9 | |
| DIP financing costs | | | – | | | | (3.7 | ) |
| Decrease in other long-term debt | | | (0.3 | ) | | | (0.3 | ) |
| Cash flows provided (used) by financing activities | | $ | (19.6 | ) | | $ | 25.9 | |
| Cash and cash equivalents, decrease in the period | | | (4.4 | ) | | | (5.8 | ) |
| Cash and cash equivalents, beginning of the period | | | 18.5 | | | | 25.1 | |
| Cash and cash equivalents, end of the period | | $ | 14.1 | | | $ | 19.3 | |
| Supplemental disclosures: | | | | | | | | |
| Income taxes paid | | $ | – | | | $ | – | |
| Net interest paid | | | 10.6 | | | | 3.3 | |
The accompanying notes are an integral part of the consolidated financial statements.
| 32 | CATALYST PAPER 2013 FIRST QUARTER REPORT │ CONSOLIDATED FINANCIAL STATEMENTS |
CONSOLIDATED BUSINESS SEGMENTS
(Unaudited and in millions of Canadian dollars)
Three months ended March 31, 2013
(successor) | | Specialty
Printing
Papers | | | Newsprint | | | Pulp | | | Corporate
Adjustments | | | Total | |
| Sales to external customers | | $ | 149.6 | | | $ | 46.6 | | | $ | 50.9 | | | $ | – | | | $ | 247.1 | |
| Inter-segment sales | | | – | | | | – | | | | 6.0 | | | | (6.0 | ) | | | – | |
| Depreciation and amortization | | | 10.6 | | | | 1.4 | | | | 0.4 | | | | – | | | | 12.4 | |
| Operating earnings (loss) | | | (2.9 | ) | | | 0.7 | | | | 1.0 | | | | – | | | | (1.2 | ) |
| Additions to property, plant and equipment | | | 4.1 | | | | 0.5 | | | | 1.3 | | | | – | | | | 5.9 | |
Three months ended March 31, 2012
(predecessor) | | Specialty
Printing
Papers | | | Newsprint | | | Pulp | | | Corporate
Adjustments | | | Total | |
| Sales to external customers | | $ | 163.2 | | | $ | 43.6 | | | $ | 60.4 | | | $ | – | | | $ | 267.2 | |
| Inter-segment sales | | | – | | | | – | | | | 7.9 | | | | (7.9 | ) | | | – | |
| Depreciation and amortization | | | 6.3 | | | | 1.0 | | | | 0.5 | | | | – | | | | 7.8 | |
| Operating earnings (loss) | | | 3.6 | | | | 3.2 | | | | 2.8 | | | | – | | | | 9.6 | |
| Additions to property, plant and equipment | | | 1.2 | | | | 0.2 | | | | 0.5 | | | | – | | | | 1.9 | |
The accompanying notes are an integral part of the consolidated financial statements.
| CATALYST PAPER 2013 FIRST QUARTER REPORT │ CONSOLIDATED FINANCIAL STATEMENTS | 33 |
NOTES TO CONSOLIDATED FINANCIAL STATEMENTS
(Unaudited and in millions of Canadian dollars, except where otherwise stated)
Table of Contents | |
| | | | |
| Note 1 | | Basis of Presentation | 35 |
| | | | |
| Note 2 | | Segmented Information | 35 |
| | | | |
| Note 3 | | Significant Accounting Policies | 36 |
| | | | |
| Note 4 | | Creditor Protection Proceedings Related Disclosures | 36 |
| | | | |
| Note 5 | | Variable Interest Entities | 37 |
| | | | |
| Note 6 | | Assets Held for Sale and Discontinued Operations | 39 |
| | | | |
| Note 7 | | Restricted Cash | 40 |
| | | | |
| Note 8 | | Accounts Receivable | 41 |
| | | | |
| Note 9 | | Inventories | 41 |
| | | | |
| Note 10 | | Prepaids and Other | 41 |
| | | | |
| Note 11 | | Property, Plant and Equipment | 42 |
| | | | |
| Note 12 | | Other Assets | 42 |
| | | | |
| Note 13 | | Accounts Payable and Accrued Liabilities | 42 |
| | | | |
| Note 14 | | Long-Term Debt | 43 |
| | | | |
| Note 15 | | Employee Future Benefits | 45 |
| | | | |
| Note 16 | | Restructuring | 46 |
| | | | |
| Note 17 | | Other Income (Expense), Net | 47 |
| | | | |
| Note 18 | | Income Taxes | 47 |
| | | | |
| Note 19 | | Fair Value Measurement | 47 |
| | | | |
| Note 20 | | Financial Instruments | 48 |
| | | | |
| Note 21 | | Comparative Figures | 48 |
| 34 | CATALYST PAPER 2013 FIRST QUARTER REPORT │ CONSOLIDATED FINANCIAL STATEMENTS |
NOTES TO CONSOLIDATED FINANCIAL STATEMENTS
(Unaudited and in millions of Canadian dollars, except where otherwise stated)
The consolidated financial statements include the accounts of Catalyst Paper Corporation and, from their respective dates of acquisition of control or formation, its wholly owned subsidiaries and partnerships (collectively, the company). All inter-company transactions and amounts have been eliminated on consolidation.
On March 20, 2013 the company disposed of its interest in Powell River Energy Inc. and Powell River Energy Limited Partnership (PREI). PREI is a variable interest entity (VIE), and prior to the disposal of its interest, the company’s consolidated financial statements included the accounts of PREI. See note 3,Significant accounting policies, for additional information on the sale of the company’s interest in PREI and the accounting treatment of future transactions between the company and PREI.
The accompanying unaudited interim consolidated financial statements have been prepared in accordance with United States generally accepted accounting principles (U.S. GAAP), on a basis consistent with those followed in the December 31, 2012 audited annual consolidated financial statements. These unaudited interim consolidated financial statements do not include all information and note disclosures required by U.S. GAAP for annual financial statements, and therefore should be read in conjunction with the December 31, 2012 audited consolidated financial statements and the notes thereto. In the opinion of the company, the unaudited interim consolidated financial statements contained herein contain all the information and note disclosures necessary to fairly present the results of the interim periods included. The results for the periods included herein may not be indicative of the results for the entire year.
Implementation of the plan of arrangement and the application of fresh start accounting on September 30, 2012 materially changed the carrying amounts and classifications reported in the company’s financial statements, and resulted in the company effectively becoming a new entity for financial reporting purposes. Accordingly, the company’s consolidated financial statements for periods prior to September 30, 2012 are not comparable to consolidated financial statements prepared for periods subsequent to September 30, 2012. References to Successor or Successor company refer to the company on or after September 30, 2012, and references to Predecessor or Predecessor company refer to the company prior to September 30, 2012.
The company is a significant specialty mechanical printing papers and newsprint producer in North America. The company operates in three business segments:
| Specialty printing papers | – | Manufacture and sale of mechanical specialty printing papers |
| Newsprint | – | Manufacture and sale of newsprint |
| Pulp | – | Manufacture and sale of long-fibre Northern Bleached Softwood Kraft (NBSK) pulp |
The company owns and operates three manufacturing facilities in the province of British Columbia (B.C.), Canada.
The primary market for the company’s paper products is North America. The primary markets for the company’s pulp products are China.
| CATALYST PAPER 2013 FIRST QUARTER REPORT │ CONSOLIDATED FINANCIAL STATEMENTS | 35 |
NOTES TO CONSOLIDATED FINANCIAL STATEMENTS
(Unaudited and in millions of Canadian dollars, except where otherwise stated)
| 3. | Significant accounting policies
|
Variable interest entities
On March 20, 2013 the company sold its 50.001% interest in PREI for proceeds of $33.0 million. Up to the date of sale, the company consolidated 100% of PREI’s balances in its consolidated results as PREI was a variable interest entity in which the company was the primary beneficiary. The sale did not affect existing operating arrangements between the company and PREI, including the power purchase agreement, and the company will continue to purchase 100% of the power generated by PREI.
The company is no longer the primary beneficiary of PREI subsequent to the sale of its equity interest and the settlement of its affiliate loans. Although the power purchase agreement continues, the company does not control PREI’s equity and Board of directors, and does not direct PREI’s activities and operations to ensure that the terms of the power purchase agreement are met.
Subsequent to the sale of the company’s interest the power purchase agreement meets the definition of a lease under U.S. GAAP. The arrangement meets the criteria of a lease as fulfillment of the power purchase agreement is dependent on identified land and depreciable assets, consisting of PREI’s integrated hydroelectric power generation, transmission and distribution system, and the power purchase agreement stipulates that the company buy 100% of the power output generated by these assets.
The lease was determined to be an operating lease, as opposed to a capital lease, and future operating lease payments will be recognized as a component of energy cost. The balances and accounts of PREI and the 50% included in non-controlling interest were derecognized on the date of sale, and a gain on sale was recognized for the difference between the net proceeds on sale after settlement of the affiliate loans and the book value of assets and liabilities derecognized.
Recently implemented accounting changes
There were no new pronouncements issued by the Financial Accounting Standards Board (FASB) that impacted the company’s consolidated financial statements in Q1 2013.
Changes in future accounting standards
There were no new pronouncements issued by the FASB that may materially impact the company’s consolidated financial statements for future periods.
| 4. | CredItOr Protection Proceedings RelateD Disclosures |
Reorganization items, net
The company successfully emerged from creditor protection proceedings under the Companies’ Creditors Arrangement Act (CCAA) on September 13, 2012. See pages 81 and 82 of the audited consolidated financial statements for the year ended December 31, 2012 for detailed information regarding the reorganization process and the company’s emergence from creditor protection proceedings.
Expenses (including professional fees), realized gains and losses, and provisions for losses resulting from reorganization activities are reported separately from ongoing operations of the business in the consolidated statement of earnings (loss) as reorganization items.
| 36 | CATALYST PAPER 2013 FIRST QUARTER REPORT │ CONSOLIDATED FINANCIAL STATEMENTS |
NOTES TO CONSOLIDATED FINANCIAL STATEMENTS
(Unaudited and in millions of Canadian dollars, except where otherwise stated)
The components of reorganization items, net on March 31, 2013 are as follows:
| | | Successor | | | Predecessor | |
| | | Three months
ended March 31, | | | Three months
ended March 31, | |
| | | 2013 | | | 2012 | |
| Professional fees1 | | $ | 0.6 | | | $ | 9.8 | |
| Loss due to plan of arrangement adjustments2 | | | 0.6 | | | | – | |
| DIP financing costs3 | | | – | | | | 3.7 | |
| Acceleration of ABL financing costs4 | | | – | | | | 3.3 | |
| Provision for repudiated lease contract5 | | | – | | | | 5.6 | |
| Reorganization items, net from continuing operations | | | 1.2 | | | | 22.4 | |
| Gain due to plan of arrangement adjustments | | | (0.1 | ) | | | – | |
| Reorganization items, net from discontinued operations | | | (0.1 | ) | | | – | |
| Total | | | 1.1 | | | | 22.4 | |
| 1 | Professional fees directly related to the creditor protection proceedings, ongoing monitoring and establishment of a reorganization plan, including legal, accounting and other professional fees. |
| 2 | Includes an adjustment to the final proceeds distributed to unsecured creditors who did not make an equity election of a portion of the $33.0 million proceeds received from the sale of PREI on March 20, 2013. |
| 3 | DIP financing costs incurred in connection with entering into the DIP Credit Agreement, including commitment fees. |
| 4 | Pursuant to the creditor protection proceedings the former ABL Facility was replaced by the DIP Credit Facility which resulted in the acceleration of the remaining deferred unamortized financing costs on the former ABL Facility. |
| 5 | The company repudiated on a lease contract at its paper recycling operation which was closed in 2010. |
The reorganization’s impact on cash flows as of March 31, 2013 was a $12.7 million distribution to certain unsecured creditors pursuant to the plan of arrangement under the CCAA. The distribution was made to unsecured creditors who did not make an equity election as full and final settlement of their claims under the creditor protection proceedings.
| 5. | Variable interest entities |
On March 20, 2013 the company sold its 50.001% interest in PREI and settled its $20.8 million affiliate loans to PREI for proceeds of $33.0 million. A $12.7 million distribution of the net proceeds was made to unsecured creditors pursuant to the plan of arrangement under the creditor protection proceedings (see note 4,Creditor protection proceedings related disclosures). PREI consists of an integrated hydroelectric power generating, transmission and distribution system which includes two hydroelectric stations in B.C. with installed capacity of 83 Megawatts. The company generally purchases 100% of the power generated by PREI and will continue to do so subsequent to the sale of its interest.
As detailed in note 3,Significant accounting policies, the company derecognized the accounts of PREI on the date of sale and recognized a gain on sale in the consolidated statement of loss. Prior to the sale, the company consolidated 100% of PREI as the company was the primary beneficiary.
| CATALYST PAPER 2013 FIRST QUARTER REPORT │ CONSOLIDATED FINANCIAL STATEMENTS | 37 |
NOTES TO CONSOLIDATED FINANCIAL STATEMENTS
(Unaudited and in millions of Canadian dollars, except where otherwise stated)
The results of PREI were included in the company’s consolidated results up to the date of sale of March 20, 2013. The condensed statements of earnings (loss) up to March 20, 2013 are as follows:
| | | Successor | | | Predecessor | |
| | | Period
ended March 20, | | | Three months ended
March 31, | |
| | | 2013 | | | 2012 | |
| Condensed statements of earnings (loss) | | | | | | | | |
| Sales – affiliate1 | | $ | 5.6 | | | $ | 5.3 | |
| Cost of sales, excluding depreciation and amortization | | | 1.3 | | | | 1.6 | |
| Depreciation and amortization | | | 1.6 | | | | 1.5 | |
| | | | 2.9 | | | | 3.1 | |
| Operating earnings | | | 2.7 | | | | 2.2 | |
| Interest expense | | | (1.8 | ) | | | (2.2 | ) |
| Interest expense – affiliate1 | | | (0.4 | ) | | | (0.6 | ) |
| Other expense, net | | | (0.1 | ) | | | - | |
| Income tax recovery | | | 0.2 | | | | 0.2 | |
| Net earnings (loss) | | | 0.6 | | | | (0.4 | ) |
| Other comprehensive income (loss) | | | – | | | | – | |
| Total comprehensive income (loss) 2 | | $ | 0.6 | | | $ | (0.4 | ) |
| 1 | Balances with Catalyst Paper Corporation. |
| 2 | 50% is included in the company’s non-controlling interest (deficit) balances. |
The company recognized a gain on the sale of its interest in PREI of $5.3 million consisting of:
| | | Gain on Sale | |
| Proceeds from sale | | | | |
| Gross proceeds from sale | | $ | 33.0 | |
| Closing costs incurred | | | (0.2 | ) |
| Settlement of affiliate loans | | | (20.8 | ) |
| Other adjustments | | | (0.1 | ) |
| Net proceeds | | | 11.9 | |
| De-recognition of assets | | | | |
| Cash and cash equivalents | | | (6.0 | ) |
| Other | | | (3.0 | ) |
| Property, plant and equipment | | | (145.6 | ) |
| De-recognition of liabilities | | | | |
| Accounts payable and accrued liabilities | | | 6.8 | |
| Long-term debt | | | 113.8 | |
| Long-term debt – affiliate loans | | | 20.8 | |
| De-recognition of non-controlling interest | | | 6.6 | |
| | | $ | 5.3 | |
| 38 | CATALYST PAPER 2013 FIRST QUARTER REPORT │ CONSOLIDATED FINANCIAL STATEMENTS |
NOTES TO CONSOLIDATED FINANCIAL STATEMENTS
(Unaudited and in millions of Canadian dollars, except where otherwise stated)
The company has identified one other potential VIE, but has not been able to obtain the financial information necessary to evaluate whether the entity is a VIE, or, if the entity is a VIE, whether the company is the primary beneficiary. The company has entered into a building lease agreement with this potential VIE whereby the company has agreed to continue making the prescribed lease payments directly to the financial institution holding the mortgage on the building in the event the lessor is no longer able to meet its contractual obligations. As at March 31, 2013 the principal amount of the mortgage was $2.5 million (December 31, 2012 - $3.0 million). This agreement does not increase the company’s liability beyond the obligation under the building lease.
| 6. | ASSETS HELD FOR SALE AND DISCONTINUED OPERATIONS |
Closure and sale of Snowflake Mill
On January 30, 2013 the company completed the U.S. Court approved sale of the assets of the Snowflake facility and the shares of Apache Railway to an acquisition vehicle organized by Hackman Capital and its affiliates for US$13.5 million and other non-monetary consideration. The assets of the Snowflake facility that were sold included approximately 19,000 acres of land, equipment and other assets associated with the paper mill. The mill, which is located in northeastern Arizona, was permanently shut on September 30, 2012 due to continued financial losses resulting from intense supply input and market pressures. The closure resulted in impairment and other closure costs of $19.9 million ($0.2 million for the three months ended March 31, 2013 and $19.7 million for the twelve months ended December 31, 2012) for, among other things, severance, environmental obligations, and inventory write-offs. Closure costs also included an estimated withdrawal liability of US$11.7 million due to the PACE Industry Union-Management Pension Fund, a multi-employer pension plan the company contributed to on behalf of hourly employees at the Snowflake mill. The results of the Snowflake mill up to the date of sale, including impairment and closure costs and the net gain on sale, were reported as a discontinued operation.
Other assets held for sale
The company has reached an agreement-in-principle to sell its 13.4 hectare wastewater treatment facility located at its Port Alberni mill along with 3.9 hectares of land combined with a road dedication for proceeds of $5.8 million. The company will settle the mortgage receivable from PRSC Limited Partnership and sell its interest in PRSC Land Developments Ltd. for proceeds of approximately $3.0 million. The company continues to actively market the site of its former Elk Falls operation and the remaining poplar plantation land. All of these assets and associated liabilities were reported as held for sale in the consolidated balance sheets as of March 31, 2013.
A summary of major classes of assets and liabilities classified as held for sale is as follows:
| | | Successor | |
| | | March 31,
2013 | | | December 31,
2012 | |
| Cash and cash equivalents | | $ | – | | | $ | 1.9 | |
| Restricted cash | | | – | | | | 2.3 | |
| Accounts receivable | | | – | | | | 0.5 | |
| Inventories | | | – | | | | 0.6 | |
| Property, plant and equipment | | | 18.0 | | | | 24.7 | |
| Other assets | | | 2.8 | | | | 4.3 | |
| Assets held for sale | | | 20.8 | | | | 34.3 | |
| Accounts payable and accrued liabilities | | | – | | | | 15.2 | |
| Liabilities associated with assets held for sale | | $ | – | | | $ | 15.2 | |
| CATALYST PAPER 2013 FIRST QUARTER REPORT │ CONSOLIDATED FINANCIAL STATEMENTS | 39 |
NOTES TO CONSOLIDATED FINANCIAL STATEMENTS
(Unaudited and in millions of Canadian dollars, except where otherwise stated)
The operations of the Snowflake mill were classified as a discontinued operation. A breakdown of earnings from discontinued operations, net of tax was as follows:
| | | Successor | | | Predecessor | |
| | | Three months
ended March 31, | | | Three months
ended March 31, | |
| | | 2013 | | | 2012 | |
| Sales | | $ | 0.7 | | | $ | 48.6 | |
| Cost of sales, excluding depreciation and amortization | | | (1.1 | ) | | | (47.9 | ) |
| Depreciation and amortization | | | – | | | | (0.1 | ) |
| Impairment, severances and other closure costs | | | (0.2 | ) | | | – | |
| Restructuring costs | | | (0.4 | ) | | | – | |
| Other income (expense), net | | | (0.1 | ) | | | 0.1 | |
| Gain on sale of assets of Snowflake and shares of Apache Railway | | | 4.1 | | | | – | |
| Reorganization items, net (note 4) | | | 0.1 | | | | – | |
| Income tax recovery | | | – | | | | 0.1 | |
| Earnings from discontinued operations, net of tax | | $ | 3.1 | | | $ | 0.8 | |
The company recognized a gain on the sale of the assets of Snowflake and the shares of Apache Railway of $4.1 million that consisted of:
| | | Gain on Sale | |
| Contract price | | $ | 13.5 | |
| Adjusted for: | | | | |
| Transaction fees related to sale | | | (0.4 | ) |
| Cancellation of letter of credit related to Arizona Department of Environmental Quality | | | (2.3 | ) |
| Net proceeds | | | 10.8 | |
| De-recognition of assets | | | | |
| Property, plant and equipment | | | (6.6 | ) |
| Other current assets (Apache Railway) | | | (0.2 | ) |
| De-recognition of liabilities | | | | |
| Accounts payable and accrued liabilities (Apache Railway) | | | 0.1 | |
| | | $ | 4.1 | |
Restricted cash included $20.0 million cash held in trust in accordance with our debt indentures pursuant to our offer to purchase US$20.0 million Exit Notes, and $0.2 million cash collateral held against letters of credit. Cash collateral is held at a rate of 105% of letters of credit.
| 40 | CATALYST PAPER 2013 FIRST QUARTER REPORT │ CONSOLIDATED FINANCIAL STATEMENTS |
NOTES TO CONSOLIDATED FINANCIAL STATEMENTS
(Unaudited and in millions of Canadian dollars, except where otherwise stated)
The components of accounts receivable were as follows:
| | | Successor | |
| | | March 31,
2013 | | | December 31,
2012 | |
| Trade receivables | | $ | 102.1 | | | $ | 94.7 | |
| Less allowance for doubtful accounts | | | (2.2 | ) | | | (2.2 | ) |
| Trade receivables, net | | | 99.9 | | | | 92.5 | |
| Sales taxes receivable | | | 5.9 | | | | 12.6 | |
| Other receivables | | | 6.6 | | | | 8.9 | |
| | | $ | 112.4 | | | $ | 114.0 | |
Accounts receivable are pledged as collateral against the long-term debt of the company. See note 14,Long-term debt, for detailed disclosure of the collateral arrangements of the company.
The components of inventories were as follows:
| | | Successor | |
| | | March 31,
2013 | | | December 31,
2012 | |
| Finished goods | | | | | | | | |
| Specialty printing papers | | $ | 26.3 | | | $ | 22.3 | |
| Newsprint | | | 9.1 | | | | 7.7 | |
| Pulp | | | 3.6 | | | | 3.9 | |
| Total finished goods | | | 39.0 | | | | 33.9 | |
| Work-in-progress | | | 1.0 | | | | 0.9 | |
| Raw materials – wood chips, pulp logs and other | | | 22.2 | | | | 23.1 | |
| Operating and maintenance supplies and spare parts | | | 69.7 | | | | 67.1 | |
| | | $ | 131.9 | | | $ | 125.0 | |
At March 31, 2013 the company had applied write-downs of $nil million to finished goods inventory (December 31, 2012 – $0.1 million) and $nil million to raw materials inventory (December 31, 2012 – $0.8 million).
Inventories are pledged as collateral against the long-term debt of the company. See note 14,Long-term debt, for detailed disclosure of the collateral arrangements of the company.
The components of prepaids and other were as follows:
| | | Successor | |
| | | March 31,
2013 | | | December 31,
2012 | |
| Property taxes, insurance and licenses | | $ | 2.7 | | | $ | 3.2 | |
| Other | | | 3.3 | | | | 5.7 | |
| | | $ | 6.0 | | | $ | 8.9 | |
| CATALYST PAPER 2013 FIRST QUARTER REPORT │ CONSOLIDATED FINANCIAL STATEMENTS | 41 |
NOTES TO CONSOLIDATED FINANCIAL STATEMENTS
(Unaudited and in millions of Canadian dollars, except where otherwise stated)
Prepaids and other assets are pledged as collateral against the long-term debt of the company. See note 14,Long-term debt, for detailed disclosure of the collateral arrangements of the company.
| 11. | PROPERTY, PLANT AND EQUIPMENT |
The components of property, plant and equipment were as follows:
| | | Successor | |
| | | March 31,
2013 | | | December 31,
2012 | |
| Cost | | $ | 481.3 | | | $ | 624.5 | |
| Accumulated depreciation, amortization and impairment | | | 21.7 | | | | 12.9 | |
| Net book value | | $ | 459.6 | | | $ | 611.6 | |
The company derecognized property, plant and equipment of PREI with a net carrying amount of $145.6 million on the sale of its interest in PREI on March 20, 2013 (note 5). These assets had a cost of $149.1 million and accumulated depreciation and amortization of $3.5 million on March 20, 2013. As discussed in note 3,Significant accounting policies, the company is no longer the primary beneficiary of this VIE subsequent to the date of sale, and therefore, will no longer consolidate PREI’s property, plant and equipment.
Property, plant and equipment are pledged as collateral against the long-term debt of the company. See note 14,Long-term debt, for detailed disclosure of the collateral arrangements of the company.
The components of other assets were as follows:
| | | Successor | |
| | | March 31,
2013 | | | December 31,
2012 | |
| Deferred financing costs | | $ | 7.9 | | | $ | 9.0 | |
| Deferred charges and other | | | 2.2 | | | | 1.8 | |
| Accrued benefit asset – pension plan (note 15) | | | 0.2 | | | | 0.2 | |
| | | $ | 10.3 | | | $ | 11.0 | |
Other assets are pledged as collateral against the long-term debt of the company. See note 14,Long-term debt, for detailed disclosure of the collateral arrangements of the company.
| 13. | Accounts payable and accrued liabilities |
The components of accounts payable and accrued liabilities were as follows:
| | | Successor | |
| | | March 31,
2013 | | | December 31,
2012 | |
| Trade payables | | $ | 52.9 | | | $ | 54.4 | |
| Accrued payroll and related liabilities | | | 34.7 | | | | 23.6 | |
| Accrued interest | | | 12.5 | | | | 11.7 | |
| Accrued benefit obligation – pension plan | | | 7.4 | | | | 7.4 | |
| Accrued benefit obligation – other employee future benefit plans | | | 5.8 | | | | 5.8 | |
| Property taxes | | | 3.2 | | | | – | |
| Restructuring (note 17) | | | 0.1 | | | | 0.3 | |
| Payables related to capital projects | | | 3.1 | | | | 3.9 | |
| Other | | | 7.9 | | | | 6.7 | |
| | | $ | 127.6 | | | $ | 113.8 | |
| 42 | CATALYST PAPER 2013 FIRST QUARTER REPORT │ CONSOLIDATED FINANCIAL STATEMENTS |
NOTES TO CONSOLIDATED FINANCIAL STATEMENTS
(Unaudited and in millions of Canadian dollars, except where otherwise stated)
| | | Successor | |
| Recourse | | March 31,
2013 | | | December 31,
2012 | |
| Floating rate senior secured notes, due September 2016 (US$35.0 million) | | $ | 34.7 | | | $ | 33.9 | |
| Senior secured notes, 11.0% due October 2017 (US$250.0 million) | | | 253.9 | | | | 248.7 | |
| | | | 288.6 | | | | 282.6 | |
| Revolving asset based loan facility of up to $175.0 million due July 2017 | | | 4.7 | | | | 24.0 | |
| Capital lease obligations | | | 7.9 | | | | 8.2 | |
| | | | 301.2 | | | | 314.8 | |
| Non-recourse | | | | | | | | |
| First mortgage bonds, 6.447% due July 2016 | | | – | | | | 95.0 | |
| Subordinated promissory notes | | | – | | | | 18.8 | |
| | | | – | | | | 113.8 | |
| Total debt | | | 301.2 | | | | 428.6 | |
| Less: Current portion | | | (1.0 | ) | | | (6.6 | ) |
| Total long-term debt | | $ | 300.2 | | | $ | 422.0 | |
The company derecognized its non-recourse debt, consisting of the first mortgage bonds and subordinated promissory notes owed by PREI, on the sale of its interest in PREI on March 20, 2013 (note 5). As discussed in note 3,Significant accounting policies,the company is no longer the primary beneficiary of this VIE subsequent to the date of sale, and therefore, will no longer consolidate PREI’s debt.
The company renewed certain master equipment leases for an additional ten years. This resulted in a reclassification in the quarter of the principal amount outstanding on its capital leases from current to long-term.
The company made an offer to purchase US$20.0 million of the floating rate senior secured notes (Floating Rate Notes) outstanding from the net proceeds that arose from the sale of its interest in PREI. The offer, which expired on April 24, 2013 was accepted by noteholders representing US$15.6 million of the Floating Rate Notes.
The indentures governing the company’s US$250.0 million senior secured notes (2017 Notes) and US$35.0 million Floating Rate Notes contain customary restrictive covenants, including restrictions on incurring additional indebtedness, certain restricted payments, including dividends and investments in other persons, the creation of liens, sale and leaseback transactions, certain amalgamations, mergers, consolidations and the use of proceeds arising from certain sales of assets and certain transactions with affiliates. Collateral provided on the 2017 Notes consists of a first charge on substantially all of the assets of the company, other than (i) a senior collateral charge on the Floating Rate Notes, and (ii) the ABL First Charge Collateral, as described below (2017 Notes First Charge Collateral), and a second charge on the senior collateral charge on the Floating Rate Notes and the ABL First Charge Collateral. The Floating Rate Notes are secured by a charge on the assets of the company that ranks senior to the lien securing the 2017 Notes (Floating Rate Notes First Charge Collateral). The indentures governing the Floating Rate Notes and 2017 Notes limit the ability of the company to incur debt, other thanpermitted debt, while the company cannot meet a fixed charge coverage ratio of 2.0:1. The company’s fixed charge coverage ratio under these indentures, calculated on a 12-month trailing average, was 0.6:1.0 at March 31, 2013.
The company cannot make any restricted payments, including paying any dividends, except to the extent the balance in its restricted payments basket is positive. The restricted payments basket under the 2017 Notes was negative $28.6 million as at March 31, 2013.
| CATALYST PAPER 2013 FIRST QUARTER REPORT │ CONSOLIDATED FINANCIAL STATEMENTS | 43 |
NOTES TO CONSOLIDATED FINANCIAL STATEMENTS
(Unaudited and in millions of Canadian dollars, except where otherwise stated)
Security for the $175.0 million ABL Facility consists of a first charge on accounts receivable, inventory and cash of the company (ABL First Charge Collateral) and a second charge of the 2017 Notes First Charge Collateral. Availability under the ABL Facility is determined by a borrowing base calculated primarily on eligible accounts receivable and eligible inventory, less certain reserves. The borrowing base at March 31, 2013, includes reserves for a landlord waiver reserve in respect of rent of approximately $2.3 million, a pension reserve not exceeding the sum of normal cost pension contributions, special and catch-up payments and any other payments in respect of a Canadian pension plan that are past due of approximately $1.1 million, a reserve for credit insurance deductibles of $2.0 million, a reserve of $1.3 million for employee source deductions, a reserve for workers compensation of $0.3 million and a $0.2 million purchasing card reserve. After deducting outstanding drawings of $4.7 million and outstanding letters of credit of $22.1 million, $106.7 million was available under the ABL Facility, before potential application of the springing fixed charge coverage ratio. The company also had an additional $14.1 million of cash on hand and $20.2 million in restricted cash on March 31, 2013.
At March 31, 2013 the company was in compliance with its covenants under the ABL Facility and under each of the indentures governing its outstanding senior notes.
At March 31, 2013 the company’s future debt repayments were reduced to $302.0 million compared to $429.5 million at December 31, 2012 largely due to the de-recognition of its non-recourse debt of $113.8 million with the sale of the company’s interest in PREI.
Scheduled total debt repayments:
| | | Recourse
debt | |
| 2013 (April 1 to December 31) | | $ | 0.7 | |
| 2014 | | | 2.0 | |
| 2015 | | | 0.5 | |
| 2016 | | | 36.0 | |
| 2017 | | | 260.9 | |
| Thereafter | | | 1.9 | |
| | | $ | 302.0 | |
The company’s long-term debt is recorded at amortized cost. The following table contains information about management’s best estimate of the fair value of the company’s debt:
| | | Successor | |
| | | March 31, 2013 | | | December 31, 2012 | |
| | | Carrying
Value | | | Fair
Value | | | Carrying
Value | | | Fair
Value | |
| Recourse | | $ | 301.2 | | | $ | 250.1 | | | $ | 314.8 | | | $ | 262.5 | |
| Non-recourse | | | – | | | | – | | | | 113.8 | | | | 113.8 | |
The fair value of the company’s long-term recourse debt related to its senior notes is determined based on quoted market prices of identical debt instruments. The fair value of the company’s recourse debt related to the ABL Facility is measured by discounting the respective cash flows at quoted market rates for similar debt having the same maturity. In measuring fair value, the company incorporates credit valuation adjustments to reflect its own non-performance risk, where applicable.
| 44 | CATALYST PAPER 2013 FIRST QUARTER REPORT │ CONSOLIDATED FINANCIAL STATEMENTS |
NOTES TO CONSOLIDATED FINANCIAL STATEMENTS
(Unaudited and in millions of Canadian dollars, except where otherwise stated)
| 15. | Employee future benefits |
The company maintains pension benefit plans for all salaried employees, which include defined benefit and defined contribution segments. Employees hired subsequent to January 1, 1994 enroll in the defined contribution segment. Effective January 1, 2010 employees in the defined benefit plan ceased to accrue benefits under the defined benefit segment of the plan and began to participate in the defined contribution segment of the plan. The company also maintains pension benefits for former hourly employees that are not covered by union pension plans. Unionized employees of the company are members of multi-employer industry-wide pension plans to which the company contributes a predetermined amount per hour worked by an employee.
The company provides other benefit plans consisting of provincial medical plan premiums, extended health care and dental benefits to employees. A description of recent changes to pension and other benefit plans can be found on pages 106 and 107 of the company’s 2012 Annual Report.
The company offered members of its defined benefit pension plan for salaried employees a one-time reduced lump-sum payment option as full settlement of their entitlements under the plan. Members had to make their elections by no later than December 15, 2012 and have until June 30, 2013 to revoke such elections in favour of continuing to receive retirement benefits in the form of a monthly pension. The company received elections for 42% of the total membership and 48% of the total solvency liability. A portion of the plan assets of the salaried pension plan was redeemed from the plan’s existing asset categories and invested in liquid short-term investments based on the percentage of elections received from plan members. The future impact of the portability election on the projected benefit obligations and fair value of plan assets of the company are impossible to estimate due to the revocation option.
For the three months ended March 31, 2013 the company incurred total post-retirement benefit costs of $5.0 million (three months ended March 31, 2012 – $7.4 million).
For the three months ended March 31, 2013 the company contributed $6.9 million (three months ended March 31, 2012 - $10.2 million) for employee future benefits which include cash contributed to the company’s funded pension plans, cash payments directly to beneficiaries for its unfunded benefit plans, cash contributions to its defined contribution plans and cash contributed to its multi-employer industry-wide pension plans.
Components of net periodic benefit cost recognized in the period were as follows:
| | | Successor | | | Predecessor | |
| | | Three months
ended March 31, | | | Three months
ended March 31, | |
| | | 2013 | | | 2012 | |
| Pension benefit plans | | | | | | | | |
| Defined benefit plan | | | | | | | | |
| Service cost for the period | | $ | 0.3 | | | $ | 0.3 | |
| Interest cost | | | 3.7 | | | | 4.1 | |
| Expected return on assets | | | (3.6 | ) | | | (3.7 | ) |
| Amortization of unrecognized items: | | | | | | | | |
| Actuarial losses | | | – | | | | 2.1 | |
| Prior service costs | | | – | | | | 0.1 | |
| | | | 0.4 | | | | 2.9 | |
| Defined contribution plan | | | | | | | | |
| Service cost for the period | | | 0.6 | | | | 0.9 | |
| Multi-employer industry-wide pension plan service cost for the period | | | 2.1 | | | | 2.4 | |
| Net periodic benefit cost for pension benefit plans | | $ | 3.1 | | | $ | 6.2 | |
| CATALYST PAPER 2013 FIRST QUARTER REPORT │ CONSOLIDATED FINANCIAL STATEMENTS | 45 |
NOTES TO CONSOLIDATED FINANCIAL STATEMENTS
(Unaudited and in millions of Canadian dollars, except where otherwise stated)
| | | Successor | | | Predecessor | |
| | | Three months
ended March 31, | | | Three months
ended March 31, | |
| | | 2013 | | | 2012 | |
| Other post-retirement benefit plans | | | | | | | | |
| Service cost for the period | | $ | 0.4 | | | $ | 0.3 | |
| Interest cost | | | 1.5 | | | | 1.8 | |
| Amortization of unrecognized items: | | | | | | | | |
| Actuarial losses | | | – | | | | – | |
| Prior service credits | | | – | | | | (0.9 | ) |
| Net periodic benefit cost for other benefit plans | | $ | 1.9 | | | $ | 1.2 | |
The following table provides the activity in the restructuring liability:
| | | Successor | |
| | | Three months
ended March 31, | | | Three months
ended December 31, | |
| | | 2013 | | | 2012 | |
| Balance, beginning of period | | $ | 0.9 | | | $ | 0.4 | |
| Expensed in period | | | 0.4 | | | | 1.1 | |
| Disbursements | | | (1.2 | ) | | | (0.6 | ) |
| Balance, end of period | | $ | 0.1 | | | $ | 0.9 | |
| Classification: | | | | | | | | |
| Accounts payable and accrued liabilities (note 13) | | $ | 0.1 | | | $ | 0.3 | |
| Liabilities associated with assets held for sale | | | – | | | | 0.6 | |
| | | $ | 0.1 | | | $ | 0.9 | |
The following table provides restructuring liability by year of initiative:
| | | Successor | |
| | | March 31, | | | December 31, | |
| | | 2013 | | | 2012 | |
| 2009 and prior initiatives | | $ | 0.1 | | | $ | 0.2 | |
| 2010 initiatives | | | – | | | | – | |
| 2011 initiatives | | | – | | | | – | |
| 2012 initiatives | | | – | | | | 0.7 | |
| | | $ | 0.1 | | | $ | 0.9 | |
During the three months ended March 31, 2013 the company recorded restructuring costs of $0.4 million related to legal and consulting fees incurred in respect of the sale of the Snowflake facility on January 30, 2013.
| 46 | CATALYST PAPER 2013 FIRST QUARTER REPORT │ CONSOLIDATED FINANCIAL STATEMENTS |
NOTES TO CONSOLIDATED FINANCIAL STATEMENTS
(Unaudited and in millions of Canadian dollars, except where otherwise stated)
| 17. | Other income (expense), net |
The components of other income (expense), net were as follows:
| | | Successor | | | Predecessor | |
| | | Three months
ended March 31, | | | Three months
ended March 31, | |
| | | 2013 | | | 2012 | |
| Loss on derivative financial instruments | | $ | – | | | $ | (1.0 | ) |
| Foreign exchange gain (loss) on working capital balances | | | 0.8 | | | | (4.0 | ) |
| Gain on disposal of property, plant and equipment | | | 0.7 | | | | 0.4 | |
| Gain on disposal of interest in PREI (note 5) | | | 5.3 | | | | – | |
| Other | | | – | | | | (0.2 | ) |
| | | $ | 6.8 | | | $ | (4.8 | ) |
As at March 31, 2013 the company has provided for a cumulative valuation allowance on its deferred tax assets of $231.2 million ($233.7 million at December 31, 2012). The effective rate for the quarter ended March 31, 2013 was 0%. The effective rate is less than the statutory rate primarily due to non-recognition of the tax benefit of the losses for the quarter. A description of the company’s income taxes can be found on pages 115 to 118 of the company’s 2012 Annual Report.
| 19. | Fair value measurement |
An established fair value hierarchy requires the company to maximize the use of observable inputs and minimize the use of unobservable inputs when measuring fair value. A financial instrument’s categorization within the fair value hierarchy is based upon the lowest level of input that is available and significant to the fair value measurement. There are three levels of inputs that may be used to measure fair value.
Level 1
Quoted prices in active markets for identical assets or liabilities.
Level 2
Observable inputs other than quoted prices in active markets for identical assets and liabilities, such as quoted prices for identical or similar assets or liabilities in markets that are not active, or other inputs that are observable or can be corroborated by observable market data for substantially the full term of the assets or liabilities.
Level 3
Inputs that are generally unobservable and are supported by little or no market activity and that are significant to the fair value determination of the assets or liabilities.
As at March 31, 2013 the company did not have any currency or commodity contracts which have been designated as hedging instruments.
The carrying value of the company’s other financial instruments, namely cash and cash equivalents, accounts receivable, accounts payable and accrued liabilities approximate their fair values because of the short-term maturity of these instruments.
| CATALYST PAPER 2013 FIRST QUARTER REPORT │ CONSOLIDATED FINANCIAL STATEMENTS | 47 |
NOTES TO CONSOLIDATED FINANCIAL STATEMENTS
(Unaudited and in millions of Canadian dollars, except where otherwise stated)
Financial Risk Management
Financial instruments of the company consist primarily of cash and cash equivalents, accounts receivable, accounts payable and accrued liabilities and long-term debt.
The company has exposure to risk from its financial instruments, specifically credit risk, market risk (including currency, price and interest rate risk) and liquidity risk. A summary of the company’s financial risk management objectives can be found on pages 125 to 127 of the company’s 2012 Annual Report.
The company is exposed to credit risk on accounts receivable from its customers who are mainly in the newspaper publishing and commercial printing businesses. Aging of receivables were as follows:
| | | Successor | |
| | | March 31,
2013 | | | December 31,
2012 | |
| Trade receivables | | | | | | | | |
| Current | | $ | 91.0 | | | $ | 86.3 | |
| Past due 1-30 days | | | 7.8 | | | | 7.3 | |
| Past due 31-90 days | | | 2.1 | | | | 0.2 | |
| Past due over 90 days | | | 1.2 | | | | 0.9 | |
| | | | 102.1 | | | | 94.7 | |
| Less allowance for doubtful accounts | | | (2.2 | ) | | | (2.2 | ) |
| Trade receivables, net | | $ | 99.9 | | | $ | 92.5 | |
The movement in the allowance for doubtful accounts in respect of trade receivables was as follows:
| | | Successor | |
| | | March 31,
2013 | | | December 31,
2012 | |
| Balance, beginning of period | | $ | 2.2 | | | $ | – | |
| Increase in provision | | | – | | | | 2.2 | |
| Balance, end of period | | $ | 2.2 | | | $ | 2.2 | |
Certain comparative figures presented in the interim consolidated financial statements have been reclassified to conform to the current period presentation.
| 48 | CATALYST PAPER 2013 FIRST QUARTER REPORT │ CONSOLIDATED FINANCIAL STATEMENTS |