PRESIDENT’S MESSAGE
Third quarter earnings reflect a significant improvement in operations led by pulp, with better machine productivity, less maintenance-related downtime at all mills and higher sales revenues compared to the second quarter and to the same period of the prior year. Net earnings for the quarter were $5.2 million ($0.36 per common share) and negative $3.5 million before specific items. This is a significant improvement from the prior quarter’s net loss of $28.0 million ($1.93 per common share) and negative $18.1 million before specific items.
Adjusted earnings before interest, taxes and depreciation (EBITDA) in the third quarter were $16.4 million. Free cash flow was positive in the quarter. Cash from operations increased by $8.1 million from the same period last year and liquidity was $128 million at quarter-end, significantly better than a year earlier due to asset sales and improved vendor payment terms.
Sales revenues of $268.8 million for the quarter were up from the prior quarter, reflecting higher paper sales volumes for directory and uncoated specialty grades. Higher transaction prices for directory and uncoated specialty products and the weaker Canadian dollar also had a positive impact on revenues.
Pulp sales volume was up nearly six thousand tonnes over the same quarter of 2012 and lower materials and maintenance expense drove a $62 per tonne improvement in average delivered cash costs.
In addition, several factors drove balance sheet improvements in Q3, including the partial settlement of the defined benefit pension plan for salaried employees, the foreign exchange gain on translation of U.S. dollar-denominated debt, and the sale of a surplus wastewater treatment facility and associated land in Port Alberni.
MARKET UPDATE
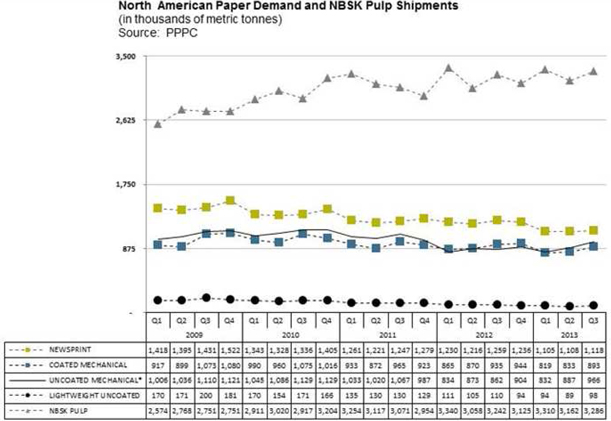
The latter half of the year is typically stronger with seasonal retail campaigns driving print demand; however, the secular decline in paper markets continued to be evident in the third quarter. Newsprint and directory were most heavily impacted, down 11.2% and 10.9% respectively compared to the prior year, while demand for coated mechanical was down 4.5%.
On a brighter note, demand for uncoated mechanical was up 12.1% compared to Q3 2012.
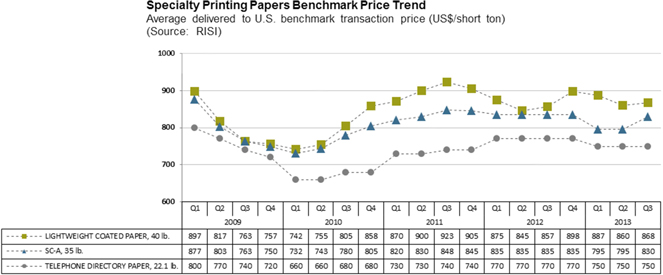
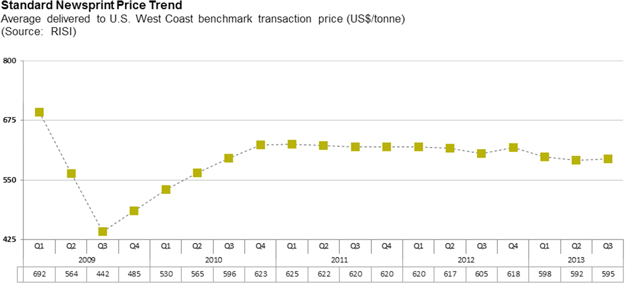
Benchmark paper prices were up slightly for all products, but directory which remained flat. Price increases of US$15 per tonne for newsprint and US$50 per short ton for uncoated soft-calendared (SC) paper announced in the quarter have been implemented.
On the pulp side, global NBSK demand was up 1.4% over the prior year and lower inventories led to a US$20 per tonne price increase for China in September.
Our sales and marketing focus continues to be on growing higher value niche specialty paper products. This includes Ascent, our coated three paper launched in Q2 which further expands Catalyst’s broad range of printing papers.
OUTLOOK
The global economy continued to grow in the third quarter, fueled by economic recovery in the Eurozone and a positive long-term economic outlook in North America. Government shutdowns during the quarter have tempered growth expectations for the United States and slower economic growth in Canada is expected to result in a weaker Canadian dollar in the fourth quarter.
Printing paper demand continues to be impacted by structural industry change, including the migration to electronic media and paper conservation measures by publishers. Weaker U.S. markets for coated specialty papers could result in pricing pressure through the end of this year. However uncoated mechanical demand is expected to support improved operating rates and price increases and strong export markets for newsprint are expected to keep newsprint pricing firm for the balance of the year.
The NBSK pulp market is expected to strengthen for the balance of the year with improved operating rates and lower producer inventories. Price increases in China of US$20 per tonne in September and US$30 per tonne in October have been implemented and a US$20 per tonne increase for November is expected to be fully realized by year end.
| CATALYST PAPER 2013 THIRD QUARTER REPORT │PRESIDENT’S MESSAGE | 1 |
Our maintenance spend will increase in the fourth quarter with the scheduled outage of the recovery boiler at our Crofton mill. The potential rise in energy rates in British Columbia in 2014 remains a concern for Catalyst and other energy-intensive industries and we are actively engaged in identifying economic impacts and solutions.
Inside the company, we are getting back to basics and are taking advantage of our deep sea port at Crofton to serve markets in Latin America and Asia, and our multi-modal distribution facility in the Lower Mainland to serve our home market of North America with capacity available to also handle third-party shipments.
Growth in Latin America and interest in North America is driving higher sales of Marathon Lite, our 40-gsm newsprint grade and it is expected to make up one-third of our newsprint business by year-end. Our recently launched coated three product, Ascent, and Sage, our environmentally focused offer, position Catalyst well to address the requirements of commercial printers, publishers and retail print advertisers.
Let me end this third quarter update by extending appreciation on behalf of my management team and the board of directors to our Chairman Les Lederer who provided executive oversight of the business on an interim basis prior to my appointment October 1st.
Operational excellence is our focus with safety, productivity and costs being our top priorities now and for the year ahead.

Joe Nemeth
President and Chief Executive Officer
| CATALYST PAPER 2013 THIRD QUARTER REPORT │PRESIDENT’S MESSAGE | 2 |

catalyst paper corporation
MANAGEMENT’S DISCUSSION AND ANALYSIS
| CATALYST PAPER 2013 THIRD QUARTER REPORT │MANAGEMENT’S DISCUSSION AND ANALYSIS | 3 |
| MANAGEMENT’S DISCUSSION AND ANALYSIS | 5 |
| | | |
| 1 | Overview and highlights | 7 |
| | | |
| 2 | Segmented results | 13 |
| | | |
| 3 | Liquidity and capital resources | 20 |
| | | |
| 4 | Contingent liabilities | 22 |
| | | |
| 5 | Summary of quarterly results | 23 |
| | | |
| 6 | Non-GAAP measures | 23 |
| | | |
| 7 | Critical accounting policies and estimates | 26 |
| | | |
| 8 | Changes in accounting policies | 27 |
| | | |
| 9 | Impact of accounting pronouncements affecting future periods | 27 |
| | | |
| 10 | Risks and uncertainties | 27 |
| | | |
| 11 | Sensitivity analysis | 28 |
| | | |
| 12 | Outlook | 29 |
| | | |
| 13 | Disclosure controls and internal control over financial reporting | 30 |
| | |
| CONSOLIDATED FINANCIAL STATEMENTS | 31 |
| CATALYST PAPER 2013 THIRD QUARTER REPORT │MANAGEMENT’S DISCUSSION AND ANALYSIS | 4 |
MANAGEMENT’S DISCUSSION AND ANALYSIS
The following management’s discussion and analysis (MD&A) of Catalyst Paper Corporation (the company, we, us, and our) should be read in conjunction with our interim consolidated financial statements for the nine month periods ended September 30, 2013 and September 30, 2012 and our audited annual consolidated financial statements for the year ended December 31, 2012 and the notes thereto, which have been prepared in accordance with generally accepted accounting principles (GAAP) in the United States (U.S.). Additional information about the company, including our most recent Annual Information Form is available on our website atwww.catalystpaper.com, or the Canadian Securities Administrator’s electronic filing website atwww.sedar.com.
Throughout this discussion, references are made to certain measures that are not measures of performance under U.S. GAAP, including operating earnings, adjusted EBITDA, adjusted EBITDA before restructuring costs, average delivered cash costs per tonne before specific items, net earnings (loss) attributable to the company before specific items, net earnings (loss) per share attributable to the company’s common shareholders before specific items, and free cash flow. We believe that these non-GAAP measures are useful in evaluating our performance. These non-GAAP measures are defined and reconciled to their nearest GAAP measure in section 6, Non-GAAP measures.
In this MD&A, unless otherwise indicated, all dollar amounts are expressed in Canadian dollars. The term “dollars” and the symbols “$” and “CDN$” refer to Canadian dollars and the term “U.S. dollars” and the symbol “US$” refer to United States dollars.
In this MD&A, the term “tonne” and the symbol “MT” refer to a metric tonne and the term “ton” or the symbol “ST” refer to a short ton, a measure of weight equal to 0.9072 metric tonne. Use of these symbols is in accordance with industry practice.
The information in this report is as of November 5, 2013 which is the date of filing in conjunction with our press release announcing our results for the third quarter of 2013. Disclosure contained in this document is current to November 5, 2013 unless otherwise stated.
| CATALYST PAPER 2013 THIRD QUARTER REPORT │MANAGEMENT’S DISCUSSION AND ANALYSIS | 5 |
CAUTIONARY STATEMENT REGARDING FORWARD-LOOKING STATEMENTS
Certain statements and information in this MD&A are not based on historical facts and constitute forward-looking statements or forward-looking information within the meaning of Canadian securities laws and the U.S. Private Securities Litigation Reform Act of 1995 (forward-looking statements), including but not limited to, statements about our strategy, plans, future operating performance, contingent liabilities and outlook.
Forward-looking statements:
| · | Are statements that address or discuss activities, events or developments that we expect or anticipate may occur in the future; |
| · | Can be identified by the use of words such as “believe”, “expect”, “anticipate”, “intend”, “plan”, “likely”, “predicts”, “estimates”, “forecasts”, and similar words or phrases or the negative of such words or phrases; |
| · | Reflect our current beliefs, intentions or expectations based on certain assumptions and estimates, including those identified below, which could prove to be significantly incorrect: |
| – | Our ability to develop, manufacture and sell new products and services that meet the needs of our customers and gain commercial acceptance; |
| – | Our ability to continue to sell our products and services in the expected quantities at the expected prices and expected times; |
| – | Our ability to successfully obtain cost savings from our cost reduction initiatives; |
| – | Our ability to implement business strategies and pursue opportunities; |
| – | Expected cost of goods sold; |
| – | Expected component supply costs and constraints; |
| – | Expected foreign exchange and tax rates. |
| · | While considered reasonable by management, are inherently subject to known and unknown risks and uncertainties and other factors that could cause actual results or events to differ from historical or anticipated results or events. These risk factors and others are discussed in the MD&A. Certain of these risks are: |
| – | The impact of general economic conditions in the countries in which we do business; |
| – | Conditions in the capital markets and our ability to obtain financing and refinance existing debt; |
| – | Market conditions and demand for our products (including declines in advertising and circulation); |
| – | The implementation of trade restrictions in jurisdictions where our products are marketed; |
| – | Fluctuations in foreign exchange or interest rates; |
| – | Raw material prices (including wood fibre, chemicals and energy); |
| – | The effect of, or change in, environmental and other governmental regulations; |
| – | Uncertainty relating to labour relations; |
| – | The availability of qualified personnel; |
| – | The effects of competition from domestic and foreign producers; |
| – | The risk of natural disaster and other factors many of which are beyond our control. |
As a result, no assurance can be given that any of the events or results anticipated by such forward-looking statements will occur or, if they do occur, what benefit they will have on our operations or financial condition. Readers are cautioned not to place undue reliance on these forward-looking statements. We disclaim any intention or obligation to update or revise any forward-looking statements, whether as a result of new information, future events or otherwise, except as required by law.
| CATALYST PAPER 2013 THIRD QUARTER REPORT │MANAGEMENT’S DISCUSSION AND ANALYSIS | 6 |
| 1. | OVERVIEW AND HIGHLIGHTS |
BUSINESS OVERVIEW
We are the largest producer of mechanical printing papers in western North America. We also produce NBSK pulp which is marketed primarily in Asia. Our business is comprised of three business segments: specialty printing papers, newsprint, and pulp. Specialty printing papers include coated mechanical, uncoated mechanical and directory paper. We are the only producer of coated mechanical paper and soft calender (SC) paper in western North America. We operate three paper mills in British Columbia (B.C.) located in Crofton, Port Alberni, and Powell River. Our Crofton mill includes a two-line kraft pulp operation.
More information about our business segments, product profile and our geographic sales distribution is provided on pages6to8 of our 2012 Annual Report. Our production capacity by mill and product line is summarized in the following chart:
2013 Capacity by Mill Location and Product Line1
| | | Specialty printing papers1 | | | Newsprint1 | | | Pulp2 | | | Total | |
| Mill location | | Number of
paper
machines | | Uncoated
mechanical | | | Coated
mechanical | | | Directory | | | Newsprint | | | NBSK
pulp | | | | |
| Crofton, B.C.3 | | 2 | | | – | | | | – | | | | 57,000 | | | | 270,000 | | | | 350,000 | | | | 677,000 | |
| Port Alberni, B.C. | | 2 | | | – | | | | 224,000 | | | | 116,000 | | | | – | | | | – | | | | 340,000 | |
| Powell River, B.C. | | 3 | | | 469,000 | | | | – | | | | – | | | | – | | | | – | | | | 469,000 | |
| Total capacity (tonnes) | | 7 | | | 469,000 | | | | 224,000 | | | | 173,000 | | | | 270,000 | | | | 350,000 | | | | 1,486,000 | |
| % of total capacity | | | | | 32 | % | | | 15 | % | | | 12 | % | | | 18 | % | | | 23 | % | | | 100 | % |
| 1 | Capacities expressed in the above table can vary as we are able to switch production between products, particularly newsprint, directory and machine-finished uncoated grades. |
| 2 | Total pulp capacity at Crofton is 393,000 tonnes, of which 350,000 tonnes are designated as market pulp with the remainder 43,000 tonnes being consumed internally. |
| 3 | No. 1 paper machine at Crofton remains indefinitely curtailed. |
THIRD QUARTER OVERVIEW
Business Overview
Our results for the third quarter of 2013 showed an improvement to the previous quarter due to better production, lower operating costs, the positive impact of a weaker Canadian dollar and increased sales volumes for pulp. This was partly offset by lower sales volumes for paper and slightly weaker prices in the quarter for both pulp and paper.
Costs were lower in the quarter partly due to fewer scheduled maintenance outages and included reductions in maintenance and labour spending. This was partly offset by an increase in the cost of furnish.
Our net income for the quarter reflected the accounting impact of the special portability election option on ourdefined benefit pension plan for salaried employees (Salaried Plan).
Financial Performance
We recorded net earnings attributable to the company of $5.2 million and a net loss attributable to the company before specific items of $3.5 million in Q3. This compared to a net loss of $28.0 million and $18.1 million, respectively, in Q2. Significant specific items in Q3 included a gain on the partial settlement of our defined benefit pension plan for salaried employees (Salaried Plan) under the special portability election option, and a foreign exchange gain on the translation of U.S. dollar denominated debt. Significant specific items in the prior quarter included a gain on the sale of the Elk Falls site, a loss on the required purchase of our Exit Notes, and a foreign exchange loss on the translation of U.S. dollar denominated debt.
Adjusted EBITDA and adjusted EBITDA before restructuring costs were $16.4 million in Q3 compared to adjusted EBITDA of negative $0.6 million and adjusted EBITDA before restructuring costs of negative $0.5 million in Q2. Refer to section 6,Non-GAAP measures, for additional information on specific items in the reported financial results.
| CATALYST PAPER 2013 THIRD QUARTER REPORT │MANAGEMENT’S DISCUSSION AND ANALYSIS | 7 |
SELECTED FINANCIAL INFORMATION
| | | 2013 | | | 2012 | |
(In millions of Canadian dollars, except
where otherwise stated) | | YTD | | | Q3 | | | Q2 | | | Q1 | | | Total | | | Q4 | | | Q3 | | | Q2 | | | Q1 | |
| | | | | | | | | | | | | | | | | | | | | | | | | | | | |
| Sales2 | | $ | 779.3 | | | $ | 268.8 | | | $ | 263.4 | | | $ | 247.1 | | | $ | 1,058.2 | | | $ | 260.5 | | | $ | 265.7 | | | $ | 264.8 | | | $ | 267.2 | |
| | | | | | | | | | | | | | | | | | | | | | | | | | | | | | | | | | | | | |
| Operating earnings (loss)2 | | | (8.3 | ) | | | 4.9 | | | | (12.0 | ) | | | (1.2 | ) | | | 19.1 | | | | (5.7 | ) | | | 5.9 | | | | 9.3 | | | | 9.6 | |
| | | | | | | | | | | | | | | | | | | | | | | | | | | | | | | | | | | | | |
| Depreciation and amortization2 | | | 35.3 | | | | 11.5 | | | | 11.4 | | | | 12.4 | | | | 36.3 | | | | 12.9 | | | | 7.9 | | | | 7.7 | | | | 7.8 | |
| | | | | | | | | | | | | | | | | | | | | | | | | | | | | | | | | | | | | |
| Adjusted EBITDA1,2 | | | 27.0 | | | | 16.4 | | | | (0.6 | ) | | | 11.2 | | | | 55.4 | | | | 7.2 | | | | 13.8 | | | | 17.0 | | | | 17.4 | |
| – before restructuring costs1,2 | | | 27.1 | | | | 16.4 | | | | (0.5 | ) | | | 11.2 | | | | 60.7 | | | | 7.2 | | | | 14.0 | | | | 16.9 | | | | 22.6 | |
| | | | | | | | | | | | | | | | | | | | | | | | | | | | | | | | | | | | | |
| Net earnings (loss) attributable to the company | | | (32.6 | ) | | | 5.2 | | | | (28.0 | ) | | | (9.8 | ) | | | 583.2 | | | | (35.2 | ) | | | 655.7 | | | | (11.7 | ) | | | (25.6 | ) |
| – before specific items1 | | | (33.2 | ) | | | (3.5 | ) | | | (18.1 | ) | | | (11.6 | ) | | | (37.8 | ) | | | (15.7 | ) | | | (7.5 | ) | | | (5.0 | ) | | | (9.6 | ) |
| Adjusted EBITDA margin1,2 | | | 3.5 | % | | | 6.1 | % | | | (0.2 | %) | | | 4.5 | % | | | 5.2 | % | | | 2.8 | % | | | 5.2 | % | | | 6.4 | % | | | 6.5 | % |
| – before restructuring costs1,2 | | | 3.5 | % | | | 6.1 | % | | | (0.2 | %) | | | 4.5 | % | | | 5.7 | % | | | 2.8 | % | | | 5.3 | % | | | 6.4 | % | | | 8.5 | % |
| | | | | | | | | | | | | | | | | | | | | | | | | | | | | | | | | | | | | |
| Net earnings (loss) per share attributable to the company’s common shareholders (in dollars) | | | | | | | | | | | | | | | | | | | | | | | | | | | | | | | | | | | | |
| – basic and diluted from continuing operations3 | | $ | (2.46 | ) | | $ | 0.36 | | | $ | (1.93 | ) | | $ | (0.89 | ) | | $ | 41.65 | | | $ | (1.55 | ) | | $ | 1.73 | | | $ | (0.03 | ) | | $ | (0.07 | ) |
| – basic and diluted from discontinued operations3 | | | 0.21 | | | | – | | | | – | | | | 0.21 | | | | (1.15 | ) | | | (0.89 | ) | | | (0.01 | ) | | | – | | | | – | |
| – before specific items1,3 | | | (2.29 | ) | | | (0.24 | ) | | | (1.25 | ) | | | (0.80 | ) | | | (2.62 | ) | | | (1.09 | ) | | | (0.02 | ) | | | (0.01 | ) | | | (0.03 | ) |
| | | | | | | | | | | | | | | | | | | | | | | | | | | | | | | | | | | | | |
| (In thousands of tonnes) | | | | | | | | | | | | | | | | | | | | | | | | | | | | | | | | | | | | |
| Sales2 | | | 1,026.8 | | | | 350.6 | | | | 346.6 | | | | 329.6 | | | | 1,401.4 | | | | 347.6 | | | | 356.6 | | | | 346.4 | | | | 350.8 | |
| Production2 | | | 1,032.4 | | | | 357.6 | | | | 338.5 | | | | 336.3 | | | | 1,388.6 | | | | 333.3 | | | | 353.4 | | | | 352.4 | | | | 349.5 | |
| 1 | Refer to section 6, Non-GAAP measures. |
| 2 | Numbers exclude the Snowflake mill’s results from operations which have been reclassified as discontinued operations; earnings from discontinued operations, net of tax, are shown separately from continuing operations in the consolidated statements of earnings (loss) in our interim consolidated financial statements for the nine months ended September 30, 2013. |
| 3 | Earnings per share data for periods ended on and subsequent to September 30, 2012 were based on 14.5 million weighted average common shares issued pursuant to our reorganization under CCAA. Earnings per share data for periods prior to September 30, 2012 were based on 381.9 million weighted average common shares outstanding prior to emergence from the CCAA proceedings. These shares were cancelled on September 13, 2012. |
| CATALYST PAPER 2013 THIRD QUARTER REPORT │MANAGEMENT’S DISCUSSION AND ANALYSIS | 8 |
Market Overview
| * | Uncoated mechanical is comprised of high-gloss and standard grades. |
Although market conditions remained challenging in the third quarter of 2013, paper demand and operating rates improved in the seasonally stronger second half of the year. While paper demand declined compared to Q3 2012 for newsprint, directory, and lightweight coated, these declines were partly offset by a significant increase in demand for uncoated mechanical. Inventory levels rose for all paper segments except for a slight decrease in lightweight coated. Average benchmark prices increased for all paper segments compared to the previous quarter except for directory paper which remained flat.
NBSK pulp shipments increased 1.4% compared to the third quarter of 2012. Benchmark prices for China slipped in the quarter to US$675 per tonne.
Sale of Port Alberni Wastewater Treatment Facility
On September 30, 2013 we completed the sale of our wastewater treatment facility and related infrastructure to the City of Port Alberni for proceeds of $5.8 million. The sale included the 13.4 hectare wastewater treatment facility and 3.9 hectare parcel of lands combined with a road dedication to facilitate development of an industrial truck route along the waterfront. We received $5.0 million of the proceeds on September 30, 2013 and will receive $0.8 million in September 2014.
Special Portability Election
Members of our Salaried Plan who exercised the election under the special portability election option received their lump-sum payments in July 2013. In addition, these members will receive quarterly top-up payments over the next four years. The lump-sum payments represented a partial settlement of the Salaried Plan in the third quarter. Seesection7, Critical Accounting Policies and Estimatesfor a description of the accounting impact of the partial settlement of the Salaried Plan on our financial results for the three and nine months ended September 30, 2013.
| CATALYST PAPER 2013 THIRD QUARTER REPORT │MANAGEMENT’S DISCUSSION AND ANALYSIS | 9 |
Appointment of President and Chief Executive Officer
Joe Nemeth was appointed President, Chief Executive Officer, and director of the company effective October 1, 2013.Leslie T. Lederer, who held this position on an interim basis, continues as a director and Chairman of the Board of directors.
STRATEGY UPDATE
Our objective is to return to profitability and maximize cash flows by focusing on reducing manufacturing costs and optimizing our brands and customer base. Additional information related to our corporate strategy, including key performance drivers and indicators, can be found on pages 16 to 24 of our 2012 Annual Report.
2013 Key Objectives
The following is an update on our third quarter progress towards our 2013 key objectives:
Social:
| · | Significantly improve safety results reducing medical incidents by 50% and lost time injuries by 41% to achieve 2nd quartile or better industry ranking |
| – | Lost-time injury frequency of 1.04 was in line with the Q2 level of 1.00 and outperformed the target of 1.12. |
| – | Medical incident rate of 3.11 improved from the Q2 level of 3.24 but was higher than the target of 2.18. |
| · | Establish Catalyst Paper as an employer-of-choice, and further strengthen linkages with training institutions and other recruitment-supporting initiatives |
| – | Leadership development training continued through the quarter. |
| – | Our relationship with the Vancouver Island University Power Engineering Program resulted in three practicum students joining the company as full time employees. |
| – | Implemented a new pre-employment assessment process for hourly new hires |
| – | Conducted focus groups to examine new employee survey results. |
| · | Continue to seek competitive business conditions in B.C. including reductions in hydro and taxation rates and work with municipalities to achieve joint cost-saving service and infrastructure agreements |
| – | Completed sale of wastewater treatment facility to City of Port Alberni for proceeds of $5.8 million. |
| – | Agreement being finalized with City of Powell River to transfer our interest in PRSC Land Development Ltd. for approximately $3.0 million. |
Financial:
| | · | Complete outstanding restructuring items and use proceeds of asset sales to pay down debt |
| | – | Non-core asset sales completed for the nine months ended September 30, 2013 include the Snowflake mill, our interest in Powell River Energy, the Elk Falls site, and the Port Alberni wastewater treatment facility. |
| | – | Purchased US$15.6 million of our Exit Notes from the net proceeds from the sale of our interest in Powell River Energy. |
| | · | Reduce operating costs, and focus on generating positive free cash flow |
| | – | Free cash flow for the quarter was $0.8 million. Liquidity decreased by $6.9 million compared to Q2 mostly due to the payment of annual property taxes of $12.1 million, partially offset by proceeds received from the sale of the Port Alberni wastewater treatment facility of $5.0 million. |
| | – | Capital expenditures in the current quarter of $5.3 million included $3.3 million invested in maintenance of business and $1.2 million in profit adding investments. |
| | · | Complete special portability option program developed to deal with the salaried pension deficit |
| | – | Elections under the program were finalized by June 30, 2013 and lump-sum payments were distributed to members exiting the plan in July. The accounting impact of the partial plan settlement was recognized in the third quarter. |
| CATALYST PAPER 2013 THIRD QUARTER REPORT │MANAGEMENT’S DISCUSSION AND ANALYSIS | 10 |
Commercial:
| · | Expand geographic reach of Catalyst Paper into emerging world markets of Latin America and Asia |
| – | Increased sales of Marathon Lite worldwide. Nearly a third of our newsprint sales is Marathon Lite. |
| – | Grew market share in Latin America for the third consecutive quarter. |
| · | Gain market share and expand sales reach into new markets with new products |
| – | Increased coated market share on the strength of our highest value coated grades, Pacficote and Ascent. |
| – | Converted a growing number of customers to Electrabrite Ultra-Lite, our lighter basis weight, more economical alternative to traditional high bright papers. |
| · | Increase breadth of product range and solidify position as the most flexible and diverse producer and marketer of paper in the West |
| – | Grew sales of Ascent, the newest addition to our coated product line. Ascent is a coated three paper, the highest value grade we now produce. |
| – | Retained customers as they moved from one grade to another. Our western location and broad product line allow customers to make the best choices for their business without the risk of changing paper suppliers. |
Environmental:
| · | Work with community stakeholders to identify and implement sustainable watershed management solutions |
| – | Assessment underway of new BC Water Sustainability Act proposed for legislative introduction in Spring 2014. |
| · | Adhere to high international standards for transparency and reporting of performance on social, governance and environmental factors |
| – | Review completed of current sustainability disclosure against Global Reporting Initiative G4 guidelines. |
| · | Support revision of the B.C. Forest Stewardship Council standard to achieve increased access to
FSC fibre |
| – | Industry working group continued to engage with other forest sector stakeholders to identify and prioritize key aspects for revision. |
CONSOLIDATED RESULTS OF OPERATIONS
Sales
Q3 2013 vs. Q2 2013
Sales revenues increased by 2.1% as a result of the positive impact of a weaker Canadian dollar, increased sales volumes achieved for directory, uncoated mechanical and pulp, and higher transaction prices for directory and uncoated, partially offset by reduced sales volumes for newsprint and lightweight coated, and lower transaction prices for newsprint, lightweight coated and pulp.
Q3 2013 vs. Q3 2012
Sales revenues increased by 1.2% due to the positive impact of a weaker Canadian dollar, increased sales volumes for uncoated and pulp, and higher transaction prices for pulp, partially offset by reduced sales volumes for newsprint, lightweight coated and directory, and lower transaction prices for all paper grades.
2013 YTD vs. 2012 YTD
Sales revenues decreased by 2.3% due to lower transaction prices for all paper segments excluding lightweight coated, and lower sales volumes for all specialty paper grades and pulp, partially offset by the positive impact of a weaker Canadian dollar, higher transaction prices for lightweight coated and pulp, and increased sales volumes for newsprint.
| CATALYST PAPER 2013 THIRD QUARTER REPORT │MANAGEMENT’S DISCUSSION AND ANALYSIS | 11 |
Adjusted EBITDA and adjusted EBITDA before Restructuring Costs
The following table provides variances between periods for adjusted EBITDA and adjusted EBITDA before restructuring costs:
| (In millions of Canadian dollars) | | Q2 2013 | | | Q3 2012 | | | 2012 YTD | |
| | | | | | | | | | |
| Adjusted EBITDAin comparative period1 | | $ | (0.6 | ) | | $ | 13.8 | | | $ | 48.2 | |
| Restructuring costs | | | 0.1 | | | | 0.2 | | | | 5.3 | |
| Adjusted EBITDAbefore restructuring costs in comparative period1 | | | (0.5 | ) | | | 14.0 | | | | 53.5 | |
| Paper prices | | | (1.1 | ) | | | (5.8 | ) | | | (13.6 | ) |
| Pulp prices | | | – | | | | 4.9 | | | | 3.8 | |
| Impact of Canadian dollar | | | 2.5 | | | | 8.0 | | | | 11.1 | |
| Volume and mix | | | 5.5 | | | | 0.1 | | | | (7.5 | ) |
| Furnish mix and costs | | | (0.8 | ) | | | (0.3 | ) | | | 6.3 | |
| Power costs | | | (0.9 | ) | | | (3.3 | ) | | | (8.8 | ) |
| Fuel costs | | | 2.5 | | | | 0.5 | | | | (2.4 | ) |
| Labour costs | | | 2.8 | | | | (0.8 | ) | | | 0.8 | |
| Maintenance costs | | | 4.6 | | | | (0.3 | ) | | | (10.4 | ) |
| Selling, general and administrative | | | 0.8 | | | | (0.2 | ) | | | 0.6 | |
| Lower of cost or market impact on inventory, net of inventory change | | | 1.1 | | | | 2.3 | | | | (2.7 | ) |
| Other, net | | | (0.1 | ) | | | (2.7 | ) | | | (3.6 | ) |
| Adjusted EBITDAbefore restructuring costs in the current period1 | | | 16.4 | | | | 16.4 | | | | 27.1 | |
| Restructuring costs | | | – | | | | – | | | | (0.1 | ) |
| Adjusted EBITDAin the current period1 | | $ | 16.4 | | | $ | 16.4 | | | $ | 27.0 | |
| 1 | Refer to section 6,Non-GAAP measures. |
Operating Earnings (Loss)
Q3 2013 vs. Q2 2013
Operating earnings increased by $16.9 million due to higher adjusted EBITDA of $17.0 million, partly offset by higher depreciation and amortization expense of $0.1 million.
Q3 2013 vs. Q3 2012
Operating earnings decreased by $1.0 million due to higher depreciation and amortization expense of $3.6 million, partially offset by higher adjusted EBITDA of $2.6 million.
2013 YTD vs. 2012 YTD
Operating earnings decreased by $33.1 million due to lower adjusted EBITDA of $21.2 million and higher depreciation and amortization expense of $11.9 million.
| CATALYST PAPER 2013 THIRD QUARTER REPORT │MANAGEMENT’S DISCUSSION AND ANALYSIS | 12 |
Net Earnings (Loss) Attributable to the Company
Q3 2013 vs. Q2 2013
Net earnings attributable to the company increased by $33.2 million compared to the previous quarter. Net earnings for Q3 2013 included higher after-tax operating earnings of $16.9 million, an after-tax settlement gain of $2.6 million related to the special pension portability election, and an after-tax foreign exchange gain on the translation of U.S. dollar debt of $6.1 million. Net earnings for Q2 2013 included an after-tax foreign exchange loss on the translation of U.S. dollar debt of $9.6 million, and an after-tax gain from the sale of the Elk Falls site of $2.1 million.
Q3 2013 vs. Q3 2012
Net earnings attributable to the company decreased by $650.5 million compared to Q3 2012. Net earnings for Q3 2013 included an after-tax settlement gain of $2.6 million related to the special pension portability election, a reduction in after-tax interest expense of $6.2 million, and a decrease in after-tax foreign exchange gain on the translation of U.S. dollar debt of $19.1 million. Net earnings for Q3 2012 included a net after-tax reorganization credit of $688.1 million, partially offset by an after-tax fair value adjustment to non-controlling interest of $41.2 million, recognized on our emergence from creditor protection proceedings.
2013 YTD vs. 2012 YTD
Net earnings attributable to the company decreased by $651.0 million compared to 2012. Net earnings for the nine months ended September 30, 2013 included lower after-tax operating earnings of $33.1 million, an after-tax foreign exchange loss on the translation of U.S. dollar debt of $9.4 million, lower after-tax interest expense of $30.9 million, an after-tax settlement gain of $2.6 million related to the special pension portability election, and after-tax gains on the sale of non-core assets including the Snowflake mill, our interest in Powell River Energy, and the Elk Falls site of $11.5 million. Net earnings for the nine months ended September 30, 2012 included a net after-tax reorganization credit of $671.7 million, partially offset by an after-tax fair value adjustment to non-controlling interest of $41.2 million, recognized on our emergence from creditor protection proceedings, and an after-tax foreign exchange gain on the translation of U.S. dollar debt of $24.0 million.
SPECIALTY PRINTING PAPERS
| | | Three months
ended September 30, | | | Nine months
ended September 30, | |
(In millions of Canadian dollars, except
where otherwise stated) | | 2013 | | | 2012 | | | Change | | | 20132 | | | 20122 | | | Change | |
| | | | | | | | | | | | | | | | | | | |
| Sales | | $ | 164.6 | | | $ | 171.2 | | | $ | (6.6 | ) | | $ | 475.3 | | | $ | 503.8 | | | $ | (28.5 | ) |
| Operating earnings (loss) | | | (3.4 | ) | | | 8.5 | | | | (11.9 | ) | | | (17.0 | ) | | | 19.3 | | | | (36.3 | ) |
| Depreciation and amortization | | | 9.9 | | | | 6.4 | | | | 3.5 | | | | 30.4 | | | | 18.9 | | | | 11.5 | |
| Adjusted EBITDA1 | | | 6.5 | | | | 14.9 | | | | (8.4 | ) | | | 13.4 | | | | 38.2 | | | | (24.8 | ) |
| – before restructuring costs1 | | | 6.5 | | | | 15.1 | | | | (8.6 | ) | | | 13.4 | | | | 41.1 | | | | (27.7 | ) |
| Adjusted EBITDA margin1 | | | 3.9 | % | | | 8.7 | % | | | (4.8 | %) | | | 2.8 | % | | | 7.6 | % | | | (4.8 | %) |
| – before restructuring costs1 | | | 3.9 | % | | | 8.8 | % | | | (4.9 | %) | | | 2.8 | % | | | 8.2 | % | | | (5.4 | %) |
| | | | | | | | | | | | | | | | | | | | | | | | | |
| (In thousands of tonnes) | | | | | | | | | | | | | | | | | | | | | | | | |
| Sales | | | 197.4 | | | | 207.6 | | | | (10.2 | ) | | | 573.2 | | | | 605.2 | | | | (32.0 | ) |
| Production | | | 197.4 | | | | 206.5 | | | | (9.1 | ) | | | 577.8 | | | | 612.7 | | | | (34.9 | ) |
| 1 | Refer to section 6,Non-GAAP measures. |
| 2 | Numbers exclude the Snowflake mill’s results from operations which have been reclassified as discontinuing operations in the consolidated statements of earnings (loss) in the interim consolidated financial statements for the nine months ended September 30, 2013. |
| CATALYST PAPER 2013 THIRD QUARTER REPORT │MANAGEMENT’S DISCUSSION AND ANALYSIS | 13 |
Segment Overview
While North American demand for coated mechanical decreased by 4.5% from the third quarter of 2012, demand for uncoated mechanical increased by 12.1% due to strong demand for high-gloss grades as customers sought lower cost alternatives to coated mechanical. Average benchmark prices increased for lightweight coated by 0.9% to US$868 per short ton, and for soft-calendered A grade (SC-A) by 4.4% to US$830 per short ton compared to the previous quarter. A US$50 per short ton price increase on our soft-calendered paper was mostly implemented in the quarter.
North American directory demand fell 10.9% in Q3 compared to the prior year due to the ongoing reduction or elimination of white pages, publication of smaller books, lower circulation, and the continued migration from printed books to the Internet. The average Q3 directory benchmark price remained flat at US$750 per short ton compared to the previous quarter as the vast majority of tonnes are sold under one-year contracts with fixed pricing. Operating rates for directory paper remain strong despite declining demand due to continued capacity reduction in the directory marketplace.
| CATALYST PAPER 2013 THIRD QUARTER REPORT │MANAGEMENT’S DISCUSSION AND ANALYSIS | 14 |
Operational Performance
The following chart summarizes the operating performance of our specialty printing papers segment:
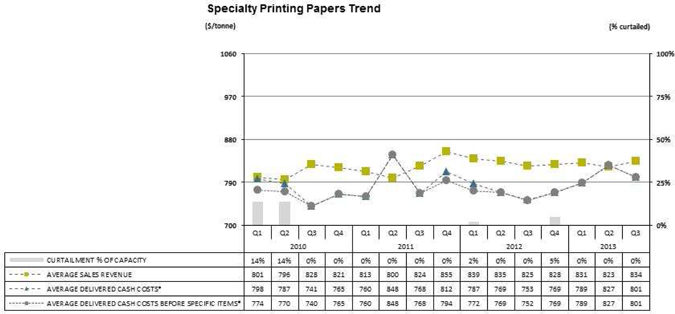
| * | Average delivered cash costs per tonne consist of cost of sales, excluding depreciation and amortization, and including the impact of SG&A and restructuring costs. Average delivered cash costs per tonne before specific items consist of cost of sales, excluding depreciation and amortization, and including the impact of SG&A, but excluding the impact of restructuring costs. |
Q3 2013 vs. Q3 2012
| | · | Sales volume decreased by 10,200 tonnes due to lower sales volumes for directory and lightweight coated, partially offset by higher sales volumes for uncoated mechanical. |
| | · | Average sales revenue increased $9 per tonne due to the positive impact of a weaker Canadian dollar, partially offset by lower average transaction prices for all specialty grades. |
| | · | Average delivered cash costs increased $48 per tonne due primarily to increased spending on maintenance, labour and indirect material and services, as well as cost increases in electric power, kraft and operating supplies. |
2013 YTD vs. 2012 YTD
| | · | Sales volume decreased by 32,000 tonnes due to lower sales volumes for all specialty grades. |
| | · | Average sales revenue decreased $4 per tonne due to lower average transaction prices for directory and uncoated mechanical, partially offset by higher average transaction prices for lightweight coated and the positive impact of a weaker Canadian dollar. |
| | · | Average delivered cash costs increased $38 per tonne due primarily to increased spending on maintenance and indirect material and services, as well as cost increases in coating, electric power and operating supplies, partially offset by the incurrence of restructuring costs in 2012. |
| CATALYST PAPER 2013 THIRD QUARTER REPORT │MANAGEMENT’S DISCUSSION AND ANALYSIS | 15 |
Newsprint
| | | Three months
ended September 30, | | | Nine months
ended September 30, | |
(In millions of Canadian dollars, except
where otherwise stated) | | 2013 | | | 2012 | | | Change | | | 20132 | | | 20122 | | | Change | |
| | | | | | | | | | | | | | | | | | | |
| Sales | | $ | 44.3 | | | $ | 45.6 | | | $ | (1.3 | ) | | $ | 140.3 | | | $ | 134.1 | | | $ | 6.2 | |
| Operating earnings (loss) | | | 1.4 | | | | 3.1 | | | | (1.7 | ) | | | 4.0 | | | | 11.7 | | | | (7.7 | ) |
| Depreciation and amortization | | | 1.1 | | | | 0.9 | | | | 0.2 | | | | 3.7 | | | | 2.7 | | | | 1.0 | |
| Adjusted EBITDA1 | | | 2.5 | | | | 4.0 | | | | (1.5 | ) | | | 7.7 | | | | 14.4 | | | | (6.7 | ) |
| – before restructuring costs1 | | | 2.5 | | | | 4.0 | | | | (1.5 | ) | | | 7.8 | | | | 15.2 | | | | (7.4 | ) |
| Adjusted EBITDA margin1 | | | 5.6 | % | | | 8.8 | % | | | (3.2 | %) | | | 5.5 | % | | | 10.7 | % | | | (5.2 | %) |
| – before restructuring costs1 | | | 5.6 | % | | | 8.8 | % | | | (3.2 | %) | | | 5.6 | % | | | 11.3 | % | | | (5.7 | %) |
| | | | | | | | | | | | | | | | | | | | | | | | | |
| (In thousands of tonnes) | | | | | | | | | | | | | | | | | | | | | | | | |
| Sales | | | 66.1 | | | | 67.8 | | | | (1.7 | ) | | | 208.0 | | | | 197.8 | | | | 10.2 | |
| Production | | | 70.1 | | | | 67.3 | | | | 2.8 | | | | 210.5 | | | | 199.8 | | | | 10.7 | |
| 1 | Refer to section 6,Non-GAAP measures. |
| 2 | Numbers exclude the Snowflake mill’s results from operations which have been reclassified as discontinuing operations in the consolidated statements of earnings (loss) in the interim consolidated financial statements for the nine months ended September 30, 2013. |
| CATALYST PAPER 2013 THIRD QUARTER REPORT │MANAGEMENT’S DISCUSSION AND ANALYSIS | 16 |
Segment Overview
Total North American demand for newsprint decreased by 11.2% compared to Q3 2012 partly due to lower newspaper print advertising and declining circulation. Strong exports, especially to Asia, partly compensated for weak domestic demand. The average Q3 North American newsprint benchmark price increased 0.5% to US$595 per tonne compared to Q2 2013. On September 1, 2013, we implemented a US$15 per tonne price increase on our US customer accounts.
Operational Performance
The following chart summarizes the operating performance of our newsprint segment:
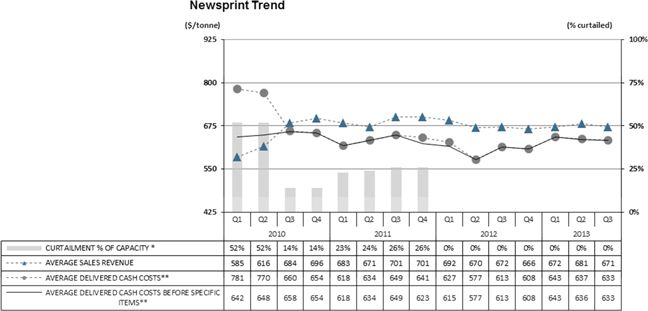
| * | Although C1 remains indefinitely curtailed, it is not included in our 2013 capacity table. |
| ** | Average delivered cash costs per tonne consist of cost of sales, excluding depreciation and amortization, and including the impact of SG&A and restructuring costs. Average delivered cash costs per tonne before specific items consist of cost of sales, excluding depreciation and amortization, and including the impact of SG&A, but excluding the impact of restructuring costs. |
Q3 2013 vs. Q3 2012
| · | Sales volume decreased by 1,700 tonnes. |
| · | Average sales revenue remained flat due to lower average transaction prices in the quarter that was offset by the positive impact of a weaker Canadian dollar. |
| · | Average delivered cash costs increased $20 per tonne due primarily to increases in maintenance, indirect material and services, and electric power cost, partially offset by lower cost of chemicals. |
2013 YTD vs. 2012 YTD
| · | Sales volume increased by 10,200 tonnes primarily due to increased newsprint production which partly offset lower directory production. |
| · | Average sales revenue decreased $3 per tonne due to lower average transaction prices, partially offset by the positive impact of a weaker Canadian dollar. |
| · | Average delivered cash costs increased $32 per tonne due primarily to increases in maintenance, indirect material & services, operating supplies and electric power cost. |
| CATALYST PAPER 2013 THIRD QUARTER REPORT │MANAGEMENT’S DISCUSSION AND ANALYSIS | 17 |
Pulp
| | | Three months
ended September 30, | | | Nine months
ended September 30, | |
(In millions of Canadian dollars, except
where otherwise stated) | | 2013 | | | 2012 | | | Change | | | 20132 | | | 20122 | | | Change | |
| | | | | | | | | | | | | | | | | | | |
| Sales | | $ | 59.9 | | | $ | 48.9 | | | $ | 11.0 | | | $ | 163.7 | | | $ | 159.8 | | | $ | 3.9 | |
| Operating earnings (loss) | | | 6.9 | | | | (5.7 | ) | | | 12.6 | | | | 4.7 | | | | (6.2 | ) | | | 10.9 | |
| Depreciation and amortization | | | 0.5 | | | | 0.6 | | | | (0.1 | ) | | | 1.2 | | | | 1.8 | | | | (0.6 | ) |
| Adjusted EBITDA1 | | | 7.4 | | | | (5.1 | ) | | | 12.5 | | | | 5.9 | | | | (4.4 | ) | | | 10.3 | |
| – before restructuring costs1 | | | 7.4 | | | | (5.1 | ) | | | 12.5 | | | | 5.9 | | | | (2.8 | ) | | | 8.7 | |
| | | | | | | | | | | | | | | | | | | | | | | | | |
| Adjusted EBITDA margin1 | | | 12.4 | % | | | (10.4 | %) | | | 22.8 | % | | | 3.6 | % | | | (2.8 | %) | | | 6.4 | % |
| – before restructuring costs1 | | | 12.4 | % | | | (10.4 | %) | | | 22.8 | % | | | 3.6 | % | | | (1.8 | %) | | | 5.4 | % |
| | | | | | | | | | | | | | | | | | | | | | | | | |
| (In thousands of tonnes) | | | | | | | | | | | | | | | | | | | | | | | | |
| Sales | | | 87.1 | | | | 81.2 | | | | 5.9 | | | | 245.6 | | | | 250.8 | | | | (5.2 | ) |
| Production | | | 90.1 | | | | 79.6 | | | | 10.5 | | | | 244.1 | | | | 242.8 | | | | 1.3 | |
| 1 | Refer to section 6,Non-GAAP measures. |
| 2 | Numbers exclude the Snowflake mill’s results from operations which have been reclassified as discontinuing operations in the consolidated statements of earnings (loss) in the interim consolidated financial statements for the nine months ended September 30, 2013. |
Segment Overview
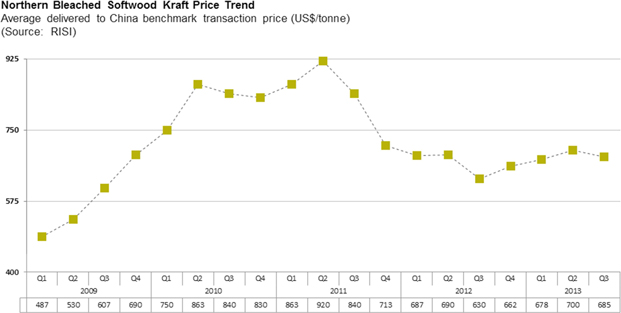
NBSK pulp markets continued to strengthen in the third quarter as demand improved in Asia and North America. Global NBSK demand increased by 1.4% from the third quarter of 2012 which supported a US$20 per tonne price increase announced for China in September. The average NBSK benchmark pulp price for China decreased 2.1% to US$685 per tonne compared to the previous quarter.
| CATALYST PAPER 2013 THIRD QUARTER REPORT │MANAGEMENT’S DISCUSSION AND ANALYSIS | 18 |
Operational Performance
The following chart summarizes the operating performance of our pulp segment:
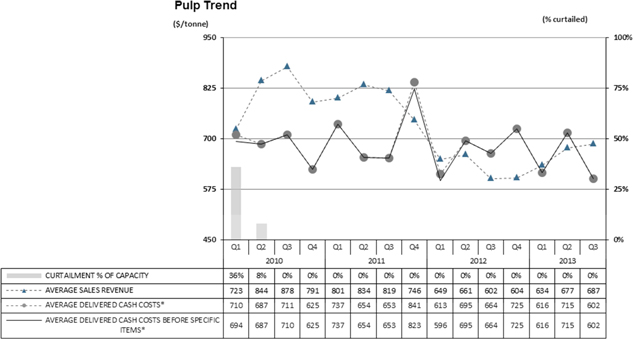
| * | Average delivered cash costs per tonne consist of cost of sales, excluding depreciation and amortization, and including the impact of SG&A and restructuring costs. Average delivered cash costs per tonne before specific items consist of cost of sales, excluding depreciation and amortization, and including the impact of SG&A, but excluding the impact of restructuring costs. |
Q3 2013 vs. Q3 2012
| · | Sales volume increased by 5,900 tonnes compared to the same quarter last year. |
| · | Average sales revenue increased $85 per tonne due to higher average transaction prices and the positive impact of a weaker Canadian dollar. |
| · | Average delivered cash costs decreased by $62 per tonne due to decreased maintenance spending and lower cost of chemicals and steam. |
2013 YTD vs. 2012 YTD
| · | Sales volume decreased by 5,200 tonnes partly due to the inclusion of an 8,000 tonne delayed shipment in 2012 results. |
| · | Average sales revenue increased by $29 due to higher average transaction prices and the positive impact of a weaker Canadian dollar. |
| · | Average delivered cash costs decreased by $13 per tonne due to a reduction in the cost of fibre and chemicals, and the incurrence of restructuring costs in 2012, partially offset by increased maintenance spending. |
| CATALYST PAPER 2013 THIRD QUARTER REPORT │MANAGEMENT’S DISCUSSION AND ANALYSIS | 19 |
| 3. | LIQUIDITY AND CAPITAL RESOURCES |
Selected Financial Information
| | | Three months
ended September 30, | | | Nine months
ended September 30, | |
(In millions of Canadian dollars, except
where otherwise stated) | | 2013 | | | 2012 | | | Change | | | 2013 | | | 2012 | | | Change | |
| | | | | | | | | | | | | | | | | | | |
| Cash flows provided (used) by operations before changes in non-cash working capital | | $ | 6.1 | | | $ | (15.8 | ) | | $ | 21.9 | | | $ | (4.6 | ) | | $ | (19.2 | ) | | $ | 14.6 | |
| Changes in non-cash working capital | | | (19.1 | ) | | | (5.3 | ) | | | (13.8 | ) | | | (6.6 | ) | | | (24.8 | ) | | | 18.2 | |
| Cash flows provided (used) by: | | | | | | | | | | | | | | | | | | | | | | | | |
| Operations | | | (13.0 | ) | | | (21.1 | ) | | | 8.1 | | | | (11.2 | ) | | | (44.0 | ) | | | 32.8 | |
| Investing activities | | | (0.7 | ) | | | (0.6 | ) | | | (0.1 | ) | | | 35.4 | | | | (3.4 | ) | | | 38.8 | |
| Financing activities | | | 11.5 | | | | 16.5 | | | | (5.0 | ) | | | (28.9 | ) | | | 34.9 | | | | (63.8 | ) |
| Capital spending | | | 5.3 | | | | 7.3 | | | | (2.0 | ) | | | 19.7 | | | | 12.2 | | | | 7.5 | |
| Depreciation and amortization | | | 11.5 | | | | 7.9 | | | | 3.6 | | | | 35.3 | | | | 23.4 | | | | 11.9 | |
| Capital spending as % of depreciation and amortization | | | 46 | % | | | 92 | % | | | (46 | %) | | | 56 | % | | | 52 | % | | | 4 | % |
| Net debt to net capitalization at September 301 | | | 74 | % | | | 76 | % | | | (1 | %) | | | 74 | % | | | 76 | % | | | (1 | %) |
| 1 | Net debt ratio equals net debt (total debt less cash) divided by net capitalization (shareholder’s equity attributable to the company and total debt less cash). |
Refer to page 43 of our 2012 Annual Report for a discussion of the nature and sources of funding for our principal cash requirements.
Operating Activities
Cash flows from operating activities increased by $8.1 million in Q3 from the same quarter in the previous year, primarily due to an increase in adjusted EBITDA of $2.6 million, cash reorganization costs incurred in Q3 2012 of $12.7 million, and a foreign exchange loss on the revaluation of working capital in Q3 2012 of $7.9 million, partially offset by an increase in cash interest expense of $3.3 million, and an unfavourable change in non-cash working capital of $19.1 million compared to an unfavourable change of $5.3 million in Q3 2012.
Investing Activities
Cash used by investing activities increased by $0.1 million mostly due to an increase in other assets of $0.6 million compared to a decrease of $0.5 million in Q3 2012, and a decrease in restricted cash in Q3 2012 of $2.6 million, partially offset by a reduction in additions to property plant and equipment of $2.0 million, and an increase in proceeds from the sale of capital assets of $1.4 million.
Financing Activities
Cash provided by financing activities was $11.5 million compared to $16.5 million in the same quarter last year. We increased the draw on our asset-based loan facility (ABL Facility) by $11.8 million in the current quarter. For Q3 2012, we received $97.1 million from the issuance of exit financing on emerging from creditor protection proceedings, partially offset by the repayment of the outstanding draw on the debtor-in-possession (DIP) Credit Facility of $70.6 million, and the payment of issuance cost of $9.5 million related to the issuance of new debt and common shares.
| CATALYST PAPER 2013 THIRD QUARTER REPORT │MANAGEMENT’S DISCUSSION AND ANALYSIS | 20 |
Capital Resources
Availability on the ABL Facility and total liquidity is summarized in the following table:
| | | ABL Facility | | | ABL Facility | | | DIP Facility | |
| | 2013 | | | 2012 | |
| (In millions of Canadian dollars) | | Q3 | | | Q2 | | | Q1 | | | Q4 | | | Q3 | | | Q2 | | | Q1 | |
| | | | | | | | | | | | | | | | | | | | | | |
| Borrowing base | | $ | 145.8 | 1 | | $ | 138.7 | | | $ | 133.5 | | | $ | 125.2 | | | $ | 164.0 | | | $ | 159.6 | | | $ | 142.1 | |
| Letters of credit | | | (19.8 | ) | | | (19.8 | ) | | | (22.1 | ) | | | (22.3 | ) | | | (17.8 | ) | | | (19.6 | ) | | | (17.8 | ) |
| Amount drawn, net | | | (11.8 | ) | | | – | | | | (4.7 | ) | | | (24.0 | ) | | | (64.0 | ) | | | (70.5 | ) | | | (77.8 | ) |
| Minimum excess availability | | | – | | | | – | | | | – | | | | – | | | | – | | | | (21.9 | )3 | | | – | |
| Availability2 | | | 114.2 | | | | 118.9 | | | | 106.7 | | | | 78.9 | | | | 82.2 | | | | 47.6 | | | | 46.5 | |
| Cash on hand | | | 13.8 | | | | 16.0 | | | | 14.1 | | | | 18.5 | | | | 12.6 | | | | 17.8 | | | | 19.3 | |
| Restricted cash | | | – | | | | – | | | | 20.0 | | | | 0.5 | | | | 2.0 | | | | 6.4 | | | | 2.1 | |
| Total liquidity | | $ | 128.0 | | | $ | 134.9 | | | $ | 140.8 | | | $ | 97.9 | | | $ | 96.8 | | | $ | 71.8 | | | $ | 67.9 | |
| 1 | Borrowing base included reserves of $1.3 million for pension, $1.8 million for creditor insurance deductibles, $2.3 million for landlord waivers, $1.3 million for employee source deductions, $0.3 million related to WCB, and $0.2 million purchasing card reserve. |
| 2 | Our ABL Facility is subject to certain financial covenants as disclosed in our interim consolidated financial statements for the three and nine months ended September 30, 2013 in note 12,Long-term debt. |
| 3 | The DIP Facility was subject to an excess availability condition. |
Our total liquidity increased by $31.2 million from the same quarter last year primarily due to non-core asset sales and improved vendor payment terms since emerging from creditor protection. Liquidity decreased by $6.9 million compared to the previous quarter mostly due to the payment of annual property taxes in July of $12.1 million, partially offset by proceeds received from the sale of the Port Alberni wastewater treatment facility of $5.0 million.
At November 5, 2013 the company had 14,527,571 common shares issued and outstanding. Our common shares have no par value and an unlimited number of shares are authorized for future issuance.
Financial Instruments
Our financial instruments consist primarily of cash and cash equivalents, accounts receivable, accounts payable and accrued liabilities, and long-term debt. Derivatives are used primarily to reduce exposure to currency risk on revenues, or occasionally debt, as well as price risk associated with revenue and energy costs.
For a description of the nature and extent of risk to the company from our financial instruments, as well as our respective accounting treatment of financial instruments, refer to our annual consolidated financial statements for the year ended December 31, 2012 note 30,Financial instruments. For the methods and assumptions we use to determine the fair value of financial instruments, refer to note 29,Fair value measurement, of those statements. Our methods and assumptions for determining the fair value of financial instruments have not changed materially since those used in the preparation of our consolidated financial statements for the year ended December 31, 2012.
At September 30, 2013 the company did not have any foreign currency or commodity contracts outstanding.
| CATALYST PAPER 2013 THIRD QUARTER REPORT │MANAGEMENT’S DISCUSSION AND ANALYSIS | 21 |
The following table reconciles the average spot exchange rate to our effective exchange rate:
US$/CDN$ FOREIGN EXCHANGE
| | | 2013 | | | 2012 | |
| | | Q3 | | | Q2 | | | Q1 | | | Q4 | | | Q3 | | | Q2 | | | Q1 | |
| | | | | | | | | | | | | | | | | | | | | | |
| Average Bank of Canada noon spot rate | | | 0.963 | | | | 0.977 | | | | 0.992 | | | | 1.009 | | | | 1.005 | | | | 0.990 | | | | 0.999 | |
| | | | | | | | | | | | | | | | | | | | | | | | | | | | | |
| Average effective rate included in adjusted EBITDA | | | 0.963 | | | | 0.977 | | | | 0.992 | | | | 1.009 | | | | 1.005 | | | | 0.990 | | | | 0.999 | |
| (Favourable)/unfavourable impact of derivatives, other than those designated as effective hedges for accounting purposes, included in other expenses1 | | | – | | | | – | | | | – | | | | – | | | | – | | | | 0.001 | | | | 0.004 | |
| | | | | | | | | | | | | | | | | | | | | | | | | | | | | |
| Foreign exchange (gain)/loss, on working capital balances, included in other expenses2 | | | – | | | | (0.011 | ) | | | (0.005 | ) | | | (0.002 | ) | | | 0.035 | | | | (0.017 | ) | | | 0.017 | |
| | | | | | | | | | | | | | | | | | | | | | | | | | | | | |
| Average effective rate in net earnings/(loss) before income taxes3 | | | 0.963 | | | | 0.966 | | | | 0.987 | | | | 1.007 | | | | 1.040 | | | | 0.974 | | | | 1.020 | |
| | | | | | | | | | | | | | | | | | | | | | | | | | | | | |
| (In millions of dollars) | | | | | | | | | | | | | | | | | | | | | | | | | | | | |
| 1 Favourable/(unfavourable) impact of derivatives other than those designated as effective hedges for accounting purposes included in other expenses | | $ | – | | | $ | – | | | $ | – | | | $ | – | | | $ | – | | | $ | (0.2 | ) | | $ | (1.0 | ) |
| 2 Foreign exchange gain/(loss) on working capital balances included in other expenses | | | – | | | | 2.2 | | | | 0.8 | | | | 0.4 | | | | (7.8 | ) | | | 3.9 | | | | (4.0 | ) |
| 3 Excludes foreign exchange gain/(loss) on long term debt and $US interest expense | | | | | | | | | | | | | | | | | | | | | | | | | | | | |
The company’s contingent liabilities at December 31, 2012 are described on page 47 of our 2012 Annual Report. We are not aware of any significant contingent liabilities outstanding as of November 5, 2013.
| CATALYST PAPER 2013 THIRD QUARTER REPORT │MANAGEMENT’S DISCUSSION AND ANALYSIS | 22 |
| 5. | SUMMARY OF QUARTERLY RESULTS |
The following table highlights selected financial information for the eight consecutive quarters ending September 30, 2013:
| | | 2013 | | | 2012 | | | 2011 | |
(In millions of Canadian dollars,
except per share amounts) | | Q3 | | | Q2 | | | Q1 | | | Q4 | | | Q3 | | | Q2 | | | Q1 | | | Q4 | |
| | | | | | | | | | | | | | | | | | | | | | | | | |
| Sales2 | | $ | 268.8 | | | $ | 263.4 | | | $ | 247.1 | | | $ | 260.5 | | | $ | 265.7 | | | $ | 264.8 | | | $ | 267.2 | | | $ | 272.2 | |
| Adjusted EBITDA1, 2 | | | 16.4 | | | | (0.6 | ) | | | 11.2 | | | | 7.2 | | | | 13.8 | | | | 17.0 | | | | 17.4 | | | | 6.9 | |
| Net earnings (loss) attributable to the company | | | 5.2 | | | | (28.0 | ) | | | (9.8 | ) | | | (35.2 | ) | | | 655.7 | | | | (11.7 | ) | | | (25.6 | ) | | | (708.0 | ) |
| | | | | | | | | | | | | | | | | | | | | | | | | | | | | | | | | |
| Net earnings (loss) per share attributable to the company’s common shareholders | | | | | | | | | | | | | | | | | | | | | | | | | | | | | | | | |
| – basic and diluted from continuing operations | | $ | 0.36 | | | $ | (1.93 | ) | | $ | (0.89 | ) | | $ | (1.55 | ) | | $ | 1.73 | | | $ | (0.03 | ) | | $ | (0.07 | ) | | $ | (1.81 | ) |
| – basic and diluted from discontinued operations | | | – | | | | – | | | | 0.21 | | | | (0.89 | ) | | | (0.01 | ) | | | – | | | | – | | | | (0.04 | ) |
| 1 | Refer to section 6,Non-GAAP measures. |
| 2 | Numbers exclude the Snowflake mill’s results from operations which have been reclassified as discontinued operations in the consolidated statements of earnings (loss) in the interim consolidated financial statements for the nine months ended September 30, 2013. |
Refer to section 1,Overview and highlights, and the discussion onConsolidated results of operations,for details of Q3 2013 results compared to Q2 2013.
Management uses certain measures that are not defined by U.S. GAAP to evaluate our performance and, as a result, the measures as employed by management may not be comparable to similarly titled measures reported by other entities. These non-GAAP measures should not be considered by an investor as an alternative to their nearest respective GAAP measure. Our non-GAAP measures include operating earnings (loss), adjusted EBITDA (earnings before interest, taxes, depreciation and amortization, impairment and other closure costs, and before other non-operating income and expenses), adjusted EBITDA before restructuring costs, adjusted EBITDA margin, adjusted EBITDA margin before restructuring costs, average delivered cash costs per tonne before specific items, net earnings (loss) attributable to the company before specific items, net earnings (loss) per share attributable to the company’s common shareholders before specific items, and free cash flow.
Specific items are items that do not arise from the company’s day-to-day operating, investing and financing activities, or items that are subject to material volatility based on factors outside of management’s control. Specific items include: foreign exchange gain or loss on long-term debt; gain or loss on cancellation of long-term debt; asset-impairment and other closure costs; restructuring costs; unusual non-recurring items; and certain income tax adjustments.
ADjusted EBITDA and adjusted EBITDA before restructuring costs
Adjusted EBITDA as defined equates to operating earnings (loss) plus depreciation and amortization and impairment and other closure costs. Adjusted EBITDA margin and adjusted EBITDA margin before restructuring costs are defined as adjusted EBITDA and adjusted EBITDA before restructuring costs as a percentage of sales.
These measures enable comparison of consolidated and segment operating results between periods without regard to debt service, income taxes, capital expenditure requirements, and specific items. These measures are provided to improve comparability between periods by eliminating the impact of financing (interest) and accounting (depreciation) items on our results.
| CATALYST PAPER 2013 THIRD QUARTER REPORT │MANAGEMENT’S DISCUSSION AND ANALYSIS | 23 |
Reconciliation to Net Earnings (Loss) Attributable to the Company:
| | | 2013 | | | 2012 | |
| (In millions of Canadian dollars) | | YTD | | | Q3 | | | Q2 | | | Q1 | | | Total | | | Q4 | | | Q3 | | | Q2 | | | Q1 | |
| | | | | | | | | | | | | | | | | | | | | | | | | | | | |
| Net earnings (loss) attributable to the company | | $ | (32.6 | ) | | $ | 5.2 | | | $ | (28.0 | ) | | $ | (9.8 | ) | | $ | 583.2 | | | $ | (35.2 | ) | | $ | 655.7 | | | $ | (11.7 | ) | | $ | (25.6 | ) |
| Net earnings (loss) attributable to non-controlling interest | | | 0.3 | | | | – | | | | – | | | | 0.3 | | | | 30.4 | | | | (1.5 | ) | | | 32.7 | | | | (0.6 | ) | | | (0.2 | ) |
| Net earnings (loss) | | | (32.3 | ) | | | 5.2 | | | | (28.0 | ) | | | (9.5 | ) | | | 613.6 | | | | (36.7 | ) | | | 688.4 | | | | (12.3 | ) | | | (25.8 | ) |
| Depreciation and amortization1 | | | 35.3 | | | | 11.5 | | | | 11.4 | | | | 12.4 | | | | 36.3 | | | | 12.9 | | | | 7.9 | | | | 7.7 | | | | 7.8 | |
| Foreign exchange (gain) loss on long-term debt1 | | | 9.4 | | | | (6.1 | ) | | | 9.6 | | | | 5.9 | | | | (20.8 | ) | | | 3.2 | | | | (25.2 | ) | | | 12.8 | | | | (11.6 | ) |
| Other (income) expense1 | | | (11.9 | ) | | | (2.8 | ) | | | (2.3 | ) | | | (6.8 | ) | | | 2.5 | | | | (0.1 | ) | | | 8.2 | | | | (10.4 | ) | | | 4.8 | |
| Interest expense, net1 | | | 28.3 | | | | 8.5 | | | | 8.7 | | | | 11.1 | | | | 71.9 | | | | 11.6 | | | | 16.3 | | | | 23.4 | | | | 20.6 | |
| Income tax expense (recovery) 1 | | | 0.1 | | | | 0.1 | | | | – | | | | – | | | | (0.9 | ) | | | 0.2 | | | | (1.6 | ) | | | 0.5 | | | | – | |
| Reorganization items, net1 | | | 1.2 | | | | – | | | | – | | | | 1.2 | | | | (663.7 | ) | | | 3.2 | | | | (685.3 | ) | | | (4.0 | ) | | | 22.4 | |
| (Earnings) loss from discontinued operations net of tax | | | (3.1 | ) | | | – | | | | – | | | | (3.1 | ) | | | 16.5 | | | | 12.9 | | | | 5.1 | | | | (0.7 | ) | | | (0.8 | ) |
| Adjusted EBITDA | | $ | 27.0 | | | $ | 16.4 | | | $ | (0.6 | ) | | $ | 11.2 | | | $ | 55.4 | | | $ | 7.2 | | | $ | 13.8 | | | $ | 17.0 | | | $ | 17.4 | |
| Restructuring costs | | | | | | | | | | | | | | | | | | | | | | | | | | | | | | | | | | | | |
| Specialty printing papers | | | – | | | | – | | | | – | | | | – | | | | 2.9 | | | | – | | | | 0.2 | | | | (0.1 | ) | | | 2.8 | |
| Newsprint | | | 0.1 | | | | – | | | | 0.1 | | | | – | | | | 0.8 | | | | – | | | | – | | | | – | | | | 0.8 | |
| Pulp | | | – | | | | – | | | | – | | | | – | | | | 1.6 | | | | – | | | | – | | | | – | | | | 1.6 | |
| Total restructuring costs | | | 0.1 | | | | – | | | | 0.1 | | | | – | | | | 5.3 | | | | – | | | | 0.2 | | | | (0.1 | ) | | | 5.2 | |
| | | | | | | | | | | | | | | | | | | | | | | | | | | | | | | | | | | | | |
Adjusted EBITDA before restructuring
costs | | $ | 27.1 | | | $ | 16.4 | | | $ | (0.5 | ) | | $ | 11.2 | | | $ | 60.7 | | | $ | 7.2 | | | $ | 14.0 | | | $ | 16.9 | | | $ | 22.6 | |
| 1 | Numbers exclude the Snowflake mill’s results from operations which have been reclassified as discontinued operations in the consolidated statements of earnings (loss) in the interim consolidated financial statements for the three and nine months ended September 30, 2013. |
| CATALYST PAPER 2013 THIRD QUARTER REPORT │MANAGEMENT’S DISCUSSION AND ANALYSIS | 24 |
Net Earnings (Loss) Attributable to the Company Before Specific Items
Specific items are defined previously, and the exclusion of such items from net earnings (loss) attributable to the company facilitates the comparison of financial results between periods.
Reconciliation to Net Earnings (Loss) Attributable to the Company:
| | | 2013 | | | 2012 | |
(In millions of Canadian dollars and after-taxes,
except where otherwise stated) | | YTD | | | Q3 | | | Q2 | | | Q1 | | | Total | | | Q4 | | | Q3 | | | Q2 | | | Q1 | |
| | | | | | | | | | | | | | | | | | | | | | | | | | | | |
| Net earnings (loss) attributable to the company | | $ | (32.6 | ) | | $ | 5.2 | | | $ | (28.0 | ) | | $ | (9.8 | ) | | $ | 583.2 | | | $ | (35.2 | ) | | $ | 655.7 | | | $ | (11.7 | ) | | $ | (25.6 | ) |
| Specific items: | | | | | | | | | | | | | | | | | | | | | | | | | | | | | | | | | | | | |
| Foreign exchange loss (gain) on long-term debt | | | 9.4 | | | | (6.1 | ) | | | 9.6 | | | | 5.9 | | | | (20.8 | ) | | | 3.2 | | | | (25.2 | ) | | | 12.8 | | | | (11.6 | ) |
| Settlement gain on special pension portability election | | | (2.6 | ) | | | (2.6 | ) | | | – | | | | – | | | | – | | | | – | | | | – | | | | – | | | | – | |
| Impairment (recovery) and other closure costs1 | | | 0.2 | | | | – | | | | – | | | | 0.2 | | | | 19.7 | | | | 11.0 | | | | 8.7 | | | | – | | | | – | |
| Restructuring costs1 | | | 0.5 | | | | – | | | | 0.1 | | | | 0.4 | | | | 6.4 | | | | 1.1 | | | | 0.2 | | | | (0.1 | ) | | | 5.2 | |
| Reorganization items, net1 | | | 1.1 | | | | – | | | | – | | | | 1.1 | | | | (667.5 | ) | | | 4.2 | | | | (688.1 | ) | | | (6.0 | ) | | | 22.4 | |
| Loss on purchase of Exit Notes | | | 2.3 | | | | – | | | | 2.3 | | | | – | | | | – | | | | – | | | | – | | | | – | | | | – | |
| Gain on sale of Elk Falls | | | (2.1 | ) | | | – | | | | (2.1 | ) | | | – | | | | – | | | | – | | | | – | | | | – | | | | – | |
| Gain on sale of Snowflake mill1 | | | (4.1 | ) | | | – | | | | – | | | | (4.1 | ) | | | – | | | | – | | | | – | | | | – | | | | – | |
| Gain on sale of interest in Powell River Energy | | | (5.3 | ) | | | – | | | | – | | | | (5.3 | ) | | | – | | | | – | | | | – | | | | – | | | | – | |
| Fair market adjustment to non-controlling interest | | | – | | | | – | | | | – | | | | – | | | | 41.2 | | | | – | | | | 41.2 | | | | – | | | | – | |
| | | | | | | | | | | | | | | | | | | | | | | | | | | | | | | | | | | | | |
| Net earnings (loss) attributable to the company before specific items | | $ | (33.2 | ) | | $ | (3.5 | ) | | $ | (18.1 | ) | | $ | (11.6 | ) | | $ | (37.8 | ) | | $ | (15.7 | ) | | $ | (7.5 | ) | | $ | (5.0 | ) | | $ | (9.6 | ) |
| | | | | | | | | | | | | | | | | | | | | | | | | | | | | | | | | | | | | |
| Net earnings (loss) per share attributable to the company’s common shareholders in dollars: | | | | | | | | | | | | | | | | | | | | | | | | | | | | | | | | | | | | |
| As reported (continuing operations) | | $ | (2.46 | ) | | $ | 0.36 | | | $ | (1.93 | ) | | $ | (0.89 | ) | | $ | 41.65 | | | $ | (1.55 | ) | | $ | 1.73 | | | $ | (0.03 | ) | | $ | (0.07 | ) |
| Before specific items | | | (2.29 | ) | | | (0.24 | ) | | | (1.25 | ) | | | (0.80 | ) | | | (2.62 | ) | | | (1.09 | ) | | | (0.02 | ) | | | (0.01 | ) | | | (0.03 | ) |
| 1 | Includes amounts classified to discontinued operations, net of tax in the consolidated statements of earnings (loss) in the interim consolidated financial statements for the three and nine months ended September 30, 2013. |
Free Cash Flow
Free cash flow excludes working capital and certain other sources and uses of cash, which are disclosed in the consolidated statements of cash flows. This measure allows us to assess our ability to generate funds to repay debt and assists in cash flow forecasting.
Reconciliation to Cash Provided by Operating Activities less Cash Used by Investing Activities:
| | | 2013 | | | 2012 | |
| (In millions of Canadian dollars) | | YTD | | | Q3 | | | Q2 | | | Q1 | | | Total | | | Q4 | | | Q3 | | | Q2 | | | Q1 | |
| | | | | | | | | | | | | | | | | | | | | | | | | | | | |
| Cash provided (used) by operating activities | | $ | (11.2 | ) | | $ | (13.0 | ) | | $ | 3.0 | | | $ | (1.2 | ) | | $ | 8.1 | | | $ | 52.1 | | | $ | (21.1 | ) | | $ | (8.2 | ) | | $ | (14.7 | ) |
| Cash provided (used) by investing activities | | | 35.4 | | | | (0.7 | ) | | | 19.7 | | | | 16.4 | | | | (9.6 | ) | | | (6.2 | ) | | | (0.6 | ) | | | 14.2 | | | | (17.0 | ) |
| Proceeds from the sale of property, plant and equipment and other assets | | | (51.9 | ) | | | (5.0 | ) | | | (8.6 | ) | | | (38.3 | ) | | | (12.3 | ) | | | (0.8 | ) | | | (3.6 | ) | | | (7.4 | ) | | | (0.5 | ) |
| Other investing activities | | | (0.1 | ) | | | 0.6 | | | | 0.5 | | | | (1.2 | ) | | | (3.7 | ) | | | – | | | | (0.5 | ) | | | (3.6 | ) | | | 0.4 | |
| Non-cash working capital changes except change in taxes and interest | | | 7.3 | | | | 26.1 | | | | (18.6 | ) | | | (0.2 | ) | | | (31.8 | ) | | | (58.8 | ) | | | 5.9 | | | | 7.3 | | | | 13.8 | |
| Other | | | (6.8 | ) | | | (7.2 | ) | | | (15.3 | ) | | | 15.7 | | | | 2.1 | | | | (10.1 | ) | | | 4.8 | | | | (7.1 | ) | | | 14.5 | |
| | | | | | | | | | | | | | | | | | | | | | | | | | | | | | | | | | | | | |
| Free cash flow | | $ | (27.3 | ) | | $ | 0.8 | | | $ | (19.3 | ) | | $ | (8.8 | ) | | $ | (47.2 | ) | | $ | (23.8 | ) | | $ | (15.1 | ) | | $ | (4.8 | ) | | $ | (3.5 | ) |
| CATALYST PAPER 2013 THIRD QUARTER REPORT │MANAGEMENT’S DISCUSSION AND ANALYSIS | 25 |
Management’s Calculation of Free Cash Flow:
| | | 2013 | | | 2012 | |
| (In millions of Canadian dollars) | | YTD | | | Q3 | | | Q2 | | | Q1 | | | Total | | | Q4 | | | Q3 | | | Q2 | | | Q1 | |
| | | | | | | | | | | | | | | | | | | | | | | | | | | | |
| Adjusted EBITDA | | $ | 27.0 | | | $ | 16.4 | | | $ | (0.6 | ) | | $ | 11.2 | | | $ | 55.4 | | | $ | 7.2 | | | $ | 13.8 | | | $ | 17.0 | | | $ | 17.4 | |
| Interest expense, excluding amortization | | | (26.8 | ) | | | (8.0 | ) | | | (8.2 | ) | | | (10.6 | ) | | | (22.7 | ) | | | (11.0 | ) | | | (4.7 | ) | | | (3.7 | ) | | | (3.3 | ) |
| Capital expenditures | | | (19.7 | ) | | | (5.3 | ) | | | (8.5 | ) | | | (5.9 | ) | | | (22.6 | ) | | | (10.4 | ) | | | (7.3 | ) | | | (3.0 | ) | | | (1.9 | ) |
| Reorganization costs | | | (0.6 | ) | | | – | | | | – | | | | (0.6 | ) | | | (37.5 | ) | | | (1.8 | ) | | | (12.7 | ) | | | (9.5 | ) | | | (13.5 | ) |
| Income taxes received (paid) | | | – | | | | – | | | | – | | | | – | | | | 0.2 | | | | – | | | | 0.2 | | | | – | | | | – | |
| Employee future benefits, expense over (under) cash contributions1 | | | (6.2 | ) | | | (2.3 | ) | | | (2.0 | ) | | | (1.9 | ) | | | (11.8 | ) | | | (3.4 | ) | | | (2.3 | ) | | | (3.2 | ) | | | (2.9 | ) |
| Net operating cash flow from discontinued operations | | | (1.0 | ) | | | – | | | | – | | | | (1.0 | ) | | | (8.2 | ) | | | (4.4 | ) | | | (2.1 | ) | | | (2.4 | ) | | | 0.7 | |
| Free cash flow | | $ | (27.3 | ) | | $ | 0.8 | | | $ | (19.3 | ) | | $ | (8.8 | ) | | $ | (47.2 | ) | | $ | (23.8 | ) | | $ | (15.1 | ) | | $ | (4.8 | ) | | $ | (3.5 | ) |
| 1 | Free cash flow is adjusted to reflect the cash impact of employee future benefits rather than the accounting expense which is included in adjusted EBITDA. |
| 7. | CRITICAL ACCOUNTING POLICIES AND ESTIMATES |
The preparation of financial statements in conformity with U.S. GAAP requires companies to establish accounting policies and to make estimates that affect both the amount and timing of recording of assets, liabilities, revenues and expenses. Some of these estimates require judgments about matters that are inherently uncertain and actual results could differ from estimates.
On an ongoing basis, we review our estimates based upon currently available information. The discussion on the accounting policies that require management's most difficult, subjective and complex judgments, and which are subject to a fair degree of measurement uncertainty can be found on pages 55 to 58 of the company's 2012 Annual Report.
Employee future benefits
Members of the Salaried Plan who exercised the election under the special portability election option received their lump-sum payments in July 2013.These lump-sum payments represented a partial settlement of the Salaried Plan in the third quarter. On the effective settlement date, deemed for accounting purposes to be July 1, 2013, we measured the fair value of plan assets and the projected benefit obligation of the Salaried Plan with the assistance of our independent actuaries and recognized a net actuarial gain of $15.1 million. The net actuarial gain included a settlement credit of $16.6 million; members who exercised the election exchanged pension benefits with total commuted value (defined below) of $59.6 million for reduced lump-sum payments (defined below) of $38.3 million and quarterly top-up payments over the next four years totaling 8% of commuted value with a present value of $4.7 million on July 1, 2013.
A portion of net actuarial gain of $2.6 million, pro-rated based on the percentage of benefit obligations settled under the special portability election option, was reclassified from accumulated other comprehensive income to earnings.
Reduced lump-sum payments were calculated as the commuted value of future pension payments multiplied by the solvency ratio of the Salaried Plan on December 31, 2012. Commuted value was the amount a plan member needed to invest on December 31, 2012 to provide for future pension benefits, incorporating an interest rate based on Government of Canada bonds.
See note 3,Significant accounting policies,and note 13,Employee future benefits, in our interim consolidated financial statements for the three and nine months ended September 30, 2013 for additional disclosure regarding the financial impact of the partial settlement of the Salaried Plan.
| CATALYST PAPER 2013 THIRD QUARTER REPORT │MANAGEMENT’S DISCUSSION AND ANALYSIS | 26 |
| 8. | CHANGES IN ACCOUNTING POLICIES |
There were no new pronouncements issued by the FASB that impacted our consolidated financial statements in Q3 2013.
| 9. | IMPACT OF ACCOUNTING PRONOUNCEMENTS AFFECTING FUTURE PERIODS |
There were no new pronouncements issued by the FASB that may impact our consolidated financial statements for future periods.
| 10. | RISKS AND UNCERTAINTIES |
We face risks and uncertainties which fall into the general business areas of markets, international commodity prices, currency exchange rates, environmental issues, fibre supply, government regulation and policy, and for Canadian companies, trade barriers and potential impacts of aboriginal rights, including unresolved aboriginal land claims in B.C. In addition, our proceedings under the CCAA will have a direct impact on our business.
In order to address these risks and effectively manage them, we have developed a process for managing risk and the interrelationship between risks and our strategic plan. We provide regular updates to the Audit Committee, work with corporate and operational management to identify, measure, and prioritize the critical risks facing the company, and manage these risks by ensuring that they are adequately addressed through mitigating procedures where appropriate. The objectives of the risk-management function include developing a common framework for understanding what constitutes principal business risks, ensuring that risk management activities are aligned with business strategies, and providing an effective mechanism for governance in the area of risk management.
A description of our risks and uncertainties can be found on pages 59 to 65 of our 2012 Annual Report.
The following update to risks and uncertainties under the heading “Increases in Energy Costs could have a Negative Impact on our Business” in our 2012 Annual Report are noted below:
Increases in energy costs could have a negative impact on our business
The rate increase effective April 1, 2012 was confirmed by the British Columbia Utilities Commission and was made up of a 3.9% rate increase together with a rate rider increase of 2.5%. A further 1.5% rate increase was approved commencing April 1, 2013. There remains a potential for further increases subject to rate review and approval by the British Columbia Utilities Commission.
| CATALYST PAPER 2013 THIRD QUARTER REPORT │MANAGEMENT’S DISCUSSION AND ANALYSIS | 27 |
Our earnings are sensitive to fluctuations in product prices, foreign exchange, energy and fibre costs as described on pages 66 to 67 of our 2012 Annual Report and summarized in the following table:
| (In millions of Canadian dollars, except per share amounts) | | Adjusted
EBITDA1 | | | Net
Earnings2 | | | Earnings
per Share | |
| | | | | | | | | | |
| Product prices3 | | | | | | | | | | | | |
| A US$10 per tonne change in the sales price of: | | | | | | | | | | | | |
| Specialty printing papers | | $ | 8 | | | $ | 6 | | | $ | 0.42 | |
| Newsprint | | | 3 | | | | 2 | | | | 0.14 | |
| Pulp | | | 4 | | | | 3 | | | | 0.19 | |
| | | | | | | | | | | | | |
| Foreign exchange4 | | | | | | | | | | | | |
| A US$0.01 change in the U.S. dollar relative to the Canadian dollar | | | 7 | | | | 5 | | | | 0.35 | |
| | | | | | | | | | | | | |
| Energy cost sensitivity5 | | | | | | | | | | | | |
| A 5% change in the price of: | | | | | | | | | | | | |
| Natural gas and oil – direct purchases | | | 1 | | | | 1 | | | | 0.05 | |
| Electricity – direct purchases | | | 7 | | | | 5 | | | | 0.35 | |
| | | | | | | | | | | | | |
| Freight cost sensitivity | | | | | | | | | | | | |
| A US$5/bbl change in the price of West Texas Int. (WTI) Oil | | | 9 | | | | 7 | | | | 0.46 | |
| | | | | | | | | | | | | |
| Fibre sensitivity5 | | | | | | | | | | | | |
| A US$5 per unit change in the price of: | | | | | | | | | | | | |
| Wood chips (Bdt) | | | 3 | | | | 2 | | | | 0.14 | |
| 1 | Refer to section 6,Non-GAAP measures. |
| 2 | Based on an expected tax rate of 26%. |
| 3 | Based on annualized sales of Q3 2013 and foreign exchange rate of US$0.96. |
| 4 | Based on Q3 2013 annualized net cash flows and a movement to US$0.97 from US$0.96 and excluding our hedging program and the impact of the translation of U.S. dollar-denominated debt. |
| 5 | Based on Q3 2013 annualized consumption levels and an exchange rate of US$0.96. |
| CATALYST PAPER 2013 THIRD QUARTER REPORT │MANAGEMENT’S DISCUSSION AND ANALYSIS | 28 |
Economy
The global economy continued to grow in the third quarter, fueled by economic recovery in the Eurozone and a positive long-term economic outlook in North America. Looking to the fourth quarter, a government shutdown in October has tempered growth expectations for the U.S. for the balance of the year, but is not expected to threaten the global economic recovery. Slower economic growth in Canada is expected to result in a weaker Canadian dollar in the fourth quarter.
Markets
Specialty printing paper markets are expected to remain challenging due to the continued migration to electronic media. However, the increase in demand for specialty paper in the current quarter is expected to continue in the fourth quarter due to seasonally stronger demand in the second half of the year. We expect that stronger market conditions for uncoated paper will support improved operating rates and price increases. We expect to fully implement the US$50 per short ton price increase on our uncoated mechanical high gloss grades that was announced and partially implemented in the third quarter. Weaker market conditions in the US for lightweight coated may result in moderately lower average prices in the fourth quarter. While directory paper is expected to continue its long-term decline due to paper conservation moves by publishers and migration to electronic media, the seasonal uptick in demand is expected to extend for the balance of the year.
While newsprint demand is expected to contract further due to declining circulation, page count reductions and other conservation measures by publishers, strong export markets are expected to partly mitigate continued demand losses in North America. We anticipate pricing in North America to remain firm for the balance of 2013.
The NBSK market will continue to strengthen for the balance of the year with strong operating rates and relatively low producer inventories. Price increases in China of US$20 per tonne in September and US$30 per tonne in October have been announced and implemented. Another increase of US$20 per tonne for November has been announced and will very likely be fully realized.
Operations
Maintenance spending is expected to increase in the fourth quarter due to a major maintenance outage on our recovery boiler at Crofton.
The following table summarizes major planned maintenance shutdown costs and related production downtime for 2013:
| | | 2013 | |
| | | Q1 | | | Q2 | | | Q3 | | | Q4 | | | Total | |
Mill
Location | | Tonnage
Impact | | | Mtce
Cost
($mm) | | | Tonnage
Impact | | | Mtce
Cost
($mm) | | | Tonnage
Impact | | | Mtce
Cost
($mm) | | | Tonnage
Impact | | | Mtce
Cost
($mm) | | | Tonnage
Impact | | | Mtce
Cost
($mm) | |
| Alberni | | | | | | | | | | | | | | | | | | | | | | | | | | | | | | | | | | | | | | | | |
| TMO | | | 5,500 | | | | 1.9 | | | | – | | | | – | | | | – | | | | – | | | | – | | | | – | | | | 5,500 | | | | 1.9 | |
| Boilers | | | – | | | | 0.6 | | | | – | | | | – | | | | – | | | | 0.2 | | | | – | | | | 1.3 | | | | – | | | | 2.1 | |
| Crofton | | | | | | | | | | | | | | | | | | | | | | | | | | | | | | | | | | | | | | | | |
| TMO | | | – | | | | – | | | | 8,100 | | | | 0.7 | | | | – | | | | – | | | | – | | | | – | | | | 8,100 | | | | 0.7 | |
| Pulp | | | – | | | | – | | | | 4,800 | | | | 6.6 | | | | – | | | | – | | | | 9,300 | | | | 7.4 | | | | 14,100 | | | | 14.0 | |
| Boilers | | | – | | | | – | | | | – | | | | – | | | | – | | | | 3.4 | | | | – | | | | – | | | | – | | | | 3.4 | |
| Powell | | | | | | | | | | | | | | | | | | | | | | | | | | | | | | | | | | | | | | | | |
| TMO | | | – | | | | – | | | | – | | | | – | | | | – | | | | – | | | | – | | | | – | | | | – | | | | – | |
| Capital | | | – | | | | – | | | | 1,600 | | | | – | | | | – | | | | – | | | | – | | | | – | | | | 1,600 | | | | – | |
| Boilers | | | – | | | | – | | | | – | | | | 2.5 | | | | – | | | | – | | | | – | | | | – | | | | – | | | | 2.5 | |
| Total | | | 5,500 | | | | 2.5 | | | | 14,500 | | | | 9.8 | | | | – | | | | 3.6 | | | | 9,300 | | | | 8.7 | | | | 29,300 | | | | 24.6 | |
The Crofton No. 1 machine will continue to be indefinitely curtailed in Q4.
Capital spending is expected to be approximately $25 million in 2013.
Liquidity, Debt Maturities and Covenants
We do not currently anticipate any significant uses of cash in Q4 other than for our operations, working capital fluctuations, interest payments, and pension funding of the Salaried DB Plan.
| CATALYST PAPER 2013 THIRD QUARTER REPORT │MANAGEMENT’S DISCUSSION AND ANALYSIS | 29 |
| 13. | DISCLOSURE CONTROLS AND INTERNAL CONTROL OVER FINANCIAL REPORTING |
A summary of our regulatory requirements for the evaluation of internal controls and subsequent reporting of the results of that evaluation can be found on page 69 of our 2012 Annual Report. Based on an evaluation of the design and operation of the company’s disclosure controls and procedures conducted under the supervision and with the participation of management, our chief executive officer and chief financial officer concluded that such disclosure controls and procedures (as defined in Canada under National Instrument 52-109 and in Rules 13a-15(e) and 15d-15(e) under theUnited States Securities Exchange Act of 1934), were effective as at December 31, 2012.
We did not make any significant changes in internal controls over financial reporting during the most recent three and nine month periods ended September 30, 2013 that have materially affected, or are reasonably likely to materially affect, our internal control over financial reporting. On March 20, 2013, we sold our interest in Powell River Energy, a variable interest entity in which we were the primary beneficiary until the sale of our interest. As a result our disclosure controls and procedures and internal controls no longer apply to the financial reporting of Powell River Energy and there is no need to reference any exclusion of the controls, policies and procedures of Powell River Energy going forward.
The company's Audit Committee, as part of its oversight role, has reviewed and recommended the approval of this MD&A to the Board of directors. The Board of directors has read and approved this MD&A.
| CATALYST PAPER 2013 THIRD QUARTER REPORT │MANAGEMENT’S DISCUSSION AND ANALYSIS | 30 |
CONSOLIDATED BALANCE SHEETS
| | | Successor | |
| | | September 30, | | | December 31, | |
| (In millions of Canadian dollars) | | 2013 | | | 2012 | |
| | | (unaudited) | | | | |
| Assets | | | | | | | | |
| Current assets | | | | | | | | |
| Cash and cash equivalents | | $ | 13.8 | | | $ | 16.6 | |
| Restricted cash | | | – | | | | 0.7 | |
| Accounts receivable (note 6) | | | 119.9 | | | | 114.0 | |
| Inventories (note 7) | | | 135.5 | | | | 125.0 | |
| Prepaids and other (note 8) | | | 9.4 | | | | 8.9 | |
| Assets held for sale (note 5) | | | 6.2 | | | | 34.3 | |
| | | | 284.8 | | | | 299.5 | |
| Property, plant and equipment (note 9) | | | 450.6 | | | | 611.6 | |
| Goodwill | | | 56.7 | | | | 56.7 | |
| Other assets (note 10) | | | 8.7 | | | | 11.0 | |
| | | $ | 800.8 | | | $ | 978.8 | |
| Liabilities | | | | | | | | |
| Current liabilities | | | | | | | | |
| Accounts payable and accrued liabilities (note 11) | | $ | 132.6 | | | $ | 113.8 | |
| Current portion of long-term debt (note 12) | | | 2.1 | | | | 6.6 | |
| Liabilities associated with assets held for sale (note 5) | | | – | | | | 15.2 | |
| | | | 134.7 | | | | 135.6 | |
| Long-term debt (note 12) | | | 293.7 | | | | 422.0 | |
| Employee future benefits (note 13) | | | 267.2 | | | | 289.7 | |
| Other long-term obligations | | | 9.0 | | | | 8.9 | |
| | | | 704.6 | | | | 856.2 | |
| Equity | | | | | | | | |
| Shareholders’ equity | | | | | | | | |
Common stock: no par value; unlimited shares authorized; issued
and outstanding: 14,527,571 shares (December 31, 2012 – 14,527,571 shares) | | | 144.9 | | | | 144.9 | |
Preferred stock: par value determined at time of issue; authorized
100,000,000 shares; issued and outstanding: nil shares | | | – | | | | – | |
| Deficit | | | (67.8 | ) | | | (35.2 | ) |
| Accumulated other comprehensive income | | | 19.1 | | | | 6.6 | |
| | | | 96.2 | | | | 116.3 | |
| Non-controlling interest | | | – | | | | 6.3 | |
| | | | 96.2 | | | | 122.6 | |
| | | $ | 800.8 | | | $ | 978.8 | |
The accompanying notes are an integral part of the consolidated financial statements.
| On behalf of the Board: | |
| | |
 |  |
| Joe Nemeth | Walter Jones |
| Director | Director |
| CATALYST PAPER 2013 THIRD QUARTER REPORT │CONSOLIDATED FINANCIAL STATEMENTS | 31 |
CONSOLIDATED STATEMENTS OF EARNINGS (LOSS)
| | | Three months
ended September 30, | | | Nine months
ended September 30, | |
| | | 2013 | | | 2012 | | | 2013 | | | 2012 | |
(Unaudited and in millions of Canadian dollars,
except where otherwise stated) | | Successor | | | Predecessor | | | Successor | | | Predecessor | |
| Sales | | $ | 268.8 | | | $ | 265.7 | | | $ | 779.3 | | | $ | 797.7 | |
| | | | | | | | | | | | | | | | | |
| Operating expenses | | | | | | | | | | | | | | | | |
| Cost of sales, excluding depreciation and amortization | | | 244.2 | | | | 243.6 | | | | 726.6 | | | | 718.0 | |
| Depreciation and amortization | | | 11.5 | | | | 7.9 | | | | 35.3 | | | | 23.4 | |
| Selling, general and administrative | | | 8.2 | | | | 8.1 | | | | 25.6 | | | | 26.2 | |
| Restructuring | | | – | | | | 0.2 | | | | 0.1 | | | | 5.3 | |
| | | | 263.9 | | | | 259.8 | | | | 787.6 | | | | 772.9 | |
| | | | | | | | | | | | | | | | | |
| Operating earnings (loss) | | | 4.9 | | | | 5.9 | | | | (8.3 | ) | | | 24.8 | |
| Interest expense, net | | | (8.5 | ) | | | (16.3 | ) | | | (28.3 | ) | | | (60.3 | ) |
| Foreign exchange gain (loss) on long-term debt | | | 6.1 | | | | 25.2 | | | | (9.4 | ) | | | 24.0 | |
| Other income (expense), net (note 14) | | | 2.8 | | | | (8.2 | ) | | | 11.9 | | | | (2.6 | ) |
| | | | | | | | | | | | | | | | | |
| Earnings (loss) before reorganization items and income taxes | | | 5.3 | | | | 6.6 | | | | (34.1 | ) | | | (14.1 | ) |
| Reorganization items, net | | | – | | | | 685.3 | | | | (1.2 | ) | | | 666.9 | |
| | | | | | | | | | | | | | | | | |
| Earnings (loss) before income taxes | | | 5.3 | | | | 691.9 | | | | (35.3 | ) | | | 652.8 | |
| Income tax expense (recovery) (note 15) | | | 0.1 | | | | (1.6 | ) | | | 0.1 | | | | (1.1 | ) |
| | | | | | | | | | | | | | | | | |
| Earnings (loss) from continuing operations | | | 5.2 | | | | 693.5 | | | | (35.4 | ) | | | 653.9 | |
| Earnings (loss) from discontinued operations, net of tax (note 5) | | | – | | | | (5.1 | ) | | | 3.1 | | | | (3.6 | ) |
| | | | | | | | | | | | | | | | | |
| Net earnings (loss) | | | 5.2 | | | | 688.4 | | | | (32.3 | ) | | | 650.3 | |
| Net earnings attributable to non-controlling interest | | | – | | | | (32.7 | ) | | | (0.3 | ) | | | (31.9 | ) |
| | | | | | | | | | | | | | | | | |
| Net earnings (loss) attributable to the company | | $ | 5.2 | | | $ | 655.7 | | | $ | (32.6 | ) | | $ | 618.4 | |
| | | | | | | | | | | | | | | | | |
| Basic and diluted net earnings (loss) per share from continuing operations attributable to the company’s common shareholders (in dollars) | | $ | 0.36 | | | $ | 1.73 | | | $ | (2.46 | ) | | $ | 1.63 | |
| Basic and diluted net earnings (loss) per share from discontinued operations attributable to the company’s common shareholders (in dollars) | | | – | | | | (0.01 | ) | | | 0.21 | | | | (0.01 | ) |
| Weighted average number of company common shares outstanding (in millions) | | | 14.5 | | | | 381.9 | | | | 14.5 | | | | 381.9 | |
The accompanying notes are an integral part of the consolidated financial statements.
| CATALYST PAPER 2013 THIRD QUARTER REPORT │CONSOLIDATED FINANCIAL STATEMENTS | 32 |
CONSOLIDATED STATEMENTS OF COMPREHENSIVE INCOME (LOSS)
| | | Three months
ended September 30, | | | Nine months
ended September 30, | |
| | | 2013 | | | 2012 | | | 2013 | | | 2012 | |
| (Unaudited and in millions of Canadian dollars) | | Successor | | | Predecessor | | | Successor | | | Predecessor | |
| Net earnings (loss) | | $ | 5.2 | | | $ | 688.4 | | | $ | (32.3 | ) | | $ | 650.3 | |
| | | | | | | | | | | | | | | | | |
| Other comprehensive income (loss), net of tax (expense) recovery: | | | | | | | | | | | | | | | | |
| | | | | | | | | | | | | | | | | |
| Employee future benefits liability adjustment | | | | | | | | | | | | | | | | |
| Gross amount | | | 12.5 | | | | (32.0 | ) | | | 12.5 | | | | (32.0 | ) |
| Tax (expense) recovery | | | – | | | | – | | | | – | | | | – | |
| | | | | | | | | | | | | | | | | |
| Net amount | | | 12.5 | | | | (32.0 | ) | | | 12.5 | | | | (32.0 | ) |
| | | | | | | | | | | | | | | | | |
| Reclassification of amortization of employee future benefits | | | | | | | | | | | | | | | | |
| Gross amount | | | – | | | | 1.3 | | | | – | | | | 3.9 | |
| Tax (expense) recovery | | | – | | | | (0.3 | ) | | | – | | | | (0.9 | ) |
| | | | | | | | | | | | | | | | | |
| Net amount | | | – | | | | 1.0 | | | | – | | | | 3.0 | |
| | | | | | | | | | | | | | | | | |
| Other comprehensive loss from continuing operations, net of tax | | | 12.5 | | | | (31.0 | ) | | | 12.5 | | | | (29.0 | ) |
| | | | | | | | | | | | | | | | | |
| Employee future benefits liability adjustment | | | | | | | | | | | | | | | | |
| Gross amount | | | – | | | | 0.3 | | | | – | | | | 0.3 | |
| Tax (expense) recovery | | | – | | | | – | | | | – | | | | – | |
| | | | | | | | | | | | | | | | | |
| Net amount | | | – | | | | 0.3 | | | | – | | | | 0.3 | |
| | | | | | | | | | | | | | | | | |
| Foreign currency translation adjustments, net of related hedging activities | | | | | | | | | | | | | | | | |
| Gross amount | | | – | | | | 4.4 | | | | – | | | | 4.0 | |
| Tax (expense) recovery | | | – | | | | – | | | | – | | | | – | |
| | | | | | | | | | | | | | | | | |
| Net amount | | | – | | | | 4.4 | | | | – | | | | 4.0 | |
| | | | | | | | | | | | | | | | | |
| Other comprehensive income from discontinued operations, net of tax | | | – | | | | 4.7 | | | | – | | | | 4.3 | |
| | | | | | | | | | | | | | | | | |
| Total comprehensive income (loss) | | | 17.7 | | | | 662.1 | | | | (19.8 | ) | | | 625.6 | |
| | | | | | | | | | | | | | | | | |
| Comprehensive income attributable to non-controlling interest: | | | | | | | | | | | | | | | | |
| Net earnings | | | – | | | | (32.7 | ) | | | (0.3 | ) | | | (31.9 | ) |
| | | | | | | | | | | | | | | | | |
| Comprehensive income (loss) attributable to the company | | $ | 17.7 | | | $ | 629.4 | | | $ | (20.1 | ) | | $ | 593.7 | |
The accompanying notes are an integral part of the consolidated financial statements.
| CATALYST PAPER 2013 THIRD QUARTER REPORT │CONSOLIDATED FINANCIAL STATEMENTS | 33 |
CONSOLIDATED STATEMENTS OF EQUITY (DEFICIENCY)
| | | Equity (Deficiency) attributable to the Company | | | | | | | |
| | | Common stock | | | | | | | | | | | | | | | | |
| (In millions of Canadian dollars) | | Number
of shares | | | $ | | | Additional
paid-in
capital | | | Deficit | | | Accumulated
other
comprehensive
income (loss) | | | Non-
controlling
interest
(deficit) | | | Total | |
| Balance as at December 31, 2011 (predecessor) | | | 381,900,450 | | | $ | 1,035.2 | | | $ | 16.6 | | | $ | (1,556.0 | ) | | $ | (89.4 | ) | | $ | (23.7 | ) | | $ | (617.3 | ) |
| Stock option compensation expense | | | – | | | | – | | | | 0.1 | | | | – | | | | – | | | | – | | | | 0.1 | |
| Net earnings | | | – | | | | – | | | | – | | | | 618.4 | | | | – | | | | 31.9 | | | | 650.3 | |
| Distributions to non-controlling interest | | | – | | | | – | | | | – | | | | – | | | | – | | | | (0.3 | ) | | | (0.3 | ) |
| Other comprehensive loss, net of tax | | | – | | | | – | | | | – | | | | – | | | | (24.7 | ) | | | – | | | | (24.7 | ) |
| Common shares issued | | | 14,400,000 | | | | 144.9 | | | | – | | | | – | | | | – | | | | – | | | | 144.9 | |
| Cancellation of Predecessor equity | | | (381,900,450 | ) | | | (1,035.2 | ) | | | (16.7 | ) | | | 937.6 | | | | 114.1 | | | | – | | | | (0.2 | ) |
| | | | | | | | | | | | | | | | | | | | | | | | | | | | | |
| Balance as at September 30, 2012 (successor) | | | 14,400,000 | | | $ | 144.9 | | | $ | – | | | $ | – | | | $ | – | | | $ | 7.9 | | | $ | 152.8 | |
| Common shares issued | | | 127,571 | | | | – | | | | – | | | | – | | | | – | | | | – | | | | – | |
| Net loss | | | – | | | | – | | | | – | | | | (35.2 | ) | | | – | | | | (1.5 | ) | | | (36.7 | ) |
| Distributions to non-controlling interest | | | – | | | | – | | | | – | | | | – | | | | – | | | | (0.1 | ) | | | (0.1 | ) |
| Other comprehensive income, net of tax | | | – | | | | – | | | | – | | | | – | | | | 6.6 | | | | – | | | | 6.6 | |
| Balance as at December 31, 2012 (successor) | | | 14,527,571 | | | $ | 144.9 | | | $ | – | | | $ | (35.2 | ) | | $ | 6.6 | | | $ | 6.3 | | | $ | 122.6 | |
| Net loss | | | – | | | | – | | | | – | | | | (32.6 | ) | | | – | | | | 0.3 | | | | (32.3 | ) |
| De-recognition of non-controlling interest | | | – | | | | – | | | | – | | | | – | | | | – | | | | (6.6 | ) | | | (6.6 | ) |
| Other comprehensive loss, net of tax | | | – | | | | – | | | | – | | | | – | | | | 12.5 | | | | – | | | | 12.5 | |
| | | | | | | | | | | | | | | | | | | | | | | | | | | | | |
| Balance as at September 30, 2013 (successor, unaudited) | | | 14,527,571 | | | $ | 144.9 | | | $ | – | | | $ | (67.8 | ) | | $ | 19.1 | | | $ | – | | | $ | 96.2 | |
The accompanying notes are an integral part of the consolidated financial statements.
| CATALYST PAPER 2013 THIRD QUARTER REPORT │CONSOLIDATED FINANCIAL STATEMENTS | 34 |
CONSOLIDATED STATEMENTS OF CASH FLOWS
| | | Three months
ended September 30, | | | Nine months
ended September 30, | |
| | | 2013 | | | 2012 | | | 2013 | | | 2012 | |
| (Unaudited and in millions of Canadian dollars) | | Successor | | | Predecessor | | | Successor | | | Predecessor | |
| Cash flows provided (used) by: | | | | | | | | | | | | | | | | |
| Operations | | | | | | | | | | | | | | | | |
| Net earnings (loss) | | $ | 5.2 | | | $ | 688.4 | | | $ | (32.3 | ) | | $ | 650.3 | |
| Items not requiring (providing) cash | | | | | | | | | | | | | | | | |
| Depreciation and amortization | | | 11.5 | | | | 7.9 | | | | 35.3 | | | | 23.4 | |
| Impairment and other closure costs | | | – | | | | 3.3 | | | | – | | | | 3.3 | |
| Deferred income taxes | | | – | | | | – | | | | – | | | | (0.7 | ) |
| Settlement gain on special pension portability election | | | (2.6 | ) | | | – | | | | (2.6 | ) | | | – | |
| Foreign exchange (gain) loss on long-term debt | | | (6.1 | ) | | | (25.2 | ) | | | 9.4 | | | | (24.0 | ) |
| Non-cash reorganization items | | | – | | | | (700.8 | ) | | | 0.5 | | | | (707.4 | ) |
| Non-cash interest on compromised notes | | | – | | | | 11.4 | | | | – | | | | 48.4 | |
| Employee future benefits, expense under cash contributions | | | (2.3 | ) | | | (2.3 | ) | | | (6.2 | ) | | | (8.4 | ) |
| (Gain) loss on disposal of property, plant and equipment | | | – | | | | 0.4 | | | | (0.7 | ) | | | (6.7 | ) |
| Gain on disposal of non-core assets1 | | | – | | | | – | | | | (11.5 | ) | | | – | |
| Loss on purchase of Floating Rate Notes | | | – | | | | – | | | | 2.2 | | | | – | |
| Other | | | 0.4 | | | | 1.1 | | | | 1.3 | | | | 2.6 | |
| Changes in non-cash working capital | | | | | | | | | | | | | | | | |
| Accounts receivable | | | (6.3 | ) | | | 0.7 | | | | (6.1 | ) | | | (22.9 | ) |
| Inventories | | | (3.1 | ) | | | 3.8 | | | | (10.0 | ) | | | 8.7 | |
| Prepaids and other | | | (3.8 | ) | | | 0.4 | | | | (1.3 | ) | | | (0.5 | ) |
| Accounts payable and accrued liabilities | | | (5.9 | ) | | | (10.2 | ) | | | 10.8 | | | | (10.1 | ) |
| Cash flows used by operations | | | (13.0 | ) | | | (21.1 | ) | | | (11.2 | ) | | | (44.0 | ) |
| Investing | | | | | | | | | | | | | | | | |
| Additions to property, plant and equipment | | | (5.3 | ) | | | (7.3 | ) | | | (19.7 | ) | | | (12.2 | ) |
| Proceeds from sale of property, plant and equipment | | | – | | | | 3.6 | | | | 0.8 | | | | 11.5 | |
| Proceeds from sale of non-core assets1 | | | 5.0 | | | | – | | | | 51.1 | | | | – | |
| Decrease (increase) in restricted cash | | | 0.2 | | | | 2.6 | | | | 3.1 | | | | (6.4 | ) |
| Decrease (increase) in other assets | | | (0.6 | ) | | | 0.5 | | | | 0.1 | | | | 3.7 | |
| Cash flows provided (used) by investing activities | | | (0.7 | ) | | | (0.6 | ) | | | 35.4 | | | | (3.4 | ) |
| Financing | | | | | | | | | | | | | | | | |
| Increase (decrease) in revolving loan | | | 11.8 | | | | 64.0 | | | | (12.2 | ) | | | 16.0 | |
| Increase in senior notes | | | – | | | | 33.1 | | | | – | | | | 33.1 | |
| Purchase of Floating Rate Notes | | | – | | | | – | | | | (15.8 | ) | | | – | |
| Decrease in debtor-in-possession (DIP) financing | | | – | | | | (70.6 | ) | | | – | | | | – | |
| Deferred financing costs | | | – | | | | (9.3 | ) | | | – | | | | (9.3 | ) |
| DIP financing costs | | | – | | | | (0.1 | ) | | | – | | | | (3.8 | ) |
| Decrease in other long-term debt | | | (0.3 | ) | | | (0.4 | ) | | | (0.9 | ) | | | (0.9 | ) |
| Share issue costs | | | – | | | | (0.2 | ) | | | – | | | | (0.2 | ) |
| Cash flows provided (used) by financing activities | | $ | 11.5 | | | $ | 16.5 | | | $ | (28.9 | ) | | $ | 34.9 | |
| Cash and cash equivalents, decrease in the period | | | (2.2 | ) | | | (5.2 | ) | | | (4.7 | ) | | | (12.5 | ) |
| Cash and cash equivalents, beginning of the period | | | 16.0 | | | | 17.8 | | | | 18.52 | | | | 25.1 | |
| Cash and cash equivalents, end of the period | | $ | 13.8 | | | $ | 12.6 | | | $ | 13.8 | | | $ | 12.6 | |
| Supplemental disclosures: | | | | | | | | | | | | | | | | |
| Income taxes paid (recovered) | | $ | 0.1 | | | $ | (0.2 | ) | | $ | 0.1 | | | $ | (0.2 | ) |
| Net interest paid | | | 8.0 | | | | 4.7 | | | | 26.8 | | | | 11.7 | |
| 1 | Non-core assets disposed of for the nine months ended September 30, 2013 included the Elk Falls site, the Snowflake mill, the company’s interest in Powell River Energy Inc, and the Port Alberni wastewater treatment facility. |
| 2 | Cash and cash equivalents at December 31, 2012 included $1.9 million recognized in assets held for sale. |
The accompanying notes are an integral part of the consolidated financial statements.
| CATALYST PAPER 2013 THIRD QUARTER REPORT │CONSOLIDATED FINANCIAL STATEMENTS | 35 |
CONSOLIDATED BUSINESS SEGMENTS
(Unaudited and in millions of Canadian dollars)
Three months ended September 30, 2013
(successor) | | Specialty
Printing
Papers | | | Newsprint | | | Pulp | | | Corporate
Adjustments | | | Total | |
| Sales to external customers | | $ | 164.6 | | | $ | 44.3 | | | $ | 59.9 | | | $ | – | | | $ | 268.8 | |
| Inter-segment sales | | | – | | | | – | | | | 6.6 | | | | (6.6 | ) | | | – | |
| Depreciation and amortization | | | 9.9 | | | | 1.1 | | | | 0.5 | | | | – | | | | 11.5 | |
| Operating earnings (loss) | | | (3.4 | ) | | | 1.4 | | | | 6.9 | | | | – | | | | 4.9 | |
| Additions to property, plant and equipment | | | 3.9 | | | | 0.6 | | | | 0.8 | | | | – | | | | 5.3 | |
Three months ended September 30, 2012
(predecessor) | | Specialty
Printing
Papers | | | Newsprint | | | Pulp | | | Corporate
Adjustments | | | Total | |
| Sales to external customers | | $ | 171.2 | | | $ | 45.6 | | | $ | 48.9 | | | $ | – | | | $ | 265.7 | |
| Inter-segment sales | | | – | | | | – | | | | 7.5 | | | | (7.5 | ) | | | – | |
| Depreciation and amortization | | | 6.4 | | | | 0.9 | | | | 0.6 | | | | – | | | | 7.9 | |
| Operating earnings (loss) | | | 8.5 | | | | 3.1 | | | | (5.7 | ) | | | – | | | | 5.9 | |
| Additions to property, plant and equipment | | | 5.9 | | | | 1.0 | | | | 0.4 | | | | – | | | | 7.3 | |
Nine months ended September 30, 2013
(successor) | | Specialty
Printing
Papers | | | Newsprint | | | Pulp | | | Corporate
Adjustments | | | Total | |
| Sales to external customers | | $ | 475.3 | | | $ | 140.3 | | | $ | 163.7 | | | $ | – | | | $ | 779.3 | |
| Inter-segment sales | | | – | | | | – | | | | 18.3 | | | | (18.3 | ) | | | – | |
| Depreciation and amortization | | | 30.4 | | | | 3.7 | | | | 1.2 | | | | – | | | | 35.3 | |
| Operating earnings (loss) | | | (17.0 | ) | | | 4.0 | | | | 4.7 | | | | – | | | | (8.3 | ) |
| Additions to property, plant and equipment | | | 12.7 | | | | 1.6 | | | | 5.4 | | | | – | | | | 19.7 | |
Nine months ended September 30, 2012
(predecessor) | | Specialty
Printing
Papers | | | Newsprint | | | Pulp | | | Corporate
Adjustments | | | Total | |
| Sales to external customers | | $ | 503.8 | | | $ | 134.1 | | | $ | 159.8 | | | $ | – | | | $ | 797.7 | |
| Inter-segment sales | | | – | | | | – | | | | 22.5 | | | | (22.5 | ) | | | – | |
| Depreciation and amortization | | | 18.9 | | | | 2.7 | | | | 1.8 | | | | – | | | | 23.4 | |
| Operating earnings (loss) | | | 19.3 | | | | 11.7 | | | | (6.2 | ) | | | – | | | | 24.8 | |
| Additions to property, plant and equipment | | | 9.2 | | | | 1.2 | | | | 1.8 | | | | – | | | | 12.2 | |
The accompanying notes are an integral part of the consolidated financial statements.
| CATALYST PAPER 2013 THIRD QUARTER REPORT │CONSOLIDATED FINANCIAL STATEMENTS | 36 |
NOTES TO CONSOLIDATED FINANCIAL STATEMENTS
(Unaudited and in millions of Canadian dollars, except where otherwise stated)
| Table of Contents | |
| | |
| Note 1 | Basis of Presentation | 38 |
| | | |
| Note 2 | Segmented Information | 38 |
| | | |
| Note 3 | Significant Accounting Policies | 39 |
| | | |
| Note 4 | Variable Interest Entities | 39 |
| | | |
| Note 5 | Assets Held for Sale and Discontinued Operations | 39 |
| | | |
| Note 6 | Accounts Receivable | 40 |
| | | |
| Note 7 | Inventories | 41 |
| | | |
| Note 8 | Prepaids and Other | 41 |
| | | |
| Note 9 | Property, Plant and Equipment | 41 |
| | | |
| Note 10 | Other Assets | 42 |
| | | |
| Note 11 | Accounts Payable and Accrued Liabilities | 42 |
| | | |
| Note 12 | Long-Term Debt | 43 |
| | | |
| Note 13 | Employee Future Benefits | 44 |
| | | |
| Note 14 | Other Income (Expense), Net | 46 |
| | | |
| Note 15 | Income Taxes | 46 |
| | | |
| Note 16 | Fair Value Measurement | 47 |
| | | |
| Note 17 | Financial Instruments | 47 |
| | | |
| Note 18 | Comparative Figures | 48 |
| CATALYST PAPER 2013 THIRD QUARTER REPORT │CONSOLIDATED FINANCIAL STATEMENTS | 37 |
NOTES TO CONSOLIDATED FINANCIAL STATEMENTS
(Unaudited and in millions of Canadian dollars, except where otherwise stated)
The consolidated financial statements include the accounts of Catalyst Paper Corporation and, from their respective dates of acquisition of control or formation, its wholly owned subsidiaries and partnerships (collectively, the company). All inter-company transactions and amounts have been eliminated on consolidation.
The accompanying unaudited interim consolidated financial statements have been prepared in accordance with United States generally accepted accounting principles (U.S. GAAP), on a basis consistent with those followed in the December 31, 2012 audited annual consolidated financial statements. These unaudited interim consolidated financial statements do not include all information and note disclosures required by U.S. GAAP for annual financial statements, and therefore should be read in conjunction with the December 31, 2012 audited consolidated financial statements and the notes thereto. In the opinion of the company, the unaudited interim consolidated financial statements contained herein contain all the information and note disclosures necessary to fairly present the results of the interim periods included. The results for the periods included herein may not be indicative of the results for the entire year.
Implementation of the plan of arrangement and the application of fresh start accounting on September 30, 2012 materially changed the carrying amounts and classifications reported in the company’s financial statements, and resulted in the company effectively becoming a new entity for financial reporting purposes. Accordingly, the company’s consolidated financial statements for periods prior to September 30, 2012 are not comparable to consolidated financial statements prepared for periods subsequent to September 30, 2012. References to Successor or Successor company refer to the company on or after September 30, 2012, and references to Predecessor or Predecessor company refer to the company prior to September 30, 2012.
The company is a significant specialty mechanical printing papers and newsprint producer in North America. The company operates in three business segments:
| Specialty printing papers | – Manufacture and sale of mechanical specialty printing papers |
| | |
| Newsprint | – Manufacture and sale of newsprint |
| | |
| Pulp | – Manufacture and sale of long-fibre Northern Bleached Softwood Kraft (NBSK) pulp |
The company owns and operates three manufacturing facilities in the province of British Columbia (B.C.), Canada.
The primary market for the company’s paper products is North America. The primary markets for the company’s pulp products are China.
| CATALYST PAPER 2013 THIRD QUARTER REPORT │CONSOLIDATED FINANCIAL STATEMENTS | 38 |
NOTES TO CONSOLIDATED FINANCIAL STATEMENTS
(Unaudited and in millions of Canadian dollars, except where otherwise stated)
| 3. | SIGNIFICANT ACCOUNTING POLICIES |
Employee future benefits
Members of thedefined benefit pension plan for salaried employees (Salaried Plan) who exercised the election under the special portability election option received their lump-sum payments in July 2013.The lump-sum payments represented a partial settlement of the Salaried Plan in the third quarter. The company elected a deemed settlement date for accounting purposes of July 1, 2013, to coincide with the monthly valuation of the investments that comprise the plan assets of the Salaried Plan. The company evaluated events, transactions, and market fluctuations affecting the Salaried Plan between July 1, 2013 and the various lump-sum payment dates in July, noting that the majority of payments were made in the first week of July, and concluded that the use of a deemed settlement date of July 1, 2013 did not have a material impact on the fair value of the projected benefit obligation and plan assets of the Salaried Plan.
See note 13,Employee future benefits, for additional disclosure regarding the financial impact of the partial settlement of the Salaried Plan.
Recently implemented accounting changes
There were no new pronouncements issued by the Financial Accounting Standards Board (FASB) that impacted the company’s consolidated financial statements in Q3 2013.
Changes in future accounting standards
There were no new pronouncements issued by the FASB that may materially impact the company’s consolidated financial statements for future periods.
| 4. | Variable interest entities |
The company has identified one potential VIE, but has not been able to obtain the financial information necessary to evaluate whether the entity is a VIE, or, if the entity is a VIE, whether the company is the primary beneficiary. The company has entered into a building lease agreement with this potential VIE whereby the company has agreed to continue making the prescribed lease payments directly to the financial institution holding the mortgage on the building in the event the lessor is no longer able to meet its contractual obligations. As at September 30, 2013 the principal amount of the mortgage was $1.5 million (December 31, 2012 - $3.0 million). This agreement does not increase the company’s liability beyond the obligation under the building lease.
| 5. | ASSETS HELD FOR SALE AND DISCONTINUED OPERATIONS |
The company completed the sale of its wastewater treatment facility and related infrastructure to the City of Port Alberni on September 30, 2013 for proceeds of $5.8 million. Assets sold had a net book value of $5.8 million and included the 13.4 hectare wastewater treatment facility and 3.9 hectare parcel of lands combined with a road dedication to facilitate development of an industrial truck route along the waterfront.
The company will settle the mortgage receivable from PRSC Limited Partnership and sell its interest in PRSC Land Developments Ltd. for proceeds of approximately $3.0 million. The company continues to actively market the remaining poplar plantation land. These assets were reported as held for sale in the consolidated balance sheets as of September 30, 2013.
| CATALYST PAPER 2013 THIRD QUARTER REPORT │CONSOLIDATED FINANCIAL STATEMENTS | 39 |
NOTES TO CONSOLIDATED FINANCIAL STATEMENTS
(Unaudited and in millions of Canadian dollars, except where otherwise stated)
A summary of major classes of assets and liabilities classified as held for sale is as follows:
| | | Successor | |
| | | September 30,
2013 | | | December 31,
2012 | |
| Cash and cash equivalents | | $ | – | | | $ | 1.9 | |
| Restricted cash | | | – | | | | 2.3 | |
| Accounts receivable | | | – | | | | 0.5 | |
| Inventories | | | – | | | | 0.6 | |
| Property, plant and equipment | | | 3.4 | | | | 24.7 | |
| Other assets | | | 2.8 | | | | 4.3 | |
| Assets held for sale | | | 6.2 | | | | 34.3 | |
| Accounts payable and accrued liabilities | | | – | | | | 15.2 | |
| Liabilities associated with assets held for sale | | $ | – | | | $ | 15.2 | |
The operations of the Snowflake mill were classified as a discontinued operation. A breakdown of earnings (loss) from discontinued operations, net of tax was as follows:
| | | Three months
ended September 30, | | | Nine months
ended September 30, | |
| | | 2013 | | | 2012 | | | 2013 | | | 2012 | |
| | | Successor | | | Predecessor | | | Successor | | | Predecessor | |
| Sales | | $ | – | | | $ | 46.2 | | | $ | 0.7 | | | $ | 142.8 | |
| Cost of sales, excluding depreciation and amortization | | | – | | | | (44.1 | ) | | | (1.1 | ) | | | (142.4 | ) |
| Depreciation and amortization | | | – | | | | – | | | | – | | | | – | |
| Impairment, severances and other closure costs | | | – | | | | (8.7 | ) | | | (0.2 | ) | | | (8.7 | ) |
| Interest expense | | | | | | | (0.1 | ) | | | – | | | | (0.1 | ) |
| Restructuring costs | | | – | | | | – | | | | (0.4 | ) | | | – | |
| Other expense, net | | | – | | | | – | | | | (0.1 | ) | | | – | |
| Gain on sale of assets of Snowflake and shares of Apache Railway | | | – | | | | – | | | | 4.1 | | | | – | |
| Reorganization items, net | | | – | | | | 2.8 | | | | 0.1 | | | | 4.8 | |
| Income tax expense | | | – | | | | (1.2 | ) | | | – | | | | – | |
Earnings (loss) from discontinued operations,
net of tax | | $ | – | | | $ | (5.1 | ) | | $ | 3.1 | | | $ | (3.6 | ) |
The components of accounts receivable were as follows:
| | | Successor | |
| | | September 30,
2013 | | | December 31,
2012 | |
| Trade receivables | | $ | 114.6 | | | $ | 94.7 | |
| Less allowance for doubtful accounts | | | (1.9 | ) | | | (2.2 | ) |
| Trade receivables, net | | | 112.7 | | | | 92.5 | |
| Sales taxes receivable | | | 2.3 | | | | 12.6 | |
| Other receivables | | | 4.9 | | | | 8.9 | |
| | | $ | 119.9 | | | $ | 114.0 | |
Accounts receivable are pledged as collateral against the long-term debt of the company. See note 12,Long-term debt, for detailed disclosure of the collateral arrangements of the company.
| CATALYST PAPER 2013 THIRD QUARTER REPORT │CONSOLIDATED FINANCIAL STATEMENTS | 40 |
NOTES TO CONSOLIDATED FINANCIAL STATEMENTS
(Unaudited and in millions of Canadian dollars, except where otherwise stated)
The components of inventories were as follows:
| | | Successor | |
| | | September 30,
2013 | | | December 31,
2012 | |
| Finished goods | | | | | | | | |
| Specialty printing papers | | $ | 26.4 | | | $ | 22.3 | |
| Newsprint | | | 8.8 | | | | 7.7 | |
| Pulp | | | 3.0 | | | | 3.9 | |
| Total finished goods | | | 38.2 | | | | 33.9 | |
| Work-in-progress | | | 0.9 | | | | 0.9 | |
| Raw materials – wood chips, pulp logs and other | | | 22.9 | | | | 23.1 | |
| Operating and maintenance supplies and spare parts | | | 73.5 | | | | 67.1 | |
| | | $ | 135.5 | | | $ | 125.0 | |
At September 30, 2013 the company had applied write-downs of $0.1 million to finished goods inventory (December 31, 2012 – $0.1 million) and $0.1 million to raw materials inventory (December 31, 2012 – $0.8 million).
Inventories are pledged as collateral against the long-term debt of the company. See note 12,Long-term debt, for detailed disclosure of the collateral arrangements of the company.
The components of prepaids and other were as follows:
| | | Successor | |
| | | September 30,
2013 | | | December 31,
2012 | |
| Property taxes, insurance and licenses | | $ | 7.6 | | | $ | 3.2 | |
| Other | | | 1.8 | | | | 5.7 | |
| | | $ | 9.4 | | | $ | 8.9 | |
Prepaids and other assets are pledged as collateral against the long-term debt of the company. See note 12,Long-term debt, for detailed disclosure of the collateral arrangements of the company.
| 9. | PROPERTY, PLANT AND EQUIPMENT |
The components of property, plant and equipment were as follows:
| | | Successor | |
| | | September 30,
2013 | | | December 31,
2012 | |
| Cost | | $ | 495.2 | | | $ | 624.5 | |
| Accumulated depreciation, amortization and impairment | | | 44.6 | | | | 12.9 | |
| Net book value | | $ | 450.6 | | | $ | 611.6 | |
Property, plant and equipment are pledged as collateral against the long-term debt of the company. See note 12,Long-term debt, for detailed disclosure of the collateral arrangements of the company.
| CATALYST PAPER 2013 THIRD QUARTER REPORT │CONSOLIDATED FINANCIAL STATEMENTS | 41 |
NOTES TO CONSOLIDATED FINANCIAL STATEMENTS
(Unaudited and in millions of Canadian dollars, except where otherwise stated)
The components of other assets were as follows:
| | | Successor | |
| | | September 30,
2013 | | | December 31,
2012 | |
| Deferred financing costs | | $ | 5.3 | | | $ | 9.0 | |
| Deferred charges and other | | | 3.2 | | | | 1.8 | |
| Accrued benefit asset – pension plan (note 13) | | | 0.2 | | | | 0.2 | |
| | | $ | 8.7 | | | $ | 11.0 | |
Other assets are pledged as collateral against the long-term debt of the company. See note 12,Long-term debt, for detailed disclosure of the collateral arrangements of the company.
| 11. | Accounts payable and accrued liabilities |
The components of accounts payable and accrued liabilities were as follows:
| | | Successor | |
| | | September 30,
2013 | | | December 31,
2012 | |
| Trade payables | | $ | 65.0 | | | $ | 54.4 | |
| Accrued payroll and related liabilities | | | 32.6 | | | | 23.6 | |
| Accrued interest | | | 12.3 | | | | 11.7 | |
| Accrued benefit obligation – pension plan | | | 8.6 | | | | 7.4 | |
| Accrued benefit obligation – other employee future benefit plans | | | 5.8 | | | | 5.8 | |
| Payables related to capital projects | | | 1.9 | | | | 3.9 | |
| Other | | | 6.4 | | | | 7.0 | |
| | | $ | 132.6 | | | $ | 113.8 | |
| CATALYST PAPER 2013 THIRD QUARTER REPORT │CONSOLIDATED FINANCIAL STATEMENTS | 42 |
NOTES TO CONSOLIDATED FINANCIAL STATEMENTS
(Unaudited and in millions of Canadian dollars, except where otherwise stated)
| | | Successor | |
| Recourse | | September 30,
2013 | | | December 31,
2012 | |
| Floating rate senior secured notes, due September 2016 (US$19.4 million; December 31, 2012 – US$35.0 million) | | $ | 19.5 | | | $ | 33.9 | |
| Senior secured notes, 11.0% due October 2017 (US$250.0 million) | | | 257.1 | | | | 248.7 | |
| | | | 276.6 | | | | 282.6 | |
| Revolving asset based loan facility of up to $175.0 million due July 2017 | | | 11.8 | | | | 24.0 | |
| Capital lease obligations | | | 7.4 | | | | 8.2 | |
| | | | 295.8 | | | | 314.8 | |
| Non-recourse | | | | | | | | |
| First mortgage bonds, 6.447% due July 2016 | | | – | | | | 95.0 | |
| Subordinated promissory notes | | | – | | | | 18.8 | |
| | | | – | | | | 113.8 | |
| Total debt | | | 295.8 | | | | 428.6 | |
| Less: current portion | | | (2.1 | ) | | | (6.6 | ) |
| Total long-term debt | | $ | 293.7 | | | $ | 422.0 | |
| | | | | | | | | |
The indentures governing the company’s US$250.0 million senior secured notes (2017 Notes) and US$19.4 million floating rate senior secured notes (Floating Rate Notes) contain customary restrictive covenants, including restrictions on incurring additional indebtedness, certain restricted payments, including dividends and investments in other persons, the creation of liens, sale and leaseback transactions, certain amalgamations, mergers, consolidations and the use of proceeds arising from certain sales of assets and certain transactions with affiliates. Collateral provided on the 2017 Notes consists of a first charge on substantially all of the assets of the company, other than (i) a senior collateral charge on the Floating Rate Notes, and (ii) the ABL First Charge Collateral, as described below (2017 Notes First Charge Collateral), and a second charge on the senior collateral charge on the Floating Rate Notes and the ABL First Charge Collateral. The Floating Rate Notes are secured by a charge on the assets of the company that ranks senior to the lien securing the 2017 Notes (Floating Rate Notes First Charge Collateral). The indentures governing the Floating Rate Notes and 2017 Notes limit the ability of the company to incur debt, other thanpermitted debt, while the company cannot meet a fixed charge coverage ratio of 2.0:1. The company’s fixed charge coverage ratio under these indentures, calculated on a 12-month trailing average, was 0.5:1.0 at September 30, 2013.
The company cannot make any restricted payments, including paying any dividends, except to the extent the balance in its restricted payments basket is positive. The restricted payments basket under the 2017 Notes was negative $45.1 million as at September 30, 2013.
Security for the $175.0 million ABL Facility consists of a first charge on accounts receivable, inventory and cash of the company (ABL First Charge Collateral) and a second charge of the 2017 Notes First Charge Collateral. Availability under the ABL Facility is determined by a borrowing base calculated primarily on eligible accounts receivable and eligible inventory, less certain reserves. The borrowing base at September 30, 2013, includes reserves for a landlord waiver reserve in respect of rent of approximately $2.3 million, a pension reserve not exceeding the sum of normal cost pension contributions, special and catch-up payments and any other payments in respect of a Canadian pension plan that are past due of approximately $1.3 million, a reserve for credit insurance deductibles of $1.8 million, a reserve of $1.3 million for employee source deductions, a reserve for workers compensation of $0.3 million and a $0.2 million purchasing card reserve. After deducting outstanding drawings of $11.8 million and outstanding letters of credit of $19.8 million, $114.2 million was available under the ABL Facility, before potential application of the springing fixed charge coverage ratio. The company also had an additional $13.8 million of cash on hand on September 30, 2013.
At September 30, 2013 the company was in compliance with its covenants under the ABL Facility and under each of the indentures governing its outstanding senior notes.
| CATALYST PAPER 2013 THIRD QUARTER REPORT │CONSOLIDATED FINANCIAL STATEMENTS | 43 |
NOTES TO CONSOLIDATED FINANCIAL STATEMENTS
(Unaudited and in millions of Canadian dollars, except where otherwise stated)
The company’s long-term debt is recorded at amortized cost. The following table contains information about management’s best estimate of the fair value of the company’s debt:
| | | Successor | |
| | | September 30, | | | December 31, | |
| | | 2013 | | | 2012 | |
| | | Carrying
Value | | | Fair
Value | | | Carrying
Value | | | Fair
Value | |
| Recourse | | $ | 295.8 | | | $ | 190.8 | | | $ | 314.8 | | | $ | 262.5 | |
| Non-recourse | | | – | | | | – | | | | 113.8 | | | | 113.8 | |
The fair value of the company’s long-term recourse debt related to its senior notes is determined based on quoted market prices of identical debt instruments. The fair value of the company’s recourse debt related to the ABL Facility is measured by discounting the respective cash flows at quoted market rates for similar debt having the same maturity. In measuring fair value, the company incorporates credit valuation adjustments to reflect its own non-performance risk, where applicable.
| 13. | Employee future benefits |
The company maintains pension benefit plans for all salaried employees, which include defined benefit and defined contribution segments. Employees hired subsequent to January 1, 1994 enroll in the defined contribution segment. Effective January 1, 2010 employees in the defined benefit plan ceased to accrue benefits under the defined benefit segment of the plan and began to participate in the defined contribution segment of the plan. The company also maintains pension benefits for former hourly employees that are not covered by union pension plans. Unionized employees of the company are members of multi-employer industry-wide pension plans to which the company contributes a predetermined amount per hour worked by an employee.
The company provides other benefit plans consisting of provincial medical plan premiums, extended health care and dental benefits to employees. A description of recent changes to pension and other benefit plans can be found on pages 106 and 107 of the company’s 2012 Annual Report.
For the three and nine months ended September 30, 2013 the company incurred total post-retirement benefit costs of $5.1 million and $15.4 million, respectively (three and nine months ended September 30, 2012 – $7.1 million and $22.1 million).
For the three and nine months ended September 30, 2013 the company contributed $7.4 million and $21.8 million, respectively (three and nine months ended September 30, 2012 - $9.1 million and $30.2 million), for employee future benefits which include cash contributed to the company’s funded pension plans, cash payments directly to beneficiaries for its unfunded benefit plans, cash contributions to its defined contribution plans and cash contributed to its multi-employer industry-wide pension plans.
| CATALYST PAPER 2013 THIRD QUARTER REPORT │CONSOLIDATED FINANCIAL STATEMENTS | 44 |
NOTES TO CONSOLIDATED FINANCIAL STATEMENTS
(Unaudited and in millions of Canadian dollars, except where otherwise stated)
Components of net periodic benefit cost recognized in the period were as follows:
| | | Three months
ended September 30, | | | Nine months
ended September 30, | |
| | | 2013 | | | 2012 | | | 2013 | | | 2012 | |
| Pension benefit plans | | Successor | | | Predecessor | | | Successor | | | Predecessor | |
| Defined benefit plan | | | | | | | | | | | | | | | | |
| Service cost for the period | | $ | 0.3 | | | $ | 0.4 | | | $ | 0.8 | | | $ | 1.0 | |
| Interest cost | | | 3.2 | | | | 4.1 | | | | 10.7 | | | | 12.3 | |
| Expected return on assets | | | (3.0 | ) | | | (3.8 | ) | | | (10.3 | ) | | | (11.2 | ) |
| Reversal of downsizing program | | | – | | | | (0.2 | ) | | | – | | | | (0.2 | ) |
| Amortization of unrecognized items: | | | | | | | | | | | | | | | | |
| Actuarial losses | | | – | | | | 2.2 | | | | – | | | | 6.4 | |
| Prior service costs | | | – | | | | 0.1 | | | | – | | | | 0.3 | |
| | | | 0.5 | | | | 2.8 | | | | 1.2 | | | | 8.6 | |
| Defined contribution plan | | | | | | | | | | | | | | | | |
| Service cost for the period | | | 0.6 | | | | 0.7 | | | | 1.9 | | | | 2.4 | |
Multi-employer industry-wide pension
plan service cost for the period | | | 2.1 | | | | 2.4 | | | | 6.6 | | | | 7.5 | |
Net periodic benefit cost for pension
benefit plans | | $ | 3.2 | | | $ | 5.9 | | | $ | 9.7 | | | $ | 18.5 | |
| | | Three months
ended September 30, | | | Nine months
ended September 30, | |
| | | 2013 | | | 2012 | | | 2013 | | | 2012 | |
| Other post-retirement benefit plans | | Successor | | | Predecessor | | | Successor | | | Predecessor | |
| Service cost for the period | | $ | 0.4 | | | $ | 0.4 | | | $ | 1.3 | | | $ | 1.0 | |
| Interest cost | | | 1.5 | | | | 1.7 | | | | 4.4 | | | | 5.3 | |
| Amortization of unrecognized items: | | | | | | | | | | | | | | | | |
| Actuarial losses | | | – | | | | 0.1 | | | | – | | | | 0.1 | |
| Prior service costs | | | – | | | | (1.0 | ) | | | – | | | | (2.8 | ) |
Net periodic benefit cost for other
benefit plans | | $ | 1.9 | | | $ | 1.2 | | | $ | 5.7 | | | $ | 3.6 | |
Accounting Impact of Special Portability Option
Members of the Salaried Plan who exercised the election under the special portability election option received their lump-sum payments in July 2013.These lump-sum payments represented a partial settlement of the Salaried Plan in the third quarter. On the effective settlement date, deemed for accounting purposes to be July 1, 2013, the company measured the fair value of plan assets and the projected benefit obligation of the Salaried Plan with the assistance of its independent actuaries. The company recognized a net actuarial gain of $15.1 million in other comprehensive income, consisting of an actuarial gain of $6.2 million with respect to members remaining in the plan, and an actuarial gain of $8.9 million with respect to members electing to settle their benefits under the special portability election option. The net actuarial gain included a settlement credit of $16.6 million; members who exercised the election exchanged pension benefits with total commuted value (defined below) of $59.6 million for reduced lump-sum payments (defined below) of $38.3 million and quarterly top-up payments over the next four years totaling 8% of commuted value with a present value of $4.7 million on July 1, 2013.
A portion of net actuarial gain of $2.6 million, pro-rated based on the percentage of benefit obligations settled under the special portability election option, was reclassified from accumulated other comprehensive income to earnings.
Reduced lump-sum payments were calculated as the commuted value of future pension payments multiplied by the solvency ratio of the Salaried Plan on December 31, 2012. Commuted value was the amount a plan member needed to invest on December 31, 2012 to provide for future pension benefits, incorporating an interest rate based on Government of Canada bonds. At September 30, 2013, the Salaried Plan had a projected benefit obligation of $237.8 million (December 31, 2012– $300.6 million) and the fair value of plan assets were $180.5 million (December 31, 2012 – $220.4 million).
| CATALYST PAPER 2013 THIRD QUARTER REPORT │CONSOLIDATED FINANCIAL STATEMENTS | 45 |
NOTES TO CONSOLIDATED FINANCIAL STATEMENTS
(Unaudited and in millions of Canadian dollars, except where otherwise stated)
Significant Assumptions
Actuarial assumptions used in accounting for the Salaried Plan are described below. Note that other company-maintained benefit plans were not re-measured in the period. With the exception of the assumed liability discount rate, calculations incorporated the same actuarial assumptions adopted for determining the December 31, 2012 valuation of the Salaried Plan. For the portion of the benefit obligation related to members remaining in the Salaried Plan, the assumed liability discount rate was 4.2% compared to 4.0% as of December 31, 2012. For the portion of the benefit obligation related to members who elected to settle their benefits under the special portability election option, the assumed liability discount rate was 2.4% for the first 10 years and 3.6% per year thereafter, reflecting the actual cost of settling the benefits as of the effective settlement date.
| 14. | OTHER INCOME (EXPENSE), NET |
The components of other income (expense), net were as follows:
| | | Three months
ended September 30, | | | Nine months
ended September 30, | |
| | | 2013 | | | 2012 | | | 2013 | | | 2012 | |
| | | Successor | | | Predecessor | | | Successor | | | Predecessor | |
| Gain (loss) on derivative financial instruments | | $ | 0.1 | | | $ | – | | | $ | 0.1 | | | $ | (1.2 | ) |
| Foreign exchange gain (loss) on working capital balances | | | – | | | | (7.8 | ) | | | 3.0 | | | | (7.9 | ) |
| Settlement gain on special pension portability election (note 13) | | | 2.6 | | | | – | | | | 2.6 | | | | – | |
| Gain (loss) on disposal of property, plant and equipment | | | – | | | | (0.4 | ) | | | 0.7 | | | | 6.7 | |
| Gain on disposal of interest in PREI | | | – | | | | – | | | | 5.3 | | | | – | |
| Gain on sale of Elk Falls site | | | – | | | | – | | | | 2.1 | | | | – | |
| Loss on purchase of Floating Rate Notes | | | – | | | | – | | | | (2.3 | ) | | | – | |
| Other | | | 0.1 | | | | – | | | | 0.4 | | | | (0.2 | ) |
| | | $ | 2.8 | | | $ | (8.2 | ) | | $ | 11.9 | | | $ | (2.6 | ) |
Asat September 30, 2013 the company has provided for a valuation allowance on its deferred tax assets of $239.8 million ($233.7 million at December 31, 2012). The effective rate for the quarter ended September 30, 2013 was nil%. The effective rate is less than the statutory rate primarily due to adjustments to deferred income taxes arising from the 1% increase in the statutory tax rate and adjustments to the valuation allowance. A description of the company’s income taxes can be found on pages 115 to 118 of the company’s 2012 Annual Report.
| CATALYST PAPER 2013 THIRD QUARTER REPORT │CONSOLIDATED FINANCIAL STATEMENTS | 46 |
NOTES TO CONSOLIDATED FINANCIAL STATEMENTS
(Unaudited and in millions of Canadian dollars, except where otherwise stated)
| 16. | Fair value measurement |
An established fair value hierarchy requires the company to maximize the use of observable inputs and minimize the use of unobservable inputs when measuring fair value. A financial instrument’s categorization within the fair value hierarchy is based upon the lowest level of input that is available and significant to the fair value measurement. There are three levels of inputs that may be used to measure fair value.
Level 1
Quoted prices in active markets for identical assets or liabilities.
Level 2
Observable inputs other than quoted prices in active markets for identical assets and liabilities, such as quoted prices for identical or similar assets or liabilities in markets that are not active, or other inputs that are observable or can be corroborated by observable market data for substantially the full term of the assets or liabilities.
Level 3
Inputs that are generally unobservable and are supported by little or no market activity and that are significant to the fair value determination of the assets or liabilities.
As at September 30, 2013 the company did not have any currency or commodity contracts which have been designated as hedging instruments.
The carrying value of the company’s other financial instruments, namely cash and cash equivalents, accounts receivable, accounts payable and accrued liabilities approximate their fair values because of the short-term maturity of these instruments.
Financial Risk Management
Financial instruments of the company consist primarily of cash and cash equivalents, accounts receivable, accounts payable and accrued liabilities and long-term debt.
The company has exposure to risk from its financial instruments, specifically credit risk, market risk (including currency, price and interest rate risk) and liquidity risk. A summary of the company’s financial risk management objectives can be found on pages 125 to 127 of the company’s 2012 Annual Report.
The company is exposed to credit risk on accounts receivable from its customers who are mainly in the newspaper publishing and commercial printing businesses. Aging of receivables were as follows:
| | | Successor | |
| | | September 30,
2013 | | | December 31,
2012 | |
| Trade receivables | | | | | | | | |
| Current | | $ | 104.5 | | | $ | 86.3 | |
| Past due 1-30 days | | | 6.9 | | | | 7.3 | |
| Past due 31-90 days | | | 0.6 | | | | 0.2 | |
| Past due over 90 days | | | 2.6 | | | | 0.9 | |
| | | | 114.6 | | | | 94.7 | |
| Less allowance for doubtful accounts | | | (1.9 | ) | | | (2.2 | ) |
| Trade receivables, net | | $ | 112.7 | | | $ | 92.5 | |
| CATALYST PAPER 2013 THIRD QUARTER REPORT │CONSOLIDATED FINANCIAL STATEMENTS | 47 |
NOTES TO CONSOLIDATED FINANCIAL STATEMENTS
(Unaudited and in millions of Canadian dollars, except where otherwise stated)
The movement in the allowance for doubtful accounts in respect of trade receivables was as follows:
| | | Successor | |
| | | September 30,
2013 | | | December 31,
2012 | |
| Balance, beginning of period | | $ | 2.2 | | | $ | – | |
| Increase (decrease) in provision | | | (0.3 | ) | | | 2.2 | |
| Balance, end of period | | $ | 1.9 | | | $ | 2.2 | |
Certain comparative figures presented in the interim consolidated financial statements have been reclassified to conform to the current period presentation.
| CATALYST PAPER 2013 THIRD QUARTER REPORT │CONSOLIDATED FINANCIAL STATEMENTS | 48 |