Filed by Regency Energy Partners LP pursuant
to Rule 425 under the Securities Act of 1933 and
deemed filed pursuant to Rule 14a-12 of the Securities
Exchange Act of 1934.
Subject Company: PVR Partners, L.P.
Commission File No.: 001-16735
IMPORTANT ADDITIONAL INFORMATION WILL BE FILED WITH THE SEC
INVESTORS AND SECURITY HOLDERS ARE URGED TO READ THE PROXY STATEMENT/PROSPECTUS AND THE REGISTRATION STATEMENT REGARDING THE TRANSACTION CAREFULLY WHEN THEY ARE AVAILABLE.These documents (when they become available), and any other documents filed by PVR or Regency with the Securities and Exchange Commission (the “SEC”), may be obtained free of charge at the SEC’s website, at www.sec.gov. In addition, security holders will be able to obtain free copies of the proxy statement/prospectus (when available) from PVR by contacting Investor Relations by mail at Attention: Investor Relations, Three Radnor Corporate Center, Suite 301, 100 Matsonford Road, Radnor, Pennsylvania 19087.
PARTICIPANTS IN THE SOLICITATION
Regency and PVR, and their respective directors and executive officers, may be deemed to be participants in the solicitation of proxies in respect of the transactions contemplated by the Agreement and Plan of Merger. Information regarding the directors and executive officers of Regency GP LLC, the general partner of Regency’s general partner, is contained in Regency’s Form 10-K for the year ended December 31, 2012, which has been filed with the SEC. Information regarding PVR’s directors and executive officers is contained in PVR’s Form 10-K for the year ended December 31, 2012 and its proxy statement filed on April 25, 2013, which are filed with the SEC. A more complete description will be available in the Registration Statement and the Proxy Statement/Prospectus.
SAFE HARBOR FOR FORWARD-LOOKING STATEMENTS
Statements in this document regarding the proposed transaction between Regency and PVR, the expected timetable for completing the proposed transaction, future financial and operating results, benefits and synergies of the proposed transaction, future opportunities for the combined company and any other statements about Regency’s or PVR’s management’s future expectations, beliefs, goals, plans or prospects constitute forward-looking statements within the meaning of the Private Securities Litigation Reform Act of 1995. Any statements that are not statements of historical fact (including statements containing the words “believes,” “plans,” “anticipates,” “expects,” “estimates” and similar expressions) should also be considered to be forward-looking statements.
Regency and PVR cannot give any assurance that expectations and projections about future events will prove to be correct. Forward-looking statements are subject to a variety of risks, uncertainties and assumptions. These risks and uncertainties include the risks that the proposed transaction may not be consummated or the benefits contemplated therefrom may not be realized. Additional risks include: the ability to obtain requisite regulatory and unitholder approval and the satisfaction of the other conditions to the consummation of the proposed transaction, the ability of Regency to successfully integrate PVR’s operations and employees and realize anticipated synergies and cost savings, the potential impact of the announcement or consummation of the proposed transaction on relationships, including with employees, suppliers, customers, competitors and credit rating agencies, the ability to achieve revenue, DCF and EBITDA growth, volatility in the price of oil, natural gas, and natural gas liquids, declines in the credit markets and the availability of credit for the combined company as well as for producers connected to the combined company’s system and its customers, the level of creditworthiness of, and performance by counterparties and customers, the ability to access capital to fund organic growth projects and acquisitions, including significant acquisitions, and the ability to obtain debt and equity financing on satisfactory terms, the use of derivative financial instruments to hedge commodity and interest rate risks, the amount of collateral required to be posted from time-to-time, changes in commodity prices, interest rates, and demand for the combined company’s services, changes in laws and regulations impacting the midstream sector of the natural gas industry, weather and other natural phenomena, acts of terrorism and war, industry changes including the impact of consolidations and changes in competition, the ability to obtain required approvals for construction or modernization of facilities and
1
the timing of production from such facilities, and the effect of accounting pronouncements issued periodically by accounting standard setting boards. Therefore, actual results and outcomes may differ materially from those expressed in such forward-looking statements.
These and other risks and uncertainties are discussed in more detail in filings made by Regency and PVR with the SEC, which are available to the public. Regency and PVR undertake no obligation to update publicly or to revise any forward-looking statements, whether as a result of new information, future events or otherwise.
*****
2
 Regency Energy Partners LP Wells Fargo MLP Conference December 10 - 11, 2013 |
 Forward-Looking Statements 2 Certain matters discussed in this report include “forward-looking” statements. Forward-looking statements are identified as any statement that does not relate strictly to historical or current facts. Statements using words such as “anticipate,” “believe,” “intend,” “project,” “plan,” “expect,” “continue,” “estimate,” “goal,” “forecast,” “may” or similar expressions help identify forward-looking statements. Although we believe our forward-looking statements are based on reasonable assumptions and current expectations and projections about future events, we cannot give assurances that such expectations will prove to be correct. Forward-looking statements are subject to a variety of risks, uncertainties and assumptions. Additional risks include, volatility in the price of oil, natural gas, and natural gas liquids, declines in the credit markets and the availability of credit for the Partnership as well as for producers connected to the Partnership’s system and its customers, the level of creditworthiness of, and performance by the Partnership’s counterparties and customers, the Partnership's ability to access capital to fund organic growth projects and acquisitions, and the Partnership’s ability to obtain debt and equity financing on satisfactory terms, the Partnership's use of derivative financial instruments to hedge commodity and interest rate risks, the amount of collateral required to be posted from time-to-time in the Partnership's transactions, changes in commodity prices, interest rates, and demand for the Partnership's services, changes in laws and regulations impacting the midstream sector of the natural gas industry, weather and other natural phenomena, industry changes including the impact of consolidations and changes in competition, the Partnership's ability to obtain required approvals for construction or modernization of the Partnership's facilities and the timing of production from such facilities, and the effect of accounting pronouncements issued periodically by accounting standard setting boards. Therefore, actual results and outcomes may differ materially from those expressed in such forward-looking information. In light of these risks, uncertainties and assumptions, the events described in the forward-looking statements might not occur or might occur to a different extent or at a different time than the Partnership has described. The Partnership undertakes no obligation to update publicly or to revise any forward-looking statements, whether as a result of new information, future events or otherwise. |
 Adjusted EBITDA increased 50% and DCF increased 67% over Legacy third quarter 2012 results, respectively³ Average volumes for the third quarter of 2013 increased by more than 50% and NGL production increased 166%, compared to third quarter 2012 volumes Lone Star’s NGL Transportation throughput increased 30% compared to the third quarter of 2012 Revenue generating horsepower reached an all-time high Key 2013 Highlights 3 1 Via Lone Star Joint Venture 2 Including assumption of net debt 3 Third quarter 2012 adjusted EBITDA results exclude SUGS In September, announced public offering of $400 million of 5.75% Senior Notes due 2020 Had approximately $1 billion of available liquidity at the end of the third quarter Pro forma leverage ratio of 4.1x as of 9/30/2013 Completed the acquisition of SUGS in May, and integration is substantially complete Completed construction of 209,000 Bbls/d Gateway NGL Pipeline and first two 100,000 Bbls/d Mont Belvieu fractionators¹ Added more than 410 MMcf/d of processing capacity and 150 MMcf/d of treating capacity via organic growth projects Completed projects continue ramp up in 2014 Creates a leading gathering and processing footprint in key, high-growth plays in the United States with a strong platform for additional growth Adds a strong growth platform in the Marcellus and Utica Shales and significantly expands Regency’s position in the Midcontinent Expect approximately $30 million in synergies per year Anticipate project cash flows will contribute to significant increase in DCF and EBITDA over time Further Strengthened Balance Sheet Announced Plans to Purchase PVR Partners for $5.6 Billion² Delivered solid financial and operating performance, driven by increased volumes in liquids-rich regions Completed more than $3 billion of major, organic growth projects and acquisitions in the last 12 months |
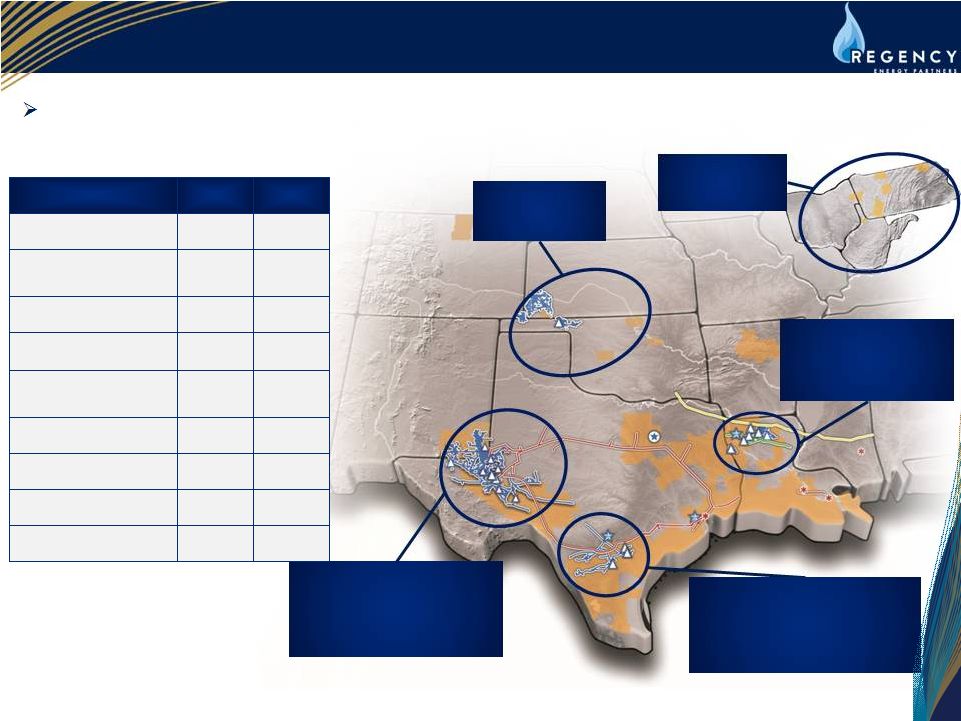 4 Expanding Asset Base 1 As of 9/30/12 and 9/30/2013, respectively 2 2012 throughput does not include SUGS 3 Via Haynesville Joint Venture, in which Regency has a 49.99% interest, and MEP Joint Venture, in which Regency has a 50% interest; also includes Gulf States Transmission, a 10-mile interstate pipeline that extends from Harrison County, Texas to Caddo Parish, Louisiana 4 Via Lone Star Joint Venture, in which Regency has a 30% interest Diversified asset portfolio is strategically positioned to benefit from drilling activity in liquids-rich plays Asset Summary 2012¹ 2013¹ Gathering Pipeline (miles) 6,345 11,945 Gathering and Processing Throughput (Mmbtu/d) 2 1.4 million 2.2 million Treating/Processing Plants 11 19 Processing Capacity (MMcf/d) 695 1,600 Transportation Pipeline (miles) 3 960 960 Contract Compression (HP) 873,000 1,014,000 NGL Transportation (miles) 4 1,170 1,740 NGL Fractionation (Bbls/d) 4 25,000 225,000 47 47 Eagle Ford Increased capacity of Eagle Ford Expansion Project by 125 MMcf/d and added 150 MMcf/d of treating capacity Permian Acquired SUGS and completed 125 MMcf/d Ranch JV facility Haynesville/Cotton Valley Added 90 MMcf/d of processing capacity Midcontinent Granite Wash Mississippi Lime Marcellus Utica NGL Storage (MMBbls/d) 4 |
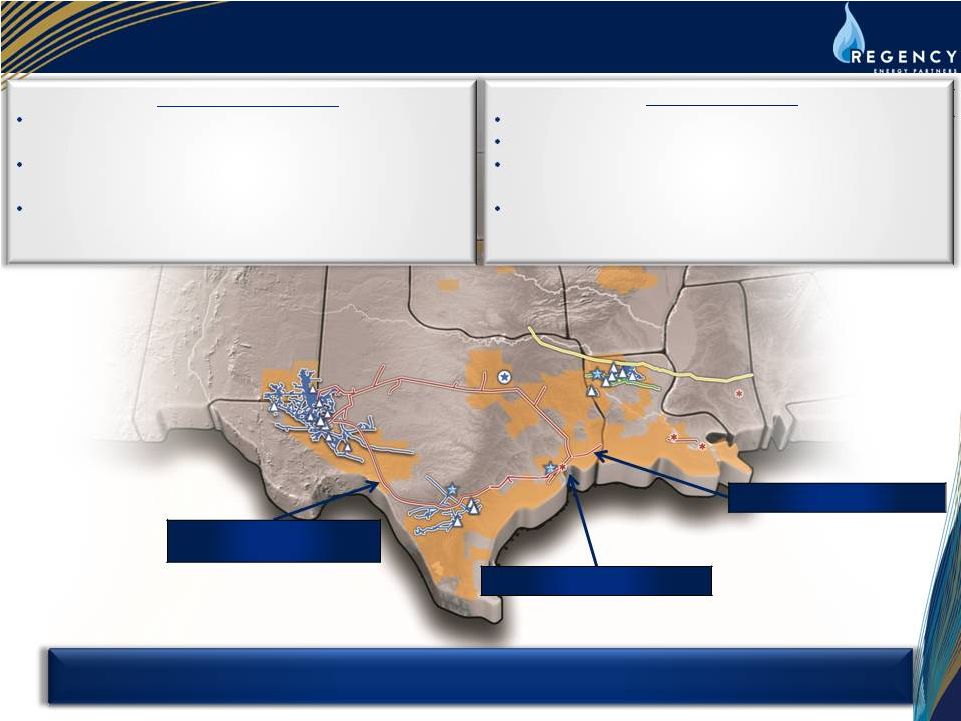
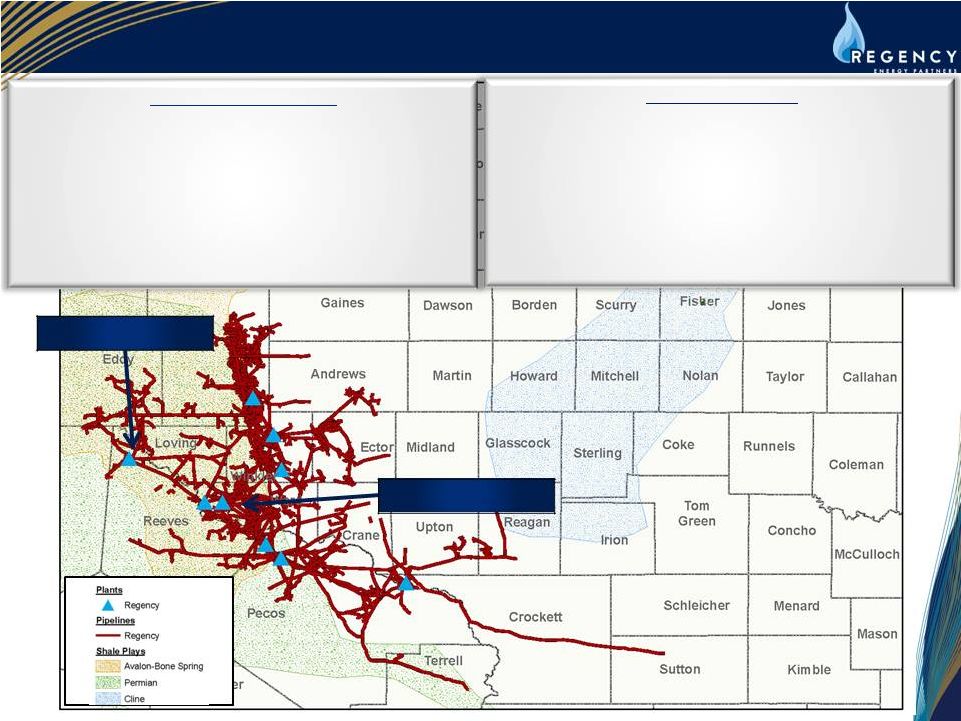 5 Gathering & Processing: West Texas Year-Over-Year Growth¹ • Total volumes increased 410% over Legacy Q3 2012 • NGL production increased 690% over Legacy Q3 2012 • SUGS system integration complete • Processing capacity increased from 125 MMcf/d to 940 MMcf/d • Recently completed 140 MMcf/d of gathering expansions into Reeves County (Delaware Basin) 2014 Opportunities • Currently constructing 125 MMcf/d of additional gathering capacity into Andrews and Culberson counties (Delaware Basin) • Plans to add 200 MMcf/d of incremental processing capacity in early 2015 • Expanding condensate stabilization and transportation systems 1 Comparison is third quarter 2012 versus third quarter 2013; third quarter 2012 results exclude SUGS Red Bluff Expansion Ranch JV Expansion |
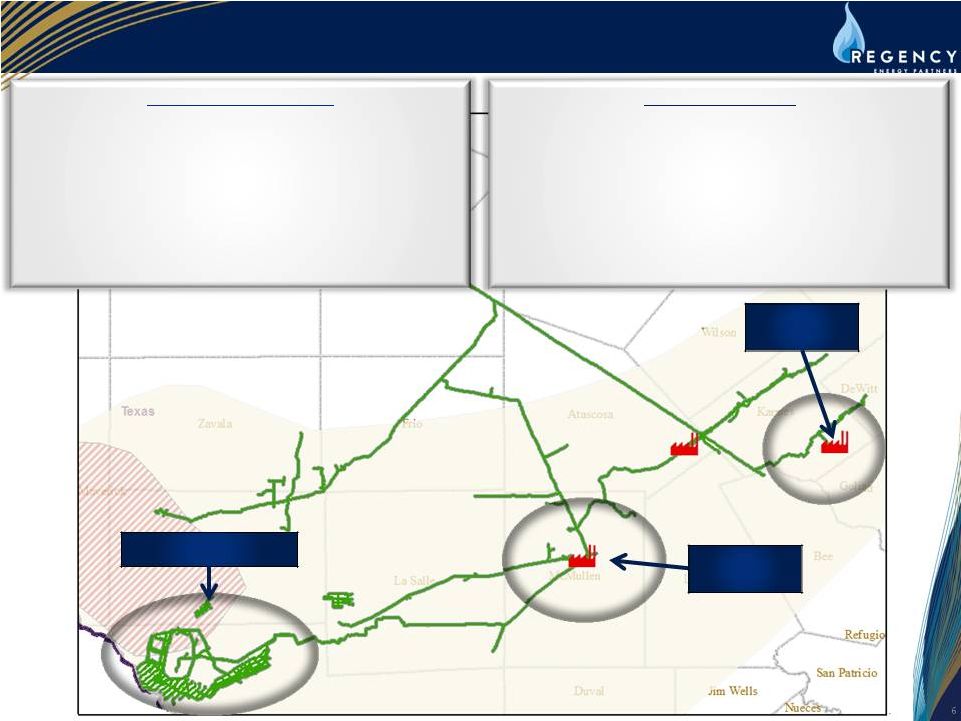 6 Gathering & Processing: South Texas Year-Over-Year Growth¹ • Total South Texas volumes have increased nearly 40% • Total NGL production has increased nearly 40% • Eagle Ford Expansion Project volumes have increased 60% • Increased total treating capacity from 170 MMcf/d to 320 MMcf/d • Added 17,000 Bbls/d of oil gathering capacity 2014 Opportunities • Continued volume ramp up across all systems • Pursuing approximately 70,000 Bbls/d of crude gathering • Expect to further increase treating capacity 1 Comparison is third quarter 2012 versus third quarter 2013; third quarter 2012 results exclude SUGS Eagle Ford Expansion Edwards Lime Expansion Tilden Expansion |
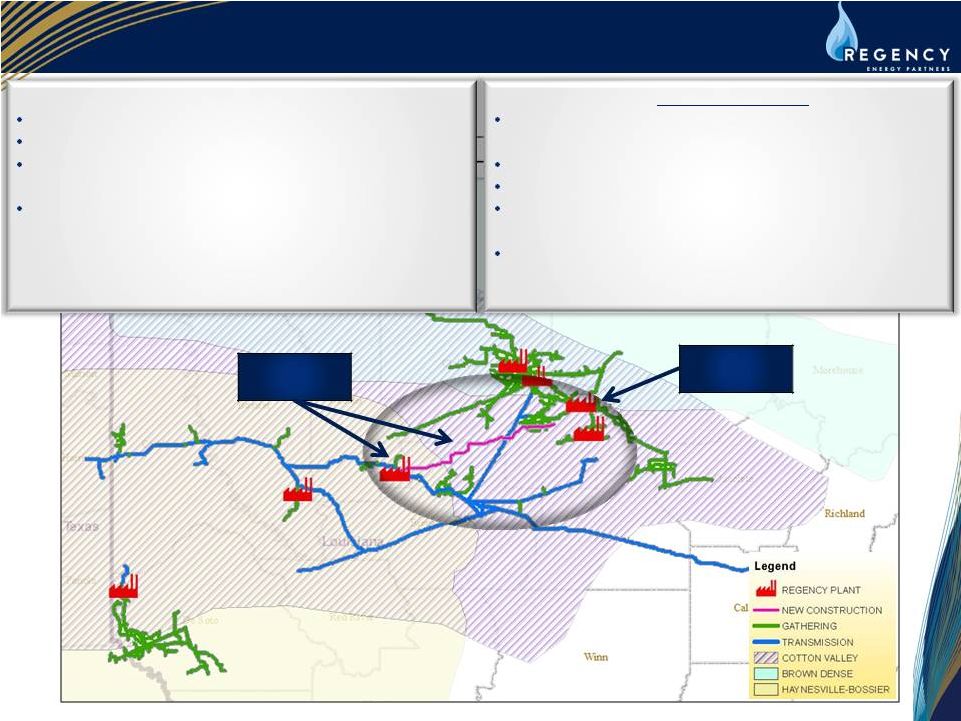 7 Gathering & Processing: North Louisiana Dubach Expansion Dubberly Expansion 2014 Opportunities Completing construction of 400 MMcf/d of additional gathering capacity by January 1, 2014 Completing 200 MMcf/d processing upgrade at Dubberly Planning to add 100 MMcf/d of gathering capacity Evaluating new cryogenic processing expansion at Dubberly Growth from Cotton Valley expected to bring new volumes to RIGS 1 Comparison is third quarter 2012 versus third quarter 2013; third quarter 2012 results exclude SUGS Dubach volumes have increased more than 60% Dubach NGL production has increased more than 50% Increased processing capacity from 140 MMcf/d to 210 MMcf/d Built 22 miles of high-pressure gathering pipeline with a capacity of 100 MMcf/d |
 8 Lone Star Opportunities Expect Lone Star’s EBITDA to increase significantly as projects come online and volumes ramp up in 2014 and 2015 West Texas Gateway NGL Pipeline Frac 1 & 2 Mariner South 209,000 Bbls/d Gateway Pipeline in service and began ramp up Announced 6 million Bbls/month LPG export facility (In service 2015) Continued volume ramp up on Gateway and Fracs I and II Permitting 100,000 Bbls/d Frac III Evaluating expansion of NGL transportation capacity from Permian Basin Opportunities to expand downstream transportation infrastructure and NGL purity product markets Year-Over-Year Growth 2014 Opportunities Added 200,000 Bbls/d of Fractionation Capacity (Frac II came online November 2013) |
 Contract Services Opportunities New opportunities driving increased capex spending for compression due to continued strong demand, particularly in the Permian Basin, Eagle Ford, Niobrara and Appalachian Shales Contract Compression Growth Opportunities As of November 1 st , have approximately 50,000 HP booked to be set for the remainder of 2013 Larger gas-lift opportunities and turn-key facility installations, including for compression and production facilities, will drive growth in the Eagle Ford and Permian – 100,000 HP potential Oil and liquids activity is increasing Utica Shale opportunities for 2014 – 40,000 HP potential Expect additional growth in the Niobrara Shale as customers solidify expansion plans – 40,000 HP potential Other – 20,000 HP potential 9 Barnett/Haynesville Marcellus/Utica Niobrara Fayetteville Permian/Avalon/ Bone Spring Granite Wash Gulf Coast Eagle Ford |
 Overview of PVR Partners Acquisition |
 Strategic Highlights Combination of Regency and PVR creates a premiere, diversified gas gathering and processing MLP with scaled presence in the most economic, high-growth, oil and gas plays in North America Increased Scale and Basin Diversification PVR adds a strategic presence in three prolific areas; the Marcellus and Utica Shales in the Appalachian Basin, and the Granite Wash in the Mid-Continent Meaningful Growth Projects PVR has several projects under development or construction which are expected to add significant volumes in 2015 Announced Utica Ohio River Project will provide a substantial growth opportunity with in-service date early 2015 ‘First-mover’ advantage Significant upside Acquisition of Largely Fee-Based EBITDA Stable contracted, fee-based asset portfolio with a majority of PVR gross margin under fixed-fee contracts Marcellus expected to comprise ~55% of PVR EBITDA in 2013E and is all fee-based; significant demand charges on trunklines Enhanced Long-Term Value Creation Significant increase in EBITDA and DCF expected over time as the combined company benefits from project cash flows Estimate achieving synergies of approximately $30 million per year (beginning in year 1) Transaction and pro forma credit profile is in keeping with Regency long-term investment grade rating objective 11 Combination strengthens Regency’s position for long-term distribution growth |
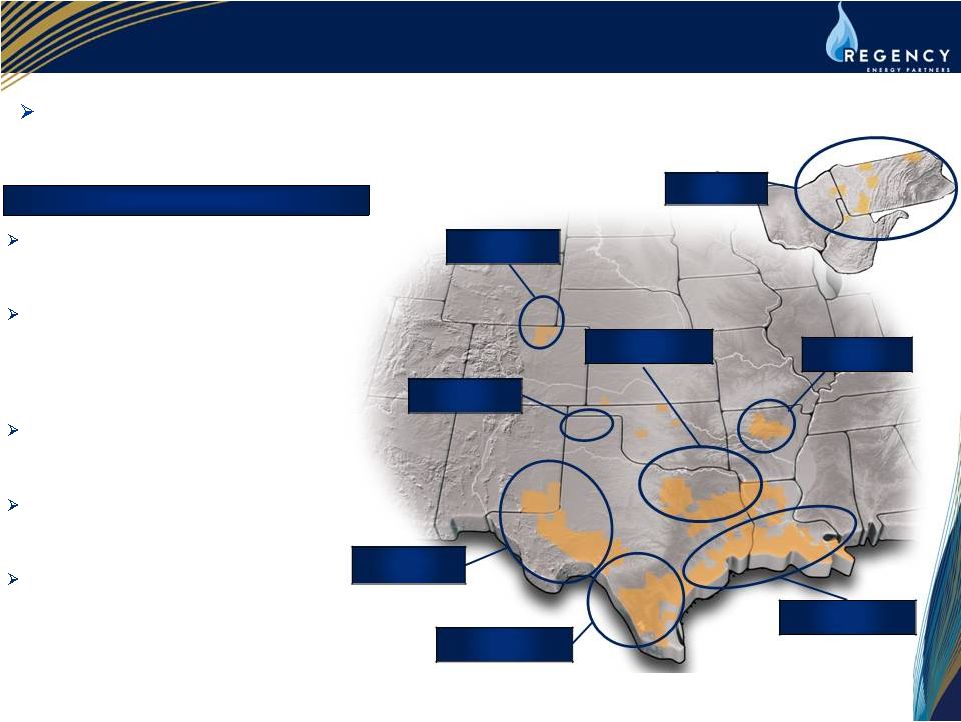
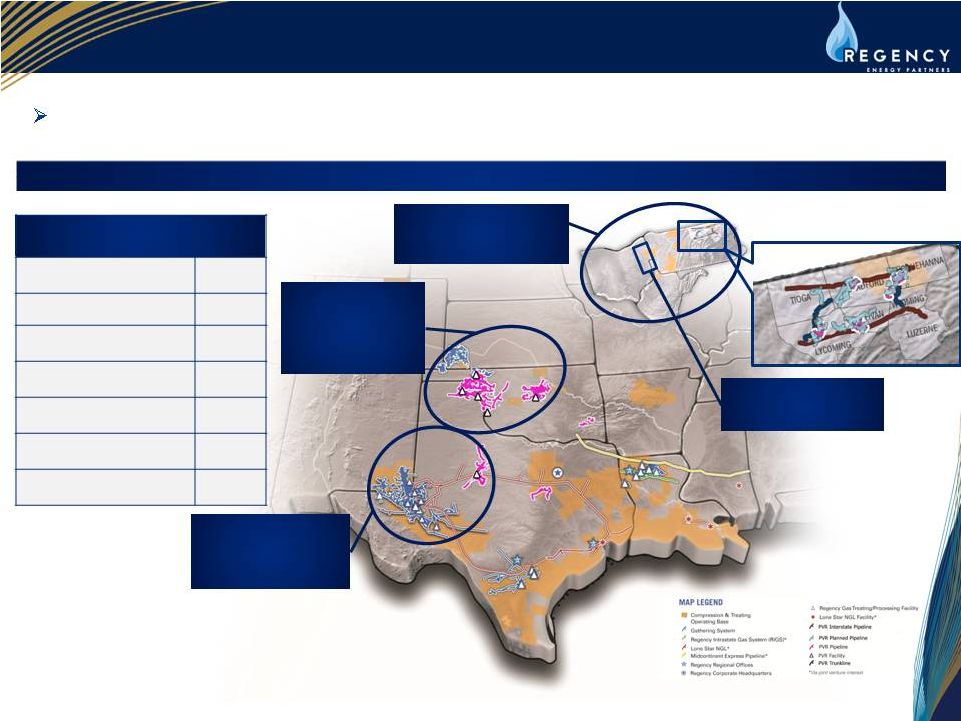 12 Expanding Asset Base Pro Forma Asset Base PVR combination will expand Regency’s position in the major growth plays in the lower 48 Expands reach into Cline Shale Greatly expands Midcontinent into Granite Wash Mississippi Lime Adds major position in Marcellus and Utica Shales 1 As of 9/30/13 2 Operated within Regency’s Gathering & Processing Segment 3 Via Haynesville Joint Venture, in which Regency has a 49.99% interest, and MEP Joint Venture, in which Regency has a 50% interest; also includes Gulf States Transmission, a 10-mile interstate pipeline that extends from Harrison County, Texas to Caddo Parish, Louisiana 4 Via Lone Star Joint Venture, in which Regency has a 30% interest Announced Utica Ohio River Project ¹ Gathering Pipeline (miles) 16,738 Treating/Processing Plants 25 Transportation Pipeline (miles) 960 Contract Compression (HP) 1,014,000 NGL Transportation (miles) 1,740 NGL Fractionation (Bbls/d) 225,000 NGL Storage (MMBbls/d) 47 Pro Forma Asset Summary 4 4 2 3 4 |
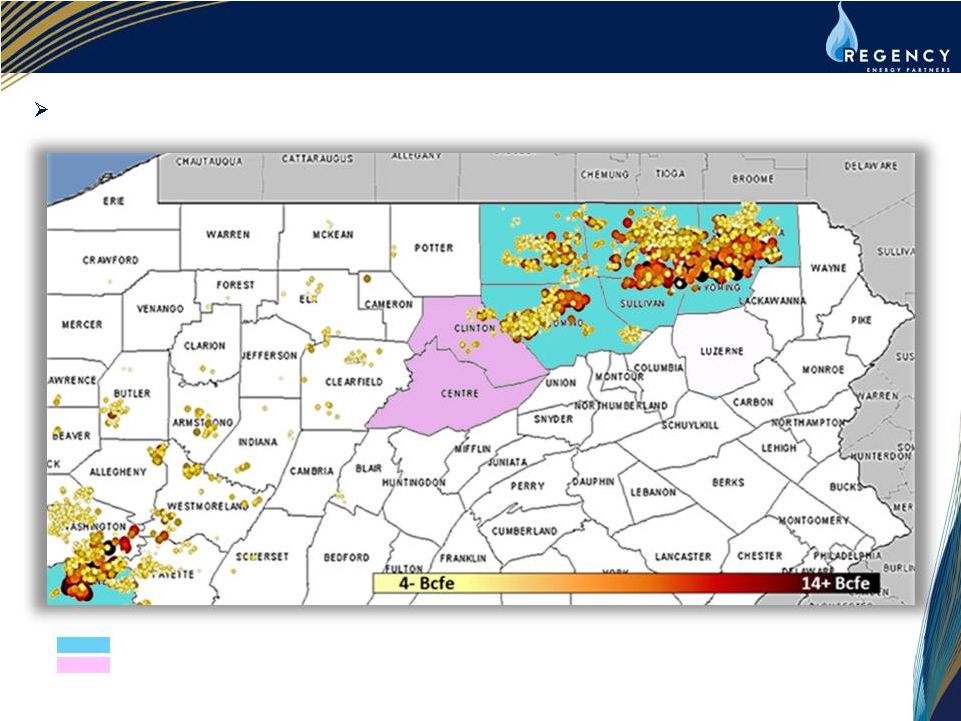 13 Marcellus Productivity: Finding the Sweet Spots Source: U.S. Capital Advisors Indicates county in which PVR has operations in service Indicates county in which PVR has acreage dedications/systems under development PVR’s assets sit in most of the top producing counties in the Marcellus Shale |
 Marcellus Productivity Rankings Source: U.S. Capital Advisors Marcellus EUR Scatter by County PVR has assets in 6 of the 10 counties generating the highest EURs in the Marcellus Shale Indicates county in which PVR has operations 14 |
 Summary 15 Extensive midstream portfolio and strong position in majority of high-growth shale plays driving expansion opportunities Strong Visibility for Continued Growth High-Quality Assets Integrated Midstream Platform Focused on Execution • Completed $3+ billion in organic projects and acquisitions with continued ramp up in 2014 and beyond • PVR acquisition will add considerable scale and significant growth opportunities, which supports long-term distribution growth • New organic growth opportunities continue to develop across all operating areas • Assets strategically located in majority of the most prolific shale plays and basins • Strong position in oil and liquids-rich plays driving significant organic growth program • High percentage of fee-based margins • Comprehensive midstream service provider with significant presence across the midstream value chain • Diversity of business mix, large scale, along with strategically located assets enhances stability of cash flows • SUGS integration substantially complete • PVR integration plan underway • Continue to develop and execute organic projects on time and within budget • Maintain strong balance sheet and financial flexibility Regency is well positioned for long-term distribution growth |
 Appendix |
 17 Recently Completed Expansions 1. Represents Regency’s 33.33% share 2. Represents Regency’s 30% share 3. Represents Regency’s 60% share 4. Represents total project costs. Regency's expected costs since April 30, 2013 are expected to be $69 million Project RGP Growth Capital ($ in millions) Estimated Completion Date Expected Ramp Up Ranch JV Processing Facility 1 $33 Refrigeration Plant –June 2012 Cryogenic Processing Plant – Operational December 2012 Currently operating at 75% capacity; 100% contracted under firm contracts Lone Star Gateway NGL Pipeline 2 $275 December 2012 Expect volumes to continue to continue to increase in 2014 and 2015 Lone Star Fractionator 1 2 $118 December 2012 Throughput reached 72,000 Bbls/d for Q3 2013; 100% contracted Tilden Treating Plant Expansion $40 January 2013 Volumes have increased more than 40% since the expansion came online in January 2013 Dubach Expansion $75 JT Plant –November 2012 Cryogenic Processing Plant –June 2013 Legacy and expanded cryogenic operating at 100% capacity Red Bluff Expansion 4 $330 In service August 2013 Currently flowing at 70% of capacity which will increase with new gathering tie ins and additional expansion planned for the area Edwards Lime JV Gathering System Expansion 3 $90 Online Q3 2013 Increased capacity of the treating facility by nearly 45% and Q3 2013 volumes have increased 28% over Q3 2012 Added 17,000 Bbls/d oil gathering system that is currently flowing 10,000 Bbls/d Lone Star Fractionator 2 2 $105 Q4 2013 Expect volumes to tier up into 2015 Eagle Ford Expansion $490 Ongoing; Final Completion Early 2014 Build out 90% complete; Moving over 400 million a day, handling three-phase flow of oil, gas and water Total Growth Capital $1,556 |
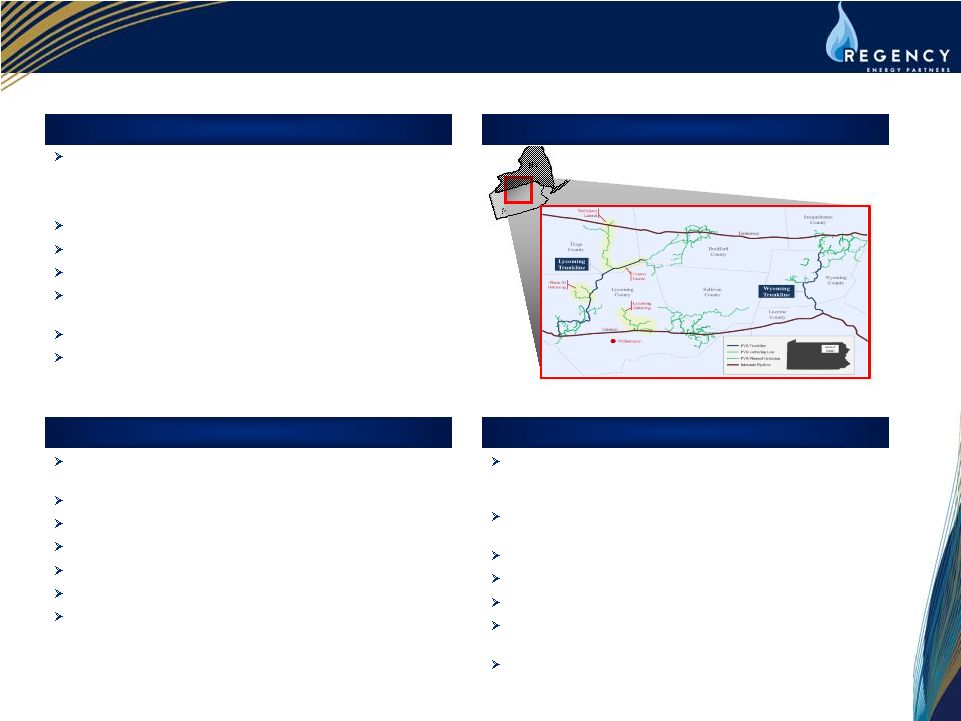   100% fee-based: – Firm reservation charges provide a floor on returns – Additional volumetric fees based upon actual volumes Gathering Pipeline / Trunkline Miles: 252 Well Connects: 261 (through July 31, 2013) 2013 Q2 Volume (MMcfd): 1,310 377,000+ dedicated acres with substantial producers committed to development Fresh water pipeline JV supplies producers In May 2012, PVR acquired a membership interests of Chief Gathering LLC resulting in a major expansion of its pipeline systems in the Eastern Midstream segment Marcellus Systems Overview NY PA PVR Eastern Midstream Overview First large-diameter gathering system in north-central PA Marcellus fairway 80 miles of 30-inch pipeline 850 MMcf/d capacity Phase I began service Q1 2011 Phase II began service Q4 2011 Phase III began service Q4 2012 Total well connects of 125 through July 31, 2013 Lycoming System Trunkline nature of the system provides bi-directional flows to Transco and Tennessee Gas; adds optionality for producers and effectively doubles capacity on the line Running through Wyoming Co., PA enables access to 4 market outlets via 2 major pipelines Began service June 2010 89 miles of 24-inch pipeline in service since Q4 2012 750 MMcf/d capacity Currently constructing system extension to service additional local producers Total well connects of 51 through July 31, 2013 Wyoming System Asset Map 18 |
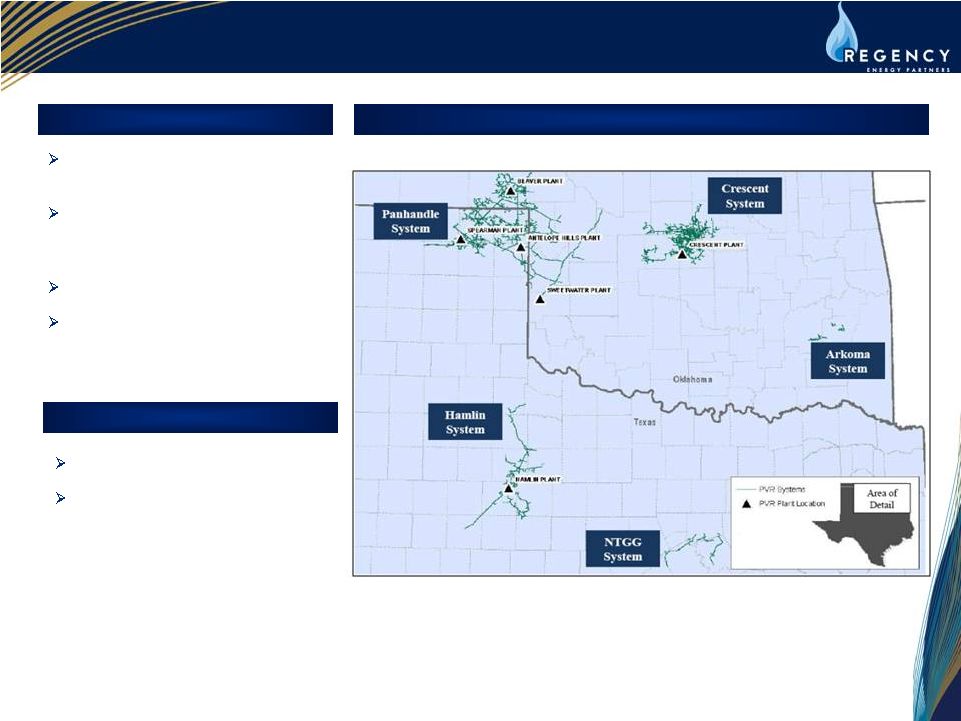 PVR Mid-Continent Midstream Overview Key Highlights Midcontinent Assets Traditional midstream gathering and processing business Assets are located in attractive natural gas basins with long-lived reserves 460 MMcfd processing capacity Hamlin and Crescent systems positioned for growth in Cline Shale and Mississippi Lime, respectively 19 Gathering Pipeline Miles: 4,541 Plants and Processing Capacity: 6 plants (460 MMcfd) Key Statistics |
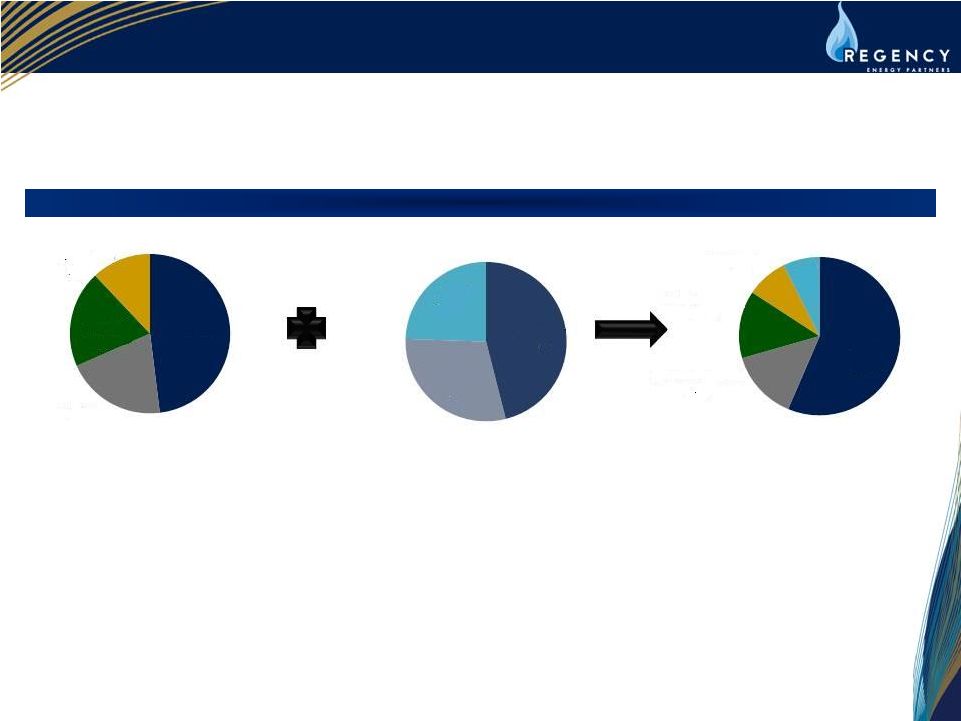 1 Excludes corporate, eliminations and Gulf State contributions 2 Represents revenue from segment 3 Includes both gathering and processing and transportation 4 Includes Eastern and Mid-Continent PVR segments 2013E Gross Margin 20 Improvements to Regency & PVR Business Profile Pro Forma Regency 1 PVR 2,3 3 2 3,4 G&P 48% Contract Services 20% Nat. Gas Trans. 20% NGL Services 12% Eastern 46% Mid- Continent 30% Coal 24% G&P 57% Contract Services Nat. Gas Trans. 14% NGL Services 8% Coal 7% 14% |
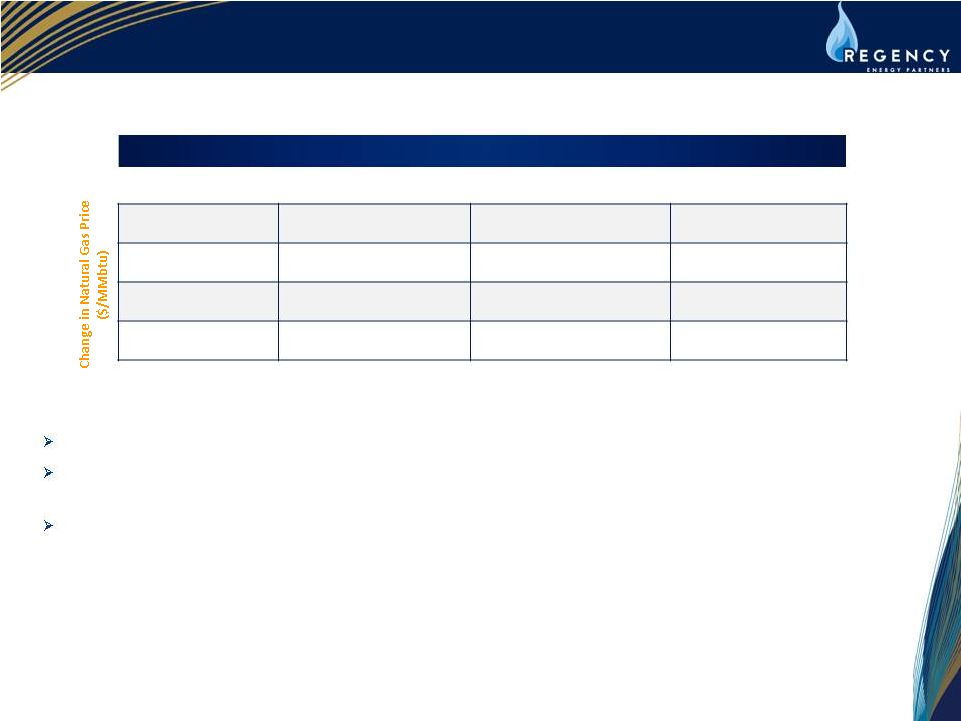 21 Maintain Stable Cash Flows: DCF Sensitivities 1 As of November 22, 2013 Regency has length in natural gas due to a concerted effort to minimize ‘keep-whole’ exposure A $10.00 per Bbl movement in crude along with the same percentage change in NGL pricing would result in a $12 million change in Regency’s forecasted 2014 DCF A $1.00 per MMbtu movement in natural gas pricing would result in a $20 million change in Regency’s forecasted 2014 DCF DCF Sensitivity to Commodity Price Changes – 2014 Decrease $10.00 Flat Increase $10.00 Decrease $1.00 $ 32M $ 20M $ 8M Flat $ 12M $ 0 $ (12)M Increase $1.00 $ (8)M $ (20)M $(32)M Change in WTI Price ($/Bbl) |
 22 Maintain Stable Cash Flows: Comprehensive Hedging Program 1 As of November 22, 2013. Based on exposures as of Q3 2013 Executed Hedges by Product¹ Balance of 2013 Full Year 2014 Natural Gas/Ethane 41% 51% Propane 84% 66% Normal Butane 54% 67% C5+/Condensate 82% 49% |
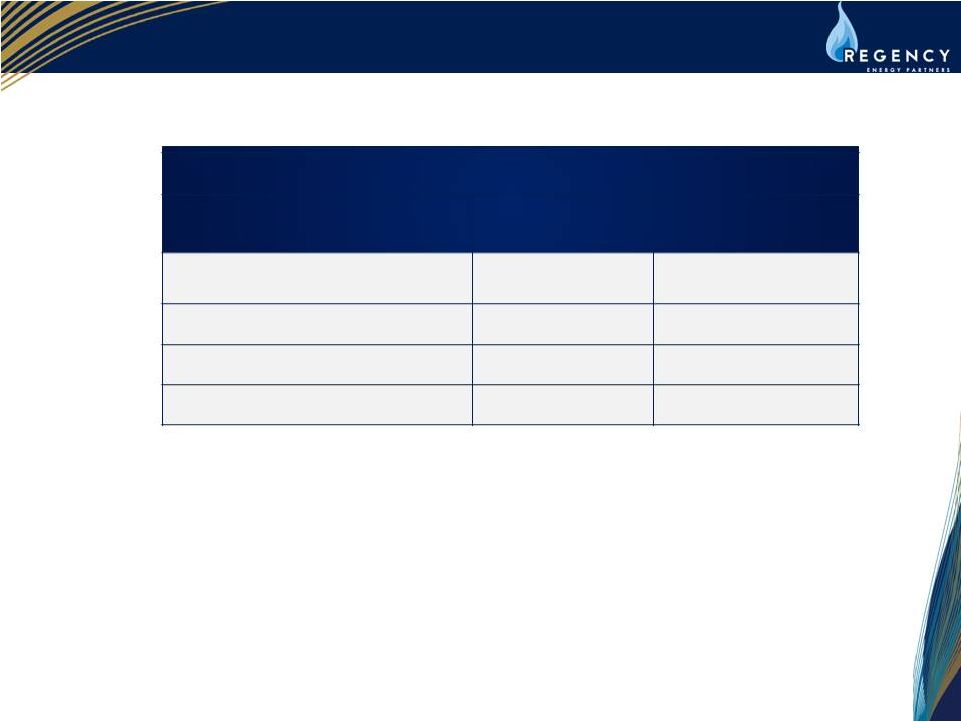
 23 Maintain Stable Cash Flows: Comprehensive Hedging Program 1 As of October 16, 2013 Executed Hedges by Product ¹ Balance of 2013 Full Year 2014 Bbls/d Price ($/gal) Bbls/d Price ($/gal) Propane 3,150 $0.96 2,500 $1.01 Normal Butane 975 $1.38 1,200 $1.39 Bbls/d Price ($/Bbl) Bbls/d Price ($/Bbl) WTI 2,365 $97.08 1,426 $92.70 Cushing to Midland Basis 1,000 (0.35) - - MMbtu/d Price ($/MMbtu) MMbtu/d Price ($/MMbtu) Natural Gas (Henry Hub) 23,000 $3.92 32,000 $3.96 Natural Gas (Permian) 15,000 $4.35 15,000 $4.22 |
 24 Non-GAAP Reconciliation 1 Beginning in the second quarter of 2013, results have been retrospectively adjusted to combine Regency’s results with SUGS results due to the as-if pooling accounting treatment required for an acquisition between commonly controlled entities. Results shown prior to the second quarter of 2013 exclude any impact related to the historical SUGS results September 30, 2013 June 30, 2013 March 31, 2013 December 31, 2012 September 30, 2012 June 30, 2012 March 31, 2012 Net income (loss) 42 11 (29) $ (8) $ (2) $ 28 $ 15 $ Add: Interest expense, net 41 41 37 35 29 28 30 Depreciation and amortization 74 68 65 60 71 69 53 Income tax expense (benefit) 2 0 (3) - (1) - - EBITDA (1) 159 $ 120 $ 70 $ 87 $ 97 $ 125 $ 98 $ Add (deduct): Partnership's ownership interest in unconsolidated affiliates' adjusted EBITDA (2)(3)(4)(5) 66 60 63 56 54 60 57 Income from unconsolidated affiliates (37) (31) (35) (19) (20) (34) (32) Non-cash (gain) loss from commodity and embedded derivatives (14) (4) 18 (2) 7 (22) (2) Loss on debt refinancing, net - 7 - - - 8 - Other income, net (2) 3 1 2 1 1 2 Adjusted EBITDA 172 $ 155 $ 117 $ 124 $ 139 $ 138 $ 123 $ (1) Earnings before interest, taxes, depreciation and amortization. (2) 100% of Haynesville Joint Venture's Adjusted EBITDA and the Partnership's interest are calculated as follows: Net income 18 $ 18 $ 20 $ 14 $ 7 $ 26 $ 23 $ Add (deduct): Depreciation and amortization 9 9 9 9 9 9 9 Interest expense, net 1 - 1 1 - 1 - Loss on sale of asset, net - - - - 1 - - Impairment of property, plant and equipment - - - 8 14 - - Other expense, net - - - 1 - - - Adjusted EBITDA 28 $ 27 $ 30 $ 33 $ 31 $ 36 $ 32 $ Ownership interest 49.99% 49.99% 49.99% 49.99% 49.99% 49.99% 49.99% Partnership's interest in Adjusted EBITDA 14 $ 13 $ 15 $ 15 $ 15 $ 18 $ 16 $ (3) 100% of MEP Joint Venture's Adjusted EBITDA and the Partnership's interest are calculated as follows: Net income 21 $ 21 $ 21 $ 21 $ 21 $ 21 $ 21 $ Add: Depreciation and amortization 17 17 18 17 17 17 17 Interest expense, net 13 13 13 13 13 13 13 Adjusted EBITDA 51 $ 51 $ 52 $ 51 $ 51 $ 51 $ 51 $ Ownership interest 50% 50% 50% 50% 50% 50% 50% Partnership's interest in Adjusted EBITDA 26 $ 26 $ 26 $ 26 $ 26 $ 26 $ 26 $ We acquired a 49.9% interest in MEP Joint Venture in May 2010. (4) 100% of Lone Star Joint Venture's Adjusted EBITDA and the Partnership's interest are calculated as follows: Net income 60 $ 44 $ 55 $ 37 $ 31 $ 41 $ 38 $ Add (deduct): Depreciation and amortization 21 20 20 14 13 13 12 Other (income) expense, net 1 1 - - - (1) 1 Adjusted EBITDA 82 $ 65 $ 75 $ 51 $ 44 $ 53 $ 51 $ Ownership interest 30% 30% 30% 30% 30% 30% 30% Partnership's interest in Adjusted EBITDA 25 $ 20 $ 23 $ 15 $ 13 $ 16 $ 15 $ We acquired a 30% interest in Lone Star Joint Venture in May 2011. (5) 100% of Ranch Joint Venture's Adjusted EBITDA and the Partnership's interest are calculated as follows: Net loss 1 $ 1 $ - $ (1) $ (1) $ - $ - $ Add (deduct): Depreciation and amortization 1 1 2 1 - - - Adjusted EBITDA 2 $ 2 $ 2 $ - $ (1) $ - $ - $ Ownership interest 33% 33% 33% 33% 33% 33% 33% Partnership's interest in Adjusted EBITDA 1 $ 1 $ 1 $ - $ (0) $ - $ - We acquired a 33.33% interest in Ranch Joint Venture in December 2011. ($ in millions) Three Months Ended |
 25 Non-GAAP Reconciliation 2013 2012 Ranch Joint Venture Net income (loss) 1 $ (1) $ Add: Operation and maintenance 1 - Depreciation and amortization 1 1 Total Segment Margin 3 $ - $ Three Months Ended September 30, ($ in millions) *Ranch Joint Venture's Refrigeration Processing Plant started its operation in June 2012 and the full facility began operations in December 2012. 2013 2012 Lone Star Joint Venture Net income 61 $ 31 $ Add: Operation and maintenance 21 15 General and administrative 8 5 Depreciation and amortization 21 13 Income tax expense 1 1 Total Segment Margin 112 $ 65 $ Three Months Ended September 30, ($ in millions) 2013 2012 MEP Joint Venture Net income 21 $ 21 $ Add: Operation and maintenance 4 4 General and administrative 6 6 Depreciation and amortization 17 17 Interest expense, net 13 13 Total Segment Margin 61 $ 61 $ Three Months Ended September 30, ($ in millions) 2013 2012 Haynesville Joint Venture Net income 18 $ 7 $ Add: Operation and maintenance 5 5 General and administrative 4 5 Depreciation and amortization 9 9 Interest expense, net 1 14 Other income and deductions, net - 1 Total Segment Margin 37 $ 41 $ Three Months Ended September 30, ($ in millions) |
  26 Non-GAAP Reconciliation¹ September 2013 June 2013 March 2013 December 2012 September 2012 June 2012 March 2012 Net cash flows provided by operating activities 183 $ 112 $ 67 $ 71 $ 79 $ 46 $ 56 $ Add (deduct): Depreciation and amortization, including debt issuance cost amortization and bond premium write-off and amortization (75) (68) (50) (62) (47) (45) (54) Income from unconsolidated affiliates 37 31 35 27 21 33 32 Derivative valuation change 14 1 (18) 2 (7) 22 3 Loss on asset sales, net 2 (1) (1) (1) - (2) - Unit-based compensation expenses (2) (1) (2) (1) (1) (1) (1) Cash flow changes in current assets and liabilities: Trade accounts receivables, accrued revenues, and related party receivables 32 27 8 4 10 (14) (7) Other current assets and other current liabilities (25) 137 (13) 1 (7) 6 (5) Trade accounts payable, accrued cost of gas and liquids, related party payables and deferred revenues (89) (57) 4 (22) (20) 18 34 Distributions of earnings received from unconsolidated affiliates (37) (35) (36) (29) (29) (34) (29) Other assets and liabilities 2 (135) 1 1 - - - Net (Loss) Income 42 $ 11 $ (5) $ (9) $ (1) $ 29 $ 29 $ Add: Interest expense, net 41 41 37 36 29 28 30 Depreciation and amortization 74 68 48 59 46 45 51 Income tax expense (benefit) 2 - (2) 1 - - - EBITDA 159 $ 120 $ 78 $ 87 $ 74 $ 102 $ 110 $ Add (deduct): Partnership's interest in unconsolidated affiliates' adjusted EBITDA 66 60 63 57 54 59 57 Income from unconsolidated affiliates (37) (31) (35) (27) (21) (34) (32) Non-cash loss (gain) from commodity and embedded derivatives (14) (4) 18 (2) 7 (22) (2) Other income, net (2) 10 3 2 1 10 1 Adjusted EBITDA 172 $ 155 $ 127 $ 117 $ 115 $ 115 $ 134 $ Add (deduct): Interest expense, excluding capitalized interest (40) (46) (42) (41) (34) (41) (35) Maintenance capital expenditures (9) (13) (7) (8) (11) (7) (7) SUGS Contribution Agreement adjustment * - 9 14 - - - - Proceeds from asset sales - 5 12 4 2 7 13 Other adjustments (8) (9) (3) (4) (3) (3) (2) Distributable cash flow 115 $ 101 $ 101 $ 68 $ 69 $ 71 $ 103 $ * Includes an adjustment to CAFD related to the historical SUGS operations for the time period prior to the Partnership's acquisition. Three Months Ended ($ in millions) 1 Historical results have been retrospectively adjusted to combine Regency’s results with SUGS results due to the as-if pooling accounting treatment required for an acquisition between commonly controlled entities |