QuickLinks -- Click here to rapidly navigate through this document
Exhibit 99.2
ASBURY
AUTOMOTIVE GROUP
AUTOMOTIVE RETAILING
Ken Gilman
CEO
This presentation contains certain forward-looking statements within the meaning of the Securities Act of 1933 and the Securities Exchange Act of 1934, which are subject to known and unknown risks, uncertainties or other factors not under Asbury's control that may cause the actual results, performance or achievements of Asbury to be materially different from the results, performance or other expectations implied by these forward-looking statements. Some of these risks, uncertainties and other factors include those disclosed in Asbury's registration statement with the Securities and Exchange Commission.
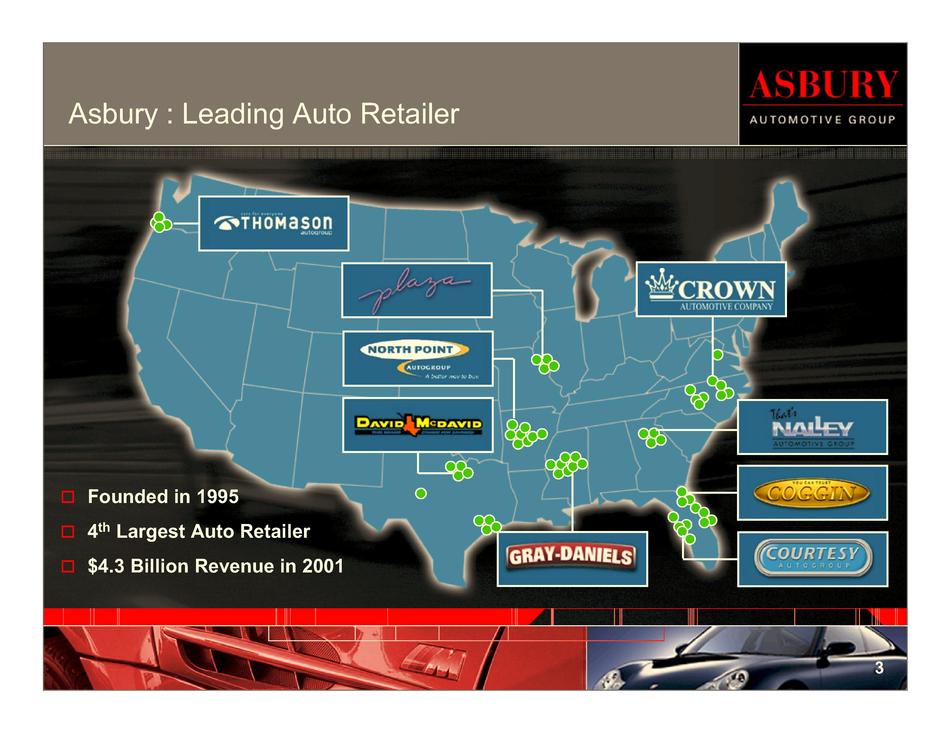
Founded in 1995
4th Largest Auto Retailer
$4.3 Billion Revenue in 2001

o Automotive retailing is a huge fragmented industry
o Diversified revenue streams
o Experienced and incentivized management
o Advantageous brand mix
o Regional concentration and strong branding of our platforms
o Growth through organic and acquisition opportunities
o Strong financial performance
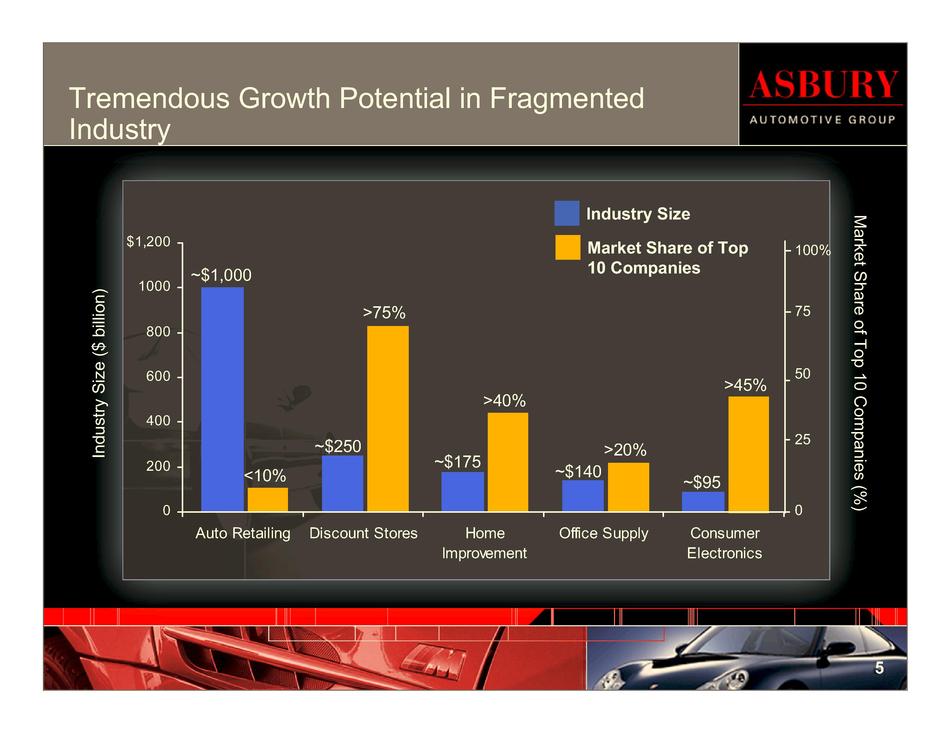
Tremendous Growth Potential in Fragmented Industry
| | Industry Size | Market Share of Top 10 Companies | |||
|---|---|---|---|---|---|
| | ($ billions) | | |||
| Auto Retailing | $ | 1,000 | 10% | ||
| Discount Stores | $ | 250 | 75% | ||
| Home Improvement | $ | 175 | 40% | ||
| Office Supply | $ | 140 | 20% | ||
| Consumer Electronics | $ | 95 | 45% | ||
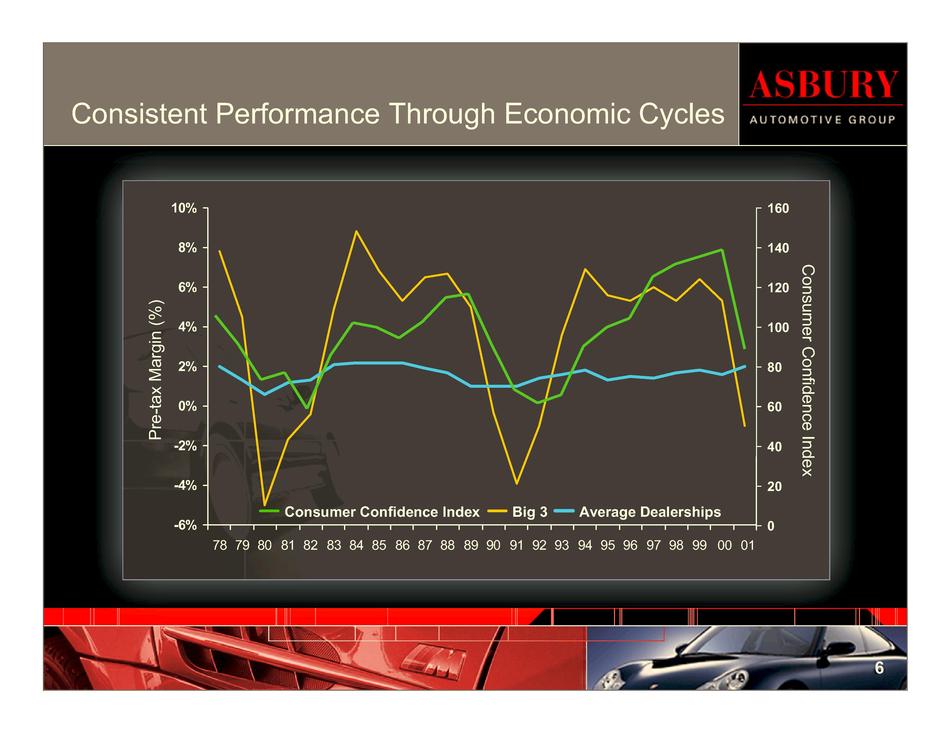
Consistent Performance Through Economic Cycles
| | 1978 | 1979 | 1980 | 1981 | 1982 | 1983 | 1984 | 1985 | 1986 | 1987 | 1988 | 1989 | 1990 | 1991 | 1992 | 1993 | 1994 | 1995 | 1996 | 1997 | 1998 | 1999 | 2000 | |||||||||||||||||||||||
|---|---|---|---|---|---|---|---|---|---|---|---|---|---|---|---|---|---|---|---|---|---|---|---|---|---|---|---|---|---|---|---|---|---|---|---|---|---|---|---|---|---|---|---|---|---|---|
| Big 3 Pre-Tax Margin | 7.80% | 4.50% | -4.95% | -1.65% | -0.41% | 4.92% | 8.81% | 6.82% | 5.33% | 6.52% | 6.70% | 5.04% | -0.27% | -3.92% | -0.98% | 3.59% | 6.89% | 5.58% | 5.29% | 6.03% | 5.27% | 6.38% | 5.34% | |||||||||||||||||||||||
| Average Dealerships Pre-Tax Margin | 1.96% | 1.26% | 0.61% | 1.16% | 1.30% | 2.14% | 2.18% | 2.20% | 2.16% | 1.88% | 1.71% | 1.00% | 1.00% | 1.00% | 1.39% | 1.60% | 1.80% | 1.30% | 1.53% | 1.37% | 1.70% | 1.80% | 1.60% | |||||||||||||||||||||||
| Consumer Confidence Index | 106.0 | 91.9 | 73.8 | 77.4 | 59.0 | 85.7 | 102.3 | 100.0 | 94.7 | 102.6 | 115.2 | 116.8 | 91.5 | 68.5 | 61.6 | 65.9 | 90.6 | 100.0 | 104.6 | 125.4 | 131.7 | 135.3 | 139.0 |
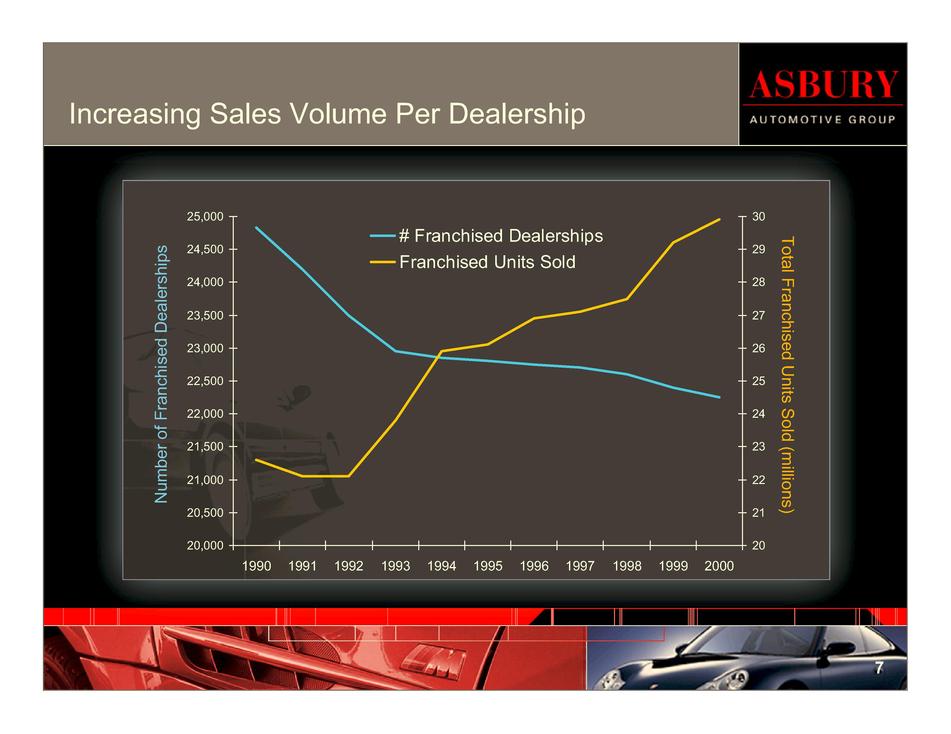
Increasing Sales Volume Per Dealership
| | Franchised Dealerships | Franchised Units Sold | ||
|---|---|---|---|---|
| 1990 | 22.6 | 24.8 | ||
| 1991 | 21.2 | 24.2 | ||
| 1992 | 22.1 | 23.5 | ||
| 1993 | 23.8 | 23.0 | ||
| 1994 | 26.0 | 22.9 | ||
| 1995 | 26.2 | 22.8 | ||
| 1996 | 27.0 | 22.8 | ||
| 1997 | 27.1 | 22.7 | ||
| 1998 | 27.6 | 22.6 | ||
| 1999 | 29.2 | 22.4 | ||
| 2000 | 30.0 | 22.3 | ||
| 2001 | 30.5 | 22.2 |
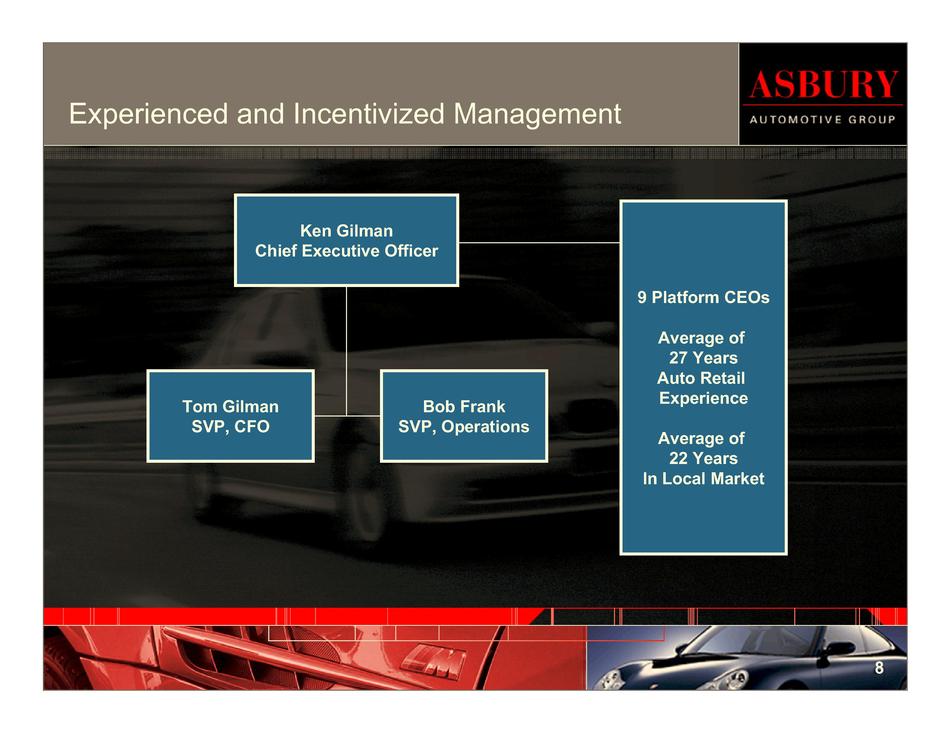
Experienced and Incentivized Management
Ken Gilman
Chief Executive Officer
Tom Gilman
SVP,CFO
Bob Frank
SVP, Operations
9 Platform CEOs
Average of 27 Years Auto Retail Experience
Average of 22 Years In Local Market
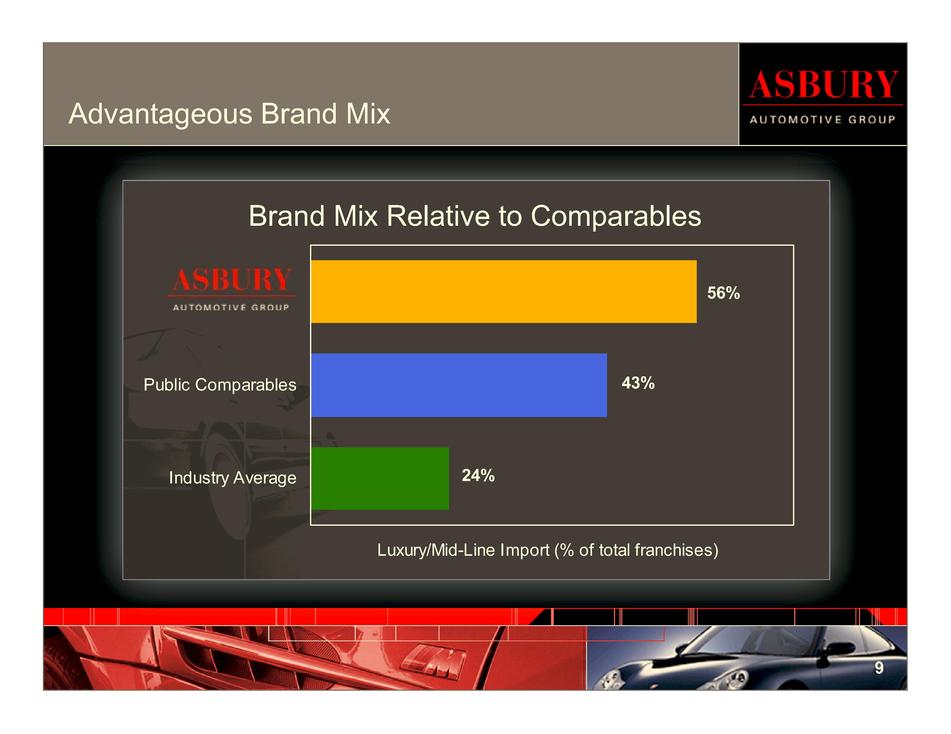
| | Brand Mix Relative to Comparables | |
|---|---|---|
| Asbury Automotive Group | 56% | |
| Public Comparables | 43% | |
| Industry Average | 24% |
Luxury/Mid-Line Omport (% of total franchises)
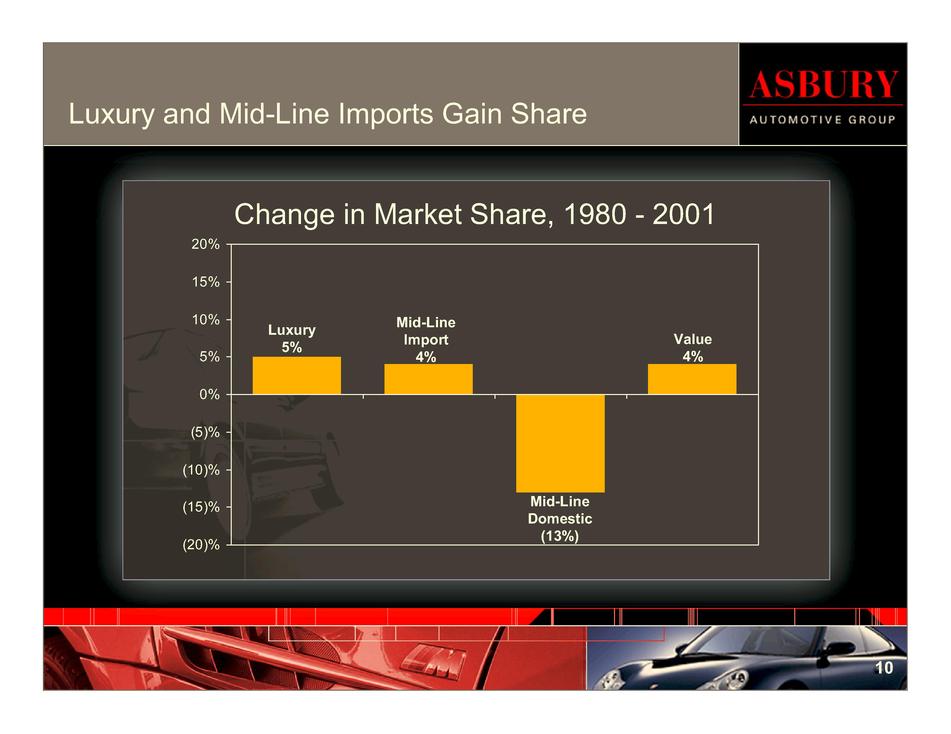
Luxury and Mid-Line Imports Gain Share
| | Change in Market Share, (1980-2001) | ||
|---|---|---|---|
| Luxury | 5 | % | |
| Mid-Line Import | 4 | % | |
| Mid-Line Domestic | (13 | )% | |
| Value | 4 | % |
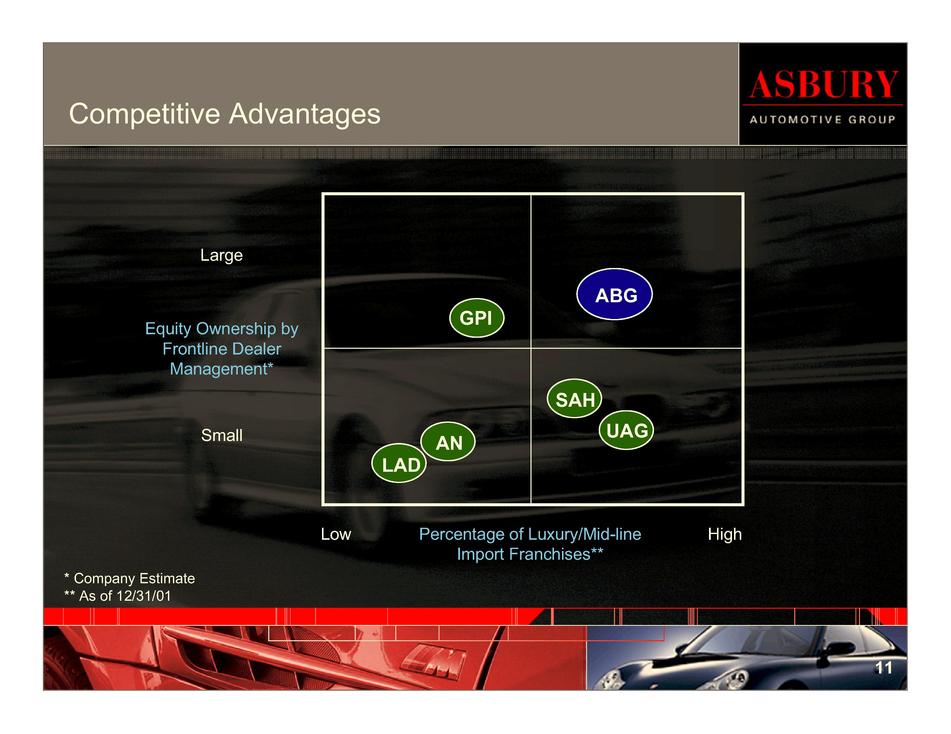
Large
Equity Ownership by Frontline Dealer Management*
Small
Low
Percentage of Luxury/Mid-Line Import Franchises**
High
- *
- Company Estimate
- **
- As of 12/31/01
- o
- Leverage best practices
- o
- Focus on higher margin opportunities by selling additive products and services—Parts & Service and F&I
- o
- Capitalize on mega trends
- •
- Favorable human and machine demographics mean that more cars will be sold and on the road
- •
- Luxury and mid-line imports are gaining share and we are well positioned
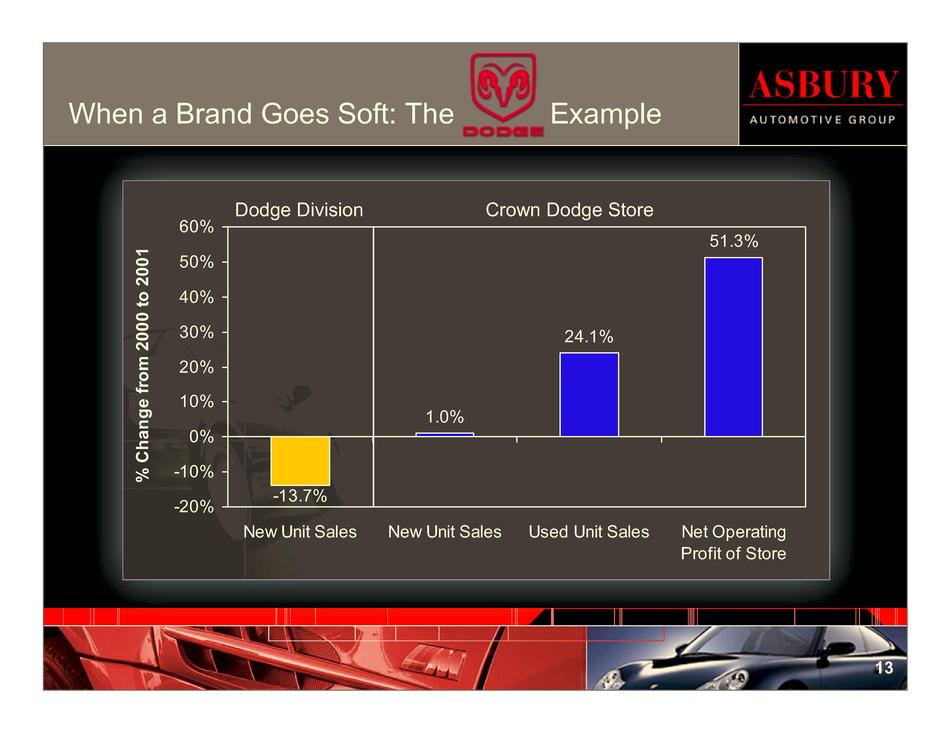
When a Brand Goes Soft: The [Dodge Logo] Example
| | % Change from 2000 to 2001 | |
|---|---|---|
| New Unit Sales | -13.7% | |
| New Unit Sales | 1.0% | |
| Used Unit Sales | 24.1% | |
| Net Operating Profit of Store | 51.3% |
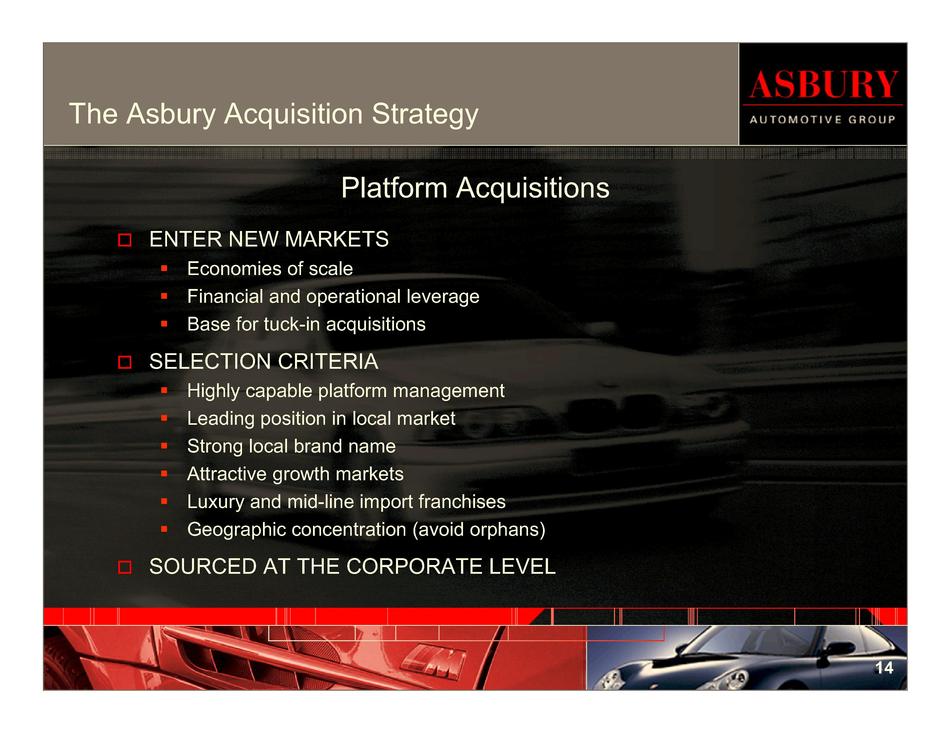
The Asbury Acquisition Strategy
- o
- ENTER NEW MARKETS
- •
- Economies of scale
- •
- Financial and operational leverage
- •
- Base for tuck-in acquisitions
- o
- SELECTION CRITERIA
- •
- Highly capable platform management
- •
- Leading position in local market
- •
- Strong local brand name
- •
- Attractive growth markets
- •
- Luxury and mid-line import franchises
- •
- Geographic concentration (avoid orphans)
- o
- SOURCED AT THE CORPORATE LEVEL
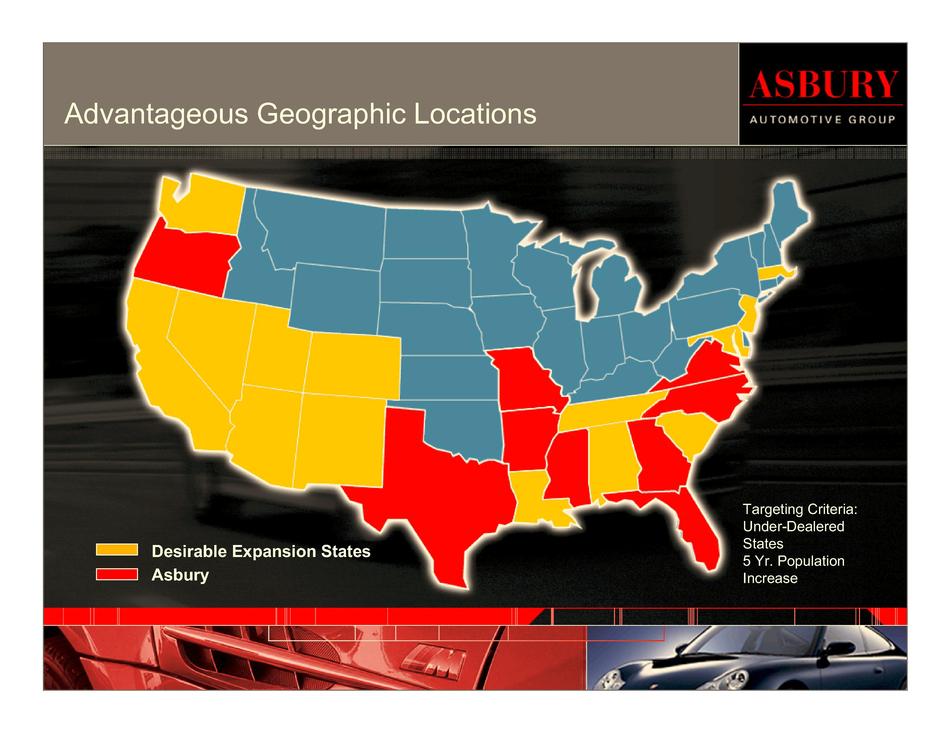
Advantageous Geographic Locations
Desirable Expansion States
Asbury
Targeting Criteria: Under-Dealered States 5 Yr. Population Increase
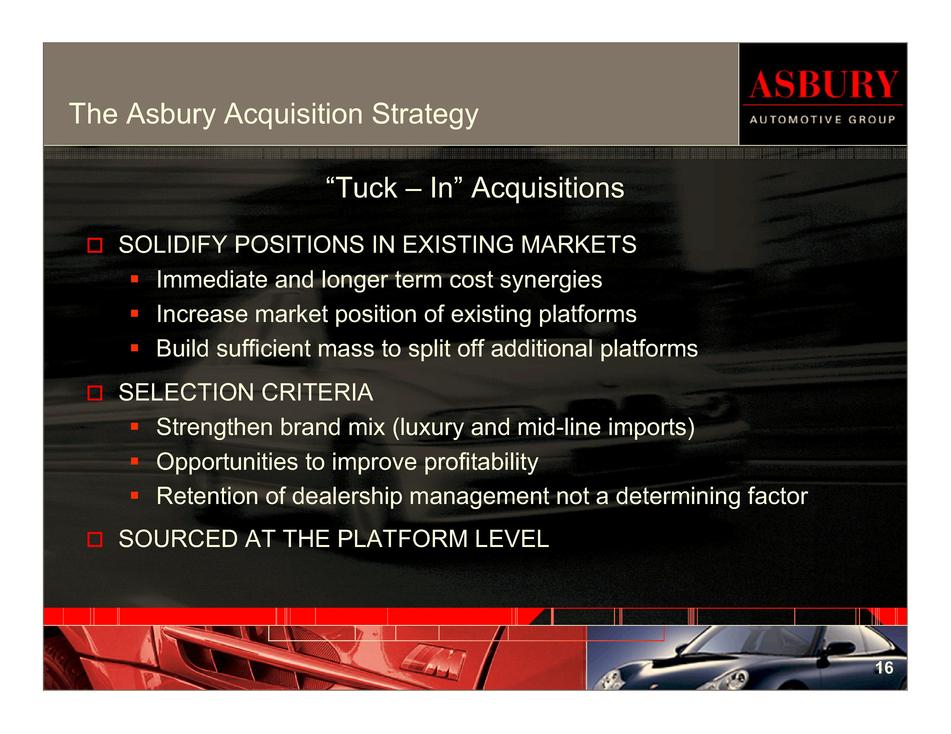
The Asbury Acquisition Strategy
- o
- SOLIDIFY POSITIONS IN EXISTING MARKETS
- •
- Immediate and longer term cost synergies
- •
- Increase market position of existing platforms
- •
- Build sufficient mass to split off additional platforms
- o
- SELECTION CRITERIA
- •
- Strengthen brand mix (luxury and mid-line imports)
- •
- Opportunities to improve profitability
- •
- Retention of dealership management not a determining factor
- o
- SOURCED AT THE PLATFORM LEVEL
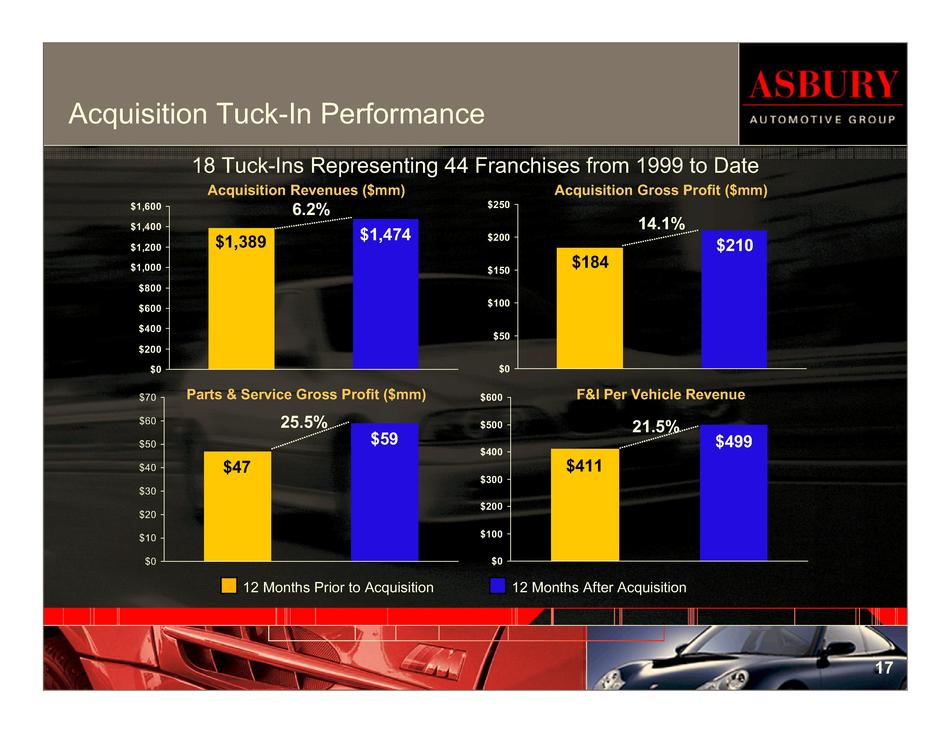
Acquisition Tuck-In Performance
18 Tuck-Ins Representing 44 Franchises from 1999 to Date
| | 12 Months Prior to Acquisition | 12 Months After Acquisition | | |||||
|---|---|---|---|---|---|---|---|---|
| Acquisition Revenues | $ | 1,389 | $ | 1,474 | 6.2% | |||
| Parts & Service Gross Profit ($mm) | $ | 47 | $ | 59 | 25.5% | |||
| Acquisition Gross Profit ($mm) | $ | 184 | $ | 210 | 14.1% | |||
| F&I Per Vehicle Revenue | $ | 411 | $ | 499 | 21.5% | |||

ASBURY
AUTOMOTIVE GROUP
FINANCIAL PERFORMANCE
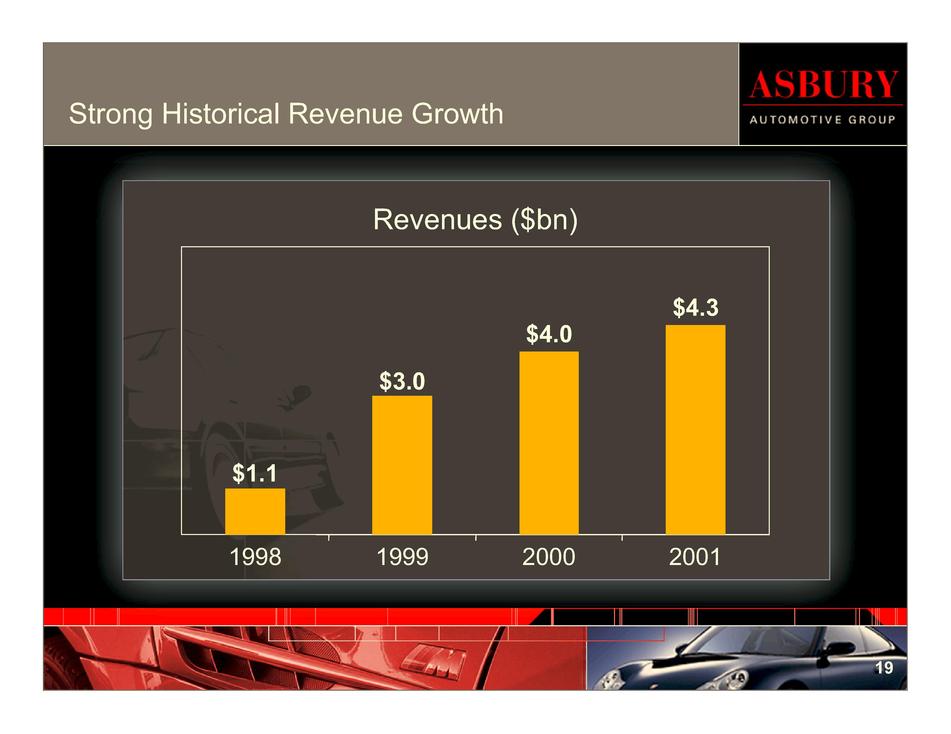
Strong Historical Revenue Growth
| | Revenues ($bn) | ||
|---|---|---|---|
| 1998 | $ | 1.1 | |
| 1999 | $ | 3.0 | |
| 2000 | $ | 4.0 | |
| 2001 | $ | 4.3 | |
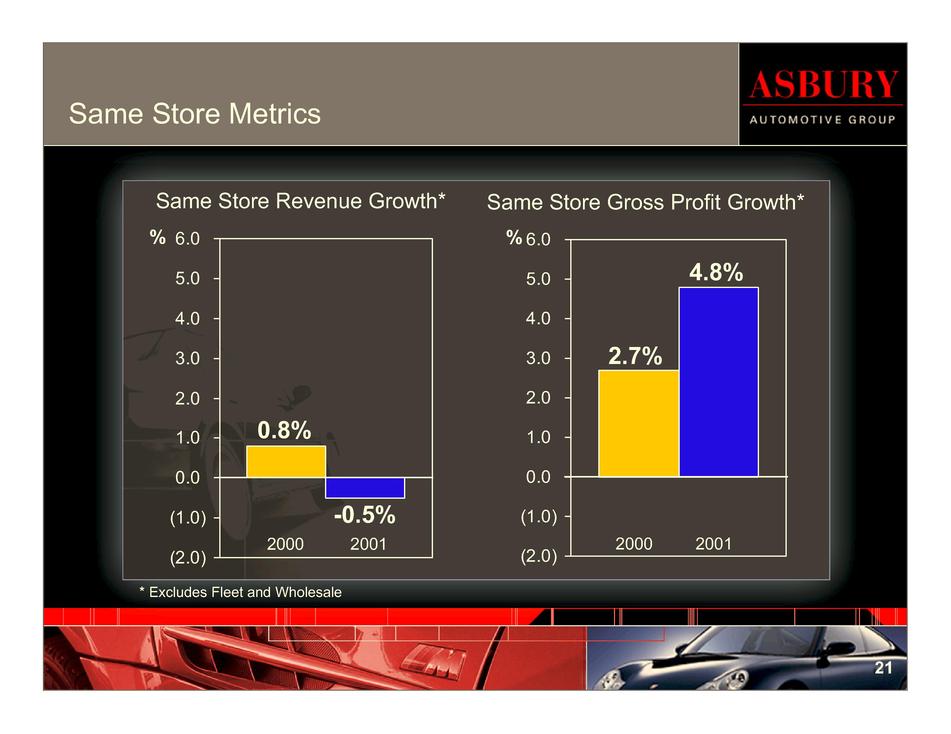
| | Same Store Revenue Growth* | Same Store Gross Profit Growth* | ||
|---|---|---|---|---|
| 2000 | 0.8% | 2.7% | ||
| 2001 | -0.5% | 4.8% |
- *
- Excludes Fleet and Wholesale
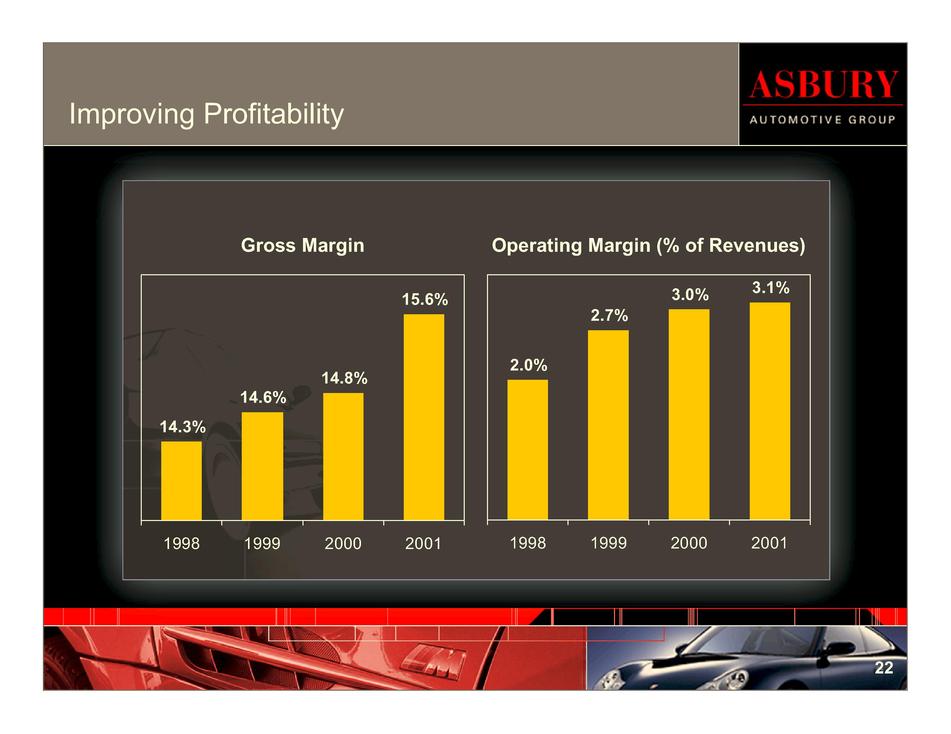
| | Gross Margin | Operating Margin (% of Revenues) | ||
|---|---|---|---|---|
| 1998 | 14.3% | 2.0% | ||
| 1999 | 14.6% | 2.7% | ||
| 2000 | 14.8% | 3.0% | ||
| 2001 | 15.6% | 3.1% |
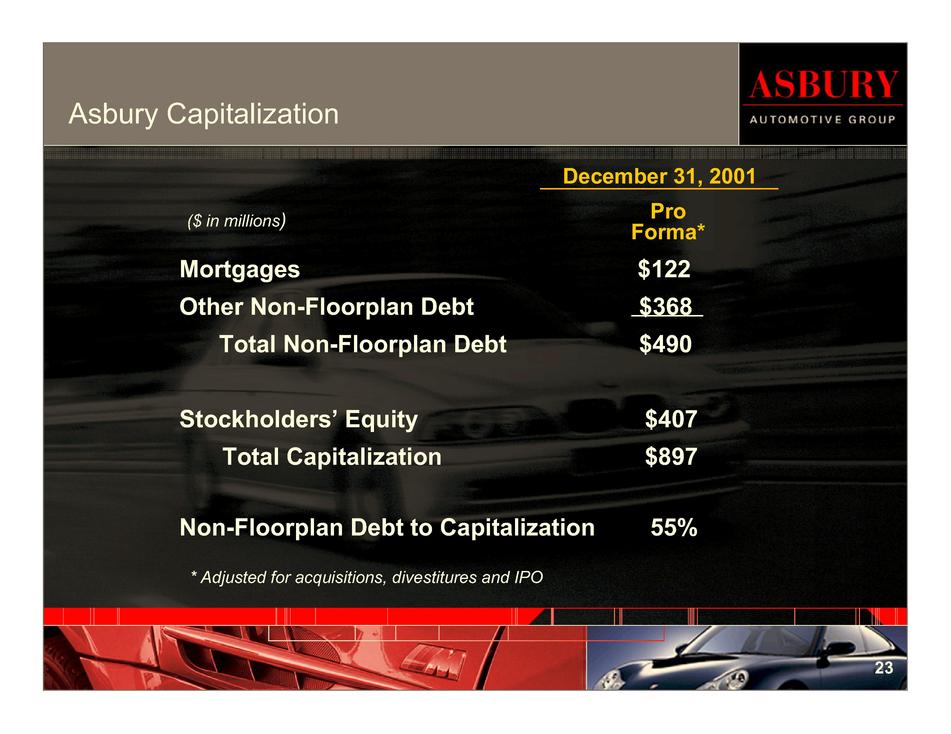
| | December 31, 2001 | ||||
|---|---|---|---|---|---|
| ($ in millions) | | ||||
| Mortgages | $ | 122 | |||
Other Non-Floorplan Debt | $ | 368 | |||
Total Non-Floorplan Debt | $ | 490 | |||
Stockholders' Equity | $ | 407 | |||
Total Capitalization | $ | 897 | |||
Non-Floorplan Debt to Capitalization | 55 | % | |||
* Adjusted for acquisitions, divestitures and IPO
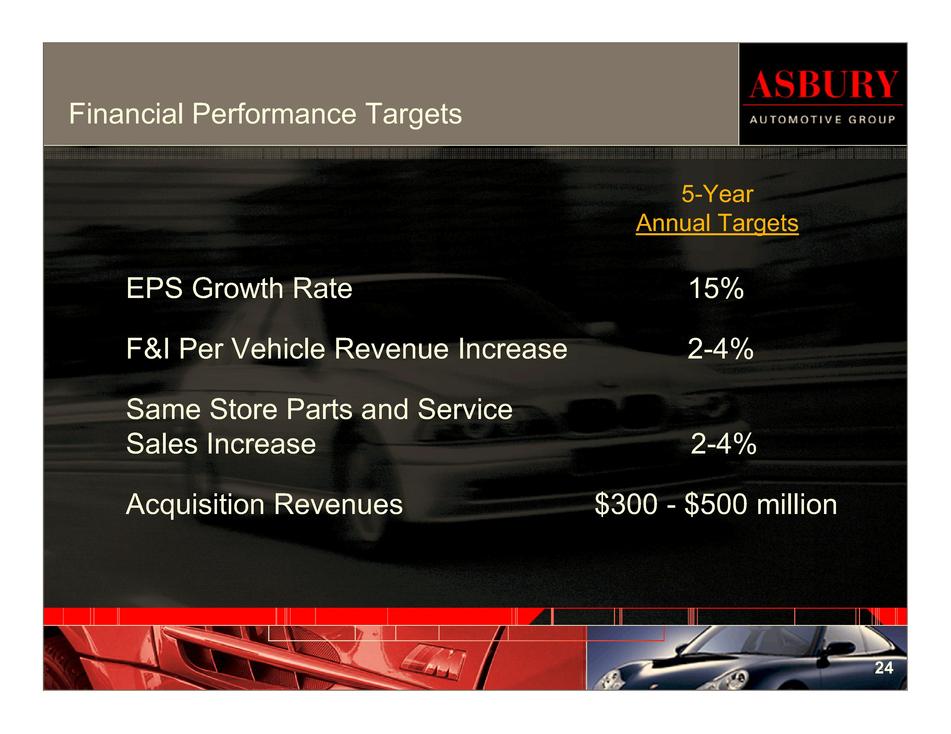
| | 5-Year Annual Targets | |
|---|---|---|
| EPS Growth Rate | 15% | |
F&I Per Vehicle Revenue Increase | 2-4% | |
Same Store Parts and Service Sales Increase | 2-4% | |
Acquisition Revenues | $300 - $500 million |
Disclaimer
Asbury: Leading Auto Retailer
Investment Highlights
Tremendous Growth Potential in Fragmented Industry
Consistent Performance Through Economic Cycles
Increasing Sales Volume Per Dealership
Experienced and Incentivized Management
Advantageous Brand Mix
Luxury and Mid-Line Imports Gain Share
Competitive Advantages
Organic Growth Strategy
When a Brand Goes Soft: The [Dodge Logo] Example
The Asbury Acquisition Strategy
Platform Acquisitions
Advantageous Geographic Locations
The Asbury Acquisition Strategy
"Tuck-In" Acquisitions
Acquisition Tuck-In Performance
Strong Historical Revenue Growth
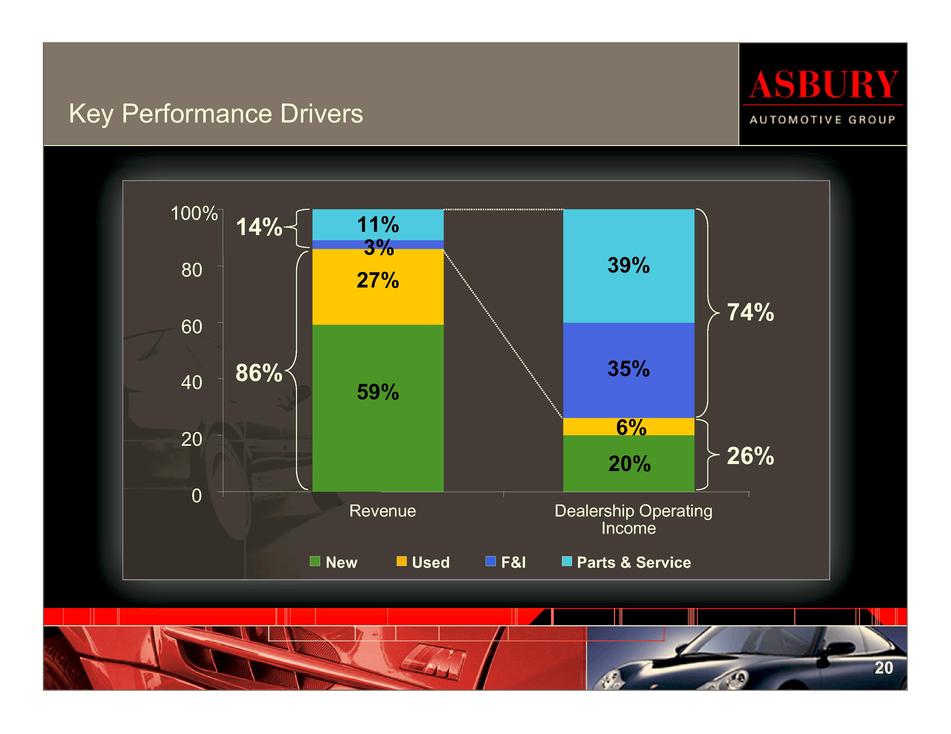
Key Performance Drivers
Same Store Metrics
Improving Profitability
Asbury Capitalization
Financial Performance Targets