1 © Asbury Automotive Group 2021. All rights reserved.NYSE | ABG Acquisition of Larry H. Miller Dealerships & Total Care Auto, Powered by Landcar September 29, 2021 © Asbury Automotive Group 2021. All R ghts Reserved (NYSE: ABG)
2 © Asbury Automotive Group 2021. All rights reserved.NYSE | ABG To the extent that statements in this presentation are not recitations of historical fact, such statements constitute "forward-looking statements" as such term is defined in the Private Securities Litigation Reform Act of 1995. The forward-looking statements in this presentation may include statements relating to goals, plans, expectations, projections regarding the expected benefits of the proposed transaction, management’s plans, projections and objectives for future operations, scale and performance, integration plans and expected synergies therefrom, the timing of completion of the proposed transaction, and our financial position, results of operations, market position, capital allocation strategy, initiatives, business strategy and expectations of our management. The following are some but not all of the factors that could cause actual results or events to differ materially from those anticipated, including: the occurrence of any event, change or other circumstances that could give rise to the termination of the asset purchase agreement; the risk that the necessary manufacturer approvals may not be obtained; the risk that the necessary regulatory approvals may not be obtained or may be obtained subject to conditions that are not anticipated; the risk that the proposed transaction will not be consummated in a timely manner; risks that any of the closing conditions to the proposed acquisition may not be satisfied or may not be satisfied in a timely manner; risks related to disruption of management time from ongoing business operations due to the proposed acquisition; failure to realize the benefits expected from the proposed acquisition; failure to promptly and effectively integrate the acquisition; and the effect of the announcement of the proposed acquisition on their operating results and businesses and on the ability of Asbury and Larry H. Miller Dealerships to retain and hire key personnel, maintain relationships with suppliers; our ability to execute our business strategy; the impact of the COVID-19 pandemic, market factors, Asbury's relationships with, and the financial and operational stability of, vehicle manufacturers and other suppliers, acts of God or other incidents and the shortage of semiconductor chips, which may adversely impact supply from vehicle manufacturers and/or present retail sales challenges, risks associated with Asbury's indebtedness (including available borrowing capacity, compliance with its financial covenants and ability to refinance or repay such indebtedness, on favorable terms), Asbury's relationships with, and the financial stability of, its lenders and lessors, risks related to competition in the automotive retail and service industries, general economic conditions both nationally and locally, governmental regulations, legislation, adverse results in litigation and other proceedings, and Asbury's ability to execute its five-year strategic plan, IT initiatives and other operational strategies, Asbury's ability to leverage gains from its dealership portfolio, Asbury's ability to capitalize on opportunities to repurchase its debt and equity securities or purchase properties that it currently leases, and Asbury's ability to stay within its targeted range for capital expenditures. These risks, uncertainties and other factors are disclosed in Asbury's Annual Report on Form 10-K, subsequent quarterly reports on Form 10-Q and other periodic and current reports filed with the Securities and Exchange Commission from time to time. These forward-looking statements and such risks, uncertainties and other factors speak only as of the date of this presentation. We expressly disclaim any obligation or undertaking to disseminate any updates or revisions to any forward-looking statement contained herein, whether as a result of new information, future events or otherwise. Forward-Looking Statements
3 © Asbury Automotive Group 2021. All rights reserved.NYSE | ABG The information contained in this presentation (including the forward-looking statements) are made as of the date hereof, unless otherwise expressly stated herein. They are subject to change without notice and, except as may be required by applicable law, Asbury expressly disclaims any obligation to update the information contained herein to reflect the occurrence of future events or developments, even if any of the assumptions, judgments and estimates on which the information contained herein is based prove to be incorrect or become outdated. No representation or warranty, express or implied, is made as to, and no reliance should be placed on, the fairness, accuracy, completeness or correctness of the information contained herein. This presentation is intended for informational purposes only. Legal Disclaimer
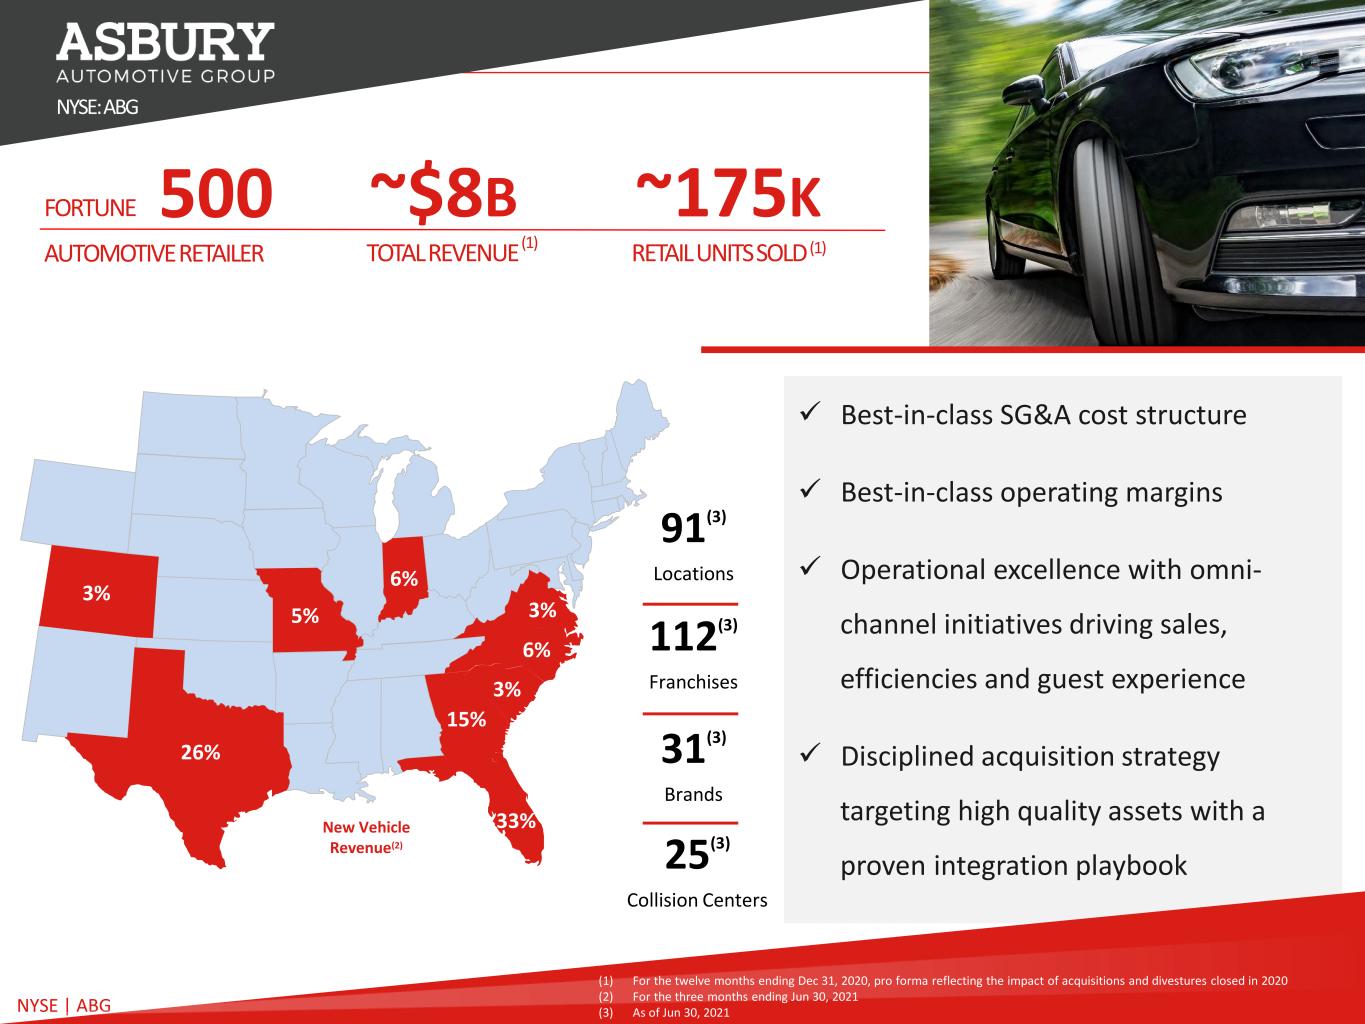
4 © Asbury Automotive Group 2021. All rights reserved.NYSE | ABG Best-in-class SG&A cost structure Best-in-class operating margins Operational excellence with omni- channel initiatives driving sales, efficiencies and guest experience Disciplined acquisition strategy targeting high quality assets with a proven integration playbook FORTUNE AUTOMOTIVE RETAILER 500 26% 3% 5% 33% 15% 3% 6% 3% 6% 91(3) Locations 112(3) Franchises 31(3) Brands ~$8B TOTAL REVENUE (1) New Vehicle Revenue(2) (1) For the twelve months ending Dec 31, 2020, pro forma reflecting the impact of acquisitions and divestures closed in 2020 (2) For the three months ending Jun 30, 2021 (3) As of Jun 30, 2021 NYSE: ABG 25(3) Collision Centers ~175K RETAIL UNITS SOLD (1)
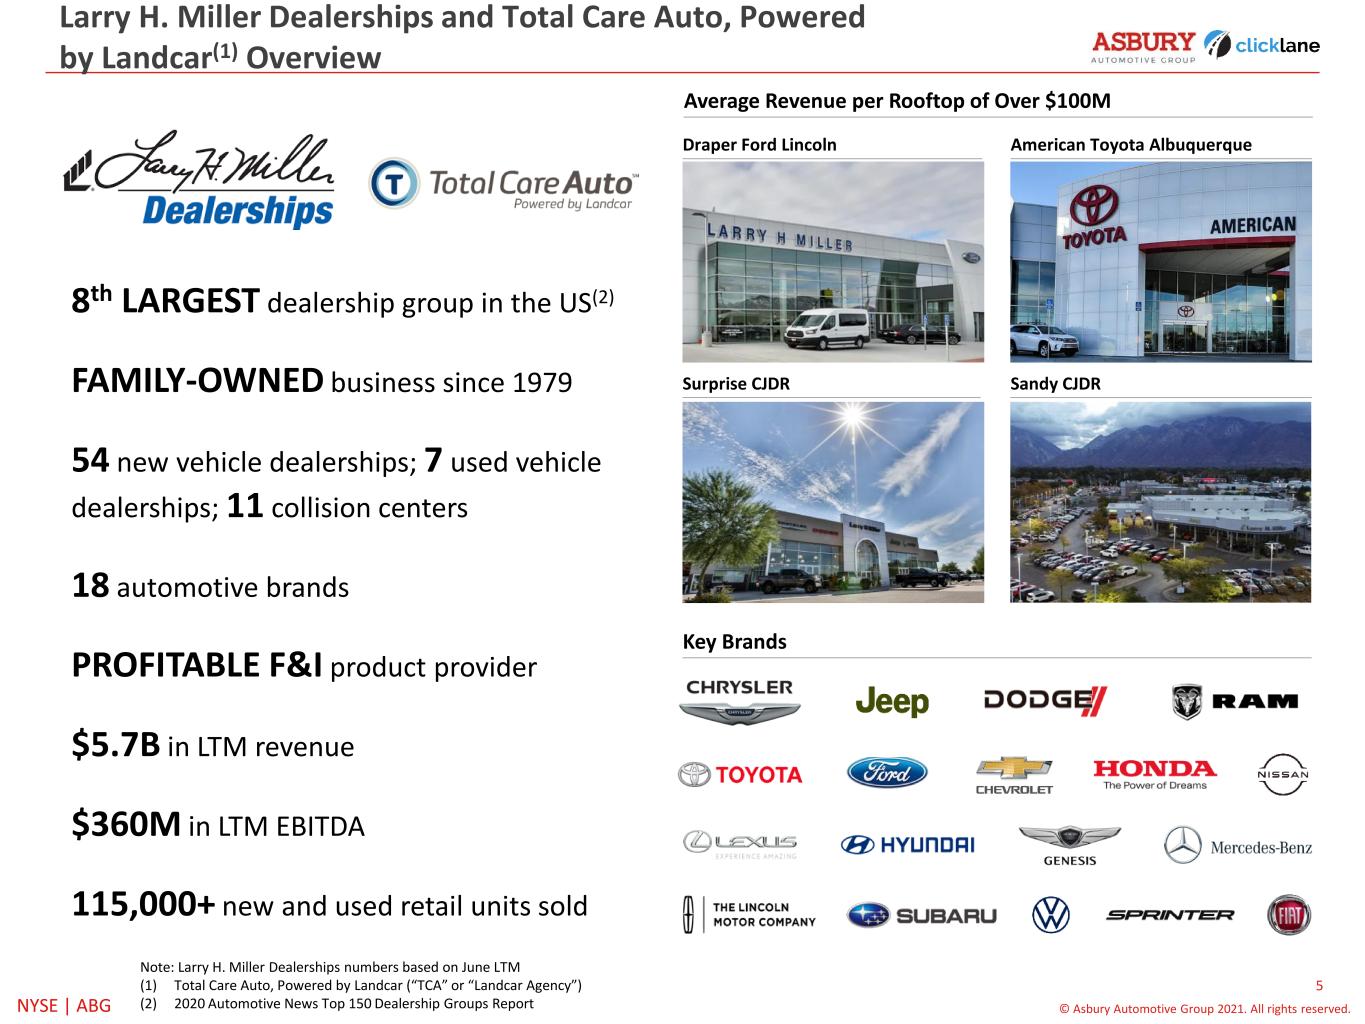
5 © Asbury Automotive Group 2021. All rights reserved.NYSE | ABG Larry H. Miller Dealerships and Total Care Auto, Powered by Landcar(1) Overview 8th LARGEST dealership group in the US(2) FAMILY-OWNED business since 1979 54 new vehicle dealerships; 7 used vehicle dealerships; 11 collision centers 18 automotive brands PROFITABLE F&I product provider $5.7B in LTM revenue $360M in LTM EBITDA 115,000+ new and used retail units sold Draper Ford Lincoln American Toyota Albuquerque Surprise CJDR Sandy CJDR Average Revenue per Rooftop of Over $100M Key Brands Note: Larry H. Miller Dealerships numbers based on June LTM (1) Total Care Auto, Powered by Landcar (“TCA” or “Landcar Agency”) (2) 2020 Automotive News Top 150 Dealership Groups Report
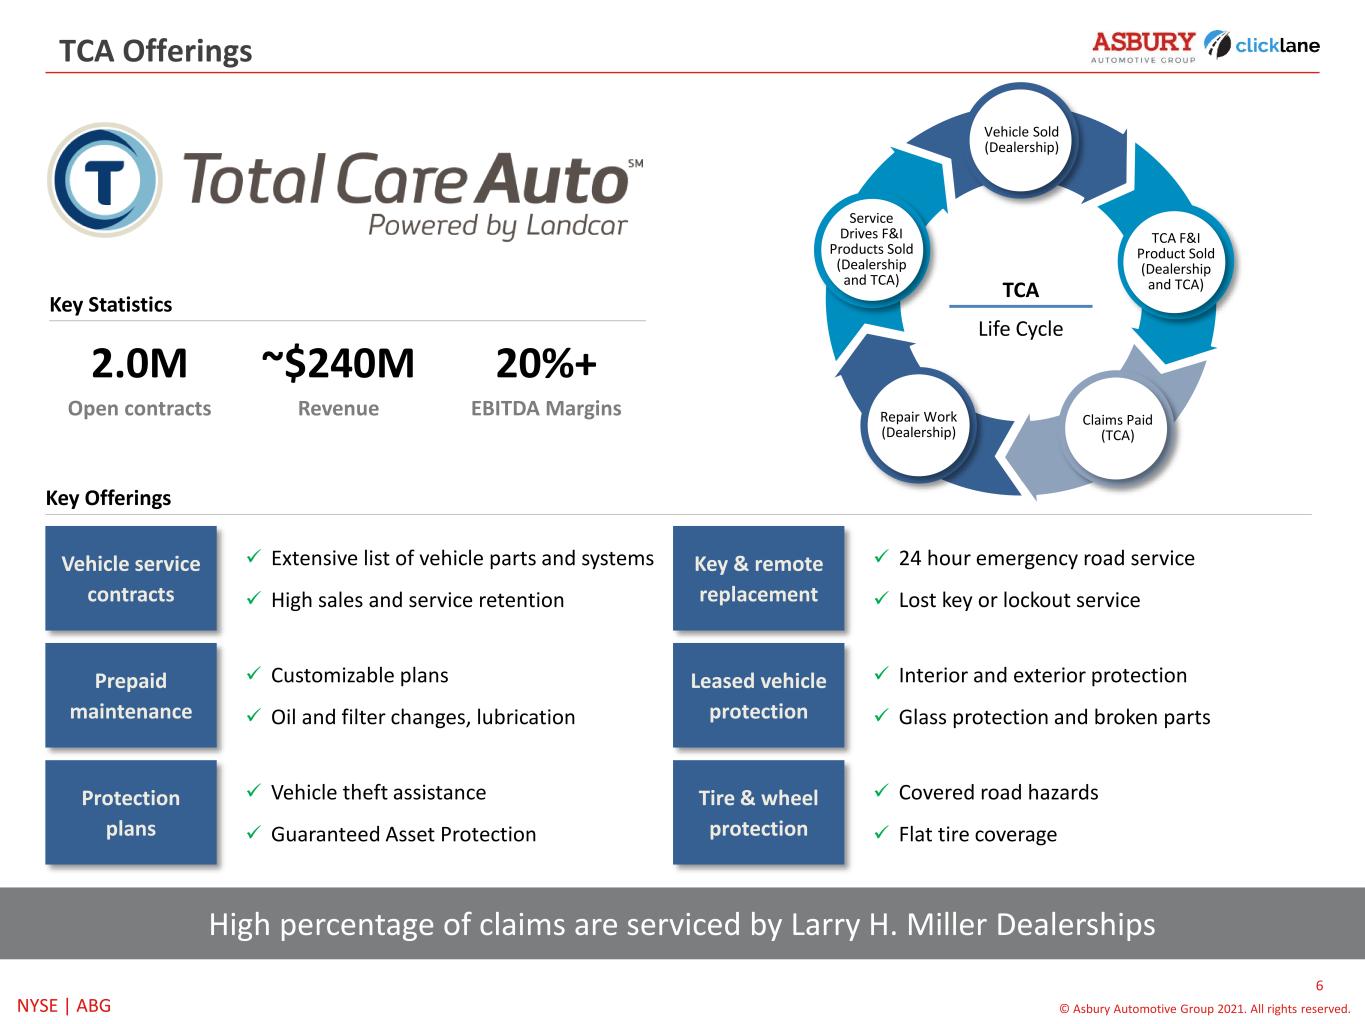
6 © Asbury Automotive Group 2021. All rights reserved.NYSE | ABG TCA Offerings Vehicle service contracts Extensive list of vehicle parts and systems High sales and service retention Prepaid maintenance Customizable plans Oil and filter changes, lubrication Protection plans Vehicle theft assistance Guaranteed Asset Protection Key & remote replacement 24 hour emergency road service Lost key or lockout service Leased vehicle protection Interior and exterior protection Glass protection and broken parts Tire & wheel protection Covered road hazards Flat tire coverage Key Offerings Key Statistics 2.0M Open contracts 20%+ EBITDA Margins ~$240M Revenue High percentage of claims are serviced by Larry H. Miller Dealerships Vehicle Sold (Dealership) TCA F&I Product Sold (Dealership and TCA) Claims Paid (TCA) Repair Work (Dealership) Service Drives F&I Products Sold (Dealership and TCA) TCA Life Cycle
7 © Asbury Automotive Group 2021. All rights reserved.NYSE | ABG Transaction Highlights Meaningfully increases Asbury’s scale and creates the 4th largest US automotive retailer1 Strong portfolio of dealerships with a long history of operational excellence and valuable brands2 Enhancing presence in targeted high-growth markets with attractive demographic dynamics3 Ownership of TCA, a highly-scalable provider of a full-suite of F&I products, will enhance profitability with 20%+ EBITDA margins6 Transaction is expected to add ~$360M in EBITDA (expected to be accretive to 2022 EPS by ~20% when factoring in additional acquisitions under contract and by ~28% in 2024)(1)7 Leverages the Clicklane transactional tool to create a coast-to-coast, truly expansive, omni-channel platform5 Dealership portfolio is highly aligned to customer brand preferences within the markets4 Exceeds previously published 5-year target for M&A within the first year of the plan8 (1) Assumes impact of potential $600M of equity financing
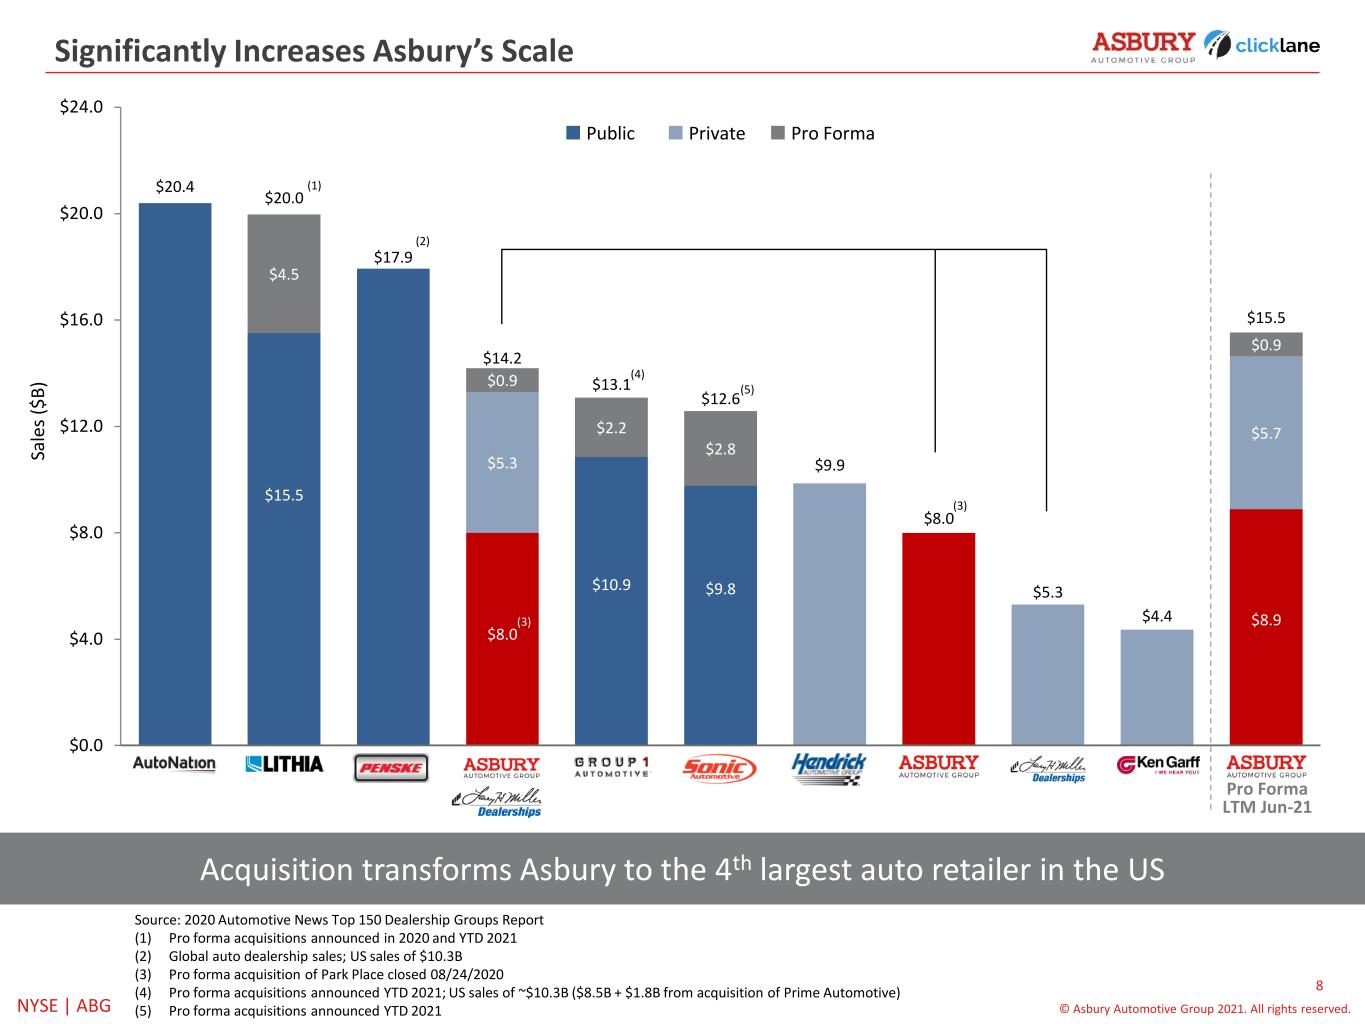
8 © Asbury Automotive Group 2021. All rights reserved.NYSE | ABG $20.4 $20.0 $17.9 $14.2 $13.1 $12.6 $9.9 $8.0 $5.3 $4.4 $15.5 $15.5 $8.0 $10.9 $9.8 $8.9 $5.3 $5.7 $0.9 $0.9 $4.5 $2.2 $2.8 $0.0 $4.0 $8.0 $12.0 $16.0 $20.0 $24.0 AutoNation Lithia Penske Asbury + LHM + Stevinson/LOIs Group 1 Sonic Hendrick Asbury Standalone LHM Standalone Ken Garff Asbury Pro Forma LTM Jun-21 Source: 2020 Automotive News Top 150 Dealership Groups Report (1) Pro forma acquisitions announced in 2020 and YTD 2021 (2) Global auto dealership sales; US sales of $10.3B (3) Pro forma acquisition of Park Place closed 08/24/2020 (4) Pro forma acquisitions announced YTD 2021; US sales of ~$10.3B ($8.5B + $1.8B from acquisition of Prime Automotive) (5) Pro forma acquisitions announced YTD 2021 Significantly Increases Asbury’s Scale Acquisition transforms Asbury to the 4th largest auto retailer in the US (1) (3) Sa le s ($ B ) (2) (4) Pro Forma LTM Jun-21 (5) (3) Public Private Pro Forma
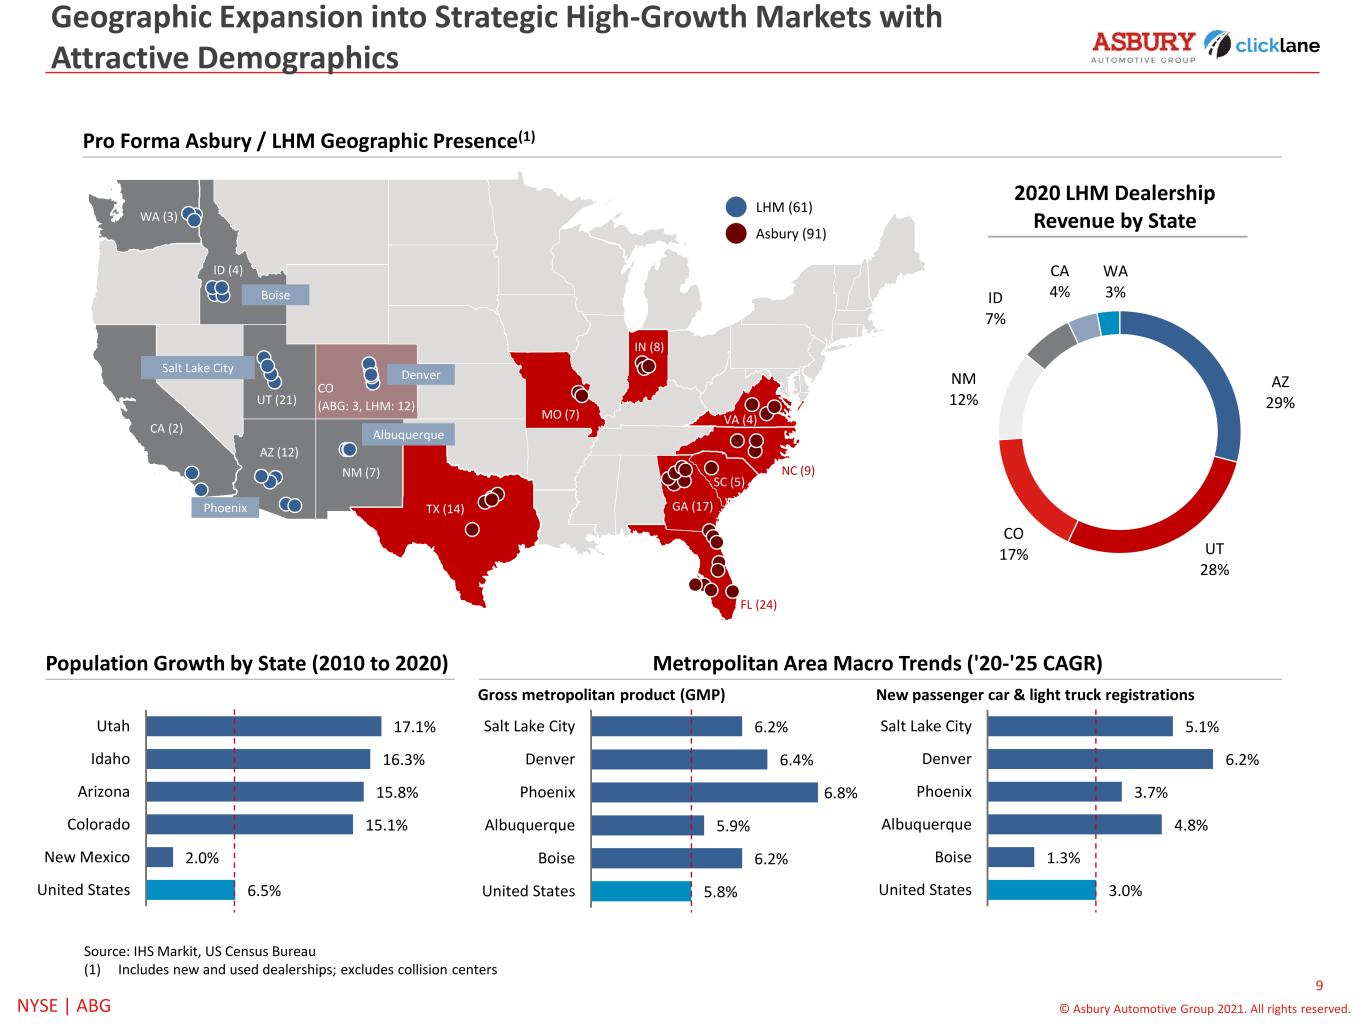
9 © Asbury Automotive Group 2021. All rights reserved.NYSE | ABG Pro Forma Asbury / LHM Geographic Presence(1) Source: IHS Markit, US Census Bureau (1) Includes new and used dealerships; excludes collision centers Metropolitan Area Macro Trends ('20-'25 CAGR) 5.1% 6.2% 3.7% 4.8% 1.3% 3.0% Salt Lake City Denver Phoenix Albuquerque Boise United States 2020 LHM Dealership Revenue by State WA (3) ID (4) CO (ABG: 3, LHM: 12) NM (7) AZ (12) CA (2) UT (21) TX (14) FL (24) MO (7) GA (17) SC (5) VA (4) NC (9) Boise Denver Albuquerque Phoenix Salt Lake City LHM (61) Asbury (91) IN (8) AZ 29% UT 28% CO 17% NM 12% ID 7% CA 4% WA 3% Population Growth by State (2010 to 2020) 17.1% 16.3% 15.8% 15.1% 2.0% 6.5% Utah Idaho Arizona Colorado New Mexico United States New passenger car & light truck registrationsGross metropolitan product (GMP) 6.2% 6.4% 6.8% 5.9% 6.2% 5.8% Salt Lake City Denver Phoenix Albuquerque Boise United States Geographic Expansion into Strategic High-Growth Markets with Attractive Demographics
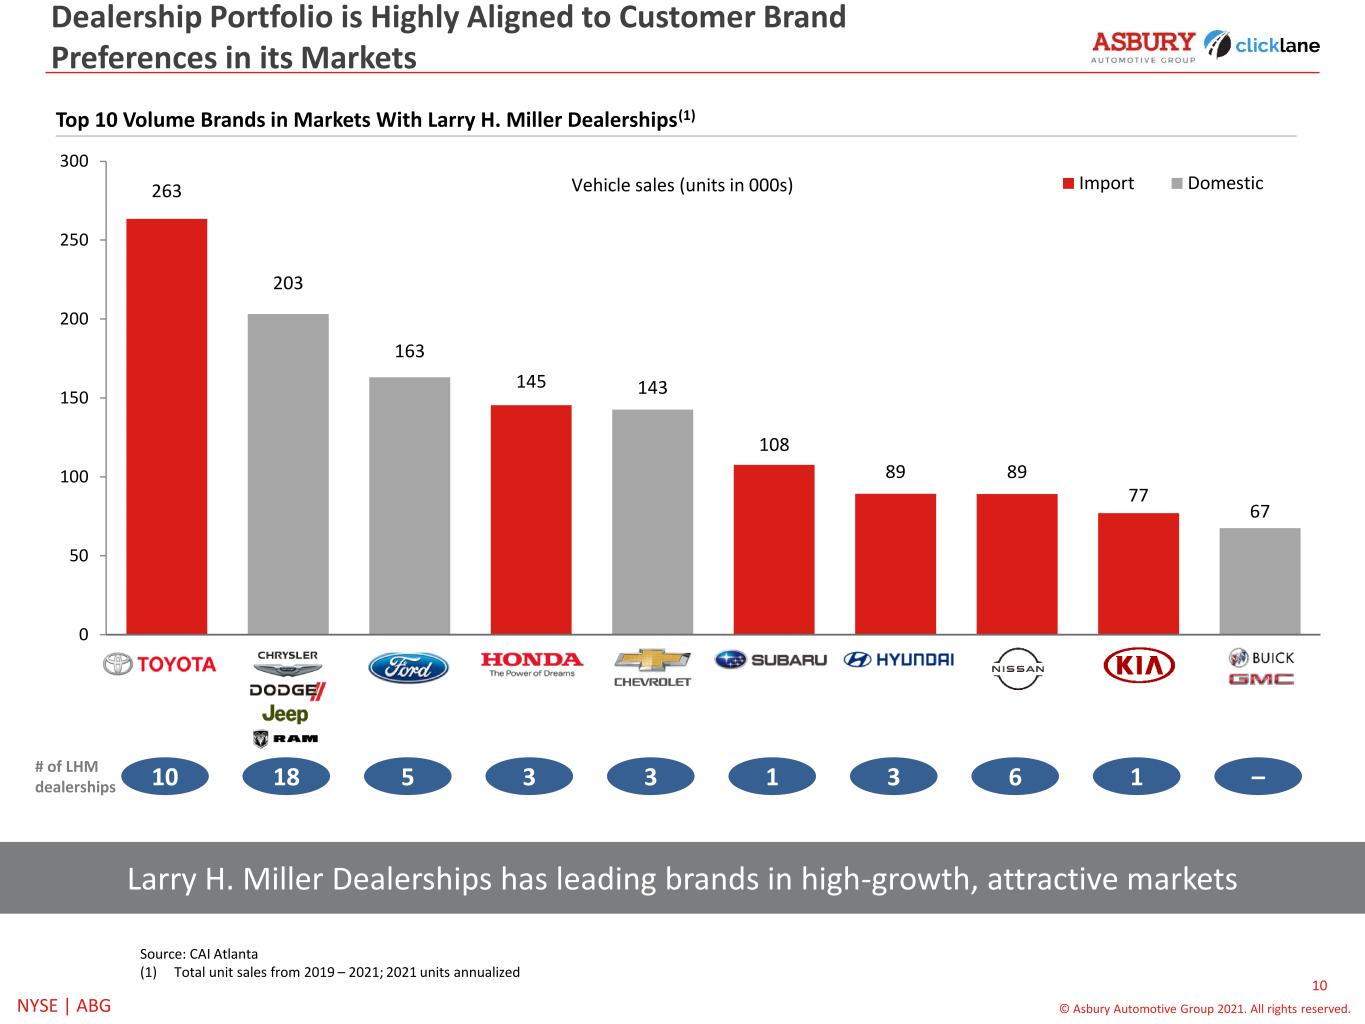
10 © Asbury Automotive Group 2021. All rights reserved.NYSE | ABG 263 203 163 145 143 108 89 89 77 67 0 50 100 150 200 250 300 Toyota CDJR Ford Honda Chevrolet Subaru Hyundai Nissan Kia Buick GMC Import Domestic Dealership Portfolio is Highly Aligned to Customer Brand Preferences in its Markets Top 10 Volume Brands in Markets With Larry H. Miller Dealerships(1) Source: CAI Atlanta (1) Total unit sales from 2019 – 2021; 2021 units annualized 10 18 5 3 3 1 3 6 1 – # of LHM dealerships Larry H. Miller Dealerships has leading brands in high-growth, attractive markets Vehicle sales (units in 000s)
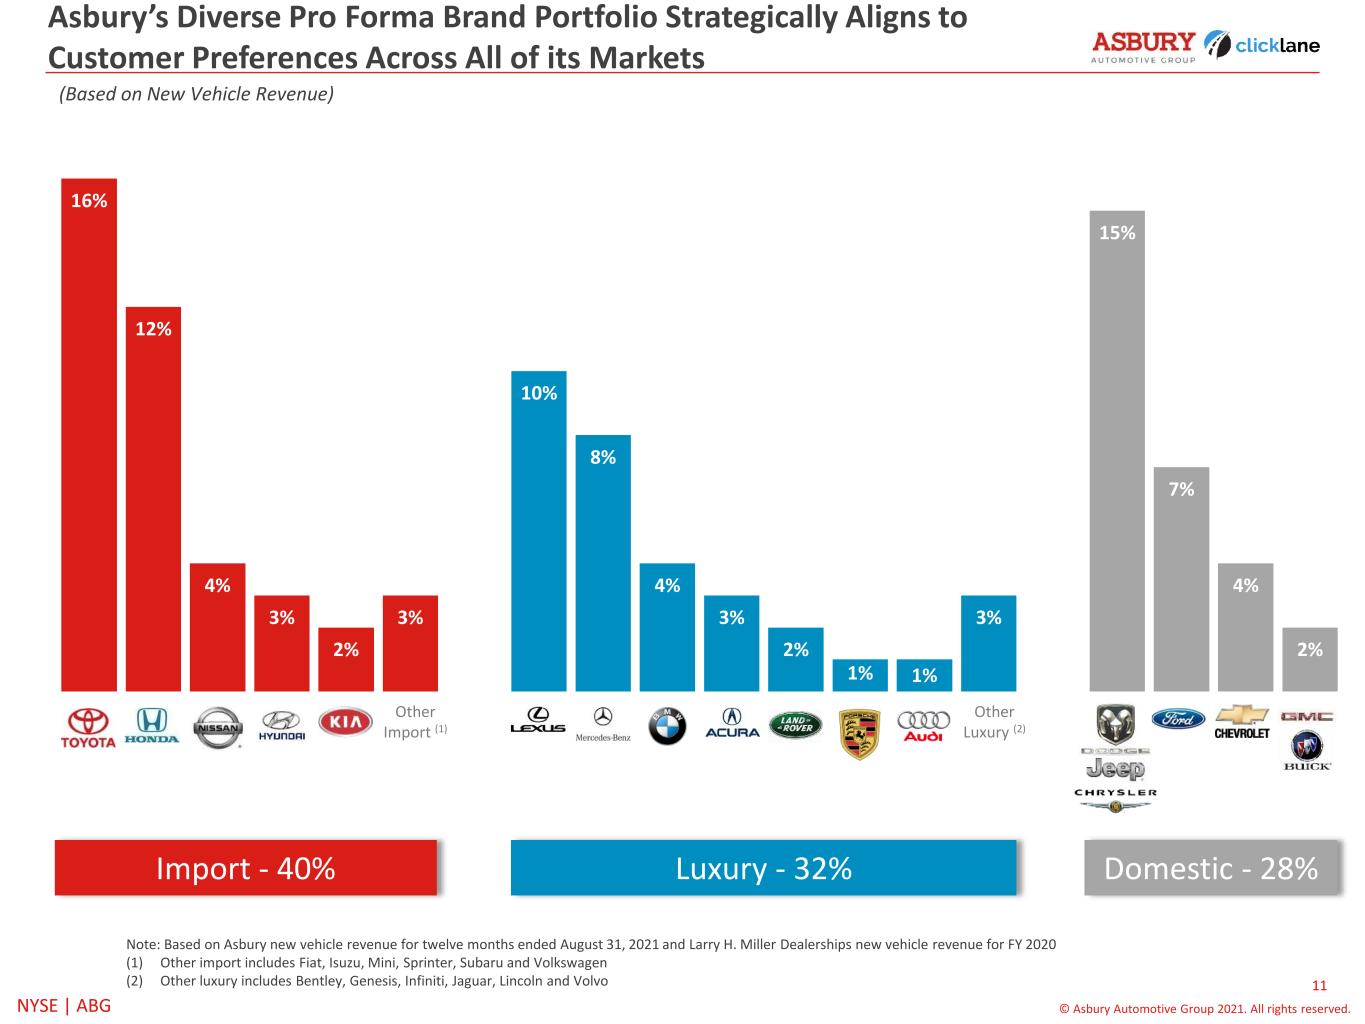
11 © Asbury Automotive Group 2021. All rights reserved.NYSE | ABG 16% 12% 4% 3% 2% 3% 10% 8% 4% 3% 2% 1% 1% 3% 15% 7% 4% 2% Asbury’s Diverse Pro Forma Brand Portfolio Strategically Aligns to Customer Preferences Across All of its Markets Import - 40% Luxury - 32% Domestic - 28% (Based on New Vehicle Revenue) Note: Based on Asbury new vehicle revenue for twelve months ended August 31, 2021 and Larry H. Miller Dealerships new vehicle revenue for FY 2020 (1) Other import includes Fiat, Isuzu, Mini, Sprinter, Subaru and Volkswagen (2) Other luxury includes Bentley, Genesis, Infiniti, Jaguar, Lincoln and Volvo Other Import (1) Other Luxury (2)
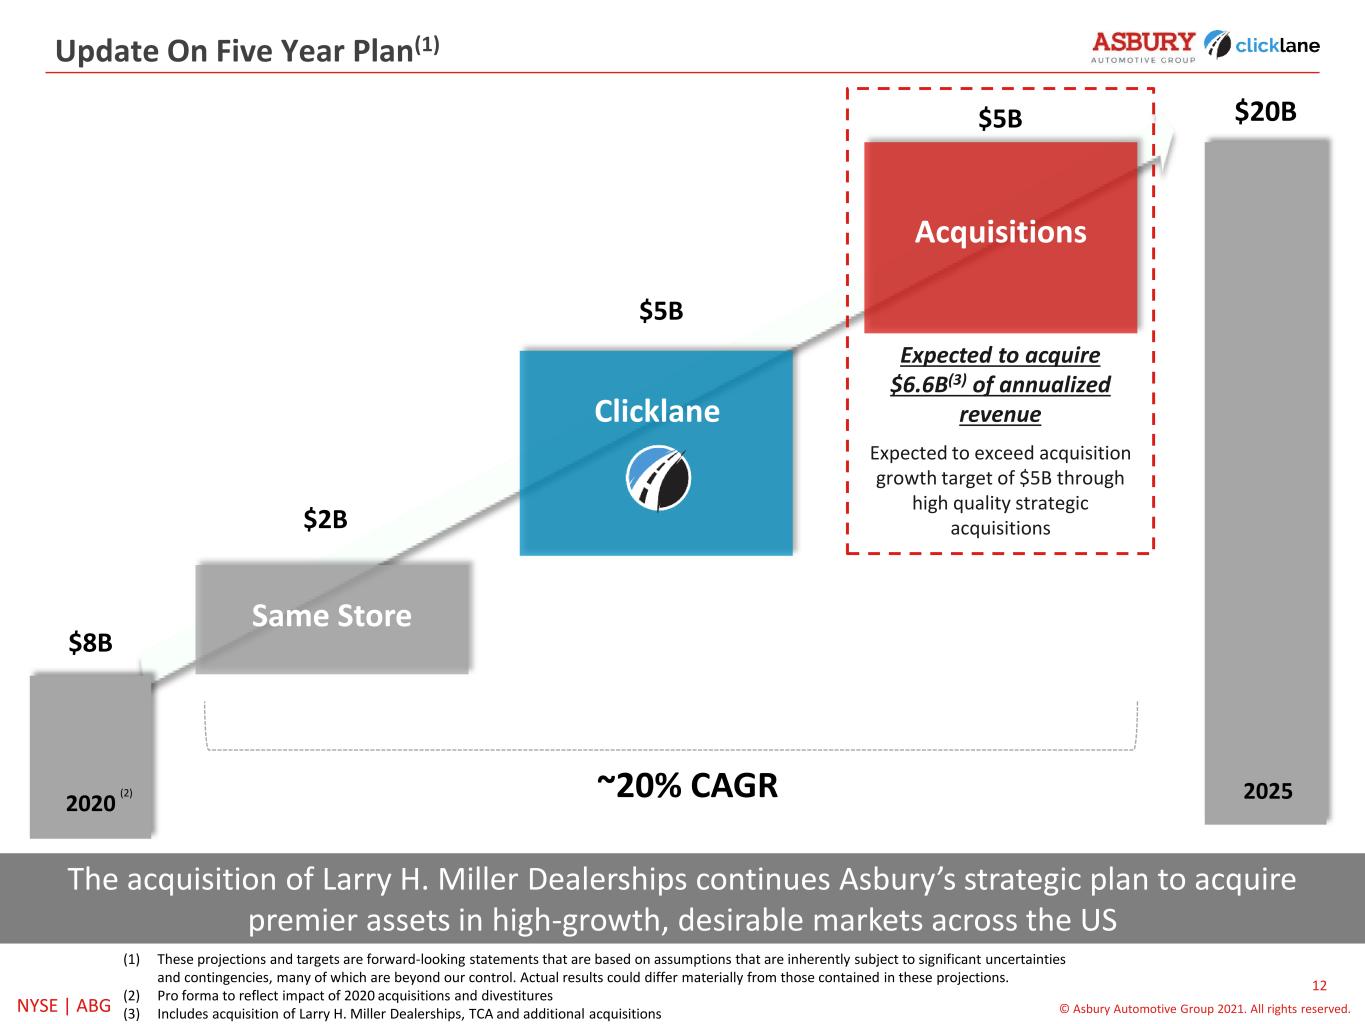
12 © Asbury Automotive Group 2021. All rights reserved.NYSE | ABG Update On Five Year Plan(1) The acquisition of Larry H. Miller Dealerships continues Asbury’s strategic plan to acquire premier assets in high-growth, desirable markets across the US $8B $2B $5B $20B Same Store Acquisitions 2020 2025~20% CAGR(2) Clicklane $5B Expected to acquire $6.6B(3) of annualized revenue Expected to exceed acquisition growth target of $5B through high quality strategic acquisitions (1) These projections and targets are forward-looking statements that are based on assumptions that are inherently subject to significant uncertainties and contingencies, many of which are beyond our control. Actual results could differ materially from those contained in these projections. (2) Pro forma to reflect impact of 2020 acquisitions and divestitures (3) Includes acquisition of Larry H. Miller Dealerships, TCA and additional acquisitions
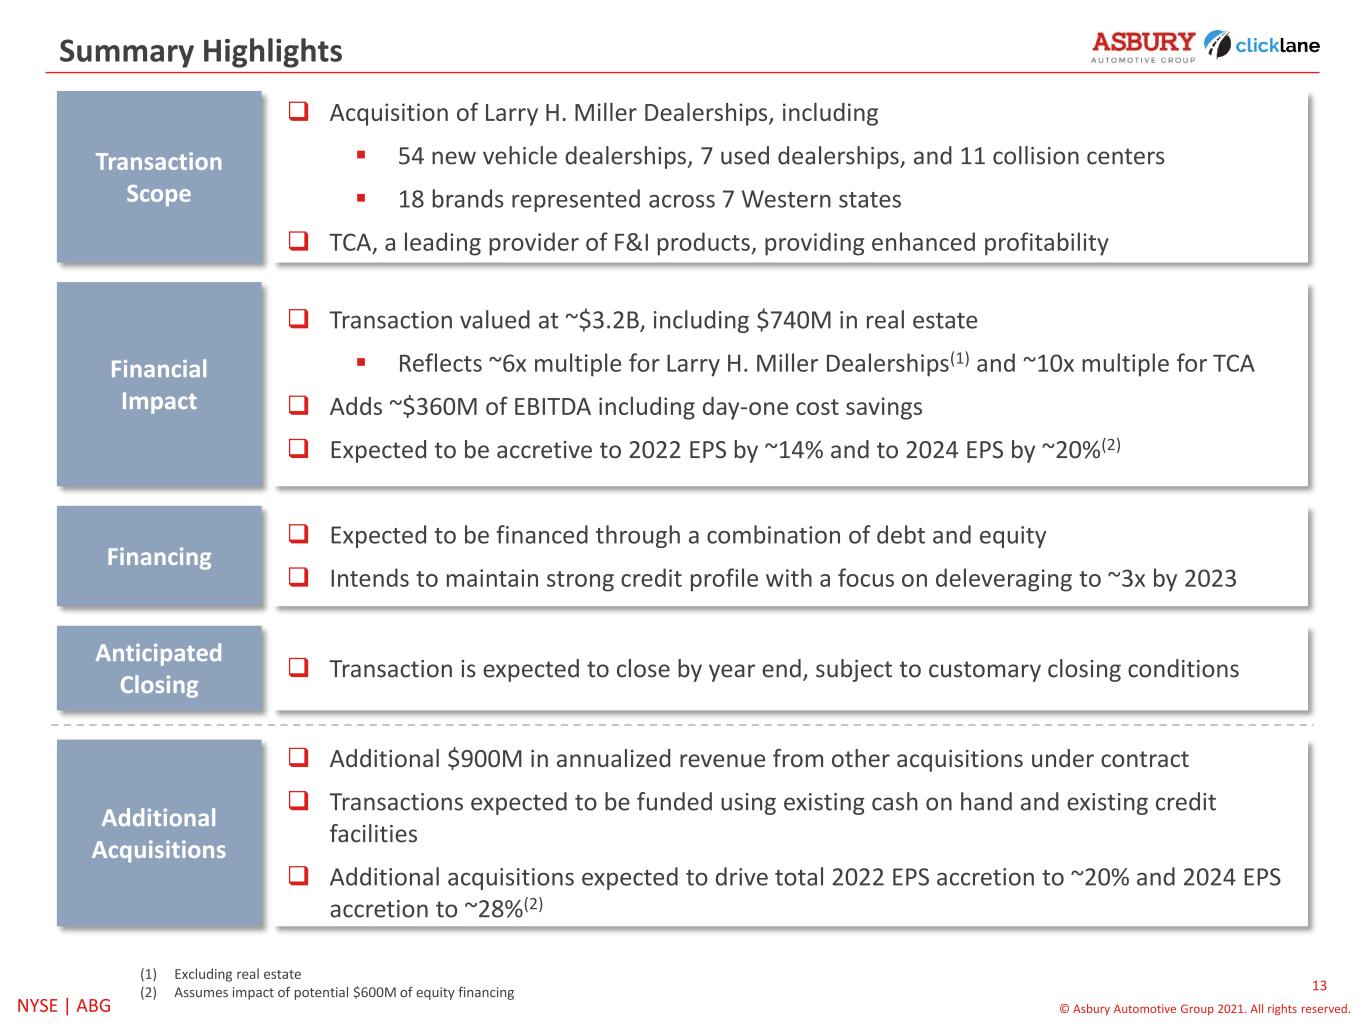
13 © Asbury Automotive Group 2021. All rights reserved.NYSE | ABG Summary Highlights Financial Impact Transaction valued at ~$3.2B, including $740M in real estate Reflects ~6x multiple for Larry H. Miller Dealerships(1) and ~10x multiple for TCA Adds ~$360M of EBITDA including day-one cost savings Expected to be accretive to 2022 EPS by ~14% and to 2024 EPS by ~20%(2) Financing Expected to be financed through a combination of debt and equity Intends to maintain strong credit profile with a focus on deleveraging to ~3x by 2023 Anticipated Closing Transaction is expected to close by year end, subject to customary closing conditions Transaction Scope Acquisition of Larry H. Miller Dealerships, including 54 new vehicle dealerships, 7 used dealerships, and 11 collision centers 18 brands represented across 7 Western states TCA, a leading provider of F&I products, providing enhanced profitability (1) Excluding real estate (2) Assumes impact of potential $600M of equity financing Additional Acquisitions Additional $900M in annualized revenue from other acquisitions under contract Transactions expected to be funded using existing cash on hand and existing credit facilities Additional acquisitions expected to drive total 2022 EPS accretion to ~20% and 2024 EPS accretion to ~28%(2)
14 © Asbury Automotive Group 2021. All rights reserved.NYSE | ABG Q&A


