QuickLinks -- Click here to rapidly navigate through this document
SECURITIES AND EXCHANGE COMMISSION
Washington, D.C. 20549
FORM 6-K
Report of Foreign Private Issuer
Pursuant to Rule 13a-16 or 15d-16
of the Securities Exchange Act of 1934
For the month of April 2004
Preem Holdings AB (publ)
(Translation of registrant's name into English)
Sandhamnsgatan 51, S-11590, Stockholm, Sweden
(Address of principal executive offices)
Indicate by check mark whether the registrant files or will file annual reports under cover of Form 20-F or Form 40-F.
Form 20-F /X/ Form 40-F / /
Indicate by check mark if the registrant is submitting the Form 6-K in paper as permitted by Regulation S-T Rule 101(b)(1): / /
Indicate by check mark if the registrant is submitting the Form 6-K in paper as permitted by Regulation S-T Rule 101(b)(7): / /
Indicate by check mark whether the registrant by furnishing the information contained in this Form is also thereby furnishing the information to the Commission pursuant to Rule 12g3-2 (b) under the Securities Exchange Act of 1934.
Yes / / No /X/
If "Yes" is marked, indicate below the file number assigned to the registrant in connection with Rule 12g3-2(b): 82-
Pursuant to the requirements of the Securities Exchange Act of 1934, the registrant has duly caused this report to be signed on its behalf by the undersigned, thereunto duly authorized.
| Preem Holdings AB (publ) | ||||
Date: April 28, 2004 | By: | /s/ PER HÖJGÅRD Name: Per Höjgård Title: Chief Financial Officer | ||
On April 27, 2004, Preem Holdings AB (publ) announced, and submitted the press release containing such announcement in a separate Form 6-K dated April 27, 2004, that it intends to raise, subject to market and other conditions, approximately €125 million of debt financing by the issuance of senior subordinated notes through its wholly owned subsidiary, Preem Petroleum AB (publ), in the international bond markets. Preem Holdings AB (publ) will guarantee the notes on a senior basis. The offering is expected to close during the second quarter of 2004. In connection therewith, we anticipate disclosing to prospective purchasers of the senior subordinated notes information that has not been previously publicly reported. We have elected to provide this information, together with other information that has been previously publicly disclosed, in this Form 6-K.
Nothing herein shall constitute an offer to sell or the solicitation of an offer to buy the notes, nor shall there be any sale of the notes in any state in which such offer, solicitation or sale would be unlawful prior to registration or qualification under the securities laws of any such state. The notes will be offered to qualified institutional buyers in reliance on Rule 144A under the U.S. Securities Act of 1933, as amended (the "Securities Act") and outside the United States in reliance on Regulation S under the Securities Act. The notes will not be registered under the Securities Act. Unless and until so registered, the notes may not be offered or sold in the United States except pursuant to an exemption from, or in a transaction not subject to, the registration requirements of the Securities Act and applicable state securities laws.
Certain Information with Respect to Preem Holdings AB (publ)
to be Disclosed to Prospective Purchasers of Senior Subordinated Notes
not Previously Publicly Reported
DISCLOSURE REGARDING FORWARD-LOOKING STATEMENTS
This offering memorandum includes forward-looking statements. These forward-looking statements can be identified by the use of forward-looking terminology, including the terms "believes," "estimates," "anticipates," "expects," "intends," "may," "will" or "should" or, in each case, their negative, or other variations or comparable terminology. These forward-looking statements include all matters that are not historical facts. They appear in a number of places throughout this offering memorandum and include statements regarding our intentions, beliefs or current expectations concerning, among other things, our results of operations, financial condition, liquidity, prospects, growth, strategies and the industry in which we operate.
By their nature, forward-looking statements involve risks and uncertainties because they relate to events and depend on circumstances that may or may not occur in the future. We caution you that forward-looking statements are not guarantees of future performance and that our actual results of operations, financial condition and liquidity, and the development of the industry in which we operate may differ materially from those made in or suggested by the forward-looking statements contained in this offering memorandum. In addition, even if our results of operations, financial condition and liquidity, and the development of the industry in which we operate are consistent with the forward-looking statements contained in this offering memorandum, those results or developments may not be indicative of results or developments in subsequent periods. Important factors that could cause those differences include, but are not limited to:
- •
- our substantial indebtedness;
- •
- our ability to obtain sufficient short-term credit to finance our spot market crude oil purchases and long-term credit to finance our future capital expenditures;
- •
- volatility in refining margins and in market prices for crude oil and refined products;
- •
- operational hazards;
- •
- our future capital needs;
- •
- our ability to comply with existing or newly implemented environmental regimes in the countries in which we operate;
- •
- our liability for violations, known and unknown, under environmental laws;
- •
- our ability to remediate contaminated sites within budgeted amounts;
- •
- our ability to hedge against currency, commodity and interest rate risks;
- •
- agreements or disagreements among members of OPEC; and
- •
- limitations on our operational flexibility arising under agreements governing our debt.
We urge you to read the sections of this offering memorandum entitled "Risk Factors," "Operating and Financial Review and Prospects" and "Business" for a more complete discussion of the factors that could affect our future performance and the industry in which we operate. In light of these risks, uncertainties and assumptions, the forward-looking events described in this offering memorandum may not occur.
We undertake no obligation to publicly update or publicly revise any forward-looking statement, whether as a result of new information, future events or otherwise. All subsequent written and oral forward-looking statements attributable to us or to persons acting on our behalf are expressly qualified in their entirety by the cautionary statements referred to above and contained elsewhere in this offering memorandum.
i
We have generally obtained the market and competitive position data in this offering memorandum from industry publications and from surveys or studies conducted by third-party sources that we believe to be reliable, including the Swedish Petroleum Institute. However, we cannot assure you of the accuracy and completeness of such information and we have not independently verified such market and position data. We do, however, accept responsibility for the correct reproduction of this information.
In addition, in many cases we have made statements in this offering memorandum regarding our industry and our position in the industry based on our experience and our own investigation of market conditions. We cannot assure you that any of these assumptions are accurate or correctly reflect our position in the industry, and none of our internal surveys or information have been verified by any independent sources.
In this offering memorandum, unless otherwise provided below:
- •
- "bridge loan" refers to a €170 million bridge loan, which matures on June 11, 2004, from a group of Swedish banks to Preem Petroleum and Preem Finans, guaranteed by Preem Holdings and Preem Petroleum, which we obtained in connection with our acquisition of 25% of the capital stock of Skandinaviska Raffinaderi AB Scanraff, the owner of the Scanraff refinery;
- •
- "EU" refers to the European Union;
- •
- "existing Preem Holdings notes" refers to the €305 million aggregate principal amount of 105/8% senior secured notes due 2011 issued by Preem Holdings in 2001;
- •
- "inter-company loan" refers to a SEK 2,277 million interest-free, subordinated inter-company loan to Preem Petroleum from Preem Holdings, which matures on March 31, 2011;
- •
- "Preem Finans" refers to Preem Finans AB, a wholly owned subsidiary of the Issuer;
- •
- "Preem Holdings" or the "Guarantor" refers to Preem Holdings AB (publ), the guarantor of the notes;
- •
- "Preem Petroleum" or the "Issuer" refers to Preem Petroleum AB (publ), the issuer of the notes;
- •
- "proposed new credit facilities" refers to proposed new multi-currency revolving credit and term loan facilities for Preem Petroleum, which we expect to be in an approximate amount of €300 million to €355 million for which we have signed an appointment letter dated April 27, 2004 with SEB Merchant Banking, Skandinaviska Enskilda Banken AB (publ) and Svenska Handelsbanken AB (publ), pursuant to which they are appointed to act, on a best efforts basis, as lead arrangers;
- •
- "shareholder loan" refers to a SEK 242 million interest-free, subordinated shareholder loan to Preem Holdings from Corral Petroleum Holdings AB (publ), which has no maturity date and may not be repaid while the existing Preem Holdings notes or these Notes are outstanding;
- •
- "Swedish GAAP" refers to generally accepted accounting principles in Sweden;
- •
- "United States" or the "U.S." refer to the United States of America;
- •
- "U.S. GAAP" refers to generally accepted accounting principles in the United States; and
- •
- "we," "us," "our," and other similar terms refer to Preem Holdings and its consolidated subsidiaries, including Preem Petroleum, except where the context otherwise requires.
In the petroleum refining industry, crude oil and refined product amounts are generally stated in cubic meters ("m3") or barrels, each of which is a unit of volume, or in metric tonnes, a unit of weight, depending on the product and the reason for which the amount is being measured. These volumes may
ii
be expressed in terms of barrels. A barrel ("bbl") contains 42 U.S. gallons. We have converted cubic meters to barrels at the rate of 1 cubic meter = 6.2898 barrels.
PRESENTATION OF FINANCIAL INFORMATION
Unless otherwise indicated, financial information in this offering memorandum has been prepared in accordance with Swedish GAAP. Swedish GAAP differs in certain significant respects from U.S. GAAP. For a discussion of the most significant differences between Swedish GAAP and U.S. GAAP as they apply to us, see "Selected Consolidated Financial Data—Principle Differences Between Swedish GAAP and U.S. GAAP" and note 26 to our audited consolidated financial statements included elsewhere in this offering memorandum.
Some financial information in this offering memorandum has been rounded and, as a result, the numerical figures shown as totals in this offering memorandum may vary slightly from the exact arithmetic aggregation of the figures that precede them.
In this offering memorandum:
- •
- "$" or "dollar" refer to the lawful currency of the United States;
- •
- "€" or "euro" refer to the single currency of the participating Member States in the Third Stage of European Economic and Monetary Union of the Treaty Establishing the European Community, as amended from time to time; and
- •
- "SEK," "krona" or "kronor" refer to the lawful currency of Sweden.
We publish our financial statements in kronor. For your convenience, this offering memorandum presents translations into euro of certain krona amounts at the Swedish Central Bank's exchange rate for the krona against the euro on December 31, 2003 of €1.00=SEK 9.09. The following chart shows, for the period from January 1, 1999 through April 23, 2004, the period end, average, high and low Swedish Central Bank foreign exchange reference rate for cable transfers of euro expressed as kronor per €1.00.
| | SEK per €1.00 | |||||||
|---|---|---|---|---|---|---|---|---|
| | High | Low | Period average(1) | Period end | ||||
| Year | ||||||||
| 1999 | 9.5400 | 8.5500 | 8.7850 | 8.5635 | ||||
| 2000 | 8.8740 | 8.0850 | 8.4736 | 8.8570 | ||||
| 2001 | 9.9410 | 8.8400 | 9.2870 | 9.4190 | ||||
| 2002 | 9.5150 | 8.9765 | 9.1328 | 9.1925 | ||||
| 2003 | 9.2965 | 8.8990 | 9.1185 | 9.0940 | ||||
Month | ||||||||
| October 2003 | 9.0760 | 8.9305 | 9.0099 | 9.0440 | ||||
| November 2003 | 9.0760 | 8.9445 | 8.9908 | 9.0085 | ||||
| December 2003 | 9.1165 | 8.9280 | 9.0169 | 9.0940 | ||||
| January 2004 | 9.1940 | 9.0570 | 9.1373 | 9.1780 | ||||
| February 2004 | 9.2415 | 9.1060 | 9.1814 | 9.2175 | ||||
| March 2004 | 9.2730 | 9.1565 | 9.2305 | 9.2635 | ||||
| April 2004 (through April 23, 2004) | 9.2615 | 9.1330 | 9.1883 | 9.1330 | ||||
- (1)
- The period average for 1999 to 2003 represents the average of the noon buying rates on the last business day of each month during the relevant period.
iii
The following chart shows, for the period from January 1, 1999 through April 23, 2004, the period end, average, high and low Swedish Central Bank foreign exchange reference rate for cable transfers of dollars expressed as kronor per $1.00.
| | SEK per $1.00 | |||||||
|---|---|---|---|---|---|---|---|---|
| | High | Low | Period average(1) | Period end | ||||
| Year | ||||||||
| 1999 | 8.6575 | 7.7100 | 8.3038 | 8.5250 | ||||
| 2000 | 10.3325 | 8.3425 | 9.2394 | 9.5350 | ||||
| 2001 | 10.9950 | 9.2650 | 10.4174 | 10.6675 | ||||
| 2002 | 10.7275 | 8.8050 | 9.6442 | 8.8250 | ||||
| 2003 | 8.8000 | 7.2750 | 8.0165 | 7.2750 | ||||
Month | ||||||||
| October 2003 | 7.7775 | 7.5825 | 7.6966 | 7.7750 | ||||
| November 2003 | 7.8900 | 7.5225 | 7.6831 | 7.5550 | ||||
| December 2003 | 7.5300 | 7.2750 | 7.3632 | 7.2750 | ||||
| January 2004 | 7.4175 | 7.0750 | 7.2493 | 7.4125 | ||||
| February 2004 | 7.4150 | 7.1275 | 7.2599 | 7.4125 | ||||
| March 2004 | 7.6625 | 7.3650 | 7.5243 | 7.5650 | ||||
| April 2004 (through April 23, 2004) | 7.7475 | 7.4850 | 7.6380 | 7.6750 | ||||
- (1)
- The period average for 1999 to 2003 represents the average of the noon buying rates on the last business day of each month during the relevant period.
The following chart shows, for the period from January 1, 1999 through April 23, 2004, the period end, average, high and low noon buying rate in the City of New York for cable transfers of euro expressed as dollars per €1.00, as certified for customs purposes by the Federal Reserve Bank of New York.
| | $ per €1.00 | |||||||
|---|---|---|---|---|---|---|---|---|
| | High | Low | Period average(1) | Period end | ||||
| Year | ||||||||
| 1999 | 1.1812 | 1.0016 | 1.0588 | 1.0070 | ||||
| 2000 | 1.0335 | 0.8270 | 0.9207 | 0.9388 | ||||
| 2001 | 0.9535 | 0.8370 | 0.8909 | 0.8901 | ||||
| 2002 | 1.0485 | 0.8594 | 0.9495 | 1.0485 | ||||
| 2003 | 1.2597 | 1.0361 | 1.1411 | 1.2597 | ||||
Month | ||||||||
| October 2003 | 1.1833 | 1.1596 | 1.1714 | 1.1609 | ||||
| November 2003 | 1.1995 | 1.1417 | 1.1710 | 1.1995 | ||||
| December 2003 | 1.2597 | 1.1956 | 1.2298 | 1.2597 | ||||
| January 2004 | 1.2853 | 1.2389 | 1.2638 | 1.2452 | ||||
| February 2004 | 1.2848 | 1.2426 | 1.2640 | 1.2441 | ||||
| March 2004 | 1.2431 | 1.2088 | 1.2261 | 1.2292 | ||||
| April 2004 (through April 23, 2004) | 1.2358 | 1.1802 | 1.2014 | 1.1802 | ||||
- (1)
- The period average for 1999 to 2003 represents the average of the noon buying rates on the last business day of each month during the relevant period.
The rates in the above tables may differ from the actual rates used in the preparation of the consolidated financial statements and other financial information appearing in this offering memorandum. Our inclusion of these exchange rates is not meant to suggest that any amount of the currencies specified above has been, or could be, converted into the applicable currency at the rates indicated or any other rate.
iv
This summary highlights information contained elsewhere in this offering memorandum. It is not complete and may not contain all of the information that you should consider before investing in the Notes. This offering memorandum contains a description of the specific terms of the Notes, as well as information about our business and detailed financial data. You should read this offering memorandum in its entirety. We have provided a glossary of certain industry defined terms on page 167 of this offering memorandum.
We are one of Europe's largest independent oil refining companies and the largest Swedish oil company. We conduct our business through our wholly owned operating company, Preem Petroleum, which operates its business through two segments, a supply and refining segment and a marketing segment. We refine crude oil in Sweden and then market and sell refined products primarily in Sweden and other northwestern European markets, including Scandinavia, the United Kingdom and Germany. Our refineries represent approximately 75% of the refining capacity in Sweden and approximately 30% of the refining capacity in Scandinavia. We sell more refined products in Sweden than any of our competitors. In Sweden, we had leading market shares in 2003 in terms of sales volume of approximately 30% in diesel, 41% in heating oil and 49% in fuel oil, based on data from the Swedish Petroleum Institute. In addition, our marketing segment's share of the Swedish gasoline market in terms of sales volume was approximately 11% in 2003, based on data from the Swedish Petroleum Institute. In 2003, we had sales revenue of SEK 34,789 million (€3,827 million), operating income of SEK 453 million (€50 million) and operating income before depreciation and amortization of SEK 1,334 million (€147 million).
Supply and Refining Operations
Our supply and refining segment operates our wholly owned Scanraff and Preemraff refineries. We also own an extensive network of storage depots in Sweden. Together, these two refineries have an aggregate capacity of approximately 335,000 barrels per calendar day. Through these refineries, we produced approximately 92 million barrels of refined products in 2003, 85 million barrels in 2002, and 94.3 million barrels in 2001. The refining margins at Scanraff were $3.47 per barrel in 2003, $1.61 per barrel in 2002, and $1.86 per barrel in 2001. The refining margins at Preemraff were $1.79 per barrel in 2003, $0.82 per barrel in 2002, and $1.01 per barrel in 2001. In 2003, our supply and refining segment had sales revenue of SEK 31,609 million (€3,477 million) and operating income of SEK 966 million (€106 million).
Scanraff Refinery. Scanraff is the largest oil refinery in Sweden in terms of capacity, representing approximately 50% of Swedish refining capacity. Scanraff is a complex, large-scale refinery with a strong market position producing a full-range of refined products. The refinery has visbreaker, catalytic cracker and mild hydrocracker upgrading units geared towards converting a significant portion of our residual fuel oil to lighter, higher value products. In addition, Scanraff has a storage capacity of 17 million barrels, which provides it with additional operating flexibility. The refinery is located on a 470-acre site on the west coast of Sweden, north of the city of Gothenburg. The refinery is situated on a peninsula providing direct jetty access to oil tankers for both the import of crude oil and the distribution of refined products. In December 2003, we acquired 25% of the capital stock of Skandinaviska Raffinaderi AB Scanraff (the owner of the Scanraff refinery) from Hydro R&M Holding AB, an affiliate of Norsk Hydro ASA, for a total consideration of approximately SEK 1,500 million (€165 million), which increased our ownership in Scanraff from 75% to 100%. The total consideration includes payment for capital stock and assumed debt. In addition, we acquired the inventory at Scanraff owned by Hydro R&M Holding. The refinery has a total refining capacity of approximately 210,000 barrels per calendar day. Prior to our acquisition of the remaining interests in Scanraff, our share of
1
the aggregate production of refined products was approximately 55.3 million barrels in 2003, 48.1 million barrels in 2002, and 53.1 million barrels in 2001.
Preemraff Refinery. We believe that Preemraff is one of the most sophisticated hydroskimming refineries in Europe and represents approximately 25% of Swedish refining capacity. The refinery has a highly sophisticated desulphurization/dearomatization unit, which permits it to manufacture diesel that is virtually sulphur-free (10 parts per million). In addition, the refinery uses its catalytic reformer and isomerization unit to convert naphtha, a portion of which is received from Scanraff, into higher-value gasoline. Preemraff also sells surplus heat generated as a result of the refining process to the city of Gothenburg and to AB Volvo. The refinery is located on a 340-acre site near the harbor of Torshamnen, Sweden's largest harbor, in Gothenburg. Preemraff's proximity to this harbor helps it to maintain low crude oil transportation costs and its proximity to Gothenburg, the second largest city in Sweden, helps it to minimize distribution costs. The refinery has a total refining capacity of approximately 125,000 barrels per calendar day. Aggregate production of refined products at Preemraff was approximately 36.7 million barrels in 2003, 36.9 million barrels in 2002, and 41.2 million barrels in 2001.
Marketing Operations
Our marketing segment, which consists of a home-heating division, a business-to-business division and a station and consumer division, obtains all of its refined products from our supply and refining segment. Our marketing segment sells heating oil directly to end-users and sells heating oil, diesel and fuel oil directly to Swedish companies using refined products purchased from our supply and refining segment. We also sell gasoline, diesel, lubricants, convenience store items and other products through 509 Preem-branded service stations. In 2003, our marketing segment had sales revenue of SEK 10,920 million (€1,201 million) and operating income of SEK 106 million (€12 million).
Our competitive strengths include:
Our Refineries Generate High Refining Margins. The Scanraff refinery generates relatively high margins in comparison to most northwestern European cracking refineries as a result of its sophisticated configuration, which enables it to produce a wide range of premium refined products, including diesel, that meet and, in some cases, surpass the highest EU environmental specifications. Our low operating costs and low crude oil delivery costs at Scanraff enhance our refining margins. Our Preemraff refinery benefits from high refining margins compared to other northwestern European hydroskimming refineries as a result of its ability to produce premium-priced, virtually sulphur-free (10 parts per million) diesel, which meets environmental specifications of the Swedish market and which is in increasing demand in our other target markets in northwestern Europe. These strong refining margins have allowed both refineries to generate positive cash flow even in adverse market conditions.
We Are the Largest Swedish Oil Company. We sell more petroleum products in Sweden than any other company and our refineries represent approximately 75% of Sweden's refining capacity. As Sweden's largest oil company, we participate in virtually every aspect of the petroleum refining and marketing industry, and we also own an extensive network of storage depots in Sweden. In Sweden, we had leading market shares in 2003 in terms of sales volume of approximately 30% in diesel, 41% in heating oil and 49% in fuel oil. We have been a leader in each of these markets for at least 10 years, based on sales volume data from the Swedish Petroleum Institute. We believe that our leadership position in these markets is sustainable and contributes to the stability of our cash flow.
2
We Are in a Strong Competitive Position as a Result of Our Focused Capital Investments. By making focused capital investments that have increased the sophistication of our refining operations, we have developed and profitably marketed premium refined products that meet and, in some cases, surpass the highest EU environmental specifications, which we believe contributes to our high refining margins relative to our competitors. As a result of these capital investments, we have a competitive advantage over other northern European refineries that do not have the ability to produce products that meet Swedish environmental specifications, which specifications are among the most stringent in Europe. This competitive advantage enables us to sell refined products both wholesale and retail to the Swedish market and wholesale to our target markets in northwestern Europe. Furthermore, we are already capable of producing gasoline and diesel that comply with the EU's specifications on the sulphur content for gasoline and diesel that will take effect in 2009. As a result, we do not have to incur the additional capital investments that some of our competitors may be required to incur to produce these EU-compliant products.
We Are Well Positioned Geographically to Access Our Target Markets. The geographical proximity of our refineries to our target markets in northwestern Europe allows us to maintain relatively low transportation costs. The lower transportation costs contribute to our refining margins and provide us with a competitive advantage relative to our competitors located outside of Sweden.
Our Non-Refining Businesses Help Insulate Us From Refining Margin Volatility. Through our marketing operations, we are insulated, to a degree, from refining margin volatility. In particular, our market-leading position in the diesel, heating oil and fuel oil markets provides us with a relatively stable source of earnings. In addition, our substantial storage capacity enables us to profit from occasional "contango" conditions (in which forward prices are greater than spot prices) in the crude oil and refined product markets without exposing us to market risk. We also use our storage capacity to earn rental income by selling storage certificates to other oil companies for their EU-imposed compulsory storage obligations. In addition, certain of our other income streams, such as the sale of surplus heat from our Preemraff refinery to the city of Gothenburg and to AB Volvo, our income from depot-throughput fees and harbor-usage fees and our sales of lubricants and other store merchandise, are also unaffected by movements in refining margins. Many of these revenue streams can be generated with relatively little additional operating cost and, thus, contribute directly to our net profit. In 2003, we generated revenues of SEK 268 million (€29 million) from these activities.
We Have an Experienced Management Team. Preem Petroleum's senior management team has significant experience in the oil refining and marketing industry. This senior management team includes industry veterans, such as Michael G:son Löw, who is President, Chief Executive Officer and a director of Preem Petroleum. Before joining Preem Petroleum in 2003, Mr. Löw spent 27 years with Du Pont Conoco. This depth of experience and technical knowledge enhance management's ability to improve operating and cost efficiencies and to manage our business successfully through changing market conditions.
Our business strategy is to enhance our operating margins and strengthen our position as one of Europe's largest independent oil refining companies and the largest Swedish oil company. We intend to implement this strategy through the following measures:
Enhance Our Refineries' Margins. We believe that our margins are among the highest in the industry and we intend to continue to enhance our margin advantage and relative competitive position. Our objective is to maximize the operating margins generated by our refineries by increasing sales in Sweden, which minimizes transportation costs, and by exploiting the synergies between our two refineries. We will continue to focus on improving our refining margins and generating cost efficiencies, and we intend to make disciplined capital investments in the years ahead to accomplish these
3
objectives. In addition, we have commenced construction of an isocracker unit at Scanraff, which will enhance Scanraff's strong market position. The new isocracker unit is expected to enable Scanraff to increase its throughput by 10% and to produce more virtually sulphur free (10 parts per million) diesel, which is a higher-margin product and for which there has been increasing demand in Europe. In addition, Scanraff will be able to process a larger proportion of sour crude oil, which is typically lower in price compared to sweet crude oil. After the isocracker unit becomes operational, which, if construction proceeds as contemplated, is expected to occur in the first half of 2006, we intend to decrease our production of heating oil, a lower margin product, and use the capacity we gain to increase our production of diesel, a higher margin product, which we expect will improve our overall refining margins.
Streamline Our Refining Operations. Because both of our refineries are now wholly owned, we are able to operate them as a single unit, which we believe will create greater value and generate stronger financial returns than could be achieved if we operated the two refineries separately. By combining the operations of our two refineries, we plan to reduce our combined operating costs, consolidate our management and administrative infrastructure, and optimize investments in upgrading our refining capabilities.
Leverage Our Competitive Advantage. We intend to increase sales of, and develop new markets for, high-margin products, such as middle distillates, including high value-added products, such as virtually sulphur-free diesel. Due in part to long-term underinvestment in refining capacity by the refining industry, we believe that demand will continue to outpace supply for these high-margin products in the coming years. We believe this to be the case, particularly outside of Sweden, as a result of recent and potential regulatory changes, tax and other incentives to market and purchase these products, and increased environmental awareness.
Improve the Margins and Market Share of Our Marketing Operations. In the home-heating and business-to-business divisions of our marketing segment, our objective is to retain and enhance our strong market position by developing products and service packages to increase customer loyalty. In the station and consumer division of our marketing segment, we intend to strengthen our network of service stations by increasing the number of low-cost unmanned stations and developing full-service convenience stores at stations that have relatively high throughput. We also intend to transfer a substantial number of our company-owned stations to dealers to increase the proportion of franchised stations in our network. This transfer will enable us to streamline our marketing operations and reduce our administrative expenses. We also disposed of our Norwegian marketing operations in March 2004 and finalized the sale of our Polish marketing operations in January 2003, which follows our decision to focus our marketing activities on the Swedish market.
Construction of an Isocracker Unit. In January 2004, we commenced construction of a new isocracker unit at Scanraff. We estimate that the aggregate cost of construction of the isocracker unit will be approximately SEK 3,500 million (€385 million). Of this amount, we have paid SEK 104 million (€11 million) as of March 31, 2004, and we have present contractual purchase commitments of approximately SEK 1,100 million (€121 million), of which approximately SEK 500 million (€55 million) will be paid by September 30, 2004. We expect that, if construction proceeds as contemplated, the new unit will become operational in the first half of 2006. Subject to completion and closing of our proposed new senior credit facilities, which we expect to be in an approximate amount of €300 million to €355 million, we intend to use the proceeds of this offering of Notes to finance a portion of the cost of the construction of the isocracker unit. See "Use of Proceeds."
4
Scanraff Purchase. In December 2003, we acquired 25% of the capital stock of Skandinaviska Raffinaderi AB Scanraff (the owner of the Scanraff refinery) from Hydro R&M Holding AB, an affiliate of Norsk Hydro ASA, which increased our ownership in Scanraff from 75% to 100%.
From April 2002 up to the time of our December 2003 acquisition of the 25% interest in Scanraff, we accounted for our ownership in Scanraff using the proportional method under Swedish GAAP, which resulted in the inclusion of only 75% of the revenues, expenses, assets and liabilities attributable to Scanraff. Since our December 2003 acquisition of the remaining 25% of Scanraff, our financial statements reflect our 100% ownership of Scanraff. Our share of the aggregate production of refined products at Scanraff was approximately 55.3 million barrels in 2003 out of a total of 73.7 million barrels. Our net cash refining margin at Scanraff was $2.71 per barrel in 2003, resulting in an aggregate net cash refining margin for our share of production at Scanraff of approximately $149.9 million. The share of the aggregate production at Scanraff attributable to Hydro R&M Holding's 25% ownership in Scanraff was 18.4 million barrels in 2003. Applying our 2003 net cash refining margin of $2.71 per barrel for Scanraff to the 2003 production of 18.4 million barrels attributable to the 25% of Scanraff owned by Hydro R&M Holding would result in an aggregate net cash refining margin of approximately $49.9 million with respect to the 25% of the refinery we recently purchased. The incremental aggregate net cash refining margin attributable to the 25% of the Scanraff refinery owned by Hydro R&M Holding is calculated by applying our net cash refining margin in 2003 at Scanraff of $2.71. However, this incremental amount is not necessarily indicative of the actual refining margins that we would have been able to achieve had we owned 100% of Scanraff for all of 2003 and had fully consolidated its results.
Proposed New Credit Facilities. On April 27, 2004, we signed an appointment letter with SEB Merchant Banking, Skandinaviska Enskilda Banken AB (publ) and Svenska Handelsbanken AB (publ), pursuant to which they are appointed to act, on a best efforts basis, as lead arrangers in connection with proposed new multi-currency revolving credit and term loan facilities for Preem Petroleum as described in a term sheet attached thereto for an approximate amount of €300 million to €355 million. We refer to the credit facilities contemplated by the appointment letter and attached term sheet in this offering memorandum as the "proposed new credit facilities." Preem Holdings will act as guarantor under the proposed new credit facilities. We have not yet entered into any definitive documents and the proposed lenders have conditioned their best efforts upon satisfactory completion of due diligence, execution of satisfactory documentation, and successful syndication, among others things. In addition, even if all of the foregoing are satisfied, draw downs will require investment of additional equity and satisfaction of certain other conditions. The proposed new credit facilities will consist of (i) a €170 million amortizing term loan facility, or Facility A; (ii) an amortizing multi-currency term loan facility of an amount from €100 million to €155 million, or Facility B; and (iii) a €30 million revolving credit facility, or Facility C.
We intend to use Facility A to repay the €170 million bridge loan, which we obtained to finance the December 2003 acquisition of the remaining 25% of the Scanraff refinery that we did not own. The bridge loan matures on June 11, 2004. We intend to use Facility B to finance a portion of the cost of the construction of the isocracker unit at the Scanraff refinery. Facility C is intended to be used for general corporate purposes. The proposed new credit facilities, if entered into on the terms currently contemplated, will require as a condition precedent to funding that Preem Holdings make certain required cash equity investments into Preem Petroleum. These equity investments are tied to drawings under the facilities and total up to €80 million. A cash equity investment of €25 million is a condition precedent to drawing down on Facility A. A second cash equity investment of €25 million is a condition precedent to drawing down on Facility B. In addition, in the event that we draw down an amount in excess of the difference between the total amount of funds made available under Facility B minus €30 million, Preem Holdings will be required to make a further cash equity investment, up to a maximum of €30 million, into Preem Petroleum in the same amount as the amount of Facility B that we draw
5
down in excess of such amount. We intend to use such equity investments as additional funding for the construction of the isocracker unit at the Scanraff refinery.
Merger of Subsidiaries. The management of Preem Petroleum intends, subject to approval by its board of directors and the completion of corporate due diligence, to merge certain of its wholly owned subsidiaries, including Skandinaviska Raffinaderi AB Scanraff and Preem Raffinaderi AB, which own the Scanraff and Preemraff refineries, respectively, into Preem Petroleum. The merger of these subsidiaries will enable us to streamline operations and reduce administrative costs.
Financial Information for the First Quarter of 2004. We are currently in the process of completing our consolidated results for the three months ended March 31, 2004. The financial information in the following two paragraphs is based on the preliminary unaudited information available to us on the date hereof and reflects the best estimates of our management. Our actual results may differ significantly from the amounts reflected below as a result of various factors. In addition, our results for an interim period are not necessarily indicative of what our results will be for the full year.
Based on our preliminary results for the three months ended March 31, 2004, we expect that sales revenues, gross profit and operating income for this period will be approximately SEK 8,461 million (€931 million), SEK 606 million (€67 million) and SEK 384 million (€42 million), respectively. These results represent decreases in sales revenues, gross profit and operating income of approximately 18%, 14% and 18%, respectively, compared to the same period in 2003. The decreases, as compared to the same period in 2003, are primarily attributable to exceptionally strong results in the first quarter of 2003, the weakening of the dollar against the krona and lower refining margins. The decreases were to a certain extent offset by higher sales volumes primarily attributable to the acquisition in December 2003 of the 25% of Scanraff that we did not own. We also expect that net profit for this period will be approximately SEK 96 million (€11 million), which represents a decrease of approximately 65% compared to the same period in 2003. The decrease was due primarily to the decrease in operating income and foreign exchange losses on our indebtedness, which, in turn resulted from an increase in the value of the dollar against the krona during the first quarter of 2004.
In addition, since December 31, 2003, we have sold some of our excess inventory and used the proceeds to reduce our indebtedness. As a result, based on our preliminary results for the three months ended March 31, 2004, we expect that our cash and cash equivalents will be SEK 1,110 million (€122 million), total consolidated indebtedness (excluding a shareholder loan from our parent company) will be SEK 6,901 million (€759 million) and approximately SEK 1,761 million (€194 million) will be available under our unutilized credit facilities.
You should carefully consider the information under the caption "Risk Factors" and all other information in this offering memorandum before investing in the Notes.
6
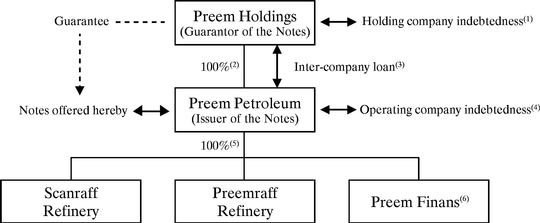
The issuer of the Notes is Preem Petroleum AB (publ), a Swedish company. As of the date of this offering memorandum, Preem Petroleum was wholly owned by Preem Holdings AB (publ), a Swedish company. Preem Holdings will guarantee the Notes. Preem Holdings is wholly owned by Corral Petroleum Holdings AB (publ), which is wholly owned by Moroncha Holdings Company Limited, which, in turn, is wholly owned by Mr. Mohammed Hussein Al-Amoudi. The following chart sets forth our summary organizational structure and our financing arrangements as of December 31, 2003. See "Description of Certain Indebtedness."
- (1)
- As of December 31, 2003, Preem Holdings had total consolidated debt (excluding a shareholder loan from Corral Petroleum Holdings) of SEK 7,797 million (€858 million) and total non-consolidated debt (excluding the shareholder loan) of SEK 2,774 million (€305 million), which represents the existing Preem Holdings notes. As of December 31, 2003, Preem Holdings owed SEK 242 million (€27 million) to Corral Petroleum Holdings in the form of an interest-free, subordinated shareholder loan, which has no maturity date and may not be repaid while the existing Preem Holdings notes and these Notes are outstanding. The shareholder loan is contractually subordinated to both the existing Preem Holdings notes and the Preem Holdings Guarantee of these Notes.
- (2)
- All outstanding shares of capital stock of Preem Petroleum were pledged in favor of the holders of the existing Preem Holdings notes.
- (3)
- As of December 31, 2003, Preem Petroleum owed SEK 2,277 million (€250 million) in the form of an interest-free, subordinated inter-company loan, which matures on March 31, 2011. This loan is contractually subordinated to the Notes and has been pledged in favor of the holders of the existing Preem Holdings notes.
- (4)
- As of December 31, 2003, Preem Petroleum had total consolidated debt (excluding the inter-company loan) of SEK 5,023 million (€553 million) and total non-consolidated debt (excluding the inter-company loan) of SEK 2,787 million (€307 million). Subsidiaries of Preem Petroleum had total debt of SEK 2,236 million (€246 million). On April 27, 2004, we signed an appointment letter with SEB Merchant Banking, Skandinaviska Enskilda Banken AB (publ) and Svenska Handelsbanken AB (publ), pursuant to which they are appointed to act, on a best efforts basis, as lead arrangers in connection with proposed new credit facilities for Preem Petroleum as described in a term sheet attached thereto for an approximate amount of €300 million to €355 million. Preem Holdings will act as guarantor under the facilities. The proposed new credit facilities, if entered into on the terms currently contemplated, will require as one of the conditions precedent to funding that Preem Holdings make certain required cash equity investments into Preem Petroleum of up to €80 million. For more information about the proposed new credit facilities, see "Operating and Financial Review and Prospects—Liquidity and Capital Resources—Future Capital Needs and Resources."
- (5)
- Preem Petroleum owns 100% of Skandinaviska Raffinaderi AB Scanraff and Preem Raffinaderi AB, which own the Scanraff and Preemraff refineries, respectively, and Preem Finans. The management of Preem Petroleum intends, subject to approval by its board of directors and the completion of corporate due diligence, to merge certain of its wholly owned subsidiaries, including Skandinaviska Raffinaderi AB Scanraff and Preem Raffinaderi AB, but not Preem Finans AB, into Preem Petroleum.
- (6)
- As of December 31, 2003, Preem Finans had total debt of SEK 1,735 million (€191 million).
7
The following summary contains basic information about the Notes. It does not contain all the information that is important to you. For a more complete understanding of the Notes, please refer to the section of this offering memorandum entitled "Description of Notes," and particularly those sub-sections to which we refer you below.
| Issuer of the Notes | Preem Petroleum AB (publ) | |||
Notes Offered | €125,000,000 aggregate principal amount of % Senior Subordinated Notes due 2014. | |||
Maturity Date | , 2014. | |||
Interest Payment Dates | Semi-annually each and , commencing , 2004. Interest will accrue from the issue date of the Notes. | |||
Guarantee | The Notes will be unconditionally guaranteed on a senior basis by Preem Holdings AB (publ). | |||
Ranking of the Notes and the Guarantee | The Notes will be contractually subordinated in right of payment to all existing and future senior indebtedness of the Issuer, including indebtedness under the proposed new credit facilities and other designated senior indebtedness. Otherwise, the Notes will rank equally in right of payment with all other indebtedness of the Issuer and will rank senior in right of payment to all of the existing and future obligations of the Issuer that are expressly subordinated in right of payment to the Notes, including the inter-company loan from the Guarantor. The Notes will be effectively subordinated in right of payment to all existing and future secured debt of the Issuer. | |||
The Guarantee will be a general unsecured senior obligation of the Guarantor and will rank equally in right of payment with any existing and future unsecured senior indebtedness of the Guarantor, including any guarantee of indebtedness under the proposed new credit facilities. The Guarantee will rank senior in right of payment to all existing and future obligations of the Guarantor expressly subordinated to the Guarantee, including the shareholder loan from the Guarantor's parent company, Corral Petroleum Holdings AB (publ). The Guarantee will be effectively subordinated in right of payment to all existing and future secured debt of the Guarantor, including the existing Preem Holdings notes. | ||||
The Notes and the Guarantee will be structurally subordinated in right of payment to all existing and future debt and other liabilities of each subsidiary of the Issuer, whether or not such debt is secured. | ||||
As of December 31, 2003, on an as-adjusted basis to give effect to the offering of the Notes but not the repayment of any existing indebtedness (i) the Issuer would have had outstanding approximately €307 million of non-consolidated indebtedness that would have been senior in right of payment to the Notes, (ii) the Guarantor would have had outstanding €305 million of non-consolidated senior indebtedness, which represents the existing Preem Holdings notes and (iii) the Issuer's consolidated subsidiaries would have had outstanding approximately €246 million of indebtedness that would have been structurally senior in right of payment to the Notes and the Guarantee. In addition, the Guarantee would have been effectively subordinated to the existing Preem Holdings notes to the extent of the value of the security interests granted in favor of the holders of the existing Preem Holdings notes. | ||||
8
Optional Redemption | The Issuer may redeem all or part of the Notes on or after , 2009, at the redemption prices listed in "Description of Notes—Optional Redemption." | |||
On or before , 2007, the Issuer may use the proceeds of specified equity offerings to redeem up to 35% of the original principal amount of the Notes at a redemption price equal to % of their principal amount, plus accrued and unpaid interest, if any, to the redemption date, provided that at least 65% of the aggregate principal amount of the Notes remains outstanding after the redemption. See "Description of Notes—Optional Redemption." | ||||
The Issuer may also redeem the Notes in whole, but not in part, at any time, upon giving proper notice, if changes in tax laws impose certain withholding taxes on amounts payable on the Notes. If the Issuer decides to do this, it must pay you a price equal to the principal amount of the Notes plus interest and certain other amounts. See "Description of Notes—Redemption for Taxation Reasons." | ||||
Change of Control | If the Guarantor experiences a change of control, the Issuer will be required to offer to repurchase the Notes at 101% of their principal amount plus accrued and unpaid interest. See "Description of Notes—Change of Control." | |||
Covenants | The Notes will be issued under an indenture (the "Indenture"), which will limit, among other things, our ability to: | |||
| • | incur additional indebtedness; | |||
| • | pay dividends or make other distributions; | |||
| • | make certain other restricted payments and investments; | |||
| • | create liens; | |||
| • | enter into any agreement that would limit the ability of the Issuer's subsidiaries to pay dividends or make other payments to the Issuer; | |||
| • | transfer or sell assets; | |||
| • | enter into transactions with affiliates; | |||
| • | create additional classes of senior subordinated indebtedness of the Issuer; | |||
| • | enter into sale-leaseback transactions; and | |||
| • | merge or consolidate with other entities. | |||
Each of the covenants is subject to a number of important exceptions and qualifications. See "Description of Notes—Certain Covenants." | ||||
9
Transfer Restrictions | We have not registered the Notes or the Guarantee under the U.S. Securities Act. The Notes are subject to restrictions on transfer and may only be offered or sold in transactions that are exempt from or not subject to the registration requirements of the U.S. Securities Act. Furthermore, the Notes and the Guarantee have not been registered under any other country's securities laws. See "Notice to Investors." | |||
No Prior Market | The Notes will be new securities for which there is currently no market. Although the Initial Purchaser has informed us that it intends to make a market for the Notes, it is not obligated to do so and it may discontinue market-making at any time without notice. Accordingly, a liquid market for the Notes may not be developed or maintained. | |||
Listing | Application has been made to list the Notes on the Luxembourg Stock Exchange. | |||
Governing Law | The laws of the state of New York. | |||
Use of Proceeds | Subject to completion and closing of the proposed new credit facilities, the money raised from the offering will be used to finance a portion of the cost of the construction of an isocracker unit at Scanraff. If for any reason the proposed new credit facilities are not available, or are not available in an amount or within the time contemplated, then a portion of the proceeds of these Notes will be used, together with amounts available under our unutilized credit facilities and cash on hand, to repay the bridge loan, which may materially adversely affect our liquidity. Pending the final application of the net proceeds, we expect to hold a portion of the proceeds in the form of cash and cash equivalents and to use a portion of the proceeds to repay amounts outstanding under our short-term revolving credit facilities, which amounts we intend to draw down later as needed to finance construction of the isocracker unit. See "Use of Proceeds." | |||
10
In addition to the other information contained in this offering memorandum, you should carefully consider the following risk factors before purchasing the Notes. The risks and uncertainties described below are not the only ones we face. Additional risks and uncertainties of which we are not aware or that we currently believe are immaterial may also adversely affect our business, financial condition or results of operation. If any of the possible events described below occur, our business, financial condition or results of operation could be materially and adversely affected. If that happens, we may not be able to pay interest or principal on the Notes when due and you could lose all or part of your investment.
Risks related to our Business
Our substantial indebtedness could adversely affect our operations or financial results and prevent us from fulfilling our debt obligations.
As of December 31, 2003, we had total consolidated indebtedness (consisting of total long-term debt and total current debt, but excluding the shareholder loan) of SEK 7,797 million. We also had SEK 697 million available under our unutilized credit facilities. Our substantial indebtedness could adversely affect our operations or financial results and could have important consequences for you. For example, such indebtedness could, in and of itself and in light of the restrictive covenants included in the indentures related to the Notes and the existing Preem Holdings notes:
- •
- make it more difficult for us to fulfill our obligations under the Notes and the existing Preem Holdings notes;
- •
- restrict our ability to borrow money in the future for working capital, capital expenditures, acquisitions or other purposes;
- •
- expose us to the risk of increased interest rates with respect to the debt we carry at variable interest rates;
- •
- make us more vulnerable to economic downturns and adverse developments in our business;
- •
- reduce our flexibility in responding to changing business and economic conditions, including increased competition in the oil and gas industry; and
- •
- limit our ability to take advantage of significant business opportunities, to respond to competitive pressures and to implement our business strategies.
If the proposed new credit facilities are not available to us in the time contemplated, or at all, we would have to use a portion of the proceeds of the offering of the Notes to repay the bridge loan, which matures on June 11, 2004, we may have to postpone construction of the isocracker and our liquidity would be adversely affected.
The bridge loan that we obtained in order to finance our December 2003 acquisition of the 25% of the Scanraff refinery that we did not already own matures on June 11, 2004. We intend to repay amounts outstanding under the bridge loan by drawing down amounts under Facility A of the proposed new credit facilities. In addition, we intend to draw down amounts on Facility B to finance a portion of the cost of construction of the isocracker. However, we have not yet entered into any definitive documents concerning the proposed new credit facilities. Even assuming that due diligence is completed satisfactorily and that definitive documents are successfully negotiated, executed and delivered as contemplated prior to the June 11, 2004 maturity date of the bridge loan, funding under such facilities will be subject to a number of conditions, including successful syndication and the completion of further equity investments from Preem Holdings. For further information, see "Summary—Recent Developments—Proposed New Credit Facilities."
Although management believes that negotiations are progressing well, we can provide no assurance that the proposed lenders will satisfactorily complete their due diligence or that definitive documents for the proposed new credit facilities will be successfully negotiated, executed and delivered,
11
or if successfully negotiated, executed and delivered, that such new proposed credit facilities will be available in the amount or on the terms contemplated. In addition, Preem Holdings is dependent on its parent company, Corral Petroleum Holdings, to provide funds to make some or all of its required equity investments. If Corral Petroleum Holdings does not make sufficient funds available to Preem Holdings, or if Preem Holdings is otherwise unable to make the required equity investments, or if other conditions precedent are not satisfied, the proposed new credit facilities may not be made available to us. If the proposed new credit facilities are for any reason not available in an amount or within the time contemplated, or at all, then a portion of the proceeds of these Notes will be used, together with available cash reserves and amounts available under our unutilized credit facilities, to repay the bridge loan, which would mean we may have to postpone construction of the isocracker unit and that we may not have sufficient funds to finance our other capital requirements. Any of the foregoing developments could be expected to materially adversely affect our business, financial condition, results of operations and cash flows.
Prices for crude oil and refined products are subject to rapid and large fluctuations and our margins may be adversely affected by market conditions.
Our results of operations from refining are influenced by the relationship between market prices for crude oil and refined products. We will not generate operating profit or positive cash flow from our refining operations unless we are able to buy crude oil and sell refined products at margins sufficient to cover the fixed and variable costs of our refineries. In recent years, both crude oil and refined product prices have fluctuated substantially. Consequently, our inventory of crude oil and refined products is exposed to fluctuations in price. Prices of crude oil and refined products depend on numerous factors, including global and regional demand for, and supply of, crude oil and refined products, and regulatory, legislative and emergency actions of national, regional and local agencies and governments. Decreases in the supply of crude oil or the demand for refined product may adversely affect our liquidity and capital resources.
Supply and demand of crude oil and refined products depend on a variety of factors. These factors include:
- •
- changes in global economic conditions, including exchange rate fluctuations;
- •
- political stability in major oil-producing countries;
- •
- actions by OPEC and crude oil production levels;
- •
- the availability of crude oil and refined product imports;
- •
- worldwide inventory levels of crude oil and refined products;
- •
- the availability and suitability of competitive fuels;
- •
- the extent of government regulation, in particular, as it relates to environmental policy;
- •
- market imperfections caused by regional price differentials;
- •
- local market conditions and the level of operations of other refineries in Europe;
- •
- the ability of suppliers, transporters and purchasers to perform on a timely basis or at all under their agreements (including risks associated with physical delivery);
- •
- seasonal demand fluctuations;
- •
- expected and actual weather conditions; and
- •
- changes in technology.
These external factors and the volatile nature of the energy markets make oil-refining margins volatile. Generally, an increase or decrease in the price of crude oil results in a corresponding increase or decrease in the price of refined products, although the timing and magnitude of these increases and
12
decreases may not correspond. During periods of excess inventories of refined products, crude oil prices can increase significantly without corresponding increases in refined products prices and, in such a case, refining margins will be adversely affected. Differentials in the timing and magnitude of movements in crude oil and refined product prices could have a significant short-term impact on our refining margins and our business, financial condition and results of operations.
We may not always be able to obtain sufficient credit to finance our spot market crude oil purchases, which could severely limit our ability to obtain crude oil.
We purchase a significant portion of our crude oil on the spot market, primarily by means of internally generated cash flow and short-term working capital facilities. Because the price of crude oil on the spot market can be volatile, access to adequate short-term credit is crucial to our business. If our working capital facilities were cancelled or restricted or we could not renew or replace them, or if we had to use them for other purposes, our financial condition would be adversely impacted. Utilizing short-term credit to finance our spot market purchases also makes us vulnerable to interest rate volatility. Increases in short-term interest rates also may limit our ability to obtain crude oil supplies.
If we become involved in legal proceedings related to construction of the isocracker, or if we experience difficulty in obtaining the necessary operating permit for the isocracker, construction of the isocracker unit or the date on which it is taken into operation may be delayed, which may have a negative impact on our margins.
In October 2003, the Supreme Environmental Court in Sweden cancelled approval of the construction of the isocracker unit, which had previously been granted by the Environmental Court of Vänersborg in October 2002. The case was transferred back to the local Environmental Court to reconsider the approval in light of the Supreme Environmental Court's findings. In January 2004, the local Environmental Court again granted approval for the construction of the isocracker unit at Scanraff. If we become involved in additional legal proceedings related to the construction of the isocracker unit, we may have to postpone its construction. In addition, we have not yet obtained the permit required to operate the isocracker unit. We may be unable to obtain, or we may experience significant delays in obtaining, the required permit, which could lead to delays on the return on our investment, or even the loss of our investment. Even if we obtain the required permit, it may be subject to stringent conditions, including with respect to emissions and discharge amounts that may require further capital expenditures or increase our operating costs. If any of the foregoing risks materialize, our business, financial condition, results of operations and cash flows could be adversely affected.
Our business is very competitive and increased competition could adversely affect our financial condition and results of operations.
Increased competition in the oil refining industry could result in a decrease in our market share, which could adversely affect our financial condition and results of operations. Competition is based on the ability to obtain and process crude oil and other feedstocks at the lowest cost, refinery efficiency, refinery product mix and product distribution. Our supply and refining segment competes principally with AB Svenska Shell and Svenska Statoil AB as well as with Fortum Oy. Our marketing segment, which includes the station and consumer division through which we sell gasoline and other refined products to retail customers, competes primarily with Svenska Statoil AB, OK-Q8 AB, AB Svenska Shell, Norsk Hydro ASA and Conoco Jet Nordic AB. In 2003, our marketing segment's gasoline sales in Sweden ranked fourth in market share, based on data from the Swedish Petroleum Institute. Our small market presence in the retail gasoline business has had an adverse effect on the results and prospects of our marketing segment and there is a risk that we will not be able to increase our marketing segment's share of the Swedish gasoline market in the future.
13
We are faced with operational hazards and uninsured risks that could have a material adverse effect on our financial condition and results of operations.
Our operations are subject to all of the risks normally associated with oil refining, transportation and distribution that could result in damage to or loss of property, suspension of operations, or injury or death to personnel or third parties. These risks and hazards could result in damage or harm to, or destruction of, properties, production facilities or the environment. Any or all of these hazards could have a material adverse effect on our financial condition and results of operations. Our property, business interruption and public and product liability insurance may not fully cover the consequences of all property damage, business interruptions and other liabilities. In particular, our business interruption insurance may not cover blockades, interruption due to political circumstances in foreign countries, hostilities or labor strikes. Our property and liability insurance does not cover gradual environmental and other damage that was not the result of a sudden, unintended and unexpected insurable accident. Insurance coverage of our chartered vessels does not include coverage of liabilities, costs and expenses related to cargo carried on ship. The occurrence of an event that affects operations and that is not fully covered by insurance could have an adverse impact on our business, financial condition, results of operations and cash flows.
We are subject to governmental and environmental regulations, which could expose us to fines or penalties or force us to modify our operations.
We are subject to various supranational, national, regional and local environmental laws and regulations relating to emissions standards for, and the safe storage and transportation of, our products. We also are subject to EU and Swedish environmental regulations concerning refined products. Sweden has among the strictest environmental specifications in the European Union. The European Union has announced stricter environmental regulations, which will take effect in 2005, restricting the sulphur content of both gasoline and diesel and the aromatic content of gasoline and imposing a CO2 emissions trading program. In addition, the European Union has recently announced even stricter restrictions on the sulphur content of gasoline and diesel, which will take effect in 2009. We already produce diesel and gasoline in compliance with the EU's 2009 specifications. However, we may be required to incur additional capital expenditures if more stringent standards are implemented. Additionally, certain aspects of the CO2 emissions trading program have not yet been finalized and could, when implemented, result in substantial additional costs. We may not have sufficient funds to make the necessary capital expenditures. Failure to make these capital expenditures could negatively impact our business, financial condition and results of operations.
In addition, we are subject to laws and regulations relating to the production, discharge, storage, treatment, handling, disposal and remediation of crude oil and refined petroleum products and certain materials, substances and wastes used in our operations and other decontamination and remedial costs. Our failure to comply with these requirements, which in some cases would constitute a criminal offense, would subject us (including individual members of management) to fines and penalties or force us to modify our operations. In addition, we need a variety of permits to conduct our operations. From time to time, we must obtain, comply with, expand and renew permits to operate our facilities. Failure to do so could subject us to civil penalties, criminal sanctions and closure of our facilities. In particular, we are currently working with environmental authorities to determine final operating conditions, such as emissions and discharge amounts, for some of the permits that we have obtained to operate certain components of our Preemraff refinery and certain of our depots. The risk exists that we will be unable to obtain or renew material permits or that obtaining or renewing material permits will require adopting controls or conditions that would result in additional capital expenditures or increased operating costs.
14
Changes in legislation affecting our operations or changes to the way such legislation is interpreted or administered may result in additional expenses, changes in our operations or fines and penalties.
The oil refining industry and the transportation and distribution of our products is highly regulated and we are subject to environmental and other laws and regulations in each jurisdiction in which we operate, including the European Union. In particular, Sweden, where both of our refineries are located, has among the strictest environmental specifications in the European Union. Changes in legislation or regulations and actions by Swedish and other regulators, including changes in administration and enforcement policies, may from time to time require operational improvements or modifications at, or possibly the closure of, various locations or the payment of fines and penalties. Generally, environmental laws and regulations affect our operations and have become and are becoming increasingly stringent. We cannot predict the nature, scope or effect of legislation or regulatory requirements that could be adopted in the future or how existing or future laws or regulations will be administered or interpreted in the future. Consequently, we may need to make additional and potentially significant expenditures in the future to comply with new or amended environmental laws and regulations. See "—We are subject to governmental and environmental regulations, which could expose us to fines or penalties or force us to modify our operations" herein.
We are subject to occupational health and safety laws in Sweden and elsewhere, which could expose us to fines or penalties or force us to modify our operations.
Our oil refining transportation and distribution activities are also subject to a wide range of supranational, national, regional and local occupational health and safety laws and regulations in each jurisdiction in which we operate. These health and safety laws change frequently, as do the priorities of those who enforce them. Our failure to comply with these health and safety laws could lead to criminal violations, civil fines and changes in the way we operate our facilities, which could increase the costs of operating our business.
We may be liable for environmental damages, which could adversely affect our financial results and reduce our ability to pay interest and principal due on the Notes.
We believe that the risk of significant environmental liability is inherent in our business. We are subject to risks relating to crude oil or refined product spills, discharge of hazardous materials into the soil, air and water, and other environmental damage. In our industry, there is an ever-present risk of accidental discharges of hazardous materials and of the assertion of claims by third parties (including governmental authorities) against us for violation of applicable law and/or damages arising out of any past or future contamination. Environmental regulators are currently investigating soil and groundwater contamination at our Preemraff facility and at some of our depot sites, which, we believe, could lead to legal proceedings being initiated against us and/or third-party contractors.
We may have to pay substantial amounts in fees and penalties, for remediation, or as compensation to third parties, in each case in respect of past or future operations, acquisitions or disposals. Any amounts paid in fees and penalties, for remediation, or as compensation to third parties would reduce, and could eliminate, the funds available for paying interest or principal on the Notes and for financing our normal operations and planned development.
We may be liable for environmental damage caused by previous owners of operations or properties that we have acquired, use, or have used. We may be liable for decontamination and other remedial costs at, and in the vicinity of, most of the sites we operate or own and that we (and companies with which we have merged) have operated and owned, including following the closure or sale of, or expiration of leases for, such sites. We may be liable for decontamination and other remedial costs as a result of contamination caused in connection with the transportation and distribution of our products. In some instances, such as the closure of a number of our depots, we are currently unable to accurately estimate the costs of necessary remediation and may face significant unexpected costs, which could materially adversely affect our financial condition, results of operations and cash flows.
15
In connection with the sale of each of our Polish and Norwegian subsidiaries, we have undertaken to reimburse the purchaser for costs incurred as a result of any final remediation orders issued by relevant authorities up to a certain amount. This obligation extends only to contamination occurring prior to the sale and only to costs in excess of a certain amount. As of the date of this offering memorandum, no claims have been made for reimbursement of remediation costs in connection with the sale of our Norwegian subsidiary and we have received claims of an aggregate amount of approximately SEK 1.6 million (€0.2 million) in connection with the sale of our Polish subsidiary. In the event that remediation of these sites is required, our exposure could materially adversely affect our financial condition, results of operations and cash flows.
Our lease on the Finnberget storage depot expired in September 2001. Our lease agreement had a provision limiting our liability for any decontamination to a maximum of SEK 4 million. We are in a dispute, however, with the landlord over whether this limitation extends to third-party claims, including claims made by governmental authorities. If we are unsuccessful in our dispute, we may be liable for all or part of the decontamination of this site. The total estimated cost of decontamination ranges from approximately SEK 75 million to SEK 120 million, depending on the intended future use of the site. Our lease on the Loudden storage depot expired in December 2003. We have reached an oral agreement with the lessor to extend the lease until December 31, 2008. Since there are a number of other lessees at the Loudden site and given that the term of the lease has been extended, we do not have an estimate for the decontamination and other remedial costs for Loudden. Any requirement that we pay decontamination costs at either of these sites could materially adversely affect our financial condition, results of operations and cash flows.
Legal action by the Swedish Competition Authority, other European regulatory authorities or any related third-party claims may expose us to liability for fines and damages.
We are subject to strict Swedish and European anti-competition laws, which limit the types of supply, sales, marketing and cooperation arrangements we can enter into, and may subject us to fines and penalties. Anti-competition regulations are subject to interpretation by governmental authorities. Agreements that we enter into in the ordinary course of our business, or other aspects of our business practices, may be subject to challenge as restrictive of competition or abusive of a dominant market position. Some of our long-standing commercial arrangements may not be fully in compliance with recent interpretations of, or changes in, anti-competition laws, or may no longer qualify for exemptions. Any of these risks could lead to material fines and penalties, restrictions on our business practices, and/or nullification of our existing agreements with third parties. Given our leading position in the Swedish market, and the nature of the European oil refining and marketing industry, we may be more closely watched by regulators and/or subject to restrictions not applicable to other competitors.
On June 29, 2000, the Swedish Competition Authority filed a summons application to the City Court of Stockholm against Preem Petroleum and four other oil companies operating in Sweden, demanding that the City Court impose fines on all five oil companies for alleged participation in a gasoline cartel. The Competition Authority demanded that fines of SEK 81 million be imposed on Preem Petroleum. Court proceedings took place during the third quarter of 2002 and on April 29, 2003, the District Court of Stockholm announced its judgment, finding that the five companies had violated the Competition Act. The court assessed Preem Petroleum with a fine of SEK 6 million. The court also ordered the Competition Authority to pay up to SEK 2.3 million of Preem Petroleum's legal fees. Both the Competition Authority and we have appealed the court's judgment.
The Swedish Competition Act also provides the possibility for companies and private parties to recover damages attributable to infringements of the Competition Act, in which case the total amount of our liability would be uncertain. If there are court rulings against us based on either existing or future claims, the fines imposed or damages awarded could be material, in which case our financial condition and results of operation would be adversely affected. Given our leading position in the
16
Swedish oil refining market, and the nature of the European oil refining industry, we may be subject to future investigations of our business conduct by European regulatory agencies.
We are exposed to currency fluctuations, which could adversely affect our financial results, liquidity and ability to pay interest and principal due on the Notes.
Our crude oil purchases are primarily denominated in dollars. Our revenues are primarily denominated in dollars and kronor. We publish our financial statements in kronor. As of December 31, 2003, approximately one-sixth of our debt was denominated in dollars, one-third was denominated in kronor, and one-half was denominated in euros. In addition, the Notes in this offering are denominated in euros. As a result, fluctuations of these currencies against each other or against other currencies in which we do business or have indebtedness could have a material adverse effect on our financial results. We primarily use forward exchange contracts and, to a lesser extent, currency swaps to manage our foreign currency risk. Present or future management of foreign exchange risk may not be adequate and exchange rate fluctuations may have a material adverse effect on our business, financial condition and results of operations. See "Operating and Financial Review and Prospects—Fluctuations in Foreign Currency Exchange Rates."
Given the highly specialized and technical nature of our business, we depend on key personnel that we may not be able to replace if they leave our company.
Our industry and our specific operations are highly specialized and technical and require a management team with industry specific knowledge and experience. Our continued success is highly dependent on the personal efforts and abilities of our executive officers, who have trained and worked in the oil refining industry for many years. Our operations and financial condition could be adversely affected if any of our executive officers become unable to continue in or devote adequate time to their present roles, or if we are unable to attract and retain other skilled management personnel.
We may be exposed to economic disruptions in the various countries in which we operate and in which our suppliers and customers are located, which could adversely affect our operations, tax treatment under foreign laws and our financial results.
Although we operate primarily in Sweden, our operations extend beyond Sweden. Through our supply and refining segment, we export refined products to certain countries in northwestern Europe including Scandinavia, the United Kingdom and Germany. Additionally, we purchase the crude oil that we refine predominantly from the North Sea area and Russia and, to a lesser extent, the Middle East. Accordingly, we are subject to legal, economic and market risks associated with operating internationally, purchasing crude oil and supplies from other countries and selling refined products to them. These risks include:
- •
- interruption of crude oil supply;
- •
- devaluations and fluctuations in currency exchange rates;
- •
- imposition of limitations on conversion of foreign currencies or remittance of dividends and other payments by our foreign subsidiaries;
- •
- imposition or increase of withholding and other taxes on remittances by foreign subsidiaries;
- •
- imposition or increase of investment and other restrictions by foreign governments;
- •
- failure to comply with a wide variety of foreign laws; and
- •
- unexpected changes in regulatory environments and government policies.
17
It is difficult to compare our results of operations from period to period, which may result in misleading or inaccurate financial indicators and data relating to our business.
It is difficult to make period-to-period comparisons of our results of operations as a result, among other things, of changes in our business, fluctuations in crude oil and refined product prices, which are denominated in dollars, and fluctuations in our capital expenditures, which are primarily denominated in kronor. As a result, our results of operations from period to period are subject to currency exchange rate fluctuations, in addition to typical period-to-period fluctuations. For these reasons, a period-to-period comparison of our results of operations may not be meaningful.
Because Preem Holdings and Preem Petroleum are Swedish companies, it may be difficult for you to effect service of process on or enforce judgments against them or any of their executive officers or directors.
Preem Holdings and Preem Petroleum are corporations organized under the laws of the Kingdom of Sweden. Most of their directors and executive officers are non-residents of the United States and all or a substantial portion of the assets of such persons are located outside the United States. As a result, service of process upon such persons and enforcement against such persons of judgments obtained in U.S. courts predicated upon the civil liability provisions of the U.S. federal securities laws may be difficult to obtain within the United States. We have been advised by our Swedish counsel that there is doubt as to the enforceability in Sweden, in original actions or in actions for enforcement of judgments of U.S. courts, of civil liabilities to the extent predicated upon the U.S. federal securities laws.
18
The proceeds from the Notes, net of the initial purchasers' discounts and the expenses of the offering, are estimated to be approximately €120 million. Subject to completion and closing of the proposed new credit facilities, Preem Petroleum will use the funds received to finance a portion of the cost of the construction of an isocracker unit at the Scanraff refinery. If for any reason the proposed new credit facilities are not available, or are not available in an amount or within the time contemplated, then a portion of the proceeds of these Notes will be used, together with available cash reserves and amounts available under our unutilized credit facilities, to repay the existing €170 million bridge loan, which may materially adversely affect our liquidity. The interest rate on the bridge loan is equal to EURIBOR plus a margin of 2.25% for the first three months or 2.75% following the first three months, plus certain standard mandatory costs. Pending the final application of the net proceeds, we expect to hold a portion of the proceeds in the form of cash and cash equivalents and to use a portion of the proceeds to repay amounts outstanding under our short-term revolving credit facilities, which amounts we intend to draw down later as needed to finance construction of the isocracker unit.
19
The following table sets out the actual consolidated capitalization and cash and cash equivalents of Preem Holdings as of December 31, 2003, determined in accordance with Swedish GAAP and, on an adjusted basis, the consolidated capitalization and cash and cash equivalents of Preem Holdings, to give effect to the offering of the Notes, but not the repayment of any existing indebtedness. You should read this table in conjunction with our audited annual consolidated financial statements and related notes included elsewhere in this offering memorandum and the information set out in "Operating and Financial Review and Prospects."
| | As of December 31, 2003 | |||||||
|---|---|---|---|---|---|---|---|---|
| | Actual | As adjusted | ||||||
| | SEK | €(1) | SEK | €(1) | ||||
| | (in millions) | |||||||
| Cash and cash equivalents | 633 | 70 | 1,724 | 190 | ||||
| Bridge loan(2) | 1,548 | 170 | 1,548 | 170 | ||||
| Total current debt (excluding the bridge loan)(3) | 1,574 | 173 | 1,574 | 173 | ||||
| Total long-term debt (excluding the existing Preem Holdings notes offered)(4) | 1,901 | 209 | 1,901 | 209 | ||||
| Notes offered | — | — | 1,136 | 125 | ||||
| Total Preem Petroleum debt | 5,023 | 553 | 6,159 | 678 | ||||
| Existing Preem Holdings notes | 2,774 | 305 | 2,774 | 305 | ||||
| Total debt | 7,797 | 858 | 8,933 | 983 | ||||
| Subordinated shareholder loan(5) | 242 | 27 | 242 | 27 | ||||
| Total shareholders' equity(6) | 3,499 | 385 | 3,499 | 385 | ||||
| Total capitalization(7) | 11,538 | 1,269 | 12,674 | 1,394 | ||||
- (1)
- We have translated kronor into euro at the rate of €1.00=SEK 9.09 (the exchange rate on December 31, 2003). We have provided this translation solely for your convenience.
- (2)
- Total current debt is represented in our audited annual consolidated financial statements under current liabilities as "Liabilities to credit institutions." Except for the bridge loan, none of the total current debt is secured debt or guaranteed by persons other than Preem Holdings or its consolidated subsidiaries. This amount includes any indirect or contingent indebtedness.
- (3)
- The obligations of Preem Finans under the bridge loan are secured by a floating charge over the assets of Preem Finans in the amount of SEK 1,000 million.
- (4)
- Total long-term debt excludes the shareholder loan and the current portion of long-term debt, but includes amounts under a bank overdraft facility that is categorized as long-term debt under Swedish GAAP. Of this amount, SEK 39 million (€4.3 million) is debt secured by real estate mortgages and SEK 364 million (€40 million) is guaranteed by persons other than Preem Holdings or its consolidated subsidiaries. This amount includes any indirect or contingent indebtedness.
- (5)
- The shareholder loan is in the form of an interest-free, subordinated loan from Corral Petroleum Holdings. The shareholder loan has no maturity date and may not be repaid while the existing Preem Holdings notes or these Notes are outstanding. The shareholder loan is contractually subordinated to both the existing Preem Holdings notes and the Preem Holdings Guarantee of these Notes.
- (6)
- Total shareholders' equity reflects the shareholders' contribution at the value reflected on the books of Corral Petroleum Holdings AB (publ) prior to the offering.
- (7)
- Total capitalization represents total debt, the shareholder loan, and total shareholders' equity.
Since December 31, 2003, we have sold some of our excess inventory and used the proceeds to reduce our indebtedness. As of March 31, 2004, we had cash and cash equivalents of SEK 1,110 million (€122 million), total consolidated indebtedness (consisting of long-term debt and total current debt, but excluding the shareholder loan) of SEK 6,901 million (€759 million), and approximately SEK 1,761 million (€194 million) available under our unutilized credit facilities.
20
On April 27, 2004, we signed an appointment letter with SEB Merchant Banking, Skandinaviska Enskilda Banken AB (publ) and Svenska Handelsbanken AB (publ), pursuant to which they are appointed to act, on a best efforts basis, as lead arrangers in connection with proposed new credit facilities for Preem Petroleum as described in a term sheet attached thereto for an approximate amount of €300 million to €355 million. Preem Holdings will act as guarantor under the facilities. We have not yet entered into any definitive documents and the proposed lenders have conditioned their best efforts upon satisfactory completion of due diligence, execution of satisfactory documentation, and successful syndication, among others things. In addition, even if all of the foregoing are satisfied, draw downs will require investment of additional equity and satisfaction of certain other conditions. We intend to use €170 million of the amounts available under the proposed new credit facilities to repay the bridge loan, which matures on June 11, 2004.
21
SELECTED CONSOLIDATED FINANCIAL DATA
The selected consolidated financial data in this section have been derived from the audited annual consolidated financial statements of Preem Holdings as of and for the years ended December 31, 2001, 2002 and 2003 and Preem Petroleum as of and for the years ended December 31, 1999 and 2000. The financial statements of both Preem Holdings and Preem Petroleum have been prepared in accordance with Swedish GAAP and audited by KPMG Bohlins AB, independent accountants. Preem Holdings was a dormant subsidiary of Preem Petroleum prior to 2001. The parent company of Preem Holdings, Corral Petroleum Holdings, contributed all of the issued and outstanding shares of Preem Petroleum to Preem Holdings in March 2001 in connection with the offering of the existing Preem Holdings notes. Therefore, we believe that a discussion of the results of operations and financial condition of Preem Petroleum as of and for the years ended December 31, 1999 and 2000 and for Preem Holdings as of and for the years ended December 31, 2001, 2002 and 2003 provides more relevant disclosure with respect to our financial position and results of operations.
The principal assets of Preem Holdings as of December 31, 2003 consist of all of the issued and outstanding shares of Preem Petroleum and a SEK 2,277 million inter-company loan to Preem Petroleum. The principal liabilities of Preem Holdings as of December 31, 2003, consist of €305 million aggregate principal amount of its existing Preem Holdings notes, of which it issued €250 million on April 10, 2001, and €55 million on July 20, 2001, and SEK 242 million outstanding under the shareholder loan from Corral Petroleum Holdings. Preem Petroleum and Preem Holdings prepare their consolidated financial statements in accordance with Swedish GAAP, which differs in certain significant respects from U.S. GAAP. Reconciliations of net profit (loss) for the years ended December 31, 2001, 2002 and 2003 and shareholders' equity as of December 31, 2002 and 2003, reflecting the significant differences between Swedish GAAP and U.S. GAAP, are set forth in note 26 to the Preem Holdings audited annual consolidated financial statements and related notes. You should read the data below in conjunction with the Preem Holdings audited annual consolidated financial statements and the related notes, which are included elsewhere in this offering memorandum.
22
| | Preem Petroleum Year ended December 31, | Preem Holdings Year ended December 31, | ||||||||||||
|---|---|---|---|---|---|---|---|---|---|---|---|---|---|---|
| | 1999 SEK | 2000 SEK | 2001 SEK | 2002 SEK | 2003 SEK | 2003 €(1) | ||||||||
| | (in millions, except ratios and share data) | |||||||||||||
| Consolidated Statement of Operations Data: | ||||||||||||||
| Amounts in accordance with Swedish GAAP: | ||||||||||||||
| Revenues | 28,793 | 46,195 | 46,697 | 42,178 | 43,030 | 4,734 | ||||||||
| Excise duties | (6,573 | ) | (6,637 | ) | (10,288 | ) | (8,855 | ) | (8,241 | ) | (907 | ) | ||
| Sales revenue | 22,220 | 39,558 | 36,409 | 33,323 | 34,789 | 3,827 | ||||||||
| Cost of goods sold | (20,161 | ) | (37,142 | ) | (34,799 | ) | (31,952 | ) | (33,303 | ) | (3,664 | ) | ||
| Gross profit | 2,059 | 2,416 | 1,610 | 1,371 | 1,486 | 163 | ||||||||
| Selling expenses | (816 | ) | (888 | ) | (943 | ) | (914 | ) | (812 | ) | (89 | ) | ||
| Administrative expenses | (277 | ) | (272 | ) | (474 | ) | (479 | ) | (479 | ) | (53 | ) | ||
| Other operating income (loss) | 236 | 381 | 268 | 249 | 258 | 28 | ||||||||
| Operating income(2) | 1,202 | 1,637 | 461 | 227 | 453 | 50 | ||||||||
| Interest income | 44 | 63 | 93 | 47 | 40 | 4 | ||||||||
| Other financial income(3) | 5 | 13 | (2 | ) | (102 | ) | 2 | 0 | ||||||
| Interest expense | (208 | ) | (268 | ) | (491 | ) | (478 | ) | (456 | ) | (50 | ) | ||
| Other financial expense(4) | (74 | ) | (180 | ) | (267 | ) | 342 | 266 | 29 | |||||
Income (loss) before taxes | 969 | 1,265 | (206 | ) | 36 | 305 | 34 | |||||||
| Income taxes(5) | (255 | ) | (433 | ) | (15 | ) | (180 | ) | (77 | ) | (9 | ) | ||
| Minority interests | (1 | ) | (1 | ) | (12 | ) | (4 | ) | (2 | ) | 0 | |||
| Net profit (loss) | 713 | 831 | (233 | ) | (148 | ) | 226 | 25 | ||||||
Amounts in accordance with U.S. GAAP: | ||||||||||||||
| Sales revenue | 22,220 | 39,558 | 36,409 | 33,323 | 34,789 | 3,827 | ||||||||
| Operating income(2) | 1,078 | 1,420 | 514 | 506 | 630 | 69 | ||||||||
| Net profit (loss) | 528 | 637 | (195 | ) | 11 | 479 | 53 | |||||||
Consolidated Balance Sheet Data: | ||||||||||||||
| Amounts in accordance with Swedish GAAP: | ||||||||||||||
| Cash and cash equivalents | 270 | 370 | 959 | 461 | 633 | 70 | ||||||||
| Total tangible fixed assets, net | 5,427 | 5,390 | 5,381 | 5,727 | 7,656 | 842 | ||||||||
| Total assets | 13,024 | 14,803 | 15,488 | 15,182 | 17,293 | 1,902 | ||||||||
| Total current debt(6) | 448 | 1,321 | 560 | 771 | 3,122 | 343 | ||||||||
| Total long-term debt(7) | 3,168 | 2,949 | 5,822 | 5,553 | 4,675 | 514 | ||||||||
| Minority interests | 117 | 122 | 134 | 8 | 8 | 1 | ||||||||
| Shareholder loan(8) | 1,903 | 2,259 | 242 | 242 | 242 | 27 | ||||||||
| Shareholders' equity | 2,562 | 2,420 | 3,112 | 2,927 | 3,499 | 385 | ||||||||
Amounts in accordance with U.S. GAAP: | ||||||||||||||
| Total current debt(6) | 469 | 1,456 | 572 | 771 | 3,123 | 344 | ||||||||
| Total long-term debt(7) | 3,147 | 2,814 | 5,810 | 5,553 | 4,674 | 514 | ||||||||
| Shareholder loan(8) | 1,903 | 2,259 | 242 | 242 | 242 | 27 | ||||||||
| Shareholders' equity | 3,825 | 3,489 | 3,122 | 3,011 | 3,836 | 422 | ||||||||
Other Financial Data: | ||||||||||||||
| Amounts in accordance with Swedish GAAP: | ||||||||||||||
| Operating income before depreciation and amortization(9) | 1,871 | 2,377 | 1,287 | 1,073 | 1,334 | 147 | ||||||||
| Depreciation and amortization | (669 | ) | (740 | ) | (826 | ) | (846 | ) | (881 | ) | (97 | ) | ||
| Interest expense | (208 | ) | (268 | ) | (491 | ) | (478 | ) | (456 | ) | (50 | ) | ||
| Capital expenditure | (590 | ) | (405 | ) | (588 | ) | (1,028 | ) | (720 | ) | (79 | ) | ||
| Cash flow from operating activities | 825 | 75 | 2,614 | 194 | 417 | 46 | ||||||||
| Total Preem Petroleum debt(10) | 3,616 | 4,270 | 3,508 | 3,646 | 5,023 | 553 | ||||||||
| Existing Preem Holdings notes | N/A | N/A | 2,874 | 2,678 | 2,774 | 305 | ||||||||
| Total debt(11) | N/A | N/A | 6,382 | 6,324 | 7,797 | 858 | ||||||||
- (1)
- We have translated kronor into euro at the rate of €1.00=SEK 9.09 (the exchange rate on December 31, 2003). We have provided this translation solely for your convenience.
23
- (2)
- Operating income (loss) under U.S. GAAP reflects differences primarily in pension, business combinations and financial instruments between Swedish GAAP and U.S. GAAP. See "—Principal Differences between Swedish GAAP and U.S. GAAP" below and note 26 to our audited annual consolidated financial statements included elsewhere in this offering memorandum.
- (3)
- Other financial income includes exchange rate gains and losses, miscellaneous financial income, and a gain on the repurchase of existing Preem Holdings notes.
- (4)
- Other financial expense includes exchange rate losses and miscellaneous expenses.
- (5)
- Income taxes do not generally reflect cash payable or paid, because Preem Holdings and Preem Petroleum have the ability to transfer, to a certain extent, their taxable income to their parent company in the form of a book-entry dividend (which, for Swedish tax law purposes is referred to as a group contribution). See "Operating and Financial Review and Prospects."
- (6)
- Total current debt is represented in the audited annual consolidated financial statements of Preem Petroleum and Preem Holdings under current liabilities as "Liabilities to credit institutions." Under U.S. GAAP, total current debt includes bank overdraft facilities, which are categorized as long-term debt under Swedish GAAP.
- (7)
- Total long-term debt excludes a shareholder loan described in note (8) below and the current portion of long-term debt, but includes amounts under a bank overdraft facility that is categorized as long-term debt under Swedish GAAP and other long-term liabilities.
- (8)
- The shareholder loan is in the form of an interest-free, subordinated loan from Corral Petroleum Holdings. The shareholder loan has no maturity date and may not be repaid while the existing Preem Holdings notes or these Notes are outstanding. The shareholder loan is contractually subordinated to both the existing Preem Holdings notes and the Preem Holdings Guarantee of these Notes.
- (9)
- Operating income before depreciation and amortization for 2000 includes SEK 89 million of non-cash income that is non-recurring and that is attributable to a refund from the Swedish National Pension Fund. Operating income before depreciation and amortization is a non-GAAP financial measure of liquidity and should not be considered as a substitute for operating earnings, net profit, cash flows from operating activities or other statements of operations or cash flow data computed in accordance with Swedish or U.S. GAAP. We believe that operating income before depreciation and amortization provides useful information to investors because it is a measure of cash flow and an indicator of our ability to finance our operations, capital expenditures, and other investments and our ability to incur and service debt. While depreciation and amortization are considered operating costs under both Swedish GAAP and U.S. GAAP, these expenses primarily represent the non-cash current period allocation of costs associated with long-lived assets acquired or constructed in prior periods. Funds depicted by this measure may not be available for management's discretionary use or for service of payment of interest or principle on the Notes. Because all companies do not calculate operating income before depreciation and amortization identically, the presentation of operating income before depreciation and amortization may not be comparable to similarly entitled measures of other companies. See "—Reconciliation of Operating Income Before Depreciation and Amortization" below for a quantitative reconciliation of operating income before depreciation and amortization to the most directly comparable measure under Swedish GAAP.
- (10)
- Total Preem Petroleum debt includes total long-term debt and total current debt of Preem Petroleum and its consolidated subsidiaries, and excludes the inter-company loan of SEK 2,277 million (€250 million), which was incurred when Preem Holdings loaned some of the proceeds of the offering of the existing Preem Holdings notes to Preem Petroleum. The inter-company loan is not included in total debt of Preem Holdings. As of March 31, 2004, total debt of Preem Petroleum and its consolidated subsidiaries, excluding the inter-company loan, was SEK 4,073 million (€448 million). In addition, Preem Petroleum and its consolidated subsidiaries had cash and cash equivalents of SEK 936 million (€103 million) as of March 31, 2004.
- (11)
- Total debt of Preem Holdings on a consolidated basis includes total long-term debt and total current debt but excludes the shareholder loan. As of March 31, 2004, Preem Holdings had total debt of SEK 6,901 million (€759 million) and cash and cash equivalents of SEK 1,110 million (€122 million) on a consolidated basis.
Principal Differences Between Swedish GAAP and U.S. GAAP
We prepare our financial statements in accordance with Swedish GAAP. For a reconciliation of certain financial statement information to U.S. GAAP, see note 26 to our audited annual consolidated financial statements included elsewhere in this offering memorandum. The principal differences pertain to the treatment of pension expense, business combinations and financial investments.
24
Pension Expense
Under U.S. GAAP, the determination of pension expense for defined benefit pension plans is made pursuant to SFAS No. 87, "Employers' Accounting for Pensions," which requires consideration of more variables than Swedish GAAP. In particular, U.S. GAAP requires the use of a specific actuarial method (the projected unit credit method), which takes into consideration factors such as future salary increases and interest rate calculations based upon company-specific borrowing capacity.
The group participates in a pension scheme in which plan assets were not segregated in separate accounts or restricted to provide benefits exclusively to group employees. As such, this pension scheme had been accounted for as a multi-employer plan for both Swedish and U.S. GAAP purposes. In 2003, the assets of the plan have been segregated and separate accounts have been established. For Swedish GAAP purposes, this pension scheme is accounted for as a multi-employer plan in 2003, and will as of January 1, 2004, be accounted for as a multiple-employer plan. For U.S. GAAP purposes, the change in 2003 is viewed as the withdrawal from a multi-employer plan and the establishment of a multiple-employer plan with the unfunded benefit obligation of SEK 72 million as of December 31, 2003 being recognized immediately in net income.
Business combinations
Acquisitions of certain subsidiaries are reported differently in accordance with Swedish GAAP and U.S. GAAP. The difference is attributable primarily to reporting and amortization of goodwill. Effective July 1, 2001, we adopted SFAS No. 141, "Business Combinations," and, effective in January 2002, we adopted SFAS No. 142, "Goodwill and Other Intangible Assets," in our determination of net profit and shareholders' equity in accordance with U.S. GAAP. In accordance with the transition rules of SFAS No. 142, we have identified our reporting units and determined the carrying value and fair value of each reporting unit as of January 1, 2002. No impairment loss has been recognized as a result of the transitional goodwill evaluation. In our income statement for 2003 prepared in accordance with Swedish GAAP, amortization of goodwill charged to income was SEK 232 million. In accordance with SFAS No. 142, goodwill and other intangible assets with indefinite useful lives should not be amortized but rather evaluated for impairment annually. Accordingly, the amortization of goodwill reported under Swedish GAAP has been reversed in the determination of net profit and shareholders' equity under U.S. GAAP. Furthermore, impairment tests have been performed for existing goodwill as of December��31, 2003 and an impairment loss of SEK 14 million has been recognized for both Swedish and U.S. GAAP.
Financial investments
Under Swedish GAAP, unrealized gains and losses on forward refining margin contracts that hedge future cash flows are deferred and recognized only when realized. Under U.S. GAAP, unrealized gains and losses on forward refining margin contracts, which do not qualify for hedge accounting treatment, would be recognized as income or loss when they occur. Effective January 1, 2001, we adopted Statement of Financial Accounting Standards, or SFAS, No.133 "Accounting for Derivative Instruments and Hedging Activities" and SFAS No. 138 "Accounting for Certain Derivative Instruments and Certain Hedging Transactions, an Amendment to FASB Statement No. 133." These statements establish accounting and reporting standards requiring that derivative instruments be recorded on the balance sheet at fair value as either assets or liabilities, and require us to designate, document and assess the effectiveness of a hedge to qualify for hedge accounting treatment. We use derivative instruments to hedge the value of our financial position. Management has determined that none of our hedges of financial exposure during 2003 qualify for hedge accounting under U.S. GAAP. In accordance with U.S. GAAP, all outstanding derivative instruments are therefore valued at fair value. The gains and losses that thereby arise are included when calculating income. The year-end adjustment to record
25
derivative instruments at fair value in accordance with U.S. GAAP resulted in a net gain adjustment of SEK 80 million recognized in current earnings in the year ended December 31, 2003.
Changes in group structure
Prior to April 2002, Preem Petroleum owned 78.5% of the Scanraff refinery with the exception of the fluid catalytic cracker, Scancracker, of which it owned 50%. The remaining interests in the Scanraff refinery and the Scancracker catalytic cracker were owned by Preem Petroleum's joint-venture partner, Hydro R&M Holding AB, an affiliate of Norsk Hydro ASA. In April 2002, Preem Petroleum and Hydro R&M Holding signed a transaction structure agreement in which the parties agreed to continue the operations of Scanraff and Scancracker as a joint refining company with unified ownership and processing rights and to restructure the ownership such that Preem Petroleum would own 75% of both Scanraff and Scancracker, with the remaining 25% owned by Hydro R&M Holding. In October 2002, Scancracker was merged into Scanraff, with no resulting change in ownership. Under Swedish GAAP, the transaction was recorded as a change in group structure with an effect only on shareholders' equity. Under U.S. GAAP, the transaction was recorded on a carry-over basis as a non-monetary exchange of similar productive assets. In December 2003, Preem Petroleum acquired Hydro R&M Holding's 25% interest in Scanraff, bringing our ownership interest in Scanraff to 100%.
Effect on Net Profit
For the year ended December 31, 2003, our net profit under U.S. GAAP was SEK 479 million (€53 million) compared to a net profit of SEK 226 million (€25 million) under Swedish GAAP. For the year ended December 31, 2002, our net profit under U.S. GAAP was SEK 11 million (€1 million) compared to a net loss of SEK 148 million (€16 million) under Swedish GAAP. For the year ended December 31, 2001, our net loss under U.S. GAAP was SEK 195 million (€21 million) compared to SEK 233 million (€26 million) under Swedish GAAP.
Reconciliation of Operating Income Before Depreciation and Amortization
The following table presents a reconciliation of operating income before depreciation and amortization under Swedish GAAP to cash flow from operating activities, the most directly comparable financial measure calculated and presented in accordance with Swedish GAAP.
| | Preem Petroleum Year ended December 31, | Preem Holdings Year ended December 31, | |||||||||||
|---|---|---|---|---|---|---|---|---|---|---|---|---|---|
| | 1999 SEK | 2000 SEK | 2001 SEK | 2002 SEK | 2003 SEK | 2003 € | |||||||
| | (in millions) | ||||||||||||
| Cash flow from operating activities | 825 | 75 | 2,614 | 194 | 417 | 46 | |||||||
| Changes in working capital | 837 | 1,946 | (1,794 | ) | 230 | 455 | 50 | ||||||
| Taxes paid | (11 | ) | 11 | 57 | 17 | 4 | 0 | ||||||
| Gain (loss) from sale of fixed assets | 12 | 7 | (2 | ) | (2 | ) | (38 | ) | (4 | ) | |||
| Gain from sale of subsidiaries | — | — | — | 1 | — | — | |||||||
| Provisions | — | 5 | 66 | 2 | 47 | 5 | |||||||
| Unrealized exchange gains (losses) | (25 | ) | (128 | ) | (231 | ) | 429 | 316 | 35 | ||||
| Deferred charges | — | — | (88 | ) | (12 | ) | (12 | ) | (1 | ) | |||
| Gain on repurchased Bonds | — | — | — | 23 | — | — | |||||||
| Non-cash pension refund | — | 89 | (2 | ) | — | (3 | ) | (0 | ) | ||||
| Financial income/expenses, net | 233 | 372 | 667 | 191 | 148 | 16 | |||||||
Operating income before depreciation and amortization | 1,871 | 2,377 | 1,287 | 1,073 | 1,334 | 147 | |||||||
26
OPERATING AND FINANCIAL REVIEW AND PROSPECTS
The following is a discussion of our results of operations and financial condition for the years ended December 31, 2001, 2002 and 2003. You should read this discussion in conjunction with the Preem Holdings audited annual consolidated financial statements and the related notes included elsewhere in this offering memorandum. We have prepared our audited annual consolidated financial statements in accordance with Swedish GAAP, which differs in certain significant respects from U.S. GAAP. The principle differences between Swedish GAAP and U.S. GAAP are set forth in "Selected Consolidated Financial Data" included elsewhere in this offering memorandum, as well as in note 26 of our audited annual consolidated financial statements. The following analysis contains forward-looking statements about our future revenue, operating results and expectations that involve risks and uncertainties. Our actual results could differ materially from those anticipated in the forward-looking statements as a result of numerous factors, including the risks discussed in "Risk Factors" and elsewhere in this offering memorandum.
Overview of the Business
We are one of Europe's largest independent oil refining companies and the largest Swedish oil company. We conduct our business through our wholly owned operating company, Preem Petroleum, which operates its business through two segments, a supply and refining segment and a marketing segment. We refine crude oil in Sweden and then market and sell refined products primarily in Sweden and other northwestern European markets, including Scandinavia, the United Kingdom and Germany. Our refineries represent approximately 75% of the refining capacity in Sweden and approximately 30% of the refining capacity in Scandinavia. We sell more refined products in Sweden than any of our competitors. In Sweden, we had leading market shares in 2003 in terms of sales volume of approximately 30% in diesel, 41% in heating oil, and 49% in fuel oil, based on data from the Swedish Petroleum Institute. In addition, our marketing segment's share of the Swedish gasoline market in terms of sales volume was approximately 11% in 2003, based on data from the Swedish Petroleum Institute.
Our supply and refining segment purchases and refines crude oil and then sells refined products wholesale to our marketing segment and to third parties. We also own an extensive network of storage depots in Sweden. Our marketing segment consists of three divisions, a home-heating division, a business-to-business division, and a station and consumer division. The marketing segment resells refined products wholesale and retail primarily in Sweden. In 2003, our supply and refining segment sold approximately 76% (by value) of its products to third parties and 24% to our marketing segment.
Prior to 2003, our marketing segment was divided into two separate segments, a Swedish market segment and an international segment. The Swedish market segment resold refined products wholesale and retail in Sweden while our international segment resold refined products primarily to wholesale customers in Poland and, to a lesser extent, in Norway. In January 2003, Preem Petroleum finalized the sale of its wholly owned Polish subsidiary, through which we conducted all of our Polish operations, to Statoil. In 2003, the other operations in our international segment, including our operations in Norway, were consolidated with our Swedish marketing operations and were included in our marketing segment. In March 2004, Preem Petroleum sold ENØK Energi AS, a wholly owned subsidiary through which we conducted our Norwegian operations. We do not expect that the sale of our Norwegian operations will have a material effect on our financial condition and results of operations in 2004. The sale of our Polish and Norwegian operations follows our decision to concentrate further investments on refining and to strengthen our marketing activities in Sweden. After the consummation of this transaction, our marketing segment no longer has any international operations.
In December 2003, we acquired 25% of the Scanraff refinery from Hydro R&M Holding AB, an affiliate of Norsk Hydro ASA, for a total consideration of approximately SEK 1,500 million (€165 million), which increased our ownership in Scanraff from 75% to 100%. The total consideration includes consideration for capital stock and assumed debt. In addition, we acquired inventory at Scanraff owned by Hydro R&M Holding.
27
Refining Margins
Oil refineries measure the financial performance of their operations by their margins. Prices for crude oil and refined products are subject to frequent and significant fluctuations. As a result, a refinery's sales revenue and cost of goods sold can vary significantly from period to period, even when the volume of crude oil purchased and refined products sold remain relatively constant. A refinery's sales revenue depends on refined product prices, currency fluctuations and throughput, which is a function of refining capacity and utilization. The cyclicality of refined product prices results in high volatility of sales revenue. Consequently, sales revenue, viewed alone, is not indicative of an oil refining company's results. Earnings and cash flow from refining are largely driven by gross and net refining margins, and a successful refinery strives to maintain its profit margins from year to year, notwithstanding fluctuations in the prices of crude oil and refined products. See "Business—Supply and Refining Operations—Raw Materials" and "—Quantitative and Qualitative Disclosures About Market Risk—Commodity Price Risk" elsewhere in this offering memorandum.
"Gross refining margin" is the difference between the sales revenue received from the sale of refined products produced by a refinery and the cost of crude oil and (where relevant) other intermediate feedstocks processed by it. While crude oil costs in general are a function of supply and demand, there are many grades of crude oil and their relative prices vary. Like crude oil, different refined products vary in price. A refinery's gross refining margin is a measure of both the sophistication of the plant's design and its crude oil purchasing strategy (its ability to produce the most valuable refined product mix from the least costly crude oil). Thus, a refinery with a cracking facility, such as Scanraff, that can produce a higher percentage of the lighter, higher-value fractions, will generally have a higher gross refining margin than a less complex facility, such as Preemraff."Refining margin" measures the ability of a refinery to cover the variable refining costs of its refining process in addition to the cost of crude oil purchases. Variable refining costs consist of volume-related costs, such as the cost of energy."Net cash margin" is the refining margin less the refinery's fixed operating costs, excluding depreciation and other non-cash costs. Fixed operating costs consist of, among others, maintenance, personnel, insurance and property costs. Net cash margin indicates the cash generating capability of the refinery."Net refining margin" is the net cash margin less depreciation and reflects the overall profitability of the refinery.
Our refining margins are affected by numerous factors beyond our control, including the supply of and demand for crude oil and refined products, which, in turn, depend on a variety of factors, including the following:
- •
- changes in global economic conditions, including exchange rate fluctuations;
- •
- political stability in major oil-producing countries;
- •
- actions by OPEC and crude oil production levels;
- •
- the availability of crude oil and refined product imports;
- •
- worldwide inventory levels of crude oil and refined products;
- •
- the availability and suitability of competitive fuels;
- •
- the extent of government regulation, in particular, as it relates to environmental policy;
- •
- market imperfections caused by regional price differentials;
- •
- local market conditions and the level of operations of other refineries in Europe;
- •
- the ability of suppliers, transporters and purchasers to perform on a timely basis or at all under their agreements (including risks associated with physical delivery);
- •
- seasonal demand fluctuations;
- •
- expected and actual weather conditions; and
- •
- changes in technology.
28
These and other factors beyond our control are likely to play an important role in refining industry economics.
The following tables show the calculation of margins for Scanraff and Preemraff for the periods covered by our audited annual consolidated financial statements. In accordance with industry practice, the margins are expressed in dollars per barrel. The information for Scanraff shows our share of the refinery's production for the years indicated.
| | 2001 | 2002 | % change | 2003 | % change | |||||||
|---|---|---|---|---|---|---|---|---|---|---|---|---|
| Scanraff | ||||||||||||
| Gross refining margin | 2.06 | 1.90 | (8 | )% | 3.86 | 103 | % | |||||
| Variable refining costs | (0.20 | ) | (0.29 | ) | 45 | % | (0.39 | ) | 34 | % | ||
| Refining margin | 1.86 | 1.61 | (13 | )% | 3.47 | 116 | % | |||||
| Fixed operating costs (excluding depreciation) | (0.59 | ) | (0.64 | ) | 8 | % | (0.76 | ) | 19 | % | ||
| Net cash margin | 1.27 | 0.97 | (24 | )% | 2.71 | 179 | % | |||||
| Depreciation | (0.32 | ) | (0.41 | ) | 28 | % | (0.48 | ) | 17 | % | ||
| Net refining margin | 0.95 | 0.56 | (41 | )% | 2.23 | 298 | % | |||||
| Total production (in 1,000 barrels) | 53,085 | 48,118 | (9 | )% | 55,301 | 15 | % | |||||
Preemraff | ||||||||||||
| Gross refining margin | 1.29 | 1.12 | (13 | )% | 2.18 | 95 | % | |||||
| Variable refining costs | (0.28 | ) | (0.30 | ) | 7 | % | (0.39 | ) | 30 | % | ||
| Refining margin | 1.01 | 0.82 | (19 | )% | 1.79 | 118 | % | |||||
| Fixed operating costs (excluding depreciation) | (0.46 | ) | (0.53 | ) | 15 | % | (0.66 | ) | 25 | % | ||
| Net cash margin | 0.55 | 0.29 | (47 | )% | 1.13 | 290 | % | |||||
| Depreciation | (0.43 | ) | (0.55 | ) | 28 | % | (0.73 | ) | 33 | % | ||
| Net refining margin | 0.12 | (0.26 | ) | (317 | )% | 0.40 | 254 | % | ||||
| Total production (in 1,000 barrels) | 41,176 | 36,906 | (10 | )% | 36,700 | (1 | )% | |||||
As noted above, the gross refining margin at Scanraff increased by 103% and the gross refining margin at Preemraff increased by 95% from 2002 to 2003. We believe that the increase in the gross refining margins at our two refineries was due to certain industry-wide factors beyond our control, including lower than normal inventory levels, the impact of the Iraq war (which contributed to an increase in demand for refined products, particularly, jet fuel), an unusually cold winter in the early part of 2003 followed by an unusually warm summer, and an increase in worldwide demand for refined products.
This increase in our gross refining margins was partly offset by an increase from 2002 to 2003 in variable refining costs of approximately 34% at Scanraff and approximately 30% at Preemraff. The increase in our variable refining costs at both refineries was primarily attributable to an increase in electricity and chemical prices. Increases in fixed operating costs of 19% at Scanraff and 25% at Preemraff, due primarily to higher personnel, insurance and real estate costs, also partially offset the improvement in our gross refining margins.
The decrease in our gross refining margins from 2001 to 2002 at Scanraff and Preemraff was due to certain industry-wide factors beyond our control, including stagnant growth in the global economy, a reduced demand for jet fuel as a result of the terrorist attacks in the United States on September 11, 2001, and increases in crude oil prices as a result of political instability following the terrorist attacks.
29
Our refining strategy involves decreasing our throughput during periods of poor refining margins (for example, in 2002) to minimize the effect of the poor margins on our gross profit.
Price Effect on Inventories
We hold large inventories of crude oil and refined products and, as a result, our financial results are impacted by the effects of fluctuations in the market prices for crude oil and refined products. To the extent that crude oil and refined product prices rise in tandem, our gross profit would generally be positively affected, because we compute the gross profit as the excess of sales revenue (determined at the time of sale at the higher refined product prices) over the cost of goods sold (determined at the earlier time the crude oil is purchased at lower prices). Thus, a portion of the gross profit that we earn during a period of rising prices may be attributable solely to the increase in prices during the period after we buy the crude oil and prior to the time we finish refining it and sell it.
However, during periods of rising crude oil prices, the cost of replenishing our crude oil inventories and, thus, our working capital requirements, are similarly rising. Because changes in refined product prices tend to lag behind changes in crude oil prices, we generally experience the increased working capital requirements from higher crude oil prices sooner, and to a greater degree, than the benefits to our gross profit that may arise from selling products at higher refined product prices. Moreover, depending on the rate and the duration of the increase, and the degree to which crude oil prices move more than refined prices, our gross profit margins may actually decline during periods of rising crude oil prices. During periods of declining crude oil prices, we believe that we experience the opposite effects.
We believe that, although the price effect on inventories may impact our results for a given period, over the long-term, the effects of rising and falling oil prices tend to offset each other. In addition we believe that from a cash flow perspective, the effects of rising and falling oil prices on gross profit and working capital tend to offset each other. In comparing our results from period to period, we believe that it is thus important to note that these price effects on inventories are unrelated to, and do not reflect, the underlying efficiency of the refineries. We employ several strategies to minimize the impact on our profitability of the volatility in feedstock costs and refined product prices. See "Business—Supply and Refining Operations—Raw Materials" and "—Quantitative and Qualitative Disclosures About Market Risk—Commodity Price Risk" elsewhere in this offering memorandum.
Fluctuations in Foreign Currency Exchange Rates
Our financial condition and results of operations are exposed to two types of risk related to foreign currency exchange rates, specifically translation risk and transaction risk. We are exposed to translation risk because a significant percentage of our sales and expenses are realized and incurred in currencies other than the kronor, which is our reporting currency. We are also exposed to translation risk because certain of our assets and liabilities are denominated in currencies other than the kronor. We are exposed to transaction risk because our revenues and costs are denominated in both the dollar and the kronor.
Translation Risk
Revenues and Expenses. Substantial portions of our revenues and expenses are recorded in dollars and then translated into kronor for inclusion in our financial statements. Thus, a decline in the value of the dollar against the kronor will have a negative affect on our revenues as reported in kronor, that is, the kronor-value of our dollar-denominated revenues will decline. Conversely, a decline in the value of the dollar against the kronor will have a positive effect on our expenses as reported in kronor, that is, the kronor value of our dollar-denominated expenses will decline.
Inventory. In the course of our ordinary operations, we store significant amounts of crude oil and refined products, the value of which is denominated in dollars because market prices for crude oil and refined products are typically denominated in dollars. Our total inventories, which are accounted
30
for as part of our current assets, were SEK 4,679 million as of December 31, 2003 and SEK 3,523 million as of December 31, 2002. A decrease in the value of the dollar against the kronor will result in a decrease in the value of our inventories, when expressed in kronor. Foreign exchange gains or losses on our inventory are included as part of cost of goods sold.
Indebtedness. As of December 31, 2003, approximately one-sixth of our debt was denominated in dollars, one-third was denominated in kronor, and one-half was denominated in euro, including our existing Preem Holdings notes. In addition, the Notes in this offering are denominated in euro. As a result, a decrease in the value of the dollar or the euro against the kronor will result in a decrease in the kronor value of our dollar- or euro-denominated indebtedness, respectively. Conversely, an increase in the value of the dollar or the euro against the kronor will result in an increase in the kronor value of our dollar- or euro-denominated indebtedness, respectively. Foreign exchange gains or losses on our indebtedness are included as part of financial expense, net.
Transaction risk
We are exposed to transaction risk because our revenues and expenses are denominated in both kronor and dollars. Accordingly, the relative movements of the kronor/dollar exchange rate can significantly affect our results of operations. For example, an appreciation of the kronor against the dollar may adversely affect our margins to the extent that our kronor-denominated revenues do not cover our kronor-denominated expenses. This risk is reduced by matching sales revenues and expenses in the same currency, which is generally the practice in our industry given the percentage of purchase and sales contracts that are denominated in dollars.
In addition, we are exposed to transaction risk in connection with our accounts payable for crude oil purchases. If the dollar changes in value against the kronor between the date of purchase and the date of payment, the difference in the kronor value of our payment and the kronor value of the account payable would be recorded as a foreign exchange gain or loss in our results of operations. We face a similar risk with respect to our accounts receivable for refined product sales.
Trend Information
Exchange rates. During the course of 2002 and 2003, the value of the dollar against both the krona and the euro declined significantly. In the near future, we expect the value of the dollar to remain low. We believe that given our current exposure to dollars, a further decline in the value of the dollar will adversely affect our financial position and results of operations.
Rising crude oil prices. Crude oil prices have increased significantly (with some volatility) since the beginning of 2002. This trend has continued into 2004, as a result of low inventory levels (particularly, in the United States), increased demand due to, among other factors, a second consecutive cold winter in the United States, a recent OPEC announcement to cut production by April 1, 2004, and speculation in the oil futures market.
Continuing strong margins. Industry margins may be volatile in the future, depending primarily on price movements for crude oil and refined products, international political and economic developments, and other factors. In the short term, however, we expect our refining margins to remain strong due to, among other factors, low worldwide inventory levels for refined products and increasing demand for refined products that, to date, has outpaced increasing production.
Shift in refined product demand. Legislation and regulations, including with respect to taxation of refined products, have been implemented in various countries in Europe, including in Sweden, the United Kingdom and Germany, which provide an incentive to us and other refining companies to produce gasoline and diesel with a sulphur content at or below the minimum required by the EU's 2005 specifications. The overall effect of such legislation is to increase market demand for, among other products, low sulphur diesel due to the tax and other benefits that suppliers can pass on to consumers. An increase in transit commercial traffic and a growing trend to switch from gasoline to
31
diesel cars in western Europe have also contributed to the increase in demand for diesel. The recent increase in demand for low sulphur diesel has been complemented by a decrease in demand for heating oil in Sweden, where there has been a shift toward electricity as a preferred source for home heating. After the isocracker unit that we propose to construct at Scanraff becomes operational, which, if construction proceeds as contemplated, is expected to occur in the first half of 2006, we intend to decrease our production of heating oil, a lower margin product, and increase our production of virtually sulphur free (10 parts per million) diesel, a higher margin product, which we expect will improve our overall refining margins.
Lack of growth in our retail operations. Since 2001, we have pursued a strategy of strengthening our station and consumer division, particularly by disposing of unprofitable stations, increasing the number of low-cost, unmanned stations, and installing full-service convenience stores in stations with relatively high throughput. However, in the past three years, this strategy has not generated significant improvement in that division. We currently intend to transfer a substantial number of our company-owned stations to dealers to increase the proportion of franchised stations in our network, which we expect to enable us to improve the performance of our station and consumer division, in part, by reducing costs.
Results of Operations
Summary
The following table shows certain items in our consolidated statements of operations for the years ended December 31, 2001, 2002 and 2003.
| | 2001 | 2002 | | 2003 | | |||||||
|---|---|---|---|---|---|---|---|---|---|---|---|---|
| | % Change | % Change | ||||||||||
| | SEK | SEK | SEK | |||||||||
| | (in millions, except % change) | |||||||||||
| Consolidated Statement of Operations Data: | ||||||||||||
| Revenues | 46,697 | 42,178 | (10 | )% | 43,030 | 2 | % | |||||
| Excise duties | (10,288 | ) | (8,855 | ) | (14 | )% | (8,241 | ) | (7 | )% | ||
| Sales revenue | 36,409 | 33,323 | (8 | )% | 34,789 | 4 | % | |||||
| Cost of goods sold | (34,799 | ) | (31,952 | ) | (8 | )% | (33,303 | ) | 4 | % | ||
| Gross profit | 1,610 | 1,371 | (15 | )% | 1,486 | 8 | % | |||||
| Selling and administrative expenses | (1,417 | ) | (1,393 | ) | (2 | )% | (1,291 | ) | (7 | )% | ||
| Other operating income/expenses | (268 | ) | (249 | ) | (7 | )% | (258 | ) | 4 | % | ||
| Operating income | 461 | 227 | (51 | )% | 453 | 100 | % | |||||
| Financial expense, net(1) | (667 | ) | (191 | ) | (71 | )% | (148 | ) | (23 | )% | ||
| Income (loss) before taxes | (206 | ) | 36 | 117 | % | 305 | 747 | % | ||||
| Income taxes(2) | (15 | ) | (180 | ) | 1,100 | % | (77 | ) | (57 | )% | ||
| Minority interests | (12 | ) | (4 | ) | (67 | )% | (2 | ) | (50 | )% | ||
| Net profit (loss) | (233 | ) | (148 | ) | (36 | )% | 226 | 253 | % | |||
- (1)
- Financial expense, net, consists of the share of the non-cash income (loss) of associated companies, dividends received, interest income and expense, foreign exchange gains or losses on our indebtedness and certain other items.
- (2)
- Income taxes do not generally reflect cash payable or paid, because we transfer, to the extent possible, our taxable income to our parent company as a group contribution, which is in the form of a book-entry dividend.
32
The following table shows the sales revenue and operating income for each of our business segments for each of the years ended December 31, 2001, 2002 and 2003.
| | 2001 | 2002 | | 2003 | | |||||||
|---|---|---|---|---|---|---|---|---|---|---|---|---|
| | % Change | % Change | ||||||||||
| | SEK | SEK | SEK | |||||||||
| | (in millions, except for % change) | |||||||||||
| Sales Revenue: | ||||||||||||
| Supply and refining(1) | 31,289 | 28,359 | (9 | )% | 31,609 | 11 | % | |||||
| Marketing(2) | 10,364 | 10,285 | (1 | )% | 10,920 | 6 | % | |||||
| International | 1,914 | 2,061 | 8 | % | — | — | ||||||
| Exchange rate differences | 140 | (169 | ) | (221 | )% | (201 | ) | 19 | % | |||
| Group eliminations | (7,298 | ) | (7,213 | ) | (1 | )% | (7,539 | ) | 5 | % | ||
| Total Sales Revenue(3) | 36,409 | 33,323 | (8 | )% | 34,789 | 4 | % | |||||
Operating Income (loss): | ||||||||||||
| Supply and refining | 543 | 1,086 | 100 | % | 966 | (11 | )% | |||||
| Marketing(2) | 79 | 116 | 47 | % | 106 | (9 | )% | |||||
| International | (72 | ) | (68 | ) | (6 | )% | — | — | ||||
| Other non-allocated income (expense)(4) | (89 | ) | (907 | ) | 919 | % | (619 | ) | (32 | )% | ||
| Total Operating Income | 461 | 227 | (51 | )% | 453 | 100 | % | |||||
- (1)
- Includes sales by our supply and refining segment to our marketing segment of SEK 7,498 million for 2003, SEK 7,184 million for 2002 and SEK 7,158 million for 2001. We have included inter-company sales revenue in the total for our supply and refining segment. These sales are made at market rates. Since refined products are commodities, these sales could have been made to third parties at similar prices. We believe that including these amounts in supply and refining segment sales revenue properly reflects the results of these segments for purposes of comparison. Such inter-company sales are eliminated in our audited annual consolidated financial statements.
- (2)
- Figures for 2003 include our remaining international operations, including our operations in Norway, which were included in our international segment in 2001 and 2002. Figures for 2001 and 2002 are for our Swedish market segment. Because our Norwegian operations were included in our marketing segment in 2003 and our international segment in 2002, sales revenue and operating income of our marketing segment in 2003 and 2002 are not directly comparable. Our Norwegian operations had sales revenue of SEK 93 million and an operating loss of SEK 5 million in 2003, compared to sales revenue of SEK 113 million and an operating loss of SEK 6 million in 2002.
- (3)
- Total sales revenue is our total revenue less excise duties, which are taxes collected at the point of sale by us and remitted to the governments of the countries in which we operate, primarily Sweden.
- (4)
- In order to evaluate the performance of our segments, we allocate certain items as "non-allocated income (expense)." Specifically, we include in non-allocated income (expense) our "corporate cost center" and foreign exchange gains or losses related to our inventory and our accounts payable/receivable. Our corporate cost center includes administrative and personnel-related expenses.
Our revenues include excise duties, which are taxes on petroleum products that we collect at the point of sale and remit monthly primarily to the government of Sweden. The continuous collection of excise duties at the time of sale and the holding of such excise duties until we are obligated to remit them to the government enables us to use this cash to fund a significant portion of our working capital needs. Sales revenue represents our revenues less the excise duties. Sales revenue also includes foreign exchange gains or losses on our accounts receivable. In this discussion, we have provided sales revenue figures for our supply and refining segment and our marketing segment. The sales revenue of our supply and refining segment includes inter-company sales to the marketing segment and the sales revenue of our marketing segment includes the sales revenue received on the resale of such refined products. The inter-company sales between our supply and refining segment and our marketing segment are made at market rates. Since refined products are commodities, these sales could have been made to third parties at similar prices. We believe that the inclusion of these amounts in the sales revenue for our supply and refining segment properly reflects the results of these segments for purposes of comparison. These inter-company sales have been eliminated in our annual audited consolidated financial statements.
33
Cost of goods sold consists of the cost of our crude oil purchases (including transportation costs) and direct production costs (including depreciation of equipment used in the refining process). Cost of goods sold also includes foreign exchange gains or losses on our inventory and our accounts payable. We have no supply contracts longer than 12 months in duration. We rely primarily on spot market purchases. We regularly monitor market conditions for various types of crude oil as well as demand for refined products.
Gross profit is our sales revenue less the cost of goods sold. Occasionally, due to market forces, the crude oil and/or refined product price curve is in "contango," meaning that forward prices of crude oil or refined products exceed current spot market prices. While we do not speculate with inventory, as a result of our large storage capacity we are able to take advantage of the price curve being in contango by simultaneously entering into current spot market purchase and future sale agreements. When we take advantage of the price curve being in contango, our primary expense is that associated with storing the crude oil or refined products until their time of delivery under the future sale agreement. So long as our storage costs are less than the profit margin resulting from the price curve being in contango we are able to lock in a profit margin. By locking in our margin, we can realize significant profits by utilizing our substantial storage facilities to store crude oil and refined products at our existing facilities until the delivery date called for by the sale agreements.
Selling expenses consist primarily of the costs of sales personnel, advertising and promotions. Administrative expenses consist primarily of the costs of administrative personnel.
Other operating income consists of our sales of surplus heat, harbor fees, commission income, sales of storage certificates to other oil companies for their EU-imposed compulsory storage obligations, income from the rental of dealer-operated service stations and several other items, none of which is individually material. Our other operating income is largely attributable to our non-refining business and, as such, is insulated to a degree from the volatility of our refining margins and provides us with relatively stable earnings.
Operating income is gross profit net of the foregoing items and net of non-recurring items, if any. We have itemized the contributions to operating income of our supply and refining segment and our marketing segment.
Financial expense, net, consists of our share of the non-cash income (loss) of associated companies, dividends received, interest income and expense, foreign exchange gains or losses on our indebtedness, and certain other items.
We are subject to Swedish income tax on our taxable income. We attempt to minimize the amount of taxes that we pay by transferring, to the extent possible, our taxable income to our parent company, Corral Petroleum Holdings in the form of a book-entry dividend, which, for Swedish tax purposes, is referred to as a group contribution. As a result, the amount included on our statement of operations as income taxes generally reflects book-entry transfers rather than cash paid or payable. The amount we can transfer on a year-to-year basis is limited by the Swedish Companies Act to the lesser of the amount of our unrestricted shareholders' equity, which includes net profit earned during the year, shown on a consolidated and stand-alone basis and an amount that, given due consideration to the financing needs of the group, its liquidity or financial position, would not contravene sound business principles. The group contribution is simultaneously offset by an equity contribution from Corral Petroleum Holdings. The excess of the group contribution, if any, over the equity contribution represents a true dividend payable in cash. We paid income taxes in cash of SEK 57 million in 2001, SEK 17 million in 2002 and SEK 4 million in 2003. The amounts recorded as income taxes in our results of operations represent the income taxes that we would have paid had we not made a group contribution. We follow the same strategy at the Preem Petroleum level to minimize the amount of income taxes that it pays. We cannot assure you that we will be able to employ this tax optimization
34
strategy in the future. If we are unable to employ this strategy, we would be required to pay income taxes in cash to the Swedish government on our taxable income.
Minority interests as of December 31, 2003 principally reflect the interest of Vattenfall AB in Preem Gas AB. Prior to April 2002, minority interests reflected the interests of Hydro R&M Holding AB, an affiliate of Norsk Hydro ASA, in Skandinaviska Raffinaderi AB Scanraff. In April 2002, with the restructuring of Scanraff and Scancracker, we began accounting for our ownership in Scanraff using the proportional method instead of the purchase method. The proportional method resulted in the inclusion of only 75% of the revenues, expenses, assets and liabilities attributable to Scanraff. The purchase method would have resulted in the inclusion of 100% of the revenues, expenses, assets and liabilities attributable to Scanraff, with corresponding minority interests recorded in the income statement and balance sheet, as applicable, to account for the 25% owned by Hydro R&M Holding.
Year ended December 31, 2003 compared to the year ended December 31, 2002
Revenues. Our revenues for the year ended December 31, 2003 were SEK 43,030 million, an increase of SEK 852 million, or approximately 2%, from SEK 42,178 million for the year ended December 31, 2002. Excluding the effect of the sale of our Polish operations, revenues would have increased by SEK 2,800 million, or approximately 7%. This increase is primarily attributable to the increase in market prices for refined products and to higher sales volumes. Average refined product prices in dollars in 2003 were approximately 20% higher than in 2002. Sales volumes in 2003 were 1,788,000 cubic meters, or 11% higher than in 2002. The increase in the prices of refined products and our sales volume was offset to a large extent by a 17% decrease in the average dollar to krona exchange rate compared to 2002 and to the effects of the sale in 2002 of our interest in Greenergy Fuels Limited.
Sales revenue. Sales revenue for the year ended December 31, 2003 was SEK 34,789 million, an increase of SEK 1,466 million, or approximately 4%, from SEK 33,323 million for the year ended December 31, 2002. Excluding the effect of the sale of our Polish operations, sales revenue would have increased by SEK 3,414 million, or approximately 11%. This increase is primarily a result of, and in the same proportions as, the factors discussed above. Sales revenue for our supply and refining segment increased by 11% from SEK 28,359 million in 2002 to SEK 31,609 million in 2003. Sales revenue for our marketing segment increased by 6% from SEK 10,285 million to SEK 10,920 million. The increases in our sales revenue in our two segments are due primarily to an increase in average refined product prices and higher sales volume because our Norwegian operations were included in our marketing segment.
Cost of goods sold. Cost of goods sold for the year ended December 31, 2003 was SEK 33,303 million, an increase of SEK 1,351 million, or approximately 4%, from SEK 31,952 million for the year ended December 31, 2002. Excluding the effect of the sale of our Polish operations, cost of goods sold would have increased by SEK 3,244 million, or approximately 11%. The increase was attributable to a 15% increase in average crude oil prices and an 11% increase in our sales volumes, which was offset to a large extent by a 17% decrease in the average dollar to krona exchange rate in 2003, compared to 2002.
Gross profit. Gross profit for the year ended December 31, 2003 was SEK 1,486 million, an increase of SEK 115 million, or approximately 8%, from SEK 1,371 million for the year ended December 31, 2002. Excluding the effect of the sale of our Polish operations, gross profit would have increased by SEK 170 million, or approximately 13%. This increase was primarily a result of an increase in our sales volumes and higher refining margins.
Selling and administrative expenses. Selling expenses for the year ended December 31, 2003 were SEK 812 million, a decrease of SEK 102 million, or approximately 11%, from SEK 914 million for the
35
year ended December 31, 2002. SEK 101 million of this decrease was attributable to the sale of our operations in Poland. Administrative expenses for the year ended December 31, 2003 were SEK 479 million compared to the same figure for the year ended December 31, 2002.
Other operating income. Our other operating income for the year ended December 31, 2003 was SEK 268 million, an increase of SEK 16 million, or approximately 6%, from SEK 252 million for the year ended December 31, 2002. The increase in other operating income is primarily a result of increased sales of waste heat from our Preemraff refinery to the City of Gothenburg.
Other operating expenses. Other operating expenses for the year ended December 31, 2003 were SEK 10 million, an increase of SEK 7 million, or approximately 233%, from SEK 3 million for the year ended December 31, 2002. The increase is primarily attributable to a bad-debt provision of SEK 10 million of accounts receivable related to the sale of our operations in Poland.
Operating income (loss). Operating income for the year ended December 31, 2003 was SEK 453 million, an increase of SEK 226 million, or approximately 100%, from SEK 227 million for the year ended December 31, 2002. Excluding the effect of the sale of our Polish operations, operating income would have increased by SEK 173 million, or approximately 62%. This increase was primarily attributable to a decrease in our non-allocated expense of SEK 288 million, or approximately 32%. The decrease in our non-allocated expense was due primarily to an increase in the net foreign exchange gain on our accounts payable/receivable, as well as a slight increase in expenses allocated to our corporate cost center and a slight decrease in foreign exchange losses on our inventory.
The operating income of our supply and refining segment was SEK 966 million for the year ended December 31, 2003, a decrease of SEK 120 million, or 11%, from SEK 1,086 million for the year ended December 31, 2002. This decrease in operating income was primarily a result of lower price gains (as expressed in dollars) on our inventory compared to year 2002. Operating income for our marketing segment was SEK 106 million, a decrease of SEK 10 million, or approximately 9%, from SEK 116 million for the year ended December 31, 2002. Because our Norwegian operations were included in our marketing segment in 2003 and our international segment in 2002, operating income of our marketing segment in 2003 and 2002 is not directly comparable. The decrease in the marketing segment's operating income was primarily a result of lower sales margins compared to the year 2002.
Financial expense, net. Our financial expense, net, for the year ended December 31, 2003 was SEK 148 million, a decrease of SEK 43 million, or approximately 23%, from SEK 191 million for the year ended December 31, 2002. This decrease was mainly attributable to a decrease in our foreign exchange losses on our financial assets.
Income taxes. Income taxes for the year ended December 31, 2003 were SEK 77 million, a decrease of SEK 103 million, or approximately 57%, from SEK 180 million for the year ended December 31, 2002. The decrease is attributable primarily to the loss we incurred in connection with the sale of our Polish operations. The amounts recorded as income taxes do not represent income taxes that we paid in cash. Instead, they represent the income taxes that we would have paid had we not made a group contribution to our parent company.
Minority interests. Minority interests for the year ended December 31, 2003 were SEK 2 million, a decrease of SEK 2 million, or approximately 50%, from SEK 4 million for the year ended December 31, 2002. This decrease is primarily attributable to the sale of our interests in Greenergy Fuels Limited in May 2002.
Net profit (loss). Net profit for the year ended December 31, 2003 was SEK 226 million, an improvement of SEK 374 million, or approximately 253%, from a net loss of SEK 148 million for the year ended December 31, 2002, primarily as a result of the factors discussed above.
36
Year ended December 31, 2002 compared to year ended December 31, 2001
Revenues. Our revenues for the year ended December 31, 2002 were SEK 42,178 million, a decrease of SEK 4,519 million, or approximately 10%, from SEK 46,697 million for the year ended December 31, 2001. The overall decrease in revenues was primarily attributable to a decrease of approximately 6% in the value of the dollar against the krona during this period.
Sales revenues. Sales revenue for the year ended December 31, 2002 was SEK 33,323 million, a decrease of SEK 3,086 million, or approximately 8%, from SEK 36,409 million for the year ended December 31, 2001, primarily as a result of, and in the same proportions as, the factors discussed above.
Cost of goods sold. Cost of goods sold for the year ended December 31, 2002 was SEK 31,952 million, a decrease of SEK 2,847 million, or approximately 8%, from SEK 34,799 million for the year ended December 31, 2001. The decrease was primarily due to foreign currrency losses on our inventory attributable to the decrease in the value of the dollar against the krona.
Gross profit. Gross profit for the year ended December 31, 2002 was SEK 1,371 million, a decrease of SEK 239 million, or approximately 15%, from SEK 1,610 million for the year ended December 31, 2001. The decrease in our gross profit was partially attributable to foreign currency losses on our inventory. The foreign currency losses on our inventory were partially offset by an increase in both crude oil and refined product prices. The decrease in our gross profit was also partially due to a decrease in our gross refining margins.
Selling and administrative expenses. Selling expenses for the year ended December 31, 2002 were SEK 914 million, a decrease of SEK 29 million, or approximately 3%, from SEK 943 million for the year ended December 31, 2001. Higher costs in our station and consumer division for sales personnel, depreciation and maintenance were more than offset by lower costs for other sales operations in Sweden. Administrative expenses for the year ended December 31, 2002 were SEK 479 million, an increase of SEK 5 million, or approximately 1%, from SEK 474 million for the year ended December 31, 2001. The increase is primarily attributable to higher costs for external services related to business development projects and to an increase in pension expenses.
Other operating income. Other operating income for the year ended December 31, 2002 was SEK 252 million, a decrease of SEK 16 million, or approximately 6%, from SEK 268 million for the year ended December 31, 2001. The decrease is almost entirely attributable to the change in the method of accounting for our ownership of Scanraff. In 2001, we accounted for our ownership of Scanraff by using the purchase method, which includes 100% of Scanraff's operating income. The operating income attributable to the 25% of Scanraff owned by Hydro R&M Holding is accounted for as a minority interest. In 2002, we applied the proportional method of accounting, which results in the inclusion of only 75% of the operating income attributable to Scanraff. If we had accounted for our ownership of Scanraff in 2002 by using the purchase method, our other operating income would have increased by SEK 16 million.
Other operating expenses. Other operating expenses for the year ended December 31, 2002 was SEK 3 million, an increase of SEK 3 million from SEK 0 million for the year ended December 31, 2001. The increase is entirely attributable to a capital loss of SEK 3 million in connection with the sale of our operations in Poland.
Operating income (loss). Operating income for the year ended December 31, 2002 was SEK 227 million, a decrease of SEK 234 million, or approximately 51%, from SEK 461 million for the year ended December 31, 2001. The decrease in our operating income was partially attributable to foreign currency losses on our inventory due to the decrease in the value of the dollar against the krona. The foreign currency losses on our inventory were partially offset by an increase in both crude oil and
37
refined product prices. A decrease in our gross refining margins also contributed the decrease in our operating income.
The operating income of our supply and refining segment was SEK 1,086 million for the year ended December 31, 2002, an increase of SEK 543 million, or 100%, from SEK 543 million for the year ended December 31, 2001. This increase in operating income is largely attributable to an increase in the value of our inventory due to an increase in both crude oil and refined product prices. Crude oil prices rose by approximately $10 per barrel from January 1, 2002 to December 31 2002, compared to a decrease of approximately $4 per barrel from January 1, 2001 to December 31, 2001.
Our marketing segment generated operating income of SEK 116 million for the year ended December 31, 2002, an increase of SEK 37 million, or approximately 47%, compared to operating income of SEK 79 million for the year ended December 31, 2001. Within this segment, our home-heating and business-to-business divisions maintained a relatively stable operating income for 2002 compared to 2001, primarily as a result of strong demand for heating oil towards the end of the year, due to the cold weather. The operating income generated by our home-heating and business-to-business divisions was to some extent offset by lower operating income in our station and consumer division in 2002, compared to 2001. The increase in operating income for the total segment was, to a large extent, a result of expenses of SEK 49 million incurred in 2001 in connection with the restructuring of our regional sales organization, which involved the reduction of our regional sales force on all levels and the recruiting and training of new staff for a centralized call center. The operating loss of our international segment was SEK 68 million for the year ended December 31, 2002, which is a decrease of approximately 6% from an operating loss of SEK 72 million for the year ended December 31, 2001. Higher sales volumes and margins were almost entirely offset by provisions for bad debts and other provisions made in connection with the sale of our operations in Poland.
Financial expense, net. Our financial expense, net, for the year ended December 31, 2002 was SEK 191 million, a decrease of SEK 476 million, or approximately 71%, from SEK 667 million for the year ended December 31, 2001. The decrease in our financial expense, net, was due primarily to a decrease in the foreign exchange losses associated with our euro-denominated debt of SEK 150 million and our dollar-denominated debt of SEK 368 million. The foreign exchange losses associated with our foreign currency-denominated debt resulted from a decrease in the value of the dollar and the euro against the krona.
Income taxes. Income taxes for the year ended December 31, 2002 were SEK 180 million, an increase of SEK 165 million, or approximately 1,100%, from SEK 15 million for the year ended December 31, 2001. The increase is attributable to higher taxable income in 2002.
Minority interests. Minority interests for the year ended December 31, 2002 were SEK 4 million, a decrease of SEK 8 million, or approximately 67%, from SEK 12 million for the year ended December 31, 2001. This decrease is primarily attributable to the sale of our holdings in Greenergy Fuels Limited.
Net profit (loss). Net loss for the year ended December 31, 2002 was SEK 148 million, an improvement of SEK 85 million, or approximately 36%, from a net loss of SEK 233 million for the year ended December 31, 2001, primarily as a result of the factors discussed above.
Liquidity and capital resources
Overview
Our primary cash requirements include funding construction, upgrade and maintenance projects, servicing indebtedness and general working capital needs. Our primary sources of liquidity are available cash reserves, internal cash generation, long-term debt, short-term working capital financing and
38
short-term use of excise duties collected. We operate in an environment in which liquidity and capital resources are impacted by changes in the prices for crude oil and refined products, and a variety of additional risks, including currency and regulatory risks. In particular, because we purchase crude oil on the spot market and prices can be volatile, the availability of cash and short-term credit is crucial to our business. Historically, our cash and short-term credit have been sufficient to finance such purchases. We believe that our working capital is sufficient for our present requirements. As of December 31, 2003 we had cash and cash equivalents of SEK 633 million and approximately SEK 697 million available under our unutilized credit facilities. As of March 31, 2004, we had cash and cash equivalents of SEK 1,110 million and approximately SEK 1,761 million available under our unutilized credit facilities.
Cash flow
| | 2001 | 2002 | | 2003 | | ||||||
|---|---|---|---|---|---|---|---|---|---|---|---|
| | % Change | % Change | |||||||||
| | SEK | SEK | SEK | ||||||||
| | (in millions, except % change) | ||||||||||
| Cash flow from operating activities before changes in working capital | 820 | 424 | (48 | )% | 872 | 106 | % | ||||
| Cash flow from operating activities | 2,614 | 194 | (93 | )% | 417 | 115 | % | ||||
| Cash flow used in investing activities | (331 | ) | (1,008 | ) | 205 | % | (1,772 | ) | 76 | % | |
| Cash flow (used in) provided by financing activities | (1,338 | ) | 319 | 124 | % | 1,527 | 379 | % | |||
| Cash flow of the year | 945 | (495 | ) | (152 | )% | 172 | 135 | % | |||
The 106% increase in our cash flow from operating activities before changes in working capital from 2002 to 2003 resulted from an increase in income from operations and a decrease in unrealized exchange gains of SEK 316 million in 2003, compared to SEK 429 million in 2002. The 48% decrease in our cash flow from operating activities before changes in working capital from 2001 to 2002 resulted from unrealized exchange gains of SEK 429 million in 2002, compared to unrealized exchange losses of SEK 231 million in 2001.
The 115% increase in our cash flow from operating activities from 2002 to 2003 was primarily attributable to a decrease in current receivables of SEK 1,364 million. The decrease in current receivables was attributable to an increase in sales in December 2002, which, in turn, resulted from unusually cold weather and anticipation of an increase in energy tax rates that took effect on January 1, 2003. The decrease in current receivables was offset to a large extent by an increase in inventory of SEK 1,295 million which was primarily attributable to an increase in goods in transit, which are included in our inventory volumes, and to the acquisition of oil inventory from Hydro R&M Holding in connection with our acquisition of its 25% interest in Scanraff. The 93% decrease in our cash flow from operating activities from 2001 to 2002 was primarily attributable to an increase in current receivables and a decrease in liabilities. The increase in current receivables is primarily attributable to high sales volume at the end of 2002.
The 76% increase in our cash flow used in investing activities from 2002 to 2003 was due primarily to our acquisition of 25% of Scanraff. The 205% increase in our cash flow used in investing activities from 2001 to 2002 was due primarily to the construction of a propane plant at Scanraff, expenses associated with the major turnaround maintenance at Scanraff, and an upgrade of the isomerization unit at Preemraff.
The 379% increase in cash flow provided by financing activities from 2002 to 2003 was due primarily to the financing that we obtained in connection with our acquisition of 25% of Scanraff. The change in cash flow from financing activities from 2001 to 2002 primarily reflects payment in 2001 of a group contribution to our parent company.
39
We collect government excise duties imposed on petroleum products at the time of retail sale and subsequently remit them to the Swedish government. Excise duties were SEK 8,241 million in 2003 compared to SEK 8,855 million in 2002 and SEK 10,288 million in 2001. The delay between the time we collect these funds and the time we are required to remit them to the respective government enables us to use the cash to finance a significant portion of our working capital needs.
Future capital needs and resources
We estimate that we will receive net proceeds of approximately €120 million from this offering. Subject to completion and closing of the proposed new credit facilities, we will use the funds received to finance a portion of the cost of the construction of the isocracker unit at the Scanraff refinery. If for any reason, the proposed new credit facilities are not available, or are not available in an amount or within the time contemplated, then a portion of the proceeds of these Notes will be used, together with available cash reserves and amounts available under our unutilized credit facilities, to repay the existing €170 million bridge loan. Pending the final application of the net proceeds, we expect to hold a portion of the proceeds in the form of cash and cash equivalents and to use a portion of the proceeds to repay amounts outstanding under our short-term revolving credit facilities, which amounts we intend to draw down later as needed to finance construction of the isocracker unit. We estimate that the aggregate cost of construction of the isocracker unit will be approximately SEK 3,500 million (€385 million). Of this amount, we have paid SEK 104 million (€11 million) as of March 31, 2004, and we have present contractual purchase commitments of approximately SEK 1,100 million (€121 million), of which approximately SEK 500 million (€55 million) will be paid by September 30, 2004.
On April 27, 2004, we signed an appointment letter with SEB Merchant Banking, Skandinaviska Enskilda Banken AB (publ) and Svenska Handelsbanken AB (publ), pursuant to which they are appointed to act, on a best efforts basis, as lead arrangers in connection with proposed new credit facilities for Preem Petroleum as described in a term sheet attached thereto for an approximate amount of €300 million to €355 million. Preem Holdings will act as guarantor under the facilities. We have not yet entered into any definitive documents and the proposed lenders have conditioned their best efforts upon satisfactory completion of due diligence, execution of satisfactory documentation, and successful syndication, among others things. In addition, even if all of the foregoing are satisfied, draw downs will require investment of additional equity and satisfaction of certain other conditions. The proposed new credit facilities will consist of (i) a €170 million amortizing term loan facility, or Facility A; (ii) an amortizing multi-currency term loan facility of an amount from €100 million to €155 million, or Facility B; and (iii) a €30 million revolving credit facility, or Facility C.
We intend to use Facility A to repay the bridge loan, which we obtained to finance the December 2003 acquisition of the remaining 25% of the Scanraff refinery that we did not own. The bridge loan matures on June 11, 2004. We intend to use Facility B to finance a portion of the cost of the construction of the isocracker unit at the Scanraff refinery. Facility C is intended to be used for general corporate purposes. The proposed new credit facilities, if entered into on the terms currently contemplated, will require as a condition precedent to funding that Preem Holdings make certain required cash equity investments into Preem Petroleum. These equity investments are tied to drawings under the facilities and total up to €80 million. A cash equity investment of €25 million is a condition precedent to drawing down on Facility A. A second cash equity investment of €25 million is a condition precedent to drawing down on Facility B. In addition, in the event that we have drawn down an amount in excess of the difference between the funds made available under Facility B minus €30 million, Preem Holdings will be required to make a further cash equity investment, up to a maximum of €30 million, into Preem Petroleum in the same amount as the amount of Facility B that we draw down in excess of such amount. We intend to use such equity investments as additional funding for the construction of the isocracker unit at the Scanraff refinery.
40
As mentioned above, funding under the proposed new credit facilities is subject to various conditions precedent. If the proposed new credit facilities are for any reason not available in an amount or within the time contemplated, or at all, then a portion of the proceeds of these Notes will be used, together with available cash reserves and amounts available under our unutilized credit facilities, to repay the bridge loan. In such a scenario, we would seek to obtain alternative long-term debt to finance the construction of the isocracker unit at the Scanraff refinery. If we are unable to obtain such financing or if such financing is delayed, we may have to postpone the construction of the isocracker unit. In such event, we may experience delays in realizing the benefits of the isocracker unit.
In addition to the above, as of December 31, 2003, we had obligations to pay in 2004 approximately SEK 555 million of maturing long-term debt and approximately SEK 101 million in operating lease obligations. Furthermore, in 2004 we intend to make additional investments to further upgrade our refineries. We intend to fund these expenditures from available cash reserves, internally generated cash flow from operating activities and amounts available under our unutilized credit facilities. If the proposed new credit facilities are not made available to us, we may have to postpone our planned capital expenditures. See "Risk Factors—If the proposed new credit facilities are not available to us in the time contemplated, or at all, we would have to use a portion of the proceeds of the offering of the Notes to repay the bridge loan, which matures on June 11, 2004, we may have to postpone construction of the isocracker, and our liquidity would be adversely affected."
Capital expenditures
Preem Petroleum made capital expenditures of SEK 720 million (€79 million) for the year ended December 31, 2003, SEK 1,028 million (€113 million) for the year ended December 31, 2002 and SEK 588 million (€65 million) for the year ended December 31, 2001. These expenditures were funded from available cash reserves, internally generated cash flow from operating activities and long-term debt. Most of Preem Petroleum's capital expenditures in these years related to smaller scale modernization and improvements to increase the safety, efficiency and reliability of its refineries. In order to meet the EU Year 2005 aromatic specification for gasoline, the isomerization unit at Preemraff has been upgraded at a cost of SEK 365 million (€40 million). The upgrade was completed in the third-quarter 2002. In 2003, a mild hydro-cracker unit was installed at Preemraff during the regular turnaround maintenance period, which will enable the refinery to upgrade part of its heavy oil production to environmentally classified diesel. The unit required an investment of approximately SEK 88 million (€10 million). In addition, Scanraff installed a new plant for the recovery of petrol gas in connection with the loading of refined products onto tankers, which required an investment of SEK 40 million (€4 million). Our capital expenditures related to major turnaround maintenance amounted to SEK 186 million (€20 million) at Scanraff in 2002 (which represents our 75% share of total capital expenses of SEK 248 million (€27 million)) and amounted to SEK 150 million at Preemraff in 2003. We have applied to the Swedish authorities for permission to perform the major turnaround maintenance at Scanraff and Preemraff every five years, instead of every four. If we receive final permission from the Swedish authorities for this change, the next major turnaround maintenance will be in 2007 at Scanraff and 2008 at Preemraff.
Description of Indebtedness
Indebtedness other than the shareholder loan. As of December 31, 2003, we had total debt of SEK 7,797 million (€858 million). As of December 31, 2003, our long-term debt (excluding the shareholder loan from Corral Petroleum Holdings) amounted to SEK 4,675 million (€514 million). As of December 31, 2003, we had current debt of SEK 3,122 million (€343 million), which included the current portion of our long-term debt of SEK 555 million (€61 million). These loans and facilities are provided by various international banks. Our indebtedness (excluding the shareholder loan, which does not bear interest) bore interest at a weighted average rate per year of 6.6% as of December 31, 2003.
41
In addition to the indebtedness described above and these Notes, on April 27, 2004, we signed an appointment letter with SEB Merchant Banking, Skandinaviska Enskilda Banken AB (publ) and Svenska Handelsbanken AB (publ), pursuant to which they are appointed to act, on a best efforts basis, as lead arrangers in connection with proposed new credit facilities for Preem Petroleum as described in a term sheet attached thereto for an approximate amount of €300 million to €355 million. See "—Future Capital Needs and Resources." For a more detailed discussion of our long-term indebtedness, see "Description of Certain Indebtedness" included elsewhere in the offering memorandum. In addition, for a discussion of the currency denomination and interest rate variability of our credit arrangements, see "—Quantitative and Qualitative Disclosures About Market Risk—Interest Rate Risk."
Ranking of our indebtedness. The following table shows the breakdown of our total indebtedness, as of December 31, 2003 (excluding the shareholder loan and any other inter-company indebtedness and on a non-consolidated basis).
| | As of December 31, 2003 | |||||
|---|---|---|---|---|---|---|
| Borrower | Current debt | Long-term Debt | Total debt | |||
| | (in millions of SEK) | |||||
| Preem Holdings | — | 2,774 | 2,774 | |||
| Preem Petroleum | 1,552 | 1,235 | 2,787 | |||
| Subsidiaries of Preem Petroleum | 1,570 | 666 | 2,236 | |||
| Total | 3,122 | 4,675 | 7,797 | |||
The SEK 2,774 million of total debt of Preem Holdings represents the outstanding existing Preem Holdings notes. This indebtedness is structurally subordinated to the indebtedness of Preem Petroleum and its subsidiaries. Similarly, the indebtedness of Preem Petroleum is structurally subordinated to the indebtedness of its subsidiaries. The Notes will be contractually subordinated to the senior indebtedness of Preem Petroleum and the Notes and the Guarantee of the Notes by Preem Holdings will be structurally subordinated to the liabilities and obligations of the subsidiaries of Preem Petroleum. The Guarantee will be effectively subordinated to the existing Preem Holdings notes to the extent that the existing Preem Holdings notes are secured.
Shareholder loan. As of December 31, 2003, Preem Holdings owed SEK 242 million to Corral Petroleum Holdings in the form of an interest-free, subordinated shareholder loan, which has no maturity date and may not be repaid while the existing Preem Holdings notes or these Notes are outstanding. See "Description of Certain Indebtedness."
Inter-company loan. As of December 31, 2003, Preem Petroleum owed Preem Holdings SEK 2,277 million in the form of an interest-free, subordinated inter-company loan, which matures on March 31, 2011. See "Description of Certain Indebtedness."
42
Long-Term Financial Obligations and Other Commercial Commitments
The following table summarizes the contractual principal maturities of long-term debt, including its current portion, and our minimum payments required under our capital lease obligations and purchase obligations, each as of December 31, 2003.
| | Payments due by period | |||||||||
|---|---|---|---|---|---|---|---|---|---|---|
| Contractual Obligations | Total | Less than 1 year | 1-3 years | 3-5 years | More than 5 years | |||||
| | (in millions of SEK) | |||||||||
| Shareholder Loan | 242 | — | — | — | 242 | |||||
| Existing Preem Holdings notes | 2,774 | — | — | — | 2,774 | |||||
| Other long-term debt obligations | 2,455 | 555 | 937 | 307 | 656 | |||||
| Capital lease obligations | — | — | — | — | — | |||||
| Operating lease obligations | 547 | 101 | 185 | 166 | 95 | |||||
| Purchase obligations | — | — | — | — | — | |||||
| Bank overdraft facilities | 1 | — | — | — | 1 | |||||
| Other long-term liabilities reflected on our balance sheet | 1 | — | 1 | — | — | |||||
| Total | 6,020 | 656 | 1,123 | 473 | 3,768 | |||||
In connection with the commencement of construction of the isocracker unit, our purchase obligations have increased materially since December 31, 2003. We estimate that the aggregate cost of construction of the isocracker unit will be approximately SEK 3,500 million. Of this amount, we have paid SEK 104 million as of March 31, 2004, and we have present contractual purchase commitments of approximately SEK 1,100 million, of which approximately SEK 500 million will be paid by September 30, 2004.
Restrictions on transfers of funds
Preem Holdings is a holding company. As a holding company, to meet its debt service and other obligations, it is dependent upon contributions, dividends, permitted repayment of debt and other transfers of funds from Preem Petroleum. Substantially all of the present assets of Preem Holdings consist of 100% of the share capital of Preem Petroleum and a loan to Preem Petroleum made in connection with the offering of senior secured notes of Preem Holdings in 2001. The ability of the subsidiaries of Preem Holdings to pay group contributions, dividends and make other payments to it may be restricted by, among other things, applicable corporate and other laws and regulations and by the terms of agreements to which such subsidiaries may be or may become subject.
Quantitative and Qualitative Disclosures About Market Risk
Our primary market risk exposures are commodity price risk, foreign currency risk and interest rate risk.
Commodity Price Risk
Changes in the price of commodities, such as crude oil, can affect our cost of goods sold and the price of our refined products. Commodity price changes can trigger a price effect on inventory, which can affect our revenues, gross profit and operating income. Our inventory management strategies include the purchase and sale of exchange-traded, oil-related futures and options with a duration of twelve months or less. To a lesser extent, we also use oil swap agreements similar to those traded on international exchanges such as the International Petroleum Exchange, including crack spreads and crude oil options that, because they contain certain terms, such as point of delivery, customized to the market in which we sell, are better suited to hedge against the specific price movements in our
43
markets. The number of barrels of crude oil and refined products covered by such contracts varies from time to time. We hedge amounts of crude oil and refined products above and below optimal inventory levels, which represent the volumes in stock and in transit within our system. These strategies are designed to minimize, on a short-term basis, our exposure to the risk of fluctuations in crude oil prices and refined product margins. This hedging activity is closely managed and subject to internally established risk standards. The results of these hedging activities are recognized in our financial statements as adjustments to the refining costs of sales and inventory costs.
Fluctuations in the crude oil price have been significant over the last three years. The three-year low of the monthly average dated Brent crude oil price (free on board, Rotterdam) during this period was $18.68/barrel in December 2001, while the three-year high was $32.68/barrel in February 2003. Monthly average prices decreased by as much as $5.08/barrel from September to October 2001, by $4.66/barrel from November to December 2002 and by $5.68 from March to April 2003.
Our revenues and cash flows, as well as estimates of future cash flows are sensitive to changes in energy prices. Major shifts in the cost of crude oil and the price of refined products can result in significant changes in the operating margin from refining operations. Energy prices also determine the carrying value of our inventory.
We enter into commodity derivative contracts from time to time, to manage our price exposure to our inventory positions and our purchases of foreign crude oil in the refining process, and to fix margins on certain future production. The commodity derivative contracts may take the form of futures contracts, collars or price swaps and are entered into with reputable counter-parties. Gains and losses on futures contracts, realized and unrealized, are recognized in cost of goods sold at the time the contract is bought or sold (marked to market).
- •
- Hedging Activities/Hedge of Inventory: As of December 31, 2003, we had a short position in derivative contracts of Brent crude oil and oil products of 351 000 m3. The unrealized profit on December 31, 2003 was SEK 16 million compared to an unrealized loss of SEK 54 million on December 31, 2002.
- •
- Trading Activities: As of December 31, 2003, the following commodity derivative contract was not treated as a hedge: a long position on trading of 1000 m3. The unrealized profit on December 31, 2003 was SEK 12 million compared to SEK 0.04 million on December 31, 2002.
- •
- Hedging Activities/Hedge of refining margin: As of December 2003, 23 million barrels of the year 2004 refinery production was secured at a refining margin of $2.636 per barrel. The unrealized loss on December 31, 2003 was SEK 110 million compared to SEK 170 million on December 31, 2002. The currency components in the hedge activities of refining margin have been hedged. The unrealized profit relating to this currency component on December 31, 2003 was SEK 29 million compared to SEK 9 million on December 31, 2002. We entered into these hedging arrangements, which covered some of our production in 2003 and 2004, to secure cash flow during a time with significant expected cash requirements. In August 2003, we decided to end our practice of entering into hedging arrangements with respect to our refining margins, primarily because our refining margins have been, and we expect them to continue to be in the near future, relatively high. The hedging arrangements that we currently have in place for our 2004 production were in place at the time of this decision. These current arrangements will terminate on December 31, 2004.
Foreign Currency Risk
We primarily use forward exchange contracts and, to a lesser extent, currency options and currency swaps to manage our foreign currency risk. See "—Fluctuations in Foreign Currency Exchange Rates" for a discussion of our exposure to changes in the dollar-krona and euro-krona exchange rates.
44
The following table provides a breakdown by currency of our revenues and expenses for 2001, 2002 and 2003.
| | Year ended December 31, | ||||||||||||
|---|---|---|---|---|---|---|---|---|---|---|---|---|---|
| | 2001 | 2002 | 2003 | ||||||||||
| Currency | |||||||||||||
| Revenues | Expenses | Revenues | Expenses | Revenues | Expenses | ||||||||
| Krona | 37 | % | 23 | % | 30 | % | 20 | % | 28 | % | 19 | % | |
| Dollar | 63 | % | 77 | % | 70 | % | 80 | % | 72 | % | 81 | % | |
| Total | 100 | % | 100 | % | 100 | % | 100 | % | 100 | % | 100 | % | |
The following table provides a breakdown by currency of our variable-rate and fixed-rate indebtedness as of December 31, 2003.
| | Variable-Rate | Fixed-Rate | ||
|---|---|---|---|---|
| Krona | SEK 974 million | SEK 535 million | ||
| Dollar | $25 million | $105 million | ||
| Euro | — | €305 million |
The table below presents, as of December 31, 2003 and 2002, a summary of our financial instruments by functional currency and expected maturity dates, which are derived from our audited annual consolidated financial statements included elsewhere in this offering memorandum.
| | 2003 SEK | 2004 SEK | 2005 SEK | 2006 SEK | 2007 SEK | 2008 SEK | Thereafter SEK | Total Value(1) SEK | % of Total Long-Term Debt SEK | Estimated Fair Value | |||||||||||
|---|---|---|---|---|---|---|---|---|---|---|---|---|---|---|---|---|---|---|---|---|---|
| | (in millions, except percentages) | ||||||||||||||||||||
| Krona-denominated indebtedness as of December 31, 2003: | |||||||||||||||||||||
| Fixed rate debt—amount due | — | — | — | — | 300 | — | 235 | 535 | 10 | % | 573 | ||||||||||
| Variable rate debt—amount due | — | 555 | 187 | 204 | 3 | 4 | 21 | 974 | 19 | % | 974 | ||||||||||
| Dollar-denominated indebtedness as of December 31, 2003: | |||||||||||||||||||||
| Fixed rate debt—amount due | — | — | — | 364 | — | — | 400 | 764 | 15 | % | 844 | ||||||||||
| Variable rate debt—amount due | — | — | 182 | — | — | — | — | 182 | 3 | % | 182 | ||||||||||
| Euro-denominated indebtedness as of December 31, 2003: | |||||||||||||||||||||
| Fixed rate debt—amount due | — | — | — | — | — | — | 2,774 | 2,774 | 53 | % | 2,823 | ||||||||||
- (1)
- Includes current portion.
45
| | 2003 SEK | 2004 SEK | 2005 SEK | 2006 SEK | 2007 SEK | 2008 SEK | Thereafter SEK | Total Value(1) SEK | % of Total Long-Term Debt SEK | Estimated Fair Value | |||||||||||
|---|---|---|---|---|---|---|---|---|---|---|---|---|---|---|---|---|---|---|---|---|---|
| | (in millions, except percentages) | ||||||||||||||||||||
| Krona-denominated indebtedness as of December 31, 2002: | |||||||||||||||||||||
| Fixed rate debt—amount due | — | — | — | — | 300 | — | 235 | 535 | 9 | % | 574 | ||||||||||
| Variable rate debt—amount due | 550 | 701 | 259 | 204 | 3 | 4 | 21 | 1,742 | 28 | % | 1,742 | ||||||||||
| Dollar-denominated indebtedness as of December 31, 2002 | |||||||||||||||||||||
| Fixed rate debt—amount due | — | — | — | 441 | — | — | 486 | 927 | 15 | % | 1,006 | ||||||||||
| Variable rate debt—amount due | — | — | 221 | — | — | — | — | 221 | 4 | % | 221 | ||||||||||
| Euro-denominated indebtedness as of December 31, 2002: | |||||||||||||||||||||
| Fixed rate debt—amount due | — | — | — | — | — | — | 2,678 | 2,678 | 44 | % | 2,316 | ||||||||||
- (1)
- Includes current portion.
Interest Rate Risk
In the normal course of our business, we hold various financial instruments that expose us to the risk of loss arising from changes in the market interest rates. We use interest rate swaps to manage our interest rate risk, but did not have any open position at either December 31, 2003 or December 31, 2002. As of December 31, 2003, SEK 4,073 million of our indebtedness required payment at fixed rates and SEK 1,156 million required payment at variable rates. As of December 31, 2002, SEK 4,140 million of our indebtedness required payment at fixed rates and SEK 1,963 million required payment at variable rates.
The table below presents, as of December 31, 2003 and 2002, principal cash flows and related weighted average interest rates by expected maturity dates, which are derived from our audited annual consolidated financial statements included elsewhere in this offering memorandum.
| | 2003 SEK | 2004 SEK | 2005 SEK | 2006 SEK | 2007 SEK | 2008 SEK | Thereafter SEK | Total Value SEK | % of Total Long-Term Debt(1) | Estimated Fair Value SEK | |||||||||||
|---|---|---|---|---|---|---|---|---|---|---|---|---|---|---|---|---|---|---|---|---|---|
| | (in millions, except percentages) | ||||||||||||||||||||
| As of December 31, 2003: | |||||||||||||||||||||
| Fixed rate debt—amount due | — | — | — | 364 | 300 | — | 3,409 | 4,073 | 78 | % | 4,240 | ||||||||||
| Weighted average interest rate | — | — | — | 5.6 | % | 6.4 | % | — | 9.8 | % | 9.2 | % | — | — | |||||||
| Variable rate debt—amount due | — | 555 | 369 | 204 | 3 | 4 | 21 | 1,156 | 22 | % | 1,156 | ||||||||||
| Weighted average interest rate | — | 3.2 | % | 2.6 | % | 3.3 | % | 3.9 | % | 3.9 | % | 3.9 | % | 3.0 | % | — | — | ||||
| As of December 31, 2002: | |||||||||||||||||||||
| Fixed rate debt—amount due | — | — | — | 441 | 300 | — | 3,399 | 4,140 | 68 | % | 3,896 | ||||||||||
| Weighted average interest rate | — | — | — | 5.6 | % | 6.4 | % | — | 9.7 | % | 8.9 | % | — | — | |||||||
| Variable rate debt—amount due | 550 | 701 | 480 | 204 | 3 | 4 | 21 | 1,963 | 32 | % | 1,963 | ||||||||||
| Weighted average interest rate | 4.6 | % | 4.5 | % | 3.6 | % | 4.3 | % | 4.4 | % | 4.4 | % | 4.4 | % | 4.3 | % | — | — | |||
- (1)
- Includes current portion.
Recently issued accounting standards
U.S. GAAP
In May 2003, the Financial Accounting Standards Board, or FASB, issued the Statement of Financial Accounting Standards, or SFAS, No. 150,Accounting for Certain Financial Instruments with
46
Characteristics of both Liabilities and Equity. SFAS No. 150 establishes standards for how an issuer classifies and measures certain financial instruments with characteristics of both liabilities and equity. SFAS No. 150 is effective for financial instruments entered into or modified after May 31, 2003 and otherwise is effective at the beginning of the first interim period beginning after June 15, 2003. The adoption of SFAS No. 150 is not expected to have a material effect on our financial position, results of operations or cash flows.
In December 2003, the FASB issued FASB interpretation No. 46 (revised December 2003),Consolidation of Variable Interest Entities ("FIN 46R") which addresses how a business enterprise should evaluate whether it has a controlling financial interest in an entity through means other than voting rights and accordingly should consolidate the entity. FIN 46R replaces FASB Interpretation No. 46,Consolidation of Variable Interest Entities, which was issued in January 2003. The Company shall apply FIN 46 or FIN 46R to variable interest entities, or VIEs, created after January 31, 2003 by the end of the first reporting period that ends after December 15, 2003. The Company shall apply FIN 46R to all entities no later than the end of the first reporting period that ends after March 15, 2004. For any VIEs that must be consolidated under FIN 46R that were created before January 1, 2004, the assets, liabilities and non-controlling interests of the VIE initially would be measured at their carrying amounts with any difference between the net amount added to the balance sheet and any previously recognized interest being recognized as the cumulative effect of an accounting change. If determining the carrying amounts is not practicable, fair value at the date FIN 46R first applies may be used to measure the assets, liabilities and non-controlling interest of the VIE. The adoption of FIN 46R is not expected to have a material effect on our financial position, results of operations or cash flows.
In November 2002, the Emerging Task Force issued its consensus on EITF 00-21, "Revenue Arrangements with Multiple Deliverables" on an approach to determine whether an entity should divide an arrangement with multiple deliverables into separate units of accounting. According to the EITF, in an arrangement with multiple deliverables, the delivered item(s) should be considered a separate unit of accounting if all of the following criteria are met: (1) the delivered item(s) has value to the customer on a standalone basis; (2) there is objective and reliable evidence of the fair value of the undelivered item(s); and (3) if the arrangement includes a general right of return, delivery or performance of the undelivered item(s) is considered probable and substantially in the control of the vendor. If all the conditions above are met and there is objective and reliable evidence of fair value for all units of accounting in an arrangement, the arrangement consideration should be allocated to the separate units of accounting based on their relative fair values. However, there may be cases in which there is objective and reliable evidence of the fair value(s) of the undelivered item(s) in an arrangement but no such evidence for one or more of the delivered items. In those cases, the residual method should be used to allocate the arrangement consideration. The guidance in this Issue is effective for revenue arrangements entered into in fiscal years beginning after June 15, 2003. Alternatively, entities may elect to report the change in accounting as a cumulative-effect adjustment in accordance with Opinion 20. If so elected, disclosure should be made in periods subsequent to the date of initial application of this consensus of the amount of recognized revenue that was previously included in the cumulative effect adjustment. The adoption of EITF 00-21 is not expected to have a material effect on our financial position and results of operations.
Swedish GAAP
Companies with securities listed on a regulated Swedish market and companies in which there is a significant public interest are required to adopt, as of January 1, 2004, RR 29,Employee benefits, published by the Swedish Financial Accounting Standards Council. The standard is equivalent to IAS 19.
The adoption of RR 29 and IAS 19 means that all post-employment benefit plans have to be classified as defined contribution plans or defined benefit plans. In a defined contribution plan the
47
contribution payable is recognized as an expense. In a defined benefit plan the company recognizes the present value of the provision and an expense based on a number of assumptions relating to, for example, future salary-increase and inflation. The change in the pension liability on first adopting the new standard is charged directly to equity and management estimates the difference to be approximately SEK 60 million.
Critical accounting policies
Our consolidated financial statements are prepared in accordance with Swedish GAAP, which differs in certain significant respects from U.S. GAAP. The principle differences between Swedish GAAP and U.S. GAAP are discussed in "Selected Consolidated Financial Data" included elsewhere in this offering memorandum, as well as in note 26 to our audited annual consolidated financial statements, also included elsewhere in this offering memorandum.
The preparation of our consolidated financial statements requires the use of estimates, judgments and assumptions that affect the reported amounts of assets, liabilities and provisions at the date of the financial statements and the reported amounts of revenues and expenses during the periods presented. We have identified the accounting policies discussed below as the most critical policies upon which our financial status depends. We believe that these critical accounting policies involve management's most complex or subjective judgments and estimates used in the preparation of our consolidated financial statements that could impact our financial results.
Impairment of long-lived assets
We review long-lived assets used in our business on an annual basis for impairment, or whenever events or changes in circumstances indicate that the carrying amount of an asset or a group of assets may not be recoverable. An impaired asset is written down to its estimated fair value. We estimate fair value based on independent appraisals and projected cash flows discounted at a rate determined by management to be commensurate with our business risk. The estimation of fair value using these methods is subject to numerous uncertainties, which require our significant judgment when making assumptions of revenues, operating costs, selling and administrative expenses, interest rates and general economic business conditions, among other factors.
Capitalized Turnaround Costs
We record the cost of major scheduled refinery maintenance ("turnarounds") as deferred charges. We amortize these deferred charges over the expected periods of benefit, generally ranging from two to four years. The American Institute of Certified Public Accountants had issued an Exposure Draft for a Proposed Statement of Position, "Accounting for Certain Costs and Activities Related to Property, Plant and Equipment," which would have required major maintenance activities to be expensed as costs are incurred. If this proposed Statement of Position had been adopted, we would have been required to write off the balance of our deferred maintenance costs, which totaled SEK 315 million at December 31, 2003 and expense future costs as incurred. The FASB recently voted not to clear this proposed Statement of Position and will consider adding a project to its agenda to address cost capitalization and depreciation issues.
Inventory
Our inventories are stated at the lower of cost or market. We use the FIFO ("first in, first out") method to determine the cost of our crude oil and refined product inventories. The carrying value of these inventories is sensitive to volatile market prices. If the value of these inventories had been $1 per barrel lower at December 31, 2003, the value of our inventory would have been approximately
48
SEK 140 million lower. If refined product prices decline from the value at the end of a period, then we may be required to write down the value of our inventories in future periods.
Contingencies
We record an estimated loss from a loss contingency when information available prior to issuance of our financial statements indicates that it is probable that an asset has been impaired or a liability has been incurred at the date of the financial statements and the amount of the loss can be reasonably estimated. Accounting for contingencies such as environmental, legal and income tax matters requires us to use our judgment. While we believe that our accruals for these matters are adequate, if the actual loss from a loss contingency is significantly different than the estimated loss, our results of operations may be over- or understated.
Legal Proceedings
We have been and are involved in various legal proceedings incidental to the conduct of our business, including those described below. Except as described below, we are not involved in any legal proceedings that we believe may have, or have had in the recent past, significant effects on our financial position or profitability.
Environmental
We have leased the Finnberget storage depot since 1987, and our lease agreement terminated in September 2001. Our lease agreement has a provision limiting our liability for any decontamination to a maximum of SEK 4 million (€0.4 million). We are in a dispute, however, with the landlord over whether this limitation extends to third-party claims, including claims made by governmental authorities. We filed an application in November 2000 with the Swedish district court asking the court to establish that the contractual limitation extends to third-party claims. If the court does not find in our favor, we may be liable for all or part of the decontamination of this site. In November 2001, the district court declined jurisdiction holding that the matter should be brought in the environmental court. In December 2001, we appealed this decision to the Stockholm Court of Appeals for civil matters. We received a decision in our favor on our appeal. The landlord petitioned for an appeal, which was denied by the Supreme Court. As a result, the case will now be tried in the district court. We expect the trial to commence no earlier than September 2004. The total cost of decontamination depends on the intended future use of the site. The total estimated decontamination cost for future industrial use would be approximately SEK 40 million (€4 million). The total estimated decontamination cost for future housing use would be approximately SEK 75 million (€8 million) to SEK 120 million (€13 million).
In October 2003, the Supreme Environmental Court in Sweden canceled approval of the construction of the isocracker unit at Scanraff. The approval had previously been granted by the Environmental Court of Vänersborg in October 2002. The case was transferred back to the local Environmental Court to reconsider the approval in light of the Supreme Environmental Court's findings. In January 2004, the local Environmental Court again granted approval for the construction of the isocracker unit at Scanraff. We have since recommenced construction of the new isocracker unit. We expect that construction of the new unit will require an investment of approximately SEK 3,500 million (€385 million), of which we have paid SEK 104 million (€11 million) as of March 31, 2004. We expect the unit to become operational in the first half of 2006.
Tax
In November 1998, the Swedish tax authorities charged us additional value added tax, or VAT, and penalties of approximately SEK 64.9 million (€7 million) relating to an audit of our 1994 tax year.
49
The tax authorities' decision to charge us additional VAT on credit card sales related to the alleged unjustified deduction of VAT regarding credit losses and rebates connected to Preem credit card sales in 1994. In December 1998, we appealed the decision of the tax authorities to the County Administrative Court of Stockholm, which ruled in our favor in October 2001. The court confirmed that VAT is to be paid by the end consumer and not by us. In December 2001, the Swedish tax authorities appealed the judgment of the County Administrative Court of Stockholm to the Administrative Court of Appeal in Stockholm and this appeal is pending. Following our successful appeal, we have, in accordance with Swedish GAAP, eliminated the reserve made for the additional VAT in 2001 in the amount of SEK 54 million (€6 million). After the Swedish tax authorities filed their appeal in December 2001, we decided not to reestablish the reserve for this dispute. If the tax authorities' appeal is successful, our VAT liability may be affected for a total of three years.
In December 2003, the Swedish tax authorities charged us additional VAT of SEK 21 million (€2 million) for the 1997 tax year, based on the same rationale as in our dispute with the Swedish tax authorities over additional VAT charges for the 1994 tax year. We have appealed this decision with reference to the decision of the County Administrative Court in Stockholm in our dispute over additional VAT charges for the 1994 tax year.
Competition
On June 29, 2000, the Swedish Competition Authority filed a summons application to the City Court of Stockholm against Preem Petroleum and four other oil companies operating in Sweden, demanding that the City Court impose total fines on all five oil companies of SEK 740 million (€81 million) as a penalty for alleged infringements of the Swedish Competition Act. Of the SEK 740 million (€81 million) in total fines, the Swedish Competition Authority demanded that the City Court impose fines on Preem Petroleum of SEK 85 million (€9 million), which was later adjusted to SEK 81 million (€9 million). The Competition Authority claims that we participated in a cartel on the Swedish market concerning prices and discounts on gasoline during the summer and fall of 1999. Court proceedings took place during the third quarter of 2002 and on April 29, 2003, the District Court of Stockholm announced its judgment, finding that the five companies had violated the Competition Act. The court assessed Preem Petroleum with a fine of SEK 6 million (€0.7 million). The court also ordered the Competition Authority to pay up to SEK 2.3 million (€0.3 million) of Preem Petroleum's legal fees. Both the Competition Authority and we have appealed the court's judgment.
In addition to the fines imposed by the Swedish courts, the Swedish Competition Act provides the possibility for companies and private parties to recover damages attributable to infringements of the Competition Act, in which case the total amount of our liability would be uncertain. Legal proceedings must be initiated within five years from the date on which the damage occurred. We cannot rule out the possibility of lawsuits from private parties or companies. As of the date of this offering memorandum, no claims have been made or threatened by third parties for damages attributable to our alleged infringements of the Competition Act.
50
Capital Trust Group
Capital Trust SA, through its subsidiaries, provides international merchant and investment banking services. A wholly owned subsidiary of Capital Trust SA acted as our advisor in connection with our offerings of the existing Preem Holdings notes, for which we paid a fee equal to 1.5% of the gross proceeds from the offerings. In addition, Capital Trust has acted as our advisor in connection with the offering of the Notes and the proposed new credit facilities, for which, we will pay fees equal to 1% of the gross proceeds of the offering and 1% of the total amount of financing available under the proposed new credit facilities.
In addition, Capital Trust SA, through its subsidiaries, provided certain technical and advisory services to Corral Petroleum Holdings AB (publ) and since 2001 has provided similar services directly to us. The existing contract governing these services, which Corral Petroleum Holdings assigned to us in January 2002, expires in September 2005. This contract will be automatically renewed after that period on an annual basis unless terminated by either party, and provides for an annual fee of $2.5 million. We also paid Capital Trust a fee of €3.2 million for advisory services it provided in connection with our acquisition of 25% of Scanraff from Hydro R&M Holding AB in December 2003. Mr. John P. Oswald, a director and Chairman of the Board of Preem Holdings and a director of Preem Petroleum and Corral Petroleum Holdings, is a principal shareholder of Capital Trust. Mr. Bassam Aburdene, a director of Preem Petroleum, is also a principal shareholder of Capital Trust. We believe that the foregoing transactions were entered into on terms no less favorable to us than those that could have been obtained from an unrelated third party.
Midroc Scandinavia AB
Midroc Scandinavia AB, a company in which Mr. Al-Amoudi has a majority interest, has provided and continues to provide maintenance and construction services, through its subsidiaries, to Preem Petroleum. For these services, we paid SEK 140 million (€15 million) in 2003 and SEK 137 million (€15 million) in 2002. Many of these services are provided on an as-needed basis. Accordingly, the amounts paid for these services may vary from year to year depending on the amount of services provided. We believe that the foregoing transactions were entered into on terms no less favorable to us than those that could have been obtained from an unrelated third party.
Svenska Petroleum Exploration AB
Svenska Petroleum Exploration AB, which is indirectly wholly owned by Mr. Al-Amoudi, lends funds to Preem Petroleum under a short-term credit facility arrangement. As of December 31, 2003, there was SEK 61 million (€7 million) outstanding under the facility arrangement. Funds lent to Preem Petroleum from Svenska Petroleum Exploration bear interest at a rate equal to the interest rate that Preem Petroleum receives from the bank accounts in which Preem Petroleum deposits the borrowed funds. We believe that the terms of this arrangement are no less favorable to us than terms that could have been obtained from an unrelated third party.
Shareholder loan
Preem Holdings owes SEK 242 million (€27 million) to Corral Petroleum Holdings in the form of an interest-free, subordinated shareholder loan, which has no maturity date and may not be repaid while the existing Preem Holdings notes or these Notes are outstanding. See "Description of Certain Indebtedness."
51
DESCRIPTION OF CERTAIN INDEBTEDNESS
As of December 31, 2003, we had total consolidated indebtedness (consisting of total long-term debt and total current debt, but excluding a shareholder loan from Corral Petroleum Holdings) of SEK 7,797 million (€858 million). We also had amounts available under our unutilized credit facilities of SEK 697 million (€77 million). As of December 31, 2003, our indebtedness bore interest at a weighted average rate per year of 6.6%. As of March 31, 2004, we had total consolidated indebtedness (consisting of total long-term debt and total current debt, but excluding the shareholder loan) of SEK 6,901 million (€759 million). Since December 31, 2003, we have sold our excess inventory and used the proceeds to reduce our indebtedness. As of March 31, 2004, our indebtedness bore interest at a weighted average rate per year of 7.0%. As of March 31, 2004, we have approximately SEK 1,761 million (€194 million) available under our unutilized credit facilities.
Long-term debt
As of December 31, 2003, we had long-term debt (excluding SEK 555 million of the current portion of long-term debt and the shareholder loan) of SEK 4,675 million. All of this indebtedness is unsecured, except for SEK 38.7 million secured by real estate mortgages and the existing Preem Holdings notes. The following credit facilities relate to long-term debt owed to a variety of banks:
- •
- a $50 million term loan facility to Preem Petroleum, guaranteed by a commercial bank (of which $50 million was outstanding as of December 31, 2003). The loan matures on January 10, 2006.
- •
- a SEK 51.9 million term loan facility to Preem Petroleum, secured by real estate mortgages (of which SEK 38.7 million was outstanding as of December 31, 2003). The loan's planned amortization schedule indicates full amortization on December 15, 2014, but we may repay the loan in March 2005.
- •
- a $55 million term loan facility to Preem Petroleum (of which $55 million was outstanding as of December 31, 2003). The loan matures on June 28, 2010.
- •
- a SEK 150 million term loan facility to Preem Finans AB, a wholly owned subsidiary of Preem Petroleum, guaranteed by Preem Petroleum (of which SEK 150 million was outstanding as of December 31, 2003). The loan matures on June 30, 2004.
- •
- a $25 million revolving credit facility to Preem Finans, guaranteed by Preem Petroleum (of which $25 million was drawn as of December 31, 2003). This facility is available until January 25, 2005.
- •
- a SEK 200 million term loan facility to Preem Finans, guaranteed by Preem Petroleum (of which SEK 83.3 million was outstanding as of December 31, 2003). The loan matures on March 1, 2005.
- •
- a SEK 300 million term loan facility to Preem Finans (of which SEK 300 million was outstanding as of December 31, 2003). The loan matures on March 11, 2007.
- •
- a SEK 200 million term loan facility to Preem Petroleum (of which SEK 200 million was outstanding as of December 31, 2003). The loan matures on December 31, 2006.
- •
- a SEK 235 million term loan facility to Preem Petroleum (of which SEK 235 million was outstanding as of December 31, 2003). The loan matures on March 1, 2010.
- •
- a SEK 1,200 million term loan facility to Syrhåla Handelsbolag (all of which has been drawn and of which SEK 501.2 million was outstanding as of December 31, 2003). The loan matures on February 9, 2005.
52
- •
- the existing Preem Holdings notes, secured by an assignment by way of security of an inter-company loan from Preem Holdings to Preem Petroleum and by a pledge of all of the outstanding share capital of Preem Petroleum (of which €305 million was outstanding as of December 31, 2003). The existing Preem Holdings notes mature on March 31, 2011.
The Existing Preem Holdings Notes
The existing Preem Holdings notes will mature on March 31, 2011 and constitute senior secured debt of Preem Holdings. The existing Preem Holdings notes are secured by a security assignment of the inter-company loan of SEK 2,277 million from Preem Holdings to Preem Petroleum and by a pledge of all of the outstanding share capital of Preem Petroleum. The Notes being offered hereby will mature in 2014 and constitute unsecured senior subordinated debt of Preem Petroleum and benefit from a senior guarantee from Preem Holdings. The terms of the covenants and other provisions applicable to the Guarantor and its restricted subsidiaries contained in the indenture relating to the existing Preem Holdings notes (including, for example, covenants relating to change of control, redemption rights, incurrence of indebtedness, asset disposition, and restricted payments) are substantially similar to those applicable to the Notes. See "Description of Notes."
In addition to the fact that the Notes will be unsecured and are issued by Preem Petroleum, there are important differences between the terms of the Notes and the existing Preem Holdings notes, which, for the most part, relate to the contractual subordination of the Notes and to structuring the Notes to comply with provisions contained in the covenants related to restricted payments, asset sale and limitation on restrictions on distributions from restricted subsidiaries contained in the existing Preem Holdings notes indenture. In addition, the Notes being offered hereby will be structurally senior to the existing Preem Holdings notes but only to the extent that Preem Petroleum does not merge or otherwise transfer assets to Preem Holdings, which it is not prevented from doing by the indenture relating to the Notes. However, the indenture relating to the Notes provides that, if Preem Holdings or Preem Petroleum approves or authorizes the transfer of all or substantially all of Preem Petroleum's assets to Preem Holdings or if either approves or authorizes similar transactions, then, unless Preem Holdings obtains an agreement from the existing Preem Holdings noteholders to become subordinated in right of payment to the Notes, Preem Holdings must make an offer to purchase the Notes. See "Description of Notes—Certain Covenants—Covenant of the Guarantor."
Proposed new credit facility
On April 27, 2004, we signed an appointment letter with SEB Merchant Banking, Skandinaviska Enskilda Banken AB (publ) and Svenska Handelsbanken AB (publ), pursuant to which they are appointed to act, on a best efforts basis, as lead arrangers in connection with proposed new credit facilities for Preem Petroleum as described in a term sheet attached thereto for an approximate amount of €300 million to €355 million. Preem Holdings will act as guarantor under the proposed new credit facilities. We have not yet entered into any definitive documents and the proposed lenders have conditioned their best efforts upon satisfactory completion of due diligence, execution of satisfactory documentation, and successful syndication, among others things. In addition, even if all of the foregoing are satisfied, draw downs will require investment of additional equity and satisfaction of certain other conditions. For more information about the proposed new credit facilities, see "Operating and Financial Review and Prospects—Liquidity and Capital Resources—Future Capital Needs and Resources."
Bank overdraft
As of December 31, 2003, we had drawings of SEK 1 million under an overdraft facility of SEK 246 million.
53
Current debt
As of December 31, 2003, we had current debt of SEK 3,122 million (including SEK 555 million of the current portion of long-term debt), and SEK 452 million available under our unutilized short-term credit facilities.
€170 million of our current debt is in the form of a bridge loan from a group of Swedish banks to Preem Petroleum and Preem Finans, guaranteed by Preem Holdings and Preem Petroleum. The obligations of Preem Finans under the bridge loan are secured by a floating charge over the assets of Preem Finans in the amount of SEK 1,000 million. The bridge loan matures on June 11, 2004. The interest rate on the bridge loan is equal to EURIBOR plus a margin of 2.25% for the first three months or 2.75% following the first three months, plus certain standard mandatory costs. Our other current debt bore interest at a weighted-average rate of 4.1% as of December 31, 2003. We intend to repay the bridge loan with proceeds from the proposed new credit facilities. See "Risk Factors—If the proposed new credit facilities are not available to us in the time contemplated, or at all, we would have to use a portion of the proceeds of the offering of the Notes to repay the bridge loan, which matures on June 11, 2004, we may have to postpone construction of the isocracker and our liquidity would be adversely affected." We are in the process of obtaining a waiver from the lending banks under the bridge loan with respect to certain provisions of the bridge loan, which we must obtain prior to the closing of this offering. The waiver, which we expect to receive shortly, will provide that the bridge loan will be amended, effective as of the closing of the offering of the Notes, to prohibit Preem Holdings and Preem Petroleum, without the prior consent of the lending banks, from (i) exercising any right to redeem the Notes prior to their stated final maturity date, (ii) making any payments on the Notes in connection with a Change of Control Offer, (iii) exercising any right of legal or covenant defeasance with respect to the Notes, and (iv) amending the terms of the indenture relating to the Notes.
Our current debt of SEK 2,567 million (which excludes the current portion of our long-term debt) does not include the SEK 61 million borrowed under the short-term credit facility arrangement with Svenska Petroleum Exploration, a company that is wholly owned by Mr. Al-Amoudi. This SEK 61 million is listed under "other liabilities" in note 20 in our audited annual consolidated financial statements, included elsewhere in this offering memorandum.
Shareholder loan
Preem Holdings owes SEK 242 million to Corral Petroleum Holdings in the form of an interest-free, subordinated shareholder loan, which has no maturity date and may not be repaid while the existing Preem Holdings notes or these Notes are outstanding. The shareholder loan has been contractually subordinated to the existing Preem Holdings notes and to Preem Holdings's guarantee of the Notes. The shareholder loan cannot be amended without the prior consent of the trustee for the existing Preem Holdings notes and the trustee for these Notes.
Inter-company loan
Preem Petroleum owes Preem Holdings SEK 2,277 million in the form of an interest-free, subordinated inter-company loan, which matures on March 31, 2011, the same date on which the existing Preem Holdings notes mature, and is subject to a 179-day standstill period. The inter-company loan has been pledged to the trustee for the existing Preem Holdings notes as security for the obligations of Preem Holdings under the existing Preem Holdings notes. The inter-company loan cannot be amended without the prior consent of the trustee for the existing Preem Holdings notes.
54
| Consolidated Financial Statements—Preem Holdings AB (publ) | ||
Report of independent accountants | F-2 | |
Consolidated statements of operations for the years ended December 31, 2003, 2002 and 2001 | F-3 | |
Consolidated balance sheets as of December 31, 2003 and 2002 | F-4 | |
Consolidated statements of cash flows for the years ended December 31, 2003, 2002 and 2001 | F-6 | |
Notes to the consolidated financial statements | F-8 |
F-1
REPORT OF INDEPENDENT ACCOUNTANTS
The Board of Directors and Shareholders
Preem Holdings AB (publ)
We have audited the consolidated balance sheets of Preem Holdings AB and subsidiaries as of December 31, 2002 and 2003, and the related consolidated statements of operations and cash flows for each of the years in the three-year period ended December 31, 2003. These consolidated financial statements are the responsibility of the Company's management. Our responsibility is to express an opinion on these consolidated financial statements based on our audits.
We conducted our audits in accordance with generally accepted auditing standards in Sweden and in the United States of America. Those standards require that we plan and perform the audit to obtain reasonable assurance about whether the financial statements are free of material misstatement. An audit includes examining, on a test basis, amounts and disclosures in the financial statements. An audit also includes assessing the accounting principles used and significant estimates made by management as well as evaluating the overall financial statement presentation. We believe that our audits provide a reasonable basis for our opinion.
In our opinion, the consolidated financial statements referred to above present fairly, in all material respects, the financial position of Preem Holdings AB and subsidiaries as of December 31, 2002 and 2003, and the results of their operations and their cash flows for each of the years in the three-year period ended December 31, 2003, in conformity with generally accepted accounting principles in Sweden.
Generally accepted accounting principles in Sweden vary in certain significant respects from generally accepted accounting principles in the United States of America. Information relating to the nature and effect of such differences is summarized in Note 26 to the consolidated financial statements.
Stockholm, Sweden
April 16, 2004
| /s/ ROLAND NILSSON Authorized Public Accountant KPMG Bohlins AB | /s/ CRONIE WALLQUIST Authorized Public Accountant KPMG Bohlins AB |
F-2
Preem Holdings AB and Subsidiaries
Consolidated Statements of Operations
Years ended December 31, 2001, 2002 and 2003
| | Year ended December 31, | ||||||||
|---|---|---|---|---|---|---|---|---|---|
| | 2001 | 2002 | 2003 | 2003 (unaudited—Note 1) | |||||
| | SEK | SEK | SEK | $ | |||||
| | |||||||||
| | (in millions) | ||||||||
| Revenues (Note 2) | 46,697 | 42,178 | 43,030 | 5,911 | |||||
| Excise duties | (10,288 | ) | (8,855 | ) | (8,241 | ) | (1,132 | ) | |
| Sales revenue (Note 2) | 36,409 | 33,323 | 34,789 | 4,779 | |||||
| Cost of goods sold (Note 3) | (34,799 | ) | (31,952 | ) | (33,303 | ) | (4,575 | ) | |
| Gross profit | 1,610 | 1,371 | 1,486 | 204 | |||||
| Selling expenses | (943 | ) | (914 | ) | (812 | ) | (112 | ) | |
| Administrative expenses | (474 | ) | (479 | ) | (479 | ) | (66 | ) | |
| Other operating income (Note 5) | 268 | 252 | 268 | 37 | |||||
| Other operating expenses | — | (3 | ) | (10 | ) | (1 | ) | ||
| Operating income (Notes 4, 6 and 21) | 461 | 227 | 453 | 62 | |||||
| Interest income (Note 7) | 93 | 47 | 40 | 6 | |||||
| Other financial income (Note 7) | (2 | ) | (102 | ) | 2 | 0 | |||
| Interest expense (Note 7) | (491 | ) | (478 | ) | (456 | ) | (63 | ) | |
| Other financial expenses (Note 7) | (267 | ) | 342 | 266 | 37 | ||||
| Income (loss) before taxes and minority interests | (206 | ) | 36 | 305 | 42 | ||||
| Income taxes (Note 8) | (15 | ) | (180 | ) | (77 | ) | (11 | ) | |
| Minority interests | (12 | ) | (4 | ) | (2 | ) | 0 | ||
| Net profit (loss) (note 9) | (233 | ) | (148 | ) | 226 | 31 | |||
The accompanying notes form an integral part of these Consolidated Financial Statements.
F-3
Preem Holdings AB and Subsidiaries
Consolidated Balance Sheets
As of December 31, 2002 and 2003
| | As of December 31, | |||||
|---|---|---|---|---|---|---|
| | 2002 | 2003 | 2003 (unaudited—Note 1) | |||
| | SEK | SEK | $ | |||
| | ||||||
| | | (in millions) | | |||
| ASSETS | ||||||
| Fixed assets | ||||||
| Intangible fixed assets (Note10) | ||||||
| Goodwill, net | 1,072 | 829 | 114 | |||
| Total intangible assets | 1,072 | 829 | 114 | |||
| Tangible assets (Note 11) | ||||||
| Land and building, net | 762 | 834 | 115 | |||
| Plant and machinery, net | 3,786 | 5,496 | 755 | |||
| Capitalized turnaround cost, net | 207 | 315 | 43 | |||
| Equipment, tools fixtures and fittings, net | 681 | 720 | 99 | |||
| Construction in progress | 291 | 291 | 40 | |||
| Total tangible fixed assets | 5,727 | 7,656 | 1,052 | |||
| Financial assets | ||||||
| Participations in associated companies (Note 13) | 5 | 5 | 1 | |||
| Receivables from associated companies | — | 0 | 0 | |||
| Other securities held as fixed assets (Note 14) | 2 | 2 | 0 | |||
| Other long-term receivables | 116 | 103 | 13 | |||
| Total financial assets | 123 | 110 | 14 | |||
| Total fixed assets | 6,922 | 8,595 | 1,180 | |||
| Current assets | ||||||
| Inventories (Note 15) | 3,523 | 4,679 | 643 | |||
| Accounts receivable | 3,684 | 2,947 | 405 | |||
| Receivables from associated companies | 1 | 0 | 0 | |||
| Other receivables | 337 | 221 | 30 | |||
| Prepaid expenses and accrued income | 254 | 218 | 30 | |||
| 7,799 | 8,065 | 1,108 | ||||
| Cash and cash equivalents | 461 | 633 | 87 | |||
| Total current assets | 8,260 | 8,698 | 1,195 | |||
| TOTAL ASSETS | 15,182 | 17,293 | 2,375 | |||
The accompanying notes form an integral part of these Consolidated Financial Statements.
F-4
Preem Holdings AB and Subsidiaries
Consolidated Balance Sheets
As of December 31, 2002 and 2003
| | As of December 31, | |||||
|---|---|---|---|---|---|---|
| | 2002 | 2003 | 2003 (unaudited—Note 1) | |||
| | SEK | SEK | $ | |||
| | (in millions) | |||||
| SHAREHOLDERS' EQUITY, PROVISIONS AND LIABILITIES | ||||||
| Shareholders' equity (Note 16) | ||||||
| Restricted equity | ||||||
| Share capital | 1 | 1 | 0 | |||
| Restricted reserves | 0 | 0 | 0 | |||
| Non-restricted equity | ||||||
| Profit brought forward | 3,074 | 3,272 | 450 | |||
| Profit/(Loss) for the year | (148 | ) | 226 | 31 | ||
| Total shareholders' equity | 2,927 | 3,499 | 481 | |||
| Minority interests | 8 | 8 | 1 | |||
| Provisions | ||||||
| Pension provision | 157 | 147 | 20 | |||
| Deferred tax liability (Note 17) | 396 | 839 | 115 | |||
| Other provisions | 53 | 6 | 1 | |||
| Total provisions | 606 | 992 | 136 | |||
| Liabilities | ||||||
| Long-term liabilities | ||||||
| Shareholder loans (Note 18) | 242 | 242 | 33 | |||
| Bond loan (Note 18) | 2,678 | 2,774 | 381 | |||
| Liabilities to credit institutions (Note 18) | 2,875 | 1,900 | 261 | |||
| Bank overdraft facility (Note 18) | — | 1 | 0 | |||
| Other long-term liabilities | 0 | 1 | 0 | |||
| Total long-term liabilities | 5,795 | 4,918 | 675 | |||
| Current liabilities | ||||||
| Liabilities to credit institutions (Note 19) | 771 | 3,122 | 429 | |||
| Advanced payment from customers | 159 | 164 | 23 | |||
| Accounts payable | 1,883 | 1,716 | 236 | |||
| Liabilities to parent company | 356 | 11 | 1 | |||
| Liabilities to associated companies | 1 | 1 | 0 | |||
| Income tax payable | 8 | 6 | 1 | |||
| Other liabilities (Note 20) | 1,556 | 1,349 | 185 | |||
| Accrued expenses and prepaid income (Note 20) | 1,112 | 1,507 | 207 | |||
| Total current liabilities | 5,846 | 7,876 | 1,082 | |||
| TOTAL SHAREHOLDERS' EQUITY, PROVISIONS AND LIABILITIES | 15,182 | 17,293 | 2,375 | |||
The accompanying notes form an integral part of these Consolidated Financial Statements.
F-5
Preem Holdings AB and Subsidiaries
Consolidated Statements of Cash Flows
Years ended December 31, 2001, 2002 and 2003
| | Year ended December 31, | ||||||||
|---|---|---|---|---|---|---|---|---|---|
| | 2001 | 2002 | 2003 | 2003 (unaudited—Note 1) | |||||
| | SEK | SEK | SEK | $ | |||||
| | (in millions) | ||||||||
| Income from operation | |||||||||
| Income/(Loss) before taxes and minority interests | (206 | ) | 36 | 305 | 42 | ||||
| Adjustments for non-cash items | |||||||||
| Depreciation and amortization | 826 | 846 | 881 | 121 | |||||
| Non-cash pension refund | 2 | — | 3 | 0 | |||||
| Unrealized exchange (gains) losses | 231 | (429 | ) | (316 | ) | (43 | ) | ||
| Deferred charges | 88 | 12 | 12 | 2 | |||||
| Provisions | (66 | ) | (2 | ) | (47 | ) | (6 | ) | |
| Gain on repurchased bonds | — | (23 | ) | — | — | ||||
| Gain on sale of subsidiaries | — | (1 | ) | — | — | ||||
| Loss on sale of fixed assets | 2 | 2 | 38 | 5 | |||||
| 877 | 441 | 876 | 121 | ||||||
| Taxes paid | (57 | ) | (17 | ) | (4 | ) | (1 | ) | |
| Cash flow in working capital | 820 | 424 | 872 | 120 | |||||
Decrease (Increase) in inventories | 765 | 152 | (1,143 | ) | (157 | ) | |||
| Decrease (Increase) in current receivables | 550 | (429 | ) | 935 | 128 | ||||
| (Decrease) Increase in liabilities | 479 | 47 | (247 | ) | (34 | ) | |||
| Cash flow from operating activities | 2,614 | 194 | 417 | 57 | |||||
Investment activities | |||||||||
| Acquisition of subsidiaries net of cash acquired | 357 | 136 | (1,067 | ) | (146 | ) | |||
| Investment in intangible fixed assets | 0 | (1 | ) | 0 | 0 | ||||
| Investment in tangible fixed assets | (588 | ) | (1,028 | ) | (720 | ) | (99 | ) | |
| Sale of tangible fixed assets | 21 | 6 | 13 | 2 | |||||
| Sale of subsidiaries net of cash disposed | — | (123 | ) | — | — | ||||
| (Increase)Decrease in long-term receivables | (121 | ) | 2 | 2 | 0 | ||||
| Cash flow used in investment activities | (331 | ) | (1,008 | ) | (1,772 | ) | (243 | ) | |
Financing activities | |||||||||
| Shareholders contribution received | — | 8 | — | — | |||||
| New loans from credit institutions | 3,455 | 825 | 3,379 | 464 | |||||
| Loans granted | (212 | ) | — | — | — | ||||
| Payment of loans from credit institution | (3,581 | ) | (404 | ) | (1,972 | ) | (271 | ) | |
| Repurchase of bonds | — | (107 | ) | — | — | ||||
| Issuance of bonds | — | — | 122 | 17 | |||||
| Dividend paid | — | (3 | ) | (2 | ) | 0 | |||
| Group contributions received/(paid) | (1,000 | ) | — | — | — | ||||
| Cash flow (used in) provided by financing activities | (1,338 | ) | 319 | 1,527 | 210 | ||||
| Cash flow of the year | 945 | (495 | ) | 172 | 24 | ||||
| Cash and cash equivalents at the beginning of the year | — | 959 | 461 | 63 | |||||
| Exchange rate difference in cash | 14 | (3 | ) | 0 | 0 | ||||
| Cash and cash equivalents at the end of the year | 959 | 461 | 633 | 87 | |||||
The accompanying notes form an integral part of these Consolidated Financial Statements.
F-6
Preem Holdings AB and Subsidiaries
Consolidated Statements of Cash Flows
Years ended December 31, 2001, 2002 and 2003
| | Year ended December 31, | ||||||||
|---|---|---|---|---|---|---|---|---|---|
| | 2001 | 2002 | 2003 | 2003 (unaudited—Note 1) | |||||
| | SEK | SEK | SEK | $ | |||||
| | (in millions) | ||||||||
| Supplementary disclosures | |||||||||
| Cash flow interest and dividend received | |||||||||
| Interest received | 91 | 47 | 37 | 5 | |||||
| Interest paid | (411 | ) | (476 | ) | (448 | ) | (62 | ) | |
Cash and cash equivalents | |||||||||
| Cash and bank balances | 758 | 264 | 282 | 39 | |||||
| Short-term investment | 201 | 197 | 351 | 48 | |||||
| Total cash and cash equivalents | 959 | 461 | 633 | 87 | |||||
Acquisition of subsidiaries | |||||||||
| Intangible fixed assets | 3,527 | — | — | — | |||||
| Tangible fixed assets | 5,305 | — | 1,900 | 261 | |||||
| Financial fixed assets | 248 | — | 1 | 0 | |||||
| Inventories | 4,495 | — | 14 | 2 | |||||
| Current receivables | 3,880 | — | 23 | 3 | |||||
| Liquid funds | 370 | 320 | 0 | 0 | |||||
| Total assets | 17,825 | 320 | 1,938 | 266 | |||||
Provisions | (560 | ) | (125 | ) | (372 | ) | (51 | ) | |
| Loans | (6,529 | ) | — | (416 | ) | (57 | ) | ||
| Liabilities | (5,209 | ) | (11 | ) | (83 | ) | (12 | ) | |
| Total provisions and liabilities | (12,298 | ) | (136 | ) | (871 | ) | (120 | ) | |
| Purchase price | (5,527 | ) | (184 | ) | (1,067 | ) | (147 | ) | |
| Offset by shareholders' loan | 5,514 | — | — | — | |||||
Purchase price paid | (13 | ) | (184 | ) | (1,067 | ) | (147 | ) | |
| Deduction for: Liquid funds in the acquired business | 370 | 320 | 0 | 0 | |||||
| Impact on liquid funds | 357 | 136 | (1,067 | ) | (147 | ) | |||
Sale of subsidiaries | |||||||||
| Intangible fixed assets | — | 1 | — | — | |||||
| Tangible fixed assets | — | 88 | — | — | |||||
| Inventories | — | 64 | — | — | |||||
| Current receivables | — | 326 | — | — | |||||
| Liquid funds | — | 138 | — | — | |||||
| Total assets | — | 617 | — | — | |||||
Minority | — | (10 | ) | — | — | ||||
| Provisions | — | (1 | ) | — | — | ||||
| Loans | — | 1 | — | — | |||||
| Liabilities | — | (392 | ) | — | — | ||||
| Total provisions and liabilities | — | (402 | ) | — | — | ||||
Sales price | — | 217 | — | — | |||||
| Deduction for vendor's mortgage | — | (202 | ) | — | — | ||||
| Proceeds of sale | — | 15 | — | — | |||||
| Deduction for liquid funds in the sold operations | — | (138 | ) | — | — | ||||
| Impact on liquid funds | — | (123 | ) | — | — | ||||
The accompanying notes form an integral part of these Consolidated Financial Statements.
F-7
Preem Holdings AB and Subsidiaries
Notes to the Consolidated Financial Statements
Years ended December 31, 2001, 2002 and 2003
Note 1. Summary of significant accounting principles
Amounts are expressed in millions of Swedish Kronor ("MSEK") unless otherwise specified.
Background
Preem Holdings AB (publ) was originally established in 1980 as Labrador Svenska AB and is registered with the Swedish Patent and Registration Office under the number 556206-9673. The name was changed from Labrador Svenska AB to Swedoil AB in September 1981. Swedoil AB was a subsidiary of Preem Petroleum AB that had been dormant since 1983. On March 1, 2001, its name was changed from Swedoil AB to Preem Holdings AB (publ), and its status was changed from a private company to a public company, through amendments to its Articles of Association and its subsequent registration with the Swedish Patent and Registration Office. Following its transformation into a public company, the share capital of Preem Holdings AB consisted of 5,000 authorized shares of common stock with a par value of SEK 100 each, of which 5,000 shares were issued and outstanding and fully paid. Corral Petroleum Holdings AB, a Swedish company, contributed all of the issued and outstanding shares of Preem Petroleum AB to Preem Holdings AB on March 19, 2001. Preem Holdings AB is wholly-owned by Corral Petroleum Holdings AB, which is wholly-owned by Moroncha Holdings Company Limited, which is wholly-owned by Mr. Mohammed Hussein Al-Amoudi.
On April 10, 2001, Preem Holdings AB issued senior secured notes in an aggregate principal amount of €250 million. Preem Holdings AB loaned part of the net proceeds of that offering of notes, which totaled approximately €223 million, to Preem Petroleum AB pursuant to a subordinated intercompany loan denominated in Kronor. Preem Petroleum AB used approximately €220 million of the proceeds received to repay all but approximately €27 million of an existing SEK2,259 million subordinated shareholder loan it owed to Corral Petroleum Holdings AB. The right to receive the remaining unpaid amount was assigned to Preem Holdings AB. The remaining amount of proceeds received by Preem Petroleum AB, approximately €3 million, was used for general corporate purposes.
On July 20, 2001, Preem Holdings AB issued an additional tranche of senior secured notes in an amount of €55 million creating a single series of €305 million aggregate principal amount of 105/8% senior secured notes. Preem Holdings AB distributed approximately €22.5 million of the proceeds from this second offering of notes to Corral Petroleum Holdings AB in the form of two interest-free intercompany loans. The Company has used the remaining proceeds for general corporate purposes.
General accounting principles
The Consolidated Financial Statements have been prepared in accordance with the Swedish Annual Accounts Act, the standards issued by the Swedish Financial Accounting Standards Council and its emerging task force pronouncements.
The accompanying Consolidated Financial Statements present the financial position, results of operations and cash flows of Preem Holdings AB and its consolidated subsidiaries (jointly the "Company" or the "Preem Group"). In the accompanying Consolidated Financial Statements the results of operations and cash flows of Preem Holdings AB for the year ended December 31, 2001 includes the results of operations and cash flows of Preem Petroleum AB for the three months ended March 31, 2001 (the pre-acquisition period). The accompanying Consolidated Financial Statements have been prepared in accordance with generally accepted accounting principles in Sweden ("Swedish
F-8
GAAP"). These accounting principles differ in certain significant respects from accounting principles generally accepted in the United States ("U.S. GAAP"). See Note 26 for information relating to the nature and effect of the principal differences between Swedish GAAP and U.S. GAAP
Solely for the convenience of the reader, the 2003 financial statements have been translated from Swedish Kronor (SEK) into U.S. Dollars ($) at the exchange rate of $1.00=SEK7.28 (the exchange rate on December 31, 2003).
Basis of consolidation and translation
The Consolidated Financial Statements have been prepared in accordance with the purchase method. This method means that assets and liabilities acquired are recorded at fair value at the date when control has passed to the company. The difference between the purchase price and the estimated fair value of the net assets acquired is recorded as goodwill. The net income (loss) of companies acquired during the year are included in the Company's Consolidated Statement of Operations from the date of acquisition and the net income (loss) of companies sold during the year is included through the date of disposal.
The consolidated accounts include Preem Holdings AB and all companies in which Preem Holdings AB directly or indirectly holds more than 50% of the voting capital. Intercompany transactions are eliminated in consolidation.
Assets and liabilities of foreign subsidiaries are translated at year end exchange rates. The income statements of foreign subsidiaries are translated at an average exchange rate for the year. Exchange differences arising out of the translation of the financial statements of foreign subsidiaries are recorded directly to the cumulative translation adjustment component of shareholders' equity.
When foreign subsidiaries and associated companies are divested or liquidated, the accumulated translation difference relating to the divested entity is reported as a realized gain (loss) in the consolidated statement of operations.
Associated Company accounts
The equity accounting method is used for those companies in which the Company has significant influence and/or owns between 20% and 50% of the voting capital (the "Associated Companies"). In the Consolidated Balance Sheet, Associated Companies are reported at the original purchase price together with the Company's share of income (loss) earned after the acquisition. Dividends received are recorded as a reduction of the recorded investment.
The companies in which the Company owns less than 20% are recorded at cost. Dividends received from these companies are recorded in the Consolidated Statement of Operations as financial income.
Joint ventures
Holdings in joint ventures are consolidated according to the proportional method. This method implies that the companies are accounted for as though they were subsidiaries, with the difference that
F-9
only the Group's share in the company's revenues and expenses as well as in the assets and liabilities are reported in the consolidated income statement and balance sheet.
Currency policy
The Company's operations are in principle Dollar-based. Purchases of petroleum products and a large percentage of the Company's sales are made in this currency. This implies that the Company has a long-position in Dollars. This exposure is balanced by loans raised in Dollars. The reporting currency of the Company is Swedish Kronor.
Estimates and assumptions
The preparation of financial statements in accordance with generally accepted accounting principles requires management to make estimates and assumptions that affect the reported amount of assets and liabilities at the date of the financial statements and reported amounts of revenues and expenses during the reporting period. Actual results could differ from management's estimates.
Fixed assets
Fixed assets are valued at the acquisition cost with a deduction for accumulated depreciation. The acquisition cost includes the cost of value-enhancing improvements. Depreciation according to plan is based on the original acquisition values and estimated average economic life. A write-down is made in the event of a permanent reduction in value. Repair and maintenance costs are expensed as incurred.
Interest is capitalized for assets constructed for the Company's use based on the average amount of accumulated expenditures during the construction period using the Company's current available rate of borrowing for the applicable project. Capitalized interest on such assets is then depreciated over the estimated useful life of the respective asset.
Goodwill
Goodwill is amortized over the periods estimated to be benefited using the straight-line method. Goodwill arising from the acquisition of Preem Petroleum AB is amortized over the remaining economic life, approximately 9 years, based on the original goodwill recorded in Corral Petroleum Holdings AB. Preem Petroleum AB's acquisition of the Swedish business of Texaco (in 1989) and BP (in 1991) are judged to have long-term earnings potential and strategic value and are amortized over 15 years. Goodwill is tested for recoverability along with the underlying assets acquired based on expected future cash flows.
Capitalized turnaround costs
A turnaround is a standard procedure periodically required for maintenance of a refinery that involves the shutdown and inspection of major processing units and generally occurs approximately every three to four years. Turnaround costs, which are included in tangible assets, are capitalized when incurred and are amortized over the period to the next scheduled turnaround, beginning the month following completion of each turnaround.
F-10
Environmental costs
Environmental expenditures are expended or capitalized based upon their future economic benefit. Costs, which improve a property's pre-existing condition, and costs that prevent future contamination are capitalized. Costs related to environmental damage resulting from operating activities subsequent to acquisition are expensed. Liabilities for these expenditures are recorded when it is probable that obligations have been incurred and the amount can be reasonably estimated.
Depreciation
Depreciation is calculated on the basis of the historic acquisition cost and the straight-line method of depreciation is used for all assets. The rates of depreciation are based on the economic useful life of the assets as follows:
| Goodwill | 5-15 years | |
| Machinery and equipment | 3-20 years | |
| Capitalized turnaround costs | 3-4 years | |
| Buildings | 20-50 years | |
| Land improvements | 20 years |
Impairment of long-lived assets
The Company reviews long-lived assets used in the business on an annual basis for impairment, or whenever events or changes in circumstances indicate that the carrying amount of an asset or a group of assets may not be recoverable. An impaired asset is written down to its estimated fair market value based on the best information available. Long-lived assets for which management have the authority to approve the action to dispose of the asset, whether by sale or abandonment, are reported at the lower of carrying amount or fair value less cost to sell.
Receivables
Receivables are reported at the amount at which they are expected to be paid. Provisions for doubtful accounts are made as considered necessary.
Receivables and liabilities in foreign currencies
All receivables and liabilities denominated in foreign currencies are translated into Swedish Kronor at year end exchange rates unless the Company has entered into matching forward foreign exchange contracts, in which case the rate specified in the contract is used. The premium or discount arising on these forward exchange contracts is recorded as interest expense or income over the duration of these contracts. All exchange rate gains and losses are reported as part of income from operations except for gains and losses relating to financial assets and liabilities which are reported as a component of financial income (expense), net.
F-11
Inventories
Inventories are valued at the lower of acquisition value, whereby cost is calculated according to the FIFO ("first in, first out") principle, and the net sales value. Inventory purchases of petroleum products in Dollars are accounted for at the exchange rate applicable on the date of the bill of lading. In manufactured products the acquisition value consists of direct production costs and an appropriate share of indirect costs. The net sales value of finished products consists of the estimated sales value reduced by estimated costs for production and estimated sales costs. Concerning crude oil, the replacement cost is used as the best available measure for net sales value. Since the purpose of crude oil holdings is to use it in production, the value of crude oil is not written down below the acquisition value where it is expected that finished products can be sold at a price exceeding the products' acquisition value.
Cash and cash equivalents
The Company considers all highly liquid instruments with an original maturity of three months or less to be cash or cash equivalents.
Short-term investments
Financial instruments included under short-term investments are valued collectively for each type of instrument at the lower of the acquisition value or the market value. Investments in bonds and other interest bearing instruments with a maturity date less than one year are reported as short-term investments. Certificates of Deposits with an original maturity of three months or less are reported under the heading of cash and cash equivalents. Investments that are anticipated to be retained until their maturity date are recorded at the acquisition cost plus accrued interest.
Taxes
Deferred income taxes reflect the impact of temporary differences between the amount of assets and liabilities recognized for financial reporting purposes and such amounts recognized for tax purposes. Provision for deferred taxes is made to the extent that it is more likely than not that a liability or asset will crystallize in the foreseeable future. Tax legislation in Sweden allows companies to defer their current tax liability by making tax-deductible allocations to untaxed reserves. The deferred tax on these reserves is classified as a provision, while the remaining portion is included within restricted reserves in shareholders' equity.
Other provisions
Provisions and contingent liabilities are accounted for in the balance sheet when the company has a formal or informal liability as a result of an occurred event, and it is likely that an outflow of resources is required to settle the liability, and a reliable estimate of the amount can be made. Present value estimates are made to account for the time effect of material future payments.
F-12
Advance payments from customers
Advance payments from customers are accounted for as a current liability until the goods are delivered or the services rendered.
Revenue recognition
A large majority of the Company's revenues is derived from supply and refining of oil products together with the retail market. Revenue is recognized in the period products are delivered.
Interest bearing receivables and liabilities
Interest income and interest expenses are recorded in accordance with the interest rate that the receivable or liability bears on the closing date. The effect on profit of interest instruments designed to hedge a future interest flow, is recorded over the same duration as the underlying receivable or liability.
Leasing—lessee
In the consolidated accounts leasing is categorised as either financial or operational leasing. Financial leasing is defined as leasing where the financial risks and benefits connected to the ownership are essentially transferred to the lessee. Otherwise it is considered an operational leasing.
Assets that are leased according to financial leasing contracts have been reported as assets in the consolidated accounts. The commitment to pay future leasing expenses has been accounted for as long and short term liabilities. These assets are depreciated according to plan while the lease expenses reported as interest and amortization of debt.
Operational leasing implies that the leasing expense is booked as an expense over the lease period, based on usage.
Advertising costs
Advertising costs are expensed as incurred.
Financial risk management and financial instruments
The Company is exposed to various types of financial risks; among them price risk, credit risk, liquidity risk and cash flow risk. The risk management is ruled by group wide policies that are determined by the board of directors. A financial instrument refers to an agreement that is the source of a financial asset or liability.
Risk policy and goal
All activities that are linked with management of risks connected to financial instruments are handled by Preem Petroleum AB. The goal of the Company's activities in derivate products is to protect the Company against unforeseen price changes in priced crude oils and refined products that are used in the refining process. The Company has a defined normal position which is the volume of
F-13
priced oil required to maximize the contribution from the refining system most efficiently without using derivate instruments. The volume is at present 2 087 000 m3. The price risk on this volume is the Company's business risk, accepted by the Board of directors. On these premises the board has defined a number of risk limits that define to what extent the volume exposure can deviate from the normal position, and the maximum risk expressed in USD that the Company is prepared to assume on the sum of these volume deviations from the normal position. As a part of this risk the Company trades in derivative instruments to keep the price exposure within the risk limits set by the Board. Within the frame of these limits the goal is, based on the Company's estimate of the oil market at any given point in time, to increase the financial contribution with the use of notably derivative instruments.
As of December 31, 2003, the Company's outstanding loans, both on long and short term, raised from credit institutes and on the market, amount to SEK7,797 (SEK6,324) million. The tenor of the loans vary depending on the length of the underlying assets financial life. The loans are raised with a mix of variable and fixed interest rates, and the Company's goal is to maintain as low a risk profile as possible at a reasonable cost for the assets financed. The Company pays approximately SEK1,000 million every month in excise duties and VAT, which requires available short term credits. The Company raises loan or pays back loan in USD to minimize the risk of losses in inventories, where the pricing is based on USD.
Price risk
In the Company's operations the price risks of the financial instruments are mainly linked to the market risk, i.e. the risk of unforeseen price changes on the oil market, and the currency risk, i.e. the risk of changes primarily in the value of USD. The currency risk can be divided into transaction risk (income and expenses in different currencies), and translation risk (translation of foreign subsidiaries), where the latter has been materially reduced in 2003 as a result of the divestment of Preem Polska. To minimize the risk of losses in the working capital associated with changes in the value of the USD in relation to SEK the Company raises or pays back loans raised in USD.
Interest rate risk
Concerning the Company's loans from credit institutes, the interest rate risk is balanced through a combination of loans at fixed interest rate and loans at floating interest.
Credit risk
The Company is exposed to the risk of not receiving payment from any of the large number of customers to which sales are made on credit. To limit the risk there are group-wide credit policies.
Liquidity and financing risk
The financing risk consists of the risk that a considerable credit requirement arises in a strained credit market situation. To ensure that the Company at all times has access to external financing, promise of credit, both short term and long term, must always be available. The lender base must also be reasonably diversified to avoid dependence on any single financing source.
F-14
Cash flow risk
Purchase of petroleum products and a considerable portion of the sales are made in USD. This implies that the Company has a so called long position in USD. The exposure is balanced by loans raised in USD. Forward contracts, options and swap agreements in oil products have been valued at the market price of the accounting year-end. The difference between acquisition price and market price of the closing day has impacted the operating profit and the balance sheet.
The Company uses various financial derivative instruments to manage financial exposure. The Company classifies these instruments as hedges for accounting purposes when the following criteria are met:
- •
- The instrument must relate to foreign currency assets, liabilities, firm commitments or anticipated probable future transactions for which the terms have been identified. Forward exchange contracts cannot be used to hedge anticipated probable future transactions.
- •
- The instrument must be in the same currency as the hedged balance sheet item or transaction, and
- •
- The instrument must reduce the risk to which the Company is exposed with regard to changes in foreign exchange rates.
- •
- The instrument must relate to firm commitments or anticipated probable future transactions for which the terms have been identified.
- •
- The instrument must correlate with the future transactions so that the Company's exposure to change in crude oil prices is effectively reduced.
Currency derivative instruments
Oil instruments
Unrealized gains and losses are included in the income statement when the underlying transaction actually occurs if the financial instrument is designated and effective as a hedge for such underlying transaction. The Company reviews the correlation and effectiveness of its financial instruments on a periodic basis. Financial instruments that do not meet the criteria for hedge accounting treatment are marked-to-market with the resulting unrealized gain or loss recorded as cost of goods sold in the Consolidated Statement of Operations.
Realized gains and losses that result from the early termination of financial instruments used for hedging purposes are deferred and are included in (i) the determination of the carrying value of the underlying asset or liability in the consolidated balance sheet, or (ii) the Consolidated Statement of Operations when the anticipated transaction actually occurs. If any underlying asset or liability is sold or settled, any related financial instrument is marked-to-market and the resulting unrealized gain or loss is recorded as part of the gain or loss on the sale or settlement of the underlying item.
Premiums paid for the purchase of foreign currency and interest rate options are recorded as a prepaid expense in the Consolidated Balance Sheet and are amortized as an adjustment of the underlying revenue or expense item over the duration of the option contract.
F-15
The table below shows the carrying values and the fair values of the Company's financial instruments;
| | As of December 31, | |||||||
|---|---|---|---|---|---|---|---|---|
| | 2002 | 2003 | ||||||
| | Carrying value | Fair value | Carrying Value | Fair value | ||||
| Assets | ||||||||
| Long-term financial assets | 123 | 123 | 110 | 110 | ||||
| Receivables | 3,684 | 3,684 | 2,947 | 2,947 | ||||
| Other short term receivables | 338 | 338 | 221 | 221 | ||||
| Accrued income | 120 | 120 | 75 | 75 | ||||
| Oil swaps | — | — | 21 | 21 | ||||
| Currency forward exchange contracts | — | 9 | — | 29 | ||||
| Cash and cash equivalents | 461 | 461 | 633 | 633 | ||||
| Total | 4,726 | 4,735 | 4,007 | 4,036 | ||||
| Liabilities | ||||||||
| Shareholder's loan | 242 | 164 | 242 | 172 | ||||
| Bond loan | 2,678 | 2,316 | 2,774 | 2,823 | ||||
| Long-term liabilities to credit institutions | 2,875 | 2,993 | 1,901 | 2,019 | ||||
| Short-term liabilities to credit institutions | 771 | 771 | 3,122 | 3,122 | ||||
| Accounts payable | 1,883 | 1,883 | 1,716 | 1,716 | ||||
| Other short-term liabilities | 1,913 | 1,913 | 1,361 | 1,361 | ||||
| Accrued expenses | 888 | 888 | 1,498 | 1,498 | ||||
| Oil swaps | 64 | 64 | — | — | ||||
| Margin hedge | — | 170 | — | 110 | ||||
| Total | 11,314 | 11,162 | 12,614 | 12,821 | ||||
Hedging of refining margins
Forward contracts, options and other instruments that are used to secure future refining margins have been valued at the acquisition value. Only realized gains and losses have impacted the operating profit and the balance sheet.
To ensure a desired minimum level on the financial contribution from the refining process the Company has signed derivative contracts where 3.72 million m3 of the production during 2004 has been hedged at a margin of $2 per barrel. The unrealized loss amounted to SEK 110 (SEK 170) million. Trading with oil products is priced in USD. The unrealized profit in currency futures amounted to SEK 29 (SEK 9) million.
Foreign exchange risk management
Forward foreign exchange contracts that are designated as a hedge of foreign currency balances are marked-to-market with the resulting unrealized gain or loss recorded in the statement of operations to offset the corresponding gain or loss on the related underlying exposure. Unrealized gains and losses
F-16
on forward foreign exchange contracts that are designated as a hedge of a firm commitment or anticipated transaction are deferred and are recognized as an adjustment of the measurement of the transaction when it actually occurs.
The Company's transaction exposure in working or financial capital is distributed on the following currencies translated to SEK on the balance date. Figures in brackets should be read as a debt exposure;
| | 2002 | 2002% | 2003 | 2003% | |||||
|---|---|---|---|---|---|---|---|---|---|
| USD | (2,996 | ) | 54 | % | (2,939 | ) | 42 | % | |
| EUR | (2,729 | ) | 49 | % | (4,099 | ) | 58 | % | |
| Other | 199 | (3 | )% | (1 | ) | 0 | % | ||
| Total | (5,526 | ) | 100 | % | (7,039 | ) | 100 | % | |
Forward oil contracts risk management
Forward oil contracts are designated as a hedge of oil transaction balances and marked-to-market with the resulting unrealized gain or loss recorded in the Consolidated Statement of Operations to offset the corresponding gain or loss on the related underlying exposure. Unrealized gains or losses on options that are used to hedge anticipated oil transactions are marked-to-market with the resulting unrealized gain or loss recorded in Cost of goods sold.
Forward contracts, options and swap agreements for oil products
Outstanding forward contracts, options and swap agreements for petroleum oil products have been valued at the market price at year end. The difference between the acquisition price and the market price at year end affects income and the balance sheet.
F-17
Note 2. Revenues
| | Year ended December 31, | |||||
|---|---|---|---|---|---|---|
| | 2001 | 2002 | 2003 | |||
| Revenues in Sweden | 23,728 | 26,784 | 27,882 | |||
| Revenues abroad | 22,969 | 15,394 | 15,148 | |||
| Total | 46,697 | 42,178 | 43,030 | |||
| | Year ended December 31, | ||||||
|---|---|---|---|---|---|---|---|
| | 2001 | 2002 | 2003 | ||||
| Sales revenue | |||||||
| Supply and refining | 31,289 | 28,359 | 31,609 | ||||
| Marketing | 10,364 | 10,285 | 10,920 | ||||
| International | 1,914 | 2,061 | — | ||||
| Exchange rate differences | 140 | (169 | ) | (201 | ) | ||
| Group eliminations | (7,298 | ) | (7,213 | ) | (7,539 | ) | |
| Total | 36,409 | 33,323 | 34,789 | ||||
Sales revenues in the International segment includes SEK 1,814 million as of December 31, 2001, and SEK 1,948 million as of December 31, 2002, attributable to Preem Polska, which was disposed of in December 2002.
In 2003, the remainder of our international segment is included in the marketing segment.
Note 3. Cost of goods sold
Includes net foreign exchange differences of SEK 331 million, SEK 182 million and SEK 491 million for the years 2001, 2002 and 2003 respectively.
Note 4. Depreciation and amortization
Distribution of depreciation and amortization
| | Year ended December 31, | |||||
|---|---|---|---|---|---|---|
| | 2001 | 2002 | 2003 | |||
| Capitalized turnaround costs | 71 | 73 | 87 | |||
| Goodwill | 229 | 232 | 242 | |||
| Land and buildings | 63 | 62 | 51 | |||
| Plant and machinery | 340 | 357 | 380 | |||
| Equipment tools, fittings and fixtures | 123 | 122 | 121 | |||
| Total | 826 | 846 | 881 | |||
F-18
Distribution of function
| | Year ended December 31, | |||||
|---|---|---|---|---|---|---|
| | 2001 | 2002 | 2003 | |||
| Cost of goods sold | 523 | 539 | 579 | |||
| Selling expenses | 165 | 174 | 151 | |||
| Administrative expenses | 138 | 133 | 151 | |||
| Total | 826 | 846 | 881 | |||
Note 5. Other operating income
| | Year ended December 31, | |||||
|---|---|---|---|---|---|---|
| | 2001 | 2002 | 2003 | |||
| Surplus heat supplies | 53 | 54 | 77 | |||
| Rental income | 52 | 57 | 51 | |||
| Harbor fees | 53 | 38 | 36 | |||
| Storage certificates | 62 | 65 | 65 | |||
| Commission income | 3 | 3 | 3 | |||
| Pension refund | 3 | — | — | |||
| Miscellaneous | 42 | 35 | 36 | |||
| Total | 268 | 252 | 268 | |||
Note 6. Operating income (loss) per segment
| | Year ended December 31, | ||||||
|---|---|---|---|---|---|---|---|
| | 2001 | 2002 | 2003 | ||||
| | SEK | SEK | SEK | ||||
| Operating Income (loss): | |||||||
| Supply and Refining | 543 | 1,086 | 966 | ||||
| Marketing | 79 | 116 | 106 | ||||
| International | (72 | ) | (68 | ) | — | ||
| Other non-allocated income (expense)(1) | (89 | ) | (907 | ) | (619 | ) | |
| Total Operating Income | 461 | 227 | 453 | ||||
- (1)
- Other non-allocated income (expense) includes corporate cost center and exchange rate differences.
F-19
Note 7. Financial income and expenses
| | Year ended December 31, | ||||||
|---|---|---|---|---|---|---|---|
| | 2001 | 2002 | 2003 | ||||
| Financial income | |||||||
| Interest income, other | 93 | 47 | 40 | ||||
| Gain on repurchase of Bonds | — | 23 | — | ||||
| Miscellaneous financial income | — | 2 | — | ||||
| Exchange rate gain (loss) | (2 | ) | (127 | ) | 2 | ||
| Total | 91 | (55 | ) | 42 | |||
| Financial expenses | |||||||
| Interest expense | (491 | ) | (478 | ) | (456 | ) | |
| Exchange rate gain (loss) | (264 | ) | 348 | 274 | |||
| Miscellaneous financial expenses | (3 | ) | (6 | ) | (8 | ) | |
| Total | (758 | ) | (136 | ) | (190 | ) | |
Note 8. Income taxes
Income (loss) before income taxes on a geographic basis is as follows:
| | Year ended December 31, | |||||
|---|---|---|---|---|---|---|
| | 2001 | 2002 | 2003 | |||
| Sweden | (104 | ) | 109 | 293 | ||
| Other | (102 | ) | (73 | ) | 12 | |
| Total | (206 | ) | 36 | 305 | ||
Income tax expenses include the following:
| | Year ended December 31, | ||||||
|---|---|---|---|---|---|---|---|
| | 2001 | 2002 | 2003 | ||||
| Current income tax | |||||||
| Sweden | (105 | ) | (100 | ) | (2 | ) | |
| Other | (4 | ) | (1 | ) | (3 | ) | |
| (109 | ) | (101 | ) | (5 | ) | ||
| Deferred income tax | |||||||
| Sweden | 94 | (79 | ) | (75 | ) | ||
| Other | — | — | 3 | ||||
| 94 | (79 | ) | (72 | ) | |||
| Total | (15 | ) | (180 | ) | (77 | ) | |
F-20
The current tax expenses include the following:
| | Year ended December 31, | |||||
|---|---|---|---|---|---|---|
| | 2001 | 2002 | 2003 | |||
| Tax on group contributions | 92 | 97 | — | |||
| Increase (decrease) in income tax liability | 6 | — | — | |||
| Other | 11 | 4 | 5 | |||
| Total | 109 | 101 | 5 | |||
The principal reasons for the difference between income tax expense (benefit) computed by applying the Swedish statutory tax rate of 28% to income (loss) before income taxes and the actual tax expense (benefit) are set forth below:
| | Year ended December 31, | ||||||
|---|---|---|---|---|---|---|---|
| | 2001 | 2002 | 2003 | ||||
| Income (loss) before taxes | (206 | ) | 36 | 305 | |||
| Statutory tax rate | (28 | )% | (28 | )% | (28 | )% | |
| Income tax benefit/(expense) at statutory rates | 58 | (10 | ) | (85 | ) | ||
| Differences in foreign tax rates | — | 2 | 5 | ||||
| Amortization of goodwill | (64 | ) | (65 | ) | (67 | ) | |
| Expenses not deductible | (2 | ) | (88 | ) | (22 | ) | |
| Taxes attributable to previous year | (12 | ) | — | — | |||
| Increases in tax loss carry-forward not utilized | (47 | ) | (25 | ) | (1 | ) | |
| Utilization of tax losses not earlier recognized | — | 13 | 79 | ||||
| Nontaxable income | 52 | 4 | 16 | ||||
| Other | 0 | (11 | ) | (2 | ) | ||
| Effective income tax | (15 | ) | (180 | ) | (77 | ) | |
| Effective income tax rate | (7 | )% | 500 | % | (25 | )% | |
The Company is subject to Swedish income tax on its taxable income in Sweden. The Company attempts to minimize the amount of taxes payable by transferring, to the extent possible, its taxable income to its parent company, Corral Petroleum Holdings AB. As a result, the amount included in the Consolidated Statement of Operations as income taxes generally reflects book entry transfers rather than cash paid or payable. In particular, the Company effects a transfer to its parent company, which is recorded as a "group contribution," which is in the form of a book-entry dividend, so the amount that is transferable on a year-to-year basis is limited by the Swedish Companies Act to the lesser of the amount of the unrestricted shareholders' equity, which includes net income earned during the year, shown on a consolidated and stand-alone basis. The group contribution is simultaneously offset by a shareholder contribution. The excess of the group contribution, if any, over a shareholder loan represents a true dividend payable in cash. In 2001, 2002 and 2003 the group paid income taxes of SEK 57 million, SEK 17 million and SEK 4 million, respectively.
F-21
| | Year ended December 31, | |||||
|---|---|---|---|---|---|---|
| | 2001 | 2002 | 2003 | |||
| Net profit (loss) | (233 | ) | (148 | ) | 226 | |
| Average number of shares (thousands) | 5 | 5 | 5 | |||
| Profit/(Loss) per share (SEK) | (46,600 | ) | (29,500 | ) | 45,100 | |
Note 10. Intangible assets
| | As of December 31, | ||||
|---|---|---|---|---|---|
| | 2002 | 2003 | |||
| Goodwill | |||||
| As of beginning of year | 3,461 | 3,356 | |||
| Acquisitions | 1 | 0 | |||
| Exchange rate differences | 1 | (1 | ) | ||
| Divestment/Disposals | (107 | ) | — | ||
| As of year end | 3,356 | 3,355 | |||
Goodwill—accumulated amortization | |||||
| As of beginning of year | 2,158 | 2,284 | |||
| Acquisition write-down | — | — | |||
| Amortization for the year | 232 | 242 | |||
| Divestment/Disposals | (106 | ) | — | ||
| As of year end | 2,284 | 2,526 | |||
Net book value | 1,072 | 829 | |||
Note 11. Tangible assets
| | As of December 31, | ||||
|---|---|---|---|---|---|
| | 2002 | 2003 | |||
Land and buildings—at cost | |||||
| As of beginning of year | 964 | 808 | |||
| Acquisitions/Company acquisitions | 17 | 22 | |||
| Company acquisitions | 103 | ||||
| Divestment/Disposals | (139 | ) | (11 | ) | |
| Completion of construction in progress | 57 | 69 | |||
| Effect using proportional consolidation | (91 | ) | — | ||
| Exchange rate differences | — | — | |||
| As of year end | 808 | 991 | |||
F-22
Land and buildings—accumulated depreciation | |||||
| As of beginning of year | 59 | 46 | |||
| Company acquisitions | — | 65 | |||
| Divestment/Disposals | (20 | ) | (5 | ) | |
| Depreciation for the year | 62 | 51 | |||
| Effect using proportional consolidation | (55 | ) | — | ||
| Exchange rate differences | — | — | |||
| As of year end | 46 | 157 | |||
| Net book value | 762 | 834 | |||
Capitalized turnaround cost—at cost | |||||
| As of beginning of year | 167 | 348 | |||
| Acquisitions | — | — | |||
| Company acquisitions | — | 111 | |||
| Divestment/Disposals | — | (105 | ) | ||
| Completion of construction in progress | 186 | 153 | |||
| Effect using proportional consolidation | (5 | ) | — | ||
| As of year end | 348 | 507 | |||
Capitalized turnaround cost—accumulated amortization | |||||
| As of beginning of year | 71 | 141 | |||
| Company acquisitions | — | 68 | |||
| Divestment/Disposals | — | (104 | ) | ||
| Amortization for the year | 73 | 87 | |||
| Effects using proportional consolidation | (3 | ) | — | ||
| As of year end | 141 | 192 | |||
| Net book value | 207 | 315 | |||
Plant and machinery—at cost | |||||
| As of beginning of year | 3,684 | 4,446 | |||
| Acquisitions | 5 | 8 | |||
| Company acquisitions | — | 2,528 | |||
| Divestment/Disposals | (37 | ) | (76 | ) | |
| Completion of construction in progress | 894 | 413 | |||
| Effect using proportional consolidation | (100 | ) | — | ||
| As of year end | 4,446 | 7,319 | |||
F-23
Plant and machinery—accumulated depreciation | |||||
| As of beginning of year | 338 | 660 | |||
| Company acquisitions | — | 820 | |||
| Divestment/Disposals | (33 | ) | (37 | ) | |
| Depreciation for the year | 357 | 380 | |||
| Effect using proportional consolidation | (2 | ) | — | ||
| As of year end | 660 | 1,823 | |||
| Net book value | 3,786 | 5,496 | |||
Equipment, tools, fixtures and fittings—at cost | |||||
| As of beginning of year | 767 | 777 | |||
| Acquisitions | 82 | 100 | |||
| Company acquisitions | — | 28 | |||
| Divestment/Disposals | (114 | ) | (42 | ) | |
| Completion of construction in progress | 68 | 56 | |||
| Effect using proportional consolidation | (26 | ) | — | ||
| Exchange rate differences | — | — | |||
| As of year end | 777 | 919 | |||
Equipment, tools, fixtures and fittings—accumulated depreciation | |||||
| As of beginning of year | 72 | 96 | |||
| Company acquisitions | — | 18 | |||
| Divestment/Disposals | (85 | ) | (36 | ) | |
| Depreciation for the year | 122 | 121 | |||
| Effect using proportional consolidation | (13 | ) | — | ||
| Exchange rate differences | — | — | |||
| As of year end | 96 | 199 | |||
| Net book value | 681 | 720 | |||
Construction in progress | |||||
| As of beginning of year | 340 | 291 | |||
| Acquisitions | 924 | 590 | |||
| Company acquisitions | — | 101 | |||
| Divestment/Disposals | (15 | ) | — | ||
| Completion of construction in progress | (1,205 | ) | (691 | ) | |
| Effect using proportional consolidation | 249 | — | |||
| Exchange rate differences | (2 | ) | — | ||
| As of year end | 291 | 291 | |||
F-24
Tax assessment values | |||||
| Buildings | 809 | 837 | |||
| Land | 248 | 258 | |||
| Plant and machinery | 2,208 | 3,187 | |||
| As of year end | 3,265 | 4,282 | |||
Note 12. Leases
Rental income and expense from operating leases were as follows:
| | Year ended December 31, | |||||
|---|---|---|---|---|---|---|
| | 2001 | 2002 | 2003 | |||
| Rental income | 52 | 57 | 51 | |||
| Rental expense | 95 | 99 | 107 | |||
Rental income is recorded as other operating income and rental expense is recorded as selling or administrative expenses.
As of December 31, 2003 the future minimum lease commitments under noncancellable operating leases and capital leases were as follows:
| | Operating Leases | Capital Leases | Total | |||
|---|---|---|---|---|---|---|
| Within 1 year | 101 | — | 101 | |||
| Between 1 and 5 years | 351 | — | 351 | |||
| Later than 5 years | 95 | — | 95 | |||
| Total minimum lease commitments | 547 | — | 547 | |||
Note 13. Participations in Associated Companies
| Company | Organization Number | Registered Office | Number of shares | Ownership% | Par value (SEK thousands) | Book value (SEK thousands) | ||||||
|---|---|---|---|---|---|---|---|---|---|---|---|---|
| Held by Preem Petroleum AB | ||||||||||||
AB Djurgårdsberg | 556077-3714 | Stockholm | 366 | 37 | 37 | 18 | ||||||
| Göteborgs Smörjmedelsfabrik (Scanlube) AB | 556287-6481 | Gothenburg | 50,000 | 50 | 5,000 | 5,000 | ||||||
| TOTAL | 5,018 | |||||||||||
F-25
In the normal course of business the Company enters into transactions with some of its Associated Companies.
Amounts due from Associated Companies amounted to SEK 1 million at December 31, 2002 and SEK 0 million at December 31, 2003. Amounts due to Associated Companies amounted to SEK 1 million at December 31, 2002 and SEK 1 million at December 31, 2003. For the years ended December 31, 2002 and 2003, sales to these affiliates were SEK 2 million and SEK 3 million, respectively and purchases from these affiliates were SEK 102 million and SEK 95 million, respectively.
The following represents combined information for the Associated Companies owned during the respective years:
| | Year ended December 31, | |||||
|---|---|---|---|---|---|---|
| Income Statement Data | ||||||
| 2001 | 2002 | 2003 | ||||
| Sales | 514 | 328 | 336 | |||
| Income before taxes | 1 | 0 | 0 | |||
| Taxes | — | 0 | 0 | |||
| Net income | 1 | — | 0 | |||
| | As of December 31, | |||
|---|---|---|---|---|
| | 2002 | 2003 | ||
| Balance Sheet Data | ||||
| Current assets | 94 | 102 | ||
| Property, plant and equipment-net | 37 | 37 | ||
| Other assets | 0 | 1 | ||
| Total assets | 131 | 140 | ||
| Liabilities | 117 | 124 | ||
| Shareholders' equity | 14 | 16 | ||
| Total liabilities and shareholders' equity | 131 | 140 | ||
F-26
Note 14. Other securities held as fixed assets
| Company | Organization Number | Registered Office | Number of shares | Ownership% | Par value (SEK thousands) | Book value (SEK thousands) | ||||||
|---|---|---|---|---|---|---|---|---|---|---|---|---|
| Held by Preem Petroleum AB | ||||||||||||
NGI Naturgasinvest AB | 556387-9260 | Stockholm | 1,667 | 17 | 167 | 198 | ||||||
| SPIMFAB-SPI Miljösaneringsfond AB | 556539-4888 | Stockholm | 1 | 1 | 2 | 2 | ||||||
| Släckmedelscentralen-SMC AB | 556488-8583 | Stockholm | 259 | 26 | 52 | 52 | ||||||
| Syrhåla Handelsbolag | 969633-6720 | Stockholm | 0 | |||||||||
| Götene E.D.F. Elföreningen, ek.för | 10 | |||||||||||
| SSH Svensk Servicehandel | 1 | |||||||||||
| Tenant-owner association Berget | 0 | |||||||||||
| Tenant-owner association Ekerum | 945 | |||||||||||
| Tenant-owner association Solhylla | 425 | |||||||||||
| TOTAL | 1,633 | |||||||||||
Note 15. Inventories
The group inventory values include the equivalent of SEK 208 million and SEK 8 million as of December 31, 2003 and 2002, respectively, relating to loaned inventory volumes. Borrowed inventory volumes representing a total inventory value of SEK 30 million and SEK 188 million as of December 31, 2003 and 2002, respectively are not included in the inventory value.
The inventories consists of the following items;
| | As of December 31, | |||
|---|---|---|---|---|
| | 2002 | 2003 | ||
| Raw materials and supplies | 1,836 | 2,756 | ||
| Finished products | 1,687 | 1,923 | ||
| Total | 3,523 | 4,679 | ||
F-27
Note 16. Shareholders' equity
The Company's share capital include 5,000 shares with a par value of SEK 100 each.
| | Share capital | Restricted Reserves | Unrestricted reserves | Total Shareholders' Equity | |||||
|---|---|---|---|---|---|---|---|---|---|
| Balance at January 1, 2001 | |||||||||
| New share issue | 1 | — | — | 1 | |||||
| Shareholders' contribution | — | — | 5,516 | 5,516 | |||||
| Acquisition elimination | — | — | (1,929 | ) | (1,929 | ) | |||
| Net loss for the year | — | — | (233 | ) | (233 | ) | |||
| Group contribution | — | — | (330 | ) | (330 | ) | |||
| Tax effect of group contribution | — | — | 92 | 92 | |||||
| Exchange rate differences | — | — | (5 | ) | (5 | ) | |||
| Balance at December 31, 2001 | 1 | — | 3,111 | 3,112 | |||||
| Shareholders' contribution | — | — | 118 | 118 | |||||
| Net loss for the year | — | — | (148 | ) | (148 | ) | |||
| Group contribution | — | — | (345 | ) | (345 | ) | |||
| Tax effect of group contribution | — | — | 97 | 97 | |||||
| Change in group structure | — | — | 85 | 85 | |||||
| Exchange rate differences | — | — | 8 | 8 | |||||
| Balance at December 31, 2002 | 1 | — | 2,926 | 2,927 | |||||
| Shareholders' contribution received | — | — | 345 | 345 | |||||
| Net profit for the year | — | — | 226 | 226 | |||||
| Exchange rate differences | — | — | 1 | 1 | |||||
| Balance at December 31, 2003 | 1 | — | 3,498 | 3,499 | |||||
Specification of exchange rate difference in equity:
| | 2001 | 2002 | 2003 | |||
|---|---|---|---|---|---|---|
| Exchange rate difference for the year in foreign subsidiaries | (5 | ) | 5 | 1 | ||
| This year's realization of accumulated exchange rate differences in connection with divestment of foreign subsidiaries | — | 3 | — | |||
| Total exchange rate differences for the year | (5 | ) | 8 | 1 | ||
Accumulated exchange rate difference | (1 | ) | (6 | ) | 2 | |
| Exchange rate difference in foreign subsidiaries for the year | (5 | ) | 5 | 1 | ||
| This year's realization of accumulated exchange rate differences in connection with divestment of foreign subsidiaries | — | 3 | — | |||
| Total exchange rate differences for the year | (5 | ) | 8 | 1 | ||
| Accumulated exchange rate difference at the end of the year | (6 | ) | 2 | 3 | ||
F-28
Corral Petroleum Holdings AB, a Swedish company and Preem Holding AB's parent company, contributed all of the issued and outstanding shares of Preem Petroleum AB to Preem Holdings AB on March 19, 2001. The contribution was made at the book value of the shares as recorded in Corral Petroleum Holdings AB as of December 31, 2000. The contribution is accounted for as of January 1, 2001.
In accordance with the Swedish Companies Act, distribution of dividends is limited to the lesser of the unrestricted shareholders' equity (including net income for the year) shown in the Consolidated Balance Sheet of the Parent Company and its subsidiaries and that of the Parent Company on a stand-alone basis, in each case, after proposed appropriations to restricted equity. Unrestricted equity in Preem Holdings AB was SEK 4,618 million as of December 31, 2003. As shown in the Consolidated Balance Sheet at December 31, 2003, unrestricted equity amounted to SEK 3,498 million. Of this amount none is estimated to be appropriated to restricted equity. Restricted reserves include both untaxed reserves (net of applicable deferred taxes) and legal reserves. The legal reserves are not available for distribution as they are required to be held to meet statutory requirements in Sweden. The untaxed reserves may be distributed as dividends upon payment of the related taxes. Transfers between restricted and unrestricted reserves mainly include establishment of new untaxed reserves or dissolution of untaxed reserves.
The group contributions in 2001 and 2002 and the shareholder contribution in 2003 have been made through forgiveness of debt. There was no cash received due to these transactions.
Note 17. Deferred income taxes
| | As of December 31, | ||||
|---|---|---|---|---|---|
| | 2002 | 2003 | |||
| Deferred tax liability | |||||
| Land and buildings | (7 | ) | (10 | ) | |
| Machinery and equipment | (390 | ) | (855 | ) | |
| Others | (3 | ) | (3 | ) | |
| Total | (400 | ) | (868 | ) | |
| | As of December 31, | ||||
|---|---|---|---|---|---|
| | 2002 | 2003 | |||
| Deferred tax assets | |||||
| Tax loss carry-forwards | 2 | 29 | |||
| Others | 4 | — | |||
| Less: valuation allowance | (2 | ) | — | ||
| Total | 4 | 29 | |||
| Deferred tax liability, net | (396 | ) | (839 | ) | |
F-29
Change of deferred tax liability, net
| | Balance at beginning of year | Reported in income | Other changes(1) | Balance at end of year | |||||
|---|---|---|---|---|---|---|---|---|---|
| Land and buildings | (7 | ) | (3 | ) | — | (10 | ) | ||
| Machinery and equipment | (390 | ) | (93 | ) | (372 | ) | (855 | ) | |
| Tax loss carry-forward | 0 | 28 | 1 | 29 | |||||
| Others | 1 | (4 | ) | — | (3 | ) | |||
| Total | (396 | ) | (72 | ) | (371 | ) | (839 | ) | |
- (1)
- Other changes include SEK 372 million relating to deferred taxes as a result of the acquisition of Scanraff.
The Company had tax loss carry-forwards of approximately SEK 7 million as of December 31, 2002. The tax loss carry-forwards are approximately SEK 2 million from the Swedish operations and approximately SEK 5 million from the Norwegian operations. Swedish and Norwegian tax loss carry-forwards are indefinite.
The Company has tax loss carry-forwards of approximately SEK 103 million as of December 31, 2003. The tax loss carry-forwards 2003 were approximately SEK 88 million from Swedish operations, and approximately SEK 15 million from Norwegian operations.
The Company provides a valuation allowance on its tax loss carry-forwards when it has not been deemed more likely than not that the tax loss carry-forwards would be utilized in the near future.
The 2002 acquisition of the subsidiary DSP Investment AB was a repurchase of the desulphurization plant that was recorded as a capital lease since a sale lease-back transaction in 1997. The tax deduction connected to excess depreciations for tax purposes in that plant was an essential part of the transaction. The valuation of the total deferred tax liability amount to SEK 275 (SEK 308) million and has been recorded based on the purchase price at SEK 111 (SEK 125) million.
F-30
Note 18. Long-term liabilities
Liabilities to credit institutions
| | As of December 31 | |||||||
|---|---|---|---|---|---|---|---|---|
| | 2002 | 2003 | ||||||
| Loans in SEK | 2,277 | 1,509 | ||||||
| Loans in € | 2,678 | 2,774 | ||||||
| Loans in $ | 1,148 | 946 | ||||||
| Less repayments due within 1 year | (550 | ) | 5,553 | (555 | ) | 4,674 | ||
| Lease obligation | — | — | ||||||
| Less current portion | — | — | — | — | ||||
| 5,553 | 4,674 | |||||||
Amortization plan
| | 2004 | 2005 | 2006 | 2007 | 2008 | 2009 and thereafter | ||||||
|---|---|---|---|---|---|---|---|---|---|---|---|---|
| Bond Loan | — | — | — | — | — | 2,774 | ||||||
| Loans | 555 | 369 | 568 | 303 | 4 | 656 | ||||||
| Total | 555 | 369 | 568 | 303 | 4 | 3,430 | ||||||
Bank overdraft facilities and other unutilized facilities
| | 2003 | |
|---|---|---|
| Bank overdraft facilities | ||
| Agreed credit limit | 246 | |
| Unutilized portion | 245 | |
| Utilized credit amount | 1 | |
| Other unutilized facilities | ||
| Short-term credit facility | 452 | |
| Mid-term credit facility | — | |
| Total | 452 | |
| Total unutilized credit facilities | 697 | |
F-31
Interest Bearing Liabilities
| | As of December 31, | ||||||||||||
|---|---|---|---|---|---|---|---|---|---|---|---|---|---|
| | Maturity | Interest rate | 2002 | 2002 % | 2003 | 2003 % | |||||||
| Fixed rate SEK | 2007/2010 | 6.39/6.45 | % | 535 | 9 | % | 535 | 10 | % | ||||
| Variable rate SEK | 2003/2010 | Variable | 1,742 | 28 | % | 974 | 19 | % | |||||
| Fixed rate $ | 2006/2010 | 5.55/5.87 | % | 927 | 15 | % | 764 | 15 | % | ||||
| Variable rate $ | 2005 | Variable | 221 | 4 | % | 182 | 3 | % | |||||
| Fixed rate € | 2011 | 10.625 | % | 2,678 | 44 | % | 2,774 | 53 | % | ||||
| Total | 6,103 | 100 | % | 5,229 | 100 | % | |||||||
| Less: Current portion | (550 | ) | (555 | ) | |||||||||
| Total | 5,553 | 4,674 | |||||||||||
| | As of December 31, | |||
|---|---|---|---|---|
| | 2002 | 2003 | ||
| Shareholder loan | 242 | 242 | ||
The Shareholder loan, which is subordinate to other liabilities, is not subject to interest or amortization.
The Company has as of December 31, 2003, debt of SEK 39 million secured by real estate mortgages and SEK 364 million of debt that is guaranteed by a financial institution. The bond loan is secured by a pledge of all of the outstanding share capital in Preem Petroleum and by assignment by way of security of an inter-company loan from Preem Holdings to Preem Petroleum of SEK 2,277 million.
Note 19. Liabilities to credit institutions
| | As of December 31, | |||
|---|---|---|---|---|
| | 2002 | 2003 | ||
| Short-term portion of long-term debt | 550 | 555 | ||
| Other loans | 221 | 2,567 | ||
| Total | 771 | 3,122 | ||
SEK 1,548 million (€170 million) of our short-term debt is in the form of a bridge loan from a group of Swedish banks to Preem Finans and Preem Petroleum, guaranteed by Preem Holdings and Preem Petroleum. The obligations of Preem Finans under the bridge loan, which total SEK 1,020 million, are secured by a floating charge over assets of Preem Finans in the amount of SEK 1,000 million. The bridge loan matures on June 11, 2004.
F-32
The average interest rate on short-term debt as of December 31, 2003 was 4.1%. Other loans include the bridge loan of SEK 1,548 million at an interest rate of 4.4% with a maturity date on June 11, 2004.
Note 20. Other liabilities and accrued expenses and prepaid income
Other liabilities
| | As of December 31, | |||
|---|---|---|---|---|
| | 2002 | 2003 | ||
| VAT | 402 | 404 | ||
| Excise duties | 800 | 800 | ||
| Liability to Svenska Petroleum Exploration AB, related party | 286 | 61 | ||
| Other | 68 | 84 | ||
| Total | 1,556 | 1,349 | ||
Accrued expenses and prepaid income
| | As of December 31, | |||
|---|---|---|---|---|
| | 2002 | 2003 | ||
| Crude oil | 710 | 1,125 | ||
| Accrued salaries and social costs | 152 | 177 | ||
| Accrued interest expenses | 119 | 113 | ||
| Other | 131 | 92 | ||
| Total | 1,112 | 1,507 | ||
F-33
Note 21. Average number of employees
| | 2002 | 2003 | ||||||
|---|---|---|---|---|---|---|---|---|
| | No. Of Employees | % men | No. Of Employees | % men | ||||
| | (actual, not in millions) | |||||||
| Preem Holdings AB | — | — | — | — | ||||
| Preem Petroleum AB | ||||||||
| Sweden | 822 | 52 | 830 | 56 | ||||
| Group companies | ||||||||
| Sweden | 934 | 88 | 931 | 83 | ||||
| Norway | 8 | 75 | 5 | 80 | ||||
| Ireland | — | — | — | — | ||||
| Poland | 231 | 70 | — | — | ||||
| Total group companies | 1,173 | 81 | 936 | 83 | ||||
| Total group | 1,995 | 69 | 1,766 | 70 | ||||
Salaries, other remuneration and payroll overheads
| | 2002 | 2003 | |||||||
|---|---|---|---|---|---|---|---|---|---|
| | Salaries, other remuneration | Payroll overheads (of which pension expenses) | Salaries, other remuneration | Payroll overheads (of which pension expenses) | |||||
| Preem Holdings AB | — | — | — | — | |||||
| Preem Petroleum AB | 272.9 | 156.3 | 281.0 | 144.3 | |||||
| (43.7 | ) | (32.1 | ) | ||||||
| Group companies | 366.8 | 183.5 | 350.0 | 179.7 | |||||
| (53.9 | ) | (53.3 | ) | ||||||
| Group total | 639.7 | 339.8 | 631.0 | 324.0 | |||||
| (97.6 | ) | (85.4 | ) | ||||||
F-34
Break-down of salaries and other remuneration according to country and between Board members and employees.
| | 2002 | 2003 | ||||||
|---|---|---|---|---|---|---|---|---|
| | Board and President | Other employees | Board and President | Other employees | ||||
| Preem Holdings AB | — | — | — | — | ||||
| Preem Petroleum AB | 2.7 | 270.2 | 3.3 | 277.5 | ||||
| (of which bonus) | (0.1 | ) | — | |||||
| Other companies in Sweden | 4.3 | 335.3 | 3.9 | 342.5 | ||||
| (of which bonus) | (0.1 | ) | (0.1 | ) | ||||
| Group companies abroad | ||||||||
| Norway | 1.4 | 4.9 | 1.0 | 2.6 | ||||
| Poland | 0.2 | 20.7 | — | — | ||||
| Ireland | — | — | — | — | ||||
| Group total | 8.6 | 631.1 | 8.2 | 622.6 | ||||
| (of which bonus) | (0.2 | ) | (0.1 | ) | ||||
Percentage of females in the management
| | As of December 31, | ||||
|---|---|---|---|---|---|
| | 2002 | 2003 | |||
| | (percent of females) | ||||
| Parent company | |||||
| Board of directors | 0 | % | 0 | % | |
| Other senior managers | 0 | % | 0 | % | |
| Preem Holdings AB Group | |||||
| Board of directors | 0 | % | 0 | % | |
| Other senior managers | 15 | % | 33 | % | |
F-35
Note 22. Auditors' fee
| | Year ended December 31, | |||
|---|---|---|---|---|
| | 2002 | 2003 | ||
| KPMG | ||||
| Auditing | 2.1 | 2.3 | ||
| Other assignments | 1.6 | 1.8 | ||
| SET | ||||
| Auditing | 0.1 | 0.2 | ||
| Other assignments | — | — | ||
| Other auditors | ||||
| Auditing | 0.5 | 0.1 | ||
| Other assignments | — | — | ||
Note 23. Pledged assets and contingent liabilities
| | As of December 31, | |||
|---|---|---|---|---|
| | 2002 | 2003 | ||
| Assets pledged | ||||
| Shares in Preem Petroleum AB (publ) | 3,468 | 3,798 | ||
| Property mortgages | 54 | 54 | ||
| Floating charges | 5 | 1,000 | ||
| Endowment insurances | 0 | 0 | ||
| Deposits | 16 | 21 | ||
| Total pledged assets | 3,543 | 4,873 | ||
Contingent liabilities | ||||
| Guarantee | 41 | 39 | ||
| Unrealized losses in oil swaps | 170 | 110 | ||
| Total contingent liabilities | 211 | 149 | ||
Guarantees are when the Company has guaranteed a third party's transaction with another party, mainly loans. Guarantees include SEK 36 million as of December 31, 2003, referring to a guarantee commitment for a credit facility taken by the associated company Göteborgs Smörjmedelsfabrik AB (Scanlube).
In November 1998, the Swedish tax authorities charged us additional VAT and penalties of approximately SEK 64.9 million relating to an audit of our 1994 tax year. The tax authorities' decision to charge us additional VAT on credit card sales related to the alleged unjustified deduction of VAT regarding credit losses and rebates connected to Preem-credit card sales in 1994. In December 1998, we appealed the decision of the tax authorities to the County Administrative Court of Stockholm, which ruled in our favor in October 2001. The court confirmed that VAT is to be paid by the end-consumer and not by us. In December 2001, the Swedish authorities appealed the judgment of the County
F-36
Administrative Court of Stockholm to the Fiscal Court of Appeal and this appeal is pending. Following our successful appeal, we have, in accordance with Swedish generally accepted accounting principles, dissolved the reservation made for the additional VAT in 2001 in the amount of SEK 54 million. After the Swedish tax authorities filed their appeal in December 2001, we decided not to reestablish the resolved reserve. If the appeal is successful, our VAT liability may be affected for a total of three years.
On June 29, 2000, the Swedish Competition Authority filed a summons application to the City Court of Stockholm against Preem Petroleum AB and four other oil companies operating in Sweden, demanding that the City Court impose total fines on all five oil companies of SEK 740 million as a penalty for alleged infringements of the Swedish Competition Act. Of the SEK 740 million in total fines, the Swedish Competition Authority has demanded that the City Court impose fines on Preem Petroleum AB of SEK 85 million, which was later adjusted to SEK 81 million. The Competition Authority claims that we participated in a cartel on the Swedish market concerning prices and discounts on gasoline during the summer and fall of 1999. Court proceedings took place during the third quarter of 2002 and on April 29, 2003, the District Court of Stockholm announced its judgment, finding that the five companies had violated the Competition Act. The court assessed Preem Petroleum with a fine of SEK 6 million. The court also ordered the Competition Authority to pay up to SEK 2.3 million of Preem Petroleum's legal fees. Both the Competition Authority and we have appealed the court's judgment.
In addition to the fines imposed by the Swedish courts, the Swedish Competition Act provides the possibility for companies and private parties to recover damages attributable to infringements of such Act, in which case the total amount of the Company's liability would be uncertain. Legal proceedings must be initiated within five years from the date on which the damage occurred. The Company can not rule out the possibility of lawsuits from private parties or companies. At present, there is no mechanism under Swedish law to bring a class action or to impose punitive damages. However, there can be no assurances that this will remain the case for the next four years.
Note 24. Selected Industry Segment Information
The Company operates mainly in the oil and gas industry and has two reportable segments: the Supply and Refining Segment and the Marketing Segment. The two segments were determined based upon the types of services and products that are provided to the customers. The Supply and Refining Segment operates the wholly-owned Scanraff refinery located on the west coast of Sweden, north of Gothenburg and the wholly-owned Preemraff refinery located near the harbour of Torshamnen in Gothenburg as well as storage depots throughout Sweden. The Supply and Refining Segment sells a full range of refined products in Sweden and abroad. The Marketing Segment sells home-heating gasoil directly to end-users, and heating oil, diesel and fuel oil directly to Swedish companies using refined products purchased from the Supply and Refining Segment. The Marketing Segment also sells gasoline, diesel, lubricants, shop merchandise and other products through its Preem- branded service stations. Performance of the segments is evaluated based upon operating profit (loss) before income taxes and excluding interest income and expenses. Segment information has been prepared in accordance with SFAS No. 131, "Disclosures about Segments of an Enterprise and Related Information." Accounting policies of the segments are the same as those described in the summary of significant accounting policies. Intersegment sales were made at market rates.
F-37
Prior to 2003, the Company had a third reportable segment—the international segment, which consisted of the Company's operations in Poland and Norway. In December 2002, the Company disposed of its Polish operations. The Company's remaining international operations are included in the marketing segment in 2003.
Financial information by segment is as follows:
| | 2001 | 2002 | 2003 | ||||
|---|---|---|---|---|---|---|---|
| | Year ended December 31, | ||||||
| | SEK | SEK | SEK | ||||
| Sales revenue: | |||||||
| Supply and refining | 31,289 | 28,359 | 31,609 | ||||
| Marketing | 10,364 | 10,285 | 10,920 | ||||
| International | 1,914 | 2,061 | — | ||||
| Segment sales revenue | 43,567 | 40,705 | 42,529 | ||||
| Exchange rate differences | 140 | (169 | ) | (201 | ) | ||
| Intersegment sales revenue | (7,298 | ) | (7,213 | ) | (7,539 | ) | |
| Sales revenues | 36,409 | 33,323 | 34,789 | ||||
Segment operating income: | |||||||
| Supply and refining | 543 | 1,086 | 966 | ||||
| Marketing | 79 | 116 | 106 | ||||
| International | (72 | ) | (68 | ) | — | ||
| Segment operating income | 550 | 1,134 | 1,072 | ||||
| Other non-allocated income (expense)(1) | (89 | ) | (907 | ) | (619 | ) | |
| Operating income | 461 | 227 | 453 | ||||
| Non-allocated items(2) | (667 | ) | (191 | ) | (148 | ) | |
| Income before income taxes | (206 | ) | 36 | 305 | |||
- (1)
- Other non-allocated income (expense) includes the corporate cost center, and exchange rate differences.
- (2)
- Non-allocated items consist of interest income and expenses, other financial income and expense.
F-38
Sales revenue, Marketing Segment:
| | Year ended December 31, | |||||
|---|---|---|---|---|---|---|
| | 2001 | 2002 | 2003 | |||
| | SEK | SEK | SEK | |||
| Home heating | 591 | 528 | 543 | |||
| Business-to-business | 5,827 | 5,632 | 6,133 | |||
| Station and consumer | 3,946 | 4,125 | 4,244 | |||
| Total | 10,364 | 10,285 | 10,920 | |||
Operating income, Marketing Segment:
| | Year ended December 31, | |||||
|---|---|---|---|---|---|---|
| | 2001 | 2002 | 2003 | |||
| | SEK | SEK | SEK | |||
| Home heating | 5 | 11 | 10 | |||
| Business-to-business | 59 | 89 | 94 | |||
| Station and consumer | 15 | 16 | 2 | |||
| Total | 79 | 116 | 106 | |||
Depreciation and amortization:
| | Year ended December 31, | |||||
|---|---|---|---|---|---|---|
| | 2001 | 2002 | 2003 | |||
| Supply and refining | 496 | 529 | 572 | |||
| International | 24 | 25 | — | |||
| Marketing | 153 | 161 | 161 | |||
| Segment depreciation and amortization | 673 | 715 | 733 | |||
| Other | 153 | 131 | 148 | |||
| Total | 826 | 846 | 881 | |||
F-39
Capital expenditures:
| | Year ended December 31, | |||||
|---|---|---|---|---|---|---|
| | 2001 | 2002 | 2003 | |||
| Supply and refining | 402 | 900 | 628 | |||
| International | 28 | 2 | — | |||
| Marketing | 148 | 123 | 88 | |||
| Segment capital expenditures | 578 | 1,025 | 716 | |||
| Other | 10 | 3 | 4 | |||
| Total | 588 | 1,028 | 720 | |||
Geographic information
Sales revenues:
| | Year ended December 31, | |||||
|---|---|---|---|---|---|---|
| | 2001 | 2002 | 2003 | |||
| Swedish market | 22,441 | 18,978 | 19,744 | |||
| Germany | 2,622 | 1,909 | 2,006 | |||
| United Kingdom | 2,650 | 1,441 | 2,290 | |||
| Denmark | 2,732 | 2,544 | 3,204 | |||
| Other | 5,964 | 8,451 | 7,545 | |||
| Total | 36,409 | 33,323 | 34,789 | |||
The largest portion of the Company's sales in other markets is comprised of sales to the Northern European market.
Fixed assets:
| | As of December 31, | |||
|---|---|---|---|---|
| | 2002 | 2003 | ||
| Sweden | 6,911 | 8,583 | ||
| Other | 11 | 12 | ||
| Total | 6,922 | 8,595 | ||
Note 25. Financial instruments and risk management
The Company has operations and assets mainly in Sweden but also in Ireland and Norway. Consequently, the Company's profits and revenues are affected, when measured in Swedish Kronor, by fluctuations of currency exchange rates. In addition the Company is exposed to fluctuations of the
F-40
Dollar due to the fact that most of its goods are priced in Dollars. When the Swedish Kronor appreciates against other currencies, the Company's profits from foreign operations, reported in Swedish Kronor, may decrease. Likewise, when the Swedish Kronor declines against other currencies, the Company's profits from foreign operations reported in Swedish Kronor may increase. The Company also has exposure to market risks from changes in interest rates and price fluctuations in oil. Certain financial instruments are used by the Company to manage these foreign currency, interest rate and oil risks as summarized below.
Notional amounts and credit exposure
The notional amounts of off-balance-sheet financial instruments presented in this Note represent face or contractual amounts and thus are not a measure of the exposure of the Company through its use of such financial instruments. The actual amounts exchanged are calculated on the basis of the notional amounts and the other terms of the financial instruments, which relate to interest rates, exchange rates, and bunker oil prices.
The Company is exposed to credit related losses in the event that counterparties to the off-balance-sheet financial instruments do not perform according to the terms of the contract. In the opinion of management, the counterparties to the financial instruments are creditworthy financial institutions and other parties and the Company does not expect any significant loss to result from non-performance. The Company, in the normal course of business, does not demand collateral. The credit exposure of interest rate and foreign exchange contracts is represented by the fair value of contracts with a positive fair value at the end of each period, reduced by the effects of master netting arrangements. Initial margin requirements and daily calls are met in cash.
Interest rate risk management
The Company uses interest swaps to manage its interest rate risk, but did not have any open position either at December 31, 2002 or 2003.
Foreign currency risk management
The Company is exposed to foreign currency exchange rate risk, due to the international nature and scope of its operations. A substantial portion of the Company's revenues and expenses are denominated in foreign currency. The Company's foreign currency risk exposure arises from fluctuations in exchange rates in relation to the value of the Company's sales and purchases in foreign currencies and certain financial assets and liabilities (transaction exposure). The Company's policy is to hedge its transaction risk primarily on its net exposures. Management regularly reviews the Company's assets and liabilities that are denominated in foreign currency and determines the net amount that is subject to risk of foreign currency fluctuations. The Company primarily uses forward exchange contracts and, to a lesser extent, purchases currency options and currency swaps to manage its foreign currency
F-41
risk. The following table presents the notional amounts and credit exposure of financial instruments used for foreign currency risk management as of December 31 for each year:
| | As of December 31, | |||||||
|---|---|---|---|---|---|---|---|---|
| | 2002 | 2003 | ||||||
| | Notional Amount | Credit Exposure | Notional Amount | Credit Exposure | ||||
| Forward exchange contracts | 362 | — | 156 | — | ||||
The following table summarizes the contractual amounts of the Company's forward exchange and option contracts by major currency in Swedish Kronor. Foreign currency amounts are translated at rates current at the reporting date. The "buy" amounts represent Swedish Kronor equivalent of commitments or options to purchase foreign currencies, and the "sell" amounts represent the Swedish Kronor equivalent of commitments or options to sell foreign currencies. The Company uses forward exchange contracts, which typically expire within one year, to hedge anticipated and firmly committed payments and receipts of foreign currencies related to sales, product costs, interest and sale and purchase of fixed assets.
| | 2002 | 2003 | ||||||
|---|---|---|---|---|---|---|---|---|
| | Buy | Sell | Buy | Sell | ||||
| US Dollar | — | 362 | — | 156 | ||||
| Total | — | 362 | — | 156 | ||||
Oil risk management
As with currency risks, Preem makes assumptions regarding future changes in the price of oil and prices are hedged on the basis of this assessment. The risk permitted within the frame for the financial policy totals a norm position 2,087,000 cubic meters (+200,000/–250,000 cubic meters) at any given instance, which, assuming current price levels, means that none of the Group's consumption must be hedged, if at norm position.
Preem uses swaps and futures to fix its price levels. The unrealized profit as of December 31, 2003, was SEK 29 million ($4 million). The total notional amount of the outstanding contracts was SEK 1,396 million as of December 31, 2002 and SEK 2,645 million as of December 31, 2003.
Preem uses forward contracts to hedge future refining margins. As of December 31, 2003, 23 million barrels of 2004 refinery production was secured at a refining margin of $2.636/barrel. The
F-42
unrealized loss as of December 31, 2003 was SEK 110 million ($15 million), which has been treated as a hedge of future flows under Swedish GAAP.
| | 2002 | 2003 | ||||||
|---|---|---|---|---|---|---|---|---|
| | Notional amount | Length of Contract | Notional amount | Length of Contract | ||||
| Oil Swaps | 1,040 | Jan-03-Dec-03 | 1,359 | Jan-04-Jan-05 | ||||
| Oil Futures | 356 | Jan-03-May-03 | 1,286 | Jan-04-Feb-04 | ||||
| 1,396 | 2,645 | |||||||
| Refining margin contracts | 1,493 | Jan-03-Dec-04 | 569 | Jan-04-Dec-04 | ||||
| Total | 2,889 | 3,214 | ||||||
Environmental cost
The Company accrues for environmental costs as indicated in Note 1. Numerous local, state and federal laws, rules and regulations relating to the environment are applicable to the Company's operations. As a result, the Company falls under the jurisdiction of numerous state and federal agencies and is exposed to the possibility of judicial or administrative actions for remediation and/or penalties brought by those agencies.
The Company has been and will be responsible for costs related to compliance with, or remediation resulting from, environmental regulations. In some instances, such as the closure of a number of our depots, we are currently unable to accurately estimate the costs of necessary remediation and may face significant unexpected costs, which could materially adversely affect our financial condition, results of operations and cash flows. The Company has leased the Finnberget depot since 1987, and its lease agreement terminated in September 2001. The lease agreement had a provision limiting the Company's liability for any decontamination to a maximum of SEK 4 million.
The Company is in a dispute, however, with the landlord over whether this limitation extends to third party claims, including claims made by governmental authorities. The Company has filed an application in November 2000 with the Swedish district court, asking the court to establish that the contractual limitation extends to third party claims. If the court does not find in the Company's favor, the Company may be liable for all or part of the decontamination of this site. The total cost of decontamination depends on the intended future use of the site. Management estimate the total decontamination cost for future industrial use would be approximately SEK 40 million. Management estimate the total decontamination cost for future housing use would be approximately SEK 75-120 million; the Company has accrued an amount of SEK 4 million, which is represented by a contractual obligation.
Our lease on the Loudden storage depot expired in December 2003. We have reached an oral agreement with the lessor to extend the lease until December 31, 2008. Since there are a number of other lessees at the Loudden site and given that the term of the lease has been extended, we do not have an estimate for the decontamination and other remedial costs for Loudden. Any requirement that we pay decontamination costs at either of these sites could materially adversely affect our financial condition, results of operations and cash flows.
F-43
There are currently no other identified environmental remediation projects of which the costs can be reasonably estimated. However, the continuation of the present investigative process, other more extensive investigation over time or changes in regulatory requirements could result in future liabilities. The Company's operations are conducted in hazardous environments where accidents involving catastrophic damage or loss of life could result, and litigation arising from such an event may result in the Company being named a defendant in lawsuits asserting material claims. The Company insures itself for liability arising from its operations, including loss of or damage to third-party property, death or injury to third parties, statutory workers compensation protection and pollution caused by a sudden and accidental occurrence. Although there can be no assurance that the amount of insurance carried by the Company is sufficient to protect the Company fully in all events, all such insurance is carried at levels of coverage and deductibles that the Company consider financially prudent. A successful liability claim for which the Company are underinsured or uninsured could have a material adverse effect on us. Environmental regulators are currently investigating soil and groundwater contamination at our Preemraff facility, which, we believe, could lead to legal proceedings being initiated against us and/or third-party contractors.
In connection with the sale of each of our Polish and Norwegian subsidiaries, we have undertaken to reimburse the purchaser for costs incurred as a result of any final remediation orders issued by relevant authorities up to a certain amount. This obligation extends only to contamination occurring prior to the sale and only to costs in excess of a certain amount. In the event that remediation of these sites is required, our exposure could materially adversely affect our financial condition, results of operations and cash flows.
F-44
Note 26. U.S. GAAP Information
The following is a summary of the most significant differences between the Preem Group's accounts in accordance with Swedish and U.S. GAAP, respectively.
| | Year ended December 31, | |||||||
|---|---|---|---|---|---|---|---|---|
| | 2001 | 2002 | 2003 | |||||
| Net income/(loss) for the year according to Swedish GAAP | (233 | ) | (148 | ) | 226 | |||
| Adjustments in accordance with U.S. GAAP: | ||||||||
| Pensions (A) | 8 | (2 | ) | (72 | ) | |||
| Pension refund (B) | 27 | 48 | 14 | |||||
| Business combinations (C) | — | 232 | 232 | |||||
| Computer software for internal use (D) | 18 | 1 | (6 | ) | ||||
| Financial instruments (E) | — | (161 | ) | 80 | ||||
| Changes in group structure (F) | — | 9 | 9 | |||||
| Income tax effects of U.S. GAAP adjustment | (15 | ) | 32 | (4 | ) | |||
| Net income (loss) according to U.S. GAAP | (195 | ) | 11 | 479 | ||||
Continuing Operations | (122 | ) | 70 | 481 | ||||
| Discontinued Operations(G) | (73 | ) | (59 | ) | (2 | ) | ||
| Basic and diluted income (loss) per share in accordance with U.S. GAAP, assuming current capitalization of Preem Holdings AB for all periods | (39,000 | ) | 2,200 | 95,800 | ||||
| Continuing Operations | (24,400 | ) | 14,000 | (400 | ) | |||
| Discontinued Operations(G) | (14,600 | ) | (11,800 | ) | 96,200 | |||
| Weighted number of shares outstanding (thousands) | 5 | 5 | 5 | |||||
| | As of December 31, | |||||
|---|---|---|---|---|---|---|
| | 2002 | 2003 | ||||
| Shareholder's equity | ||||||
| According to Swedish GAAP | 2,927 | 3,499 | ||||
| Adjustments in accordance with U.S. GAAP: | ||||||
| Pensions (A) | 56 | (16 | ) | |||
| Pension refund (B) | (14 | ) | — | |||
| Business combinations (C) | 232 | 464 | ||||
| Computer software for internal use (D) | 19 | 13 | ||||
| Financial instruments (E) | (161 | ) | (81 | ) | ||
| Changes in group structure (F) | (76 | ) | (67 | ) | ||
| Accumulated income tax effects | 28 | 24 | ||||
| According to U.S. GAAP | 3,011 | 3,836 | ||||
F-45
- (A)
- Pensions—The Group companies have various pension schemes in accordance with local conditions and practices in the countries in which they operate. Most of these schemes are defined benefit pension schemes with retirement, disability, death and termination income benefits. The retirement income benefits are generally a function of years of employment and final salary with the Company and are generally coordinated with local national pension schemes. The Group companies' schemes are generally funded through payments to insurance companies or to trustee-administered funds as determined by periodic actuarial calculations. The Group policy for funding its defined benefit plans is to satisfy local statutory funding requirements for tax deductible contributions. The Company contributes at least an amount equal to the minimum funding requirements for the countries in which it maintains pension schemes. Under U.S. GAAP, the determination of pension expense for defined benefit pension plans is made pursuant to Statement of Financial Accounting Standard No. 87, "Employers' Accounting for Pensions SFAS No. 87." SFAS 87 is more prescriptive than Swedish GAAP in that it requires the use of specific actuarial method (the projected unit credit method). SFAS 87 requires, under certain circumstances, a minimum liability may be recorded with a corresponding intangible asset and/or reduction of shareholders' equity for plans that are underfunded. The Company also participates in some multi-employer pension arrangements and defined contribution pension arrangements.
The Group participates in a pension scheme in which plan assets were not segregated in separate accounts or restricted to provide benefits exclusively to Group employees. As such, this pension scheme had been accounted for as a multi-employer plan for both Swedish and U.S. GAAP purposes. In 2003, the assets of the plan have been segregated and separate accounts have been established. For Swedish GAAP purposes, this pension scheme is accounted for as a multi-employer plan in 2003, but will as of January 1, 2004, be accounted for as a multi-employer plan. For U.S. GAAP purposes, the change in 2003 is viewed as the withdrawal from a multiple-employer plan and the establishment of a multiple-employer plan with the unfunded benefit obligation of SEK 72 million as of December 31, 2003 being recognized immediately in net income.
- (B)
- Pension refund—The Swedish National Pension Fund decided during late 1999 to repay some of its excess funds to the contributors to the plan. The amount to be received was split into two parts i) 20% in cash during September 2000; and ii) 80% as a reduction of future required payments. Swedish GAAP allows the Companies to account for this refund in income during 2000 using a present value calculation of future payments. Under U.S. GAAP the non-cash portion of the refund will be recognized as an offset to future contributions.
- (C)
- Business combinations—Acquisitions of certain subsidiaries are reported differently in accordance with Preem's accounting principles and U.S. GAAP. The difference is attributable primarily to reporting and amortization of goodwill.
In 2002 Preem adopted SFAS 142 "Goodwill and Other Intangible Assets" In accordance with the transition rules of SFAS 142, Preem identified its reporting units and determined the carrying value and fair value of each reporting unit as of January 1, 2002. No impairment loss was recognized in 2002 as a result of the transitional goodwill evaluation. Furthermore, impairment test have been performed for existing goodwill as of December 31, 2002 and 2003. There were no impairment
F-46
losses recognized in 2002 for either Swedish or US GAAP. In 2003 there is an impairment loss of SEK 14 million recognized in both Swedish and US GAAP. In accordance with SFAS 142, goodwill and other intangible assets with indefinite useful lives should not be amortized but rather evaluated for impairment annually. Accordingly, the amortization of goodwill reported under Swedish GAAP has been reversed in the determination of Net income and Shareholders' equity under U.S. GAAP. The following reflects the impact that SFAS 142 would have had on prior years net income (loss):
| | Year ended December 31, 2001 | ||
|---|---|---|---|
| Reported net loss under U.S. GAAP | (195 | ) | |
| Cease goodwill amortization | 229 | ||
| Adjusted net income under U.S. GAAP | 34 | ||
- (D)
- Computer software for internal use—The cost of developing computer software for internal use is expensed as incurred under Swedish GAAP. Certain costs are capitalized under U.S. GAAP (SOP 98-1) and are amortized over the expected economic life of the asset.
- (E)
- Financial instruments—Under Swedish GAAP, unrealized gains and losses on forward refining margin contracts which hedge future cash flows are deferred and recognized only when realized. Under US GAAP, unrealized gains and losses on forward refining margin contracts, which do not qualify for hedge accounting treatment would be recognized as income or loss when they occur. Effective January 1, 2001, the Company adopted SFAS No.133 "Accounting for Derivative Instruments and Hedging Activities" and SFAS No. 138 "Accounting for Certain Derivative Instruments and Certain Hedging Transactions, an Amendment to FASB Statement No. 133". These statements establish accounting and reporting standards requiring that derivative instruments be recorded on the balance sheet at fair value as either assets or liabilities, and requires the company to designate, document and assess the effectiveness of a hedge to qualify for hedge accounting treatment. The Company uses derivative instruments to hedge the value of the Groups' financial position. Management has determined that none of the Groups' hedges of financial exposure qualify for hedge accounting under US GAAP during 2002 and 2003. In accordance with US GAAP, all outstanding derivative instruments are therefore valued at fair value. The gains and losses that thereby arise are included when calculating income. The year-end adjustment to record derivative instruments at fair value in accordance with US GAAP resulted in a net loss adjustment of SEK 161 million and a net gain of SEK 80 million recognized in current earnings in 2002 and 2003, respectively.
- (F)
- Changes in group structure—Preem changed its shareholding in the refineries during 2002 through a transaction structure agreement in which the parties agreed to combine the operations, assets and liabilities of Scanraff and Scancracker into a joint refining company with unified ownership shares and processing rights being held 75% by Preem and 25% by Norsk Hydro. The transaction has been recorded as a change in group structure with an effect of increasing shareholders' equity and assets and the related depreciation charge recorded under Swedish GAAP have therefore been reversed to reflect Norsk Hydro's book value of net assets transferred. The transaction under US GAAP is recorded at carryover basis as a non-monetary exchange of similar productive assets.
F-47
- (G)
- Discontinued Operation—On January 31, 2003, Preem finalized the sale of its subsidiary in Poland, Preem Polska. The sale of Preem Polska has been classified as continuing under Swedish GAAP. The operations and cash flows of Preem Polska have been eliminated from Preem's ongoing operations and Preem does not have any significant continuing involvement in Preem Polska. As such, for US GAAP purposes Preem Polska is classified as a discontinued operation. In March 2004, Preem sold its interest in its subsidiary in Norway, ENØK Energi AS. The results of operations of ENØK Energi AS are reported as continuing under Swedish GAAP. Under U.S. GAAP ENØK Energi AS is classified as held for sale as of December 31, 2003 and the results of operations are classified as discontinued operations.
Other U.S. GAAP disclosures
Fair value of financial instruments
FASB Statement No. 107, "Disclosures about Fair Value of Financial Instruments," requires the disclosure of estimated fair values for all financial instruments, both on and off balance-sheet, for which it is practicable to estimate fair value. The Company's estimates show that there are no material variation between market value and book value for its financial instruments, except for long-term loans as presented below, as at December 31, 2002 and 2003. For certain instruments, including cash and cash equivalents, and accounts payable and accruals, it was assumed that the carrying amount approximated fair value due to the short maturity of those instruments.
The estimated fair value of the Company's long-term debt are based on present value of future payments based on the difference in interest rates.
| | As of December 31, | ||||||||
|---|---|---|---|---|---|---|---|---|---|
| | 2002 | 2003 | |||||||
| | Carrying value | Fair value | Carrying Value | Fair value | |||||
| Liabilities | |||||||||
| Long-term liabilities to credit institutions | 2,875 | 2,993 | 1,901 | 2,019 | |||||
| Bond loan | 2,678 | 2,316 | 2,774 | 2,823 | |||||
Financial instruments | |||||||||
| Forward exchange contracts | — | 9 | — | 29 | |||||
| Refining margin contracts | — | (170 | ) | — | (110 | ) | |||
F-48
Allowance for doubtful accounts
Schedule of movements in allowance for doubtful accounts in the Preem Group for the years ended December 31, 2001, 2002 and 2003:
| Year | Balance at beginning of period | Charged to costs and expenses | Charged (credited) to other accounts | Additions or Deductions (A) | Balance at end Of period | |||||
|---|---|---|---|---|---|---|---|---|---|---|
| 2001 | 46 | 12 | — | (15 | ) | 43 | ||||
| 2002 | 43 | 3 | — | (23 | ) | 23 | ||||
| 2003 | 23 | 0 | — | (1 | ) | 22 |
- (A)
- Primary write-offs of bad debts.
Comprehensive income
Comprehensive Income—The Company has adopted Statement of Financial Accounting Standards ("SFAS") No. 130, "Reporting Comprehensive Income," which establishes standards for the reporting and presentation of comprehensive income and its components in a full set of financial statements. Comprehensive income generally encompasses all changes in shareholders equity (except those arising from transactions with the owners) and includes net income (loss), net unrealized capital gains or losses on available for sale securities and foreign currency translation adjustments. Comprehensive income (loss) in accordance with Swedish GAAP were as follows:
| | Comprehensive income (loss) | Accumulated other comprehensive income (loss) | |||
|---|---|---|---|---|---|
| Balance of January 1, 2001 | (1 | ) | |||
| Net loss | (233 | ) | |||
| Foreign currency translation adjustment | (5 | ) | (5 | ) | |
| Comprehensive income 2001 | (238 | ) | |||
| Balance of December 31, 2001 | (6 | ) | |||
| Net loss | (148 | ) | |||
| Foreign currency translation adjustment | 8 | 8 | |||
| Change in group structure | 85 | 85 | |||
| Comprehensive income 2002 | (55 | ) | |||
| Balance of December 31, 2002 | 87 | ||||
| Net income | 226 | ||||
| Foreign currency translation adjustment | 1 | 1 | |||
| Comprehensive income 2003 | 227 | ||||
| Balance of December 31, 2003 | 88 | ||||
F-49
Proportional method
On April 17, 2002, Preem Petroleum AB and Norsk Hydro ASA signed a transaction structure agreement in which the parties agreed to combine the operations, assets and liabilities of Scanraff and Scancracker into a joint refining company with unified ownership shares and processing rights being held 75% by Preem and 25% by Norsk Hydro. Preem and Norsk Hydro agreed to use Scanraff as such joint refining company by assigning all shares of Scancracker to Scanraff in return for the issuance of such number of shares in Scanraff as was required in order to meet the ownership ratio of 75% for Preem and 25% for Norsk Hydro. As a consequence of this structure we adopted the proportional method under Swedish GAAP for group consolidation regarding Scanraff, meaning that 75% of the financial accounts for Scanraff was consolidated in Preem.
The proportional method is not permissible under U.S. GAAP and Scanraff is therefore consolidated for the financial year 2002. In 2003, Preem acquired the remaining 25% of Scanraff and is being consolidated for both Swedish and US GAAP. The transaction is treated as an acquisition of 25% in a subsidiary under Swedish GAAP and is under US GAAP determined to be an acquisition of assets.
Deconsolidation of subsidiary
On October 14, 2002, Preem Petroleum AB and Statoil signed an agreement concerning the sale of Preem's subsidiary company in Poland, Preem Polska. The sale of the Polish operations follows the decision by Preem Petroleum AB to concentrate further investments on refining and to strengthen its activities in Sweden. The transaction was finalized on January 31, 2003. The consolidated balance sheet as of December 31, 2002, does not include Preem Polska under Swedish GAAP. This would not be possible under U.S. GAAP, but has no effect on either net income or shareholders' equity of Preem. Total assets would be SEK 237 million higher as of December 31, 2002 under US GAAP.
Repurchase of capital lease
Preem acquired a desulphurization plant on December 19, 2002, that had been sold subject to a capital lease since a sale lease-back transaction in 1997. There is deemed to be a deferred tax liability connected to the acquisition which under Swedish GAAP has been recorded at a discounted value amounting to SEK 125 million. US GAAP does not allow tax liabilities to be discounted and is recorded gross. The remaining consideration of SEK 184 million is allocated as a deferred tax liability and long-term asset under US GAAP.
Note 27. Recently issued accounting standards
U.S. GAAP:
In May 2003, the FASB issued SFAS No. 150,Accounting for Certain Financial Instruments with Characteristics of both Liabilities and Equity. SFAS No. 150 establishes standards for how an issuer classifies and measures certain financial instruments with characteristics of both liabilities and equity. SFAS No. 150 is effective for financial instruments entered into or modified after May 31, 2003 and otherwise is effective at the beginning of the first interim period beginning after June 15, 2003. The adoption of SFAS No. 150 is not expected to have a material effect on the Company's financial position, results of operations or cash flows.
F-50
In December 2003, the FASB issued FASB Interpretation No. 46 (revised December 2003),Consolidation of Variable Interest Entities ("FIN 46R") which addresses how a business enterprise should evaluate whether it has a controlling financial interest in an entity through means other than voting rights and accordingly should consolidate the entity. FIN 46R replaces FASB Interpretation No. 46,Consolidation of Variable Interest Entities, which was issued in January 2003. The Company shall apply FIN 46 or FIN 46R to VIEs created after January 31, 2003 by the end of the first reporting period that ends after December 15, 2003. The Company shall apply FIN 46R to all entities no later than the end of the first reporting period that ends after March 15, 2004. For any VIEs that must be consolidated under FIN 46R that were created before January 1, 2004, the assets, liabilities and non-controlling interests of the VIE initially would be measured at their carrying amounts with any difference between the net amount added to the balance sheet and any previously recognized interest being recognized as the cumulative effect of an accounting change. If determining the carrying amounts is not practicable, fair value at the date FIN 46R first applies may be used to measure the assets, liabilities and non-controlling interest of the VIE. The adoption of FIN 46R is not expected to have a material effect on the Company's financial position, results of operations or cash flows.
In November 2002, the Emerging Task Force issued its consensus on EITF 00-21,Revenue Arrangements with Multiple Deliverables on an approach to determine whether an entity should divide an arrangement with multiple deliverables into separate units of accounting. According to the EITF in an arrangement with multiple deliverables, the delivered item(s) should be considered a separate unit of accounting if all of the following criteria are met: (1) The delivered item(s) has value to the customer on a standalone basis, (2) There is objective and reliable evidence of the fair value of the undelivered item(s), (3) If the arrangement includes a general right of return, delivery or performance of the undelivered item(s) is considered probable and substantially in the control of the vendor. If all the conditions above are met and there is objective and reliable evidence of fair value for all units of accounting in an arrangement, the arrangement consideration should be allocated to the separate units of accounting based on their relative fair values. However, there may be cases in which there is objective and reliable evidence of the fair value(s) of the undelivered item(s) in an arrangement but no such evidence for one or more of the delivered items. In those cases, the residual method should be used to allocate the arrangement consideration. The guidance in this Issue is effective for revenue arrangements entered into in fiscal years beginning after June 15, 2003. Alternatively, entities may elect to report the change in accounting as a cumulative-effect adjustment in accordance with Opinion 20. If so elected, disclosure should be made in periods subsequent to the date of initial application of this consensus of the amount of recognized revenue that was previously included in the cumulative effect adjustment. The impact of the adoption of EITF 00-21 is not expected to have a material effect on its financial position and the results of its operations.
Swedish GAAP:
Companies listed at a regulated Swedish market and companies in which there is a great public interest are as of 2004 to adopt the standard RR 29, Employee benefits, published by the Swedish Financial Accounting Standards Council. The standard is equivalent to IAS 19. For each financial year starting on or after 1 January 2005 all companies with securities admitted to trading on a regulated market shall prepare their consolidated account according to EU endorsed IFRS. Parent companies
F-51
whose debt securities only are admitted to public trading, are in a Swedish investigation proposed to adopt IFRS for each financial year starting on or after January 2007.
The adoption of RR 29 and IAS 19 means that all post-employment benefit plans have to be classified as defined contribution plans or defined benefit plans. In a defined contribution plan the contribution payable is recognized as an expense. In a defined benefit plan the company recognize the present value of the provision and an expense based on a number of assumptions. Assumptions are e.g. to be made about future salary-increase and inflation. The change in the pension liability on first adopting the new standard is charged directly to equity and the management estimates the difference to be approximately SEK 60 million.
Note 28. Pension information
The Group has certain Swedish pension arrangements that are not multi-employer or non-participating insurance arrangements that are funded through payments to a separate pension foundation. For Swedish GAAP purposes, pension expense for defined benefit pension plans is based on an actuarial computation. The net periodic pension expense and the vested benefit obligation have also been determined for U.S. GAAP purposes on the basis that would result if all employees are separated immediately. The accounting for pension plans in accordance with Swedish GAAP is different from the accounting and disclosure requirements of SFAS No. 87 "Employers Accounting for Pensions" and SFAS No. 132 "Employers Disclosure about Pensions and Other Post-retirement Benefits." The Company adopted SFAS 87 in January 1, 1996, and the transition amount was SEK 17 million, which is being amortized over a period of 15 years.
Pension cost, on the defined benefit plans, calculated in accordance with U.S. GAAP includes the following:
| | Year ended December 31, | |||||
|---|---|---|---|---|---|---|
| | 2001 | 2002 | 2003 | |||
| Service cost | — | — | — | |||
| Interest cost | 8 | 8 | 7 | |||
| Change in pension plan | — | — | 72 | |||
| Net amortization and deferral | — | (1 | ) | — | ||
| Net periodic pension cost | 8 | 7 | 79 | |||
F-52
The change in benefit obligation is as follows:
| | Year ended December 31, | ||||
|---|---|---|---|---|---|
| Change in benefit obligation | |||||
| 2002 | 2003 | ||||
| Benefit obligation at beginning of year | 153 | 149 | |||
| Interest cost | 8 | 8 | |||
| Actuarial gain (loss) | (1 | ) | — | ||
| Benefit paid | (11 | ) | (10 | ) | |
| Change in pension plan | — | 431 | |||
| Benefit obligation at end of year | 149 | 578 | |||
| Change in plan assets | |||||
| Fair value of plan assets at beginning of year | — | — | |||
| Change in pension plan | — | (359 | ) | ||
| Fair value of plan assets at end of year | — | (359 | ) | ||
| Funded status | 149 | 219 | |||
| Unrecognized loss | (10 | ) | (30 | ) | |
| Amounts recognized in the consolidated balance sheets consist of accrual pension liability | 139 | 189 | |||
Assumptions used in the calculation of pension obligations are as follows:
| | 2001 Sweden | 2002 Sweden | 2003 Sweden | ||||
|---|---|---|---|---|---|---|---|
| Weighted discount rate | 5.0 | % | 5.0 | % | 5.0 | % | |
| Rates of increase in compensation levels | 2.5 | % | 2.5 | % | 2.5 | % |
The projected benefit obligation and accumulated benefit obligation for pension plans with accumulated benefit obligations in excess of plan assets was SEK 139 million and SEK 139 million, respectively, as of December 31, 2002 and SEK 189 million and SEK 189 million, respectively, as of December 31, 2003.
Note 29. Related party transactions
Capital Trust Group. Capital Trust SA, through its subsidiaries, provides international merchant/investment banking services. A wholly owned subsidiary of Capital Trust SA acted as the Company's advisor in connection with its offerings of senior secured notes in 2001. For these services the Company paid a fee equal to 1.5% of the gross proceeds from the April 2001 offering of the notes and 1.5% of the gross proceeds from the July 2001 offering of the notes. In addition, Capital Trust SA, through its subsidiaries, provided certain technical and advisory services to Corral Petroleum Holdings AB and since 2001 has provided similar services directly to Preem Holdings AB. The existing contract governing these services, which Corral Petroleum Holdings AB assigned to Preem Holdings AB in January 2002, expires in September 2005. This contract will be automatically renewed after that period on an annual basis unless terminated by either party, and provides for an annual fee for services of $2.5 million. We also paid Capital Trust a fee of €3.2 million for advisory services it provided in connection with our
F-53
acquisition of 25% of Scanraff from Hydro R&M Holding AB in December 2003. Mr. John P. Oswald, a director and Chairman of the Board of Preem Holdings AB, is a principal shareholder of Capital Trust SA. Mr. Oswald also is a director of Preem Petroleum AB and Corral Petroleum Holdings AB. Mr. Bassam Aburdene, a director of Preem Petroleum AB, is also a principal shareholder of Capital Trust SA. We believe that the foregoing transactions were entered into on terms no less favorable than those that could have been obtained from an unrelated third party.
Midroc Scandinavia AB. Midroc Scandinavia AB, a company in which Mr. Al-Amoudi has a majority shareholding, has provided and continues to provide maintenance and construction services, through its subsidiaries, to Preem Petroleum AB. For these services, Preem Petroleum AB paid SEK 140 million in 2003 and SEK 137 million in 2002. Many of these services are provided on an as-needed basis. Accordingly, the amounts paid for these services may vary from year to year depending on the amount of services provided. We believe that the foregoing transactions were entered into on terms no less favorable than those that could have been obtained from an unrelated third party.
Shareholder Loan. As of December 31, 2003, Preem Holdings AB owed SEK 242 million to Corral Petroleum Holdings AB in the form of an interest-free subordinated shareholder loan with no maturity date (the "Corral Loan"). Preem Holdings AB loaned the proceeds of the April 2001 offering of the senior secured notes (net of the initial purchasers' discount, the expenses of such offering and an amount equal to the first interest payment due on the notes) to Preem Petroleum AB, pursuant to a subordinated intercompany loan denominated in Kronor. Preem Petroleum AB used approximately €220 million of the funds received to repay all but approximately €27 million of the Corral Loan. In connection with the right to receive the approximately €27 million portion of the Corral Loan being assigned by Corral Petroleum Holdings AB to Preem Holdings AB, Preem Holdings AB incurred a corresponding subordinated shareholder debt to Corral Petroleum Holdings AB pursuant to an interest-free subordinated shareholder loan with no maturity date.
Intercompany Loans. On April 10, 2001, the intercompany loans owed to Preem Holdings AB by Preem Petroleum AB, which consisted of the approximately €223 million loan of a portion of the proceeds of the April 2001 offering of the senior secured notes and the approximately €27 million remaining balance of the Corral Loan assigned to Preem Holdings AB, were restructured into a single intercompany loan. The SEK 2,277 million principal amount of this restructured loan equaled the Krona equivalent, on April 10, 2001, of the principal amount of the notes issued on such date. The resulting loan is subject to a security assignment to the trustee, on behalf of the holders of the notes, to secure the notes. The loan matures on March 31, 2011, will be non-interest-bearing, subordinated with a 179-day standstill provision, and will default in the event that indebtedness in excess of SEK 150 million in the aggregate under any loan agreement or other credit facility of Preem Petroleum AB is declared prematurely due and payable or placed on demand as a result of an event of default. The loan is subordinated to the existing and future debt of Preem Petroleum AB, and certain of Preem Petroleum AB's creditors will be given the right to enforce this subordination.
Following the July 20, 2001 offering an additional tranche of senior secured notes, Preem Holdings AB distributed a portion of the proceeds of this offering equal to approximately €22.5 million to its parent company, Corral Petroleum Holdings AB. This distribution took the form of two interest-free loans by Preem Holdings AB to Corral Petroleum Holdings AB. These interest-free loans
F-54
were made in accordance with the restricted payments covenant set forth in the indenture related to the senior secured notes.
Svenska Petroleum Exploration AB. Preem Petroleum AB performs a cash management function for Svenska Petroleum Exploration AB, which is indirectly controlled by Mr. Al-Amoudi. The liability associated with such cash management services amounted to SEK 61 million as of December 31, 2003 and SEK 286 million as of December 2002. The amounts represents the cash balances attributable to Svenska Petroleum Exploration AB. The liability bears an interest corresponding to the interest that Preem Petroleum AB receives from the banks where such funds are deposited. We believe that the foregoing transactions were entered into on terms no less favorable than those that could have been obtained from an unrelated third party.
Note 30. Subsequent events
In January 2004 the construction of the Isocracker unit resumed at Scanraff. The investment is expected to amount to approximately SEK 3,500 million and is due to be taken into operation in 2006.
In March 2004 an agreement for the sale of the Norwegian subsidiary was signed. The transaction is not expected to impact the profits in 2004.
F-55
SIGNATURES
DISCLOSURE REGARDING FORWARD-LOOKING STATEMENTS
PRESENTATION OF INFORMATION
PRESENTATION OF FINANCIAL INFORMATION
CURRENCY PRESENTATION
EXCHANGE RATE INFORMATION
SUMMARY
Overview
Our Strengths
Our Strategy
Recent Developments
Risk Factors
Organizational Structure
The Offering
RISK FACTORS
USE OF PROCEEDS
CAPITALIZATION
SELECTED CONSOLIDATED FINANCIAL DATA
OPERATING AND FINANCIAL REVIEW AND PROSPECTS
RELATED PARTY TRANSACTIONS
DESCRIPTION OF CERTAIN INDEBTEDNESS
INDEX TO FINANCIAL STATEMENTS
REPORT OF INDEPENDENT ACCOUNTANTS
Preem Holdings AB and Subsidiaries Consolidated Statements of Operations Years ended December 31, 2001, 2002 and 2003
Preem Holdings AB and Subsidiaries Consolidated Balance Sheets As of December 31, 2002 and 2003
Preem Holdings AB and Subsidiaries Consolidated Balance Sheets As of December 31, 2002 and 2003
Preem Holdings AB and Subsidiaries Consolidated Statements of Cash Flows Years ended December 31, 2001, 2002 and 2003
Preem Holdings AB and Subsidiaries Consolidated Statements of Cash Flows Years ended December 31, 2001, 2002 and 2003
Preem Holdings AB and Subsidiaries Notes to the Consolidated Financial Statements Years ended December 31, 2001, 2002 and 2003