QuickLinks -- Click here to rapidly navigate through this documentExhibit 1
| From |
| 2003 to 2004, |
Geac's net earnings increased 79.4%.
New license revenue increased 32.0%.
Revenue increased 9.0%. |
Geac. Delivering results through change. |
2004 Annual Report |
"Action [is] the great business of mankind."—John Locke
Successful companies, like successful
people, are defined by their actions.
At Geac, fiscal 2004 was a year of action
and change. Having formulated a master
plan to revitalize and reinvent the
company based on several key strategies—
"Build, Buy and Partner," Business
Performance Management, organic growth
and rigorous cost control—Geac took
many actions this year to execute its goals.
While its reinvention is still a work in
progress, Geac's FY2004 financial results
began to demonstrate the soundness of its
strategies, and the efficacy of its actions.
Change comes in bursts, so financial
results will follow unevenly.
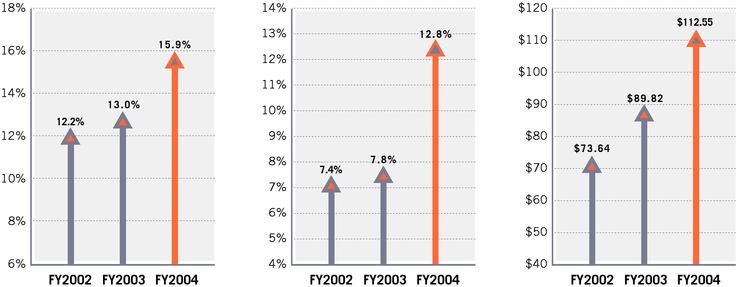
Geac 2004 Financial Highlights (U.S. Dollars)
Earnings Before Income Taxes
as a Percent of Total Revenue | | Net Earnings as a Percent
of Total Revenue | | Cash and Cash Equivalents
in Millions |
 |
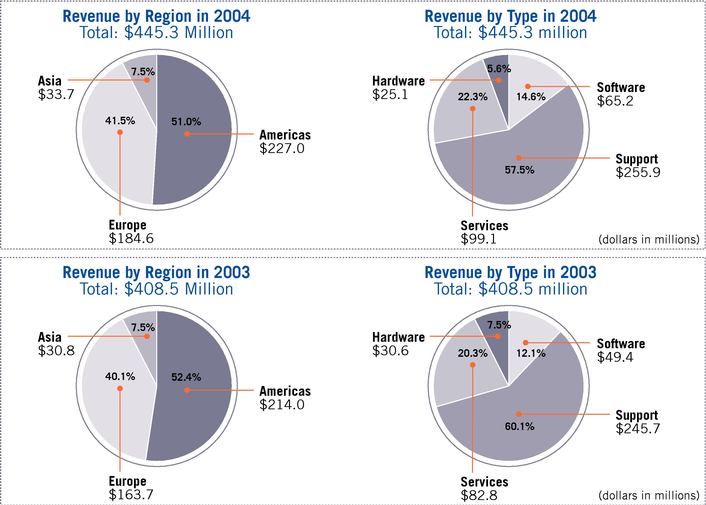
Revenue Segmentation
1
 | |
Geac: Change for Profitability | | |
Charles S. Jones, President & Chief Executive Officer
|
To Our Shareholders:
Last year, Geac promised change—change for the profitability of our shareholders, change for the benefit of our customers, and change for the long-term opportunity of our employees. In fiscal year 2004, we delivered upon our promise.
In my letter to you a year ago, we committed to growing our revenue. We strove to make our acquisitions successful. And, importantly, we asserted that we would improve our earnings. Collectively, we have accomplished these tasks.
REVENUE GROWTH
In fiscal year 2004, Geac's revenue reached US $445.3 million, compared to US $408.5 million last year. Your management team has diligently focused on increasing license sales across product lines in the many regions in which we operate. This effort permeated every corporate action taken, but was driven by three major initiatives. First, we closely examined key product lines in place—product lines that could capitalize on emerging market opportunity—and we invested in strategic development initiatives within those lines to expand product functionality and market presence. The result was the significant organic growth of three traditional applications within the existing product suite. Second, we built advanced connectivity and utility applications to link our traditional back office solutions with new flexible front end applications in Geac's expanded Performance Management suite of products. This development effort enabled existing customers to extend the lives and functionality of their current Geac systems and generated additional license and service sales from our customer base. Third, and most important, through acquisition and partnership, we increased our activity within the Performance Management product family and benefited from marketing, sales and distributor alliances as we worked to expand the reach of this newest product line across our existing customer base and with new prospects. By expanding both our product footprint and our customer base, we accelerated sales opportunities across many of Geac's product lines.
With a commitment in these areas, Geac delivered strong results year over year with license revenue growth of 32%. The Company will continue to pursue initiatives with organic product growth, with internal development and with strategic acquisitions and partnerships.
ACQUISITION INTEGRATION
Throughout fiscal year 2004, we continued to deliver against our Business Performance Management strategy. This year, we integrated the Extensity expense and resource management applications into Comshare's offerings to broaden the capability of Geac's financial planning and budgeting applications. Comshare's expanded Performance Management suite of budgeting, planning, forecasting and consolidation was enhanced with additional internal development, which enabled easier integration with existing Geac customer installations and which offered expanded capability. Not only was the newly acquired product suite valuable to our existing customer base, but Comshare's and Extensity's products also assisted our own management in implementing budgeting policies. Additional integration into Geac's enterprise applications is ongoing as we expand this essential front office technology to an increasing number of Geac product lines in both our Enterprise Applications Systems and our Industry Specific Applications divisions. With the successful melding and evolution of these highly regarded software suites into Geac, the Company has launched its Geac Performance Management family of products.
2
 | | Donna de Winter
Senior Vice President and Chief Financial Officer | |  | | Timothy J. Wright
Chief Executive, EMEA and Asia Pacific and Chief Technology Officer | |  | | James M. Travers
Senior Vice President and President, Geac Americas |
"The Company's 79.4% increase in net earnings year over year is testament to the fiscally responsible manner in which Geac management has integrated new businesses, invested in key products and managed all Company resources."
The success of Geac Performance Management in fiscal year 2004 underscores a cornerstone of the Company's acquisition strategy—increasing sales by providing incremental functionality to our extensive existing customer base with new product offerings that create value. Importantly, the existing pipeline for Geac Performance Management continues to include existing Geac customers. Partnerships with companies such as Microsoft and American Express have provided additional momentum, as a significant number of license deals closed in this past year were through distributors or through joint selling initiatives.
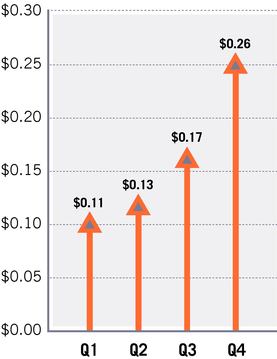
EARNINGS IMPROVEMENT
The Company's 79.4% increase in net earnings year over year is testament to the fiscally responsible manner in which Geac management has integrated new businesses, invested in key products and managed all Company resources. The results throughout the year provided a sequential increase for our shareholders in earnings per share in each quarter with a year over year increase in basic earnings per share of $0.28. We executed in a deliberate and focused manner against key business priorities. Geac managed its costs in anticipation of changes in revenue in various parts of its business. Our success in building net earnings was achieved not only with an increase in revenue, but also with a decrease in general and administrative costs over the year. In addition, the Company was able to increase its gross margin from 58.6% to 60.7%. Management remained diligently focused on cost control throughout the year and worked aggressively to reduce redundancies and to create efficiencies around the new acquisitions. Our employee headcount before the Comshare acquisition was approximately 2,500. We added 333 employees with the Comshare acquisition and finished the year with approximately 2,300 employees worldwide, representing a reduction of about 530 redundant positions, or more than 21%, while increasing sales by 9%. The Company ended fiscal year 2004 with a cash position of $112.6 million, generating net cash from operations of $66.6 million.
Fiscal Year 2004 Diluted Net Earnings Per Share
3
 | |
Letter to Shareholders (continued) |
"Whether our customers have a need to do more with less as a result of an increasingly competitive environment or as a result of regulatory pressure, Geac delivers best-in-class technology solutions for the issues confronting the CFO."
With the achievement of key change initiatives focused on revenue growth, acquisition integration and earnings improvement in fiscal year 2004, Geac is well positioned to seize new opportunities for growth and product expansion over the longer term in support of new customers and its existing 18,000 customers worldwide.
CHANGE FOR THE BENEFIT OF OUR CUSTOMERS
Not only did Geac achieve its operational execution goals, but Geac also developed more client solution specificity and capability with System21 Aurora, Libraries, Local Government, and Performance Management. Geac is the software solution for the Chief Financial Officer. Whether our customers have a need to do more with less as a result of an increasingly competitive environment or as a result of regulatory pressure, Geac delivers best-in-class technology solutions for the issues confronting the CFO.
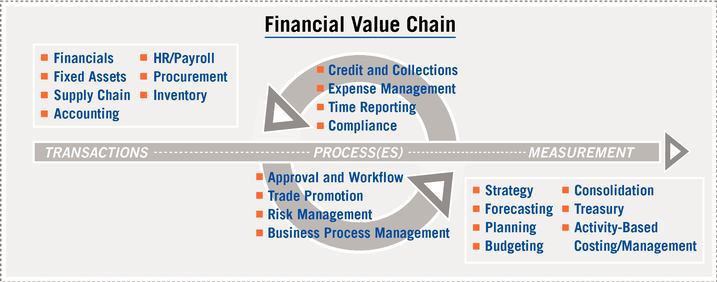
CFOs are focused on the financial value chain, which enables financial management over end-to-end business processes. Geac offers solutions that enable a range of business transactions and processes, as well as the precise measurement and insightful analysis crucial to successfully managing any business.
Through internal development, strategic partnerships and target acquisitions, Geac was able to extend value to our current customer base with expanded front-end technology solutions and with critical new business performance management functionality. Beyond mere functionality, we enabled the leadership of our customers' financial teams by facilitating visibility and control over all financial information. This is not simply the provision of accurate and timely financial information, it is also access to superior, sophisticated analytical results.
Geac's product strategy and the new Geac Performance Management family of products benefited from certain market conditions in fiscal year 2004. In this changing environment, our customers began to address increasing regulatory requirements, they attempted to rationalize their own organizations in the wake of rapid consolidation, and they worked to address the limitations of current technology models and platforms in the face of an increasingly mobile and Web-based workforce. Through our "Build, Buy and Partner" strategy, we focused on the market challenges our customers faced and delivered the technology solutions they needed.
CHANGE FOR THE BENEFIT OF OUR EMPLOYEES
Ourchange philosophy has permeated every effort throughout the Company this year. The impact of our change actions on our financial results and customer offerings has been dramatic. In turn, we have built better relationships, confidence in our future success and an improving environment for all of our employees. Quite simply, Geac is a better place to work at today than it was a year ago, and it will become even better. We have increased the opportunity for professional and career development across the employee base and witnessed the benefits through enriched customer relationships and a unified focus on long-term shared success.
4
 | | Jack Dolmat-Connell
Senior Vice President, Human Resources | |  | | Alys Scott
Vice President, Global Communications | |  | | Jeff Snider
Senior Vice President and General Counsel |
"Geac focuses on its financial performance with a rigid commitment to the way in which we account for and communicate our performance."
We were delighted to see a strong participation rate of nearly 25% of all North American employees in the Company's new Employee Stock Purchase Plan offering, which exhibited a 43% increase in value over the six-month offering period. With this effort, Geac is aligning the interests of its employees with those of its shareholders. We anticipate even greater participation in this program as we introduce it worldwide in fiscal year 2005.
GOING FORWARD
Geac embraced change in fiscal year 2004. The impact of this change created opportunity for our shareholders, for our customers and for our employees.
We take measured pride in the consistency of the Company's performance throughout fiscal year 2004 and with our ability so far to deliver to our shareholders continually improving results, quarter over quarter and year over year. Geac focuses on its financial performance with a rigid commitment to the way in which we account for and communicate our performance. In fiscal year 2004, approximately 1% of total annual revenue was allocated to corporate governance costs assuring proper adherence to Regulatory, Exchange and Board Policy. Our corporate governance commitment is more formally outlined by our Chairman of Corporate Governance preceding the financial section of this annual report.
We have solidified a business path and a technology direction through our expanded Geac Performance Management suite. Importantly, this direction not only preserves the integrity of our important enterprise applications, but it also delivers additional value through our improved front end applications. In so doing, we believe we are serving our customers well. While we understand that market conditions and the complexity of our business will continue to be intensely challenging for Geac, our performance demonstrates the ability of this management team to achieve success in a fiscally responsible manner and, importantly, to steer a steady course in a complex and variable global business environment. These attributes become increasingly important as we examine our strategic alternatives for revenue growth and product expansion in the coming year. We recognize the short-term necessity to grow the business by acquisition. Improving our business will be an uneven activity, but we are committed to the long-term success of our customer and employee relationships, which, in turn, will benefit our shareholders.
We ask you to join us in thanking our 2,300 loyal employees in 53 offices in 22 countries for their continued dedication and hard work. We are grateful for the ongoing commitment of our customers to invest in Geac's growing product lines. And we thank you, our shareholders, for your continuing support as we strive to transform Geac into a leading Performance Management software company serving markets throughout the world.
On behalf of our entire team,
Respectfully submitted, | | |

Charles S. Jones |
|
|
President and Chief Executive Officer
July 21, 2004 | | |
5
 | |
Geac: The Software Company for the CFO |
Geac is the software solution for the Chief Financial Officer. Whether our customers have a need to do more with less as a result of an increasingly competitive environment, or as a result of regulatory pressure, Geac delivers best-in-class technology solutions for the issues confronting the Chief Financial Officer.
6
Geac Lines of Business: A Profile
Geac is engaged in a process of strategic change as it creates a software company uniquely geared to optimizing an organization's financial value chain. In so doing, Geac is bringing Performance Management to its customer base, and to the industry at large.
The CFO is responsible for thefinancial value chain of an organization in its entirety, but virtually every employee of an organization touches at least one link in that chain. That means the information systems designed to optimize an organization's financial value chain must, by definition, be pervasive. And so it is with Geac systems: They are used continuously and widely throughout the organizations in which they are deployed—approximately 18,000 worldwide, including about half of the Fortune 100.
The financial value chain enables financial management over end-to-end business processes. So, Geac offers software and services that address fundamental transactional activities, such as accounting, procurement and inventory. Geac also offers solutions that optimize processes embedded within the financial value chain, such as expense management and compliance. And Geac offers solutions that enable the precise measurement and insightful analysis so crucial to successfully managing any business—including strategic planning, budgeting, forecasting, and more.
Organizationally, Geac segments its business intoEnterprise Applications Systems (EAS), which represent about 80 percent of Geac's global revenue, andIndustry Specific Applications (ISA). Geac's EAS offerings include various ERP systems and the Geac Performance Management product family, the newest line of Geac solutions and a growth engine for Geac's software license revenue. Geac's ISA business units develop and sell specialized software and systems for libraries, local government administration, public safety agencies and the real estate, restaurant, property management and construction marketplaces.
7
 | |
Geac: Extending the Value of Customers' Technology Investments |
Strategy: Build, Buy & Partner
Deploy Geac's technical and financial resources creatively and efficiently to develop internally, acquire, or forge alliances to strengthen Geac's product and service portfolio for optimizing the financial value chain.
THE ACTIONS
In 2004, Geac executed a strategy for company growth and a more competitive leadership position in Business Performance Management through "Build, Buy and Partner" initiatives. With internal product development, acquisition, and strategic partnering, Geac continued to expand its range of products and solutions, enabling CFOs to address more effectively business challenges such as remaining competitive and compliant, managing change and measuring results, growing their businesses and containing costs, and maximizing the return of their existing investments. Additionally, Geac's "Build, Buy, and Partner" initiatives created opportunities to grow Geac's top line revenue across the business with increased license sales.
THE RESULTS
› BUILD
Extending the value of existing Geac applications and customer solutions, Geac developed new E and M Series integration applications linking new Performance Management functionality with existing product lines. Building on acquired products, Geac developed Strategy Management to help companies measure the effectiveness of business strategies; introduced a new version of MPC (Management Planning & Control) to offer greater financial consolidation and reporting capabilities; and created a browser-enabled version of Geac Expense Management. Recently Geac announced more new home-grown products, including Geac Compliance Management, SmartStream 7.0 and System21 Performance Analyzer.
› BUY
Geac's acquisition strategy has focused on buying technologies at a discount and revitalizing and integrating them with existing applications. Geac's acquisition of Comshare, Inc. and its MPC suite provided Geac with the centerpiece of the Geac Performance Management product line, creating incremental revenue opportunities with new and established customers.
› PARTNER
Geac's partnership with Lombardi Software introduced business process management to Geac's product suite, which provides the foundation for a range of offerings including the new Geac Compliance Management product. Through a partnership with IBI, Geac delivered advanced Web extensions with its newest Enterprise Intelligence product. Geac also expanded its global strategic alliance with Microsoft, which has contributed to new license sales, and entered into a partnership with American Express Tax and Business Services to extend the North American sales channel for Geac Performance Management.
"We are partnering with Geac to utilize their market leading performance management solutions in an effort to further bolster companies' operational effectiveness."
American Express Tax and Business Services
8
Focus: Business Performance Management
Offer an expanding set of solutions for CFOs that builds on their existing systems, that provides new capabilities for strategic planning and management, and that enables CFOs to run more efficient and effective finance operations.
THE ACTIONS
Geac fortified its position as a Business Performance Management leader with its acquisition of Comshare, Inc. Geac successfully integrated Comshare's worldwide operations and began to sell the MPC software suite into Geac's customer base. MPC, already highly respected in the marketplace, became even more attractive to prospective customers because of Geac's strong global support and financial resources. MPC joined Expense Management in a portfolio of solutions now known as Geac Performance Management.
THE RESULTS
Upon the Comshare acquisition, Geac's priority becameproduct integration: A focused effort to sell Geac Performance Management to existing Geac customers, to infuse new capabilities into key Geac product lines and to extend the performance of customers' financial value chains. With new rapid integration tools, Geac EnterpriseServer customers were the first to benefit. By fiscal year-end, Geac had incorporated budgeting and reporting capabilities into System21 Aurora, Geac's flagship mid-market ERP offering; AMSI property management software; and commenced developing integration products for SmartStream and other ISA solutions.
Geac also executed on its Business Performance Management focus by creating a hosted offering and pure Web-based version of Geac Expense Management, now available worldwide. These developments provided customers more ways to buy, deploy and use automated expense reporting capabilities.
"With Geac Performance Management, we'll be able to analyze data faster because the system is so efficient and the information is easy to access. We'll be more efficient at budgeting and better able to understand our financials."
Commerce Bancshares, Inc.
PERFORMANCE MANAGEMENT SOLUTIONS MAP
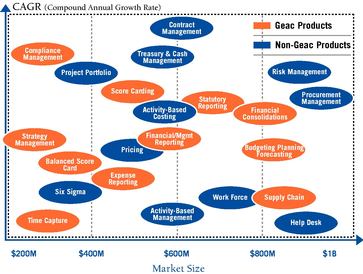
Geac helps companies track operations against strategy; forecast, manage, and measure business processes; control costs; and ensure compliance. Geac will continue to "Build, Buy and Partner" to expand the Geac Performance Management product line, carefully considering our customers' needs and the market opportunity for specific new solutions.
9
 | |
Geac: Reliable, Secure and Flexible Solutions to Address and Manage Change |
Priority: Organic Growth
Drive increased software license sales from established Geac product lines by identifying new customers and markets, and by adding new value to those products for existing customers.
THE ACTIONS
Assessing the stabilization of the ERP market, Geac's traditional and majority line of business, Geac determined that the acquisition of Business Performance Management solutions alone would not be enough to generate new license sales and reduce customer base attrition. It was imperative that Geac create cross-sell and up-sell opportunities within established Geac lines of business, opening doors for future license sales with existing and new customers.
Geac's reinvention efforts made an impact on three of its business units in particular, with new license revenue generated by product investments: System21, Library Solutions and Local Government.
THE RESULTS
Geac System21 Aurora exemplifies the benefits of Geac's investment of financial and technical resources to reinvigorate a product line. Deployed in 2004, System21 Aurora is a state-of-the-art, mid-market ERP offering that offers expanded functionality and the ability to integrate with the customer's enterprise network. Aurora is re-energizing the System21 customer base and winning new business—as evidenced by year-over-year revenue growth for the System21 business in the fourth quarter of 29%.
Geac Library Solutions' Vubis Smart Web-based library automation system surpassed 100 customer installations this year—even prior to its launch in North America, which is currently in process. Success with existing customers—including some of the most prestigious universities in Europe—and expansion into new organizations, such as Belgium's Library for the Blind, has accounted for this business unit's growth. License revenue in Library Solutions grew nearly 45% in fiscal fourth quarter from the previous quarter.
Geac Local Government continued to grow its business with municipal councils in Australia and New Zealand. Recently the City of Auburn, home to the majority of the Sydney Olympics sporting venues and a population of more than 50,000, purchased Geac's land information system, Pathway PPR, and the City of Melbourne signed a six-figure contract to install additional Pathway PPR to expedite the processing of approximately 450,000 parking tickets a year. License revenue in Geac Local Government grew 41% in the fiscal fourth quarter compared to the previous quarter.
"Geac's Vubis Smart is the most innovative and flexible system for managing data in a variety of formats. We are confident that Vubis Smart will enable us to provide excellent access and service to our customers."
Kingston Frontenac Public Library
10
Imperative: Rigorous Cost Control
Maximize profit and shareholders' equity by rigorously controlling costs and instilling a philosophy of creatively doing more with less throughout the organization.
THE ACTIONS
Similar to the needs of customers that use Geac's Performance Management solutions to help them contain costs and make the most of their resources, Geac has also undertaken measures to examine its operating and development expenses to improve its bottom line.
Geac is using its own performance management technologies to integrate back office business processes to share resources better across the organization. Implementing Geac budgeting, planning and expense management solutions, Geac is creating more efficiency and eliminating operational redundancies throughout the organization. Geac continues to assess real estate, legal and other administrative costs and is increasing its use, reporting and tracking of key financial and operational benchmarking metrics. These improvements will be required to absorb the increased regulatory costs of corporate governance.
THE RESULTS
Two numbers tell the story: This year Geac grew its top line by 9.0%, and its bottom line by 79.4%. The improved outcome was in large part due to effective cost control.
For example, Geac continues to reassess its real estate holdings and, as appropriate, to consolidate facilities and renegotiate leases in order to drive cost out of operations.
Geac was able to reduce total headcount again during a year of revenue growth, product innovation, and strategic acquisitions. Starting fiscal year 2004 at approximately 2,500 employees and acquiring Comshare with nearly 333 employees, Geac ended its fiscal year with approximately 2,300 employees, effectively reducing the global workforce by 8% from the start of the year, even after the integration of Comshare.
During the year, the Company increased license sales by 32%, improved its gross profit margin and reduced its General and Administrative expenses as a percentage of sales. In total, Geac was successful in decreasing continuing development costs 6.3% in the fourth quarter from the third quarter run rate.
"Using System21, we were able save millions of dollars by giving our manufacturing personnel visibility and control of the systems they needed to adjust inventories quickly and efficiently."
Smith & Wesson
11
 | |
Geac: Good Governance Builds Great Reputation
| | |
Corporate Governance at Geac
The increased focus on corporate governance by shareholders and regulatory authorities has resulted in new legislative requirements and policy guidelines. Geac has followed these developments carefully and implemented a number of measures to meet existing and pending legislative and stock exchange requirements. These measures involve an additional commitment of management resources and related expenses for all public companies, including Geac.
Board Structure
Your Board is composed of unrelated directors, with the sole exception of the President and Chief Executive Officer (and former Chairman of the Board). This allows for maximum breadth of participation on committees by outside directors, since there is no shortage of unrelated directors. The Board committees include Audit, Human Resources and Governance.
At Geac, the roles of Chairman and Chief Executive Officer are separated. This separation was, in fact, encouraged by the former Chairman (now President and Chief Executive Officer) in the belief that it is an appropriate separation of roles to allow for a healthy degree of enquiry on behalf of the Board into executive activity and strategic planning.
Risk Management
Risk Management, together with succession planning and strategic planning, are the three principal activities of a Board. With respect to risk management, governance at Geac includes the creation of an internal audit function whose mandate is to assist senior management and the Board in the effective discharge of their responsibilities by furnishing them with analyses, recommendations, counsel and information concerning the activities reviewed, and new or revised systems recommended or decreed by the Board or senior management. The company has appointed a Director of Internal Audit, Wendy Conrod, and has retained the services of Ernst & Young to assist the Director in carrying out a comprehensive annual program of internal audit review. The internal audit function reports to the Chair of the Audit Committee.
A further risk factor facing public companies in the post-Enron era is the risk of reputational damage flowing from inadequate or untimely disclosure. Geac has responded to regulatory suggestions through the creation of a senior management disclosure committee.
Board Functioning
Apart from regularly scheduled quarterly Board meetings, Geac's Board devotes two exclusive days a year to strategic planning. Additionally, a budget review and approval meeting is conducted once a year, or more often if necessary. At all regularly scheduled Board meetings, as a matter of course the independent directors meet among themselves in camera, in the absence of management.
Board Evaluation
Geac has a program of director self-evaluation, conducted by the Chairman of the Board, in association with the Chairman of the Corporate Governance Committee, so as to maximize the benefit which the Board draws from each member's potential contribution.
12
Ethical Conduct
Finally a matter which perhaps should better be placed first in this discussion: Ethical conduct in the course of the conduct of Geac's business. Geac has a Code of Business Conduct and Ethics, which can be found on its web site. This code has been circulated to all employees.
IN SUMMARY: Governance is a matter which we take seriously. We believe that we have responded positively to the requirements of regulators and investors in our stock.
Respectfully submitted,

Thomas Allen | | |
PROFESSIONAL INVOLVEMENT
- •
- Mr. Allen is a Senior Partner of Ogilvy Renault in Toronto.
- •
- Mr. Allen is also Chairman of the Accounting Standards Oversight Council of Canada and a member of the Advisory Board of the Office of the Superintendent of Financial Institutions of Canada.
- •
- Mr. Allen is past Chairman of the Corporate Finance Committee of the Investment Dealers Association of Canada (IDA), a former public director of the IDA, and a former member of the IDA's Executive Committee.
- •
- Mr. Allen is a Fellow of the Chartered Institute of Arbitrators (London, England).
- •
- Mr. Allen was a member of a committee commissioned last year by the Ministry of Finance in Canada to review the structure of securities regulation in Canada.
- •
- Mr. Allen has been a frequent speaker at conferences held by many organizations on topics relevant to the investment industry.
13
| Board of Directors |
 |
|
|
|
 |
|
 |
C. Kent Jespersen
Chairman of the Board,
Geac Computer
Corporation Limited |
|
Thomas I. A. Allen, Q. C.
Senior Partner,
Ogilvy Renault |
|
David Friend
General Partner,
Orchid Partners |
|
Pierre MacDonald
Chairman and Chief
Executive Officer,
MacD Consult Inc. |
 |
|
 |
|
 |
|
 |
Michael D. Marvin
Founder and Chairman
Emeritus, MapInfo
Corporation |
|
William G. Nelson
Private Investor |
|
Robert L. Sillcox
Chairman,
Quant Investment
Strategies, Inc. |
|
Charles S. Jones
President and Chief
Executive Officer,
Geac Computer
Corporation Limited |
Management Team |
 |
|
 |
|
|
|
|
Charles S. Jones
President and
Chief Executive Officer |
|
Hema Anganu
Treasurer |
|
Donna de Winter
Senior Vice President and
Chief Financial Officer |
|
Jack Dolmat-Connell
Senior Vice President,
Human Resources |
 |
|
|
|
|
|
 |
Larry Kaplan
Senior Vice President |
|
Alys Scott
Vice President,
Global Communications
and Investor Relations |
|
Jeffrey Snider
Senior Vice President
and General Counsel |
|
Craig C. Thorburn
Senior Vice President,
Mergers & Acquisitions and
Corporate Secretary |
|
|
|
|
|
|
|
James M. Travers
Senior Vice President
and President,
Geac Americas |
|
|
|
Timothy J. Wright
Chief Executive, EMEA
and Asia Pacific and
Chief Technology Officer |
|
|
14
Table of Contents
| Management Discussion and Analysis | | 16 |
Auditors' Report |
|
45 |
Consolidated Financial Statements |
|
46 |
Notes to the Consolidated Financial Statements |
|
50 |
Management Discussion and Analysis
The following management discussion and analysis of results of operations and financial position should be read in conjunction with the consolidated financial statements and notes for the fiscal years (FY) ended April 30, 2004 and April 30, 2003. This following discussion and analysis contains forward-looking statements that relate to future events or our future financial performance or results. In addition, these forward-looking statements include, but are not limited to, statements regarding our plans, objectives, expectations and intentions. These forward-looking statements are neither promises nor guarantees but rather are subject to a number of risks and uncertainties which could cause actual results to differ materially from those described in the forward-looking statements, including the risks and uncertainties set forth in the section entitled "Risks and Uncertainties." You should not place undue reliance on any such forward-looking statements, which are current only as of the date when made. You should not expect that these forward-looking statements will be updated or supplemented as a result of changing circumstances or otherwise, and we disavow and disclaim any obligation to do so.
Our financial statements are prepared and filed in accordance with accounting principles generally accepted in Canada ("Canadian GAAP"). Note 23 to our consolidated financial statements sets out the differences between accounting principles generally accepted in the United States ("U.S. GAAP") and Canadian GAAP that would affect our financial statements. Our financial statements have historically been reported in Canadian dollars. Effective May 1, 2003, we adopted the U.S. dollar as our reporting currency since U.S. dollar denominated operations represent an increasingly significant portion of our operations. Accordingly, the change of our reporting currency from the Canadian dollar to the U.S. dollar reduces our exposure to foreign currency translation adjustments. Comparative financial information for the fiscal year ended April 30, 2003 has been recast as if the U.S. dollar had always been used as our reporting currency, and financial information has been translated into U.S. dollars for all periods presented. As used in this discussion, and unless the context otherwise requires or unless otherwise indicated, all references to "Geac," "we," "our," "the Company" or similar expression refer to Geac Computer Corporation Limited and its consolidated subsidiaries. All dollar amounts herein are expressed in U.S. dollars unless otherwise noted, and references to "FY" are references to our fiscal year end, which ends on April 30 of each year.
On February 3, 2004 our common shares were registered under the Securities and Exchange Act of 1934 and began trading on the NASDAQ National Market under the ticker symbol "GEAC." Our common shares also continue to be listed on the Toronto Stock Exchange under the ticker symbol "GAC."
OVERVIEW
Geac is the software solution for the Chief Financial Officer. Whether there is a need to do more with less as a result of an increasingly competitive environment or as a result of regulatory pressure, Geac provides best-in-class technology solutions for the issues confronting the Chief Financial Officer.
We are a leading global provider of software solutions for business performance management, providing customers worldwide with financial and operational technology solutions to improve their business performance in real time. Geac Performance Management (GPM) is an integrated product suite that we offer for business performance management that enables companies to bolster their effectiveness by tightening the linkage between business strategy formulation and operational execution. Our software solutions include cross-industry enterprise application systems (EAS) for financial administration and human resources functions, expense management, time capture, budgeting, financial consolidation, management reporting and analysis and enterprise resource planning applications for manufacturing, distribution, and supply chain management. We also provide industry specific applications (ISA) tailored to the real estate, restaurant, property management, local government and construction marketplaces, and for libraries and public safety agencies. In addition, we resell computer
16
hardware and software, and provide a broad range of professional services, including application hosting, consulting, implementation services, and training worldwide.
To deliver these products and services, we employed approximately 2300 people worldwide on April 30, 2004 compared to approximately 2500 on April 30, 2003. On April 30, 2004, 16% of our employees were in sales and marketing, 27% in services, 23% in support, 22% in research and development and 12% in corporate services.
Today we assist many of the largest companies in the world who rely on our software applications for their financial transaction analysis and operational processing.
GEAC GROWTH STRATEGY
Software Revenue Growth
We intend (i) to extend relationships with our existing customers by improving the productivity and return on investment of our customers' existing business processes with new products that build on our customers' enterprise and resource planning (ERP) systems and Internet frameworks, and (ii) to attract new customers by delivering a suite of software solutions that can be integrated with their existing enterprise application systems. In both cases, we target our software solutions to the Chief Financial Officer of customers to help improve business performance utilizing their existing information technology investments. We need to continue to identify compelling products that expand upon and complement our existing suite of performance management products and then employ a combination of three strategies to aggregate those complementary target product offerings: build, buy and partner. Each component of the build, buy and partner strategy is critically important for us to achieve our growth strategy. We believe that if we are successful in achieving new product offerings from organic development or acquisitions and we develop partnerships to enhance our product offerings, sales and/or services, these objectives may be fulfilled and new software license revenue will likely increase. Software license revenue is the principal driver for support revenue and professional services revenue and therefore needs to increase as a percentage of the revenue mix to generate total revenue growth. Furthermore, our ability to increase software license revenue is an essential component in offsetting the attrition in maintenance contract renewals we have experienced in the past and that we expect to continue.
Build: Organic Growth
Selling new software licenses has and will continue to play an important role in our growth strategy. During FY 2004, we continued to focus on growing our business organically along key product lines, which resulted in revenue growth in several of our legacy products with sales to both new and existing customers. We need to continue to invest in new product development so we can offer our customers a portfolio of performance management solutions. To maintain revenue growth momentum, we also announced several complementary products at our recently held annual user conference, including Geac Compliance, SmartStream 7.0, and Enterprise Intelligence.
Software license sales growth has contributed to an increase in the demand for our professional services. In response, we have broadened our service offerings, expanded our delivery model, and created a "best practices" consulting group. Our integrated technology solutions deliver more value and utility to our customers by combining new products, product expansions, product integrations and practical business services.
Value for Maintenance—In the second quarter of FY 2004 we introduced a value-based maintenance offering, which delivers new technology to users of our mainframe software products that simplifies the web-enablement of, and integration with, Geac and non-Geac systems. The new program was rolled out to existing Geac E and M Series customers coming up for maintenance
17
renewal in the third quarter of FY 2004. An important component of this program is an initiative that offers multiple years of support services including incentives to encourage customers to extend beyond our typical one-year maintenance contract. At April 30, 2004, 40 renewing E and M series customers had elected to participate in the Value for Maintenance (VFM) program, representing approximately 15% of the total renewal dollars since the program was launched. An additional 18% of customers in the renewal pipeline are evaluating the VFM program. We expect to continue to refine the VFM program as we receive customer feedback and expect more of our customers to make the transition to this program as they renew their maintenance contracts.
Hosted Application Offering—We have expanded our delivery model by broadening the availability of our application service provider (ASP) offerings across certain products within our GPM suite. We currently provide hosting solutions in America, Europe and Australia across a range of product lines for some applications and are also assessing the expansion of hosted offerings across additional product lines. Our hosted solutions represent one of several application delivery and deployment options that we offer our customers as part of our commitment to provide customers with effective solutions that are flexible, easier to implement, and competitively priced. The increase in ASP offerings also has an effect on our revenue recognition: while perpetual licenses are generally recognized at the beginning of the contract when they meet the criteria described in the critical accounting policies, ASP offerings are recognized on a straight-line basis over the life of the contract. Thus, the dollar value of an ASP contract may be larger than a combined license and maintenance contract, although less revenue may be recognized in the first year after the contract is executed.
Product Expansion
Geac System21—System21 Aurora, our next generation ERP system for the iSeries with real-time business process management capabilities, continues to attract customers for us in the mid-market ERP sector. During the fourth quarter of FY 2004, System21 closed approximately 230 deals contributing to 29.2% revenue growth attributable to software license sales over the fourth quarter of FY 2003 and 6.2% growth from FY 2004 compared to FY 2003 for this product suite. Also during the fourth quarter of FY 2004, System21 Aurora was enhanced with integrated reporting and analysis and budgeting functionality derived from GPM.
Geac Library Solutions—Continuing to build upon the momentum it established earlier in FY 2004, in the fourth quarter of FY 2004 Geac Library Solutions won a dozen new license, maintenance and service contracts, including two new customers for Vubis Smart, our next-generation library automation system. Revenue for FY 2004 grew by 4.5% compared to FY 2003 revenue for this product suite.
Geac Local Government—Focused on opportunities in Australia and New Zealand, Geac Local Government has been awarded contracts with 10 councils (municipalities or counties) during FY 2004 to replace their existing land information systems (LIS). Most recently, the City of Auburn (Australia), home to the majority of the Sydney Olympics sporting venues purchased our LIS, named Pathway PPR. In addition, the City of Melbourne (Australia) acquired additional Pathway PPR modules to undertake their PINS3 (Penalty Infringement Notice System) project, to expedite processing of approximately 450,000 parking tickets per year. By delivering products to meet the unique demands of government customers, revenue for FY 2004 increased by 28% compared to FY 2003 revenue for this product suite; however, new license revenue in this business increased only modestly year over year.
Buy: Growth Through Acquisitions
On August 6, 2003, we acquired Comshare Incorporated ("Comshare"), a leading provider of Business Performance Management software for planning, budgeting, forecasting, financial
18
consolidation, management reporting and analysis—the MPC product line. Our current GPM software sales pipeline continues to include our legacy customers, which underscores a critical component of our acquisition strategy—the ability to sell newly acquired GPM products into our legacy customer accounts worldwide. During FY 2004, we closed several GPM sales with existing customers, including planning and expense management applications.
GPM is an integrated product suite that enables companies to bolster their effectiveness by tightening the linkage between business strategy formulation and operational execution. GPM can be integrated with many general ledger, ERP, CRM, and other applications provided by us and other software vendors, including SAP, PeopleSoft, Oracle, and Lawson. As part of our growth strategy we have begun to integrate GPM solutions into some of our existing ERP product offerings in both the EAS and ISA segments. In the third quarter of FY 2004, we integrated GPM with the Enterprise Server software and this integrated offering is gaining traction with our Enterprise server customers. In FY 2005, we plan to integrate GPM into our Anael, SmartStream, System21, Libraries, Local Government and Commercial Systems product suites.
In Q4 of FY 2004, we announced new releases of the MPC, our planning, budgeting, forecasting, financial consolidation, and management reporting and analysis software, and Expense Management solutions within the GPM product family. These new releases offer existing and potential customers greater functionality and flexibility, such as, the ability to submit or approve an employee expense report from any Web-enabled device.
Partner: Key Relationships
During FY 2004, we were successful in leveraging an existing partnership between Comshare and Microsoft® to encompass most of our major product lines in all regions. We are working with Microsoft® to develop joint marketing and sales programs within the business performance management market. We expect to receive focused technical, marketing and sales support from Microsoft®. In turn, we intend to utilize our experience and credibility providing technology-based solutions to financial executives, to assist Microsoft® in expanding its opportunities within the finance function of enterprises.
During FY 2004, we also leveraged our relationship with Lombardi Software and its expertise in business process design to develop a Sarbanes Oxley (SOX) compliance tool. The SOX certification cycle has created a growing demand for remediation activity as businesses try to extract value from their significant investment in regulatory compliance. There are two types of SOX compliance software offered by Geac: (1) applications that streamline processes and workflow allowing a company to reach scalable repeatable processes and (2) software to assist in making the SOX certifications.
Finally, during FY 2004 we partnered with Information Builders to develop our Enterprise Intelligence offering, an enhanced reporting solution for our E Series and M Series customers.
Subsequent to FY 2004, we announced a new alliance relationship with American Express Tax and Business Services Inc. (AMEX TBS). Under the terms of the agreement, AMEX TBS will now offer GPM to its North American customers. Our alliance with AMEX TBS will combine the financial services expertise of AMEX TBS with our technology strengths to extend GPM to a broader audience.
19
RESULTS OF OPERATIONS
Twelve Months Ended April 30, 2004 compared to the Twelve Months Ended April 30, 2003
(all dollar figures in tables are presented in thousands of U.S. dollars)
| | For the year ended April 30
| |
| |
| |
|---|
Revenue
| | $ change
from 2003
| | % Change
from 2003
| |
|---|
| | 2004
| | 2003
| |
|---|
| Software | | $ | 65,190 | | $ | 49,380 | | $ | 15,810 | | 32.0 | % |
| Support and services | | | 355,019 | | | 328,472 | | | 26,547 | | 8.1 | % |
| Hardware | | | 25,063 | | | 30,625 | | | (5,562 | ) | (18.2 | )% |
| | |
| |
| |
| |
| |
| | | $ | 445,272 | | $ | 408,477 | | $ | 36,795 | | 9.0 | % |
| | |
| |
| |
| |
| |
Total revenue increased 9.0% to $445.3 million for FY 2004, compared to $408.5 million for FY 2003. This increase is a result of organic revenue growth and the acquisitions of Extensity, Incorporated ("Extensity") and Comshare. We continue to execute on our strategy to increase software revenue as a percentage of our total revenue mix. As a percentage of total revenue, software revenue has increased from 12.1% in FY 2003 to 14.6% in FY 2004. Excluding the increase in support revenue resulting from the acquisitions of Extensity and Comshare and the effect of foreign exchange, support revenue declined $22.3 million or 9.4%. This decline was in line with our expectations. Services revenue increased $2.4 million or 2.9% in FY 2004, compared to FY 2003, excluding the increase in services revenue resulting from the acquisitions of Extensity and Comshare. Our focus shifted away from the lower margin hardware business in FY 2004 and the result was a hardware revenue decrease of $5.6 million or 18.2% from FY 2003. We are not seeking to grow our hardware business, which is a service we provide only to accommodate certain customers.
For FY 2004 we managed and reported our business on our two major business segments: EAS and ISA. The software products acquired in the Comshare and Extensity transactions are components of the EAS business segment, but may be extended into the ISA business segment in FY 2005. As a result of the integration of the Comshare and Extensity businesses as product lines in the EAS business segment, it is not possible to identify the expense components of the merged businesses separately.
| | For the year ended April 30
| |
| |
| |
|---|
Revenue—Segmented
| | $ change
from 2003
| | % Change
from 2003
| |
|---|
| | 2004
| | 2003
| |
|---|
| EAS | | $ | 351,259 | | $ | 305,156 | | $ | 46,103 | | 15.1 | % |
| ISA | | | 94,013 | | | 103,321 | | | (9,308 | ) | (9.0 | )% |
| | |
| |
| |
| |
| |
| | | $ | 445,272 | | $ | 408,477 | | $ | 36,795 | | 9.0 | % |
| | |
| |
| |
| |
| |
As a result of the acquisition of Comshare and Extensity, revenue in the EAS segment increased $46.1 million, or 15.1%, from $305.2 million in FY 2003 to $351.3 million in FY 2004. The increase was attributable to growth both in software and support and services revenue. New product lines from the Comshare and Extensity acquisitions contributed $52.2 million to the total revenue for the EAS business segment and, we also experienced organic growth from legacy products such as System21 Aurora. This growth was offset predominantly by a decline in total support revenue of approximately $16.2 million or 9.6%, and a decline in revenue related to the sale of the Northern Ontario division.
EAS software license sales to new and existing customers, from both newly-acquired and existing software, totalled $54.8 million in FY 2004 compared to $37.4 million in FY 2003. This represents an increase of $17.5 million, or 46.7%, of which $2.4 million was generated from our legacy product suites.
20
The software products acquired in the Comshare and Extensity transactions represented $15.1 million of total EAS software license sales during FY 2004.
EAS support and services revenue was $274.9 million in FY 2004, compared to $242.5 million in FY 2003. Support and services revenue generated by the Comshare and Extensity businesses represented $35.4 million of the increase in FY 2004. Therefore, excluding revenue from acquisitions, there was a $3.0 million decrease in EAS support and services revenue attributable to a decline in support revenue from the existing EAS business and foreign exchange. This decline, which was in line with our expectations, was due to attrition in maintenance contract renewals within the various EAS business units. As the integration of the Comshare and Extensity product lines into our other businesses continue, it will not be possible to report the revenue components of the merged businesses separately.
EAS hardware sales revenue was $21.6 million in FY 2004, compared to $25.3 million in FY 2003. This represents a 14.8% decline in hardware revenue. The decline in EAS hardware sales revenue may continue as a result of our de-emphasis of this low margin business.
Revenue in the ISA segment decreased $9.3 million or 9.0%, from $103.3 million in FY 2003 to $94.0 million in FY 2004. This $9.3 million decline was primarily attributable to:
- •
- $9.1 million decline in the Interealty business reflecting significant price pressure, customer losses in the core Multiple Listing Service (MLS) application business and the anticipated continuing decline in revenue from the MLS book publishing business;
- •
- $2.2 million decline in the Restaurants business attributable in part to a decrease in hardware sales due to our focus to shift away from this lower margin business; and
- •
- $1.3 million decline in the Construction business which was due to a a legacy software conversion program which expired in FY 2003.
An increase of $2.7 million in the Local Government business resulting from new installations and higher volumes of professional service engagements partially offset these declines.
| | For the year ended April 30
| |
| |
|---|
Gross Profit
| | % Change
from 2003
| |
|---|
| | 2004
| | 2003
| |
|---|
| Margin on software revenue | | 88.2 | % | 86.8 | % | 1.4 | % |
| Margin on support and services revenue | | 58.8 | % | 58.4 | % | 0.4 | % |
| Margin on hardware revenue | | 15.7 | % | 15.5 | % | 0.2 | % |
| | |
| |
| |
| |
| Margin on total revenue | | 60.7 | % | 58.6 | % | 2.1 | % |
| | |
| |
| |
| |
Gross profit increased by $30.7 million, or 12.8%, from $239.4 million in FY 2003 to $270.2 million in FY 2004 versus an increase of total revenue of 9%. Overall gross profit margins increased from 58.6% in FY 2003 to 60.7% in FY 2004 as a result of higher margin software revenue increasing as a percentage of the revenue mix, a decrease in lower margin hardware sales as a percentage of the revenue mix and cost reductions. However, it is uncertain if such growth will continue in future years. Included in cost of revenue in FY 2004 is $0.3 million in compensation expenses relating to the adoption of the fair value method of accounting for stock options.
21
Management Discussion and Analysis
Operating Expenses—Operating expenses increased 6.8% to $197.9 million in FY 2004, compared to $185.3 million in FY 2003. Sales and marketing, product development, and general and administrative expenses increased by $26.6 million primarily as a result of the acquired Extensity and Comshare businesses and the accounting for the fair value of stock options which was adopted in the fourth quarter of FY 2004. Our total operating expenses increased by 6.8% in absolute dollars in FY 2004 compared to FY 2003, while total revenue increased by 9.0%. Therefore, as a percentage of total revenue, operating expenses decreased from 45.4% in FY 2003 to 44.5% in FY 2004.
In accordance with accounting standards set by the CICA, we elected to adopt Handbook Section 3870 "Stock-based compensation and other stock-based payments" ("Section 3870") in the fourth quarter of FY 2004, and began recording stock-based compensation expense using the prospective method of accounting for stock options, available to companies that adopt Section 3870 in their 2004 fiscal years. Recording the compensation expense related to stock options increased our operating and cost of sales expenses by approximately $2.4 million and decreased Earnings Per Diluted Share ("EPS") by $0.03. The full-year expense was recognized in the fourth quarter; the amount per quarter going forward may be less.
| | For the year ended April 30
| |
| |
| |
|---|
| | $ change
from 2003
| | % Change
from 2003
| |
|---|
| | 2004
| | 2003
| |
|---|
| Sales and marketing | | $ | 74,051 | | $ | 58,730 | | $ | 15,321 | | 26.1 | % |
| Product development | | | 58,805 | | | 51,905 | | | 6,900 | | 13.3 | % |
| General and administrative | | | 62,774 | | | 58,420 | | | 4,354 | | 7.5 | % |
Sales and Marketing—Sales and marketing expenses increased by $15.3 million, or 26.1%, in FY 2004. As a percentage of revenue, sales and marketing expenses increased from 14.4% in FY 2003 to 16.6% in FY 2004 reflecting our ongoing expenses from personnel costs and sales and marketing costs intended to drive new software revenue. Sales and marketing expenses may increase in the future as a percentage of total revenue as we focus on growing new software license revenue. Included in sales and marketing expenses in FY 2004 is $0.9 million of compensation expense for the adoption of the fair value method of accounting for stock options.
Product Development—Product development expenses increased by $6.9 million, or 13.3%, in FY 2004 and increased as a percentage of total revenue from 12.7% in FY 2003 to 13.2% in FY 2004. The increase in product development expenses is primarily attributable to the acquisitions of Extensity and Comshare and our focused organic growth, each of which has contributed to our strategy of build, buy and partner to generate software revenue growth. We expect product development expenses to continue at this rate as we continue to execute on our strategy. Included in product development expenses in FY 2004 is $0.3 million of compensation expense relating to the adoption of the fair value method of accounting for stock options.
General and Administrative—General and administrative expenses increased by $4.4 million, or 7.5%, in FY 2004. As a percentage of total revenues, general and administrative expenses decreased from 14.3% in FY 2003 to 14.1% in FY 2004. Included in general and administrative expenses in FY 2004, is $0.9 million of compensation expense relating to the adoption of the fair value method of accounting for stock options. Going forward, it is anticipated that general and administrative expenses will be adversely and significantly impacted by new corporate governance regulations and requirements.
Net Restructuring and Other Unusual Items—During FY 2004, we recorded a net reversal of $5.3 million in net restructuring and other unusual items. The net reversal for the year included $7.0 million in the release of severance, premises, litigation and other reserves set up in prior years that are no longer required. Also included in the net restructuring and other unusual items was a gain of
22
$0.2 million resulting from the sale of assets associated with our Northern Ontario NTC division. These amounts were partially offset by charges of $0.8 million relating to new information obtained on a lease obligation, $0.5 million for severance costs related to the restructuring of our business in North America and $0.6 million for a pension liability relating to our French operations.
Amortization of Intangible Assets and Goodwill Impairment—Our past acquisitions resulted in the recording of goodwill and other intangible assets that represent the excess of the purchase price paid over the fair value of the net tangible assets acquired. Intangible assets are amortized over periods ranging from one to five years. Amortization of intangible assets, primarily acquired software, was $7.6 million for FY 2004, compared to $1.1 million in FY 2003. This $6.5 million increase is attributable to amortization of intangible assets associated with the Extensity and Comshare businesses, which were acquired in the fourth quarter of FY 2003 and the second quarter of FY 2004, respectively. In accordance with CICA 3062, "Goodwill and Other Intangible Assets," goodwill is reviewed for impairment annually. We completed our review for potential impairment as of February 29, 2004, and concluded that there was no impairment. In FY 2003, we completed the same review and it was determined that goodwill had been impaired by $11.5 million.
Other Expense—Interest expense increased by $0.8 million in FY 2004. The increase was attributable to the amortization of the financing costs related to the $50.0 million credit facility obtained in FY 2004.
Income Taxes—Income taxes are accounted for under the liability method, whereby future income tax assets and liabilities are recognized for temporary differences between the tax and accounting bases of assets and liabilities, as well as for the benefit of losses available to be carried forward to future years for income tax purposes. Future income tax assets are recognized only to the extent that, in the opinion of management, it is more likely than not that the future income tax assets will be realized. Future income tax assets and liabilities are measured using income tax rates applicable to taxable income in the years in which those temporary differences are expected to be recovered or settled. Future income tax assets and liabilities are adjusted for the effects of changes in income tax laws and rates in the period in which the change occurs.
The provision for income taxes was $13.7 million for FY 2004, compared to $21.3 million for FY 2003. Of the total $13.7 million provision recorded in FY 2004, $6.0 million related to future tax expense and $7.6 million represented cash taxes. Of the total $21.3 million provision recorded in FY 2003, $16.4 million related to future tax expense and $4.9 million represented cash taxes due for the period.
The effective tax rate for FY 2004 was 19.3%, compared to a rate of 40.1% for FY 2003. When the FY 2003 income before taxes is adjusted for the non-tax deductible goodwill impairment charge of $11.5M (discussed above), the effective tax rate for FY 2003 is reduced to 33.0%.
The decrease in the effective tax rate from FY 2003 to FY 2004 is due primarily to the release of valuation allowances on future tax assets and release of reserves for tax exposures due to changes in circumstances in various subsidiaries.
Net Earnings—Net earnings were $57.2 million, or $0.66 per diluted share in FY 2004, compared to $31.9 million, or $0.39 per diluted share in FY 2003. We are organized globally such that many of our expenses are incurred in the same currency as our revenue, which mitigates our exposure to currency fluctuations. Compared to FY 2003, currency fluctuations—primarily attributable to the British Pound Sterling, Euro, and Australian Dollar versus the U.S. Dollar—had the effect of increasing net income by $3.7 million, or $0.04 per diluted share, in FY 2004. This net increase resulted from the positive impact on revenue of $29.3 million, offset by the negative impact on expenses of $25.6 million. The British Pound Sterling, Euro and Australian Dollar appreciated by approximately 10.0%, 17.3% and 24.3%, respectively against the U.S. Dollar in FY 2004.
23
QUARTERLY RESULTS
The following table sets forth the unaudited consolidated statements of earnings for each of our last eight fiscal quarters. Our data has been derived from our unaudited consolidated statements of earnings that have been prepared on the same basis as the annual audited consolidated statements of earnings and, in our opinion, include all adjustments necessary for a fair presentation of such information. These unaudited quarterly results should be read in conjunction with our audited consolidated financial statements and notes thereto for FY 2004 and FY 2003. The consolidated results of operations for any quarter are not necessarily indicative of the results for any future period.
Condensed Consolidated Quarterly Statements of Earnings
(in thousands of U.S. dollars, except share and per share data)
| | 2003
| | 2004
|
|---|
| | Quarter 1
| | Quarter 2
| | Quarter 3
| | Quarter 4
| | Quarter 1
| | Quarter 2
| | Quarter 3
| | Quarter 4
|
|---|
| Total revenues | | $ | 101,364 | | $ | 101,937 | | $ | 102,588 | | $ | 102,588 | | $ | 101,525 | | $ | 111,467 | | $ | 116,175 | | $ | 116,105 |
| Cost of revenues | | | 45,430 | | | 41,964 | | | 41,863 | | | 39,785 | | | 40,836 | | | 45,142 | | | 45,863 | | | 43,255 |
| Gross profit | | | 55,934 | | | 59,973 | | | 60,725 | | | 62,803 | | | 60,689 | | | 66,325 | | | 70,312 | | | 72,850 |
| Operating expenses | | | 40,585 | | | 41,259 | | | 42,494 | | | 60,914 | | | 46,488 | | | 50,275 | | | 51,108 | | | 50,067 |
| Earnings from operations | | | 15,349 | | | 18,714 | | | 18,231 | | | 1,889 | | | 14,201 | | | 16,050 | | | 19,204 | | | 22,783 |
| Net earnings | | | 10,480 | | | 11,643 | | | 12,013 | | | (2,265 | ) | | 9,407 | | | 10,746 | | | 14,437 | | | 22,576 |
| Basic EPS | | | 0.13 | | | 0.15 | | | 0.15 | | | (0.03 | ) | | 0.11 | | | 0.13 | | | 0.17 | | | 0.27 |
| Diluted EPS | | | 0.13 | | | 0.15 | | | 0.15 | | | (0.03 | ) | | 0.11 | | | 0.13 | | | 0.17 | | | 0.26 |
During FY 2004, we continued to see quarterly year-over-year revenue growth. Though the majority of growth came from our acquisitions, we did experience some organic growth in our business.
During FY 2004, we also saw an increase in gross profit as a result of higher margin revenue replacing lower margin hardware sales in the revenue mix.
We continue to see an increase in quarterly operating expenses primarily as a result of our acquisitions. However, operating expenses as a percentage of revenue are decreasing as we integrate our expense management disciplines into the acquired businesses.
Operating expenses for the fourth quarter of FY 2003 included the impact of restructuring and goodwill impairment charges of $15.8 million. There was no such impairment charge in FY 2004.
Included in cost of revenues and operating expenses in the fourth quarter of FY 2004 is $2.4 million in compensation expense relating to the adoption of the fair value method of accounting for stock options.
In FY 2004, net earnings and EPS grew in each consecutive quarter, with the fourth quarter of FY 2004 contributing to the largest portion of the growth for the year. Significant restructuring and unusual items impacted the net earnings and EPS in the fourth quarter of FY 2003. On a quarterly basis, we will continue to focus on operating results, including employee headcount requirements, to reduce the risk of future significant restructuring and unusual item charges.
LIQUIDITY AND FINANCIAL CONDITION
| | For the year ended April 30
| |
| |
|---|
| | $ Change
from 2003
| |
|---|
| | 2004
| | 2003
| |
|---|
| Cash and cash equivalents | | $ | 112,550 | | $ | 89,819 | | $ | 22,731 | |
| Current assets | | | 195,192 | | | 179,128 | | | 16,064 | |
| Total assets | | | 406,903 | | | 332,756 | | | 74,147 | |
| Current liabilities | | | 232,520 | | | 233,268 | | | (748 | ) |
| Long-term liabilities | | | 38,312 | | | 23,318 | | | 14,994 | |
| Total shareholders' equity | | | 136,071 | | | 76,170 | | | 59,901 | |
24
At April 30, 2004, cash and cash equivalents (cash) totalled $112.6 million, compared to $89.8 million at April 30, 2003.
During the second quarter of FY 2004, we acquired Comshare by way of a cash tender offer for all outstanding shares, followed by a cash merger for a purchase price, excluding acquisition costs, of $53.8 million. Since Comshare had $16.6 million in cash and cash equivalents at the date of acquisition, the net cash outflow resulting from completion of the transaction was $37.2 million plus transaction costs of $1.9 million. As a result, exclusive of an increase of $0.7 million from the effect of foreign exchange rates, cash increased by $22.0 million for FY 2004 compared to FY 2003.
Total assets increased $74.1 million to $406.9 million at April 30, 2004 compared to $332.8 million at April FY 2003. In addition to the increase in cash and cash equivalents, the remaining increase in total assets was attributable to the increase in goodwill and intangible assets resulting from the acquisition of Comshare during FY 2004.
Long-term liabilities increased $15.0 million to $38.3 million at April 30, 2004, compared to $23.3 million at April 30, 2003. The majority of the increase was as a result of a defined benefit pension plan obligation of $22.3 million that was assumed as part of the acquisition of Comshare. This was offset by a decrease in restructuring costs and long-term debt.
Net Changes in Cash Flow
| | For the year ended April 30
| |
| |
|---|
| | $ Change
from 2003
| |
|---|
| | 2004
| | 2003
| |
|---|
| Net cash provided by operating activities | | $ | 66,618 | | $ | 29,044 | | $ | 37,574 | |
| Net cash used in investing activities | | | (41,817 | ) | | (23,828 | ) | | (17,989 | ) |
| Net cash (used in)/provided by financing activities | | | (2,796 | ) | | 6,589 | | | (9,385 | ) |
| Effect of exchange rate changes on cash and cash equivalents | | | 726 | | | 4,376 | | | (3,650 | ) |
| | |
| |
| |
| |
| Net increase in cash and cash equivalents | | $ | 22,731 | | $ | 16,181 | | $ | 6,550 | |
| | |
| |
| |
| |
Net cash provided by operating activities increased 129.4% to $66.6 million in FY 2004, compared to $29.0 million in FY 2003. The improvement in net cash flow from operating activities was primarily due to the significant increase in net income for the year. Balance sheet changes for non-cash working capital were affected significantly by acquisitions.
Net cash used in investing activities increased 75.5% to $41.8 million in FY 2004, compared to $23.8 million in FY 2003. There was an increase in net cash used in investing activities of $39.1 million due to the acquisition of Comshare, compared to the net acquisition of Extensity and EBC, which used $22.7 million in the prior year. In addition, net capital asset acquisitions were $1.6 million higher than in the prior year.
25
Net cash used in financing activities was $2.8 million in FY 2004, compared to $6.6 million, which was provided in FY 2003. In FY 2004, we received $2.9 million in proceeds from stock options exercised. This was more than offset by a $2.9 million repayment of long-term debt and deferred financing costs of $2.8 million attributable to the financing costs associated with the Wells Fargo Foothill, Inc. $50.0 million credit facility ("the facility"). As of April 30, 2004, we utilized $1.8 million of the letter of credit sub-facility for general working capital needs. Approximately $48.2 million of the revolving line of credit remains available to us.
CONTRACTS AND COMMITMENTS
The facility discussed above is collateralized by substantially all of our assets and the assets of certain of our U.S. and Canadian subsidiaries and guaranteed by certain of our U.S., Canadian, UK and Hungarian subsidiaries. The facility is available for our working capital needs and other general corporate purposes and for the needs of our subsidiaries that are parties to the facility agreement.
We do not enter into off-balance sheet financing as a general practice. Except for operating leases, as disclosed in note 14 to the FY 2004 consolidated financial statements and in accordance with Canadian GAAP, we have no commitments that are not reflected in our balance sheets. Commitments include operating leases for office equipment and premises, and letters of credit, bank guarantees, and performance bonds that are routinely issued on our behalf by financial institutions, primarily in connection with premises leases and contracts with public sector customers. In addition, as disclosed in note 13 to the FY 2004 consolidated financial statements, in connection with the acquisition of Comshare, we assumed responsibility for a defined benefit pension plan, which will require continued payments until the plan is fully funded. Except as otherwise disclosed in the financial statements, we do not have any other business arrangements, derivative financial instruments, or any equity interests in unconsolidated companies that would have a material effect on our assets and liabilities at April 30, 2004.
The following table summarizes our outstanding cash commitments as of April 30, 2004:
| | Payments due by period
|
|---|
| | Total
| | Less than
1 Year
| | 1 - 3 Years
| | 3 - 5 Years
| | More than
5 Years
|
|---|
| Operating leases | | $ | 43,109 | | $ | 17,400 | | $ | 16,375 | | $ | 4,323 | | $ | 5,011 |
| Capital leases | | | 5,885 | | | 603 | | | 1,206 | | | 1,206 | | | 2,870 |
| Future benefit payments | | | 3,685 | | | 598 | | | 1,213 | | | 1,239 | | | 635 |
| Long-term debt | | | 4,941 | | | 391 | | | 818 | | | 955 | | | 2,777 |
| | |
| |
| |
| |
| |
|
| Total outstanding cash commitments | | $ | 57,620 | | $ | 18,992 | | $ | 19,612 | | $ | 7,723 | | $ | 11,293 |
| | |
| |
| |
| |
| |
|
RISKS AND UNCERTAINTIES
This Management Discussion and Analysis, and other reports, statements and other communications to shareholders, as well as oral statements made by our officers or agents, contains forward-looking statements, including statements regarding the future success of our business and technology strategies, and future market opportunities. These forward-looking statements are neither promises nor guarantees but rather are subject to a number of risks and uncertainties, which could cause actual results to differ materially from those described in the forward-looking statements. Some of the risks and uncertainties that may cause such variation are discussed below. You should not place undue reliance on any such forward-looking statements, which are current only as of the date when made. You should not expect that these forward-looking statements will be updated or supplemented as a result of changing circumstances or otherwise, and we disavow and disclaim any obligation to do so. You should understand that the sole purpose of discussing
26
these risks and uncertainties is to alert you to certain factors which could cause actual results to differ materially from those described in the forward-looking statements and not to describe facts, trends and circumstances that could have a beneficial impact on the Company's results.
We operate in a dynamic and rapidly changing environment and industry that involve numerous risks and uncertainties. The following section describes some, but not all, of these risks and uncertainties that may adversely affect our business, financial condition or results of operations. Additional risks and uncertainties not described below or not presently known to us may also affect our business operations. If any of these risks actually occurs, our business, financial condition, or results of operations could be seriously harmed. This section should be read in conjunction with the audited Consolidated Financial Statements and Notes thereto, and the other parts of Management's Discussion and Analysis of Financial Condition and Results of Operations.
We have had losses in the past and may not maintain our current profitability in the future. The trading price of our common shares may fall if we fail to maintain profitability or generate sufficient cash from operations.
We generated net earnings of $57.2 million and $31.9 million for the years ended April 30, 2004 and 2003, respectively. Although we had net earnings for the past three years, we had a net loss of $169.4 million for the year ended April 30, 2001. Our losses have resulted principally from costs incurred to realign our global operations and as a result of the conclusion that the goodwill we carried on our consolidated balance sheet was impaired. We expect to continue experiencing fluctuations in our operating results and cannot assure sustained profitability.
As we grow our business, we expect operating expenses and capital expenditures to increase correspondingly, and as a result, we will need to generate significant revenue to maintain profitability. We may not be able to sustain or to increase profitability or cash flows from operations on a quarterly or annual basis in the future and could incur losses in future periods. If our revenues decline as they have in past years, our operating results could be seriously impaired because many of our expenses are fixed and cannot be easily or quickly reduced. A failure to maintain profitability could materially and adversely affect our business.
In FY 2003, we recorded goodwill impairment and net restructuring and other unusual items of $15.1 million related to significant write-downs of goodwill and intangible assets, as well as to restructuring efforts intended to reduce costs and more efficiently organize our operations.
We periodically review the value of acquired intangibles and goodwill to determine whether any impairment exists and could write-down a portion of our intangible assets and goodwill as part of any such future review. We also periodically review opportunities to more efficiently organize operations, and may record further restructuring charges in connection with any such reorganization. Any write-down of intangible assets or goodwill or restructuring charges in the future could affect our results of operations materially and adversely.
Our revenues and operating results fluctuate significantly from quarter to quarter, and the trading price of our common shares could fall if our revenues or operating results are below the expectations of analysts or investors.
Our revenues and operating results fluctuate significantly from quarter to quarter. Historically, our revenue in the third quarter of each fiscal year, our quarter ending January 31, has benefited from year-end budget cycles and spending, and we have generated less revenue, and collected less cash, during our first and second fiscal quarters of each year, our quarters ending July 31 and October 31, due in part to the European summer holiday season. These historical patterns may change over time. Revenue in any quarter depends substantially upon our ability to sign contracts and our ability to recognize revenue in that quarter in accordance with revenue recognition policies.
27
Our quarterly revenues and operating results may fluctuate based on a variety of factors, including the following:
- •
- the timing of significant orders, delivery and implementation of our products;
- •
- the gain or loss of any significant customer;
- •
- the number, timing and significance of new product announcements and releases by us or our competitors;
- •
- our ability to acquire or develop (independently or through strategic relationships with third parties), to introduce and to market new and enhanced versions of our products on a timely basis;
- •
- order cancellations and shipment rescheduling delays;
- •
- patterns of capital spending and changes in budgeting cycles by our customers;
- •
- market acceptance of new and enhanced versions of our products;
- •
- changes in the pricing and the mix of products and services that we sell and that our customers demand;
- •
- the demand for our products and the market conditions for technology spending;
- •
- seasonal variations in our sales cycle (such as lower sales levels typically experienced by our European operations during summer months);
- •
- the level of product and price competition;
- •
- the amount and timing of operating costs and capital expenditures relating to the expansion of our business;
- •
- the geographical mix of our sales, together with fluctuations in foreign currency exchange rates;
- •
- the timing of any acquisitions and related costs;
- •
- changes in personnel and related costs; and
- •
- legal proceedings in the normal course of business.
In addition, we expect that a substantial portion of our revenue will continue to be derived from renewals of maintenance contracts from customers of our software applications. These maintenance contracts typically expire on an annual basis, and the timing of cash collections of related revenues varies from quarter to quarter. In addition, our new license revenue and results of operations may fluctuate significantly on a quarterly and annual basis in the future, as a result of a number of factors, many of which are outside of our control. A sale of a new license generally requires a customer to make a purchase decision that involves a significant commitment of capital. As a result, the sales cycle associated with the new license revenue will vary substantially and will be subject to a number of factors, including customers' budgetary constraints, timing of budget cycles and concerns about the pricing or introduction of new products by us or our competitors.
If our revenues or operating results fall below the expectations of financial analysts or investors, the trading price of our common shares could fall. As a result of the foregoing factors and the other factors described in this section, we believe that period-to-period comparisons of our revenue and operating results are not necessarily meaningful. You should not rely on these comparisons to predict our future performance.
28
We experience customer attrition, which could affect our revenues more adversely than we expect, and we may be unable to adapt quickly to such attrition. Any significant reduction in revenues as a result of attrition may result in a decrease in the trading price of our common shares.
We expect that a substantial portion of our revenue will continue to be derived from renewals of annual maintenance contracts with customers of our software applications, and, to a lesser extent, from professional services engagements for these customers. Attrition in our customer base has historically taken place, and continues to take place, when existing customers elect not to renew their maintenance contracts and cease purchasing professional services from us. Customer attrition occurs for a variety of reasons, including a customer's decision to replace our product with that of a competing vendor, to purchase maintenance or consulting services from a third-party service provider, or to forgo maintenance altogether. It can also occur when a customer is acquired or ceases operations.
To date, we have experienced relatively predictable and stable customer attrition, and have been able, in part, to replace the revenue lost through attrition with new revenue from maintenance contracts and professional services associated with new license sales and from maintenance contract price increases, as well as from acquisitions. However, any factors that adversely affect the ability of our installed systems to compete with those available from others, such as availability from competitors of products offering more advanced product architecture, superior functionality or performance or lower prices, or factors that reduce demand for our maintenance and professional services, such as intensifying price competition, could lead to increased rates of customer attrition. Should the rate of customer attrition exceed our expectations, we may be unable to replace the lost revenue or to reduce our costs sufficiently or in a timely enough fashion to maintain profitability. In such circumstances, higher than expected customer attrition could have a material adverse effect on our business, results of operations, and financial condition.
We may be unable to realize our growth strategy if we are unable to identify other suitable acquisition opportunities.
We believe that our future success depends upon our ability to make additional worthwhile acquisitions to offset the effect of customer attrition, such as our recent acquisitions of Extensity and Comshare. If we cannot make additional worthwhile acquisitions, our revenues and stock price will likely decline. We cannot be certain that we will be able to identify additional suitable acquisition candidates available for purchase at reasonable prices, to consummate any acquisition. When evaluating an acquisition opportunity, we cannot assure you that we will correctly identify the risks and costs inherent in the business that we are acquiring. In addition, to achieve desired growth rates as we become larger, acquisition candidates are likely to be larger and may continue to include public companies. The acquisition of a public company may involve additional risks, including the potential for lack of recourse against public shareholders for undisclosed material liabilities of the acquired business. If we were to proceed with one or more significant future acquisitions in which the consideration consisted of cash, a substantial portion of our available cash resources could be used.
Our inability to successfully integrate other businesses that we acquire may disrupt our operations or otherwise have a negative impact on our business.
We made one acquisition in FY 2004 and two acquisitions during FY 2003. We made numerous acquisitions prior to FY 2002, including eleven during FY 2000. We are frequently in formal or informal discussions with potential acquisition candidates and may make additional acquisitions of, or large investments in, other businesses that offer products, services, and technologies that we believe would complement our products and services. Integration of our completed acquisitions and any future acquisitions involves a number of special risks, including the following: diversion of management's
29
attention from, and disruption of, our on-going business; failure to successfully integrate the personnel, information systems, technology, and operations of the acquired business; failure to maximize the potential financial and strategic benefits of the transaction; failure to realize the expected synergies from businesses that we acquire; possible impairment of relationships with employees and customers as a result of any integration of new businesses and management personnel; impairment of assets related to resulting goodwill; reductions in future operating results from amortization of intangible assets; and unanticipated adverse events, circumstances, or legal liabilities associated with the transaction or the acquired business.
Moreover, mergers or acquisitions of technology companies are generally risky and often fail to deliver the return on investment that acquirers expect. Such failures can result from a number of factors, including the following: rapid changes in technology in the markets in which the combining companies compete, and in demand for their products and services; difficulties in integrating the businesses and personnel of the acquired company; failure to achieve expected revenue or cost synergies; unanticipated costs or liabilities; and other factors. If we are unable to integrate future acquisitions successfully, our business and results of operations could be adversely affected.
The loss, cancellation or delay of orders by our customers could harm our business.
The purchase of some of our products, particularly our EAS products, and the related professional services may involve a significant commitment of resources and costs for our customers. As a result, our sales process involves a lengthy evaluation and product qualification process that may require significant capital expenditures. For these and other reasons, the sales cycle associated with the license of our products, renewal of maintenance agreements, and sale of related professional services varies substantially from contract to contract and customer to customer. The sales cycles for our products vary by product and application, and may range up to a year or more for large, complex installations. We may experience delays over which we have no control and which further extend that period. During the process, we may devote significant time and resources to a prospective customer, including costs associated with multiple site visits, product demonstrations, and feasibility studies. If we are unsuccessful in generating offsetting revenues during these sales cycles, our revenues and earnings could be substantially reduced or we could experience a large loss. Any significant or ongoing failure to ultimately achieve sales as a result of our efforts, or any delays or difficulties in the implementation process for any given customer could have a negative impact on our revenues and results of operations.
Demand for our products and services fluctuates rapidly and unpredictably, which makes it difficult for us to manage our business efficiently and can reduce our gross margins, profitability and market share.
We depend upon the capital spending budgets of our customers. World economic conditions have in the past adversely affected our licensing and maintenance revenue. We believe that the continued weakness in our revenues from sales of new licenses of our enterprise applications systems is consistent with the experience of other participants in our industry. If economic or other conditions reduce our customers' capital spending levels, our business, results of operations, and financial condition may be adversely affected. There has been a financial severe worldwide downturn in information technology spending over the last few years, and any growth in our markets will depend on a general recovery in information technology spending. Growth prospects for our existing businesses are uncertain, with expansion in the industry also being highly dependent on users of enterprise applications systems enhancing their current systems through Web-based applications and new functionality that is complementary to that of their existing systems. Currently, we believe that the market for enterprise resource planning software is weak, and it may continue to be weak for the foreseeable future.
In addition, the purchase and implementation of our products can constitute a major portion of our customers' overall corporate services budget, and the amount customers are willing to invest in
30
acquiring and implementing such products has tended to vary in response to economic or financial crises or other business conditions. Prolongation of the current economic downturn or other difficulty in the economies where we license our products, including North America, the United Kingdom, and other European countries, could have a material adverse effect on our business, financial position, operating results, or cash flows. In particular, our financial position may be significantly adversely affected by a prolonged recession or economic slowdown in any of the economies where we derive a substantial portion of our revenue.
We face significant competition from other providers of enterprise applications software and systems, which may reduce our market share or limit the prices we can charge for our systems and services.
The enterprise resource planning market in which we compete is maturing and is deeply penetrated by large independent software suppliers, such as Microsoft, Oracle Corp., Hyperion, Cognos, Outlooksoft, Cartesis, Lawson Software, PeopleSoft, Inc., SAP AG, SSA and Intentia, and many other suppliers selling to small and mid-sized customers. As a result, competition is intense, and significant pricing pressure exists. The intensity of this competition increases as demand for products and services, such as those offered by us, weakens. To maintain and to improve our competitive position, we must continue to develop and to introduce, in a timely and cost effective manner, new products, product features, and services. In addition, we expect that a substantial portion of our revenue will continue to be derived from renewals of annual maintenance contracts with customers of our software applications. Although we have experienced relatively stable and predictable attrition relating to these contracts, increased competition could significantly reduce the need for our maintenance services, as customers could either decide to replace our software applications with a competitor's applications or to enter in to a maintenance contract with a third party to service their software.
We anticipate additional competition as other established and emerging companies enter the market for our products and as new products and technologies are introduced. For example, companies that historically have not competed in the enterprise resource planning systems market could introduce new enterprise applications based on newer product architectures that could provide for functionality similar to that of our products that are based on older technology. In addition, current and potential competitors may make strategic acquisitions or establish co-operative relationships among themselves or with third parties, thereby increasing the ability of their products to address the needs of our prospective customers. Accordingly, it is possible that new competitors or alliances among current and new competitors may emerge and rapidly gain significant market share. This competition could result in price reductions, fewer customer orders, reduced gross margins, and loss of market share. In addition, variances or slowdowns in our new licensing revenue may negatively impact our current and future revenue from services and maintenance, since such services and maintenance revenues typically depend on new license sales.
Our competitors may have advantages over us that may inhibit our ability to compete effectively.
Many of our competitors and potential competitors have significantly greater financial, technical, marketing, and other resources, greater name recognition, and a larger installed base of customers than we do. The products of some of our competitors are based on more advanced product architectures or offer performance advantages compared with our more mature EAS and ISA products. Our competitors may be able to respond more quickly to new or emerging technologies and changes in customer requirements or may devote greater resources to the development, promotion, and sale of their products than we are able to do. Many competitive factors affect the market for our products and our ability to earn maintenance, professional services and new license revenue. Some of these factors are: vendor and product reputation; expertise and experience in implementing products in a particular customer's industry sector; cost of ownership; ease and speed of implementation; customer support;
31
product architecture, quality, price and performance; product performance attributes, such as flexibility, scalability, compatibility, functionality and ease of use; and vendor financial stability. Our inability to compete effectively based on any of the foregoing factors could have a material adverse effect on our business, results of operations and financial condition. Not all of our existing products compete equally well with respect to each of these factors. To the extent that we conclude that one or more of our existing products is unable to compete effectively, we may reduce the amount of product development, sales and marketing and other resources that we devote to that product. This could result in customer dissatisfaction and a more rapid than anticipated rate of customer attrition and decline in revenues from that product, each of which could have a material adverse effect on our business, results of operations, and financial condition.
Our business may be impacted by the recent consolidation trend in the software industry.
There is a recent trend in the software industry generally, and the enterprise resource planning segment specifically, towards the consolidation of the participants within the industry and between segments. This trend may continue and could result in fewer participants in each segment, some of whom may have greater economic resources, broader geographic scope, a broader range of products and better overall positioning than we do. As a result of this consolidation trend and the fact that there may be fewer participants in the industry or in each segment, competition may increase and pricing pressure on our products may intensify. Industry participants with a broader range of product offerings may be better able to meet customers' needs and win new business. In addition, as a result of this trend, customers' buying patterns may be impacted. The uncertainty in the market created by this trend may cause customers to postpone or delay their buying decisions until the uncertainty regarding this consolidation trend is reduced. We believe that, to the extent we are unable to capitalize on this consolidation trend, it could have a material adverse effect on our business, results of operations, and financial condition.
Our rapid growth through acquisitions has placed significant demands on our management resources and operational infrastructure. Any failure to manage growth effectively may lead to a disruption in our operations and a resulting decline in profitability.
In recent years, we have experienced substantial growth, primarily through acquisitions, which have significantly expanded our operations. We have made 33 acquisitions between May 1, 1996, and April 30, 2004, and plan to continue to make acquisitions in the future. This growth and expansion have placed, and will continue to place, a significant demand on our management resources. To manage growth effectively, we must maintain a high level of quality, efficiency and performance and must continue to enhance our operational, financial, and management systems and to attract, to train, to motivate and to manage employees. We may not be able to effectively manage this expansion, and any failure to do so could lead to a disruption in our business, a loss of customers and revenue, and increased expenses. Any such decline in profitability could lessen the trading price of Geac common shares.
32
Potential divestitures may reduce revenues in the short term and create uncertainty among our employees, customers and potential customers, which could harm our business.
We have in the past divested, and may in the future consider divesting certain portions of our business. Any divestitures would result in a short-term reduction in revenue and could harm our results of operations if we were not able to reduce expenses accordingly or to generate offsetting sources of revenue. To the extent that our consideration of these potential divestitures became known prior to their completion, we could face the risk, among others, that customers and potential customers of the business division in question might be reluctant to purchase our products and services during this period. In addition, we might face the risk that we may be unable to retain qualified personnel within that business division during this period. These risks could prevent us from successfully completing on favourable terms, or at all, divestitures that would otherwise be beneficial to us, and may in the process weaken business divisions subject to consideration for divestiture that are not, in fact, divested. Any of these events could result in a loss of customers, revenues, and employees and could harm our results of operations.
Our international operations expose us to additional risks, including currency-related risk.
We are subject to risks of doing business internationally, including fluctuations in currency exchange rates, increases in duty rates, difficulties in obtaining export licenses, difficulties in the enforcement of intellectual property rights and political uncertainties. We derived more than 95 percent of our total revenue from sales outside Canada in each of FY 2004 and FY 2003. Our most significant international operations are in the United States, the United Kingdom, and France, which are the only countries in which our revenues constituted more than 10 percent of our total worldwide revenues during FY 2004 and FY 2003. Historically, our Canadian sales and expenses have been denominated in Canadian dollars, and our non-Canadian sales and expenses have been denominated in the currencies of 21 other jurisdictions. Effective May 1, 2003, we adopted the U.S. dollar as our reporting currency. To date, we have not used forward, exchange contracts to hedge exposures denominated in non-U.S. currencies, or any other derivative financial instrument for trading, hedging, or speculative purposes.
Revenues and expenses generated in foreign currencies are translated at exchange rates during the month in which the transaction occurs. We cannot predict the effect of foreign exchange losses in the future; however, if significant foreign exchange losses are experienced, they could have a material adverse effect on our business, results of operations, and financial condition. In addition, fluctuations in exchange rates could affect the demand for our products. Additional risks we face in conducting business internationally include the following: longer payment cycles, difficulties in managing international operations, including constraints associated with local laws regarding employment, problems in collecting accounts receivable, complex international tax compliance requirements, and the adverse effects of tariffs, duties, price controls or other restrictions that impair trade.
Seasonal trends in sales of our software products may result in periodic reductions in our cash flow and impairment of our operating results.
Seasonality in our business could result in our revenues or cash flows in a given period being less than market estimates. Seasonality could also result in quarter-to-quarter decreases in our revenues or cash flows. Our revenues and operating results in our January quarter have tended to benefit from customer spending related to calendar year end budget cycles. The greatest number of our maintenance contract renewals occur on a calendar year basis. Accordingly, cash receipts from maintenance contract renewals are highest in the January quarter and lowest in the July and October quarters. These historical patterns may change over time, however, particularly as our operations become larger and the sources of our revenue change and become more diverse. Our European operations have expanded significantly in recent years and may experience variability in demand associated with seasonal buying
33
patterns in these foreign markets. For example, our July and October quarters typically experience reduced sales and cash collections activity, in part, due to the European summer holiday season.
Impact of geopolitical and other world or local events may have a significant effect on our operations.
Various events, including natural disasters, extreme weather conditions, labour disputes, civil unrest, war and political instability, terrorism, and contagious illness outbreaks, or the perceived threat of these events, may cause a disruption of our normal operations and may disrupt the domestic and international travel of our sales and other personnel. In addition to the general uncertainty that these events or the perceived threat of these events could have on the demand for our products and services, the ability of our personnel, including maintenance and sales personnel, to travel to visit customers or potential customers may be affected. The sales cycle for our products includes a period of education for potential customers on the use and benefits of our products and services, as well as the integration of our products and services with additional applications utilized by individual customers. Any disruption in the ability of our personnel to travel could have a material and adverse impact on our ability to complete this process and to service these customers, which could, in turn, have a material adverse effect on our business, results of operations and financial condition. In addition, these events or the perceived threat of these events may require us to reorganize our day-to-day operations to minimize the associated risks. Any expense related to the reorganization of our day-to-day operations, even on a short-term basis, could also have a material adverse effect on our business, results of operations and financial condition.
If we cannot attract and retain qualified sales personnel, customer service personnel, and software developers, we may not be able to sell and to support our existing products or to develop new products.
We depend on key technical, sales, and senior management personnel. Many of these individuals would be difficult to replace if they were to leave our employment. In addition, our success is highly dependent on our continuing ability to identify, to hire, to train, to assimilate, to motivate, and to retain highly qualified personnel, including recently hired officers and other employees. Competition for qualified employees is particularly intense in the technology industry, and we have in the past experienced difficulty recruiting qualified employees. Our failure to attract and to retain the necessary qualified personnel could seriously harm our operating results and financial condition.
Our future growth depends, in part, upon our ability to develop new products and to improve existing products. Our ability to develop new products and services and to enhance our existing products and services will depend, in part, on our ability to recruit and to retain top quality software programmers. If we are unable to hire and to retain sufficient numbers of qualified programming personnel, we may not be able to develop new products and services or to improve our existing products and services in the time frame necessary to execute our business plan.
Our executive officers are critical to our business, and these officers may not remain with us in the future.
Our future success largely depends on the continued efforts and abilities of our executive officers. Their skills, experience, and industry contacts significantly benefit us. Although we have employment and non-competition agreements with Charles Jones, our President and Chief Executive Officer; Donna deWinter, our Chief Financial Officer; James Travers, President, Geac Americas; and Timothy Wright, our Chief Technology Officer and our Chief Executive of Europe and Asia-Pacific; we cannot assure you that they, or our other executive officers will all choose to remain employed by us. If we lose the services of one or more of our executive officers, or if one or more of them decide to join a competitor or otherwise compete directly or indirectly with us, our business, operating results, and financial condition could be harmed. We do not maintain key-man life insurance on any of our employees.
34
The market for our software products is characterized by rapid technological advances, and we must continually improve our technology to remain competitive.
Rapid technological change and frequent new product introductions and enhancements characterize the enterprise solutions software industry. Our current and potential customers increasingly require greater levels of functionality and more sophisticated product offerings. In addition, the life cycles of our products are difficult to estimate. Accordingly, we believe that our future success depends upon our ability to enhance current products and to develop and to introduce new products offering enhanced performance and functionality at competitive prices in a timely manner, and on our ability to enable our products to work in conjunction with other products from other suppliers that our customers may utilize. Our failure to develop and to introduce or to enhance products in a timely manner could have a material adverse effect on our business, results of operations, and financial condition. We may be unable to respond on a timely basis to the changing needs of our customer base, and the new applications we design for our customers may prove to be ineffective. Our ability to compete successfully will depend in large measure on our ability to be among the first to market with effective new products or services, to maintain a technically competent research and development staff, and to adapt to technological changes and advances in the industry, including providing for the continued compatibility of our software products with evolving computer hardware and software platforms and operating environments. We cannot assure you that we will be successful in these efforts. In addition, competitive or technological developments and new regulatory requirements may require us to make substantial, unanticipated investments in new products and technologies, and we may not have sufficient resources to make these investments. If we were required to expend substantial resources to respond to specific technological or product changes, our operating results would be adversely affected.
We may be unable to develop and to maintain collaborative development and marketing relationships, which could result in a decline in revenues or slower than anticipated growth rates.
As a part of our business strategy, we have and intend to continue to form collaborative relationships with other leading companies to increase new license revenue. We believe that our success will depend, in part, on our ability to maintain these relationships and to cultivate additional corporate alliances with such companies. We cannot assure you that our historical collaborative relationships will be commercially successful, that we will be able to negotiate additional collaborative relationships, that such additional collaborative relationships will be available to us on acceptable terms, or that any such relationships, if established, will be commercially successful. In addition, we cannot assure you that parties with whom we have established, or will establish, collaborative relationships will not, either directly or in collaboration with others, pursue alternative technologies or develop alternative products in addition to, or instead of, our products, be acquired by our competitors resulting in the termination of our relationship or experience financial or other difficulties that lessen their value to us and to our customers. Our financial condition or results of operations may be adversely affected by our failure to establish and maintain collaborative relationships.
We may become increasingly dependent on third party software incorporated in our products, and, if so, impaired relations with these third parties, errors in third-party software, or inability to enhance the software over time could harm our business.
We incorporate third party software into our products. Currently, the third-party software we use includes several products from IBM, including Websphere Application Server, Websphere Commerce Suite, HACP, and MQSeries. Other third-party software incorporated by us in our products includes Impromptu, FRx Professional Edition and Enterprise Edition, NetManage Rumba, Applix iSales, Jacada, Brio Brio.Report, Rogue Wave Software Tools.h++, FileNET Panagon, Captaris RightFax, Microsoft Clearlead, Microsoft.net, Lombardi TeamWorks, IBI WebFOCUS, John Galt Forecasting,
35
Pervasive Pervasive.SQL, Inxight Hyperbolic Tree, Summit BasciScript, application server software licensed from BEA Systems, off-line database software from Pointbase, off-line client server software from Pumatech, synchronization software from Aether Systems, reporting software from Business Objects, and Java Web Start from Sun Microsystems. We may incorporate additional third party software into our products as we expand our product lines. The operation of our products would be impaired if errors occur in the third-party software that we license. It may be more difficult for us to correct any errors in third-party software because the software is not within our control. Accordingly, our business would be adversely affected in the event of any errors in this software. Furthermore, it may be difficult for us to replace any third-party software if a vendor seeks to terminate our license to the software.
We may be unable to protect our proprietary technology and that of other companies we may acquire, which could harm our competitive position.
We have relied, and expect to continue to rely, on a combination of copyright, trademark and trade secret laws, confidentiality procedures, and contractual provisions to establish, to maintain, and to protect our proprietary rights. Despite our efforts to protect our proprietary rights in our intellectual property and that of other companies we may acquire, unauthorized parties may attempt to copy aspects of our products or to obtain information we regard as proprietary. Policing unauthorized use of our technology, if required, may be difficult, time consuming, and costly. Our means of protecting our technology may be inadequate.
Third parties may apply for patent protection for processes that are the same as or similar to our processes or for products that use the same or similar processes as our products. Despite our efforts to protect our proprietary rights, unauthorized parties may attempt to copy aspects of our products or services or to obtain and to use information that we regard as proprietary. Third parties may also independently develop similar or superior technology without violating our proprietary rights. In addition, the laws of some foreign countries do not protect proprietary rights to the same extent as do the laws of Canada and the United States.
We believe that trademark protection is an important factor in establishing product recognition. Our inability to protect our trademarks from infringement could result in injury to any goodwill, which may be developed in our trademarks. Moreover, we may be unable to use one or more of our trademarks because of successful third-party claims.
Claims of infringement are becoming increasingly common as the software industry develops and legal protections, including patents, are applied to software products. Although we believe that our products and technology do not infringe proprietary rights of others, litigation may be necessary to protect our proprietary technology, and third parties may assert infringement claims against us with respect to their proprietary rights. Any claims or litigation can be time consuming and expensive regardless of their merit. Infringement claims against us could cause product release delays, require us to redesign our products or to enter into royalty or license agreements that may not be available on terms acceptable to us, or at all.
Product development delays could harm our competitive position and reduce our revenues.
If we experience significant delays in releasing new or enhanced products, our position in the market could be harmed and our revenue could be substantially reduced, which would adversely affect our operating results. We have experienced product development delays in the past and may experience delays in the future. In particular, we may experience product development delays associated with the integration of recently acquired products and technologies. Delays may occur for many reasons, including an inability to hire a sufficient number of developers, discovery of bugs and errors, or the inability of our current or future products to conform to customer and industry requirements.
36
Our software products may contain errors or defects that could result in lost revenue, delayed or limited market acceptance, or product liability claims with substantial litigation costs.
As a result of their complexity, software products may contain undetected errors or failures when entering the market. Despite testing performed by us and testing and use by current and potential customers, defects and errors may be found in new products after commencement of commercial shipments or the offering of a network service using these products. In these circumstances, we may be unable to successfully correct the errors in a timely manner or at all. The occurrence of errors and failures in our products could result in negative publicity and a loss of, or delay in, market acceptance of those products, which could reduce revenue from new licenses and lead to increased customer attrition. Alleviating these errors and failures could require significant expenditure of capital and other resources by us. The consequences of these errors and failures could have a material adverse effect on our business, results of operations, and financial condition.
Because many of our customers use our products for business-critical applications, any errors, defects, or other performance problems could result in financial or other damage to our customers. Our customers or other third parties could seek to recover damages from us in the event of actual or alleged failures of our products or the provision of services. We have in the past been, and may in the future continue to be, subject to these kinds of claims. Although our license agreements with customers typically contain provisions designed to limit our exposure to potential claims, as well as any liabilities arising from these claims, the provisions may not effectively protect against these claims and the liability and associated costs. Accordingly, any such claim could have a material adverse effect upon our business, results of operations, and financial condition. In addition, defending this kind of claim, regardless of its merits, or otherwise satisfying affected customers, could entail substantial expense and require the devotion of significant time and attention by key management personnel.
The hosting services of our AppCare service, Extensity products, and Interealty subsidiary are dependent on the uninterrupted operation of our data centers. Any unexpected interruption in the operation of our data centers could result in customer dissatisfaction and a loss of revenues.
The hosting services offered by our AppCare remote application management service, Extensity products, Anael, Local Government and Interealty subsidiary depend upon the uninterrupted operation of our data centers and our ability to protect computer equipment and information stored in our data centers against damage that may be caused by natural disaster, fire, power loss, telecommunications or internet failure, unauthorized intrusion, computer viruses and other similar damaging events. If any of our data centers were to become inoperable for an extended period we might be unable to provide our customers with contracted services. Although we take what we believe to be reasonable precautions against such occurrences, we can give no assurance that damaging events such as these will not result in a prolonged interruption of our services, which could result in customer dissatisfaction, loss of revenue and damage to our business.
In addition, if customers determine that our hosted product is not scalable, does not provide adequate security for the dissemination of information over the Internet, or is otherwise inadequate for Internet-based use, or, if for any other reason, customers fail to accept our hosted products for use on the Internet or on a subscription basis, our business will be harmed. As a provider of hosted services, we expect to receive confidential information, including credit card, travel booking, employee, purchasing, supplier, and other financial and accounting data, through the Internet. There can be no assurance that this information will not be subject to computer break-ins, theft, and other improper activity that could jeopardize the security of information for which we are responsible. Any such lapse in security could expose us to litigation, loss of customers, or otherwise harm our business. In addition, any person who is able to circumvent our security measures could misappropriate proprietary or confidential customer information or cause interruptions in our operations. We may be required to incur significant costs to protect against security breaches or to alleviate problems caused by breaches.
37
Further, a well-publicized compromise of security could deter people from using the Internet to conduct transactions that involve transmitting confidential information. Our failure to prevent security breaches, or well-publicized security breaches affecting the Internet in general could significantly harm our business, operating results and financial condition.
As Internet commerce evolves, we expect that federal, provincial, state or foreign agencies will adopt regulations covering issues, such as user privacy, pricing, taxation of goods and services provided over the Internet, and content and quality of products and services. It is possible that legislation could expose companies involved in electronic commerce to liability, which could limit the growth of electronic commerce generally. Legislation could dampen the growth in Internet usage and decrease its acceptance as a communications and commercial medium. If enacted, these laws, rules or regulations could limit the market for our products and services.
Our shareholder protection rights plan may discourage take-over attempts.
We have adopted a shareholder protection rights plan, pursuant to which one right for each Geac common share has been issued. The rights represent the right to purchase, subject to the terms and conditions of the rights plan, Geac common shares that would have the effect of diluting the interests of potential acquirers. The rights plan may have an anti-take-over effect and discourage take-over attempts not first approved by our board of directors or made in accordance with the terms of the plan.
Our subsidiary, Extensity, is the target of a securities class action complaint, which may result in substantial costs and divert management attention and resources.
Extensity, a subsidiary that we acquired in March 2003, is subject to a class action suit, which alleges that Extensity, certain of its former officers and directors, and the underwriters of its initial public offering in January 2000 violated U.S. securities laws by not adequately disclosing the compensation paid to such underwriters. The class action suit has been consolidated with a number of similar class action suits brought against other issuers and underwriters involved in initial public offerings. The plaintiffs seek an unspecified amount of damages. The plaintiffs and issuer parties have entered into a memorandum of understanding to settle all claims, which would be funded by the issuers' insurers. The settlement is subject to a number of conditions, including approval by the proposed settling parties and the Court. This action may divert the efforts and attention of our management and, if determined adversely, could have a material impact on our business, financial position, results of operations and cash flows.
We may be required to delay the recognition of revenue until future periods, which could adversely impact our operating results.
We may have to defer revenue recognition due to several factors, including whether:
- •
- we are required to accept extended payment terms;
- •
- the transaction involves contingent payment terms or fees;
- •
- the transaction involves acceptance criteria or there are identified product-related issues; or
- •
- license agreements include products that are under development or other undelivered elements.
Because of the factors listed above and other specific requirements for software revenue recognition, we must have very precise terms in our license agreements to recognize revenue when we initially deliver our products or perform services. Negotiation of mutually acceptable terms and conditions can extend the sales cycle, and sometimes we do not obtain terms and conditions that permit revenue recognition at the time of delivery or even as work on the project is completed.
38
We may have exposure to additional tax liabilities.
As a multinational corporation, we are subject to income taxes as well as non-income based taxes, in Canada, the United States and various foreign jurisdictions and our tax structure is subject to review by numerous taxation authorities. Significant judgment is required in determining our worldwide provision for income taxes and other tax liabilities. In the ordinary course of a global business, there are many intercompany transactions and calculations where the ultimate tax determination is uncertain. Although we believe that our tax estimates are reasonable, we cannot assure you that the final determination of any tax audits and litigation will not be different from what is reflected in our historical income tax provisions and accruals, and any such differences may materially affect our operating results for the affected period or periods.
We also have exposure to additional non-income tax liabilities. We are subject to non-income taxes, such as payroll, sales, use, value-added, net worth, property and goods and services taxes, in Canada, the United States and various foreign jurisdictions. We are regularly under audit by tax authorities with respect to these non-income taxes.
Terrorist attacks or hostilities could harm our business.
Actual or threatened terrorist attacks or military actions, and events occurring in response to those developments, may reduce the amount, or delay the timing, of capital expenditures by corporations for information technology. Accordingly, we cannot be assured that we will be able to increase or maintain our revenue. In addition, any increase in terrorist activity or escalation of military action may disrupt our operations or the operations of our customers, which could adversely affect our business, financial condition or operating results.
Legislative actions, higher insurance costs and potential new accounting pronouncements may affect our future financial position and results of operations.
To comply with the Sarbanes-Oxley Act of 2002, as well as recent changes to stock exchange standards, we may be required to hire additional personnel, make additional investment in our infrastructure and utilize additional outside legal, accounting and advisory services, all of which will cause our general and administrative costs to increase. Insurers may increase premiums as a result of high claims rates experienced by them over the past year, and so our future premiums for our various insurance policies, including our directors' and officers' insurance policies, could be subject to increase. Proposed changes in the accounting rules could materially increase the expenses that we report under generally accepted accounting principles and adversely affect our operating results.
CRITICAL ACCOUNTING POLICIES AND ESTIMATES
General
The preparation of our consolidated financial statements requires management to make estimates and assumptions that affect the reported amounts of assets, liabilities, revenue and expenses, and related disclosure of contingent assets and liabilities. Our estimates are based on historical experience and on various other assumptions that are believed to be reasonable under the circumstances. Our ongoing evaluation of these estimates forms the basis for making judgments about the carrying values of assets and liabilities and the reported amount of revenues and expenses, in cases where they are not readily ascertainable from other sources. Actual amounts may differ from these estimates under different assumptions or conditions.
Our significant accounting policies are fully described in Note 2 to our consolidated financial statements. However, certain accounting policies are particularly important to the reporting of our financial position and results of operations, and require the application of significant judgment by our
39
management. An accounting policy is deemed to be critical if it requires an accounting estimate to be made based on assumptions about matters that are highly uncertain at the time the estimate is made, and if different estimates that reasonably could have been used, or changes in the accounting estimates that are reasonably likely to occur periodically, could materially impact the financial statements. Management believes the following critical accounting policies reflect the more significant estimates and assumptions used in the preparation of our consolidated financial statements.
Revenue Recognition. Revenue consists primarily of software licenses fees, maintenance fees, and professional service fees. Support and service revenue is comprised of professional services revenue from consulting, implementation and training services related to our products; and maintenance and technical support subscriptions, which also includes software upgrades and enhancements. We recognize revenue in accordance with the current rules that have been prescribed for the software industry under Canadian generally accepted accounting principles. Revenue recognition requirements are very complex and are affected by interpretations of the rules and industry practices, both of which are subject to change. We follow specific and detailed guidelines in measuring revenue; however, certain judgments and current interpretations of rules and guidelines affect the application of our revenue recognition policy.
Software license revenue is comprised of license fees charged for the use of our products licensed under single or multiple year arrangements in which the fair value of the license fee is separately determinable from maintenance and/or professional services. For license arrangements that do not require significant modifications or customization of the software, we recognize software license revenue when persuasive evidence of an arrangement exists, the product has been delivered, the fee is fixed or determinable, and collection of the resulting receivable is probable.
One of the critical judgments we make is our assessment of the probability of collecting the related accounts receivable balance on a customer-by-customer basis. As a result, the timing or amount of revenue recognition may have been different if different assessments of the probability of collection had been made at the time that the transactions were recorded in revenue. In cases where collectibility is not deemed probable, revenue is recognized upon receipt of cash, assuming all other criteria have been met.
When a license agreement includes one or more elements to be delivered at a future date and vendor specific objective evidence ("VSOE") of the fair value of all undelivered elements exists, we use the residual method to recognize revenue. Under the residual method, the fair value of the undelivered elements is deferred and the remaining portion of the arrangement fee is recognized as revenue. If evidence of the fair value of one or more undelivered elements does not exist, all revenue is deferred and recognized when delivery of those elements occurs or when fair value can be established. VSOE for all elements of an arrangement is based upon the normal pricing and discounting practices for those elements when sold separately, and for maintenance services, is additionally measured by the renewal rate. We are required to exercise judgment in determining whether VSOE exists for each undelivered element and to determine whether and when each element has been delivered. If we were to change any of these assumptions or judgments, it could cause a material increase or decrease in the amount of revenue that we recognize in a particular period.
Maintenance revenue consists of fees charged for customer support on our software products post-delivery, which are determinable based upon VSOE of the fair value. Maintenance fee arrangements include ongoing customer support and rights to product updates "if and when available." Customer payments for maintenance are generally received in advance and are non-refundable. Maintenance revenue is deferred and recognized on a straight-line basis as support and services revenue over the life of the related agreement, which is typically one year.
Professional service revenue consists of fees charged for product training and consulting services, which are determinable based upon VSOE of the fair value. When license arrangements include
40
professional services, the license fees are recognized upon delivery, provided that (1) the criteria described above for delivery have been met, (2) payment of the license fees is not dependent upon the performance or acceptance of the services, (3) the services are not essential to the functionality of the software, and (4) VSOE exists on the undelivered services. When professional services are not considered essential, which has been the case in the majority of our license arrangements, we recognize time and materials service contracts as the services are performed. Fixed price professional services contracts are recognized on a proportional performance basis as determined by the relationship of contract costs incurred to date and the estimated total contract costs, which are regularly reviewed during the life of the contract, subject to the achievement of the agreed upon milestones. In the event that a milestone has not been achieved, the associated cost is deferred and revenue is not recognized until the customer has accepted the milestone.
Revenue from fixed price professional service contracts is recognized on a proportional performance basis which requires us to make estimates and is subject to risks and uncertainties inherent in projecting future events. A number of internal and external factors can affect our estimates, including the nature of the services being performed, the complexity of the customer'slogy environment and the utilization and efficiency of our professional services employees. Recognized revenues and profit are subject to revisions as the contract progresses to completion. Revisions in profit estimates are charged to income in the period in which the facts that give rise to the revision become known. If we do not have a sufficient basis to estimate the progress towards completion, revenue is recognized when the project is complete or when we receive final acceptance from the customer.
For arrangements that do not meet the criteria described above, both the license revenues and professional services revenues are recognized using the percentage-of-completion method where reasonably dependable estimates of progress toward completion of a contract can be made. We estimate the percentage-of-completion on contracts utilizing costs incurred to date as a percentage of the total costs at project completion, subject to meeting agreed milestones. In the event that a milestone has not been reached, the associated cost is deferred and revenue is not recognized until the milestone has been accepted by the customer. Recognized revenues and profit are subject to revisions as the contract progresses to completion. Revisions in profit estimates are charged to earnings in the period in which the facts that give rise to the revision become known. To date, we have had no contracts accounted for using the percentage of completion method.
Valuation of Identifiable Goodwill and Other Intangible Assets. We account for our business acquisitions under the purchase method of accounting. The total cost of an acquisition is allocated to the underlying net assets based on their respective estimated fair values. As part of this allocation process, we must identify and attribute values and estimated lives to the intangible assets acquired. While we may employ experts to assist us with these matters, such determinations involve considerable judgment, and often involve the use of significant estimates and assumptions, including those with respect to future cash inflows and outflows, discount rates, and asset lives. These determinations will affect the amount of amortization expense recognized in future periods.
Goodwill is initially recorded when the purchase price paid for an acquisition exceeds the estimated fair value of the net identified tangible and intangible assets acquired. Goodwill is not amortized but rather it is periodically assessed for impairment. We perform an annual review in the fourth quarter of each fiscal year, or more frequently if indicators of potential impairment exist, to determine if the recorded goodwill is impaired.
We test goodwill for impairment annually or more frequently if circumstances indicate that impairment may exist. Goodwill is tested for impairment at the "reporting unit level" ("reporting unit") in accordance with Canadian Institute of Chartered Accountants ("CICA") Handbook Section 3062, "Goodwill and Other Intangible Assets." A "reporting unit" is a group or business for which discrete financial information is available and that have similar economic characteristics. Our impairment review
41
process compares the fair value of the reporting unit to its carrying value, including the goodwill related to the reporting unit. To determine the fair value, our review process uses the cash flow method and is based on a discounted future cash flow approach that uses estimates including the following for the reporting units: revenue, based on expected growth rates; estimated costs; and appropriate discount rates based on our weighted-average cost of capital. Significant management judgment is required in the forecasting of future operating results, which are used in the preparation of the projected discounted cash flows and should different conditions prevail, material write-downs of goodwill could occur.
We also review the carrying value of amortizable intangible assets for impairment whenever events and circumstances indicate that the carrying value of an asset may not be recoverable from the estimated future cash flows expected to result from its use and eventual disposition. Any change in estimate which causes the undiscounted expected future cash flows to be less than the carrying value, would result in an impairment loss being recognized equal to the amount by which the carrying value of the asset exceeds the fair value of the asset.
Accounting for Income Taxes. Significant management judgment is required in determining our provision for income taxes, our income tax assets and liabilities, and any valuation allowance recorded against our net income tax assets. We operate in multiple geographic jurisdictions, and to the extent we have profits in each jurisdiction, these profits are taxed pursuant to the tax laws of their jurisdiction. Our effective tax rate may be affected by the changes in, or interpretations of, tax laws in any given jurisdiction, the level of profitability, utilization of net operating losses and tax credit carry forwards, changes in geographical mix of income and expense, and changes in management's assessment of matters, such as the ability to realize ust estimate future tax assets our income taxes in each of the jurisdictions in which we operate on a quarterly basis. This process involves estimating our actual current tax exposure, together with assessing temporary differences resulting from differing treatment of items for tax and accounting purposes. These differences result in future tax assets and liabilities, which are included in our consolidated balance sheet.
We record a valuation allowance to reduce our future tax assets recorded on our balance sheet to the amount of future tax benefit that is more likely than not to be realized. The valuation allowance is based on our estimates of taxable income by jurisdiction in which we operate and the period over which our income tax assets will be recoverable. While we have considered future taxable income and ongoing prudent and feasible tax planning strategies in assessing the need for the valuation allowance, there is no assurance that the valuation allowance will not need to be increased to cover additional future tax assets that may not be realizable. Although we believe that our estimates are reasonable, no assurance can be given that the final tax outcome of these matters will not be different than that which is reflected in our historical income tax provisions and accruals. Any increase in the valuation allowance could have a material adverse impact on our income tax provision and net income reflected in our consolidated statement of operations in the period in which such determination is made.
Restructuring. We have accrued restructuring charges for lease commitments for the various facilities that we have vacated or plan to vacate, net of estimated projected sublease income. The assumptions we have made are based on the current market conditions in the various areas we have vacant space, and necessarily entail a high level of management judgment. These market conditions will often fluctuate greatly due to such factors as changes in property occupancy rates, rental prices charged for comparable properties and general economic conditions. These changes could materially affect our accrual. If, in future periods, it is determined that we have over accrued restructuring charges for the consolidation of facilities, the reversal of such over-accrual would have a favorable impact on our financial statements in the period during which this was determined and would be recorded as a credit to restructuring costs. Conversely, if it is determined that our accrual is insufficient, an additional charge would have an unfavorable impact on our financial statements in the period this was determined.
42
Accounts Receivable. We evaluate the collectibility of our trade receivables based on a combination of factors. We regularly analyze our significant customer accounts, and, when we become aware of a specific customer's inability to meet its financial obligations to us, such as in the case of bankruptcy filings or deterioration in the customer's operating results or financial position, we record specific bad debt reserves to reduce the related receivable to the amount we reasonably believe is collectible. We also record reserves for bad debt on a small portion of all other customer balances based on a variety of factors, including the length of time that the receivables are past due, the financial health of the customer, macroeconomic considerations and historical experience. If circumstances related to specific customers change, our estimates of the recoverability of receivables could be further adjusted. As of April 30, 2004 our allowance for doubtful accounts was $11.5 million.
Contingencies. We are currently involved in various claims and legal proceedings. Quarterly, we review the status of each significant matter and assess our potential financial exposure. If the potential loss from any claim or legal proceeding is considered probable and the amount can be reasonably estimated, we accrue a liability for the estimated loss. Significant judgment is required in both the determination of probability and the determination as to whether an exposure is reasonably estimable. Because of the uncertainties related to these matters, accruals are based only on the best information available at the time. As additional information becomes available, we reassess the potential liability related to our pending claims and litigation and, if necessary, revise our estimates. Such revisions in the estimates of the potential liabilities could have a material impact on our results of operations and financial position.
SELECTED ANNUAL INFORMATION
The following information is provided to give a context to the broader comments elsewhere in this report.
43
Three year financial highlights
(in thousands of U.S. dollars, except share and per share data)
| | Years Ended April 30,
| |
|---|
| | 2004
| | 2003(1)
| | 2002(2)
| |
|---|
| Consolidated Statement of Earnings Data: | | | | | | | | | | |
| Total revenues | | $ | 445,272 | | $ | 408,477 | | $ | 457,286 | |
| Total cost of revenues | | | (175,096 | ) | | (169,042 | ) | | (208,393 | ) |
| | |
| |
| |
| |
| Gross profit | | | 270,176 | | | 239,435 | | | 248,893 | |
| Operating expenses | | | (197,938 | ) | | (185,252 | ) | | (192,762 | ) |
| | |
| |
| |
| |
| Earnings from operations | | | 72,238 | | | 54,183 | | | 56,131 | |
| Other expense, net | | | (1,398 | ) | | (969 | ) | | (429 | ) |
| | |
| |
| |
| |
| Earnings from operations before income taxes | | | 70,840 | | | 53,214 | | | 55,702 | |
| Income taxes | | | (13,674 | ) | | (21,343 | ) | | (21,929 | ) |
| | |
| |
| |
| |
| Net earnings | | $ | 57,166 | | $ | 31,871 | | $ | 33,773 | |
| | |
| |
| |
| |
Basic net earnings per common share |
|
$ |
0.68 |
|
$ |
0.40 |
|
$ |
0.46 |
|
| Diluted net earnings per common share | | $ | 0.66 | | $ | 0.39 | | $ | 0.45 | |
Weighted average number of common shares used in computing basic net earnings per share ('000s) |
|
|
84,645 |
|
|
80,152 |
|
|
73,130 |
|
| Weighted average number of common shares used in computing diluted net earnings per share ('000s) | | | 86,233 | | | 81,695 | | | 75,784 | |
| | |
| |
| |
| |
Consolidated Balance Sheet Data: |
|
|
|
|
|
|
|
|
|
|
| Cash and cash equivalents | | $ | 112,550 | | $ | 89,819 | | $ | 73,638 | |
| Current assets | | | 195,192 | | | 179,128 | | | 156,165 | |
| Total assets | | | 406,903 | | | 332,756 | | | 305,096 | |
| Current liabilities | | | 232,520 | | | 233,268 | | | 257,809 | |
| Total liabilities | | | 270,832 | | | 256,586 | | | 270,970 | |
| Shareholders' equity | | | 136,071 | | | 76,170 | | | 34,126 | |
| | |
| |
| |
| |
Consolidated Statement of Cash Flows Data: |
|
|
|
|
|
|
|
|
|
|
| Cash provided by operating activities | | $ | 66,618 | | $ | 29,044 | | $ | 52,871 | |
| Cash used in investing activities | | | (41,817 | ) | | (23,828 | ) | | (3,967 | ) |
| Cash (used in)/provided by financing activities | | | (2,796 | ) | | 6,589 | | | 3,330 | |
| | |
| |
| |
| |
- (1)
- Certain figures were restated to conform to the fiscal year 2004 presentation.
- (2)
- For fiscal year 2002, the selected financial highlights from the statement of earnings have been translated into U.S. dollars at the weighted average quarterly rates. The selected financial highlights from the consolidated balance sheet have been translated into U.S. dollars at the April 30, 2002 closing rate. The selected financial highlights from the statement of cash flows have been translated into U.S. dollars at the average rate for fiscal year 2002.
44
Auditors' Report
To the Shareholders of Geac Computer Corporation Limited
We have audited the consolidated balance sheets of Geac Computer Corporation Limited as at April 30, 2004 and 2003 and the consolidated statements of earnings, shareholders' equity and cash flows for each of the years in the two-year period ended April 30, 2004. These consolidated financial statements are the responsibility of the Company's management. Our responsibility is to express an opinion on these financial statements based on our audits.
We conducted our audits in accordance with Canadian generally accepted auditing standards. Those standards require that we plan and perform an audit to obtain reasonable assurance whether the financial statements are free of material misstatement. An audit includes examining, on a test basis, evidence supporting the amounts and disclosures in the financial statements. An audit also includes assessing the accounting principles used and significant estimates made by management, as well as evaluating the overall financial statement presentation.
In our opinion, these consolidated financial statements present fairly, in all material respects, the financial position of the Company as at April 30, 2004 and 2003 and the results of its operations and its cash flows for each of the years in the two-year period ended April 30, 2004 in accordance with Canadian generally accepted accounting principles.

PricewaterhouseCoopers LLP
Chartered Accountants
Toronto, Ontario
June 28, 2004
45
Geac Computer Corporation Limited
Consolidated Balance Sheets
(in thousands of U.S. dollars)
| | April 30,
| |
|---|
| | 2004
| | 2003
| |
|---|
| Assets | | | | | | | |
| Current assets: | | | | | | | |
| Cash and cash equivalents | | $ | 112,550 | | $ | 89,819 | |
| Restricted cash | | | 95 | | | — | |
| Accounts receivable and other receivables (note 3) | | | 49,300 | | | 54,339 | |
| Unbilled receivables | | | 6,537 | | | 6,901 | |
| Future income taxes (note 18) | | | 15,247 | | | 16,238 | |
| Inventory (note 4) | | | 624 | | | 787 | |
| Prepaid expenses | | | 10,839 | | | 11,044 | |
| | |
| |
| |
| | Total current assets | | | 195,192 | | | 179,128 | |
Restricted cash |
|
|
1,781 |
|
|
2,395 |
|
| Future income taxes (note 18) | | | 21,741 | | | 23,008 | |
| Property, plant and equipment (note 5) | | | 23,843 | | | 26,431 | |
| Intangible assets (note 6) | | | 32,628 | | | 11,172 | |
| Goodwill (note 7) | | | 128,366 | | | 89,386 | |
| Other assets | | | 3,352 | | | 1,236 | |
| | |
| |
| |
| | Total assets | | $ | 406,903 | | $ | 332,756 | |
| | |
| |
| |
| Liabilities & Shareholders' Equity | | | | | | | |
| Current liabilities: | | | | | | | |
| Accounts payable and accrued liabilities (note 9) | | $ | 79,664 | | $ | 81,484 | |
| Income taxes payable | | | 34,538 | | | 31,114 | |
| Current portion of long-term debt (note 11) | | | 391 | | | 733 | |
| Deferred revenue (note 2) | | | 117,927 | | | 119,937 | |
| | |
| |
| |
| | Total current liabilities | | | 232,520 | | | 233,268 | |
Deferred revenue (note 2) |
|
|
2,256 |
|
|
2,690 |
|
| Pension liability (note 13) | | | 23,994 | | | 1,059 | |
| Asset retirement obligation (note 2) | | | 1,648 | | | 1,517 | |
| Accrued restructuring (note 17) | | | 5,864 | | | 12,436 | |
| Long-term debt (note 11) | | | 4,550 | | | 5,616 | |
| | |
| |
| |
| | Total liabilities | | | 270,832 | | | 256,586 | |
Shareholders' Equity |
|
|
|
|
|
|
|
| Preference shares; no par value; unlimited shares authorized; none issued or outstanding | | | — | | | — | |
| Common shares; no par value; unlimited shares authorized; issued and outstanding as at April 30, 2004—85,174,785 (2003—84,136,490) | | | 124,019 | | | 120,976 | |
| Common stock options | | | 44 | | | 163 | |
| Contributed surplus | | | 2,368 | | | — | |
| Retained earnings/(deficit) | | | 34,517 | | | (22,649 | ) |
| Cumulative foreign exchange translation adjustment | | | (24,877 | ) | | (22,320 | ) |
| | |
| |
| |
| | Total shareholders' equity | | | 136,071 | | | 76,170 | |
| | |
| |
| |
| | | $ | 406,903 | | $ | 332,756 | |
| | |
| |
| |
Commitments and contingencies (notes 11, 14 and 20)
The accompanying notes are an integral part of these consolidated financial statements.
Approved by the Board of Directors
/s/ C. KENT JESPERSEN
C. Kent Jespersen
Chairman | | /s/ ROBERT L. SILLCOX
Robert L. Sillcox
Chair of the Audit Committee
| | |
46
Geac Computer Corporation Limited
Consolidated Statements of Earnings
(in thousands of U.S. dollars, except share and per share data)
| | Year ended April 30,
| |
|---|
| | 2004
| | 2003
| |
|---|
| Revenues: | | | | | | | |
| | Software | | $ | 65,190 | | $ | 49,380 | |
| | Support and services | | | 355,019 | | | 328,472 | |
| | Hardware | | | 25,063 | | | 30,625 | |
| | |
| |
| |
| | | Total revenues | | | 445,272 | | | 408,477 | |
Cost of revenues: |
|
|
|
|
|
|
|
| | Costs of software | | | 7,663 | | | 6,535 | |
| | Costs of support and services | | | 146,316 | | | 136,621 | |
| | Costs of hardware | | | 21,117 | | | 25,886 | |
| | |
| |
| |
| | | Total cost of revenues | | | 175,096 | | | 169,042 | |
| | |
| |
| |
| Gross profit | | | 270,176 | | | 239,435 | |
Operating expenses: |
|
|
|
|
|
|
|
| | Sales and marketing | | | 74,051 | | | 58,730 | |
| | Product development | | | 58,805 | | | 51,905 | |
| | General and administrative | | | 62,774 | | | 58,420 | |
| | Net restructuring and other unusual items (note 17) | | | (5,281 | ) | | 3,603 | |
| | Goodwill impairment (note 7) | | | — | | | 11,509 | |
| | Amortization of intangible assets | | | 7,589 | | | 1,085 | |
| | |
| |
| |
| | | Total costs and expenses | | | 197,938 | | | 185,252 | |
| | |
| |
| |
| Earnings from operations | | | 72,238 | | | 54,183 | |
| Interest income | | | 1,265 | | | 1,327 | |
| Interest expense | | | (1,289 | ) | | (482 | ) |
| Other expense, net | | | (1,374 | ) | | (1,814 | ) |
| | |
| |
| |
| Earnings from operations before income taxes | | | 70,840 | | | 53,214 | |
| Income taxes (note 18) | | | 13,674 | | | 21,343 | |
| | |
| |
| |
| Net earnings | | $ | 57,166 | | $ | 31,871 | |
| | |
| |
| |
| Basic net earnings per common share | | $ | 0.68 | | $ | 0.40 | |
| | |
| |
| |
| Diluted net earnings per common share | | $ | 0.66 | | $ | 0.39 | |
| | |
| |
| |
| Weighted average number of common shares used in computing basic net earnings per share ('000s) (note 16) | | | 84,645 | | | 80,152 | |
| | |
| |
| |
| Weighted average number of common shares used in computing diluted net earnings per share ('000s) (note 16) | | | 86,233 | | | 81,695 | |
| | |
| |
| |
The accompanying notes are an integral part of these consolidated financial statements.
47
Geac Computer Corporation Limited
Consolidated Statement of Shareholders' Equity
For the years ended April 30, 2004 and 2003
(in thousands of U.S. dollars, except share data)
| | Share capital
| |
| |
| |
| | Cumulative
Foreign
Exchange
Translation
Adjustment
| |
| |
|---|
| | Common
Shares
('000s)
| | Amount
| | Common
Stock
Options
| | Purchase
Warrants
| | Contributed
Surplus
| | Retained
Earnings/
(deficit)
| | Total
Shareholders'
Equity
| |
|---|
| Balance—April 30, 2002 as reported | | 78,145 | | $ | 110,987 | | $ | — | | $ | 1,139 | | $ | — | | $ | (53,944 | ) | $ | (24,055 | ) | $ | 34,127 | |
| Adoption of new accounting pronouncements (note 2) | | — | | | — | | | — | | | — | | | — | | | (576 | ) | | — | | | (576 | ) |
| | |
| |
| |
| |
| |
| |
| |
| |
| |
| Balance—April 30, 2002 as restated | | 78,145 | | | 110,987 | | | — | | | 1,139 | | | — | | | (54,520 | ) | | (24,055 | ) | | 33,551 | |
| Issuance of common stock for cash (note 15) | | 58 | | | 129 | | | — | | | — | | | — | | | — | | | — | | | 129 | |
| Exercise of purchase warrants (note 15) | | 5,000 | | | 9,860 | | | — | | | (1,139 | ) | | — | | | — | | | — | | | 8,721 | |
| Issuance of common stock in exchange for shares of acquired company (note 15) | | 933 | | | — | | | — | | | — | | | — | | | — | | | — | | | — | |
| Stock option value resulting from acquisition (note 15) | | — | | | — | | | 163 | | | — | | | — | | | — | | | — | | | 163 | |
| Net earnings | | — | | | — | | | — | | | — | | | — | | | 31,871 | | | — | | | 31,871 | |
| Foreign exchange translation adjustment | | — | | | — | | | — | | | — | | | — | | | — | | | 1,735 | | | 1,735 | |
| | |
| |
| |
| |
| |
| |
| |
| |
| |
| Balance—April 30, 2003 | | 84,136 | | | 120,976 | | | 163 | | | — | | | — | | | (22,649 | ) | | (22,320 | ) | | 76,170 | |
| Issuance of common stock for cash (note 15) | | 1,039 | | | 2,907 | | | — | | | — | | | — | | | — | | | — | | | 2,907 | |
| Exercise of stock options granted in connection with acquisition of Extensity | | — | | | 119 | | | (119 | ) | | — | | | — | | | — | | | — | | | — | |
| Stock-based compensation (note 2) | | — | | | — | | | — | | | — | | | 2,385 | | | — | | | — | | | 2,385 | |
| Employee stock purchase plan (note 2) | | — | | | 17 | | | — | | | — | | | (17 | ) | | — | | | — | | | — | |
| Net earnings | | — | | | — | | | — | | | — | | | — | | | 57,166 | | | — | | | 57,166 | |
| Foreign exchange translation adjustment | | — | | | — | | | — | | | — | | | — | | | — | | | (2,557 | ) | | (2,557 | ) |
| | |
| |
| |
| |
| |
| |
| |
| |
| |
| Balance—April 30, 2004 | | 85,175 | | $ | 124,019 | | $ | 44 | | $ | — | | $ | 2,368 | | $ | 34,517 | | $ | (24,877 | ) | $ | 136,071 | |
| | |
| |
| |
| |
| |
| |
| |
| |
| |
The accompanying notes are an integral part of these consolidated financial statements.
48
Geac Computer Corporation Limited
Consolidated Statements of Cash Flows
For the years ended April 30, 2004 and 2003
(amounts in thousands of U.S. dollars)
| | Year ended April 30,
| |
|---|
| | 2004
| | 2003
| |
|---|
| Cash Flows from Operating activities | | | | | | | |
| Net earnings for the year | | $ | 57,166 | | $ | 31,871 | |
| Adjustments to reconcile net earnings to net cash provided by operating activities: | | | | | | | |
| | Amortization of intangible assets | | | 7,589 | | | 1,085 | |
| | Depreciation of property, plant and equipment | | | 7,243 | | | 10,436 | |
| | Amortization of deferred financing costs (note 10) | | | 607 | | | — | |
| | Goodwill impairment (note 7) | | | — | | | 11,509 | |
| | Stock-based compensation (note 2) | | | 2,385 | | | — | |
| | Future income tax expense (note 18) | | | 6,044 | | | 16,433 | |
| | Reversal of accrued liabilities and other provisions | | | (6,015 | ) | | (5,253 | ) |
| | Gain on sale of assets (note 21) | | | (243 | ) | | — | |
| | Other | | | (46 | ) | | (464 | ) |
| | Changes in operating assets and liabilities: | | | | | | | |
| | | Accounts receivable and other and unbilled receivables | | | 18,809 | | | 2,755 | |
| | | Inventory | | | 262 | | | 806 | |
| | | Prepaid expenses | | | 2,089 | | | 414 | |
| | | Accounts payable and accrued liabilities | | | (15,486 | ) | | (31,774 | ) |
| | | Income taxes payable | | | 1,347 | | | 2,320 | |
| | | Deferred revenue | | | (12,983 | ) | | (11,708 | ) |
| | | Other | | | (2,150 | ) | | 614 | |
| | |
| |
| |
Net cash provided by operating activities |
|
|
66,618 |
|
|
29,044 |
|
| | |
| |
| |
Cash Flows from Investing activities |
|
|
|
|
|
|
|
| Acquisitions less cash acquired (note 8) | | | (39,147 | ) | | (22,686 | ) |
| Proceeds from sale of assets less cash divested (note 21) | | | 339 | | | — | |
| Net additions to property, plant and equipment | | | (3,661 | ) | | (2,077 | ) |
| Change in restricted cash | | | 652 | | | 935 | |
| | |
| |
| |
Net cash used in investing activities |
|
|
(41,817 |
) |
|
(23,828 |
) |
| | |
| |
| |
Cash Flows from Financing activities |
|
|
|
|
|
|
|
| Deferred financing costs | | | (2,828 | ) | | — | |
| Issue of common shares and special warrants | | | 2,907 | | | 8,850 | |
| Repayment of long-term debt | | | (2,875 | ) | | (2,261 | ) |
| | |
| |
| |
Net cash (used in)/provided by financing activities |
|
|
(2,796 |
) |
|
6,589 |
|
| | |
| |
| |
| Effect of exchange rate changes on cash and cash equivalents | | | 726 | | | 4,376 | |
| | |
| |
| |
Cash and cash equivalents |
|
|
|
|
|
|
|
| Net increase in cash and cash equivalents | | | 22,731 | | | 16,181 | |
| Cash and cash equivalents—Beginning of year | | | 89,819 | | | 73,638 | |
| | |
| |
| |
Cash and cash equivalents—End of year |
|
$ |
112,550 |
|
$ |
89,819 |
|
| | |
| |
| |
Supplemental disclosures of cash flow information: |
|
|
|
|
|
|
|
| | Interest paid (note 11) | | $ | 563 | | $ | 457 | |
| | |
| |
| |
| | Income taxes paid, net of recoveries (note 18) | | $ | 5,091 | | $ | 5,626 | |
| | |
| |
| |
The accompanying notes are an integral part of these consolidated financial statements.
49
Geac Computer Corporation Limited
Notes to the Consolidated Financial Statements
April 30, 2004 and 2003
(in thousands of U.S. dollars, except share and per share data unless otherwise noted)
1 NATURE OF OPERATIONS
Geac Computer Corporation Limited ("Geac" or "the Company") is a global enterprise software company for business performance management, providing customers worldwide with the core financial and operational solutions and services to improve their business performance in real time. Geac's solutions include cross-industry enterprise application systems (EAS) for financial administration and human resources functions, expense management and time capture, budgeting, financial consolidation, management reporting and analysis and enterprise resource planning applications for manufacturing, distribution, and supply chain management. These cross-industry applications are marketed globally and span a number of product lines. Geac also provides industry specific applications (ISA) tailored to the real estate, restaurant, property management, local government, and construction marketplaces, and for libraries, and public safety agencies. Geac is also a reseller of computer hardware and software, and provides a broad range of professional services, including application hosting, consulting, implementation services, and training. Geac's most sinificant international operations are in the United States, the United Kingdom and France.
2 SUMMARY OF SIGNIFICANT ACCOUNTING POLICIES
Basis of presentation
These consolidated financial statements comprise the financial statements of Geac Computer Corporation Limited and its subsidiary companies, which are fully owned by Geac. All intercompany balances and transactions have been eliminated.
The consolidated financial statements have been prepared in accordance with Canadian generally accepted accounting principles. These principles are also in conformity, in all material respects, with United States generally accepted accounting principles, except as described in note 23 to the consolidated financial statements.
Reporting currency
The financial statements of the Company have historically been reported in Canadian dollars. Effective May 1, 2003 the Company adopted the U.S. dollar as its reporting currency since U.S. dollar denominated operations represent an increasingly significant portion of the Company's operations. Comparative financial information has been recast as if the U.S. dollar reporting currency had always been used, and financial statements have been reported in U.S. dollars for all periods presented.
Comparative figures
Certain of the prior year's figures have been reclassified to conform to the current year's presentation.
Changes in accounting policies
Effective May 1, 2003 the Company changed its policy with respect to the classification of reimbursements received for out-of-pocket expenses to classify these amounts as revenue. In previous years these reimbursements had been characterized as a reduction of expenses incurred. The change
50
has been applied retroactively and comparative figures were restated. In addition, effective May 1, 2003, the Company has reclassified certain "bug-fixing" expenses that had been characterized as support costs in certain product lines as product development expenses across all product lines. The consolidated statement of earnings for the year ended April 30, 2003 has been restated to conform to the current year's presentation. The net effect of the change in policy and reclassification on results for the year ended April 30, 2003 was to increase support and services revenue by $3,130, to reduce support and services costs by $4,448, and to increase product development expenses by $7,578. There was no impact on net earnings for the year ended April 30, 2003.
See also section entitled "Adoption of new accounting pronouncements."
Use of estimates
The preparation of consolidated financial statements in conformity with Canadian generally accepted accounting principles requires management to make estimates and assumptions that affect the reported amounts of assets and liabilities, including future income tax assets and liabilities, the disclosure of contingent assets and liabilities at the date of the financial statements, and the reported amounts of revenues and expenses during the reporting period. Actual results could differ from those estimates.
Foreign currency translation
Assets and liabilities of the Company's operations having a functional currency other than the U.S. dollar are translated into U.S. dollars at year-end exchange rates. Income and expense items are translated at average rates of exchange prevailing during the year. Translation adjustments are recorded in the cumulative foreign exchange translation adjustment in shareholders' equity.
Other operations and transactions denominated in a non-U.S. dollar currency are translated into U.S. dollars using the temporal method. Non-monetary assets and liabilities are translated at approximate exchange rates prevailing when the Company acquired the assets or incurred the liabilities. All other assets and liabilities are translated at year-end exchange rates. Cost of revenues, amortization of intangible assets and depreciation of property, plant and equipment are translated at historical exchange rates. All other income and expense items are translated at the average rates of exchange prevailing during the year. Gains and losses that result from translation are included in net earnings.
Revenue recognition
Revenue consists primarily of fees for software licenses of the Company's software products, maintenance fees, and professional service fees.
When a license agreement includes one or more elements to be delivered at a future date and vendor specific objective evidence ("VSOE") of the fair value of all undelivered elements exists, the Company uses the residual method to recognize revenue. Under the residual method, the fair value of the undelivered elements is deferred and the remaining portion of the arrangement fee is recognized as revenue. If evidence of the fair value of one or more undelivered elements does not exist, all revenue is
51
deferred and recognized when delivery of those elements occurs or when fair value can be established. VSOE for all elements of an arrangement is based upon the normal pricing and discounting practices for those elements when sold separately, and for maintenance services, is additionally measured by the renewal rate.
Software license revenue is comprised of license fees charged for the use of the Company's products licensed under single or multiple year arrangements in which the fair value of the license fee is separately determinable from maintenance and/or professional services. For license arrangements that do not require significant modifications or customization of the software, the Company recognizes software license revenue when persuasive evidence of an arrangement exists, the product has been delivered, the fee is fixed or determinable, and collection of the resulting receivable is probable. Software is considered to have been delivered when the Company has provided the customer with the access codes that allow for immediate possession of the software or when, based on the shipping terms, delivery of the software products to the customer has occurred. Contract terms do not provide customers, including resellers, with product rotation rights or rights of return. The Company's assessment of a customer's creditworthiness is a factor in the determination of whether or not collection is probable. The determination of creditworthiness requires the exercise of judgment, which affects the Company's revenue recognition. If a customer is deemed not to be creditworthy, all revenue under arrangements with that customer is recognized upon receipt of cash.
Maintenance revenue is comprised of fees charged for post-contract customer support. Maintenance fee arrangements include ongoing customer support and rights to product updates "if and when available." Customer payments for maintenance are generally received in advance and are non-refundable. Maintenance revenue is deferred and recognized on a straight-line basis as support and services revenue over the life of the related agreement, which is typically one year.
Revenues for professional services, including implementation services, are generally recognized as the services are performed. When license arrangements include professional services, the license fees are recognized upon delivery, provided that (1) the criteria described above for delivery have been met, (2) payment of the license fees is not dependent upon the performance of the services, (3) the services are not essential to the functionality of the software, and (4) VSOE exists on the undelivered services. When professional services are not considered essential, which has been the case in the majority of the Company's license arrangements, the Company recognizes time and materials service contracts as the services are performed. Fixed price professional services contracts are recognized on a proportional performance basis as determined by the relationship of contract costs incurred to date and the estimated total contract costs, which are regularly reviewed during the life of the contract, subject to the achievement of the agreed upon milestones. In the event that a milestone has not been achieved, the associated cost is deferred and revenue is not recognized until the milestone has been accepted by the customer.
For arrangements that do not meet the criteria described above, both the license revenues and professional services revenues are recognized using the percentage-of-completion method where reasonably dependable estimates of progress toward completion of a contract can be made. The Company estimates the percentage-of-completion on contracts utilizing costs incurred to date as a
52
percentage of the total costs at project completion, subject to meeting agreed milestones. In the event that a milestone has not been reached, the associated cost is deferred and revenue is not recognized until the milestone has been accepted by the customer. Recognized revenues and profit are subject to revisions as the contract progresses to completion. Revisions in profit estimates are charged to earnings in the period in which the facts that give rise to the revision become known. To date, the Company has had no contracts accounted for using the percentage of completion method.
The timing of revenue recognition may differ from contract payment schedules, resulting in revenues that have been earned but not yet billed. These amounts are included in unbilled receivables. Customer advances in excess of revenue earned and recognized are recorded as deferred revenue. Deferred revenue is comprised of deferrals for maintenance and professional services. Long-term deferred revenue, as at April 30, 2004 and 2003, represents amounts received for maintenance and support services to be provided beginning in periods on or after May 1, 2005 and 2004, respectively. The principal components of deferred revenue as at April 30, 2004 and 2003 were as follows:
| | 2004
| | 2003
|
|---|
| Maintenance | | $ | 111,593 | | $ | 112,444 |
| Professional services | | | 8,590 | | | 10,183 |
| | |
| |
|
| | Total deferred revenue | | | 120,183 | | | 122,627 |
| Less: Current portion | | | 117,927 | | | 119,937 |
| | |
| |
|
| Deferred revenue—long-term | | $ | 2,256 | | $ | 2,690 |
| | |
| |
|
Research and development costs
Research costs are charged to operations as incurred. Product development costs are deferred if the product or process and its market or usefulness are clearly defined, the product or process has reached technological feasibility, adequate resources exist or are expected to exist to complete the project and management intends to market or use the product or process. Technological feasibility is attained when the software has completed system testing and has been determined viable for its intended use. The time between the attainment of technological feasibility and completion of software development has historically been relatively short with immaterial amounts of development costs incurred during this period. Accordingly, the Company has not capitalized material amounts of development costs, other than product development costs acquired through business combinations.
Cash and cash equivalents
Cash and cash equivalents are composed of non-restricted cash and short-term, highly liquid investments with an original maturity of 90 days or less. Cash equivalents are stated at amounts that approximate fair value, based on quoted market prices.
53
Restricted cash
Cash is considered to be restricted when it is subject to contingent rights of a third party customer, vendor, or government agency. As at April 30, 2004, $367 of the Company's restricted cash balance was related to bid proposal deposits, customer holdbacks, lease and other deposits. Additionally, $1,509 was related to cash collateralization of bank guarantees issued for leased office space, vendor, customer and government agency obligations. As at April 30, 2003, $2,355 in restricted cash was related to cash collateralization of letters of credit and bank guarantees issued for leased office space, customer and government agency obligations, and the remaining $40 was for other restricted deposits.
Allowances for doubtful accounts
The Company maintains an allowance for doubtful accounts at an amount estimated to be sufficient to provide adequate protection against losses resulting from collecting less than full payment on its receivables. Individual overdue accounts are reviewed, and allowance adjustments are recorded when determined necessary to state accounts receivable at net realizable value. Additionally, the Company judges the overall adequacy of the allowance for doubtful accounts by considering multiple factors including the aging of receivables, historical bad debt experience, and the general economic environment. A considerable amount of judgment is required when the Company assesses the realization of receivables, including assessing the probability of collection and the current creditworthiness of each customer. If the financial condition of the Company's customers were to deteriorate, resulting in an impairment of their ability to make payments, an additional provision for doubtful accounts may be required. Once all collection efforts are exhausted, the receivable is written-off against the balance in the allowance for doubtful accounts.
Inventory
Work-in-progress and finished goods inventory are stated at the lower of cost on a first-in, first-out basis and net realizable value.
Property, plant and equipment
Property, plant and equipment are recorded at cost less accumulated depreciation and are depreciated over the estimated useful lives of the related assets as follows:
| • | | Buildings | | 40 years straight-line |
| • | | Computers, processing and office equipment and machinery | | 3 to 5 years straight-line |
| • | | Automobiles | | 4 years straight-line |
| • | | Leasehold improvements | | straight-line over the lease term |
| • | | Assets under capital leases | | straight-line over the useful lives of the assets, as indicated above |
The Company reviews, on an ongoing basis, the carrying values of its property, plant and equipment. If it is determined that the carrying value of property, plant and equipment is not
54
recoverable, a write-down to fair value is charged to earnings in the period that such a determination is made.
Asset retirement obligations
The Company has obligations with respect to the retirement of leasehold improvements at maturity of facility leases and the restoration of facilities back to their original state at the end of the lease term. Accruals are made based on management's estimates of current market restoration costs, inflation rates and discount rates. At the inception of a lease, the present value of the expected cash payment is recognized as an asset retirement obligation with a corresponding amount recognized in property assets. The property asset amount is amortized, and the liability is accreted, over the period from lease inception to the time the Company expects to vacate the premises resulting in both depreciation and interest charges in the consolidated statement of earnings.
Discount rates used are based on credit-adjusted risk-free interest rates on government bonds ranging from 2.0% to 7.5% depending on the lease term. Based on the Company's current lease commitments, obligations are required to be settled commencing in fiscal 2005 and ending in fiscal 2016. Revisions to these obligations may be required if restoration costs or discount rates change.
Goodwill and intangible assets
Goodwill represents the excess of the cost of an acquired enterprise over the net identifiable amounts assigned to assets acquired and liabilities assumed. In accordance with Canadian Institute of Chartered Accountants ("CICA") Handbook Section 3062, "Goodwill and Other Intangible Assets," goodwill and indefinite lived intangible assets are reviewed for impairment annually. Goodwill is required to be tested for impairment between the annual tests if an event occurs or circumstances change such that it is more likely than not that the fair value of a reporting unit has been reduced below its carrying value.
The Company completed its annual impairment test as of February 29, 2004, and concluded that there was no impairment of goodwill. All remaining and future acquired goodwill will be subject to impairment tests annually, or earlier if indicators of potential impairment exist, using the present value of estimated future cash flows. If it is determined that the carrying amount of goodwill exceeds the fair value of goodwill as a result of the impairment testing, a goodwill impairment loss will be recognized on the statement of earnings.
The Company reviews the carrying value of amortizable intangible assets for impairment whenever events and circumstances indicate that the carrying value of an asset may not be recoverable from the estimated future cash flows expected to result from its use and eventual disposition. In cases where undiscounted expected future cash flows are less than the carrying value, an impairment loss is recognized equal to the amount by which the carrying value of the asset exceeds the fair value of the asset.
Intangible assets, which consist of acquired software, customer relationships and agreements, in-process research and development, and trademarks, are recorded at cost less accumulated
55
amortization. Intangible assets are amortized on a straight-line basis over the estimate useful lives of the related assets as follows:
| • | | Acquired software | | 1 to 5 years |
| • | | Customer relationships and agreements | | 3 to 5 years |
| • | | Trademarks and names | | 4 years |
| • | | In-process research and development | | 3 to 5 years |
Employee future benefit plans
The cost of providing benefits through defined benefit pensions is actuarially determined and recognized in earnings using the projected benefit method prorated on service and management's best estimate of expected plan investment performance and retirement ages of employees. Differences arising from plan amendments, changes in assumptions and experience gains and losses are recognized in earnings over the expected average remaining service life of employees. Plan assets are valued at fair value. The cost of providing benefits through defined contribution pension plans is charged to earnings in the period in respect of which contributions become payable.
Income taxes
Income taxes are accounted for under the liability method, whereby future income tax assets and liabilities are recognized for temporary differences between the tax and accounting bases of assets and liabilities, as well as for the benefit of losses available to be carried forward to future years for income tax purposes. A valuation allowance is provided for the portion of future tax assets that is more likely than not to remain unrealized. Significant judgement is involved in determining the realizability of temporary differences and tax loss carry forwards. Future income tax assets and liabilities are measured using substantively enacted income tax rates applicable to taxable income in the years in which those temporary differences are expected to be recovered or settled. Future income tax assets and liabilities are adjusted for the effects of changes in income tax laws and rates in the period in which the change occurs.
Investment tax credits arising from research and development are deducted from the related costs and, accordingly, are included in the determination of earnings in the same year as the related costs.
Advertising costs
Advertising costs are expensed as incurred. Advertising expenses incurred for the years ended April 30, 2004 and 2003 were $3,408 and $2,363, respectively.
Shipping and handling costs
Shipping and handling costs are included in the cost of revenues.
56
Legal contingencies
The Company is from time to time involved in various claims and legal proceedings. Periodically, it reviews the status of each significant matter and assesses its potential financial exposure. If the potential loss from any claim or legal proceeding is considered probable and the amount can be reasonably estimated, a liability is accrued for the estimated loss. Significant judgment is involved in both the determination of probability and the determination as to whether an exposure is reasonably estimable. Because of uncertainties related to these matters, accruals are based on the best information available at the time. As additional information becomes available, the Company reassesses the potential liability relating to the pending claims and litigation and it may revise its estimates. Such revisions in estimates or potential liabilities could have a material impact on the results of the Company's earnings and financial position.
Adoption of new accounting pronouncements
- a)
- Stock-based compensation
The Company adopted the revised recommendations of CICA Handbook Section 3870, "Stock-Based Compensation and other Stock-Based Payments" ("Section 3870"), which requires that a fair value method of accounting be applied to all stock-based compensation payments to both employees and non-employees. In accordance with the transitional provisions of Section 3870, the Company has prospectively applied the fair value method of accounting for stock option awards granted and shares issued under its Employee Stock Purchase Plan ("ESPP") after May 1, 2003 and, accordingly, has recorded compensation expense in 2004. Prior to May 1, 2003, the Company accounted for its employee stock options and shares issued under ESPP using the settlement method and no compensation expense was recognized. For awards granted during the year ended April 30, 2003, the standard requires the disclosure of pro forma net earnings and earnings per share information as if the Company had accounted for employee stock options under the fair value method. The pro forma effect of awards granted and shares issued prior to May 1, 2002 has not been included in the pro forma net earnings and earnings per share information.
The estimated fair value of the options is amortized to earnings over the vesting period, on a straight-line basis and was determined using the Black-Scholes option pricing model with the following weighted average assumptions:
Assumptions—Stock Options
| | 2004
| | 2003
| |
|---|
| Weighted average risk-free interest rate | | | 4.20 | % | | 4.54 | % |
| Weighted average expected life (in years) | | | 7.0 | | | 6.61 | |
| Weighted average volatility in the market price of common shares | | | 71.71 | % | | 75.81 | % |
| Weighted average dividend yield | | | 0.00 | % | | 0.00 | % |
| Weighted average grant date fair values of options issued | | $ | 3.16 | | $ | 2.09 | |
| | 2004
| | 2003
|
|---|
| | Exercise Price
| | Fair Value
| | Exercise Price
| | Fair Value
|
|---|
| Weighted average fair value of in-the-money options (per option*) | | | nil | | | nil | | $ | 1.77 | | $ | 1.45 |
| Weighted average fair value of at-the-money options (per option*) | | $ | 4.64 | | $ | 3.28 | | $ | 3.13 | | $ | 2.27 |
| Weighted average fair value of out-of-the-money options (per option*) | | $ | 3.57 | | $ | 2.52 | | $ | 2.82 | | $ | 1.97 |
- *
- In-the-money options are defined as the options with an exercise price less than the market price of the stock on the grant date of the options. At-the-money options are defined as the options with
57
an exercise price the same as the market price of the stock on the grant date of the options. Out-of-the money options are defined as the options with an exercise price more than the market price of the stock on the grant date of the options.
Assumptions—ESPP
| | 2004
| | 2003
| |
|---|
| Weighted average risk-free interest rate | | | 2.94 | % | | 2.68 | % |
| Weighted average expected life (in years) | | | 0.25 | | | 0.25 | |
| Weighted average volatility in the market price of common shares | | | 32.91 | % | | 65.50 | % |
| Weighted average dividend yield | | | 0.00 | % | | 0.00 | % |
| Weighted average grant date fair values of awards or shares issued | | $ | 1.00 | | $ | 0.80 | |
For the year ended April 30, 2004, the Company expensed $2,368 relating to the fair value of options granted and $17 relating to the fair value of shares issued under the ESPP in 2004. Contributed surplus was credited $2,385 for these awards and the balance will be reduced as the awards are exercised and the amount initially recorded for the awards in contributed surplus will be credited to share capital along with the proceeds received on exercise. Contributed surplus was reduced by $17 relating to shares issued under the ESPP during fiscal year 2004.
The pro forma disclosure relating to options granted in fiscal 2003 is as follows:
| | Year ended April 30,
|
|---|
| | 2004
| | 2003
|
|---|
| Net earnings—as reported | | $ | 57,166 | | $ | 31,871 |
| | Pro forma stock-based compensation expense, net of tax | | | 967 | | | 377 |
| | |
| |
|
| Net earnings—pro forma | | $ | 56,199 | | $ | 31,494 |
| | |
| |
|
Basic net earnings per share—as reported |
|
$ |
0.68 |
|
$ |
0.40 |
| | Pro forma stock-based compensation expense per share | | | 0.01 | | | — |
| | |
| |
|
| Basic net earnings per share—pro forma | | $ | 0.67 | | $ | 0.40 |
| | |
| |
|
Diluted net earnings per share—as reported |
|
$ |
0.66 |
|
$ |
0.39 |
| | Pro forma stock-based compensation expense per share | | | 0.01 | | | — |
| | |
| |
|
| Diluted net earnings per share—pro forma | | $ | 0.65 | | $ | 0.39 |
| | |
| |
|
See note 15 for a description of the employee stock purchase and stock option plans.
- b)
- Asset retirement obligations
In March 2003, the CICA issued Handbook Section 3110, "Asset Retirement Obligations" ("Section 3110"), which establishes standards for the recognition, measurement and disclosure of liabilities for asset retirement obligations and the associated retirement costs. This section applies to legal obligations associated with the retirement of tangible long-lived assets that results from their acquisition, lease construction, development or normal operation. The Company has obligations with respect to the retirement of leasehold improvements at maturity of facility leases and the restoration of facilities back to their original state at the end of the lease term. This new section is effective for years beginning after January 1, 2004 and harmonizes Canadian requirements with existing U.S. GAAP. The Company early adopted the provisions of Section 3110 for its year ended April 30, 2004. Section 3110 requires that the effect of initially applying the Section be treated as a change in accounting policy. Accordingly, the financial statements of prior periods presented for comparative purposes have been restated retroactively. The adoption of Section 3110 resulted in a liability and a corresponding asset of $1,517 as at April 30, 2003. In addition, the Company had an adjustment to opening retained earnings in fiscal 2003 of $576, and recorded a charge in the statement of earnings of $174 and $160 for the
58
years ended April 30, 2004 and 2003 respectively. As at April 30, 2004 the total undiscounted amount estimated to settle the asset retirement obligation was $2,386. No amounts were paid during the years ended April 30, 2004 and 2003.
Recently issued accounting pronouncements
In December 2003, the Emerging Issues Committee released EIC-141, "Revenue Recognition" ("EIC-141") and EIC-142, "Revenue Arrangements with Multiple Deliverables" ("EIC-142"). EIC-141 summarizes the principles set forth in SAB 101 that, in the Committee's view, are generally appropriate as interpretive guidance on the application of CICA Handbook Section 3400 "Revenue." EIC-141 is effective on a prospective basis for the Company's 2005 fiscal year. EIC-142 addresses certain aspects of the accounting by a vendor for arrangements under which it will perform multiple revenue-generating activities. Specifically, EIC-142 addresses how to determine whether an arrangement involving multiple deliverables contains more than one unit of accounting, and how arrangement consideration should be measured and allocated to the separate units of accounting in the arrangement. EIC-142 is applicable for revenue arrangements with multiple deliverables entered into by the Company on or after May 1, 2004. The adoption of EIC-141 and EIC-142 is not expected to have a material impact on the Company's results of operations or financial position.
In 2003, the CICA issued Accounting Guideline AcG-15, "Consolidation of Variable Interest Entities" ("AcG-15"), to provide guidance for determining when an enterprise includes the assets, liabilities and results of activities of an entity (a "variable interest entity") in its consolidated financial statements, and aids in applying the principles in Handbook Section 1590 "Subsidiaries" to certain entities. AcG-15 applies to annual and interim periods beginning on or after November 1, 2004. The adoption of AcG-15 is not expected to have a material impact on the Company's results of operations or financial position.
3 ACCOUNTS RECEIVABLE AND OTHER RECEIVABLES
Accounts receivable and other receivables as at April 30, 2004 and 2003 consist of the following:
| | 2004
| | 2003
| |
|---|
| Trade accounts receivable | | $ | 60,555 | | $ | 60,282 | |
| Allowance for doubtful accounts | | | (11,509 | ) | | (6,214 | ) |
| Other receivables (note 19) | | | 254 | | | 271 | |
| | |
| |
| |
| | | $ | 49,300 | | $ | 54,339 | |
| | |
| |
| |
4 INVENTORY
Inventory as at April 30, 2004 and 2003 consists of the following:
| | 2004
| | 2003
|
|---|
| Finished goods | | $ | 624 | | $ | 774 |
| Work-in-progress | | | — | | | 13 |
| | |
| |
|
| | | $ | 624 | | $ | 787 |
| | |
| |
|
59
5 PROPERTY, PLANT AND EQUIPMENT
Property, plant and equipment as at April 30, 2004 and 2003 consists of the following:
| | 2004
|
|---|
| | Cost
| | Accumulated
Depreciation
| | Net
|
|---|
| Land | | $ | 2,175 | | $ | — | | $ | 2,175 |
| Buildings | | | 10,195 | | | 2,813 | | | 7,382 |
| Computers, processing and office equipment and machinery | | | 79,958 | | | 73,832 | | | 6,126 |
| Automobiles | | | 702 | | | 607 | | | 95 |
| Leasehold improvements | | | 14,889 | | | 11,539 | | | 3,350 |
| Asset retirement obligations | | | 1,648 | | | 907 | | | 741 |
| Assets under capital leases (i) | | | 5,424 | | | 1,450 | | | 3,974 |
| | |
| |
| |
|
| | | $ | 114,991 | | $ | 91,148 | | $ | 23,843 |
| | |
| |
| |
|
| | 2003
|
|---|
| | Cost
| | Accumulated
Depreciation
| | Net
|
|---|
| Land | | $ | 2,045 | | $ | — | | $ | 2,045 |
| Buildings | | | 9,822 | | | 2,467 | | | 7,355 |
| Computers, processing and office equipment and machinery | | | 78,086 | | | 69,293 | | | 8,793 |
| Automobiles | | | 817 | | | 628 | | | 189 |
| Leasehold improvements | | | 12,445 | | | 9,436 | | | 3,009 |
| Asset retirement obligations | | | 1,517 | | | 735 | | | 782 |
| Assets under capital leases (i) | | | 6,210 | | | 1,952 | | | 4,258 |
| | |
| |
| |
|
| | | $ | 110,942 | | $ | 84,511 | | $ | 26,431 |
| | |
| |
| |
|
- i)
- Assets under capital leases consist mainly of buildings.
60
6 INTANGIBLE ASSETS
Intangible assets as at April 30, 2004 and 2003 consist of the following:
| | 2004
|
|---|
| | Cost
| | Accumulated
Amortization
| | Net
|
|---|
| Acquired software(i) | | $ | 28,469 | | $ | 5,574 | | $ | 22,895 |
| Customer relationships and agreements(i) | | | 10,332 | | | 2,444 | | | 7,888 |
| In-process research and development(i) | | | 1,483 | | | 173 | | | 1,310 |
| Trademarks and name(i) | | | 773 | | | 238 | | | 535 |
| | |
| |
| |
|
| | | $ | 41,057 | | $ | 8,429 | | $ | 32,628 |
| | |
| |
| |
|
|
|
2003
|
|---|
| | Cost
| | Accumulated
Amortization
| | Net
|
|---|
| Acquired software | | $ | 8,183 | | $ | 414 | | $ | 7,769 |
| Customer relationships and agreements | | | 3,051 | | | 376 | | | 2,675 |
| Trademarks and name | | | 768 | | | 40 | | | 728 |
| | |
| |
| |
|
| | | $ | 12,002 | | $ | 830 | | $ | 11,172 |
| | |
| |
| |
|
- i)
- Additions of intangible assets in fiscal 2004 resulted primarily from the acquisition of Comshare, Incorporated. (See note 8).
7 GOODWILL
Goodwill as at April 30, 2004 and 2003 was as follows:
| | 2004
| | 2003
|
|---|
| Goodwill | | $ | 128,366 | | $ | 89,386 |
| | |
| |
|
For the year ended April 30, 2004 the Company completed its review for potential impairment and concluded that there was no impairment of goodwill. In connection with the Company's annual review of the carrying value of goodwill for the year ended April 30, 2003, a goodwill write-down of $11,509 was recorded in the fourth quarter of fiscal 2003 relating to the Interealty business. The impairment was based on revised future estimates of its likely performance and resulted in the write-off of the full amount of goodwill related to the Company's Interealty business.
All remaining and future acquired goodwill will be subject to impairment tests annually, or earlier if indicators of potential impairment exist, using a future cash flow based approach.
61
The changes in the carrying amount of goodwill are as follows:
| Balance as at April 30, 2002 | | $ | 80,920 | |
| Goodwill from EBC acquisition (note 8) | | | 1,555 | |
| Goodwill from Extensity acquisition (note 8) | | | 16,558 | |
| Goodwill impairment | | | (11,509 | ) |
| Goodwill adjustment related to pre-acquisition liabilities (note 17) | | | (701 | ) |
| Foreign exchange impact | | | 2,563 | |
| | |
| |
| Balance as at April 30, 2003 | | | 89,386 | |
| Goodwill from Comshare acquisition (note 8) | | | 37,931 | |
| Goodwill adjustment related to acquisition reserves | | | (149 | ) |
| Goodwill adjustment related to future tax assets (note 8) | | | (962 | ) |
| Foreign exchange impact | | | 2,160 | |
| | |
| |
| Balance as at April 30, 2004 | | $ | 128,366 | |
| | |
| |
8 BUSINESS COMBINATIONS
On August 6, 2003 the Company acquired Comshare, Incorporated (Comshare), a provider of corporate performance management software, based in Michigan, by way of a cash tender offer for all outstanding shares of Comshare at a price of $4.60 per share. The acquisition was accounted for by the purchase method with the results of operations of the business included in the consolidated financial statements from the date of acquisition.
The total purchase price was approximately $55,772, consisting of $53,807 of cash and $1,965 of acquisition costs. The purchase price was allocated to the fair value of assets acquired and liabilities assumed as follows:
| Cash | | $ | 16,625 | |
| Other current assets | | | 10,411 | |
| Office and computer equipment | | | 909 | |
| Future income tax assets | | | 6,323 | |
| Acquired intangible assets (including $20,253 of acquired software, $1,483 of in-process research and development, and $6,755 of customer agreements) | | | 28,491 | |
| Goodwill | | | 37,931 | |
| Current liabilities | | | (11,512 | ) |
| Future income tax liabilities | | | (4,481 | ) |
| Other liabilities (primarily pension obligation) | | | (28,925 | ) |
| | |
| |
| Total purchase price | | $ | 55,772 | |
| | |
| |
In fiscal 2003, the Company acquired the shares of Extensity, Inc. and certain assets of EBC Informatique. The acquisitions were accounted for by the purchase method with the results of operations of each business included in the consolidated financial statements from the respective dates of acquisition. The total net cash purchase price of the businesses acquired by the Company was $22,686, related to the businesses as described below.
Effective August 5, 2002, the Company acquired certain assets of EBC Informatique, a French hardware and software solutions provider. These assets included customer contracts, intellectual
62
property rights, trademarks, and property, plant and equipment. The cash purchase price was $2,362. The purchase price was allocated to the fair value of assets acquired and liabilities assumed as follows:
| Property, plant and equipment | | $ | 31 | |
| Acquired intangible assets (including $1,854 of customer agreements, $415 of acquired software, and $59 of trademarks) | | | 2,328 | |
| Goodwill | | | 1,555 | |
| Current liabilities | | | (201 | ) |
| Future income tax liabilities | | | (551 | ) |
| Other liabilities | | | (800 | ) |
| | |
| |
| Total purchase price | | $ | 2,362 | |
| | |
| |
On March 6, 2003, the Company acquired 100% of the common shares of Extensity, Inc., a provider of solutions to automate employee-based financial systems, headquartered in California. The purchase price was $50,327, consisting of $43,423 of cash, 932,736 of common shares with a value of $2,619 less issuance costs of $2,619, $163 of fair value of the assumed outstanding stock options of Extensity, Inc., and $4,122 of transaction costs.
The purchase price was allocated to the fair value of assets acquired and liabilities assumed as follows:
| Cash | | $ | 29,840 | |
| Other current assets | | | 3,978 | |
| Property, plant and equipment | | | 1,281 | |
| Future income tax assets* | | | 5,161 | |
| Acquired intangible assets (including $7,700 of acquired software, $900 of customer agreements, and $700 of trademarks) | | | 9,300 | |
| Goodwill* | | | 16,558 | |
| Current liabilities | | | (12,712 | ) |
| Other liabilities | | | (3,079 | ) |
| | |
| |
| Total purchase price | | $ | 50,327 | |
| | |
| |
- *
- Due to new guidance issued by the relevant tax authority, management has assessed that the valuation allowance related to the Extensity, Inc. acquisition completed in fiscal 2003 should be reduced by $962, as the more likely than not criteria is now met. The goodwill for Extensity Inc. was also adjusted accordingly in fiscal 2004 for this same amount as well as for $149 related to premises. (See note 7).
63
9 ACCOUNTS PAYABLE AND ACCRUED LIABILITIES
Accounts payable and accrued liabilities as at April 30, 2004 and 2003 consist of the following:
| | 2004
| | 2003
|
|---|
| Accounts payable | | $ | 9,504 | | $ | 11,125 |
| Payroll and benefits | | | 30,839 | | | 27,103 |
| Accrued restructuring charges | | | 7,552 | | | 10,849 |
| Accrued professional fees and legal costs | | | 8,875 | | | 10,079 |
| Commodity and property taxes | | | 7,319 | | | 5,853 |
| Hardware and third party software | | | 3,241 | | | 3,779 |
| Insurance | | | 1,027 | | | 1,609 |
| Other accrued liabilities | | | 11,307 | | | 11,087 |
| | |
| |
|
| | | $ | 79,664 | | $ | 81,484 |
| | |
| |
|
10 CREDIT FACILITY
On September 9, 2003 the Company and certain of its subsidiaries entered into a Loan, Guaranty and Security Agreement (the "Loan Agreement") with Wells Fargo Foothill, Inc., pursuant to which the Company and certain of its subsidiaries obtained a three-year revolving credit facility (the "Facility") with a $50,000 revolving line of credit, including a $5,000 letter of credit sub-facility. The interest rate payable on advances under the Facility is, at the Company's option, the prime rate plus 0.50% or LIBOR plus 3.00%. The facility is collateralized by substantially all of the assets of the Company and certain of its United States and Canadian subsidiaries and guaranteed by certain of its United States, Canadian, United Kingdom and Hungarian subsidiaries. The Facility is available for the working capital needs and other general corporate purposes of the Company and its subsidiaries that are parties to the Loan Agreement. As of April 30, 2004, $1,815 of the letter of credit sub-facility has been utilized, and the remaining $48,185 revolving line of credit is available and has not been drawn on.
The financing costs of $2,828 incurred to close the transaction were recorded as other assets in the second quarter of fiscal 2004 and are being amortized to interest expense on a straight-line basis over the term of the Facility. Amortization expense related to these financing costs was $607 in fiscal 2004.
64
11 LONG-TERM DEBT
Long-term debt as at April 30, 2004 and 2003 consists of the following:
| | 2004
| | 2003
|
|---|
| Collateralized loans | | | | | | |
| | Euro loans bearing interest ranging from 4.10% to 6.50% for fiscal 2003, collateralized by certain assets of the borrowing subsidiary | | $ | — | | $ | 11 |
| | Sterling loans, bearing interest at 2.00% above bank base rate for fiscal 2003, collateralized by real properties | | | — | | | 2,505 |
| Uncollateralized loans | | | | | | |
| | Euro loans bearing interest at 4.6% per annum (2003—ranging from 4.10% to 4.60%), repayable in fiscal 2005 | | | 27 | | | 361 |
| Capital lease obligations | | | | | | |
| | Bearing interest at 8.00% per annum (2003—ranging between 4.75% and 8.00%), uncollaterized | | | 4,914 | | | 3,422 |
| Mandatorily redeemable preference shares | | | | | | |
| | U.S. dollar preference shares issued by subsidiary, bearing a fixed dividend of 12% per annum | | | — | | | 50 |
| | |
| |
|
| Total long-term debt | | | 4,941 | | | 6,349 |
| Less: Current portion | | | 391 | | | 733 |
| | |
| |
|
| Long-term debt | | $ | 4,550 | | $ | 5,616 |
| | |
| |
|
The interest expense on long-term debt and interest paid are as follows:
| | Year ended April 30,
|
|---|
| | 2004
| | 2003
|
|---|
| Interest expense on long-term debt | | $ | 206 | | $ | 270 |
| Interest expense on capital lease obligations | | $ | 334 | | $ | 259 |
| Cash interest paid on long-term and short-term obligations | | $ | 563 | | $ | 457 |
The capital repayments required on the Company's total long-term obligations at April 30, 2004 are as follows:
| | Year ending April 30,
|
|---|
| 2005 | | $ | 391 |
| 2006 | | | 393 |
| 2007 | | | 425 |
| 2008 | | | 459 |
| 2009 | | | 496 |
| 2010 and subsequent | | | 2,777 |
| | |
|
| | | $ | 4,941 |
| | |
|
12 FINANCIAL INSTRUMENTS
Financial instruments included in the consolidated balance sheets consist of cash and cash equivalents, restricted cash, accounts receivable and other receivables, unbilled receivables, accounts payable and accrued liabilities, asset retirement obligations, pension liabilities and long-term debt.
65
a. Fair values of financial assets and liabilities
The fair values of cash equivalents, accounts receivable and other receivables, unbilled receivables, and accounts payable and accrued liabilities approximate their carrying values because of the short-term maturity of those instruments. At April 30, 2004, there is no significant difference between the carrying value and the fair value of asset retirement obligations, pension liabilities, and long-term debt. The Company is not a party to any significant derivative instruments.
b. Credit risk
The Company is subject to credit risk for billed and unbilled receivables and cash and cash equivalents. The Company places its temporary excess cash in high-quality, short-term financial instruments issued or guaranteed by major financial institutions in the countries in which it operates or in similar low-risk instruments. To date, the Company has not experienced significant losses on these investments.
Trade receivables are with customers in many diverse industries and are subject to normal industry credit risks. The Company sells a significant portion of its software to customers in North America, Europe and Asia-Pacific. Accordingly, adverse economic trends affecting these geographic locations may increase the Company's credit risk in its trade accounts receivable. The Company has adopted credit policies and standards intended to accommodate industry growth and inherent risk. In addition, ongoing credit evaluations of our customers' financial condition are performed. The Company does not obtain collateral for its trade receivables.
c. Interest rate risk
The Company is subject to interest rate risk on its floating rate long-term debt and on its senior secured credit facility. The senior secured credit facility will bear interest at a variable rate based on margin over the prime rate or LIBOR, as the case may be. The annual increase or decrease in interest expense for each one percentage change in interest rates on the floating rate debt and the senior secured credit facility at April 30, 2004 are $nil (2003—$25) and $18 (2003—$nil) respectively.
d. Foreign exchange risk
The Company is subject to foreign exchange risk because some of its business is transacted in currencies other than U.S. dollars.
Accordingly, some of its financial instruments are denominated in foreign currencies. The amount of the net risk fluctuates in the normal course of business, as transactions in various jurisdictions are concluded.
13 EMPLOYEE FUTURE BENEFITS
Prior to the acquisition of Comshare, a subsidiary of Comshare in the United Kingdom maintained a defined contribution plan for substantially all Comshare employees in the United Kingdom. In connection with the acquisition of Comshare, the Company assumed the defined contribution plan. Since inception of the plan through June 30, 2002, the plan provided a minimum annual company contribution of 2.5% of the employee's compensation and matching contribution up to an additional 2.5% of compensation, based on employee contributions. Effective July 1, 2002 the Company contribution formula was amended to eliminate the minimum company contribution and cap the maximum company contribution at 3% of compensation. There have been no contributions to the plan since the date of acquisition.
66
The United Kingdom Comshare subsidiary also has a defined benefit plan, which covered substantially all of its employees hired prior to January 1, 1994, based on years of service and final average salary. This plan was frozen on April 1, 1997, with no further benefits accruing under the plan.
The Company used a measurement date of April 30 for the majority of its plans.
Defined contribution pension plans
The Company sponsors a number of defined contribution plans in Europe, of which the most significant are in France and Italy. Benefits under defined contribution pension plans are generally based on pay and years of service.
The combined status of the Company's defined contribution pension plans was as follows as at April 30, 2004 and 2003:
| | 2004
| | 2003
|
|---|
| Defined contribution retirement obligation | | $ | 1,682 | | $ | 1,059 |
| | |
| |
|
Defined contribution expense was approximately $764 and $111 for the years ended April 30, 2004 and April 30, 2003, respectively.
Defined benefit pension plan
The Company's intention is to fund its defined benefit pension plan in amounts at least sufficient to meet the minimum requirements of the applicable local laws and regulations. The assets of the plan are invested in equity and bond funds consistent with the requirements of local law. Depending on the design of the plan, and local custom and market circumstances, the minimum liabilities of a plan may exceed qualified plan assets.
As of April 30, 2004, the plan was funded to the minimum legal funding requirement.
The weighted-average of significant assumptions adopted in measuring the Company's obligations and costs are as follows:
| | April 30, 2004
| |
|---|
| Projected benefit obligation | | | |
| | Discount rate | | 5.75 | % |
| | Rate of compensation increase | | n/a | |
Net periodic benefit cost |
|
|
|
| | Discount rate | | 5.75 | % |
| | Expected rate of return on plan assets | | 6.75 | % |
| | Rate of compensation increase | | n/a | |
67
Information about the Company's defined benefit pension plan is as follows for the year ended April 30, 2004:
| | April 30, 2004
| |
|---|
| Change in benefit obligation | | | | |
| Accrued benefit obligation, beginning of year | | $ | — | |
| | Benefit obligation assumed upon the acquisition of Comshare | | | 38,339 | |
| | Interest cost on accrued benefit obligations | | | 1,846 | |
| | Actuarial gains | | | (2,646 | ) |
| | Benefits payments | | | (522 | ) |
| | Currency translation adjustment | | | 3,817 | |
| | |
| |
| Accrued benefit obligation, end of year | | $ | 40,834 | |
| | |
| |
Change in plan assets |
|
|
|
|
| Fair value of plan assets, beginning of year | | $ | — | |
| | Pension assets acquired upon the acquisition of Comshare | | | 18,817 | |
| | Actual return on plan assets | | | 1,608 | |
| | Employer contribution | | | — | |
| | Benefits payments | | | (522 | ) |
| | Currency translation adjustment | | | 1,936 | |
| | |
| |
| Fair value of plan assets, end of year | | $ | 21,839 | |
| | |
| |
Unfunded amount |
|
$ |
18,995 |
|
| Unamortized actuarial gain | | | 3,317 | |
| | |
| |
| Net amount recognized in the consolidated balance sheets | | $ | 22,312 | |
| | |
| |
|
|
Year ended April 30, 2004
|
|
|---|
| Components of net periodic benefit cost | | | | |
| Current interest costs | | $ | 1,846 | |
| Current service costs | | | — | |
| Less: Expected return on plan assets | | | (1,103 | ) |
| | |
| |
| Net period benefit cost | | $ | 743 | |
| | |
| |
The Company made no contributions to its defined benefit pension plan for the year ending April 30, 2004. The Company expects to contribute $782 to its pension plan in 2005.
Future benefit payments
Anticipated future retirement payments are as follows:
| | Year ending April 30,
|
|---|
| 2005 | | $ | 598 |
| 2006 | | $ | 603 |
| 2007 | | $ | 610 |
| 2008 | | $ | 616 |
| 2009 | | $ | 623 |
| 2010 and subsequent | | $ | 635 |
68
Plan assets
The asset allocation for the Company's pension plan at the end of fiscal 2004, and the target allocation of fiscal 2005, by asset category, is as follows:
| | Target
Allocation 2005
| | Percentage of Plan Assets
at April 30, 2004
| |
|---|
| Equity securities | | 55-65 | % | 61.7 | % |
| Debt securities | | 35-45 | % | 38.3 | % |
The weighted average of the long-term rate of returns that are expected on the actual assets held as of April 30, 2004 is 6.75% per annum. Asset return assumptions are derived following consideration of the Company's current investment mix and from an analysis of long-term historical data relevant to the country where the plan is in effect and the investments applicable to the plan.
14 COMMITMENTS AND CONTINGENCIES
The Company has operating leases on rental equipment for varying terms up to a maximum of 5 years, leases on vehicles for varying terms up to a maximum of 4 years, and has entered into leases for the rental of premises for varying terms up to a maximum of 21 years. Aggregate lease payments in each of the next five years and thereafter are as follows:
| | Year ending April 30,
|
|---|
| 2005 | | $ | 17,400 |
| 2006 | | | 11,233 |
| 2007 | | | 5,142 |
| 2008 | | | 2,737 |
| 2009 | | | 1,586 |
| 2010 and subsequent | | | 5,011 |
| | |
|
| Total obligations under operating leases | | $ | 43,109 |
| | |
|
The total expense incurred on operating leases for the year ended April 30, 2004 was $16,151 (2003—$15,836).
The Company has capital leases on various assets (notes 5 and 11) for terms ranging up to a maximum of 7 years. Aggregate lease payments on assets held under capital leases in each of the next five years are as follows:
| | Year ending April 30,
|
|---|
| 2005 | | $ | 603 |
| 2006 | | | 603 |
| 2007 | | | 603 |
| 2008 | | | 603 |
| 2009 | | | 603 |
| 2010 and subsequent | | | 2,870 |
| | |
|
| | | | 5,885 |
| Less: Imputed interest on capital lease obligations | | | 971 |
| | |
|
| Total obligations under capital leases | | $ | 4,914 |
| | |
|
As at April 30, 2004, letters of credit and bank guarantees are outstanding for approximately $3,324 (2003—$2,736) of which $1,509 (2003—$2,355) are cash collateralised and included in restricted cash.
See note 20 for legal contingencies.
69
15 SHARE CAPITAL
The Company is authorized to issue an unlimited number of common shares, with no par value, and an unlimited number of preference shares, with no par value, issuable in series.
In March 2003, the Company acquired Extensity, Inc. Under the terms of the merger agreement, Extensity shareholders were able to elect to receive, for each share of Extensity common stock, 0.627 of a Geac common share or US$1.75 in cash. In connection with this transaction, the Company issued 932,736 shares at a value of Cdn$4.13 per share, which is determined based on an average market price of Geac during 3 days prior to the closing of the acquisition. The issued share capital of Cdn$3,852 was offset by the issuance costs incurred in the transaction. In accordance with the terms of the merger agreement, the Company assumed all of the Extensity outstanding options on the closing date of March 6, 2003. The fair value of $163 of the assumed options was recognized as part of the share capital of the Company for the year ended April 30, 2003.
In May 2001, the Company entered into an agreement with a syndicate of underwriters led by CIBC World Markets Inc. under which the underwriters agreed to buy 10 million units via special warrants. Each unit consisted of one common share plus one half of a common share purchase warrant, and the units were issued at Cdn$2.00 per unit, for aggregate proceeds of Cdn$20,000. The net proceeds after underwriters' fees and other issue expenses were Cdn$17,885. On August 1, 2001, the 10 million special warrants were exercised, which resulted in the issuance of 10 million common shares and 5 million common share purchase warrants and an increase in share capital in the amount of Cdn$16,135. The purchase warrants were recorded at their fair value of Cdn$1,750. Each full common share purchase warrant entitled the purchaser to acquire a common share of the Company for Cdn$2.75 at any time up to 18 months from the close of the offering on June 29, 2001. During the second and third quarters of fiscal 2003, all 5 million purchase warrants were exercised. As a result of this exercise, share capital increased by $8,721 and the fair value of purchase warrants of $1,139 was reclassified and recognized as part of the issued share capital.
Employee stock purchase plan
The Company's employee stock purchase plan (the "Old ESPP") became effective in August 2001. Under the Old ESPP, membership was limited to employees resident in Canada and after entering continuous full-time employment with the Company or a subsidiary of the Company. The maximum number of common shares issuable under the Old ESPP was 600,000. During fiscal 2004, 26,973 (2003—39,646) shares were issued to employees under this plan at a weighted average price of Cdn$4.48 (2003—Cdn$3.57) per share. The Company's share capital account was credited for $88 (2003—$92) for cash received from employees for purchases of stock under the Old ESPP.
The Company's 2003 Employee Stock Purchase Plan (the "New ESPP") was approved by the Company's shareholders in September 2003. Under the New ESPP, employees of the Company resident in Canada and the United States are entitled to participate with additional countries to be added over time. The maximum number of common shares issuable under the New ESPP is 2,000,000 shares. As at April 30, 2004, no shares were issued to employees under this new plan.
Stock option plan
Options have been granted to employees, directors, and executive officers to purchase common shares at or above the prevailing market price at the time of the grant under the Company's various employee stock option plans. Options under these plans typically vest over three to four years and expire ten years from the date granted. Currently, the Company is only granting options under the Geac's Stock Option Plan VI ("Plan VI"). The maximum number of shares reserved for Plan VI is 9,554,016. As at April 30, 2004, the total number still available to be issued under the Plan VI was 441,106 (2003—1,977,097) options.
70
In connection with the Comshare acquisition in fiscal 2004, 1,535,250 options were granted on September 9, 2003, to employees of Comshare, Inc., under Plan VI, which vest over four years and expire in ten years after the date of grant.
In connection with the Extensity acquisition in fiscal 2003, 175,768 options were issued under Plan VI to replace outstanding options of Extensity, Inc. and 958,320 additional options were granted under Plan VI on March 25, 2003, to employees of Extensity, Inc., which vest over three years and expire in ten years after the date of grant.
An analysis of the stock options outstanding under the employee stock option plans and other arrangements is as follows:
| | 2004
| | 2003
|
|---|
| | Number of
Options
| | Weighted Average
Exercise Price
$CDN
| | Number of
Options
| | Weighted Average
Exercise Price
$CDN
|
|---|
| | ('000s of options)
| |
| | ('000s of options)
| |
|
|---|
| Outstanding—Beginning of year | | 7,214 | | $ | 7.10 | | 6,492 | | $ | 9.64 |
| Options granted | | 5,004 | | $ | 6.11 | | 2,404 | | $ | 4.39 |
| Options exercised | | (1,011 | ) | $ | 3.73 | | (20 | ) | $ | 2.89 |
| Options expired | | (1,361 | ) | $ | 4.67 | | (974 | ) | $ | 14.48 |
| Options forfeited | | (591 | ) | $ | 11.57 | | (688 | ) | $ | 11.27 |
| | |
| | | | |
| | | |
| Outstanding—End of year | | 9,255 | | $ | 7.10 | | 7,214 | | $ | 7.10 |
| | |
| | | | |
| | | |
Weighted average exercise price of options exercisable—End of year |
|
|
|
$ |
9.70 |
|
|
|
$ |
9.83 |
| | | | |
| | | |
|
For the years ended April 30, 2004 and 2003, the Company's share for capital account was credited with $2,819 and $37 respectively, for cash received from employees upon the exercise of stock options.
| | Options Outstanding
| | Options Exercisable
|
|---|
Range of Exercise
Prices $CDN
| | Number
Outstanding as at
April 30, 2004
| | Weighted Average
Remaining
Contractual Life
(years)
| | Weighted Average
Exercise Price
$CDN
| | Number
Outstanding as at
April 30, 2004
| | Weighted Average
Remaining
Contractual Life
(years)
| | Weighted Average
Exercise Price
$CDN
|
|---|
| $ 0.38 - 3.52 | | 227,102 | | 6.8 | | $ | 2.87 | | 158,458 | | 6.6 | | $ | 2.90 |
| $ 4.24 - 5.01 | | 2,731,837 | | 8.7 | | $ | 4.65 | | 584,450 | | 8.4 | | $ | 4.52 |
| $ 6.11 - 9.32 | | 5,913,250 | | 8.5 | | $ | 6.89 | | 1,852,875 | | 6.5 | | $ | 8.11 |
| $10.15 - 29.25 | | 225,000 | | 3.3 | | $ | 23.82 | | 225,000 | | 3.3 | | $ | 23.82 |
| $32.92 - 41.25 | | 158,000 | | 2.7 | | $ | 34.22 | | 158,000 | | 2.7 | | $ | 34.22 |
| | |
| | | | | | |
| | | | | |
| $ 0.38 - 41.25 | | 9,255,189 | | 8.3 | | $ | 7.01 | | 2,978,783 | | 6.5 | | $ | 9.70 |
| | |
| | | | | | |
| | | | | |
Amended and restated shareholder protection rights plan
The Company and a predecessor to Computershare Trust Company of Canada, as rights agent, entered into an agreement dated March 15, 2000 to implement a shareholder protection rights plan (the "Original Plan"). The Company's Board of Directors adopted, and the Company's shareholders on September 10, 2003 approved, the amended and restated shareholder protection rights plan (the "Amended Plan") thereby reconfirming and amending the Original Plan. The Amended Plan is identical to the Original Plan in all material respects.
One right (a "Right") was issued on March 15, 2000, the date of implementation of the Original Plan, for each common share that was outstanding on that date or issued subsequently. Under the Amended Plan, the Rights are reconfirmed and the Company reconfirms its authorization to continue the issuance of one new Right for each common share issued. Generally, each Right, except for Rights
71
owned by an acquiring person (as defined in the Amended Plan) will, if certain events occur, constitute the right to purchase from the Company, on payment of the exercise price, that number of common shares of the Company having an aggregate market price equal to twice the exercise price, subject to adjustment in certain circumstances. Prior to the separation time (as defined in the Amended Plan), the exercise price for a Right is equal to three times the market price from time to time. After the separation time, the exercise price is three times the market price at the separation time. The Rights become exercisable after the separation time, which generally occurs ten days after a person acquires beneficial ownership of or announces an intention to acquire 20% or more of the voting securities of the Company, unless the Board of Directors determines that it should be a later date. Until the separation time, the Rights trade together with the existing common shares. The Board of Directors may, in certain circumstances, redeem outstanding Rights at a redemption price of $0.001 per Right.
Directors' deferred share unit plan
In March 2004, the Board authorized a Director's deferred share unit plan. Under the plan, the Human Resources and Compensation Committee of the Board, or its designee, may grant deferred share units to members of the Company's Board of Directors relating to compensation for the services rendered to the Company as a member of the Board. Units issued under the plan may be subject to vesting conditions or certain share ownership requirements. Ten thousand units were issued under this plan as at April 30, 2004 to each non-executive Director of the Company, with one-third of the units vesting on the date of issuance, one-third vesting on April 30, 2005 and one-third vesting on April 30, 2006.
16 WEIGHTED AVERAGE NUMBER OF COMMON SHARES OUTSTANDING
The following table summarizes the reconciliation of the basic weighted average number of shares outstanding and the diluted weighted average number of shares outstanding used in the diluted net earnings per share calculations:
| | 2004
| | 2003
|
|---|
| | ('000s)
| | ('000s)
|
|---|
| Basic weighted average number of shares outstanding | | 84,645 | | 80,152 |
| Stock options and warrants | | 1,588 | | 1,543 |
| | |
| |
|
| Diluted weighted average number of shares outstanding | | 86,233 | | 81,695 |
| | |
| |
|
17 NET RESTRUCTURING AND OTHER UNUSUAL ITEMS
For the years ended April 30, 2004 and 2003, net restructuring and other unusual items (recovery)/expense was comprised of the following:
| | 2004
| | 2003
|
|---|
| Unusual items | | $ | (2,851 | ) | $ | 1,973 |
| Restructuring (reversals)/charges | | | (2,430 | ) | | 1,630 |
| | |
| |
|
| Net restructuring and other unusual items | | $ | (5,281 | ) | $ | 3,603 |
| | |
| |
|
Details related to each of these components are discussed below.
72
Unusual items
The unusual items credit balance of $2,851 is comprised of the reversal of previously accrued liabilities of approximately $1,916 which, based on changing circumstances, were determined to no longer be required, and a $2,170 liability balance relating to customer commitments from previous acquisitions which was reversed as a result of the fulfillment of the commitments. Also, a pre-tax gain of $243 on the sale of the assets of the NTC Northern Ontario business was recorded in the third quarter of fiscal 2004. These balances were reduced by a charge for $825 resulting from new information obtained on a capital lease obligation which required the Company to increase its outstanding liability balance, and by an increase of $653 in a pension obligation held by the Company resulting from an actuarial valuation.
For the year ended April 30, 2003, $1,973 in charges for unusual items included $3,473 for legal claims. This amount was partially offset by a credit of $1,500 for the elimination of customer commitments from a fiscal 2000 acquisition based on revised estimates of the acquired obligations. (For the year ended April 30, 2004, $3,587 in charges related to legal claims were also incurred. These amounts were classified in general and administrative expenses in the consolidated statement of earnings. See note 20.)
Restructuring expense
For the year ended April 30, 2004, the net restructuring credit balance of $2,430 was comprised of a release of $987 related to severance accruals as a result of plan amendments and employee attrition prior to their planned termination and $1,930 related to previously accrued lease termination costs that are no longer required. This was reduced by a severance charge of $487 related to employee terminations in North America to align the Company's workforce with existing and anticipated future market requirements. Approximately 34 employees were terminated in the first half of fiscal year 2004, primarily from the support and services, development and sales and marketing areas.
In fiscal 2003, the Company recorded a net charge of $1,630 related to accrued restructuring charges. The Company incurred a charge of approximately $1,959 for severance relating to the restructuring of the Company's business, primarily in North America, and recorded a charge for increases in premises rationalization accruals of $2,418 for changes in estimated recoveries and settlements related to actions in the fiscal 2002 restructuring. This was reduced by a reversal of $1,040 in severance accruals as a result of plan amendments and employee attrition prior to their planned termination and a reduction in premises rationalization of $1,707 related to plan amendments.
73
Restructuring accrual
Activity related to the Company's restructuring plans, business recorded rationalization, and prior to fiscal 2002, was as follows:
| | Premises
Restructuring
| | Workforce
Reductions
| | Total
| |
|---|
| April 30, 2002 provision balance | | $ | 14,296 | | $ | 10,480 | | $ | 24,776 | |
| Fiscal year 2003 provision additions | | | 8,438 | | | 5,722 | | | 14,160 | |
| Fiscal year 2003 costs charged against provisions | | | (3,398 | ) | | (9,555 | ) | | (12,953 | ) |
| Fiscal year 2003 provision release | | | (1,678 | ) | | (1,022 | ) | | (2,700 | ) |
| | |
| |
| |
| |
| April 30, 2003 provision balance | | | 17,658 | | | 5,625 | | | 23,283 | |
| Fiscal year 2004 provision additions | | | 3,101 | | | 5,990 | | | 9,091 | |
| Fiscal year 2004 costs charged against provisions | | | (4,860 | ) | | (8,661 | ) | | (13,521 | ) |
| Fiscal year 2004 provision release | | | (3,699 | ) | | (1,738 | ) | | (5,437 | ) |
| | |
| |
| |
| |
| April 30, 2004 provision balance | | $ | 12,200 | | $ | 1,216 | | | 13,416 | |
| | |
| |
| | | | |
| Less: Current portion | | | | | | | | | 7,552 | |
| | | | | | | | |
| |
| Long-term portion of restructuring accrual | | | | | | | | $ | 5,864 | |
| | | | | | | | |
| |
For the year ended April 30, 2004, the Company recorded a restructuring liability of approximately $4,922 related to the acquisition of Comshare. An amount of $3,125 was accrued related to workforce reductions for 72 employees of Comshare in the general and administrative, support and services, and sales and marketing areas. As at April 30, 2004, restructuring of the Comshare workforce was substantially complete. The remaining balance of $1,867 related to lease termination costs. Of this balance, $190 has been paid through April 30, 2004 and the remaining balance will be recognized through to the end of the contractual lease obligation of the premise.
During the year ended April 30, 2004, the Company also accrued $2,865 in severance and $1,234 in lease termination costs related to the rationalization of the North American and EMEA businesses. As at April 30, 2004, a balance of approximately $1,082 is remaining for severance, of which the remainder will be paid in the first half of 2005 and will include employees from the support and services, development and sales and marketing areas. The remaining balance for accrued premises restructuring was $6,289 as at April 30, 2004. The Company anticipates that the remainder of the balance will be utilized through fiscal 2009.
As at April 30, 2004, the remaining $4,359 balance related to the acquisition of Extensity is for reserves on premises, which are expected to be utilized through the second quarter of fiscal 2007.
During the year ended April 30, 2004, several smaller restructuring accruals relating to severance amounts and lease termination costs were released through the general and administrative expense line to adjust the accruals to match the current estimates of the amounts required.
74
18 INCOME TAXES
The provision for income taxes reflects an effective income tax rate that differs from the combined basic Canadian federal and provincial income tax rate for the reasons in the table below.
| | Year ended April 30,
| |
|---|
| | 2004
| | 2003
| |
|---|
| Combined basic Canadian federal and provincial income tax rate | | | 36.5 | % | | 38.0 | % |
Provision for income taxes based on above rate |
|
$ |
25,857 |
|
$ |
20,282 |
|
| Increase (decrease) resulting from: | | | | | | | |
| | Non-deductible amortization arising from acquisitions | | | — | | | 412 | |
| | Write-down of goodwill | | | — | | | 4,373 | |
| | Foreign tax rate differences | | | (2,647 | ) | | (1,124 | ) |
| | Change in valuation allowance | | | (9,030 | ) | | (3,696 | ) |
| | Other | | | (506 | ) | | 1,096 | |
| | |
| |
| |
| Provision for income taxes per consolidated statements of earnings | | $ | 13,674 | | $ | 21,343 | |
| | |
| |
| |
Total amount of income taxes paid in excess of recoveries is $5,091 (2003—$5,626).
Income tax expense
| | Year ended April 30,
| |
|---|
| | 2004
| | 2003
| |
|---|
| Current income tax expense | | $ | 7,630 | | $ | 4,910 | |
Change in temporary differences |
|
|
1,191 |
|
|
4,195 |
|
| Realization of non-capital loss carry-forwards | | | 13,883 | | | 15,934 | |
| Change in valuation allowance | | | (9,030 | ) | | (3,696 | ) |
| | |
| |
| |
| Future income tax expense | | | 6,044 | | | 16,433 | |
| | |
| |
| |
| Total income tax expense | | $ | 13,674 | | $ | 21,343 | |
| | |
| |
| |
75
The following table shows the income tax effects of temporary differences and tax losses that gave rise to future income tax assets as at April 30, 2004 and 2003.
| | 2004
| | 2003
| |
|---|
| Provisions and other | | $ | 14,773 | | $ | 15,309 | |
| Deferred revenue | | | 1,893 | | | 2,349 | |
| Valuation allowance | | | (1,419 | ) | | (1,420 | ) |
| | |
| |
| |
| Future income taxes—current | | | 15,247 | | | 16,238 | |
| | |
| |
| |
Property, plant and equipment |
|
|
25,404 |
|
|
21,833 |
|
| Non-capital loss carry-forwards | | | 48,792 | | | 47,104 | |
| Capital loss carry-forwards | | | 2,869 | | | 2,586 | |
| Intangible assets | | | (12,075 | ) | | (4,422 | ) |
| Valuation allowance | | | (43,249 | ) | | (44,093 | ) |
| | |
| |
| |
| Future income taxes—non-current | | | 21,741 | | | 23,008 | |
| | |
| |
| |
| Total future income taxes | | $ | 36,988 | | $ | 39,246 | |
| | |
| |
| |
Substantially all of the Company's activities are carried out through operating subsidiaries in a number of countries. The income tax effect of operations depends on the income tax legislation in each country and operating results of each subsidiary and the parent Company.
The Company has non-capital losses of approximately $160,842 (2003—$133,909), which are available for carry-forward against taxable income in future years and which expire as shown in the table below. Certain non-capital losses may be subject to restrictions on their availability.
The Company has capital losses of approximately $139,037 (2003—$131,329), which are available for carry-forward against taxable capital gains in future years and which expire as shown in the table below.
| | Capital Losses
| | Non-Capital Losses
|
|---|
| 2005 | | $ | — | | $ | 2,610 |
| 2006 | | | — | | | 3,055 |
| 2007 | | | — | | | 2,291 |
| 2008 | | | 577 | | | 1,206 |
| 2009 - 2023 | | | — | | | 66,434 |
| Losses without expiry date | | | 138,460 | | | 85,246 |
| | |
| |
|
| | | $ | 139,037 | | $ | 160,842 |
| | |
| |
|
In assessing the realizability of future tax assets, management considers whether it is more likely than not that some portion or all of the future tax assets will not be realized. Management evaluates a variety of factors, including the Company's earnings history, the number of years the Company's non-capital losses can be carried forward, and projected future taxable income. As indicated in the table above, management has provided a valuation allowance for a portion of the non-capital loss carry-forwards in certain jurisdictions where it is unlikely that the entities will generate sufficient taxable income in the carry-forward years to utilize the losses and for all of the capital losses. For the balance of future tax assets, although realization is not assured, management believes it is more likely than not that the future tax assets will be realized.
76
19 RELATED PARTY TRANSACTIONS
Accounts receivable and other receivables as at April 30, 2004 included $254 (2003—$254) for a loan due from a former officer of the Company in connection with a compensatory arrangement relating to his employment with the Company. The Company holds as collateral 250,625 common shares of the Company, a portion of which were purchased by the former officer with the proceeds of the loan. The 250,625 common shares had a market value of approximately $1.5 million as at April 30, 2004. The loan came due in October 2003 and the Company anticipates that the amount will be settled in fiscal 2005.
The Company also acquired legal services from a law firm of which the Company's Senior Vice President, Mergers and Acquisition and Corporate Secretary is a partner, in the amount of $1,420 in fiscal 2004 (2003—$1,345). The expenses for these services have been included in general and administrative expenses in the consolidated statements of earnings. As at April 30, 2004 a balance of $118 was owing to the law firm and has been included in accounts payable and accrued liabilities in the consolidated balance sheet.
20 LITIGATION
Activity related to the Company's legal accruals was as follows for the years ended April 30, 2004 and 2003:
| April 30, 2002 provision balance | | $ | 6,255 | |
| Fiscal year 2003 provision additions | | | 3,413 | |
| Fiscal year 2003 costs charged against provisions | | | (5,701 | ) |
| Fiscal year 2003 provision release | | | (123 | ) |
| | |
| |
| April 30, 2003 provision balance | | | 3,844 | |
| Fiscal year 2004 provision additions | | | 3,587 | |
| Fiscal year 2004 costs charged against provisions | | | (3,125 | ) |
| Fiscal year 2004 provision release | | | (109 | ) |
| | |
| |
| April 30, 2004 provision balance | | $ | 4,197 | |
| | |
| |
In May 2001, Cels Enterprises, Inc. ("Cels") filed a complaint in the United States District Court for the Central District of California against Geac, Geac Enterprise Solutions (GES) and JBA International, Inc. (JBA). GES is JBA's successor in interest as a result of Geac's acquisition of JBA Holdings plc in 1999. The complaint alleged that JBA software supplied to Cels was experimental and did not work. The software product in question, which was part of JBA's product offering prior to the acquisition, is no longer sold by Geac. Cels claimed damages of $28,300. In August 2003, following a jury trial and verdict, the Court entered judgment against GES for approximately $4,134 in damages and prejudgment interest. GES will satisfy the judgment in two separate payments in June and August 2004 totalling, with post-judgment interest, approximately $4,180. Cels' appeal of the Court's denial of its motion seeking approximately $1,000 in attorneys' fees is still pending. At April 30, 2003 Geac had accrued $2,000 in respect of the Cels claim. Geac increased the amount of this reserve to $4,187 as at April 30, 2004.
Extensity, a subsidiary acquired by Geac in March 2003, is subject to a class action suit, which alleges that Extensity, certain of its former officers and directors, and the underwriters of its initial public offering in January 2000 violated U.S. securities laws by not adequately disclosing the compensation paid to such underwriters. The class action suit has been consolidated with a number of similar class action suits brought against other issuers and underwriters involved in initial public offerings. The plaintiffs seek an unspecified amount of damages. The plaintiffs and issuer parties have
77
entered into a settlement agreement to settle all claims, which will be funded by the issuers' insurers. The settlement is still subject to approval by the Court.
In addition, Geac is subject to various other legal proceedings and claims in the ordinary course of business, arising out of disputes over contracts, alleged torts, intellectual property, real estate and employee relations, among other things. In the opinion of management, resolution of these matters is not reasonably expected to have a material adverse effect on Geac's financial position, results of operations or cash flows. However, a materially adverse outcome with respect to such matters may affect our future financial position, results of operations or cash flows.
21 SALE OF NTC NORTHERN ONTARIO ASSETS
The total sales proceeds in fiscal 2004 were $339 relating to the sale of the assets of the NTC Northern Ontario business on January 31, 2004. The transaction resulted in a gain of $243, which was recorded as an unusual item on the consolidated statements of earnings (note 17).
22 SEGMENTED INFORMATION
The Company reports segmented information according to CICA Handbook Section 1701, "Segment Disclosures." The Company operates the following business segments, which have been segregated based on product offerings, reflecting the way that management organizes the segments within the business for making operating decisions and assessing performance.
Enterprise Applications Systems (EAS) offer software solutions, which include cross-industry enterprise business applications for financial administration and human resource functions, and enterprise resource planning applications for manufacturing, distribution, and supply chain management.
Industry-Specific Applications (ISA) products include applications for the real estate, construction, banking, local government, hospitality and publishing marketplaces, as well as a range of applications for libraries and public safety administration.
Accounting policies for the operating segments are the same as those described in note 2. There are no significant inter-segment revenues. Segment assets consist of working capital items, excluding cash and cash equivalents. Cash and cash equivalents are considered to be corporate assets. Property, plant and equipment are typically shared by operating segments and those assets are managed by geographic region, rather than through the operating segments.
During the year, the Company determined that given the nature of the products offered in its local government product line the inclusion of the local government business in the EAS segment was no longer appropriate. As a result, the local government business has been reclassified from EAS to ISA. For comparison purposes, the Company has reclassified revenue, segment contribution margin and
78
segment assets relating to this business in its comparatives. The impact on revenue, contribution and segment assets for fiscal 2003 was approximately $10,354, $3,176 and $2,071, respectively.
| | Year ended April 30, 2004
|
|---|
| | EAS
| | ISA
| | Total
|
|---|
| Revenues: | | | | | | | | | |
| | Software | | $ | 54,826 | | $ | 10,364 | | $ | 65,190 |
| | Support and services | | | 274,859 | | | 80,160 | | | 355,019 |
| | Hardware | | | 21,574 | | | 3,489 | | | 25,063 |
| | |
| |
| |
|
| Total revenues | | $ | 351,259 | | $ | 94,013 | | $ | 445,272 |
| | |
| |
| |
|
| Segment contribution | | $ | 77,618 | | $ | 11,117 | | $ | 88,735 |
| Segment assets | | $ | 57,057 | | $ | 9,674 | | $ | 66,731 |
| | Year ended April 30, 2003
|
|---|
| | EAS
| | ISA
| | Total
|
|---|
| Revenues: | | | | | | | | | |
| | Software | | $ | 37,363 | | $ | 12,017 | | $ | 49,380 |
| | Support and services | | | 242,473 | | | 85,999 | | | 328,472 |
| | Hardware | | | 25,320 | | | 5,305 | | | 30,625 |
| | |
| |
| |
|
| Total revenues | | $ | 305,156 | | $ | 103,321 | | $ | 408,477 |
| | |
| |
| |
|
| Segment contribution | | $ | 74,615 | | $ | 5,102 | | $ | 79,717 |
| Segment assets | | $ | 58,164 | | $ | 12,865 | | $ | 71,029 |
Reconciliation of segment contribution to earnings from operations before income taxes
| | Year ended April 30,
| |
|---|
| | 2004
| | 2003
| |
|---|
| Segment contribution | | $ | 88,735 | | $ | 79,717 | |
| Corporate expenses | | | (14,144 | ) | | (8,325 | ) |
| Amortization of intangible assets | | | (7,589 | ) | | (1,085 | ) |
| Interest income (expense), net | | | (24 | ) | | 845 | |
| Foreign exchange | | | (1,419 | ) | | (2,826 | ) |
| Net restructuring and other unusual items | | | 5,281 | | | (3,603 | ) |
| Goodwill impairment | | | — | | | (11,509 | ) |
| | |
| |
| |
| Earnings from operations before income taxes | | $ | 70,840 | | $ | 53,214 | |
| | |
| |
| |
79
Reconciliation of segment assets to total Company assets
| | April 30,
|
|---|
| | 2004
| | 2003
|
|---|
| Segment assets | | $ | 66,731 | | $ | 71,029 |
| Goodwill | | | 128,366 | | | 89,386 |
| Intangible assets | | | 32,628 | | | 11,172 |
| Other assets | | | 3,352 | | | 1,236 |
| Property, plant and equipment | | | 23,843 | | | 26,431 |
| Future income taxes | | | 36,988 | | | 39,246 |
| Cash and cash equivalents | | | 112,550 | | | 89,819 |
| Restricted cash | | | 1,876 | | | 2,395 |
| Other unallocated assets | | | 569 | | | 2,042 |
| | |
| |
|
| Total assets | | $ | 406,903 | | $ | 332,756 |
| | |
| |
|
Geographical information
| | April 30, 2004
| | April 30, 2003
|
|---|
| | Revenue
| | Property, Plant
and Equipment
Intangible Assets
Goodwill and
Other Assets
| | Revenue
| | Property, Plant
and Equipment
Intangible Assets
Goodwill and
Other Assets
|
|---|
| Canada | | $ | 12,956 | | $ | 8,681 | | $ | 12,812 | | $ | 7,506 |
| U.S.A. | | | 213,070 | | | 135,218 | | | 199,961 | | | 97,448 |
| United Kingdom | | | 84,579 | | | 27,035 | | | 68,757 | | | 5,467 |
| France | | | 54,042 | | | 7,357 | | | 55,167 | | | 8,014 |
| Australia | | | 21,265 | | | 2,838 | | | 17,932 | | | 1,823 |
| All other | | | 59,360 | | | 7,060 | | | 53,848 | | | 7,967 |
| | |
| |
| |
| |
|
| | Total | | $ | 445,272 | | $ | 188,189 | | $ | 408,477 | | $ | 128,225 |
| | |
| |
| |
| |
|
Revenues in the above tables are based on the location of the sales organization, which reflects the location of the customers to which sales are made. Revenues are derived from the licensing of software, the resale of hardware and the provision of related support and consulting services.
80
23 UNITED STATES GENERALLY ACCEPTED ACCOUNTING PRINCIPLES
The consolidated financial statements of the Company have been prepared in accordance with Canadian GAAP; however the accounting policies, as reflected in these consolidated financial statements, do not materially differ from U.S. GAAP except as follows:
| | Year ended April 30,
| |
|---|
| | 2004
| | 2003
| |
|---|
| Net earnings under Canadian GAAP | | $ | 57,166 | | $ | 31,871 | |
| Adjustments (net of related tax effects): | | | | | | | |
| | Stock-based compensation (a) | | | (204 | ) | | (273 | ) |
| | Goodwill impairment (b) | | | — | | | 2,900 | |
| | Asset retirement obligation (c) | | | — | | | 160 | |
| | Write off of intellectual property capitalized under Canadian
GAAP in connection with the Comshare acquisition net of tax of $70 (d) | | | (1,378 | ) | | — | |
| | |
| |
| |
| Net earnings under U.S. GAAP before cumulative catch-up adjustments | | | 55,584 | | | 34,658 | |
| Cumulative adjustment for change in accounting policy for asset retirement obligation (e) | | | (736 | ) | | — | |
| | |
| |
| |
| Net earnings under U.S. GAAP | | | 54,848 | | | 34,658 | |
| Other comprehensive income (loss): | | | | | | | |
| | Foreign currency translation adjustment | | | (2,731 | ) | | 1,123 | |
| | |
| |
| |
| Comprehensive income under U.S. GAAP | | $ | 52,117 | | $ | 35,781 | |
| | |
| |
| |
| Net earnings per share under U.S. GAAP: | | | | | | | |
| Basic net earnings per common share | | $ | 0.65 | | $ | 0.43 | |
| | |
| |
| |
| Diluted net earnings per common share | | $ | 0.64 | | $ | 0.42 | |
| | |
| |
| |
| Weighted average number of common shares used in computing basic net earnings per share ('000s) | | | 84,645 | | | 80,152 | |
| | |
| |
| |
| Weighted average number of common shares used in computing diluted net earnings per share ('000s) | | | 86,233 | | | 81,695 | |
| | |
| |
| |
a) Stock-based compensation
Accounting for stock options
As more fully described in note 2, the Company has prospectively adopted the new Canadian GAAP recommendations, which require that a fair value method of accounting be applied to all stock-based compensation awards to both employees and non-employees granted on or after May 1, 2003. The Canadian GAAP recommendations are substantially harmonized with the existing U.S. GAAP rules, which have also been adopted by the Company prospectively for all awards granted on or after May 1, 2003. Therefore, there is no GAAP difference for stock-based compensation and awards granted in fiscal year 2004.
In fiscal year 2003, the Company did not expense any compensation cost under Canadian GAAP. For U.S. GAAP, the Company elected to measure compensation cost based on the difference, if any, on the date of the grant, between the market value of the shares and the exercise price (referred to as the "intrinsic value method") over the vesting period. As a result, the Company has recorded stock
81
compensation charges under U.S. GAAP for fiscal years 2003 and 2004, and will have additional charges in 2005, 2006 and 2007 for stock-based compensation and awards granted in fiscal year 2003.
Prior to fiscal year 2003, the Company expensed stock-based compensation under U.S. GAAP as a result of the issuance of stock options with an exercise price below market value.
Pro forma disclosures
For awards granted prior to May 1, 2003, U.S. GAAP requires the disclosure of pro forma net earnings and earnings per share information for all outstanding awards as if the Company had accounted for employee stock options under the fair value method.
The following table presents net earnings and earnings per share information following U.S. GAAP for purposes of pro forma disclosures:
| | Year ended April 30,
|
|---|
| | 2004
| | 2003
|
|---|
| Net earnings under U.S. GAAP—as reported above | | $ | 54,848 | | $ | 34,658 |
| | Pro forma stock-based compensation expense, net of tax | | | 3,730 | | | 5,001 |
| | |
| |
|
| Net earnings—pro forma | | $ | 51,118 | | $ | 29,657 |
| | |
| |
|
| Basic net earnings per share under U.S. GAAP—as reported above | | $ | 0.65 | | $ | 0.43 |
| | Pro forma stock-based compensation expense per share | | | 0.05 | | | 0.06 |
| | |
| |
|
| Basic net earnings per share—pro forma | | $ | 0.60 | | $ | 0.37 |
| | |
| |
|
| Diluted net earnings per share under U.S. GAAP—as reported above | | $ | 0.64 | | $ | 0.42 |
| | Pro forma stock-based compensation expense per share | | | 0.05 | | | 0.06 |
| | |
| |
|
| Diluted net earnings per share—pro forma | | $ | 0.59 | | $ | 0.36 |
| | |
| |
|
Fair values
The fair values of awards granted were estimated using the Black-Scholes option-pricing model (see note 2). The Black-Scholes model was developed to estimate the fair value of traded options and awards, which have no vesting restrictions, and are fully transferable. The Black-Scholes model requires the input of highly subjective assumptions including the expected stock price volatility and expected time until exercise. Because the Company's employee stock options from those and stock of traded options and awards, and because changes in the subjective input assumptions can materially affect the fair value estimate, in management's opinion, existing models, including the Black-Scholes model, do not necessarily provide a reliable single measure of the fair value of its employee stock options and stock awards.
b) Goodwill
In connection with the Company's annual review of the carrying value of goodwill for the year ended April 30, 2003, a goodwill write-down of $11,509 was recorded under Canadian GAAP in the fourth quarter of fiscal 2003 relating to the Interealty business. Under U.S. GAAP, the carrying value of goodwill was $2,900 lower than the carrying value of goodwill under Canadian GAAP due to the varying tax treatments on the intangible assets, which affected the amount of goodwill. While the new Canadian GAAP section for Income Taxes is substantially harmonized with U.S. GAAP, it was applied prospectively and goodwill was not adjusted, resulting in differing carrying values of goodwill under
82
Canadian and U.S. GAAP. Under U.S. GAAP, the carrying value of goodwill on the consolidated balance sheet would be $111,235 (2003—$73,013).
c) Asset retirement obligations
Under U.S. GAAP, the Company adopted a new accounting standard dealing with accounting for asset retirement obligations during the year ended April 30, 2004. This new accounting standard addresses the financial accounting and reporting for legal obligations associated with the retirement of tangible long-lived assets and associated retirement costs and is relatively consistent with Canadian requirements, which the Company adopted under Canadian GAAP (see note 2). The main difference between the two standards is the method of adoption. U.S. GAAP requires that the adoption be treated as a cumulative effect of an accounting change in fiscal 2004, whereas Canadian GAAP allows the financial statements of prior periods to be restated retroactively. The adoption of the standard for U.S. GAAP resulted in the cumulative effect of an accounting change of $736 being charged against earnings for fiscal 2004 and the reversal of a charge under Canadian GAAP of $160 charged against earnings for fiscal 2003.
d) Intangible assets
In connection with the acquisition of Comshare, in-process research and development was acquired and capitalized under Canadian GAAP. Under U.S. GAAP, such in-process research and development must be charged to expense at the acquisition date.
e) Related party transactions
Accounts receivable and other receivables as at April 30, 2004 included $254 for a loan due from a former officer of the Company in connection with a compensatory arrangement relating to his employment with the Company. The proceeds from the loan were used by the former officer to purchase 250,625 common shares of the Company, which are currently held as collateral. Under Canadian GAAP, the loan is classified as an other receivable. However, under U.S. GAAP, the loan is classified as a reduction of shareholders' equity. As a result, in accordance with U.S. GAAP, current and total assets and shareholders' equity would be reduced by $254.
U.S. GAAP Recent accounting pronouncements
In January 2003, the Financial Accounting Standards Board ("FASB") issued FASB Interpretation No. 46 ("FIN 46"), "Consolidation of Variable Interest Entities, an Interpretation of ARB No. 51," which addresses consolidation by business enterprises of variable interest entities ("VIEs") either: (1) that do not have sufficient equity investment at risk to permit the entity to finance its activities without additional subordinated financial support or (2) in which the equity investors lack an essential characteristic of a controlling financial interest. In December 2003, the FASB completed deliberations on proposed modifications to FIN 46 and re-issued FIN 46 ("Revised Interpretation") resulting in multiple effective dates based on the nature as well as the creation date of the VIE. The Revised Interpretation for all VIEs was effective for the Company's fourth quarter of ements of fiscal 2004. For VIEs created after January 31, 2003, the requirements of FIN 46 are effective immediately, and for variable interest entities in which an enterprise holds a variable interest that it acquired before February 1, 2003, the provisions of FIN 46 are effective for the first fiscal year or interim period beginning after June 15, 2003. The Company has not entered into any arrangements with VIEs and has determined that it did not create any material VIEs, including Special Purpose Entities ("SPEs") that have an impact on its financial position, results of operations and cash flows.
In December 2003, the FASB issued revised Statement of Financial Accounting Standards No. 132 (revised 2003) ("SFAS No. 132(R)"), "Employer's Disclosure about Pensions and Other Post-Retiremention Benefits." SFAS 132(R) revised employers' disclosure about pension plans and other post-retirement benefit plans. SFAS 132(R) requires additional disclosures in annual financial statements about the types of plan assets, investment strategy, measurement dates, plan obligations, cash flows, and components of net periodic benefit cost of defined benefit pension plans and other post-retirement benefit plans. The annual disclosure requirements are effective for fiscal years ending after December 15, 2003. The Company has adopted the disclosure requirements in its Consolidated Financial Statements as disclosed in note 13.
83
Shareholder Information
Transfer Agent and Registrar
Our transfer agent, Computershare Trust Company of Canada, can help you with a variety of shareholder related services, including change of address and lost share certificates.
| |
|
|---|
| Email | | careregistryinfo@computershare.com |
Online |
|
www.computershare.com |
Phone |
|
800.564.6253 / 514.982.7270 |
Fax |
|
888.453.0330 / 416.263.9394 |
Mail |
|
Computershare Trust Company of Canada
100 University Avenue, 9th Floor
Toronto, ON M5J 2Y1 |
Stock Exchange Listings
Geac common shares are listed on The Toronto Stock Exchange under ticker symbol GAC, and on the NASDAQ National Market under ticker symbol GEAC.
Web Site
For more information about Geac, including current financial and corporate information, stock quotations, press releases and product announcements, visit our Web site at www.investors.geac.com
Investor Relations
| |
|
|---|
| Email | | investor@geac.com |
Phone |
|
905.940.3751 (Canada)
508.871.5854 (US) |
During regular business hours, for financial documents or investment related questions
| |
|
|---|
| Fax | | 905.940.3752 (Canada)
508.871.5855 (US) |
Mail |
|
Geac Computer Corporation Limited
11 Allstate Parkway, Suite 300
Markham, ON L3R 9T8 |
|
|
Geac Computer Corporation Limited
120 Turnpike Road
Southborough, MA 01772 |
84
Subscribe to Geac NewsFlash
Geac NewsFlash is a service designed to provide you with timely information about what's happening at Geac. If you would like to subscribe to Geac NewsFlash, please visit our Web site at www.investors.geac.com to register.
Annual General Meeting
| |
|
|---|
| Date | | September 15, 2004 |
Time |
|
10.00 a.m. ET |
Venue |
|
The Design Exchange
234 Bay Street
Toronto-Dominion Centre
Toronto, ON M5K 1B2 |
Legal Counsel
| |
|
|---|
| Email | | craig.thorburn@blakes.com |
Online |
|
www.blakes.com |
Phone |
|
416.863.2965 |
Fax |
|
416.863.2653 |
Mail |
|
Blake, Cassels & Graydon LLP
199 Bay Street
Box 25, Commerce Court West
Toronto, ON M5L 1A9 |
Auditors
| |
|
|---|
| Online | | www.pwcglobal.com |
Phone |
|
416.863.1133 |
Fax |
|
416.365.8215 |
Mail |
|
PricewaterhouseCoopers LLP
Royal Trust Tower, TD Centre
Suite 3000, Box 82
Toronto, ON M5K 1G8 |
85
Geac Office Locations
World Headquarters
Geac Computer Corporation Limited
11 Allstate Parkway, Suite 300
Markham, Ontario L3R 9T8
Canada |
Tel |
|
+1.905.475.0525 |
| Fax | | +1.905.475.3847 |
North American Headquarters
120 Turnpike Road
Southborough, MA 01772
United States |
Tel |
|
+1.508.871.5000 |
| Fax | | +1.508.871.5887 |
Europe / Middle East / Africa Headquarters
Needles House
Birmingham Road
Studley
Warwickshire B80 7AS
United Kingdom |
Tel |
|
+44.(0)1527.496.200 |
| Fax | | +44.(0)1527.496.300 |
Asia-Pacific Headquarters
Level 10, 423 Pennant Hills Road
Pennant Hills, NSW 1715
Australia |
Tel |
|
+61.2.9875.9100 |
| Fax | | +61.2.9875.9190 |
86
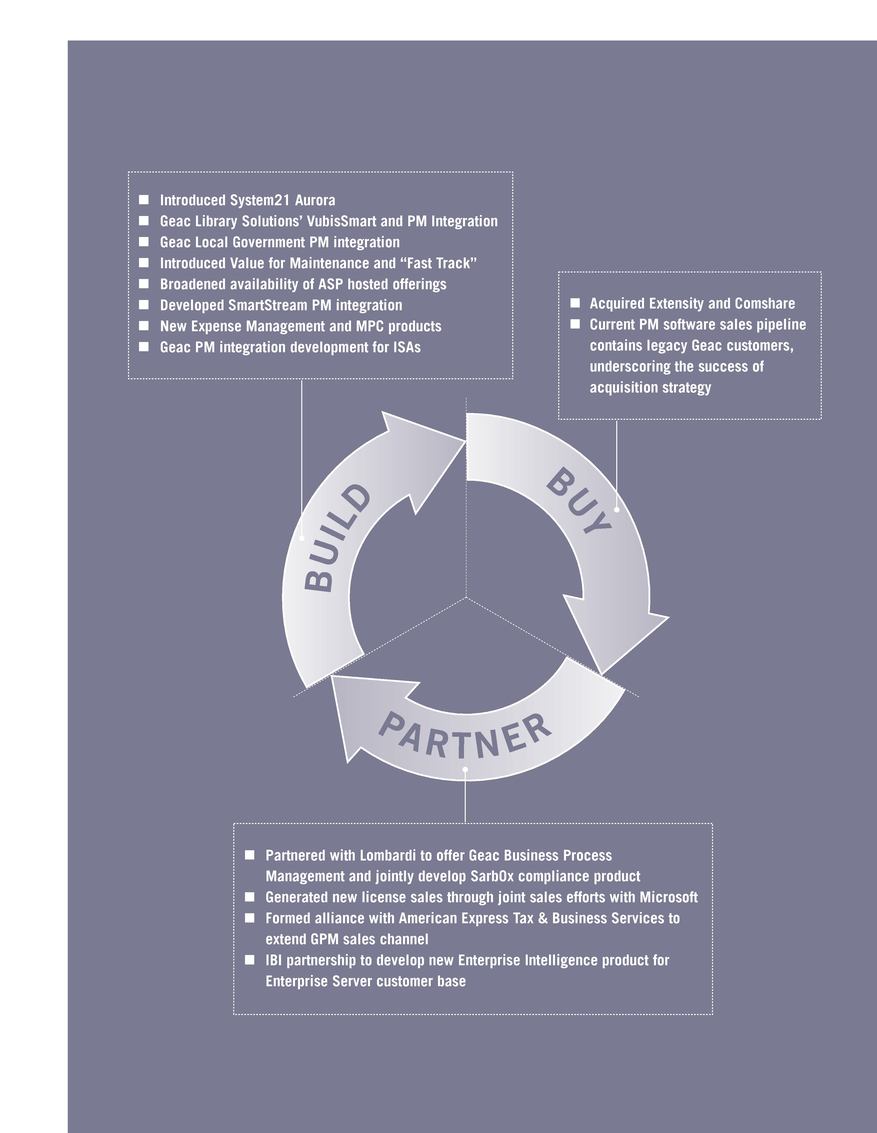

www.geac.com
QuickLinks
Geac 2004 Financial Highlights (U.S. Dollars)Revenue SegmentationPERFORMANCE MANAGEMENT SOLUTIONS MAPPROFESSIONAL INVOLVEMENTTable of ContentsGeac Computer Corporation Limited Consolidated Balance Sheets (in thousands of U.S. dollars)Geac Computer Corporation Limited Consolidated Statements of Earnings (in thousands of U.S. dollars, except share and per share data)Geac Computer Corporation Limited Consolidated Statement of Shareholders' Equity For the years ended April 30, 2004 and 2003 (in thousands of U.S. dollars, except share data)Geac Computer Corporation Limited Consolidated Statements of Cash Flows For the years ended April 30, 2004 and 2003 (amounts in thousands of U.S. dollars)Geac Computer Corporation Limited Notes to the Consolidated Financial Statements April 30, 2004 and 2003 (in thousands of U.S. dollars, except share and per share data unless otherwise noted)