Exhibit 99.2
Overview of Financial Results
The following overview of results of operations and financial position should be read in conjunction with the attached financial information for the fiscal year ended April 30, 2004 (FY 2004), and the financial statements for the year ended April 30, 2003 (FY 2003). This discussion contains certain forward-looking statements based on current expectations. These forward-looking statements entail various risks and uncertainties that could cause actual results to differ materially from those reflected in these forward-looking statements. These risks and uncertainties are substantially unchanged from those presented under the “Risk Factors” heading in the “Key Information” section of our annual report on Form 20-F, No. 333-103019, for the fiscal year ended April 30, 2003 filed on October 31, 2003 with the United States Securities and Exchange Commission, and available through the website maintained by the Commission at www.sec.gov and filed on November 3, 2003 with the Canadian Securities Administrators, and available through the website maintained by the Canadian Securities Administrators and the Canadian Depository for Securities at www.sedar.com, which risks and uncertainties are incorporated by reference herein.
Our financial statements are prepared in accordance with accounting principles generally accepted in Canada (“Canadian GAAP”). The financial statements of the Company have historically been reported in Canadian dollars. Effective May 1, 2003 the Company adopted the U.S. dollar as its reporting currency as U.S. dollar denominated operations represent an increasingly significant portion of the Company’s operations. Accordingly, the change of the Company’s reporting currency from the Canadian dollar to the U.S. dollar reduces the Company’s exposure to foreign currency translation adjustments. Comparative financial information has been recast as if the U.S. dollar had always been used as the Company’s reporting currency, and financial information has been translated into U.S. dollars for all periods presented. As used in this discussion and unless the context otherwise requires or unless otherwise indicated, all references to “Geac,” “we,” “our,” or “the Company” refer to Geac Computer Corporation Limited and its consolidated subsidiaries.
On February 3, 2004 our common shares were registered under the Securities and Exchange Act of 1934 and began trading on the NASDAQ National Market under the ticker symbol “GEAC”. Our common shares also continue to be listed on the Toronto Stock Exchange under the ticker symbol “GAC.”
Overview
Chief Financial Officers are challenged by the market demand of doing more with less
at a time of increasing regulatory pressure. Geac strives to provide best-in-class
technology for many of the issues confronting the Chief Financial Officer.
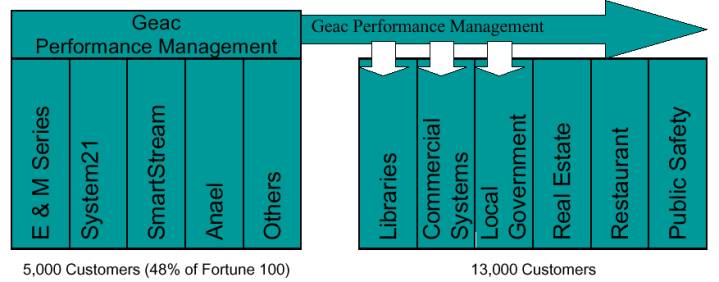
Geac is a global enterprise software company for business performance management, providing customers worldwide with the core financial and operational solutions and services to improve their business performance in real time. Our solutions include cross-industry enterprise application systems (EAS) for financial administration and
1
human resources functions, expense management, time capture, budgeting, financial consolidation, management reporting and analysis and enterprise resource planning applications for manufacturing, distribution, and supply chain management. These cross-industry applications are marketed globally and span a number of product lines. We also provide industry specific applications (ISA) tailored to the real estate, restaurant, property management and construction marketplaces, and for libraries and public safety agencies. Geac is also a reseller of computer hardware and software, and we provide a broad range of professional services, including application hosting, consulting, implementation services, and training worldwide.
EAS – Approximately 80% Revenue |
| ISA – Approximately 20% Revenue |
To deliver these products and services, Geac employed approximately 2300 people worldwide on April 30, 2004 compared to approximately 2500 on April 30, 2003. Functionally, we had 16% in sales and marketing, 27% in services, 23% in support, 22% in research and development and 12% in corporate services on April 30, 2004.
Geac today has a presence in the financial front and back offices of many of the largest companies in the world. These companies rely on our software applications for their financial and operational processing.
Geac Growth Strategy
Software Revenue Growth
Geac’s dual objectives are (i) to extend relationships with our existing customers by improving the productivity and return of our customers’ existing business processes with new products that build on our customers’ enterprise and resource planning (ERP) systems and Internet frameworks, and (ii) to attract new customers by delivering a suite
2
of software solutions that can be integrated with their existing enterprise application systems. In both cases, we aim to deliver our software solutions to the Chief Financial Officer of customers to help improve business performance utilizing their existing resources. We need to continue to identify compelling products that are consistent with our existing suite of products and then employ a combination of three strategies to aggregate those product offerings into a complimentary suite: build, buy and partner. We believe that, if we are successful in achieving these objectives, the result is likely to be an increase in new software license revenues.
Build: Organic Growth
Selling new software licenses has and will continue to play an important role in our growth strategy. During FY 2004, we continued to focus on growing our business organically along key product lines, which resulted in revenue growth in several of our legacy products with sales to both new and existing customers. To maintain revenue growth momentum, we also launched several complementary products at our recently held annual user conference, including Geac Compliance, SmartStream 7.0, and Enterprise Intelligence.
Software license sales growth has contributed to an increase in the demand for our professional services. In response, we have broadened our service offerings, expanded our delivery model, and created a “best practices” consulting group. Our integrated technology solutions deliver more value and utility to Geac’s customers by combining new products, product expansions, product integrations and practical business services.
Value for Maintenance – In Q2 FY 2004 we introduced a value-based maintenance offering, which delivers new technology to users of our mainframe software products that simplifies the web-enablement of and integration with Geac and non-Geac systems. The new program was rolled out to existing Geac E and M Series customers coming up for maintenance renewal in Q3 FY 2004. An important component of the program is an initiative that offers multiple years of support services including incentives to encourage customers to extend beyond our typical one-year maintenance contract. To date, 40 renewing E and M series customers have elected to participate in the Value For Maintenance (VFM) program representing approximately 15% of the total renewal dollars since the program was launched. An additional 18% of customers in the renewal pipeline are evaluating the program. We will continue to refine this offering as we receive customer feedback and expect more of our customers to make the transition to this program as they renew their maintenance contracts. This program has merit across many of our product lines and will be rolled out on a product-by-product basis.
Hosted Application Offering – We have expanded our delivery model by broadening the availability of our application service provider (ASP) offering across our Geac Performance Management (GPM) suite. We currently provide hosting solutions in America, Europe and Australia across a range of product lines and are also assessing the expansion of hosted offerings across additional product lines.
3
Our hosted solutions represent one of several application delivery and deployment options that we offer our customers as part of our commitment to provide customers with effective solutions that are flexible, easier to implement, and competitively priced.
Product Expansion –
Geac System21 – System21 Aurora, Geac’s next generation (ERP) system with real-time business process management capabilities, continues to attract customers for Geac in the mid-market ERP sector. During Q4 of FY 2004, System21 closed approximately 230 deals contributing to 29.2% revenue growth over the Q4 FY 2003 and 6.2% growth from FY 2004 compared to FY 2003 for this product suite. Also during the fourth quarter, System21 Aurora was enhanced with integrated reporting and analysis and budgeting functionality derived from GPM.
Geac Library Solutions – Continuing to build upon the momentum it established earlier in the year, Geac Library Solutions won a dozen new license and maintenance contracts in Q4 FY 2004, including two new name accounts for Vubis Smart, Geac’s next-generation library automation system. Revenue for FY 2004 grew by 4.5% compared to total revenue for FY 2003 for this product suite.
Geac Local Government – Focused on opportunities in Australia and New Zealand, Geac Local Government has been awarded contracts with 10 councils (municipalities or counties) during FY 2004 to replace their existing land information systems (LIS). Most recently, the City of Auburn, home to the majority of the Sydney Olympics sporting venues purchased Geac’s LIS, named Pathway PPR. In addition, the City of Melbourne acquired additional Pathway PPR modules as part of their PINS3 (Penalty Infringement Notice System) project, to expedite processing of approximately 450,000 parking tickets per year. By delivering products to meet the unique demands of government customers, revenue for FY 2004 increased by 28% compared to total revenue for FY 2003.
Buy: Growth Through Acquisitions
On August 6, 2003 we acquired Comshare, a leading provider of Business Performance Management software for planning, budgeting, forecasting, financial consolidation, management reporting and analysis - the MPC product line. Approximately 35% of our current GPM software sales pipeline is comprised of legacy Geac customers, which underscores an important component of our acquisition strategy – the ability to sell newly acquired GPM products into legacy Geac customer accounts worldwide. During FY 2004, Geac closed several GPM sales with existing customers, encompassing planning and expense management applications
GPM is an integrated product suite that enables companies to bolster their effectiveness by tightening the linkage between business strategy formulation and operational execution. GPM can be linked to a multitude of general ledger, ERP, CRM, and other applications provided by Geac and other software vendors. As part of our growth
4
strategy we have begun to integrate GPM solutions into some of our existing ERP product offerings in both the EAS and ISA segments. Our first integration occurred in Q3 FY 2004 with the Enterprise Server software and the offering is gaining traction with our Enterprise server customers. In FY 2005 we plan to complete the integration of GPM into our System21, Libraries, Local Government, and Restaurant divisions’ product suites.
In the fourth quarter, Geac announced significant new releases of the MPC and Expense Management solutions within the GPM product family. These offer customers greater functionality and flexibility – for example, the ability to submit or approve an employee expense report from any Web-enabled device.
Partner: Key Relationships
Geac leveraged its relationship with Lombardi Software and its expertise in business process design to develop a Sarbanes Oxley (SOX) compliance tool. The SOX certification cycle has created a growing demand for remediation activity as businesses try to extract value from the large dollars being spent on regulatory compliance. There are two types of SOX compliance software: applications that streamline processes and workflow allowing a company to reach scalable repeatable processes and software to assist in achieving certification. Geac offers both.
Subsequent to the year-end, Geac announced a new alliance relationship with American Express Tax and Business Services Inc. (AMEX TBS). Under terms of the agreement, AMEX TBS will now offer GPM to its North American customers. This alliance will combine the financial services expertise of AMEX TBS with the technology strengths of Geac to extend GPM to a broader audience.
Results of Operations
Three Month Period Ended April 30, 2004 Compared to the Three Month Period Ended April 30, 2003
(all tables presented are in thousands of U.S. dollars)
Revenue
|
| For the 4th quarter ended |
| $ change |
| % change |
| |||||
2004 |
| 2003 | ||||||||||
Software |
| $ | 18,387 |
| $ | 15,938 |
| $ | 2,449 |
| 15.4 | % |
Support and services |
| 93,517 |
| 81,214 |
| 12,303 |
| 15.1 | % | |||
Harware |
| 4,201 |
| 5,437 |
| (1,236 | ) | (22.7 | )% | |||
|
| $ | 116,105 |
| $ | 102,589 |
| $ | 13,516 |
| 13.2 | % |
5
Revenue for Q4 FY 2004 of $116.1 million was an increase of $13.5 million compared to $102.6 million in revenue in Q4 FY 2003. Total Q4 revenue is essentially unchanged from Geac’s Q3 FY 2004, traditionally the Company’s highest revenue quarter although it is notable that the software revenue increase replaced a portion of the low margin hardware revenue in the revenue mix. Software revenue represented $18.4 million of the fourth quarter total, a 15.4% increase over the FY 2003 quarter when software license sales generated $15.9 million. As a percentage of total revenue, software has increased from 15.5% in Q4 FY 2003 to 15.8% in Q4 FY 2004.
Revenue in the EAS segment increased $12.5 million or 17.8%, from $70.6 million in Q4 FY 2003 to $83.1 million in Q4 FY 2004. The increase was attributable to growth in both software and support and services revenue. A significant portion of the growth was the result of new product lines acquired in the Comshare acquisition in Q2 FY 2004 and the Extensity acquisition in Q4 FY 2003.
Revenue in the ISA segment increased $1.0 million or 3.0%, from $32.0 million in Q4 FY 2003 to $33.0 million in Q4 FY 2004.
Gross Profit
|
| For the 4th quarter ended |
| % change |
| ||
|
| Q4 2004 |
| Q4 2003 |
| ||
Margin on software revenue |
| 88.2 | % | 88.1 | % | 0.1 | % |
Margin on support and services revenue |
| 59.6 | % | 58.6 | % | 1.0 | % |
Margin on hardware revenue |
| 22.1 | % | 21.4 | % | 0.7 | % |
Margin on total revenue |
| 62.7 | % | 61.2 | % | 1.5 | % |
The gross profit margin for Q4 FY 2004 increased to 62.7% of revenue from 61.2% in the fourth quarter of fiscal year 2003 as a result of higher margin software revenue replacing lower margin hardware sales in the revenue mix. Included in cost of revenue in Q4 FY 2004 is $0.3 million in expenses relating to the adoption of the fair value method of accounting for stock options.
Operating Expenses
Operating expenses were $50.1 million in Q4 FY 2004, compared to $60.9 million in Q4 FY 2003. Operating expenses for Q4 FY 2003 included the impact of restructuring and goodwill impairment charges of $15.8 million. Sales and marketing, product development, and general and administrative expenses increased by $4.9 million in Q4 FY 2004 mainly as a result of the acquired Extensity and Comshare businesses and expensing of stock options.
6
|
| For the 4th quarter ended |
| $ change |
| % change |
| |||||
|
| 2004 |
| 2003 | ||||||||
Sales and marketing |
| $ | 19,379 |
| $ | 16,635 |
| $ | 2,744 |
| 16.5 | % |
Product development |
| 14,578 |
| 12,934 |
| 1,644 |
| 12.7 | % | |||
General and administrative |
| 15,411 |
| 14,945 |
| 466 |
| 3.1 | % | |||
Sales and marketing expenses increased as a percentage of revenue from 16.2% in Q4 FY 2003 to 16.7% in Q4 FY 2004. This increase reflects the ongoing investment intended to drive increased new software revenue. Included in sales and marketing expenses in Q4 FY 2004 is $0.9 million relating to the adoption of the fair value method of accounting for stock options.
Product development expenses were flat at 12.6% of revenue, from Q4 FY 2003 to Q4 FY 2004. Included in product development expenses in Q4 FY 2004 is $0.3 million relating to the adoption of the fair value method of accounting for stock options.
General and administrative expenses decreased as a percentage of revenue from 14.6% in Q4 FY 2003 to 13.3% in Q4 FY 2004. The decrease is a result of continued cost containment and cost reduction measures, offset by an increase in costs as a result of the acquired Extensity and Comshare businesses. Included in general and administrative expenses in Q4 FY 2004 is $0.9 million relating to the adoption of the fair value method of accounting for stock options.
Interest expense increased $0.3 million from $0.1 million in Q4 FY 2003 to $0.4 million in Q4 FY 2004. The increase was attributable to the amortization of the financing costs related to the credit facility obtained in FY 2004.
Other income (expense) of $0.4 million in Q4 FY 2004 was attributable to gains on foreign exchange compared to a $4.1 million loss on foreign exchange in Q4 FY 2003.
Income Taxes. The provision for income taxes was $0.5 million in Q4 FY 2004, compared to $0.3 million in Q4 FY 2003. The $0.5 million provision in Q4 FY 2004 comprised of $1.3 million of cash taxes offset by $0.8 million net recovery of future income tax assets. The $0.3 million provision in Q4 FY 2003 comprised $1.3 million of cash taxes offset by a $1.0 million net recovery of future income tax assets.
The effective tax rate for Q4 FY 2004 was 2.2%.
Net Income. The Company’s net income for Q4 FY 2004 was $22.6 million, or $0.26 per diluted share, compared with a net loss of $2.3 million, or $0.03 per diluted share in the fourth quarter of last year.
7
Results of Operations
Twelve Months Ended April 30, 2004 compared to the Twelve Months Ended April 30, 2003
(all tables presented are in thousands of U.S. dollars)
Revenue
|
| For the year ended April 30 |
| $ change from |
| % change |
| |||||
2004 |
| 2003 | ||||||||||
Software |
| $ | 65,190 |
| $ | 49,380 |
| $ | 15,810 |
| 32.0 | % |
Support and services |
| 355,019 |
| 328,472 |
| 26,547 |
| 8.1 | % | |||
Hardware |
| 25,063 |
| 30,625 |
| (5,562 | ) | -18.2 | % | |||
|
| $ | 445,272 |
| $ | 408,477 |
| $ | 36,795 |
| 9.0 | % |
Total revenue increased 9.0% to $445.3 million for FY 2004, compared to $408.5 million for the preceding year. The increase is a result of organic revenue growth and the acquisitions of Extensity and Comshare. The Company continues to execute on its strategy to increase software revenue in total revenue mix. As a percentage of total revenue, software revenue has increased from 12.1% in FY 2003 to 14.6% in FY 2004. Excluding the support revenue growth from the acquisitions of Extensity and Comshare and the effect of foreign exchange, support revenue declined $22.3 million or 9.4%. This decline was in line with our expectations. Services revenue increased $2.4 million or 2.9% in FY 2004, excluding the services revenue from the acquisitions of Extensity and Comshare. The Company shifted its focus away from the lower margin hardware business in FY 2004 and the result was a hardware revenue decrease of $5.6 million or 18.2% from FY 2003.
The Company will continue to report on its two major business segments: EAS and ISA. The software products acquired in the Comshare and Extensity transactions are components of the EAS business segment but maybe extended into the ISA business segment in FY 2005. As a result of the business integration of Comshare and Extensity into the EAS business segment, it is not possible to identify the expense components of the merged businesses separately.
8
|
| For the year ended April 30 |
| $ change from |
| % change |
| |||||
2004 |
| 2003 |
| |||||||||
EAS |
| $ | 351,259 |
| $ | 305,156 |
| $ | 46,103 |
| 15.1 | % |
ISA |
| 94,013 |
| 103,321 |
| (9,308 | ) | -9.0 | % | |||
|
| $ | 445,272 |
| $ | 408,477 |
| $ | 36,795 |
| 9.0 | % |
Revenue in the EAS segment increased $46.1 million or 15.1%, from $305.2 million in FY 2003 to $351.3 million in FY 2004. The increase was attributable to growth both in software and support and services revenue. New product lines from the Comshare and Extensity acquisitions contributed $52.2 million to the total revenue for the EAS segment and we also experienced organic growth from legacy products such as System21 Aurora. This growth was offset by a decline in ERP revenue and a decline in NTC revenue related to the sale of the Northern Ontario division.
EAS software license sales to new and existing customers, from both newly acquired and existing software, totalled $54.8 million in FY 2004 compared to $37.4 million in FY 2003. This represents an increase of $17.5 million, or 46.7% of which $2.4 million was generated from our legacy product suites. The software products acquired in the Comshare and Extensity transactions represented $15.1 million of total EAS software license sales during FY 2004.
EAS support and services revenue was $274.9 million in FY 2004, compared to $242.5 million in FY 2003. Support and services revenue generated by the Comshare and Extensity businesses represented $35.4 million of the increase in FY 2004. Therefore, excluding this revenue, there was a $3.0 million decrease attributable to support revenue and foreign exchange.
EAS hardware sales revenue was $21.6 million in FY 2004, compared to $25.3 million in FY 2003. This represents a 14.8% decline in hardware revenue. This declining trend may continue as a result of our shift of focus away from this low margin business.
Revenue in the ISA segment decreased $9.3 million or 9.0%, from $103.3 million in FY 2003 to $94.0 million in FY 2004. The $9.3 million decline was mainly attributable to:
• $9.1 million decline in the Interealty business reflecting significant price pressure and customer losses in the core Multiple Listing Service (MLS) application business and the continuing decline in revenue from the MLS book publishing business, which was expected;
• $2.2 million decline in the Restaurants business which was expected; and
• $1.3 million decline in the Construction business.
9
These declines were offset by an increase of $2.7 million in the Local Government business due to new installations and higher volumes of professional service engagements.
Gross Profit
|
| For the year ended April 30 |
| % change |
| ||
2004 |
| 2003 |
| ||||
Margin on software revenue |
| 88.2 | % | 86.8 | % | 1.4 | % |
Margin on support and services revenue |
| 58.8 | % | 58.4 | % | 0.4 | % |
Margin on hardware revenue |
| 15.7 | % | 15.5 | % | 0.2 | % |
Margin on total revenue |
| 60.7 | % | 58.6 | % | 2.1 | % |
Gross profit increased by $30.7 million, or 12.8%, from $239.4 million in FY 2003 to $270.2 million in FY 2004. Overall gross profit margins increased from 58.6% in FY 2003 to 60.7% in FY 2004 as a result of higher margin software revenue increasing as a percentage of the revenue mix, a decrease in lower margin hardware sales as a percentage of the revenue mix and cost reductions. Included in cost of revenue in FY 2004 is $0.3 million in expenses relating to the adoption of the fair value method of accounting for stock options.
Operating Expenses
Operating expenses were $197.9 million in FY 2004, compared to $185.3 million in FY 2003. Sales and marketing, product development, and general and administrative expenses increased by $26.6 million mainly as a result of the acquired Extensity and Comshare businesses and accounting for stock options adopted in the quarter. Our total operating expenses increased by 6.9% in FY 2004 compared to FY 2003; however as a percentage of total revenue operating expenses decreased from 45.4% in FY 2003 to 44.5% in FY 2004.
In accordance with accounting standards set by the Accounting Standards Board (of Canada), in the fourth quarter of fiscal year 2004, Geac elected to adopt Section 3870 (Stock-based compensation and other stock-based payments) and began recording compensation expense using the prospective method of accounting for stock options, available to companies that adopt Section 3870 in their 2004 fiscal years. Recording this compensation expense related to stock options has increased operating and cost of sales expenses in Geac’s fiscal year 2004 year-end results by approximately $2.4 million and decreased EPS by $0.03. The full-year expense was recognized in the fourth quarter; the amount per quarter going forward may be less.
10
|
| For the year ended April 30 |
| $ change |
| % change |
| |||||
2004 |
| 2003 | ||||||||||
Sales and marketing |
| $ | 74,051 |
| $ | 58,730 |
| $ | 15,321 |
| 26.1 | % |
Product development |
| 58,805 |
| 51,905 |
| 6,900 |
| 13.3 | % | |||
General and administrative |
| 62,774 |
| 58,420 |
| 4,354 |
| 7.5 | % | |||
Sales and marketing expenses increased by $15.3 million, or 26.1%, in FY 2004. As a percentage of revenue they also increased from 14.4% in FY 2003 to 16.6% in FY 2004 reflecting our ongoing investment in personnel expenses and sales and marketing costs intended to drive new software revenue. Included in sales and marketing expenses in FY 2004 is $0.9 million relating to the adoption of the fair value method of accounting for stock options.
Product development expenses increased by $6.9 million, or 13.3%, in FY 2004 and increased as a percentage of total revenue from 12.7% in FY 2003 to 13.2% in FY 2004. This increase is primarily attributable to the acquisitions of Extensity and Comshare and our focused organic growth, each of which has contributed to Geac’s strategy of build, buy and partner to generate software revenue growth. We expect product development expenses to continue at this rate as we continue to execute on our strategy. Included in product development expenses in FY 2004 is $0.3 million relating to the adoption of the fair value method of accounting for stock options.
General and administrative expenses increased by $4.4 million, or 7.5%, in FY 2004 but decreased as a percentage of total revenues from 14.3% in FY 2003 to 14.1% in FY 2004. Included in general and administrative expenses in FY 2004 is $0.9 million relating to the adoption of the fair value method of accounting for stock options. General and administrative expenses will continue to be a focus for operational efficiency and cost reductions and are expected to decline as a percentage of total revenue going forward.
Net Restructuring and Other Unusual Items. During FY 2004 the Company recorded a net reversal of $5.3 million in net restructuring and other unusual items. The net reversal for the year included $7.0 million in the release of severance, premises, litigation and other reserves set up in prior years that are no longer required. Also included in the net restructuring and other unusual items was a gain of $0.2 million resulting from the sale of assets associated with our Northern Ontario NTC division. These amounts were partially offset by a charge of $0.8 million relating to new information obtained on a lease obligation, a charge of $0.5 million for severance costs related to the restructuring of the Company’s business in North America and a charge of $0.6 million for a pension liability in its European operations.
Amortization of Intangible Assets and Goodwill Impairment. Our past acquisitions resulted in the recording of goodwill and other intangible assets that represent the
11
excess of the purchase price paid over the fair value of the net tangible assets acquired. Intangible assets are amortized over periods ranging from one to five years. Amortization of intangible assets, primarily acquired software, was $7.6 million for FY 2004, compared to $1.1 million in FY 2003. This $6.5 million increase is attributable to amortization of intangible assets associated with the Extensity and Comshare businesses, which were acquired in Q4 of FY 2003 and Q2 of FY 2004, respectively. Prior to May 1, 2001, goodwill was amortized on a straight-line basis over the estimated periods of benefit not exceeding ten years. In accordance with CICA 3062, “Goodwill and Other Intangible Assets”, goodwill is no longer amortized but is reviewed for impairment annually. The Company completed its review for potential impairment as of February 29, 2004, and concluded that there was no impairment. In the prior year the Company completed the same review and it was determined that goodwill had been impaired by $11.5 million.
Other Income (Expense). Interest expense increased by $0.8 million in FY 2004. The increase was attributable to the amortization of the financing costs related to the $50 million credit facility obtained in FY 2004.
Income Taxes. Income taxes are accounted for under the liability method, whereby future income tax assets and liabilities are recognized for temporary differences between the tax and accounting bases of assets and liabilities, as well as for the benefit of losses available to be carried forward to future years for income tax purposes. Future income tax assets are recognized only to the extent that, in the opinion of management, it is more likely than not that the future income tax assets will be realized. Future income tax assets and liabilities are measured using income tax rates applicable to apply to taxable income in the years in which those temporary differences are expected to be recovered or settled. Future income tax assets and liabilities are adjusted for the effects of changes in income tax laws and rates in the period in which the change occurs.
The provision for income taxes was $13.7 million for FY 2004, compared to $21.3 million for FY 2003. Of the total $13.7 million recorded in FY 2004, $6.0 million related to future tax expense and $7.6 million represented cash taxes. Of the total $21.3 recorded in FY 2003, $16.4 million related to future tax expense and $4.9 million represented cash taxes.
The effective tax rate for FY 2004 was 19.3%, compared to a rate of 40.1% for FY 2003. When the FY 2003 income before taxes is adjusted for the non-tax deductible goodwill impairment charge of $11.5M (discussed above), the effective rate is reduced to 33.0%.
The decrease in the effective tax rate from FY 2003 to FY 2004 is due primarily to the release of valuation allowances on future tax assets and release of reserves for tax exposures due to changes in circumstances in various subsidiaries.
Net Income. Net income was $57.2 million in FY 2004, or $0.66 per diluted share, compared to $32.0 million, or $0.39 per diluted share. We are organized globally such that many of our expenses are incurred in the same currency as our revenue, which provides a natural hedge against currency fluctuations. Compared to FY 2003,
12
currency fluctuations - primarily attributable to the British Pound Sterling, Euro, and Australian Dollar versus the U.S. Dollar – had the effect of increasing net income by $3.7 million, or $0.04 per diluted share, in FY 2004. The net impact was a combination of a positive impact on revenue of $29.3 million, and a negative impact on expenses of $25.6 million. The British Pound Sterling, Euro and Australian Dollar appreciated by approximately 10.0%, 17.3% and 24.3% respectively against the U.S. Dollar in FY 2004.
Liquidity and Financial Condition
|
| For the year ended April 30 |
| $ change |
| |||||
|
| 2004 |
| 2003 |
| from 2003 |
| |||
Cash and cash equivalents |
| $ | 112,550 |
| $ | 89,819 |
| $ | 22,731 |
|
Current assets |
| 195,192 |
| 179,128 |
| 16,064 |
| |||
Total assets |
| 406,903 |
| 332,756 |
| 74,147 |
| |||
Current liabilities |
| 232,520 |
| 240,482 |
| (7,962 | ) | |||
Total Liabilities |
| 270,832 |
| 256,586 |
| 14,246 |
| |||
Total Shareholders’ Equity |
| 136,071 |
| 76,170 |
| 59,901 |
| |||
At April 30, 2004, cash and cash equivalents (cash) totalled $112.6 million, compared to $89.8 million at April 30, 2003. Excluding an increase of $0.7 million from the effect of foreign exchange rates cash increased by $22.0 million for FY 2004 compared to FY 2003.
Total assets increased $74.1 million for FY2004 compared to FY 2003, in addition to the increase in cash and cash equivalents the majority of the remaining increase was attributable the increase in goodwill and intangible assets resulting from the acquisition of Comshare on August 5th, 2003.
Total liabilities increased $14.2 million. The majority of the increase was as a result of a defined benefit pension plan obligation of $22.3 million that was assumed as part of the acquisition of Comshare, this was offset by a decrease in accounts payable and accrued liabilities.
13
|
| For the year ended |
| $ change |
| |||||
|
| April 30 |
| from |
| |||||
|
| 2004 |
| 2003 |
| 2003 |
| |||
Net cash provided by operating activities |
| $ | 66,666 |
| $ | 29,045 |
| $ | 37,621 |
|
Net cash (used in) investing activities |
| (44,646 | ) | (23,828 | ) | (20,818 | ) | |||
Net cash provided by financing activities |
| (15 | ) | 6,588 |
| (6,603 | ) | |||
Effect of exchange rate changes on cash and cash equivalents |
| 726 |
| 4,376 |
| (3,650 | ) | |||
Net increase in cash and cash equivalents |
| $ | 22,731 |
| $ | 16,181 |
| $ | 6,550 |
|
Net cash provided by operating activities was $66.6 million in FY 2004, which is more than double the FY 2003 amount of $29.0 million. The improvement in net cash flow from operating activities was primarily due to the significant increase in net income for the year. Balance sheet changes for non-cash working capital are affected significantly by acquisitions.
Net cash used in investing activities was $44.6 million in FY 2004 compared to $23.8 million in FY 2003. The increase in investing activities is due to the acquisition of Comshare of $39.1 million compared to the net acquisition of Extensity and EBC of $22.7 million in the prior year. Higher capital asset acquisitions of $1.6 million and deferred financing costs of $2.8 million also increased the investing activities.
Cash provided by financing activities was $0.1 million in FY 2004 compared to $6.6 million in FY 2003. In FY 2004 the Company received $2.8 million in proceeds from stock options exercised offset by $2.7 million repayment of long-term debt.
14