
Searchable text section of graphics shown above
Continuing the Momentum:
Financial, Operational, Strategic
C. Kent Jespersen
Non-Executive Chairman
Thomas I.A. Allen
Chairman, Corporate Governance
and Nominating Committee
Charles S. Jones
Chief Executive Officer
August 26, 2005
[LOGO]
Forward Looking Statement Disclaimer
This discussion includes forward-looking statements of Geac’s intentions, beliefs, expectations and predictions for the future These forward-looking statements may include use of the future tense with words such as “will,” “may,” “intends,” “anticipates,” “expects” and similar conditional or forward-looking words and phrases. These forward-looking statements are neither promises nor guarantees. They are only predictions that are subject to risks and uncertainties, and they may differ materially from actual future events or results. Geac undertakes no obligation to update or revise the information presented today and Geac disclaims any obligation to update any such forward-looking statements after today’s date. Among the risks and uncertainties that could cause a material difference between these forward-looking statements and actual events include, among other things:
• our ability to increase revenues from new license sales, cross-sell into our existing customer base and reduce customer attrition;
• whether we can identify and acquire synergistic businesses and, if so, whether we can successfully integrate them into our existing operations;
• whether we are able to deliver products and services within required time frames and budgets to meet increasingly competitive customer demands and performance guaranties;
• risks inherent in fluctuating international currency exchange rates in light of our global operations and the unpredictable effect of geopolitical world and local events;
• whether we are successful in our continued efforts to manage expenses effectively and maintain profitability;
• our ability to achieve revenue from products and services that are under development; and
• the uncertain effect of the competitive environment in which we operate and resulting pricing pressures.
These and other potential risks and uncertainties that relate to Geac’s business and operations are summarized in more detail from time to time in our filings with the United States Securities and Exchange Commission and with the Canadian Securities Administrators, including Geac’s most recent quarterly reports available through the website maintained by the SEC at www.sec.gov and through the website maintained by the Canadian Securities Administrators and the Canadian Depository for Securities Limited at www.sedar.com for more information on risk factors that could cause actual results to differ from the statements discussed today.
[GRAPHIC] |
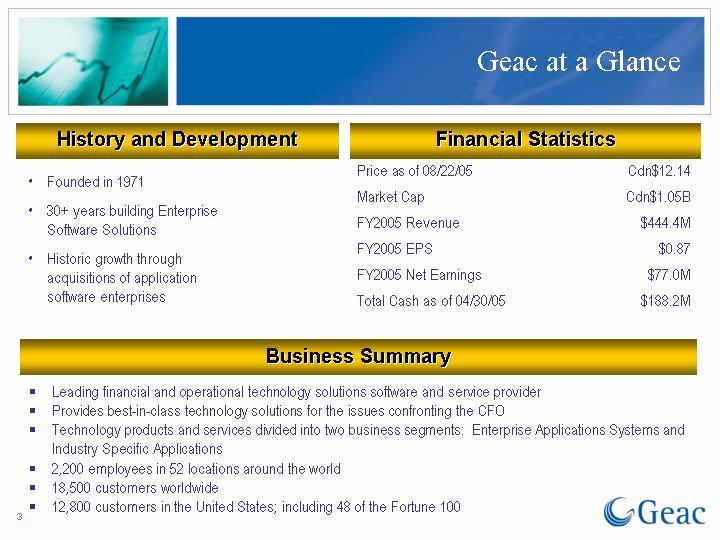
| Geac at a Glance |
History and Development
• Founded in 1971
• 30+ years building Enterprise Software Solutions
• Historic growth through acquisitions of application software enterprises
Financial Statistics
Price as of 08/22/05 |
| Cdn$ | 12.14 |
| |
Market Cap |
| Cdn$ | 1.05B |
| |
FY2005 Revenue |
| $ | 444.4M |
| |
FY2005 EPS |
| $ | 0.87 |
| |
FY2005 Net Earnings |
| $ | 77.0M |
| |
Total Cash as of 04/30/05 |
| $ | 188.2M |
| |
Business Summary
• Leading financial and operational technology solutions software and service provider
• Provides best-in-class technology solutions for the issues confronting the CFO
• Technology products and services divided into two business segments: Enterprise Applications Systems and Industry Specific Applications
• 2,200 employees in 52 locations around the world
• 18,500 customers worldwide
• 12,800 customers in the United States; including 48 of the Fortune 100
3
| Geac’s Transformation |
Geac has delivered for shareholders. Since 2003 we have:
• Strengthened our executive team
• Acquired and integrated two key businesses
• Reduced costs
• Penetrated and entered new markets
• Driven new revenue through product and marketing innovation
Actions taken by current leadership have resulted in dramatically improved financial results
4
|
| Significant Performance Improvement |
During the past two fiscal years, a period that closely tracks the tenure of Geac’s current leadership team:
• Net earnings have increased 141%, to $77.0 million ($0.87 per diluted share), up from $31.9 million ($0.39 per diluted share)
• EBITDA margin increased to 22.5% from 16.1%
• Cash and equivalents more than doubled to $188.2 million from $89.8 million.
5
|
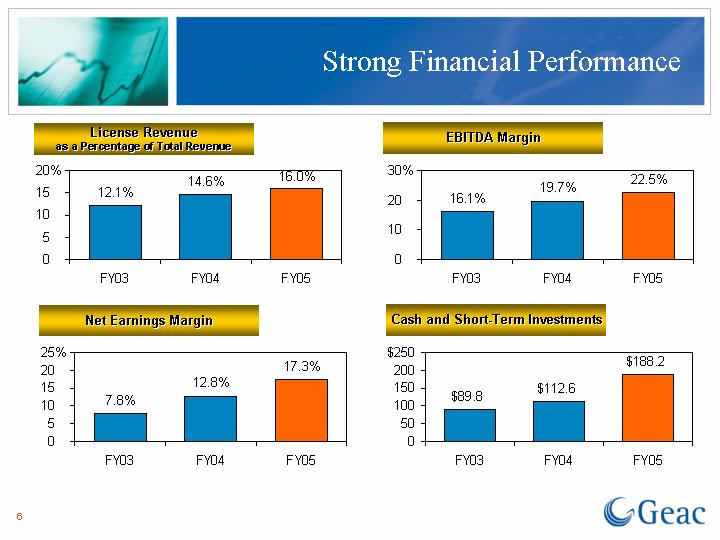
| Strong Financial Performance |
License Revenue as a Percentage of Total Revenue
[CHART]
Net Earnings Margin
[CHART]
EBITDA Margin
[CHART]
Cash and Short-Term Investments
[CHART]
6
|
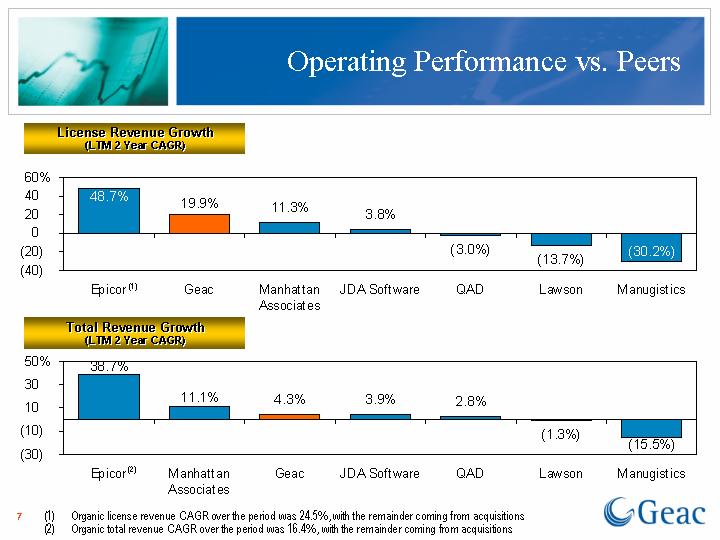
| Operating Performance vs. Peers |
License Revenue Growth
(LTM 2 Year CAGR)
[CHART]
Total Revenue Growth
(LTM 2 Year CAGR)
[CHART]
(1) | Organic license revenue CAGR over the period was 24.5%, with the remainder coming from acquisitions |
(2) | Organic total revenue CAGR over the period was 16.4%, with the remainder coming from acquisitions |
7
|
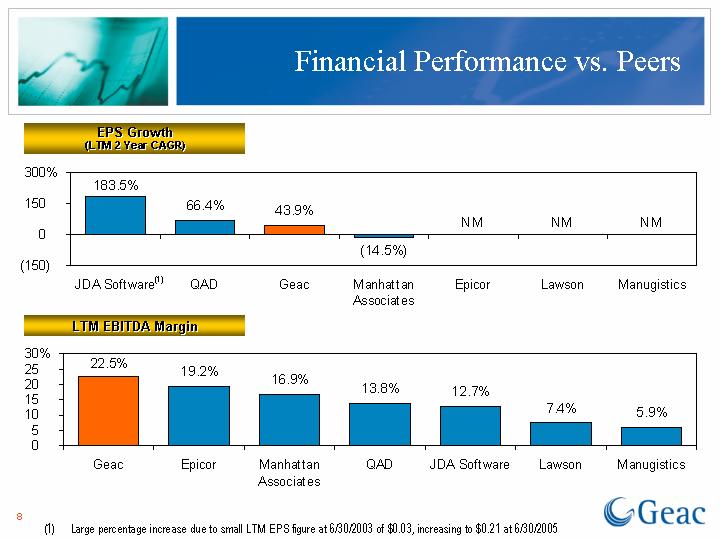
| Financial Performance vs. Peers |
EPS Growth
(LTM 2 Year CAGR)
[CHART]
LTM EBITDA Margin
[CHART]
(1) Large percentage increase due to small LTM EPS figure at 6/30/2003 of $0.03, increasing to $0.21 at 6/30/2005
8
|
| Outstanding Stock Performance |
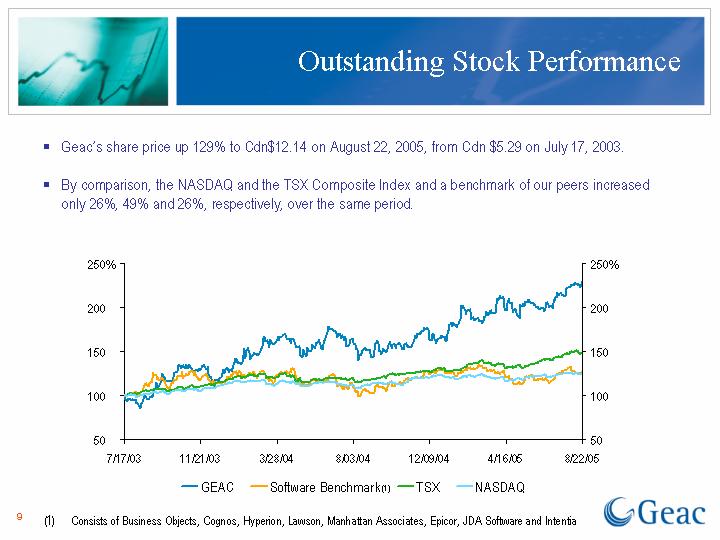
• Geac’s share price up 129% to Cdn$12.14 on August 22, 2005, from Cdn $5.29 on July 17, 2003.
• By comparison, the NASDAQ and the TSX Composite Index and a benchmark of our peers increased only 26%, 49% and 26%, respectively, over the same period.
[CHART]
(1) Consists of Business Objects, Cognos, Hyperion, Lawson, Manhattan Associates, Epicor, JDA Software and Intentia
9
Continue to Build Revenue Growth Engine
• Expand and integrate offerings
• Sell solutions, not just products
Additional Cost Reductions
• Target: reduce support and development costs an additional 30% over 2 years
Strategic Acquisitions
• Increase competitiveness
• Grow license revenue base
• Add scale
10
|
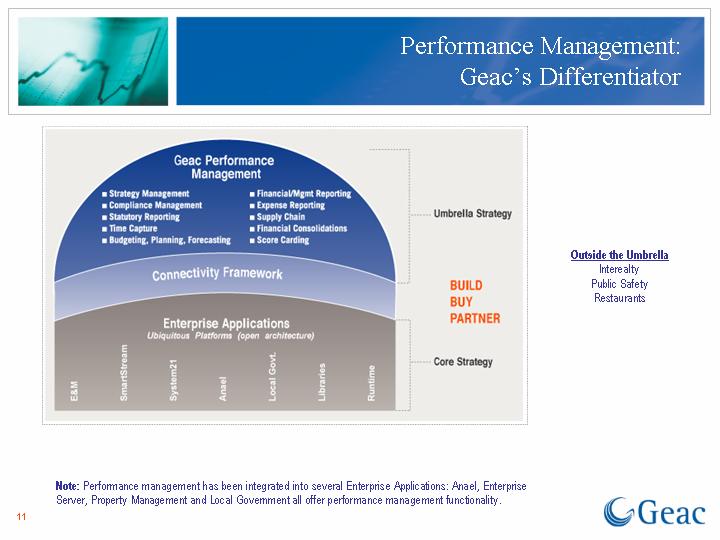
| Performance Management: |
BUILD BUY PARTNER
Geac Performance Management
Umbrella Strategy
• Strategy Management
• Compliance Management
• Statutory Reporting
• Time Capture
• Budgeting, Planning, Forecasting
• Financial/Mgmt Reporting
• Expense Reporting
• Supply Chain
• Financial Consolidations
• Score Carding
Connectivity Framework
Enterprise Applications
Ubiquitous Platforms (open architecture)
Core Strategy
E&M | SmartStream | System21 | Anael | Local Govt. | Libraries | Runtime |
Outside the Umbrella
Interealty
Public Safety
Restaurants
Note: Performance management has been integrated into several Enterprise Applications: Anael, Enterprise Server, Property Management and Local Government all offer performance management functionality.
11
|
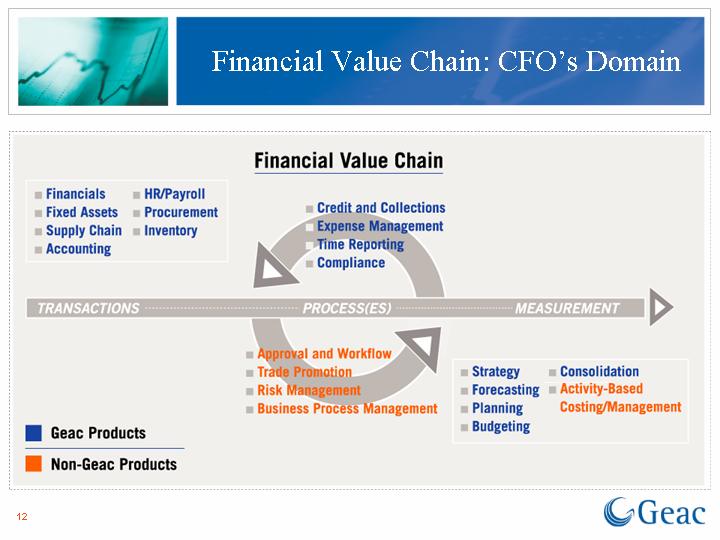
| Financial Value Chain: CFO’s Domain |
Financial Value Chain
• Financials | • HR/Payroll |
| • Credit and Collections |
|
• Fixed Assets | • Procurement |
| • Expense Management |
|
• Supply Chain | • Inventory |
| • Time Reporting |
|
• Accounting |
|
| • Compliance |
|
TRANSACTIONS |
| PROCESS(ES) |
| MEASUREMENT |
|
|
| • Approval and Workflow |
|
|
|
|
|
|
| • Trade Promotion |
| • Strategy | • Consolidation |
|
|
|
| • Risk Management |
| • Forecasting | • Activity-Based |
|
|
|
| • Business Process Management |
| • Planning | Costing/Management |
|
|
|
|
|
| • Budgeting |
|
|
12
|
| Revenue Growth Engines |
Continue to build new products internally
Increase maintenance revenue by replicating success of Aurora into other product lines
Target additional sales of integrated products
Cross-sell products into existing client base
Build on domain expertise (government, financial services, specialty retail, healthcare)
13
|
| Recent Successes |
Organic growth engine beginning to take hold
• 28% of new licenses in the fourth quarter were new products
• Multiple products being integrated into single solutions
• Multi-product solutions have been sold to Apparel retailers such as Animal and VF Europe, incorporating Runtime, System21 and MPC. These unique solutions, which consist of ERP, CRM, PLM and Budgeting/Planning meet this industry’s needs.
Value for Maintenance Program has resulted in maintenance attrition under 10%
System21 Aurora Project has revitalized System21, and extended its lifecycle
Bundling of products and cross-selling is driving more revenue synergies
14
|
| Continuing Focus on Cost Reduction |
Targeting Development and Sales/Marketing expenses for additional improvement
• Combine certain products for added efficiencies
• Combine support and R&D functions in certain legacy product lines
Assessing implementation of cost-saving programs for customer service and R&D
Continue to increase efficiency of development spending
• Offshore significantly more R&D and some support functions to lower-cost countries
Product group consolidation
Additional real estate savings
15
|
| Acquisition Strategy |
Business Intelligence Platform
• We are currently platform agnostic
Performance Management Applications
• Fill in the Financial Value Chain (e.g., Activity-Based Costing)
Consolidation of another ERP Company
Current Management and Board are disciplined and prudent buyers
16
|
| Geac Board Nominees: |
Our Board is independent, strong, highly experienced, and along with our management team, dedicated to supporting Geac’s success through responsible and well-considered strategic actions that create and return value to all shareholders.
C. Kent Jespersen
Chairman of the Board, Geac
Chairman, La Jolla Resources International Ltd.
Thomas I.A. Allen, Q.C.
Senior Partner, Ogilvy Renault
David Friend
General Partner, Orchid Partners
Pierre MacDonald
Chairman and Chief Executive Officer, MacD Consult Inc.
Michael D. Marvin
Founder and Chairman Emeritus, MapInfo Corporation
William G. Nelson
Private Investor
Geac’s 10th largest shareholder
Robert L. Sillcox
Cofounder and former Chairman, Quant Investment Strategies Inc.
Charles S. Jones
President and Chief Executive Officer, Geac
17
|
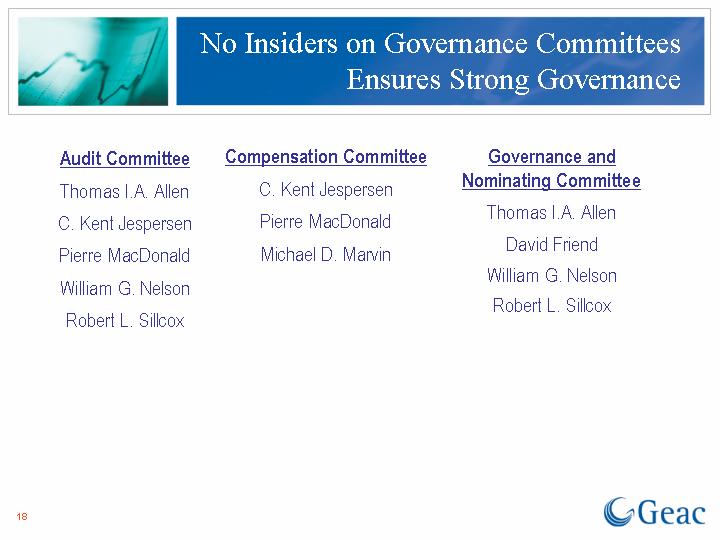
| No Insiders on Governance Committees |
Audit Committee |
| Compensation Committee |
| Governance and Nominating Committee |
Thomas I.A. Allen |
| C. Kent Jespersen |
| Thomas I.A. Allen |
C. Kent Jespersen |
| Pierre MacDonald |
| David Friend |
Pierre MacDonald |
| Michael D. Marvin |
| William G. Nelson |
William G. Nelson |
|
|
| Robert L. Sillcox |
Robert L. Sillcox |
|
|
|
|
18
|
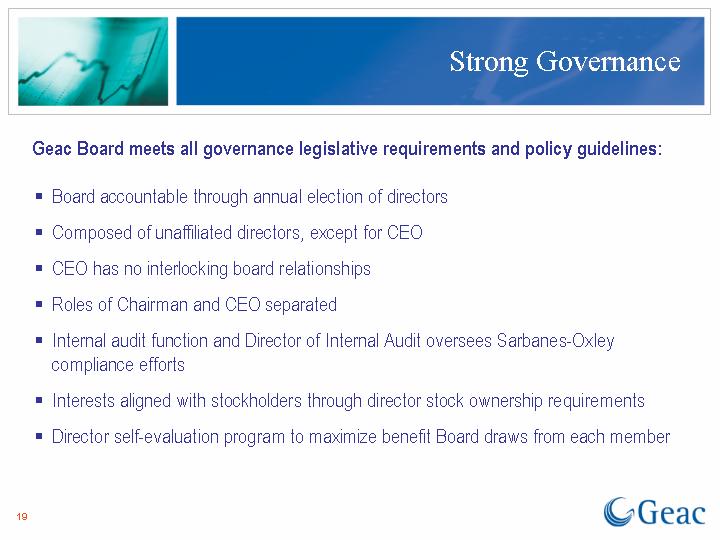
| Strong Governance |
Geac Board meets all governance legislative requirements and policy guidelines:
• Board accountable through annual election of directors
• Composed of unaffiliated directors, except for CEO
• CEO has no interlocking board relationships
• Roles of Chairman and CEO separated
• Internal audit function and Director of Internal Audit oversees Sarbanes-Oxley compliance efforts
• Interests aligned with stockholders through director stock ownership requirements
• Director self-evaluation program to maximize benefit Board draws from each member
19
|
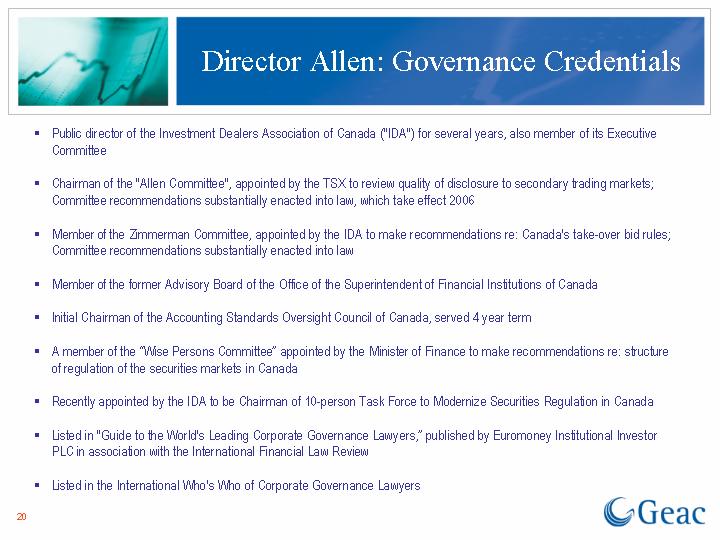
| Director Allen: Governance Credentials |
• Public director of the Investment Dealers Association of Canada (“IDA”) for several years, also member of its Executive Committee
• Chairman of the “Allen Committee”, appointed by the TSX to review quality of disclosure to secondary trading markets; Committee recommendations substantially enacted into law, which take effect 2006
• Member of the Zimmerman Committee, appointed by the IDA to make recommendations re: Canada’s take-over bid rules; Committee recommendations substantially enacted into law
• Member of the former Advisory Board of the Office of the Superintendent of Financial Institutions of Canada
�� Initial Chairman of the Accounting Standards Oversight Council of Canada, served 4 year term
• A member of the “Wise Persons Committee” appointed by the Minister of Finance to make recommendations re: structure of regulation of the securities markets in Canada
• Recently appointed by the IDA to be Chairman of 10-person Task Force to Modernize Securities Regulation in Canada
• Listed in “Guide to the World’s Leading Corporate Governance Lawyers,” published by Euromoney Institutional Investor PLC in association with the International Financial Law Review
• Listed in the International Who’s Who of Corporate Governance Lawyers
20
|
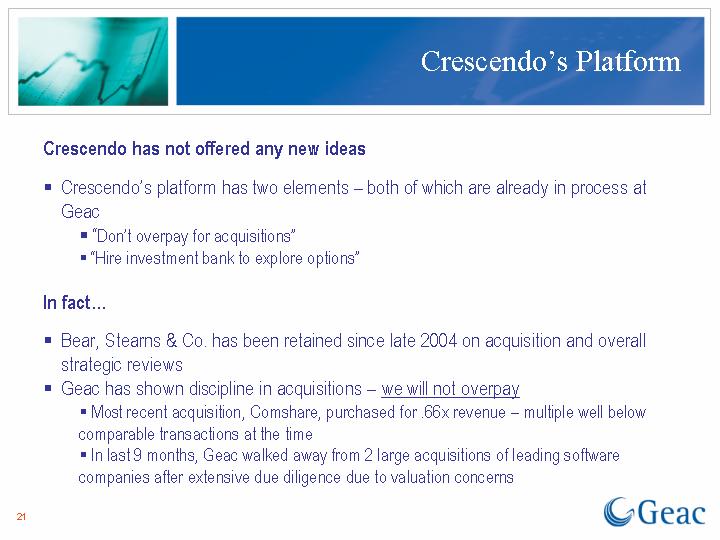
| Crescendo’s Platform |
Crescendo has not offered any new ideas
• Crescendo’s platform has two elements – both of which are already in process at Geac
• “Don’t overpay for acquisitions”
• “Hire investment bank to explore options”
In fact…
• Bear, Stearns & Co. has been retained since late 2004 on acquisition and overall strategic reviews
• Geac has shown discipline in acquisitions – we will not overpay
• Most recent acquisition, Comshare, purchased for .66x revenue – multiple well below comparable transactions at the time
• In last 9 months, Geac walked away from 2 large acquisitions of leading software companies after extensive due diligence due to valuation concerns
21
|
| Proven Leadership Delivering |
Geac’s current leadership has proven itself, and the company is well positioned to continue to deliver superior shareholder value:
• Dramatic improvement in financial performance
• Stock price significantly outperforming all peers and indices
• Independent Board with strong governance structure
• Current leadership will continue to act in best interests of ALL shareholders
22
|
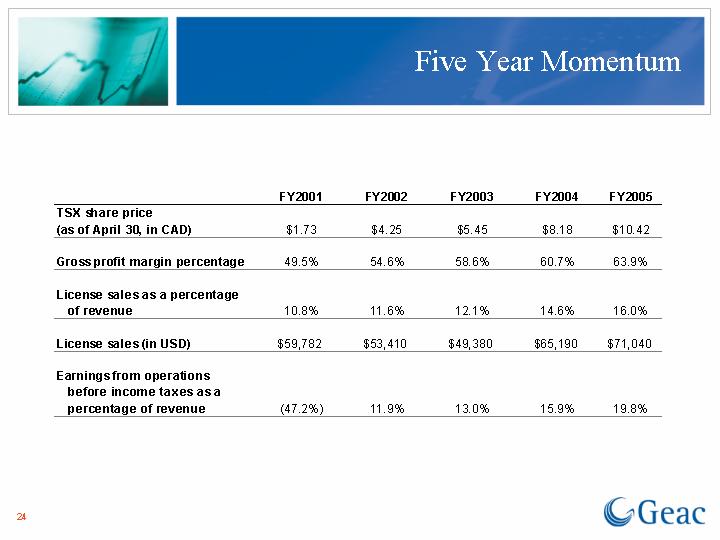
| Five Year Momentum |
|
| FY2001 |
| FY2002 |
| FY2003 |
| FY2004 |
| FY2005 |
| |||||
TSX share price |
|
|
|
|
|
|
|
|
|
|
| |||||
(as of April 30, in CAD) |
| $ | 1.73 |
| $ | 4.25 |
| $ | 5.45 |
| $ | 8.18 |
| $ | 10.42 |
|
|
|
|
|
|
|
|
|
|
|
|
| |||||
Gross profit margin percentage |
| 49.5 | % | 54.6 | % | 58.6 | % | 60.7 | % | 63.9 | % | |||||
|
|
|
|
|
|
|
|
|
|
|
| |||||
License sales as a percentage of revenue |
| 10.8 | % | 11.6 | % | 12.1 | % | 14.6 | % | 16.0 | % | |||||
|
|
|
|
|
|
|
|
|
|
|
| |||||
License sales (in USD) |
| $ | 59,782 |
| $ | 53,410 |
| $ | 49,380 |
| $ | 65,190 |
| $ | 71,040 |
|
|
|
|
|
|
|
|
|
|
|
|
| |||||
Earnings from operations before income taxes as a percentage of revenue |
| (47.2 | )% | 11.9 | % | 13.0 | % | 15.9 | % | 19.8 | % | |||||
24
|
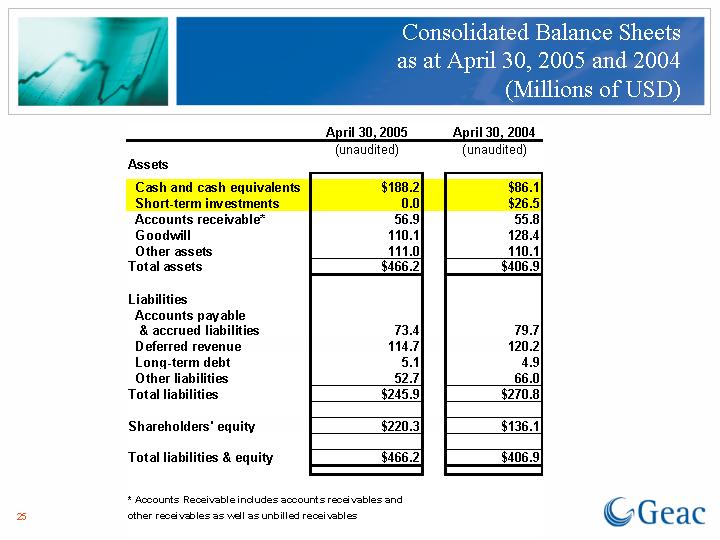
| Consolidated Balance Sheets |
|
| April 30, 2005 |
| April 30, 2004 |
| ||
|
| (unaudited) |
| (unaudited) |
| ||
Assets |
|
|
|
|
| ||
Cash and cash equivalents |
| $ | 188.2 |
| $ | 86.1 |
|
Short-term investments |
| 0.0 |
| $ | 26.5 |
| |
Accounts receivable* |
| 56.9 |
| 55.8 |
| ||
Goodwill |
| 110.1 |
| 128.4 |
| ||
Other assets |
| 111.0 |
| 110.1 |
| ||
Total assets |
| $ | 466.2 |
| $ | 406.9 |
|
|
|
|
|
|
| ||
Liabilities |
|
|
|
|
| ||
Accounts payable & accrued liabilities |
| 73.4 |
| 79.7 |
| ||
Deferred revenue |
| 114.7 |
| 120.2 |
| ||
Long-term debt |
| 5.1 |
| 4.9 |
| ||
Other liabilities |
| 52.7 |
| 66.0 |
| ||
Total liabilities |
| $ | 245.9 |
| $ | 270.8 |
|
|
|
|
|
|
| ||
Shareholders’ equity |
| $ | 220.3 |
| $ | 136.1 |
|
|
|
|
|
|
| ||
Total liabilities & equity |
| $ | 466.2 |
| $ | 406.9 |
|
* Accounts Receivable includes accounts receivables and other receivables as well as unbilled receivables
25
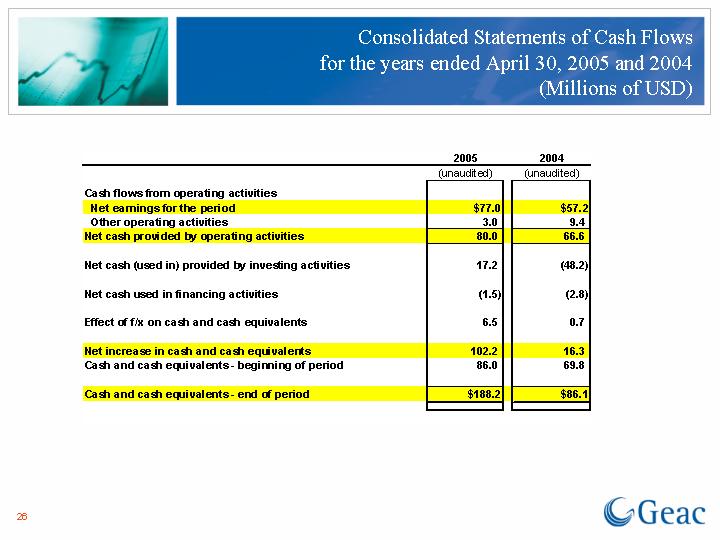
|
| Consolidated Statements of Cash Flows |
|
| 2005 |
| 2004 |
| ||
|
| (unaudited) |
| (unaudited) |
| ||
Cash flows from operating activities |
|
|
|
|
| ||
Net earnings for the period |
| $ | 77.0 |
| $ | 57.2 |
|
Other operating activities |
| 3.0 |
| 9.4 |
| ||
Net cash provided by operating activities |
| 80.0 |
| 66.6 |
| ||
|
|
|
|
|
| ||
Net cash (used in) provided by investing activities |
| 17.2 |
| (48.2 | ) | ||
|
|
|
|
|
| ||
Net cash used in financing activities |
| (1.5 | ) | (2.8 | ) | ||
|
|
|
|
|
| ||
Effect of f/x on cash and cash equivalents |
| 6.5 |
| 0.7 |
| ||
|
|
|
|
|
| ||
Net increase in cash and cash equivalents |
| 102.2 |
| 16.3 |
| ||
Cash and cash equivalents - beginning of period |
| 86.0 |
| 69.8 |
| ||
|
|
|
|
|
| ||
Cash and cash equivalents - end of period |
| $ | 188.2 |
| $ | 86.1 |
|
26
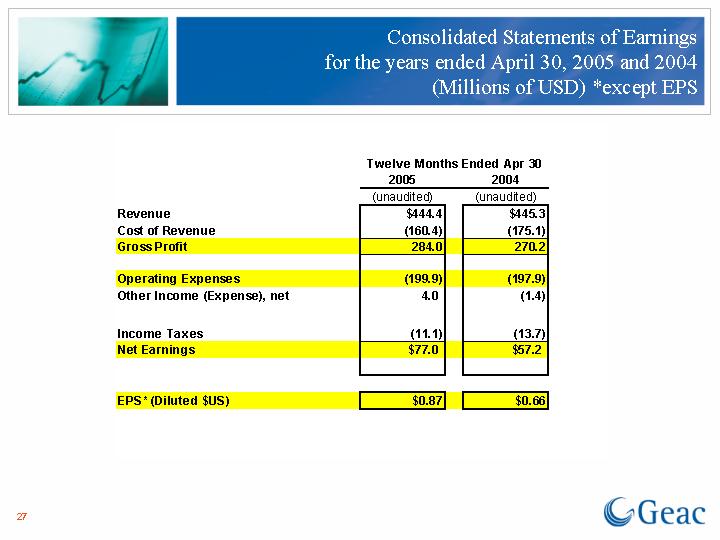
|
| Consolidated Statements of Earnings |
|
| Twelve Months Ended Apr 30 |
| ||||
|
| 2005 |
| 2004 |
| ||
|
| (unaudited) |
| (unaudited) |
| ||
Revenue |
| $ | 444.4 |
| $ | 445.3 |
|
Cost of Revenue |
| (160.4 | ) | (175.1 | ) | ||
Gross Profit |
| 284.0 |
| 270.2 |
| ||
|
|
|
|
|
| ||
Operating Expenses |
| (199.9 | ) | (197.9 | ) | ||
Other Income (Expense), net |
| 4.0 |
| (1.4 | ) | ||
|
|
|
|
|
| ||
Income Taxes |
| (11.1 | ) | (13.7 | ) | ||
Net Earnings |
| $ | 77.0 |
| $ | 57.2 |
|
|
|
|
|
|
| ||
EPS* (Diluted $US) |
| $ | 0.87 |
| $ | 0.66 |
|
27
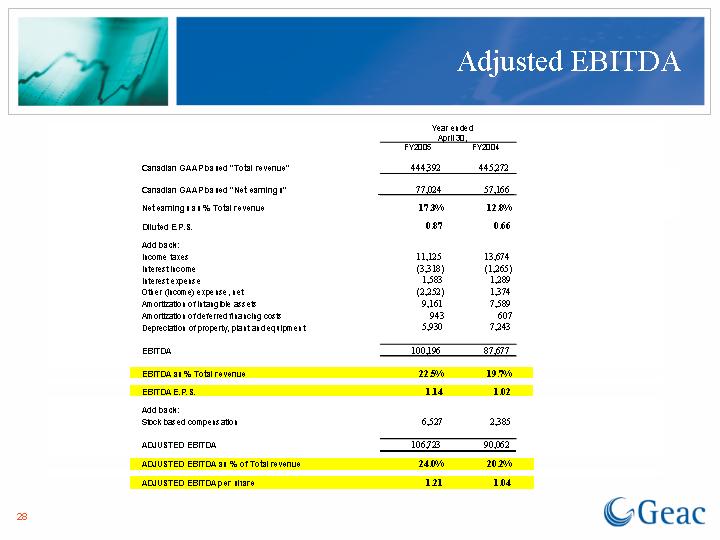
|
| Adjusted EBITDA |
|
| Year ended |
| ||
|
| April 30, |
| ||
|
| FY2005 |
| FY2004 |
|
|
|
|
|
|
|
Canadian GAAP based “Total revenue” |
| 444,392 |
| 445,272 |
|
|
|
|
|
|
|
Canadian GAAP based “Net earnings” |
| 77,024 |
| 57,166 |
|
|
|
|
|
|
|
Net earnings as % Total revenue |
| 17.3 | % | 12.8 | % |
|
|
|
|
|
|
Diluted E.P.S. |
| 0.87 |
| 0.66 |
|
|
|
|
|
|
|
Add back: |
|
|
|
|
|
Income taxes |
| 11,125 |
| 13,674 |
|
Interest income |
| (3,318 | ) | (1,265 | ) |
Interest expense |
| 1,583 |
| 1,289 |
|
Other (income) expense, net |
| (2,252 | ) | 1,374 |
|
Amortization of intangible assets |
| 9,161 |
| 7,589 |
|
Amortization of deferred financing costs |
| 943 |
| 607 |
|
Depreciation of property, plant and equipment |
| 5,930 |
| 7,243 |
|
|
|
|
|
|
|
EBITDA |
| 100,196 |
| 87,677 |
|
|
|
|
|
|
|
EBITDA as % Total revenue |
| 22.5 | % | 19.7 | % |
|
|
|
|
|
|
EBITDA E.P.S. |
| 1.14 |
| 1.02 |
|
|
|
|
|
|
|
Add back: |
|
|
|
|
|
Stock based compensation |
| 6,527 |
| 2,385 |
|
|
|
|
|
|
|
ADJUSTED EBITDA |
| 106,723 |
| 90,062 |
|
|
|
|
|
|
|
ADJUSTED EBITDA as % of Total revenue |
| 24.0 | % | 20.2 | % |
|
|
|
|
|
|
ADJUSTED EBITDA per share |
| 1.21 |
| 1.04 |
|
28