UNITED STATES SECURITIES AND EXCHANGE COMMISSION
Washington, D.C. 20549
Form 10-K
| | | | | | | | |
| ☒ | ANNUAL REPORT PURSUANT TO SECTION 13 OR 15(d) OF THE SECURITIES EXCHANGE ACT OF 1934 |
| For the fiscal year ended | December 31, 2024 |
| or | |
| | | | | |
| ☐ | TRANSITION REPORT PURSUANT TO SECTION 13 OR 15(d) OF THE SECURITIES EXCHANGE ACT OF 1934 |
| For the transition period from to |
Commission File Number 001-33462
INSULET CORPORATION
(Exact name of Registrant as specified in its charter)
| | | | | | | | | | | | | | | | | |
| Delaware | | 04-3523891 |
| (State or Other Jurisdiction of
Incorporation or Organization) | | (I.R.S. Employer
Identification No.) |
| | | | |
| 100 Nagog Park | Acton | Massachusetts | | 01720 |
| (Address of Principal Executive Offices)
| | (Zip Code) |
Registrant’s telephone number, including area code: (978) 600-7000
Securities registered pursuant to Section 12(b) of the Act:
| | | | | | | | |
| Title of Each Class | Trading Symbol(s) | Name of Each Exchange on Which Registered |
| Common Stock, $0.001 Par Value Per Share | PODD | The NASDAQ Stock Market, LLC |
| | |
Securities registered pursuant to Section 12(g) of the Act: None
Indicate by check mark if the registrant is a well-known seasoned issuer, as defined in Rule 405 of the Securities Act. Yes x No ¨
Indicate by check mark if the registrant is not required to file reports pursuant to Section 13 or Section 15(d) of the Act. Yes ¨ No x
Indicate by check mark whether the registrant (1) has filed all reports required to be filed by Section 13 or 15(d) of the Securities Exchange Act of 1934 during the preceding 12 months (or for such shorter period that the Registrant was required to file such reports) and (2) has been subject to such filing requirements for the past 90 days. Yes x No ¨
Indicate by check mark whether the registrant has submitted electronically every Interactive Data File required to be submitted pursuant to Rule 405 of Regulation S-T (§ 232.405 of this chapter) during the preceding 12 months (or for such shorter period that the registrant was required to submit and post such files). Yes x No ¨
Indicate by check mark whether the registrant is a large accelerated filer, an accelerated filer, a non-accelerated filer, or a smaller reporting company. See the definitions of “large accelerated filer,” “accelerated filer,” “smaller reporting company,” and “emerging growth company” in Rule 12b-2 of the Exchange Act.
| | | | | | | | | | | | | | |
| Large accelerated filer | x | | Non-accelerated filer | ¨ |
| | | | |
| Accelerated filer | ¨ | | Smaller reporting company | ☐ |
| | | | |
| | | Emerging growth company | ☐ |
If an emerging growth company, indicate by check mark if the registrant has elected not to use the extended transition period for complying with any new or revised financial accounting standards provided pursuant to Section 13(a) of the Exchange Act. ¨
Indicate by check mark whether the registrant has filed a report on and attestation to its management’s assessment of the effectiveness of its internal control over financial reporting under Section 404(b) of the Sarbanes-Oxley Act (15 U.S.C. 7262(b)) by the registered public accounting firm that prepared or issued its audit report. ☒
If securities are registered pursuant to Section 12(b) of the Act, indicate by check mark whether the financial statements of the registrant included in the filing reflect the correction of an error to previously issued financial statements. ¨
Indicate by check mark whether any of those error corrections are restatements that required a recovery analysis of incentive-based compensation received by any of the registrant’s executive officers during the relevant recovery period pursuant to §240.10D-1(b). ¨
Indicate by check mark whether the Registrant is a shell company (as defined in Rule 12b-2 of the Act). Yes ☐ No ☒
The aggregate market value of the common stock held by non-affiliates of the registrant computed by reference to the last reported sale price of the Common Stock as reported on The NASDAQ Global Market on June 30, 2024 was approximately $14.1 billion.
The number of shares of common stock outstanding as of February 13, 2025 was 70,226,104.
DOCUMENTS INCORPORATED BY REFERENCE
The registrant intends to file a proxy statement pursuant to Regulation 14A within 120 days of the end of the fiscal year ended December 31, 2024. Portions of such proxy statement are incorporated by reference into Part III of this Annual Report on Form 10-K.
TABLE OF CONTENTS
| | | | | | | | |
| | |
| Item 1 | | |
| Item 1A | | |
| Item 1B | | |
| Item 1C | | |
| Item 2 | | |
| Item 3 | | |
| Item 4 | | |
| | |
| | |
| Item 5 | | |
| Item 6 | | |
| Item 7 | | |
| Item 7A | | |
| Item 8 | | |
| Item 9 | | |
| Item 9A | | |
| Item 9B | | |
| | |
| | |
| Item 10 | | |
| Item 11 | | |
| Item 12 | | |
| Item 13 | | |
| Item 14 | | |
| | |
| | |
| Item 15 | | |
| Item 16 | | |
| | |
| | |
PART I
Item 1. Business
Overview
Insulet Corporation (“we” or the “Company”) is primarily engaged in the development, manufacture, and sale of its proprietary continuous insulin delivery systems for people with insulin-dependent diabetes. The Omnipod platform includes: the Omnipod® 5 Automated Insulin Delivery System (“Omnipod 5”), the Omnipod DASH® Insulin Management System (“Omnipod DASH”), and the Omnipod Insulin Management System (“Classic Omnipod”).
We also produce pods for Amgen for use in the Neulasta® Onpro® kit, a delivery system for Amgen’s Neulasta to help reduce the risk of infection after intense chemotherapy.
Market Opportunity: Management of Diabetes
Diabetes is a chronic, life-threatening disease for which there is no known cure. It is caused by the body’s inability to produce or effectively utilize the hormone insulin, which prevents the body from adequately regulating blood glucose levels. Glucose, the primary source of energy for cells, must be maintained at certain concentrations in the blood in order to permit optimal cell function and health. In people with diabetes, blood glucose levels fluctuate between very high levels, a condition known as hyperglycemia, and very low levels, a condition called hypoglycemia. Hyperglycemia can lead to serious short-term complications, such as confusion, vomiting, dehydration, and loss of consciousness and long-term complications, such as blindness, kidney disease, nervous system disease, occlusive vascular diseases, stroke, cardiovascular disease, or death. Hypoglycemia can lead to confusion, loss of consciousness, or death.
Diabetes is typically classified as either type 1 or type 2:
•Type 1 diabetes is characterized by the body’s nearly complete inability to produce insulin. It is diagnosed throughout the age spectrum, with over half of newly diagnosed cases occurring in adulthood. Individuals with type 1 diabetes require daily insulin therapy to survive. We estimate that approximately 5 million people have type 1 diabetes in the countries we currently serve.
•Type 2 diabetes, the more common form, is characterized by the body’s inability to either properly utilize insulin or produce enough insulin. Historically, type 2 diabetes has occurred in later adulthood, but its incidence is increasing among the younger population, due primarily to increasing obesity. Initially, many people with type 2 diabetes attempt to manage their diabetes with improvements in diet, exercise, and/or medications, both oral and injectable, including SGLT2 inhibitors and GLP-1 drugs. As their diabetes advances, some individuals progress to multiple drug therapies, which often include insulin therapy. People with type 2 diabetes who take insulin either require intensive insulin therapy (typically multiple injections of insulin per day) or basal (long-acting) insulin (typically a single injection daily or weekly). We estimate that approximately 6 million people have insulin-intensive type 2 diabetes in the countries we currently serve and another 3 million people with type 2 diabetes in the United States require only long-acting insulin.
We estimate that approximately 40% of the type 1 diabetes population in the United States and 20% of the international type 1 diabetes population use insulin pump therapy. An even smaller portion of the U.S. and international insulin-intensive type 2 diabetes population and the U.S. basal only insulin type 2 population use insulin pump therapy. We believe these factors present a significant available market for our Omnipod platform globally.
Throughout this Annual Report on Form 10-K, we refer to both type 1 diabetes and insulin-intensive type 2 diabetes as insulin-dependent diabetes.
Diabetes Management Challenges
Diabetes is often frustrating and difficult for people to manage. Blood glucose levels can be affected by the carbohydrate and fat content of meals, exercise, stress, illness, impending illness, hormonal releases, variability in insulin absorption, and changes in the effects of insulin on the body. For people with insulin-dependent diabetes, many corrections, consisting of the administration of additional insulin or ingestion of additional carbohydrates, are needed throughout the day in order to maintain blood glucose levels within normal ranges. Achieving this result can be very difficult with multiple daily injections of insulin. Individuals with diabetes attempting to control their blood glucose levels tightly to prevent the long-term complications associated with fluctuations in blood glucose levels are at greater risk for overcorrection and hypoglycemia. Additionally, the time spent managing fluctuations in blood glucose levels and the fear associated with hypoglycemia can be incredibly stressful for individuals with diabetes and their families.
Current Insulin Therapy
People with insulin-dependent diabetes need a continuous supply of insulin, known as basal insulin, for background metabolic needs. In addition to basal insulin, people with insulin-dependent diabetes require supplemental insulin, known as bolus insulin, to compensate for carbohydrates ingested during meals or snacks or for a high blood glucose level caused by other physiological reasons. There are two primary types of insulin therapy practiced today: multiple daily injection (“MDI”) therapy using syringes or insulin pens and pump therapy using insulin pumps.
MDI therapy involves injecting fast-acting insulin before meals (bolus) to lower blood glucose levels to a healthy range. MDI therapy may also require a separate injection of a long-acting (basal) insulin, to control glucose levels between meals; typically, once or twice per day. By comparison, insulin pump therapy uses only fast-acting insulin to fulfill both mealtime (bolus) and background (basal) requirements. Insulin pump therapy allows individuals to customize their bolus and basal insulin doses to meet their insulin needs throughout the day and is intended to more closely resemble the physiologic function of a healthy pancreas.
Insulin pumps perform continuous subcutaneous insulin infusion and typically use a programmable device and an infusion set to administer insulin into the body. Insulin pump therapy has been shown to provide numerous advantages relative to MDI therapy. For example, insulin pump therapy eliminates individual insulin injections, delivers insulin more accurately and precisely than injections, often improves HbA1c (a common measure of blood glucose levels) over time, provides greater flexibility with meals, exercise, and daily schedules, and can reduce severe low blood glucose levels. We believe that these advantages, along with technological advancements, including the use of continuous glucose monitoring technology and automated insulin device (“AID”) algorithms, and increased awareness of insulin pump therapy, will continue to generate demand for insulin pump devices.
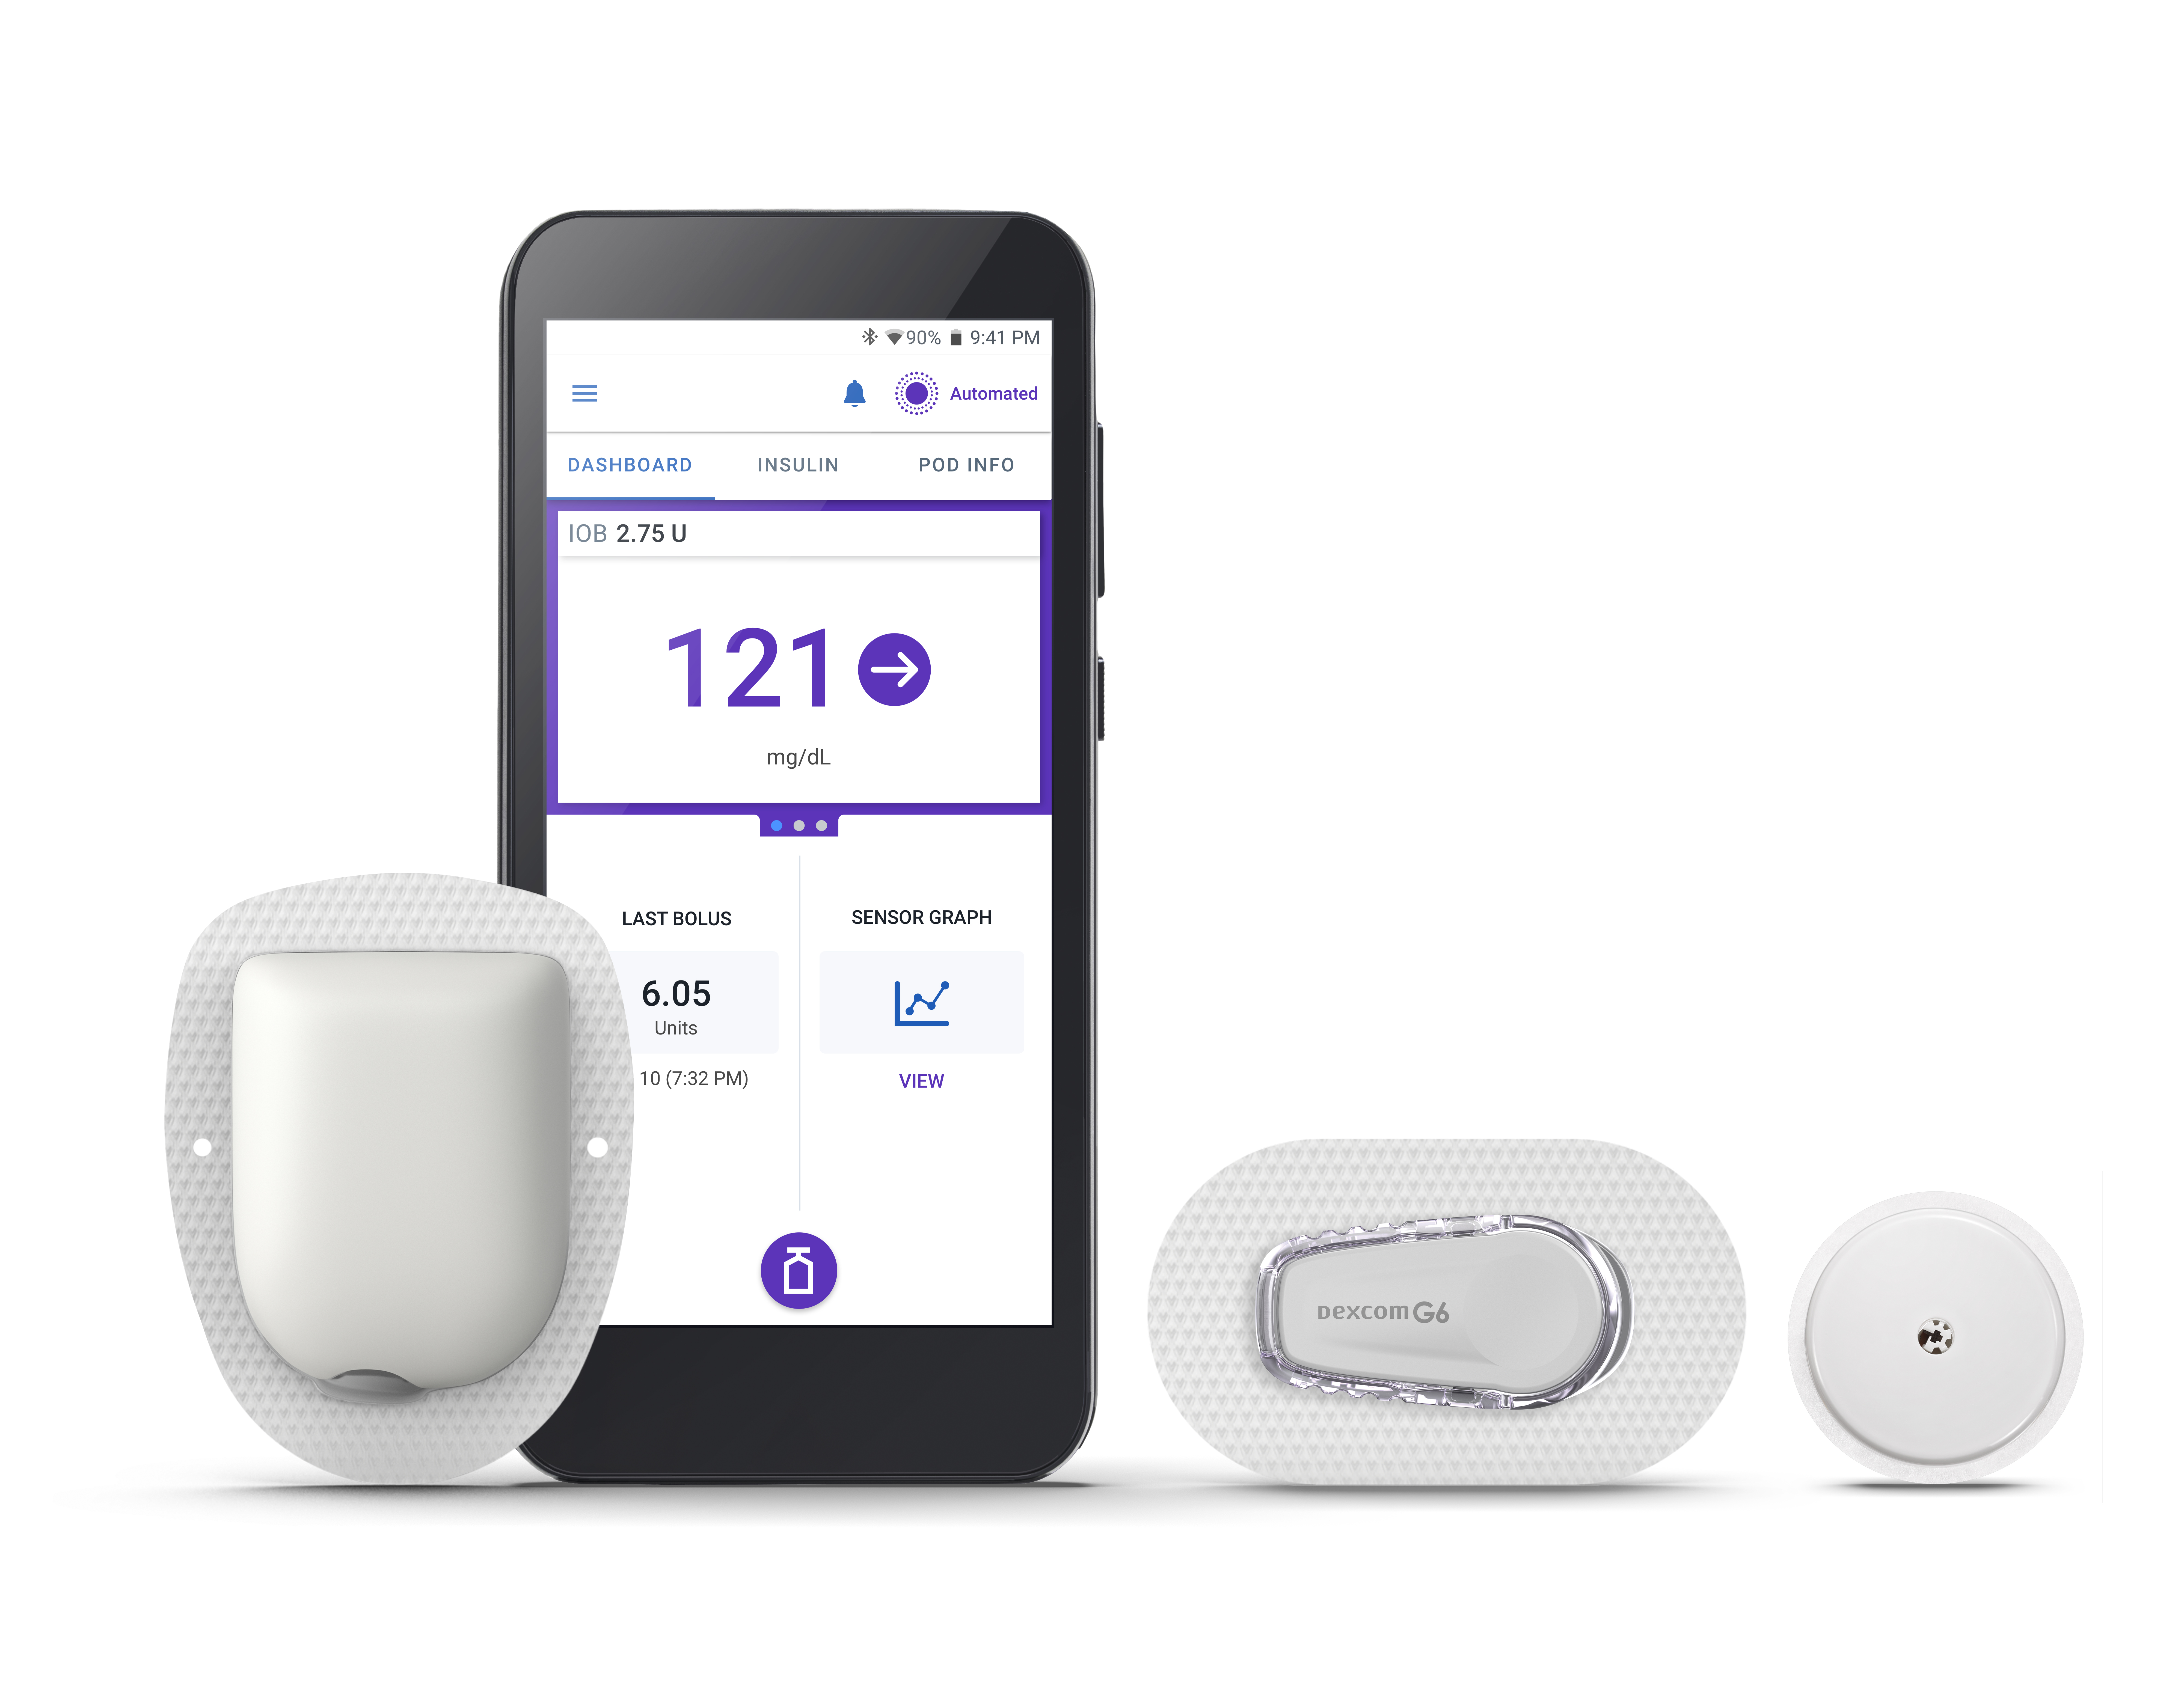
Our Solution: The Omnipod Platform
The Omnipod platform offers continuous insulin delivery that provides all the benefits of insulin pump therapy in a unique way without the need for external tubing required with conventional pumps. The small, lightweight, self-adhesive disposable tubeless Omnipod device (“Pod”), can be worn in multiple locations, including the abdomen, hip, back of upper arm, upper thigh, or lower back, and delivers insulin into the body through a small flexible tube (called a cannula). We refer to this as “Pod therapy.” We believe the Omnipod platform’s innovative proprietary design and differentiated features allow people with insulin-dependent diabetes to live their lives and manage their diabetes, with unprecedented freedom, comfort, convenience, and ease.
Omnipod 5
In 2022, we received U.S. Food and Drug Administration (“FDA”) clearance and CE Mark approval under the European Union Medical Device Regulation (“MDR”) for Omnipod 5, which builds on our Omnipod DASH platform. Omnipod 5 is now available in 10 countries. Additionally, in August 2024, we received FDA clearance for an expanded indication of Omnipod 5 for people with type 2 diabetes (ages 18 years and older) in the United States.
Omnipod 5 includes a proprietary AID algorithm embedded in the Pod. The Pod integrates with a third-party continuous glucose monitor (“CGM”) to obtain glucose values through wireless Bluetooth communication. The embedded algorithm utilizes these glucose values to predict glucose levels into the future and automatically adjusts insulin dosing intended to improve time-in-range and reduce the occurrence of blood glucose highs and lows. The user can also deliver insulin doses for snacks or meals or to correct high blood glucose through the system. The Pod can be controlled by an Insulet-provided
handheld device or a user-downloaded Android app or, in the US, the iOS app, with full smartphone compatibility. The Omnipod 5 Controller and the Android and iOS apps use cloud-based technology to upload data wirelessly via a built-in SIM card or secure Wi-Fi. The Pod currently integrates with Dexcom, Inc.’s G6 and G7 CGMs and with Abbott Diabetes Care, Inc.’s (“Abbott”) FreeStyle Libre 2 Plus sensor (“Libre 2 Plus”) in various markets as depicted under Markets and Distribution Methods.
Omnipod DASH
Omnipod DASH features a secure Bluetooth enabled Pod that is controlled by a smartphone-like Personal Diabetes Manager (“PDM”) with a color touch screen user interface. In the U.S., the PDM has Wi-Fi capabilities to enable automatic data uploads providing users and their clinicians with cloud access to data and enhancements for pushing software updates wirelessly to users. Omnipod DASH provides continuous insulin delivery at preset rates, eliminating the need for individual insulin injections. In addition, insulin delivery can be changed with the press of a button to adapt to snacks or unexpected changes in daily routine. Omnipod DASH delivers insulin in two ways:
•A small, constant background supply of insulin is delivered automatically at a programmed rate, all day and night.
•An extra dose of insulin can be delivered when needed to match the carbohydrates in a snack or meal to correct high blood glucose.
We have designed Omnipod DASH to fit within the normal daily routines of users. Omnipod DASH communicates wirelessly, provides for virtually pain-free automated cannula insertion, and eliminates the need for MDI therapy or the use of pump and tubing. The Pod can be worn for up to three days at a time and, because it is waterproof (with an IP28 rating for up to 25 feet for 60 minutes), there is no need to remove it when showering, swimming, or performing other activities.
Omnipod Classic
Following the launch of Omnipod 5, the vast majority of our customer base is no longer using our Classic Omnipod product. Accordingly, we are phasing out our Classic Omnipod product.
Data Management
We have partnered with Glooko Inc. (“Glooko”) to connect user data with Glooko’s comprehensive diabetes data management system (including Glooko and Diasend in selected regions). Glooko provides a cloud-based application for clinicians and users accessible through a kiosk, home computer, or a mobile application on the user’s smartphone that provides users and their healthcare providers access to insulin delivery trends, blood glucose levels, and other integrated data.
Security
Paramount to our ability to deliver full compatible smartphone control is our commitment to cybersecurity and information security. With certifications from the Diabetes Technology Society’s “Standard for Wireless Diabetes Device Security” cybersecurity and assurance standard and program as well as from the International Organization for Standardization (“ISO”), Insulet is globally recognized for incorporating the highest standards for cybersecurity, information security, and safety, including secure data transfer between the Pod and PDM, as well as secure cloud storage. See Item 1C. “Cybersecurity” for additional information.
Third-Party Reimbursement
In the United States, we sell our products primarily through wholesalers and, to a lesser extent to healthcare organizations, pharmacies, and consumers. In some cases, we seek reimbursement from government administrative payors and/or health insurance companies. In the United States, consumers generally have commercial insurance, Medicare or Medicaid coverage that pays for the product. Our Omnipod platform’s unique patented design allows us to provide Pod therapy at a relatively low or no up-front investment, which reduces the risk to third-party payors in the United States.
In our international locations, we sell either directly to consumers or through a distributor/intermediary. In all countries where we operate, either Insulet or our partners establish appropriate reimbursement contracts with healthcare systems in those countries and provinces. Reimbursement structures vary by country and our unique offering allows us to provide Pod therapy in attractive pricing structures that reduce the risk to payors while expanding access.
Markets and Distribution Methods
Omnipod products are currently available in the following 25 countries:
| | | | | | | | | | | | | | |
| Australia | Cyprus | Greece | Netherlands* | Switzerland |
| Austria | Denmark* | Iceland | Norway* | Turkey |
| Belgium | Finland* | Israel | Qatar | United Arab Emirates |
| Canada | France* | Italy* | Saudi Arabia | United Kingdom* |
| Croatia | Germany* | Kuwait | Sweden* | United States* |
* Represents country in which Omnipod 5 is available
We sell Omnipod products to wholesalers that supply the pharmacy channel in the United States. In addition, we sell Omnipod products through distribution partners and directly to consumers. For the year ended December 31, 2024, 88% of Omnipod product sales globally were through intermediaries.
The percentages of total revenue for customers that represent 10% or more of total revenue was as follows:
| | | | | | | | | | | | | | | | | |
| Years Ended December 31, |
| 2024 | | 2023 | | 2022 |
| Distributor A | 28% | | 28% | | 19% |
| Distributor B | 26% | | 24% | | 16% |
| Distributor C | 21% | | 19% | | 17% |
Our sales and marketing efforts are focused on customer acquisition and retention to meet the user, clinician, and payor demands for our Omnipod products. We have a comprehensive sales and marketing approach, which communicates the benefits of the Omnipod platform to users, physicians, and providers. This includes three areas of focus:
•Building consumer awareness about the features and benefits that Omnipod products provide to simplify diabetes management.
•Strengthening physician support by demonstrating clinical evidence of how Omnipod products improve outcomes and quality of life and providing data and insights to physicians offering diabetes care.
•Providing payors with the clinical and economic justifications for why Omnipod products offer unique value to the people they insure.
Training
We believe that training consumers on how to use Omnipod products is an important factor to promote successful outcomes and customer retention. We have streamlined and standardized our training by developing online resources and increased our field clinician team to directly train new users. We created an online training program for Omnipod customers transitioning to Omnipod 5 or Omnipod DASH. In addition, our virtual training allows us to onboard new Omnipod customers transitioning from MDI in a cost-effective manner. Our distributors have also implemented virtual training programs.
Customer Support
We seek to provide our customers with high quality customer support, from product ordering to insurance investigation, order fulfillment, and ongoing support. Our customer support systems are integrated with our sales, reimbursement, and billing processes, allowing us to provide customers with reliable support by telephone and through our website.
Competition
The diabetes medical device market is highly competitive, subject to rapid change, and significantly affected by new product introductions. Our Omnipod platform competes for consumers in the insulin delivery market. Because most new Omnipod users come from MDI therapy, which currently is the most prevalent method of insulin delivery, we believe that we primarily compete with companies that provide products and supplies for MDI therapy. We also compete with companies in the insulin pump market, which today consists of tubed pump companies, primarily Medtronic MiniMed, a division of Medtronic public limited company (“Medtronic”) and Tandem Diabetes Care Inc. (“Tandem”). The competitive landscape in our industry continues to undergo significant change. In addition to the established insulin pump competitors, several companies are
working to develop and market new insulin pumps and smart pens. These companies are at various stages of development and the number of such companies often changes as they enter or exit the market.
Research and Development
Our innovation programs are designed to drive:
•simplicity of user interaction with our systems to minimize the burden of diabetes;
•improved outcomes, primarily through algorithm advancements;
•insights and value from our growing datasets and analytics; and
•user choice of sensor and smartphone integrations.
Many of our research and development efforts are focused on making improvements to Omnipod 5, including adding features and functionality that will deliver increased economic value and convenience to users. Advances in innovation in 2024 include the following:
•received FDA clearance for an expanded indication of Omnipod 5 for type 2 diabetes for people aged 18 years and older in the United States;
•launched iOS app with Dexcom’s G6 CGM in the United States;
•launched Omnipod 5 integration with Dexcom’s G7 CGM in the United States;
•launched Omnipod 5 integration with Dexcom’s G6 CGM in France;
•received CE mark approval under the MDR for the added compatibility of both Dexcom’s G7 CGM and Libre 2 Plus with Omnipod 5 for individuals aged two years and older with type 1 diabetes; and
•launched Omnipod 5 integration with Libre 2 Plus in the United States, United Kingdom. and Netherlands.
We also continue to advance work to improve the Omnipod 5 algorithm and develop next-generation AID products. In 2024, we completed the first round of our EVOLUTION feasibility trial in New Zealand to test potential enhancements to the Omnipod 5 algorithm in order to further drive simplicity of use. The study included testing the system with both type 1 and type 2 users. We are in the process of analyzing the data and making modifications for the next round of study.
Manufacturing and Quality Assurance
In order to manufacture sufficient volumes of our Pods at high quality while still achieving a cost-effective per unit production price, we have designed our Pods to be manufactured through automation. We produce our products at our highly automated manufacturing facility in Acton, Massachusetts and, beginning in June 2024, also at our new highly automated manufacturing plant in Malaysia, which we constructed to support our international expansion strategy and further ensure product supply.
We also produce our devices on manufacturing lines at a facility in China operated by a contract manufacturer. This contract manufacturing agreement expires in October 2025 and is subject to automatic renewal, unless canceled by either party under the terms of the contract.
We also continue to invest in supply chain efficiencies, including automation improvements at our suppliers and contract manufacturer.
Raw Materials
We use a broad range of raw materials in the assembly and manufacturing of our products. We purchase our raw materials and select components used in the manufacturing of our products from external suppliers. We purchase some supplies from a single or limited number of sources for reasons of proprietary know-how, quality assurance, cost-effectiveness, or constraints resulting from regulatory requirements. We rely on a limited number of suppliers for a certain number of the components and sub-assemblies used in the manufacture of our products, including application-specific integrated circuit chips, Bluetooth low-energy chips, and other specialized parts. The design of certain components and sub-assemblies (including, in some instances, the raw materials used to manufacture them) is proprietary and the intellectual property rights may be owned exclusively by one party. In such cases, we are sole-sourced, with the supplier controlling the intellectual property rights. These sole-sourced components are critical to the design and functionality of our products. In the case of sole-sourced parts, we manage risk through holding inventory in-house and at the supplier to ensure continuity of supply and lower risk of disruption. We purchase many of our components and sub-assemblies from manufacturers with whom we are at least dual-sourced. We work closely with all suppliers to ensure continuity of supply while maintaining high quality and reliability.
Quality Assurance
We utilize outside vendors for the supply of components, sub-assemblies, and various services used in the manufacture of our products. Our outside vendors produce the components to our specifications, and they are audited periodically by our Quality team to confirm conformity with the specifications, policies, and procedures for our products. Our Quality team also inspects and tests our products at various steps in the manufacturing cycle to facilitate compliance with our specifications. We have received our ISO, European Union MDR, and Medical Device Single Audit Program certifications for our Quality Management System from BSI Group, an accredited Notified Body for CE Marking. Processes utilized in the manufacture, test, and release of our products have been verified and validated as required by the FDA and other regulatory bodies. As a medical device manufacturer and distributor, our manufacturing facilities and the facilities of our suppliers are subject to periodic inspection by the FDA, certain corresponding state agencies, and other regulatory bodies.
Intellectual Property
To maintain a competitive advantage, we believe we must develop and preserve the proprietary aspect of our technologies. We rely on a combination of copyright, patent, trademark, trade secret, and other intellectual property laws, non-disclosure agreements, and other measures to protect our proprietary rights. We require our employees, consultants, and advisers to execute non-disclosure agreements in connection with their employment, consulting, or advisory relationships with us, where appropriate. We also require employees, consultants, and advisers who work on our products to agree to disclose and assign to us all inventions conceived during their work with us that are developed using our property or relate to our business. Despite measures taken to protect our intellectual property, unauthorized parties may attempt to copy aspects of our products or obtain and use information that we regard as proprietary.
Patents
As of December 31, 2024, we had over 750 patents in the United States and certain other countries, with expiration dates ranging from 2025 through 2047 and had over 550 patent applications pending. The issued patents and pending patent applications cover, among other things:
•the basic architecture of our Omnipod products, including the pump and the Controller/PDM;
•the Omnipod drive system;
•the Omnipod cannula insertion system;
•software, such as algorithms and apps, for controlling our current and next generation Omnipod products; and
•various novel aspects of our current and potential future generations of Omnipod products, and other mechanisms for the delivery of pharmaceuticals.
Trademarks
We have registered various trademarks associated with our business with the United States Patent and Trademark Office on the Principal Register and in other appropriate jurisdictions. Our trademarks include INSULET®, OMNIPOD®, SIMPLIFY LIFE®, Omnipod DASH®, Omnipod DISPLAY®, OmnipodPromise®, Omnipod VIEW®, SmartAdjustTM, PodPals®, Podder®, and PodderCentral®.
Government Regulation
United States FDA Regulation
Our products are medical devices that are subject to extensive and ongoing regulation by the FDA and other federal, state, and local regulatory bodies. FDA regulations govern, among other things, product design and development, preclinical and clinical testing, pre-market clearance or approval, manufacturing, labeling, product storage, advertising and promotion, sales and distribution, post-market adverse event reporting, post-market surveillance, complaint handling, repair or recall of products, and record keeping.
Unless an exemption applies, each medical device we seek to commercially distribute in the United States will require either prior 510(k) clearance or pre-market approval (“PMA”) from the FDA. A 510(k) pre-market notification filing must contain information establishing that the device to be sold is substantially equivalent to a device commercially distributed prior to May 28, 1976 or to a device that has been determined by the FDA to be substantially equivalent. Both the 510(k) clearance and PMA processes can be expensive and lengthy and entail significant user fees. We have obtained 510(k) clearance for Classic Omnipod, Omnipod DASH, and Omnipod 5 and expect that regulatory clearances or approvals will be needed for some of our future products. In addition, we may be required to obtain a new 510(k) clearance or pre-market approval for significant post-market modifications to our products.
Clinical Trials. Clinical trials are almost always required to support a PMA application and may also be required to support 510(k) submissions. If the device presents a “significant risk” to human health as defined by the FDA, the FDA requires the device sponsor to submit an investigational device exemption (“IDE”) and obtain IDE approval prior to commencing human clinical trials. The IDE must be supported by appropriate data, such as animal and laboratory testing results, showing that it is safe to test the device in humans and that the testing protocol is scientifically sound. Clinical trials for a significant risk device may begin once an IDE is approved by the FDA and the appropriate Institutional Review Board (“IRB”) at each clinical trial site. If the product is deemed a “non-significant risk” device, IDE approval from the FDA would not be required, but the clinical trial would need to meet other requirements including IRB approval.
Our clinical trials must be conducted in accordance with FDA regulations and federal and state regulations concerning human subject protection, including informed consent and privacy. A clinical trial may be suspended by the FDA or at a specific site by the relevant IRB at any time for various reasons, including a belief that the risks to the trial participants outweigh the benefits of participation in the clinical trial. Even if a clinical trial is completed, the results of our clinical testing may not demonstrate the safety and efficacy of the device or may be equivocal or otherwise insufficient for us to obtain approval of our product.
Ongoing Regulation. After a device is placed on the market, numerous regulatory requirements apply, including:
•establishment registration and device listing;
•the FDA’s Quality System Regulation (“QSR”), which requires manufacturers, including third-party manufacturers, to follow stringent design, testing, control, documentation, and other quality assurance procedures during the development and manufacturing process;
•labeling regulations and prohibitions against the promotion of products for uncleared, unapproved or “off-label” uses, and other requirements related to promotional activities;
•medical device reporting regulations, which require that manufacturers report to the FDA if their device may have caused or contributed to a death or serious injury, or malfunctioned in a way that would likely cause or contribute to a death or serious injury if the malfunction were to recur;
•corrections and product recall reporting regulations, which require that manufacturers report to the FDA field corrections and product recalls or removals if undertaken to reduce the risk to health posed by the device or to remedy a violation of the federal Food, Drug, and Cosmetic Act that may present a risk to health. In addition, the FDA may order a mandatory recall if there is a reasonable probability that the device would cause serious adverse health consequences or death; and
•post-market surveillance regulations, which apply when necessary to protect the public health or to provide additional safety and efficacy data for the device.
Failure to comply with applicable regulatory requirements can result in enforcement actions by the FDA and other regulatory agencies, which may include any of the following sanctions: untitled letters or warning letters, fines, injunctions, consent decrees, civil or criminal penalties, recall or seizure of our current or future products, operating restrictions, partial suspension or total shutdown of production, refusal of or delay in granting 510(k) clearance or PMA of new products or modified products, rescinding previously granted 510(k) clearances or withdrawing previously granted PMAs, or refusal to grant import or export approval of our products.
We are subject to announced and unannounced inspections by the FDA, and these inspections may include the manufacturing facilities of our subcontractors. If, as a result of these inspections, the FDA determines that our equipment, facilities, laboratories, or processes do not comply with applicable FDA regulations and conditions of product approval, the FDA may seek civil, criminal, or administrative sanctions and/or remedies against us, including the suspension of our manufacturing operations. Since clearance of the first generation of our Omnipod product, we have been subject to FDA inspections of our facilities on multiple occasions.
Other Regulations
Licensure. In order to sell our product through the pharmacy channel in the United States, we are required to work with intermediaries who have the appropriate pharmacy license for the applicable market. We are also subject to certain state laws regarding professional licensure. We believe that our certified diabetes educators are in compliance with all such state laws. However, if our educators or we were to be found non-compliant, we may need to modify our approach to providing education, clinical support, and customer service.
Federal Anti-Kickback and Self-Referral Laws. The federal healthcare Anti-Kickback Statute prohibits the knowing and willful offer, payment, solicitation, or receipt of any form of remuneration (anything of value) in return for, or to induce:
•the referral of an individual;
•furnishing or arranging for the furnishing of items or services reimbursable under Medicare, Medicaid, or other federal healthcare programs; or
•the purchase, lease, or order of, or the arrangement or recommendation of the purchasing, leasing, or ordering of, any item or service reimbursable under Medicare, Medicaid, or other federal healthcare programs.
The federal Anti-Kickback Statute has been interpreted to apply to arrangements between drug and medical device manufacturers and suppliers on one hand and prescribers, patients, purchasers, and formulary managers on the other. Liability under the statute may be established without a person or entity having actual knowledge of the statute or specific intent to violate it. In addition, claims resulting from a violation of the federal Anti-Kickback Statute constitute false or fraudulent claims for purposes of the federal civil False Claims Act discussed below. Although there are a number of statutory exemptions and regulatory safe harbors protecting certain common business practices from prosecution and administrative sanctions, the exemptions and safe harbors are drawn narrowly, and practices that involve remuneration that may be perceived as inducing the prescription, purchase, or recommendation of Omnipod products may be subject to scrutiny under the law. For example, we may provide the initial training to users necessary for appropriate use of our product either through our own diabetes educators or by contracting with outside diabetes educators that have completed a Certified Pod Trainer course. We compensate outside diabetes educators for their services at contracted rates deemed to be consistent with the market. We have structured our arrangements with diabetes educators and other business practices to comply with statutory exemptions and regulatory safe harbors whenever possible, but our practices may be subject to scrutiny if they fail to strictly comply with the criteria in the exemption or regulatory safe harbor. Moreover, there are no safe harbors for many common practices such as providing reimbursement assistance, coding and billing information, or other customer assistance and product support programs. If any of our practices, arrangements, or programs are found to violate the federal Anti-Kickback Statute, we could be subject to significant criminal, civil, and administrative penalties, including imprisonment, fines, damages, and exclusion from Medicare, Medicaid, or other governmental programs.
Federal law also includes a provision commonly known as the “Stark Law,” which prohibits a physician from referring Medicare or Medicaid patients to an entity for the furnishing of certain “designated health services,” in which the physician has an ownership or investment interest or with which the physician has entered into a compensation arrangement. Violation of the Stark Law could result in denial of payment, disgorgement of reimbursements received for items and services referred by a physician with a noncompliant arrangement, civil damages and penalties, and exclusion from Medicare, Medicaid, or other governmental programs. Although there are statutory and regulatory exceptions protecting certain common business practices, and we have structured our arrangements with physicians and other providers to comply with these exceptions, these arrangements may not expressly meet the requirements for applicable exceptions from the Stark Law.
Federal Civil False Claims Act. The federal civil False Claims Act imposes penalties against any person or entity who, among other things, knowingly presents, or causes to be presented, a false or fraudulent claim for payment of government funds, or knowingly making, using, or causing to be made or used a false record or statement material to a false or fraudulent claim. Actions under the False Claims Act may be brought by the Attorney General or as a qui tam action by a private individual in the name of the government. Violations of the False Claims Act are subject to the imposition of significant per claim penalties, three times the amount of damages that the federal government sustained and possible exclusion from participation in federal healthcare programs like Medicare and Medicaid. We believe that we are in compliance with the federal government’s laws and regulations concerning the filing of claims for reimbursement. However, many drug and medical device manufacturers have been investigated or subject to lawsuits by whistleblowers and have reached substantial financial settlements with the federal government under the False Claims Act for a variety of alleged improper marketing activities, including providing free product to customers with the expectation that the customers would bill federal programs for the product; or causing submission of false claims by providing inaccurate coding or billing information to actual or prospective purchasers. Our business practices could be subject to scrutiny and enforcement under the federal False Claims Act. We also may be subject to other federal false claim laws, including federal criminal statutes that prohibit making a false statement to the federal government.
Civil Monetary Penalties Law. We are subject to the federal Civil Monetary Penalties Law, which prohibits, among other things, the offering or transferring of remuneration to a Medicare or Medicaid beneficiary that the person knows or should know is likely to influence the beneficiary’s selection of a particular supplier of Medicare or Medicaid payable items or services. Noncompliance can result in significant civil monetary penalties for each wrongful act, assessment of three times the amount claimed for each item or service, and exclusion from the federal healthcare programs.
Federal Healthcare Fraud Statutes. We are also subject to federal healthcare fraud statutes that, among other things, impose criminal and civil liability for executing a scheme to defraud any healthcare benefit program including non-governmental programs, and prohibit knowingly and willfully falsifying, concealing, or covering up a material fact or making any materially false or fraudulent statement or representation, or making or using any false writing or document with knowledge that it contains a materially false or fraudulent statement in connection with the delivery of or payment for healthcare benefits, items, or services. Violations of these statutes can result in significant civil, criminal, and administrative penalties, fines, damages, and exclusion from federal healthcare programs.
State Fraud and Abuse Laws and Marketing Restrictions. Many states have adopted anti-kickback, anti-referral laws, and false claims laws and regulations analogous to the federal civil Anti-Kickback Statute and federal False Claims Act. In some cases, these state laws apply regardless of the payor, including private payors. We believe that we are in compliance with such laws. Moreover, several states have imposed requirements to disclose payments to healthcare providers, restrictions on marketing and other expenditures, and requirements to adopt a code of conduct or compliance program with specific elements. Liability under such laws could result in fines and penalties and restrictions on our ability to operate in these jurisdictions.
Administrative Simplification of the Health Insurance Portability and Accountability Act of 1996. The Health Insurance Portability and Accountability Act of 1996 (“HIPAA”) mandated the adoption of standards for the exchange of electronic health information to encourage overall administrative simplification and enhance the effectiveness and efficiency of the healthcare industry. Ensuring privacy and security of patient information is one of the key factors driving the legislation. HIPAA regulations have been amended under the Health Information Technology for Economic and Clinical Health Act of 2009. If we are found to be in violation of HIPAA, we could be subject to civil or criminal penalties.
Privacy Laws. At least 15 states have enacted various privacy laws of general applicability over the past several years. For example, the California Consumer Privacy Act (“CCPA”) and California Privacy Rights Act (“CPRA”) are consumer privacy laws that provide certain privacy rights and consumer protection for residents of the state of California. These consumer rights include the right to know what personal information is collected, the right to know whether the data is sold or disclosed and to whom, the right to request a company to the delete personal information collected, the right to opt-out of the sale of personal information and the right to non-discrimination in terms of price or service when a consumer exercises a privacy right. If we fail to comply with these regulations, we could be subject to civil sanctions, including fines and penalties for noncompliance. The California laws have served as a model for similar laws in other states like the Consumer Data Protection Act in Virginia and the Colorado Privacy Act. In addition, general privacy legislation has been filed in Congress in recent sessions, but the final form of the legislation and when it might be enacted is difficult to predict.
Patient Protection and Affordable Care Act. The Patient Protection and Affordable Care Act as amended by the Health Care and Education Reconciliation Act of 2010 (“ACA”) enacted significant changes to the provision of and payment for healthcare in the United States. Under the ACA and related laws and regulations, federal and state government initiatives are focused on limiting the growth of healthcare costs and implementing changes to healthcare delivery structures. These reforms are intended in part to put increased emphasis on the delivery to patients of more cost-effective therapies and could adversely affect our business. Additional legislative changes, regulatory changes, and judicial challenges related to the ACA remain possible. We expect that the ACA will continue to have a significant impact on the delivery of healthcare in the United States and on our business in the near term.
Physician Payments Sunshine Act. The Physician Payments Sunshine Act, implemented as the Open Payments program, requires manufacturers of drugs and devices for which payment is available under Medicare, Medicaid, or the Children’s Health Insurance Program (with certain exceptions) to report annually to the Centers for Medicare & Medicaid Services (“CMS”) information related to direct or indirect payments and other transfers of value provided to physicians and teaching hospitals, as well as ownership and investment interests held by physician and their immediate family members. Applicable manufacturers are also required to report information regarding payments and transfers of value provided to physician assistants, nurse practitioners, clinical nurse specialists, certified nurse anesthetists and certified nurse-midwives. Failure to disclose reportable payments could subject us to penalties and materially adversely impact our business and financial results. Certain states’ laws require additional reporting of payments and transfers of value to healthcare providers.
Since these laws and regulations continue to evolve, we lack definitive guidance as to the application of certain key aspects of these laws and regulations as they relate to certain of our arrangements and programs, including those with providers with respect to user training. We cannot predict the final form of these regulations or the effect their application will have on us. As a result, our provider and training arrangements may ultimately be found not to be in compliance with applicable laws.
Ensuring that our business arrangements and interactions with healthcare professionals, third‑party payors, customers, and others comply with applicable healthcare laws and regulations requires substantial resources. Because of the breadth of these
laws and the narrowness of the exceptions or safe harbors, it is possible that some of our business activities could be subject to challenge under one or more of these laws.
U.S. Foreign Corrupt Practices Act (“FCPA”). We are subject to FCPA in the United States. and to similar anti-bribery laws in other jurisdictions, which generally prohibit companies and their intermediaries from making improper payments to foreign officials for the purpose of obtaining or retaining business. Because of the predominance of government-sponsored healthcare systems around the world, our customer relationships outside of the United States may be with governmental entities and therefore subject to such anti-bribery laws. Our policies mandate compliance with these anti-bribery laws. We operate in parts of the world that have experienced governmental corruption to some degree, and in certain circumstances strict compliance with anti-bribery laws may conflict with local customs and practices. Despite our training and compliance programs, our internal control policies and procedures may not protect us from reckless or criminal acts committed by our employees or agents.
Artificial Intelligence (“AI”). Governments around the world have begun to regulate AI, including Generative AI. The EU AI Act was enacted in August 2024, with provisions taking effect over time, through August 2026. U.S. states are also starting to legislate in this area, as are other countries. Federal regulation in the United States is in flux at this time, given the recent change in administrations. To the extent we develop or deploy AI systems in our business operations or in our products, we will be subject to AI regulations governing AI systems. We are engaged in regular reviews of development and licensing of software used in the business for compliance with relevant AI regulations. Guidance from EU regulators is starting to be published and we will continue to track developments in this area and adjust operations accordingly.
In addition, we are subject to numerous federal, state, foreign, and local laws relating to safe working conditions, manufacturing practices, and environmental protection. We may be required to incur significant costs to comply with these laws and regulations in the future and complying with these laws may result in a material adverse effect on our business, financial condition, and results of operations.
Increasingly, regulators, customers, investors, employees, and other stakeholders are focusing on environmental, social and governance matters and related disclosures. These changing rules, regulations, and stakeholder expectations have resulted in, and are likely to continue to result in, increased general and administrative expenses and increased management time and attention spent meeting such regulations and expectations and complying with disclosure requirements. For example, collecting, measuring, and reporting environmental data is subject to evolving reporting standards, including California’s climate disclosure requirements, and similar regulations established by other international regulatory bodies, such as the Corporate Sustainability Reporting Directive in the European Union. In addition, a number of our customers who are payors or distributors have adopted, or may adopt, procurement policies that include environmental provisions that their suppliers or manufacturers must comply with. If we do not adapt to or comply with new regulations, or fail to meet evolving investor, industry, or stakeholder expectations and concerns regarding environmental issues, investors may reconsider their investment in us, and customers and suppliers may choose to limit their business with us, which could have a material adverse effect on our business, operations, or reputation.
International Regulations
International sales of medical devices are subject to foreign government regulations, which may vary substantially from country to country. The time required to obtain approval by a foreign country may be longer or shorter than that required for FDA clearance or approval, and the requirements may differ. There is a trend towards harmonization of quality system standards among the European Union, United States, Canada, and various other industrialized countries.
The primary regulatory body in Europe is that of the European Union, which includes most of the major countries in Europe. Other countries, such as Switzerland, have voluntarily adopted laws and regulations that mirror those of the European Union with respect to medical devices. The European Union has adopted numerous directives and standards regulating the design, clinical trials, manufacture, labeling, and adverse event reporting for medical devices, including the Medical Device Directive (“MDD”) and the MDR, which replaced MDD in 2021. Certain devices that comply with the requirements of the MDD can be commercially distributed until December 2027 if certain requirements are met. The method of assessing conformity with the applicable directive varies depending on the class of the product, but normally involves a combination of self-assessment by the manufacturer and a third-party assessment by a “Notified Body”. The latter is required in order for a manufacturer to commercially distribute the product throughout the European Union. This third-party assessment may consist of an audit of the manufacturer’s quality system and specific testing of the manufacturer’s product. Outside of the European Union, regulatory approval needs to be sought on a country-by-country basis for us to market our products.
We have obtained the right to affix the CE Mark to Omnipod 5 and Omnipod DASH under MDR, which allows us to distribute it throughout the European Union and in the United Kingdom. We have obtained the right to affix the CE Mark to Classic Omnipod under the MDD and can continue to sell Classic Omnipod through 2027 in the European Union and in other countries that recognize the CE Mark.
A range of anti-bribery and anti-corruption laws, as well as industry specific laws and codes of conduct, apply to the medical device industry and interactions with government officials and entities and healthcare professionals. These laws include the U.K. Bribery Act and similar antibribery laws in other jurisdictions in which we operate. Such laws generally prohibit U.S.-based companies and their intermediaries from making improper payments for the purpose of obtaining or retaining business to foreign officials, or in the case of the U.K. Bribery Act, to any person. In addition, the European Union Whistleblower Directive and other applicable law around the world impose specific requirements on companies regarding speak up policies and non-retaliation policies.
General Data Protection Regulation. The General Data Protection Regulation (“GDPR”) is a comprehensive update to the data protection regime in the European Economic Area that imposes requirements relating to, among other things, consent to process personal data of individuals, the information provided to individuals regarding the processing of their personal data, the security and confidentiality of personal data, notifications in the event of data breaches, and use of third-party processors. If we fail to comply with these standards, we could be subject to criminal penalties and civil sanctions, including fines and penalties for noncompliance.
The European Union has laid out a multi-year plan for additional privacy and data regulation, building upon the GDPR, and has begun to execute on that plan. For example, the Cybersecurity Directive and the Artificial Intelligence Act have been finalized and will impose additional obligations on businesses generally, including those in the medical device industry.
Human Capital Resources
Employees
Our people are our most valuable asset and are the source of our innovation and our success. We strive to attract and retain the best talent with competitive compensation and benefits, opportunities for growth and development, and a culture that emphasizes fair and equitable treatment. As of December 31, 2024, we had approximately 3,900 full-time employees, representing a 29% increase over the prior year. Approximately 70% of our employees are located in the United States and the remainder are located in 15 other countries.
In 2024, we defined and shared our Ways of Working, the key behaviors that we believe are most important to our success and to creating an exceptional employee experience. Additionally, in 2024, we launched our Insulet for Good program, which enables employees globally to engage in volunteerism and corporate philanthropy in ways aligned with our corporate strategic priorities.
To assess employee retention and engagement and identify potential opportunities for improvement, we conduct periodic ‘Your Voice’ employee pulse surveys and take timely action to address key areas of employee concern. Our executive leadership team also conducts regular Town Hall meetings to ensure our global employees are highly engaged and receive timely business updates. To help our remote employees feel socially connected to their colleagues, we created our “Stay Connected” initiative, which includes virtual meetings with our executive team members. These virtual meetings are designed as casual conversations with our executives so employees can talk about what is on their minds, get to know the executive leaders, and connect with colleagues from across the organization. We also publish a monthly global employee newsletter, which includes a timely collection of high-level developments and local highlights from across our organization and utilize a social networking tool to ensure our global employees are engaged, motivated, and collaborating with one another.
Our success thrives on the diversity of perspective, thought, experience, and background within our workforce. We are committed to creating a global culture that reflects the diversity of the customers we serve and creates an environment where all employees feel welcomed, respected, and valued. Accordingly, we are committed to providing equal opportunity in all aspects of our Company culture and workplace.
Our voluntary employee-led Employee Resource Groups (“ERGs”) are a thriving part of Insulet’s community, driving inclusion across the following categories: African Descent, Asian and Pacific Islander, Hispanic/Latin, LGBTQ+, Sustainability, Veterans and First Responders, Women, Young Professionals, Jewish Heritage, and our newly created People with Diabetes. These ERGs support the attraction, engagement, development, and retention of our people.
Training and Development
Our people are core to our success and the achievement of our business strategy. We are therefore committed to fostering an environment in which our employees continuously learn and develop the skills and capabilities needed for their success by offering both leadership and professional skills development programs. All employees who join Insulet undergo a robust onboarding program called RITE Start that introduces our core values and educates new employees about diabetes, Omnipod products, our business strategy, Insulet's culture and Ways of Working, and our mission, which is to improve the lives of people with diabetes and enable them to enjoy simplicity, freedom, and healthier lives through innovative technology. All employees participate in our flagship ‘Ignite Your Growth’ career development program and as a result, establish an Individual
Development Plan, which is reviewed and updated regularly with their manager. We also offer LinkedIn Learning to all employees, providing access to virtual and online learning programs on demand to enable them to continuously build their skills and capabilities to support our current and future business needs. Additionally, we offer professional certification course reimbursement of up to $3,000 annually and tuition reimbursement of up to $5,250 annually for courses taken in pursuit of an undergraduate degree and up to $10,000 annually for courses taken in pursuit of a graduate degree. Further, managers participate in our ‘Ignite Your Leadership’ development program to support the growth and development of our future leaders and build their capabilities. We also offer new manager assimilation and team effectiveness programs and quick tip resources for our experienced leaders. In addition, we offer intensive Customer Care and Sales New Hire Training.
Competitive Pay and Benefits
Our compensation program is designed to align employee compensation with our performance and to provide the proper incentives to attract, retain, and motivate employees to achieve superior results. The structure of our compensation program balances incentive earnings for both short-term and long-term performance. Specifically,
•We provide employee wages that are competitive and consistent with employee positions, skill levels, experience, knowledge, and geographic location.
•We engage internationally recognized outside compensation and benefits consulting firms to independently evaluate the effectiveness of our executive compensation and benefit programs and to provide benchmarking.
•We align our executives’ long-term equity compensation with our shareholders’ interests.
•Annual increases and incentive compensation are based on our performance as well as each individual’s contribution to the results achieved and are documented through our talent management process as part of our annual review process.
We are committed to providing comprehensive benefit options that allow our employees and their families to live healthier and more secure lives. Our wide-ranging benefits include health insurance, telehealth, prescription drug benefits, dental insurance, vision insurance, paid time off, sick time, bereavement leave, life insurance, disability insurance, accident insurance, critical illness insurance, hospital indemnity insurance, health savings accounts, flexible savings accounts, retirement plans, employee stock purchase plan, legal services, identity theft protection, paid parental and postpartum recovery leave, tuition and professional certification course reimbursement, business travel accident insurance, pet insurance and employee assistance program. In addition, we offer Pod perks, which provides a free Omnipod 5 or Omnipod DASH product, including Controller/PDM and Pods to benefit eligible employees or dependents. We also offer summer hours and flexible work arrangements, including the opportunity to work remotely, which allows us to access a broader, more diverse, and more exceptional talent pool.
Health and Safety
We maintain an occupational health and safety management system that covers all our employees, contractors, and temporary employees because we are committed to the safety and well-being of our workforce. By minimizing risks at our factories and implementing training to enhance awareness of hazards, we are able to promote safe practices and preserve the health of our employees.
Modern manufacturing enables efficiency and automation, which reduces exposure to health and safety risks throughout the production process. At our facilities, the majority of our equipment is fully automated to minimize human involvement in the operations of machines and therefore reduce the risk of injury. We maintain high standards for workplace safety, and our orientation for technicians includes training about safe procedures, such as lockout/tagout.
We have a Health and Safety Compliance Manual to provide employees with the tools needed to identify and report hazards and reduce work-related injuries. Our programs and policies are in compliance with applicable local, regional, and federal laws, including U.S. Occupational Safety and Health Administration requirements. We continuously monitor and adapt to regional regulations as we expand our facilities into new geographies. In addition to hazard recognition, our workplace health and safety programs cover ergonomics, hearing conservation, fall protection, and accident and injury prevention.
We also have formal plans in place to protect our employees' safety in the event of an emergency. In addition, our facilities maintain Emergency Action/Preparedness Plans that describe procedures that employees should follow when faced with a variety of unexpected health and safety events. As part of this initiative, we have trained certain employees to use automated external defibrillators, provide first aid, and perform cardiopulmonary resuscitation (CPR) in the event someone is injured or becomes ill while at work. We also have internal emergency response teams, comprised of people who are trained to respond to emergencies such as a fire, natural disaster, chemical spill, and/or workplace accident. Further, we maintain an emergency evacuation map for each location in our plants and conduct mock drills to familiarize staff with our emergency routes, emergency exits, and assembly points. Additionally, we have a text emergency system for our employee base located in our
Acton headquarters and Acton manufacturing facility, which advises employees on building closures and emergencies with clear instructions. We also conduct periodic health and safety audits of our facilities to monitor the effectiveness of our programs and drive continuous improvement in our overall safety performance as Insulet expands in size and impact.
Company Information
Insulet Corporation is a Delaware corporation formed in 2000. Our principal office is located at 100 Nagog Park, Acton, Massachusetts, 01720 and our website address is http://www.insulet.com. We make available free of charge on our website our annual reports on Form 10-K, quarterly reports on Form 10-Q, current reports on Form 8-K, proxy statements and amendments to those reports as soon as reasonably practicable after we electronically file or furnish such materials to the U.S. Securities and Exchange Commission (“SEC”). We have also posted the charters for our Audit Committee, Talent and Compensation Committee and Nominating, Governance and Risk Committee, as well as our Code of Business Conduct and Ethics, under the heading “Corporate Governance” in the Investors section of our website. The information on our website is not incorporated in this report by reference. In addition, the SEC maintains a website (http//www.sec.gov) that contains reports, proxy and information statements, and other information regarding issuers that file electronically with the SEC.
Item 1A. Risk Factors
Risks Related to Our Business and Industry
We currently rely on sales of our Omnipod product platform to generate nearly all our revenue.
We expect to continue to derive nearly all our revenue from our Omnipod product platform. Accordingly, our ability to continue to generate revenue is highly reliant on our ability to market and sell our Omnipod products and to retain consumers who currently use the product. Our sales of Omnipod products may be negatively impacted by many factors, including:
•development of an effective patch pump by one or more competitors or breakthrough diabetes treatments not requiring the delivery of insulin;
•failure of our Omnipod products to achieve and maintain wide acceptance among opinion leaders in the diabetes treatment community, insulin-prescribing physicians, third-party payors, and people with insulin-dependent diabetes;
•manufacturing problems or capacity constraints;
•actual or perceived quality problems;
•reductions in reimbursement rates or coverage policies relating to Omnipod products by third-party payors;
•claims that any portion of Omnipod products infringes on intellectual property rights of others;
•adverse regulatory or legal actions relating to our Omnipod products;
•damage, destruction or loss of any of the facilities where our products are manufactured or stored or of the equipment therein;
•failure to successfully open or expand new facilities;
•the inability of users to continue paying for our products;
•attrition rates of consumers who cease using Omnipod products;
•competitive pricing;
•failure to appropriately forecast the demand, competition, and costs related to markets in which we compete; and
•results of clinical studies relating to Omnipod products or our competitors’ products.
If any of these events occur, our ability to generate revenue could be significantly reduced, which would adversely affect our business, financial condition, and results of operations.
If we fail to expand and maintain an effective sales force or successfully develop and maintain our relationships with intermediaries, our business, prospects, and brand may be materially and adversely affected.
In addition to promoting, marketing, and selling Omnipod products through our own direct sales force, we also utilize domestic and international intermediaries to distribute our product to users. We need to expand our distribution network to maintain and grow our business and revenue. If we are not able to successfully develop our relationships with third-party intermediaries, our sales could fail to grow or could decline, and our ability to grow our business could be adversely affected. Intermediaries that are in the business of selling other medical products may not devote a sufficient level of resources and the support required to generate awareness of our products and grow or maintain our product sales. If our intermediaries are unwilling or unable to market and sell our products, or if they or our sales force do not perform to our expectations, we could experience delayed or
reduced market acceptance and sales of our products, which would adversely affect our business, financial condition, and results of operations.
Our ability to grow our revenue depends in part on our retaining a high percentage of our customers.
A key to driving our revenue growth is the retention of a high percentage of our customers. Current uncertainty in global economic conditions, competition, higher levels of unemployment, changes in insurance reimbursement levels, and negative financial news may negatively affect product demand. If demand for our products fluctuates as a result of economic conditions, competition, or otherwise, our ability to attract and retain customers could be harmed. The failure to retain a high percentage of our customers could negatively impact our revenue growth and may have a material adverse effect on our business, financial condition, and results of operations.
If we do not effectively manage our rapid growth, our business resources may become strained and we may not be able to deliver our products in a timely manner, which could adversely affect our results of operations.
As we continue to expand the number of customers we serve, driven in large part by significant demand for Omnipod 5, we expect to continue to increase our manufacturing capacity, our personnel, and the scope of our sales and marketing efforts. This growth, as well as any other growth that we may experience in the future, will create challenges for our organization and may strain our management and operations resources, including our customer service. In order to manage future growth, we will be required to improve existing, and implement new, sales and marketing efforts, distribution channels, and customer support procedures. In addition, the form and function of our enterprise information technology systems will need to change and be improved upon as our business needs change. For example, we recently implemented a new enterprise resource planning system and plan to upgrade our customer relationship management system. We will also need to manage our supply chain and manufacturing effectively, including our sourcing of materials such as semiconductor chips. We may also need to partner with additional third-party suppliers to manufacture certain components of our Omnipod products and install additional manufacturing lines, including as a part of our newly constructed facility in Malaysia. A transition to new suppliers may result in additional costs or delays. We may misjudge the amount of time or resources that will be required to effectively manage any anticipated or unanticipated growth in our business, or we may not be able to manufacture sufficient inventory, or attract, hire, and retain sufficient personnel to meet our needs. If we cannot scale our business appropriately, maintain control over expenses, or otherwise adapt to anticipated and unanticipated growth, our business resources may become strained, we may not be able to deliver our Omnipod products in a timely manner, and our results of operations may be adversely affected.
Failure to secure or retain adequate coverage or reimbursement for our products by third-party payors could adversely affect our business, financial condition, and results of operations.
We expect that sales of our Omnipod products, which, for Omnipod 5, occur only through the pharmacy channel in the United States and for Omnipod DASH, primarily through the pharmacy channel, will be limited unless a substantial portion of their sales price is paid for by third-party payors, including private insurance companies, health maintenance organizations, preferred provider organizations, federal and state government healthcare agencies, intermediaries, Medicare, Medicaid, and other managed care providers. In the United States, we currently have contracts establishing reimbursement for Omnipod products with national and regional third-party payors and government agencies that provide reimbursement in all 50 states. Medicare Part D Plan Sponsors may provide coverage for Omnipod products under the Medicare Part D prescription drug program, which requires negotiating with third-party payors in order to provide our product through the pharmacy channel in the United States. While we anticipate entering into additional contracts with other intermediaries and third-party payors, we cannot assure that our efforts will be successful, which could limit the availability of Omnipod products. In addition, these contracts can generally be terminated by the third-party payor without cause. Healthcare market initiatives in the United States may also lead third-party payors to decline or reduce reimbursement for Omnipod products. Moreover, compliance with administrative procedures or requirements of third-party payors may result in delays in processing approvals by those payors for consumers to obtain coverage for the use of Omnipod products and for payment to be made for such use. Coverage decisions and rates of reimbursement increasingly require clinical evidence showing an improvement in user outcomes. Generating this clinical evidence requires substantial time and investment and there is no guarantee of a desired outcome.
As we expand our sales and marketing efforts internationally, we face additional risks associated with obtaining and maintaining reimbursement from foreign healthcare payment systems on a timely basis or at all. Failure to secure or retain adequate coverage or reimbursement for our products by third-party payors could have a material adverse effect on our business, financial condition, and results of operations.
Healthcare reform laws could adversely affect our revenue and financial condition.
Efforts to control healthcare costs, including limiting access to care, alternative delivery models, and changes in the methods used to determine reimbursement systems and rates, are ongoing at the federal and state levels. Future changes cannot be predicted with certainty, and may have an adverse effect on our industry and on our ability to maintain or increase sales of any of our products.
Risks Related to Competition, Product Development and Intellectual Property
Our failure to compete effectively would negatively impact our revenue.
The competitive landscape in our industry continues to undergo significant change. We compete with companies that produce insulin pumps, such as Medtronic and Tandem. In addition to the established insulin pump competitors, we compete with companies that provide products and supplies for MDI therapy. MDI therapy, including smart pens, can be substantially less expensive than pump therapy, and improvements in the effectiveness of MDI therapy may result in fewer people than we expect converting from MDI therapy to pump therapy, which could result in price pressure and decreased revenue.
In addition, some of our competitors, such as Medtronic, are large, well-capitalized companies with more resources than we have. These companies may have competitive advantages over us, including:
•significantly greater name recognition;
•different and more complete reimbursement profiles;
•established relations with healthcare professionals, customers, and third-party payors;
•larger and more established distribution networks;
•greater experience in conducting research and development, clinical trials, manufacturing, marketing, and obtaining regulatory approval; and
•greater financial and human resources for product development, sales and marketing, and patent litigation.
As a result, we may not be able to compete effectively against these companies or their products, which may adversely impact our business.
Our current competitors or other companies may at any time develop additional products for the treatment of diabetes. Several companies are working to develop and market new insulin “patch” pumps, smart pens, and other methods for the treatment of diabetes. If an existing or future competitor develops a product that competes with or is superior to our Omnipod products, our revenue may decline. In addition, some of our competitors may compete by changing their pricing model or by lowering the price of their insulin delivery systems or ancillary supplies. If these competitors’ products were to gain acceptance by healthcare professionals, people with insulin-dependent diabetes, or third-party payors, we could experience pricing pressure. If prices were to fall, our results of operations could be materially adversely impacted.
Technological breakthroughs in diabetes monitoring, treatment, or prevention could render our Omnipod products obsolete or less desirable.
The diabetes treatment market is subject to rapid technological change and product innovation. Our Omnipod products are based on our proprietary technology, but a number of companies, medical researchers, and pharmaceutical companies are pursuing new delivery devices, delivery technologies, sensing technologies, procedures, drugs, and other therapeutics for the monitoring, treatment, and/or prevention of insulin-dependent diabetes. In addition, well-capitalized biopharmaceutical companies like Vertex Pharmaceuticals, the National Institutes of Health, and other supporters of diabetes research, are continually seeking ways to prevent, cure, or improve the treatment of diabetes. Any breakthroughs in diabetes monitoring, treatment, or prevention could reduce the potential market for our products or render our products obsolete altogether, which would significantly reduce our sales or cause our sales to grow at a slower rate than we currently expect. In addition, even the perception that new products may be introduced, or that technological or treatment advancements could occur, could cause consumers to delay the purchase of our products or impact our stock price.
Our new product development initiatives may prove to be ineffective or not commercially successful.
The healthcare industry is characterized by continuous technological change, resulting in changing consumer preferences and requirements. If we are unable to introduce and market new products and keep pace with advances in technology, our business will be negatively impacted. To compete in the marketplace, we must make substantial investments in new product development whether internally or externally through licensing or acquisitions. Even if we can develop, manufacture, and obtain regulatory and reimbursement approvals for our new products, the success of those products depends on market acceptance. Market acceptance for our new products could be affected by several factors, including the availability of alternative products from our competitors, the price of our products, the timing of our market entry, and our ability to market
and distribute our products effectively. Our failure to introduce commercially successful new and innovative products in a timely manner could have a material adverse effect on our business, results of operations, financial condition, and cash flows.
If the third parties on which we rely to conduct our clinical trials and to assist us with pre-clinical development do not perform as contractually required or expected, we may not be able to obtain regulatory clearance or approval or commercialize our products.
We rely on third parties, such as contract research organizations, medical institutions, clinical investigators, contract laboratories, and other third parties to conduct some of our clinical trials and pre-clinical investigations. If these third parties do not successfully carry out their contractual duties or regulatory obligations or meet expected deadlines, or if the quality or accuracy of the data they obtain is compromised due to failure to adhere to our clinical protocols or regulatory requirements or for other reasons, our pre-clinical development activities or clinical trials may be extended, delayed, suspended, or terminated, and we may not be able to obtain regulatory approval for, or successfully commercialize, our products on a timely basis, or at all, and our business and operating results may be adversely affected.
Future market or clinical studies may be unfavorable to our Omnipod products and their efficacy, which could hinder our sales efforts and have a material adverse effect on our business, results of operations, financial condition, and cash flows.
To help improve, market, and sell our Omnipod products, we have sponsored, and expect to continue to sponsor, market studies to assess various aspects of the functionality and relative efficacy of our products. The data obtained from the studies may be unfavorable to our products or may be inadequate to support satisfactory conclusions. In addition, in the future we may sponsor clinical trials to assess certain aspects of the efficacy of our products. If future clinical trials fail to support the efficacy of our current or future products, our sales may be adversely affected and we may lose an opportunity to secure clinical preference from prescribing clinicians, which may have a material adverse effect on our business, financial condition, and results of operations.
In addition, future clinical studies or articles regarding our existing products or any competing products may be published that either support a claim, or are perceived to support a claim, that a competitor’s product is clinically more effective or easier to use than our products or that our products are not as effective or easy to use as we claim. Additionally, diabetes associations, healthcare providers that focus on diabetes, or other organizations that may be viewed as authoritative could endorse products or methods that compete with our products or otherwise announce positions that are unfavorable to our products. Any of these events may negatively affect our sales efforts and result in decreased revenue.
We may be unable to adequately protect our intellectual property rights.
Our success depends in part on our ability to develop or acquire commercially valuable intellectual property rights and to protect those rights adequately. We rely on a combination of patents, trade secrets, copyright and trademark laws, confidentiality, non-disclosure and assignment of invention agreements, and other contractual provisions and technical measures to protect our intellectual property rights. Despite these measures, any of our intellectual property rights could be challenged, invalidated, circumvented, or misappropriated. Companies could produce competing products using the stolen intellectual property and counterfeit products could also be developed. The latter could be damaging to our reputation if the products do not work properly.
We may not be able to develop additional proprietary technologies that are patentable, and we cannot ensure that our pending patent applications will result in the issuance of patents to us. To protect our intellectual property, we may need to assert claims of infringement or misappropriation against third parties, as we are currently doing in several cases. Any lawsuits that we initiate could be expensive, take significant time, and divert management’s attention from other business concerns. The outcome of litigation to enforce our intellectual property rights is highly unpredictable. A court could determine that some or all of our asserted intellectual property rights are not infringed or misappropriated, or are invalid, or unenforceable. We may not prevail in any lawsuits that we initiate, and the damages or other remedies awarded, if any, may not be commercially valuable. Additionally, we may provoke third parties to assert claims against us, and we may not be successful defending against these claims. The occurrence of any of these events could have a material adverse effect on our business, financial condition, and results of operations.
Claims that our current or future products infringe or misappropriate the proprietary rights of others could adversely affect our ability to sell those products and cause us to incur additional costs.
We have been involved in patent infringement suits in the past and may be again in the future. As the number of companies with whom we compete grows and the functionality of products and technology in different industry segments overlap, the risk of third-party infringement claims increases. Third parties may currently have, or may eventually be issued, patents related to our current or future products or technologies and any of these third parties might make a claim of infringement against us.
Such litigation, regardless of its outcome, could result in the expenditure of significant financial resources and the diversion of management’s time and resources. In addition, such litigation could cause negative publicity, adversely affect prospective users,
cause product shipment delays, limit or prohibit us from manufacturing, marketing, or selling our current or future products, and/or require us to develop non-infringing technology, make substantial payments to third parties, or enter into royalty or license agreements, which may not be available on acceptable terms or at all. If a successful claim of infringement were made against us and we could not develop non-infringing technology or license the infringed or similar technology on a timely and cost-effective basis, our revenue could decrease substantially, and we could be exposed to significant liability. A court could enter orders that temporarily, preliminarily, or permanently enjoin consumers from using our products or us from manufacturing, selling, or importing our products, or could enter an order mandating that we undertake certain remedial activities.
We rely on agreements or licenses to intellectual property or other rights in order to sell our current product and commercialize new products.
We rely on agreements or licenses to intellectual property or other rights in order to sell our current products and commercialize new products. If we cannot retain or obtain these agreements, licenses, or other rights, we may not be able to sell, develop, or commercialize our products. For example, we have commercial agreements with Dexcom and Abbott that allow us to sell Omnipod 5 with integration to Dexcom’s and Abbott’s CGM sensors. The loss of any of these rights could impair the functionality of our products or prevent us from selling our products without significant development and regulatory activities that may not be completed in time to prevent an interruption in the availability of our products to consumers. This could result in a material adverse effect on our business, financial condition, and results of operations.
We also have a partnership with Glooko that allows our products to connect with Glooko’s cloud-based diabetes data management system so that users and healthcare providers can monitor user data, including insulin delivery trends and blood glucose levels. Our agreement with Glooko expires in December 2025. If this agreement is not renewed in the future and we do not develop or contract for an alternative data management system, our business could be materially adversely impacted.
Risks Related to Economic Conditions and Operating Internationally
The continuing worldwide macroeconomic and geopolitical uncertainty as well as the impact of global pandemics may adversely affect our business and prospects.
Continued concerns about the systemic impact of potential long-term and wide-spread recession and geopolitical issues, including wars and terrorism, have contributed to increased market volatility and diminished expectations for economic growth in the world. Our business and results of operations may be adversely impacted by changes in macroeconomic conditions, including inflation, bank failures, rising interest rates and availability of capital markets. Uncertainty about global economic conditions, particularly in countries with government-sponsored healthcare systems, may also cause slower adoption of new technologies such as Omnipod 5, resulting in decreased demand for our products and increased competition, downward pricing pressure, and increased user attrition, which could have a material adverse effect on our business, sales, financial condition, and results of operations.
A weakening of macroeconomic conditions may also adversely affect our suppliers, which could result in interruptions in supply. In addition, continuing social and political concerns and divisions in the United States and throughout the world, could have a material, adverse effect on the economic conditions in markets we serve, and on our results of operations, cash flow and financial position. Elections and political changes in various countries, including the United States, may further exacerbate geopolitical and geoeconomic tensions and market instability.
Another global pandemic could adversely impact our business and financial condition.
Another global pandemic or new variants of COVID-19, and the requirements to take action to help limit the spread of illness, could impact our ability to carry out our business as usual. For example, the COVID-19 pandemic diverted healthcare resources away from the conduct of clinical trials and interrupted the operations of the FDA, which delayed product approval timelines, including for Omnipod 5.
Following the onset of the COVID-19 pandemic, many employees transitioned to a remote or hybrid work environment, which has increased risks associated with our information technology systems and networks. These increased risks include cyber-attacks, computer viruses, disruptions, or shutdowns that could result in a failure to protect our information technology systems and data integrity.
In addition, another global pandemic like COVID-19 could significantly impact our supply chain if the manufacturing plants that produce our products or product components, the distribution centers where we manage our inventory, or the operations of our logistics and other service providers, including third parties that sterilize our products, are disrupted, temporarily closed, or experience worker shortages for a sustained period of time.
Our financial condition or results of operations may be adversely affected by international business risks.
Our international operations are subject to risks that are inherent in conducting business under foreign laws, regulations, and customs. International sales made up 25% of our revenues in 2024 and we expect international sales to contribute significantly to our future growth as we continue to launch Omnipod 5 in additional international markets. We also rely on third-party suppliers located in other countries. A significant portion of our products are manufactured by a third-party contract manufacturer in China, and we also manufacture products at our facility in Malaysia.
Our future and existing international operations may subject us to a number of additional risks and expenses, any of which could harm our operating results. These risks and expenses include:
•political instability and actual or anticipated military or political conflicts;
•trade protection measures, such as tariff increases, and import and export licensing and control requirements;
•negative consequences from changes in or interpretations of tax laws;
•currency fluctuation;
•difficulty in establishing, staffing, and managing international operations;
•difficulties associated with foreign legal systems, including increased costs associated with enforcing contractual obligations in foreign jurisdictions;
•adapting to the differing laws and regulations, business and clinical practices, and consumer preferences in international markets;
•difficulties in managing international relationships, including any relationships that we establish with foreign partners, distributors, or sales or marketing agents; and
•difficulty in collecting accounts receivable and longer collection periods.
In addition, government policies on international trade and investment such as import quotas, capital controls or tariffs, whether adopted by individual governments or addressed by regional trade blocks, can affect the cost of and the demand for our products and services, impact the competitive position of our products, or otherwise adversely affect our ability to sell products in the affected countries. The implementation of more restrictive trade policies, such as more detailed inspections, higher tariffs, or new barriers to entry, could negatively impact our business, results of operations, and financial condition. For example, a government's adoption of “buy national” policies or retaliation by another government against such policies could have a negative impact on our results of operations.
Failure to comply with the U.S. Foreign Corrupt Practices Act and similar worldwide anti-bribery laws could materially adversely affect our business and result in civil and/or criminal sanctions.
The FCPA, the U.K. Bribery Act, and similar anti-bribery laws enacted in other jurisdictions generally prohibit companies and their intermediaries from making improper payments to foreign officials for the purpose of obtaining or retaining business. Because of the predominance of government-sponsored healthcare systems around the world, most of our customer relationships outside of the United States are with governmental entities and are therefore subject to such anti-bribery laws. Because we do business in the United Kingdom, the U.K. Bribery Act also extends to our interaction with public and private sector entities and persons outside the United Kingdom, including in the United States. Our policies mandate compliance with these anti-bribery laws. We operate in parts of the world that have experienced governmental corruption to some degree, and in certain circumstances strict compliance with anti-bribery laws may conflict with local customs and practices. Despite our training and compliance programs, our internal control policies and procedures may not always protect us from reckless or criminal acts committed by our employees or agents. Violations of anti-bribery laws, or allegations of such violations, could disrupt our business and have a material adverse effect on our results of operations, financial condition, and cash flows.
Risks Related to Supply Chain, Operations, and Drug Delivery
Our inventory is produced and maintained in a limited number of locations.
Our products are manufactured in three locations: at our manufacturing facility in the United States, at our newly constructed manufacturing facility in Malaysia, and on manufacturing lines owned by us at a facility located in China that is operated by a third-party contract manufacturer. Political or financial instability, currency fluctuations, the outbreak of pandemics such as COVID-19, labor unrest, transport capacity and costs, port security, weather conditions, natural disasters, or other events that could slow or disrupt port activities and affect foreign trade are beyond our control and could materially disrupt our supply of product from China, increase our costs, and/or adversely affect our results of operations. Further, following the COVID-19 pandemic there may be increased pressure for U.S. medical device companies to reduce dependency on China for their supply chain. In addition, substantially all of our inventory in the United States is held at a single location in Massachusetts and our inventory in Europe is maintained by a third-party logistics entity primarily at a single location in the Netherlands. We take precautions to ensure that our third-party contract manufacturer and logistics entity safeguard our assets, including maintaining
insurance, enacting health and safety protocols, and storing computer data offsite. However, a natural or other disaster, such as a fire or flood, could cause substantial delays in our operations, damage or destroy our manufacturing equipment and/or inventory, and cause us to incur additional expenses. Further, the insurance we maintain may not be adequate to cover our losses in any particular case. With or without insurance, damage to our facility, manufacturing equipment, inventory, or other property, or to any of our suppliers, may have a material adverse effect on our business, financial condition, and results of operations.
We are dependent upon third-party suppliers, making us vulnerable to supply problems and price fluctuations, and we may not be able to obtain sufficient components or raw materials on a timely basis or at all.
The manufacture of our products requires the timely delivery of sufficient amounts of quality components and materials from many suppliers in various countries. We work closely with our suppliers to ensure the continuity of supply, but we cannot guarantee these efforts will always be successful. For example, given the recent worldwide semiconductor chip shortage, we have entered into “take or pay” contracts with suppliers but cannot guarantee our suppliers will meet their obligations under these contracts. We have also seen significant price increases for various components and raw materials, including for semiconductor chips. We do not have long-term supply agreements with all of our suppliers, and, in many cases, we, or our contract manufacturer, make purchases based on individual purchase orders. In some cases, our agreements with suppliers can be terminated by either party upon short notice. Additionally, while efforts are made to diversify our sources of components and materials, in certain instances we acquire components and materials from a sole supplier. Also, due to the stringent regulations and requirements of the FDA and similar regulatory agencies in other countries regarding the manufacture of our products, we may not be able to quickly establish additional or replacement sources for some components or materials.
Our reliance on these third-party suppliers, as well as on our third-party manufacturer, subjects us to other risks that could harm our business, including:
•our suppliers may give other customers’ needs higher priority than ours affecting their ability to deliver products to us in a timely manner, as we are not a major customer of many of our suppliers;
•we may not be able to obtain an adequate supply of materials or components in a timely manner or on commercially reasonable terms;
•our suppliers may make errors in manufacturing that could negatively affect the safety or efficacy of our products, cause delays in shipment, or negatively affect our reputation;
•we may have difficulty locating and qualifying alternative suppliers for our sole-source supplies;
•switching components may require product redesign and submission to the FDA of a new 510(k);
•thefts of our trade secrets and intellectual property could occur with the third-party supply process;
•the occurrence of a fire, natural disaster, or other catastrophe, impacting one or more of our suppliers, may affect their ability to deliver products to us in a timely manner;
•our suppliers may encounter financial hardships unrelated to our demand, which could inhibit their ability to fulfill our orders and meet our requirements, and
•our suppliers may fail to comply with environmental, conflict minerals, anti-slavery, or other applicable laws, thus impairing our ability to source materials.
An interruption, delay, or inability to obtain components, products, and raw materials from our third-party suppliers at acceptable prices in a timely manner, could hinder our ability to manufacture our products in a timely or cost-effective manner and have a material adverse effect on our business and results of operations.
Our manufacturing process is highly complex and subject to regulation; as demand for our products increase, we may experience manufacturing difficulties, including not effectively managing the start-up of new manufacturing lines or issues with our third-party contract manufacturer, which could harm our business.
The manufacture of our product is highly exacting and complex, due in part to strict regulatory requirements. While we manufacture our products in the United States and at our new facility in Malaysia, a third-party contract manufacturer in China manufactures and supplies a significant portion of our inventory. We and our contract manufacturer may encounter problems during manufacturing for a variety of reasons, including equipment malfunction, failure to follow specific protocols and procedures, defective raw materials, and environmental factors. These issues could lead to launch delays, product shortage, unanticipated costs, lost revenues, and damage to our reputation. A failure to identify and address manufacturing problems prior to the release of products to our customers may also result in a quality or safety issue. Significant manufacturing problems could have a material adverse effect on our business, results of operations, financial condition, and cash flows. In addition, as we commence operation of new manufacturing lines, we could experience quality issues and unexpected operational delays that
decrease our gross margins and cause a shortage of product supply. Failure to scale manufacturing appropriately to meet future demand could also result in product shortages.
Our non-insulin Drug Delivery product line faces challenges which, if not met, may impair its future success.
Our non-insulin Drug Delivery product line involves the development, manufacture, and sale of a modified Pod for delivery of a specific drug other than insulin. Substantially all of our commercialized Drug Delivery revenue consists of sales of a customized version of our product for use in Amgen’s Neulasta Onpro kit under an agreement that expires in December 2028. The marketing and sales initiatives driving this product line differ markedly from those on which we rely for our sales of Omnipod products to treat diabetes since the non-insulin drug delivery devices depend on marketing and sales to pharmaceutical companies, not to users and clinicians. We expect that the future results of our Drug Delivery product line will face several challenges, including:
•our identification of drug delivery opportunities for a modified Pod;
•our achievement of satisfactory development and pricing terms with the pharmaceutical companies that sell such drugs;
•our development of appropriate modifications to our Omnipod technology to address the needs and parameters required for the respective drug-delivery opportunities;
•manufacturing issues relating to the modified Pod;
•long lead-times associated with the development, regulatory approvals, and ramp up applicable to the use of modified Pods for the delivery of such drugs;
•relatively small number of modified Pods needed to address each drug-delivery opportunity;
•uncertainties regarding the market acceptance of such drugs and the modified Pod as an appropriate delivery device;
•uncertainties relating to the success of the pharmaceutical companies in marketing and selling such drugs as well as the modified Pods as the appropriate delivery devices;
•intense competition in the drug-delivery industry, including from competitors which have substantially greater resources;
•maintaining appropriate gross margins; and
•regulatory requirements and reimbursement rates associated with such drugs.
If we are unsuccessful in overcoming one or more of these challenges, or if our agreement with Amgen is terminated or not renewed, our financial results could be negatively impacted.
Risks Related to Government Regulation and Litigation
We are subject to extensive government regulation, which could restrict the sales and marketing of our products, could cause us to incur significant costs, and impact our profitability and competitiveness.
Our medical device products and operations are subject to extensive regulation by the FDA and various other federal, state, local, and foreign government authorities. Government regulation of medical devices is meant to assure their safety and effectiveness, and includes regulation of, among other things:
•design, development and manufacturing;
•testing, labeling, and content and language of instructions for use and storage;
•clinical trials;
•regulatory clearances and approvals, including premarket clearance and approval;
•product safety;
•advertising and promotion;
•marketing, sales, and distribution;
•conformity assessment procedures;
•product traceability and record keeping procedures;
•product complaints, complaint reporting, recalls and field safety corrective actions;
•post-market surveillance, including reporting of deaths or serious injuries and malfunctions that, if they were to recur, could lead to death or serious injury;
•post-market studies; and
•product import and export.
Before a new medical device, or a significant modification of a medical device, including a new use of or claim for an existing product, can be marketed in the United States, it must first receive regulatory clearance, unless an exemption applies. Obtaining such regulatory clearance can be expensive and lengthy. Delays in obtaining or inability to obtain future clearances could adversely affect our ability to introduce new or enhanced products in a timely manner, which in turn could harm our revenue and future profitability.
We also are subject to numerous post-marketing regulatory requirements, which include quality system regulations related to the manufacture of our devices, labeling regulations, and medical device reporting regulations. The last of these regulations requires us to report to the FDA if our devices cause or contribute to a death or serious injury, or malfunction in a way that would likely cause or contribute to a death or serious injury if the malfunction recurred. If we fail to comply with present or future regulatory requirements that are applicable to us, we may be subject to enforcement action by the FDA, which may include any of the following sanctions:
•untitled letters, warning letters, fines, injunctions, consent decrees, and civil penalties;
•customer notification, or orders for repair, replacement, or refunds;
•voluntary or mandatory recall or seizure of our current or future products;
•administrative detention by the FDA of medical devices believed to be adulterated or misbranded;
•operating restrictions or suspension or shutdown of production;
•refusing our requests for regulatory clearance of new products, new intended uses, or modifications to our Omnipod products;
•rescinding, suspending, or withdrawing clearance that has already been granted; and
•criminal prosecution.
The occurrence of any of these events may have a material adverse effect on our business, financial condition, and results of operations.
In addition, the FDA may change its clearance and approval policies, adopt additional regulations, revise existing regulations, or take other actions that may prevent or delay approval or clearance of our products under development or impact our ability to modify our currently approved or cleared products on a timely basis or make it more difficult and costly to produce, market, and distribute existing products.
We also sell our products in Canada, Australia and certain countries in Europe and the Middle East. As a result, we are required to comply with additional foreign regulatory requirements. As we expand our sales efforts internationally, we may need to obtain additional foreign approval certifications. Failure to fulfill foreign regulatory requirements on a timely basis or at all could adversely affect our ability to grow our business.
If we, our contract manufacturer or our component suppliers fail to comply with the FDA’s quality system regulations, the manufacturing and distribution of our devices could be interrupted, and our sales and operating results could suffer.
We and our contract manufacturers are required to comply with the FDA’s QSR, which is a complex regulatory framework that covers the procedures and documentation of the design, testing, production, control, quality assurance, sterilization, labeling, packaging, storage, shipping, and servicing of our devices. Compliance with applicable regulatory requirements is subject to continual review and is monitored rigorously through periodic, sometimes unannounced, inspections by the FDA. We cannot assure you that our facilities or our contract manufacturers’ facilities will pass any future quality system inspection. If our or our contract manufacturers’ facilities fails a quality system inspection or otherwise fails to adhere to QSR requirements, this could delay production of our products and lead to business disruption; failure to take adequate and timely corrective action in response to an adverse quality system inspection or QSR violation could result in business disruption; failure to take adequate and timely corrective action in response to an adverse quality system inspection or QSR violation could result in fines, difficulties in obtaining regulatory clearances, recalls, enforcement actions, including injunctive relief or consent decrees, or other consequences, which could have a material adverse effect on our financial condition or results of operations.
Malfunction of our products could lead to recalls or safety alerts or litigation and have a significant adverse impact on us.
The FDA and similar governmental bodies in other countries have the authority to require the recall of our products if we or our contract manufacturer fails to comply with relevant regulations pertaining to manufacturing practices, labeling, advertising, or promotional activities, or if new information is obtained concerning the safety or efficacy of these products. A government-mandated recall could occur if the FDA finds that there is a reasonable probability that the device would cause serious, adverse health consequences or death. A voluntary recall by us could occur as a result of any material deficiency in a
device, such as manufacturing defects, labeling deficiencies, packaging defects, or other failures to comply with applicable regulations. Adverse events involving our products have been reported to us in the past, and we cannot guarantee that they will not occur in the future. Any corrective action, whether voluntary or involuntary, may require the dedication of our time and capital, could distract management from operating our business and potentially harm our reputation and financial results. We may initiate voluntary recalls involving our products in the future that we determine do not require notification to the FDA. If the FDA disagrees with our determinations, it could require us to report those actions as recalls and could take enforcement action against us for failing to report the recalls when they were conducted. In the event of a product malfunction, we may also be subject to liability claims, be required to bear other costs, or take other actions that may have a negative impact on our future sales and our ability to generate profits.
We may be subject to enforcement action if we engage in improper marketing or promotion of our products.
Our promotional materials and training methods must comply with FDA and other applicable laws and regulations, including the prohibition of the promotion of unapproved, or off-label, use. Doctors may prescribe our products off-label, as the FDA does not restrict or regulate a doctor’s choice of treatment within the practice of medicine. However, if the FDA determines that our promotional materials or training constitutes promotion of an off-label use, it could subject us to regulatory or enforcement actions, including the issuance of an untitled letter, a warning letter, injunction, seizure, civil fine, or criminal penalties. It is also possible that other federal, state, or foreign enforcement authorities might take action if they consider our promotional or training materials to constitute promotion of an off-label use, which could result in significant fines or penalties under other statutory authorities, such as laws prohibiting false claims for reimbursement. In that event, our reputation could be damaged, and adoption of our products could be impaired. Although our policy is to refrain from statements that could be considered off-label promotion of our products, the FDA or another regulatory agency could disagree with our characterization of certain statements and conclude that we have engaged in off-label promotion. In addition, the off-label use of our products may increase the risk of product liability claims. Product liability claims are expensive to defend and could divert management’s attention, result in substantial damage awards against us, and harm our reputation.
If we fail to comply with Medicare, Medicaid, fraud and abuse, and other healthcare regulations, we could be subject to substantial penalties and/or be excluded from participation in government programs.
Our relationships with customers and third-party payors are subject to broadly applicable fraud and abuse and other healthcare laws and regulations that may constrain our sales, marketing, and other promotional activities by limiting the kinds of financial arrangements, including sales programs and certain customer and product support programs, we may have with hospitals, physicians, customers, or other potential purchasers of medical devices. These laws include, among others, the federal healthcare Anti-Kickback Statute, the federal civil False Claims Act, other federal healthcare false statement and fraud statutes, the Open Payments program, the Civil Monetary Penalties Law, and analogous fraud and abuse and transparency laws in most states, as described in “Item 1—Business—Government Regulation.”
We conduct various marketing and product training activities that involve making payments to healthcare providers and entities. While we believe and make every effort to ensure that our business arrangements with third parties and other activities and programs comply with all applicable laws, these laws are complex and our activities may be found not to be compliant with one of these laws, which may result in significant civil, criminal, and/or administrative penalties, fines, damages, and exclusion from participation in federal healthcare programs. Even an unsuccessful challenge or investigation into our practices could cause adverse publicity, and be costly to respond to, and thus could have a material adverse effect on our business, financial condition, and results of operations. Our compliance with Medicare and Medicaid regulations may be reviewed by federal or state agencies, including the OIG, CMS, and the Department of Justice, or may be subject to whistleblower lawsuits under federal and state false claims laws. To ensure compliance with Medicare, Medicaid, and other regulations, government agencies conduct periodic audits of us to ensure compliance with various supplier standards and billing requirements.
Risks Related to Information Technology, Privacy and Security
We are subject to complex and evolving laws and regulations regarding privacy and data protection, many of which are subject to change and uncertain interpretation, which could result in claims, changes to our business practices, monetary penalties, increased cost of operations, or declines in user growth or engagement, or otherwise harm our business.
We are subject to a variety of laws and regulations relating to privacy and data protection. The introduction of new products or expansion of our activities in certain jurisdictions may subject us to additional laws and regulations. For example, data privacy laws at the federal and state levels protect the confidentiality of certain health information and restrict the use and disclosure of that protected information. In particular, the U.S. privacy rules under HIPAA protect medical records and other personal health information by limiting their use and disclosure, giving individuals the right to access, amend, and seek accounting of their own health information, and limiting most use and disclosures of health information to the minimum amount reasonably necessary to accomplish the intended purpose. At least 15 states have adopted new privacy laws in the past few years. For example, CCPA
and CPRA provide privacy rights and consumer protection for residents of California, including the right to know what personal information is collected, the right to know whether the data is sold or disclosed and to whom, the right to request a company to delete the personal information collected, the right to opt-out of the sale of personal information, and the right to non-discrimination in terms of price or service when a consumer exercises a privacy right. The California laws have served as a model for many subsequently adopted laws in other states like Colorado and Virginia. California and other states’ laws apply more broadly and now or in the future may reach data we hold that relates to employees and healthcare providers, not just customers. In addition, data security protection laws passed by the federal government and many states require notification to data subjects, including customers and others, when there is a security breach of personal data. If we fail to comply with these regulations, we could be subject to civil sanctions, including fines and penalties for noncompliance.
In addition, foreign data protection, privacy, and other laws and regulations can be more restrictive than those in the United States. Data localization laws in some countries generally mandate that certain types of data collected in a particular country be stored and/or processed within that country. We could be subject to audits in Europe and around the world, particularly in the areas of consumer and data protection, as we continue to grow and expand our operations. Legislators and regulators may make legal and regulatory changes, or interpret and apply existing laws, in ways that make our products less useful to users, require us to incur substantial costs, expose us to unanticipated civil or criminal liability, or cause us to change our business practices. These changes or increased costs could negatively impact our business and results of operations in material ways. For example, the GDPR imposes requirements in the European Economic Area relating to, among other things, consent to process personal data of individuals, the information provided to individuals regarding the processing of their personal data, the security and confidentiality of personal data, notifications in the event of data breaches, and use of third-party processors. If we fail to comply with these standards, we could be subject to criminal penalties and civil sanctions, including significant fines and penalties.
The increased scope of regulation around the world may require expanded compliance programs and resources. As our efforts to gain insights from data increase for the operation of our products and services and for the improvement of business processes, including sales and marketing, our exposure to increasingly complex privacy regulation may impede our ability to use data in this way.
We rely on the proper function, availability, and security of our product and information technology systems; a successful cyber-attack or other breach or disruption of our product or these systems could have a material adverse effect on our business and results of operations.
We rely on IT systems to process, transmit, and store electronic information, including personal, financial, and sensitive medical information. Our IT systems support various business processes, including sales, shipping, billing, customer service, procurement, supply chain, manufacturing, and accounts payable. In addition, we use enterprise IT systems for internal financial reporting and to comply with external financial reporting, legal, and tax regulatory requirements. Many of our systems are cloud-hosted and managed by third-party vendors who may have access to confidential business, employee, healthcare professional, and/or customer information. Our IT systems are vulnerable to damage, disruptions, or shutdowns due to various factors such as viruses, hacking, power outages, user error, hardware failures, and catastrophic events. Failure to protect our IT systems could lead to unauthorized access to customer data, theft of intellectual property or other misappropriation of assets, loss of key data, or disruption of operations.
If our product is breached or our information technology systems are breached or suffer severe damage, disruption, or shutdown and we are unable to effectively resolve the issues in a timely manner, our reputation, business, and operating results may be materially adversely affected.
Failure to maintain the privacy and security of our customer, third-party payor, employee, supplier, or Company information could result in substantial costs and/or subject us to litigation, enforcement actions, and reputational damage.
Our business, like that of most medical device manufacturers, involves the receipt, storage, and transmission of customer information and payment and reimbursement information, as well as confidential information about third-party payors, our employees, our suppliers, and our Company. Our information systems are vulnerable to an increasing threat of continually evolving cybersecurity risks. Unauthorized parties may attempt to gain access to our systems or information through fraud or other means of deceiving our employees or third-party service providers. Hardware, software, or applications we develop or obtain from third parties may contain defects in design or manufacture or other problems that could unexpectedly compromise information and device security. The methods used to obtain unauthorized access, disable or degrade service, or sabotage systems are also constantly changing and evolving, and may be difficult to anticipate or detect for long periods of time. We have implemented and regularly review and update processes and procedures to protect against unauthorized access to or use of secured data and to prevent data loss. However, the ever-evolving threats mean we must continually evaluate and adapt our systems and processes, and our efforts may not be adequate to safeguard against all data security breaches, misuse of data, or sabotage of our systems. Any future significant compromise or breach of our data security, whether external or internal, or
misuse of customer, third-party payor, employee, supplier, or Company data, could result in significant costs, lost sales, fines, lawsuits, and damage to our reputation. In addition, as the regulatory environment related to information security, data collection and use, and privacy becomes increasingly rigorous, with new and constantly changing requirements applicable to our business, compliance with those requirements could also result in additional costs.
The rapidly-changing technical and regulatory environment and our AI-related activities may have an adverse effect on our business.
We develop and license from other developers, and deploy, AI tools including Generative AI tools for use in our operations. Our teams collaborate on the development of responsible AI policies and practices and deployment of AI tools in accordance with those policies and practices, which are in turn based on relevant laws and standards, including the EU AI Act (which is taking effect in stages, through August 2026). While we anticipate being able to capitalize on opportunities using AI tools including Generative AI tools, improving efficiencies and creating more personalized experiences, doing so is not without risk. Risks include potential inappropriate disclosure of personal information and confidential information and potential use of inaccurate information contained in Generative AI outputs.
Risks Related to Our Debt
Our Credit Agreement imposes restrictions on us that may adversely affect our ability to operate our business.
Our Credit Agreement contains covenants that restrict our ability, and that of our subsidiaries, to engage in certain transactions, including, among other things, limitations on our ability to incur additional indebtedness, make asset dispositions, create or permit liens, sell, transfer or exchange assets, guarantee certain indebtedness, and make acquisitions or other investments. These restrictions may impair our ability to respond to changing business and economic conditions and may make it more difficult for us to obtain additional capital and to pursue business opportunities, including potential acquisitions.
Conversion of any of our Convertible Senior Notes may dilute the ownership interest of existing stockholders or depress our stock price.
The conversion of some or all our Convertible Senior Notes may dilute the ownership interests of existing stockholders. Any sales in the public market of any of our common stock issuable upon such conversion could adversely affect prevailing market prices of our common stock. In addition, conversion of the Convertible Senior Notes could depress the price of our common stock.
General Risks
Our success depends on our ability to attract, motivate, and retain key personnel.
As Insulet continues to quickly grow, our success is highly dependent on attracting the right talent, retaining our employees, and keeping them engaged and focused on our mission. Amidst significant competition for talent, we continue to support our employees working remotely, where feasible. While this policy aids in recruitment and breadth of candidate pools, it could impact job performance in some cases. In addition, the sale and after-sale support of Omnipod products require a complex infrastructure of field sales personnel, diabetes educators, customer support, insurance specialists, and billing and collections personnel. Recruiting, training, managing, motivating, and retaining these employees, especially in geographically dispersed teams, presents challenges. If we are unable to successfully recruit or retain employees as needed, we could experience significant operational disruptions, which could in turn negatively impact our customers, our reputation and our financial condition.
Acquisitions or investments in new businesses, products, or technologies could disrupt our business.
If we are presented with appropriate opportunities, we may pursue acquisitions or investments in complementary businesses, products, or technologies. For example, in 2022, we acquired one of our suppliers. We may not complete transactions in a timely manner, on a cost-effective basis, or at all, and we may not realize the expected benefits of any acquisition or investment. Even if we are successful in making an acquisition, the products and technologies that we acquire may not be successful or may require significantly greater resources and investments than we originally anticipated. We could also experience negative effects on our results of operations and financial condition from acquisition-related charges, amortization of intangible assets, and asset impairment charges if the acquisitions are not as successful as we originally anticipate. Acquisitions also present risks, uncertainties, and disruptions associated with the integration process, including difficulties in the integration of the operations of any acquired company, integration of acquired technology with our products, and the potential loss of key employees, customers, distributors, or suppliers of the acquired businesses. In addition, integration of an acquired business may require management resources that otherwise would be available for development of our existing business. If an acquired business fails to operate as anticipated or cannot be successfully integrated into our existing business, our stock price, business, financial
condition, and results of operations could be materially and adversely affected. Furthermore, we may have to incur debt or issue equity to pay for any future acquisitions or investments, the issuance of which could be dilutive to our existing stockholders.
We may need to raise additional funds in the future, and these funds may not be available on acceptable terms or at all.
We may in the future seek additional funds from public and private stock or debt offerings, borrowings under credit lines, or other sources, and we may need to raise additional debt or equity financing to repay our outstanding debt obligations. If we issue equity or debt securities to raise additional funds, our existing stockholders may experience dilution, and the new equity or debt securities may have rights, preferences, and privileges senior to those of our existing stockholders. In addition, if we raise additional funds through collaboration, licensing, or other similar arrangements, it may be necessary to relinquish valuable rights to our potential future products or proprietary technologies or grant licenses on terms that are not favorable to us. Our ability to raise additional capital may be adversely impacted by economic conditions, including inflation, higher interest rates, and worldwide political unrest, and we may not be able to raise any necessary capital on acceptable terms, or at all. If we are unable to raise additional capital due to these or other factors, such as a worldwide or U.S. financial crisis, we may need to further manage our operational expenses, including potentially curtailing planned product development activities. In addition, we may not be able to execute our business plan, take advantage of future opportunities, or respond to competitive pressures or unanticipated customer requirements. If any of these events occur, it could adversely affect our business, financial condition, and results of operations.
The price of our common stock may be volatile.
The market price of our common stock is affected by a number of factors, including factors related to our operating performance as a high-growth company and the operating performance of our competitors. At times, the fluctuations in the market price of our common stock have been unrelated or disproportionate to our operating performance. In particular, the U.S. equity markets have at times experienced significant price and volume fluctuations that have affected the market prices of equity securities of many medical device and technology companies. Also, in 2023, ongoing adoption of the GLP-1 class of drugs in diabetes and news surrounding the expansion of use of GLP-1 drugs in obesity led to speculation regarding the impact of GLP-1 drugs on the insulin therapy market. We believe this negatively impacted the stock prices of companies in the medical device industry, including ours. Broad market and industry factors such as these could materially and adversely affect the market price of our stock, regardless of our actual operating performance.
Changes in tax laws or exposures to additional tax liabilities could negatively impact our operating results.
We are subject to income taxes, as well as taxes that are not income-based, in both the U.S. and jurisdictions outside of the U.S. Changes in tax laws or regulations in the jurisdictions in which we operate, including the U.S. and as led by the Organization for Economic Cooperation and Development for a global minimum tax, could negatively impact the Company’s effective tax rate, results of operations and cash flows. In addition, our future effective tax rate could be unfavorably affected by numerous other factors including a change in the interpretation of tax rules and regulations in the jurisdictions in which we operate, a change in our geographic earnings mix, or a change in the measurement of our deferred taxes. We are also subject to ongoing tax audits in various jurisdictions, and tax authorities may disagree with certain positions we have taken and assess additional taxes.
A material weakness in our internal control over financial reporting could result in material misstatements in our financial statements and cause us to fail to meet our reporting and financial obligations.
In 2024, we worked to remediate a material weakness related to the effectiveness of information technology general controls over systems that support our financial reporting outside of North America, which has now been fully remediated. We cannot, however, guarantee that additional material weaknesses will not arise in the future. The development of new material weaknesses in our internal control over financial reporting could result in material misstatements in our financial statements and cause us to fail to meet our reporting and financial obligations, which in turn could have a negative impact on our financial condition, results of operations or cash flows, restrict our ability to access the capital markets, require significant resources to correct the material weaknesses or deficiencies, subject us to fines, penalties or judgments, harm our reputation, or otherwise cause a decline in investor confidence and cause a decline in the market price of our stock.
Market Risk. See Item 7A for additional risks relating to interest rates, market-sensitive instruments, and foreign currency exchange.
Item 1B. Unresolved Staff Comments
None.
Item 1C. Cybersecurity
We manage cyber risk on a daily basis, as we face a multitude of threats ranging from ransomware, phishing attacks, business email compromise, and a wide array of other cyber-criminal tactics aimed at impacting our operations and compromising our sensitive information. Our customers, suppliers, subcontractors, and partners face similar cybersecurity threats, and a cybersecurity incident impacting us or any of these entities could materially adversely affect our operations, performance and results of operations. Accordingly, we have invested in resources (people, processes, and technology) aimed at identifying, assessing, and responding to cyber threats.
Our Board of Directors (“Board”) oversees management’s processes for identifying and mitigating risks, including cybersecurity risks, to help align our risk exposure to our strategic objectives. While the Board reviews the Company’s cybersecurity program annually, the Nominating, Governance, and Risk Committee (“NGR Committee”) of the Board has primary responsibility for cybersecurity as part of its risk oversight mandate. The NGR Committee is updated on cybersecurity matters from our Chief Information Security Officer (“CISO”) and members of the CISO’s team at least twice annually. The CISO discusses management’s actions to identify and detect threats and reviews the structure of and enhancements to the Company’s defenses as well as management’s progress on its cybersecurity strategic roadmap. The NGR Committee Chair reports to the full Board after each Committee meeting, including information relating to the cybersecurity discussions.
Our Cybersecurity organization, which includes infrastructure security, product security, technology risk management, and security awareness and culture is led by our CISO. Our CISO, reports directly to our Chief Technology Officer (“CTO”) and is responsible for developing and implementing our cybersecurity program, including setting the directional security strategy and continuous improvement plans for the overall security program. Our CISO has over a decade of experience leading cyber-security and technology risk management programs in both healthcare and medical device manufacturing organizations and maintains multiple industry certifications, including Certified Information Systems Security Professional and Certified Information Security Manager.
The CTO ensures cyber-security measures are prioritized across research and development, software engineering, and our information technology functions. The CTO supports the CISO in chairing a quarterly Technology Risk Committee aimed at providing proper oversight and governance of the cybersecurity program, remediation of identified technology risks, and execution of the cybersecurity strategy. Our processes for assessing, identifying, and managing cybersecurity-related risks is also included within our overall enterprise risk management (ERM) program.
We leverage the National Institute of Standards and Technology (“NIST”) Cybersecurity Framework to better manage and respond to cybersecurity risks in protecting our infrastructure and sensitive data. We have mapped and base-lined our people, processes, and technology in alignment with the categories defined in the NIST industry standard framework: Identify, Protect, Detect, Respond, and Recover. Additionally, Insulet’s information security management system is ISO 27001 and 27701 certified. For the seventh consecutive year, Insulet received re-certification from the ISO, which is the recognized standard for information security management and privacy best practices that adheres to the highest international data security standards. In 2024, we also added ISO certifications specific to Cloud Computing and Health Informatics, which pairs with and supports other applicable medical device and international certification requirements.
We regularly assess the threat landscape and take a holistic view of cybersecurity risks, with a layered cybersecurity strategy based on prevention, detection, and mitigation. We maintain a cybersecurity risk register, and cybersecurity team leaders hold monthly meetings to discuss and prioritize risks as well as the status of any remediation activity. Key facets of our cybersecurity program include:
•24/7 cyber monitoring. Our security operations center is located in multiple time zones to ensure around-the-clock coverage and timely threat detection and response.
•External Threat Landscape Assessment. Our integrated privacy, legal, and security teams are continuously monitoring for any external threat that may impact our operations. Third-party threat intelligence feeds are leveraged to monitor Insulet’s digital footprint and activity that may cause brand damage.
•Insider Risk Detection. We have targeted tools aimed at detecting insider threats and suspicious data movement.
•Cloud and Vulnerability Management. To enhance cloud and data security, we reduce the attack surface by establishing secure defaults, implementing least privilege, and monitoring configurations continuously. As part of vulnerability and overall security posture management, we have a focused cross-functional team that meets regularly to address issues identified by security scans and security configuration checks to maintain hygiene of Insulet’s computing devices.
•Testing and Audits. Regular penetration testing, incident response tabletop testing, and audits are performed by trusted third-party security consultants. These final reports and gap analysis documents are logged into our risk register as appropriate.
•Operating Technology (“OT”) Visibility. As a manufacturer of medical devices, OT is a vital component of our business operations. Interconnectedness between OT technology and other business critical information technology
infrastructure can create a material cyber risk. Insult deploys segmentation and OT-specific monitoring capabilities to mitigate and monitor this risk.
•Vendor Management. Vendors and key partners are subject to Insulet’s Vendor Risk assessment process and subsequently monitored by our threat intelligence capability, which tracks our key vendors and suppliers.
•Training and Culture. Training, awareness, and incorporating security into Insulet’s culture is key to reducing risk around common threats such as phishing. We have an operational information security training program for all employees. In addition to annual trainings, we require and monitor completion of frequent “nanolearning” targeted trainings. These quick trainings provide constant reminders to our employees to be vigilant and give them the tools to recognize and protect against cyber threats. We also conduct phishing simulations to test effectiveness of our training program with the aim of reducing the percentage of employees who click on suspicious emails.
We are intensely focused on protecting the security of our products; our guiding principle of “security and privacy by design” underlies all of our product development. We have a cybersecurity team embedded with our research and development group to deliver on this mission as well as a Product Cybersecurity Risk Management Policy that aligns with FDA guidance. Omnipod 5 incorporates cybersecurity by design principles, which includes secure data transfer between the Pod, Controller, cloud storage, and compatible CGMs. Our Secure Software Development Lifecycle enforces application testing and continuous monitoring to identify security risks. Omnipod 5 is certified by ISO (27001, 27017 and 27799) and the U.K. Cyber Essentials. Omnipod 5 incorporates authentication, encryption, and cybersecurity protection to ensure only trusted devices and authorized people can access the system.
Notwithstanding the extensive approach we take to cybersecurity, we may not be successful in preventing or mitigating a cybersecurity incident that could have a material adverse effect on us. Should a cyber incident occur, we have in place the Insulet Cybersecurity Incident Response Procedure (“CIRP”) and Crisis Management Plan, which are designed to enable us to respond efficiently to any incidents. Pursuant to the CIRP, cybersecurity incidents are reviewed and rated by our CISO and his team. A cybersecurity incident rated at predefined risk levels will be escalated to CTO, the Chief Compliance Officer, and the General Counsel and assessed for materiality and disclosure to the CEO and the Board. Our internal Disclosure Committee will review any planned public disclosures or filings. CIRP provides the organizational and operational structure to respond to incidents that may affect the confidentiality, integrity or availability of our information systems.
We currently do not believe that risks from cybersecurity threats, including as a result of any previous cybersecurity incidents, have materially affected the Company’s business strategy, results of operations, or financial condition. While Insulet maintains cybersecurity insurance, the costs related to cybersecurity threats or disruptions may not be fully insured. See Item 1A. “Risk Factors” for a discussion of cybersecurity and other risks which may impact Insulet.
Item 2. Properties
We own a 350,000 square foot facility in Acton, MA, which houses both our headquarters and our U.S. manufacturing. We also own a 400,000 square foot facility in Malaysia, which houses our new manufacturing facility and office space. As of December 31, 2024, we leased a total of 11 facilities in 6 countries consisting of approximately 297,000 square feet of office, research and development, and warehousing space and other related facilities, primarily in North America, Asia and Europe. Additional information regarding our leases is provided in Note 14 to the consolidated financial statements included in Item 8 of this Form 10-K.
Item 3. Legal Proceedings
The information required by this Item is provided under “Legal Proceedings” in Note 18 to the consolidated financial statements included in Item 8 of this Form 10-K and is incorporated herein by reference.
Item 4. Mine Safety Disclosures
Not applicable.
PART II
Item 5. Market for Registrant’s Common Equity, Related Stockholder Matters and Issuer Purchases of Equity Securities
Market Information
Our common stock is listed on The NASDAQ Global Market (“NASDAQ”) under the trading symbol PODD.
Holders of Record
As of February 13, 2025, there were 6 registered holders of record of our common stock.
Recent Sales of Unregistered Securities
None.
Stock Performance Graph
The following graph shows the cumulative total return on $100 invested in each of our common stock, the NASDAQ Composite Index, the NASDAQ Health Care Index, and the S&P 500 Index for the five-year period beginning on December 31, 2019, and ending on December 31, 2024, assuming reinvestment of all dividends. The historical stock price performance on the graph below is not necessarily indicative of future stock price performance.
| | | | | | | | | | | | | | | | | | | | |
| 2019 | 2020 | 2021 | 2022 | 2023 | 2024 |
| Insulet Corporation | $ | 100 | | $ | 149 | | $ | 155 | | $ | 172 | | $ | 127 | | $ | 152 | |
NASDAQ Composite
| $ | 100 | | $ | 144 | | $ | 174 | | $ | 117 | | $ | 167 | | $ | 215 | |
| NASDAQ Health Care | $ | 100 | | $ | 130 | | $ | 125 | | $ | 100 | | $ | 106 | | $ | 105 | |
S&P 500(1) | $ | 100 | | $ | 118 | | $ | 152 | | $ | 125 | | $ | 158 | | $ | 197 | |
(1) Our common stock was added to S&P 500 Index in March 2023.
The material in this performance graph shall not be deemed to be filed with the SEC and is not incorporated by reference in any filing of Insulet Corporation under the Securities Act of 1933, as amended or the Securities Exchange Act of 1934, as amended, whether made on, before, or after the date of this filing and irrespective of any general incorporation language in such filing.
Dividends
We currently intend to retain any earnings to finance research and development and the operation and expansion of our business and do not anticipate paying any cash dividends for the foreseeable future.
Issuer Purchases of Equity Securities
None.
Securities Authorized for Issuance Under Equity Compensation Plans
The information required by this Item is provided under Item 12. Security Ownership of Certain Beneficial Owners and Management and Related Stockholder Matters.
Item 6. Reserved
Item 7. Management’s Discussion and Analysis of Financial Condition and Results of Operations
The following discussion and analysis of our financial condition and results of operations should be read in conjunction with our consolidated financial statements and the accompanying notes included in this annual report. The following discussion may contain forward-looking statements that reflect our plans, estimates, and beliefs, which are subject to risks, uncertainties, and assumptions. Our actual results could differ materially from those discussed in these forward-looking statements. Factors that could cause or contribute to these differences include those discussed under the headings “Risk Factors” and “Forward-Looking Statements.”
Overview
Our mission is to improve the lives of people with diabetes. We are primarily engaged in the development, manufacture, and sale of our proprietary Omnipod product platform, a continuous insulin delivery system for people with insulin-dependent diabetes. The Omnipod platform includes: the most recent generation Omnipod 5, and its predecessors Omnipod DASH and Classic Omnipod, all of which eliminate the need for multiple daily injections using syringes or insulin pens or the use of pump and tubing. Omnipod 5, which builds on our Omnipod DASH mobile platform, is a tubeless automated insulin delivery system that integrates with a CGM to manage blood sugar and is fully controlled by a compatible personal smartphone or Omnipod 5 Controller. The CGM is sold separately by third parties. Omnipod DASH features a secure Bluetooth enabled Pod that is controlled by a smartphone-like PDM with color touch screen user interface. We have been phasing-out Classic Omnipod as we launch Omnipod 5.
Our financial objective is to sustain profitable growth. To achieve this, we launched Omnipod 5 in the United States in 2022 and in the United Kingdom and Germany in June and August 2023, respectively. In June 2024, we launched our full market releases of Omnipod 5 in the Netherlands and France, and most recently, in January 2025, we announced that Omnipod 5 is now available in Italy, Denmark, Finland, Norway, and Sweden. Additionally, we are working on further building our international teams and advancing our regulatory, reimbursement, and market development efforts so we can bring Omnipod 5 to additional international markets.
In August 2024, we received FDA clearance for an expanded indication of Omnipod 5 for people with type 2 diabetes. Due to the positive results of our Omnipod 5 type 2 pivotal trial and the learnings from our Omnipod GO commercial pilot, we made a strategic decision to drive growth in the type 2 diabetes market with Omnipod 5 and, accordingly, decided not to move forward with the commercialization of Omnipod GO.
During 2024, we completed participant enrollment in our RADIANT study in France, the United Kingdom, and Belgium, which is our Omnipod 5 with Libre 2 randomized controlled trial. Similar to the randomized control trial that we completed in the United States and France for Omnipod 5 with DexCom’s G6 CGM, the objective is to provide data to support our pricing and market access initiatives as we roll out Omnipod 5 with multiple sensors across our international markets. We also continue to expand market access and awareness of Omnipod products through our direct to consumer advertising programs and through growing our presence in the U.S. pharmacy channel, where access to Omnipod 5 and Omnipod DASH is simpler and affordable, as no up-front investment is required.
We also continue to focus on our product development efforts, including AID offerings, such as choice of smartphone integration and CGM, and enhancing the customer experience through digital product and data capabilities. Omnipod 5 integration with Dexcom’s G6 CGM is available in every country where Omnipod 5 is available. In June 2024, we began our full market release of Omnipod 5 with Dexcom’s G7 CGM in the United States. Similarly, in June 2024 we launched our full market release of Omnipod 5 with Libre 2 Plus for individuals aged two years and older with type 1 diabetes in both the United Kingdom and Netherlands, where we offer sensor of choice (integration with either Abbott’s Libre 2 Plus or Dexcom’s G6 CGM). We also now offer sensor of choice in the United States, Italy, Denmark, Finland, Norway, and Sweden. Additionally, in October 2024, our Omnipod 5 app for iPhone compatible with Dexcom’s G6 CGM became fully available in the United States.
Finally, we continue to take steps to strengthen our global manufacturing capabilities. In 2024, we began producing product at our newly constructed manufacturing plant in Malaysia. This plant provides us with increased capacity to satisfy our growing demand, supports our international expansion strategy, and is expected to drive higher gross margins over time.
Results of Operations
The discussion of our results of operations for 2022 has been omitted from this Form 10-K but can be found in Item 7. Management’s Discussion and Analysis and Results of Operations in our Form 10-K for the fiscal year ended December 31, 2023 filed with the Securities and Exchange Commission on February 22, 2024.
Factors Affecting Operating Results
Our Pods are intended to be used continuously for up to three days, after which it may be replaced with a new disposable Pod. We recently achieved a milestone of 500,000 estimated active global customers using Omnipod products, including 365,000 global customers using Omnipod 5. The unique patented design of the Omnipod allows us to provide Pod therapy at a relatively low or no up-front investment in regions where reimbursement allows for it and our pay-as-you-go pricing model reduces the risk to third-party payors. As we grow our customer base, we expect to generate an increasing portion of our revenues through recurring sales of our disposable Pods, which provide recurring revenue.
Following our strategic decision to not move forward with the commercialization of Omnipod GO discussed above, we recorded a charge of $13.5 million related to certain inventory components that we no longer expect to utilize, which is included in our consolidated statement of income for 2024.
In 2022, we issued two voluntary Medical Device Correction (“MDC”) notices, one for our Omnipod DASH PDM related to its battery and the other for our Omnipod 5 Controller related to its charging port and cable. During 2022, we initially recorded a net charge of $57.9 million related to these MDCs and, in 2023, we recorded $11.5 million of income associated with a change in our estimated liability for the MDCs, primarily due to lower distribution costs.
Comparison of the Years Ended December 31, 2024 and December 31, 2023
Revenue
| | | | | | | | | | | | | | | | | | | | | | | | | | | | | |
| Years Ended December 31, | | | | | | |
| (in millions) | 2024 | | 2023 | | % Change | | Currency Impact | | Constant Currency(1) |
| U.S. | $ | 1,509.3 | | | $ | 1,251.0 | | | 20.6 | % | | — | % | | 20.6 | % |
| International | 523.4 | | | 410.1 | | | 27.6 | % | | 0.7 | % | | 26.9 | % |
| Total Omnipod Products | 2,032.7 | | | 1,661.1 | | | 22.4 | % | | 0.2 | % | | 22.2 | % |
| Drug Delivery | 38.9 | | | 36.0 | | | 8.1 | % | | — | % | | 8.1 | % |
| Total | $ | 2,071.6 | | | $ | 1,697.1 | | | 22.1 | % | | 0.2 | % | | 21.9 | % |
(1) Constant currency revenue growth is a non-GAAP financial measure which should be considered supplemental to, and not a substitute for, our reported financial results prepared in accordance with GAAP. See “Management’s Use of Non-GAAP Measures.”
Total revenue increased $374.5 million, or 22.1%, to $2,071.6 million in 2024, compared with $1,697.1 million in 2023. Constant currency revenue growth of 21.9% was primarily driven by higher volume largely attributable to our growing customer base and, to a lesser extent, higher price.
U.S.
Revenue from the sale of Omnipod products in the U.S. increased $258.3 million, or 20.6%, in 2024 to $1,509.3 million, compared with $1,251.0 million in 2023. This increase primarily resulted from higher volume through the pharmacy channel driven by growing our customer base, partially offset by a decrease in estimated inventory days-on-hand at distributors and lower conversions to Omnipod 5. Inventory days-on-hand declined to more normal levels following an acceleration of orders by U.S. pharmacy wholesales in advance of the implementation of our new ERP system on January 1, 2024. We experienced a benefit from conversions to Omnipod 5 in the prior year following the launch of the product in the latter half of 2022 since users generally fill both their Omnipod 5 starter kit and their first month of refills simultaneously. Conversions to Omnipod 5 declined since the vast majority of U.S. conversions to Omnipod 5 occurred in 2023. To a lesser extent, the revenue increase was driven by a higher average selling price resulting from our annual wholesale acquisition cost increase implemented during the second quarter of 2024 and growth in the pharmacy channel.
Revenue from the sale of Omnipod products in the U.S. includes $587.8 million of related party revenue in 2024, compared with $473.7 million in 2023. The $114.1 million increase primarily resulted from growth through the pharmacy channel. Additional information regarding our related party transactions is provided in Note 5 to our consolidated financial statements.
In 2025, we expect strong U.S. revenue growth primarily driven by the benefits of our recurring revenue model and continued volume growth of Omnipod 5. Our recent type 2 indication for Omnipod 5, the launch of Omnipod 5 integrations with both Dexcom’s G7 CGM and Libre 2 Plus, and the launch our Omnipod 5 app for iPhone, are expected to contribute to an increase in our customer base.
International
Revenue from the sale of Omnipod products in our international markets increased $113.3 million, or 27.6%, in 2024 to $523.4 million, compared with $410.1 million in 2023. Excluding the 0.7% favorable impact of currency exchange, the remaining 26.9% increase in revenue was primarily due to higher volumes from the launches of Omnipod 5 in the United Kingdom and Germany in the prior year, driven by our growing customer base and the favorable impact of conversions to
Omnipod 5. A higher average selling price for Omnipod 5 compared with Omnipod DASH and Classic Omnipod also contributed to the revenue increase, although to a lesser extent.
In 2025, we expect higher International Omnipod revenue due to continued volume growth driven by new customers and conversions to Omnipod 5 primarily due to the launch of Omnipod 5 in France and the Netherlands, growth from the earlier launches in Germany and the United Kingdom, and the continued roll out of Omnipod 5 in additional markets.
Drug Delivery
Substantially all of our Drug Delivery revenue consists of sales of pods to Amgen for use in the Neulasta® Onpro® kit, a delivery system for Amgen’s Neulasta to help reduce the risk of infection after intense chemotherapy. Drug Delivery revenue increased $2.9 million, or 8.1%, to $38.9 million in 2024, compared with $36.0 million in 2023. This increase primarily resulted from an increase in orders from our partner, partially offset by a reimbursement from our partner to cover a portion of our increased production costs in the prior year, which did not repeat in the current year.
Costs and Expenses
| | | | | | | | | | | | | | | | | | | | | | | |
| Years Ended December 31, |
| 2024 | | 2023 |
| (in millions) | Amount | | Percent of Revenue | | Amount | | Percent of Revenue |
| Cost of revenue | $ | 625.9 | | | 30.2 | % | | $ | 537.2 | | | 31.7 | % |
| Research and development expenses | $ | 219.6 | | | 10.6 | % | | $ | 205.0 | | | 12.1 | % |
| Selling, general and administrative expenses | $ | 917.2 | | | 44.3 | % | | $ | 734.9 | | | 43.3 | % |
Cost of Revenue
Cost of revenue for 2024 increased $88.7 million, or 16.5%, to $625.9 million, compared with $537.2 million in 2023. Gross margin was 69.8% in 2024, compared with 68.3% in 2023. The 1.5 point increase in gross margin was primarily driven by pricing benefits in both the U.S. pharmacy channel and in our international markets, improved manufacturing efficiencies, and procurement savings. These increases were partially offset by a $13.5 million charge related to certain components utilized in Omnipod GO, which we decided not to commercialize, an $11.5 million accrual reversal during the prior year associated with the voluntary MDC notices we issued in 2022, which did not recur in the current year, and higher costs due to inflation.
We expect gross margin to further increase to approximately 70.5% in 2025 primarily due to improved manufacturing efficiencies.
Research and Development
Research and development expenses increased $14.6 million, or 7.1%, to $219.6 million for 2024, compared with $205.0 million for 2023. Research and development expenses as a percent of revenue decreased to 10.6% in 2024, compared with 12.1% in 2023 primarily due to an increase in sustaining costs following the launch of Omnipod 5 in the United States, which are included in selling, general and administrative expenses. We expect research and development spending in 2025 to increase compared with 2024 as we continue to invest in advancing our innovation and clinical pipeline.
Selling, General and Administrative
Selling, general and administrative expenses increased $182.3 million, or 24.8%, to $917.2 million in 2024, compared with $734.9 million in 2023. This increase was primarily attributable to year-over-year headcount additions to support our growth, international expansion and sustain Omnipod 5, and as a result of our new organizational structure. To a lesser extent, the increase was due to higher legal fees to defend our intellectual property and support our business growth; an increase in advertising expense; higher costs associated with the continued commercial rollout of Omnipod 5 in international markets; and increases in travel and expenses resulting from headcount additions.
We expect selling, general and administrative expenses to increase in 2025 compared with 2024 due to investments in our operating structure, primarily headcount additions, particularly in the areas of customer support, sales and information technology support, to facilitate continued growth globally. We also plan to make additional investments to support the Omnipod platform and to continue support the phased launch of Omnipod 5 in our existing international markets and prepare for expansion into new countries.
Non-Operating Items
Interest Expense and Income
Interest expense increased $6.5 million to $42.7 million in 2024, compared with $36.2 million in 2023 primarily due to fees paid to amend our Term Loan. Interest income increased $10.9 million to $39.5 million in 2024, compared with $28.6 million in 2023 primarily driven by increased average cash balances and higher interest rates.
Other (Expense) Income, net
Other expense, net of $5.5 million for 2024 consists primarily of $3.8 million of loss related to fair value adjustments associated with a strategic debt investment. Other income, net of $2.2 million for 2023 consists primarily of $2.6 million of gains related to fair value adjustments associated with our strategic debt and equity investments.
Income Tax Expense
Income tax benefit was $118.1 million on pre-tax income of $300.2 million for 2024, compared with income tax expense of $8.3 million on pre-tax income of $214.6 million for 2023. Our effective tax rate was a benefit of 39.3% for 2024, compared with a provision of 3.9% for 2023. The decrease in our effective tax rate was primarily due to a $182.5 million non-cash tax benefit from the release of the majority of our valuation allowance against deferred tax assets discussed in Note 22 to our consolidated financial statements and a $8.3 million tax benefit from a research and development tax credit recovery project for the years 2017 through 2022. These tax benefits were partially offset by a $8.2 million decrease in tax benefits from employee stock-based compensation.
In 2021, the Organization for Economic Co-operation and Development (“OECD”) and G20 international forum released the Model Global Anti-Base Erosion (GloBE) rules (“Model Rules”) under Pillar Two. These Model Rules set forth the common approach for a Global Minimum Tax at 15% for multinational enterprises with revenue greater than €750 million and is expected to be applicable to Insulet. Pillar Two has been adopted by the Council of the European Union for implementation by European Union member states by December 31, 2023, with effect for tax years beginning 2024. Similar directives under Pillar Two are already adopted or expected to be adopted by taxing authorities in other countries where Insulet has business operations, with widespread implementation of the Global Minimum Tax in 2024 and 2025. There was no impact on the consolidated financial statements for 2024. While we do not expect the Pillar Two Model Rules and related legislation to have a material impact on our consolidated financial statements for 2025, we continue to evaluate their potential impact on future years.
Adjusted EBITDA
The table below presents reconciliations of Adjusted EBITDA, a non-GAAP financial measure, to net income, the most directly comparable financial measure prepared in accordance with accounting principles generally accepted in the United States of America (“GAAP”):
| | | | | | | | | | | |
| Years Ended December 31, |
| (in millions) | 2024 | | 2023 |
| Net income | $ | 418.3 | | | $ | 206.3 | |
| Interest expense, net | 3.2 | | | 7.6 | |
| Income tax expense | (118.1) | | | 8.3 | |
| Depreciation and amortization | 80.8 | | | 72.8 | |
| Stock-based compensation expense | 69.3 | | | 48.3 | |
Voluntary medical device corrections(1) | — | | | (11.5) | |
Unrealized loss (gain) on investments(2) | 3.8 | | | (2.6) | |
| Adjusted EBITDA | $ | 457.3 | | | $ | 329.2 | |
(1) Represents net (income) expense resulting from estimated costs associated with the voluntary MDC notices issued in the fourth quarter of 2022 and adjustments to those costs, which is included in cost of revenue. Refer to Note 13 to our consolidated financial statements for additional information.
(2) Represents non-operating gain or loss related to fair value adjustments of strategic debt and other investments.
Non-GAAP Financial Measures
Management uses the non-GAAP financial measures described below.
Constant currency revenue growth represents the change in revenue between current and prior year periods using the exchange rate in effect during the applicable prior year period. We present constant currency revenue growth because we believe it provides meaningful information regarding our results on a consistent and comparable basis. Management uses this non-GAAP financial measure, in addition to financial measures in accordance with GAAP, to evaluate our operating results. It is also one of the performance metrics that determines management incentive compensation.
Adjusted EBITDA represents net income plus net interest expense, income tax expense (benefit), depreciation and amortization, stock-based compensation expense and other significant transactions or events, such as legal settlements, medical device corrections, gains (losses) on investments, and loss on extinguishment of debt, which affect the period-to-period comparability of our performances, as applicable. We present Adjusted EBITDA because management uses it as a supplemental measure in assessing our performance, and we believe that it is helpful to investors and other interested parties as a measure of our
comparative performance from period to period. Adjusted EBITDA is a commonly used measure in determining business value and we use it internally to report results.
Free cash flow, a non-GAAP measure, represents the cash that we have available to pursue opportunities that we believe enhance shareholder value and is calculated as net cash provided by operating activities less capital expenditures. Management uses this non-GAAP measure, in addition to U.S. GAAP financial measures, to evaluate our operating results.
These non-GAAP financial measures should be considered supplemental to, and not a substitute for, our reported financial results prepared in accordance with GAAP. In addition, the above definitions may differ from similarly titled measures used by others. Non-GAAP financial measures exclude the effect of items that increase or decrease our reported results of operations; accordingly, we strongly encourage investors to review our consolidated financial statements in their entirety.
Liquidity and Capital Resources
We believe that our current liquidity as further described below will be sufficient to meet our projected operating, investing and debt service requirements for at least the next twelve months.
Capitalization
The following table contains several key measures to gauge our financial condition and liquidity at the end of each year:
| | | | | | | | | | | |
| As of December 31, |
| (in millions) | 2024 | | 2023 |
| Cash and cash equivalents | $ | 953.4 | | | $ | 704.2 | |
| Current portion of long-term debt | $ | 83.8 | | | $ | 49.4 | |
| Long-term debt, net | $ | 1,296.1 | | | $ | 1,366.4 | |
| Total debt, net | $ | 1,379.9 | | | $ | 1,415.8 | |
| Total stockholders’ equity | $ | 1,211.6 | | | $ | 732.7 | |
| Debt-to-total capital ratio | 53 | % | | 66 | % |
| Net debt-to-total capital ratio | 16 | % | | 33 | % |
Convertible Debt
To finance our operations and global expansion, we have periodically issued convertible senior notes, which are convertible into our common stock. As of December 31, 2024, the following Convertible Senior Notes were outstanding:
| | | | | | | | | | | | | | | | | | | | | | | | | | | | | | | | |
| Issuance Date | | Coupon | | Principal Outstanding
(in millions) | | Due Date | | Conversion Rate(1) | | Conversion Price
per Share of Common Stock |
| September 2019 | | 0.375% | | $ | 800.0 | | | September 2026 | | 4.4105 | | $226.73 |
(1) Per $1,000 face value of notes.
In connection with the issuance of the Convertible Senior Notes, we purchased capped call options (“Capped Calls”) on our common stock. By entering into the Capped Calls, we expect to reduce the potential dilution to our common stock (or, in the event the conversion is settled in cash, to provide a source of cash to settle a portion of our cash payment obligation) if at the time of conversion our stock price exceeds the conversion price under the Convertible Senior Notes. The Capped Calls have an initial strike price of $335.90 per share and cover 3.5 million shares of our common stock.
Credit Agreement
We have a $300 million senior secured revolving credit facility (the “Revolving Credit Facility”), which expires in 2028. At December 31, 2024, no amount was outstanding under the Revolving Credit Facility. The Revolving Credit Facility contains a covenant to maintain a specified leverage ratio when there are amounts of at least 35% of the aggregate Revolving Credit Facility outstanding. It also contains other customary covenants, none of which we consider restrictive to our operations. Additionally, we have a Term Loan B (“Term Loan”), which matures in 2031, which contains covenants restricting or limiting our ability to incur additional indebtedness, make asset dispositions, create or permit liens, sell, transfer or exchange assets, guarantee certain indebtedness, and make acquisitions and other investments.
Additional information regarding our debt is provided in Notes 15 to the consolidated financial statements.
Summary of Cash Flows
| | | | | | | | | | | |
| Years Ended December 31, |
| (in millions) | 2024 | | 2023 |
| Cash provided by (used in): | | | |
| Operating activities | $ | 430.3 | | | $ | 145.7 | |
| Investing activities | (146.2) | | | (119.4) | |
| Financing activities | (28.1) | | | (13.6) | |
| Effect of exchange rate changes on cash and cash equivalents | (6.8) | | | 1.8 | |
| Net increase in cash, cash equivalents, and restricted cash | $ | 249.2 | | | $ | 14.5 | |
Operating Activities
Net cash provided by operating activities of $430.3 million in 2024 was primarily attributable to net income, as adjusted for deferred income taxes, depreciation and amortization, stock-based compensation expense, and a $17.0 million working capital outflow. The working capital outflow was driven by a $32.4 million increase in inventories, a $21.9 million increase in prepaid expenses and other assets, and a $10.4 million increase in accounts receivable, partially offset by a $45.5 million increase in accrued expenses and other liabilities. The increase in inventories was primarily due to a planned inventory build to satisfy our growing demand and, to a lesser extent, to mitigate supply chain risk. The increase in prepaid expenses and other assets was primarily driven by an increase in prepaid software fees, cloud computing upgrade and implementation costs, prepaid income taxes, and capitalized commissions. The increase in accounts receivable was primarily due to an increase in sales driven by our growing customer base. Finally, the increase in accrued expenses and other liabilities was primarily driven by an increase in compensation costs due to headcount additions and an increase in professional consulting fees primarily driven by higher legal costs and direct-to-consumer spending.
Investing Activities
Net cash used in investing activities was $146.2 million in 2024, compared with $119.4 million in 2023.
Capital Spending—Capital expenditures were $124.9 million and $75.6 million in 2024 and 2023, respectively. The $49.3 million increase primarily related to the purchase of machinery, equipment and tooling to increase our manufacturing capacity for our new Malaysia manufacturing facility and continuous improvements at our other owned manufacturing facility. We expect capital expenditures for 2025 to increase compared with 2024 as we continue to expand and optimize our manufacturing and supply chain operations as well as support our global expansion. We expect to fund our capital expenditures using existing cash.
Investments in Developed Software—Investments in developed software were $9.1 million and $8.5 million in 2024 and 2023, respectively, and primarily related to investments in projects to support our cloud-based capabilities.
Investments—In 2024 and 2023, we made strategic investments in private companies in the amount of $12.2 million and $7.2 million, respectively.
Acquisitions—In 2023, we paid Bigfoot Biomedical, Inc. $25.1 million, including transaction costs, to acquire patent assets related to pump-based AID technologies. We also paid a purchase price holdback of $3.0 million associated with our 2022 acquisition of substantially all the assets related to the manufacture and production of shape-memory alloy wire assemblies used in the production of our product from Dynalloy, Inc.
Financing Activities
Net cash used in financing activities was $28.1 million in 2024, compared with $13.6 million in 2023.
Debt Issuance and Repayments—In 2024, we refinanced our Term Loan, which resulted in net cash proceeds of $130.0 million, net of issuance costs, and the simultaneous repayment of $132.2 million of the Term Loan. Refer to Note 15 for more information regarding this refinancing. Additionally, we made $26.4 million and $27.0 million of aggregate principal payments on our equipment financings, Term Loan, and mortgage in 2024 and 2023, respectively.
Finance Lease Payments—During 2024, we made $22.7 million in finance lease repayments associated with our Malaysia manufacturing facility, including the amount associated with exercising our option to purchase the property.
Proceeds and Repayments from Secured Borrowing—During 2024, we received $45.5 million of cash advances from a third-party to whom we outsource our insurance claim submissions process in a certain country. Additionally, we repaid $34.8 million of cash advances during 2024.
Proceeds from Exercise of Stock Options—Proceeds from option exercises were $8.2 million and $16.3 million in 2024 and 2023, respectively. The $8.1 million decrease was primarily driven by option exercises by former executives in the prior year.
Proceeds from Shares Issued Under Employee Stock Purchase Plan (“ESPP”)—Proceeds from the issuance of shares under the ESPP were $11.9 million and $10.6 million in 2024 and 2023, respectively.
Payment of Taxes for Restricted Stock Net Settlements—Payments for taxes related to net restricted and performance stock unit settlements were $7.6 million and $13.2 million in 2024 and 2023, respectively. The $5.6 million decrease was primarily driven by a lower fair market value of the restricted and performance stock units (“PSUs”) that vested in 2024 compared to the prior year, partially offset by higher achievement of the PSUs that vested in 2024 (111% achievement), compared to in the prior year (84% achievement).
Free Cash Flow
Free cash flow was $305.4 million in 2024, compared with $70.1 million in 2023. The $235.3 million increase in free cash flow primarily resulted from the $285.8 million increase in gross profit, partially offset by the $49.3 million increase in capital expenditures.
Free cash flow is a non-GAAP measure, which should be considered supplemental to and not a substitute for our reported financial results prepared in accordance with U.S. GAAP. See “Non-GAAP Financial Measures.” A reconciliation between net cash provided by operating activities (the most comparable U.S. GAAP measure) and free cash flow is as follows:
| | | | | | | | | | | |
| Years Ended December 31, |
| (in millions) | 2024 | | 2023 |
| Net cash provided by operating activities | $ | 430.3 | | | $ | 145.7 | |
| Capital expenditures | (124.9) | | | (75.6) | |
| Free cash flow | $ | 305.4 | | | $ | 70.1 | |
Commitments and Contingencies
Contractual Obligations—The following table summarizes our contractual obligations as of December 31, 2024:
| | | | | | | | | | | | | | | | | |
| (in millions) | Short Term | | Long Term | | Total |
| Debt obligations | $ | 83.8 | | | $ | 1,309.2 | | | $ | 1,393.0 | |
Interest payments(1)(2) | 46.9 | | | 211.3 | | | 258.2 | |
Purchase obligations(3) | 282.4 | | | 49.2 | | | 331.6 | |
Lease obligations(1) | 5.4 | | | 62.2 | | | 67.6 | |
| Total contractual obligations | $ | 418.5 | | | $ | 1,631.9 | | | $ | 2,050.4 | |
(1)Interest on debt and lease obligations are projected for future periods using the interest rates in effect as of December 31, 2024. Certain of these projected interest payments may differ in the future based on changes in market interest rates. Additional information regarding our leases is provided in Note 14 to the consolidated financial statements.
(2)Excludes the impact of the interest rate swaps discussed in Note 17 to our consolidated financial statements.
(3)Purchase obligations include commitments for the purchase of components for our products, commitments related to establishing additional manufacturing capabilities, and other commitments for purchases of goods or services in the normal course of business. These commitments are derived from purchase orders, supplier contracts and open orders based on projected demand information.
Legal Proceedings—In December 2024, a jury found that EOFlow Co., Ltd. (“EOFlow”) and several other defendants misappropriated certain of our trade secrets and awarded us $452 million in damages. EOFlow subsequently moved for a directed verdict and for a new trial, as well as for a reduction of the jury award, and we moved for a permanent worldwide injunction on the sale of EOFlow’s EOPatch 2 product and any other products that embody our trade secrets. EOFlow and other defendants may seek to appeal the verdict. Further, EOFlow may not be able to satisfy this damage award; accordingly, it has not been recorded in our consolidated statement of income. Refer to Note 18 to our consolidated financial statements for additional information regarding this matter.
Off-Balance Sheet Arrangements
Information regarding our letters of credit is provided in Note 18 to the consolidated financial statements.
Critical Accounting Policies and Estimates
The preparation of our consolidated financial statements in conformity with U.S. GAAP requires management to use judgment in making estimates and assumptions that affect the reported amounts of assets, liabilities, revenue and expenses, and related disclosure of contingent assets and liabilities. The following accounting policies are based on, among other things, judgments and assumptions made by management that include inherent risks and uncertainties. Management’s estimates are based on the relevant information available at the end of each period.
Pharmacy Rebates
We exercise significant judgment when we determine variable consideration adjustments. As discussed in Note 2 to our consolidated financial statements, we are subject to rebates on pricing programs with managed care organizations, such as pharmacy benefit managers, governmental and third-party commercial payors, primarily in the United States. Reductions to our revenues for rebates on products sold through our distributors under pharmacy benefits are the most significant component of variable consideration. In addition, pharmacy rebates are most at risk for significant adjustment because of the time delay between the recording of the provision when revenue is recognized and its ultimate settlement, an interval that generally ranges from 30 to 90 days, but can last up to one year. Our estimates for pharmacy rebates are based on historical experience, revenue growth, distribution channel lag, contract amendments and trends. Pharmacy rebates charged against gross sales amounted to $452.7 million, $367.3 million, and $175.2 million in 2024, 2023, and 2022, respectively. When actual pharmacy rebate settlements differ from our estimates, we adjust our estimates, which affects reported revenue in the period that such variances become known.
Income Taxes
We estimate our income taxes based on the various jurisdictions where we conduct business. Significant judgment is required in determining our income tax provision. The calculation of our tax liabilities involves uncertainties in the application of complex tax laws and regulations and the potential for future adjustments by tax authorities. While we believe we have appropriate support for the positions taken on our tax returns, we regularly assess the potential outcomes of examinations in determining the adequacy of our provision for income taxes and adjust the income tax provision, income taxes payable, and deferred taxes in the period in which the facts that give rise to a revision become known.
Significant judgement is required in determining whether it is probable that sufficient future taxable income will be available against which a deferred tax asset can be utilized. In evaluating our ability to recover our deferred tax assets, we consider all available positive and negative evidence, including cumulative income in recent fiscal years, our forecast of future taxable income exclusive of certain reversing temporary differences and significant risks and uncertainties related to our business. In determining future taxable income, we are responsible for assumptions utilized including the amount of state, federal and international pre-tax operating income, the reversal of certain temporary differences and the implementation of feasible and prudent tax planning strategies. These assumptions require significant judgment about the forecasts of future taxable income in applicable tax jurisdictions, which are based on our commercial experience to date and are consistent with the plans and estimates that we are using to manage our underlying business.
During 2024, we determined that it is more likely than not that we will realize substantially all of our net deferred tax assets after weighing positive and negative evidence to assess recoverability, including cumulative income (loss) position, revenue growth, current profitability, and expectations regarding future forecasted income. Accordingly, in 2024, we recorded a tax benefit of $182.5 million from the release of our valuation allowance. As of December 31, 2024, we have a valuation allowance of $23.9 million on certain U.S. state tax credits and state net operating loss carryforwards because it is more likely than not that those deferred tax assets will not be realized.
Significant judgment is also required to evaluate uncertain tax positions and is based on a number of factors, including changes in facts or circumstances, changes in tax laws, correspondence with tax authorities during the course of audits and effective settlement of audit issues. Changes in the recognition or measurement of uncertain tax positions could result in a material increase or decrease in our income tax expense in the period in which we make the change, which could have a material impact on our effective rate and results of operations.
Accounting Standards Issued and Not Yet Adopted as of December 31, 2024
In December 2023, the Financial Accounting Standards Board (“FASB”) issued Accounting Standards Update (“ASU”) 2023-09, Income Taxes (Topic 740): Improvements to Income Tax Disclosures, which requires incremental annual income tax disclosures. The new guidance standardizes categories for the effective tax rate reconciliation and requires disaggregation of income taxes and additional income tax-related disclosures. We are required to comply with these new disclosure requirements beginning with our annual filing for 2025.
In November 2024, the FASB issued ASU 2024-03, Income Statement—Reporting Comprehensive Income—Expenses Disaggregation Disclosures (Subtopic 220-40). The new guidance requires disaggregated disclosure of expenses included in
certain expense captions presented in the statements of incomes as well as additional disclosures about selling expenses. We are required to comply with these new disclosure requirements beginning with our annual filing for 2027.
In November 2024, the FASB issued ASU 2024-04, Debt—Debt with Conversion and Other Options (Subtopic 470-20), which clarifies the requirements for determining whether certain settlements of convertible debt instruments should be accounted for as an induced conversion. We are required to comply with the updates beginning with our interim and annual filings for 2026. The adoption of ASU 2024-04 is not expected to impact our consolidated financial statements.
Forward-Looking Statements
This Form 10-K contains forward-looking statements relating to future events or future financial performance that are based on management’s current expectations, estimates, and projections. Words such as “may,” “will,” “should,” “expects,” “plans,” “anticipates,” “could,” “intends,” “targets,” “projects,” “contemplates,” “believes,” “estimates,” “predicts,” “potential” or “continue” or the negative of these terms or other similar words or expressions are intended to identify these forward-looking statements. Forward-looking statements are only predictions and involve risks, uncertainties, and assumptions. Certain factors, including but not limited to those identified under “Item 1A. Risk Factors” of this Form 10-K, may cause actual results to differ materially from current expectations, estimates, projections, and forecasts, and from past results. You should not place undue reliance on any forward-looking statements. We expressly disclaim any obligation to update these forward-looking statements other than as required by law.
Item 7A. Quantitative and Qualitative Disclosures about Market Risk
Interest Rate Risk
Our exposure to changes in interest rates is associated with borrowings under our Revolving Credit Facility and our Term Loan, both of which are variable-rate debt. At December 31, 2024, no amounts were outstanding under our Revolving Credit Facility. In May 2021, we entered into two interest rate swap agreements to effectively convert $480.0 million of our term loan borrowings from a variable rate to a fixed rate through April 2025. These interest rate swaps are intended to mitigate the exposure to fluctuations in interest rates and qualify for hedge accounting treatment as cash flow hedges. A 100 basis point increase or decrease in interest rates as of December 31, 2024 would have an insignificant impact on our annual earnings.
Market Price Sensitive Instruments
As of December 31, 2024, we had outstanding debt related to our Convertible Senior Notes recorded on our consolidated balance sheet of $794.9 million, net of unamortized discount and issuance costs totaling $5.1 million. Changes in the fair value of our outstanding debt, which could be impacted by changes in interest rates, are not recorded in these consolidated financial statements as the debt is accounted for at cost less unamortized discount and issuance costs. The fair value of the Convertible Senior Notes, which was $1,018.8 million as of December 31, 2024, is also impacted by changes in our stock price.
In order to reduce potential equity dilution, in connection with the issuance of the Convertible Senior Notes, we purchased Capped Calls. We expect the Capped Calls to reduce the potential dilution to our common stock (or, in the event the conversion is settled in cash, to provide a source of cash to settle a portion of our cash payment obligation) if at the time of conversion our stock price exceeds the conversion price under the Convertible Senior Notes. The Capped Calls have an upper protection price of $335.90 per share and cover 3.5 million shares of common stock.
Foreign Currency Exchange Risk
Foreign currency risk arises from our investments in subsidiaries owned and operated in countries other than the United States. Such risk is also a result of transactions with customers in those countries. Approximately 25% of our revenue was denominated in foreign currencies for the year ended December 31, 2024. As our business in regions outside of the United States continues to increase, we will be increasingly exposed to foreign currency exchange risk related to our foreign operations. The cost of revenue related to revenue generated outside of the United States is primarily denominated in U.S. dollars; however, operating costs related to these revenues are largely denominated in the same respective currencies, thereby partially limiting our transaction risk exposure. Fluctuations in the rate of exchange between the United States dollar and foreign currencies, primarily the Euro, British pound and Malaysian ringgit, could affect our financial results, including our revenues, revenue growth rates, gross margins, operating income, and net income as well as assets and liabilities.
At December 31, 2024, we have intercompany receivables and payables from our foreign subsidiaries that are denominated in their functional currencies, principally the Chinese yuan renminbi. Fluctuations from the beginning to the end of a reporting period result in the revaluation of our foreign currency-denominated intercompany receivables and payables, generating currency translation gains or losses.
Net realized and unrealized gains (losses) from foreign currency transactions are included in other (expense) income, net in the consolidated statements of income and amounted to a loss of $2.3 million for the year ended December 31, 2024.
Item 8. Financial Statements and Supplementary Data
Our financial statements as of December 31, 2024 and 2023 and for each of the three years in the period ended December 31, 2024, and the Report of the Registered Independent Public Accounting Firm are included in this report as listed in the index.
| | | | | |
| INDEX TO CONSOLIDATED FINANCIAL STATEMENTS |
| |
| |
| |
| Consolidated Balance Sheets as of December 31, 2024 and 2023 | |
| |
| Consolidated Statements of Income for the Years ended December 31, 2024, 2023 and 2022 | |
| |
| |
| |
| |
| |
| |
| |
| |
REPORT OF INDEPENDENT REGISTERED PUBLIC ACCOUNTING FIRM
Board of Directors and Shareholders
Insulet Corporation
Opinions on the financial statements and internal control over financial reporting
We have audited the accompanying consolidated balance sheets of Insulet Corporation (a Delaware corporation) and subsidiaries (the “Company”) as of December 31, 2024 and 2023, and the related consolidated statements of income, comprehensive income, stockholders’ equity, and cash flows for each of the three years in the period ended December 31, 2024, and the related notes and financial statement schedule included under Item 15(a) (collectively referred to as the “consolidated financial statements”). We also have audited the Company’s internal control over financial reporting as of December 31, 2024, based on criteria established in the 2013 Internal Control—Integrated Framework issued by the Committee of Sponsoring Organizations of the Treadway Commission (“COSO”).
In our opinion, the consolidated financial statements referred to above present fairly, in all material respects, the financial position of the Company as of December 31, 2024 and 2023, and the results of its operations and its cash flows for each of the three years in the period ended December 31, 2024 in conformity with accounting principles generally accepted in the United States of America. Also in our opinion, the Company maintained, in all material respects, effective internal control over financial reporting as of December 31, 2024, based on criteria established in the 2013 Internal Control—Integrated Framework issued by COSO.
Basis for opinions
The Company’s management is responsible for these consolidated financial statements, for maintaining effective internal control over financial reporting, and for its assessment of the effectiveness of internal control over financial reporting, included in the accompanying Management’s Annual Report on Internal Control Over Financial Reporting. Our responsibility is to express an opinion on the Company’s consolidated financial statements and an opinion on the Company’s internal control over financial reporting based on our audits. We are a public accounting firm registered with the Public Company Accounting Oversight Board (United States) (“PCAOB”) and are required to be independent with respect to the Company in accordance with the U.S. federal securities laws and the applicable rules and regulations of the Securities and Exchange Commission and the PCAOB.
We conducted our audits in accordance with the standards of the PCAOB. Those standards require that we plan and perform the audits to obtain reasonable assurance about whether the financial statements are free of material misstatement, whether due to error or fraud, and whether effective internal control over financial reporting was maintained in all material respects.
Our audits of the financial statements included performing procedures to assess the risks of material misstatement of the financial statements, whether due to error or fraud, and performing procedures that respond to those risks. Such procedures included examining, on a test basis, evidence regarding the amounts and disclosures in the financial statements. Our audits also included evaluating the accounting principles used and significant estimates made by management, as well as evaluating the overall presentation of the financial statements. Our audit of internal control over financial reporting included obtaining an understanding of internal control over financial reporting, assessing the risk that a material weakness exists, and testing and evaluating the design and operating effectiveness of internal control based on the assessed risk. Our audits also included performing such other procedures as we considered necessary in the circumstances. We believe that our audits provide a reasonable basis for our opinions.
Definition and limitations of internal control over financial reporting
A company’s internal control over financial reporting is a process designed to provide reasonable assurance regarding the reliability of financial reporting and the preparation of financial statements for external purposes in accordance with generally accepted accounting principles. A company’s internal control over financial reporting includes those policies and procedures that (1) pertain to the maintenance of records that, in reasonable detail, accurately and fairly reflect the transactions and dispositions of the assets of the company; (2) provide reasonable assurance that transactions are recorded as necessary to permit preparation of financial statements in accordance with generally accepted accounting principles, and that receipts and expenditures of the company are being made only in accordance with authorizations of management and directors of the company; and (3) provide reasonable assurance regarding prevention or timely detection of unauthorized acquisition, use, or disposition of the company’s assets that could have a material effect on the financial statements.
Because of its inherent limitations, internal control over financial reporting may not prevent or detect misstatements. Also, projections of any evaluation of effectiveness to future periods are subject to the risk that controls may become inadequate because of changes in conditions, or that the degree of compliance with the policies or procedures may deteriorate.
Critical audit matter
The critical audit matter communicated below is a matter arising from the current period audit of the financial statements that was communicated or required to be communicated to the audit committee and that: (1) relates to accounts or disclosures that are material to the financial statements and (2) involved our especially challenging, subjective, or complex judgments. The communication of critical audit matters does not alter in any way our opinion on the financial statements, taken as a whole, and we are not, by communicating the critical audit matter below, providing a separate opinion on the critical audit matter or on the accounts or disclosures to which it relates.
Variable consideration – Rebates to pharmacy benefit managers
As described further in Note 2 to the financial statements, the Company provides for certain rebates for sales of its product through intermediaries. The Company estimates variable consideration related to rebates to pharmacy benefit managers in the United States when determining the transaction price at the time of sale. We identified the rebate estimate for pharmacy benefit managers as a critical audit matter.
The principal consideration for our determination that the rebate estimate related to pharmacy benefit managers is a critical audit matter was the high degree of auditor judgment in applying procedures to evaluate the significant estimation made by management. Management's estimate is based on historical experience adjusted for revenue growth, trends, and contract amendments.
Our audit procedures related to the rebate estimate included the following, among others;
•Evaluated the significant assumptions and the completeness and accuracy of the underlying data used in management’s calculation through inspection of source documents and agreement to other audited schedules.
•Performed retrospective analysis comparing actual rebates incurred to the previously estimated amounts.
•Tested the design and operating effectiveness of controls related to management’s estimate.
/s/ GRANT THORNTON LLP
We have served as the Company’s auditor since 2016.
Boston, Massachusetts
February 20, 2025
INSULET CORPORATION
CONSOLIDATED BALANCE SHEETS
| | | | | | | | | | | |
| As of December 31, |
| (in millions, except share and per share data) | 2024 | | 2023 |
| ASSETS | | | |
| Current Assets | | | |
| Cash and cash equivalents | $ | 953.4 | | | $ | 704.2 | |
| Accounts receivable trade, net | 252.5 | | | 240.2 | |
| Accounts receivable trade, net — related party | 113.0 | | | 119.5 | |
| Inventories | 430.4 | | | 402.6 | |
| Prepaid expenses and other current assets | 142.0 | | | 116.4 | |
| Total current assets | 1,891.3 | | | 1,582.9 | |
| Property, plant and equipment, net | 723.1 | | | 664.9 | |
| Other intangible assets, net | 98.5 | | | 98.7 | |
| Goodwill | 51.5 | | | 51.7 | |
| Deferred tax assets | 141.8 | | | $ | 1.8 | |
| Other assets (includes $10.2 and $31.3 at fair value) | 181.5 | | | 188.2 | |
| Total assets | $ | 3,087.7 | | | $ | 2,588.2 | |
| LIABILITIES AND STOCKHOLDERS’ EQUITY | | | |
| Current Liabilities | | | |
| Accounts payable | $ | 19.8 | | | $ | 19.2 | |
| Accrued expenses and other current liabilities | 423.8 | | | 373.7 | |
| Accrued expenses and other current liabilities — related party | 1.0 | | | 8.9 | |
| Current portion of long-term debt | 83.8 | | | 49.4 | |
| Total current liabilities | 528.4 | | | 451.2 | |
| Long-term debt, net | 1,296.1 | | | 1,366.4 | |
| Other liabilities | 51.6 | | | 37.9 | |
| Total liabilities | 1,876.1 | | | 1,855.5 | |
| Commitments and contingencies (Note 18) | | | |
| Stockholders’ Equity | | | |
| Preferred stock, $.001 par value, 5,000,000 authorized; none issued and outstanding | — | | | — | |
| Common stock, $.001 par value, 100,000,000 authorized; 70,196,031 and 69,907,289 issued and outstanding | 0.1 | | | 0.1 | |
| Additional paid-in capital | 1,184.4 | | | 1,102.6 | |
| Accumulated earnings (deficit) | 40.3 | | | (378.0) | |
| Accumulated other comprehensive (loss) income | (13.2) | | | 8.0 | |
| Total stockholders’ equity | 1,211.6 | | | 732.7 | |
| Total liabilities and stockholders’ equity | $ | 3,087.7 | | | $ | 2,588.2 | |
The accompanying notes are an integral part of these consolidated financial statements.
44
INSULET CORPORATION
CONSOLIDATED STATEMENTS OF INCOME
| | | | | | | | | | | | | | | | | |
| | Years Ended December 31, |
| (in millions, except share and per share data) | 2024 | | 2023 | | 2022 |
| Revenue | $ | 1,483.8 | | | $ | 1,223.4 | | | $ | 1,055.4 | |
| Revenue from related party | 587.8 | | | 473.7 | | | 249.9 | |
| Total revenue | 2,071.6 | | | 1,697.1 | | | 1,305.3 | |
| Cost of revenue | 625.9 | | | 537.2 | | | 499.7 | |
| Gross profit | 1,445.7 | | | 1,159.9 | | | 805.6 | |
| Research and development expenses | 219.6 | | | 205.0 | | | 180.2 | |
| Selling, general and administrative expenses | 917.2 | | | 734.9 | | | 587.8 | |
| Operating income | 308.9 | | | 220.0 | | | 37.6 | |
| Interest expense, net of portion capitalized (Note 9) | (42.7) | | | (36.2) | | | (36.0) | |
| Interest income | 39.5 | | | 28.6 | | | 9.3 | |
| Other (expense) income, net | (5.5) | | | 2.2 | | | (1.1) | |
| Income before income taxes | 300.2 | | | 214.6 | | | 9.8 | |
| Income tax benefit (expense) | 118.1 | | | (8.3) | | | (5.2) | |
| Net income | $ | 418.3 | | | $ | 206.3 | | | $ | 4.6 | |
| | | | | |
| Net income per share: | | | | | |
| Basic | $ | 5.97 | | | $ | 2.96 | | | $ | 0.07 | |
| Diluted | $ | 5.78 | | | $ | 2.94 | | | $ | 0.07 | |
| | | | | |
| Weighted-average number of common shares outstanding (in thousands): | | | | |
| Basic | 70,076 | | | 69,751 | | | 69,375 | |
| Diluted | 73,890 | | | 73,633 | | | 69,910 | |
The accompanying notes are an integral part of these consolidated financial statements.
45
INSULET CORPORATION
CONSOLIDATED STATEMENTS OF COMPREHENSIVE INCOME
| | | | | | | | | | | | | | | | | |
| | Years Ended December 31, |
| (in millions) | 2024 | | 2023 | | 2022 |
| Net income | $ | 418.3 | | | $ | 206.3 | | | $ | 4.6 | |
| Other comprehensive (loss) income, net of tax | | | | | |
| Foreign currency translation adjustment | (7.8) | | | 2.5 | | | (10.3) | |
| Unrealized (loss) gain on cash flow hedges | (13.4) | | | (14.2) | | | 32.5 | |
| Unrealized loss on securities | — | | | (0.3) | | | — | |
| Other comprehensive (loss) income, net of tax | (21.2) | | | (12.0) | | | 22.2 | |
| Comprehensive income | $ | 397.1 | | | $ | 194.3 | | | $ | 26.8 | |
The accompanying notes are an integral part of these consolidated financial statements.
46
INSULET CORPORATION
CONSOLIDATED STATEMENTS OF STOCKHOLDERS’ EQUITY
| | | | | | | | | | | | | | | | | | | | | | | | | | | | | | | | | | | |
| | Common Stock | | Additional
Paid-in
Capital | | Accumulated (Deficit) Earnings | | Accumulated Other Comprehensive (Loss) Income | | Total
Stockholders’
Equity |
| (dollars in millions) | Shares
(in thousands) | | Amount | |
| Balance, December 31, 2021 | 69,179 | | | $ | 0.1 | | | $ | 1,207.9 | | | $ | (649.5) | | | $ | (2.2) | | | $ | 556.3 | |
Adoption of ASU 202-06 (Note 2) | — | | | — | | | (207.7) | | | 60.6 | | | — | | | (147.1) | |
| Exercise of options to purchase common stock | 147 | | | — | | | 6.9 | | | — | | | — | | | 6.9 | |
| Issuance of shares for employee stock purchase plan | 53 | | | — | | | 9.4 | | | — | | | — | | | 9.4 | |
| Stock-based compensation expense | — | | | — | | | 40.9 | | | — | | | — | | | 40.9 | |
| Restricted stock units vested, net of shares withheld for taxes | 132 | | | — | | | (16.8) | | | — | | | — | | | (16.8) | |
| Net income | — | | | — | | | — | | | 4.6 | | | — | | | 4.6 | |
| Other comprehensive income | — | | | — | | | — | | | — | | | 22.2 | | | 22.2 | |
| Balance, December 31, 2022 | 69,511 | | | 0.1 | | | 1,040.6 | | | (584.3) | | | 20.0 | | | 476.4 | |
| Exercise of options to purchase common stock | 249 | | | — | | | 16.3 | | | — | | | — | | | 16.3 | |
| Issuance of shares for employee stock purchase plan | 55 | | | — | | | 10.6 | | | — | | | — | | | 10.6 | |
| Stock-based compensation expense | — | | | — | | | 48.3 | | | — | | | — | | | 48.3 | |
| Restricted stock units vested, net of shares withheld for taxes | 92 | | | — | | | (13.2) | | | — | | | — | | | (13.2) | |
| Net income | — | | | — | | | — | | | 206.3 | | | — | | | 206.3 | |
| Other comprehensive loss | — | | | — | | | — | | | — | | | (12.0) | | | (12.0) | |
| Balance, December 31, 2023 | 69,907 | | | 0.1 | | | 1,102.6 | | | (378.0) | | | 8.0 | | | 732.7 | |
| Exercise of options to purchase common stock | 127 | | | — | | | 8.2 | | | — | | | — | | | 8.2 | |
| Issuance of shares for employee stock purchase plan | 78 | | | — | | | 11.9 | | | — | | | — | | | 11.9 | |
| Stock-based compensation expense | — | | | — | | | 69.3 | | | — | | | — | | | 69.3 | |
| Restricted stock units vested, net of shares withheld for taxes | 84 | | | — | | | (7.6) | | | — | | | — | | | (7.6) | |
| Net income | — | | | — | | | — | | | 418.3 | | | — | | | 418.3 | |
| Other comprehensive loss, net of tax | — | | | — | | | — | | | — | | | (21.2) | | | (21.2) | |
| Balance, December 31, 2024 | 70,196 | | | $ | 0.1 | | | $ | 1,184.4 | | | $ | 40.3 | | | $ | (13.2) | | | $ | 1,211.6 | |
The accompanying notes are an integral part of these consolidated financial statements.
47
INSULET CORPORATION
CONSOLIDATED STATEMENTS OF CASH FLOWS | | | | | | | | | | | | | | | | | |
| Years Ended December 31, |
| (in millions) | 2024 | | 2023 | | 2022 |
| Cash flows from operating activities | | | | | |
| Net income | $ | 418.3 | | | $ | 206.3 | | | $ | 4.6 | |
| Adjustments to reconcile net income to net cash provided by operating activities: | | | | | |
| Depreciation and amortization | 80.8 | | | 72.8 | | | 63.2 | |
| Stock-based compensation expense | 69.3 | | | 48.3 | | | 40.9 | |
| Deferred income taxes | (136.9) | | | 0.5 | | | (1.0) | |
| Non-cash interest expense | 7.3 | | | 6.7 | | | 5.8 | |
| Provision for credit losses | (0.2) | | | 2.3 | | | 4.2 | |
| Unrealized loss (gain) on investments | 3.8 | | | (2.6) | | | — | |
| Other | 4.9 | | | 2.0 | | | 3.8 | |
| Changes in operating assets and liabilities: | | | | | |
| Accounts receivable | (16.9) | | | (99.4) | | | (12.9) | |
| Accounts receivable — related party | 6.5 | | | (54.8) | | | (38.9) | |
| Inventories | (32.4) | | | (53.6) | | | (49.1) | |
| Prepaid expenses and other assets | (21.9) | | | (42.1) | | | (36.8) | |
| Accounts payable | 2.2 | | | (11.0) | | | (2.4) | |
| Accrued expenses and other liabilities | 53.4 | | | 73.8 | | | 133.9 | |
| Accrued expenses and other liabilities — related party | (7.9) | | | (3.5) | | | 3.7 | |
| Net cash provided by operating activities | 430.3 | | | 145.7 | | | 119.0 | |
| Cash flows from investing activities | | | | | |
| Capital expenditures | (124.9) | | | (75.6) | | | (122.9) | |
| Investments in developed software | (9.1) | | | (8.5) | | | (12.9) | |
| Cash paid for investments | (12.2) | | | (7.2) | | | (7.8) | |
| Acquisition of other intangible assets | — | | | (25.1) | | | (21.5) | |
| Acquisition of a business | — | | | (3.0) | | | (26.0) | |
| Net cash used in investing activities | (146.2) | | | (119.4) | | | (191.1) | |
| Cash flows from financing activities | | | | | |
| Proceeds from issuance of term loan, net of issuance costs | 130.0 | | | — | | | — | |
| Repayment of term loan | (137.2) | | | (5.0) | | | (5.0) | |
| Repayment of equipment financings | (19.0) | | | (19.8) | | | (17.4) | |
| Financing lease payments | (22.7) | | | — | | | (15.3) | |
| Repayment of mortgage | (2.4) | | | (2.2) | | | (2.1) | |
| Proceeds from secured borrowing (Note 6) | 45.5 | | | — | | | — | |
| Repayment of secured borrowing (Note 6) | (34.8) | | | — | | | — | |
| Proceeds from exercise of stock options | 8.2 | | | 16.3 | | | 6.9 | |
| Proceeds from issuance of common stock under employee stock purchase plan | 11.9 | | | 10.6 | | | 9.4 | |
| Payment of withholding taxes in connection with vesting of restricted stock units | (7.6) | | | (13.2) | | | (16.8) | |
| Other | — | | | (0.3) | | | — | |
| Net cash used in financing activities | (28.1) | | | (13.6) | | | (40.3) | |
| Effect of exchange rate changes on cash | (6.8) | | | 1.8 | | | (4.3) | |
| Net increase (decrease) in cash, cash equivalents, and restricted cash | 249.2 | | | 14.5 | | | (116.7) | |
| Cash, cash equivalents, and restricted cash, beginning of year | 704.2 | | | 689.7 | | | 806.4 | |
| Cash, cash equivalents, and restricted cash, end of year | $ | 953.4 | | | $ | 704.2 | | | $ | 689.7 | |
Supplemental cash flow information (Notes 14 and 24) | | | | | |
The accompanying notes are an integral part of these consolidated financial statements.
48
INSULET CORPORATION
NOTES TO CONSOLIDATED FINANCIAL STATEMENTS
Note 1. Nature of the Business
Insulet Corporation (the “Company”) is primarily engaged in the development, manufacture, and sale of its proprietary continuous insulin delivery system for people with insulin-dependent diabetes. The Company generates most of its revenue from sales of its Omnipod products. The Omnipod platform includes: Omnipod® 5 and its predecessors Omnipod DASH and Classic Omnipod. Each product features a small, lightweight, self-adhesive disposable tubeless Omnipod device (“Pod”) that the user fills with insulin and wears directly on the body for up to three days at a time, which delivers personalized doses of insulin and eliminates the need for multiple daily injections using syringes or insulin pens or the use of pump and tubing. Omnipod 5, which builds on the Omnipod DASH mobile platform, is a tubeless automated insulin delivery system, that integrates with a continuous glucose monitor (“CGM”) to manage blood sugar and is fully controlled by a compatible personal smartphone or Omnipod 5 Controller. The CGM is sold separately by third parties. Omnipod DASH features a secure Bluetooth enabled Pod that is controlled by a smartphone-like Personal Diabetes Manager (“PDM”) with a color touch screen user interface. Following the launch of Omnipod 5, the Company began phasing-out Classic Omnipod.
The Company’s Omnipod products are currently sold in the United States, Europe, Canada, the Middle East, and Australia either indirectly through intermediaries or directly to end-users. Intermediaries include wholesalers who sell the Company’s product to end-users through the pharmacy channel in the United States and independent distributors who resell Omnipod products to end-users. Substantially all of the Company’s Drug Delivery revenue consists of sales of pods to Amgen for use in the Neulasta® Onpro® kit, a delivery system for Amgen’s Neulasta to help reduce the risk of infection after intense chemotherapy.
Note 2. Summary of Significant Accounting Policies
Basis of Presentation
The accompanying financial statements reflect the consolidated operations of Insulet Corporation and its subsidiaries. The consolidated financial statements have been prepared in United States dollars, in accordance with accounting principles generally accepted in the United States of America (“GAAP”). The preparation of the consolidated financial statements in conformity with GAAP requires management to make use of estimates and assumptions that affect the reported amounts of assets and liabilities, disclosure of contingent assets and liabilities, and the reported amounts of revenues and expenses. Actual results may differ from those estimates.
Principles of Consolidation
The consolidated financial statements include the accounts of the Company and its wholly owned subsidiaries. All intercompany balances and transactions have been eliminated.
Foreign Currency Translation
The assets and liabilities of the Company’s foreign subsidiaries are translated into U.S. dollars using exchange rates as of the balance sheet date, while income and expenses of foreign subsidiaries are translated using the average exchange rates in effect for the related month. The net effect of these translation adjustments is reported in accumulated other comprehensive income (loss) within stockholders’ equity on the consolidated balance sheets. Net realized and unrealized losses from foreign currency transactions are included in other (expense) income, net in the consolidated statements of income and were $2.3 million, $0.4 million and $1.3 million for the years ended December 31, 2024, 2023 and 2022, respectively.
Cash and Cash Equivalents
The Company considers all highly liquid investments with maturities of 90 days or less at the time of purchase to be cash equivalents. Cash equivalents may include money market mutual funds, commercial paper, and U.S. government and agency bonds, that are carried at cost.
Certain of the Company’s subsidiaries participate in a multi-currency, notional cash pooling arrangement with a third-party bank provider to manage global liquidity requirements. Under this arrangement, cash deposited by participating subsidiaries may be in positive or negative cash positions to the extent the overall balance in the cash pool is at least zero. The net cash balance of the notional cash pooling arrangement is included within cash and cash equivalents in the consolidated balance sheets and was insignificant at both December 31, 2024 and 2023.
Investments
The Company has investments in equity securities of privately held companies, in which the Company’s interest is less than 20%, the Company does not exercise significant influence over the investee, and the investment does not have a readily determinable fair value. These investments are carried at cost less impairment, if any. If an observable price change in orderly transactions for the identical or similar investment in the same issuer is identified, the investment is measured at its fair value as of the date that the observable transaction occurred with the adjustments reflected in other (expense) income, net in the Company’s consolidated statements of income. Investments in equity securities are recorded within other assets on the consolidated balance sheets.
The Company also has investments in debt securities of privately held companies, which are either classified as available-for-sale securities or for which the Company has elected the fair value option. The available-for-sale securities are recorded at fair value with unrealized gains and losses recorded as a component of accumulated other comprehensive income (loss) in stockholders’ equity on the consolidated balance sheets. The other investment is a debt security that contains embedded derivatives. Unrealized gains and losses for this investment are recorded as a component of other (expense) income, net in the consolidated statements of income. Investments in debt securities are recorded within other assets on the consolidated balance sheets.
The Company may also invest in marketable securities, including term deposits, commercial paper, U.S. government and agency bonds, and corporate bonds, which are classified as available-for-sale and carried at fair value with unrealized gains and losses recorded as a component of accumulated other comprehensive income (loss) in stockholders’ equity on the consolidated balance sheets. Investments with a stated maturity date of more than one year from the balance sheet date and that are not expected to be used in current operations are classified as long-term investments within other assets on the consolidated balance sheets. The Company reviews investments for other-than-temporary impairment when the fair value of an investment is less than its amortized cost. If an available-for-sale security is other than temporarily impaired, the loss is included in other (expense) income, net in the consolidated statements of income.
Accounts Receivable and Allowance for Credit Losses
Trade accounts receivable consist of amounts due from intermediaries, third-party payors, and customers and are presented at amortized cost. The allowance for credit losses reflects an estimate of losses inherent in the Company’s accounts receivable portfolio determined based on historical experience, specific allowances for known troubled accounts, and other available evidence. Accounts receivable are written off when management determines they are uncollectible.
The allowance for credit losses is measured on a collective (pool) basis when similar risk characteristics exist. The Company has identified the following portfolio segments and measures the allowance for credit losses using the following methods:
Direct Customer Receivables—The Company measures expected credit losses on direct customer receivables using an aging methodology. The risk of loss for direct customer receivables is higher than other portfolios. The Company relies on third-party payors to accept and timely process claims and on direct consumers to have the ability to pay. The estimate of expected credit losses considers historical credit loss information that is adjusted for current conditions and supportable forecasts.
Distributor Receivables—The Company measures expected credit losses on distributor receivables using an individual reserve methodology. The risk of loss in this portfolio is low based on the Company’s historical experience. The estimate of expected credit losses considers payment history and the financial condition of the distributors.
National Healthcare System Receivables—The Company measures expected credit losses on national healthcare system receivables using an individual reserve methodology. The risk of loss in this portfolio is low based on the Company’s historical experience. The estimate of expected credit losses considers historical credit loss information that is adjusted for current conditions and supportable forecasts.
Inventories
Inventories are stated at the lower of cost or net realizable value, with cost determined under the first-in, first-out method. The Company reduces the carrying value of inventories for those items that are potentially excess, obsolete, or slow-moving based on changes in customer demand, technology developments, or other economic factors in order to state inventories at net realizable value. Factors influencing these adjustments include inventories on hand compared to estimated future usage and sales.
Contract Acquisition Costs
The Company incurs commission costs to obtain a contract related to new customer starts. These costs are capitalized as contract assets in other assets on the consolidated balance sheet, net of the short-term portion included in prepaid expenses and other current assets. Costs to obtain a contract are amortized to selling, general and administrative expense on a straight-line basis over the expected period of benefit, which considers future product upgrades. These costs are periodically reviewed for impairment.
Derivative Instruments
The Company is exposed to certain risks relating to its business operations. Risks that relate to interest rate exposure are managed by using interest rate swaps. The Company recognizes derivative instruments as either assets or liabilities at fair value on the consolidated balance sheet. Changes in a derivative financial instrument’s fair value are recognized in earnings unless specific hedge criteria are met, in which case changes in fair value are recognized as adjustments to other comprehensive income. The Company has designated its interest rate swap contracts as cash flow hedges. Additional information on the Company’s derivative instruments is included in Note 17 and fair values are included in Note 16.
Fair Value Measurements
Fair value is defined as the price that would be received from the sale of an asset or paid to transfer a liability in the principal or most advantageous market in an orderly transaction between market participants on the measurement date.
To measure fair value of assets and liabilities, the Company uses the following fair value hierarchy based on three levels of inputs:
Level 1 — observable inputs, such as quoted prices in active markets for identical assets or liabilities;
Level 2 — significant other observable inputs that are observable either directly or indirectly; and
Level 3 — significant unobservable inputs for which there are little or no market data, which require the Company to develop its own assumptions.
Judgement is involved in estimating inputs, such as discount rates, used in Level 3 fair value measurements. Changes to these inputs can have a significant effect on fair value measurements and amounts that could be realized.
Certain of the Company’s financial instruments, including cash and cash equivalents, accounts receivable, accounts payable, and accrued expenses and other current liabilities, are carried at cost, which approximates their fair value because of their short-term maturity.
Property, Plant and Equipment
Property, plant and equipment is stated at cost less accumulated depreciation. Major improvements are capitalized, while routine repairs and maintenance are expensed as incurred. Depreciation for property, plant and equipment, other than land and construction in progress, is based upon the following estimated useful lives using the straight-line method:
| | | | | |
| Building and building improvements | 20 to 39 years |
| Leasehold improvements | Lesser of lease term or useful life of asset |
| Machinery and equipment | 2 to 15 years |
| Furniture and fixtures | 3 to 5 years |
The Company assesses the recoverability of assets whenever events or changes in circumstances suggest that the carrying value of an asset may not be recoverable. The Company recognizes an impairment loss if the carrying amount of a long-lived asset is not recoverable based on its undiscounted future cash flows. The impairment loss is measured as the difference between the carrying amount and the fair value of the asset.
Business Combinations
The Company recognizes the assets and liabilities assumed in business combinations based on their estimated fair values at the date of acquisition. The Company allocates the purchase price in excess of net tangible assets acquired to identifiable intangible assets. The Company assesses the fair value of assets, including intangible assets, using a variety of methods and each asset is measured at fair value from the perspective of a market participant. Assets recorded from the perspective of a market participant that are determined to not have economic use for the Company are expensed immediately. Any excess purchase price over the fair value of the net tangible and intangible assets acquired is allocated to goodwill. Transaction costs and restructuring costs associated with a business combination are expensed as incurred.
Goodwill and Other Intangible Assets
Goodwill represents the excess of the purchase price of an acquired entity over the amounts assigned to assets and liabilities assumed in a business combination. The Company performs an assessment of its goodwill for impairment annually on October 1 or whenever events or changes in circumstances indicate there might be impairment. Goodwill is evaluated for impairment at the reporting unit level.
The Company may assess its goodwill for impairment initially using a qualitative approach to determine whether conditions exist that indicate it is more likely than not that the fair value of a reporting unit is less than its carrying value. If management concludes, based on its assessment of relevant events, facts, and circumstances that it is more likely than not that a reporting unit’s carrying value is greater than its fair value, then a quantitative analysis will be performed to determine if there is any impairment. Alternatively, the Company may elect to initially perform a quantitative analysis instead of starting with a qualitative analysis. The Company would record an impairment loss to the extent that the carrying value of the reporting unit’s goodwill exceeds its fair value.
Intangible assets acquired in a business combination are recorded at fair value, while intangible assets purchased or software developed for internal-use are recorded at cost and are stated at cost less accumulated amortization. Intangible assets with finite useful lives are amortized based on the pattern in which the economic benefits of the assets are estimated to be consumed over the following estimated useful lives of the assets:
| | | | | |
| Customer relationships | 14 years |
| Internal-use software | 3 to 5 years |
| Developed technology | 13 to 15 years |
| Patents | 8 to 15 years |
Amortization expense is included in selling, general and administrative expenses in the consolidated statement of income. The Company reviews intangible assets for impairment by comparing the fair value of the assets, estimated using an income approach, with their carrying value. If the carrying value exceeds the fair value of the intangible asset, the Company recognizes an impairment equal to the difference between the carrying value of the asset and the present value of future cash flows. The Company assesses the remaining useful life and the recoverability of intangible assets whenever events or circumstances indicate that the carrying value of an asset may not be recoverable using undiscounted cash flows.
Cloud Computing Arrangements
Cloud computing arrangements includes services used to support certain internal corporate functions as well as technology platforms that support commercial initiatives. The Company capitalizes costs incurred to implement cloud computing arrangements that are service contracts within other current and non-current assets and amortizes such costs over the expected term of the hosting arrangement using the straight-line method to the same income statement line as the associated cloud operating expenses. The Company assesses the recoverability of capitalized implementation costs in accordance with the policy disclosed under Property, Plant and Equipment.
Leases
The Company determines if an arrangement includes a lease at inception. At lease commencement, the Company recognizes lease liabilities equal to the present value of the future lease payments and lease assets representing the right to use the underlying asset throughout the lease term. The Company uses an incremental borrowing rate based on the information available at lease commencement in determining the present value of lease payments, when the implicit rate is not readily determinable. The Company’s incremental borrowing rate reflects a secured rate that considers the term of the lease, the nature of the underlying asset and the economic environment. Lease terms may include options to extend and/or terminate the lease. These options are included in the lease term when it is reasonably certain that the Company will exercise that option. Operating lease expense is recognized on a straight-line basis over the lease term. Right-of-use assets are calculated as the initial measurement of the lease liability plus lease payments made prior to lease commencement and initial direct costs incurred, less lease incentives received. The Company excludes leases with an expected term of one year or less from recognition on the consolidated balance sheet and does not separate lease and non-lease components.
Loss Contingencies
The Company records a liability on the consolidated balance sheet for loss contingencies when a loss is considered probable and the amount can be reasonably estimated. If the reasonable estimate of a known or probable loss is a range, and no amount within the range is a better estimate than any other, the minimum amount of the range is accrued. If a loss is reasonably possible but not known or probable, and can be reasonably estimated, the estimated loss or range of loss is disclosed. Legal costs associated with loss contingencies are expensed as incurred.
Product Warranty
The Company provides a four-year warranty on its Controllers and PDMs Controllers sold in the United States and Europe and a five-year warranty on PDMs sold in Canada and may replace Pods that do not function in accordance with product specifications. The Company estimates its warranty obligation at the time the product is shipped based on historical experience and the estimated cost to service the claims. Costs to service the claims reflect the current product cost, reclaim costs, shipping and handling costs and direct and incremental distribution and customer service support costs. Since the Company continues to introduce new products and versions, the anticipated performance of the product over the warranty period is also considered in estimating warranty reserves. Warranty expense is recorded in cost of revenue in the consolidated statements of income.
Revenue Recognition
The Company generates revenue from the sale of its Controller/PDM and Pods. We generally recognize revenue when control is transferred to our customers in an amount that reflects the net consideration to which we expect to be entitled. In determining how revenue should be recognized, a five-step process is used, which includes identifying performance obligations in the contract, determining whether the performance obligations are separate, allocating the transaction price to each separate performance obligation, estimating the amount of variable consideration to include in the transaction price, and determining the timing of revenue recognition for separate performance obligations.
•Contracts and Performance Obligations. The Company generally considers customer purchase orders, which in most cases are governed by agreements with distributors or third-party payors, to be contracts with a customer. The Company considers the obligation to transfer the Controller/PDM, the initial and subsequent quantity of Pods ordered, and product training, each of which are distinct, to be separate performance obligations.
•Transaction Price. Transaction price for the Controller/PDM and Pods reflects the net consideration to which the Company expects to be entitled. The prices charged depend on the Company’s pricing as established with third-party payors and intermediaries. Variable consideration is estimated at the outset of the contract and includes, but is not limited to reductions for: consideration payable to customers, such as rebates, chargebacks, and administrative fees paid to distributors; product returns provision; prompt payment discounts; and various other promotional or incentive arrangements. If a contract contains more than one performance obligation, the transaction price is allocated to each performance obligation based on relative standalone selling price.
•Rebates. The Company is subject to rebates on pricing programs with managed care organizations, such as pharmacy benefit managers, governmental and third-party commercial payors, primarily in the United States. The Company estimates provisions for rebates primarily based on historical experience, revenue growth, distribution channel lag, and known events or trends.
•Chargebacks. The Company participates in chargeback programs in the United States, under which pricing on products below negotiated list prices is provided to participating entities. Distributors selling to participating entities receive a chargeback equal to the difference between their acquisition cost and the lower negotiated price. The Company estimates provisions for chargebacks primarily based on historical experience on a program basis and current contract prices.
•Administrative fees paid to distributors. The Company pays administrative fees to certain distributors, which is generally based on a fixed percentage multiplied by either gross purchases from Insulet or gross sales of Insulet products sold by the distributor. These fees are not in exchange for a distinct good or service and therefore are recognized as a reduction of the transaction price. The Company accrues for these fees based on gross sales and contractual fee rates negotiated with the customer.
•Product Returns. The Company estimates product returns provision primarily based on historical experience by applying a historical return rate to the amounts of revenue estimated to be subject to returns. Additionally, the Company considers other specific factors such as the estimated shelf life of inventory in the distribution channel and changes to customer terms.
•Discounts. The Company provides customers with prompt payment discounts, which may result in adjustments to the price that is invoiced for the product transferred, in the case that payments are made within a defined period. The Company estimates prompt payment discount accruals based on actual gross sales and contractual discount rates.
•Other Arrangements. Other incentive or promotional arrangements may be offered to customers, including but not limited to copayment assistance for users with commercial insurance. We record a provision for the incentive earned based on the number of estimated claims and our estimate of the cost per claim related to product sales that have been recognized as revenue.
•Revenue Recognition. The Company records revenue upon transfer of control of the product to the customers, which is generally when the product is shipped or delivered and title passes to the customer. Revenue from product training is recognized in the period it is provided. The Company records deferred revenue if a customer pays consideration, or the Company has the right to invoice, before the Company transfers a good or service to a customer. Deferred revenue primarily represents product training as there is generally a lag between when the customer is billed and when the end-user receives training.
The Company’s Drug Delivery product line includes sales of a modified version of the Pod to pharmaceutical and biotechnology companies who use the Company’s technology as a delivery method for their drugs. For the majority of this product line, revenue is recognized, with an associated unbilled receivable, as the product is produced pursuant to the customer’s firm purchase commitments. The Company has an enforceable right to payment for performance completed to date and the inventory has no alternative use to the Company. The Company recognizes revenue over time using a blend of costs incurred to date relative to total estimated costs at completion and time incurred to date relative to total production time to measure progress toward the satisfaction of its performance obligations. The Company believes that both incurred cost and elapsed time reflect the value generated, which best depicts the transfer of control to the customer. Contract costs include third-party costs as well as an allocation of manufacturing overhead.
Research and Software Development Costs
Internal research and development costs are expensed as incurred. Research and development expenses include salary and benefits, allocated overhead and occupancy costs, clinical trial and related clinical manufacturing costs, contract services, and other costs.
Costs incurred in the research, design, and development of software embedded in products to be sold to customers are charged to expense until technological feasibility of the ultimate product to be sold is established. The Company’s policy is that technological feasibility is achieved when a working model, with the key features and functions of the product, is available for customer testing. Software development costs incurred after the establishment of technological feasibility and until the product is available for general release are capitalized, provided recoverability is reasonably assured. Capitalized software development costs are amortized over their estimated useful life and recorded within cost of revenue.
Shipping and Handling Costs
The Company does not typically charge its customers for shipping and handling costs associated with shipping its product to its customers unless non-standard shipping and handling services are requested. These shipping and handling costs are included in selling, general and administrative expenses and were $16.3 million, $12.4 million, and $12.8 million for the years ended December 31, 2024, 2023, and 2022, respectively.
Advertising Costs
The Company expenses advertising costs as they are incurred. Advertising costs are included in selling, general and administrative expenses and were $84.3 million, $63.1 million, and $41.2 million for the years ended December 31, 2024, 2023, and 2022, respectively.
Stock-Based Compensation Expense
The Company measures stock-based compensation on the grant date based on the fair value of the award and recognizes the compensation expense over the requisite service period, which is generally the vesting period. The amount of stock-based compensation expense recognized during a period is based on the portion of the awards that are expected to vest. Forfeitures are estimated at the time of grant and revised, if necessary, in subsequent periods if actual forfeitures differ from those estimates.
Income Taxes
The Company recognizes deferred tax assets and liabilities for the expected future tax consequences of events that have been included in the consolidated financial statements. Deferred tax assets and liabilities are determined based on differences between the financial reporting and tax bases of assets and liabilities and are measured using the enacted tax rates that will be in effect in the years in which the differences are expected to reverse. The Company reviews its deferred tax assets for recoverability by considering all available positive and negative evidence, including historical profitability, projected future taxable income, and the expected timing of the reversals of existing temporary differences and tax planning strategies. A valuation allowance is provided to reduce the deferred tax assets if, based on the available evidence, it is more likely than not that some or all the deferred tax assets will not be realized. The effect of a change in enacted tax rates on deferred tax assets and liabilities is recognized in income in the period that includes the enactment date. Interest and penalties are classified as a component of income tax expense.
Concentration Risk
Credit Risk—Financial instruments that subject the Company to credit risk primarily consist of cash and cash equivalents and accounts receivable. The Company maintains most of its cash and investments in money market funds with a limited number of financial institutions that have a high investment grade credit rating. See Notes 4 and 6 for customer concentration.
Supply Risk—The Company uses different types of semiconductor chips, which are sourced from external suppliers, in the manufacturing of its products. While the Company has multiple suppliers of semiconductor chips, each type is typically sourced from a single supplier. Supply chain disruptions, supplier shortages, logistic delays, or quality problems could result in manufacturing delays, increased costs, or a possible loss of sales, which could adversely affect operating results.
Recently Adopted Accounting Standards
Segment Reporting—The Company adopted Accounting Standards Update (“ASU”) 2023-07, Segment Reporting (Topic 280): Improvements to Reportable Segment Disclosures during the fourth quarter of 2024. ASU 2023-07 requires incremental disclosures on reportable segments, primarily significant segment expenses. The required disclosures are included in Note 3.
Convertible Debt—Effective January 1, 2022, the Company adopted ASU 2020-06, Debt – Debt With Conversion and Other Options (Subtopic 470-20) and Derivatives and Hedging – Contracts in Entity’s Own Equity (Subtopic 815-40): Accounting for Convertible Instruments and Contracts in an Entity’s Own Equity using the modified retrospective method for convertible debt instruments outstanding as of the date of adoption. Under ASU 2020-06, a convertible debt instrument is generally reported as a single liability at its amortized cost with no separate accounting for embedded conversion features. Consequently, the effective interest rate of convertible debt instruments is closer to the coupon interest rate under this guidance. The cumulative effect of adopting ASU 2020-06 resulted in a $207.7 million decrease to the opening balance of additional paid-in-capital upon adoption resulting from the derecognition of the embedded conversion feature and debt issuance costs bifurcated to equity, a $60.6 million decrease to the opening balance of accumulated deficit representing the cumulative interest expense recognized related to the amortization of the bifurcated conversion option and debt issuance costs, and a $147.1 million increase in long-term debt resulting from the derecognition of the discount associated with the embedded conversion feature, offset by the remaining debt issuance costs reclassified out of equity. In addition, the Company wrote-off the related deferred tax liabilities with a corresponding adjustment to the valuation allowance, resulting in no net impact to the cumulative adjustment recorded to accumulated deficit. Adoption of this standard had no impact on the Company’s diluted earnings per share as the Company historically calculated earnings per share using the if-converted method.
Reference Rate Reform—ASU 2020-04, Reference Rate Reform (Topic 848) – Facilitation of the Effects of Reference Rate Reform on Reporting and ASU 2021-01, Reference Rate Reform (Topic 848) – Scope allow companies to elect optional expedients and exceptions for applying U.S. GAAP to contracts, hedging relationships, and other transactions affected by reference rate reform (e.g., discontinuation of the London Interbank Offered Rate (“LIBOR”)) if certain criteria are met. During the fourth quarter of 2022, the Company elected to apply optional expedients for contract modifications to all eligible debt instruments and hedging relationships affected by the transition from LIBOR to the Secured Overnight Financing Rate (“SOFR”). Accordingly, the Company did not have to assess whether the contract modification should be accounted for as a debt extinguishment. Additionally, the Company was not required to de-designate hedging relationships when the contractual terms changed. The adoption of these standards had no impact on our consolidated financial statements.
Note 3. Segment and Geographic Data
As described in Note 1, the Company’s product offering primarily consists of the Omnipod platform and drug delivery device based on the Omnipod platform. Operating segments are defined as components of an enterprise for which separate financial information is available that is evaluated on a regular basis by the chief operating decision-maker (“CODM”) in deciding how to allocate resources to an individual segment and in assessing performance of the segment. The Company has concluded that its Chief Executive Officer (“CEO”) is the CODM as the CEO is the ultimate decision maker for key operating decisions, determining the allocation of resources and assessing the financial performance of the Company. The Company operates under one reportable segment. While decisions, allocations, and assessments are performed by the CODM using consolidated operating income, net income is also provided to the CODM.
Geographic information about revenue, based on customer location, is as follows:
| | | | | | | | | | | | | | | | | |
| Years Ended December 31, |
| (in millions) | 2024 | | 2023 | | 2022 |
| U.S. | $ | 1,548.2 | | | $ | 1,287.0 | | | $ | 942.3 | |
| International | 523.4 | | | 410.1 | | | 363.0 | |
| Total revenue | $ | 2,071.6 | | | $ | 1,697.1 | | | $ | 1,305.3 | |
The following table presents selected financial information for the Company’s single operating segment, including significant expenses:
| | | | | | | | | | | | | | | | | |
| Years Ended December 31, |
| (in millions) | 2024 | | 2023 | | 2022 |
| Total revenue | 2,071.6 | | | 1,697.1 | | | 1,305.3 | |
Materials(1) | 296.7 | | | 261.3 | | | 198.0 | |
Factory conversion(2) | 176.9 | | | 151.2 | | | 125.7 | |
Depreciation and amortization(3) | 25.9 | | | 26.3 | | | 21.9 | |
Other costs of revenue(4) | 126.4 | | | 98.4 | | | 154.1 | |
| Cost of revenue | 625.9 | | | 537.2 | | | 499.7 | |
Labor(5) | 478.4 | | | 398.4 | | | 343.7 | |
Outside services(6) | 260.5 | | | 225.4 | | | 157.6 | |
| Depreciation and amortization | 47.0 | | | 40.7 | | | 28.9 | |
Other operating expenses(7) | 350.9 | | | 275.4 | | | 237.8 | |
| Operating income | 308.9 | | | 220.0 | | | 37.6 | |
| Interest expense, net | (3.2) | | | (7.6) | | | (26.7) | |
| Other (expense) income, net | (5.5) | | | 2.2 | | | (1.1) | |
| Income tax benefit (expense) | 118.1 | | | (8.3) | | | (5.2) | |
| Net income | $ | 418.3 | | | $ | 206.3 | | | $ | 4.6 | |
(1) Consists of raw materials utilized included in cost of revenue.
(2) Consists of manufacturing labor, factory overhead and depreciation of plant and equipment primarily at our Acton manufacturing plant.
(3) Consists of depreciation and amortization included in cost of revenue, except for depreciation of plant and equipment included in factory conversion as described in Note 2.
(4) Consists primarily of warranty expense, cost to manufacture Controllers/PDMs, provision for inventory reserves, cost of data plans and licensing, and costs to train users.
(5) Consists of labor expenses included in research and development expenses and selling, general and administrative expenses, excluding stock-based compensation expense.
(6) Consists primarily of contract labor and professional and consulting fees.
(7) Consists primarily of advertising expense, license fees, stock-based compensation expense and travel and expenses.
Geographic information about long-lived assets, net, excluding goodwill and other intangible assets is as follows:
| | | | | | | | | | | |
| As of December 31, |
| (in millions) | 2024 | | 2023 |
| U.S. | $ | 475.9 | | | $ | 461.3 | |
| Malaysia | 159.1 | | | 113.7 | |
| China | 78.5 | | | 82.0 | |
| Other | 9.6 | | | 7.9 | |
| Total long-lived assets, net | $ | 723.1 | | | $ | 664.9 | |
Note 4. Revenue and Contract Acquisition Costs
The following table summarizes the Company’s disaggregated revenue:
| | | | | | | | | | | | | | | | | |
| Years Ended December 31, |
| (in millions) | 2024 | | 2023 | | 2022 |
| U.S. | $ | 1,509.3 | | | $ | 1,251.0 | | | $ | 884.8 | |
| International | 523.4 | | | 410.1 | | | 363.0 | |
| Total Omnipod products | 2,032.7 | | | 1,661.1 | | | 1,247.8 | |
| Drug Delivery | 38.9 | | | 36.0 | | | 57.5 | |
| Total revenue | $ | 2,071.6 | | | $ | 1,697.1 | | | $ | 1,305.3 | |
The percentages of total revenue for customers that represent 10% or more of total revenue was as follows:
| | | | | | | | | | | | | | | | | |
| Years Ended December 31, |
| 2024 | | 2023 | | 2022 |
| Distributor A | 28% | | 28% | | 19% |
| Distributor B | 26% | | 24% | | 16% |
| Distributor C | 21% | | 19% | | 17% |
Deferred revenue related to unsatisfied performance obligations was included in the following consolidated balance sheet accounts in the amounts shown:
| | | | | | | | | | | | | | | | | |
| As of December 31, |
| (in millions) | 2024 | | 2023 | | 2022 |
| Accrued expenses and other current liabilities | $ | 12.0 | | | $ | 15.4 | | | $ | 16.1 | |
| Other liabilities | 2.0 | | | 1.9 | | | 1.6 | |
| Total deferred revenue | $ | 14.0 | | | $ | 17.3 | | | $ | 17.7 | |
Revenue recognized from amounts included in deferred revenue at the beginning of each respective period was as follows:
| | | | | | | | | | | | | | | | | |
| As of December 31, |
| (in millions) | 2024 | | 2023 | | 2022 |
| Deferred revenue recognized | $ | 15.4 | | | $ | 16.0 | | | $ | 2.1 | |
Contract acquisition costs, representing capitalized commission costs related to new customers, net of amortization, were included in the following consolidated balance sheet captions in the amounts shown:
| | | | | | | | | | | |
| As of December 31, |
| (in millions) | 2024 | | 2023 |
| Prepaid expenses and other current assets | $ | 20.1 | | | $ | 16.6 | |
| Other assets | 40.8 | | | 32.0 | |
| Total capitalized contract acquisition costs, net | $ | 60.9 | | | $ | 48.6 | |
The Company recognized $18.2 million, $16.3 million, and $14.6 million of amortization of capitalized contract acquisition costs for the years ended December 31, 2024, 2023, and 2022, respectively.
Note 5. Related Party Transactions
The spouse of one of the members of the Company’s Board of Directors is an executive officer of one of the Company’s distributors. The terms of the distribution agreement are consistent with those prevailing at arm’s length. The Company recorded $587.8 million, $473.7 million and $249.9 million of net revenues from the distributor for the years ended December 31, 2024, 2023, and 2022, respectively.
Related party transactions recorded on the consolidated balance sheets were as follows:
| | | | | | | | | | | |
| As of December 31, |
| (in millions) | 2024 | | 2023 |
| Accounts receivable, net | $ | 113.0 | | | $ | 119.5 | |
Distribution fees payable(1) | $ | — | | | $ | 6.1 | |
Deferred revenue(1) | $ | 1.0 | | | $ | 2.8 | |
(1) Balances are included in accrued expenses and other current liabilities.
Note 6. Accounts Receivable
Accounts receivable were comprised of the following: | | | | | | | | | | | | | | | | | |
| As of December 31, |
| (in millions) | 2024 | | 2023 | | 2022 |
| Accounts receivable trade, net | $ | 242.8 | | | $ | 234.5 | | | $ | 128.6 | |
| Unbilled receivable | 9.7 | | | 5.7 | | | 12.3 | |
| Accounts receivable, net | $ | 252.5 | | | $ | 240.2 | | | $ | 140.9 | |
The percentages of total net accounts receivable trade for customers that represent 10% or more of total net accounts receivable trade were as follows: | | | | | | | | | | | |
| As of December 31, |
| 2024 | | 2023 |
| Distributor A | 35% | | 35% |
| Distributor B | 27% | | 25% |
| Distributor C | 15% | | 18% |
The following table presents the activity in the allowance for credit losses:
| | | | | | | | | | | | | | | | | |
| Years Ended December 31, |
| (in millions) | 2024 | | 2023 | | 2022 |
| Credit losses at beginning of year | $ | 2.5 | | | $ | 2.5 | | | $ | 2.7 | |
| Provision for expected credit losses | (0.2) | | | 2.3 | | | 4.2 | |
| Write-offs charged against allowance | (0.9) | | | (2.6) | | | (4.9) | |
| Recoveries of amounts previously reserved | — | | | 0.3 | | | 0.5 | |
| Credit losses at end of year | $ | 1.4 | | | $ | 2.5 | | | $ | 2.5 | |
The Company outsources the insurance claim submissions process to a third-party service provider in one country in which it operates. Under this agreement, the Company transfers certain receivables in exchange for cash in advance. If the third-party service provider is unable to collect on the transferred receivables, the third-party service provider has recourse to the Company. This arrangement is accounted for as a secured borrowing with a pledge of collateral as the transfer does not meet the criteria for sale accounting. Receivables pledged as collateral of $12.2 million are included in accounts receivable on the consolidated balance sheet as of December 31, 2024. Liabilities associated with the secured borrowings of $12.2 million are included within accrued expenses and other current liabilities in the consolidated balance sheet as of December 31, 2024. No amounts were outstanding as of December 31, 2023. The classification within current liabilities is based on the expected resolution of the underlying receivables. The proceeds from and repayments of secured borrowings are reflected as cash flows provided by (used in) financing activities in the consolidated statement of cash flows.
Note 7. Inventories
Inventories were comprised of the following:
| | | | | | | | | | | |
| As of December 31, |
| (in millions) | 2024 | | 2023 |
| Raw materials | $ | 156.7 | | | $ | 118.2 | |
| Work in process | 81.2 | | | 60.6 | |
| Finished goods | 192.5 | | | 223.8 | |
| Total inventories | $ | 430.4 | | | $ | 402.6 | |
Following the strategic decision to not move forward with the commercialization of Omnipod GO, the Company recorded a charge of $13.5 million related to certain inventory components that it no longer expected to utilize, which is included in cost of revenue in the consolidated statement of income for the year ended December 31, 2024.
Note 8. Cloud Computing Costs
Capitalized costs to implement cloud computing arrangements at cost and accumulated amortization were as follows:
| | | | | | | | | | | |
| | As of December 31, |
| (in millions) | 2024 | | 2023 |
| Short-term portion | $ | 31.7 | | | $ | 26.4 | |
| Long-term portion | 135.3 | | | 116.9 | |
| Total capitalized implementation costs | 167.0 | | | 143.3 | |
| Less: accumulated amortization | (62.4) | | | (36.6) | |
| Capitalized implementation costs, net | $ | 104.6 | | | $ | 106.7 | |
Amortization expense is recognized on a straight-line basis over the expected term of the hosting arrangements, which range from three to ten years. Amortization expense was $26.8 million, $20.3 million, and $12.7 million for the years ended December 31, 2024, 2023, and 2022, respectively.
Note 9. Property, Plant and Equipment, Net
Property, plant and equipment at cost and accumulated depreciation were as follows:
| | | | | | | | | | | |
| | As of December 31, |
| (in millions) | 2024 | | 2023 |
| Land | $ | 12.2 | | | $ | 9.0 | |
| Building and building improvements | 226.8 | | | 205.3 | |
| Machinery and equipment | 672.7 | | | 572.2 | |
| Furniture and fixtures | 20.8 | | | 18.1 | |
| Leasehold improvements | 16.4 | | | 16.0 | |
| Construction in process | 136.6 | | | 137.5 | |
| Property, plant and equipment, gross | 1,085.5 | | | 958.1 | |
| Less: accumulated depreciation | (362.4) | | | (293.2) | |
| Property, plant and equipment, net | $ | 723.1 | | | $ | 664.9 | |
Capitalized interest expense was $1.5 million, $1.6 million, and $1.3 million for the years ended December 31, 2024, 2023, and 2022, respectively. Depreciation expense related to property and equipment was $71.0 million, $62.6 million, and $56.0 million for the years ended December 31, 2024, 2023, and 2022, respectively. Construction in process primarily consists of equipment and tooling expected to be placed into service during 2025.
Note 10. Business Combination
On January 3, 2022, the Company acquired substantially all of the assets related to the manufacture and production of shape-memory alloy wire assemblies that are used in the production of Pods from Dynalloy, Inc., a maker of dynamic alloys. The aggregate purchase price was $29.0 million, of which $26.0 million was paid in cash upon closing, and the remaining $3.0 million was paid in January 2023. Transaction costs were expensed as incurred and were not material. The following table summarizes the fair value allocation of the assets acquired at the date of acquisition:
| | | | | |
| (in millions) | |
| Inventories | $ | 0.5 | |
| Property, plant and equipment | 0.9 | |
| Other assets | 0.2 | |
| Goodwill (tax deductible) | 12.0 | |
| Developed technology (15 year useful life) | 15.4 | |
| Total assets acquired | $ | 29.0 | |
The primary factor that contributed to an acquisition price in excess of the fair value of assets acquired and the establishment of goodwill was the expected cost savings resulting from the integration of a supplier.
Note 11. Goodwill and Other Intangible Assets, Net
Goodwill
The change in the carrying amount of goodwill for the period is as follows:
| | | | | | | | | | | |
| Years Ended December 31, |
| (in millions) | 2024 | | 2023 |
| Goodwill at beginning of the year | $ | 51.7 | | | $ | 51.7 | |
| Foreign currency translation | (0.2) | | | — | |
| Goodwill at end of the year | $ | 51.5 | | | $ | 51.7 | |
Intangible Assets, Net
The gross carrying amount, accumulated amortization and net book value of intangible assets at the end of each period were as follows:
| | | | | | | | | | | | | | | | | | | | | | | | | | | | | | | | | | | |
| | As of December 31, |
| 2024 | | 2023 |
| (in millions) | Gross Carrying Amount | | Accumulated Amortization | | Net Book Value | | Gross Carrying Amount | | Accumulated Amortization | | Net Book Value |
| Customer relationships | $ | 43.1 | | | $ | (33.5) | | | $ | 9.6 | | | $ | 43.2 | | | $ | (30.9) | | | $ | 12.3 | |
| Internal-use software | 52.4 | | | (15.6) | | | 36.8 | | | 43.1 | | | (13.9) | | | 29.2 | |
| Developed technology | 27.4 | | | (4.9) | | | 22.5 | | | 27.4 | | | (3.0) | | | 24.4 | |
| Patents | 36.2 | | | (6.6) | | | 29.6 | | | 36.2 | | | (3.4) | | | 32.8 | |
| Total intangible assets | $ | 159.1 | | | $ | (60.6) | | | $ | 98.5 | | | $ | 149.9 | | | $ | (51.2) | | | $ | 98.7 | |
Amortization expense for intangible assets was $9.8 million, $10.2 million, and $7.2 million for the years ended December 31, 2024, 2023, and 2022, respectively.
In February 2023, the Company paid Bigfoot Biomedical, Inc. $25.1 million, including transaction costs, to acquire patent assets related to pump-based automated insulin delivery technologies. The acquired patent assets have a useful life of 11 years.
Amortization expense associated with the intangible assets included on the Company’s consolidated balance sheet as of December 31, 2024 is expected to be as follows:
| | | | | |
| Years Ending December 31, | (in millions) |
| 2025 | $ | 14.2 | |
| 2026 | $ | 15.1 | |
| 2027 | $ | 14.0 | |
| 2028 | $ | 12.9 | |
| 2029 | $ | 12.3 | |
Note 12. Investments
Equity Securities
In 2024, the Company made a strategic investment in equity securities of a privately held entity in the amount of $12.0 million. As of December 31, 2024 and 2023, the total carrying value of the Company’s investments in equity securities without readily determinable fair values was $21.9 million and $9.7 million, respectively. There were no unrealized gains or losses recorded due to changes in the fair value of equity investments during the years ended December 31, 2024 and 2022, and the unrealized gain recorded was insignificant for the year ended December 31, 2023. Refer to “Assets Measured at Fair Value on a Non-Recurring Basis” in Note 16 for disclosures regarding equity securities without readily determinable fair values.
Debt Securities
In 2023, the Company made a strategic investment in debt securities of a privately held entity in the amount of $5.0 million, which is included in other assets on the consolidated balance sheets. The debt securities mature in December 2026, unless converted earlier. The amortized cost basis of the debt securities was $5.0 million at both December 31, 2024 and December 31, 2023. The amount of interest earned on the investment for the years ended December 31, 2024 and 2023 was insignificant. Refer to Note 16 for the fair values.
Other
In 2023, the Company made a strategic investment in a privately held entity in the amount of $2.0 million. The investment is a debt security with embedded derivatives and is accounted for by applying the fair value option, as this approach best reflects the underlying economics of the transaction. The fair value of the investment is calculated using a combination of the market approach and income approach methodologies and is reported within other assets on the consolidated balance sheet. Refer to Note 16 for the fair values and unrealized losses recorded.
Note 13. Accrued Expenses and Other Current Liabilities
The components of accrued expenses and other current liabilities were as follows:
| | | | | | | | | | | |
| As of December 31, |
| (in millions) | 2024 | | 2023 |
| Accrued rebates | $ | 148.3 | | | $ | 144.0 | |
| Employee compensation and related costs | 142.8 | | | 122.0 | |
| Professional and consulting services | 51.6 | | | 34.1 | |
| Liability associated with secured borrowings | 12.2 | | | — | |
| Other | 68.9 | | | 73.6 | |
| Accrued expenses and other current liabilities | $ | 423.8 | | | $ | 373.7 | |
Product Warranty Costs
Reconciliations of the changes in the Company’s product warranty liability were as follows:
| | | | | | | | | | | | | | | | | |
| Years Ended December 31, |
| (in millions) | 2024 | | 2023 | | 2022 |
| Product warranty liability at beginning of year | $ | 10.3 | | | $ | 62.1 | | | $ | 6.8 | |
| Warranty expense | 24.1 | | | 18.6 | | | 87.0 | |
| Change in estimate | (0.4) | | | (11.5) | | | (14.0) | |
| Warranty fulfillment | (20.1) | | | (58.9) | | | (17.7) | |
| Product warranty liability at end of year | $ | 13.9 | | | $ | 10.3 | | | $ | 62.1 | |
In 2022, the Company issued two voluntary medical device correction notices (“MDCs”), one for its Omnipod DASH PDM relating to its battery and the other for its Omnipod 5 Controller relating to its charging port and cable. The Company initially accrued an estimated liability of $68.9 million related to these MDCs, which was subsequently revised by $11.0 million due to significantly fewer customers requesting a replacement Omnipod DASH PDM prior the Company’s updated PDM being available, resulting in a net charge of $57.9 million for the year ended December 31, 2022. During the year ended December 31, 2023, the Company further revised the estimated liability for these MDCs by 11.5 million. This change in estimate primarily resulted from lower shipping costs for replacement DASH PDMs and lower expected distribution costs for Omnipod 5 Controllers. The liability related to the MDCs included in product warranty liability at December 31, 2023 was insignificant and no amount was remaining as of December 31, 2024.
Note 14. Leases
As of December 31, 2024, the Company leased certain automobiles and facilities for offices, laboratories, manufacturing, and warehousing, all of which were classified as operating leases. Certain of the Company’s operating leases include escalating rental payments, some include the option to extend for up to 10 years, and some include options to terminate the leases at certain times within the lease term. In 2023, the Company also leased land and a manufacturing building in Malaysia, which were classified as finance leases until the Company exercised its option to purchase this property for $18.1 million in 2024.
Lease assets and lease liabilities were included in the following consolidated balance sheet accounts in the amounts shown:
| | | | | | | | | | | |
| Years Ended December 31, |
| (in millions) | 2024 | | 2023 |
| Operating leases | | | |
| Operating lease asset: | | | |
| Other assets | $ | 36.7 | | | $ | 27.9 | |
| Operating lease liabilities: | | | |
| Accrued expenses and other current liabilities | $ | 2.1 | | | $ | 3.5 | |
| Other liabilities | 40.0 | | | 29.5 | |
| Total operating lease liabilities | $ | 42.1 | | | $ | 33.0 | |
| Finance leases | | | |
| Finance lease assets: | | | |
| Property, plant and equipment, net | $ | — | | | $ | 37.8 | |
| Finance lease liabilities: | | | |
| Current portion of long-term debt and finance leases | $ | — | | | $ | 22.9 | |
The Company’s operating and financing lease cost was as follows:
| | | | | | | | | | | | | | | | | |
| Years Ended December 31, |
| (in millions) | 2024 | | 2023 | | 2022 |
| Operating lease cost | $ | 7.3 | | | $ | 8.8 | | | $ | 8.8 | |
| Finance lease cost: | | | | | |
| Amortization of leased assets | 0.7 | | | 0.4 | | | — | |
| Interest on lease liabilities | 1.0 | | | 0.6 | | | — | |
| Total finance lease cost | 1.7 | | | 1.0 | | | — | |
| Total operating and financing lease cost | $ | 9.0 | | | $ | 9.8 | | | $ | 8.8 | |
Supplemental cash flow information related to leases is as follows:
| | | | | | | | | | | | | | | | | |
| Years Ended December 31, |
| (in millions) | 2024 | | 2023 | | 2022 |
| Right-of-use assets obtained in exchange for lease liabilities | | | | | |
| Operating leases | $ | 8.0 | | | $ | 5.4 | | | $ | 25.5 | |
| Finance lease | $ | — | | | $ | 22.3 | | | $ | — | |
| Lease payment made for amounts included in the measurement of operating lease liabilities | | | | | |
| Cash paid for operating leases included in operating cash flows | $ | 5.8 | | | $ | 5.7 | | | $ | 4.6 | |
| Cash paid for finance lease included in operating cash flows | $ | 1.1 | | | $ | — | | | $ | — | |
| Cash paid for finance lease included in financing cash flows | $ | 22.7 | | | $ | — | | | $ | — | |
Maturities of lease liabilities as of December 31, 2024 are as follows:
| | | | | |
| Years Ending December 31, | (in millions) |
| 2025 | $ | 5.4 | |
| 2026 | 4.9 | |
| 2027 | 5.5 | |
| 2028 | 5.7 | |
| 2029 | 6.0 | |
| Thereafter | 40.1 | |
| Total future minimum lease payments | 67.6 | |
| Less: imputed interest | (25.5) | |
| Present value of future minimum lease payments | $ | 42.1 | |
As of December 31, 2024, the weighted average remaining lease term for operating leases was 11.4 and the weighted-average discount rate used to determine the operating lease liability was 8.1%.
Note 15. Debt
The components of debt consisted of the following:
| | | | | | | | | | | | | | | | | | | | | | | | | | | | | |
| | | | December 31, 2024 | | December 31, 2023 |
| (in millions) | Maturity Date | | Amount | | Effective Interest Rate | | Amount | | Effective Interest Rate |
| Equipment financing | 2024 | | $ | — | | | 7.83 | % | | $ | 2.7 | | | 5.76 | % |
| Equipment financing | 2025 | | 8.6 | | | 5.90 | % | | 15.2 | | | 4.77 | % |
| Mortgage | 2025 | | 61.0 | | | 5.74 | % | | 63.3 | | | 5.73 | % |
| Convertible Senior Notes | 2026 | | 800.0 | | | 0.76 | % | | 800.0 | | | 0.76 | % |
| Equipment financing | | | 17.5 | | | 8.87 | % | | 12.7 | | | 9.37 | % |
| Revolving Credit Facility | 2028 | | — | | | | | — | | | |
| Equipment financing | 2028 | | 23.4 | | | 4.27 | % | | 29.0 | | | 4.27 | % |
| Term Loan | 2031 | | 482.5 | | | | | 487.5 | | | |
Finance lease obligation(1) | | | — | | | | | 22.9 | | | |
| Unamortized debt discount | 2025 - 2031 | | (5.4) | | | | | (6.4) | | | |
| Debt issuance costs | 2025 - 2031 | | (7.7) | | | | | (11.1) | | | |
| Total debt, net | | | 1,379.9 | | | | | 1,415.8 | | | |
| Less: current portion | | | 83.8 | | | | | 49.4 | | | |
| Total long term-debt, net | | | $ | 1,296.1 | | | | | $ | 1,366.4 | | | |
(1) Refer to Note 14 for information regarding finance lease obligation.
Equipment Financings
The Company has two outstanding loans secured by manufacturing lines located at the Company’s Acton, Massachusetts manufacturing facility. Additionally, in May 2023, the Company entered into an arrangement under which the Company may obtain up to $24.0 million of financing for manufacturing equipment. The Company is involved in the construction of the manufacturing equipment; accordingly, it is included in property, plant and equipment on the consolidated balance sheets. The Company’s obligation reflects payments made to date by the third-party bank to the equipment manufacturer, net of discount and less repayment of principal. The financing obligation will mature 36 months following completion of construction.
Mortgage
The Company has an outstanding loan that is secured by the Company’s Acton, Massachusetts headquarters. The Mortgage contains non-financial customary covenants, none of which are considered restrictive to the Company’s operations.
Convertible Senior Notes
The Company has $800.0 million aggregate principal amount of 0.375% Convertible Senior Notes due September 2026 (the “Convertible Senior Notes”) outstanding. The Convertible Senior Notes are convertible into cash, shares of the Company’s common stock, or the combination of cash and shares of common stock, at the Company's election, at an initial conversion rate of 4.4105 shares of common stock per $1,000 principal amount of the notes, which is equivalent to a conversion price of $226.73 per share, subject to adjustment under certain circumstances. The notes will be convertible at the holder's election, from June 1, 2026 through August 28, 2026 and prior to then under certain circumstances as set forth in the agreement. Additionally, on or after September 6, 2023, the Company may redeem for cash all or a portion of the Convertible Senior Notes, if its stock price has been equal to or greater than $294.75 for at least 20 of the prior 30 consecutive trading days including the date which the Company provides notice of redemption.
Additional interest of 0.5% per annum is payable if the Company fails to timely file required documents or reports with the Securities and Exchange Commission (“SEC”). If the Company merges or consolidates with a foreign entity, the Company may be required to pay additional taxes. The Company determined that the higher interest payments and tax payments required in certain circumstances were embedded derivatives that should be bifurcated and accounted for at fair value. The Company assessed the value of the embedded derivatives at each balance sheet date and determined they had nominal value.
In conjunction with the issuance of the Convertible Senior Notes, the Company purchased capped call options (“Capped Calls”) on the Company’s common stock with certain counterparties to reduce the potential dilution to its common stock (or, in the event the conversion is settled in cash, to provide a source of cash to settle a portion of its cash payment obligation) if at the time of conversion its stock price exceeds the conversion price under the Convertible Senior Notes. The Capped Calls have an initial strike price of $335.90 per share, which represents a premium of 100% over the last reported sale price of the Company’s common stock of $167.95 per share on the date of the transaction. The Capped Calls cover 3.5 million shares of common stock and are recorded within stockholders’ equity on the consolidated balance sheets.
As of December 31, 2024 and 2023, the net carrying amount of the Notes was $794.9 million and $791.8 million, respectively, net of unamortized issuance costs of $5.1 million and $8.2 million, respectively.
The components of interest expense related to the Notes were as follows:
| | | | | | | | | | | | | | | | | |
| Years Ended December 31, |
| (in millions) | 2024 | | 2023 | | 2022 |
| Contractual interest expense | $ | 3.0 | | | $ | 3.0 | | | $ | 3.0 | |
| Amortization of debt issuance costs | 3.0 | | | 3.0 | | | 3.0 | |
| Total interest recognized on the Convertible Senior Notes | $ | 6.0 | | | $ | 6.0 | | | $ | 6.0 | |
Senior Secured Credit Agreement
In May 2021, the Company entered into a senior secured credit agreement (the “Credit Agreement”), which includes a $500 million seven-year senior secured term loan B (the “Term Loan”). On November 30, 2022, the Company amended the Term Loan to bear interest at a rate of SOFR plus 3.25%, with a 0.50% SOFR floor and in January 2024, amended it again to bear interest at a rate of SOFR plus 3.0%, with a 0% SOFR floor. At the same time, the Company amended its senior secured revolving credit facility (the “Revolving Credit Facility”) discussed below such that outstanding borrowings bear interest at a rate of SOFR plus an applicable margin of 2.375% to 3.0% (previously 2.625% to 3.25%) based on the Company’s net leverage ratio and credit rating. In August 2024, the Company amended its Term Loan to bear interest at a rate of SOFR plus 2.5% and extended the term to August 2031. At the same time, the Company amended its Revolving Credit Facility such that outstanding borrowings bear interest at a rate of SOFR plus an applicable margin of 2% to 2.5% based on the Company’s net leverage ratio. The Term Loan contains leverage and fixed charge coverage ratio covenants, both of which are measured upon the incurrence of future debt.
Under the same agreement, the Company obtained a Revolving Credit Facility. In 2023, the Company increased the borrowing capacity under the Revolving Credit Facility to $300.0 million and extended the maturity date to the earlier of June 2028 or 91 days prior to the maturity date of the Company's term loan if still outstanding. The Revolving Credit Facility contains a covenant to maintain a specified leverage ratio under certain conditions when there are amounts outstanding.
Borrowings under the Credit Agreement are guaranteed by certain wholly owned domestic subsidiaries of the Company and are secured by substantially all assets of the Company and of each subsidiary guarantor, subject to certain exceptions. Additionally, borrowings under the Credit Agreement are senior to all of the Company’s unsecured indebtedness, including the Convertible Senior Notes.
The carrying value amounts of the Company’s debt were as follows:
| | | | | | | | | | | |
| As of December 31, |
| (in millions) | 2024 | | 2023 |
| Term Loan | $ | 475.1 | | | $ | 479.2 | |
| Convertible Senior Notes | 794.9 | | | 791.8 | |
| Equipment financings | 49.3 | | | 59.3 | |
| Mortgage | 60.6 | | | 62.6 | |
| Finance lease obligation | — | | | 22.9 | |
| Total debt, net | $ | 1,379.9 | | | $ | 1,415.8 | |
Maturity of Debt
The maturity of debt as of December 31, 2024 is as follows: | | | | | |
| Years Ending December 31, | (in millions) |
| 2025 | $ | 83.8 | |
| 2026 | $ | 817.1 | |
| 2027 | $ | 18.1 | |
| 2028 | $ | 11.4 | |
| 2029 | $ | 5.0 | |
Note 16. Financial Instruments and Fair Value
Financial Instruments Disclosed at Fair Value
The following tables provide a summary of the significant financial instruments disclosed at fair value on a recurring basis:
| | | | | | | | | | | | | | | | | | | | | | | |
| Fair Value Measurements at December 31, 2024 |
| (in millions) | Level 1 | | Level 2 | | Level 3 | | Total |
Term Loan(1) | $ | 485.8 | | | $ | — | | | $ | — | | | $ | 485.8 | |
Convertible Senior Notes(2) | — | | | 1,018.8 | | | — | | | 1,018.8 | |
Equipment financings(3) | — | | | — | | | 49.3 | | | 49.3 | |
Mortgage(3) | — | | | — | | | 60.6 | | | 60.6 | |
| Total | $ | 485.8 | | | $ | 1,018.8 | | | $ | 109.9 | | | $ | 1,614.5 | |
| | | | | | | | | | | | | | | | | | | | | | | |
| Fair Value Measurements at December 31, 2023 |
| (in millions) | Level 1 | | Level 2 | | Level 3 | | Total |
Term Loan(1) | $ | 490.2 | | | $ | — | | | $ | — | | | $ | 490.2 | |
Convertible Senior Notes(2) | — | | | 928.7 | | | — | | | 928.7 | |
Equipment financings(3) | — | | | — | | | 59.3 | | | 59.3 | |
Mortgage(3) | — | | | — | | | 62.6 | | | 62.6 | |
| Total | $ | 490.2 | | | $ | 928.7 | | | $ | 121.9 | | | $ | 1,540.8 | |
(1) Fair value was determined using quoted market prices.
(2) Fair value was determined using market prices obtained from third-party pricing sources.
(3) Fair value approximates carrying value and was determined using the cost basis.
Assets Measured at Fair Value on a Recurring Basis
The following tables provide a summary of assets that are measured at fair value on a recurring basis:
| | | | | | | | | | | | | | | | | | | | | | | |
| Fair Value Measurements at December 31, 2024 |
| (in millions) | Level 1 | | Level 2 | | Level 3 | | Total |
Cash(1) | $ | 133.4 | | | $ | — | | | $ | — | | | $ | 133.4 | |
Money market mutual funds(1) | 820.0 | | | — | | | — | | | 820.0 | |
Interest rate swaps(2) | — | | | 5.5 | | | — | | | 5.5 | |
Debt securities(3) | — | | | — | | | 4.7 | | | 4.7 | |
| Total assets | $ | 953.4 | | | $ | 5.5 | | | $ | 4.7 | | | $ | 963.6 | |
| | | | | | | | | | | | | | | | | | | | | | | |
| Fair Value Measurements at December 31, 2023 |
| (in millions) | Level 1 | | Level 2 | | Level 3 | | Total |
Cash(1) | $ | 103.7 | | | $ | — | | | $ | — | | | $ | 103.7 | |
Money market mutual funds(1) | 547.0 | | | — | | | — | | | 547.0 | |
Term deposits(1) | — | | | 53.5 | | | — | | | 53.5 | |
Interest rate swaps(2) | — | | | 22.8 | | | — | | | 22.8 | |
Debt securities(3) | — | | | — | | | 4.7 | | | 4.7 | |
Other investments(3) | — | | | — | | | 3.8 | | | 3.8 | |
| Total assets | $ | 650.7 | | | $ | 76.3 | | | $ | 8.5 | | | $ | 735.5 | |
| | | | | | | |
| | | | | | | |
(1) Cash and cash equivalents are carried at face amounts, which approximate their fair values.
(2) Fair value represents the estimated amounts the Company would receive or pay to terminate the contracts and is determined using industry standard valuation models and market-based observable inputs, including credit risk and interest rate yield curves. The fair value of the swaps is included in other assets on the consolidated balance sheets.
(3) Fair value is determined using industry standard valuation models and market-based unobservable inputs, including credit spread and risk free rate. The range used for the risk free rate is 4.0% - 4.7%.
Judgement is involved in estimating inputs, such as discount rates, used in Level 3 fair value measurements. Changes to these inputs can have a significant effect on fair value measurements and amounts that could be realized.
Below is a reconciliation of changes in fair value of debt and other investments:
| | | | | | | | | | | | | | | | | |
| (in millions) | Debt Securities | | Other Investments | | Total |
| Balance at December 31, 2022 | $ | — | | | $ | — | | | $ | — | |
| Purchases | 5.0 | | | 2.0 | | | 7.0 | |
| Unrealized gain included in other (expense) income, net | — | | | 1.8 | | | 1.8 | |
| Unrealized loss on securities included in other comprehensive income | (0.3) | | | — | | | (0.3) | |
| Balance at December 31, 2023 | 4.7 | | | 3.8 | | | 8.5 | |
Unrealized loss included in other (expense) income, net | — | | | (3.8) | | | (3.8) | |
| Balance at December 31, 2024 | $ | 4.7 | | | $ | — | | | $ | 4.7 | |
Assets Measured at Fair Value on a Non-Recurring Basis
Due to an observable price change in an orderly transaction during 2023, the Company adjusted the carrying value of certain investments in equity securities held as of December 31, 2023, which resulted in an unrealized gain of $0.8 million. As of both December 31, 2024 and December 31, 2023, cumulative gains were $0.8 million. The investments are classified as Level 2 in the fair value hierarchy.
Note 17. Derivative Instruments
The Company manages interest rate exposure through the use of interest rate swap transactions with financial institutions acting as principal counterparties. Under the Company’s interest rate swap agreements that expire on April 30, 2025, the Company receives variable rate interest payments and pays fixed interest rates of 0.95% and 0.96% on a total notional value of $480.0 million of its Term Loan. The Company has designated the interest rate swaps as cash flow hedges.
Gains and losses on cash flow hedges reported in accumulated other comprehensive income are reclassified into interest expense, net in the consolidated statement of income when the hedged transactions affect earnings, that is, when interest expense is recognized for the Term Loan. As of December 31, 2024, the Company estimates that $5.4 million of net gains related to the interest rate swaps included in accumulated other comprehensive income will be reclassified into the statement of income over the next 12 months.
Note 18. Commitments and Contingencies
Legal Proceedings
On December 3, 2024, a jury verdict was returned in favor of the Company in the matter of Insulet Corporation vs. EOFlow Co., Ltd. et al. pending in the U.S. District Court of Massachusetts Case No. 1:23-cv-11780. The jury found that EOFlow Co., Ltd. (“EOFlow”) and several other defendants misappropriated certain of the Company’s trade secrets. The jury awarded the Company $170 million in compensatory damages from EOFlow and an additional $282 million in exemplary damages from EOFlow for willful and malicious misappropriation, for a total damages award of $452 million. On January 24, 2025, EOFlow moved for a directed verdict and for a new trial, as well as for a reduction of the jury award. On January 24, 2025, the Company moved for a permanent worldwide injunction on the sale of EOFlow’s EOPatch 2 product and any other products that embody Insulet’s trade secrets. EOFlow and other defendants may seek to appeal the verdict. EOFlow may not be able to satisfy this damage award; accordingly, it has not been recorded in the Company’s consolidated statement of income.
In June 2020, Roche Diabetes Care, Inc. (“Roche”) filed a patent infringement lawsuit against the Company in the United States District Court for the District of Delaware alleging that the Company’s manufacture and sale of its Omnipod Insulin Management System, including Pods, PDMs, and other components of the system, and kits in the United States infringed Roche’s now-expired U.S. Patent 7,931,613. Roche was seeking monetary damages and attorneys’ fees and costs. In July 2022, the Company entered into a Settlement and License Agreement (the “Settlement Agreement”) with Roche to settle the pending litigation. Pursuant to the Settlement Agreement, in exchange for a release of claims, mutual covenant not to sue for five years, and license to the patent in suit from Roche, the Company made a one-time payment of $20.0 million to Roche. On July 12, 2022, following the filing by the parties of a Stipulation of Dismissal, the Court ordered the case dismissed with prejudice. The $20.0 million charge is included in selling, general and administrative expenses for the year ended December 31, 2022.
The Company is, from time to time, involved in the normal course of business in various legal proceedings, including intellectual property, contract, employment, and product liability suits. The Company does not expect the outcome of these proceedings, either individually or in the aggregate, to have a material adverse effect on its results of operations.
Contract Dispute
Throughout 2022, the Company was engaged in negotiations over a contractual dispute involving in-licensed intellectual property. In December 2022, the Company entered into an agreement with Automated Glucose Control LLC (the “Asset Purchase Agreement”). Pursuant to the Asset Purchase Agreement, the Company made a one-time payment of $25.0 million for the acquisition of developed technology and patents and the release of future obligations, including any future royalty obligations. This amount, together with transaction costs, was allocated between the assets acquired and the settlement of the contractual dispute. A value of $12.0 million was allocated to acquired developed technology and a value of $9.5 million was allocated to acquired patents. The acquired developed technology and patents are being amortized over their useful lives of 13 years. The remaining $3.6 million was allocated to the settlement and is included in selling, general and administrative expenses for the year ended December 31, 2022.
Letters of Credit
The Company had $0.8 million and $20.9 million of letters of credit outstanding as of December 31, 2024 and December 31, 2023, respectively. The letters of credit outstanding at December 31, 2023 primarily served as security for our manufacturing facility in Malaysia until we purchased the property in 2024.
Note 19. Stock-Based Compensation Expense
Equity Award Plan
In May 2017, the Company adopted the 2017 Stock Option and Incentive Plan (the “2017 Plan”), which replaced its previous stock option and incentive plan (the “2007 Plan”). The 2017 Plan provides for a maximum of 5.2 million shares to be issued, in addition to the number of shares related to awards outstanding under the 2007 Plan that are terminated by expiration, forfeiture, or cancellation. The shares can be issued as stock options, restricted stock units, stock appreciation rights, deferred stock awards, restricted stock, unrestricted stock, cash-based awards, performance share awards, or dividend equivalent rights. As of December 31, 2024, 1.6 million shares remain available for future issuance under the 2017 Plan.
Stock-Based Compensation Expense
Compensation expense related to stock-based awards was recorded as follows:
| | | | | | | | | | | | | | | | | |
| Years Ended December 31, |
| (in millions) | 2024 | | 2023 | | 2022 |
| Cost of revenue | $ | 0.7 | | | $ | 0.4 | | | $ | 0.4 | |
| Research and development | 9.0 | | | 11.5 | | | 8.9 | |
| Selling, general and administrative | 59.6 | | | 36.4 | | | 31.6 | |
| Total | $ | 69.3 | | | $ | 48.3 | | | $ | 40.9 | |
Stock Options
Options are granted to purchase common shares at prices that are equal to the fair market value of the shares on the date the options are granted. Options generally vest in equal annual installments over a period of four years and expire 10 years after the date of grant. The grant-date fair value of options, adjusted for estimated forfeitures, is recognized as expense on a straight-line basis over the requisite service period, which is generally the vesting period.
The following summarizes the activity under the Company’s stock option plans:
| | | | | | | | | | | | | | | | | | | | | | | |
| Number of
Options | | Weighted Average
Exercise Price | | Weighted Average Remaining Contractual Term
(in years) | | Aggregate
Intrinsic
Value
(in millions) |
| Outstanding at December 31, 2023 | 436,094 | | | $ | 135.37 | | | | | |
| Granted | 138,108 | | | $ | 166.62 | | | | | |
| Exercised | (127,125) | | | $ | 64.24 | | | | | $ | 16.5 | |
| Forfeited and canceled | (47,682) | | | $ | 246.17 | | | | | |
| Outstanding at December 31, 2024 | 399,395 | | | $ | 155.65 | | | 6 | | $ | 43.4 | |
| Vested, December 31, 2024 | 202,279 | | | $ | 113.10 | | | 3.3 | | $ | 30.5 | |
| Vested or expected to vest, December 31, 2024 | 370,691 | | | $ | 153.06 | | | 5.7 | | $ | 41.2 | |
The aggregate intrinsic value of options exercised for the years ended December 31, 2023 and 2022 was $52.7 million and $31.7 million, respectively.
The Company uses the Black-Scholes pricing model to determine the fair value of options granted. The assumptions used in the Black-Scholes pricing model are as follows:
•Risk-free Interest Rate—The risk-free interest rate is the implied yield available on U.S. treasury zero-coupon issues with a remaining term equal to the option’s expected term on the grant date.
•Expected Term—The expected term of options granted represents the period of time for which the options are expected to be outstanding. The Company estimates the expected term using both historical and hypothetical exercise data for outstanding options.
•Dividend Yield—The Company has never declared or paid any cash dividends on any of its capital stock and does not expect to do so in the foreseeable future. Accordingly, the Company uses an expected dividend yield of zero to calculate the grant-date fair value of a stock option.
•Expected Volatility—The expected volatility is a measure of the amount by which the Company’s stock price is expected to fluctuate during the expected term of options granted. The Company determines the expected volatility based primarily upon the historical volatility of the Company’s common stock over a period commensurate with the option’s expected term.
The assumptions used in the Black-Scholes pricing model for options granted during each year, along with the weighted-average grant-date fair values, were as follows:
| | | | | | | | | | | | | | | | | |
| | Years Ended December 31, |
| | 2024 | | 2023 | | 2022 |
| Risk-free interest rate | 4.4% | | 4.3% | | 1.8% |
| Expected life of options (in years) | 4.1 | | 4.2 | | 4.2 |
| Dividend yield | —% | | —% | | —% |
| Expected stock price volatility | 46.2% | | 45.7% | | 42.8% |
| Fair value per option | $69.48 | | $115.32 | | $93.26 |
As of December 31, 2024, there was $11.9 million of unrecognized compensation cost related to non-vested stock options. This cost is expected to be recognized over a weighted average period of 2.7 years.
Restricted Stock Units
Restricted Stock Units (“RSUs”) generally vest in equal annual installments over a three-year period. The grant-date fair value of RSUs, adjusted for estimated forfeitures, is recognized as expense on a straight-line basis over the requisite service period, which is generally the vesting period. The Company determines the fair value of RSUs based on the closing price of its common stock on the date of grant.
Activity for RSUs is as follows:
| | | | | | | | | | | |
| Number of
Shares | | Weighted
Average
Fair Value |
| Outstanding at December 31, 2023 | 249,194 | | | $ | 255.31 | |
| Granted | 279,528 | | | $ | 171.23 | |
| Vested | (108,839) | | | $ | 260.01 | |
| Forfeited | (27,137) | | | $ | 215.48 | |
| Outstanding at December 31, 2024 | 392,746 | | | $ | 196.74 | |
The weighted-average grant-date fair value per share of RSUs granted was $259.86 and $248.02 for the years ended December 31, 2023 and 2022, respectively. The total fair value of RSUs vested was $28.3 million, $24.1 million, and $20.3 million for the years ended December 31, 2024, 2023, and 2022, respectively.
As of December 31, 2024, there was $50.0 million of unrecognized compensation cost related to time-based RSUs, which is expected to be recognized over a weighted-average period of 1.8 years.
Performance Stock Units
Performance stock units (“PSUs”) generally vest over a three-year period from the grant date and include both a service and performance component. Stock-based payments that contain performance conditions are recognized when such conditions are probable of being achieved. Certain of these PSUs could ultimately vest at up to 200% of the target award depending on the achievement of the performance criteria. The Company determines the fair value of PSUs based on the closing price of its common stock on the date of grant.
Activity for PSUs is as follows:
| | | | | | | | | | | |
| Number of
Shares | | Weighted
Average
Fair Value |
| Outstanding at December 31, 2023 | 122,466 | | | $ | 261.65 | |
Granted(1) | 137,383 | | | $ | 166.86 | |
| Vested | (16,677) | | | $ | 278.97 | |
| Forfeited | (6,400) | | | $ | 261.63 | |
Outstanding at December 31, 2024(2) | 236,772 | | | $ | 205.74 | |
(1) Includes a 675 share adjustment to awards granted in 2021 for the three-year performance cycle award period ended 2023, based on the actual performance achievement of 111%.
(2) Based on 169% achievement of the performance metrics, approximately 83,000 shares of Insulet were earned for awards that were granted in 2022 for the performance period ended December 31, 2024. These shares vest in February 2025.
The weighted-average grant-date fair value per share of PSUs granted was $276.36 and $250.25 for the years ended December 31, 2023 and 2022, respectively. The total fair value of PSUs vested was $4.7 million, $8.7 million, and $7.8 million for the years ended December 31, 2024, 2023, and 2022, respectively.
As of December 31, 2024, there was $44.8 million of unrecognized compensation cost related to PSUs, which is expected to be recognized over a weighted-average period of 1.8 years.
Employee Stock Purchase Plan
The Employee Stock Purchase Plan (“ESPP”) authorizes the issuance of up to 880,000 shares of common stock to participating employees. Employees that participate in the Company’s ESPP may annually purchase up to a maximum of 800 shares per offering period or $25,000 worth of common stock by authorizing payroll deductions of up to 10% of their base salary. The purchase price for each share purchased is 85% of the lower of the fair market value of the common stock on the first or last day of the offering period. The Company issued 78,068, 55,439, and 52,724 shares of common stock for the years ended December 31, 2024, 2023, and 2022, respectively, to employees participating in the ESPP. As of December 31, 2024, 286,428 shares remain available for future issuance under the ESPP.
The Company uses the Black-Scholes pricing model to determine the fair value of shares purchased under the ESPP. The calculation of the fair value of shares purchased is affected by the stock price on the purchase date, the expected volatility of the Company’s stock over the expected term, the risk-free interest rate, and the dividend yield.
The estimated fair value of shares purchased under the ESPP were based on the following assumptions:
| | | | | | | | | | | | | | | | | |
| | Years Ended December 31, |
| | 2024 | | 2023 | | 2022 |
| Risk-free interest rate | 4.4% - 5.4% | | 5.3% - 5.4% | | 1.6% - 4.7% |
| Expected term (in years) | 0.5 | | 0.5 | | 0.5 |
| Dividend yield | —% | | —% | | —% |
| Expected stock price volatility | 34.2% - 40.9% | | 29.1% - 47.0% | | 44.3% - 50.1% |
The weighted average grant date fair value of the six-month option inherent in the ESPP was $58.54, $60.67, and $74.50, for the years ended December 31, 2024, 2023, and 2022, respectively.
As of December 31, 2024, there was $1.9 million of unrecognized compensation cost related to the ESPP. This cost is expected to be recognized over a weighted average period of 0.4 years.
Note 20. Accumulated Other Comprehensive (Loss) Income
Changes in the components of accumulated other comprehensive income (loss), net of tax, were as follows:
| | | | | | | | | | | | | | | | | | | | | | | |
| (in millions) | Foreign Currency Translation Adjustment | | Unrealized Losses on Securities | | Unrealized Gains on Cash Flow Hedges | | Accumulated Other Comprehensive (Loss) Income |
| Balance, December 31, 2021 | $ | (6.7) | | | $ | — | | | $ | 4.5 | | | $ | (2.2) | |
| Other comprehensive income (loss) before reclassifications | (10.3) | | | — | | | 36.5 | | | 26.2 | |
| Amounts reclassified to net income | — | | | — | | | (4.0) | | | (4.0) | |
| Balance, December 31, 2022 | (17.0) | | | — | | | 37.0 | | | 20.0 | |
| Other comprehensive income (loss) before reclassifications | 2.5 | | | (0.3) | | | 6.1 | | | 8.3 | |
| Amounts reclassified to net income | — | | | — | | | (20.3) | | | (20.3) | |
| Balance, December 31, 2023 | (14.5) | | | (0.3) | | | 22.8 | | | 8.0 | |
| Other comprehensive income (loss) before reclassifications | (7.8) | | | — | | | (39.4) | | | (47.2) | |
Amounts reclassified to net income(1) | — | | | — | | | 26.0 | | | 26.0 | |
| Balance, December 31, 2024 | $ | (22.3) | | | $ | (0.3) | | | $ | 9.4 | | | $ | (13.2) | |
(1) Income tax expense on cash flow hedges in other comprehensive income (loss) before reclassification for the year ended December 31, 2024 was $3.9 million. There was no tax impact for the years ended December 31, 2023 and 2022. Additionally, there is no income tax impact on currency translation adjustments.
Note 21. Defined Contribution Plan
The Company maintains a tax-qualified 401(k) retirement plan in the United States. The Company generally makes a matching contribution equal to 50% of each employee’s elective contribution to the plan up to 6% of the employee’s eligible pay. In addition, the Company offers defined contribution plans for eligible employees in its foreign subsidiaries. The total amount contributed by the Company to these defined contribution plans was $13.3 million, $12.1 million, and $9.8 million for the years ended December 31, 2024, 2023, and 2022, respectively.
Note 22. Income Taxes
The U.S. and foreign components of income before income taxes were as follows:
| | | | | | | | | | | | | | | | | |
| Years Ended December 31, |
| (in millions) | 2024 | | 2023 | | 2022 |
| U.S. | $ | 253.9 | | | $ | 199.5 | | | $ | 11.8 | |
| Foreign | 46.3 | | | 15.1 | | | (2.0) | |
| Income before income taxes | $ | 300.2 | | | $ | 214.6 | | | $ | 9.8 | |
The provision for income taxes consists of the following:
| | | | | | | | | | | | | | | | | |
| Years Ended December 31, |
| (in millions) | 2024 | | 2023 | | 2022 |
| Current: | | | | | |
| Federal | $ | 5.8 | | | $ | — | | | $ | — | |
| State | 6.4 | | | 3.7 | | | 1.3 | |
| Foreign | 6.6 | | | 4.1 | | | 4.8 | |
| Total current tax expense | 18.8 | | | 7.8 | | | 6.1 | |
| Deferred: | | | | | |
| Federal | (111.1) | | | 0.1 | | | — | |
| State | (18.6) | | | — | | | — | |
| Foreign | (7.2) | | | 0.4 | | | (0.9) | |
| Total deferred tax (benefit) expense | (136.9) | | | 0.5 | | | (0.9) | |
| Income tax (benefit) expense | $ | (118.1) | | | $ | 8.3 | | | $ | 5.2 | |
Reconciliations of the U.S. federal statutory rate to the Company’s effective tax rate are as follows:
| | | | | | | | | | | | | | | | | |
| | Years Ended December 31, |
| | 2024 | | 2023 | | 2022 |
| U.S. federal statutory rate | 21.0 | % | | 21.0 | % | | 21.0 | % |
| Foreign tax rate differential | 1.1 | | | 0.6 | | | 13.2 | |
| State taxes, net of federal benefit | 2.3 | | | 2.4 | | | (5.0) | |
| Federal and state R&D credits | (4.4) | | | (5.9) | | | (49.4) | |
| Stock-based compensation | 0.5 | | | (3.2) | | | (94.8) | |
| Non-deductible officers’ compensation | 0.6 | | | 1.3 | | | 52.4 | |
| Permanent items | 1.1 | | | 0.7 | | | 6.3 | |
| Foreign income taxed in the U.S. | 0.9 | | | 0.7 | | | 14.5 | |
| Change in valuation allowance | (59.8) | | | (10.8) | | | 124.4 | |
| Tax rate changes | — | | | 0.5 | | | (30.9) | |
| Change to prior year R&D credit | (2.8) | | | (2.8) | | | — | |
| Other | 0.2 | | | (0.6) | | | 1.7 | |
| Effective tax rate | (39.3) | % | | 3.9 | % | | 53.4 | % |
The income tax benefit in 2024 primarily resulted from the release of substantially all of the valuation allowance maintained against deferred tax assets discussed below and the completion of a research and development (“R&D”) credit study for the
periods 2017 through 2022, which resulted in a $8.3 million income tax benefit from the increase to U.S. federal and state R&D credit carryforwards.
For all periods presented, no provision for income taxes has been provided on undistributed earnings of the Company’s foreign subsidiaries, except for Canada, because such earnings are indefinitely reinvested in the foreign operations. The Company has recorded a deferred tax liability for the tax costs on these earnings to the extent they cannot be repatriated in a tax-free manner. A deferred tax liability related to the repatriation of approximately $57.3 million indefinitely reinvested earnings has not been recorded. Events that could trigger a tax liability include, but are not limited to, distributions, reorganizations or restructurings, and/or tax law changes. Determining the amount of unrecognized deferred tax liabilities on these indefinitely reinvested earnings is not practicable due to complexities associated with the hypothetical calculation.
The Company files federal, state, and foreign tax returns, which are subject to examination by the relevant tax authorities. The Company’s U.S. federal and state tax returns are currently open to examination for tax years 2021 through 2023. In addition, the Company’s U.S. net operating loss carryforwards from 2001 and forward may be subject to examination in the periods that they are utilized.
The following table summarizes the activity related to the Company’s unrecognized tax benefits:
| | | | | | | | | | | |
| Years Ended December 31, |
| (in millions) | 2024 | | 2023 |
| Unrecognized tax benefits at beginning of year | $ | 5.0 | | | $ | — | |
| Additions related to current period tax positions | 2.7 | | | 2.6 | |
| Additions related to prior period tax positions | 5.1 | | | 2.4 | |
| Unrecognized tax benefits at end of year | $ | 12.8 | | | $ | 5.0 | |
As of December 31, 2024 and 2023, the Company had unrecognized tax benefits that would impact the effective tax rate if recognized of $12.8 million and $5.0 million, respectively. As of December 31, 2022, the Company had no unrecognized tax benefits that would impact the effective tax rates. No interest and penalties were recognized related to uncertain tax positions for the years ended December 31, 2024, 2023, and 2022, respectively, and no interest or penalties were accrued as of December 31, 2024 and 2023, respectively. The Company does not anticipate that the amount of existing unrecognized tax benefits will materially increase or decrease within the next 12 months.
The components of the net deferred tax asset were as follows:
| | | | | | | | | | | |
| | As of December 31, |
| (in millions) | 2024 | | 2023 |
| Deferred tax assets: | | | |
| Net operating loss carryforwards | $ | 23.4 | | | $ | 91.4 | |
| Tax credits | 56.6 | | | 54.1 | |
| Capitalized research and development expenditures | 78.8 | | | 53.3 | |
| Accrued expenses | 34.4 | | | 25.1 | |
| Amortization of debt discount | 4.2 | | | 7.8 | |
| Inventory capitalization | 8.2 | | | 6.5 | |
| Intangible assets | 6.4 | | | 8.0 | |
| Incentive compensation | 14.7 | | | 13.5 | |
| Stock-based compensation | 10.2 | | | 8.0 | |
| Other | 7.1 | | | 5.4 | |
| Total deferred tax assets | 244.0 | | | 273.1 | |
| Deferred tax liabilities: | | | |
| Prepaid assets | (9.3) | | | (7.7) | |
| Property, plant and equipment | (47.4) | | | (38.1) | |
| Capitalized contract acquisition costs | (13.1) | | | (10.4) | |
| Unrealized gains on cash flow hedges | (1.2) | | | (5.1) | |
| Other | (7.4) | | | (7.7) | |
| Total deferred tax liabilities | (78.4) | | | (69.0) | |
| Net deferred tax asset before valuation allowance | 165.6 | | | 204.1 | |
| Valuation allowance | (23.9) | | | (202.9) | |
| Net deferred tax asset | $ | 141.7 | | | $ | 1.2 | |
The Company regularly assesses the need for a valuation allowance against its deferred tax assets. In making such assessment, the Company considers both positive and negative evidence related to the likelihood of realization of the deferred tax assets and, based on the weight of available evidence, whether it is more-likely-than-not that some or all of the deferred tax assets will not be realized. During the year ended December 31, 2024, the Company recorded a $182.5 million non-cash income tax benefit related to the release of a substantial portion of its valuation allowance against deferred tax assets. This was based on the Company’s evaluation of the positive and negative evidence including cumulative income (loss) position, revenue growth, current profitability and expectations regarding future forecasted income. The remaining change in the valuation allowance is comprised of a $4.8 million increase related to current year state R&D credits, partially offset by $1.3 million of federal R&D credits that will not be utilized prior to expiration. The valuation allowance at December 31, 2024 primarily relates to certain U.S. state tax credits and state net operating loss carryforwards.
As of December 31, 2024, the Company’s net operating loss carryforwards were as follows:
| | | | | | | | | | | |
| (in millions) | Expiration Period | | Net Operating Loss Carryforwards |
| U.S. federal | 2029 | | $ | 54.9 | |
| State | 2025 - 2042 | | $ | 203.1 | |
| Foreign | Indefinite | | $ | 1.7 | |
As of December 31, 2024, the Company’s tax credit carryforwards were as follows:
| | | | | | | | | | | |
| (in millions) | Expiration Period | | Tax Credit Carryforwards |
| U.S. federal | 2025 - 2044 | | $ | 44.3 | |
| State | 2025 - 2044 | | $ | 30.7 | |
The above loss and credit carryforwards, which may be utilized in a future period, may be subject to limitations based on changes in the ownership of the Company ordinary shares.
Note 23. Earnings Per Share
Basic earnings per share is computed by dividing net income by the weighted average number of common shares outstanding for the period. Diluted earnings per share is computed using the weighted average number of common shares outstanding and, when dilutive, common share equivalents. The computation of basic and diluted earnings per share was as follows:
| | | | | | | | | | | | | | | | | |
| Years Ended December 31, |
| (in millions, except share and per share data) | 2024 | | 2023 | | 2022 |
| Net income | $ | 418.3 | | | $ | 206.3 | | | $ | 4.6 | |
| Add back interest expense, net of tax attributable to assumed conversion of convertible senior notes | 9.1 | | | 10.4 | | | — | |
| Net income, diluted | $ | 427.4 | | | $ | 216.7 | | | $ | 4.6 | |
| | | | | |
Weighted average number of common shares outstanding, basic (in thousands) | 70,076 | | | 69,751 | | | 69,375 | |
| Convertible Senior Notes | 3,528 | | | 3,528 | | | — | |
| Stock options | 150 | | | 286 | | | 454 | |
| Restricted stock units | 136 | | | 68 | | | 81 | |
Weighted average number of common shares outstanding, diluted (in thousands) | 73,890 | | | 73,633 | | | 69,910 | |
| | | | | |
| Earnings per share | | | | | |
| Basic | $ | 5.97 | | | $ | 2.96 | | | $ | 0.07 | |
| Diluted | $ | 5.78 | | | $ | 2.94 | | | $ | 0.07 | |
The number of common share equivalents excluded from the computation of diluted earnings per share because either the effect would have been anti-dilutive, or the performance criteria related to the units had not yet been met, were as follows:
| | | | | | | | | | | | | | | | | |
| Years Ended December 31, |
| (in thousands) | 2024 | | 2023 | | 2022 |
| | | | | |
| Restricted stock units | 464 | | | 322 | | | 227 | |
| Stock options | 209 | | | 163 | | | 137 | |
| Convertible Senior Notes | — | | | — | | | 3,528 | |
| | | | | |
| Total | 673 | | | 485 | | | 3,892 | |
Note 24. Supplemental Cash Flow Information
| | | | | | | | | | | | | | | | | |
| Years Ended December 31, |
| (in millions) | 2024 | | 2023 | | 2022 |
| Cash paid for interest, net of amount capitalized | $ | 47.1 | | | $ | 49.9 | | | $ | 34.2 | |
| Cash paid for taxes | $ | 20.6 | | | $ | 8.1 | | | $ | 5.5 | |
| Purchases of property and equipment included in accounts payable and accrued expenses | $ | 3.2 | | | $ | 7.1 | | | $ | 3.9 | |
| Purchases of property, plant and equipment included in long-term debt | $ | 7.1 | | | $ | 12.9 | | | $ | — | |
| | | | | |
| | | | | |
| | | | | |
| | | | | |
| | | | | |
| | | | | |
SCHEDULE II — VALUATION AND QUALIFYING ACCOUNTS
The following table sets forth activities in the Company’s valuation allowance accounts:
| | | | | | | | | | | | | | | | | | | | | | | | | | | | | |
| Description | Balance at
Beginning of
Year | | Additions Charged
to Costs and
Expenses | | Other | | Deductions | | Balance at
End
of Year |
| (in millions) | | | | | | | | | |
| Year Ended December 31, 2024 | | | | | | | | | |
| Reserve for rebates, chargebacks and wholesaler fees | $ | 157.7 | | | $ | 587.8 | | | $ | — | | | $ | (573.8) | | | $ | 171.7 | |
| Deferred tax valuation allowance | $ | 202.9 | | | $ | 5.1 | | | $ | — | | | $ | (184.1) | | | $ | 23.9 | |
| Year Ended December 31, 2023 | | | | | | | | | |
| Reserve for rebates, chargebacks and wholesaler fees | $ | 77.3 | | | $ | 465.5 | | | $ | — | | | $ | (385.1) | | | $ | 157.7 | |
| Deferred tax valuation allowance | $ | 222.8 | | | $ | 73.5 | | | $ | 3.7 | | | $ | (97.1) | | | $ | 202.9 | |
| Year Ended December 31, 2022 | | | | | | | | | |
| Reserve for rebates, chargebacks and wholesaler fees | $ | 34.1 | | | $ | 247.1 | | | $ | — | | | $ | (203.9) | | | $ | 77.3 | |
Deferred tax valuation allowance(1) | $ | 182.4 | | | $ | 72.5 | | | $ | 37.8 | | | $ | (69.9) | | | $ | 222.8 | |
(1) Other represents the increase in deferred tax valuation allowance resulting from the adoption of ASU 2020-06, Debt — Debt with Conversations and Other Options (Subtopic 470-20) and Derivatives and Hedging — Contracts in Entity's Own Equity (Subtopic 815-40): Accounting for Convertible Instruments and Contracts in an Entity's Own Equity. Refer to Note 2 to the consolidated financial statements included in Item 8 for additional information.
Item 9. Changes in and Disagreements With Accountants On Accounting And Financial Disclosure
None.
Item 9A. Controls and Procedures
Disclosure Controls and Procedures
Our management, with the participation of our chief executive officer and chief financial officer, evaluated the effectiveness of our disclosure controls and procedures as of December 31, 2024. The term “disclosure controls and procedures,” as defined in Rules 13a-15(e) and 15d-15(e) under the Securities Exchange Act of 1934, as amended (the “Exchange Act”) means controls and other procedures of a company that are designed to ensure that information required to be disclosed by a company in the reports that it files or submits under the Exchange Act is recorded, processed, summarized and reported, within the time periods specified in the Securities and Exchange Commission’s rules and forms. Disclosure controls and procedures include, without limitation, controls and procedures designed to ensure that information required to be disclosed by a company in the reports that it files or submits under the Exchange Act is accumulated and communicated to the company’s management, including its principal executive and principal financial officers, as appropriate to allow timely decisions regarding required disclosure. Management recognizes that any controls and procedures, no matter how well designed and operated, can provide only reasonable assurance of achieving their objectives and management necessarily applies its judgment in evaluating the cost-benefit relationship of possible controls and procedures. Based on the evaluation of our disclosure controls and procedures as of December 31, 2024, our chief executive officer and chief financial officer concluded that, as of such date, our disclosure controls and procedures were effective at a reasonable assurance level.
Management’s Annual Report on Internal Control Over Financial Reporting
Our management is responsible for establishing and maintaining adequate internal control over financial reporting. Management’s assessment included an evaluation of the design of the Company’s internal control over financial reporting and testing of the operational effectiveness of our internal control over financial reporting. Our management assessed the effectiveness of our internal control over financial reporting as of December 31, 2024. In making this assessment, our management used the criteria set forth by the Committee of Sponsoring Organizations of the Treadway Commission 2013 (“COSO”) in Internal Control — Integrated Framework (the COSO criteria). Based on our assessment, we believe that our internal controls over financial reporting were effective as of December 31, 2024.
The effectiveness of our internal control over financial reporting as of December 31, 2024 has been audited by Grant Thornton LLP, an independent registered public accounting firm. Their report is included in Item 8 of this Form 10-K.
Remediation of Previously Reported Material Weakness
As previously reported in Part II, Item 9A, Controls and Procedures of our Annual Report on Form 10-K for the fiscal year ended December 31, 2023, filed with the Securities and Exchange Commission on February 22, 2024, in connection with our assessment of the effectiveness of internal control over financial reporting as of December 31, 2023, we identified a material weakness related to ineffective information technology general controls (“ITGCs”) around systems that support the Company’s financial reporting outside of North America. Automated and manual business process controls that are dependent on the affected ITGCs were also deemed ineffective because they could have been adversely affected to the extent that they rely upon information and configurations from the affected systems.
In response to the material weakness, the Company developed and implemented a remediation plan. We obtained and evaluated a service auditor’s report on the ITGCs over a system used by an outsourced service provider outside of North America. Based on those remediation actions, management has concluded that the material weakness previously reported has been remediated as of December 31, 2024. We also enhanced our security access controls over our newly implemented enterprise resource planning system.
Changes in Internal Control Over Financial Reporting
Other than the actions taken to remediate the material weakness described above, there were no changes in our internal control over financial reporting during the three months ended December 31, 2024 that have materially affected, or are reasonably likely to materially affect, our internal control over financial reporting.
Item 9B. Other Information
Rule 10b5-1 Plans
On December 3, 2024, Wayne A. I. Frederick, a member of our Board of Directors, adopted a written trading plan intended to satisfy Rule 10b5-1(c) under the Exchange Act to sell up to 1,825 shares of our common stock between March 5, 2025 and December 31, 2025. The trading plan will terminate upon the earlier of December 31, 2025, or the sale of all shares subject to the trading plan.
During the fourth quarter of 2024, no other director and none of our executive officers adopted, modified or terminated a “Rule 10b5-1 trading arrangement” or “non-Rule 10b5-1 trading arrangement” as defined in Item 408(c) of Regulation S-K.
PART III
Item 10. Directors, Executive Officers and Corporate Governance
The information required by this Item will be set forth in our definitive proxy statement for our 2025 Annual Meeting of Stockholders (the “Proxy Statement”) and is incorporated herein by reference.
Item 11. Executive Compensation
The information required by this Item will be set forth in the Proxy Statement and is incorporated herein by reference.
Item 12. Security Ownership of Certain Beneficial Owners and Management and Related Stockholder Matters
Other than as set forth below, the information required by this Item will be set forth in the Proxy Statement and is incorporated herein by reference.
Securities Authorized for Issuance Under Equity Compensation Plans
The following table sets forth information regarding securities authorized for issuance under our equity compensation plans as of December 31, 2024.
| | | | | | | | | | | | | | | | | | | | |
| Plan Category | Number of securities to be
issued upon exercise of
outstanding options,
warrants and rights
(a) | | Weighted average
exercise price of
outstanding options,
warrants and rights
(b) | | Number of securities
remaining available for
future issuance
(excluding securities
reflected in column (a))
(c) | |
Equity compensation plans approved by security holders(1) | 399,396 | | | $ | 155.65 | | | 1,646,720 | | (2) |
| Equity compensation plans not approved by security holders | — | | | — | | | — | | |
| Total | 399,396 | | | $ | 155.65 | | | 1,646,720 | | |
(1) Includes our 2017 Plan and our 2007 Plan. Outstanding restricted stock units convert to common stock without the payment of consideration. As of December 31, 2024, 629,518 restricted stock units were outstanding. The weighted-average exercise price of outstanding options as of such date issued under these Plans (excluding restricted stock units) was $155.65. For more information relating to our equity compensation plans, see Note 19 to our consolidated financial statements.
(2) The shares available for future issuance are under our 2017 Plan, which includes shares related to awards outstanding under the 2007 Plan that are terminated by expiration, forfeiture or cancellation.
Item 13. Certain Relationships and Related Transactions, and Director Independence
The information required by this Item will be set forth in the Proxy Statement and is incorporated herein by reference.
Item 14. Principal Accounting Fees and Services
The information required by this Item will be set forth in the Proxy Statement and is incorporated herein by reference.
PART IV
Item 15. Exhibits, Financial Statement Schedules
(a) Financial Statements and Schedules
(1) and (2) The required information is set forth in Item 8—“Financial Statements and Supplementary Data.”
(3) Exhibit Index:
| | | | | |
| Number | Description |
| 3.1 | |
| |
| 3.2 | |
| |
| 4.1 | |
| |
| 4.2 | |
| |
| 4.3 | |
| |
| 10.1* | |
| |
| 10.2* | |
| |
| 10.3* | |
| |
| 10.4* | |
| |
| 10.5* | |
| |
| 10.6* | |
| |
| 10.7* | |
| |
| 10.8* | |
| |
| 10.9* | |
| |
| 10.10* | |
| |
| 10.11* | |
| |
| 10.12* | |
| |
| 10.13* | |
| |
| | | | | |
| 10.14* | |
| |
| 10.15* | |
| |
| 10.16* | |
| |
| 10.17* | |
| |
| 10.18* | |
| |
| 10.19* | |
| |
| 10.20* | |
| |
| 10.21* | |
| |
| 10.22* | |
| |
| 10.23* | |
| |
| 10.24* | |
| |
| 10.25* | |
| |
| 10.26* | |
| |
| 10.27* | |
| |
| 10.28* | |
| |
| 10.29* | |
| |
| 10.30* | |
| |
| 10.31* | |
| |
| 10.32* | |
| |
| 10.33* | |
| |
| 10.34* | |
| |
| 10.35* | |
| |
| | | | | |
| 10.36 | |
| |
| 10.37 | |
| 10.38 | Incremental Amendment to Credit Agreement, dated June 15, 2022, among Insulet Corporation, Insulet MA Securities Corporation, Morgan Stanley Senior Funding, Inc., as administrative agent, swingline lender, and letter of credit issuer, and the other lenders party thereto (Incorporated by reference to Exhibit 10.1 to our Current Report on Form 8-K, filed June 16, 2022) |
| |
| 10.39 | |
| |
| 10.40 | |
| |
| 10.41 | Fourth Amendment to Credit Agreement, dated June 9, 2023, among Insulet Corporation, Insulet MA Securities Corporation, Morgan Stanley Senior Funding, Inc., as administrative agent, swingline lender, and letter of credit issuer, and the other lenders party thereto (Incorporated by reference to Exhibit 10.1 to the Company's Current Report on Form 8-K filed June 9, 2023) |
| |
| 10.42 | |
| |
| 10.43 | |
| |
| 10.44 | |
| |
| 10.45+ | |
| |
| 10.46++ | |
| |
| 10.47+ | |
| |
| 10.48++ | |
| |
| 10.49++ | |
| |
| 10.50++ | |
| |
| 10.51++ | |
| |
| 10.52+ | |
| |
| | | | | |
| 10.53++ | |
| |
| 10.54++ | |
| |
| 10.55++ | |
| |
| 10.56++ | |
| |
| 10.57++ | |
| |
| 10.58++ | |
| |
| 10.59++ | |
| |
| 10.60++ | |
| |
| 10.61++ | |
| |
| 10.62++ | |
| |
| 10.63++ | |
| |
| 10.64++ | |
| |
| 10.65++ | |
| |
| 10.66++ | |
| |
| 10.67+ | |
| |
| 10.68++ | |
| |
| 10.69++ | |
| |
| | | | | |
| 10.70++ | |
| |
| 10.71 | |
| |
| 19.1# | |
| |
| 21.1# | |
| |
| 23.1# | |
| |
| 24.1# | |
| |
| 31.1# | |
| |
| 31.2# | |
| |
| 32.1** | |
| |
| 97.1 | |
| |
| 101 | The following materials from Insulet Corporation’s Annual Report on Form 10-K for the year ended December 31, 2024 formatted in XBRL (eXtensible Business Reporting Language): (i) the Consolidated Balance Sheets; (ii) the Consolidated Statements of Income; (iii) the Consolidated Statements of Comprehensive Income; (iv) the Consolidated Statements of Stockholders’ Equity; (v) the Consolidated Statements of Cash Flows |
| | | | | |
| + | Confidential treatment granted as to certain portions of this exhibit. |
| |
| ++ | Certain portions of this exhibit are considered confidential and have been omitted as permitted under SEC rules and regulations. |
| |
| * | Management contract or compensation plan. |
| |
| # | Filed herewith. |
| |
| ** | Furnished herewith. |
Item 16. Form 10-K Summary
None.
SIGNATURES
Pursuant to the requirements of Section 13 or 15(d) of the Securities Exchange Act of 1934, the Registrant has caused this report to be signed on its behalf by the undersigned thereunto duly authorized.
| | | | | |
| INSULET CORPORATION (Registrant) |
| |
| February 20, 2025 | /s/ James R. Hollingshead |
| James R. Hollingshead |
| Chief Executive Officer
(Principal Executive Officer) |
| | | | | |
| |
| February 20, 2025 | /s/ Ana M. Chadwick |
| Ana M. Chadwick |
| Chief Financial Officer, Executive Vice President (Principal Financial Officer) |
POWER OF ATTORNEY AND SIGNATURES
We, the undersigned officers and directors of Insulet Corporation, hereby severally constitute and appoint James R. Hollingshead and Ana M. Chadwick, and each of them singly, our true and lawful attorneys, with full power to them and each of them singly, to sign for us in our names in the capacities indicated below, on all amendments to this Report, and generally to do all things in our names and on our behalf in such capacities to enable Insulet Corporation to comply with the provisions of the Securities Exchange Act of 1934, as amended, and all requirements of the Securities and Exchange Commission.
Pursuant to the requirements of the Securities Exchange Act of 1934, this Report has been signed below by the following persons on behalf of the Registrant and in the capacities on February 20, 2025.
| | | | | | | | |
| Signature | | Title |
| /s/ James R. Hollingshead | | Chief Executive Officer |
| James R. Hollingshead | | (Principal Executive Officer) |
| |
| /s/ Ana M. Chadwick | | Chief Financial Officer, Executive Vice President |
| Ana M. Chadwick | | (Principal Financial Officer) |
| |
| /s/ Luciana Borio, M.D. | | |
| Luciana Borio, M.D. | | Director |
| |
| /s/ Wayne A.I. Frederick, M.D. | | |
| Wayne A.I. Frederick, M.D. | | Director |
| | |
| /s/ Jessica Hopfield | | |
| Jessica Hopfield | | Director |
| | |
| /s/ Michael R. Minogue | | |
| Michael R. Minogue | | Director |
| | |
| /s/ Flavia H. Pease | | |
| Flavia H. Pease | | Director |
| | |
| /s/ Timothy J. Scannell | | |
| Timothy J. Scannell | | Director |
| | |
| /s/ Timothy C. Stonesifer | | |
| Timothy C. Stonesifer | | Director |
| | |
| /s/ Elizabeth H. Weatherman | | |
| Elizabeth H. Weatherman | | Director |