UNITED STATES
SECURITIES AND EXCHANGE COMMISSION
Washington, D.C. 20549
FORM 10-K
(Mark One)
| | | | | |
| ☒ | ANNUAL REPORT PURSUANT TO SECTION 13 OR 15(d) OF THE
SECURITIES EXCHANGE ACT OF 1934 |
For the fiscal year ended December 31, 2024
OR
| | | | | |
| ☐ | TRANSITION REPORT PURSUANT TO SECTION 13 OR 15(d) OF THE
SECURITIES EXCHANGE ACT OF 1934 |
For the transition period from to
Commission file number: 001-16751
ELEVANCE HEALTH, INC.
(Exact name of registrant as specified in its charter)
| | | | | | | | |
| Indiana | | 35-2145715 |
(State or other jurisdiction of
incorporation or organization) | | (I.R.S. Employer Identification Number) |
| |
220 Virginia Avenue
Indianapolis, Indiana 46204
(Address of principal executive offices) (Zip Code)
Registrant’s telephone number, including area code: (833) 401-1577
Securities registered pursuant to Section 12(b) of the Act:
| | | | | | | | | | | | | | |
| Title of each class | | Trading symbol(s) | | Name of each exchange on which registered |
| Common Stock, Par Value $0.01 | | ELV | | New York Stock Exchange |
Securities registered pursuant to Section 12(g) of the Act: NONE
Indicate by check mark if the registrant is a well-known seasoned issuer, as defined in Rule 405 of the Securities Act. Yes x No ¨
Indicate by check mark if the registrant is not required to file reports pursuant to Section 13 or Section 15(d) of the Act. Yes ¨ No x
Indicate by check mark whether the registrant (1) has filed all reports required to be filed by Section 13 or 15(d) of the Securities Exchange Act of 1934 during the preceding 12 months (or for such shorter period that the registrant was required to file such reports), and (2) has been subject to such filing requirements for the past 90 days. Yes x No ¨
Indicate by check mark whether the registrant has submitted electronically every Interactive Data File required to be submitted pursuant to Rule 405 of Regulation S-T (§232.405 of this chapter) during the preceding 12 months (or for such shorter period that the registrant was required to submit such files). Yes x No ¨
Indicate by check mark whether the registrant is a large accelerated filer, an accelerated filer, a non-accelerated filer, a smaller reporting company, or an emerging growth company. See the definitions of “large accelerated filer,” “accelerated filer,” “smaller reporting company,” and “emerging growth company” in Rule 12b-2 of the Exchange Act.
| | | | | | | | | | | | | | | | | |
| Large accelerated filer | ☒ | | | Accelerated filer | ☐ |
| Non-accelerated filer | ☐ | | | Smaller reporting company | ☐ |
| Emerging growth company | ☐ | | | | |
If an emerging growth company, indicate by check mark if the registrant has elected not to use the extended transition period for complying with any new or revised financial accounting standards provided pursuant to Section 13(a) of the Exchange Act. ¨
Indicate by check mark whether the registrant has filed a report on and attestation to its management’s assessment of the effectiveness of its internal control over financial reporting under Section 404(b) of the Sarbanes-Oxley Act (15 U.S.C. 7262(b)) by the registered public accounting firm that prepared or issued its audit report. x
If securities are registered pursuant to Section 12(b) of the Act, indicate by check mark whether the financial statements of the registrant included in the filing reflect the correction of an error to previously issued financial statements. ¨
Indicate by check mark whether any of those error corrections are restatements that required a recovery analysis of incentive-based compensation received by any of the registrant’s executive officers during the relevant recovery period pursuant to §240.10D-1(b) ¨
Indicate by check mark whether the registrant is a shell company (as defined in Rule 12b-2 of the Exchange Act). Yes ☐ No x
The aggregate market value of the voting and non-voting common equity held by non-affiliates of the registrant (assuming solely for the purposes of this calculation that all directors and executive officers of the registrant are “affiliates”) as of June 30, 2024, was approximately $116,687,067,115.
As of February 1, 2025, 227,351,871 shares of the registrant’s common stock were outstanding.
DOCUMENTS INCORPORATED BY REFERENCE
Part III of this Annual Report on Form 10-K incorporates by reference information from the registrant’s Definitive Proxy Statement for the Annual Meeting of Shareholders to be held May 14, 2025.
Elevance Health, Inc.
Annual Report on Form 10-K
For the Year Ended December 31, 2024
Table of Contents
| | | | | | | | | | |
| | | |
| ITEM 1. | | | | |
| ITEM 1A. | | | | |
| ITEM 1B. | | | | |
| ITEM 1C. | | | | |
| ITEM 2. | | | | |
| ITEM 3. | | | | |
| ITEM 4. | | | | |
| | | |
| | | |
| ITEM 5. | | | | |
| ITEM 6. | | | | |
| ITEM 7. | | | | |
| ITEM 7A. | | | | |
| ITEM 8. | | | | |
| ITEM 9. | | | | |
| ITEM 9A. | | | | |
| ITEM 9B. | | | | |
| ITEM 9C. | | | | |
| | | |
| | | |
| ITEM 10. | | | | |
| ITEM 11. | | | | |
| ITEM 12. | | | | |
| ITEM 13. | | | | |
| ITEM 14. | | | | |
| | | |
| | | |
| ITEM 15. | | | | |
| ITEM 16. | FORM 10-K SUMMARY | | | |
| | | |
| | | |
| | | | |
| | | | |
| | | | |
| | | | |
| | | | |
| | | | |
| | | | |
| | | | |
References in this Annual Report on Form 10-K to the terms “we,” “our,” “us,” “Elevance Health” or the “Company” refer to Elevance Health, Inc., an Indiana corporation, and, unless the context otherwise requires, its direct and indirect subsidiaries. References to the term “states” include the District of Columbia and Puerto Rico, unless the context otherwise requires.
FORWARD-LOOKING STATEMENTS
This document contains certain forward-looking statements within the meaning of the Private Securities Litigation Reform Act of 1995. Forward-looking statements reflect our views about future events and financial performance and are generally not historical facts. Words such as “expect,” “feel,” “believe,” “will,” “may,” “should,” “anticipate,” “intend,” “estimate,” “project,” “forecast,” “plan” and similar expressions are intended to identify forward-looking statements. These statements include, but are not limited to: financial projections and estimates and their underlying assumptions; statements regarding plans, objectives and expectations with respect to future operations, products and services; and statements regarding future performance. Such statements are subject to certain risks and uncertainties, many of which are difficult to predict and generally beyond our control, that could cause actual results to differ materially from those expressed in, or implied or projected by, the forward-looking statements. You are cautioned not to place undue reliance on these forward-looking statements that speak only as of the date hereof. You are also urged to carefully review and consider the various risks and other disclosures discussed in our reports filed with the U.S. Securities and Exchange Commission from time to time, which attempt to advise interested parties of the factors that affect our business. Except to the extent required by law, we do not update or revise any forward-looking statements to reflect events or circumstances occurring after the date hereof. These risks and uncertainties include, but are not limited to: trends in healthcare costs and utilization rates; reduced enrollment; our ability to secure and implement sufficient premium rates; the impact of large scale medical emergencies, such as public health epidemics and pandemics, and other catastrophes; the impact of new or changes in existing federal, state and international laws or regulations, including laws and regulations impacting healthcare, insurance, pharmacy services and other diversified products and services, or their enforcement or application; the impact of cyber-attacks or other privacy or data security incidents or our failure to comply with any privacy, data or security laws or regulations, including any investigations, claims or litigation related thereto; failure to effectively maintain and modernize our information systems; failure of our information systems or technology, including artificial intelligence, to operate as intended; failure to effectively maintain the availability and integrity of our data; changes in economic and market conditions, as well as regulations that may negatively affect our liquidity and investment portfolios; competitive pressures and our ability to adapt to changes in the industry and develop and implement strategic growth opportunities; risks and uncertainties regarding Medicare and Medicaid programs, including those related to non-compliance with the complex regulations imposed thereon; our ability to maintain and achieve improvement in Centers for Medicare and Medicaid Services Star Ratings and other quality scores and funding risks with respect to revenue received from participation therein; a negative change in our healthcare product mix; costs and other liabilities associated with litigation, government investigations, audits or reviews; our ability to contract with providers on cost-effective and competitive terms; risks associated with providing healthcare, pharmacy and other diversified products and services, including medical malpractice or professional liability claims and non-compliance by any party with the pharmacy services agreement between us and CaremarkPCS Health, L.L.C.; the effects of any negative publicity related to the health benefits industry in general or us in particular; risks associated with mergers, acquisitions, joint ventures and strategic alliances; possible impairment of the value of our intangible assets if future results do not adequately support goodwill and other intangible assets; possible restrictions in the payment of dividends from our subsidiaries and increases in required minimum levels of capital; our ability to repurchase shares of our common stock and pay dividends on our common stock due to the adequacy of our cash flow and earnings and other considerations; the potential negative effect from our substantial amount of outstanding indebtedness and the risk that increased interest rates or market volatility could impact our access to or further increase the cost of financing; a downgrade in our financial strength ratings; events that may negatively affect our licenses with the Blue Cross and Blue Shield Association; intense competition to attract and retain employees; risks associated with our international operations; and various laws and provisions in our governing documents that may prevent or discourage takeovers and business combinations.
PART I
ITEM 1. BUSINESS.
General
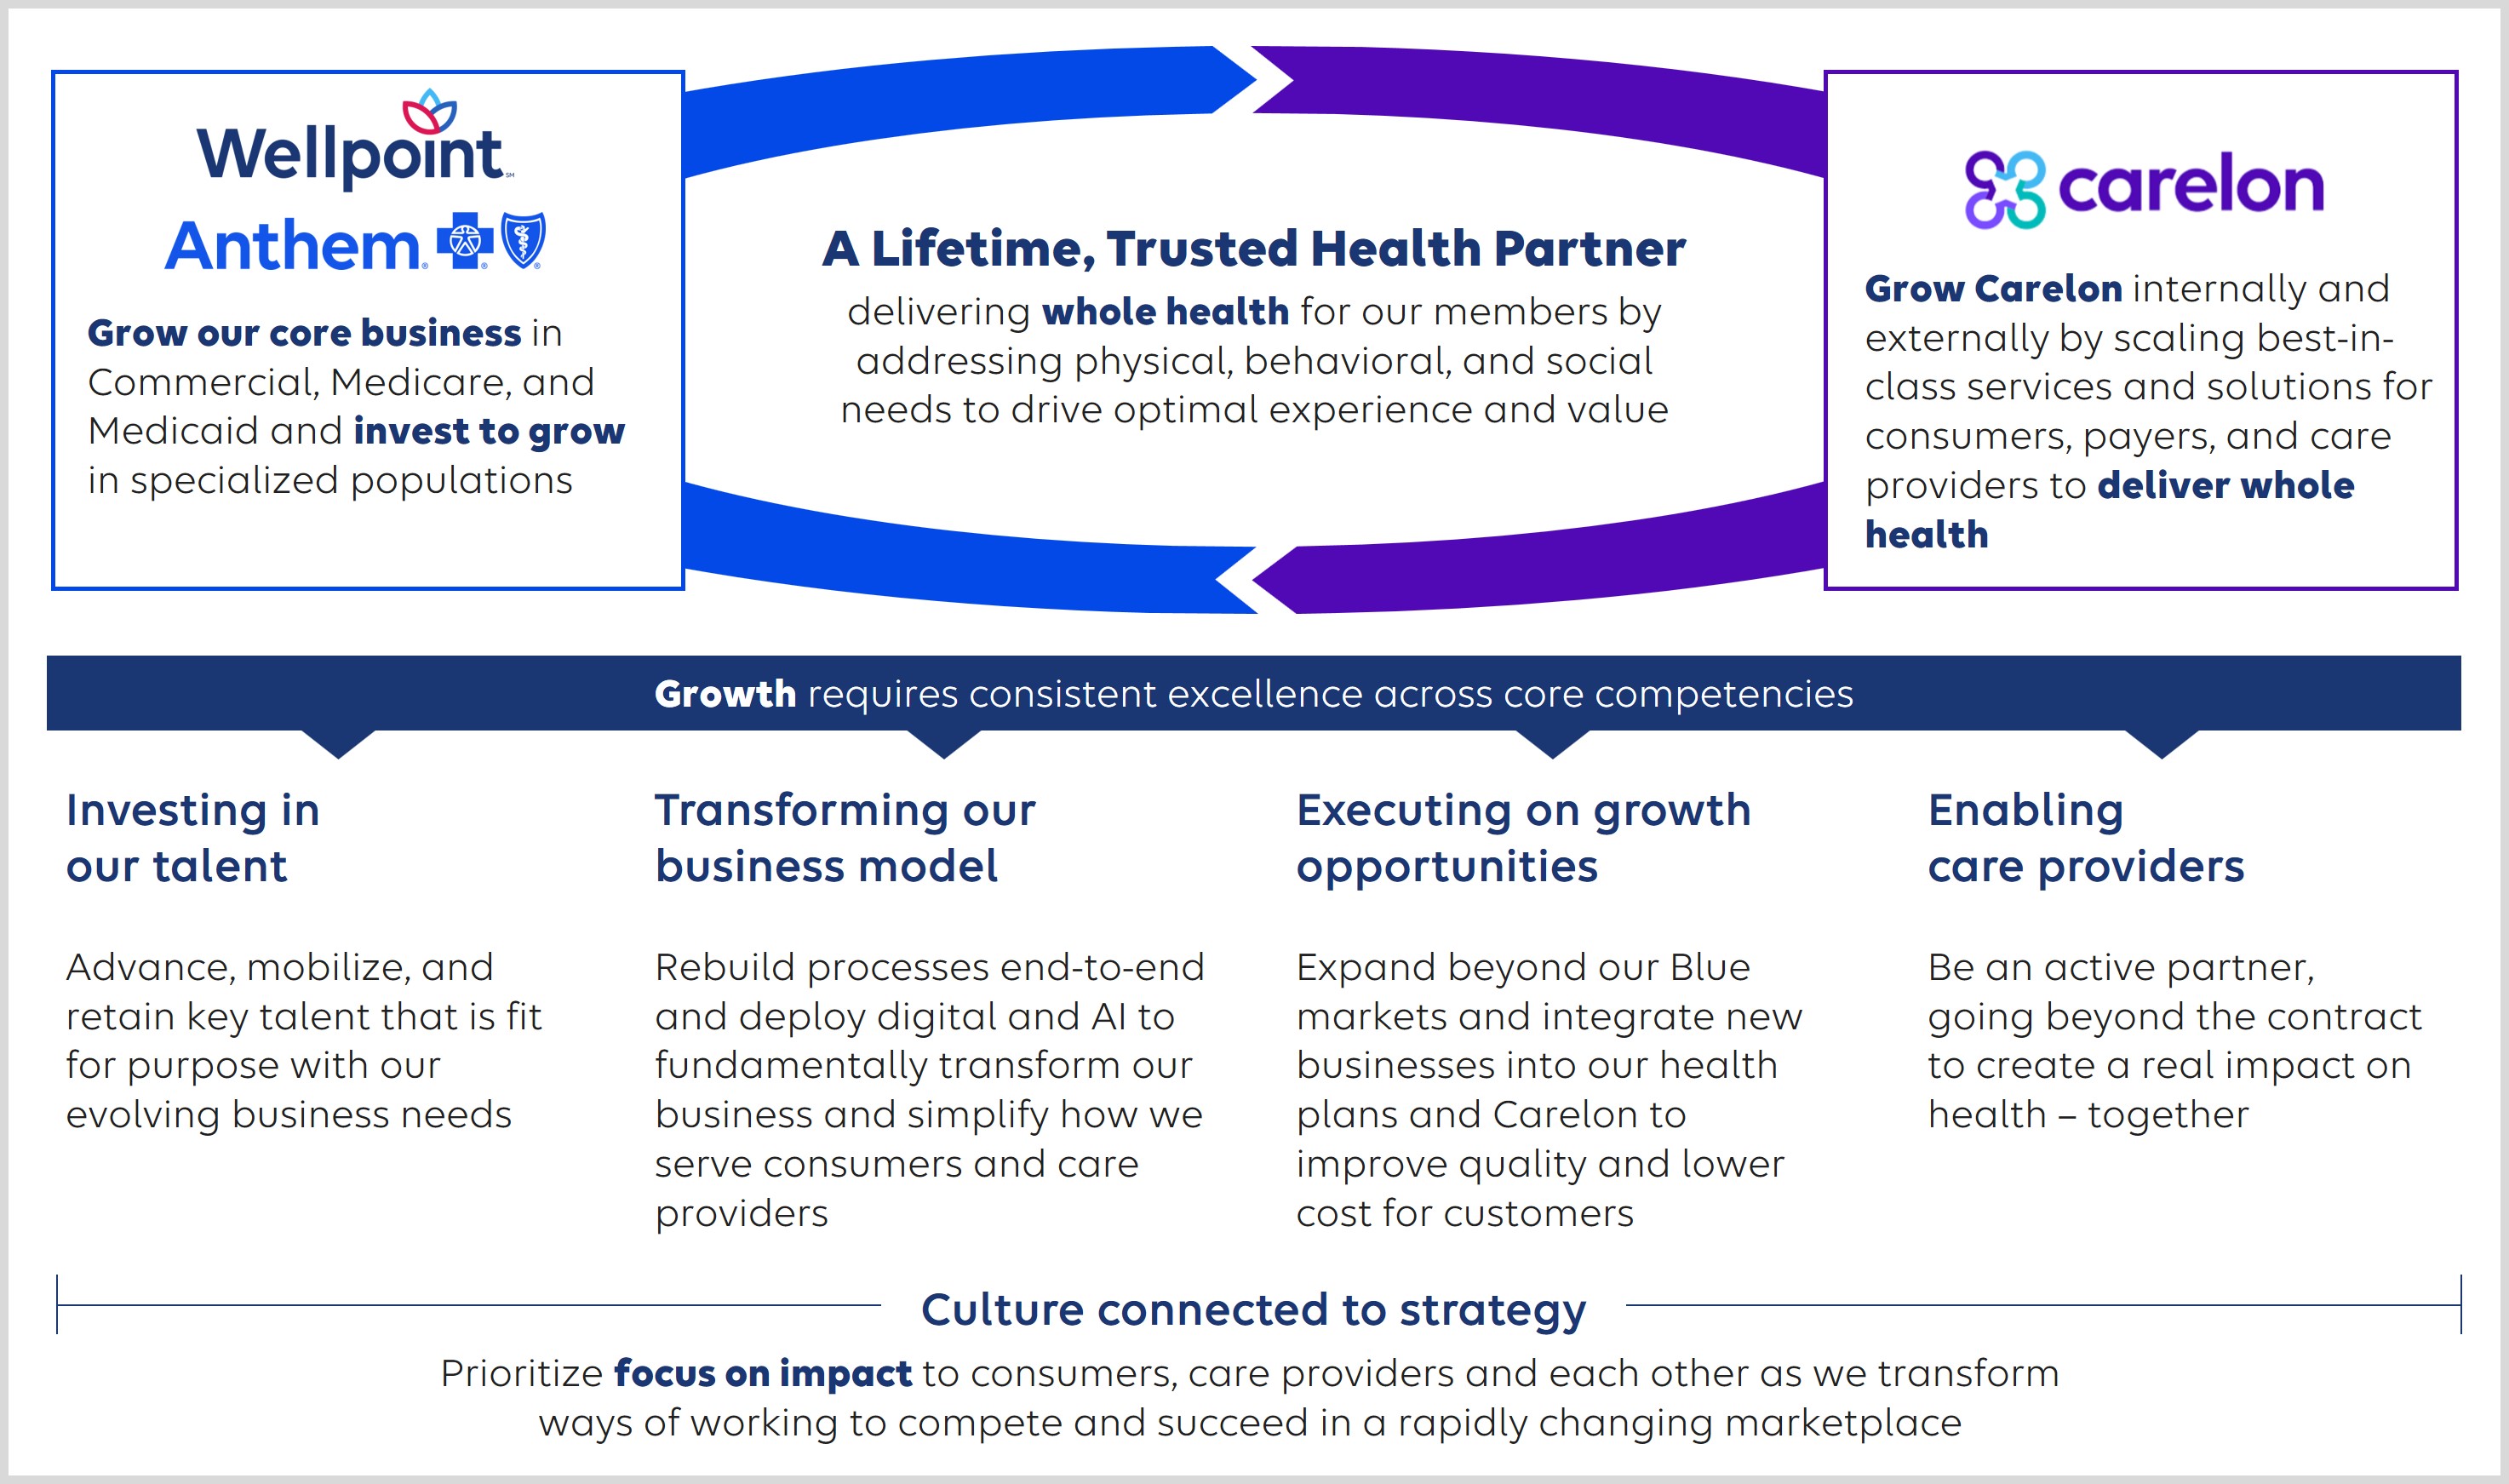
Elevance Health and its direct and indirect subsidiaries, referred to throughout this document as “we,” “us,” “our,” the “Company” or “Elevance Health,” is a leading health company bringing together the concepts of elevate and advance, in order to exemplify and follow our purpose of improving the health of humanity. We serve people across their entire health journey to better address their full range of needs with an integrated whole-health approach. Through our broad view, we aim to meaningfully improve the health of the people and communities we serve. We strive to deliver on our mission by maximizing the power of partnerships, innovating to fuel growth and health equity, and maintaining a high-performance culture. Our strategy is to be a lifetime trusted health partner through the following four core competencies:
With an unyielding commitment to meeting the needs of our diverse customers, we are guided by the following values:
We are one of the largest health insurers in the United States in terms of medical membership, serving approximately 45.7 million medical members through our affiliated health plans as of December 31, 2024. We offer a broad spectrum of
network-based managed care risk-based plans to Individual, Employer Group, Medicaid and Medicare markets. In addition, we provide a broad array of managed care services to fee-based customers, including claims processing, stop loss insurance, provider network access, medical management, care management, wellness programs, actuarial services and other administrative services. We provide services to the federal government in connection with our Federal Health Products & Services business, which administers the Federal Employee Program® (“FEP®”). We provide an array of specialty services both to customers of our subsidiary health plans and to unaffiliated health plans, including pharmacy services, stop loss insurance, dental, vision and supplemental health insurance benefits, as well as integrated health services.
We are an independent licensee of the Blue Cross and Blue Shield Association (“BCBSA”), an association of independent health benefit plans. We serve our members as the Blue Cross licensee for California and as the Blue Cross and Blue Shield (“BCBS”) licensee for Colorado, Connecticut, Georgia, Indiana, Kentucky, Maine, Missouri (excluding 30 counties in the Kansas City area), Nevada, New Hampshire, New York (in the New York City metropolitan area and upstate New York), Ohio, Virginia (excluding the Northern Virginia suburbs of Washington, D.C.) and Wisconsin. In a majority of these service areas, we do business as Anthem Blue Cross and Anthem Blue Cross and Blue Shield. We also conduct business through arrangements with other BCBS licensees, as well as other strategic partners. In addition, we serve members in numerous states as Wellpoint, Carelon, MMM and/or Simply Healthcare. We are licensed to conduct insurance operations in all 50 states, the District of Columbia and Puerto Rico through our subsidiaries. Through various subsidiaries, we also offer pharmacy services through our CarelonRx business, and other healthcare related services as Carelon Insights and Carelon Health.
We have organized our brand portfolio into the following core go-to-market brands:
•Anthem Blue Cross/Anthem Blue Cross and Blue Shield — represents our Anthem-branded and affiliated Blue Cross and/or Blue Shield licensed plans;
•Wellpoint — unites select non-BCBSA licensed Medicare, Medicaid and commercial plans under the Wellpoint name; and
•Carelon — this brand brings together our healthcare related services and capabilities, including our CarelonRx and Carelon Services businesses, under a single brand name.
We report our results of operations in the following four reportable segments: Health Benefits, CarelonRx, Carelon Services and Corporate & Other (our businesses that do not individually meet the quantitative thresholds for an operating segment, as well as corporate expenses not allocated to our other reportable segments).
For additional discussion, see “Reportable Segments” below in this “Business” section and Note 1, “Organization,” and Note 20, “Segment Information,” of the Notes to Consolidated Financial Statements included in Part II, Item 8 of this Annual Report on Form 10-K.
We believe healthcare is local and that we have the strong local presence required to understand and meet local customer needs with regard to any product customers are enrolled in with us. Further, we believe we are well-positioned to deliver what customers want: innovative, choice-based and affordable products; distinctive service; simplified transactions; and better access to information for quality care. Our local presence, combined with our national expertise, has created opportunities for collaborative programs that reward physicians and hospitals for clinical quality and excellence. We feel that our commitment to health improvement and care management provides added value to customers and healthcare professionals. Ultimately, we believe that practical and sustainable improvements in healthcare must focus on improving healthcare quality while managing costs for total affordability. We have implemented initiatives driving payment innovation and partnered with providers to lower cost and improve the quality of healthcare for our members, and we continue to develop new and innovative ways to effectively manage risk and engage our members. Further, we continue to expand our financial arrangements with providers to implement payment models that advance value-based care. We believe focusing on quality of care rather than volume of care is the foundation for improving patient outcomes. Our value-based payment models support patient-centered care by improving collaboration between providers and health partners and delivering to our members the right care, at the right time, in the right place. In addition, we are focused on achieving efficiencies from our national scale while optimizing service performance for our customers. Finally, we expect to continue to rationalize our portfolio of businesses and products and align our investments to optimize our core businesses, invest in high-growth opportunities, and accelerate value creation through expanded capabilities and services.
Impact on Our Results of Operations
Our results of operations depend in large part on our ability to accurately predict and effectively manage healthcare costs through effective contracting with providers of care to our members, product pricing, medical management and health and wellness programs, including service coordination and case management for addressing complex and specialized healthcare needs, innovative product design and our ability to maintain or achieve improvement in our Centers for Medicare and Medicaid Services (“CMS”) Star Ratings. CMS Star Ratings affect Medicare Advantage plan reimbursements as well as our eligibility to earn quality-based bonus payments for those plans. See “Regulation” below in this “Business” section for additional information on our CMS Star Ratings. For additional information on our networks and provider relations, product pricing and healthcare cost management programs, see “Pricing and Underwriting of Our Products,” “Networks and Provider Relations,” “Medical Management Programs,” “Care Management and Wellness Products and Programs” and “Healthcare Quality Initiatives” below in this “Business” section.
Advances in medical technology, including new specialty drugs, and new indications for existing prescription drugs, changes in regulations, the aging population and other demographic characteristics continue to contribute to rising healthcare costs. Our managed care plans and products are designed to encourage providers and members to participate in quality, cost-effective health benefit programs by using the full range of our innovative medical management services, health outcomes-based initiatives and health quality-based financial incentives. We believe our market position and high business retention rates will enable us to realize the long-term benefits of investing in preventive and early detection programs. Our ability to provide cost-effective health benefits products and services is enhanced through a disciplined approach to internal cost containment, prudent management of our risk exposure and successful integration of acquired businesses. In addition, our ability to manage operating expenses continues to be a driver of our overall profitability.
Our future results of operations will be impacted by certain external forces and resulting changes in our business model and strategy. Changes to our business environment will continue as elected officials at the national and state levels enact modifications to existing laws and regulations, including changes to available subsidies, taxes and fees. For additional discussion, see “Regulation” below in this “Business” section and Part I, Item 1A “Risk Factors” included in this Annual Report on Form 10-K.
Our results of operations are also impacted by levels and mix of membership, which has changed, and will continue to change, as a result of the quality and pricing of our health benefits products and services, Medicaid redeterminations, an aging population, healthcare utilization patterns, previously uninsured members entering the healthcare system, provider and member fraud, economic conditions, changes in unemployment, the continued and future impact of large-scale emergencies, acquisitions, entry into new markets and expansions in or exits from existing markets. These membership trends could be negatively impacted by various factors that could have a material adverse effect on our future results of operations such as general economic downturns that result in business failures, failure to obtain new customers or retain existing customers, premium increases, benefit changes, changes in how our members access healthcare services or our exit from a specific market. See Part I, Item 1A “Risk Factors” and Part II, Item 7 “Management’s Discussion and Analysis of Financial Condition and Results of Operations” included in this Annual Report on Form 10-K.
We continue to enhance interactions with customers, providers, brokers, agents, employees and other stakeholders through digital technology and improvements to internal operations. Our approach includes not only the sales and distribution of health benefits products through digital technology, but also implementing advanced capabilities that improve services benefiting customers, agents, brokers and providers while optimizing administrative costs. These enhancements can also help improve the quality, coordination and safety of healthcare through increased communications between patients and their physicians.
Through our participation in various federal government programs, we generated approximately 31%, 29% and 28% of our total consolidated revenues from agencies of the U.S. government for the years ended December 31, 2024, 2023 and 2022, respectively. The majority of these revenues are contained in our Health Benefits segment as described below. An immaterial amount of our total consolidated revenues is derived from activities outside of the U.S. and Puerto Rico.
Reportable Segments
We report our results of operations in the following four reportable segments: Health Benefits, CarelonRx, Carelon Services and Corporate & Other (our businesses that do not individually meet the quantitative thresholds for an operating segment, as well as corporate expenses not allocated to our other reportable segments).
Our Health Benefits segment offers a comprehensive suite of health plans and services to our Individual, Employer Group risk-based, Employer Group fee-based, BlueCard®, Medicare, Medicaid and FEP® members. The Health Benefits segment offers health products on a full-risk basis; provides a broad array of administrative managed care services to our fee-based customers; and provides a variety of specialty and other insurance products and services such as stop loss, dental, vision and supplemental health insurance benefits.
Our CarelonRx segment includes our pharmacy services business. CarelonRx markets and offers pharmacy services to our affiliated health plan customers, as well as to external customers outside of the health plans we own. CarelonRx offers a comprehensive portfolio of pharmacy services, which includes all core pharmacy services, such as home delivery and specialty pharmacies, claims adjudication, formulary management, pharmacy networks, rebate administration, a prescription drug database and member services. In addition, CarelonRx includes ambulatory infusion centers, added to our portfolio in March 2024 through our acquisition of Paragon Healthcare, Inc. and its subsidiaries.
Our Carelon Services segment integrates physical, behavioral, pharmacy, and social services with the aim of delivering whole health affordably by offering a broad array of healthcare related services and capabilities to internal and external customers through our Carelon Health and Carelon Insights businesses. Our Carelon businesses promote affordability by managing complex areas of the healthcare system, leveraging data and insights to improve how our members receive safe, appropriate, high-quality care and providers are reimbursed accurately and timely. Our approach to cost management relies on capabilities including provider enablement, value-based networks, member engagement, and utilization management. Our care delivery services primarily target serving chronic and complex populations by providing personalized care in the home and virtually. As a part of Carelon Health, we completed our acquisition of RSV QOZB LTSS, Inc. and certain affiliated entities (d/b/a CareBridge) at the end of 2024, which provides virtual care to complex Medicaid and Medicare patients and supports plans in managing home and community-based services.
Our Corporate & Other segment includes our businesses that do not individually meet the quantitative threshold for an operating segment, as well as corporate expenses not allocated to our other reportable segments.
For additional information, see Note 20, “Segment Information,” of the Notes to Consolidated Financial Statements included in Part II, Item 8 of this Annual Report on Form 10-K.
Membership
Our medical membership includes the following customer types: Individual, Employer Group risk-based, Employer Group fee-based, BlueCard®, Medicare, Medicaid and FEP®. In addition, we also serve customers who purchase one or more of our other products or services that are often ancillary to our health business.
Our products are generally developed and marketed with an emphasis on the differing needs of our customers. In particular, our product development and marketing efforts take into account the differing characteristics between the various customers served by us, as well as the unique needs of educational and public entities, labor groups, the FEP®, national employers and state-run programs servicing low-income, high-risk and underserved markets. Overall, we seek to establish pricing and product designs to provide value for our customers while achieving an appropriate level of profitability for each of our customer categories balanced with the competitive objective to grow market share. We believe that one of the keys to our success has been our focus on these distinct customer types, which better enables us to develop benefit plans and services that meet our customers’ unique needs.
We market our Individual, Medicare and certain Employer Group products with a smaller employee base through direct marketing activities and an extensive network of independent agents, brokers and retail partnerships. Products for commercial customers with a larger employee base are generally sold through independent brokers or consultants retained by the customer who work with industry specialists from our in-house sales force. In the Individual markets, we offer on-exchange products through state- or federally-facilitated marketplaces (the “Public Exchange”) in compliance with the Patient
Protection and Affordable Care Act and the Health Care and Education Reconciliation Act of 2010, as amended (collectively, the “ACA”) and off-exchange products. Federal subsidies are available for certain members, subject to eligibility, who purchase Public Exchange products.
We continue to participate in the Public Exchange in nearly all of our Anthem Blue Cross and Anthem Blue Cross and Blue Shield service areas. We anticipate growth in our Public Exchange membership as former Medicaid members, no longer eligible for Medicaid coverage, continue to seek alternative coverage options. Additionally, we are entering select service areas in Florida, Maryland, and Texas in 2025, using our Simply Healthcare and Wellpoint brands, and we are actively evaluating expansion opportunities in additional marketplaces beyond 2025. See “Regulation” below in this “Business” section for additional discussion about the Public Exchange marketplace.
Being a licensee of the BCBS association of companies, of which there were 33 independent primary licensees including us as of December 31, 2024, provides significant market value, especially when competing for very large multi-state employer groups. For example, each BCBS member company is able to utilize other BCBS licensees’ substantial provider networks and discounts when any BCBS member works or travels outside of the state in which their policy is written. This program is referred to as BlueCard®. BlueCard® host members are generally members who reside in or travel to a state in which an Elevance Health subsidiary is the Blue Cross and/or Blue Shield licensee and who are covered under an employer-sponsored health plan serviced by a non-Elevance Health controlled BCBS licensee, which is the “home” plan. We perform certain administrative functions for BlueCard® host members, including claims pricing and administration, for which we receive service fees from the BlueCard® members’ home plan. Other administrative functions, including maintenance of enrollment information and customer services, are performed by the home plan. See “BCBSA Licenses” below in this “Business” section for additional information on our BCBSA licenses. We refer to members in our service areas licensed by the BCBSA as our BCBS-branded, or Anthem BCBS, business. Non-BCBS-branded business refers to members in our non-BCBS-branded plans, which include Wellpoint, MMM and Simply Healthcare plans.
For additional information describing each of our customer types and changes in medical membership over the last three years, see “Management’s Discussion and Analysis of Financial Condition and Results of Operations - Membership” included in Part II, Item 7 of this Annual Report on Form 10-K.
Product and Service Descriptions
Various forms of managed care products have been developed to contain the cost of healthcare by negotiating contracts with hospitals, physicians and other providers to deliver high-quality healthcare to members at favorable rates. These products usually feature medical management and other quality and cost optimization measures such as pre-admission review and approval for certain non-emergency services, pre-authorization of outpatient surgical procedures, network credentialing to determine that network physicians and hospitals have the required certifications and expertise, and various levels of care management programs to help members better understand and navigate the healthcare system. In addition, providers may have incentives to achieve certain quality measures, may share medical cost risk or may have other incentives to deliver quality medical services in a cost-effective manner. Also, certain plans offer members incentives for healthy behaviors, such as smoking cessation and weight management. Members are charged periodic, prepaid premiums and generally pay copayments, coinsurance and/or deductibles when they receive services.
Health Benefits
•Commercial Risk-Based Products. We offer employer groups a diversified mix of managed care risk-based products including: Preferred Provider Organization (“PPO”), Health Maintenance Organization (“HMO”), Consumer-Driven Health Plans (“CDHP”), Traditional Indemnity and Point-of-Service (“POS”) plans. PPO plans generally provide members the freedom to choose any healthcare provider, but require the member to pay a greater portion of the provider’s fee in the event the member chooses not to use a provider participating in the PPO’s network. HMOs include comprehensive managed care benefits generally through a participating network of physicians, hospitals and other providers. CDHPs generally combine a high-deductible PPO plan with an employer-funded and/or employee-funded personal care account, which may result in tax benefits to the employee and allow some or all of the dollars remaining in the personal care account at year-end to be rolled over to the next year for future healthcare needs. Traditional indemnity plans offer the member an option to select any healthcare provider for covered services, with coverage subject to deductibles and coinsurance and with member cost-sharing usually limited by out-of-pocket maximums. POS products
blend the characteristics of HMO, PPO and indemnity plans. In general, POS plans allow members to choose to seek care from a provider within the plan’s network or outside the network, subject to, among other things, certain deductibles and coinsurance.
We also offer Individual risk-based products on and off the Public Exchange, covering essential health benefits (as defined in the ACA) along with many other requirements and cost-sharing features.
•Commercial Fee-Based Products. We provide a broad array of managed care services to fee-based groups, including claims processing, provider network access, medical management, care management and wellness programs, actuarial services and other administrative services. Fee-based health plans are also able to use our provider networks and to realize savings through our negotiated provider arrangements, while allowing employers the ability to design certain health benefit plans in accordance with their own requirements and objectives. We also charge a premium to underwrite stop loss insurance for employers that maintain fee-based plans but want to limit their retained risk.
In addition, we perform certain administrative functions for BlueCard® host members, discussed under “Membership” above, including claims pricing and administration, for which we receive service fees from the BlueCard® members’ home plans. Other administrative functions, including maintenance of enrollment information and customer service, are performed by the home plan.
•Specialty Products. We offer an array of products and services to both risk-based and fee-based customers in conjunction with our health plans as well as to unaffiliated healthcare plans that are not Elevance Health subsidiaries.
◦Stop Loss Insurance. Our stop loss insurance arrangements are built around our clients’ needs while assuming 100% of the risk. We offer specific and aggregate plans that will provide options to meet our clients’ coverage terms, budget and risk tolerance; active claims management to help avoid errors and missing claims; as well as cost containment to assist our clients with claims and cost control.
◦Dental. Our dental plans include networks in certain states in which we operate and are offered on both a risk-based and fee-based basis. Our members also have access to additional dental providers through our participation in the National Dental GRID, a national dental network developed by and for BCBS plans that offers in-network discounts across the country.
◦Vision. Our vision plans include networks within the states in which we operate and are offered on both a risk-based and fee-based basis.
◦Supplemental Health. We offer supplemental health products, including accident, critical illness and hospital indemnity, which provide coverage for specific conditions or circumstances.
•Medicare Plans. We offer a wide variety of plans, products and options to individuals age 65 and older such as Medicare Advantage, including Special Needs Plans (“SNPs”), dual-eligible programs through Medicare-Medicaid Plans (“MMPs”), Medicare Supplement plans and Medicare Part D Prescription Drug Plans (“Medicare Part D”).
Medicare Advantage plans provide Medicare beneficiaries with a managed care alternative to traditional Medicare and often include a Medicare Part D benefit. In addition, our Medicare Advantage SNPs provide tailored benefits to special needs individuals who are institutionalized or have severe or disabling chronic conditions and to dual-eligible customers, who are low-income seniors and persons under age 65 with disabilities. Medicare Advantage SNPs are coordinated care plans specifically designed to provide targeted care, covering all the healthcare services considered medically necessary for members and often providing professional care coordination services, with personal guidance and programs that help members maintain their health. Medicare Advantage membership also includes Medicare Advantage members in our Group Retiree Solutions business who are retired members of commercial accounts or groups who are not affiliated with our commercial accounts that have selected a Medicare Advantage product through us. MMP is focused on serving members who are dually eligible for Medicaid and Medicare. Medicare Supplement plans typically pay the difference between healthcare costs incurred by a beneficiary and amounts paid by the traditional Medicare Fee-For-Service program. Medicare Part D offers a prescription drug plan to Medicare and MMP beneficiaries.
•Medicaid Plans and Other State-Sponsored Programs. Our Medicaid business includes our managed care alternatives through public-funded healthcare programs, including Medicaid; Medicaid expansion programs; Temporary Assistance for Needy Families (“TANF”); programs for seniors and people with disabilities (“SPD”); Children’s Health Insurance
Programs (“CHIP”); and specialty programs such as those focused on long-term services and support (“LTSS”), HIV/AIDS, children living in foster care, behavioral health and/or substance abuse disorders, and intellectual disabilities and/or developmental disabilities. The Medicaid program makes federal matching funds available to all states for the delivery of healthcare benefits for low income and/or high medical risk individuals. These programs are managed by the individual states based on broad federal guidelines. Our Medicaid plans also cover certain dual-eligible customers, as previously described above, who also receive Medicare benefits. In 2024, we provided Medicaid and other state sponsored services, such as administrative services, in Arkansas, California, Colorado, District of Columbia, Florida, Georgia, Indiana, Iowa, Kentucky, Louisiana, Maryland, Minnesota, Missouri, Nebraska, Nevada, New Jersey, New York, North Carolina, Ohio, Puerto Rico, South Carolina, Tennessee, Texas, Virginia, Washington, West Virginia and Wisconsin.
•Federal Employee Program®. FEP® members consist of United States government employees and their dependents within our geographic markets.
•Medicare Administrative Operations. We serve as a fiscal intermediary, carrier and Medicare administrative contractor for the federal government by providing administrative services for the Medicare program, Parts A and B, which generally provides coverage for persons who are 65 or older and for persons who are under 65 and disabled or with end-stage renal disease. Part A of the Medicare program provides coverage for services provided by hospitals, skilled nursing facilities and other healthcare facilities. Part B of the Medicare program provides coverage for services provided by physicians, physical and occupational therapists and other professional providers, as well as certain durable medical equipment and medical supplies.
Carelon
Carelon integrates physical, behavioral, social and pharmacy services to deliver whole health affordably by creating value through the offering of market-competitive services powered by analytics.
CarelonRx
Our subsidiary CarelonRx markets and offers pharmacy services to our affiliated health plan customers throughout the country, as well as to customers outside of the health plans we own. Our comprehensive pharmacy services portfolio includes all core pharmacy services, such as home delivery and specialty pharmacies, claims adjudication, formulary management, pharmacy networks, rebate administration, a prescription drug database and member services, as well as infusion services and injectable therapies through owned ambulatory infusion centers.
CarelonRx delegates certain core pharmacy services to CaremarkPCS Health, L.L.C., which is a subsidiary of CVS Health Corporation (“CVS”), pursuant to an agreement (the “CVS Agreement”) with the current contractual term extending through December 31, 2027. We can elect to have CVS continue to provide services to us for a three-year extension period on the same terms and conditions as in the current CVS Agreement in the event of a termination or non-renewal by either party.
Carelon Services
Carelon Services integrates physical, behavioral, pharmacy, and social services with the aim of delivering whole health affordably by offering a broad array of healthcare related services and capabilities to internal and external customers through our Carelon Health and Carelon Insights businesses. Carelon businesses promote affordability by managing complex areas of the healthcare system, leveraging data and insights to improve how our members receive safe, appropriate, high-quality care and providers are reimbursed accurately and timely. Our approach to cost management relies on capabilities including provider enablement, value-based networks, member engagement, and utilization management. Our care delivery services primarily target serving the chronic and complex populations by providing personalized care in the home and virtually.
•Carelon Health: Carelon Health, powered by clinical excellence, curates value-based whole health solutions for populations, one person at a time. Carelon Medical Benefits Management provides specialty care enablement and utilization management support for specialized clinical domains. Carelon Post Acute Solutions manages home health, post-acute institutional management, and durable medical equipment costs. Carelon Behavioral Health provides comprehensive behavioral health management services through clinical services and network
administration. Carelon Care Navigation provides comprehensive care management services. Our Carelon Advanced Primary Care business includes palliative care services and management of our partnership with Augusta Topco Holdings L.P. (“Mosaic Health”), a joint venture with Clayton, Dubilier & Rice (“CD&R”). At the end of 2024, we completed our acquisition of CareBridge, which provides virtual care to complex Medicaid and Medicare patients and supports plans in managing home and community-based services.
•Carelon Insights: Carelon Insights aims to improve the health of the healthcare system by simplifying workflows and providing real-time insights. Carelon Insights capabilities include payment integrity, subrogation, clinical data exchange through our HealthOS platform, research and data services, reporting and clinical analytics, and information technology services and global business process support.
Competition
The managed care industry is highly competitive, both nationally and in our local markets. Competition continues to be intense due to aggressive marketing, pricing, bid activity for government-sponsored programs, business consolidations, new strategic alliances, new competitors in the market, a proliferation of new products, technological advancements, the impact of legislative reform, increased quality awareness and price sensitivity among customers and changing market practices, such as increased usage of telehealth.
We believe that participants in the managed care industry compete for customers based on quality of service, price, access to provider networks, access to care management and wellness programs (including health information), innovation, effective use of digital technology, breadth and flexibility of products and benefits, expertise and reputation (including National Committee on Quality Assurance (“NCQA”) accreditation status as well as CMS Star Ratings), brand recognition and financial stability. Our ability to attract and retain customers is substantially tied to our ability to distinguish ourselves from our competitors in these areas.
We believe our exclusive right to market products under the most recognized brand in the industry, BCBS, in our most significant markets provides us with greater brand recognition over competitive product offerings. Typically, we are the largest participant in each of our BCBS branded markets, and thus are closely watched by other health benefits companies.
Product pricing remains competitive, and we strive to price our health benefit products and design our Medicare and Medicaid bids consistent with anticipated underlying medical trends. We believe our pricing and bid strategy, based on predictive modeling, proprietary research and data-driven processes, has positioned us to benefit from the potential growth opportunities available through entry into new markets, expansions in existing markets and as a result of any future changes to the current regulatory scheme. We believe that our pricing and bid strategy, brand name and network quality will provide a strong foundation for membership growth opportunities in the future.
Our provider networks give us a highly competitive unit cost position and provide distinctive service levels which allow us to offer a broad range of affordable health benefit products to our customers. To build our provider networks, we compete with other health benefits plans for the best contracts with hospitals, physicians and other providers. We believe that physicians and other providers primarily consider customer volume, reimbursement rates, timeliness of reimbursement and administrative service capabilities along with the reduction of non-value added administrative tasks when deciding whether to contract with a health benefits plan.
At the sales and distribution level, we compete for qualified agents and brokers to recommend and distribute our products. Strong competition exists among insurance companies and health benefits plans for agents and brokers with demonstrated ability to secure new business and maintain existing accounts. We believe that the quality and price of our products, support services, reputation and prior relationships, along with a reasonable commission structure, are the factors agents and brokers consider in choosing whether to market our products. We believe that we have good relationships with our agents and brokers, and that our products, support services and commission structure compare favorably to those of our competitors in all of our markets.
In addition, the pharmacy industry is highly competitive, and CarelonRx is subject to competition from national, regional and local pharmacy service providers, insurers, health plans, large retail pharmacy chains, large retail stores, supermarkets, mail order pharmacies, web pharmacies and specialty pharmacies. Strong competition within the pharmacy industry has
generated greater demand for lower product and service pricing, increased revenue sharing and enhanced product and service offerings.
Pricing and Underwriting of Our Products
We price our products based on our assessment of current healthcare claim costs and emerging healthcare cost trends, combined with charges for administrative expenses, risk and profit. We continually review our product designs and pricing guidelines on a national and regional basis so that our products remain competitive and consistent with our strategies and profitability goals.
Our revenue on Medicare policies is based on annual bids submitted to CMS. We base the commercial and Medicaid premiums we charge and our Medicare bids on our estimates of future medical costs over the fixed contract period. In applying our pricing to each employer group and customer, we aim to maintain consistent, competitive and disciplined underwriting standards. We employ our proprietary accumulated actuarial and financial data to determine underwriting and pricing parameters for both our risk-based and fee-based businesses.
In most circumstances, our pricing and underwriting decisions follow a prospective rating process in which a fixed premium is determined at the beginning of the contract period. For our risk-based business, any deviation, favorable or unfavorable, from the medical costs assumed in determining the premium is our responsibility. Some of our larger groups employ retrospective rating reviews, where positive experience is partially refunded to the group, and negative experience is charged against a rate stabilization fund established from the group’s favorable experience or charged against future favorable experience. In addition, our ACA and government risk-based contracts may include minimum medical loss ratio, risk adjustment, or risk corridor arrangements, which also stabilize premiums based upon claims experience.
Our pharmacy services pricing through CarelonRx is presented to market via discounts off the average wholesale price for drugs dispensed through the retail, mail and specialty channels as well as through rebate projections. We utilize group-specific script data, formulary, network and clinical care program selection combined with administrative expense, risk and profit guidance to set market competitive pricing discounts and rebate projections. Pharmacy services pricing guidelines guide the underwriting process and undergo an annual external review process to ensure market competitiveness.
Networks and Provider Relations
Our relationships with physicians, hospitals and professionals that render healthcare services to our members are guided by local, regional and national standards for network development, reimbursement and contract methodologies. While following industry standards, we are simultaneously seeking to lead transformation efforts within our healthcare system, moving from a fragmented model premised on episodic intervention to one based on proactive, coordinated care built around the whole health needs of the patient.
We establish “market-based” hospital reimbursement payments that we believe are fair, but aggressive, and among the most competitive in the market. We also seek to ensure that physicians in our network are paid in a timely manner at appropriate rates. In most instances, we deploy multi-year contracting strategies, including fixed case rates and fee schedules, to limit our exposure to medical cost inflation and to increase cost predictability. We maintain both broad and narrow provider networks to ensure member choice, based on both price and access needs, while implementing programs designed to improve the quality of care our members receive. Increasingly, we are supplementing our broad-based networks with smaller or more cost-conscious networks that are designed to be attractive to a more price-sensitive customer segment, such as Public Exchange customers.
Our reimbursement strategies are tailored to each market and reflect the degree of consolidation and integration of physician groups and hospitals. Under a fee-for-service reimbursement methodology for physicians, fee schedules are developed at the state level based on an assessment of several factors and conditions, including the CMS resource-based relative value system (“RBRVS”), medical practice cost inflation and physician supply of each specialty. We utilize CMS RBRVS fee schedules as a reference point for fee schedule development and analysis. The RBRVS structure was developed, maintained, and updated by CMS and is used by the Medicare program and other major health plans. In addition, we have implemented and continue to expand physician incentive contracting, which ties physician payment levels to performance on efficiency, clinical and patient experience measures.
While we generally do not delegate full financial responsibility to our physician providers in the form of capitation-based reimbursement, we maintain capitation-based arrangements in certain markets where we determine that market dynamics result in it being a useful method to lower costs and reduce underwriting risk. Our provider engagement and contracting strategies have evolved to include value-based contracting arrangements that meet providers where they are in the movement from traditional fee-for-service to value-based care. These programs are designed to support commercial, Medicare and Medicaid programs and the unique characteristics of these populations. Our value-based contracting programs are designed to reward our contracted providers for improving the overall quality of care they deliver by adhering to evidence-based medicine. In addition, these value-based contracts also share with the providers total cost of care savings that are achieved by adhering to evidence-based medicine over time. For providers who contract in one of our value-based programs, we work with them to share gaps in care information and other important data to assist them in managing the care of their patients. Often providers will also grant us access to data to support the efficient administration of program components. This data can allow us to more efficiently capture information regarding the risk of our membership and the overall adherence to evidence-based medicine, as well as information to more efficiently perform utilization management administration.
Our hospital contracts provide for a variety of reimbursement arrangements depending on local market dynamics and current hospital utilization efficiency. Most hospitals are reimbursed a per-case amount, per admission, for inpatient covered services. Our “per-case” reimbursement methods utilize many of the same attributes contained in Medicare’s Diagnosis Related Groups methodology. Hospital outpatient services are reimbursed by fixed case rates, fee schedules or percent of approved charges. A small percentage of hospitals, primarily rural, sole community hospitals, are reimbursed on a discount from approved charge basis for covered outpatient services. Our hospital contracts recognize unique hospital attributes, such as academic medical centers or sole community hospitals, and the volume of care performed for our members. To improve predictability of expected costs, we frequently use a multi-year contracting approach with providers. In addition, the majority of our hospital contracts include a pay-for-performance component where reimbursement levels are linked to improved clinical performance, patient safety and medical error reduction.
Seasonality
Within our Health Benefits segment, although premium revenues for our commercial business are not seasonal, our benefit costs rise as members pay their contractual portion of claims responsibility, hitting their deductibles and out-of-pocket maximums. Seasonality in our Medicaid business can vary depending on the timing of the recognition of premium rates during the year, and we typically experience additional costs in our Medicare business in the fourth quarter to support the annual enrollment period.
Our Carelon Services segment engages in risk-based contracts with members across many health plans including Elevance Health plans. These risk-based contracts allow our Health Benefits segment to reduce medical expense variability by replacing seasonal claims costs with agreed-upon pricing. Seasonality in our Carelon Services segment aligns with the claims and revenue seasonality for services covered, which can vary by Carelon product and line of business. As the year progresses, members will generally reach their deductible and out-of-pocket maximum limit, and benefit expense in our Carelon Services businesses will typically increase to cover member costs.
Medical Management Programs
We have a broad array of medical management activities that facilitate improvements in the quality of care provided to our members and promote cost-effective medical care. These medical management activities and programs are administered and directed by physicians and nurses with the goal of ensuring that the care delivered to our members is supported by appropriate medical and scientific evidence, is received on a timely basis and occurs in the most appropriate setting. The medical management programs available to our members may vary depending on the particular plan or product in which they participate.
Care coordination is one of the strategies we utilize and is based on nationally recognized criteria developed by third-party medical specialists to help coordinate inpatient as well as outpatient care and monitor appropriate utilization of such services. Our case management focuses on identifying membership that will require a high level of intervention and providing assistance to manage their healthcare needs. Precertification is utilized to assess appropriateness of certain medical services and sites of care prior to the services being rendered. Our medical policy committee determines our national policies
and guidelines for the application of medical technologies, procedures and services and reviews these policies and guidelines at least once a year or as new published clinical evidence becomes available. We are actively engaged with our hospital and physician networks to enable them to achieve better outcomes for our members. We also work with outside experts through a process of external review to provide our members scientifically and clinically evidence-based medical care. Our web-based tools allow our members to obtain or compare cost estimates for care, including out-of-pocket costs.
We remain committed to assisting our members in making informed and value-based healthcare decisions, providing for easier navigation of healthcare services and delivering a better healthcare experience.
Care Management and Wellness Products and Programs
We continue to expand our suite of integrated care management programs and tools. Availability of these programs and tools to our members may depend on the particular plan or product in which they participate. Our care management tools and programs are designed to increase quality and reduce medical costs for our members and help them make better decisions about their well-being as they navigate the healthcare system. Our digital engagement platform, Sydney Health, is designed to give our members access to personalized health and wellness resources, medical, pharmacy, dental and vision benefits details, and virtual care services, all in one place. Our care management, infertility services and maternity management programs serve as adjuncts to physician care. Through these programs, medical professionals help to educate participants regarding their care and condition. Our 24/7 NurseLine offers access to qualified, registered nurses to allow our members to make informed decisions about the appropriate level of care and avoid unnecessary worry. Our Carelon Palliative Care Services subsidiary engages with members near end of life and/or requiring palliative care to manage serious illnesses and improve quality of life during a difficult time. With our integrated information systems and sophisticated data analytics, we help our members improve their compliance with evidence-based care guidelines, provide personal care notes that alert members to potential gaps in care, enable more prudent healthcare choices and assist in the realization of member out-of-pocket cost savings. Our employee assistance programs provide 24/7 telephonic support for personal and crisis events and provide resources such as counseling and referral assistance with childcare, health and wellness, financial issues, legal issues, adoption and daily living. We have a comprehensive behavioral health case management program supporting a wide range of members who are impacted by their behavioral health conditions, including specialty areas such as eating disorders, anxiety, depression and substance abuse. The program assists members and their families with obtaining appropriate behavioral health treatment, offering community resources, providing education and telephonic support, and promoting provider collaboration.
Healthcare Quality Initiatives
Increasingly, the healthcare industry is able to define quality healthcare based on effective, safe, equitable and affordable care in preventive health, and optimal care management for chronic disease. A key to our success has been our ability to develop partnerships by working with our network physicians, hospitals, and social resources providers to improve the quality outcomes of the healthcare and social impact services provided to our members, their families, and the community-at-large. Our ability to promote quality medical care and patient safety, address health-related social risks and advance health equity has been recognized by the National Committee for Quality Assurance (“NCQA”), the largest and most respected national accreditation program for managed care health plans, and our company was awarded the NCQA 2023-2024 Innovation Award for the advancement of better maternal and neonatal outcomes.
Several quality healthcare measures, including the Healthcare Effectiveness Data and Information Set (“HEDIS®”), have been incorporated into NCQA’s accreditation processes. HEDIS® measures range from preventive services, such as screening mammography and pediatric immunization, to elements of care, including decreasing the complications of diabetes, improving treatment for patients with heart disease, integration of behavioral health, and racial and ethnic stratification measurement to help close healthcare disparities.
Through our Carelon Medical Benefits Management, Inc. subsidiary, we promote appropriate, safe and affordable member care in areas including maternity care, imaging, sleep disorders, cardiac testing, oncology drugs and musculoskeletal procedures. These expanded specialty benefit management solutions leverage clinical expertise and technology to engage provider communities and members in the more effective and efficient use of outpatient services and to promote the most appropriate use of clinical services to improve the quality of care.
We perform management review for home health and post-acute institutional services provided to Medicare members through our Carelon Post Acute Solutions, Inc. subsidiary, with the goal of ensuring they receive appropriate, high-quality
care and supporting their transition back into the home. Effective management of these services can help reduce preventable hospital admissions and readmissions, thereby improving healthcare outcomes for patients. Additionally, Carelon Medical Benefits Management, Inc. has developed programs to address healthcare quality by identifying and closing care gaps. A social determinants of health program screens our members for social needs and connects members to appropriate community resources to encourage better care outcomes. Both medical benefits management and post-acute solutions programs are examples of how we facilitate improvements in the quality of care provided to our members and promote cost-effective, affordable medical care.
The physical aspects of health have been traditionally the focus and the priority for healthcare. However, unique life circumstances and experiences impact every individual and their health. We seek to understand our members' health-related social needs to create a healthcare system that synchronizes care delivery for physical, behavioral, social and pharmacy needs. We have invested in a number of strategies to improve how we address health related social needs. We are advancing our efforts through consistent screening of our members for their social needs by using industry-standard tools such as the Protocol for Responding to & Assessing Patients’ Assets, Risks & Experiences, co-creating social action plans with our members, connecting members to related social support services, and evaluating the entire process for continuous quality improvement. We have also implemented our “Food as Medicine” strategy across many of our lines of business to create interventions that not only prevent, manage, and treat diseases but also address food and nutrition insecurity among our members. We are committed to ensuring that all people, regardless of age, race or ethnicity, sexual orientation, gender identity, disability, and geographic or financial access can receive individualized care. Harnessing data gives a more complete picture of each member and their health needs and can help make healthcare more personalized and equitable. Strengthening communities has a positive effect on health; therefore, we value and nurture our local ties, which are a key component of our whole-health approach and drive us to work closely with community organizations that create support networks. Using our data, we also identify the resources needed to support local residents, including the people who we serve, to ensure those resources can better meet local needs.
BCBSA Licenses
We are a party to license agreements with the BCBSA that entitle us to the exclusive, and in certain areas, non-exclusive, use of the Blue Cross and Blue Shield names and marks in assigned geographic territories. BCBSA is a national association of independent Blue Cross and Blue Shield companies, the primary function of which is to promote and preserve the integrity of the BCBS names and marks, as well as provide certain coordination among the member companies. Each BCBSA licensee is an independent legal organization and is not responsible for obligations of other BCBSA member organizations. Although previously we did not have a right to sell products and services using the BCBS names and marks outside of our exclusive service areas, under the terms of the In re Blue Cross Blue Shield Antitrust Litigation subscriber settlement agreement and release (“Subscriber Settlement Agreement”) some large national employers with self-funded plans (specifically identified in the Subscriber Settlement Agreement), have a right to request a second Blue plan bid in addition to a bid from the local Blue plan, effective as of September 2024.
We are required to pay an annual license fee to the BCBSA based on enrollment and to comply with various requirements and restrictions regarding our operations and our use of the BCBS names and marks. These requirements and restrictions include, among other things: minimum capital and liquidity requirements; enrollment and customer service performance requirements; participation in programs that provide portability of membership between plans; disclosures to the BCBSA relating to enrollment and financial conditions; disclosures as to the structure of the BCBS system in contracts with third parties and in public statements; plan governance requirements; cybersecurity requirements; a requirement that at least 80% (or, in the case of Blue Cross of California, substantially all) of a licensee’s annual combined local net revenue, as defined by the BCBSA, attributable to healthcare plans and related services within its service areas must be sold, marketed, administered or underwritten under the BCBS names and marks; a requirement that neither a plan nor any of its licensed affiliates may permit an entity other than a plan or a licensed affiliate to obtain control of the plan or the licensed affiliate or to acquire a substantial portion of its assets related to licensable services; governance requirements such as a requirement that we divide our Board of Directors into three classes serving staggered three-year terms; a requirement that we guarantee certain contractual and financial obligations of our licensed affiliates; and a requirement that we indemnify the BCBSA against any claims asserted against it resulting from the contractual and financial obligations of any subsidiary that serves as a fiscal intermediary providing administrative services for Medicare Parts A and B. In addition, a change of control or violation of the BCBSA ownership limitations on our capital stock, impending financial insolvency or the appointment of a trustee or
receiver or the commencement of any action against us seeking our dissolution could cause a termination of our license agreements.
We believe that we and our licensed affiliates are currently in compliance with these standards. The standards under the license agreements may be modified in certain instances by the BCBSA. See Part I, Item 1A, “Risk Factors” in this Annual Report on Form 10-K for additional details on the impact if we were not to comply with these license agreements and Note 14, “Commitments and Contingencies – Litigation and Regulatory Proceedings – Blue Cross Blue Shield Antitrust Litigation,” of the Notes to our Consolidated Financial Statements included in Part II, Item 8 of this Annual Report on Form 10-K for additional information on the Subscriber Settlement Agreement.
Regulation
General
Our operations are subject to comprehensive and detailed state, federal and international regulation throughout the jurisdictions in which we do business. These laws and regulations, which can vary significantly from jurisdiction to jurisdiction, restrict how we conduct our businesses and result in additional burdens and costs to us. Further, federal and state laws and regulations are subject to amendments and changing interpretations in each jurisdiction. The application of these complex legal and regulatory requirements to the detailed operation of our businesses creates areas of uncertainty. In addition, there are numerous proposed healthcare laws and regulations at the federal and state levels, including single payer, Medicare for All and public option proposals, some of which could materially adversely affect our businesses if they were to be enacted.
Supervisory agencies, including federal and state regulators, departments of health and insurance and secretaries of state, have broad authority to:
•grant, suspend and revoke licenses to transact business;
•regulate our products and services in great detail;
•regulate, limit, or suspend our ability to market products, including participation in Medicare and the Public Exchanges;
•determine through a procurement process our ability to participate in certain programs, including state Medicaid programs;
•retroactively adjust premium rates;
•monitor our solvency and reserve adequacy;
•audit, and recover audit discrepancies, including risk adjustment data validation (“RADV”) audits;
•scrutinize our investment activities on the basis of quality, diversification and other quantitative criteria; and
•impose monetary and criminal sanctions for non-compliance with regulatory requirements.
To carry out these tasks, these government entities periodically examine our operations and accounts.
The health benefits business, pharmacy services, and related healthcare products and services businesses also may be adversely impacted by court and regulatory decisions that expand or invalidate the interpretations of existing statutes and regulations. It is uncertain whether we could recoup, through higher premiums or other measures, the increased costs of mandated benefits or other increased costs caused by potential legislation, regulation or court rulings. See Part I, Item 1A “Risk Factors” in this Annual Report on Form 10-K.
The Consolidation Appropriations Act of 2023
The Consolidated Appropriations Act of 2023 decoupled Medicaid eligibility redetermination from the COVID-19 Public Health Emergency, initially declared in January 2020. As a result, states were permitted to begin removing ineligible beneficiaries from their Medicaid programs starting April 1, 2023, and the majority of our Medicaid markets began doing so as of June 30, 2023. Although most states have completed this process, CMS has provided that states have until December 31, 2025, to complete these eligibility redeterminations. Since redeterminations resumed, we have continued to experience a decline in our Medicaid membership. We expect growth over time in our commercial plans, including through the Public Exchanges, as members who have lost Medicaid coverage in states where we offer commercial plans seek coverage elsewhere.
The Inflation Reduction Act of 2022
The Inflation Reduction Act of 2022 contains a variety of provisions that have impacted, and continue to impact, our business including extending the American Rescue Plan Act of 2021's enhanced Premium Tax Credits (“PTC”) through 2025; imposing a new corporate alternative minimum tax; providing a one percent excise tax on repurchases of stock; allowing CMS to negotiate prices on a limited set of prescription drugs beginning in 2026; instituting caps on insulin cost sharing in Medicare; redesigning the Medicare Part D benefit; requiring drug manufacturers to pay rebates if prices increase beyond inflation; and delaying the implementation of the Trump Administration Medicare drug rebate rule to 2032. The extension of the enhanced PTC has allowed for growth in Individual Public Exchange enrollment and has supported continuity of coverage since Medicaid eligibility redeterminations resumed in 2023. If Congress does not act to extend the enhanced PTC, they will expire at the end of 2025, which could have a material adverse effect on our business and results of operations.
The Consolidated Appropriations Act of 2021
The Consolidated Appropriations Act of 2021 (the “2021 Appropriations Act”) has impacted our business, including by imposing additional disclosure and reporting requirements related to broker compensation, mental health parity, pharmacy benefits and drug costs, as well as procedures and coverage requirements related to surprise medical bills, provider directory maintenance and continuity of care for certain patients. The requirements applicable to us under the 2021 Appropriations Act had varying effective dates beginning in December 2021.
The health plan price transparency regulations issued by the U.S. Departments of Health and Human Services (“HHS”), Labor, and Treasury (the “Tri-Agencies”) pursuant to the 2021 Appropriations Act required us to begin disclosing certain pricing information regarding negotiated rates and historical payment information with providers in 2022. Additionally, as directed by law, we make available to members personalized out-of-pocket cost information and underlying negotiated rates.
In September 2024, the Tri-Agencies issued final regulations related to mental health parity that will require health plans to make administrative and operational changes to comply with these final regulations. Although some provisions became effective on January 1, 2025, additional guidance from the Tri-Agencies will be necessary to assess the full impact of these regulations on our operations and financial results. Litigation has been filed challenging the final regulation and is pending court action.
State Regulation of Insurance Companies and HMOs
Our insurance and HMO subsidiaries must obtain a certificate of authority and maintain that license in the jurisdictions in which they conduct business. The National Association of Insurance Commissioners (“NAIC”) has adopted model regulations that, where adopted by states, require expanded governance practices, risk and solvency assessment reporting and the filing of periodic financial and operating reports. Most states have adopted these or similar measures to expand the scope of regulations relating to corporate governance and internal control activities of HMOs and insurance companies. Health insurers and HMOs are subject to state examination and periodic license renewal.
In addition, we are regulated as an insurance holding company and are subject to the insurance holding company acts of the states in which our insurance company and HMO subsidiaries are domiciled. These acts contain certain reporting requirements, as well as restrictions on transactions between an insurer or HMO and its affiliates, and may restrict the ability of our regulated subsidiaries to pay dividends to our holding companies. These holding company laws and regulations
generally require registration with applicable state departments of insurance and the filing of reports describing capital structure, ownership, financial condition, certain intercompany transactions, enterprise risks, corporate governance and general business operations. State insurance holding company laws and regulations require notice or prior regulatory approval of transactions including acquisitions, material intercompany transfers of assets, guarantees and other transactions between the regulated companies and their affiliates, including parent holding companies. Applicable state insurance holding company acts also restrict the ability of any person to obtain control of an insurance company or HMO without prior regulatory approval. “Control” is generally defined as the direct or indirect power to direct or cause the direction of the management and policies of a person and is presumed to exist if a person directly or indirectly owns or controls 10% or more of the voting securities of another person. Dispositions of control generally are also regulated under the state insurance holding company acts.
The states of domicile of our regulated subsidiaries have statutory risk-based capital (“RBC”) requirements for health and other insurance companies and HMOs based on the Risk-Based Capital (RBC) For Health Organizations Model Act. These RBC requirements are intended to assess the capital adequacy of health insurers and HMOs, taking into account the risk characteristics of a company’s investments and products. In general, under these laws, an insurance company or HMO must submit a report of its RBC level to the insurance department or insurance commissioner of its state of domicile for each calendar year. The law requires increasing degrees of regulatory oversight and intervention as a company’s RBC declines. As of December 31, 2024, the RBC levels of our insurance and HMO subsidiaries exceeded all applicable mandatory RBC requirements. For more information on RBC capital and additional liquidity and capital requirements for a licensee of the BCBSA, see “Management’s Discussion and Analysis of Financial Condition and Results of Operations – Liquidity and Capital Resources – Capital Resources,” included in Part II, Item 7 of this Annual Report on Form 10-K.
Ongoing Requirements and Changes Stemming from the ACA
Since its enactment in 2010, the ACA has introduced new risks, regulatory challenges and uncertainties, has impacted our business model and strategy and has required changes in the way our products are designed, underwritten, priced, distributed and administered. We expect the ACA will continue to significantly impact our business and results of operations, including pricing, minimum medical loss ratios (“MLRs”) and the geographies in which our products are available. We will continue to evaluate the impact of the ACA as any further developments occur.
We also expect further and ongoing regulatory guidance on a number of issues related to Medicare, including evolving methodology for ratings and quality bonus payments. CMS also frequently proposes changes to its program that audits data submitted under the risk adjustment programs in ways that could increase financial recoveries from plans.
Certain significant provisions of the ACA include, among others:
•The creation of Public Exchanges for individuals and small group customers.
•The establishment of minimum MLR thresholds by line of business for the commercial market (which may be subject to more restrictive MLR thresholds under state regulations, such as those in New York). Medicare Advantage or Medicare Part D prescription drug plans that do not meet the mandated threshold will have to pay a minimum MLR rebate, will be subject to restricted enrollment if MLR is below the threshold for three consecutive years and are subject to contract termination if the plan’s MLR is below the threshold for five consecutive years. In addition, state Medicaid programs are required to set managed care capitation rates such that a minimum MLR is projected to be achieved; however, states are not required to collect remittances if the minimum MLR is not achieved.
Approximately 54.2% and 18.4% of our premium revenue and medical membership, respectively, were subject to the minimum MLR regulations as of and for the year ended December 31, 2024. Approximately 52.3% and 18.0% of our premium revenue and medical membership, respectively, were subject to the minimum MLR regulations as of and for the year ended December 31, 2023.
•The creation of an incentive payment program for Medicare Advantage plans. CMS developed the Medicare Advantage Star Ratings system, which awards between 1.0 and 5.0 Stars to Medicare Advantage plans based on performance in several categories, including quality of care and customer service. The Star Ratings are used by CMS to award quality-based bonus payments to plans that receive a rating of 4.0 or higher. The methodology and measures included in the Star Ratings system can be modified by CMS annually. Our 2024 Star Ratings, which are
used for payment year 2025, reflect that 53% of our Medicare Advantage members are enrolled in plans rated at least 4.0 Stars or higher. This was an increase over the original 2024 Star Rating of 34% that were released in October 2023 and were subsequently recalculated by CMS. CMS released our 2025 Star Ratings in October 2024, which will be used to determine our Medicare Advantage bonus payments in 2026. Our 2025 Star Ratings reflect that 38% of our Medicare Advantage members are enrolled in plans rated at least 4.0 Stars or higher. We expect this will result in a reduction to our 2026 operating revenue of approximately $183 million, net of offsets from contracting provisions. Further, we expect to mitigate the financial impact to our 2026 operating gain and net income per share through various strategies such as contract diversification, operating expense efficiencies, capital deployment alternatives and network enhancements.
•The implementation of a Medicare Advantage payment formula, which prevents reimbursement rates from increasing as much as otherwise would be expected.
We continue to participate in the Public Exchange in nearly all of our Anthem Blue Cross and Anthem Blue Cross and Blue Shield service areas. We anticipate growth in our Public Exchange membership as former Medicaid members, no longer eligible for Medicaid coverage, continue to seek alternative coverage options. Additionally, we are entering select service areas in Florida, Maryland, and Texas in 2025, using our Simply Healthcare and Wellpoint brands, and we are actively evaluating expansion opportunities in additional marketplaces beyond 2025. Any variation from our expectations regarding acuity, enrollment levels, adverse selection, or other assumptions utilized in setting premium rates could have a material adverse effect on our results of operations, financial position, and cash flows, and may require further adjustments to our rates and participation going forward. Changes to our business environment are likely to continue as elected officials at the national and state levels continue to enact significant modifications to existing laws and regulations, including changes to available subsidies, taxes and fees.
Pharmacy Services and Drug Benefit Regulation
Pharmacy services, including pharmacy benefit managers, are regulated at both the federal and state levels and must comply with federal and state statutes and regulations governing a pharmacy benefit manager's business, including, but not limited to, pharmacy network restrictions and configurations, formulary management, affiliate pharmacy reimbursement, anti-steering to affiliated pharmacies, prohibition on pharmacy claim processing/transaction fees, pharmacy effective rates, guarantees and reconciliations, reimbursement pricing type mandates, purchase discount and/or rebate arrangements with drug manufacturers, advertising and licensing. Regulation in the states varies dramatically and ranges from licensure of pharmacy benefit managers as third-party administrators, licensure specifically as a pharmacy benefit manager, and licensure accompanied by additional disclosures and limitations of business practices to varying degrees.
Pharmacy benefit managers are also subject to continued changes in public policy, legislation, laws, and regulations relating to drug benefits and pharmacy services, which include, but are not limited to, (1) regulation of rebates from drug manufacturers that would require rebate dollars to be applied at the point-of-sale or passed through to the plan sponsor, (2) federal policy changes to set the prices for a subset of drugs covered under the Medicare program, (3) reforms to the Medicare drug benefit, such as beneficiary cost-sharing changes that aim to lower consumer costs and prohibit pharmacy benefit managers and their affiliates from deriving income based on the price of the drug, (4) attempts at both the federal and state levels to prohibit the use of spread pricing contracts in both the commercial and Medicaid markets, (5) prior authorizations of drugs, (6) transparency and public disclosure of costs and profits, (7) prohibiting exclusive specialty and mail pharmacy networks, (8) limiting pharmacy accreditation and credentialing requirements, (9) consumer choice/any willing provider requirements, and (10) prohibiting steering to affiliated pharmacies. These changes in public policy, legislation, laws, and regulations have the potential to have broad impacts on our pharmacy benefit management services and could materially adversely affect our business.
Our pharmacy services business includes home delivery and specialty pharmacies, infusion services, injectable therapies and clinic-based pharmacies, which must be licensed as pharmacies in the states in which they are located. Certain pharmacies must also register with the U.S. Drug Enforcement Agency (“DEA”) and individual state-controlled substance authorities to dispense controlled substances. In addition to adhering to the laws and regulations in the states where our pharmacies are located, we may also be required to comply with certain laws and regulations in certain states into which one of our pharmacies delivers prescription drugs, including those requiring us to register with Boards of Pharmacy as a non-resident pharmacy. These non-resident states generally expect our pharmacies to follow the laws of the state in which the
pharmacies are located, but some non-resident states also require us to comply with certain of their pharmacy regulations as well. Additionally, pharmacies that participate in Medicare or Medicaid pharmacy networks are required to comply with applicable Medicare and Medicaid provider rules and regulations.
Privacy, Confidentiality and Data Standards Regulation
The federal Health Insurance Portability and Accountability Act of 1996 (“HIPAA”) and the administrative simplification provisions of HIPAA impose a number of requirements on covered entities (including insurers, HMOs, group health plans, providers and clearinghouses) and their business associates relating to the use, disclosure and safeguarding of protected health information. These requirements include uniform standards of common electronic healthcare transactions; privacy and security regulations; and unique identifier rules for employers, health plans and providers.
Also, the Health Information Technology for Economic and Clinical Health (“HITECH”) Act provisions of the American Recovery and Reinvestment Act of 2009 and corresponding implementing regulations have imposed additional requirements on the use and disclosure of protected health information such as additional data breach notification and reporting requirements, contracting requirements for HIPAA business associate agreements, strengthened enforcement mechanisms and increased penalties for HIPAA violations. Federal consumer protection laws may also apply in some instances to privacy and security practices related to personally identifiable information.
The federal Gramm-Leach-Bliley Act generally places restrictions on the disclosure of non-public information to non-affiliated third parties, and requires financial institutions, including insurers, to provide customers with notice regarding how their non-public personal information is used, including an opportunity to “opt out” of certain disclosures. State departments of insurance and certain federal agencies adopted implementing regulations as required by federal law.
The Cybersecurity Information Sharing Act of 2015 encourages organizations to share cyber threat indicators with the federal government and, among other things, directed HHS to develop a set of voluntary cybersecurity best practices for organizations in the healthcare industry, which were issued in 2018.
In addition, Public Exchanges are required to adhere to privacy and security standards with respect to personally identifiable information and to impose privacy and security standards that are at least as protective as those the Public Exchange has implemented for itself on insurers offering plans through the Public Exchanges and their designated downstream entities, including pharmacy services providers and other business associates. These standards may differ from, and be more stringent than, HIPAA.
Furthermore, states have begun enacting more comprehensive privacy laws and regulations addressing consumer rights to data protection or transparency that may affect our privacy and security practices, such as state laws like the California Privacy Rights Act of 2020 that govern the use, disclosure and protection of member data and impose additional breach notification requirements. The NAIC has proposed revisions to the Privacy of Consumer Financial and Health Information Model Act, which, if implemented, would expand consumer privacy rights and place additional limitations on the use and disclosure of member data. State consumer protection laws may also apply to privacy and security practices related to personally identifiable information, including information related to consumers and care providers. Complying with conflicting cybersecurity regulations and varying enforcement philosophies, which may differ from state to state, requires significant resources and may materially and adversely affect our ability to standardize our products and services across state lines.
Federal regulations have been finalized in the following areas that will continue to materially impact our operations:
•Federal regulations on data interoperability that require claims data to be made available to third parties unaffiliated with us that may not be HIPAA regulated; and
•Federal regulations requiring hospitals and health insurers to publish negotiated prices for services, including the health plan price transparency regulations issued in October 2020 by the U.S. Departments of Health and Human Services, Labor and Treasury (the “Health Plan Transparency Rule”).
Beginning in July 2022, the Health Plan Transparency Rule required us to disclose, on a monthly basis, detailed pricing information regarding negotiated rates for all covered items and services between the plan or issuer and in-network providers and historical payments to, and billed charges from, out-of-network providers. Additionally, beginning in 2023, we were
required to make available to members personalized out-of-pocket cost information and the underlying negotiated rates for 500 covered healthcare items and services, including prescription drugs. Effective January 1, 2024, this ongoing requirement has expanded to include all items and services.
Employee Retirement Income Security Act of 1974
The provision of services to certain employee welfare benefit plans is subject to the Employee Retirement Income Security Act of 1974, as amended (“ERISA”), a complex set of laws and regulations subject to interpretation and enforcement by the Internal Revenue Service and the Department of Labor. ERISA regulates certain aspects of the relationships between us, the employers that maintain employee welfare benefit plans subject to ERISA and participants in such plans. Some of our administrative services and other activities may also be subject to regulation under ERISA. In addition, certain states require licensure or registration of companies providing third-party claims administration services for benefit plans. We provide a variety of products and services to employee welfare benefit plans that are covered by ERISA. Plans subject to ERISA can also be subject to state laws, and the question of whether and to what extent ERISA preempts a state law has been, and will continue to be, interpreted by many courts.
Guaranty Fund Assessments
Under insolvency or guaranty association laws in most states, insurance companies and HMOs can be assessed for amounts paid by guaranty funds for policyholder losses incurred when an insurance company or HMO becomes insolvent. Most state insolvency or guaranty association laws currently provide for assessments based upon the amount of premiums received on insurance underwritten within such state (with a minimum amount payable even if no premium is received). Under many of these guaranty association laws, assessments are made retrospectively. Some states permit insurers or HMOs to recover assessments paid through full or partial premium tax offsets or through future policyholder surcharges. The amount and timing of any future assessments cannot be predicted with certainty; however, future assessments are likely to occur.
International Regulation
We have various international subsidiaries, which provide administrative and other services, that are subject to different, and sometimes more stringent, legal and regulatory requirements that vary widely by jurisdiction. In addition, our non-U.S. operations are subject to U.S. laws regulating the conduct and activities of U.S.-based businesses operating abroad, including but not limited to, the Foreign Corrupt Practices Act and corresponding foreign laws governing anti-bribery, anti-corruption, anti-money laundering, data protection and privacy, employment, and other regulatory oversight initiatives.
Human Capital
The foundation of our strategy starts with our culture, and our associates are critical to fulfilling our purpose of improving the health of humanity. As of December 31, 2024, our employee population, including all full-time, part-time and temporary workers, consisted of approximately 104,200 individuals, 76,300 in the United States and 27,900 internationally. Ninety-nine percent of our total workforce is employed full-time, at least 33 hours a week.
We believe we have built a high-performance culture that enhances our ability to deliver on our commitments and long-term strategy, as well as guides us to address the challenges of today. We believe that our culture allows us to attract and retain talented and experienced individuals to support the communities we serve.
Because dedication to human capital management is a core component of our corporate governance, the Compensation and Talent Committee of our Board of Directors (our “Board”) regularly reviews and discusses management's approach to talent acquisition and retention, and monitors our programs and practices related to workforce inclusion. Additionally, the Governance Committee of our Board has primary responsibility for monitoring our corporate social responsibility and environmental sustainability initiatives and performance. We provide the age, gender and racial and ethnic compositions of our U.S. work force in our annual Impact Report, which includes Equal Employment Opportunity Employer Information Report (EEO-1) data.
Culture, Engagement and Inclusion
Each year we conduct internal associate engagement surveys that provide our associates with an opportunity to share their opinions and experiences with respect to their roles, their teams and the Company, and we also offer online feedback
tools. Our management team reviews, monitors and analyzes associate feedback and acts on responses to identify opportunities to adjust our policies and benefits to improve our associates’ experiences. In addition, in 2024, over 20% of our U.S. workforce participated in our Business Resource Groups, or BRGs, which provide associates meaningful opportunities to connect, collaborate and grow. These voluntary, associate-led communities, which are open to all of our associates, help to foster an environment of inclusivity, respect and collaboration. To further engage and reward our associates, we have an associate recognition program called IMPACT that empowers all associates to recognize their colleagues for their contributions to our Company and to celebrate both personal and professional milestones, whether recognition is for going “above and beyond” or simply to express thanks.
We are dedicated to attracting, developing, maintaining, and supporting an inclusive workforce that fosters a sense of belonging for individuals with a wide range of backgrounds, life experiences and cultures. We believe that these varied experiences enhance our connection with our members, enabling us to serve our members and communities more effectively and driving business impact. Our initiatives in this area are led by our Chief Talent Officer, and our workforce embodies a multitude of dimensions, including skills, experiences, age, tenure, gender, race, ethnicity, physical abilities and geographic location.
Fair Pay
We are committed to a fair pay workplace. We were in the first cohort of companies certified by the Fair Pay Workplace (“FPW”), an independent certification that takes a holistic approach to pay equity, partnering to design an annual pay equity action plan that includes a perpetual review of all positions, new hires and promotions to effect meaningful and measurable change. This independent certification is based on a set of publicly available rules and standards and the endorsed methodology of a group of leading experts from forward-thinking corporations, academia, human resources, data science and the legal field. After partnering with and overseeing our review process examining pay equity for cash compensation, including base and short-term incentives, in December 2024 FPW again validated our analysis of our U.S. associate population, which found that pay for women is 99.2% of men, and pay for people of color is 99.8% of white associates, after taking into account neutral, job related factors.
Talent Development and Retention
Growing, developing and retaining our talent internally is key to our succession plans and our ability to lead at our best every day. To inspire a high-performance culture, promote talent excellence and accelerate growth and innovation, we offer individual, career and leadership development opportunities, encouraging associates to continually learn, grow and expand their skill sets. We offer various instructor-led and virtual instructor-led programs and maintain a vast curriculum of relevant, on-demand learning and development resources. In 2024, we invested a significant amount in human capital development, averaging approximately 27 hours of training and development per associate.
Health, Wellness and Safety
We have the privilege of touching the lives of millions of people each day, starting with the health and safety of our own associates. To improve the health, wellbeing and safety of our associates, we offer a comprehensive compensation package, including competitive salaries, a 401(k) plan and medical, dental, vision and disability coverage. In addition, we offer our associates wellness and behavioral health programs and tools to help them get and stay healthy and more easily manage their work and personal lives. We have a mixed in-office, hybrid and remote workplace strategy, and we foster associate engagement through a variety of activities based in our key office locations.
Information About Our Executive Officers
The following sets forth certain information regarding our executive officers and Chief Accounting Officer as of February 1, 2025.
| | | | | | | | | | | | | | |
| Name | | Age | | Position |
| Gail K. Boudreaux | | 64 | | President and Chief Executive Officer |
| Mark B. Kaye | | 45 | | Executive Vice President and Chief Financial Officer |
| Peter D. Haytaian | | 55 | | Executive Vice President and President, Carelon and CarelonRx |
| Charles M. Kendrick, Jr. | | 59 | | Executive Vice President and President, Commercial Health Benefits |
| Ratnakar V. Lavu | | 54 | | Executive Vice President and Chief Digital and Information Officer |
| Felicia F. Norwood | | 65 | | Executive Vice President and President, Government Health Benefits |
| | | | |
| Ronald W. Penczek | | 60 | | Chief Accounting Officer and Controller |
Ms. Boudreaux has been serving as our President and Chief Executive Officer and as a Director of the Company since November 2017. Prior to joining us, she served as Chief Executive Officer of GKB Global Health, LLC (healthcare consulting firm) from 2015 to November 2017. Prior thereto, Ms. Boudreaux was Executive Vice President of UnitedHealth Group Incorporated (“UHGI”) (diversified healthcare company) from 2008 to 2015. She also served as Chief Executive Officer of UnitedHealthcare (managed healthcare company), a subsidiary of UHGI from 2011 to 2014 and as President of the Commercial Business of UnitedHealthcare from 2008 to 2010. Before joining United Healthcare, she worked at Health Care Service Corporation (“HCSC”) (health insurance company) as Executive Vice President of External Operations from 2005 to 2008 and President of Blue Cross and Blue Shield of Illinois from 2002 to 2005. Before joining HCSC, Ms. Boudreaux held various positions at Aetna, Inc. (“Aetna”) (managed healthcare company), including Senior Vice President, Group Insurance.
Mr. Kaye has been serving as our Executive Vice President and Chief Financial Officer since November 2023, having joined us in September 2023 as our Chief Financial Officer Designate. Prior to joining us, he served as the Executive Vice President and Chief Financial Officer of Moody’s Corporation (“Moody’s”) (credit rating and research company) from April 2021 to September 2023, with responsibility for all global finance activities across the company and as Senior Vice President - Chief Financial Officer from August 2018 to April 2021. Prior to Moody’s, he served as Senior Vice President and Head of Financial Planning and Analysis at Massachusetts Mutual Life Insurance Company (“MassMutual”) (financial services company) from February 2016 until July 2018, and Chief Financial Officer of MassMutual U.S. from July 2015 to February 2016. Prior to that, Mr. Kaye served as Chief Financial Officer and Senior Vice President, Retirement Solutions, at Voya Financial (formerly ING U.S.) (institutional asset manager) from 2011 to 2015. Leading up to that appointment, Mr. Kaye held various senior financial and risk reporting positions at ING U.S. and ING Group. Prior to that, Mr. Kaye worked in the investment banking division of Credit Suisse First Boston.
Mr. Haytaian has been serving as our Executive Vice President and President of Carelon and CarelonRx since October 2021. Prior to his current role, he was Executive Vice President and President of the Commercial & Specialty Business Division beginning in April 2018. From June 2014 until April 2018, Mr. Haytaian held the position of Executive Vice President and President of the Government Business Division. He joined the Company in 2012 through the acquisition of Amerigroup Corporation (“Amerigroup”) and served as President of our Medicaid business from 2013 until 2014. From 2005 to 2013, Mr. Haytaian held various leadership positions with Amerigroup, including Chief Executive Officer of the North Region for its Medicaid business from 2012 until 2013. Mr. Haytaian has extensive experience leading Medicare and Medicaid programs both at Amerigroup and, prior thereto, with Oxford Health Plans, Inc.
Mr. Kendrick has been serving as our Executive Vice President and President of our Commercial Health Benefits since October 2021. From January 2021 until October 2021, Mr. Kendrick served as President of our Commercial Business West Markets (California, Colorado, Indiana, Kentucky, Missouri, Nevada, Ohio and Wisconsin). Mr. Kendrick has been with the Company since 1995, and has held various leadership roles across the organization, including serving as President, Anthem National Accounts/Central Markets from 2015 until January 2021 and President of National Accounts and General Manager for Anthem Blue Cross and Blue Shield of Georgia from 2010 until 2015.
Mr. Lavu has been serving as our Executive Vice President and Chief Digital and Information Officer since February 2024. Prior to joining us, he served as Global Chief Digital Information Officer of Nike, Inc. (“Nike”) (retailer) from July 2019 to February 2023. Prior to Nike, he served as Chief Technology Officer/CIO of Kohl’s Corporation (“Kohls”) (retailer) from March 2016 to June 2019, and he held other various roles at Kohl's beginning in 2011, including Executive Vice President, Digital Technology, and Senior Vice President of Digital Innovation. Prior to Kohl's, Mr. Lavu served as Chief Technology Officer at Redbox Automated Retail, LLC (retailer) from October 2009 to October 2011.
Ms. Norwood has been serving as our Executive Vice President and President of our Government Health Benefits since June 2018. Prior to joining us, she was Director of The Department of Healthcare and Family Services for the State of Illinois from 2015 to June 2018. Prior to that appointment, Ms. Norwood held various leadership roles at Aetna, with her most recent role as President of the Mid-America Region for Aetna from 2010 until 2013.
Mr. Penczek has been serving as our Controller since November 2015 and as our Chief Accounting Officer since December 2015. He served as our Vice President and Corporate Controller from 2013 to 2015. Prior to that appointment, Mr. Penczek served as Vice President and Assistant Controller from 2008 to 2012 and in various other roles in our finance department from 2005 until 2008. Before joining us in 2005, Mr. Penczek was a Staff Vice President with CNA Insurance from 2000 to 2005 and held various positions at PricewaterhouseCoopers LLP from 1992 to 2000, including as a Manager.
Available Information
We are a large accelerated filer (as defined in Rule 12b-2 of the Securities Exchange Act of 1934, as amended (the “Exchange Act”)) and are required, pursuant to Item 101 of Regulation S-K, to provide certain information regarding our website and the availability of certain documents filed with or furnished to the U.S. Securities and Exchange Commission (the “SEC”). The SEC maintains a website that contains reports, proxy and information statements and other information regarding issuers at www.sec.gov. Our website is www.elevancehealth.com. We have included our website address in this Annual Report on Form 10-K as a textual reference only. The information contained on, or accessible through, our website is not incorporated into this Annual Report on Form 10-K or any of our other SEC filings. We make available through our website, free of charge, our Annual Report on Form 10-K, Quarterly Reports on Form 10-Q, Current Reports on Form 8-K, and amendments to those reports filed or furnished pursuant to Section 13(a) or 15(d) of the Exchange Act as soon as reasonably practicable after we electronically file such material with or furnish it to the SEC. We also include on our website our Corporate Governance Guidelines, our Code of Conduct and the charter of each standing committee of our Board of Directors. In addition, we intend to disclose on our website any amendments to, or waivers from, our Code of Conduct that are required to be publicly disclosed pursuant to rules of the SEC and the New York Stock Exchange. Elevance Health, Inc. is an Indiana corporation incorporated on July 17, 2001.
ITEM 1A. RISK FACTORS.
In evaluating our business, the risks described below, as well as the other information contained in this Annual Report on Form 10-K, should be carefully considered. Any one or more of such risks could materially and adversely affect our business, financial condition, results of operations and stock price and could cause our actual results of operations and financial condition to vary materially from past or anticipated future results of operations and financial condition. Additional risks and uncertainties not presently known to us or that we currently believe to be immaterial may also adversely affect us.
BUSINESS RISKS
If we fail to appropriately predict, price for and manage healthcare costs, the profitability of our products and services could decline, which could materially adversely affect our business, cash flows, financial condition and results of operations.
Our profitability depends on accurately predicting and pricing for healthcare costs. Profitability is also dependent on our ability to manage future healthcare costs through medical management, product design, negotiation of favorable provider contracts and underwriting criteria. Total healthcare costs are affected by the type, number and unit cost of individual services rendered. Numerous factors affecting healthcare costs may adversely affect our ability to predict and manage such costs, and may impact our business, cash flows, financial condition and results of operations. These factors include, among others: changes in healthcare practices; healthcare utilization patterns; demographic characteristics including the aging population; previously uninsured members entering the healthcare system; short and long-term risks associated with our members' lifestyle decisions; medical cost inflation; increased labor costs; provider and member fraud; evolution of new technologies, drugs and treatments; increased cost of individual services; increased number and cost of prescription drugs; direct-to-consumer marketing by drug manufacturers; clusters of high cost cases; increased use of services, including resulting from pandemics, large-scale medical emergencies, increasing natural
disasters in connection with climate change, geopolitical instability and other public health crises; and new mandated benefits and treatment guidelines and changes to other regulations impacting our business.
Our estimates of future benefit cost projections involve extensive judgment and are subject to considerable inherent variability. Slight differences between our predicted and actual medical costs or utilization rates as a percentage of premium revenues can result in significant changes in our results of operations. Generally, our premiums on commercial policies and Medicaid contracts are fixed for a 12-month period and are determined based on data from several months prior to the commencement of the premium period. Our revenue from Medicare policies is based on bids submitted to CMS six months prior to the start of the contract year. CMS has explicit gain and loss margin requirements within the bids, as well as contract-specific federal MLR annual requirements. Accordingly, the costs we incur in excess of our benefit cost projections cannot be recovered in the contract year through higher premiums. Existing Medicaid contract rates are often established by the applicable state, and our actual costs may exceed those rates. Many factors, including those discussed above, have caused, and may in the future cause, actual costs to exceed those estimated and reflected in our commercial premiums and Medicare and Medicaid bids.
We participate in the Public Exchange in many of the states where we offer Medicaid health plans. The Public Exchange markets in general are highly volatile and unpredictable from year to year. We develop each state's Public Exchange market premium rates during the spring of each year for policies effective in the following calendar year. Legislation, regulation enforcement activity and judicial decisions that cause the Public Exchange to operate in a manner different than we projected in setting premium rates, including the potential expiration of enhanced PTCs at the end of 2025, could affect our results. In addition, any variation from our cost expectations regarding acuity, enrollment levels, adverse selection, or other assumptions utilized in setting premium rates, could have a material adverse effect on our results of operations, financial position, and cash flows.
Although federal and state premium and risk adjustment mechanisms could help offset health benefit costs above our projections if the assumptions we use to set our premium rates are significantly different than actual results, our results of operations and financial condition could still be adversely affected. The reserves that we establish for health insurance policy benefits and other contractual rights and benefits are based on assumptions concerning a number of factors, including trends in healthcare costs, expenses, general economic conditions and other factors. To the extent the actual claims experience is unfavorable compared to our underlying assumptions, our incurred losses would increase, and future earnings could be adversely affected. Further, if we are unable to provide higher quality outcomes and better experiences through the development and expansion of our value-based care products at lower costs or to integrate our care delivery model, our results of operations, financial position and cash flows may be adversely impacted.
Pharmaceutical products and services are a significant component of our healthcare costs. Evolving regulations and state and federal mandates regarding coverage may impact the ability of our health plans to continue to receive existing price discounts on pharmaceutical products for our members. Other factors affecting our pharmaceutical costs include, but are not limited to, existing prices, geographical variation in utilization of new FDA-approved pharmaceuticals and new FDA-approved indications for existing pharmaceuticals, and changes in discounts.
In addition to the challenge of managing healthcare costs, we face pressure to contain premium rates. Our customers may renegotiate their contracts to seek to contain their costs or may move to a competitor to obtain more favorable premiums. Public Exchange plan selection by our customers is also highly price sensitive. Further, federal and state regulatory agencies may restrict or prevent entirely our ability to implement changes in premium rates. A limitation on our ability to increase or maintain our premium or reimbursement levels or a significant loss of membership resulting from our need to increase or maintain premium or reimbursement levels could adversely affect our business, cash flows, financial condition and results of operations.
A significant reduction in the enrollment in our health benefits programs, pharmacy services or diversified products and services, particularly in states where we have large regional concentrations, could have an adverse effect on our business, cash flows, financial condition and results of operations.
A significant reduction in the number of enrollees in our health benefits programs, pharmacy services, or diversified products and services could adversely affect our business, cash flows, financial condition and results of operations. Factors that have contributed, and may continue to contribute, to a reduction in enrollment include: reductions in workforce by existing customers; a reduction in Medicaid membership due to the end of the temporary suspension of eligibility redetermination for Medicaid recipients in response to the COVID-19 pandemic; a general economic upturn that results in fewer individuals being eligible for Medicaid programs; a general economic downturn that results in business failures and high unemployment rates; employers no longer offering certain healthcare coverage as an employee benefit or electing to offer coverage on a voluntary, employee-funded basis; participation on Public Exchanges; federal and state regulatory changes; failure to obtain new customers or retain existing customers; premium increases and benefit changes; our exit from a specific market; negative publicity and news coverage; and, failure to attain or maintain nationally recognized accreditations.
The states in which we operate with the largest concentrations of revenues include California, Virginia, New York, Ohio, Indiana, Florida, Texas and Georgia. Due to this concentration of business in these states, we are exposed to potential losses resulting from the risk of state-specific or regional economic downturns or healthcare coverage changes impacting these states. If any such negative economic conditions do not improve, we may experience a reduction in existing and new business, which could have a material adverse effect on our business, cash flows, financial condition and results of operations.
A cyber-attack or other privacy or data security incident sustained by us or third parties we rely on could result in an unauthorized disclosure of sensitive or confidential information, cause a loss of data, disrupt our operations, give rise to remediation or other expenses, expose us to liability under our contracts, federal, state and international laws, and subject us to litigation and investigations, which could have an adverse effect on our business, reputation, cash flows, financial condition and results of operations.
As part of our normal operations, we collect, store, process, retain and analyze certain sensitive and confidential information, including personal information subject to privacy, security and data breach notification requirements. Some of the data we process, store and transmit is outside of the U.S. due to the structure of our information technology systems and our internal business operations. We are subject to a variety of continuously evolving federal, state and international laws and rules regarding collection, dissemination, receipt, maintenance, protection, use, transmission, disclosure, privacy, confidentiality, security, availability, integrity, creation, processing and disposal of sensitive or confidential information that, depending on the specific business and intended data use, include without limitation, HIPAA's privacy and security rules, HIPAA's HITECH rule, the Gramm-Leach-Bliley Act, the General Data Protection Regulation and numerous state laws governing personal information, including the California Consumer Privacy Act, as amended by the California Privacy Rights Act. Regulators are also imposing new and greater monetary fines or penalties for privacy violations, and jurisdictions where we operate have passed, and continue to propose, data privacy legislation and/or regulations related to Artificial Intelligence (“AI”). We have programs in place to detect, contain and respond to data, privacy and security incidents and provide employee awareness training regarding phishing, malware, and other risks to protect against privacy and cybersecurity incidents. Our facilities and systems, and those of our third-party service providers, including our business associates, are regularly the target of, and may be vulnerable to, cyber-attacks, security breaches, acts of vandalism, computer viruses, misplaced or lost data, programming and/or human errors, negligent or wrongful conduct by associates or others with permitted access to our systems and information, or other threats or catastrophic events. Additionally, there have been, and may in the future be, heightened vulnerabilities due to our remote or varied geographical workforce operations.
We cannot ensure that we or our third-party service providers will be able to identify, prevent or contain the effects of cyber-attacks or other cybersecurity risks that bypass our or their security measures or disrupt our or their information technology systems or business. Hardware, software or applications we develop or procure from third parties may contain defects in design, manufacturer defects or other problems that could unexpectedly compromise information security. In addition, because the techniques used to obtain unauthorized access, disable, disrupt or degrade service or sabotage systems change frequently, are becoming increasingly sophisticated (in part due to the use of evolving technologies), and may not immediately produce signs of intrusion, we may be unable to anticipate these techniques and threats, timely discover or counter them or implement adequate preventative measures. Viruses, worms, malicious software programs or other unauthorized methods of acquiring data may be used to attack our systems or otherwise exploit any security vulnerabilities which may cause system disruptions or shutdowns, or may cause personal, proprietary or confidential information to be disclosed, misappropriated or compromised. We have business continuation and resiliency plans which are maintained, updated and tested regularly in an effort to successfully contain and remediate potential disruptions or cyber events, but there is no guarantee that such efforts will be effective. If those efforts are not effective, the functionality of our information technology systems or those of third parties could be interrupted. Cybersecurity and the continued development and enhancement of our controls, processes and practices designed to protect our systems, computers, software, data and networks from attack, damage and unauthorized access remain a priority for us.
We have been, and may in the future be, subject to litigation and governmental investigations related to cyber-attacks, privacy incidents and security breaches. Any such future litigation or governmental investigation could divert the attention of management from the operation of our business, result in reputational damage and have a material adverse impact on our business, cash flows, financial condition, and results of operations. Moreover, our programs to detect, contain, and respond to data security incidents as well as contingency plans and insurance coverage for potential liabilities of this nature may not be sufficient to cover all claims and liabilities.
Noncompliance with any privacy, security or data protection laws and regulations, or any security breach, cyber-attack or cybersecurity breach, and any incident involving the misappropriation, exfiltration, theft, loss or other unauthorized disclosure or use of, or access to, sensitive or confidential information, whether by us or by one of our third-party service providers or their vendors, previously have and could in the future require us to expend significant resources to continue to modify or enhance our protective measures and to remediate any damage. In addition, this could negatively affect our operations, cause system disruptions, damage our reputation, cause membership losses and contract breaches, expose us or our members to the risk of financial or medical
identity theft, and result in regulatory enforcement actions, material fines and penalties, litigation or other actions that could have a material adverse effect on our business, cash flows, financial condition and results of operations.
If we fail to responsibly use and protect data, or if such data is found to be inaccurate or unreliable, our business and customers could suffer adverse consequences.
We use de-identified and aggregated data to create analytic models designed to predict, and potentially improve, outcomes and patient care. The collection, maintenance, protection, use, transmission, disclosure and disposal of sensitive personal information is regulated at the federal, state, international and industry levels and requirements are also imposed on us and vendors through contracts with clients. We are also subject to various other consumer protection laws that regulate our communications with customers. Certain of our businesses are also subject to the Payment Card Industry Data Security Standard, which is designed to protect credit card account data as mandated by payment card industry entities. In addition, more jurisdictions are regulating the collection, use and transfer of data across borders. These laws, rules, regulations and contractual requirements are subject to change, and the regulatory environment surrounding data protection and privacy is becoming more onerous. Compliance with existing or new privacy, security, technology or data protection laws, regulations and requirements may result in increased enforcement and costs, and may constrain or require us to alter our business model or operations.
Further, if the data we rely upon to run our businesses is found to be inaccurate or unreliable or if we fail to maintain or protect our information systems and data integrity effectively, we could experience failures in our technology products; lose existing customers; have difficulty attracting new customers; experience problems in determining medical cost estimates and establishing appropriate pricing; have difficulty preventing, detecting and controlling fraud; have disputes with customers, physicians and other healthcare professionals; become subject to regulatory sanctions, penalties, investigations or audits; incur increases in operating expenses; or suffer other adverse consequences.
There are various risks and conditions associated with participating in Medicare and Medicaid programs, including payment rates, processes and timelines that are determined by the government, compliance with government contract requirements and regulatory oversight.
We contract with various federal and state agencies, including CMS, to provide managed health benefits services, such as Medicare Advantage, Medicare Part D, Medicare Supplement, Medicaid, TANF, SPD, LTSS, CHIP, Medicaid expansion programs and various specialty programs, products and services. We also provide various administrative services for other entities offering medical and/or prescription drug plans to their Medicaid or Medicare eligible members, and we offer employer group waiver plans which provide medical and/or prescription drug coverage to retirees. We also participate in programs in several states for the care of dual-eligible members. Changes in existing laws or regulations applicable to these programs, or their interpretations, are difficult to predict and could have a material adverse effect on our business, cash flows, financial condition and results of operations.
Revenues from the Medicare and Medicaid programs are determined, in whole or in part, by the federal government and/or applicable state governments, and base premium rates paid by each state or federal agency differ depending upon a combination of factors such as defined upper payment limits, a member’s health status, age, gender, county or region, benefit mix, member eligibility category and risk scores. Rates may be affected by federal and state budgetary constraints. Certain state contracts are subject to cancellation in the event of the unavailability of state funds. Additionally, ongoing CMS changes to the calculation of risk in the Medicare Advantage program may impact our revenue. For example, CMS made significant changes to the structure of the hierarchical condition category model in version 28, which may impact risk adjustment factor (“RAF”) scores for a larger percentage of Medicare Advantage beneficiaries and could result in changes to beneficiary RAF scores with or without a change in the patient’s health status. The federal government or any state in which we operate could decrease rates paid to us, pay us less than the amount necessary to keep pace with our cost trends, cancel our contracts retroactively or seek an adjustment to previously negotiated rates. In addition, various states’ Medicare-Medicaid dual-eligible plans are still subject to uncertainty surrounding payment rates and other requirements, which could affect where we seek to participate in these programs. For example, CMS will require in future years that health plans offering certain dual-eligible products must also align with integrated Medicaid products in the same service area. Some states are also requiring companies to offer Medicaid within a state and are conducting competitive bid processes to qualify to offer dual-eligible products. An unexpected reduction in payments, inadequate government funding or significantly delayed payments for these programs may adversely affect our business, cash flows, financial condition and results of operations.
Other potential risks associated with Medicare Advantage and Medicare Part D plans include increased medical or pharmaceutical costs, data corrections identified as a result of ongoing auditing and monitoring activities, potential uncollectability of receivables resulting from processing and/or verifying enrollment, inadequacy of underwriting assumptions, inability to receive and process correct information (including inability due to systems issues by the federal government, the applicable state government or us), uncollectability of premiums from members and limited enrollment periods. Actual results may be materially
different than our assumptions and estimates and could have a material adverse effect on our business, financial condition and results of operations.
Our contracts with CMS and state governmental agencies contain certain provisions regarding data submission, risk adjustment, provider network and directory maintenance, quality measures, claims payment, timely and accurate processing of appeals and grievances, oversight of service providers, encounter data, continuity of care, call center performance and other requirements specific to federal and state program regulations. We have been subject in the past, and may again be in the future, to administrative actions, fines, penalties, liquidated damages or retrospective adjustments in payments made to our health plans as a result of a failure to comply with these requirements, which has impacted, and in the future could impact, our profitability. We have experienced retroactive rate adjustments by certain state Medicaid agencies in the past, and such rate adjustments may occur in the future. Further, our state Medicaid contracts have not always been renewed, we have not always been awarded new contracts as a result of the competitive procurement process, and in some cases, we have lost members under existing contracts as a result of a post-award challenge by unsuccessful bidders, each of which could take place in the future and have a material adverse effect on our business, cash flows, financial condition and results of operations.
The Star Rating System utilized by CMS to evaluate Medicare Advantage Plans may have a significant effect on our revenue, as higher-rated plans tend to experience increased enrollment, plans with a Star Rating of 4.0 or higher are eligible for quality-based bonus payments and plans with a Star Rating of 5.0 can market to and enroll members year-round. CMS continues to change its rating system to make achieving and maintaining a 4.0 or higher Star Rating more difficult. CMS released our 2025 Star Ratings in October 2024, which will be used to determine our Medicare Advantage plans' quality bonus payments in 2026. Based on our membership at September 1, 2024, 38% of our Medicare Advantage members were in plans with 2025 Star Ratings of at least 4.0 Stars, compared to 53% of our Medicare Advantage members being in plans with 2024 Star Ratings of at least 4.0 Stars (based on our 2024 Star Ratings, as recalculated by CMS). This change in our 2025 Star Ratings is expected to negatively impact our Medicare quality bonus payments, plan level rebates and operating revenue beginning in 2026, and our enrollment may be negatively impacted as consumers seek higher rated plans. Further, if we do not improve our Star Ratings, or if quality-based bonus payments are reduced or eliminated, we will experience further negative impact on our revenues and the benefits that our plans can offer, which could materially and adversely affect the marketability of our plans, our ability to expand our business, our membership levels, results of operations, financial condition and cash flows. Similarly, if we fail to meet or exceed any performance standards imposed by state Medicaid programs in which we participate, we may not receive performance-based bonus payments or may incur penalties.
In addition, our failure to comply with federal and state healthcare laws and regulations applicable to our participation in Medicaid and Medicare programs, including those directed at preventing fraud, abuse and discrimination, could result in investigations, litigation, fines, restrictions on, or exclusions from, program participation, or the imposition of corporate integrity agreements or other agreements with a federal or state governmental agency, any of which could adversely impact our business, cash flows, financial condition and results of operations.
We are periodically subject to government audits, including CMS RADV audits of our Medicare Advantage Plans to validate diagnostic data, patient claims and financial reporting, and audits of our Medicare Part D plans by the Medicare Part D Recovery Audit Contractor (“RAC”), as well as state Medicaid RAC programs. Certain of our contracts currently have pending RADV audits by CMS and the HHS Office of Inspector General that are awaiting CMS finalization. In addition, we routinely perform ordinary course reviews of, among other things, our Medicare Advantage data submitted to CMS. These governmental audits, or changes in how these audits are conducted, including changes that may result from the final RADV Audit rule that was issued in 2023, and our internal reviews, have, and could in the future, result in reports or disclosures for prior, current or future filing years to federal or state regulatory agencies, submission of data corrections, and/or significant adjustments in payments made to our health plans and future Medicare Advantage bids, which could adversely affect our financial condition and results of operations. Governmental regulators and agencies continue to heighten their scrutiny of business and reporting practices within the health services industry with respect to risk adjustment and claims payment. Additionally, state regulators are increasingly conducting audits to assess the quality of services we provide to our Medicare members. If we fail to report and correct errors discovered through our own auditing procedures, during a RADV or RAC audit or during state regulatory audits, or otherwise fail to comply with applicable laws and regulations, we could be subject to fines, civil penalties or other sanctions, which could have a material adverse effect on our ability to participate in these programs, and on our financial condition, cash flows and results of operations. In addition, price transparency initiatives, such as the Health Plan Transparency Rule, may impact our ability to obtain or maintain favorable contract terms. For example, hospitals are required to publish online payer-specific negotiated charges for each item or service the hospital provides.
Our Medicare and Medicaid contracts are also subject to various MLR rules, including minimum MLR thresholds, rebate requirements and audits, which could adversely affect our membership and revenues if any of our state Medicare or Medicaid plans do not meet an applicable minimum MLR threshold. If a Medicare Advantage, MMP or Medicare Part D contract pays minimum
MLR rebates for three consecutive years, it will become ineligible to enroll new members. If a Medicare Advantage or Medicare Part D contract pays such rebates for five consecutive years, it will be terminated by CMS.
A change in our healthcare product mix may impact our profitability.
Our healthcare products that involve greater potential risk generally tend to be more profitable than administrative services products and those healthcare products where the employer groups assume the underwriting risks. Individuals and small employer groups are more likely to purchase our higher-risk healthcare products because such purchasers are generally unable or unwilling to bear greater liability for healthcare expenditures. Typically, government-sponsored programs also involve our higher-risk healthcare products. A shift of enrollees from more profitable products to less profitable products could have a material adverse effect on our cash flows, financial condition and results of operations.
If we fail to develop and maintain satisfactory relationships with hospitals, physicians, pharmacy service providers and other healthcare providers, our business, cash flows, financial condition and results of operations may be adversely affected.
Our profitability is dependent in part upon our ability to contract on favorable terms with hospitals, physicians, pharmacy services providers and supply chain partners and other healthcare providers. These partners may elect not to contract with us, and the failure to secure or maintain cost-effective contracts on competitive terms may result in a loss of membership or higher medical costs, which could adversely affect our business. In addition, consolidation among healthcare providers, Accountable Care Organizations practice management companies, and other organizational structures that physicians, hospitals and other care providers choose, as well as the ability of larger employers to contract directly with providers, has changed and may continue to change the way that these providers interact with us and may alter the competitive landscape overall. Such organizations or groups of physicians may compete directly with us or be owned by one of our competitors, which may impact our relationship with these providers or affect the way that we price our products and estimate our costs. Such competition may require us to incur costs to change our operations, which could adversely affect our business, cash flows, financial condition, and results of operations.
Our inability to contract with providers, providers attempting to use their market position to negotiate more favorable contracts or place us at a competitive disadvantage, the departure of prominent network providers or provider groups to competitors, or the inability of providers to provide adequate care could adversely affect our business. In addition, we do not have contracts with all providers that render services to our members and, as a result, may not have a pre-established agreement about the amount of compensation those out-of-network providers will accept for the services they render. State and federal laws, such as the No Surprises Act, define the compensation that must be paid to out-of-network providers in certain scenarios, and related litigation has lessened the weight of the Qualifying Payment Amount during independent dispute resolution processes, which may result in an increase in rates we must pay to out-of-network providers. Both our lack of contracts with certain providers and the development of new federal and state laws could result in significant litigation or arbitration proceedings, to the extent a provider attempts to obtain payment from our members for the difference between the amount we have paid and the amount they have charged, or other increases in rates paid to out-of-network providers.
We are dependent on the success of our relationships with third parties for various services and functions.
We contract with various third parties to perform certain functions and services and provide us with certain information technology systems. Certain of these third parties provide us with significant portions of our business infrastructure and operating requirements. For example, a single vendor can provide to us a wide range of technology infrastructure services, such as end user (help desk and field support), data center, mainframe, payment card handling, storage and database services and multi-cloud management services, and we are subject to the risks of any operational failure, termination or other restraints in such an arrangement. We could become overly dependent on key vendors, which could cause us to lose core competencies. A termination of our agreements with, or disruption in the performance of, one or more of these service providers could result in service disruptions or unavailability, reduced service quality and effectiveness, increased or duplicative costs or an inability to meet our obligations to our customers. In addition, we may also have to seek alternative service providers, which may be unavailable or only available on less favorable contract terms or with more difficult integration hurdles. Any of these outcomes could adversely affect our business, reputation, cash flows, financial condition and operating results.
Our pharmacy services business would be adversely affected if we are unable to contract on favorable terms with third-party vendors, including pharmaceutical manufacturers. We delegate certain pharmacy benefit manager services, including, but not limited to, claims adjudication, pharmacy network administration, rebate administration, advanced home delivery back-end dispensing, and customer service, to CVS pursuant to the CVS Agreement. If CVS fails to provide pharmacy benefit manager services as contractually required, we may not be able to meet the full demands of our customers, which could have a material adverse effect on our business, reputation and results of operations. Additionally, we may not maintain favorable terms and conditions, including financial terms, to compete in the market. For additional information on the CVS Agreement, see “Business - Product and Service Descriptions,” in Part I, Item 1 of this Annual Report on Form 10-K.
The failure to properly maintain the integrity or availability of our data, or to successfully maintain, protect and upgrade our information systems could adversely affect our business.
Our business depends significantly on effective information systems, and we have many different information systems for our various businesses, including those that we have acquired as a result of our merger and acquisition activities. Our information systems require an ongoing investment, commitment of significant resources to maintain, integrate, upgrade, enhance and expand existing systems, and development of new systems to keep pace with continuing changes in information processing technology, emerging cybersecurity risks, changing customer preferences, evolving industry and regulatory standards and legal requirements, including as a result of the ACA, the Health Plan Transparency Rule, the 2021 Appropriations Act and federal data interoperability regulations. In addition, we may obtain significant portions of our systems-related or other services from independent third parties (and their vendors), which may make our operations vulnerable if such third parties fail to perform and oversee adequately. Further, unauthorized third parties present additional risk, including by propagating misinformation related to products, business and the health industry.
Failure to adequately implement, consolidate, integrate, streamline, maintain and upgrade effective and efficient information systems, including those powered by or incorporating AI, with sufficiently advanced technological capabilities could result in investigations, audits, fines and penalties, competitive and cost disadvantages to us compared to our competitors, contractual damages, and diversion of management’s time, and could have a material adverse effect on our business, financial condition and results of operations. Failure or disruption of our performance of, or our ability to perform, key business functions, including as a result of the unavailability or cyber-attack of our information technology systems or those of third parties (including cloud service providers), could decrease response times, lower levels of service satisfaction and harm our reputation and brand. Our systems interface with and depend on third-party systems, hardware, infrastructure and cloud technologies, and we could experience service denials if demand for such service exceeds capacity, or these systems fail or experience interruption. From time to time, we update, transition, acquire, or expand use of our and third-party information technology systems, which may result in heightened vulnerability. Some third-party systems that are necessary for the operation of our business processes are maintained outside of our control but would impact our business operations if compromised as a result of a cyber-attack. Despite our adoption and continued enhancement of business continuity and disaster recovery strategies, there is no guarantee that such efforts will be effective, which could interrupt the functionality of our information technology systems or those of third parties. Our failure to implement adequate business continuity and disaster recovery strategies could significantly reduce our ability to provide products and services to our customers and members, which could have a material adverse effect on our business and results of operations.
In addition, connectivity amongst technologies is becoming increasingly important, with recent trends bringing greater consumer engagement in healthcare; therefore, the pace at which our customers will need enhanced technologies with sophisticated applications for mobile interfaces, including tools and products that leverage AI to improve the customer experience, will quicken. We anticipate that fast-evolving AI technologies will play an increasingly significant role in our information systems and technology products. If the information systems we rely upon to run our business were found to be inaccurate or unreliable or if we fail to adequately maintain, upgrade, enhance, expand and protect our information systems, security controls and data integrity effectively, we could experience problems in determining medical cost estimates and establishing appropriate pricing and reserves, have disputes with customers and providers, lengthen the pace of integration activities or otherwise delay the launch of acquired products, face regulatory problems, including sanctions and penalties, incur increases in operating expenses or suffer other adverse consequences, including a decrease in membership.
We are subject to risks associated with our use of AI, which could adversely affect our business, reputation or financial results.
As part of our operations, we are making investments in certain AI administrative tools and solutions to enhance our operations and positively impact the experience of our members, and we continue to explore further innovation using AI. The rapid advancement of these technologies presents opportunities for us, but there are risks associated with the development and deployment of AI, and there can be no assurance that our usage of AI will enhance our operations. We have developed and implemented policies and procedures intended to promote and sustain responsible design, development, and use of AI. Our AI-related efforts may give rise to risks related to accuracy, harmful bias, discrimination, intellectual property infringement, data privacy, and cybersecurity, among others. In addition, we may be subject to new or enhanced governmental or regulatory scrutiny, litigation or other liability and ethical concerns, and negative consumer perceptions as to the use of automation and AI, or other complications that could adversely affect our business, reputation, or financial results. Any inadequacy in or failure to comply with our responsible use of AI policies and procedures or emerging laws, regulations and standards governing AI use could cause our technology not to operate as intended or to produce outcomes that could have a material and adverse effect on our business, reputation, results of operations, financial position and cash flows.
We are subject to risks associated with pandemics, like the COVID-19 pandemic, as well as other extreme events, large-scale medical emergencies and public health crises, which could have a material adverse effect on our business, results of operations, and financial condition and financial performance.
A pandemic or other large-scale medical emergency or public health crisis, such as the COVID-19 pandemic, referred to collectively as “public health crises,” may cause illness, death, quarantines, business and school shutdowns, reductions in business activity, travel and financial transactions, unemployment, inflation, labor shortages, supply chain interruptions, disruptions in public and private infrastructure and overall economic and financial market instability. The following are some risks that we could experience as a result of future public health crises, all of which could increase our costs, impair our ability to provide services, and have a material adverse effect on our business, cash flows, financial condition and results of operations:
•Increased healthcare costs due to higher utilization rates of medical facilities and services and behavioral health services, increased labor costs resulting from labor shortages and increases in medical expenses and associated hospital and pharmaceutical costs, including testing, treatment and the administration of vaccines and other therapeutics and costs due to care deferred during the public health crisis, which may lead to additional care resulting from missed treatments.
•Increased estimation uncertainty for our claims liability, as well as decreased predictability of Medicare and Medicaid rates due to changes in utilization of medical facilities and services, medical expenses and other costs.
•A reduction in enrollment in our health benefits, pharmacy services, or other healthcare services and products or a change in membership mix to less profitable lines of business by existing customers due to reductions in workforce and other impacts of an economic downturn.
•Cash flow volatility or shortfalls caused by delayed, delinquent or non-collectable payments.
If any future public health crisis occurs and continues for a prolonged period, these risks could be exacerbated and cause further impact to our business and operations. Additionally, other extreme events such as natural disasters, war, terrorism, increased crime, civil unrest and sanctions could create public health crises, operations disruptions or otherwise have a material adverse effect on our business, cash flows, financial condition and results of operations. In the event of a public health crisis, we may need to make temporary policy changes, such as waiving various medical requirements, assisting with replacement medications, transferring prescriptions and expanding our help line. Natural disasters or extreme weather events, such as wildfires, floods, hurricanes, tropical storms, and snow and ice storms, have impacted, and may in the future impact, our customers, associates, facilities and third-party vendors located in the affected area. Furthermore, climate change could result in certain types of natural disasters occurring more frequently or with more intense effects, which could have a long-term impact on general economic conditions and the health benefits and pharmacy services industries in particular.
LEGAL, REGULATORY AND PUBLIC POLICY RISKS
We are subject to significant government regulation, and changes or proposed changes in the regulation of our business by federal and state regulators may adversely affect our business, cash flows, financial condition and results of operations and the market price of our securities.
We are subject to significant state and federal regulation associated with many aspects of our business, including, but not limited to, licensing, premiums, marketing activities, provider contracting, access and payment standards, and corporate governance and financial reporting matters, as described in greater detail in Part I, Item 1, “Business - Regulation” in this Annual Report on Form 10-K. Further, the integration into our business of entities that we acquire, or our expansion into new businesses or jurisdictions, may increase our regulatory risk and affect the way in which existing laws and rules apply to us.
Frequent and sometimes unpredictable changes to existing laws, rules and regulations or judicial interpretation, application or enforcement thereof, or development of new laws, rules, regulatory interpretations or judgments could force us to change how we conduct our business, affect the products and services we offer (and where we offer them), restrict revenue and enrollment growth, increase our costs, including operating, healthcare technology and administrative costs, restrict our ability to obtain new product approvals and implement changes in premium rates, and require enhancements to our compliance infrastructure and internal controls environment, which could adversely impact our business and results of operations. In addition, legislative and/or regulatory policies or proposals that seek to manage the healthcare industry or otherwise impact our business may cause the market price of our securities to decrease, even if such policies or proposals never become effective. In particular, further regulations and modifications to the ACA and laws and regulations stemming from the ACA could impact the market for our products, funding for ACA programs, the regulations applicable to us and the fees and taxes payable by us and otherwise affect our business and future operations, some of which may adversely affect our financial condition and results of operations.
We are required to obtain and maintain insurance, licenses and other regulatory approvals to market certain of our products and services, to increase prices for certain regulated products and services and to consummate some of our acquisitions and dispositions.
Delays in obtaining or failure to obtain or maintain these approvals, as well as future regulatory action by state or federal authorities, could have a material adverse effect on the profitability or marketability of our health benefits, pharmacy services, healthcare and other products and services or on our business, financial condition, and results of operations. In addition, changes in government regulations, policies or funding that apply to government-sponsored programs such as Medicare and Medicaid including, among other things, reimbursement levels, quality-based bonus payment determinations, eligibility and redetermination requirements, benefit coverage requirements and additional governmental participation, have adversely affected, and could in the future adversely affect, our business, cash flows, financial condition, and results of operations. Although Medicaid eligibility redeterminations following COVID-19 suspensions slowed throughout 2024, CMS has provided that states have until December 31, 2025, to complete these eligibility redeterminations.
We have experienced past assessments under state or federal insolvency or guaranty association laws applicable to insurance companies, HMOs and other payers, and may experience assessments in the future if, for example, premiums established by other companies for their health insurance products, including certain long-term care products, are inadequate to cover their costs. Any such assessment could expose us to the risk of paying a portion of an impaired or insolvent insurance company’s claims through state guaranty associations. We are not currently able to estimate our potential financial obligations, losses or the availability of offsets associated with potential guaranty association assessments; however, any significant increase in guaranty association assessments could have a material adverse effect on our business, cash flows, financial condition, and results of operations.
We expect state legislatures will continue to focus on healthcare delivery and financing issues, including actions to reduce or limit increases to premium payments, provider billing protections, access to care and other reforms of state health insurance markets. State ballot initiatives could also be put to voters that could materially impact our operating environment. If enacted into law, these state proposals and actions could have a material adverse impact on our business, cash flows, operations or financial condition. Additionally, state legislative actions and litigation could impact ERISA pre-emption. Further, in the past, Congress has considered, and may consider in the future, various forms of managed care reform legislation which, if adopted, could fundamentally alter the treatment of coverage decisions under ERISA, including limiting ERISA’s preemptive effect on state laws, and other laws and could increase our costs, expose us to expanded liability, permit greater state regulation on our operations, or require us to revise the ways in which we conduct business.
We are subject to various risks associated with our international operations.
As we expand and operate our business outside of the U.S., we are presented with different challenges, including challenges in adapting to new markets, languages, business, labor and cultural practices, regulatory environments and local civil unrest or political controversy. Adapting to these challenges could require us to devote significant senior management attention and other resources. If we are unable to successfully manage our international operations, our business, cash flows, financial condition and results of operations could be adversely affected. In the future, we may acquire or operate new businesses outside of the U.S., increasing our exposure to these risks.
Certain of our subsidiaries operate internationally and are subject to regulation in the jurisdictions in which they are organized or conduct business related to, among other things, local and cross border taxation, intellectual property, investment, currency rate differentials, management control, labor, anti-fraud, anti-corruption and privacy and data protection, which vary by jurisdiction. In addition, we are subject to U.S. laws that regulate the conduct and activities of U.S.-based businesses operating abroad, such as the Foreign Corrupt Practices Act. Violations of these laws and regulations could result in fines, criminal sanctions against us, our officers or associates, restrictions or outright prohibitions on the conduct of our business and significant reputational harm and could adversely affect our ability to market our products and services, which may have a material adverse effect on our business, financial condition and results of operations.
We face risks related to litigation.
We are, and may in the future be, a party to a variety of private party and governmental legal actions and investigations that may affect our business, such as administrative charges before government agencies, employment and employment discrimination-related suits, employee benefit claims, breach of contract actions, tort claims, intellectual property-related litigation and settlements. In addition, because of the nature of our business, we are subject to a variety of legal actions relating to our business operations, including the design, administration and offering of our products and services. These could include claims relating to the denial or limitation of health benefits; federal and state false claims act laws; dispensing of drugs associated with our pharmacy services business; professional liability claims arising out of the delivery of healthcare and related services to the public; development or application of medical policies and coverage and clinical guidelines; medical malpractice actions; allegations of anti-competitive and unfair business activities; provider disputes over reimbursement and contracts; provider tiering programs; narrow networks; termination of provider contracts; the recovery of overpayments from providers; fee-based business; disputes over co-payment calculations; reimbursement of out-of-network claims; the failure to disclose certain business practices; the failure to comply with various state or federal laws, including but not limited to: ERISA and the Mental Health Parity Act; the calculation of minimum
MLR and rebates related thereto; claims related to privacy, intellectual property and vendor disputes; claims related to our use of personal information and other proprietary data; and, customer audits and contract performance, including government contracts. These actions or proceedings could result in substantial costs to us, require management to spend substantial time focused on litigation, result in negative media attention, and may adversely affect our business, reputation, financial condition, results of operations and cash flows.
We are also involved in, or may in the future be party to, pending or threatened litigation incidental to the business we transact or arising out of our operations, including, but not limited to, breaches of security and violations of privacy requirements, shareholder actions, compliance with federal and state laws and regulations (including qui tam or “whistleblower” actions), or sales and acquisitions of businesses or assets. From time to time, we are involved as a party in various governmental inquiries, investigations, audits, reviews and administrative proceedings, including challenges relating to the award of government contracts. These investigations, audits and reviews include routine and special investigations by state insurance departments, various federal regulators including CMS and the HHS Office of Inspector General, state attorneys general, the Department of Justice, and various offices of the U.S. Attorney General. Following an investigation, we may be subject to civil or criminal fines, penalties, and other sanctions if we are determined to be in violation of applicable laws or regulations. Liabilities that may result from these actions could have a material adverse effect on our cash flows, results of operations and financial condition.
Recent court decisions and legislative activity may increase our exposure for any of these types of claims. In some cases, substantial non-economic (including injunctive relief), treble or punitive damages may be sought. Our international footprint also subjects us to additional potential disputes or differing interpretations related to contractual rights, tax positions, and regulatory oversight. Some liabilities and damages may not be covered by the insurance we carry, insurers may dispute coverage, or the amount of insurance may not be enough to cover the damages awarded. In addition, insurance coverage for all or certain forms of liability may become unavailable or prohibitively expensive in the future. Any adverse judgment against us resulting in such damage awards could result in negative publicity and have an adverse effect on our cash flows, results of operations and financial condition.
There are various risks associated with providing health benefits and other healthcare diversified products and services.
We continue to evolve our business to offer products and services beyond traditional health insurance, including digital health technology, pharmacy services, home health, and behavioral and clinical care services, which subjects us to litigation and regulatory risks that are different from our traditional product and services offerings and may materially affect our exposure to other risks.
The direct provision of healthcare services by certain of our subsidiaries involves risks of additional litigation brought against us or our associates for alleged malpractice or professional liability claims arising out of the delivery of healthcare and related services. In addition, liability may arise from maintaining healthcare premises that serve the public. Behavioral health services may also raise the risk profile of our business given the critical and sensitive nature of the services provided. In addition, we are, to a certain extent, self-insured with regard to litigation risks, including claims of medical malpractice against our affiliated physicians and us, and it is possible that the level of actual losses will significantly exceed the liabilities recorded for our estimates of the probable costs resulting from self-insured matters. The defense of any actions may result in significant expenses, and if we fail to maintain adequate insurance coverage for these liabilities, or if such insurance is not available, the resulting costs could adversely affect our business, cash flows, financial condition and results of operations. As we become more involved in direct care delivery and the provision of other services, such as crisis management services, there will be an increased possibility of litigation.
Additionally, many states in which certain of our subsidiaries operate limit the practice of medicine to licensed individuals or professional organizations comprised of licensed individuals. Business corporations generally may not exercise control over the medical decisions of physicians, and we are not licensed to practice medicine. Rules and regulations relating to the practice of medicine, fee-splitting between physicians and referral sources, and similar issues vary from state to state, and any enforcement actions by governmental officials alleging non-compliance with these rules and regulations could adversely affect our business, cash flows, financial condition and results of operations. Further, in certain states we are required to use professional corporations that are not affiliates, which exposes us to risk in the event the physician owners of those professional corporations take actions that are in breach of the contractual obligations that exist between us.
We rely on agreements with customers, confidentiality agreements with associates and third parties, and our trademarks, trade secrets, copyrights and patents to protect our proprietary rights. These legal protections and precautions may not prevent misappropriation of our proprietary information. Litigation and misappropriation of our proprietary information could hinder our ability to market and sell products and services, which could materially and adversely affect our results of operations, financial position and cash flows. Further, certain of our businesses use, develop or sell software products that may contain unexpected design defects or may encounter unexpected complications during integration or when used with other technologies utilized by the customer. A failure of these products to operate as intended and in a seamless fashion with other products could also materially and adversely affect our results of operations, financial position and cash flows.
Our pharmacy services business and pharmacy related operations are subject to risks and uncertainties that are in addition to those we face in our core healthcare business.
We provide pharmacy services and are responsible to regulators, our members and customers for the delivery of those pharmacy services that we contract to provide. Our pharmacy services business is subject to the risks inherent in the dispensing, packaging, fulfillment and distribution of pharmaceuticals and other healthcare products, including exposure to liabilities and reputational harm related to clinical quality, patient safety, infusion center operations, and other risks inherent in the dispensing, packaging and distribution of drugs, and other operational errors by us or our pharmacy services suppliers. Any failure by us or one of our pharmacy services suppliers to adhere to the laws and regulations applicable to the dispensing of pharmaceuticals could subject our pharmacy services business to civil and criminal penalties.
Our pharmacy services business is subject to federal and state laws and regulations that govern its relationships with pharmaceutical manufacturers, physicians, pharmacies and customers, including without limitation, federal and state anti-kickback laws, beneficiary inducement laws, consumer protection laws, ERISA, HIPAA and laws related to the operation of mail-service pharmacies, as well as an increasing number of licensure, registration and other laws and accreditation standards that impact the business practices of a pharmacy services business. In addition, the pharmacy services business, which conducts business through home delivery, infusion and specialty pharmacies, is subject to federal and state laws and regulations, including those of state boards of pharmacy, individual state-controlled substance authorities, the U.S. Drug Enforcement Agency and the U.S. Food and Drug Administration. Growth of our home delivery, specialty pharmacy and infusion services businesses subjects us to an increase in licensure requirements, and to regulatory and operational risks as our pharmacy services business becomes more vertically integrated. Also, we and our third-party vendors may be subject to certain registration requirements and state and federal laws related to the practice of pharmacy. Noncompliance with applicable laws and regulations by us or our third-party vendors could have material adverse effects on our business, results of operations, financial condition, liquidity and reputation.
Federal and state legislatures and regulators also regularly consider new laws and regulations and changes to existing regulations and policies for the industry that could materially affect current industry practices and our business. These new and changing laws and regulations include the regulation that was issued by HHS in November 2020 (but delayed to 2032 by the Inflation Reduction Act) related to drug manufacturer rebates, Medicaid spread pricing contract arrangements, the pricing of pharmaceuticals, the 2021 Appropriations Act provisions on drug price reporting and potential new regulations or legislation regarding commercial spread pricing, rebates, fees from pharmaceutical companies, the development and use of formularies and other utilization management tools, pharmacy benefit manager compensation, the use of average wholesale prices or other pricing benchmarks, pricing for specialty pharmaceuticals, limited access to networks, prohibitions on pharmacy steering and pharmacy network reimbursement methodologies, and reporting requirements, as well as greater state regulation of pharmacy benefit managers and state involvement in the self-insured and Medicare Part D markets, which are typically preempted by federal law. Further, various government agencies have conducted and continue to conduct investigations and studies into certain pharmacy services practices, which have resulted and may in the future result in pharmacy benefit managers agreeing to civil penalties, including the payment of money and entry into corporate integrity agreements, or could materially and adversely impact the pharmacy services business model. These changes in legislation within the prescription drug industry and pharmacy benefit management practices have both short-term and long-term impacts that could have a material adverse effect on our business and results of operations.
We are a party to license agreements with the BCBSA that entitle us to the exclusive and, in certain areas, non-exclusive use of the BCBS names and marks in our geographic territories. The termination of these license agreements or changes in the terms and conditions of these license agreements could adversely affect our business, cash flows, financial condition and results of operations.
Our license agreements with the BCBSA contain certain requirements and restrictions regarding our operations and our use of the BCBS names and marks, and failure to comply with those requirements could result in a termination of the license agreements. The license agreements may be modified by the BCBSA, which could have a material adverse effect on our future expansion plans or results of operations. Further, BCBS licensees have certain requirements to perform administrative services for members of other BCBS licensees. As of December 31, 2024, we provided health benefit and other healthcare services to approximately 34 million Blue Cross and/or Blue Shield enrollees. If we or another BCBS licensee are not in compliance with all legal requirements or are unable to perform administrative services as required, this could have an adverse effect on our members and our ability to maintain our licenses, which could have a material adverse effect on our business, cash flows, financial condition and results of operations.
Upon the occurrence of an event causing termination of the license agreements, we would no longer have the right to use the BCBS names and marks or to sell BCBS health insurance products and services in one or more of our service areas. Furthermore, the BCBSA would be free to issue a license to use the BCBS names and marks in these service areas to another entity. Our existing BCBS members would be provided with instructions for obtaining alternative products and services licensed by the BCBSA. We believe that the BCBS names and marks are valuable identifiers of our products and services in the marketplace.
Upon termination of either license agreement, the BCBSA would have the right to impose a “Re-establishment Fee” upon us, which would be used in part to fund the establishment of a replacement Blue Cross and/or Blue Shield licensee in the vacated service area. The fee is set at $98.33 per licensed enrollee. If the Re-establishment Fee were applied to our total Blue Cross and/or Blue Shield enrollees of approximately 34 million as of December 31, 2024, we would be assessed approximately $3 billion by the BCBSA. As a result, termination of the license agreements would have a material adverse effect on our business, cash flows, financial condition and results of operations. For more information on the BCBSA license agreements, including requirements, restrictions and termination events set forth in these license agreements, see Part I, Item 1, “Business - BCBSA Licenses” of this Annual Report on Form 10-K.
Indiana law, other applicable laws, our articles of incorporation and bylaws, and provisions of our BCBSA license agreements may prevent or discourage takeovers and business combinations that our shareholders might consider to be in their best interest.
Indiana law, other applicable laws and regulations and provisions in our articles of incorporation and bylaws may delay, defer, prevent or render more difficult a takeover attempt that our shareholders might consider to be in their best interests. For instance, they may prevent our shareholders from receiving the benefit from any premium to the market price of our common stock offered by a bidder in a takeover context or adversely affect the price that some investors are willing to pay for our stock.
The insurance holding company system acts and certain health statutes of the states in which our insurance company or HMO subsidiaries are regulated restrict the ability of any person to obtain control of an insurance company or HMO without prior regulatory approval. Further, the Indiana Business Corporation Law contains business combination provisions that, in general, prohibit for five years any business combination with a beneficial owner of 10% or more of our common stock unless the holder’s acquisition of the stock was approved in advance by our Board of Directors.
Our articles of incorporation and bylaws contain provisions that could have anti-takeover effects and may delay, defer or prevent a takeover attempt that our shareholders might consider to be in their best interests. Our articles of incorporation provide that no person may beneficially own shares of voting capital stock beyond specified ownership limits, except with the prior approval of a majority of the “continuing directors.” The ownership limits, which may not be exceeded without the prior approval of the BCBSA, are the following: (1) for any institutional investor (as defined in our articles of incorporation), one share less than 10% of our outstanding voting securities; (2) for any non-institutional investor (as defined in our articles of incorporation), one share less than 5% of our outstanding voting securities; and (3) for any person, one share less than the number of shares of our common stock or other equity securities (or a combination thereof) representing a 20% ownership interest in us.
In addition, our articles of incorporation and bylaws: divide our Board of Directors into three classes serving staggered three-year terms (which is required by our license agreements with the BCBSA); permit our Board of Directors to determine the terms of and issue one or more series of preferred stock without further action by shareholders; restrict the maximum number of directors and the ability to increase that number; limit the ability of shareholders to remove directors; impose restrictions on shareholders’ ability to fill vacancies on our Board of Directors; impose advance notice requirements for shareholder proposals and nominations of directors to be considered at meetings of shareholders; prohibit shareholders from amending certain provisions of our bylaws; and impose restrictions on who may call a special meeting of shareholders.
The health benefits industry is subject to negative publicity, which could adversely affect our business, cash flows, financial condition and results of operations.
Negative publicity in the healthcare industry is driven by factors that include, but are not limited to, premium rate increases, prior authorization practices, industry consolidation, cost of care initiatives and debate about current or proposed legislation. Such publicity may lead to more regulation and legislative review of industry practices, which may increase business costs and impact profitability by constraining our ability to market, maintain or expand our product and service offerings and result in increased regulatory oversight of our operations. Negative publicity and perception of the health benefits industry in general, the BCBSA, other BCBSA licensees, us, or our key vendors could limit our ability to attract and retain talent, impact the security of our workforce, and adversely affect our business, cash flows, financial condition and results of operations.
STRATEGIC RISKS
We face competition in many of our markets, and if we fail to adequately adapt to changes in our industry and develop and implement strategic growth opportunities, our ability to compete and grow may be adversely affected.
As a health company offering health benefits, pharmacy services and other diversified products and services, we operate in a highly competitive industry that is subject to significant changes from and competition due to legislative reform, business consolidations, new strategic alliances, new market entrants, aggressive marketing practices, technological advancements and changing market practices such as increasing usage of telehealth. We also must respond to pricing and other actions taken by existing competitors, suppliers and potentially disruptive new entrants in the Public Exchanges and in our other lines of business. These factors have produced and will continue to produce significant pressures on our profitability and membership. Furthermore,
decisions to buy our products and services are increasingly made or influenced by consumers, through means such as direct purchasing (for example, Medicare Advantage plans) and insurance exchanges that allow individual choice, or by large employers that may increasingly be able to contract directly with providers. Our success and future growth depend on our ability to compete effectively under these unique market pressures in the consumer-driven marketplace, and our ability to develop and deliver innovative and potentially disruptive products and services to satisfy evolving market demands.
In addition, the pharmacy services industry is highly competitive, and our pharmacy services business unit is subject to competition from national, regional and local pharmacy services providers, other insurers, health plans, large retail pharmacy chains, large retail stores, supermarkets, mail order and web pharmacies, discount cards and specialty pharmacies. Strong competition within the pharmacy services business has generated greater demand for lower product and service pricing and enhanced product and service offerings. Our inability to maintain positive trends, or to contract on favorable terms with CVS, wholesalers or pharmaceutical manufacturers for, among other things, rebates, discounts, administrative fees and inventory purchase prices, or a failure to identify and implement new ways to mitigate pricing pressures, could negatively impact our ability to attract or retain customers, negatively impact our margins and have a material adverse effect on our business and results of operations. In addition, legislative reforms such as the regulation issued by HHS related to rebates and the 2021 Appropriations Act, which requires reporting of plan spending, the cost of plan pharmacy benefits, enrollee premiums and any manufacturer rebates received by the plan or issuer, may adversely affect our competitive position, cash flows, financial condition and results of operations.
In order to achieve our long-term financial targets, we need to not only grow our profitable medical membership, but also continue to profitably grow and diversify our sources of revenue and earnings, including through the increased sale of our pharmacy services, both integrated and external, other healthcare services and products, and specialty products, such as stop loss, dental, vision and other supplemental products, expand our products and services and establish new cost of care solutions. If we are unable to execute our strategy with respect to the growth of our healthcare, pharmacy services, and other diversified products and services businesses, or if we are unable to acquire or develop and successfully manage new opportunities that further our strategic objectives and differentiate our products and services from our competitors, our ability to profitably grow our business could be adversely affected.
We are currently dependent on the non-exclusive services of independent agents and brokers in the marketing of our healthcare products, particularly with respect to individuals, seniors and certain group customers. We face intense competition for the services and allegiance of these independent agents and brokers, who may also market the products of our competitors. Our relationship with our brokers and independent agents could be adversely impacted by changes in our business practices to address legislative changes, including potential reductions in commissions and consulting fees paid to agents and brokers. We cannot ensure that we will be able to compete successfully against current and future competitors for these services or that competitive pressures faced by us will not materially and adversely affect our business, cash flows, financial condition and results of operations.
For additional information, see “Business - Competition” in Part I, Item 1 of this Annual Report on Form 10-K.
We have built a significant portion of our current business through mergers and acquisitions, joint ventures, strategic alliances and investments, and although we expect to pursue such opportunities in the future, we are subject to risks resulting from such business combinations.
The following are some of the risks associated with mergers, acquisitions, divestitures, joint ventures and strategic alliances and investments, referred to collectively as business combinations, that could have a material adverse effect on our business, cash flows, financial condition and results of operations:
•some business combinations may not achieve anticipated revenues, earnings or cash flow, business opportunities, synergies, growth prospects or other anticipated benefits;
•we may assume liabilities that were not disclosed to us, or which were underestimated, and which could lead to legal challenges, investigations and enforcement actions, and we may not be able to adequately recover from sellers or insurance carriers for such assumed liabilities;
•we may experience difficulties in integrating business combinations, including into our internal control environment and culture, be unable to integrate business combinations successfully or as quickly as expected and be unable to realize anticipated economic, operational and other benefits in a timely manner or at all;
•business combinations and proposed business combinations that are not completed could disrupt our ongoing business, lead to the incurrence of significant fees, distract management, result in the loss of key associates, divert resources, result in tax costs or inefficiencies and make it difficult to maintain our current business standards, controls, information technology systems, policies and procedures;
•IT system vulnerabilities may be more acute for IT systems associated with recently acquired businesses, and we may be unable to address such vulnerabilities, inadequacies, or failures immediately after acquiring a business, which could undermine integration activities, delay launch of acquired products, and increase infrastructure risk;
•we may finance future business combinations by issuing common stock for some or all of the purchase price, which could dilute the ownership interests of our shareholders;
•we may compete with other firms, some of which may have greater financial and other resources, to acquire attractive companies;
•we may experience disputes with or competition from our partners or former partners in our strategic alliances, investments and joint ventures, which could result in litigation or a loss of business;
•we may not be able to obtain required regulatory approval for an acquisition, in a timely manner, or at all, and government actions such as actions by the Federal Trade Commission, Department of Justice, or state governmental agencies, may affect our ability to complete our business combinations, which could result in additional expenditures required to develop products and services internally, place us at a competitive disadvantage, or impact market perceptions of our business and brand;
•the integration of entities we acquire into our business may affect the way in which existing and future laws and rules apply to us, including expansion of applicability; and
•future business combinations may make it difficult to comply with the requirements of the BCBSA and lead to a risk that our BCBSA license agreements may be terminated.
We face intense competition to attract and retain associates. Further, managing key executive succession and retention is critical to our success.
Our success depends on our ability to attract, develop and retain qualified associates, including those with diverse backgrounds, experience and skill sets, to operate and expand our business. We face intense competition for experienced and highly skilled associates, and we may be unable to attract and retain such associates, or competition among potential associates may result in increasing salaries. Further, adverse changes to our corporate culture could harm our business operations and our ability to retain key associates and executives. An inability to retain and attract associates and executives could have a material adverse effect on our business, cash flows, financial condition and results of operations.
In addition, if we are unable to attract, retain and effectively manage the succession plans for key associates and executives, including our President and Chief Executive Officer, our business, results of operations and future performance could be adversely affected. We may have difficulty in replacing key executives because of the limited number of qualified individuals with the breadth of skills and experience required to operate and successfully expand our business. The succession plans we have in place for members of our senior management and employment arrangements with certain key executives do not guarantee that the services of our senior executives will continue to be available to us or that we will be able to attract, transition and retain suitable successors.
Restrictions on our ability to obtain funds from our regulated subsidiaries could limit our ability to repurchase shares, pay dividends and meet our obligations and materially adversely affect our business, cash flows, financial condition and results of operations.
As a holding company, we are dependent on dividends and administrative expense reimbursements from our subsidiaries. Among other restrictions, state insurance and HMO laws restrict the ability of most of our regulated subsidiaries to pay dividends. In some states, we have made special undertakings that may further limit the ability of our regulated subsidiaries to pay dividends. Our ability to repurchase shares, pay dividends to our shareholders and meet our obligations, including paying operating expenses and debt service on our outstanding and future indebtedness, will depend upon the receipt of dividends from our subsidiaries. An inability of our subsidiaries to pay dividends in the future in an amount sufficient for us to meet our financial obligations may materially adversely affect our business, cash flows, financial condition and results of operations.
In addition, most of our regulated subsidiaries are subject to minimum capital requirements and periodic financial reporting that require them to report their results of risk-based capital calculations to the departments of insurance and the NAIC. Failure to maintain these minimum standards could subject our regulated subsidiaries to corrective action, including state supervision or liquidation. We are also a party to license agreements with the BCBSA which contain additional minimum capital and liquidity requirements. Changes to existing minimum capital requirements could further restrict the ability of our regulated subsidiaries to pay dividends and adversely affect our business.
Our regulated subsidiaries are subject to state laws and regulations that require diversification of their investment portfolios and limit the amount of investments in certain investment categories. Failure to comply with these laws and regulations might cause investments exceeding regulatory limitations to be treated as non-admitted assets for purposes of measuring statutory surplus and risk-based capital, and in some instances, require the sale of those investments.
We have substantial indebtedness outstanding and may incur additional indebtedness in the future, which could adversely affect our ability to pursue desirable business opportunities and to react to changes in the economy or our industry.
Our debt service obligations require us to use a portion of our cash flow to pay interest and principal on debt instead of for other corporate purposes, including funding future expansion. We are exposed to interest rate risk to the extent of our variable rate indebtedness. Increases in interest rates could increase our cost of borrowing, and volatility in U.S. and global financial markets could impact our access to, or further increase the cost of, financing. If our cash flow and capital resources are insufficient to service our debt obligations, we may be forced to seek extraordinary dividends from our subsidiaries, sell assets, seek additional equity or debt capital or restructure our debt. However, these measures might be unsuccessful or inadequate to meet scheduled debt service obligations or may not be available on commercially reasonable terms.
We may also incur future debt obligations that might subject us to restrictive covenants that could affect our financial and operational flexibility. Our breach or failure to comply with any of these covenants could result in a default under our credit facilities or other indebtedness. If we default under our credit agreement, the lenders could cease to make further extensions of credit or cause all of our outstanding debt obligations under our credit agreement to become immediately due and payable, together with accrued and unpaid interest. If the indebtedness under our notes or our credit agreement or our other indebtedness is accelerated, we may be unable to repay or finance the amounts due, on commercially reasonable terms, or at all.
A downgrade in our credit ratings could have an adverse effect on our business, cash flows, financial condition and results of operations.
Claims-paying ability, financial strength and debt ratings by nationally recognized statistical rating organizations are important factors in establishing the competitive position of insurance and health benefits companies. We believe our strong credit ratings are an important factor in marketing our products to customers. In addition, if our credit ratings are downgraded or placed under review, our business, cash flows, financial condition and results of operations could be adversely impacted by limitations on future borrowings and a potential increase in our borrowing costs. Each of the ratings organizations reviews our ratings periodically, and there can be no assurance that our current ratings will be maintained in the future.
The value of our intangible assets may become impaired.
As of December 31, 2024, we had $40.4 billion of goodwill and other intangible assets, representing 34.5% of our total consolidated assets. In accordance with applicable accounting standards, we periodically evaluate our goodwill and other intangible assets for potential impairment, using assumptions and judgments regarding the estimated fair value of our reporting units. Estimated fair values might be significantly different if other reasonable assumptions and estimates were to be used. If estimated fair values are less than the carrying values of goodwill and other intangible assets with indefinite lives in future impairment tests, or if significant impairment indicators are noted relative to other intangible assets subject to amortization, we may be required to record impairment losses against future income.
The value we place on intangible assets may be adversely impacted if existing or future business combinations fail to perform in a manner consistent with our assumptions. In addition, from time to time we divest businesses, and any such divestiture could result in significant asset impairment and disposition charges, including those related to goodwill and other intangible assets. Further, the estimated value of our reporting units may be impacted because of business decisions we make associated with any future changes to laws and regulations, which could unfavorably affect the carrying value of certain goodwill and other intangible assets and result in impairment charges in future periods. Any future evaluations requiring an impairment of our goodwill and other intangible assets could materially affect our results of operations and shareholders’ equity which could, in turn, negatively impact our debt ratings or potentially impact our compliance with existing debt covenants.
The value of our investments is influenced by varying economic and market conditions, and a decrease in value may result in a loss charged to income.
We maintain a significant investment portfolio of cash equivalents and short-term and long-term investments in a variety of securities, which are subject to general credit, liquidity, market and interest rate risks. As a result, we may experience a reduction in value or loss of our investments, which may have a negative adverse effect on our results of operations, liquidity and financial condition. Changes in the economic environment, including periods of increased volatility in the securities markets, recent changes in interest rates and currency exchange rates, can increase the difficulty of assessing investment impairment and increase the risk of potential impairment of these assets. There is continuing risk that declines in the fair value of our investments may occur and material impairments may be charged to income in future periods, resulting in recognized losses.
GENERAL RISKS
We also face other risks that could adversely affect our business, financial condition or results of operations, which include:
•adverse securities and credit market conditions, which could impact our ability to meet liquidity needs;
•any requirement to restate financial results in the event of inappropriate application of accounting principles;
•changes in tax laws and regulations, uncertainty in the interpretation of tax laws and regulations or unfavorable resolutions of exams that could impact the future value of our deferred tax assets and deferred tax liabilities, or result in significant one-time charges in the current or future taxable years;
•a significant failure of our internal control over financial reporting;
•provider fraud that is not prevented or detected and impacts our medical costs or those of self-insured customers; and
•failure of our corporate governance policies or procedures.
ITEM 1B. UNRESOLVED STAFF COMMENTS.
None.
ITEM 1C. CYBERSECURITY
We operate in a highly regulated industry. Federal, state and international laws and contractual commitments guide our collection, use and disclosure of confidential information such as protected health information, personal financial information and personally identifiable information. Our success depends on maintaining a high level of trust among our stakeholders, including our consumers, clients, business partners, providers, regulators and associates. Failure to effectively secure, maintain and upgrade our information systems, or the availability and integrity of our data, could adversely affect our business, including our business strategy, cash flows, financial condition and results of operations.
Cybersecurity Risk Assessment
Our cybersecurity and risk management programs are part of our continuously evolving enterprise-wide risk management practices. Aligned and measured against the National Institute of Standards and Technology (NIST) Cybersecurity Framework, recognized best practices and standards for cybersecurity and information technology, industry and government standards and other guidelines, our cybersecurity and risk management programs utilize policies, processes, and technologies to identify, assess, manage and mitigate cybersecurity risks and threats we face. We also conduct periodic reviews and updates to uphold our security standards, including implementation of tabletop crises exercises. Our management implements ongoing and annual risk assessment processes to identify and manage risks that could affect our ability to safeguard sensitive data or provide reliable transaction processing and to minimize financial risk exposure. These risks include, but are not limited to, regulatory compliance; third-party management, including risks from business partners and software providers; mergers and acquisitions; system availability and disruption of business operations; data use and security; vulnerability and configuration management; fraud and extortion; and reputation risk.
The steps we take to reduce vulnerability to cyber-attacks and to mitigate and remediate the impact of cybersecurity incidents in a timely and coordinated manner include, but are not limited to: establishing information security policies and standards, implementing information protection processes, tools and technologies, monitoring information technology systems for cybersecurity threats, coordinating internal reporting, assessing cybersecurity risk profiles of key third-parties, implementing cybersecurity training and collaborating with public and private organizations on cyber threat information and best practices.
In addition to our internal Information Security teams, we also utilize trusted third-party auditors and recognized cybersecurity consultants and certified assessors, to assess cybersecurity risks, related controls, and alignment to relevant regulatory and legal requirements. A third party evaluates our information security policies, standards and control environment at least annually. Assessments and testing protocols are performed against industry best practices and widely recognized security frameworks.
We face many cybersecurity risks in connection with our business. As of December 31, 2024, no known cybersecurity threats have materially affected, or are reasonably likely to materially affect, the Company, including our business strategy, cash flows, financial condition or results of operations; however, future cybersecurity incidents or threats may materially affect us, including by affecting our business strategy, results of operations or financial conditions. See Part I, Item 1A. “Risk Factors” for more information on the Company’s cybersecurity-related risks.
Management and Governance of Cybersecurity Risk
To manage our cybersecurity risk, we employ a cross-organizational steering committee, the Information Security Steering Committee (“ISSC”), that supports the direction and governance of our enterprise-wide Information Security Program. The ISSC is chaired by our Chief Information Security Officer (“CISO”) and is comprised of accountable senior business leaders including our Chief Compliance Officer (“CCO”), Chief Risk Officer (“CRO”), legal counsel, and human resources, procurement and business segment leaders.
In addition to the ISSC, we have defined risk functions to cover overall enterprise risks and information technology and cybersecurity risks within our enterprise risk management framework, including, but not limited to: our IT Risk Management program, led by our CISO; our Responsible Artificial Intelligence (“RAI”) Program, led by our Chief Digital Information Officer; Compliance, led by our CCO; Internal Audit, led by our Chief Audit Executive (“CAE”); Enterprise Risk Management programs led by our CRO; Third-Party Risk Management, comprised of business and information security leaders; IT due diligence processes, led by business, technology and information security leaders; and our Corporate Insurance Program, including cybersecurity insurance, led by our Treasurer.
To evaluate cybersecurity and privacy incidents and enable us to comply with public disclosure requirements, we have a Privacy and Security Incident Response and Reporting Policy and Procedure (the “Policy”) with defined escalation criteria (the “Plan”) in support of our incident response processes. The Plan provides a framework to our Cyber Incident Response Taskforce, comprised of our Chief Privacy Officer (“CPO”), CISO and applicable legal counsel and business and corporate services leaders, for responding to cybersecurity incidents. The Policy, together with the Plan, identifies applicable requirements for incident disclosure and reporting and also provides protocols for incident evaluation based on facts and circumstances of each incident, including the use of third-party service providers and partners, processes for notification and internal escalation of information to our senior management, including to our chief legal officer and CEO, a subcommittee of our SEC disclosure committee, and ultimately, our Board of Directors and appropriate Board committees. The Policy also addresses requirements for our external reporting obligations. The Policy is reviewed and updated, as necessary, under the leadership of our CISO and CPO.
Our Board oversees and guides our business and oversees our exposure to major risks, including steps taken by management to monitor and mitigate cybersecurity risks. The Board receives and reviews periodic reports from management on various risks, and delegates to its Audit Committee certain oversight responsibilities. The Board monitors cybersecurity risks and receives a report at least quarterly from our CISO regarding our Information Security Program. In addition, certain cybersecurity incidents are escalated to the Board in accordance with our Plan as described above. Periodically, the Board also receives third party assessments of our information security. The Audit Committee receives regular updates on both information security and data privacy matters, and oversees data privacy, integrity, incident and breach risks.
Cybersecurity Expertise
Our Information Security Program has been established with the mission of minimizing risk to our member, client and associate data and it is managed by our CISO. Our current CISO has over 30 years of experience in information security and technology and has held a wide variety of technical and strategic leadership positions. He holds advanced certifications including Certified Information Systems Security Professional and Certified Secure Software Lifecycle Professional.
Our associates, including those responsible for cybersecurity, are evaluated for competence, including the knowledge and skills necessary to accomplish tasks that define associates’ roles and responsibilities and undergo regular training regarding security-awareness, privacy, ethics and compliance. Our job summaries contain specific educational and knowledge requirements necessary for cybersecurity jobs. In addition, a criminal background check is completed for all new associates and performance reviews are conducted annually to measure performance results and achievements and to assess the job competency of our associates.
ITEM 2. PROPERTIES.
We lease our principal executive offices located at 220 Virginia Avenue, Indianapolis, Indiana. In addition to this location, we have operating facilities located in each state where we operate as licensees of the BCBSA and in other states or countries where we operate under our other brands. A majority of these locations are also leased properties. Our facilities
support our various business segments. We operate in a hybrid workforce environment and believe that our properties are adequate and suitable for our business as presently conducted.
ITEM 3. LEGAL PROCEEDINGS.
For information regarding our legal proceedings, see Note 14, “Commitments and Contingencies – Litigation and Regulatory Proceedings,” of the Notes to Consolidated Financial Statements included in Part II, Item 8 of this Annual Report on Form 10-K, which information is incorporated herein by reference.
ITEM 4. MINE SAFETY DISCLOSURES.
Not applicable.
PART II
ITEM 5. MARKET FOR REGISTRANT’S COMMON EQUITY, RELATED STOCKHOLDER MATTERS AND ISSUER PURCHASES OF EQUITY SECURITIES.
Market Information
Our common stock, par value $0.01 per share, is listed on the NYSE under the symbol “ELV.”
Holders
As of February 1, 2025, there were 46,307 shareholders of record of our common stock.
Securities Authorized for Issuance under Equity Compensation Plans
The information required by this Item concerning securities authorized for issuance under our equity compensation plans is set forth in Part III, Item 12, “Security Ownership of Certain Beneficial Owners and Management and Related Stockholder Matters” in this Annual Report on Form 10-K.
Issuer Purchases of Equity Securities
The following table presents information related to our repurchases of common stock for the periods indicated (in millions, except share and per share data):
| | | | | | | | | | | | | | | | | | | | | | | | | | | | | |
| Period | | | Total Number of Shares Purchased1 | | Average Price Paid per Share | | Total Number of Shares Purchased as Part of Publicly Announced Programs2 | | Approximate Dollar Value of Shares that May Yet Be Purchased Under the Programs |
| | | | | | | | |
| October 1, 2024 to October 31, 2024 | | 801,484 | | | 421.93 | | | 798,055 | | | $ | 10,774 | |
| November 1, 2024 to November 30, 2024 | | 1,859,856 | | | 409.95 | | | 1,856,962 | | | 10,013 | |
| December 1, 2024 to December 31, 2024 | | 1,858,281 | | | 383.93 | | | 1,857,988 | | | 9,300 | |
| | | 4,519,621 | | | | | 4,513,005 | | | |
| | | | | | | | | |
1Total number of shares purchased includes 6,616 shares delivered to or withheld by us in connection with employee payroll tax withholding upon exercise or vesting of stock awards. Stock grants to employees and directors and stock issued for stock option plans and stock purchase plans in the consolidated statements of shareholders’ equity are shown net of these shares purchased.
2Represents the number of shares repurchased through the common stock repurchase program authorized by our Board of Directors, which the Board evaluates periodically. During the year ended December 31, 2024, we repurchased 6,661,737 shares at an aggregate cost of $2,900 under the program, including the cost of options to purchase shares. The Board of Directors has authorized our common stock repurchase program since 2003. The most recent authorized increase to the program was $8,000 on October 15, 2024 by our Audit Committee, pursuant to authorization granted by the Board of Directors. No duration has been placed on our common stock repurchase program, and we reserve the right to discontinue the program at any time.
Performance Graph
The following Performance Graph and related information compares the cumulative total return to shareholders of our common stock for the period from December 31, 2019 through December 31, 2024, with the cumulative total return over such period of (i) the Standard & Poor’s 500 Stock Index (the “S&P 500 Index”) and (ii) the Standard and Poor’s 500 Health Care Index (the “S&P 500 Health Care Index”). The graph assumes an investment of $100 on December 31, 2019 in each of our common stock and these indices (and the reinvestment of all dividends).
The comparisons shown in the graph below are based on historical data, and we caution that the stock price performance shown in the graph below is not indicative of, and is not intended to forecast, the potential future performance of our common stock. Information used in the graph was obtained from S&P Global Market Intelligence, a source believed to be reliable, but we are not responsible for any errors or omissions in such information. The following graph and related information shall not be deemed “soliciting materials” or to be “filed” with the SEC, nor shall such information be incorporated by reference into any future filing under the Exchange Act, except to the extent that we specifically incorporate it by reference into such filing.
| | | | | | | | | | | | | | | | | | | | | | | | | | | | | | | | | | | | | | |
| | | December 31, |
| | | 2019 | | 2020 | | 2021 | | 2022 | | 2023 | | 2024 |
| Elevance Health, Inc. | $ | 100 | | | $ | 108 | | | $ | 157 | | | $ | 176 | | | $ | 164 | | | $ | 130 | |
| S&P 500 Index | 100 | | | 118 | | | 152 | | | 125 | | | 158 | | | 197 | |
| S&P 500 Health Care Index | 100 | | | 113 | | | 143 | | | 140 | | | 143 | | | 147 | |
| | | | | | | | | | | | |
Based upon an initial investment of $100 on December 31, 2019 with dividends reinvested.
ITEM 6. [RESERVED]
ITEM 7. MANAGEMENT’S DISCUSSION AND ANALYSIS OF FINANCIAL CONDITION AND RESULTS OF OPERATIONS.
(In Millions, Except Per Share Data or as Otherwise Stated Herein)
This Management's Discussion and Analysis of Financial Condition and Results of Operations (“MD&A”) should be read in conjunction with the accompanying audited consolidated financial statements and notes, included in Part II, Item 8 of this Annual Report on Form 10-K. References to the terms “we,” “our,” “us,” “Elevance Health” or the “Company” used throughout this MD&A refer to Elevance Health, Inc., an Indiana corporation, and, unless the context otherwise requires, its direct and indirect subsidiaries. References to the “states” include the District of Columbia and Puerto Rico, unless the context otherwise requires.
This MD&A generally discusses 2024 and 2023 items and year-over-year comparisons between 2024 and 2023. A detailed discussion of 2022 items and year-over-year comparisons between 2023 and 2022 that are not included in this Annual Report on Form 10-K can be found in “Management’s Discussion and Analysis of Financial Condition and Results of Operations” in Part II, Item 7 included in our Annual Report on Form 10-K for the year ended December 31, 2023.
Overview
Elevance Health is a health company with the purpose of improving the health of humanity. We are one of the largest health insurers in the United States in terms of medical membership, serving approximately 45.7 million medical members through our affiliated health plans as of December 31, 2024. We are an independent licensee of the Blue Cross and Blue Shield Association (“BCBSA”), an association of independent health benefit plans. We serve our members as the Blue Cross licensee for California and as the Blue Cross and Blue Shield (“BCBS”) licensee for Colorado, Connecticut, Georgia, Indiana, Kentucky, Maine, Missouri (excluding 30 counties in the Kansas City area), Nevada, New Hampshire, New York (in the New York City metropolitan area and upstate New York), Ohio, Virginia (excluding the Northern Virginia suburbs of Washington, D.C.) and Wisconsin. In a majority of these service areas, we do business as Anthem Blue Cross and Anthem Blue Cross and Blue Shield. We also conduct business through arrangements with other BCBS licensees, as well as other strategic partners. In addition, we serve members in numerous states as Wellpoint, Carelon, MMM and/or Simply Healthcare. We are licensed to conduct insurance operations in all 50 states, the District of Columbia and Puerto Rico through our subsidiaries. Through various subsidiaries, we also offer pharmacy services through our CarelonRx business, and other healthcare related services as Carelon Insights and Carelon Health.
We have organized our brand portfolio into the following core go-to-market brands:
•Anthem Blue Cross/Anthem Blue Cross and Blue Shield — represents our Anthem-branded and affiliated Blue Cross and/or Blue Shield licensed plans;
•Wellpoint — unites select non-BCBSA licensed Medicare, Medicaid and commercial plans under the Wellpoint name; and
•Carelon — this brand brings together our healthcare related services and capabilities, including our CarelonRx and Carelon Services businesses, under a single brand name.
We report our results of operations in the following four reportable segments: Health Benefits, CarelonRx, Carelon Services and Corporate & Other (our businesses that do not individually meet the quantitative thresholds for an operating segment, as well as corporate expenses not allocated to our other reportable segments).
Our results of operations discussed throughout this MD&A are determined in accordance with generally accepted accounting principles (“GAAP”). We also calculate operating gain and operating margin to further aid investors in understanding and analyzing our core operating results. Operating gain is calculated as total operating revenue less benefit expense, cost of products sold and operating expense. Operating margin is calculated as operating gain divided by operating revenue. Our definition of operating gain and operating margin may not be comparable to similarly titled measures reported by other companies. We use these measures as a basis for evaluating segment performance, allocating resources, forecasting future operating periods and setting incentive compensation targets. This information is not intended to be considered in isolation or as a substitute for income before income tax expense, net income or fully-diluted shareholders’ earnings per share (“EPS”) prepared in accordance with GAAP. For additional details on operating gain, see our “Reportable Segments Results
of Operations” discussion included in this MD&A. For a reconciliation of reportable segment operating revenue to the amounts of total revenue included in the consolidated statements of income and a reconciliation of reportable segment operating gain to income before income tax expense, see Note 20, “Segment Information,” of the Notes to Consolidated Financial Statements included in Part II, Item 8 of this Annual Report on Form 10-K.
Our operating revenue consists of premiums, product revenue, and service fees. Premium revenue is generated from risk-based contracts where we indemnify our policyholders against costs for covered health benefits. Product revenue represents services performed by CarelonRx for unaffiliated pharmacy customers and includes ingredient costs (net of any rebates or discounts), including co-payments made by or on behalf of the customer, and service fees. Unaffiliated pharmacy customers include our fee-based employer groups that contract with CarelonRx for pharmacy services and external customers outside of the health plans we own. Service fees are generated from our fee-based customers for the processing of transactions or network discount savings realized, revenues from our Medicare processing business and revenues from other health-related businesses, including care management programs and miscellaneous other income.
Our benefit expense primarily includes costs of care for health services consumed by our risk-based members, such as outpatient care, inpatient hospital care, professional services (primarily physician care) and pharmacy benefit costs. All four components are affected both by unit costs and utilization rates. Unit costs include the cost of outpatient medical procedures per visit, inpatient hospital care per admission, physician fees per office visit and prescription drug prices. Utilization rates represent the volume of consumption of health services and prescription drugs, and typically vary with the age and health status of our members and their social and lifestyle choices, along with clinical protocols and medical practice patterns in each of our markets. A portion of benefit expense recognized in each reporting period consists of actuarial estimates of claims incurred but not yet paid by us. Any changes in these estimates are recorded in the period the need for such an adjustment arises. While we offer a diversified mix of managed care products and services through our managed care plans, our aggregate cost of care can fluctuate based on a change in the overall mix of these products and services. Our managed care plans include: Preferred Provider Organizations; Health Maintenance Organizations; Point-of-Service plans; Traditional Indemnity plans and other hybrid plans, including Consumer-Driven Health Plans; and hospital only and limited benefit products.
We classify certain quality improvement costs as benefit expense. Quality improvement activities are those designed to improve member health outcomes, prevent hospital readmissions and improve patient safety. They also include expenses for wellness and health promotion provided to our members. These quality improvement costs may be comprised of expenses incurred for: (i) medical management, including care coordination and case management; (ii) health and wellness, including disease management services for such conditions as diabetes, high-risk pregnancies, congestive heart failure and asthma management and wellness initiatives like weight-loss programs and smoking cessation treatments; and (iii) clinical health policy, such as identification and use of best clinical practices to avoid harm, identifying clinical errors and safety concerns, and identifying potential adverse drug interactions.
Our cost of products sold represents the cost of pharmaceuticals dispensed by CarelonRx for our unaffiliated pharmacy customers (net of rebates or discounts), including any co-payments made by or on behalf of the customer, per-claim administrative fees for prescription fulfillment and certain direct costs related to sales and administration of customer contracts.
Our operating expenses consist of fixed and variable costs. Examples of fixed costs are depreciation, amortization and certain facilities expenses. Certain variable costs, such as premium taxes, vary directly with premium volume. Commission expense generally varies with premium or membership volume. Other variable costs, such as salaries and benefits, do not vary directly with changes in premium but are more aligned with changes in membership or services provided to our customers. The acquisition or loss of a significant block of business would likely impact staffing levels and thus, associated compensation expense. Other variable costs include professional and consulting expenses and advertising. Other factors can impact our administrative cost structure, including systems efficiencies, inflation and changes in productivity.
Our results of operations depend in large part on our ability to accurately predict and effectively manage healthcare costs through effective contracting with providers of care to our members, product pricing, medical management and health and wellness programs, including service coordination and case management for addressing complex and specialized healthcare needs, innovative product design and our ability to maintain or achieve improvement in our Centers for Medicare and Medicaid Services Star Ratings. Several economic factors related to healthcare costs, such as regulatory mandates of
coverage as well as direct-to-consumer advertising by providers and pharmaceutical companies, have a direct impact on the volume of care consumed by our members. The potential effect of escalating healthcare costs, any changes in our ability to negotiate competitive rates with our providers and any regulatory or market-driven restrictions on our ability to obtain adequate premium rates to offset overall inflation in healthcare costs, including increases in unit costs and utilization rates resulting from the aging of the population and other demographics, the impact of epidemics and pandemics, as well as advances in medical technology and pharmaceuticals, may impose further risks to our ability to profitably underwrite our business and may have a material adverse impact on our results of operations.
We intend to expand through a combination of organic growth, strategic acquisitions and efficient use of capital in both existing and new markets. Our growth strategy is designed to enable us to take advantage of additional economies of scale, as well as provide us access to new and evolving technologies and products. In addition, we believe geographic and product diversity reduces our exposure to local or regional regulatory, economic and competitive pressures and provides us with increased opportunities for growth. We market and offer pharmacy services through CarelonRx and other subsidiaries, and we expect CarelonRx to continue to improve our ability to integrate pharmacy benefits within our medical and specialty platform. We have continued growing our government-sponsored business through organic growth and acquisitions. In all other markets, we intend to maintain our position by delivering excellent service, offering competitively priced products, providing access to high-quality provider networks and effectively capitalizing on the brand strength of the Blue Cross and Blue Cross and Blue Shield names and marks.
For additional information about our business and reportable segments, see Part I, Item 1 “Business” and Note 20, “Segment Information” of the Notes to Consolidated Financial Statements included in Part II, Item 8 of this Annual Report on Form 10-K.
Business Trends
We continue to participate in the Individual state- or federally-facilitated marketplaces (“the Public Exchange”) in nearly all of our Anthem Blue Cross and Anthem Blue Cross and Blue Shield service areas. We anticipate growth in our Public Exchange memberships as former Medicaid members, no longer eligible for Medicaid coverage, continue to seek alternative coverage options. Additionally, we are entering select service areas in Florida, Maryland, and Texas in 2025, using our Simply Healthcare and Wellpoint brands, and we are actively evaluating expansion opportunities in additional marketplaces beyond 2025. Changes to our business environment are likely to continue as elected officials at the national and state levels continue to enact significant modifications to existing laws and regulations, including changes to available subsidies, taxes and fees.
CarelonRx markets and offers pharmacy services to our affiliated health plan customers throughout the country, as well as to customers outside of the health plans we own. Our comprehensive pharmacy services portfolio includes all core pharmacy services, such as home delivery and specialty pharmacies, claims adjudication, formulary management, pharmacy networks, rebate administration, a prescription drug database and member services, as well as infusion services and injectable therapies.
CarelonRx delegates certain core pharmacy services to CaremarkPCS Health, L.L.C., which is a subsidiary of CVS Health Corporation (“CVS”), pursuant to an agreement (the “CVS Agreement”) with the current contractual term extending through December 31, 2027. We can elect to have CVS continue to provide services to us for a three-year extension period on the same terms and conditions as in the current CVS Agreement in the event of a termination or non-renewal by either party.
Pricing Trends: We strive to price our health benefit products consistent with anticipated underlying medical cost trends. We frequently make adjustments to respond to legislative and regulatory changes as well as pricing and other actions taken by existing competitors and new market entrants. Revenues from the Medicare and Medicaid programs are dependent, in whole or in part, upon annual funding from the federal government and/or applicable state governments. Product pricing remains competitive.
If the approvals of any annual premium rate changes by contracted government agencies are delayed, we are required to defer the recognition of any premium rate increases to the period in which the premium rates become final. The impact of this deferral can be significant in the period in which the increased premium rates are first recognized depending on the magnitude of the premium rate increase, the number of members to which it applies and the length of the delay between the
effective date of the rate increase and the final contract date. Premium rate decreases are recognized in the period the change in premium rate becomes effective and the change in the rate is known, which may be prior to the period in which the contract amendment affecting the rate is finalized.
Medical Cost Trends: Our medical cost trends are primarily driven by changes in the utilization of services across all provider types and the unit cost of these services. We work to mitigate these trends through various medical management programs such as care and condition management, program integrity and specialty pharmacy management and utilization management, as well as benefit design changes. There are many drivers of medical cost trends that can cause variance from our estimates, such as changes in the level and mix of services utilized, regulatory changes, aging of the population, health status and other demographic characteristics of our members, epidemics, pandemics, advances in medical technology, new high-cost prescription drugs, new indications of existing prescription drugs, provider contracting inflation, labor costs and healthcare provider or member fraud.
For additional discussion regarding business trends, see Part I, Item 1 “Business” of this Annual Report on Form 10-K.
Regulatory Trends and Uncertainties
The Consolidated Appropriations Act of 2023, decoupled Medicaid eligibility redeterminations from the COVID-19 Public Health Emergency initially declared in January 2020. As a result, states were permitted to begin removing ineligible beneficiaries from their Medicaid programs starting April 1, 2023, and the majority of our Medicaid markets began doing so as of June 30, 2023. Although most states have completed this process, Centers for Medicare and Medicaid Services (“CMS”) has provided that states have until December 31, 2025 to complete these eligibility redeterminations. Since redeterminations have resumed, we have continued to experience a decline in our Medicaid membership. We expect growth over time in our commercial plans, including through the Public Exchanges in states where we offer commercial plans, as members who have lost Medicaid coverage seek alternative coverage elsewhere.
The Inflation Reduction Act of 2022 contains a variety of provisions that have impacted, and continue to impact our business including by extending the American Rescue Plan Act of 2021's enhanced Premium Tax Credits (“PTC”) through 2025; imposing a new corporate alternative minimum tax; providing a one percent excise tax on repurchases of stock; allowing CMS to negotiate prices on a limited set of prescription drugs in Medicare effective in 2026; instituting caps on insulin cost sharing in Medicare; redesigning the Medicare Part D benefit; requiring drug manufacturers to pay rebates if prices increase beyond inflation; and delaying the implementation of the Trump Administration Medicare drug rebate rule until at least 2032. The extension of the enhanced PTC has allowed for growth in Individual Public Exchange enrollment and has supported continuity of coverage since Medicaid eligibility redeterminations resumed in 2023. If Congress does not act to extend the enhanced PTC, they will expire at the end of 2025, which could have a material adverse effect on our business and results of operations.
The Consolidated Appropriations Act of 2021 (the “2021 Appropriations Act”) has impacted our business, including by imposing additional disclosure and reporting requirements related to broker compensation, mental health parity, pharmacy benefits and drug costs, as well as procedures and coverage requirements related to surprise medical bills, provider directory maintenance and continuity of care for certain patients. The requirements applicable to us under the 2021 Appropriations Act had varying effective dates, beginning in December 2021.
The health plan price transparency regulations issued by the U.S. Departments of Health and Human Services, Labor, and Treasury (“the Tri-Agencies”) pursuant to the 2021 Appropriations Act required us to begin disclosing certain pricing information regarding negotiated rates and historical payment information with providers in 2022. Additionally, as directed by law, we make available to members personalized out-of-pocket cost information and underlying negotiated rates.
In September 2024, the Tri-Agencies issued final regulations related to mental health parity that will require health plans to make administrative and operational changes to comply with these final regulations. While some provisions became effective on January 1, 2025, additional guidance from the Tri-Agencies will be necessary to assess the full impact of these regulations on our operations and financial results. Litigation has been filed challenging the final regulation and is pending court action.
The Patient Protection and Affordable Care Act and the Health Care and Education Reconciliation Act of 2010, as amended (collectively, the “ACA”), continues to impact our business and results of operations, including pricing, minimum
medical loss ratios, and the geographies in which our products are available. We also expect further and ongoing regulatory guidance on a number of issues related to Medicare, including evolving methodology for ratings and quality bonus payments. CMS also frequently proposes changes to its program that audits data submitted under the risk adjustment programs in ways that could increase financial recoveries from plans.
For additional discussion regarding regulatory trends and uncertainties, and risk factors that could cause actual results to differ materially from those contained in forward-looking statements made in this Annual Report on Form 10-K, see Part I, Item 1 “Business-Regulation” and Part I, Item 1A “Risk Factors.”
Other Significant Items
Business and Operational Matters
During the third quarter of 2023, based on a strategic review of our operations, assets and investments, management implemented the “2023-2024 Business Efficiency Program” to refine the focus of our investments, and optimize our physical footprint. The 2023-2024 Business Efficiency Program included the write-off of certain information technology assets and contract exit costs, a reduction in staff including the relocation of certain job functions, and the impairment of assets associated with the closure or partial closure of data centers and offices. The 2023-2024 Business Efficiency Program was finalized as of December 31, 2024. For additional information, see Note 4, “Business Optimization Initiatives,” and Note 18, “Leases,” of the Notes to Consolidated Financial Statements included in Part II, Item 8 of this Annual Report on Form 10-K.
Pursuant to CMS’ Medicare Advantage Star Ratings system, CMS annually awards between 1.0 and 5.0 Stars to Medicare Advantage plans based on performance in several categories. Plans must have a Star Rating of 4.0 or higher to qualify for bonus payments. Our 2024 Star Ratings, which are used for payment year 2025, reflect that 53% of our Medicare Advantage members were enrolled in plans rated at least 4.0 Stars or higher. This is an increase, based on subsequent recalculations by CMS, over the original 2024 Star Ratings from October 2023, which reflected that 34% of our Medicare Advantage members were enrolled in plans rated at least 4.0 Stars or higher.
CMS released our 2025 Star Ratings in October 2024, which will be used to determine our Medicare Advantage bonus payments in 2026. Our 2025 Star Ratings reflect that 38% of our Medicare Advantage members were enrolled in plans rated at least 4.0 Stars or higher. We expect this change will result in a reduction to our 2026 operating revenue of approximately $183 million, net of offsets from contracting provisions. Further, we expect to mitigate the financial impact to our 2026 operating gain and net income per share resulting from this change through various strategies such as contract diversification, operating expense efficiencies, capital deployment alternatives and network enhancements.
Business Acquisitions and Divestitures
Investments in Joint Ventures and Completed Acquisitions
On December 31, 2024, we completed our acquisition of Centers Plan for Healthy Living LLC and Centers for Specialty Care Group IPA, LLC (“Centers”). Centers is a managed long-term care plan that serves New York state Medicaid and dual-eligible Medicaid/Medicare members, enabling adults with long-term care needs and disabilities to live safely and independently in their own home. This acquisition aligns with our strategic plan to grow the Health Benefits segment and leverage industry-leading expertise while serving Medicaid and dual-eligible populations.
On December 10, 2024, we completed our acquisition of RSV QOZB LTSS, Inc. and certain affiliated entities (d/b/a CareBridge), a value-based healthcare company that manages home and community-based services for Medicaid and dual-eligible Medicaid/Medicare members receiving long-term services and support. This acquisition aligns with Carelon Services’ care at home strategy, and our vision to be an innovative, valuable, and inclusive healthcare partner by providing care management programs that improve the lives of the people we serve.
On August 6, 2024, as discussed in Note 5 “Investments,” we made an equity investment of $2,580 that resulted in our minority interest ownership of approximately 35% of Augusta Topco Holdings, L.P. (“Mosaic Health”), a joint venture with Clayton, Dubilier & Rice (“CD&R”) that is designed to accelerate innovation in care delivery across multiple regions in the United States by bringing together certain care delivery and enablement assets of Carelon Management Services, LLC (“CMSI Assets”), a Carelon Health business, and two CD&R portfolio businesses, apree health and Millennium Physician Group. Our additional contribution of the CMSI Assets to Mosaic Health was completed on January 1, 2025, for which we received an additional $300 of equity (approximately 5% ownership) in Mosaic Health. The CMSI Assets are included under the captions “Assets held for sale” and “Liabilities held for sale” in our consolidated balance sheets as of December 31, 2024.
On March 11, 2024, we completed our acquisition of Paragon Healthcare, Inc. and its subsidiaries (“Paragon”). Paragon, which operates as part of CarelonRx, provides infusion services and injectable therapies through its omnichannel model of ambulatory infusion centers, home infusion pharmacies, and other specialty pharmacy services. This acquisition aligns with our vision to be an innovative, valuable and inclusive healthcare partner by providing care management programs that improve the lives of the people we serve.
On February 15, 2023, we completed our acquisition of BioPlus Parent, LLC and its subsidiaries (“BioPlus”) from CarepathRx Aggregator, LLC. Prior to the acquisition, BioPlus was one of the largest independent specialty pharmacy organizations in the United States. BioPlus, which operates as part of CarelonRx, seeks to connect payors and providers of specialty pharmaceuticals to meet the medication therapy needs of patients with complex medical conditions. This acquisition aligns with our vision to be an innovative, valuable and inclusive healthcare partner by providing care management programs that improve the lives of the people we serve.
Divestiture
On April 1, 2024, we completed the sale of our life and disability businesses to StanCorp Financial Group, Inc. (“The Standard”), a provider of financial protection products and services for employers and individuals, which resulted in a gain on sale of business of $201 in the year ended December 31, 2024. Upon closing, we and The Standard entered into a product distribution partnership. The related net assets held for sale for the life and disability businesses divested as of December 31, 2023, and the results of operations for such businesses for the year ended December 31, 2024 were not material.
For additional information, see Note 3, “Business Acquisitions and Divestitures,” of the Notes to Consolidated Financial Statements included in Part II, Item 8 of this Annual Report on Form 10-K.
Litigation Matters
We are a defendant in multiple lawsuits that were initially filed in 2012 against the BCBSA and Blue Cross and/or Blue Shield licensees (the “Blue plans”) across the country. Cases filed in 28 states were consolidated into a single, multi-district proceeding captioned In re Blue Cross Blue Shield Antitrust Litigation (“BCBSA Litigation”), that is pending before the U.S. District Court for the Northern District of Alabama (the “Court”). Generally, the lawsuits in the BCBSA Litigation challenge elements of the licensing agreements between the BCBSA and the independently owned and operated Blue plans. The cases were brought by two putative nationwide classes of plaintiffs, health plan subscribers and providers.
The BCBSA and Blue plans approved a settlement agreement and release with the subscriber plaintiffs (the “Subscriber Settlement Agreement”), and the ultimate amount paid by the Company under the Subscriber Settlement Agreement was $604, which was primarily accrued in 2020. The Subscriber Settlement Agreement and the defendants’ payment and non-monetary obligations under the Subscriber Settlement Agreement became effective in June 2024 with the request for the second Blue plan bid provision effective in September 2024. The funds held in escrow will be distributed in accordance with the Subscriber Settlement Agreement.
The BCBSA and the Blue plans have approved a settlement agreement and release (the “Provider Settlement Agreement”) with the provider plaintiffs, and in October 2024, the provider plaintiffs filed a motion for preliminary approval with the Court. The Court granted preliminary approval of the Provider Settlement Agreement on December 4, 2024. If approved by the Court, the Provider Settlement Agreement will require the defendants to make a monetary settlement payment, our portion of which is estimated to be $666, and will contain certain non-monetary terms including (i) expansion of certain opportunities to contract with providers in contiguous service areas, (ii) certain prompt pay commitments, and (iii)
various technological enhancements to the BlueCard program. We recognized our estimated payment obligation under the Provider Settlement Agreement of $666 in September 2024.
For additional information regarding the BCBSA Litigation, see Note 14, “Commitments and Contingencies – Litigation and Regulatory Proceedings – Blue Cross Blue Shield Antitrust Litigation,” of the Notes to Consolidated Financial Statements included in Part II, Item 8 of this Annual Report on Form 10-K.
Selected Operating Performance
During the year ended December 31, 2024, total medical membership decreased by 1.1 million, or 2.3%. The decrease in medical membership was driven primarily by attrition in Medicaid membership, including as a result of eligibility redeterminations and certain market exits, and decreases in our Employer Group risk-based and Medicare Supplement businesses. These decreases were partially offset by increases in our Employer Group fee-based, Individual and FEP® businesses.
Operating revenue for the year ended December 31, 2024, was $175,204, an increase of $4,995, or 2.9%, from the year ended December 31, 2023. The increase in operating revenue was primarily driven by premium rate increases in all of our lines of business in recognition of medical cost trends, growth in CarelonRx product revenue and recent acquisitions. These increases were partially offset by declines in premiums driven by Medicaid membership attrition.
Net income for the year ended December 31, 2024, was $5,971, a decrease of $20, or 0.3%, from the year ended December 31, 2023. The decrease in net income was primarily due to a net decrease in our operating gain in our reportable segments and higher income tax expense, partially offset by increased net investment income, gain on the sale of our life and disability businesses and lower amortization of other intangible assets.
Our fully-diluted shareholders’ EPS for the year ended December 31, 2024, was $25.68, an increase of $0.46, or 1.8%, from the year ended December 31, 2023. Our diluted shares for the year ended December 31, 2024 were 232.9, a decrease of 4.5, or 1.9%, compared to the year ended December 31, 2023. The increase in EPS resulted from fewer diluted shares outstanding.
Operating cash flow for the year ended December 31, 2024, was $5,808, or approximately 1.0 times net income. Operating cash flow for the year ended December 31, 2023 was $8,061, or approximately 1.3 times net income. The decrease in operating cash flow was primarily due to the impact of the membership decline in our Medicaid business and working capital changes.
Membership and Other Metrics
Our medical membership includes the following customer types: Individual, Employer Group risk-based, Employer Group fee-based, BlueCard®, Medicare, Medicaid and our FEP®. We refer to members in our service areas licensed by the BCBSA as our BCBS-branded, or Anthem BCBS, business. Non-BCBS-branded business refers to members in our non-BCBS-branded plans, which include Wellpoint, MMM and Simply Healthcare plans. In addition to the above medical membership, we also serve customers who purchase one or more of our other products or services that are often ancillary to our health business.
•Individual consists of individual customers under age 65 and their covered dependents. Individual policies are generally sold through independent agents and brokers, retail partnerships, our in-house sales force or via the Public Exchanges. Individual business is sold on a risk-based basis. We offer on-exchange products through Public Exchanges and off-exchange products. Federal premium subsidies are available only for certain Public Exchange Individual products. Unsubsidized Individual customers are generally more sensitive to product pricing and, to a lesser extent, the configuration of the network and the efficiency of administration. Customer turnover is generally higher with Individual as compared to Employer Group risk-based. Individual business accounted for 2.8%, 2.2% and 1.7% of our medical members at December 31, 2024, 2023 and 2022, respectively.
•Employer Group risk-based consists of employer customers who purchase products on a full-risk basis, which are products for which we charge a premium and indemnify our policyholders against costs for health benefits. Employer Group risk-based accounts include Local Group customers and National Accounts. Local Group consists of those employer customers with less than 5% of eligible employees located outside of the headquarter state, as
well as customers with more than 5% of eligible employees located outside of the headquarter state with up to 5,000 eligible employees. In addition, Local Group includes Student Health members. National Accounts generally consist of multi-state employer groups primarily headquartered in an Elevance Health service area with at least 5% of the eligible employees located outside of the headquarter state and with more than 5,000 eligible employees. Some exceptions are allowed based on broker and consultant relationships. Employer Group risk-based accounts are generally sold through brokers or consultants who work with industry specialists from our in-house sales force and are offered both on and off the Public Exchanges. Employer Group risk-based accounted for 8.1%, 8.0% and 8.4% of our medical members at December 31, 2024, 2023 and 2022, respectively.
•Employer Group fee-based customers represent employer groups, Local Group, and National Accounts, who purchase fee-based products and elect to retain most or all of the financial risk associated with their employees’ healthcare costs. Some fee-based customers choose to purchase stop loss coverage to limit their retained risk. Employer Group fee-based accounts are generally sold through independent brokers or consultants retained by the customer working with our in-house sales force. Employer Group fee-based accounted for 45.0%, 43.2% and 42.4% of our medical members at December 31, 2024, 2023 and 2022, respectively.
•BlueCard® host customers represent enrollees of Blue Cross and/or Blue Shield plans not owned by Elevance Health who receive healthcare services in our BCBSA licensed markets. BlueCard® membership consists of estimated host members using the national BlueCard® program. Host members are generally members who reside in or travel to a state in which an Elevance Health subsidiary is the Blue Cross and/or Blue Shield licensee and who are covered under an employer-sponsored health plan issued by a non-Elevance Health controlled BCBSA licensee (the “home plan”). We perform certain functions, including claims pricing and administration, for BlueCard® members, for which we receive service fees from the BlueCard® members’ home plans. Other administrative functions, including maintenance of enrollment information and customer service, are performed by the home plan. Host members are computed using, among other things, the average number of BlueCard® claims received per month. BlueCard® host membership accounted for 14.5%, 14.3% and 13.8% of our medical members at December 31, 2024, 2023 and 2022, respectively.
•Medicare customers are Medicare-eligible individual members age 65 and over who have enrolled in Medicare Advantage, including Special Needs Plans (“SNPs”), also known as Medicare Advantage SNPs; dual-eligible programs through Medicare-Medicaid Plans (“MMPs”); Medicare Supplement plans; and Medicare Part D Prescription Drug Plans (“Medicare Part D”). Medicare Advantage plans provide Medicare beneficiaries with a managed care alternative to traditional Medicare and often include a Medicare Part D benefit. In addition, our Medicare Advantage SNPs provide tailored benefits to special needs individuals who are institutionalized or have severe or disabling chronic conditions and to dual-eligible customers, who are low-income seniors and persons under age 65 with disabilities. Medicare Advantage SNPs are coordinated care plans specifically designed to provide targeted care, covering all the healthcare services considered medically necessary for members and often providing professional care coordination services, with personal guidance and programs that help members maintain their health. Medicare Advantage membership also includes Medicare Advantage members in our Group Retiree Solutions business who are retired members of commercial accounts or retired members of groups who are not affiliated with our commercial accounts who have selected a Medicare Advantage product through us. Medicare Supplement plans typically pay the difference between healthcare costs incurred by a beneficiary and amounts paid by Medicare. Medicare Part D offers a prescription drug plan to Medicare and MMP beneficiaries. MMP, which was established as a result of the passage of the ACA, is focused on serving members who are dually eligible for Medicaid and Medicare. Medicare Supplement and Medicare Advantage products are marketed in the same manner, primarily through independent agents and brokers. Medicare program business accounted for 6.5%, 6.3% and 6.1% of our medical members at December 31, 2024, 2023 and 2022, respectively.
•Medicaid membership represents eligible members who receive health benefits through publicly funded healthcare programs, including Medicaid, ACA-related Medicaid expansion programs, Temporary Assistance for Needy Families, programs for seniors and people with disabilities, Children’s Health Insurance Programs, and specialty programs such as those focused on long-term services and support, HIV/AIDS, foster care, behavioral health and/or substance abuse disorders, and intellectual disabilities or developmental disabilities, among others. Total Medicaid program business accounted for 19.5%, 22.4% and 24.3% of our medical members at December 31, 2024, 2023 and 2022, respectively.
•FEP® members consist of United States government employees and their dependents who receive health benefits within our geographic markets. FEP® business accounted for 3.6%, 3.5% and 3.4% of our medical members at December 31, 2024, 2023 and 2022, respectively.
The following table presents our medical membership by customer type as of December 31, 2024, 2023 and 2022. Also included below is other membership by product and other metrics. The membership data and other metrics presented are unaudited and in certain instances include estimates of the number of members represented by each contract at the end of the period. The CarelonRx Quarterly Adjusted Scripts metric represents adjusted script volume based on the number of days a prescription covers. On an adjusted basis, one 90-day script counts the same as three 30-day scripts. The Carelon Services Consumers Served metric represents the number of consumers receiving one or more healthcare related services from Carelon Services who are members of our affiliated health plans as well as those who are members of non-affiliated health plans.
| | | | | | | | | | | | | | | | | | | | | | | | | | | | | | | | | | | | | | | | | |
| | | 2024 vs. 2023 | | 2023 vs. 2022 |
| 2024 | | 2023 | | 2022 | | Change | | % Change | | Change | | % Change |
Medical Membership (in thousands) | | | | | | | | | | | | | |
| Individual | 1,287 | | | 1,025 | | | 789 | | | 262 | | | 25.6 | % | | 236 | | | 29.9 | % |
| Employer Group Risk-Based | 3,713 | | | 3,756 | | | 3,988 | | | (43) | | | (1.1) | % | | (232) | | | (5.8) | % |
| Commercial Risk-Based | 5,000 | | | 4,781 | | | 4,777 | | | 219 | | | 4.6 | % | | 4 | | | 0.1 | % |
BlueCard®1 | 6,630 | | | 6,706 | | | 6,555 | | | (76) | | | (1.1) | % | | 151 | | | 2.3 | % |
| Employer Group Fee-Based | 20,569 | | | 20,227 | | | 20,174 | | | 342 | | | 1.7 | % | | 53 | | | 0.3 | % |
| Commercial Fee-Based | 27,199 | | | 26,933 | | | 26,729 | | | 266 | | | 1.0 | % | | 204 | | | 0.8 | % |
| Medicare Advantage | 2,066 | | | 2,047 | | | 1,977 | | | 19 | | | 0.9 | % | | 70 | | | 3.5 | % |
| Medicare Supplement | 891 | | | 923 | | | 947 | | | (32) | | | (3.5) | % | | (24) | | | (2.5) | % |
| Total Medicare | 2,957 | | | 2,970 | | | 2,924 | | | (13) | | | (0.4) | % | | 46 | | | 1.6 | % |
| Medicaid | 8,917 | | | 10,503 | | | 11,571 | | | (1,586) | | | (15.1) | % | | (1,068) | | | (9.2) | % |
Federal Employee Program® | 1,661 | | | 1,642 | | | 1,623 | | | 19 | | | 1.2 | % | | 19 | | | 1.2 | % |
| Total Medical Membership | 45,734 | | | 46,829 | | | 47,624 | | | (1,095) | | | (2.3) | % | | (795) | | | (1.7) | % |
Other Membership (in thousands)2 | | | | | | | | | | | | | |
| | | | | | | | | | | | | |
| Dental Members | 7,282 | | | 6,820 | | | 6,692 | | | 462 | | | 6.8 | % | | 128 | | | 1.9 | % |
| Dental Administration Members | 1,887 | | | 1,729 | | | 1,586 | | | 158 | | | 9.1 | % | | 143 | | | 9.0 | % |
| Vision Members | 10,419 | | | 9,944 | | | 9,813 | | | 475 | | | 4.8 | % | | 131 | | | 1.3 | % |
| Medicare Part D Standalone Members | 256 | | | 260 | | | 271 | | | (4) | | | (1.5) | % | | (11) | | | (4.1) | % |
| | | | | | | | | | | | | |
Other Metrics (in millions) | | | | | | | | | | | | | |
| CarelonRx Quarterly Adjusted Scripts | 82.9 | | | 78.0 | | | 82.0 | | | 4.9 | | | 6.3 | % | | (4.0) | | | (4.9) | % |
| Carelon Services Consumers Served | 101.1 | | | 103.3 | | | 105.0 | | | (2.2) | | | (2.1) | % | | (1.7) | | | (1.6) | % |
1 BlueCard® membership at December 31, 2023 and 2022 has been restated lower by 132 and higher by 93, respectively, to align to our current reporting, which is the BCBSA reporting methodology.
2 We are no longer presenting our Life and Disability membership following the sale of that business on April 1, 2024.
December 31, 2024 Compared to December 31, 2023
Medical Membership
Total medical membership declined during the twelve months ended December 31, 2024. This was driven primarily by attrition in Medicaid membership, including as a result of eligibility redeterminations and certain market exits, decreases in our Employer Group risk-based and Medicare Supplement businesses. These decreases were partially offset by increases in our Employer Group fee-based, Individual and FEP® businesses.
Other Membership
Our other membership has the potential to be impacted by changes in our medical membership, as our medical members often purchase our other products that are ancillary to our health business. Dental membership increased primarily due to favorable sales in our Individual, Employer Group fee-based and FEP® businesses. Dental Administration membership increased primarily due to favorable in-group change with our other BCBSA plans associated with the FEP®. Vision membership increased due to increased sales in our Employer Group fee-based and Individual businesses and increased sales associated with our Medicare Advantage plans.
Consolidated Results of Operations
Our consolidated summarized results of operations and other information for the years ended December 31, 2024, 2023 and 2022 are as follows:
| | | | | | | | | | | | | | | | | | | | | | | | | | | | | | | | | | | | | | | | | | | | |
| | | | | | | | | Change |
| | | Years Ended December 31 | | 2024 vs. 2023 | | 2023 vs. 2022 |
| | | 2024 | | 2023 | | 2022 | | $ | | % | | $ | | % |
| Total operating revenue | $ | 175,204 | | | $ | 170,209 | | | $ | 155,660 | | | $ | 4,995 | | | 2.9 | % | | $ | 14,549 | | | 9.3 | % |
| Net investment income | 2,051 | | | 1,825 | | | 1,485 | | | 226 | | | 12.4 | % | | 340 | | | 22.9 | % |
| Net losses on financial instruments | (445) | | | (694) | | | (550) | | | 249 | | | (35.9) | % | | (144) | | | 26.2 | % |
| Gain on sales of business | 201 | | | — | | | — | | | 201 | | | 100.0 | % | | — | | | — | % |
| Total revenues | 177,011 | | | 171,340 | | | 156,595 | | | 5,671 | | | 3.3 | % | | 14,745 | | | 9.4 | % |
| Benefit expense | 127,567 | | | 124,330 | | | 116,642 | | | 3,237 | | | 2.6 | % | | 7,688 | | | 6.6 | % |
| Cost of products sold | 19,750 | | | 17,293 | | | 13,035 | | | 2,457 | | | 14.2 | % | | 4,258 | | | 32.7 | % |
| Operating expense | 20,025 | | | 20,087 | | | 17,700 | | | (62) | | | (0.3) | % | | 2,387 | | | 13.5 | % |
Other expense1 | 1,765 | | | 1,915 | | | 1,618 | | | (150) | | | (7.8) | % | | 297 | | | 18.4 | % |
| Total expenses | 169,107 | | | 163,625 | | | 148,995 | | | 5,482 | | | 3.4 | % | | 14,630 | | | 9.8 | % |
| Income before income tax expense | 7,904 | | | 7,715 | | | 7,600 | | | 189 | | | 2.4 | % | | 115 | | | 1.5 | % |
| Income tax expense | 1,933 | | | 1,724 | | | 1,712 | | | 209 | | | 12.1 | % | | 12 | | | 0.7 | % |
| Net income | 5,971 | | | 5,991 | | | 5,888 | | | (20) | | | (0.3) | % | | 103 | | | 1.7 | % |
| Net loss (gain) attributable to noncontrolling interests | 9 | | | (4) | | | 6 | | | 13 | | | NM | | (10) | | | NM |
| Shareholders’ net income | $ | 5,980 | | | $ | 5,987 | | | $ | 5,894 | | | $ | (7) | | | (0.1) | % | | $ | 93 | | | 1.6 | % |
| | | | | | | | | | | | | |
| Average diluted shares outstanding | 232.9 | | | 237.4 | | | 242.8 | | | (4.5) | | | (1.9) | % | | (5.4) | | | (2.2) | % |
| | | | | | | | | | | | | |
| | | | | | | | | | | | | |
| | | | | | | | | | | | | |
| Diluted shareholders’ earnings per share | $ | 25.68 | | | $ | 25.22 | | | $ | 24.28 | | | $ | 0.46 | | | 1.8 | % | | $ | 0.94 | | | 3.9 | % |
| Effective tax rate | 24.5 | % | | 22.3 | % | | 22.5 | % | | | | 200 bp3 | | | | (20) bp3 |
Benefit expense ratio2 | 88.5 | % | | 87.0 | % | | 87.6 | % | | | | 150 bp3 | | | | (60) bp3 |
Operating expense ratio4 | 11.4 | % | | 11.8 | % | | 11.4 | % | | | | (40) bp3 | | | | 40 bp3 |
| Income before income tax expense as a percentage of total revenues | 4.5 | % | | 4.5 | % | | 4.9 | % | | | | 0 bp3 | | | | (40) bp3 |
| Shareholders’ net income as a percentage of total revenues | 3.4 | % | | 3.5 | % | | 3.8 | % | | | | (10) bp3 | | | | (30) bp3 |
| | | | | | | | | | | | | | |
Certain of the following definitions are also applicable to all other results of operations tables in this discussion:
NM Not meaningful.
1Includes interest expense and amortization of other intangible assets.
2Benefit expense ratio represents benefit expense as a percentage of premium revenue. Premiums for the years ended December 31, 2024, 2023 and 2022 were $144,166, $142,854 and $133,229, respectively. Premiums are included in total operating revenue presented above.
3bp = basis point; one hundred basis points = 1%.
4Operating expense ratio represents operating expense as a percentage of total operating revenue.
Year Ended December 31, 2024 Compared to the Year Ended December 31, 2023
Total operating revenue increased primarily as a result of premium rate increases in all of our lines of business in recognition of medical cost trends, growth in CarelonRx product revenue and recent acquisitions. These increases were partially offset by declines in premiums driven by Medicaid membership attrition.
Net investment income increased primarily due to higher income from fixed maturity securities and alternative investments.
Net losses on financial instruments decreased due to increased gains on fixed maturity securities, partially offset by losses on strategic investments and equity securities.
During the twelve months ended December 31, 2024, we experienced a gain on sale of business due to the sale of our life and disability business.
Benefit expense increased primarily due to increases in medical cost trends in our Health Business segment due to Medicaid membership eligibility redeterminations. These increases were partially offset by declines driven by Medicaid membership attrition.
Our benefit expense ratio increased, primarily driven by higher Medicaid membership cost trends due to Medicaid rates being inadequate to cover medical cost trends that were well in excess of historical averages, primarily due to the Medicaid membership redeterminations.
Cost of products sold reflects the cost of pharmaceuticals dispensed by CarelonRx for our unaffiliated pharmacy customers. Cost of products sold increased as a result of higher script utilization.
Operating expense decreased primarily due to disciplined cost management, enhanced efficiency and lower business optimization charges, partially offset by the accrual for the Provider Settlement Agreement associated with the BCBSA Litigation.
Our operating expense ratio decreased primarily due to disciplined cost management, enhanced efficiency, lower business optimization charges and the favorable impact of operating revenue growth, partially offset by the accrual for the Provider Settlement Agreement associated with the BCBSA Litigation.
Other expense decreased primarily due to decreased amortization of intangible assets during the twelve months ended December 31, 2024. During the twelve months ended December 31, 2023, we had increased amortization of other intangible assets as the amortization period of certain assets was shortened to align with the dates our new branding took place.
Our effective income tax rate increased from 22.3% to 24.5%, primarily due to the impact of geographic changes in the mix of our 2024 earnings.
Our shareholders’ net income as a percentage of total revenues slightly decreased in 2024 as compared to 2023 as a result of all the factors discussed above.
Reportable Segments Results of Operations
The following table presents a summary of our reportable segment financial information for the years ended December 31, 2024, 2023 and 2022:
| | | | | | | | | | | | | | | | | | | | | | | | | | | | | | | | | | | | | | | | | | | | | | | |
| | | Years Ended December 31 | | Change |
| | | | 2024 vs. 2023 | | 2023 vs. 2022 |
| | 2024 | | 2023 | | 2022 | | $ | | % | | $ | | % |
| Operating Revenue | | | | | | | | | | | | | | |
| Health Benefits | | $ | 150,275 | | $ | 148,571 | | $ | 138,484 | | $ | 1,704 | | | 1.1 | % | | $ | 10,087 | | | 7.3 | % |
| CarelonRx | | 35,961 | | 33,835 | | 28,526 | | 2,126 | | | 6.3 | % | | 5,309 | | | 18.6 | % |
| Carelon Services | | 17,961 | | 14,147 | | 12,860 | | 3,814 | | | 27.0 | % | | 1,287 | | | 10.0 | % |
| Corporate & Other | | 309 | | 479 | | 399 | | (170) | | | (35.5) | % | | 80 | | | 20.1 | % |
| Eliminations | | (29,302) | | (26,823) | | (24,609) | | (2,479) | | | 9.2 | % | | (2,214) | | | 9.0 | % |
| Total operating revenue | | $ | 175,204 | | $ | 170,209 | | $ | 155,660 | | $ | 4,995 | | | 2.9 | % | | $ | 14,549 | | | 9.3 | % |
| | | | | | | | | | | | | | |
| Operating Gain (Loss) | | | | | | | | | | | | | | |
| Health Benefits | | $ | 6,243 | | $ | 6,888 | | $ | 6,022 | | $ | (645) | | | (9.4) | % | | $ | 866 | | | 14.4 | % |
| CarelonRx | | 2,172 | | 1,975 | | 1,868 | | 197 | | | 10.0 | % | | 107 | | | 5.7 | % |
| Carelon Services | | 717 | | 680 | | 535 | | 37 | | | 5.4 | % | | 145 | | | 27.1 | % |
| Corporate & Other | | (1,270) | | (1,044) | | (142) | | (226) | | | 21.6 | % | | (902) | | | 635.2 | % |
| | | | | | | | | | | | | | | |
| | | | | | | | | | | | | | |
| Operating Margin | | | | | | | | | | | | | | |
| Health Benefits | | 4.2 | % | | 4.6 | % | | 4.3 | % | | | | (40) bp | | | | 30 bp |
| CarelonRx | | 6.0 | % | | 5.8 | % | | 6.5 | % | | | | 20 bp | | | | (70) bp |
| Carelon Services | | 4.0 | % | | 4.8 | % | | 4.2 | % | | | | (80) bp | | | | 60 bp |
| | | | | | | | | | | | | | | |
The following table summarizes Health Benefits operating revenues by Commercial, Medicare, Medicaid and FEP® lines of business for the years ended December 31, 2024, 2023 and 2022: | | | | | | | | | | | | | | | | | | | | | | | | | | | | | | | | | | | | | | | | | | | | | | | |
| | | Years Ended December 31 | | Change |
| | | | 2024 vs. 2023 | | 2023 vs. 2022 |
| | 2024 | | 2023 | | 2022 | | $ | | % | | $ | | % |
| Health Benefits Operating Revenue | | | | | | | | | | | | | | |
| Commercial | | $ | 46,816 | | | $ | 43,266 | | | $ | 41,674 | | | $ | 3,550 | | | 8.2 | % | | $ | 1,592 | | | 3.8 | % |
| Medicare | | 36,795 | | | 35,067 | | | 31,604 | | | 1,728 | | | 4.9 | % | | 3,463 | | | 11.0 | % |
| Medicaid | | | 51,937 | | | 56,601 | | | 52,886 | | | (4,664) | | | (8.2) | % | | 3,715 | | | 7.0 | % |
Federal Employee Program® | | 14,727 | | | 13,637 | | | 12,320 | | | 1,090 | | | 8.0 | % | | 1,317 | | | 10.7 | % |
| Total Health Benefits operating revenues | | $ | 150,275 | | | $ | 148,571 | | | $ | 138,484 | | | $ | 1,704 | | | 1.1 | % | | $ | 10,087 | | | 7.3 | % |
Year Ended December 31, 2024 Compared to the Year Ended December 31, 2023
Health Benefits
Operating revenue increased primarily as a result of higher premium yields driven by premium rate increases in all of our lines of business in recognition of medical cost trends, partially offset by membership attrition in our Medicaid business.
The decrease in operating gain was primarily a result of Medicaid rates being inadequate to cover medical cost trends that were well in excess of historical averages due to Medicaid membership eligibility redeterminations, partially offset by improved premium yields in our other Health Benefits businesses.
CarelonRx
Operating revenue increased primarily as a result of higher prescription volume associated with growth in external pharmacy members and the recent acquisition of Paragon, partially offset by the impact of Medicaid membership attrition.
The increase in operating gain was primarily a result of the growth in product revenue, partially offset by expenses associated with the launch of additional services by CarelonRx.
Carelon Services
Operating revenue increased primarily due to the continued expansion of our medical benefit management, behavioral health and post-acute care services, as well as acquisitions completed in 2024.
The increase in operating gain was primarily driven by improved performance in Carelon Services businesses, partially offset by increased medical cost trends in our post-acute business and the impact of Medicaid membership attrition.
Corporate & Other
The increase in operating loss was primarily due to the accrual recorded for the Provider Settlement Agreement associated with the BCBSA Litigation, partially offset by disciplined cost management and lower business optimization charges.
Critical Accounting Policies and Estimates
We prepare our consolidated financial statements in conformity with GAAP. Application of GAAP requires management to make estimates and assumptions that affect the amounts reported in our consolidated financial statements and accompanying notes and within this MD&A. We consider our most important accounting policies that require significant estimates and management judgment to be those policies with respect to liabilities for medical claims payable, goodwill and other intangible assets and investments, which are discussed below. Our other significant accounting policies are summarized in Note 2, “Basis of Presentation and Significant Accounting Policies,” of the Notes to Consolidated Financial Statements included in Part II, Item 8 of this Annual Report on Form 10-K.
We continually evaluate the accounting policies and estimates used to prepare the consolidated financial statements. In general, our estimates are based on historical experience, evaluation of current trends, information from third-party professionals and various other assumptions that we believe to be reasonable under the known facts and circumstances. Estimates can require a significant amount of judgment, and a different set of assumptions could result in material changes to our reported results.
Medical Claims Payable
The most subjective accounting estimate in our consolidated financial statements is our liability for medical claims payable. At December 31, 2024, this liability was $15,746 and represented 20.9% of our total liabilities. We record this liability and the corresponding benefit expense for incurred but not paid claims, including the estimated costs of processing such claims. Incurred but not paid claims include (1) an estimate for claims that are incurred but not reported; as well as (2) claims reported to us but not yet processed through our systems, which approximated 97.5%, or $15,347, of our total medical claims liability as of December 31, 2024; and (3) claims reported to us and processed through our systems but not yet paid, which approximated 2.5%, or $399 of the total medical claims payable as of December 31, 2024. The level of claims payable processed through our systems but not yet paid may fluctuate from one period-end to the next, from approximately 2% to 6% of our total medical claims liability, due to timing of when claim payments are made.
Liabilities for claims incurred but not reported and reported but not yet processed through our systems are determined in the aggregate, employing actuarial methods that are commonly used by health insurance actuaries and meet Actuarial Standards of Practice. Our reserving practice for claim liabilities is to consistently recognize the appropriate amount of reserve within a level of confidence required by Actuarial Standards of Practice. We determine the amount of the liability for incurred but not yet reported or processed claims by following a detailed actuarial process that uses both historical claim payment patterns as well as emerging medical cost trends to project our best estimate of claim liabilities. Under this process, historical paid claims data is formatted into “claim triangles,” which compare claim incurred dates to the dates of claim
payments. This information is analyzed to create “completion factors” that represent the average percentage of total incurred claims that have been paid through a given date after being incurred. Completion factors are applied to claims paid through the period-end date to estimate the ultimate claim expense incurred for the period. Actuarial estimates of incurred but not paid claim liabilities are then determined by subtracting the actual paid claims from the estimate of the ultimate incurred claims.
For the most recent incurred months (typically the most recent two months), the percentage of claims paid for claims incurred in those months is generally low. This makes the completion factor methodology less reliable for such months. Therefore, incurred claims for recent months are not projected from historical completion and payment patterns; rather, they are projected by estimating the claims expense for those months based on recent claims expense levels and healthcare trend levels (“trend factors”).
Our reserve methodology, which relies upon historical information, must be adjusted to account for known or suspected operational and environmental changes. Adjustments are carried out by our actuaries, drawing on expert knowledge and taking into account their estimate of emerging impacts to benefit costs and payment speed. Factors such as changes in levels of utilization, unit costs, business mix, benefit plan designs, provider reimbursements, processing system modifications, claim inventory levels, claim processing and submission patterns, and operational changes resulting from business combinations are considered when developing our reserve estimates. We also compare prior period liabilities to revised claim liabilities based on subsequent claim development. In these comparisons, methods and assumptions remain constant as reserves are recalculated; rather, the availability of additional paid claims information drives changes in the re-estimate of the unpaid claim liability. To the extent appropriate, changes in such development are recorded as a change to current period benefit expense.
On a regular basis, we review cost trends and utilization assumptions set upon initial establishment of claim liabilities. We utilize subsequent paid claims activity to monitor and continuously adjust the claims liability and benefit expense. If actual results are determined to be materially different than assumptions regarding cost trends and utilization, future periods of our income statement and overall financial position could be impacted. Adjustments made to prior year estimates may result in either an additional benefit expense or a reduction of benefit expense in the period the adjustment is made. The variability of healthcare costs necessitates that claim liabilities be adjusted each period and are sometimes significant compared to the net income recorded in that period. An actuary’s judgment that a portion of the prior period liability is no longer needed or that an additional liability should have been accrued triggers the immediate recognition of prior period development. Once sufficient information is available to ascertain that the re-estimate of the liability is reasonable, the determination is made.
While numerous factors contribute to our medical claims payable liability estimation, the two assumptions having the most significant impact on our incurred but not paid claims liability as of December 31, 2024, were the completion and trend factors. These vital assumptions can be affected by variables such as utilization levels, unit costs, mix of business, benefit plan designs, provider reimbursement levels, processing system conversions and changes, claim inventory levels, claim processing and submission patterns, and operational changes resulting from business combinations.
There is variation in the reasonable choice of completion factors by duration for durations of three months through twelve months where the completion factors have the most significant impact. As previously discussed, completion factors tend to be less reliable for the most recent months and therefore are not specifically utilized for months one and two. In our analysis for the claim liabilities at December 31, 2024, the variability in months three to five was estimated to be between 40 and 90 basis points, while months six through twelve have much lower estimated variability ranging from 0 to 30 basis points.
The difference in completion factor assumptions results in variability of 2%, or approximately $295, in the December 31, 2024 incurred but not paid claims liability, depending on the completion factors chosen. It is important to note that the completion factor methodology inherently assumes that historical completion rates will be reflective of the current period. However, it is possible that the actual completion rates for the current period will develop differently from historical patterns and therefore could fall outside the possible variations described herein.
The other major assumption used in the establishment of the December 31, 2024 incurred but not paid claim liability was the trend factors. In our analysis for the period ended December 31, 2024, there was a 380 basis point differential in the high and low trend factors. This range of trend factors would imply variability of 4%, or approximately $560, in the incurred but
not paid claims liability, depending upon the trend factors used. Because historical trend factors are often not representative of current claim trends, the trend experience for the most recent six to nine months, plus knowledge of recent events likely affecting current trends, have been taken into consideration in establishing the incurred but not paid claims liability at December 31, 2024.
See Note 12, “Medical Claims Payable,” of the Notes to Consolidated Financial Statements included in Part II, Item 8 of this Annual Report on Form 10-K, for a reconciliation of the beginning and ending balance for medical claims payable for the years ended December 31, 2024, 2023 and 2022. Components of the total incurred claims for each year include amounts accrued for current year estimated claims expense as well as adjustments to prior year estimated accruals. In Note 12, “Medical Claims Payable,” the line labeled “Net incurred medical claims: Prior years redundancies” accounts for those adjustments made to prior year estimates. The impact of any reduction of “Net incurred medical claims: Prior years redundancies” may be offset as we establish the estimate of “Net incurred medical claims: Current year”, or as we establish liabilities for premium refunds based upon the minimum medical loss ratio (“MLR”), the relative health risk of members, and other contractual or regulatory requirements. Our reserving practice is to consistently recognize the actuarial best estimate of our ultimate liability for our claims. When we recognize a release of the redundancy, we disclose the amount that is not in the ordinary course of business, if material.
The ratio of current year medical claims paid as a percent of current year net medical claims incurred was 88.5% for 2024, 88.0% for 2023 and 87.3% for 2022. This ratio serves as an indicator of claims processing speed whereby 2024 claims were processed at a similar speed to 2023 and 2022.
We calculate the percentage of prior year redundancies in the current year as a percent of prior year net incurred claims payable less prior year redundancies in the current year in order to demonstrate the development of the prior year reserves. For the year ended December 31, 2024, this metric was 12.3%, largely driven by favorable completion factor development from 2023 as well as favorable trend factor development at the end of 2023. For the year ended December 31, 2023, this metric was 11.4% and was largely driven by favorable trend factor development at the end of 2022 as well as favorable completion factor development from 2022. For the year ended December 31, 2022, this metric was 7.0% and was largely driven by favorable trend factor development at the end of 2021.
We calculate the percentage of prior year redundancies in the current year as a percent of prior year net incurred medical claims to indicate the percentage of redundancy included in the preceding year calculation of current year net incurred medical claims. We believe this calculation supports the reasonableness of our prior year estimate of incurred medical claims. For the year ended December 31, 2024, this metric was 1.4%, which was calculated using the redundancy of $1,731. This metric was 1.4% for 2023 and 0.9% for 2022.
The following table shows the variance between total net incurred medical claims as reported in Note 12, “Medical Claims Payable,” of the Notes to Consolidated Financial Statements included in Part II, Item 8 of this Annual Report on Form 10-K, for each of 2023 and 2022 and the incurred claims for such years had it been determined retrospectively (computed as the difference between “net incurred medical claims – current year” for the year shown and “net incurred medical claims – prior years redundancies” for the immediately following year): | | | | | | | | | | | |
| | Years Ended December 31 |
| | 2023 | | 2022 |
| Total net incurred medical claims, as reported | $ | 120,227 | | | $ | 112,545 | |
| Retrospective basis, as described above | 120,067 | | | 111,843 | |
| Variance | $ | 160 | | | $ | 702 | |
| Variance to total net incurred medical claims, as reported | 0.1 | % | | 0.6 | % |
Given that our business is primarily short tailed (which means that medical claims are generally paid within twelve months of the member receiving service from the provider), the variance to total net incurred medical claims, as reported above, is used to assess the reasonableness of our estimate of ultimate incurred medical claims for a given calendar year with the benefit of one year of experience. We expect that substantially all of the development of the 2024 estimate of medical claims payable will be known during 2025.
The 2023 variance to total net incurred medical claims, as reported, of 0.1% was less than the 2022 percentage of 0.6%. This was primarily driven by the fact that the change in prior year redundancy reported for 2023 as compared to 2022 was less than the change in the prior year redundancy reported for 2022 as compared to 2021.
Goodwill and Other Intangible Assets
Our total goodwill and other intangible assets at December 31, 2024 were $40,371, and represented 34.5% of our total assets and 97.5% of our total equity at December 31, 2024.
We follow FASB guidance for business combinations and goodwill and other intangible assets, which specifies the types of acquired intangible assets that are required to be recognized and reported separately from goodwill. Under the guidance, goodwill and other intangible assets (with indefinite lives) are not amortized but are tested for impairment at least annually. Furthermore, goodwill and other intangible assets are allocated to reporting units for purposes of the annual impairment test. Our impairment tests require us to make assumptions and judgments regarding the estimated fair value of our reporting units, which include goodwill and other intangible assets. In addition, certain other intangible assets with indefinite lives, such as trademarks, are also tested separately.
We complete our annual impairment tests of existing goodwill and other intangible assets with indefinite lives during the fourth quarter of each year. These tests involve the use of estimates related to the fair value of goodwill at the reporting unit level and other intangible assets with indefinite lives, and require a significant degree of management judgment and the use of subjective assumptions. Certain interim impairment tests are also performed when potential impairment indicators exist or changes in our business or other triggering events occur. We have the option of first performing a qualitative assessment for each reporting unit to determine whether it is more likely than not that the fair value of a reporting unit is less than its carrying amount, which is an indication that our goodwill may be impaired. These qualitative impairment tests include assessing events and factors that could affect the fair value of the indefinite-lived intangible assets. Our procedures include assessing our financial performance, macroeconomic conditions, industry and market considerations, various asset specific factors and entity specific events. If we determine that a reporting unit’s goodwill may be impaired after utilizing these qualitative impairment analysis procedures, we are required to perform a quantitative impairment test.
Our quantitative impairment test utilizes the projected income and market valuation approaches for goodwill and the projected income approach for our indefinite lived intangible assets. Use of the projected income and market valuation approaches for our goodwill impairment test reflects our view that both valuation methodologies provide a reasonable estimate of fair value. The projected income approach is developed using assumptions about future revenue, expenses and net income derived from our internal planning process. These estimated future cash flows are then discounted. Our assumed discount rate is based on our industry’s weighted-average cost of capital. Market valuations are based on observed multiples of certain measures including revenue; earnings before interest, taxes, depreciation and amortization; and book value of invested capital (debt and equity) and include market comparisons to publicly traded companies in our industry.
We did not incur any impairment losses as a result of our 2024 annual impairment tests, as it was determined that it is more likely than not that the estimated fair values of our reporting units were substantially in excess of the carrying values as of December 31, 2024. Additionally, we do not believe that the estimated fair values of our reporting units are at risk of becoming impaired in the next twelve months.
If estimated fair values are less than the carrying values of goodwill and other intangibles with indefinite lives in future annual impairment tests, or if significant impairment indicators are noted relative to other intangible assets subject to amortization, we may be required to record impairment losses against future income.
For additional information, see Note 3, “Business Acquisitions and Divestitures,” and Note 10, “Goodwill and Other Intangible Assets,” of the Notes to Consolidated Financial Statements included in Part II, Item 8 of this Annual Report on Form 10-K.
Investments
Current and long-term marketable investment securities were $27,428 at December 31, 2024 and represented 23.5% of our total consolidated assets at December 31, 2024. We classify fixed maturity securities in our investment portfolio as “available-for-sale” and report those securities at fair value. Most fixed maturity securities are available to support current
operations and, accordingly, we classify such investments as current assets without regard to their contractual maturity. Investments used to satisfy contractual, regulatory or other requirements are classified as long-term, without regard to contractual maturity.
Our impairment review is subjective and requires a high degree of judgment. We conduct this review on a quarterly basis, using both qualitative and quantitative factors. Such factors considered include the extent to which a security’s market value has been less than its cost, the reasons for the decline in value (i.e., credit event compared to liquidity, general credit spread widening, currency exchange rate or interest rate factors), financial condition and near term prospects of the issuer, including the credit ratings and changes in the credit ratings of the issuer, recommendations of investment advisors, and forecasts of economic, market or industry trends.
If a fixed maturity security is in an unrealized loss position and we have the intent to sell the fixed maturity security, or it is more likely than not that we will have to sell the fixed maturity security before recovery of its amortized cost basis, we write down the fixed maturity security’s cost basis to fair value and record an impairment loss in our consolidated statements of income. For impaired fixed maturity securities that we do not intend to sell or if it is more likely than not that we will not have to sell such securities, but we expect that we will not fully recover the amortized cost basis, we recognize the credit component of the impairment as an allowance for credit loss in our consolidated balance sheets and record an impairment loss in our consolidated statements of income. The non-credit component of the impairment is recognized in accumulated other comprehensive (loss) income. Furthermore, unrealized losses entirely caused by non-credit-related factors related to fixed maturity securities for which we expect to fully recover the amortized cost basis continue to be recognized in accumulated other comprehensive (loss) income.
The credit component of an impairment is determined primarily by comparing the net present value of projected future cash flows with the amortized cost basis of the fixed maturity security. The net present value is calculated by discounting our best estimate of projected future cash flows at the effective interest rate implicit in the fixed maturity security at the date of purchase. For mortgage-backed and asset-backed securities, cash flow estimates are based on assumptions regarding the underlying collateral, including prepayment speeds, vintage, type of underlying asset, geographic concentrations, default rates, recoveries and changes in value. For all other securities, cash flow estimates are driven by assumptions regarding probability of default, including changes in credit ratings and estimates regarding timing and amount of recoveries associated with a default.
We have a committee of accounting and investment associates and management that is responsible for managing the impairment review process. We believe that we have adequately reviewed our investment securities for impairment and that our investment securities are carried at fair value. We have established an allowance for credit loss and recorded credit loss expense as a reflection of our expected impairment losses. Given the inherent uncertainty of changes in market conditions and the significant judgments involved, there is continuing risk that declines in fair value may occur and additional impairment losses on investments may be recorded in future periods.
In addition to marketable investment securities, we held additional long-term investments of $9,749, or 8.3% of total consolidated assets, at December 31, 2024. These long-term investments consisted primarily of certain other equity investments, the cash surrender value of corporate-owned life insurance policies, notes receivables and mortgage loans. Due to their less liquid nature, these investments are classified as long-term.
Through our investing activities, we are exposed to financial market risks, including those resulting from changes in interest rates and changes in equity market valuations. We manage market risks through our investment policy, which establishes credit quality limits and limits on investments in individual issuers. Ineffective management of these risks could have an impact on our future results of operations and financial condition. Our investment portfolio includes fixed maturity securities with a fair value of $26,236 at December 31, 2024. The weighted-average credit rating of these securities was “A” as of December 31, 2024. Included in this balance are investments in fixed maturity securities of states, municipalities and political subdivisions of $835 that are guaranteed by third parties. With the exception of 14 securities with a fair value of $8, these securities are all investment-grade and carry a weighted-average credit rating of “AA” as of December 31, 2024. The securities are guaranteed by a number of different guarantors, and we do not have any material exposure to any single guarantor, neither indirectly through the guarantees, nor directly through investment in the guarantor. Further, the weighted-average credit rating of the fixed maturity securities without a guarantee, for which such information is available, was “A” as of December 31, 2024.
Fair values of fixed maturity and equity securities are based on quoted market prices, where available. These fair values are obtained primarily from third-party pricing services, which generally use Level I or Level II inputs for the determination of fair value in accordance with FASB guidance for fair value measurements and disclosures. We have controls in place to review the pricing services’ qualifications and procedures used to determine fair values. In addition, we periodically review the pricing services’ pricing methodologies, data sources and pricing inputs to ensure the fair values obtained are reasonable.
We obtain quoted market prices for each security from the pricing services, which are derived through recently reported trades for identical or similar securities, making adjustments through the reporting date based upon available market observable information. For securities not actively traded, the pricing services may use quoted market prices of comparable instruments or discounted cash flow analyses, incorporating inputs that are currently observable in the markets for similar securities. Inputs that are often used in these valuation methodologies include, but are not limited to, broker quotes, benchmark yields, credit spreads, default rates and prepayment speeds. As we are responsible for the determination of fair value, we perform analysis on the prices received from the pricing services to determine whether the prices are reasonable estimates of fair value. Our analysis includes procedures such as a review of month-to-month price fluctuations and price comparisons to secondary pricing services. There were no adjustments to quoted market prices obtained from the pricing services during the years ended December 31, 2024 and 2023.
In certain circumstances, it may not be possible to derive pricing model inputs from observable market activity, and therefore, such inputs are estimated internally. Such securities are designated Level III in accordance with FASB guidance. Securities designated Level III at December 31, 2024 totaled $872 and represented approximately 2.6% of our total assets measured at fair value on a recurring basis. Our Level III securities primarily consisted of certain corporate securities and equity securities for which observable inputs were not always available and the fair values of these securities were estimated using inputs including, but not limited to, prepayment speeds, credit spreads, default rates and benchmark yields.
For additional information, see Part II, Item 7A, “Quantitative and Qualitative Disclosures about Market Risk” of this Annual Report on Form 10-K and Note 2, “Basis of Presentation and Significant Accounting Policies,” Note 5, “Investments,” and Note 7, “Fair Value,” of the Notes to Consolidated Financial Statements included in Part II, Item 8 of this Annual Report on Form 10-K.
New Accounting Pronouncements
For information regarding new accounting pronouncements that were issued or became effective during the year ended December 31, 2024 that had, or are expected to have, a material impact on our financial position, results of operations or financial statement disclosures, see the “Recently Adopted Accounting Guidance” and “Recent Accounting Guidance Not Yet Adopted” sections of Note 2, “Basis of Presentation and Significant Accounting Policies,” of the Notes to Consolidated Financial Statements included in Part II, Item 8 of this Annual Report on Form 10-K.
Liquidity and Capital Resources
Introduction
Our cash receipts result primarily from premiums, product revenue, service fees, investment income, proceeds from the sale or maturity of our investment securities, proceeds from business divestitures, proceeds from borrowings and proceeds from the issuance of common stock under our employee stock plans. Cash disbursements result mainly from claims payments, operating expenses, taxes, purchases of investment securities, interest expense, payments on borrowings, acquisitions, capital expenditures, repurchases of our debt securities and common stock and the payment of cash dividends. Cash outflows fluctuate with the amount and timing of settlement of these transactions. Any future decline in our profitability would likely have an unfavorable impact on our liquidity.
We manage our cash, investments and capital structure so that we are able to meet the short-term and long-term obligations of our business while maintaining financial flexibility and liquidity. We forecast, analyze and monitor our cash flows to enable investment and financing within the overall constraints of our financial strategy.
A substantial portion of the assets held by our regulated subsidiaries are in the form of cash and cash equivalents and investments. After considering expected cash flows from operating activities, we generally invest cash that exceeds our near-term obligations in longer term marketable fixed maturity securities to improve our overall investment income returns. Our investment strategy is to make investments consistent with insurance statutes and other regulatory requirements, while preserving our asset base. Our investments are generally available-for-sale to meet liquidity and other needs. Our subsidiaries pay out excess capital annually in the form of dividends to their respective parent companies for general corporate use, as permitted by applicable regulations.
The availability of financing in the form of debt or equity is influenced by many factors, including our profitability, operating cash flows, debt levels, debt ratings, contractual restrictions, regulatory requirements and market conditions. The securities and credit markets have in the past experienced higher than normal volatility. Interest rates on fixed debt income securities have increased since the beginning of 2022, which may increase our borrowing costs if we elect to issue debt. During recent years, the federal government and various governmental agencies have taken a number of steps to strengthen the regulation of the financial services market. In addition, governments around the world have developed their own plans to provide stability and security in the credit markets and to ensure adequate capital in certain financial institutions.
A summary of our major sources and uses of cash and cash equivalents for the years ended December 31, 2024, 2023 and 2022 is as follows: | | | | | | | | | | | | | | | | | | | | | | | | | | | | | |
| | Years Ended December 31 | | $ Change |
| | 2024 | | 2023 | | 2022 | | 2024 vs. 2023 | | 2023 vs. 2022 |
| Sources of Cash: | | | | | | | | | |
| Net cash provided by operating activities | $ | 5,808 | | | $ | 8,061 | | | $ | 8,399 | | | $ | (2,253) | | | $ | (338) | |
| Proceeds from sales, maturities, calls and redemptions of investments, net of purchases | 586 | | | — | | | — | | | 586 | | | — | |
| Issuances of short- and long-term debt, net of repayments | 6,200 | | | 626 | | | 862 | | | 5,574 | | | (236) | |
| Issuances of common stock under employee stock plans | 221 | | | 152 | | | 182 | | | 69 | | | (30) | |
| Other sources of cash, net | — | | | — | | | 762 | | | — | | | (762) | |
| Total sources of cash | 12,815 | | | 8,839 | | | 10,205 | | | 3,976 | | | (1,366) | |
| Uses of Cash: | | | | | | | | | |
| Purchases of investments, net of proceeds from sales, maturities, calls and redemptions | — | | | (2,700) | | | (2,338) | | | 2,700 | | | (362) | |
| Repurchase and retirement of common stock | (2,900) | | | (2,676) | | | (2,316) | | | (224) | | | (360) | |
| Purchases of subsidiaries, net of cash acquired | (4,809) | | | (1,552) | | | (649) | | | (3,257) | | | (903) | |
| Purchases of property and equipment | (1,256) | | | (1,296) | | | (1,152) | | | 40 | | | (144) | |
| | | | | | | | | |
| Cash dividends | (1,508) | | | (1,395) | | | (1,229) | | | (113) | | | (166) | |
| Other uses of cash, net | (508) | | | (80) | | | — | | | (428) | | | (80) | |
| Total uses of cash | (10,981) | | | (9,699) | | | (7,684) | | | (1,282) | | | (2,015) | |
| Effect of foreign exchange rates on cash and cash equivalents | (6) | | | (1) | | | (14) | | | (5) | | | 13 | |
| Net increase (decrease) in cash and cash equivalents | $ | 1,828 | | | $ | (861) | | | $ | 2,507 | | | $ | 2,689 | | | $ | (3,368) | |
Liquidity—Year Ended December 31, 2024 Compared to Year Ended December 31, 2023
The decline in cash provided by operating activities was primarily due to the impact of the membership decline in our Medicaid business and working capital changes.
Other significant changes in sources and uses of cash year-over-year included (a) additional sources of cash from issuances of short- and long-term debt, net of repayments, proceeds from sales, maturities, calls and redemptions of investments, net of purchases, and issuances of common stock under employee stock plans and (b) increased uses of cash from purchases of subsidiaries, net of cash acquired, the repurchase and retirement of common stock, the purchase of property and equipment, cash dividends, and other uses of cash, net.
Financial Condition
We maintained a strong financial condition and liquidity position, with consolidated cash, cash equivalents and investments in fixed maturity and equity securities of $35,716 at December 31, 2024. Since December 31, 2023, total cash, cash equivalents and investments in fixed maturity and equity securities decreased by $1,529, primarily due to cash used for common stock repurchases, purchases of subsidiaries net of cash acquired, purchases of property and equipment and cash dividends paid to shareholders. This decrease was partially offset by cash generated from operations, issuances of short-and-long term debt, net of repayment, proceeds from sales, maturities, calls, and redemptions, and issuances of common stock.
Many of our subsidiaries are subject to various government regulations that restrict the timing and amount of dividends and other distributions that may be paid to their respective parent companies. Certain accounting practices prescribed by insurance regulatory authorities, or statutory accounting practices, differ from GAAP. Changes that occur in statutory accounting practices, if any, or other regulatory requirements, could impact our subsidiaries’ future dividend capacity. In addition, we have agreed to certain undertakings to regulatory authorities, including the requirement to maintain certain capital levels in certain of our subsidiaries.
At December 31, 2024, we held $2,357 of cash, cash equivalents and investments at the parent company, which are available for general corporate use, including investment in our businesses, acquisitions, potential future common stock repurchases and dividends to shareholders, repurchases of debt securities and debt and interest payments.
Periodically, we access capital markets and issue debt (“Notes”) for long-term borrowing purposes, for example, to refinance debt, to finance acquisitions or for share repurchases. Certain of these Notes may have a call feature that allows us to redeem the Notes at any time at our option and/or a put feature that allows a Note holder to redeem the Notes upon the occurrence of both a change in control event and a downgrade of the Notes below an investment grade rating. For more information on our debt, including redemptions and issuances, see Note 13, “Debt,” of the Notes to Consolidated Financial Statements included in Part II, Item 8 of this Annual Report on Form 10-K.
We calculate our consolidated debt-to-capital ratio, a non-GAAP measure, from the amounts presented on our audited consolidated balance sheets included in Part II, Item 8 of this Annual Report on Form 10-K. Our debt-to-capital ratio is calculated as total debt divided by total debt plus total equity. Total debt is the sum of short-term borrowings, current portion of long-term debt and long-term debt, less current portion. We believe our debt-to-capital ratio assists investors and rating agencies in measuring our overall leverage and additional borrowing capacity. In addition, our bank covenants include a maximum debt-to-capital ratio that we cannot and did not exceed. Our debt-to-capital ratio may not be comparable to similarly titled measures reported by other companies. Our consolidated debt-to-capital ratio was 43.0% and 38.9% as of December 31, 2024 and 2023, respectively.
Our senior debt is rated “A” by S&P Global Ratings, “BBB+” by Fitch Ratings, Inc., “Baa2” by Moody’s Investors Service, Inc. and “bbb+” by AM Best Company, Inc. We intend to maintain our senior debt investment grade ratings. If our credit ratings are downgraded, our business, liquidity, financial condition and results of operations could be adversely impacted by limitations on future borrowings and a potential increase in our borrowing costs.
Capital Resources
We have a shelf registration statement on file with the U.S. Securities and Exchange Commission to register an unlimited amount of any combination of debt or equity securities in one or more offerings. Specific information regarding terms and securities being offered will be provided at the time of an offering. Proceeds from future offerings are expected to be used for general corporate purposes, including, but not limited to, the repayment of debt, investments in or extensions of credit to our subsidiaries and the financing of possible acquisitions or business expansions.
We have a senior revolving credit facility (the “5-Year Facility”) with a group of lenders for general corporate purposes. The 5-Year Facility provides credit of up to $4,000 and matures in April 2027. Our ability to borrow under the 5-Year Facility is subject to compliance with certain covenants, including covenants requiring us to maintain a defined debt-to-capital ratio of not more than 60%, subject to increase in certain circumstances set forth in the credit agreement for the 5-Year Facility. As of December 31, 2024, our debt-to-capital ratio, as defined and calculated under the 5-Year Facility, was 43.0%. We do not believe the restrictions contained in our 5-Year Facility covenants materially affect our financial or operating
flexibility. As of December 31, 2024, we were in compliance with all of our debt covenants under the 5-Year Facility. There were no amounts outstanding under the 5-Year Facility at December 31, 2024.
We have an authorized commercial paper program of up to $4,000, the proceeds of which may be used for general corporate purposes. Should commercial paper issuance become unavailable, we have the ability to use a combination of cash on hand and/or our 5-Year Facility, which provides for credit in the amount of $4,000, to redeem any outstanding commercial paper upon maturity. At December 31, 2024, we had $0 outstanding under our commercial paper program. Beginning June 30, 2023, we have reclassified our commercial paper balances from long-term debt to short-term debt as our intent is to not replace short-term commercial paper outstanding at expiration with additional short-term commercial paper for an uninterrupted period extending for more than one year.
While there is no assurance in the current economic environment, we believe the lenders participating in our 5-Year Facility, if market conditions allow, would be willing to provide financing in accordance with their legal obligations.
We are a member, through certain subsidiaries, of the Federal Home Loan Bank of Indianapolis, the Federal Home Loan Bank of Cincinnati, the Federal Home Loan Bank of Atlanta and the Federal Home Loan Bank of New York (collectively the “FHLBs”). As a member, we have the ability to obtain short-term cash advances, subject to certain minimum collateral requirements. At December 31, 2024, we had $365 of outstanding short-term borrowings from the FHLBs.
As discussed in “Financial Condition” above, many of our subsidiaries are subject to various government regulations that restrict the timing and amount of dividends and other distributions that may be paid. Based upon these requirements, we currently estimate that approximately $2,700 of dividends will be paid to us by our subsidiaries during 2025. During 2024, we received $6,322 of dividends from our subsidiaries.
In addition to regulations regarding the timing and amount of dividends, our regulated subsidiaries’ states of domicile have statutory risk-based capital (“RBC”) requirements for health and other insurance companies and health maintenance organizations largely based on the National Association of Insurance Commissioners (the “NAIC”) Risk-Based Capital (RBC) for Health Organizations Model Act (the “RBC Model Act”). These RBC requirements are intended to measure capital adequacy, taking into account the risk characteristics of an insurer’s investments and products. The NAIC sets forth the formula for calculating the RBC requirements, which are designed to take into account asset risks, insurance risks, interest rate risks and other relevant risks with respect to an individual insurance company’s business. In general, under the RBC Model Act, an insurance company must submit a report of its RBC level to the state insurance department or insurance commissioner, as appropriate, at the end of each calendar year. Our regulated subsidiaries’ respective RBC levels as of December 31, 2024 were in excess of all applicable mandatory RBC requirements. In addition to exceeding these RBC requirements, we are in compliance with the liquidity and capital requirements for a licensee of the BCBSA and with the tangible net worth requirements applicable to certain of our California subsidiaries. For additional information, see Note 22, “Statutory Information,” of the Notes to Consolidated Financial Statements included in Part II, Item 8 of this Annual Report on Form 10-K.
Future Sources and Uses of Liquidity
Short-Term Liquidity Requirements
As previously described, our cash disbursements result mainly from claims payments, administrative expenses, taxes, purchases of investment securities, interest expense, payments on borrowings, acquisitions, capital expenditures, repurchases of our debt securities and common stock and the payment of cash dividends. We believe cash on hand, operating cash receipts, investments and amounts available under our commercial paper program, our 5-Year Facility and borrowings available from the FHLBs will be adequate to fund our expected cash disbursements over the next twelve months.
Long-Term Liquidity Requirements
As of December 31, 2024, our long-term cash disbursements required under various contractual obligations and commitments were:
•Debt and interest expense: Future debt and estimated interest payments are $52,073, with $2,855 due within the next twelve months. For additional information, see Note 13, “Debt,” of the Notes to Consolidated Financial Statements included in Part II, Item 8 of this Annual Report on Form 10-K.
•Operating leases: We lease office space and certain computer equipment, for which the future estimated payments were $886, with $184 due within the next twelve months. For additional information, see Note 18, “Leases,” of the Notes to Consolidated Financial Statements included in Part II, Item 8 of this Annual Report on Form 10-K.
•Other liabilities: These liabilities primarily consist of future policy reserves, projected other postretirement benefits, deferred compensation, supplemental executive retirement plan liabilities and certain other miscellaneous long-term obligations. Amounts due within twelve months were $35, with $1,956 due in future periods. Estimated future payments for funded pension benefits have been excluded from these numbers, as we had no funding requirements under the Employee Retirement Income Security Act of 1974, as amended, at December 31, 2024, as a result of the value of the assets in the plans. In addition, gross liabilities for uncertain tax positions and interest for which we cannot reasonably estimate the timing of the resolutions with the respective taxing authorities have not been included. For further information, see Note 8, “Income Taxes,” of the Notes to Consolidated Financial Statements included in Part II, Item 8 of this Annual Report on Form 10-K.
•Purchase obligations: These obligations include estimated payments for future services under contractual arrangements from third-party service vendors. Amounts due within the next twelve months for these purchase obligations were $995, while longer term payments were $3,891. For further information, see Note 14, “Commitments and Contingencies,” of the Notes to Consolidated Financial Statements included in Part II, Item 8 of this Annual Report on Form 10-K.
•Investment commitments: These include unfunded capital commitments for alternative investments and low-income housing tax credits. Estimated amounts due were $1,444, including $409 due within the next twelve months.
In addition to the contractual obligations and commitments discussed above, we have a variety of other contractual agreements related to acquiring materials and services used in our operations. However, we do not believe these other agreements contain material noncancelable commitments.
We regularly review the appropriate use of capital, including acquisitions, common stock and debt security repurchases and dividends to shareholders. The declaration and payment of any dividends or repurchases of our common stock or debt is at the discretion of our Board of Directors and depends upon our financial condition, results of operations, future liquidity needs, regulatory and capital requirements and other factors deemed relevant by our Board of Directors.
On January 22, 2025, our Audit Committee declared a quarterly cash dividend to shareholders of $1.71 per share on the outstanding shares of our common stock. This quarterly dividend is payable on March 25, 2025 to the shareholders of record as of March 10, 2025.
Under our Board of Directors’ authorization, we maintain a common stock repurchase program. As of December 31, 2024, we had Board authorization of $9,300 to repurchase our common stock. No duration has been placed on our common stock repurchase program, and we reserve the right to discontinue the program at any time. We intend to utilize this authorization over a multi-year period, subject to market and industry conditions.
We believe that funds from future operating cash flows, cash and investments and funds available under our credit facilities and/or from public or private financing sources will be sufficient for future operations and commitments, and for capital acquisitions and other strategic transactions.
Other than disclosed in the Notes to Consolidated Financial Statements included in Part II, Item 8 of this Annual Report on Form 10-K, we do not have any off-balance sheet derivative instruments, guarantee transactions, agreements or other contractual arrangements or any indemnification agreements that will require funding in future periods. We have not transferred assets to an unconsolidated entity that serves as credit, liquidity or market risk support to such entity. We do not hold any variable interest in an unconsolidated entity where such entity provides us with financing, liquidity, market risk or
credit risk support. See Note 2, “Subsidiary Transactions,” of the Notes to Condensed Financial Statements (Parent Company Only) included in Part IV, Item 15 of this Annual Report on Form 10-K for additional detail on the Elevance Health, Inc. parent guarantees of certain subsidiaries.
ITEM 7A. QUANTITATIVE AND QUALITATIVE DISCLOSURES ABOUT MARKET RISK.
(In Millions, Except As Otherwise Stated Herein)
As a result of our investing and borrowing activities, we are exposed to financial market risks, including those resulting from changes in interest rates and changes in market valuations. Potential impacts discussed below are based upon sensitivity analyses performed on our financial position as of December 31, 2024. Actual results could vary from these estimates. Our primary objectives with our investment portfolio are to provide safety and preservation of capital, sufficient liquidity to meet cash flow requirements, the integration of investment strategy with the business operations and an attainment of a competitive after-tax total return.
Investments
Our investment portfolio is exposed to three primary sources of risk: credit quality risk, interest rate risk and market valuation risk.
The primary risks associated with our fixed maturity securities, which are classified as available-for-sale, are credit quality risk and interest rate risk. Credit quality risk is defined as the risk of a credit event, such as a ratings downgrade or default, to an individual fixed maturity security and the potential loss attributable to that event. Credit quality risk is managed through our investment policy, which establishes credit quality limitations on the overall portfolio as well as diversification and percentage limits on securities of individual issuers. The result is a well-diversified portfolio of fixed maturity securities, with an average credit rating of approximately “A.” Interest rate risk is defined as the potential for economic losses on fixed maturity securities due to a change in market interest rates. Our fixed maturity portfolio is invested primarily in U.S. government securities, corporate bonds, asset-backed bonds, mortgage-related securities and municipal bonds, all of which have exposure to changes in the level of market interest rates. Interest rate risk is managed by maintaining asset duration within a band based upon our liabilities, operating performance and liquidity needs. Additionally, we have the capability of holding any security to maturity, which would allow us to realize full par value.
Investments in fixed maturity securities include corporate securities, which account for 53% of our total fixed maturity securities at December 31, 2024 and are subject to credit/default risk. In a declining economic environment, corporate yields will usually increase, prompted by concern over the ability of corporations to make interest payments, thus causing a decrease in the price of corporate securities, and the decline in value of the corporate fixed maturity portfolio. We manage this risk through fundamental credit analysis, diversification of issuers and industries and an average credit rating of our corporate fixed maturity portfolio of approximately “BBB.”
Market risk for fixed maturity securities is addressed by actively managing the duration, allocation and diversification of our investment portfolio. We have evaluated the impact on the fixed maturity portfolio’s fair value considering an immediate 100 basis point change in interest rates. A 100 basis point increase in interest rates would result in an approximate $1,424 decrease in fair value, whereas a 100 basis point decrease in interest rates would result in an approximate $1,527 increase in fair value. While we classify our fixed maturity securities as “available-for-sale” for accounting purposes, we believe our cash flows and the duration of our portfolio should allow us to hold securities to maturity, thereby avoiding the recognition of losses should interest rates rise significantly.
Our equity portfolio is comprised of large capitalization and small capitalization exchange-traded funds, domestic equities, foreign equities and index mutual funds. Our equity portfolio is subject to the volatility inherent in the stock market, driven by concerns over economic conditions, earnings and sales growth, inflation, and consumer confidence. These systemic risks cannot be managed through diversification alone. However, more routine risks, such as stock/industry specific risks, are managed by investing in a diversified equity portfolio.
Our other invested assets, reported within our long-term investments, are primarily subject to private market exposures, including private equity and private credit investments. These investments are also subject to credit quality risk, interest rate risk and market valuation risk, as public market valuations will form a basis for valuations for these investments. Given their
illiquid nature, we focus on appropriate sizing of these investments relative to our liquidity needs and risk tolerance. Our risk tolerance is formed by the level of illiquidity and short-term price movements from market valuation risk we are willing to accept relative to the higher long-term expected returns over the life of these investments.
As of December 31, 2024, 4% of our marketable investments were equity securities. An immediate 10% decrease in each equity investment’s value, arising from market movement, would result in a fair value decrease of $119. Alternatively, an immediate 10% increase in each equity investment’s value, attributable to the same factor, would result in a fair value increase of $119.
For additional information regarding our investments, see Note 5, “Investments,” of the Notes to Consolidated Financial Statements included in Part II, Item 8 and “Critical Accounting Policies and Estimates - Investments” within Part II, Item 7 “Management’s Discussion and Analysis of Financial Condition and Results of Operations” included in this Annual Report on Form 10-K.
Long-Term Debt
Our total long-term debt at December 31, 2024 consisted of senior unsecured notes and subordinated surplus notes issued by one of our insurance subsidiaries. At December 31, 2024, the carrying value and estimated fair value of our long-term debt was $30,867 and $28,460, respectively. This debt is subject to interest rate risk, as these instruments have fixed interest rates and the fair value is affected by changes in market interest rates. Should interest rates increase or decrease in the future, the estimated fair value of our fixed rate debt would decrease or increase accordingly.
For additional information regarding our long-term debt, see Note 7, “Fair Value,” and Note 13, “Debt,” of the Notes to Consolidated Financial Statements included in Part II, Item 8 of this Annual Report on Form 10-K.
Derivatives
We have exposure to economic losses due to interest rate risk arising from changes in the level or volatility of interest rates. We attempt to mitigate our exposure to interest rate risk through the use of derivative financial instruments. These strategies include the use of interest rate swaps and forward contracts, which are used to lock-in interest rates or to hedge (on an economic basis) interest rate risks associated with variable rate debt. We have used these types of instruments as designated hedges against specific liabilities.
Changes in interest rates will affect the estimated fair value of these derivatives. As of December 31, 2024, we recorded a net liability of $142, the estimated fair value of the swaps at that date. We have evaluated the impact on the interest rate swaps’ fair value considering an immediate 100 basis point change in interest rates. A 100 basis point increase in interest rates would result in an approximate $383 decrease in fair value, whereas a 100 basis point decrease in interest rates would result in an approximate $383 increase in fair value.
For additional information regarding our derivatives, see Note 6, “Derivative Financial Instruments,” of the Notes to Consolidated Financial Statements included in Part II, Item 8 of this Annual Report on Form 10-K.
ITEM 8. FINANCIAL STATEMENTS AND SUPPLEMENTARY DATA.
Elevance Health, Inc.
CONSOLIDATED FINANCIAL STATEMENTS
Years ended December 31, 2024, 2023 and 2022
Contents
| | | | | |
| Reports of Independent Registered Public Accounting Firm (PCAOB ID:42) | |
| |
| Audited Consolidated Financial Statements: | |
| Consolidated Balance Sheets | |
| Consolidated Statements of Income | |
| Consolidated Statements of Comprehensive Income | |
| Consolidated Statements of Cash Flows | |
| Consolidated Statements of Shareholders’ Equity | |
| Notes to Consolidated Financial Statements | |
Report of Independent Registered
Public Accounting Firm
To the Shareholders and the Board of Directors of Elevance Health, Inc.
Opinion on the Financial Statements
We have audited the accompanying consolidated balance sheets of Elevance Health, Inc. (the Company) as of December 31, 2024 and 2023, the related consolidated statements of income, comprehensive income, cash flows and shareholders’ equity for each of the three years in the period ended December 31, 2024, and the related notes and financial statement schedule listed in the Index at Item 15(c) (collectively referred to as the “consolidated financial statements”). In our opinion, the consolidated financial statements present fairly, in all material respects, the financial position of the Company at December 31, 2024 and 2023, and the results of its operations and its cash flows for each of the three years in the period ended December 31, 2024, in conformity with U.S. generally accepted accounting principles.
We also have audited, in accordance with the standards of the Public Company Accounting Oversight Board (United States) (PCAOB), the Company’s internal control over financial reporting as of December 31, 2024, based on criteria established in Internal Control—Integrated Framework issued by the Committee of Sponsoring Organizations of the Treadway Commission (2013 framework), and our report dated February 20, 2025 expressed an unqualified opinion thereon.
Basis for Opinion
These financial statements are the responsibility of the Company’s management. Our responsibility is to express an opinion on the Company’s financial statements based on our audits. We are a public accounting firm registered with the PCAOB and are required to be independent with respect to the Company in accordance with the U.S. federal securities laws and the applicable rules and regulations of the Securities and Exchange Commission and the PCAOB.
We conducted our audits in accordance with the standards of the PCAOB. Those standards require that we plan and perform the audit to obtain reasonable assurance about whether the financial statements are free of material misstatement, whether due to error or fraud. Our audits included performing procedures to assess the risks of material misstatement of the financial statements, whether due to error or fraud, and performing procedures that respond to those risks. Such procedures included examining, on a test basis, evidence regarding the amounts and disclosures in the financial statements. Our audits also included evaluating the accounting principles used and significant estimates made by management, as well as evaluating the overall presentation of the financial statements. We believe that our audits provide a reasonable basis for our opinion.
Critical Audit Matter
The critical audit matter communicated below is a matter arising from the current period audit of the financial statements that was communicated or required to be communicated to the audit committee and that: (1) relates to accounts or disclosures that are material to the financial statements and (2) involved our especially challenging, subjective, or complex judgments. The communication of the critical audit matter does not alter in any way our opinion on the consolidated financial statements, taken as a whole, and we are not, by communicating the critical audit matter below, providing a separate opinion on the critical audit matter or on the account or disclosure to which it relates.
| | | | | | | | |
| Valuation of Incurred but Not Paid Claims |
| | |
| Description of the Matter | | Medical claims payable was $15,746 million at December 31, 2024, a significant portion of which related to the Company’s estimate for claims that are incurred but not paid. As discussed in Note 2 to the consolidated financial statements, the Company’s liability for incurred but not paid claims is determined using actuarial methods that include a number of factors and assumptions, including completion factors, which represent the average percentage of total incurred claims that have been paid through a given date after being incurred, and trend factors, which represent an estimate of claims expense based on recent claims expense levels and healthcare cost levels. There is significant uncertainty inherent in determining management’s best estimate of completion and trend factors, which are used to calculate actuarial estimates of incurred but not paid claims. |
| | Auditing management’s estimate of incurred but not paid claims was complex and required the involvement of our actuarial specialists due to the highly judgmental nature of the completion and trend factor assumptions used in the valuation process. The significant judgment was primarily due to the sensitivity of management’s best estimate of completion and trend factor assumptions, which have a significant impact on the valuation of incurred but not paid claims. |
| | |
| How We Addressed the Matter in Our Audit | | We obtained an understanding, evaluated the design and tested the operating effectiveness of controls over the Company’s actuarial process for estimating the liability for incurred but not paid claims. These audit procedures included among others, testing management review controls over completion and trend factor assumptions and the review and approval processes that management has in place for estimating the liability for incurred but not paid claims. |
| | To test the Company’s liability for incurred but not paid claims, our audit procedures included, among others, testing the completeness and accuracy of the underlying claims and membership data recorded in the source claims processing and disbursement systems to the data used by management in developing completion and trend factor assumptions and agreeing a sample of incurred and paid claims to source documentation. With the support of actuarial specialists, we evaluated the methodologies applied by the Company in determining the actuarially determined liability and management's actuarial assumptions, including trend and completion factor assumptions, used in their analysis based on historical claim experience and independently calculated a range of reasonable reserve estimates for comparison to management’s best estimate of the liability for incurred but not paid claims. Additionally, we performed a review of the prior period liabilities for incurred but not paid claims to subsequent claims development. |
/s/ Ernst & Young LLP
We have served as the Company’s auditor since 1944.
Indianapolis, Indiana
February 20, 2025
Elevance Health, Inc.
Consolidated Balance Sheets
| | | | | | | | | | | |
| December 31,
2024 | | December 31,
2023 |
| (In millions, except share data) | | | |
| Assets | | | |
| Current assets: | | | |
| Cash and cash equivalents | $ | 8,288 | | | $ | 6,526 | |
| Fixed maturity securities (amortized cost of $25,879 and $30,446; allowance for credit losses of $6 and $4) | 25,201 | | | 29,614 | |
| Equity securities | 1,192 | | | 229 | |
| | | |
| | | |
| Premium receivables | 8,011 | | | 7,902 | |
| Self-funded receivables | 5,044 | | | 4,558 | |
| Other receivables | 6,016 | | | 5,405 | |
| | | |
| | | |
| Other current assets | 4,700 | | | 5,795 | |
| Assets held for sale | 490 | | | — | |
| Total current assets | 58,942 | | | 60,029 | |
| Long-term investments: | | | |
| Fixed maturity securities (amortized cost of $1,049 and $890; allowance for credit losses of $0 and $0) | 1,035 | | | 876 | |
| Other invested assets | 9,749 | | | 6,107 | |
| Property and equipment, net | 4,652 | | | 4,359 | |
| Goodwill | 28,277 | | | 25,317 | |
| Other intangible assets | 12,094 | | | 10,273 | |
| Other noncurrent assets | 2,140 | | | 1,967 | |
| Total assets | $ | 116,889 | | | $ | 108,928 | |
| | | |
| Liabilities and equity | | | |
| Liabilities | | | |
| Current liabilities: | | | |
| Medical claims payable | $ | 15,746 | | | $ | 16,111 | |
| | | |
| Other policyholder liabilities | 4,204 | | | 5,600 | |
| Unearned income | 1,508 | | | 1,402 | |
| Accounts payable and accrued expenses | 6,927 | | | 6,910 | |
| | | |
| | | |
| Short-term borrowings | 365 | | | 225 | |
| Current portion of long-term debt | 1,649 | | | 1,649 | |
| Other current liabilities | 10,029 | | | 9,894 | |
| Liabilities held for sale | 153 | | | — | |
| Total current liabilities | 40,581 | | | 41,791 | |
| Long-term debt, less current portion | 29,218 | | | 23,246 | |
| Reserves for future policy benefits | 190 | | | 778 | |
| Deferred tax liabilities, net | 2,148 | | | 1,970 | |
| Other noncurrent liabilities | 3,326 | | | 1,738 | |
| Total liabilities | 75,463 | | | 69,523 | |
| Commitments and Contingencies—Note 14 | | | |
| Shareholders’ equity | | | |
| Preferred stock, without par value, shares authorized - 100,000,000; shares issued and outstanding - none | — | | | — | |
| Common stock, par value $0.01, shares authorized - 900,000,000; shares issued and outstanding - 227,479,695 and 233,071,088 | 2 | | | 2 | |
| Additional paid-in capital | 8,911 | | | 8,868 | |
| Retained earnings | 33,549 | | | 31,749 | |
| Accumulated other comprehensive loss | (1,147) | | | (1,313) | |
| Total shareholders’ equity | 41,315 | | | 39,306 | |
| Noncontrolling interests | 111 | | | 99 | |
| Total equity | 41,426 | | | 39,405 | |
| Total liabilities and equity | $ | 116,889 | | | $ | 108,928 | |
See accompanying notes.
Elevance Health, Inc.
Consolidated Statements of Income
| | | | | | | | | | | | | | | | | |
| | Years Ended December 31 |
| (In millions, except per share data) | 2024 | | 2023 | | 2022 |
| Revenues | | | | | |
| Premiums | $ | 144,166 | | | $ | 142,854 | | | $ | 133,229 | |
| Product revenue | 22,630 | | | 19,452 | | | 14,978 | |
| Service fees | 8,408 | | | 7,903 | | | 7,453 | |
| Total operating revenue | 175,204 | | | 170,209 | | | 155,660 | |
| Net investment income | 2,051 | | | 1,825 | | | 1,485 | |
| Net losses on financial instruments | (445) | | | (694) | | | (550) | |
| Gain on sale of business | 201 | | | — | | | — | |
| | | | | |
| | | | | |
| | | | | |
| Total revenues | 177,011 | | | 171,340 | | | 156,595 | |
| Expenses | | | | | |
| Benefit expense | 127,567 | | | 124,330 | | | 116,642 | |
| Cost of products sold | 19,750 | | | 17,293 | | | 13,035 | |
| Operating expense | 20,025 | | | 20,087 | | | 17,700 | |
| Interest expense | 1,185 | | | 1,030 | | | 851 | |
| Amortization of other intangible assets | 580 | | | 885 | | | 767 | |
| | | | | |
| Total expenses | 169,107 | | | 163,625 | | | 148,995 | |
| Income before income tax expense | 7,904 | | | 7,715 | | | 7,600 | |
| Income tax expense | 1,933 | | | 1,724 | | | 1,712 | |
| | | | | |
| | | | | |
| Net income | 5,971 | | | 5,991 | | | 5,888 | |
| Net loss (gain) attributable to noncontrolling interests | 9 | | | (4) | | | 6 | |
| Shareholders’ net income | $ | 5,980 | | | $ | 5,987 | | | $ | 5,894 | |
| Shareholders’ earnings per share | | | | | |
| | | | | |
| | | | | |
| Basic | $ | 25.81 | | | $ | 25.38 | | | $ | 24.56 | |
| | | | | |
| | | | | |
| | | | | |
| Diluted | $ | 25.68 | | | $ | 25.22 | | | $ | 24.28 | |
| | | | | |
| | | | | |
| | | | | |
| | | | | |
| | | | | |
| | | | | |
See accompanying notes.
Elevance Health, Inc.
Consolidated Statements of Comprehensive Income
| | | | | | | | | | | | | | | | | |
| | Years Ended December 31 |
| (In millions) | 2024 | | 2023 | | 2022 |
| Net income | $ | 5,971 | | | $ | 5,991 | | | $ | 5,888 | |
| Other comprehensive income (loss), net of tax: | | | | | |
| Change in net unrealized gains/losses on investments | 103 | | | 1,117 | | | (2,260) | |
| Change in non-credit component of impairment losses on investments | 1 | | | — | | | (3) | |
| Change in net unrealized gains/losses on cash flow hedges | 4 | | | 18 | | | 10 | |
| Change in net periodic pension and other benefit costs | 60 | | | 40 | | | (70) | |
| Change in future policy benefits | (2) | | | (3) | | | 32 | |
| Foreign currency translation adjustments | (6) | | | (1) | | | (13) | |
| Other comprehensive income (loss) | 160 | | | 1,171 | | | (2,304) | |
| Net loss (gain) attributable to noncontrolling interests | 9 | | | (4) | | | 6 | |
| Other comprehensive loss attributable to noncontrolling interests | 6 | | | 6 | | | 11 | |
| Total shareholders’ comprehensive income | $ | 6,146 | | | $ | 7,164 | | | $ | 3,601 | |
See accompanying notes.
Elevance Health, Inc.
Consolidated Statements of Cash Flows
| | | | | | | | | | | | | | | | | |
| | Years Ended December 31 |
| (In millions) | 2024 | | 2023 | | 2022 |
| Operating activities | | | | | |
| Net income | $ | 5,971 | | | $ | 5,991 | | | $ | 5,888 | |
| Adjustments to reconcile net income to net cash provided by operating activities: | | | | | |
| Net losses on financial instruments | 445 | | | 694 | | | 550 | |
| Gain on sale of business | (201) | | | — | | | — | |
| Equity in net earnings (losses) of other invested assets | (1) | | | 33 | | | (293) | |
| Depreciation and amortization | 1,393 | | | 1,745 | | | 1,675 | |
| | | | | |
| | | | | |
| Deferred income taxes | (374) | | | (602) | | | (115) | |
| Impairment of property, equipment and right-of-use assets | 103 | | | 446 | | | 7 | |
| Share-based compensation | 191 | | | 289 | | | 264 | |
| Changes in operating assets and liabilities: | | | | | |
| Receivables, net | (683) | | | (1,762) | | | (2,510) | |
| Other invested assets | (78) | | | (79) | | | 11 | |
| Other assets | 824 | | | (675) | | | 133 | |
| Policy liabilities | (1,840) | | | 147 | | | 2,411 | |
| Unearned income | (113) | | | 290 | | | (42) | |
| Accounts payable and other liabilities | (272) | | | 1,640 | | | 824 | |
| Income taxes | 404 | | | (103) | | | (338) | |
| Other, net | 39 | | | 7 | | | (66) | |
| Net cash provided by operating activities | 5,808 | | | 8,061 | | | 8,399 | |
| Investing activities | | | | | |
| Purchases of investments | (17,986) | | | (16,236) | | | (24,946) | |
| Proceeds from sale of investments | 16,547 | | | 10,596 | | | 11,988 | |
| Maturities, calls and redemptions from investments | 2,025 | | | 2,940 | | | 10,620 | |
| | | | | |
| Changes in securities lending collateral | 73 | | | 78 | | | (301) | |
| Purchases of subsidiaries, net of cash acquired | (4,809) | | | (1,552) | | | (649) | |
| Proceeds from sales of subsidiaries, net of cash sold | 363 | | | — | | | — | |
| Purchases of property and equipment | (1,256) | | | (1,296) | | | (1,152) | |
| Other, net | (124) | | | (102) | | | (120) | |
| Net cash used in investing activities | (5,167) | | | (5,572) | | | (4,560) | |
| Financing activities | | | | | |
| | | | | |
| Proceeds from long-term borrowings | 7,710 | | | 2,574 | | | 3,071 | |
| Repayments of long-term borrowings | (1,650) | | | (1,909) | | | (1,899) | |
| Proceeds from short-term borrowings | 275 | | | 225 | | | 1,365 | |
| Repayments of short-term borrowings | (135) | | | (265) | | | (1,675) | |
| Changes in securities lending payable | (75) | | | (77) | | | 302 | |
| Changes in bank overdrafts | (638) | | | 114 | | | 933 | |
| Repurchase and retirement of common stock | (2,900) | | | (2,676) | | | (2,316) | |
| Cash dividends | (1,508) | | | (1,395) | | | (1,229) | |
| Proceeds from issuance of common stock under employee stock plans | 221 | | | 152 | | | 182 | |
| Taxes paid through withholding of common stock under employee stock plans | (109) | | | (99) | | | (93) | |
| Other, net | 2 | | | 7 | | | 41 | |
| Net cash provided by (used in) financing activities | 1,193 | | | (3,349) | | | (1,318) | |
| Effect of foreign exchange rates on cash and cash equivalents | (6) | | | (1) | | | (14) | |
| Change in cash and cash equivalents | 1,828 | | | (861) | | | 2,507 | |
| Cash and cash equivalents at beginning of year | 6,526 | | | 7,387 | | | 4,880 | |
| Less cash and cash equivalents included in assets held for sale at end of year | (66) | | | — | | | — | |
| Cash and cash equivalents at end of year | $ | 8,288 | | | $ | 6,526 | | | $ | 7,387 | |
See accompanying notes.
Elevance Health, Inc.
Consolidated Statements of Shareholders’ Equity | | | | | | | | | | | | | | | | | | | | | | | | | | | | | | | | | | | | | | | | | | | |
| Total Shareholders’ Equity | | | | | | |
| | Common Stock | | Additional
Paid-in
Capital | | | | Accumulated
Other
Comprehensive
(Loss) Income | | Noncontrolling Interests | | Total
Equity | | |
| (In millions) | Number
of Shares | | Par
Value | | | Retained
Earnings | | | | | |
| January 1, 2022 | 241.8 | | | $ | 2 | | | $ | 9,148 | | | $ | 27,119 | | | $ | (197) | | | $ | 68 | | | $ | 36,140 | | | |
| Net income (loss) | — | | | — | | | — | | | 5,894 | | | — | | | (6) | | | 5,888 | | | |
| Other comprehensive loss | — | | | — | | | — | | | — | | | (2,293) | | | (11) | | | (2,304) | | | |
| Noncontrolling interests adjustment | — | | | — | | | — | | | — | | | — | | | 36 | | | 36 | | | |
| Repurchase and retirement of common stock | (4.8) | | | — | | | (184) | | | (2,132) | | | — | | | — | | | (2,316) | | | |
| Dividends and dividend equivalents | — | | | — | | | — | | | (1,234) | | | — | | | — | | | (1,234) | | | |
| Issuance of common stock under employee stock plans, net of related tax benefits | 1.0 | | | — | | | 352 | | | — | | | — | | | — | | | 352 | | | |
| Convertible debenture repurchases and conversions | | | — | | | (232) | | | — | | | — | | | — | | | (232) | | | |
| December 31, 2022 | 238.0 | | | 2 | | | 9,084 | | | 29,647 | | | (2,490) | | | 87 | | | 36,330 | | | |
| Net income | — | | | — | | | — | | | 5,987 | | | — | | | 4 | | | 5,991 | | | |
| Other comprehensive income (loss) | — | | | — | | | — | | | — | | | 1,177 | | | (6) | | | 1,171 | | | |
| Noncontrolling interests adjustment | — | | | — | | | — | | | — | | | — | | | 14 | | | 14 | | | |
| Repurchase and retirement of common stock, including excise tax | (5.8) | | | — | | | (217) | | | (2,481) | | | — | | | — | | | (2,698) | | | |
| Dividends and dividend equivalents | — | | | — | | | — | | | (1,404) | | | — | | | — | | | (1,404) | | | |
| Issuance of common stock under employee stock plans, net of related tax benefits | 0.9 | | | — | | | 342 | | | — | | | — | | | — | | | 342 | | | |
| Convertible debenture repurchases and conversions | — | | | — | | | (341) | | | — | | | — | | | — | | | (341) | | | |
| December 31, 2023 | 233.1 | | | 2.0 | | | 8,868.0 | | | 31,749.0 | | | (1,313.0) | | | 99.0 | | | 39,405.0 | | | |
| Net income (loss) | — | | | — | | | — | | | 5,980 | | | — | | | (9) | | | 5,971 | | | |
| Other comprehensive income (loss) | — | | | — | | | — | | | — | | | 166 | | | (6) | | | 160 | | | |
| Noncontrolling interests adjustment | — | | | — | | | — | | | — | | | — | | | 27 | | | 27 | | | |
| Repurchase and retirement of common stock, including excise tax | (6.7) | | | — | | | (262) | | | (2,662) | | | — | | | — | | | (2,924) | | | |
| Dividends and dividend equivalents | — | | | — | | | — | | | (1,518) | | | — | | | — | | | (1,518) | | | |
| Issuance of common stock under employee stock plans, net of related tax benefits | 1.1 | | | — | | | 305 | | | — | | | — | | | — | | | 305 | | | |
| | | | | | | | | | | | | | | |
| December 31, 2024 | 227.5 | | | $ | 2 | | | $ | 8,911 | | | $ | 33,549 | | | $ | (1,147) | | | $ | 111 | | | $ | 41,426 | | | |
See accompanying notes.
Elevance Health, Inc.
Notes to Consolidated Financial Statements
December 31, 2024
(In Millions, Except Per Share Data or As Otherwise Stated Herein)
1. Organization
References to the terms “we,” “our,” “us” or “Elevance Health” used throughout these Notes to Consolidated Financial Statements refer to Elevance Health, Inc., an Indiana corporation, and unless the context otherwise requires, its direct and indirect subsidiaries. References to the “states” include the District of Columbia and Puerto Rico, unless the context otherwise requires.
Elevance Health is a health company with the purpose of improving the health of humanity. We are one of the largest health insurers in the United States in terms of medical membership, serving approximately 45.7 million medical members through our affiliated health plans as of December 31, 2024. We offer a broad spectrum of network-based managed care risk-based plans to Individual, Employer Group, Medicaid and Medicare markets. In addition, we provide a broad array of managed care services to fee-based customers, including claims processing, stop loss insurance, provider network access, medical management, care management, wellness programs, actuarial services and other administrative services. We provide services to the federal government in connection with our Federal Health Products & Services business, which administers the Federal Employee Program® (“FEP®”). We provide an array of specialty services both to customers of our subsidiary health plans and to unaffiliated health plans, including pharmacy services, stop loss insurance, dental, vision and supplemental health insurance benefits, as well as integrated health services.
We are an independent licensee of the Blue Cross and Blue Shield Association (“BCBSA”), an association of independent health benefit plans. We serve our members as the Blue Cross licensee for California and as the Blue Cross and Blue Shield (“BCBS”) licensee for Colorado, Connecticut, Georgia, Indiana, Kentucky, Maine, Missouri (excluding 30 counties in the Kansas City area), Nevada, New Hampshire, New York (in the New York City metropolitan area and upstate New York), Ohio, Virginia (excluding the Northern Virginia suburbs of Washington, D.C.) and Wisconsin. In a majority of these service areas, we do business as Anthem Blue Cross and Anthem Blue Cross and Blue Shield. We also conduct business through arrangements with other BCBS licensees as well as other strategic partners. In addition, we serve members in numerous states as Wellpoint, Carelon, MMM and/or Simply Healthcare. We are licensed to conduct insurance operations in all 50 states, the District of Columbia and Puerto Rico through our subsidiaries.
We have organized our brand portfolio into the following core go-to-market brands:
•Anthem Blue Cross/Anthem Blue Cross and Blue Shield — represents our Anthem-branded and affiliated Blue Cross and/or Blue Shield licensed plans;
•Wellpoint — unites select non-BCBSA licensed Medicare, Medicaid and commercial plans under the Wellpoint name; and
•Carelon — this brand brings together our healthcare related services and capabilities, including our CarelonRx and Carelon Services businesses, under a single brand name.
We report our results of operations in the following four reportable segments: Health Benefits, CarelonRx, Carelon Services and Corporate & Other (our businesses that do not individually meet the quantitative thresholds for an operating segment, as well as corporate expenses not allocated to our other reportable segments). For additional discussion, see Note 20, “Segment Information.”
2. Basis of Presentation and Significant Accounting Policies
Basis of Presentation: The accompanying consolidated financial statements include the accounts of Elevance Health and its subsidiaries and have been prepared in conformity with U.S. generally accepted accounting principles (“GAAP”). All significant intercompany accounts and transactions have been eliminated in consolidation. Our consolidated financial
Elevance Health, Inc.
Notes to Consolidated Financial Statements (continued)
statements include the accounts of Elevance Health, Inc. and subsidiaries that we control, including variable interest entities for which we are the primary beneficiary. We are considered the primary beneficiary if we have the power to direct the variable interest entity's most significant economic activities, and we have the right to receive benefits or obligations to absorb losses that could be significant to the entity. We evaluate the following criteria: (1) the structure and purpose of the entity; (2) the risks and rewards created by and shared through the entity; and (3) our ability to direct its activities, receive its benefits and absorb its losses relative to the other parties involved with the entity.
Certain of our subsidiaries operate outside of the United States and have functional currencies other than the U.S. dollar (“USD”). We translate the assets and liabilities of those subsidiaries to USD using the exchange rate in effect at the end of the period. We translate the revenues and expenses of those subsidiaries to USD using the average exchange rates in effect during the period. The net effect of these translation adjustments is included in “Foreign currency translation adjustments” in our consolidated statements of comprehensive income.
Reclassifications: Certain prior year amounts have been reclassified to conform to the current year presentation.
Use of Estimates: The preparation of consolidated financial statements in conformity with GAAP requires us to make estimates and assumptions that affect the amounts reported in our consolidated financial statements and accompanying notes. Our most significant estimate relates to estimates and judgments for medical claims payable. Actual results could differ from those estimates.
Cash and Cash Equivalents: Cash and cash equivalents includes available cash and all highly liquid investments with maturities of three months or less when purchased. We control a number of bank accounts that are used exclusively to hold customer funds for the administration of customer benefits, and we have cash and cash equivalents on deposit to meet certain regulatory requirements. These amounts totaled $409 and $294 at December 31, 2024 and 2023, respectively, and are included in the cash and cash equivalents line on our consolidated balance sheets.
Investments: We classify fixed maturity securities in our investment portfolio as “available-for-sale” and report those securities at fair value. Certain fixed maturity securities are available to support current operations and, accordingly, we classify such investments as current assets without regard to their contractual maturity. Investments used to satisfy contractual, regulatory or other requirements are classified as long-term, without regard to contractual maturity.
If a fixed maturity security is in an unrealized loss position and we have the intent to sell the fixed maturity security, or it is more likely than not that we will have to sell the fixed maturity security before recovery of its amortized cost basis, we write down the fixed maturity security’s cost basis to fair value and record an impairment loss in our consolidated statements of income. For impaired fixed maturity securities that we do not intend to sell or if it is more likely than not that we will not have to sell such securities, but we expect that we will not fully recover the amortized cost basis, we recognize the credit component of the impairment as an allowance for credit loss in our consolidated balance sheets and record an impairment loss in our consolidated statements of income. The non-credit component of the impairment is recognized in accumulated other comprehensive loss. Furthermore, unrealized losses entirely caused by non-credit-related factors related to fixed maturity securities for which we expect to fully recover the amortized cost basis continue to be recognized in accumulated other comprehensive loss.
The credit component of an impairment is determined primarily by comparing the net present value of projected future cash flows with the amortized cost basis of the fixed maturity security. The net present value is calculated by discounting our best estimate of projected future cash flows at the effective interest rate implicit in the fixed maturity security at the date of purchase. For mortgage-backed and asset-backed securities, cash flow estimates are based on assumptions regarding the underlying collateral, including prepayment speeds, vintage, type of underlying asset, geographic concentrations, default rates, recoveries and changes in value. For all other securities, cash flow estimates are driven by assumptions regarding probability of default, including changes in credit ratings and estimates regarding timing and amount of recoveries associated with a default.
For asset-backed securities included in fixed maturity securities, we recognize income using an effective yield based on anticipated prepayments and the estimated economic life of the securities. When estimates of prepayments change, the effective yield is recalculated to reflect actual payments to date and anticipated future payments. The net investment in the securities is adjusted to the amount that would have existed had the new effective yield been applied since the purchase date of the securities. Such adjustments are reported within net investment income.
Elevance Health, Inc.
Notes to Consolidated Financial Statements (continued)
The changes in fair value of our marketable equity securities are recognized in our results of operations within net gains and losses on financial instruments. Certain marketable equity securities are held to satisfy contractual obligations and are reported under the caption “Other invested assets” in our consolidated balance sheets.
Mortgage loans on real estate are classified as held for investment and are reported at their amortized cost basis net of loss allowance under the caption “Other invested assets” in our consolidated balance sheets. Amortized cost is the amount at which the loan is originated, adjusted for accrued interest, amortization of premium, discount and net deferred fees or costs, collection of cash and write-offs.
We have corporate-owned life insurance policies on certain participants in our deferred compensation plans and other members of management. The cash surrender value of the corporate-owned life insurance policies is reported under the caption “Other invested assets” in our consolidated balance sheets.
We have investments in limited partnerships (“LPs”) and companies in which our ownership interest may enable us to influence the operating or financial decisions of the investee company, including unconsolidated variable interest entities. These investments are accounted for using the equity method of accounting and are reported within “Other invested assets” in our consolidated balance sheets. Our proportionate share of equity in net income for these LPs and unconsolidated investee companies is reported within “Net investment income” in our consolidated statements of income. The carrying value of these investments are written down, or impaired, to fair value when a decline in value is considered to be other-than temporary. In applying the equity method (including assessment for other-than temporary impairment), we use financial information provided by the LPs and investee companies, generally on a one-to three-month lag. We consolidate investee companies in certain other instances where it is deemed to exercise control, or is considered the primary beneficiary of a variable interest entity.
Investment income is recorded when earned. All securities sold resulting in investment realized gains and losses are recorded on the trade date. Realized gains and losses are determined on the basis of the cost or amortized cost of the specific securities sold.
We participate in securities lending programs whereby marketable securities in our investment portfolio are transferred to independent brokers or dealers in exchange for cash and securities collateral. Under Financial Accounting Standards Board (“FASB”) guidance related to accounting for transfers and servicing of financial assets and extinguishments of liabilities, we recognize the collateral as an asset, which is reported in Other current assets on our consolidated balance sheets, and we record a corresponding liability for the obligation to return the collateral to the borrower, which is reported in Other current liabilities. The securities on loan are reported in the applicable investment category on our consolidated balance sheets. Unrealized gains or losses on securities lending collateral are included in accumulated other comprehensive income as a separate component of shareholders’ equity. The market value of loaned securities and that of the collateral pledged can fluctuate in non-synchronized fashions. To the extent the loaned securities’ value appreciates faster or depreciates slower than the value of the collateral pledged, we are exposed to the risk of the shortfall. As a primary mitigating mechanism, the loaned securities and collateral pledged are marked to market on a daily basis and the shortfall, if any, is collected accordingly. Secondarily, the collateral level is set at 102% of the value of the loaned securities, which provides a cushion before any shortfall arises. The investment of the cash collateral is subject to market risk, which is managed by limiting the investments to higher quality and shorter duration instruments.
Receivables: Receivables are reported net of amounts for expected credit losses. The allowance for doubtful accounts is based on historical collection trends, future forecasts and our judgment regarding the ability to collect specific accounts.
Premium receivables include the uncollected amounts from insured groups, individuals and government programs. Premium receivables are reported net of an allowance for doubtful accounts of $183 and $212 at December 31, 2024 and 2023, respectively.
Self-funded receivables include administrative fees, claims and other amounts due from fee-based customers. Self-funded receivables are reported net of an allowance for doubtful accounts of $115 and $87 at December 31, 2024 and 2023, respectively.
Other receivables include pharmacy rebates, provider advances, claims recoveries, reinsurance receivables, proceeds due from brokers on investment trades that have not yet settled, accrued investment income and other miscellaneous amounts due
Elevance Health, Inc.
Notes to Consolidated Financial Statements (continued)
to us. These receivables are reported net of an allowance for doubtful accounts of $1,385 and $941 at December 31, 2024 and 2023, respectively.
Income Taxes: We file a consolidated U.S. federal income tax return. Deferred income tax assets and liabilities are recognized for temporary differences between the financial statement and tax return basis of assets and liabilities based on enacted tax rates and laws and are reported net on our consolidated balance sheets. The deferred tax benefits of the deferred tax assets are recognized to the extent realization of such benefits is more likely than not. Deferred income tax expense or benefit generally represents the net change in deferred income tax assets and liabilities during the year, excluding the impact from amounts initially recorded for business combinations, if any, and amounts recorded to accumulated other comprehensive income. Current income tax expense represents the tax consequences of revenues and expenses currently taxable or deductible on various income tax returns for the year reported.
The Internal Revenue Code subjects a U.S. shareholder to tax on Global Intangible Low-Taxed Income (“GILTI”) earned by certain foreign subsidiaries. We have elected to account for GILTI tax in the year the tax is incurred.
The Inflation Reduction Act of 2022 includes a provision that imposes a new corporate alternative minimum tax (the “Corporate AMT”) that became effective for us beginning January 1, 2023. We have elected to account for the effects of the Corporate AMT on deferred tax assets and carryforwards and tax credits in the period they arise. We have also elected to disregard Corporate AMT when evaluating the need for a valuation allowance for non-Corporate AMT deferred tax assets. We do not believe the Corporate AMT will have a material impact on our consolidated financial position, results of operations, cash flows or related disclosures. Additionally, the Inflation Reduction Act of 2022 imposes an excise tax on the fair market value of net stock repurchases made after December 31, 2022. These are included as a charge to retained earnings as a component of the repurchase and retirement of common stock.
We account for income tax contingencies in accordance with FASB guidance that contains a model to address uncertainty in tax positions and clarifies the accounting for income taxes by prescribing a minimum recognition threshold, which all income tax positions must achieve before being recognized in the financial statements.
Property and Equipment: Property and equipment is recorded at cost, net of accumulated depreciation. Depreciation is computed principally by the straight-line method over estimated useful lives ranging from fifteen to thirty years for buildings and improvements, three to five years for computer equipment and software, and seven years for furniture and other equipment. Leasehold improvements are depreciated over the term of the related lease. Certain costs related to the development or purchase of internal-use software are capitalized and amortized over estimated useful lives ranging from three to ten years.
Goodwill and Other Intangible Assets: FASB guidance requires business combinations to be accounted for using the acquisition method of accounting, and it also specifies the types of acquired intangible assets that are required to be recognized and reported separately from goodwill. Goodwill represents the excess of the cost of acquisition over the fair value of net assets acquired, including other intangible assets. Other intangible assets represent the values assigned to customer relationships, provider and hospital networks, Blue Cross and Blue Shield and other trademarks, licenses and other agreements, such as non-compete agreements. Goodwill and other intangible assets are allocated to reportable segments based on the relative fair value of the components of the businesses acquired.
Goodwill and other intangible assets with indefinite lives are not amortized but are tested for impairment at least annually. Goodwill and other intangible assets are allocated to reporting units for purposes of the annual goodwill impairment test. Other intangible assets with indefinite lives, such as trademarks, are tested for impairment separately. We complete our annual impairment tests of existing goodwill and other intangible assets with indefinite lives during the fourth quarter of each year. Our impairment tests require us to make assumptions and judgments regarding the estimated fair value of our reporting units, including goodwill and other intangible assets with indefinite lives. Certain interim impairment tests are also performed when potential impairment indicators exist or changes in our business or other triggering events occur.
FASB guidance allows for qualitative assessments of whether it is more likely than not that the fair value of a reporting unit is less than its carrying amount for purposes of a goodwill impairment analysis and whether it is more likely than not that an indefinite-lived intangible asset is impaired for purposes of an indefinite-lived intangible asset impairment analysis. Estimated fair values developed based on our assumptions and judgments might be different if other reasonable assumptions and estimates were to be used. Qualitative analysis involves assessing situations and developments that could affect key
Elevance Health, Inc.
Notes to Consolidated Financial Statements (continued)
drivers used to evaluate whether the fair value of our goodwill and indefinite-lived intangible assets is impaired. Our procedures include assessing our financial performance, macroeconomic conditions, industry and market considerations, various asset specific factors, and entity specific events.
Quantitative analysis must be performed if qualitative analyses are not conclusive. Entities also have the option to bypass the assessment of qualitative factors and proceed directly to performing quantitative analyses. Fair value for purposes of a quantitative goodwill impairment test is calculated using a blend of the projected income and market valuation approaches. The projected income approach is developed using assumptions about future revenue, expenses and net income derived from our internal planning process. Our assumed discount rate is based on our industry’s weighted-average cost of capital and reflects volatility associated with the cost of equity capital. Market valuations include market comparisons to publicly traded companies in our industry and are based on observed multiples of certain measures including revenue; earnings before interest, taxes, depreciation and amortization (“EBITDA”); and book value of invested capital.
A goodwill impairment loss is recognized to the extent that the carrying amount exceeds the asset’s estimated fair value. This determination consists of a one-step test comparing the estimated fair value of a reporting unit, including goodwill, to its carrying amount. If the carrying amount of a reporting unit exceeds its estimated fair value, an impairment loss is recognized. This goodwill impairment loss is equal to the excess of the reporting unit’s carrying amount over its estimated fair value, which is recorded in the results of operations.
Fair value for purposes of a quantitative impairment test for indefinite-lived intangible assets is estimated using a projected income approach. We recognize an impairment loss when the estimated fair value of indefinite-lived intangible assets is less than the carrying value, which is recorded in the results of operations. If significant impairment indicators are noted relative to other intangible assets subject to amortization, we may be required to record impairment losses against future income.
Derivative Financial Instruments: We primarily invest in the following types of derivative financial instruments: interest rate swaps, futures, forward contracts, put and call options, collars, swaptions, embedded derivatives and warrants. Derivatives embedded within non-derivative instruments, such as options embedded in convertible fixed maturity securities, are bifurcated from the host instrument when the embedded derivative is not clearly and closely related to the host instrument. Our use of derivatives is limited by statutes and regulations promulgated by the various regulatory bodies to which we are subject, and by our own derivative policy. Our derivative use is generally limited to hedging purposes, on an economic basis, and we generally do not use derivative instruments for speculative purposes.
We have exposure to economic losses due to interest rate risk arising from changes in the level or volatility of interest rates. We attempt to mitigate our exposure to interest rate risk through active portfolio management, including rebalancing our existing portfolios of assets and liabilities, as well as changing the characteristics of investments to be purchased or sold in the future. In addition, derivative financial instruments are used to modify the interest rate exposure of certain liabilities or forecasted transactions. These strategies include the use of interest rate swaps and forward contracts, which are used to lock-in interest rates or to hedge, on an economic basis, interest rate risks associated with variable rate debt. We have used these types of instruments as designated hedges against specific liabilities.
All investments in derivatives are recorded as assets or liabilities at fair value, except certain put and call options on large blocks of equity securities. Put and call options on large blocks of equity securities are initially recorded at fair value; however, they are not subsequently marked to market. If certain correlation, hedge effectiveness and risk reduction criteria are met, a derivative may be specifically designated as a hedge of exposure to changes in fair value or cash flow. The accounting for changes in the fair value of a derivative depends on the intended use of the derivative and the nature of any hedge designation thereon. Amounts excluded from the assessment of hedge effectiveness, if any, are reported in results of operations immediately. If the derivative is not designated as a hedge, the gain or loss resulting from the change in the fair value of the derivative is recognized in results of operations in the period of change. Cash flows associated with the settlement of non-designated derivatives are shown on a net basis in investing activity in our consolidated statements of cash flow.
From time to time, we may also purchase derivatives to hedge, on an economic basis, our exposure to foreign currency exchange fluctuations associated with the operations of certain of our subsidiaries. We generally use futures or forward
Elevance Health, Inc.
Notes to Consolidated Financial Statements (continued)
contracts for these transactions. We generally do not designate these contracts as hedges and, accordingly, the changes in fair value of these derivatives are recognized in results of operations immediately.
As part of our international operations, we conduct transactions in foreign currencies, which exposes us to risks associated with fluctuations in foreign currency exchange rates. To manage this exposure, we utilize forward contracts to hedge expenses that are denominated in currencies other than the U.S. dollar. These forward contracts are designated as cash flow hedges and qualify for hedge accounting treatment under the applicable accounting standards.
Credit exposure associated with non-performance by the counterparties to derivative instruments is generally limited to the uncollateralized fair value of the asset related to instruments recognized in the consolidated balance sheets. We attempt to mitigate the risk of non-performance by selecting counterparties with high credit ratings and monitoring their creditworthiness and by diversifying derivatives among multiple counterparties. At December 31, 2024, we believe there were no material concentrations of credit risk with any individual counterparty.
We generally enter into master netting agreements, which reduce credit risk by permitting net settlement of transactions with the same counterparty. Certain of our derivative agreements also contain credit support provisions that require us or the counterparty to post collateral if there are declines in the derivative fair value or our credit rating. The derivative assets and derivative liabilities are reported at their fair values net of collateral and netting by the counterparty.
Retirement Benefits: We recognize the funded status of pension and other postretirement benefit plans on the consolidated balance sheets based on fiscal-year-end measurements of plan assets and benefit obligations. Prepaid pension benefits represent prepaid costs related to defined benefit pension plans and are reported with other noncurrent assets. Prepaid postretirement benefits represent prepaid costs related to retiree medical, life, vision and dental benefits and are reported with other noncurrent assets.
We determine the expected return on plan assets using the calculated value of plan assets, which recognizes changes in the fair value of plan assets in a systematic manner over three years. We apply a corridor approach to amortize unrecognized actuarial gains or losses. Under this approach, only accumulated net actuarial gains or losses in excess of 10% of the greater of the projected benefit obligation or the fair value of plan assets are amortized over the average remaining service or lifetime of the workforce as a component of net periodic benefit cost.
The discount rate reflects the current rate at which the pension liabilities could be effectively settled at the end of the year based on our most recent measurement date. We use the annual spot rate approach for setting our discount rate. Under the spot rate approach, individual spot rates from a full yield curve of published rates are used to discount each plan’s cash flows to determine the plan’s obligations.
The assumed healthcare cost trend rates used to measure the expected cost of other postretirement benefits are based on an initial assumed healthcare cost trend rate declining to an ultimate healthcare cost trend rate over a select number of years.
Medical Claims Payable: Liabilities for medical claims payable include estimated provisions for incurred but not paid claims on an undiscounted basis, as well as estimated provisions for expenses related to the processing of claims. Incurred but not paid claims include (1) an estimate for claims that are incurred but not reported; (2) claims reported to us but not yet processed through our systems; and (3) claims reported to us and processed through our systems but not yet paid.
Liabilities for claims incurred but not reported and reported but not yet processed through our systems are determined in the aggregate, employing actuarial methods that are commonly used by health insurance actuaries and meet Actuarial Standards of Practice. Our reserving practice for claim liabilities is to consistently recognize the appropriate amount of reserve within a level of confidence required by Actuarial Standards of Practice. We determine the amount of the liability for incurred but not yet reported or processed claims by following a detailed actuarial process that uses both historical claim payment patterns as well as emerging medical cost trends to project our best estimate of claim liabilities. Under this process, historical paid claims data is formatted into “claim triangles,” which compare claim incurred dates to the dates of claim payments. This information is analyzed to create “completion factors” that represent the average percentage of total incurred claims that have been paid through a given date after being incurred. Completion factors are applied to claims paid through the period-end date to estimate the ultimate claim expense incurred for the period. Actuarial estimates of incurred but not paid claim liabilities are then determined by subtracting the actual paid claims from the estimate of the ultimate incurred claims.
Elevance Health, Inc.
Notes to Consolidated Financial Statements (continued)
For the most recent incurred months (typically the most recent two months), the percentage of claims paid for claims incurred in those months is generally low. This makes the completion factor methodology less reliable for such months. Therefore, incurred claims for recent months are not projected from historical completion and payment patterns; rather, they are projected by estimating the claims expense for those months based on recent claims expense levels and healthcare trend levels (“trend factors”).
On a regular basis, we review cost trends and utilization assumptions set upon initial establishment of claim liabilities. We utilize subsequent paid claims activity to monitor and continuously adjust the claims liability and benefit expense. If actual results are determined to be materially different than assumptions regarding cost trends and utilization, future periods of our income statement and overall financial position could be impacted.
Premium deficiencies are recognized when it is probable that expected claims plus administrative expenses will exceed future premiums on existing medical insurance contracts without consideration of investment income. For purposes of evaluating premium deficiencies, contracts are deemed to be either short or long duration and are grouped in a manner consistent with our method of acquiring, servicing and measuring the profitability of such contracts. Once established, reserves for premium deficiencies are released commensurate with actual claims experience over the remaining life of the contract. No reserves for premium deficiencies were established at December 31, 2024 or 2023.
Benefit expense includes incurred medical claims as well as quality improvement expenses for our risk-based members. Quality improvement activities are those designed to improve member health outcomes, prevent hospital readmissions and improve patient safety. They also include expenses for wellness and health promotion provided to our members.
Other Policyholder Liabilities: Other policyholder liabilities include rate stabilization reserves associated with retrospectively rated insurance contracts and certain case-specific reserves. Rate stabilization reserves represent accumulated premiums that exceed what customers owe us based on actual claim experience. The timing of payment of these retrospectively rated refunds is based on the contractual terms with our customers and can vary from period to period based on the specific contractual requirements.
Other policyholder liabilities also include liabilities for premium refunds based upon the minimum medical loss ratio (“MLR”). We are required to meet certain minimum MLR thresholds prescribed by the Patient Protection and Affordable Care Act and the Health Care and Education Reconciliation Act of 2010, as amended (collectively, the “ACA”). If we do not meet or exceed the minimum MLR thresholds specified by the ACA, we are required to pay rebates to certain customers. Minimum MLR rebates are calculated by subsidiary, state and applicable line of business in accordance with regulations issued by the US Department of Health and Human Services (“HHS”). Such calculations are made using estimated calendar year medical loss expense and premiums, as defined by HHS.
We follow HHS guidelines for determining the types of expenses that may be included in our minimum MLR rebate calculations, which differ from benefit expense and premiums as reported in our consolidated financial statements prepared in conformity with GAAP. Certain amounts reported as expense in our consolidated GAAP financial statements may be reported as a reduction of premiums in accordance with HHS regulations. In addition, profit amounts included in our payments to third-party administrative service providers are recorded as benefit expense in our consolidated GAAP financial statements, while HHS does not allow for the inclusion of these expenses within the medical loss expense for purposes of calculating minimum MLR.
Also included are our risk-adjustment payables for certain risk-adjustment programs. The risk-adjustment programs reallocate funds from insurers with lower risk populations to insurers with higher risk populations based on the relative risk scores of participants. We estimate our payable based on the risk of our customers compared to the risk of other customers in the same state and market, considering data obtained from industry studies and HHS. Payables are recorded as adjustments to premium revenue based on our year-to-date experience when the amounts are reasonably estimable and collection is reasonably assured. Final revenue adjustments are determined by HHS in the year following the policy year.
Reserves for Future Policy Benefits: Future policy benefits include liabilities for insurance policies for which some of the premiums received in earlier years are intended to pay anticipated benefits to be incurred in future years. Future policy benefits are continually monitored and reviewed, and when reserves are adjusted, differences are reflected in benefit expense.
Elevance Health, Inc.
Notes to Consolidated Financial Statements (continued)
We believe that our liabilities for future policy benefits, along with future premiums received, are adequate to satisfy our ultimate benefit liability; however, these estimates are inherently subject to a number of variable circumstances. Consequently, the actual results could differ materially from the amounts recorded in our consolidated financial statements.
Revenue Recognition: Premiums for risk-based contracts are recognized as revenue over the period insurance coverage is provided, and, if applicable, net of amounts recognized for MLR rebates, risk adjustment, reinsurance and risk corridor under contractual premium stabilization arrangements, the ACA or other regulatory requirements. Premiums may also include performance incentives and penalties, which are recognized based on contractual terms. We estimate amounts receivable and payable under these contractual terms, and to the extent that such estimated amounts vary from the final amounts paid, the adjustments are included in earnings in the period of final settlement. Premium payments from contracted government agencies are based on eligibility lists produced by the government agencies. Premium payments related to the unexpired contractual coverage periods are reflected in the accompanying consolidated balance sheets as Unearned income. Premiums include revenue adjustments for retrospectively rated contracts where revenue is based on the estimated loss experience of the contract. Premium rates for certain lines of business are subject to approval by the Department of Insurance of each respective state. Additionally, delays in annual premium rate changes from contracted government agencies require that we defer the recognition of any increases to the period in which the premium rates become final. The value of the impact can be significant in the period in which it is recognized depending on the magnitude of the premium rate increase, the membership to which it applies and the length of the delay between the effective date of the rate increase and the final contract date. Premium rate decreases are recognized in the period the change in premium rate becomes effective and the change in the rate is known, which may be prior to the period when the contract amendment affecting the rate is finalized.
Service fees include revenue from certain group contracts that provide for the group to be at risk for all, or with supplemental insurance arrangements, a portion, of their claims experience. We charge these fee-based groups an administrative fee, which is based on the number of members in a group and the group’s claim experience. In addition, service fees include amounts received for the administration of Medicare, certain other government programs, and administrative services arrangements of our Carelon subsidiaries. Generally, each fee-based arrangement includes services which constitute a single suite of services provided and for which consideration is based upon an agreed-upon rate, regardless of the amount of services provided in a given period. As with premiums, each fee-based arrangement may include terms with retroactive rate or membership adjustments, performance incentives and penalties, each of which is a form of variable consideration within the transaction price. As such, each fee-based arrangement contains a single performance obligation that constitutes a series, and revenue is recognized over time as the services are performed. All benefit payments under these programs are excluded from benefit expense.
The determination of whether services are distinct performance obligations that should be accounted for separately or combined as one unit of accounting may require significant judgment. The estimation of variable consideration to be recognized requires significant judgment in the determination of the level of achievement of performance incentives, service level achievements subject to performance penalties, and the completion level of tasks subject to implementation fees.
Product revenue represents services performed by CarelonRx for unaffiliated pharmacy customers and includes ingredient costs (net of any rebates or discounts), including co-payments made by or on behalf of the customer, and service fees. Unaffiliated pharmacy customers include our fee-based groups that have contracted with CarelonRx for pharmacy services and third-party health plans. Product revenues and costs of goods sold for our affiliated health plans are eliminated in consolidation, excluding co-payments and subsidies made by or on behalf of affiliated customers. Product revenue for pharmacy services is recognized using the gross method at the negotiated contract price when CarelonRx has concluded that it is the principal, and it controls the services before prescription drugs are transferred to the customer. CarelonRx determined it is the principal due to its contractual rights to design and develop a listing of prescription drugs offered to the customer (formulary management); its control over establishing the pharmacy network available to the customer to have its prescription fulfilled (network management); and its discretion over establishing the pricing for prescription drugs. Overall, control over these activities indicate CarelonRx is primarily responsible for fulfilling the promise to provide pharmacy services. CarelonRx recognizes revenue when control of the prescription drugs is transferred to customers, in an amount it expects to be entitled to in exchange for the products or services provided.
For our non-risk-based contracts, we had no material contract assets, contract liabilities or deferred contract costs recorded on our consolidated balance sheets at December 31, 2024 and 2023. Revenue recognized in 2024 and 2023 from performance obligations related to prior years, such as due to changes in transaction price, was not material. For contracts that
Elevance Health, Inc.
Notes to Consolidated Financial Statements (continued)
have an original expected duration of greater than one year, revenue expected to be recognized in future periods related to unfulfilled contractual performance obligations and contracts with variable consideration related to undelivered performance obligations is not material.
Cost of Products Sold: CarelonRx’s cost of products sold includes the cost of prescription drugs dispensed to unaffiliated pharmacy customers (net of rebates or discounts). Cost of products sold includes per-claim administrative fees for prescription fulfillment by its vendor and certain CarelonRx direct costs related to sales and administration of customer contracts.
Share-Based Compensation: Our current compensation philosophy provides for share-based compensation, including stock options, restricted stock awards and an employee stock purchase plan. Stock options are granted for a fixed number of shares with an exercise price at least equal to the fair value of the shares at the date of the grant. Restricted stock awards are issued at the fair value of the stock on the grant date. The employee stock purchase plan allows for a purchase price per share which is 90% of the fair value of a share of common stock on the lower of the first or last trading day of the plan quarter. The employee stock purchase plan discount is recognized as compensation expense based on GAAP guidance. All other share-based payments to employees are recognized as compensation expense in our consolidated statements of income based on their fair values. Additionally, excess tax benefits, which result from actual tax benefits realized when awards vest or options are exercised exceeding deferred tax benefits previously recognized based on grant date fair value, are recognized as tax benefits in the consolidated statements of income.
Advertising and Marketing Costs: We use print, broadcast and other advertising to promote our products and to develop our corporate image. We market our products through direct marketing activities and an extensive network of independent agents, brokers and retail partnerships for Individual and Medicare customers, and for certain Employer Group risk-based customers with a smaller employee base. Products for our Employer Group risk-based customers with a larger employee base are generally sold through independent brokers or consultants retained by the customer who work with industry specialists from our in-house sales force. In the Individual and Group markets, we offer products through state or federally facilitated marketplaces, or Public Exchanges, and off-exchange products. The cost of advertising and marketing for product promotion is expensed as incurred, while advertising and marketing costs associated with our corporate image are expensed when first aired. Total advertising and marketing expense was $540, $599 and $511 for the years ended December 31, 2024, 2023 and 2022, respectively.
Leases: We lease office space and certain computer and related equipment under noncancelable operating leases. We determine whether an arrangement is or contains a lease at its inception. We recognize lease liabilities based on the present value of the minimum lease payments not yet paid by using the lease term, any amounts probable of being owed under any residual value guarantees and the discount rate determined at lease commencement. As our leases do not generally provide an implicit rate, we use our incremental secured borrowing rate commensurate with the underlying lease terms to determine the present value of our lease payments. Our lease liabilities may include amounts for options to extend or terminate a lease when it is reasonably certain that we will exercise that option. We recognize operating right-of-use (“ROU”) assets at an amount equal to the lease liability adjusted for prepaid or accrued rent, the remaining balance of any lease incentives and unamortized initial direct costs.
The operating lease liabilities are reported in Other current liabilities and Other noncurrent liabilities and the related ROU assets are reported in Other noncurrent assets on our consolidated balance sheets. Lease expense for our operating leases is calculated on a straight-line basis over the lease term and is reported in operating expense on our consolidated statements of income. For our office space leases, we account for the lease and non-lease components (such as common area maintenance) as a single lease component. We also do not recognize a lease liability or ROU asset for our office space leases whose lease terms, at commencement, are twelve months or less and that do not include a purchase option or option to extend that we are reasonably certain to exercise.
We assess our ROU assets for impairment when there are indicators of impairment and compare the carrying amount of the ROU asset to its estimated undiscounted future cash flows. If the estimated undiscounted future cash flows are less than the carrying amount of the ROU asset, an impairment calculation is performed. An impairment loss is recorded for the difference of the ROU asset’s carrying value that exceeds its estimated discounted cash flows. During the years ended December 31, 2024, 2023 and 2022, we recorded $17, $23 and $34, respectively, for impairment and abandonment of ROU assets. See Note 18, “Leases,” for additional information about the ROU asset impairment and abandonment charges.
Elevance Health, Inc.
Notes to Consolidated Financial Statements (continued)
Shareholders’ Earnings per Share: Earnings per share amounts, on a basic and diluted basis, have been calculated based upon the weighted-average common shares outstanding for the period.
Basic shareholders’ earnings per share excludes dilution and is computed by dividing income available to common shareholders by the weighted-average number of common shares outstanding for the period. Diluted shareholders’ earnings per share may include the dilutive effect of stock options, restricted stock and convertible debentures, using the treasury stock method. The treasury stock method assumes exercise of stock options and vesting of restricted stock, with the assumed proceeds used to purchase common stock at the average market price for the period. The difference between the number of shares assumed issued and the number of shares assumed purchased represents the dilutive shares.
Recently Adopted Accounting Guidance: In November 2023, the FASB issued Accounting Standards Update No. 2023-07, Segment Reporting (Topic 280): Improvements to Reportable Segment Disclosures (“ASU 2023-07”). The amendments in ASU 2023-07 are intended to improve reportable segment disclosure requirements, primarily through enhanced disclosures about significant segment expenses. ASU 2023-07 is effective for our fiscal year beginning after December 15, 2023, and interim periods within our fiscal year beginning after December 15, 2024. The amendments are to be applied retrospectively to all prior periods presented in the financial statements, and upon transition, the significant segment expense categories and amounts disclosed in the prior periods should be based on the significant segment expense categories identified and disclosed in the period of adoption. The adoption of ASU 2023-07 did not have an impact on our results of operations or our consolidated cash flows.
In November 2020, the FASB issued Accounting Standards Update No. 2020-11, Financial Services—Insurance (Topic 944): Effective Date and Early Application (“ASU 2020-11”). The amendments in ASU 2020-11 changed the effective date and early application of Accounting Standards Update No. 2018-12, Financial Services—Insurance (Topic 944): Targeted Improvements to the Accounting for Long-Duration Contracts, which was issued in November 2018. The amendments in ASU 2020-11 extended the original effective date by one year to our interim and annual reporting periods beginning after December 15, 2022. This standard requires us to review cash flow assumptions for our long-duration insurance contracts at least annually and recognize the effect of changes in future cash flow assumptions in net income. This standard also requires us to update discount rate assumptions quarterly and recognize the effect of changes in these assumptions in other comprehensive income. The rate used to discount our reserves for future policy benefits will be based on an estimate of the yield for an upper-medium grade fixed-income instrument with a duration profile matching that of our liabilities. In addition, this standard changes the amortization method for deferred acquisition costs. We adopted these amendments on January 1, 2023, using the modified retrospective transition method for changes to the liability for future policy benefits and deferred acquisition costs as of the transition date, January 1, 2021. While the adoption did not have an overall material impact, our prior period financial statements presented in this Annual Report on Form 10-K have been restated to reflect the impacts of our adoption as required by the new standard. An adjustment of $(131) was made to shareholders’ net income for the year ended December 31, 2022, which include an adjustment to benefit expense of $155. In addition, the following balance sheet adjustments were made for the year ended December 31, 2022: $(17) to total assets; $47 to total liabilities; $13 to accumulated other comprehensive loss; and $(64) to shareholders’ equity and total equity.
Recent Accounting Guidance Not Yet Adopted: In November 2024, the FASB issued Accounting Standards Update No. 2024-03, Income Statement - Reporting Comprehensive Income - Expense Disaggregation Disclosures (Subtopic 220-40): Disaggregation of Income Statement Expenses (“ASU 2024-03”). This standard requires additional expense breakdowns in the footnotes for items such as inventory purchases, employee compensation, depreciation, and intangible asset amortization. Public companies must also provide a qualitative description of remaining expense amounts not separately disclosed, as well as the definition and total amount of selling expenses. ASU 2024-03 is effective for our fiscal year beginning after December 15, 2026, and interim periods within our fiscal year beginning after December 15, 2027. The amendments are to be applied either prospectively to financial statements issued for reporting periods after the effective date of the update, or retrospectively to all prior periods presented in the financial statements. We are currently evaluating the effects the adoption of ASU 2024-03 will have on our consolidated financial statements and related disclosures.
In December 2023, the FASB issued Accounting Standards Update No. 2023-09, Income Taxes (Topic 740) (“ASU 2023-09”). The amendments in ASU 2023-09 are intended to improve income tax disclosures, primarily related to the rate reconciliation and income taxes paid information. ASU 2023-09 is effective for our fiscal year beginning after December 15, 2024. The amendments are to be applied on a prospective basis, although retrospective adoption is permitted. We do not believe the adoption of ASU 2023-09 will have a material impact on our consolidated financial statements or disclosures.
Elevance Health, Inc.
Notes to Consolidated Financial Statements (continued)
In August 2023, the FASB issued Accounting Standards Update No. 2023-05, Business Combinations—Joint Venture Formations (Subtopic 805-60): Recognition and Initial Measurement (“ASU 2023-05”). ASU 2023-05 clarifies existing guidance to reduce diversity in practice and is requiring a joint venture to recognize and initially measure its assets and liabilities using a new basis of accounting, at fair value, upon formation. These amendments are effective prospectively for all joint venture formations with a formation date on or after January 1, 2025. We do not believe the adoption of ASU 2023-05 will have a material impact on our consolidated financial statements and disclosures.
There were no other new accounting pronouncements that were issued or became effective during the year ended December 31, 2024 that had, or are expected to have, a material impact on our financial position, results of operations, cash flows or financial statement disclosures.
3. Business Acquisitions and Divestitures
Completed Acquisitions
On December 31, 2024, we completed our acquisition of Centers Plan for Healthy Living LLC and Centers for Specialty Care Group IPA, LLC (“Centers”). Centers is a managed long-term care plan that serves New York state Medicaid and dual-eligible Medicaid/Medicare members, enabling adults with long-term care needs and disabilities to live safely and independently in their own home. This acquisition aligns with our strategic plan to grow the Health Benefits segment and leverage industry-leading expertise while serving Medicaid and dual-eligible populations. As of December 31, 2024, the purchase price was allocated to the tangible and intangible net assets acquired based on management's initial estimates of their fair values, of which $152 has been allocated to finite-lived intangible assets, $426 to indefinite-lived intangible assets and $450 to goodwill. The majority of the goodwill is not deductible for income tax purposes. As of December 31, 2024, the initial accounting for the acquisition has not been finalized. The proforma effects of this acquisition for prior periods were not material to our consolidated results of operations.
On December 10, 2024, we completed our acquisition of RSV QOZB LTSS, Inc. and certain affiliated entities (“CareBridge”), a value-based healthcare company that manages home and community-based services for Medicaid and dual-eligible members receiving long-term services and support. This acquisition aligns with Carelon Services’ care at home strategy, and our vision to be an innovative, valuable and inclusive healthcare partner by providing care management programs that improve the lives of the people we serve. As of December 31, 2024, the purchase price was allocated to the tangible and intangible net assets acquired based on management's initial estimates of their fair values, of which $995 has been allocated to finite-lived intangible assets and $1,631 to goodwill. The majority of the goodwill is not deductible for income tax purposes. As of December 31, 2024, the initial accounting for the acquisition has not been finalized. The proforma effects of this acquisition for prior periods were not material to our consolidated results of operations.
On March 11, 2024, we completed our acquisition of Paragon Healthcare, Inc. (“Paragon”). Paragon, which operates as part of CarelonRx, provides infusion services and injectable therapies through its omnichannel model of ambulatory infusion centers, home infusion pharmacies, and other specialty pharmacy services. This acquisition aligns with our vision to be an innovative, valuable and inclusive healthcare partner by providing care management programs that improve the lives of the people we serve. As of December 31, 2024, the purchase price was allocated to the tangible and intangible net assets acquired based on management's initial estimates of their fair values, of which $411 has been allocated to finite-lived intangible assets and $747 to goodwill. The majority of the goodwill is not deductible for income tax purposes. As of December 31, 2024, the initial accounting for the acquisition has not been finalized. The proforma effects of this acquisition for prior periods were not
Elevance Health, Inc.
Notes to Consolidated Financial Statements (continued)
material to our consolidated results of operations.
During the year ended December 31, 2024, in total, we completed business combinations for total cash consideration of approximately $5,128. The purchase prices for all business combinations were preliminarily allocated to the tangible and intangible net assets acquired based on management's initial estimates of their fair values. Tangible net assets acquired were $(236), and intangible assets were $5,364, of which $1,872 was allocated to finite-lived intangible assets, $426 to indefinite-lived intangible assets, and $3,066 to goodwill. Of these amounts, $2,641 was allocated to our Carelon Services reportable segment, $1,594 was allocated to our CarelonRx reportable segment and $1,129 to our Health Benefits reportable segment. The majority of goodwill is not deductible for income tax purposes. As of December 31, 2024, the initial accounting for the acquisitions had not been finalized. Any subsequent adjustments made to the assets acquired or liabilities assumed during the measurement period may result from a purchase price adjustment, or will be recorded as an adjustment to goodwill and/or intangible assets acquired. The proforma effects of these acquisitions for prior periods were not material to our consolidated results of operations.
During the year ended December 31, 2023, in total, we completed business combinations for total cash consideration of approximately $1,655. These acquisitions included BioPlus Parent, LLC and its subsidiaries (“BioPlus”), which were acquired in February 2023. The purchase prices for all business combinations were preliminarily allocated to the tangible and intangible net assets acquired based on management's initial estimates of their fair values, of which $820 was allocated to finite-lived intangible assets and $923 to goodwill. Of these amounts, $1,723 was allocated to our CarelonRx reportable segment and $20 to our Carelon Services reportable segment. The majority of goodwill is not deductible for income tax purposes. As of December 31, 2024, the accounting for the acquisitions was finalized. The proforma effects of these acquisitions for prior periods were not material to our consolidated results of operations.
Acquired tangible assets (liabilities) at the acquisition date were:
| | | | | | | | | | | |
| 2024 | | 2023 |
| Cash, cash equivalents and short-term investments | $ | 484 | | | $ | 6 | |
| Accounts receivable and other current assets | 847 | | | 241 | |
| Property, equipment and other long-term assets | 309 | | | 18 | |
| Medical claims and other policyholder liabilities payable | (154) | | | — | |
| Accounts payable and other current liabilities | (1,005) | | | (169) | |
| Other long-term liabilities | (242) | | | (1) | |
| Deferred tax liabilities | (475) | | | (183) | |
| Total net tangible assets (liabilities) | $ | (236) | | | $ | (88) | |
The preliminary purchase price allocations for the various 2024 business combinations are subject to adjustment as valuation analyses, primarily related to intangible assets and contingent and tax liabilities, are finalized.
Acquisition date fair values and weighted-average useful lives assigned to intangible assets include:
| | | | | | | | | | | | | | | | | | | | | | | |
| 2024 | | 2023 |
| Fair Value | | Weighted Average Useful Life | | Fair Value | | Weighted Average Useful Life |
| Customer-related | $ | 1,621 | | | 20 years | | $ | 796 | | | 25 years |
| Provider and hospital relationships | 70 | | | 10 years | | — | | | 0 |
| Other | 181 | | | 8 years | | 24 | | | 5 years |
| State Medicaid licenses | 426 | | | — | | | — | | | — | |
| Total intangible assets | $ | 2,298 | | | | | $ | 820 | | | |
The results of operations and financial condition of acquired entities have been included in our consolidated results and the results of the corresponding operating segment as of the date of acquisition. Through December 31, 2024, the impact of
Elevance Health, Inc.
Notes to Consolidated Financial Statements (continued)
the acquired entities on revenue and net earnings was not material. Unaudited pro-forma revenues for the years ended December 31, 2024, 2023 and 2022, as if the acquisitions had occurred on January 1, 2022, were immaterial.
Divestitures
On April 1, 2024, we completed the sale of our life and disability businesses to StanCorp Financial Group, Inc. (“The Standard”), a provider of financial protection products and services for employers and individuals, which resulted in a gain on sale of business of $201 in the year ended December 31, 2024. Upon closing, we and The Standard entered into a product distribution partnership. The related net assets held for sale for the life and disability businesses divested as of December 31, 2023 and results of operations for the year ended December 31, 2024 were not material.
4. Business Optimization Initiatives
2023-2024 Business Efficiency Program
During the third quarter of 2023, based on a strategic review of our operations, assets and investments, management implemented the “2023-2024 Business Efficiency Program” to enhance operating efficiency, refine the focus of our investments and optimize our physical footprint. The 2023-2024 Business Efficiency Program included the write-off of certain information technology assets and contract exit costs, a reduction in staff including the relocation of certain job functions, and the impairment of assets associated with the closure or partial closure of data centers and offices. The 2023-2024 Business Efficiency Program was finalized as of December 31, 2024. Cash outlays associated with this program, which primarily relate to the personnel-related costs, are expected to be paid through 2025.
In 2024, we incurred $268 of costs towards the 2023-2024 Business Efficiency Program. This included primarily $72 of pre-tax charges for information technology asset write-offs, $165 of pre-tax personnel-related charges for the reduction and/or relocation of staff, which includes severance and related costs primarily determined under our existing severance plans, and $31 of pre-tax charges from asset impairments related to the closure or partial closure of offices, including operating lease-related ROU assets and other property and equipment.
In 2023, we incurred $752 of expense, which included $468 of pre-tax charges for information technology assets and contract write-offs related to projects that have been de-prioritized and stopped, $230 of pre-tax personnel-related charges for the reduction and/or relocation of workforce, which includes severance and related costs primarily determined under our existing severance plans, and $54 of pre-tax charges from asset impairments related to the closure or partial closure of data centers and offices, including operating lease-related ROU assets and other property and equipment.
These charges in both years were recognized in operating expense in the Corporate & Other segment; see Note 20, “Segment Information.”
During the year ended December 31, 2024, there were $165 in charges related to employee termination costs under the 2023-2024 Business Efficiency Program, and payments were $132. During the year ended December 31, 2023, there were $230 in charges related to employee termination costs under the 2023-2024 Business Efficiency Program, and payments were $39.
Elevance Health, Inc.
Notes to Consolidated Financial Statements (continued)
5. Investments
A summary of current and long-term fixed maturity securities, available-for-sale, at December 31, 2024 and 2023 is as follows: | | | | | | | | | | | | | | | | | | | | | | | | | | | | | | | | | |
| Cost or
Amortized
Cost | | Gross
Unrealized
Gains | | Gross
Unrealized
Losses | | Allowance For Credit Losses | | Estimated
Fair Value | | | | |
| | | | | | | | | |
| December 31, 2024 | | | | | | | | | | | | | |
| Fixed maturity securities: | | | | | | | | | | | | | |
| United States Government securities | $ | 1,907 | | | $ | 2 | | | $ | (85) | | | $ | — | | | $ | 1,824 | | | | | |
| Government sponsored securities | 156 | | | — | | | (5) | | | — | | | 151 | | | | | |
| Foreign government securities | 19 | | | — | | | (2) | | | — | | | 17 | | | | | |
| States, municipalities and political subdivisions, tax-exempt | 3,142 | | | 33 | | | (123) | | | — | | | 3,052 | | | | | |
| Corporate securities | 14,095 | | | 192 | | | (367) | | | (4) | | | 13,916 | | | | | |
| Residential mortgage-backed securities | 3,274 | | | 13 | | | (236) | | | — | | | 3,051 | | | | | |
| Commercial mortgage-backed securities | 1,801 | | | 8 | | | (60) | | | (1) | | | 1,748 | | | | | |
| Other asset-backed securities | 2,534 | | | 36 | | | (92) | | | (1) | | | 2,477 | | | | | |
| Total fixed maturity securities | $ | 26,928 | | | $ | 284 | | | $ | (970) | | | $ | (6) | | | $ | 26,236 | | | | | |
| | | | | | | | | | | | | |
| | | | | | | | | | | | | |
| December 31, 2023 | | | | | | | | | | | | | |
| Fixed maturity securities: | | | | | | | | | | | | | |
| United States Government securities | $ | 1,873 | | | $ | 25 | | | $ | (54) | | | $ | — | | | $ | 1,844 | | | | | |
| Government sponsored securities | 112 | | | 1 | | | (3) | | | — | | | 110 | | | | | |
| Foreign government securities | 5 | | | 1 | | | (2) | | | — | | | 4 | | | | | |
| States, municipalities and political subdivisions, tax-exempt | 3,985 | | | 69 | | | (152) | | | — | | | 3,902 | | | | | |
| Corporate securities | 14,838 | | | 322 | | | (580) | | | (2) | | | 14,578 | | | | | |
| Residential mortgage-backed securities | 4,071 | | | 40 | | | (279) | | | — | | | 3,832 | | | | | |
| Commercial mortgage-backed securities | 2,174 | | | 13 | | | (138) | | | (2) | | | 2,047 | | | | | |
| Other asset-backed securities | 4,278 | | | 25 | | | (130) | | | — | | | 4,173 | | | | | |
| Total fixed maturity securities | $ | 31,336 | | | $ | 496 | | | $ | (1,338) | | | $ | (4) | | | $ | 30,490 | | | | | |
| | | | | | | | | | | | | |
| | | | | | | | | | | | | |
Other asset-backed securities primarily consist of collateralized loan obligations and other debt securities.
Elevance Health, Inc.
Notes to Consolidated Financial Statements (continued)
For fixed maturity securities in an unrealized loss position at December 31, 2024 and 2023, the following table summarizes the aggregate fair values and gross unrealized losses by length of time those securities have continuously been in an unrealized loss position. | | | | | | | | | | | | | | | | | | | | | | | | | | | | | | | | | | | |
| | Less than 12 Months | | 12 Months or Greater |
| | Number of
Securities | | Estimated
Fair Value | | Gross
Unrealized
Loss | | Number of
Securities | | Estimated
Fair Value | | Gross
Unrealized
Loss |
| (Securities are whole amounts) | | | | | | | | | | | |
| December 31, 2024 | | | | | | | | | | | |
| Fixed maturity securities: | | | | | | | | | | | |
| United States Government securities | 40 | | $ | 1,240 | | | $ | (52) | | | 25 | | $ | 330 | | | $ | (33) | |
| Government sponsored securities | 10 | | 89 | | | (2) | | | 36 | | 42 | | | (3) | |
| Foreign government securities | 2 | | 15 | | | (1) | | | 2 | | 2 | | | (1) | |
| States, municipalities and political subdivisions, tax-exempt | 527 | | 1,092 | | | (22) | | | 661 | | 943 | | | (101) | |
| Corporate securities | 1,415 | | 4,717 | | | (92) | | | 1,317 | | 2,645 | | | (275) | |
| Residential mortgage-backed securities | 306 | | 1,097 | | | (25) | | | 1,312 | | 1,291 | | | (211) | |
| Commercial mortgage-backed securities | 136 | | 670 | | | (15) | | | 297 | | 661 | | | (45) | |
| Other asset-backed securities | 123 | | 293 | | | (9) | | | 236 | | 735 | | | (83) | |
| Total fixed maturity securities | 2,559 | | $ | 9,213 | | | $ | (218) | | | 3,886 | | $ | 6,649 | | | $ | (752) | |
| | | | | | | | | | | |
| | | | | | | | | | | |
| December 31, 2023 | | | | | | | | | | | |
| Fixed maturity securities: | | | | | | | | | | | |
| United States Government securities | 35 | | | $ | 552 | | | $ | (9) | | | 44 | | | $ | 370 | | | $ | (45) | |
| Government sponsored securities | — | | | — | | | — | | | 40 | | | 52 | | | (3) | |
| Foreign government securities | — | | | — | | | — | | | 2 | | | 4 | | | (2) | |
| States, municipalities and political subdivisions, tax-exempt | 203 | | | 354 | | | (2) | | | 1,034 | | | 1,811 | | | (150) | |
| Corporate securities | 389 | | | 608 | | | (15) | | | 2,624 | | | 6,871 | | | (565) | |
| Residential mortgage-backed securities | 183 | | | 438 | | | (5) | | | 1,620 | | | 2,075 | | | (274) | |
| Commercial mortgage-backed securities | 112 | | | 353 | | | (6) | | | 534 | | | 1,317 | | | (132) | |
| Other asset-backed securities | 110 | | | 394 | | | (18) | | | 761 | | | 2,342 | | | (112) | |
| Total fixed maturity securities | 1,032 | | | $ | 2,699 | | | $ | (55) | | | 6,659 | | | $ | 14,842 | | | $ | (1,283) | |
| | | | | | | | | | | |
| | | | | | | | | | | |
| | | | | | | | | | | |
| | | | | | | | | | | |
Unrealized losses on our securities shown in the table above have not been recognized into income because, as of December 31, 2024, we do not intend to sell these investments, and it is likely that we will not be required to sell these investments prior to their anticipated recovery. The declines in fair values are largely due to increasing interest rates driven by the higher rate of inflation and other market conditions.
Allowances for credit losses have been recorded in the amounts of $6 and $4 at December 31, 2024 and 2023, respectively, for declines in fair value due to unfavorable changes in the credit quality characteristics that impact our assessment of collectability of principal and interest.
Elevance Health, Inc.
Notes to Consolidated Financial Statements (continued)
The amortized cost and fair value of fixed maturity securities at December 31, 2024, by contractual maturity, are shown below. Expected maturities may differ from contractual maturities because the issuers of the securities may have the right to prepay obligations.
| | | | | | | | | | | |
| Amortized
Cost | | Estimated
Fair Value |
| Due in one year or less | $ | 198 | | | $ | 196 | |
| Due after one year through five years | 4,827 | | | 4,772 | |
| Due after five years through ten years | 10,550 | | | 10,378 | |
| Due after ten years | 6,278 | | | 6,090 | |
| Mortgage-backed securities | 5,075 | | | 4,800 | |
| Total fixed maturity securities | $ | 26,928 | | | $ | 26,236 | |
Equity Securities
A summary of current equity securities at December 31, 2024 and 2023 is as follows:
| | | | | | | | | | | |
| December 31, 2024 | | December 31, 2023 |
| Equity Securities: | | | |
| Exchange traded funds | $ | 1,002 | | | $ | 106 | |
| | | |
| Common equity securities | 118 | | | 45 | |
| Private equity securities | 72 | | | 78 | |
| Total | $ | 1,192 | | | $ | 229 | |
Other Invested Assets
Other invested assets include non-controlled joint ventures, including our minority interest ownership of approximately 35% of Augusta Topco Holdings, L.P. (“Mosaic Health”) and our 40% minority interest ownership of Project Freedom Holdings, LLC, which is the ultimate parent of LIBERTY Dental Plan Corporation (“Liberty Dental”).
On August 6, 2024, we made an equity investment in Mosaic Health of $2,580, consisting of cash and the net put option discussed in Note 6 “Derivative Financial Instruments”, Mosaic Health is a joint venture with Clayton, Dubilier & Rice (“CD&R”) that is designed to accelerate innovation in care delivery across multiple regions in the United States by bringing together certain care delivery and enablement assets of Carelon Management Services, LLC (“CMSI Assets”), a Carelon Health business, and two CD&R portfolio businesses, apree health and Millennium Physician Group. The investment is accounted for as an equity method investment. Our additional contribution of the CMSI Assets to Mosaic Health was completed on January 1, 2025, for which we received an additional $300 of equity (approximately 5% ownership) in Mosaic Health. The CMSI Assets are included under the captions “Assets held for sale” and “Liabilities held for sale” in our consolidated balance sheets as of December 31, 2024.
In connection with our equity method investment in Mosaic Health, we entered into a financing agreement to provide a term loan of $200 and a line of credit up to $500 to Mosaic Health. Net amounts receivable under these arrangements were $188 at December 31, 2024, which is included under the caption “Other invested assets” in our consolidated balance sheets as of December 31, 2024. During the year ended December 31, 2024, we recognized $7 in interest income from the financing arrangement with Mosaic Health. In addition to the term loan and line of credit, we committed to providing $70 of funding with no additional equity interest in Mosaic Health to meet any shortfall in operating cash flow and regulatory capital requirements of the CMSI Assets through December 31, 2026, and to fund any remaining shortfalls as necessary for which we would receive additional equity interests in Mosaic Health.
Elevance Health, Inc.
Notes to Consolidated Financial Statements (continued)
In January 2023, we made an equity investment in Liberty Dental, a joint venture with Welsh, Carson, Anderson & Stowe which engages in dental insurance and dental health care administration. The investment is accounted for as an equity method investment. In connection with our equity method investment in Liberty Dental, in December 2024 we entered into a commitment to provide funding in the form of mandatorily redeemable preferred equity shares in Liberty Dental of up to $250 of which $87 was disbursed in 2024. The mandatorily redeemable preferred equity in Liberty Dental is included in the caption “Other invested assets” in our consolidated balance sheets at December 31, 2024. Dividend income recognized from the financing arrangement during the year ended December 31, 2024 was not material.
Investment Income
The major categories of net investment income for the years ended December 31, 2024, 2023 and 2022 are as follows:
| | | | | | | | | | | | | | | | | |
| 2024 | | 2023 | | 2022 |
| Fixed maturity securities | $ | 1,539 | | | $ | 1,387 | | | $ | 971 | |
| Equity securities | 40 | | | 18 | | | 48 | |
| Cash equivalents | 235 | | | 305 | | | 77 | |
| Other invested assets | 274 | | | 157 | | | 432 | |
| Investment income | 2,088 | | | 1,867 | | | 1,528 | |
| Investment expenses | (37) | | | (42) | | | (43) | |
| Net investment income | $ | 2,051 | | | $ | 1,825 | | | $ | 1,485 | |
Investment (Losses) Gains
Net investment (losses) gains for the years ended December 31, 2024, 2023 and 2022 are as follows:
| | | | | | | | | | | | | | | | | |
| 2024 | | 2023 | | 2022 |
| Net gains (losses): | | | | | |
| Fixed maturity securities: | | | | | |
| Gross realized gains from sales | $ | 158 | | | $ | 47 | | | $ | 52 | |
| Gross realized losses from sales | (479) | | | (488) | | | (469) | |
| Impairment losses recognized in income | (17) | | | (15) | | | (31) | |
| Net realized losses on fixed maturity securities | (338) | | | (456) | | | (448) | |
| Equity securities: | | | | | |
| Unrealized losses recognized on equity securities still held | (6) | | | (1) | | | (78) | |
| Net realized (losses) gains recognized on equity securities sold | (9) | | | 6 | | | (102) | |
| Net (losses) gains on equity securities | (15) | | | 5 | | | (180) | |
| Other investments: | | | | | |
| Gross gains | 49 | | | 103 | | | 96 | |
| Gross losses | (25) | | | (63) | | | (64) | |
| Impairment losses recognized in income | (126) | | | (291) | | | (34) | |
| Net losses on other investments | (102) | | | (251) | | | (2) | |
| Net losses on investments | $ | (455) | | | $ | (702) | | | $ | (630) | |
| | | | | |
| | | | | |
| | | | | |
| | | | | |
| | | | | |
| | | | | |
| | | | | |
| | | | | |
| | | | | |
| | | | | |
A primary objective in the management of our fixed maturity and equity portfolios is to maximize total return relative to underlying liabilities and respective liquidity needs. In achieving this goal, assets may be sold to take advantage of market conditions or other investment opportunities as well as tax considerations. Sales will generally produce realized gains and losses. In the ordinary course of business, we may sell securities at a loss for a number of reasons, including, but not limited
Elevance Health, Inc.
Notes to Consolidated Financial Statements (continued)
to: (i) changes in the investment environment; (ii) expectations that the fair value could deteriorate further; (iii) desire to reduce exposure to an issuer or an industry; (iv) changes in credit quality; or (v) changes in expected cash flow.
Total proceeds from sales, maturities, calls or redemptions of fixed maturity securities were $16,334, $12,289 and $22,048 for the years ended December 31, 2024, 2023 and 2022, respectively.
A significant judgment in the valuation of investments is the determination of when a credit loss has occurred. We follow a consistent and systematic process for recognizing impairments on securities that sustain credit declines in value. We have established a committee responsible for the impairment review process. The decision to impair a security incorporates both quantitative criteria and qualitative information. The impairment review process considers a number of factors including, but not limited to: (i) the extent to which the fair value is less than book value, (ii) the financial condition and near term prospects of the issuer, (iii) our intent and ability to retain impaired investments for a period of time sufficient to allow for any anticipated recovery in fair value, (iv) our intent to sell or the likelihood that we will need to sell a fixed maturity security before recovery of its amortized cost basis, (v) whether the debtor is current on interest and principal payments, (vi) the reasons for the decline in value (i.e., credit event compared to liquidity, general credit spread widening, currency exchange rate or interest rate factors) and (vii) general market conditions and industry or sector specific factors. When a decision has been made to sell an impaired security or it is more likely than not that the impaired security will be required to be disposed of prior to recovery of its cost basis, the security is written down to fair value at the reporting date. For all other impaired securities, if the impairment is deemed to be credit related, an allowance is created.
Investment securities are exposed to various risks, such as interest rate, market and credit. Due to the level of risk associated with certain investment securities and the level of uncertainty related to changes in the value of investment securities, it is possible that changes in these risk factors in the near term could have a material adverse impact on our results of operations or shareholders’ equity.
At December 31, 2024 and 2023, there were no individual investments that exceeded 10% of shareholders’ equity.
At December 31, 2024 and 2023, there were nine and eleven, respectively, fixed maturity investments that did not produce income during the years then ended.
We had unfunded loan commitments to certain equity investees of $1,442 and $1,321 at December 31, 2024 and 2023, respectively. We do not believe such obligations will materially affect its financial position, results of operations, or cash flows.
As of December 31, 2024 and 2023, we had committed approximately $423 and $497, respectively, to future investments in rated notes.
At December 31, 2024 and 2023, securities with carrying values of approximately $1,035 and $876, respectively, were deposited by our insurance subsidiaries under requirements of regulatory authorities.
Accrued Investment Income
Accrued investment income totaled $287 and $301 at December 31, 2024 and 2023, respectively. We recognize accrued investment income under the caption “Other receivables” on our consolidated balance sheets.
Securities Lending Programs
The fair value of the cash and securities received as collateral for securities loaned at December 31, 2024 and 2023 was $2,305 and $2,380, respectively. The collateral received was 102% of the market value of the loaned securities at each of December 31, 2024 and 2023.
We recognize the collateral as an asset under the caption “Other current assets” in our consolidated balance sheets, and we recognize a corresponding liability for the obligation to return the collateral to the borrower under the caption “Other current liabilities.” The securities on loan are reported in the applicable investment category on our consolidated balance sheets.
Elevance Health, Inc.
Notes to Consolidated Financial Statements (continued)
At December 31, 2024 and 2023, the remaining contractual maturities of our securities lending transactions included overnight and continuous transactions of cash for $2,115 and $2,255, respectively, United States Government securities for $176 and $99, respectively, and residential mortgage-backed securities for $14 and $26, respectively.
6. Derivative Financial Instruments
We primarily invest in the following types of derivative financial instruments: interest rate swaps, futures, forward contracts, put and call options, collars, swaptions, embedded derivatives and warrants. We also enter into master netting agreements which reduce credit risk by permitting net settlement of transactions. At December 31, 2024 and 2023, we had posted collateral of $142 and $35, respectively, related to our derivative financial instruments.
Elevance Health, Inc.
Notes to Consolidated Financial Statements (continued)
A summary of the aggregate contractual or notional amounts and carrying values related to derivative financial instruments at December 31, 2024 and 2023 is as follows: | | | | | | | | | | | | | | | | | | | | | | | |
| | Contractual/
Notional
Amount | | Balance Sheet Location | | Carrying Value |
| Asset | | (Liability) |
| December 31, 2024 | | | | | | | |
| Hedging instruments | | | | | | | |
| Interest rate swaps - fixed to floating | $ | 6,475 | | | Other assets/other liabilities | | $ | 8 | | | $ | (150) | |
| Foreign currency forwards | 322 | | | Other liabilities | | — | | | (6) | |
| Subtotal hedging | 6,797 | | | | | 8 | | | (156) | |
| Non-hedging instruments | | | | | | | |
| | | | | | | |
| Interest rate swaps | 5 | | | | | — | | | — | |
| Options | 2,453 | | | Other liabilities | | — | | | (1,415) | |
| | | | | | | |
| Futures/Forwards | 124 | | | Equity securities/other assets | | 3 | | | — | |
| Subtotal non-hedging | 2,582 | | | Subtotal non-hedging | | 3 | | | (1,415) | |
| Total derivatives | $ | 9,379 | | | Total derivatives | | 11 | | | (1,571) | |
| | | Amounts netted | | (6) | | | 6 | |
| | | Net derivatives | | $ | 5 | | | $ | (1,565) | |
| | | | | | | |
| December 31, 2023 | | | | | | | |
| Hedging instruments | | | | | | | |
| Interest rate swaps - fixed to floating | $ | 1,475 | | | Other assets/other liabilities | | $ | 15 | | | $ | (52) | |
| | | | | | | |
| Non-hedging instruments | | | | | | | |
| Derivatives embedded in convertible securities | 15 | | | Fixed maturity securities | | 1 | | | — | |
| Interest rate swaps | 5 | | | | | — | | | — | |
| Options | 161 | | | Other liabilities | | — | | | (85) | |
| Collars | 19 | | | Equity securities | | 14 | | | (3) | |
| Futures/Forwards | 151 | | | Equity securities/other assets | | 7 | | | — | |
| Subtotal non-hedging | 351 | | | Subtotal non-hedging | | 22 | | | (88) | |
| Total derivatives | $ | 1,826 | | | Total derivatives | | 37 | | | (140) | |
| | | Amounts netted | | (15) | | | 15 | |
| | | Net derivatives | | $ | 22 | | | $ | (125) | |
| | | | | | | |
| | | | | | | |
| | | | | | | |
Elevance Health, Inc.
Notes to Consolidated Financial Statements (continued)
Fair Value Hedges
We have entered into various interest rate swap contracts to convert a portion of our interest rate exposure on our long-term debt from fixed rates to floating rates. The floating rates payable on all of our fair value hedges are benchmarked to the Secured Overnight Financing Rate. A summary of our outstanding fair value hedges at December 31, 2024 and 2023 is as follows: | | | | | | | | | | | | | | | | | | | | | | | | | | | | | | | | | | | |
| Type of Fair Value Hedges | | Year
Entered
Into | | Outstanding Notional Amount | | Interest Rate
Received | | Expiration Date |
| 2024 | | 2023 | |
| Interest rate swap | | 2024 | | $ | 200 | | | $ | — | | | 5.500 | | % | | April 15, 2032 |
| Interest rate swap | | 2024 | | 1,000 | | | — | | | 4.750 | | | | August 15, 2032 |
| Interest rate swap | | 2024 | | 600 | | | — | | | 5.150 | | | | December 15, 2028 |
| Interest rate swap | | 2024 | | 1,000 | | | — | | | 5.375 | | | | December 15, 2033 |
| Interest rate swap | | 2024 | | 750 | | | — | | | 4.750 | | | | August 15, 2029 |
| Interest rate swap | | 2024 | | 750 | | | — | | | 4.950 | | | | May 1, 2031 |
| Interest rate swap | | 2024 | | 1,200 | | | — | | | 5.200 | | | | August 15, 2034 |
| Interest rate swap | | 2023 | | 300 | | | 300 | | | 5.000 | | | | April 15, 2032 |
| Interest rate swap | | 2023 | | 150 | | | 150 | | | 2.550 | | | | September 15, 2030 |
| Interest rate swap | | 2023 | | — | | | 500 | | | 4.900 | | | | February 8, 2026 |
| Interest rate swap | | 2023 | | 125 | | | 125 | | | 4.101 | | | | September 1, 2027 |
| Interest rate swap | | 2023 | | 100 | | | 100 | | | 2.250 | | | | November 15, 2029 |
| Interest rate swap | | 2022 | | 150 | | | 150 | | | 5.500 | | | | April 15, 2032 |
| Interest rate swap | | 2022 | | 75 | | | 75 | | | 4.101 | | | | September 1, 2027 |
| Interest rate swap | | 2022 | | 75 | | | 75 | | | 2.250 | | | | November 15, 2029 |
| Total notional amount outstanding | | | | $ | 6,475 | | | $ | 1,475 | | | | | | |
The following amounts were recorded on our consolidated balance sheets related to cumulative basis adjustments for fair value hedges at December 31, 2024 and 2023: | | | | | | | | | | | | | | | | | | | | | | | | | | |
| Balance Sheet Classification in Which Hedged Item is Included | | Carrying Amount of Hedged Liability | | Cumulative Amount of Fair Value Hedging Adjustment Included in the Carrying Amount of the Hedged Liability |
| 2024 | | 2023 | | 2024 | | 2023 |
| Long-term debt | | $ | 29,218 | | | $ | 23,246 | | | $ | (142) | | | $ | (37) | |
Cash Flow Hedges
We have entered into a series of forward starting pay fixed interest rate swaps with the objective of eliminating the variability of cash flows in the interest payments on future financings that were anticipated at the time of entering into the swaps. During 2024 and 2023, swaps in the notional amount of $900 and $550, respectively, were terminated.
The unrecognized loss for all expired and terminated cash flow hedges included in accumulated other comprehensive loss, net of tax, was $201 and $211 at December 31, 2024 and 2023, respectively. As of December 31, 2024, the total amount of amortization over the next twelve months for all cash flow hedges is estimated to increase interest expense by approximately $13. No amounts were excluded from effectiveness testing.
Elevance Health, Inc.
Notes to Consolidated Financial Statements (continued)
Non-Hedging Derivatives
A summary of the effect of non-hedging derivatives on our consolidated statements of income for the years ended December 31, 2024, 2023 and 2022 is as follows:
| | | | | | | | | | | | | | |
| Type of Non-hedging Derivatives | | Income Statement Location of
Gain (Loss) Recognized | | Derivative
(Loss) Gain
Recognized |
| Year ended December 31, 2024 | | | | |
| | | | |
| | | | |
| Options (including swaptions) | | Net losses on financial instruments | | $ | (1) | |
| Collars | | Net losses on financial instruments | | 14 | |
| Futures | | Net losses on financial instruments | | (3) | |
| Total | | | | $ | 10 | |
| Year ended December 31, 2023 | | | | |
| Derivatives embedded in convertible securities | | Net losses on financial instruments | | $ | (2) | |
| | | | |
| Options (including swaptions) | | Net losses on financial instruments | | 3 | |
| Collars | | Net losses on financial instruments | | (3) | |
| Futures | | Net losses on financial instruments | | 10 | |
| Total | | | | $ | 8 | |
| Year ended December 31, 2022 | | | | |
| Derivatives embedded in convertible securities | | Net losses on financial instruments | | $ | (3) | |
| Interest rate swaps | | Net losses on financial instruments | | (4) | |
| Options (including swaptions) | | Net losses on financial instruments | | 13 | |
| Collars | | Net losses on financial instruments | | 10 | |
| Futures | | | | 64 | |
| Total | | | | $ | 80 | |
In connection with our equity investment in Mosaic Health (see Note 5, “Investments”), we entered into a limited partnership and related agreements with the majority owners that provides for certain rights and obligations of each party, including certain put, call, and purchase price true-up options. These options, if exercised, will result in our purchase of the units held by the majority owners as early as 2028 but no later than 2030 at a price based on certain multiples of revenue and earnings of Mosaic Health businesses, subject to various adjustments and qualifications. We have calculated the fair value of the net put option, which is a Level III measurement (see Note 7, “Fair Value”), using a Monte Carlo simulation, which relies on assumptions including cash flow projections, risk-free rates, volatility and details specific to the options. Significant changes in assumptions could result in significantly lower or higher fair value measurements. The net put option’s fair value liability of $1,330, which is a non-cash item measured at the date of our initial investment, is included under the caption “Other noncurrent liabilities” in our consolidated balance sheets as of December 31, 2024. We have elected to not mark the net put option to market, as it is an option on large blocks of equity securities, and the carrying value of the net put option will remain on the consolidated balance sheets until it is exercised or expires.
As discussed in Note 5, “Investments,” in January 2023, we made an equity investment that resulted in our minority interest ownership of Liberty Dental. As part of the Liberty Dental transaction, we entered into a shareholders’ agreement with the majority owners that provides for certain rights and obligations of each party, including certain put and call options. These options could result in our purchase of the units held by the majority owners in 2026 and 2027. We have calculated the fair value of the net put option, which is a Level III measurement (see Note 7, “Fair Value”), using a Monte Carlo simulation, which relies on assumptions, including cash flow projections, risk-free rates, volatility and details specific to the put and call options. Significant changes in assumptions could result in significantly lower or higher fair value measurements. The net put option’s fair value liability of $85 determined as of December 31, 2023 is included under the caption “Other noncurrent liabilities” in our consolidated balance sheets as of December 31, 2024 and 2023. We have elected to not mark the net put option to market, and the carrying value of the net put option will remain on the consolidated balance sheets until it is exercised or expires.
Elevance Health, Inc.
Notes to Consolidated Financial Statements (continued)
7. Fair Value
Assets and liabilities recorded at fair value in the consolidated balance sheets are categorized based upon the level of judgment associated with the inputs used to measure their fair value. Level inputs, as defined by FASB guidance for fair value measurements and disclosures, are as follows:
| | | | | | | | |
| Level Input: | | Input Definition: |
| Level I | | Inputs are unadjusted, quoted prices for identical assets or liabilities in active markets at the measurement date. |
| Level II | | Inputs other than quoted prices included in Level I that are observable for the asset or liability through corroboration with market data at the measurement date. |
| Level III | | Unobservable inputs that reflect management’s best estimate of what market participants would use in pricing the asset or liability at the measurement date. |
The following methods, assumptions and inputs were used to determine the fair value of each class of the following assets and liabilities recorded at fair value in the consolidated balance sheets:
Cash equivalents: Cash equivalents primarily consist of highly rated money market funds with maturities of three months or less and are purchased daily at par value with specified yield rates. Due to the short-term nature of the funds, we designate all cash equivalents as Level I.
Fixed maturity securities, available-for-sale: Fair values of available-for-sale fixed maturity securities are based on quoted market prices, where available. These fair values are obtained primarily from third-party pricing services, which generally use Level I or Level II inputs for the determination of fair value to facilitate fair value measurements and disclosures. Level II securities primarily include corporate securities, securities from states, municipalities and political subdivisions, mortgage-backed securities, United States Government securities, foreign government securities, and certain other asset-backed securities. For securities not actively traded, the pricing services may use quoted market prices of comparable instruments or discounted cash flow analyses, incorporating inputs that are currently observable in the markets for similar securities. We have controls in place to review the pricing services’ qualifications and procedures used to determine fair values. In addition, we periodically review the pricing services’ pricing methodologies, data sources and pricing inputs to ensure the fair values obtained are reasonable. Inputs that are often used in the valuation methodologies include, but are not limited to, broker quotes, benchmark yields, credit spreads, default rates and prepayment speeds. We also have certain fixed maturity securities, primarily collateralized loan obligation securities, rated note securities and corporate debt securities, that are designated Level III securities. For these securities, the valuation methodologies may incorporate broker quotes, net asset value of underlying loans or discounted cash flow analyses using assumptions for inputs such as expected cash flows, benchmark yields, credit spreads, default rates and prepayment speeds that are not observable in the markets.
Equity securities: Fair values of equity securities are generally designated as Level I and are based on quoted market prices. For certain equity securities, quoted market prices for the identical security are not always available, and the fair value is estimated by reference to similar securities for which quoted prices are available. These securities are designated Level II. We also have certain equity securities, including private equity securities, for which the fair value is estimated based on each security’s current condition and future cash flow projections. Such securities are designated Level III. The fair values of these private equity securities are generally based on either broker quotes or discounted cash flow projections using assumptions for inputs such as the weighted-average cost of capital, long-term revenue growth rates and earnings before interest, taxes, depreciation and amortization, and/or revenue multiples that are not observable in the markets.
Securities lending collateral: Fair values of securities lending collateral are based on quoted market prices, where available. These fair values are obtained primarily from third-party pricing services, which generally use Level I or Level II inputs for the determination of fair value, to facilitate fair value measurements and disclosures.
Derivatives: Fair values are generally based on the quoted market prices by the financial institution that is the counterparty to the derivative transaction. We independently verify prices provided by the counterparties using valuation models that incorporate market observable inputs for similar derivative transactions. These derivatives are designated as Level II securities. Fair values of certain derivatives where market observable inputs are not available are estimated using
Elevance Health, Inc.
Notes to Consolidated Financial Statements (continued)
assumptions such as cash flow projections, risk-free rates, volatility and details specific to the derivative contract. These derivatives are designated as Level III securities.
In addition, the following methods and assumptions were used to determine the fair value of each class of pension benefit plan assets and other benefit plan assets not defined above (see Note 11, “Retirement Benefits,” for fair values of benefit plan assets):
Mutual funds: Fair values are based on quoted market prices, which represent the net asset value (“NAV”) of shares held.
Partnership investments: Fair values are estimated based on the plan’s ownership share of the partnerships’ net assets, as reported in their periodic capital statements, and are valued using NAV as a practical expedient. The partnerships primarily consist of a real estate investment fund which acquires investments in real estate entities, and an energy fund which invests in public and private oil and gas companies principally through privately issued securities.
Collective investment trusts (“CITs”): Fair values are based on the NAV of the units held by the plan at year end and are valued using NAV as a practical expedient. The CITs are passive index funds that seek investment results that generally correspond to the performance of the Bloomberg U.S. Intermediate Treasury Index.
Commingled fund: Fair value is based on NAV per fund share and is valued using NAV as a practical expedient. The fund primarily invests in publicly traded equity securities of issuers within the fund’s benchmark. The objective of the fund is to produce returns in excess of the relevant benchmark over rolling five-year periods.
Insurance company contracts: Fair value is based on the fair value of the underlying investments of the account as determined by the insurance company.
Investment in DOL 103-12 trust: Fair value is based on the plan’s proportionate share of the fair value of investments held by the trust, qualified as a Department of Labor Regulation 2520.103-12 entity (“DOL 103-12 trust”) as reported in the audited financial statements of the trust, where the trustee applies fair value measurements to the underlying investments of the trust.
Life insurance contracts: Fair value is based on the cash surrender value of the policies as reported by the insurance carriers.
Elevance Health, Inc.
Notes to Consolidated Financial Statements (continued)
A summary of fair value measurements by level for assets and liabilities measured at fair value on a recurring basis at December 31, 2024 and 2023 is as follows: | | | | | | | | | | | | | | | | | | | | | | | |
| Level I | | Level II | | Level III | | Total |
| December 31, 2024 | | | | | | | |
| Assets: | | | | | | | |
| Cash equivalents | $ | 3,199 | | | $ | — | | | $ | — | | | $ | 3,199 | |
| Fixed maturity securities, available-for-sale: | | | | | | | |
| United States Government securities | — | | | 1,824 | | | — | | | 1,824 | |
| Government sponsored securities | — | | | 151 | | | — | | | 151 | |
| Foreign government securities | — | | | 17 | | | — | | | 17 | |
| States, municipalities and political subdivisions, tax-exempt | — | | | 3,052 | | | — | | | 3,052 | |
| Corporate securities | — | | | 13,873 | | | 43 | | | 13,916 | |
| Residential mortgage-backed securities | — | | | 3,041 | | | 10 | | | 3,051 | |
| Commercial mortgage-backed securities | — | | | 1,748 | | | — | | | 1,748 | |
| Other asset-backed securities | — | | | 1,730 | | | 747 | | | 2,477 | |
| Total fixed maturity securities, available-for-sale | — | | | 25,436 | | | 800 | | | 26,236 | |
| Equity securities: | | | | | | | |
| Exchange traded funds | 1,002 | | | — | | | — | | | 1,002 | |
| Common equity securities | 87 | | | 31 | | | — | | | 118 | |
| Private equity securities | — | | | — | | | 72 | | | 72 | |
| Total equity securities | 1,089 | | | 31 | | | 72 | | | 1,192 | |
| Other invested assets - common equity securities | 18 | | | — | | | — | | | 18 | |
| Securities lending collateral | — | | | 2,306 | | | — | | | 2,306 | |
| Derivatives - other assets | — | | | 5 | | | — | | | 5 | |
| Total assets | $ | 4,306 | | | $ | 27,778 | | | $ | 872 | | | $ | 32,956 | |
| Liabilities: | | | | | | | |
| Derivatives - other liabilities | $ | — | | | $ | (150) | | | $ | — | | | $ | (150) | |
| Total liabilities | $ | — | | | $ | (150) | | | $ | — | | | $ | (150) | |
| | | | | | | |
| December 31, 2023 | | | | | | | |
| Assets: | | | | | | | |
| Cash equivalents | $ | 2,210 | | | $ | — | | | $ | — | | | $ | 2,210 | |
| Fixed maturity securities, available-for-sale: | | | | | | | |
| United States Government securities | — | | | 1,844 | | | — | | | 1,844 | |
| Government sponsored securities | — | | | 110 | | | — | | | 110 | |
| Foreign government securities | — | | | 4 | | | — | | | 4 | |
| States, municipalities and political subdivisions, tax-exempt | — | | | 3,902 | | | — | | | 3,902 | |
| Corporate securities | — | | | 14,532 | | | 46 | | | 14,578 | |
| Residential mortgage-backed securities | — | | | 3,830 | | | 2 | | | 3,832 | |
| Commercial mortgage-backed securities | — | | | 2,047 | | | — | | | 2,047 | |
| Other asset-backed securities | — | | | 3,634 | | | 539 | | | 4,173 | |
| Total fixed maturity securities, available-for-sale | — | | | 29,903 | | | 587 | | | 30,490 | |
| Equity securities: | | | | | | | |
| Exchange traded funds | 106 | | | — | | | — | | | 106 | |
| Common equity securities | 12 | | | 33 | | | — | | | 45 | |
| Private equity securities | — | | | — | | | 78 | | | 78 | |
| Total equity securities | 118 | | | 33 | | | 78 | | | 229 | |
| Other invested assets - common equity securities | 111 | | | — | | | — | | | 111 | |
| Securities lending collateral | — | | | 2,382 | | | — | | | 2,382 | |
| Derivatives - other assets | — | | | 10 | | | — | | | 10 | |
| Total assets | $ | 2,439 | | | $ | 32,328 | | | $ | 665 | | | $ | 35,432 | |
| Liabilities: | | | | | | | |
| Derivatives - other liabilities | $ | — | | | $ | (40) | | | $ | — | | | $ | (40) | |
| Total liabilities | $ | — | | | $ | (40) | | | $ | — | | | $ | (40) | |
A reconciliation of the beginning and ending balances of assets measured at fair value on a recurring basis using Level III inputs for the years ended December 31, 2024, 2023 and 2022 is as follows:
Elevance Health, Inc.
Notes to Consolidated Financial Statements (continued)
| | | | | | | | | | | | | | | | | | | | | | | | | | | | | | | |
| Corporate
Securities | | Residential
Mortgage-
backed
Securities | | | | Other Asset-Backed Securities | | Equity
Securities | | Total |
| Year ended December 31, 2024 | | | | | | | | | | | |
| Beginning balance at January 1, 2024 | $ | 46 | | | $ | 2 | | | | | $ | 539 | | | $ | 78 | | | $ | 665 | |
| Total gains (losses): | | | | | | | | | | | |
| Recognized in net income | 1 | | | — | | | | | — | | | (6) | | | (5) | |
| Recognized in accumulated other comprehensive income | — | | | — | | | | | 12 | | | — | | | 12 | |
| Purchases | 26 | | | 10 | | | | | 118 | | | 17 | | | 171 | |
| Sales | (5) | | | (2) | | | | | (10) | | | (17) | | | (34) | |
| Settlements | (4) | | | — | | | | | (1) | | | — | | | (5) | |
| Transfers into Level III | — | | | — | | | | | 92 | | | — | | | 92 | |
| Transfers out of Level III | (21) | | | — | | | | | (3) | | | — | | | (24) | |
| Ending balance at December 31, 2024 | $ | 43 | | | $ | 10 | | | | | $ | 747 | | | $ | 72 | | | $ | 872 | |
| Change in unrealized gains or losses included in net income related to assets still held at December 31, 2024 | $ | — | | | $ | — | | | | | $ | — | | | $ | (5) | | | $ | (5) | |
| | | | | | | | | | | |
| Year ended December 31, 2023 | | | | | | | | | | | |
| Beginning balance at January 1, 2023 | $ | 137 | | | $ | — | | | | | $ | 356 | | | $ | 88 | | | $ | 581 | |
| Total gains (losses): | | | | | | | | | | | |
| Recognized in net income | (10) | | | — | | | | | — | | | (4) | | | (14) | |
| Recognized in accumulated other comprehensive income | 6 | | | — | | | | | 3 | | | — | | | 9 | |
| Purchases | 38 | | | — | | | | | 191 | | | 15 | | | 244 | |
| Sales | (88) | | | — | | | | | (17) | | | (21) | | | (126) | |
| Settlements | (21) | | | — | | | | | — | | | — | | | (21) | |
| Transfers into Level III | 6 | | | 2 | | | | | 6 | | | — | | | 14 | |
| Transfers out of Level III | (22) | | | — | | | | | — | | | — | | | (22) | |
| Ending balance at December 31, 2023 | $ | 46 | | | $ | 2 | | | | | $ | 539 | | | $ | 78 | | | $ | 665 | |
| Change in unrealized gains or losses included in net income related to assets still held at December 31, 2023 | $ | — | | | $ | — | | | | | $ | — | | | $ | (6) | | | $ | (6) | |
| | | | | | | | | | | |
| Year ended December 31, 2022 | | | | | | | | | | | |
| Beginning balance at January 1, 2022 | $ | 336 | | | $ | 5 | | | | | $ | 19 | | | $ | 89 | | | $ | 449 | |
| Total gains (losses): | | | | | | | | | | | |
| Recognized in net income | — | | | — | | | | | (1) | | | — | | | (1) | |
| Recognized in accumulated other comprehensive income | (1) | | | — | | | | | (16) | | | — | | | (17) | |
| Purchases | 56 | | | — | | | | | 370 | | | 17 | | | 443 | |
| Sales | (210) | | | — | | | | | (14) | | | (18) | | | (242) | |
| Settlements | (41) | | | — | | | | | — | | | — | | | (41) | |
| Transfers into Level III | 9 | | | — | | | | | — | | | — | | | 9 | |
| Transfers out of Level III | (12) | | | (5) | | | | | (2) | | | — | | | (19) | |
| Ending balance at December 31, 2022 | $ | 137 | | | $ | — | | | | | $ | 356 | | | $ | 88 | | | $ | 581 | |
| Change in unrealized gains or losses included in net income related to assets still held at December 31, 2022 | $ | — | | | $ | — | | | | | $ | — | | | $ | — | | | $ | — | |
There were no individually material transfers into or out of Level III during the years ended December 31, 2024, 2023 or 2022.
Certain assets and liabilities are measured at fair value on a nonrecurring basis; that is, the instruments are not measured at fair value on an ongoing basis but are subject to fair value adjustments only in certain circumstances. As disclosed in Note 3, “Business Acquisitions and Divestitures,” we completed our acquisitions of Centers, CareBridge and Paragon in 2024 and BioPlus in 2023. The net assets acquired in these acquisitions and resulting goodwill and other intangible assets were recorded at fair value primarily using Level III inputs. The majority of assets acquired and liabilities assumed were recorded at their carrying values as of the respective date of acquisition, as their carrying values approximated their fair values due to
Elevance Health, Inc.
Notes to Consolidated Financial Statements (continued)
their short-term nature. The fair values of goodwill and other intangible assets acquired in our acquisitions of Centers, CareBridge, Paragon and BioPlus were estimated based on the income approach. The income approach estimates fair value based on the present value of the cash flows that the assets could be expected to generate in the future. We developed internal estimates for the expected cash flows and discount rate in the present value calculation.
Also, we entered into agreements which included certain put and call options associated with our minority interest ownership of Mosaic Health in 2024 and Liberty Dental in 2023. The resulting net put option liabilities were recorded at their fair values measured at the dates of acquisition using Level III inputs with an election not to mark the derivative to market, which is further discussed and disclosed in Note 6, “Derivatives”. The net put option carrying value for Mosaic Health was $1,330 at December 31, 2024. The net put option fair value for Liberty Dental was $543 and $85 at December 31, 2024 and 2023, respectively.
Other than the assets acquired and liabilities assumed in our acquisitions of CareBridge, Centers, Paragon and BioPlus and the net put options on Mosaic Health and Liberty Dental described above, there were no material assets or liabilities measured at fair value on a nonrecurring basis during the years ended December 31, 2024 or 2023.
Our valuation policy is determined by members of our treasury and accounting departments. Whenever possible, our policy is to obtain quoted market prices in active markets to estimate fair values for recognition and disclosure purposes. Where quoted market prices in active markets are not available, fair values are estimated using discounted cash flow analyses, broker quotes, unobservable inputs or other valuation techniques. These techniques are significantly affected by our assumptions, including discount rates and estimates of future cash flows. The use of assumptions for unobservable inputs for the determination of fair value involves a level of judgment and uncertainty. Changes in assumptions that reasonably could have been different at the reporting date may result in a higher or lower determination of fair value. Changes in fair value measurements, if significant, may affect performance of cash flows.
Potential taxes and other transaction costs are not considered in estimating fair values. Our valuation policy is generally to obtain quoted prices for each security from third-party pricing services, which are derived through recently reported trades for identical or similar securities, making adjustments through the reporting date based upon available market observable information. As we are responsible for the determination of fair value, we perform analysis on the prices received from the pricing services to determine whether the prices are reasonable estimates of fair value. This analysis is performed by our internal treasury personnel who are familiar with our investment portfolios, the pricing services engaged and the valuation techniques and inputs used. Our analysis includes procedures such as a review of month-to-month price fluctuations and price comparisons to secondary pricing services. There were no adjustments to quoted market prices obtained from the pricing services during the years ended December 31, 2024, 2023 or 2022.
In addition to the preceding disclosures on assets recorded at fair value in the consolidated balance sheets, FASB guidance also requires the disclosure of fair values for certain other financial instruments for which it is practicable to estimate fair value, whether or not such values are recognized in the consolidated balance sheets.
Non-financial instruments such as property and equipment, other current assets, deferred income taxes, intangible assets and certain financial instruments, such as limited partnerships, joint ventures, other non-controlled corporations, corporate-owned life insurance policies, and policy liabilities, are excluded from the fair value disclosures. Therefore, the fair value amounts cannot be aggregated to determine our underlying economic value.
The carrying amounts reported in the consolidated balance sheets for cash, premium receivables, self-funded receivables, other receivables, unearned income, accounts payable and accrued expenses, and certain other current liabilities approximate fair value because of the short-term nature of these items. These assets and liabilities are not listed in the table below.
The following methods and assumptions were used to estimate the fair value of each class of financial instrument that is recorded at its carrying value on the consolidated balance sheets:
Other invested assets: Other invested assets primarily include our mortgage loans and notes receivables. Mortgage loans are carried at amortized cost net of loss allowance. The fair value of mortgage loans is measured using discounted cash flows benchmarked against the 10-year U.S. Treasury yield plus a market rate spread. The notes receivables are measured at their amortized cost. The fair value of notes receivables is the present value of discounted future cash flows.
Elevance Health, Inc.
Notes to Consolidated Financial Statements (continued)
Short-term borrowings: The fair value of our short-term borrowings is based on quoted market prices for the same or similar debt, or if no quoted market prices were available, on the current market interest rates estimated to be available to us for debt of similar terms and remaining maturities.
Long-term debt—senior unsecured notes and surplus notes: The fair values of our notes are based on quoted market prices in active markets for the same or similar debt, or, if no quoted market prices are available, on the current market observable rates estimated to be available to us for debt of similar terms and remaining maturities.
Options: The options consist of put, call and purchase price true-up options associated with our equity investment in the Mosaic Health joint venture and the put and call options associated with our equity investment in Liberty Dental. The fair value of the net put option associated with Mosaic Health is based on a Monte Carlo simulation, which relies on assumptions including cash flow projections, risk-free rates, volatility and details specific to the options. The fair value of the net put option associated with Liberty Dental is based on the discounted present value of estimated future option exercise prices.
A summary of the estimated fair values by level of each class of financial instrument that is recorded at its carrying value on our consolidated balance sheets at December 31, 2024 and 2023 is as follows:
| | | | | | | | | | | | | | | | | | | | | | | | | | | | | |
| | Carrying
Value | | Estimated Fair Value |
| | Level I | | Level II | | Level III | | Total |
| December 31, 2024 | | | | | | | | | |
| Assets: | | | | | | | | | |
| Other invested assets | $ | 642 | | | $ | — | | | $ | — | | | $ | 610 | | | $ | 610 | |
| Liabilities: | | | | | | | | | |
| Debt: | | | | | | | | | |
| Short-term borrowings | 365 | | | — | | | 365 | | | — | | | 365 | |
| | | | | | | | | |
| Notes | 30,867 | | | — | | | 28,460 | | | — | | | 28,460 | |
| Options | 1,415 | | | — | | | — | | | 1,873 | | | 1,873 | |
| | | | | | | | | |
| December 31, 2023 | | | | | | | | | |
| Assets: | | | | | | | | | |
| Other invested assets | $ | 302 | | | $ | — | | | $ | — | | | $ | 278 | | | $ | 278 | |
| Liabilities: | | | | | | | | | |
| Debt: | | | | | | | | | |
| Short-term borrowings | 225 | | | — | | | 225 | | | — | | | 225 | |
| | | | | | | | | |
| Notes | 24,895 | | | — | | | 23,569 | | | — | | | 23,569 | |
| Options | 85 | | | — | | | — | | | 85 | | | 85 | |
| | | | | | | | | |
Elevance Health, Inc.
Notes to Consolidated Financial Statements (continued)
8. Income Taxes
The components of deferred income taxes at December 31, 2024 and 2023 are as follows:
| | | | | | | | | | | |
| 2024 | | 2023 |
| Deferred income tax assets: | | | |
| Accrued expenses | $ | 826 | | | $ | 595 | |
| Bad debt reserves | 434 | | | 415 | |
| Insurance reserves | 192 | | | 178 | |
| Lease liabilities | 170 | | | 172 | |
| Retirement liabilities | 126 | | | 132 | |
| Deferred compensation | 45 | | | 44 | |
| Federal and state carryforwards | 428 | | | 368 | |
| Foreign (including Puerto Rico) carryforwards | 90 | | | 87 | |
| Other | 100 | | | 166 | |
| Subtotal | 2,411 | | | 2,157 | |
| Less: valuation allowance | (294) | | | (271) | |
| Total deferred income tax assets | 2,117 | | | 1,886 | |
| | | |
| Deferred income tax liabilities: | | | |
| U.S. federal and state intangible assets | 2,584 | | | 2,043 | |
| Foreign (including Puerto Rico) intangible assets | 194 | | | 330 | |
| Capitalized software | 513 | | | 485 | |
| Depreciation and amortization | 38 | | | 81 | |
| Investment basis | 11 | | | 11 | |
| Retirement assets | 330 | | | 319 | |
| Lease right-of-use assets | 114 | | | 110 | |
| Prepaid expenses | 275 | | | 249 | |
| | | |
| Total deferred income tax liabilities | 4,059 | | | 3,628 | |
| Net deferred income tax liabilities | $ | 1,942 | | | $ | 1,742 | |
We recognized $206 and $228 of deferred tax asset under the caption “Other noncurrent assets” at December 31, 2024 and 2023, respectively. We recognized $2,148 and $1,970 of deferred tax liability under the caption “Deferred tax liabilities, net” at December 31, 2024 and 2023, respectively.
As of December 31, 2024, we have established U.S. deferred taxes for undistributed earnings from certain non-U.S. subsidiaries, which are included in the Investment basis component above, consistent with prior years.
Elevance Health, Inc.
Notes to Consolidated Financial Statements (continued)
Significant components of the provision for income taxes for the years ended December 31, 2024, 2023 and 2022 consist of the following:
| | | | | | | | | | | | | | | | | |
| 2024 | | 2023 | | 2022 |
| Current tax expense: | | | | | |
| Federal | $ | 1,753 | | | $ | 1,899 | | | $ | 1,455 | |
| Foreign (including Puerto Rico) | 93 | | | 95 | | | 98 | |
| State and local | 448 | | | 420 | | | 244 | |
| Total current tax expense | 2,294 | | | 2,414 | | | 1,797 | |
| Deferred tax benefit | (361) | | | (690) | | | (85) | |
| Total income tax expense | $ | 1,933 | | | $ | 1,724 | | | $ | 1,712 | |
State and local current tax expense is reported gross of federal benefit in the preceding table, and includes amounts related to audit settlements, uncertain tax positions, state tax credits and true up of prior years’ tax. Such items are included on a net of federal tax basis in multiple lines in the following rate reconciliation table.
A reconciliation of income tax expense recorded in the consolidated statements of income and amounts computed at the statutory federal income tax rate for the years ended December 31, 2024, 2023 and 2022 is as follows:
| | | | | | | | | | | | | | | | | | | | | | | | | | | | | | | | | | | |
| | 2024 | | 2023 | | 2022 |
| | Amount | | Percent | | Amount | | Percent | | Amount | | Percent |
| Amount at statutory rate | $ | 1,660 | | | 21.0 | % | | $ | 1,620 | | | 21.0 | % | | $ | 1,596 | | | 21.0 | % |
| State and local income taxes net of federal tax expense/benefit | 216 | | | 2.7 | | | 124 | | | 1.6 | | | 190 | | | 2.5 | |
| Tax exempt interest and dividends received deduction | (12) | | | (0.1) | | | (15) | | | (0.2) | | | (19) | | | (0.3) | |
| | | | | | | | | | | |
| | | | | | | | | | | |
| Change in valuation allowance | 43 | | | 0.6 | | | 84 | | | 1.1 | | | 51 | | | 0.7 | |
| Other, net | 26 | | | 0.3 | | | (89) | | | (1.2) | | | (106) | | | (1.4) | |
| Total income tax expense | $ | 1,933 | | | 24.5 | % | | $ | 1,724 | | | 22.3 | % | | $ | 1,712 | | | 22.5 | % |
During the year ended December 31, 2024, we recognized income tax expense of $1,933, or $8.30 per diluted share. The increase in effective income tax rate for 2024 compared to 2023 was primarily due to the impact of geographic changes in the mix of 2024 earnings.
During the year ended December 31, 2023, we recognized income tax expense of $1,724, or $7.26 per diluted share. The decrease in effective income tax rate for 2023 compared to 2022 was primarily due to the impact of geographic changes in the mix of 2023 earnings.
During the year ended December 31, 2022, we recognized income tax expense of $1,712, or $7.05 per diluted share.
The change in the carrying amount of gross unrecognized tax benefits from uncertain tax positions for the years ended December 31, 2024 and 2023 is as follows:
| | | | | | | | | | | |
| 2024 | | 2023 |
| Balance at January 1 | $ | 468 | | | $ | 349 | |
| Additions based on: | | | |
| Tax positions related to current year | 146 | | | 19 | |
| Tax positions related to prior years | 216 | | | 119 | |
| Reductions based on: | | | |
| | | |
| Tax positions related to prior years | (55) | | | (19) | |
| | | |
| Balance at December 31 | $ | 775 | | | $ | 468 | |
Elevance Health, Inc.
Notes to Consolidated Financial Statements (continued)
The table above excludes interest, net of related tax benefits, which is treated as income tax expense (benefit) under our accounting policy. The interest is included in the amounts described in the following paragraph.
The amount of unrecognized tax benefits that would impact our effective tax rate in future periods, if recognized, was $804 and $450 at December 31, 2024 and 2023, respectively. Also included in the table above, at December 31, 2024, is $2 that would be recognized as an adjustment to additional paid-in capital, which would not affect our effective tax rate.
For the years ended December 31, 2024, 2023 and 2022, we recognized net interest expense of $57, $24 and $13, respectively. We had accrued approximately $165 and $79 for the payment of interest at December 31, 2024 and 2023, respectively. For the years ended December 31, 2024, 2023 and 2022 we recognized net penalty expense of $7, $17 and $0, respectively. We had accrued approximately $85 and $60 for the payment of penalties at December 31, 2024 and 2023, respectively.
As of December 31, 2024, as further described below, certain tax years remain open to examination by the Internal Revenue Service (“IRS”) and various state, local and foreign authorities. As a result of these examinations and discussions with taxing agencies, we have recorded amounts for uncertain tax positions. It is anticipated that the amount of unrecognized tax benefits will change in the next twelve months due to possible settlements of audits and changes in temporary items. However, the ultimate resolution of these items is dependent on the completion of negotiations with various taxing authorities. While it is difficult to determine when other tax settlements will actually occur, it is reasonably possible that one could occur in the next twelve months and our unrecognized tax benefits could be reduced within a range of approximately $137 to $475.
We are a member of the IRS Compliance Assurance Process (“CAP”). The objective of CAP is to reduce taxpayer burden and uncertainty while assuring the IRS of the accuracy of tax returns prior to filing, thereby reducing or eliminating the need for post-filing examinations. As of December 31, 2024, the IRS examination of our 2024, 2023 and 2022 tax years continues to be in process.
In certain states, we pay premium taxes in lieu of state income taxes. Premium taxes are reported in operating expense.
At December 31, 2024, we had federal net operating loss carryforwards of $54, of which $33 will expire beginning 2032 through 2044 and $21 have an indefinite carryforward period. State and local net operating loss carryforwards of $256, of which $194 will expire beginning 2025 through 2044, and $62 have an indefinite carryforward period. Foreign net operating loss carryforward of $90 will expire beginning 2033.
Income taxes receivable totaled $138 and $543 at December 31, 2024 and 2023, respectively. We recognized the income tax receivable of $213 and $543 as an asset under the caption “Other current assets” and the income tax payable of $75 and $0 as a liability under the caption “Other current liabilities” in our consolidated balance sheets as of December 31, 2024 and December 31, 2023, respectively.
During 2024, 2023 and 2022, federal income taxes paid totaled $1,303, $1,936 and $1,594, respectively.
9. Property and Equipment
A summary of property and equipment at December 31, 2024 and 2023 is as follows:
| | | | | | | | | | | |
| 2024 | | 2023 |
| Computer software, purchased and internally developed | $ | 6,617 | | | $ | 6,195 | |
| Computer equipment, furniture and other equipment | 940 | | | 955 | |
| Leasehold improvements | 744 | | | 715 | |
| Building and improvements | 27 | | | 37 | |
| Land and improvements | 1 | | | 1 | |
| Property and equipment, gross | 8,329 | | | 7,903 | |
| Accumulated depreciation and amortization | (3,677) | | | (3,544) | |
| Property and equipment, net | $ | 4,652 | | | $ | 4,359 | |
Elevance Health, Inc.
Notes to Consolidated Financial Statements (continued)
Depreciation expense for 2024, 2023 and 2022 was $105, $107 and $123, respectively. Amortization expense on computer software and leasehold improvements for 2024, 2023 and 2022 was $809, $765 and $661, respectively, which includes amortization expense on computer software, both purchased and internally developed, for 2024, 2023 and 2022 of $734, $685 and $599, respectively. Capitalized costs related to the internal development of software of $6,363 and $5,870 at December 31, 2024 and 2023, respectively, are reported with computer software.
Impairment of property and equipment for the years ended December 31, 2024, 2023 and 2022 was $72, $446, and $7, respectively, which is included in Operating expenses and primarily related to our activities disclosed in Note 4, “Business Optimization Initiatives.”
10. Goodwill and Other Intangible Assets
A summary of the change in the carrying amount of goodwill for our segments (see Note 20, “Segment Information”) for 2024 and 2023 is as follows:
| | | | | | | | | | | | | | | | | | | | | | | | | | | |
| | | Health Benefits | | CarelonRx | | Carelon Services | | Total |
| Balance as of January 1, 2023 | | | $ | 22,088 | | | $ | 59 | | | $ | 2,236 | | | $ | 24,383 | |
| Acquisitions and adjustments | | | 16 | | | 898 | | | 20 | | | 934 | |
| Balance as of December 31, 2023 | | | 22,104 | | | 957 | | | 2,256 | | | 25,317 | |
| Acquisitions and adjustments | | | 460 | | | 958 | | | 1,542 | | | 2,960 | |
| Balance as of December 31, 2024 | | | $ | 22,564 | | | $ | 1,915 | | | $ | 3,798 | | | $ | 28,277 | |
| Accumulated impairment as of December 31, 2024 | | | $ | — | | | $ | — | | | $ | (106) | | | $ | (106) | |
| | | | | | | | | |
As required by FASB guidance, we completed annual impairment tests of existing goodwill and other intangible assets with indefinite lives during 2024, 2023 and 2022. We perform these annual impairment tests during the fourth quarter. FASB guidance also requires interim impairment testing to be performed when potential impairment indicators exist. These tests involve the use of estimates related to the estimated fair value of goodwill and intangible assets with indefinite lives and require a significant degree of management judgment and the use of subjective assumptions. Qualitative testing procedures include assessing our financial performance, macroeconomic conditions, industry and market considerations, various asset specific factors and entity specific events. For quantitative testing, the fair values are estimated using the projected income and market valuation approaches, incorporating Level III internal estimates for inputs, including, but not limited to, revenue projections, income projections, cash flows and discount rates.
In 2024, we incurred goodwill impairment losses of $106 in our Carelon Services reporting segment specific to the fair valuation of the CMSI assets included in assets and liabilities held for sale as discussed in Note 5, “Investments.” Otherwise, the estimated fair values of our reporting units were substantially in excess of their carrying values.
We did not incur any impairment losses in 2023 or 2022, as the estimated fair values of our reporting units were substantially in excess of their carrying values.
Elevance Health, Inc.
Notes to Consolidated Financial Statements (continued)
The components of other intangible assets as of December 31, 2024 and 2023 are as follows:
| | | | | | | | | | | | | | | | | | | | | | | | | | | | | | | | | | | |
| | 2024 | | 2023 |
Gross
Carrying
Amount | | Accumulated
Amortization | | Net
Carrying
Amount | | Gross
Carrying
Amount | | Accumulated
Amortization | | Net
Carrying
Amount |
| Intangible assets with finite lives: | | | | | | | | | | | |
| Customer relationships | $ | 7,866 | | | $ | (4,233) | | | $ | 3,633 | | | $ | 6,263 | | | $ | (3,817) | | | $ | 2,446 | |
| Provider and hospital relationships | 377 | | | (165) | | | 212 | | | 326 | | | (164) | | | 162 | |
| Other | 423 | | | (67) | | | 356 | | | 242 | | | (44) | | | 198 | |
| Total | 8,666 | | | (4,465) | | | 4,201 | | | 6,831 | | | (4,025) | | | 2,806 | |
| Intangible assets with indefinite lives: | | | | | | | | | | | |
| Blue Cross and Blue Shield and other trademarks | 5,991 | | | — | | | 5,991 | | | 5,991 | | | — | | | 5,991 | |
| State Medicaid licenses | 1,902 | | | — | | | 1,902 | | | 1,476 | | | — | | | 1,476 | |
| Total | 7,893 | | | — | | | 7,893 | | | 7,467 | | | — | | | 7,467 | |
| Other intangible assets | $ | 16,559 | | | $ | (4,465) | | | $ | 12,094 | | | $ | 14,298 | | | $ | (4,025) | | | $ | 10,273 | |
In 2024, additions to the gross carrying amount of customer relationships primarily relate to the acquisitions of Centers, CareBridge and Paragon.
Intangible assets with finite lives, along with the related accumulated amortization, are removed from the table above at the end of the fiscal year in which they become fully amortized.
As of December 31, 2024, the estimated amortization expense for each of the five succeeding years is as follows: 2025, $671; 2026, $474; 2027, $428; 2028, $377; and 2029, $317.
11. Retirement Benefits
We sponsor various non-contributory employee defined benefit plans through certain subsidiaries. Future benefit accruals for these plans are frozen, but participants continue to earn interest on existing account balances. We also have a post-retirement health and welfare plan that primarily provides healthcare benefits to certain eligible employees. The majority of the pension and post-retirement plans are over funded. We fund our qualified pension plans at least sufficient to meet minimum amounts required by law. Pension and post-retirement healthcare plan expenses and valuations are dependent on assumptions used by third-party actuaries in calculating those amounts. These assumptions include discount rates, healthcare cost trends, long-term return on plan assets, retirement rates, mortality rates and other factors.
The reconciliation of the benefit obligations for the plans is as follows:
| | | | | | | | | | | | | | | | | | | | | | | |
| | Pension Benefits | | Other Benefits |
| | 2024 | | 2023 | | 2024 | | 2023 |
| Benefit obligation at beginning of year | $ | 1,393 | | | $ | 1,415 | | | $ | 255 | | | $ | 277 | |
| | | | | | | |
| Interest cost | 63 | | | 68 | | | 12 | | | 14 | |
| Plan participant contributions | — | | | — | | | 16 | | | 16 | |
| Actuarial (gain) loss | (61) | | | 40 | | | (10) | | | (12) | |
| Settlements | (27) | | | (27) | | | — | | | — | |
| Benefits paid | (105) | | | (103) | | | (35) | | | (40) | |
| Benefit obligation at end of year | $ | 1,263 | | | $ | 1,393 | | | $ | 238 | | | $ | 255 | |
Elevance Health, Inc.
Notes to Consolidated Financial Statements (continued)
The changes in the fair value of plan assets are as follows:
| | | | | | | | | | | | | | | | | | | | | | | |
| | Pension Benefits | | Other Benefits |
| | 2024 | | 2023 | | 2024 | | 2023 |
| Fair value of plan assets at beginning of year | $ | 1,807 | | | $ | 1,734 | | | $ | 313 | | | $ | 299 | |
| Actual return on plan assets | 83 | | | 199 | | | 29 | | | 42 | |
| Employer contributions | 6 | | | 4 | | | — | | | — | |
| Plan participant contributions | — | | | — | | | 16 | | | 16 | |
| Settlements | (27) | | | (27) | | | 4 | | | — | |
| Benefits paid | (105) | | | (103) | | | (37) | | | (44) | |
| Fair value of plan assets at end of year | $ | 1,764 | | | $ | 1,807 | | | $ | 325 | | | $ | 313 | |
The amounts included in the consolidated balance sheets are as follows:
| | | | | | | | | | | | | | | | | | | | | | | |
| | Pension Benefits | | Other Benefits |
| | 2024 | | 2023 | | 2024 | | 2023 |
| Noncurrent assets | $ | 539 | | | $ | 459 | | | $ | 87 | | | $ | 58 | |
| Current liabilities | (4) | | | (7) | | | — | | | — | |
| Noncurrent liabilities | (34) | | | (38) | | | — | | | — | |
| Net amount at end of year | $ | 501 | | | $ | 414 | | | $ | 87 | | | $ | 58 | |
Our estimated future payments for pension benefits and other benefits are as follows: | | | | | | | | | | | |
| Pension
Benefits | | Other
Benefits |
| 2025 | $ | 128 | | | $ | 26 | |
| 2026 | 112 | | | 26 | |
| 2027 | 109 | | | 25 | |
| 2028 | 106 | | | 24 | |
| 2029 | 103 | | | 24 | |
| 2030 - 2034 | 472 | | | 99 | |
Elevance Health, Inc.
Notes to Consolidated Financial Statements (continued)
The components of net periodic benefit credit included in the consolidated statements of income are as follows:
| | | | | | | | | | | | | | | | | |
| 2024 | | 2023 | | 2022 |
| Pension Benefits | | | | | |
| Interest cost | $ | 63 | | | $ | 68 | | | $ | 52 | |
| Expected return on assets | (117) | | | (127) | | | (101) | |
| Recognized actuarial loss | 14 | | | 9 | | | 16 | |
| | | | | |
| Settlement loss | 6 | | | 7 | | | 28 | |
| Net periodic benefit credit | $ | (34) | | | $ | (43) | | | $ | (5) | |
| | | | | |
| Other Benefits | | | | | |
| Interest Cost | $ | 12 | | | $ | 14 | | | $ | 7 | |
| Expected return on assets | (22) | | | (21) | | | (26) | |
| Amortization of prior service credit | (1) | | | (2) | | | (4) | |
| Recognized actuarial gain | (1) | | | — | | | — | |
| Net periodic benefit credit | $ | (12) | | | $ | (9) | | | $ | (23) | |
The net amounts included in accumulated other comprehensive income (loss) that have not been recognized as components of net periodic benefit costs are as follows:
| | | | | | | | | | | | | | | | | | | | | | | |
| | Pension Benefits | | Other Benefits |
| | 2024 | | 2023 | | 2024 | | 2023 |
| Net actuarial gain (loss) | $ | (580) | | | $ | (625) | | | $ | 55 | | | $ | 38 | |
| Prior service credit | — | | | — | | | — | | | 2 | |
| Net amount before tax at end of year | $ | (580) | | | $ | (625) | | | $ | 55 | | | $ | 40 | |
The pre-tax amounts recognized in other comprehensive loss are as follows:
| | | | | | | | | | | | | | | | | |
| 2024 | | 2023 | | 2022 |
| Pension Benefits | | | | | |
| Net actuarial gain (loss) | $ | 25 | | | $ | 31 | | | $ | (91) | |
| Recognized actuarial loss | 14 | | | 9 | | | 16 | |
| Settlement loss | 6 | | | 7 | | | 28 | |
| Total pre-tax other comprehensive income (loss) | $ | 45 | | | $ | 47 | | | $ | (47) | |
| | | | | |
| Other Benefits | | | | | |
| Net actuarial gain (loss) | $ | 17 | | | $ | 34 | | | $ | (32) | |
| Recognized actuarial gain | (1) | | | — | | | — | |
| Prior service credit | (1) | | | (2) | | | (5) | |
| Total pre-tax other comprehensive income (loss) | $ | 15 | | | $ | 32 | | | $ | (37) | |
| | | | | |
The accumulated benefit obligation for the defined benefit pension plans was $1,262 and $1,391 at December 31, 2024 and 2023, respectively.
As of December 31, 2024, certain pension plans had accumulated benefit obligations in excess of plan assets. Such plans had accumulated benefit obligation and fair value of plan assets of $38 and $0, respectively. In addition, certain plans had projected benefit obligations in excess of plan assets. Such plans had projected benefit obligation and fair value of plan assets of $38 and $0, respectively.
Elevance Health, Inc.
Notes to Consolidated Financial Statements (continued)
The following table represents the significant weighted-average actuarial assumptions for all plans:
| | | | | | | | | | | | | | | | | | | | | | | |
| | Pension Benefits | | Other Benefits |
| | 2024 | | 2023 | | 2024 | | 2023 |
| Benefit Obligation | | | | | | | |
| Discount rate | 5.47 | % | | 4.91 | % | | 5.34 | % | | 4.83 | % |
| Interest Crediting rate | 4.50 | % | | 4.50 | % | | 4.36 | % | | 4.50 | % |
The following table represents the significant weighted-average actuarial assumptions for all plans:
| | | | | | | | | | | | | | | | | |
| 2024 | | 2023 | | 2022 |
| Net Periodic Benefit Cost | | | | | |
| Pension Benefits | | | | | |
| Discount rate | 4.91 | % | | 5.18 | % | | 2.70 | % |
| | | | | |
| Expected rate of return on plan assets | 6.47 | % | | 6.58 | % | | 5.02 | % |
| Interest crediting rate | 4.50 | % | | 4.25 | % | | 3.82 | % |
| | | | | |
| Other Benefits | | | | | |
| Discount rate | 4.83 | % | | 5.12 | % | | 2.49 | % |
| | | | | |
| Expected rate of return on plan assets | 6.64 | % | | 6.57 | % | | 6.43 | % |
| Interest crediting rate | 4.50 | % | | 3.89 | % | | 1.56 | % |
The assumed healthcare cost trend rates used to measure the expected cost of pre-Medicare (those who are not currently eligible for Medicare benefits) benefits at December 31, 2024 was 8.00% for 2025, with a gradual decline to 4.50% by the year 2035. The assumed healthcare cost trend rates used to measure the expected medical and pharmacy cost of post-Medicare (those who are currently eligible for Medicare benefits) benefits at December 31, 2024 was 5.50% and 10.00% for 2025, respectively, both with a gradual decline to 4.50% by the year 2035. These estimated trend rates are subject to change in the future.
Plan assets include a diversified mix of equity securities, investment grade fixed maturity securities and other types of investments across a range of sectors and levels of capitalization to maximize long-term return for a prudent level of risk. The weighted-average target allocation for pension benefit plan assets is 35% equity securities, 63% fixed maturity securities, and 2% to all other types of investments. Equity securities primarily include a mix of domestic securities, foreign securities and mutual funds invested in equities. Fixed maturity securities primarily include corporate bonds, treasury securities and asset-backed investments issued by corporations and the U.S. government. Other types of investments include insurance contracts designed specifically for employee benefit plans, an investment in a DOL 103-12 trust and certain alternative investments.
As of December 31, 2024, there were no significant concentrations of investments in the pension benefit assets or other benefit assets. No plan assets were invested in Elevance Health common stock.
Pension benefit assets and other benefit assets recorded at fair value are categorized based upon the level of judgment associated with the inputs used to measure their fair value. In accordance with FASB guidance, certain alternative investments that are measured at fair value using the NAV per share (or its equivalent) as a practical expedient have not been classified in the fair value hierarchy. The fair value amounts presented are intended to permit reconciliation of the fair value hierarchy to the total plan assets.
The fair values of our pension benefit assets and other benefit assets by asset category and level inputs at December 31, 2024, excluding cash, investment income receivable and amounts due to/from brokers of $30, and excluding estimated claims settlements to be paid from other benefit assets of $(19), are as follows (see Note 7, “Fair Value,” for additional information regarding the definition of level inputs):
Elevance Health, Inc.
Notes to Consolidated Financial Statements (continued)
| | | | | | | | | | | | | | | | | | | | | | | |
| Level I | | Level II | | Level III | | Total |
| December 31, 2024 | | | | | | | |
| Pension Benefit Assets: | | | | | | | |
| Cash equivalents | $ | 6 | | | $ | — | | | $ | — | | | $ | 6 | |
| Equity securities: | | | | | | | |
| U.S. securities | 307 | | | — | | | — | | | 307 | |
| Foreign securities | 71 | | | — | | | — | | | 71 | |
| Mutual funds | 44 | | | — | | | — | | | 44 | |
| Fixed maturity securities: | | | | | | | |
| Government securities | — | | | 78 | | | — | | | 78 | |
| Corporate securities | — | | | 539 | | | — | | | 539 | |
| Asset-backed securities | — | | | 3 | | | — | | | 3 | |
| Other types of investments: | | | | | | | |
| | | | | | | |
| | | | | | | |
| | | | | | | |
| Insurance company contracts | — | | | — | | | 143 | | | 143 | |
| | | | | | | |
| Total pension benefit assets at fair value | $ | 428 | | | $ | 620 | | | $ | 143 | | | 1,191 | |
| Alternative investments | | | | | | | 543 | |
| Total pension benefit assets | | | | | | | $ | 1,734 | |
| | | | | | | |
| Other Benefit Assets: | | | | | | | |
| Equity securities: | | | | | | | |
| U.S. securities | $ | 7 | | | $ | — | | | $ | — | | | $ | 7 | |
| Foreign securities | 2 | | | — | | | — | | | 2 | |
| Mutual funds | 16 | | | — | | | — | | | 16 | |
| | | | | | | |
| | | | | | | |
| | | | | | | |
| | | | | | | |
| Other types of investments: | | | | | | | |
| | | | | | | |
| | | | | | | |
| Life insurance contracts | — | | | — | | | 301 | | | 301 | |
| Investment in DOL 103-12 trust | — | | | 9 | | | — | | | 9 | |
| Total other benefit assets at fair value | $ | 25 | | | $ | 9 | | | $ | 301 | | | 335 | |
| Alternative investments | | | | | | | 9 | |
| Total other benefit assets | | | | | | | $ | 344 | |
Elevance Health, Inc.
Notes to Consolidated Financial Statements (continued)
The fair values of our pension benefit assets and other benefit assets by asset category and level inputs at December 31, 2023, excluding cash, investment income receivable and amounts due to/from brokers of $43, and excluding estimated claims settlements to be paid from other benefit assets of $(23), are as follows: | | | | | | | | | | | | | | | | | | | | | | | |
| Level I | | Level II | | Level III | | Total |
| December 31, 2023 | | | | | | | |
| Pension Benefit Assets: | | | | | | | |
| Cash equivalents | $ | 2 | | | $ | — | | | $ | — | | | $ | 2 | |
| Equity securities: | | | | | | | |
| U.S. securities | 390 | | | — | | | — | | | $ | 390 | |
| Foreign securities | 94 | | | — | | | — | | | 94 | |
| Mutual funds | 42 | | | — | | | — | | | 42 | |
| Fixed maturity securities: | | | | | | | |
| Government securities | — | | | 70 | | | — | | | 70 | |
| Corporate securities | — | | | 522 | | | — | | | 522 | |
| Asset-backed securities | — | | | 2 | | | — | | | 2 | |
| Other types of investments: | | | | | | | |
| | | | | | | |
| | | | | | | |
| Insurance company contracts | — | | | — | | | 143 | | | 143 | |
| | | | | | | |
| Total pension benefit assets at fair value | $ | 528 | | | $ | 594 | | | $ | 143 | | | 1,265 | |
| Alternative investments | | | | | | | 500 | |
| Total pension benefit assets | | | | | | | $ | 1,765 | |
| | | | | | | |
| Other Benefit Assets: | | | | | | | |
| Equity securities: | | | | | | | |
| U.S. securities | $ | 7 | | | $ | — | | | $ | — | | | $ | 7 | |
| Foreign securities | 2 | | | — | | | — | | | 2 | |
| Mutual funds | 17 | | | — | | | — | | | 17 | |
| Other types of investments: | | | | | | | |
| | | | | | | |
| Life insurance contracts | — | | | — | | | 289 | | | 289 | |
| Investment in DOL 103-12 trust | — | | | 9 | | | — | | | 9 | |
| Total other benefit assets at fair value | $ | 26 | | | $ | 9 | | | $ | 289 | | | 324 | |
| Alternative investments | | | | | | | 11 | |
| Total other benefit assets | | | | | | | $ | 335 | |
| | | | | | | |
| | | | | | | |
Elevance Health, Inc.
Notes to Consolidated Financial Statements (continued)
The following table provides additional information on the alternative investments that are measured using NAV as a practical expedient: | | | | | | | | | | | | | | | | | | | | | | | | | | | | | |
| Fair Value as of December 31 | | Unfunded Commitments as of December 31, 2024 | | Redemption Frequency (if applicable) | | Redemption Notice Period |
| | | |
| 2024 | | 2023 | | | | | | |
| Collective investment trusts: | | | | | | | | | |
| Pension benefit assets | $ | 413 | | | $ | 346 | | | | | | | |
| Other benefit assets | 8 | | | 9 | | | | | | | |
| Total CITs | 421 | | | 355 | | | $ | — | | | Daily | | 2 days |
| Commingled fund: | | | | | | | | | |
| Pension benefit assets | 69 | | | 84 | | | | | | | |
| Other benefit assets | 1 | | | 2 | | | | | | | |
| Total commingled fund | 70 | | | 86 | | | — | | | 1st & 15th of the month | | 7 business days |
| Partnership investments | 61 | | | 70 | | | 1 | | | Not Applicable | | Not Applicable |
| Total alternative investments | $ | 552 | | | $ | 511 | | | $ | 1 | | | | | |
| | | | | | | | | |
A reconciliation of the beginning and ending balances of plan assets measured at fair value using Level III inputs for the years ended December 31, 2024, 2023 and 2022 is as follows: | | | | | | | | | | | | | | | | | | | | | |
| | | | | Insurance
Company
Contracts | | Life
Insurance
Contracts | | Total |
| Year ended December 31, 2024 | | | | | | | | | |
| Beginning balance at January 1, 2024 | | | | | $ | 143 | | | $ | 289 | | | $ | 432 | |
| Actual return on plan assets relating to assets still held at the reporting date | | | | | 3 | | | 28 | | | 31 | |
| Purchases | | | | | 6 | | | — | | | 6 | |
| Sales | | | | | (9) | | | (16) | | | (25) | |
| | | | | | | | | |
| Ending balance at December 31, 2024 | | | | | $ | 143 | | | $ | 301 | | | $ | 444 | |
| | | | | | | | | |
| Year ended December 31, 2023 | | | | | | | | | |
| Beginning balance at January 1, 2023 | | | | | $ | 154 | | | $ | 270 | | | $ | 424 | |
| Actual return on plan assets relating to assets still held at the reporting date | | | | | 3 | | | 37 | | | 40 | |
| Purchases | | | | | 6 | | | — | | | 6 | |
| Sales | | | | | (20) | | | (18) | | | (38) | |
| | | | | | | | | |
| Ending balance at December 31, 2023 | | | | | $ | 143 | | | $ | 289 | | | $ | 432 | |
| | | | | | | | | |
| Year ended December 31, 2022 | | | | | | | | | |
| Beginning balance at January 1, 2022 | | | | | $ | 179 | | | $ | 338 | | | $ | 517 | |
| Actual return on plan assets relating to assets still held at the reporting date | | | | | (22) | | | (53) | | | (75) | |
| Purchases | | | | | 9 | | | — | | | 9 | |
| Sales | | | | | (12) | | | (15) | | | (27) | |
| Ending balance at December 31, 2022 | | | | | $ | 154 | | | $ | 270 | | | $ | 424 | |
There were no transfers into or out of Level III during the years ended December 31, 2024, 2023 or 2022.
Elevance Health, Inc.
Notes to Consolidated Financial Statements (continued)
In addition to the defined benefit plans, we maintain the Elevance Health 401(k) Plan, which is a qualified defined contribution plan covering substantially all employees. Voluntary employee contributions are matched by us subject to certain limitations. Contributions made by us totaled $314, $316 and $275 during 2024, 2023 and 2022, respectively.
12. Medical Claims Payable
A reconciliation of the beginning and ending balances for medical claims payable for the years ended December 31, 2024, 2023 and 2022 is as follows:
| | | | | | | | | | | | | | | | | | | |
| 2024 | | 2023 | | 2022 | | |
| Gross medical claims payable, beginning of year | $ | 15,865 | | | $ | 15,348 | | | $ | 13,282 | | | |
| Ceded medical claims payable, beginning of year | (7) | | | (6) | | | (21) | | | |
| Net medical claims payable, beginning of year | 15,858 | | | 15,342 | | | 13,261 | | | |
| Business combinations and purchase adjustments | 143 | | | — | | | 133 | | | |
| Net incurred medical claims: | | | | | | | |
| Current year | 125,370 | | | 121,798 | | | 113,414 | | | |
| Prior years redundancies | (1,731) | | | (1,571) | | | (869) | | | |
| Total net incurred medical claims | 123,639 | | | 120,227 | | | 112,545 | | | |
| Net payments attributable to: | | | | | | | |
| Current year medical claims | 110,930 | | | 107,146 | | | 98,997 | | | |
| Prior years medical claims | 13,143 | | | 12,565 | | | 11,600 | | | |
| Total net payments | 124,073 | | | 119,711 | | | 110,597 | | | |
| Net medical claims payable, end of year | 15,567 | | | 15,858 | | | 15,342 | | | |
| Ceded medical claims payable, end of year | 13 | | | 7 | | | 6 | | | |
| Gross medical claims payable, end of year | $ | 15,580 | | | $ | 15,865 | | | $ | 15,348 | | | |
Amounts incurred related to prior years vary from previously estimated liabilities as the claims are ultimately settled. Liabilities at any period-end are continually reviewed and re-estimated as information regarding actual claims payments, or run out, becomes known. This information is compared to the originally established year end liability. Negative amounts reported for incurred medical claims related to prior years result from claims being settled for amounts less than originally estimated. The prior year redundancy of $1,731 shown above for the year ended December 31, 2024, represents an estimate based on paid claim activity from January 1, 2024 to December 31, 2024. Medical claim liabilities are usually described as having a “short tail,” which means that they are generally paid within twelve months of the member receiving service from the provider. Accordingly, the majority of the $1,731 redundancy relates to claims incurred in calendar year 2023.
The following table provides a summary of the two key assumptions having the most significant impact on our incurred but not paid liability estimates for the years ended December 31, 2024, 2023 and 2022, which are the completion and trend factors. These vital assumptions can be affected by variables such as utilization levels, unit costs, mix of business, benefit plan designs, provider reimbursement levels, processing system conversions and changes, claim inventory levels, claim processing and submission patterns, and operational changes resulting from business combinations.
| | | | | | | | | | | | | | | | | |
| | Favorable Developments
by Changes in Key Assumptions |
| | 2024 | | 2023 | | 2022 |
| Assumed trend factors | $ | (688) | | | $ | (895) | | | $ | (859) | |
| Assumed completion factors | (1,043) | | | (676) | | | (10) | |
| Total | $ | (1,731) | | | $ | (1,571) | | | $ | (869) | |
The favorable development recognized in 2024 resulted primarily from completion factors developing more favorably than originally expected as well as a smaller but significant contribution from trend factors in late 2023.
Elevance Health, Inc.
Notes to Consolidated Financial Statements (continued)
The favorable development recognized in 2023 resulted primarily from trend factors in late 2022 developing more favorably than originally expected. Favorable development in the completion factors in late 2022 also contributed to the favorable development in 2023.
The favorable development recognized in 2022 resulted primarily from trend factors in late 2021 developing more favorably than originally expected as well as a smaller contribution from completion factor development.
The reconciliation of net incurred medical claims to benefit expense included in the consolidated statements of income is as follows: | | | | | | | | | | | | | | | | | | | | |
| | Years Ended December 31 |
| | 2024 | | 2023 | | 2022 |
| Total net incurred medical claims | | $ | 123,639 | | | $ | 120,227 | | | $ | 112,545 | |
| Quality improvement and other claims expense | | 3,928 | | | 4,103 | | | 4,097 | |
| Benefit expense | | $ | 127,567 | | | $ | 124,330 | | | $ | 116,642 | |
Incurred claims development, net of reinsurance, for the years ended December 31, 2024, 2023 and 2022 is as follows:
| | | | | | | | | | | | | | | | | | | | |
| | Cumulative Incurred Claims and Allocated Claim Adjustment Expenses, Net of Reinsurance |
| | 2022 | | 2023 | | 2024 |
| Claim Years | | (Unaudited) | | (Unaudited) | | |
| 2022 & Prior | | $ | 125,938 | | | $ | 124,367 | | | $ | 124,041 | |
| 2023 | | | | 121,798 | | | 120,393 | |
| 2024 | | | | | | 125,513 | |
| Total | | | | | | $ | 369,947 | |
Paid claims development, net of reinsurance, for the years ended December 31, 2024, 2023 and 2022 is as follows:
| | | | | | | | | | | | | | | | | | | | |
| | Cumulative Paid Claims and Allocated Claim Adjustment Expenses, Net of Reinsurance |
| | 2022 | | 2023 | | 2024 |
| Claim Years | | (Unaudited) | | (Unaudited) | | |
| 2022 & Prior | | $ | 110,597 | | | $ | 123,162 | | | $ | 123,849 | |
| 2023 | | | | 107,146 | | | 119,601 | |
| 2024 | | | | | | 110,930 | |
| Total | | | | | | $ | 354,380 | |
At December 31, 2024, the total of incurred but not reported liabilities plus expected development on reported claims was $192, $792 and $14,583 for the claim years 2022 and prior, 2023 and 2024, respectively.
At December 31, 2024, the cumulative number of reported claims was 507, 497 and 454 for the claim years 2022 and prior, 2023 and 2024, respectively.
The information about incurred claims development, paid claims development and cumulative number of reported claims for the years ended December 31, 2022 and 2023 is unaudited and presented as supplementary information.
The cumulative number of reported claims for each claim year has been developed using historical data captured by our claim payment systems. The provided claim amounts are not a precise tool for understanding utilization of medical services. They could be impacted by a variety of factors, including changes in provider billing practices, provider reimbursement arrangements, mix of services, benefit design or processing systems. The cumulative number of reported claims has been provided to comply with FASB accounting standards and is not used by management in its claims analysis. Our cumulative number of reported claims may not be comparable to similar measures reported by other health benefits companies.
Elevance Health, Inc.
Notes to Consolidated Financial Statements (continued)
The reconciliation of incurred and paid claims development information for the three years ended December 31, 2024, reflected in the tables above, to the consolidated ending balance for medical claims payable included in the consolidated balance sheets, as of December 31, 2024, is as follows:
| | | | | |
| Total |
| Cumulative incurred claims and allocated claim adjustment expenses, net of reinsurance | $ | 369,947 | |
| Less: Cumulative paid claims and allocated claim adjustment expenses, net of reinsurance | 354,380 | |
| Net medical claims payable, end of year | 15,567 | |
| Ceded medical claims payable, end of year | 13 | |
| Insurance lines other than short duration | 256 | |
| Liabilities held for sale | (90) | |
| Gross medical claims payable, end of year | $ | 15,746 | |
13. Debt
Short-term Borrowings
We are a member, through certain subsidiaries, of the Federal Home Loan Bank of Indianapolis, the Federal Home Loan Bank of Cincinnati, the Federal Home Loan Bank of Atlanta and the Federal Home Loan Bank of New York (collectively, the “FHLBs”). As a member we have the ability to obtain short-term cash advances, subject to certain minimum collateral requirements. At December 31, 2024 and 2023, $365 and $225, respectively, were outstanding under our short-term FHLB borrowings. Outstanding short-term FHLB borrowings at December 31, 2024 had fixed interest rates of 4.43%.
We have a senior revolving credit facility (the “5-Year Facility”) with a group of lenders for general corporate purposes. The 5-Year Facility provides credit of up to $4,000 and matures in April 2027. Our ability to borrow under the 5-Year Facility is subject to compliance with certain covenants, including covenants requiring us to maintain a defined debt-to-capital ratio of not more than 60%, subject to increase in certain circumstances set forth in the credit agreement for the 5-Year Facility. As of December 31, 2024, our debt-to-capital ratio, as defined and calculated under the 5-Year Facility, was 43.0%. We do not believe the restrictions contained in our 5-Year Facility covenants materially affect our financial or operating flexibility. As of December 31, 2024, we were in compliance with all of our debt covenants under the 5-Year Facility. There were no amounts outstanding under the 5-Year Facility at any time during the years ended December 31, 2024 or 2023.
We have an authorized commercial paper program of up to $4,000, the proceeds of which may be used for general corporate purposes. At December 31, 2024 and 2023, we had $0 outstanding under our commercial paper program. Beginning in 2023, we reclassified our commercial paper balances from long-term debt to short-term debt as our intent is to not replace short-term commercial paper outstanding at expiration with additional short-term commercial paper for an uninterrupted period extending for more than one year.
Elevance Health, Inc.
Notes to Consolidated Financial Statements (continued)
Long-term Debt
The carrying value of our long-term debt at December 31, 2024 and 2023 consists of the following:
| | | | | | | | | | | |
| 2024 | | 2023 |
| Senior unsecured notes: | | | |
| | | |
| 3.350%, due 2024 | $ | — | | | $ | 850 | |
| 3.500%, due 2024 | — | | | 799 | |
| 2.375%, due 2025 | 1,250 | | | 1,251 | |
| 5.350%, due 2025 | 399 | | | 399 | |
| 1.500%, due 2026 | 749 | | | 747 | |
| 4.500%, due 2026 | 349 | | | — | |
| 4.900%, due 2026 | 499 | | | 496 | |
| 3.650%, due 2027 | 1,596 | | | 1,595 | |
| 4.101%, due 2028 | 1,238 | | | 1,236 | |
| 2.875%, due 2029 | 822 | | | 821 | |
| 5.150%, due 2029 | 601 | | | — | |
| 2.250%, due 2030 | 1,075 | | | 1,075 | |
| 4.750%, due 2030 | 731 | | | — | |
| 2.550%, due 2031 | 971 | | | 972 | |
| 4.950%, due 2031 | 726 | | | — | |
| 4.100%, due 2032 | 596 | | | 595 | |
| 5.500%, due 2032 | 635 | | | 658 | |
| 4.750%, due 2033 | 973 | | | 992 | |
| 5.375%, due 2034 | 992 | | | — | |
| 5.950%, due 2034 | 335 | | | 335 | |
| 5.200%, due 2035 | 1,151 | | | — | |
| 5.850%, due 2036 | 397 | | | 397 | |
| 6.375%, due 2037 | 364 | | | 364 | |
| 5.800%, due 2040 | 115 | | | 114 | |
| 4.625%, due 2042 | 860 | | | 860 | |
| 4.650%, due 2043 | 975 | | | 975 | |
| 4.650%, due 2044 | 768 | | | 768 | |
| 5.100%, due 2044 | 548 | | | 548 | |
| 4.375%, due 2047 | 1,389 | | | 1,388 | |
| 4.550%, due 2048 | 840 | | | 840 | |
| 3.700%, due 2049 | 813 | | | 813 | |
| 3.125%, due 2050 | 988 | | | 988 | |
| 3.600%, due 2051 | 1,234 | | | 1,233 | |
| 4.550% due 2052 | 689 | | | 689 | |
| 6.100%, due 2052 | 742 | | | 742 | |
| 5.125%, due 2053 | 1,084 | | | 1,083 | |
| 4.850%, due 2054 | 247 | | | 247 | |
| 5.650%, due 2054 | 985 | | | — | |
| 5.700%, due 2055 | 1,327 | | | — | |
| 5.850% due 2064 | 789 | | | — | |
| Surplus note: | | | |
| 9.000%, due 2027 | 25 | | | 25 | |
| | | |
| | | |
| | | |
| | | |
| Total Long-Term Debt | 30,867 | | | 24,895 | |
| Current portion of long-term debt | (1,649) | | | (1,649) | |
| Long-term debt, less current portion | $ | 29,218 | | | $ | 23,246 | |
| | | |
All debt is a direct obligation of Elevance Health, Inc., except for the surplus note and the FHLB borrowings.
We generally issue senior unsecured notes (“Notes”) for long-term borrowing purposes. Certain of these Notes may have a call feature that allows us to redeem the Notes at any time at our option and/or a put feature that allows a Note holder to
Elevance Health, Inc.
Notes to Consolidated Financial Statements (continued)
redeem the Notes upon the occurrence of both a change in control event and a downgrade of the Notes below an investment grade rating.
On January 15, 2025, we repaid, at maturity, the $1,250 outstanding balance of our 2.375% senior unsecured notes.
On December 1, 2024, we repaid, at maturity, the $850 outstanding balance of our 3.35% senior unsecured notes.
On October 31, 2024, we issued $350 aggregate principal amount of 4.500% Notes due 2026 (the “New 2026 Notes”), $750 aggregate principal amount of 4.750% Notes due 2030 (the “2030 Notes”), $750 aggregate principal amount of 4.950% Notes due 2031 (the “2031 Notes”), $1,200 aggregate principal amount of 5.200% Notes due 2035 (the “2035 Notes”), $1,350 aggregate principal amount of 5.700% Notes due 2055 (the “2055 Notes”) and $800 aggregate principal amount of 5.850% Notes due 2064 (the “2064 Notes”) under our shelf registration statement. Interest on the New 2026 Notes is payable semi-annually in arrears on April 30 and October 30 of each year, commencing April 30, 2025. Interest on the 2030 Notes, 2035 Notes and 2055 Notes are payable semi-annually in arrears on February 15 and August 15 of each year, commencing February 1, 2025. Interest on the 2031 Notes and 2064 Notes are payable semi-annually in arrears on May 1 and November 1 of each year, commencing May 1, 2025. We used the net proceeds for working capital and general corporate purposes, including, but not limited to, the funding of acquisitions, repayment of short-term and long-term debt and the repurchase of our common stock pursuant to our share repurchase program.
On August 15, 2024, we repaid, at maturity, the $799 outstanding balance of our 3.500% senior unsecured notes.
On May 30, 2024, we issued $600 aggregate principal amount of 5.150% Notes due 2029 (the “2029 Notes”), $1,000 aggregate principal amount of 5.375% Notes due 2034 (the “2034 Notes”) and $1,000 aggregate principal amount of 5.650% Notes due 2054 (the “2054 Notes”, and, together with the 2029 Notes and the 2034 Notes, the “Notes”) under our shelf registration statement. Interest on the Notes is payable semi-annually in arrears on June 15 and December 15 of each year, commencing December 15, 2024. We used the net proceeds for working capital and general corporate purposes, including, but not limited to, the funding of acquisitions, repayment of short-term and long-term debt and the repurchase of our common stock pursuant to our share repurchase program.
On February 8, 2023, we issued $500 aggregate principal amount of 4.900% Notes due 2026 (the “2026 Notes”), $1,000 aggregate principal amount of 4.750% Notes due 2033 (the “2033 Notes”) and $1,100 aggregate principal amount of 5.125% Notes due 2053 (the “2053 Notes”) under our shelf registration statement. Interest on the 2026 Notes is payable semi-annually in arrears on February 8 and August 8 of each year, commencing August 8, 2023. Interest on the 2033 Notes and 2053 Notes is payable semi-annually in arrears on February 15 and August 15 of each year, commencing August 15, 2023. We used the net proceeds for working capital and general corporate purposes, including, but not limited to, the funding of acquisitions, repayment of short-term and long-term debt and the repurchase of our common stock pursuant to our share repurchase program.
On January 17, 2023, we repaid, at maturity, the $1,000 outstanding balance of our 3.300% senior unsecured notes. On March 15, 2023, we repaid, at maturity, the $500 outstanding balance of our 0.450% senior unsecured notes.
On December 1, 2022, we repaid, at maturity, the $750 outstanding balance of our 2.950% senior unsecured notes.
On November 4, 2022, we issued $400 aggregate principal amount of 5.350% Notes due 2025, $650 aggregate principal amount of 5.500% Notes due 2032 and $750 aggregate principal amount of 6.100% Notes due 2052 under our shelf registration statement. Interest on these notes is payable semi-annually in arrears on April 15 and October 15 of each year, commencing April 15, 2023. We used the net proceeds for working capital and general corporate purposes, such as the funding of acquisitions, repayment of short-term and long-term debt and the repurchase of our common stock pursuant to our share repurchase program.
On May 16, 2022, we repaid, at maturity, the $850 outstanding balance of our 3.125% senior unsecured notes.
On April 29, 2022, we issued $600 aggregate principal amount of 4.100% Notes due 2032 and $700 aggregate principal amount of 4.550% Notes due 2052 under our shelf registration statement. Interest on these notes is payable semi-annually in arrears on May 15 and November 15 of each year, commencing November 15, 2022. We used the net proceeds for working
Elevance Health, Inc.
Notes to Consolidated Financial Statements (continued)
capital and general corporate purposes, such as the funding of acquisitions, repayment of short-term and long-term debt and the repurchase of our common stock pursuant to our share repurchase program.
Convertible Debentures
On March 15, 2023, we redeemed all of our outstanding senior unsecured convertible debentures due 2042 (the “Debentures”), pursuant to the indenture dated as of October 9, 2012 (the “Indenture”) between us and The Bank of New York Mellon Trust Company, N.A., as trustee. The Debentures were redeemed at a redemption price equal to 100% of the principal amount of the Debentures plus accrued and unpaid interest to, but excluding, the date of redemption for cash totaling $5. During the three months ended March 31, 2023, $59 of aggregate principal amount of the Debentures was surrendered for conversion by certain holders in accordance with the terms and conditions of the Indenture. We elected to settle the excess of the principal amount of the conversions with cash for total payments during the three months ended March 31, 2023 of $404.
During the year ended December 31, 2022, $41 aggregate principal amount of the Debentures was surrendered for conversion by certain holders in accordance with the terms and provisions of the Indenture. We elected to settle the excess of the principal amount of the conversion with cash for total payments of $299. We recognized $2 of interest expense related to the Debentures during 2022.
Interest paid on our total outstanding debt during 2024, 2023 and 2022 was $1,239, $1,032, and $878, respectively.
We were in compliance with all applicable covenants under all of our outstanding debt agreements at December 31, 2024 and 2023.
Future maturities of all long-term debt outstanding at December 31, 2024 are as follows: 2025, $1,649; 2026, $1,596; 2027, $1,621; 2028, $1,237; 2029, $1,423 and thereafter, $23,341.
14. Commitments and Contingencies
Litigation and Regulatory Proceedings
We are defendants in, or parties to, a number of pending or threatened legal actions or proceedings. To the extent a plaintiff or plaintiffs in the following cases have specified in their complaint or in other court filings the amount of damages being sought, we have noted those alleged damages in the descriptions below.
Where available information indicates that it is probable that a loss has been incurred as of the date of the consolidated financial statements and we can reasonably estimate the amount of that loss, we accrue the estimated loss by a charge to income. In many proceedings, however, it is difficult to determine whether any loss is probable or reasonably possible. In addition, even where loss is possible or probable or an exposure to loss exists in excess of the liability already accrued with respect to a previously identified loss contingency, it is not always possible to reasonably estimate the amount of the possible or probable loss or range of losses in excess of the amount, if any, accrued, for various reasons, including but not limited to some or all of the following: (i) there are novel or unsettled legal issues presented, (ii) the proceedings are in early stages, (iii) there is uncertainty as to the likelihood of a class being certified or decertified or the ultimate size and scope of the class, (iv) there is uncertainty as to the outcome of pending appeals or motions, (v) there are significant factual issues to be resolved, and/or (vi) in many cases, the plaintiffs have not specified damages in their complaint or in court filings.
With respect to the cases described below, we contest liability and/or the amount of damages in each matter, and we believe we have meritorious defenses. We do not believe the outcome of any known pending or threatened legal actions or proceedings will, in the aggregate, have a material impact on our financial position. However, unanticipated outcomes do sometimes occur, which could result in liabilities in excess of our accruals and could have a material adverse effect on our consolidated financial position or results of operations.
In addition to the lawsuits described below, we are also involved in other pending and threatened litigation of the character incidental to our business and are from time to time involved as a party in various governmental investigations, audits, reviews and administrative proceedings (“government actions”). These government actions include routine and special inquiries by and disclosures to state insurance departments, state attorneys general, U.S. Regulatory Agencies, the U.S.
Elevance Health, Inc.
Notes to Consolidated Financial Statements (continued)
Attorney General and subcommittees of the U.S. Congress. Such government actions could result in the imposition of civil or criminal fines, penalties, other sanctions and additional rules, regulations or other restrictions on our business operations. Any liability that may result from any one of these government actions individually, or in the aggregate, could have a material adverse effect on our consolidated financial position or results of operations.
Blue Cross Blue Shield Antitrust Litigation
We are a defendant in multiple lawsuits that were initially filed in 2012 against the BCBSA and Blue Cross and/or Blue Shield licensees (the “Blue plans”) across the country. Cases filed in twenty-eight states were consolidated into a single, multi-district proceeding captioned In re Blue Cross Blue Shield Antitrust Litigation that is pending in the U.S. District Court for the Northern District of Alabama (the “Court”). Generally, the suits allege that the BCBSA and the Blue plans have conspired to horizontally allocate geographic markets through license agreements, best efforts rules that limit the percentage of non-Blue revenue of each plan, restrictions on acquisitions, rules governing the BlueCard® and National Accounts programs and other arrangements in violation of the Sherman Antitrust Act and related state laws. The cases were brought by two putative nationwide classes of plaintiffs, health plan subscribers and providers.
The BCBSA and Blue plans approved a settlement agreement and release with the subscriber plaintiffs (the “Subscriber Settlement Agreement”), which agreement required the Court’s approval to become effective. The Subscriber Settlement Agreement requires the defendants to make a monetary settlement payment and contains certain terms imposing non-monetary obligations including (i) eliminating the “national best efforts” rule in the BCBSA license agreements (which rule limits the percentage of non-Blue revenue permitted for each Blue plan) and (ii) allowing for some large national employers with self-funded benefit plans to request a bid for insurance coverage from a second Blue plan in addition to the local Blue plan.
In November 2020, the Court issued an order preliminarily approving the Subscriber Settlement Agreement, following which members of the subscriber class were provided notice of the Subscriber Settlement Agreement and an opportunity to opt out of the class. A small number of subscribers submitted valid opt-outs by the opt-out deadline.
In August 2022, the Court issued a final order approving the Subscriber Settlement Agreement (the “Final Approval Order”). The Court amended its Final Approval Order in September 2022, further clarifying the injunctive relief that may be available to subscribers who submitted valid opt-outs. The ultimate amount paid by us under the Subscriber Settlement Agreement was $604.
Four notices of appeal of the Final Approval Order were heard by a panel of the United States Court of Appeals for the Eleventh Circuit (the “Eleventh Circuit”) in September 2023, and the Eleventh Circuit affirmed the Court’s Final Approval Order approving the Subscriber Settlement Agreement in October 2023. Petitions for rehearing were filed by certain appellants in November 2023 and December 2023 and were denied in January 2024. As a result, the Eleventh Circuit issued a mandate terminating the jurisdiction of the Eleventh Circuit in February 2024. In March 2024, Home Depot, one of the appellants, filed a petition for certiorari to the United States Supreme Court (the “Supreme Court”). On the respondents' request, the Supreme Court granted an extension to respond until May 2024. In April 2024, David Behenna, another appellant, filed a petition for certiorari to the Supreme Court, and the defendants and the subscriber plaintiffs filed briefs in opposition in May 2024. In June 2024, the Supreme Court declined to grant certiorari, exhausting all appellate rights. The Subscriber Settlement Agreement and the defendants' payment and non-monetary obligations under the Subscriber Settlement Agreement became effective in June 2024, with the request for second Blue plan bid provisions effective in September 2024. The funds held in escrow will be distributed in accordance with the Subscriber Settlement Agreement.
A number of follow-on cases involving entities that opted out of the Subscriber Settlement Agreement have been filed. Those actions are: Alaska Air Group, Inc., et al. v. Anthem, Inc., et al., No. 2:21-cv-01209-AMM (N.D. Ala.) (“Alaska Air”); JetBlue Airways Corp., et al. v. Anthem, Inc., et al., No. 2:22-cv-00558-GMB (N.D. Ala.) (“Jet Blue”); Metropolitan Transportation Authority v. Blue Cross and Blue Shield of Alabama et al., No. 2:22-cv-00265-RDP (N.D. Ala.) (dismissed without prejudice in June 2023); Bed Bath & Beyond Inc. v. Anthem, Inc., No. 2:22-cv-01256-SGC (N.D. Ala.); Hoover, et al. v. Blue Cross Blue Shield Association, et al., No. 2:22-cv-00261-RDP (N.D. Ala.); and VHS Liquidating Trust v. Blue Cross of California, et al., No. RG21106600 (Cal. Super.) (“VHS”). In February 2023, the Court denied the defendants’ motion to dismiss based on a statute of limitations defense in Alaska Air and Jet Blue. In September 2023, the California court presiding over the VHS case, upheld its prior order granting in part defendants’ motion to strike based on the statute of
Elevance Health, Inc.
Notes to Consolidated Financial Statements (continued)
limitations. We intend to continue to vigorously defend these follow-on cases, which we believe are without merit; however, their ultimate outcome cannot be presently determined.
In October 2020, after the Court lifted the stay as to the provider litigation, provider plaintiffs filed a renewed motion for class certification, which defendants opposed. In March 2021, the Court issued an order terminating the pending motion for class certification until the Court determined the standard of review applicable to the providers’ claims. In response to that order, the parties filed renewed standard of review motions, and in June 2021, the parties filed summary judgment motions not critically dependent on class certification. In February 2022, the Court issued orders (i) granting certain defendants’ motion for partial summary judgment against the provider plaintiffs who had previously released claims against such defendants, and (ii) granting the provider plaintiffs’ motion for partial summary judgment, determining that Ohio v. American Express Co. does not affect the standard of review in this case. In August 2022, the Court issued orders (i) granting in part the defendants’ motion regarding the antitrust standard of review, holding that for the period of time after the elimination of the “national best efforts” rule, the rule of reason applies to the provider plaintiffs’ market allocation conspiracy claims, and (ii) denying the provider plaintiffs’ motion for partial summary judgment on the standard of review, reaffirming its prior holding that the provider groups’ boycott claims are subject to the rule of reason. In December 2023, the Court denied defendants’ motion for summary judgment on providers’ damage claims as time-barred and speculative and provider plaintiffs’ motion for partial summary judgment on the defendants’ single entity defense due to the existence of genuine issues of material fact. In January 2024, the Court issued orders (i) denying defendants’ motion for summary judgment on (a) all claims by certain hospital providers and (b) any claims based on the Blue system's rules other than exclusive serviced areas or BlueCard and (ii) denying provider plaintiffs’ motion for partial summary judgment on defendants’ common law trademark claims.
In the third quarter of 2024, the BCBSA, along with the individually named Blue plans approved a settlement agreement and release (the “Provider Settlement Agreement”) with the provider plaintiffs, and in October 2024 the provider plaintiffs filed a motion for preliminary approval with the Court. The Court granted preliminary approval of the provider settlement on December 4, 2024. If finally approved by the Court, the Provider Settlement Agreement will require the defendants to make a monetary settlement payment, our portion of which is estimated to be $666, and will contain certain non-monetary terms including (i) expansion of certain opportunities to contract with providers in contiguous service areas, (ii) certain prompt pay commitments, and (iii) various technological enhancements to the BlueCard program. We recognized our estimated payment obligation under the Provider Settlement Agreement of $666 in September 2024. We recognized this estimated payment obligation as operating expense in the Corporate & Other segment (see Note 20, “Segment Information”).
Express Scripts, Inc. Pharmacy Benefit Management Litigation
In March 2016, we filed a lawsuit against Express Scripts, Inc. (“Express Scripts”), our vendor at the time for pharmacy benefit management services, captioned Anthem, Inc. v. Express Scripts, Inc., in the U.S. District Court for the Southern District of New York (the “District Court”). The lawsuit sought to recover over $14,800 in damages for pharmacy pricing that is higher than competitive benchmark pricing under the agreement between the parties (the “ESI Agreement”), over $158 in damages related to operational breaches, as well as various declarations under the ESI Agreement, including that Express Scripts: (i) breached its obligation to negotiate in good faith and to agree in writing to new pricing terms (the “Pricing Claim”); (ii) was required to provide competitive benchmark pricing to us through the term of the ESI Agreement; (iii) has breached the ESI Agreement; and (iv) is required under the ESI Agreement to provide post-termination services, at competitive benchmark pricing, for one year following any termination.
Express Scripts disputed our contractual claims and it sought declaratory judgments: (i) regarding the timing of the periodic pricing review under the ESI Agreement, and (ii) that it has no obligation to ensure that we receive any specific level of pricing, that we have no contractual right to any change in pricing under the ESI Agreement and that its sole obligation is to negotiate proposed pricing terms in good faith. In the alternative, Express Scripts claimed that we have been unjustly enriched by its payment of $4,675 at the time we entered into the ESI Agreement. In March 2017, the District Court granted our motion to dismiss Express Scripts’ counterclaims for (i) breach of the implied covenant of good faith and fair dealing, and (ii) unjust enrichment with prejudice. After such ruling, Express Scripts’ only remaining claims were for breach of contract and declaratory relief. In August 2021, Express Scripts filed a motion for summary judgment, which we opposed. In March 2022, the District Court granted in part and denied in part Express Scripts’ motion for summary judgment. The District Court dismissed our declaratory judgment claim, our breach of contract claim for failure to prove damages and most of our operational breach claims. As a result of the summary judgment decision, only two claims remained. Express Scripts filed a second motion for summary judgment in June 2022, challenging our remaining operational breach claims, which the
Elevance Health, Inc.
Notes to Consolidated Financial Statements (continued)
District Court denied in March 2023. In November 2023, the District Court issued a final judgment ending the lawsuit in the District Court after the parties settled and stipulated to dismiss the only remaining claim that had not been disposed of by the court order or stipulation. In December 2023, we filed a notice of appeal with the United States Court of Appeals for the Second Circuit (the “Second Circuit”), regarding the Pricing Claim. Mediation ordered by the Second Circuit occurred in March 2024 and was unsuccessful. Oral argument before the Second Circuit was held in October 2024. In November 2024, the Court affirmed the trial court's decision dismissing the case. A motion for rehearing was submitted which was denied. The matter is now closed.
Medicare Risk Adjustment Litigation
In March 2020, the U.S. Department of Justice (“DOJ”) filed a civil lawsuit against Elevance Health, Inc. in the District Court in a case captioned United States v. Anthem, Inc. The DOJ’s suit alleges, among other things, that we falsely certified the accuracy of the diagnosis data we submitted to the Centers for Medicare and Medicaid Services (“CMS”) for risk-adjustment purposes under Medicare Part C and knowingly failed to delete inaccurate diagnosis codes. The DOJ further alleges that, as a result of these purported acts, we caused CMS to calculate the risk-adjustment payments based on inaccurate diagnosis information, which enabled us to obtain unspecified amounts of payments in Medicare funds in violation of the False Claims Act. The DOJ filed an amended complaint in July 2020, alleging the same causes of action but revising some of its factual allegations. In September 2020, we filed a motion to transfer the lawsuit to the Southern District of Ohio, a motion to dismiss part of the lawsuit, and a motion to strike certain allegations in the amended complaint, all of which the District Court denied in October 2022. In November 2022, we filed an answer. In March 2023, discovery commenced, and an initial case management conference was held in April 2023. Fact discovery is ongoing. In December 2024, the District Court issued a scheduling order setting the deadlines for the completion of fact discovery in August 2025 and April 2026 for the completion of expert discovery. We intend to continue to vigorously defend this suit, which we believe is without merit; however, the ultimate outcome cannot be presently determined.
Other Contingencies
From time to time, we and certain of our subsidiaries are parties to various legal proceedings, many of which involve claims for coverage encountered in the ordinary course of business. We, like Health Maintenance Organizations (“HMOs”) and health insurers generally, exclude certain healthcare and other services from coverage under our HMO, Preferred Provider Organizations and other plans. We are, in the ordinary course of business, subject to the claims of our enrollees arising out of decisions to restrict or deny reimbursement for uncovered services. The loss of even one such claim, if it results in a significant punitive damage award, could have a material adverse effect on us. In addition, the risk of potential liability under punitive damage theories may increase significantly the difficulty of obtaining reasonable reimbursement of coverage claims.
Contractual Obligations and Commitments
In September 2024, we extended our agreement with a vendor for information technology infrastructure and related management and support services through June 2029. Our remaining commitment under this agreement is approximately $2,065. We have the ability to terminate the agreement upon the occurrence of certain events, subject to early termination fees.
CarelonRx markets and offers pharmacy services to our affiliated health plan customers throughout the country, as well as to customers outside of the health plans we own. The comprehensive pharmacy services portfolio includes all core pharmacy services, such as home delivery and specialty pharmacies, claims adjudication, formulary management, pharmacy networks, rebate administration, a prescription drug database and member services. CarelonRx delegates certain core pharmacy services to CVS, pursuant to the CVS Agreement, with the current contractual term extending through December 31, 2027. We can elect to have CVS continue to provide services to us for a three-year extension period on the same terms and conditions as in the current CVS Agreement in the event of a termination or non-renewal by either party.
We have financial guarantees related to standby letters of credit and surety bonds related to certain contractual commitments which totaled $912 as of December 31, 2024. We do not believe such obligations will materially affect its financial position, results of operations, or cash flows.
Elevance Health, Inc.
Notes to Consolidated Financial Statements (continued)
The Company has unfunded loan commitments to certain equity investees of $501 at December 31, 2024. The Company does not believe such obligations will materially affect its financial position, results of operations, or cash flows.
Vulnerability from Concentrations
Financial instruments that potentially subject us to concentrations of credit risk consist primarily of cash equivalents, investment securities, premium receivables and instruments held through hedging activities. All investment securities are managed by professional investment managers within policies authorized by our Board of Directors. Such policies limit the amounts that may be invested in any one issuer and prescribe certain investee company criteria. Concentrations of credit risk with respect to premium receivables are limited due to the large number of employer groups that constitute our customer base in the states in which we conduct business. As of December 31, 2024, there were no significant concentrations of financial instruments in a single investee, industry or geographic location.
15. Capital Stock
Stock Incentive Plans
Our Board of Directors has adopted the 2017 Elevance Health Incentive Compensation Plan (the “2017 Incentive Plan”) which has been approved by our shareholders. The term of the 2017 Incentive Plan is such that no awards may be granted on or after May 18, 2027. The 2017 Incentive Plan gives authority to the Compensation and Talent Committee of the Board of Directors to make incentive awards to our non-employee directors, employees and consultants, consisting of stock options, stock, restricted stock, restricted stock units, cash-based awards, stock appreciation rights, performance shares and performance units. The 2017 Incentive Plan limits the number of available shares for issuance to 37.5 shares, subject to adjustment as set forth in the 2017 Incentive Plan.
Stock options are granted for a fixed number of shares with an exercise price at least equal to the fair value of the shares at the grant date. Stock options vest over three years in equal annual installments and generally have a term of ten years from the grant date.
Certain option grants contain provisions whereby the employee continues to vest in the award subsequent to termination due to retirement. Our attribution method for newly granted awards considers all vesting and other provisions, including retirement eligibility, in determining the requisite service period over which the fair value of the awards will be recognized.
Awards of restricted stock or restricted stock units are issued at the fair value of the stock on the grant date and may also include one or more performance measures that must be met for the award to vest. For restricted stock or restricted stock units without performance measures, the restrictions lapse in three equal annual installments. Restricted stock or restricted stock units with performance measures vest in three-year installments. Performance units issued in 2024 will vest in 2027, based on certain revenue and earnings targets over the three-year period of 2024 to 2026. Performance units issued in 2023 will vest in 2026, based on certain revenue and earnings targets over the three-year period of 2023 to 2025. Performance units issued in 2022 will vest in 2025, based on certain revenue and earnings targets over the three-year period of 2022 to 2024.
For the years ended December 31, 2024, 2023 and 2022, we recognized share-based compensation expense of $191, $289 and $264, respectively, as well as related tax benefits of $47, $73 and $66, respectively.
A summary of stock option activity for the year ended December 31, 2024 is as follows:
| | | | | | | | | | | | | | | | | | | | | | | |
| Number of
Shares | | Weighted-Average
Option Price
per Share | | Weighted-Average
Remaining
Contractual Life
(Years) | | Aggregate
Intrinsic
Value |
| Outstanding at January 1, 2024 | 3.0 | | | $ | 327.14 | | | | | |
| Granted | 0.5 | | | 499.52 | | | | | |
| Exercised | (0.5) | | | 286.33 | | | | | |
| Forfeited or expired | (0.1) | | | 459.14 | | | | | |
| Outstanding at December 31, 2024 | 2.9 | | | 361.36 | | | 5.58 | | $ | 166 | |
| Exercisable at December 31, 2024 | 1.9 | | | 300.24 | | | 4.41 | | $ | 166 | |
Elevance Health, Inc.
Notes to Consolidated Financial Statements (continued)
The intrinsic value of options exercised during the years ended December 31, 2024, 2023 and 2022 amounted to $123, $69 and $120, respectively. We recognized tax benefits of $21, $18 and $31 during the years ended December 31, 2024, 2023 and 2022, respectively, from option exercises and disqualifying dispositions. During the years ended December 31, 2024, 2023 and 2022, we received cash of $154, $87 and $120, respectively, from exercises of stock options.
The total fair value of restricted stock awards that vested during the years ended December 31, 2024, 2023 and 2022 was $298, $285 and $261, respectively.
A summary of the status of nonvested restricted stock activity, including restricted stock units and performance units, for the year ended December 31, 2024 is as follows:
| | | | | | | | | | | |
| Restricted
Stock Shares
and Units | | Weighted-Average
Grant Date
Fair Value
per Share |
| Nonvested at January 1, 2024 | 1.1 | | | $ | 423.94 | |
| Granted | 0.6 | | | 501.78 | |
| Vested | (0.6) | | | 358.21 | |
| Forfeited | (0.1) | | | 479.40 | |
| Nonvested at December 31, 2024 | 1.0 | | | 478.70 | |
During the year ended December 31, 2024, we granted approximately 0.2 restricted stock units that are contingent upon us achieving certain revenue and earnings targets over the three-year period of 2024 to 2026. These grants have been included in the activity shown above, but will be subject to adjustment at the end of 2026, based on results in the three-year period.
As of December 31, 2024, the total remaining unrecognized compensation expense related to nonvested stock options and restricted stock, including restricted stock units and performance units, amounted to $37 and $203, respectively, which will be amortized over the weighted-average remaining requisite service periods of 9 months and 13 months, respectively.
As of December 31, 2024, there were approximately 10.2 shares of common stock available for future grants under the 2017 Incentive Plan.
Fair Value
We use a binomial lattice valuation model to estimate the fair value of all stock options granted. Expected volatility assumptions used in the binomial lattice model are based on an analysis of implied volatility of publicly traded options on our stock and historical volatility of our stock price. The risk-free interest rate is derived from the U.S. Treasury strip rates at the time of the grant. The expected term of the options was derived from the outputs of the binomial lattice model, which incorporates post-vesting forfeiture assumptions based on an analysis of historical data. The dividend yield was based on our estimate of future dividend yields. Similar groups of employees that have dissimilar exercise behavior are considered separately for valuation purposes. We utilize the multiple-grant approach for recognizing compensation expense associated with each separately vesting portion of the share-based award.
The following weighted-average assumptions were used to estimate the fair values of options granted during the years ended December 31, 2024, 2023 and 2022:
| | | | | | | | | | | | | | | | | |
| 2024 | | 2023 | | 2022 |
| Risk-free interest rate | 4.28 | % | | 3.95 | % | | 1.97 | % |
| Volatility factor | 28.00 | % | | 29.00 | % | | 29.00 | % |
| Dividend yield (annual) | 1.31 | % | | 1.30 | % | | 1.10 | % |
| Weighted-average expected life (years) | 4.40 | | 4.40 | | 5.10 |
Elevance Health, Inc.
Notes to Consolidated Financial Statements (continued)
The following weighted-average fair values per share were determined for the years ended December 31, 2024, 2023 and 2022:
| | | | | | | | | | | | | | | | | |
| 2024 | | 2023 | | 2022 |
| Options granted during the year | $ | 134.61 | | | $ | 126.90 | | | $ | 116.92 | |
| Restricted stock awards granted during the year | 501.78 | | | 467.79 | | | 453.70 | |
The binomial lattice option-pricing model requires the input of subjective assumptions including the expected stock price volatility. Because our stock option grants have characteristics significantly different from those of traded options, and because changes in the subjective input assumptions can materially affect the fair value estimate, in our opinion, existing models do not necessarily provide a reliable single measure of the fair value of our stock option grants.
Employee Stock Purchase Plan
We have registered 14.0 shares of common stock for the Employee Stock Purchase Plan (the “Stock Purchase Plan”), which is intended to provide a means to encourage and assist employees in acquiring a stock ownership interest in Elevance Health. Pursuant to the terms of the Stock Purchase Plan, an eligible employee is permitted to purchase no more than $25,000 (actual dollars) worth of stock in any calendar year, based on the fair value of the stock at the end of each plan quarter. Employees become participants by electing payroll deductions from 1% to 15% of gross compensation. Once purchased, the stock is accumulated in the employee’s investment account. The Stock Purchase Plan allows participants to purchase shares of our common stock at a discounted price per share of 90% of the fair value of a share of common stock on the lower of the first or last trading day of the plan quarter purchase period. The Stock Purchase Plan discount was recognized as compensation expense for the year ended December 31, 2024, based on GAAP guidance. During the years ended December 31, 2024, 2023 and 2022, we issued 0.2, 0.1 and 0.1 shares, respectively, under the Stock Purchase Plan, and we received cash of $65, $65 and $62, respectively, for such shares. As of December 31, 2024, 4.0 shares were available for issuance under the Stock Purchase Plan.
Use of Capital and Stock Repurchase Program
We regularly review the appropriate use of capital, including acquisitions, common stock and debt security repurchases and dividends to shareholders. The declaration and payment of any dividends or repurchases of our common stock or debt is at the discretion of our Board of Directors and depends upon our financial condition, results of operations, future liquidity needs, regulatory and capital requirements and other factors deemed relevant by our Board of Directors.
A summary of the cash dividend activity for the years ended December 31, 2024 and 2023 is as follows:
| | | | | | | | | | | | | | | | | | | | | | | | | | |
| Declaration Date | | Record Date | | Payment Date | | Cash Dividend
per Share | | Total |
| Year ended December 31, 2024 | | | | | | |
| January 23, 2024 | | March 8, 2024 | | March 22, 2024 | | $ | 1.63 | | | $ | 379 | |
| April 16, 2024 | | June 10, 2024 | | June 25, 2024 | | 1.63 | | | 378 | |
| July 16, 2024 | | September 10, 2024 | | September 25, 2024 | | 1.63 | | | 378 | |
| October 15, 2024 | | December 5, 2024 | | December 20, 2024 | | 1.63 | | | 373 | |
| | | | | | | | |
| Year ended December 31, 2023 | | | | | | |
| January 24, 2023 | | March 10, 2023 | | March 24, 2023 | | $ | 1.48 | | | $ | 351 | |
| April 18, 2023 | | June 9, 2023 | | June 23, 2023 | | 1.48 | | | 350 | |
| July 18, 2023 | | September 8, 2023 | | September 22, 2023 | | 1.48 | | | 348 | |
| October 17, 2023 | | December 6, 2023 | | December 21, 2023 | | 1.48 | | | 346 | |
On January 22, 2025, our Audit Committee declared a quarterly cash dividend to shareholders of $1.71 per share on the outstanding shares of our common stock. This quarterly dividend is payable on March 25, 2025 to the shareholders of record as of March 10, 2025.
Elevance Health, Inc.
Notes to Consolidated Financial Statements (continued)
Under our Board of Directors’ authorization, we maintain a common stock repurchase program. On October 15, 2024, our Audit Committee, pursuant to authorization granted by the Board of Directors, authorized an $8,000 increase to the common stock repurchase program. No duration has been placed on our common stock repurchase program, and we reserve the right to discontinue the program at any time. We intend to utilize this authorization over a multi-year period, subject to market and industry conditions. Repurchases may be made from time to time at prevailing market prices, subject to certain restrictions on volume, pricing and timing. The repurchases are affected from time to time in the open market, through negotiated transactions, including accelerated share repurchase agreements, and through plans designed to comply with Rule 10b5-1 under the Securities Exchange Act of 1934, as amended. Our stock repurchase program is discretionary, as we are under no obligation to repurchase shares. We repurchase shares under the program when we believe it is a prudent use of capital. The excess cost of the repurchased shares over par value is charged on a pro rata basis to additional paid-in capital and retained earnings.
A summary of common stock repurchases for the years ended December 31, 2024 and 2023 is as follows:
| | | | | | | | | | | | | | | |
| | | Years Ended December 31 |
| | 2024 | | 2023 |
| Shares repurchased | | | 6.7 | | | 5.8 | |
| Average price per share | | | $ | 435.32 | | | $ | 463.53 | |
| Aggregate cost | | | $ | 2,900 | | | $ | 2,676 | |
| Authorization remaining at end of year | | | $ | 9,300 | | | $ | 4,200 | |
We expect to utilize the remaining authorized amount over a multi-year period, subject to market and industry conditions.
For additional information regarding the use of capital for debt security repurchases, see Note 13, “Debt.”
Elevance Health, Inc.
Notes to Consolidated Financial Statements (continued)
16. Accumulated Other Comprehensive (Loss) Income
A reconciliation of the components of accumulated other comprehensive (loss) income at December 31, 2024, 2023, and 2022 is as follows:
| | | | | | | | | | | | | | | | | |
| 2024 | | 2023 | | 2022 |
| Net unrealized investment gains: | | | | | |
| Beginning of year balance | $ | (632) | | | $ | (1,755) | | | $ | 494 | |
| Other comprehensive (loss) income before reclassifications, net of tax benefit (expense) of $44, $(218), and $926, respectively | (153) | | | 760 | | | (2,614) | |
| Amounts reclassified from accumulated other comprehensive income, net of tax expense of $(82), $(113), and $(94), respectively | 256 | | | 357 | | | 354 | |
| Other comprehensive income (loss) | 103 | | | 1,117 | | | (2,260) | |
| Other comprehensive income attributable to noncontrolling interests, net of tax benefit (expense) of $1, $1, and $(3), respectively | 6 | | | 6 | | | 11 | |
| End of year balance | (523) | | | (632) | | | (1,755) | |
| Non-credit components of impairments on investments: | | | | | |
| Beginning of year balance | (3) | | | (3) | | | — | |
| Other comprehensive income (loss), net of tax expense of $(1), $0, and $0, respectively | 1 | | | — | | | (3) | |
| End of year balance | (2) | | | (3) | | | (3) | |
| Net cash flow hedges: | | | | | |
| Beginning of year balance | (211) | | | (229) | | | (239) | |
| Other comprehensive income, net of tax benefit (expense) of $(4), $6, and $(6), respectively | 4 | | | 18 | | | 10 | |
| End of year balance | (207) | | | (211) | | | (229) | |
| Pension and other benefits: | | | | | |
| Beginning of year balance | (459) | | | (499) | | | (429) | |
| Other comprehensive income (loss), net of tax expense of $0, $(39), and $(23), respectively | 60 | | | 40 | | | (70) | |
| End of year balance | (399) | | | (459) | | | (499) | |
| Future policy benefits: | | | | | |
| Beginning of year balance | 10 | | | 13 | | | (19) | |
| | | | | |
| Other comprehensive (loss) income, net of tax benefit (expense) of $1, $1, and $(10), respectively | (2) | | | (3) | | | 32 | |
| End of year balance | 8 | | | 10 | | | 13 | |
| Foreign currency translation adjustments: | | | | | |
| Beginning of year balance | (18) | | | (17) | | | (4) | |
| Other comprehensive loss, net of tax benefit of $0, $1, and $6 | (6) | | | (1) | | | (13) | |
| End of year balance | (24) | | | (18) | | | (17) | |
| Total: | | | | | |
| Total beginning of year accumulated other comprehensive loss | (1,313) | | | (2,490) | | | (197) | |
| | | | | |
| Total other comprehensive income (loss), net of tax benefit (expense) of $(42), $(362), and $799, respectively | 160 | | | 1,171 | | | (2,304) | |
| Total other comprehensive income attributable to noncontrolling interests, net of tax benefit (expense) of $1, $1, and $(3), respectively | 6 | | | 6 | | | 11 | |
| Total end of year accumulated other comprehensive loss | $ | (1,147) | | | $ | (1,313) | | | $ | (2,490) | |
Elevance Health, Inc.
Notes to Consolidated Financial Statements (continued)
17. Reinsurance
We reinsure certain risks with other companies and assume risk from other companies. We remain primarily liable to policyholders under ceded insurance contracts and are contingently liable for amounts recoverable from reinsurers in the event that such reinsurers do not meet their contractual obligations.
A summary of direct, assumed and ceded premiums earned for the years ended December 31, 2024, 2023 and 2022 is as follows:
| | | | | | | | | | | | | | | | | | | | | | | |
| | | | | | | | | | | |
| | | | 2024 | | | | 2023 | | | | 2022 |
| Direct | | | $ | 139,479 | | | | $ | 136,927 | | | | $ | 127,788 |
| Assumed | | | 4,753 | | | | 5,988 | | | | 5,505 |
| Ceded | | | (66) | | | | (61) | | | | (64) |
| Net premiums | | | $ | 144,166 | | | | $ | 142,854 | | | | $ | 133,229 |
| Percentage—assumed to net premiums | | | 3.3 | % | | | | 4.2 | % | | | | 4.1 | % |
The difference between written premiums and earned premiums is immaterial in each of the years presented above.
A summary of net premiums earned by segment (see Note 20, “Segment Information”) for the years ended December 31, 2024, 2023 and 2022 is as follows:
| | | | | | | | | | | | | | | | | | | | | | | |
| | | | | | | | | | | |
| | | | 2024 | | | | 2023 | | | | 2022 |
| Reportable segments: | | | | | | | | | | | |
| Health Benefits | | | $ | 142,668 | | | | | $ | 141,515 | | | | | $ | 131,964 | |
| Carelon Services | | | 2,630 | | | | | 1,679 | | | | | 1,499 | |
| Eliminations | | | (1,132) | | | | | (340) | | | | | (234) | |
| Net premiums | | | $ | 144,166 | | | | | $ | 142,854 | | | | | $ | 133,229 | |
The effect of reinsurance on benefit expense for the years ended December 31, 2024, 2023 and 2022 is as follows:
| | | | | | | | | | | | | | | | | |
| 2024 | | 2023 | | 2022 |
| Direct | $ | 123,602 | | | $ | 119,409 | | | $ | 112,061 | |
| Assumed | 4,021 | | | 4,984 | | | 4,633 | |
| Ceded | (56) | | | (63) | | | (52) | |
| Net benefit expense | $ | 127,567 | | | $ | 124,330 | | | $ | 116,642 | |
18. Leases
We lease office space and certain computer and related equipment using noncancelable operating leases. Our leases have remaining lease terms of 1 year to 11 years.
The information related to our leases is as follows:
| | | | | | | | | | | | | | | | | |
| Balance Sheet Location | | December 31, 2024 | | December 31, 2023 |
| Operating Leases | | | | | |
| ROU assets | Other noncurrent assets | | $ | 567 | | | $ | 584 | |
| Lease liabilities, current | Other current liabilities | | 153 | | | 164 | |
| Lease liabilities, noncurrent | Other noncurrent liabilities | | 658 | | | 685 | |
Elevance Health, Inc.
Notes to Consolidated Financial Statements (continued)
| | | | | | | | | | | | | | | | | |
| Years Ended December 31 |
| 2024 | | 2023 | | 2022 |
| Lease Expense | | | | | |
| Operating lease expense | $ | 147 | | $ | 155 | | $ | 143 | |
| Short-term and variable lease expense | 47 | | 43 | | 35 | |
| Sublease income | (6) | | (5) | | (3) | |
| Total lease expense | $ | 188 | | $ | 193 | | | $ | 175 | |
| | | | | |
| | | | | |
| | | | | |
| | | | | |
| | | | | |
| | | | | |
Our activities as disclosed in Note 4, “Business Optimization Initiatives,” include reducing our office space footprint. As a result, we performed an interim impairment test during the years ended December 31, 2024, 2023 and 2022, and recorded impairment charges of $17, $23 and $34, respectively, for impairment and abandonment of ROU assets which are included in the operating lease expense shown above.
| | | | | | | | | | | | | | | | | | |
| | | | Years Ended December 31 |
| | | | 2024 | | 2023 |
| | | | | |
| | | | | |
| | | | | |
| | | | | |
| | | | | |
| | | | | | |
| Other information | | | | | |
| Operating cash paid for amounts included in the measurement of lease liabilities, operating leases | | | $ | 202 | | $ | 206 |
| ROU assets obtained in exchange for new lease liabilities, operating leases | | | $ | 44 | | $ | 59 |
| Weighted average remaining lease term in years, operating leases | | | 6 | | 6 |
| Weighted average discount rate, operating leases | | | 3.96 | % | | 3.66 | % |
At December 31, 2024, future lease payments for noncancelable operating leases with initial or remaining terms of one year or more are as follows:
| | | | | |
| 2025 | $ | 184 | |
| 2026 | 154 | |
| 2027 | 127 | |
| 2028 | 112 | |
| 2029 | 100 | |
| Thereafter | 209 | |
| Total future minimum payments | 886 | |
| Less imputed interest | (75) | |
| Total lease liabilities | $ | 811 | |
19. Shareholders’ Earnings per Share
The denominator for basic and diluted shareholders’ earnings per share at December 31, 2024, 2023 and 2022 is as follows:
| | | | | | | | | | | | | | | | | |
| 2024 | | 2023 | | 2022 |
| Denominator for basic shareholders’ earnings per share—weighted-average shares | 231.7 | | | 235.9 | | | 240.0 | |
| Effect of dilutive securities—employee stock options, non-vested restricted stock awards and convertible debentures | 1.2 | | | 1.5 | | | 2.8 | |
| Denominator for diluted shareholders’ earnings per share | 232.9 | | | 237.4 | | | 242.8 | |
During the years ended December 31, 2024, 2023 and 2022, weighted-average shares related to certain stock options of 0.7, 0.8 and 0.4, respectively, were excluded from the denominator for diluted shareholders’ earnings per share because the stock options were anti-dilutive.
Elevance Health, Inc.
Notes to Consolidated Financial Statements (continued)
During each of the years ended December 31, 2024, 2023 and 2022, we issued approximately 0.2 restricted stock units, of which vesting was contingent upon us meeting certain earnings targets. Contingent restricted stock units are excluded from the denominator for diluted shareholders’ earnings per share and are included only if and when the contingency is met. The 2024 contingent restricted stock units are being measured over the three-year period of 2024 through 2026, the 2023 contingent restricted stock units are being measured over the three-year period of 2023 through 2025 and the 2022 contingent restricted stock units are being measured over the three year period of 2022 through 2024. Contingent restricted stock units generally vest in March of the year following each measurement period.
20. Segment Information
We report our results of operations in the following four reportable segments: Health Benefits, CarelonRx, Carelon Services and Corporate & Other. An immaterial amount of our total consolidated revenues is derived from activities outside of the U.S. and Puerto Rico.
Our Health Benefits segment offers a comprehensive suite of health plans and services to our Individual, Employer Group risk-based, Employer Group fee-based, BlueCard®, Medicare, Medicaid and FEP® members. The Health Benefits segment offers health products on a full-risk basis; provides a broad array of administrative managed care services to our fee-based customers; and provides a variety of specialty and other insurance products and services such as stop loss, dental, vision and supplemental health insurance benefits.
Our CarelonRx segment includes our pharmacy services business. CarelonRx markets and offers pharmacy services to our affiliated health plan customers, as well as to external customers outside of the health plans we own. CarelonRx offers a comprehensive pharmacy services portfolio, which includes all core pharmacy services, such as home delivery and specialty pharmacies, claims adjudication, formulary management, pharmacy networks, rebate administration, a prescription drug database and member services, as well as infusion services and injectable therapies.
Our Carelon Services segment integrates physical, behavioral, pharmacy, and social services with the aim of delivering whole health affordably by offering a broad array of healthcare related services and capabilities to internal and external customers through our Carelon Health and Carelon Insights businesses. Carelon promotes affordability by managing complex areas of the healthcare system, leveraging data and insights to ensure members receive safe, appropriate, high-quality care and providers are reimbursed accurately and timely. Our approach to cost management relies on capabilities including provider enablement, value-based networks, member engagement, and utilization management. Our care delivery services primarily target serving chronic and complex populations by providing personalized care in the home and virtually. As a part of Carelon Health, we completed our acquisition of CareBridge at the end of 2024, which provides virtual care to complex Medicaid and Medicare patients and supports plans in managing home and community-based services.
Our Corporate & Other segment includes our businesses that do not individually meet the quantitative threshold for an operating segment, as well as corporate expenses not allocated to our other reportable segments.
We define operating revenues to include premiums, product revenue and service fees. Operating revenues are derived from premiums and fees received, primarily from the sale and administration of health benefits and pharmacy products and services. Operating gain is calculated as total operating revenue less benefit expense, cost of products sold and operating expense.
Affiliated operating revenues represent revenues or costs for services provided to our subsidiaries by CarelonRx and Carelon Services, in addition to certain administrative and other services provided by our international businesses, which are recorded at cost or management’s estimate of fair market value. These affiliated operating revenues are eliminated in our consolidated financial statements. For segment reporting, we present all capitation risk arrangements on a gross basis; therefore, eliminations also include adjustments for capitated risk arrangements that are recognized on a net basis under GAAP.
Through our participation in various federal government programs, we generated approximately 31%, 29% and 28% of our total consolidated revenues from agencies of the U.S. government for the year ended December 31, 2024, 2023 and 2022, respectively. The majority of these revenues are contained in our Health Benefits segment.
Elevance Health, Inc.
Notes to Consolidated Financial Statements (continued)
The accounting policies of the segments are consistent with those described in the summary of significant accounting policies in Note 2, “Basis of Presentation and Significant Accounting Policies,” except that all capitation risk arrangements are reported on a gross basis with an adjustment included in eliminations for capitated risk arrangements that are presented on a net basis under GAAP.
Our chief operating decision maker (the “CODM”) is our Chief Executive Officer. The CODM assesses the performance of our reportable segments based on operating gain or loss as defined above. The CODM evaluates net investment income, net gains (losses) on financial instruments, interest expense, depreciation and amortization expense, income taxes and assets, liabilities and equity on a consolidated basis, as these items are managed in a corporate shared service environment and are not the responsibility of segment operating management.
The CODM uses operating gain or loss, developed during the annual budget process, and updated during the periodic forecasting process, as a basis to assess performance and allocate operating and capital resources to each segment.
Financial data by reportable segment for the years ended December 31, 2024, 2023 and 2022 is as follows:
Elevance Health, Inc.
Notes to Consolidated Financial Statements (continued)
| | | | | | | | | | | | | | | | | | | | | | | | | | | | | | | | | | | | | | | | | |
| | | Carelon | | | | | | |
| Health
Benefits | | CarelonRx | | Carelon
Services | | Total | | Corporate
& Other | | Eliminations | | Total |
| Year Ended December 31, 2024 | | | | | | | | | | | | |
| Premiums | $ | 142,668 | | | $ | — | | | $ | 2,630 | | | $ | 2,630 | | | $ | — | | | $ | (1,132) | | | $ | 144,166 | |
| Product revenue | — | | | 22,630 | | | — | | | 22,630 | | | — | | | — | | | 22,630 | |
| Service fees | 7,607 | | | 5 | | | 790 | | | 795 | | | 6 | | | — | | | 8,408 | |
| Operating revenue - unaffiliated | 150,275 | | | 22,635 | | | 3,420 | | | 26,055 | | | 6 | | | (1,132) | | | 175,204 | |
| Operating revenue - affiliated | — | | | 13,326 | | | 14,541 | | | 27,867 | | | 303 | | | (28,170) | | | — | |
| Operating revenue - total | $ | 150,275 | | | $ | 35,961 | | | $ | 17,961 | | | $ | 53,922 | | | $ | 309 | | | $ | (29,302) | | | $ | 175,204 | |
| | | | | | | | | | | | | |
| Benefit expense | $ | 126,703 | | | $ | — | | | $ | 14,388 | | | $ | 14,388 | | | $ | 19 | | | $ | (13,543) | | | $ | 127,567 | |
| Cost of products sold | — | | | 32,978 | | | — | | | 32,978 | | | — | | | (13,228) | | | 19,750 | |
| Operating expense | 17,329 | | | 811 | | | 2,856 | | | 3,667 | | | 1,560 | | | (2,531) | | | 20,025 | |
| Operating gain (loss) | $ | 6,243 | | | $ | 2,172 | | | $ | 717 | | | $ | 2,889 | | | $ | (1,270) | | | $ | — | | | $ | 7,862 | |
| | | | | | | | | | | | | |
| | | | | | | | | | | | | |
| | | | | | | | | |
| | | | | | | | | | | | | |
| | | | | | | | | | | | | |
| Year Ended December 31, 2023 | | | | | | | | | | | | |
| Premiums | $ | 141,515 | | | $ | — | | | $ | 1,679 | | | $ | 1,679 | | | $ | — | | | $ | (340) | | | $ | 142,854 | |
| Product revenue | — | | | 19,452 | | | — | | | 19,452 | | | — | | | — | | | 19,452 | |
| Service fees | 7,056 | | | 6 | | | 813 | | | 819 | | | 28 | | | — | | | 7,903 | |
| Operating revenue - unaffiliated | 148,571 | | | 19,458 | | | 2,492 | | | 21,950 | | | 28 | | | (340) | | | 170,209 | |
| Operating revenue - affiliated | — | | | 14,377 | | | 11,655 | | | 26,032 | | | 451 | | | (26,483) | | | — | |
| Operating revenue - total | $ | 148,571 | | | $ | 33,835 | | | $ | 14,147 | | | $ | 47,982 | | | $ | 479 | | | $ | (26,823) | | | $ | 170,209 | |
| | | | | | | | | | | | | |
| Benefit expense | $ | 123,705 | | | $ | — | | | $ | 10,610 | | | $ | 10,610 | | | $ | 35 | | | $ | (10,020) | | | $ | 124,330 | |
| Cost of products sold | — | | | 31,588 | | | — | | | 31,588 | | | — | | | (14,295) | | | 17,293 | |
| Operating expense | 17,978 | | 272 | | 2,857 | | 3,129 | | 1,488 | | (2,508) | | | 20,087 |
| Operating gain (loss) | $ | 6,888 | | | $ | 1,975 | | | $ | 680 | | | $ | 2,655 | | | $ | (1,044) | | | $ | — | | | $ | 8,499 | |
| | | | | | | | | | | | | |
| | | | | | | | | | | | | |
Year Ended December 31, 2022 | | | | | | | | | | | | |
| Premiums | $ | 131,964 | | | $ | — | | | $ | 1,499 | | | $ | 1,499 | | | $ | — | | | $ | (234) | | | $ | 133,229 | |
| Product revenue | — | | | 14,978 | | | — | | | 14,978 | | | — | | | — | | | 14,978 | |
| Service fees | 6,520 | | | — | | | 889 | | | 889 | | | 44 | | | — | | | 7,453 | |
| Operating revenue - unaffiliated | 138,484 | | | 14,978 | | | 2,388 | | | 17,366 | | | 44 | | | (234) | | | 155,660 | |
| Operating revenue - affiliated | — | | | 13,548 | | | 10,472 | | | 24,020 | | | 355 | | | (24,375) | | | — | |
| Operating revenue - total | $ | 138,484 | | | $ | 28,526 | | | $ | 12,860 | | | $ | 41,386 | | | $ | 399 | | | $ | (24,609) | | | $ | 155,660 | |
| | | | | | | | | | | | | |
| Benefit expense | $ | 115,869 | | | $ | — | | | $ | 9,667 | | | $ | 9,667 | | | $ | 39 | | | $ | (8,933) | | | $ | 116,642 | |
| Cost of products sold | — | | | 26,544 | | | — | | | 26,544 | | | — | | | (13,509) | | | 13,035 | |
| Operating expense | 16,593 | | 114 | | 2,658 | | 2,772 | | 502 | | (2,167) | | | 17,700 |
| Operating gain (loss) | $ | 6,022 | | | $ | 1,868 | | | $ | 535 | | | $ | 2,403 | | | $ | (142) | | | $ | — | | | $ | 8,283 | |
| | | | | | | | | | | | | |
Elevance Health, Inc.
Notes to Consolidated Financial Statements (continued)
A reconciliation of reportable segments’ operating revenue to the amounts of total revenues included in our consolidated statements of income for the years ended December 31, 2024, 2023 and 2022 is as follows:
| | | | | | | | | | | | | | | | | |
| 2024 | | 2023 | | 2022 |
| Reportable segments’ operating revenues | $ | 175,204 | | | $ | 170,209 | | | $ | 155,660 | |
| Net investment income | 2,051 | | | 1,825 | | | 1,485 | |
| Net losses on financial instruments | (445) | | | (694) | | | (550) | |
| Gain on sale of business | 201 | | | — | | | — | |
| Total revenues | $ | 177,011 | | | $ | 171,340 | | | $ | 156,595 | |
A reconciliation of reportable segments’ operating gain to income before income tax expense included in our consolidated statements of income for the years ended December 31, 2024, 2023 and 2022 is as follows:
| | | | | | | | | | | | | | | | | |
| 2024 | | 2023 | | 2022 |
| Income before income tax expense | $ | 7,904 | | | $ | 7,715 | | | $ | 7,600 | |
| Net investment income | (2,051) | | | (1,825) | | | (1,485) | |
| Net losses on financial instruments | 445 | | | 694 | | | 550 | |
| Gain on sale of business | (201) | | | — | | | — | |
| Interest expense | 1,185 | | | 1,030 | | | 851 | |
| Amortization of other intangible assets | 580 | | | 885 | | | 767 | |
| | | | | |
| Reportable segments’ operating gain | $ | 7,862 | | | $ | 8,499 | | | $ | 8,283 | |
21. Related Party Transactions
We have an equity investment in APC Passe, LLC, which offers Medicaid products in Arkansas. During the years ended December 31, 2024, 2023 and 2022, in the normal course of business, we assumed premiums of $490, $481 and $501, respectively, from APC Passe, LLC, which is included in our total assumed premiums (see Note 17, “Reinsurance”).
In January 2023, we made an equity investment that resulted in our minority interest ownership of Liberty Dental. During the years ended December 31, 2024 and 2023, in the normal course of business, Liberty Dental provided administrative services to our Medicare Advantage members under a capitated arrangement amounting to $519 and $426, respectively, reported in benefit expense.
22. Statutory Information
The majority of our insurance and HMO subsidiaries report their accounts in conformity with accounting practices prescribed or permitted by state insurance regulatory authorities, commonly referred to as statutory accounting, which vary in certain respects from GAAP. However, certain of our insurance and HMO subsidiaries, including Blue Cross of California, Blue Cross of California Partnership Plan, Inc., Carelon Behavioral Health of California, Inc. and Carelon Health of California, Inc. are regulated by the California Department of Managed Health Care (“DMHC”) and report their accounts in conformity with GAAP (these entities are collectively referred to as the “DMHC regulated entities”). Typical differences of GAAP reporting as compared to statutory reporting are the recognition of all assets including those that are non-admitted for statutory purposes and recognition of all deferred tax assets without regard to statutory limits. The National Association of Insurance Commissioners (the “NAIC”) developed a codified version of the statutory accounting principles, designed to foster more consistency among the states for accounting guidelines and reporting. Prescribed statutory accounting practices are set forth in a variety of publications of the NAIC as well as state laws, regulations and general administrative rules.
Our statutory basis insurance and HMO subsidiaries are subject to risk-based capital (“RBC”) requirements. RBC is a method developed by the NAIC to determine the minimum amount of statutory capital appropriate for an insurance company or HMO to support its overall business operations in consideration of its size and risk profile. The formula for determining the amount of RBC specifies various factors, weighted based on the perceived degree of risk, which are applied to certain financial balances and financial activity. Below minimum RBC requirements are classified within certain levels, each of
Elevance Health, Inc.
Notes to Consolidated Financial Statements (continued)
which requires specified corrective action. Additionally, the DMHC regulated entities are subject to capital and solvency requirements as prescribed by the DMHC. As of December 31, 2024 and 2023, all of our regulated subsidiaries exceeded the minimum applicable mandatory RBC requirements and/or capital and solvency requirements of their applicable governmental regulator.
The statutory RBC necessary to satisfy regulatory requirements of our statutory basis insurance and HMO subsidiaries was approximately $8,100 and $7,800 as of December 31, 2024 and 2023, respectively. The tangible net equity required for the DMHC regulated entities was approximately $970 and $950 as of December 31, 2024 and 2023, respectively. Statutory-basis capital and surplus of our insurance and HMO subsidiaries and capital and surplus of our other regulated subsidiaries, excluding the DMHC regulated entities, was $18,668 and $19,808 at December 31, 2024 and 2023, respectively. GAAP equity of the DMHC regulated entities was $3,817 and $3,975 at December 31, 2024 and 2023, respectively.
Our ability to pay dividends and credit obligations is significantly dependent on receipt of dividends from our subsidiaries. The payment of dividends to us by our insurance and HMO subsidiaries without prior approval of the insurance departments of each subsidiary’s domiciliary jurisdiction is limited by formula. Dividends in excess of these amounts are subject to prior approval by the respective state insurance departments or the DMHC. During 2024, our insurance and HMO subsidiaries paid aggregate cash dividends of $6,322 to the parent company, including cash dividends which required prior approval from regulatory authorities. We currently estimate that approximately $2,700 of dividends will be paid to the parent company in 2025.
ITEM 9. CHANGES IN AND DISAGREEMENTS WITH ACCOUNTANTS ON ACCOUNTING AND FINANCIAL DISCLOSURE.
There have been no changes in or disagreements with our independent registered public accounting firm on accounting or financial disclosures.
ITEM 9A. CONTROLS AND PROCEDURES.
Evaluation of Disclosure Controls and Procedures
We carried out an evaluation as of December 31, 2024, under the supervision and with the participation of our management, including our Chief Executive Officer and Chief Financial Officer, of the effectiveness of the design and operation of our disclosure controls and procedures as defined in Rule 13a-15(e) of the Exchange Act. Based upon that evaluation, our Chief Executive Officer and Chief Financial Officer concluded that our disclosure controls and procedures are effective in timely alerting them to material information relating to us (including our consolidated subsidiaries) required to be disclosed in our reports under the Exchange Act. In addition, based on that evaluation, our Chief Executive Officer and Chief Financial Officer concluded that our disclosure controls and procedures were effective in ensuring that information required to be disclosed by us in the reports that we file or submit under the Exchange Act is accumulated and communicated to our management, including our Chief Executive Officer and Chief Financial Officer, as appropriate to allow timely decisions regarding required disclosures.
Management’s Report on Internal Control over Financial Reporting
Management, under the supervision and with the participation of the principal executive officer and principal financial officer, of Elevance Health, Inc. (the “Company”) is responsible for establishing and maintaining effective internal control over financial reporting (“Internal Control”), as such term is defined in the Exchange Act. The Company’s Internal Control is designed to provide reasonable assurance regarding the reliability of the Company’s financial reporting and the preparation of financial statements for external reporting purposes in accordance with GAAP. The Company’s Internal Control includes those policies and procedures that (i) pertain to the maintenance of records that in reasonable detail accurately and fairly reflect the transactions and dispositions of the assets of the Company; (ii) provide reasonable assurance that transactions are recorded as necessary to permit preparation of financial statements in accordance with GAAP, and that receipts and expenditures of the Company are being made only in accordance with authorizations of management and directors of the Company; and (iii) provide reasonable assurance regarding prevention or timely detection of unauthorized acquisition, use or disposition of the Company’s assets that could have a material effect on the financial statements.
Because of inherent limitations in any Internal Control, no matter how well designed, misstatements due to error or fraud may occur and not be detected. Accordingly, even effective Internal Control can provide only reasonable assurance regarding the reliability of financial reporting and the preparation of financial statements for external purposes in accordance with GAAP.
Management, under the supervision and with the participation of the principal executive officer and principal financial officer, assessed the effectiveness of the Company’s Internal Control as of December 31, 2024. Management’s assessment was based on criteria established in Internal Control—Integrated Framework (2013) issued by the Committee of Sponsoring Organizations of the Treadway Commission.
The Company completed its acquisitions of Paragon Healthcare, Inc., Centers Plan for Healthy Living LLC, Centers for Specialty Care Group IPA, LLC, and RSV QOZB LTSS, Inc. and certain of its affiliated entities in 2024. As permitted by the U.S. Securities and Exchange Commission, management's assessment as of December 31, 2024 did not include the Internal Control of these acquired entities, which are included in the Company's consolidated financial statements as of December 31, 2024. Such operations of Paragon Healthcare, Inc., Centers Plan for Health Living LLC, Centers for Specialty Care Group IPA, LLC, and RSV QOZB LTSS, Inc. and certain of its affiliated entities constituted 5% of the Company's total assets and 11% of the Company's net assets, respectively, as of December 31, 2024 and 1% of the Company's total revenues and 0% of the Company's net income, respectively, for the year then ended.
Based on management’s assessment, management has concluded that the Company’s Internal Control was effective as of December 31, 2024 to provide reasonable assurance regarding the reliability of financial reporting and the preparation of financial statements for external reporting purposes in accordance with GAAP.
Ernst & Young LLP, the Company’s independent registered public accounting firm, has audited the consolidated financial statements of the Company for the year ended December 31, 2024, and has also issued an audit report dated February 20, 2025, on the effectiveness of the Company’s Internal Control as of December 31, 2024, which is included in this Annual Report on Form 10-K.
| | | | | | | | |
/S/ GAIL K. BOUDREAUX | | /S/ MARK B. KAYE |
| President and Chief Executive Officer | | Executive Vice President and Chief Financial Officer |
Changes in Internal Control over Financial Reporting
There have been no changes in our internal control over financial reporting that occurred during the three months ended December 31, 2024 that have materially affected, or are reasonably likely to materially affect, our internal control over financial reporting.
Report of Independent Registered Public Accounting Firm
To the Shareholders and the Board of Directors of Elevance Health, Inc.
Opinion on Internal Control Over Financial Reporting
We have audited Elevance Health, Inc.’s internal control over financial reporting as of December 31, 2024, based on criteria established in Internal Control—Integrated Framework issued by the Committee of Sponsoring Organizations of the Treadway Commission (2013 framework) (the COSO criteria). In our opinion, Elevance Health, Inc. (the Company) maintained, in all material respects, effective internal control over financial reporting as of December 31, 2024, based on the COSO criteria.
As indicated in the accompanying Management's Report on Internal Control over Financial Reporting, management's assessment of and conclusion on the effectiveness of internal control over financial reporting did not include the internal controls of Paragon Healthcare, Inc., Centers Plan for Healthy Living LLC, Centers for Specialty Care Group IPA, LLC, and RSV QOZB LTSS, Inc. and certain affiliated entities, which are included in the 2024 consolidated financial statements of the Company and constituted 5% and 11% of total and net assets, respectively, as of December 31, 2024 and 1% and 0% of revenues and net income, respectively, for the year then ended. Our audit of internal control over financial reporting of the Company also did not include an evaluation of the internal control over financial reporting of Paragon Healthcare, Inc., Centers Plan for Healthy Living LLC, Centers for Specialty Care Group IPA, LLC, and RSV QOZB LTSS, Inc. and certain affiliated entities.
We also have audited, in accordance with the standards of the Public Company Accounting Oversight Board (United States) (PCAOB), the consolidated balance sheets of Elevance Health, Inc. as of December 31, 2024 and 2023, the related consolidated statements of income, comprehensive income, cash flows and shareholders’ equity for each of the three years in the period ended December 31, 2024, and the related notes and financial statement schedule listed in the Index at Item 15(c) and our report dated February 20, 2025 expressed an unqualified opinion thereon.
Basis for Opinion
The Company’s management is responsible for maintaining effective internal control over financial reporting and for its assessment of the effectiveness of internal control over financial reporting included in the accompanying Management’s Report on Internal Control over Financial Reporting. Our responsibility is to express an opinion on the Company’s internal control over financial reporting based on our audit. We are a public accounting firm registered with the PCAOB and are required to be independent with respect to the Company in accordance with the U.S. federal securities laws and the applicable rules and regulations of the Securities and Exchange Commission and the PCAOB.
We conducted our audit in accordance with the standards of the PCAOB. Those standards require that we plan and perform the audit to obtain reasonable assurance about whether effective internal control over financial reporting was maintained in all material respects.
Our audit included obtaining an understanding of internal control over financial reporting, assessing the risk that a material weakness exists, testing and evaluating the design and operating effectiveness of internal control based on the assessed risk, and performing such other procedures as we considered necessary in the circumstances. We believe that our audit provides a reasonable basis for our opinion.
Definition and Limitations of Internal Control Over Financial Reporting
A company’s internal control over financial reporting is a process designed to provide reasonable assurance regarding the reliability of financial reporting and the preparation of financial statements for external purposes in accordance with generally accepted accounting principles. A company’s internal control over financial reporting includes those policies and procedures that (1) pertain to the maintenance of records that, in reasonable detail, accurately and fairly reflect the transactions and dispositions of the assets of the company; (2) provide reasonable assurance that transactions are recorded as necessary to permit preparation of financial statements in accordance with generally accepted accounting principles, and that receipts and expenditures of the company are being made only in accordance with authorizations of management and directors of the company; and (3) provide reasonable assurance regarding prevention or timely detection of unauthorized acquisition, use, or disposition of the company’s assets that could have a material effect on the financial statements.
Because of its inherent limitations, internal control over financial reporting may not prevent or detect misstatements. Also, projections of any evaluation of effectiveness to future periods are subject to the risk that controls may become inadequate because of changes in conditions, or that the degree of compliance with the policies or procedures may deteriorate.
/s/ Ernst & Young LLP
Indianapolis, Indiana
February 20, 2025
ITEM 9B. OTHER INFORMATION.
Rule 10b5-1 Trading Plans
During the three months ended December 31, 2024, none of our directors or officers (as defined in Rule-1(f) of the Exchange Act) adopted, modified or terminated a “Rule 10b5-1 trading arrangement” or “non-Rule 10b5-1 trading arrangement”, as each term is defined in Item 408 of Regulation S-K.
ITEM 9C. DISCLOSURE REGARDING FOREIGN JURISDICTIONS THAT PREVENT INSPECTIONS.
None.
PART III
ITEM 10. DIRECTORS, EXECUTIVE OFFICERS AND CORPORATE GOVERNANCE.
We have adopted an insider trading policy governing the purchase, sale and other dispositions of our securities that applies to all directors, officers and employees. We also follow procedures for the repurchase of our securities. We believe our insider trading policy and repurchase procedures are reasonably designed to promote compliance with insider trading laws, rules and regulations and listing standards of the New York Stock Exchange applicable to us. A copy of our insider trading policy is filed as Exhibit 19.1 to this Form 10-K.
The information required by this Item concerning our Executive Officers is included in Part I, Item 1, “Business - Information about our Executive Officers.”
The information required by this Item concerning our Directors and nominees for Director, information about our Audit Committee members and financial expert(s), disclosure of any delinquent filers under Section 16(a) of the Exchange Act and our Code of Conduct is incorporated herein by reference from our definitive Proxy Statement for our 2025 Annual Meeting of Shareholders, which will be filed with the SEC pursuant to Regulation 14A within 120 days after the end of our last fiscal year.
ITEM 11. EXECUTIVE COMPENSATION.
The information required by this Item concerning remuneration of our Executive Officers and Directors, material transactions involving such Executive Officers and Directors and Compensation Committee interlocks, as well as the Compensation and Talent Committee Report and the CEO pay ratio are incorporated herein by reference from our definitive Proxy Statement for our 2025 Annual Meeting of Shareholders, which will be filed with the SEC pursuant to Regulation 14A within 120 days after the end of our last fiscal year.
ITEM 12. SECURITY OWNERSHIP OF CERTAIN BENEFICIAL OWNERS AND MANAGEMENT AND RELATED STOCKHOLDER MATTERS.
Securities Authorized for Issuance under Equity Compensation Plans
Securities authorized for issuance under our equity compensation plans as of December 31, 2024 are as follows:
| | | | | | | | | | | |
Plan Category1 | Number of securities to be issued upon exercise of outstanding options, warrants and rights2 (a) | Weighted-average exercise price of outstanding options, warrants and rights3 (b) | Number of securities remaining available for future issuance under equity compensation plans (excluding securities reflected in column (a))4 (c) |
| Equity compensation plans approved by shareholders as of December 31, 2024 | 4,415,217 | $361.36 | 14,215,732 |
| | | |
| | | |
1We have no equity compensation plans pursuant to which awards may be granted in the future that have not been approved by shareholders.
2Includes shares that may be issued under the Elevance Health Incentive Compensation Plan and the 2017 Elevance Health Incentive Compensation Plan pursuant to the following outstanding awards: 2,863,293 stock options, 500,096 unvested restricted stock units, and 1,051,828 performance stock units (assuming that the outstanding performance stock units are earned at the maximum award level).
3Represents the weighted average exercise price of outstanding stock options. Does not take into consideration outstanding restricted stock units or performance stock units, which, once vested, may be converted into shares of our common stock on a one-for-one basis upon distribution at no additional cost.
4Excludes securities reflected in the first column, “Number of securities to be issued upon exercise of outstanding options, warrants and rights.” Includes 10,204,347 shares of common stock available for issuance as stock options, restricted stock awards, performance stock awards, performance awards and stock appreciation rights under the 2017 Elevance Health Incentive Compensation Plan at December 31, 2024. Includes 4,011,385 shares of common stock available for issuance under the Stock Purchase Plan at December 31, 2024.
The information required by this Item concerning the stock ownership of management and five percent beneficial owners is incorporated herein by reference from our definitive Proxy Statement for our 2025 Annual Meeting of Shareholders, which will be filed with the SEC pursuant to Regulation 14A within 120 days after the end of our last fiscal year.
ITEM 13. CERTAIN RELATIONSHIPS AND RELATED TRANSACTIONS, AND DIRECTOR INDEPENDENCE.
The information required by this Item concerning certain relationships and related person transactions and Director independence is incorporated herein by reference from our definitive Proxy Statement for our 2025 Annual Meeting of Shareholders, which will be filed with the SEC pursuant to Regulation 14A within 120 days after the end of our last fiscal year.
ITEM 14. PRINCIPAL ACCOUNTANT FEES AND SERVICES.
The information required by this Item concerning principal accountant fees and services is incorporated herein by reference from our definitive Proxy Statement for our 2025 Annual Meeting of Shareholders, which will be filed with the SEC pursuant to Regulation 14A within 120 days after the end of our last fiscal year.
PART IV
ITEM 15. EXHIBITS AND FINANCIAL STATEMENT SCHEDULES.
(a) 1. Financial Statements:
The following consolidated financial statements of the Company are set forth in Part II, Item 8:
Report of Independent Registered Public Accounting Firm
Consolidated Balance Sheets as of December 31, 2024 and 2023
Consolidated Statements of Income for the years ended December 31, 2024, 2023, and 2022
Consolidated Statements of Comprehensive Income for the years ended December 31, 2024, 2023, and 2022
Consolidated Statements of Cash Flows for the years ended December 31, 2024, 2023 and 2022
Consolidated Statements of Shareholders’ Equity for the years ended December 31, 2024, 2023 and 2022
Notes to Consolidated Financial Statements
2. Financial Statement Schedule:
The following financial statement schedule of the Company is included in Item 15(c):
Schedule II—Condensed Financial Information of Registrant (Parent Company Only).
All other schedules for which provision is made in the applicable accounting regulations of the SEC are not required under the related instructions, are inapplicable, or the required information is included in the consolidated financial statements, and therefore, have been omitted.
3. Exhibits required to be filed as part of this report:
| | | | | | | | | | | | | | |
Exhibit Number | | Exhibit | |
| | | | |
| 3.1 | | | |
| | | | |
| 3.2 | | | |
| | | | |
| 4.1 | | | |
| | | | |
| 4.2 | | | |
| | | | |
| | (a) | | |
| | | | |
| | (b) | | |
| | | | |
| | (c) | | |
| | | |
| | (d) | | |
| | | |
| | (e) | | |
| | | |
| | | | | | | | | | | | | | |
Exhibit Number | | Exhibit | |
| | | | |
| | (f) | | |
| | | | |
| | | | |
| | (g) | | |
| | | | |
| | (h) | | |
| | | | |
| 4.3 | | | |
| | | | |
| 4.4 | | | |
| | | | |
| | (a) | | |
| | | | |
| | (b) | | |
| | | | |
| | (c) | | |
| | | | |
| | (d) | | |
| | | | |
| | (e) | | |
| | | | |
| | (f) | | |
| | | | |
| | (g) | | |
| | | | |
| | (h) | | |
| | | | |
| | (i) | | |
| | | | |
| | (j) | | |
| | | | |
| | (k) | | |
| | | | |
| | (l) | | |
| | | | |
| | (m) | | |
| | | | |
| | (n) | | |
| | | | |
| | (o) | | |
| | | | |
| | (p) | | |
| | | | |
| | | | | | | | | | | | | | |
Exhibit Number | | Exhibit | |
| | | | |
| | (q) | | |
| | | | |
| | (r) | | |
| | | | |
| | (s) | | |
| | | | |
| | (t) | | |
| | | | |
| | (u) | | |
| | | | |
| | (v) | | |
| | | | |
| | (w) | | |
| | | | |
| | (x) | | |
| | | | |
| | (y) | | |
| | | | |
| | (z) | | |
| | | | |
| | (aa) | | |
| | | | |
| | (bb) | | |
| | | | |
| | (cc) | | |
| | | | |
| 4.5 | | Upon the request of the Securities and Exchange Commission, the Company will furnish copies of any other instruments defining the rights of holders of long-term debt of the Company or its subsidiaries. | |
| | | | |
| 4.6 | | | |
| | | | |
| 10.1 | * | | |
| | | | |
| | (a) | | |
| | | |
| 10.2 | | * | | |
| | | |
| | (a) | | |
| | | |
| | (b) | | |
| | | | |
| | | | | | | | | | | | | | |
Exhibit Number | | Exhibit | |
| | | | |
| | (c) | | |
| | | | |
| | (d) | | |
| | | | |
| | (e) | | |
| | | | |
| | (f) | | |
| | | | |
| | (g) | | |
| | | | |
| | (h) | | |
| | | | |
| | (i) | | |
| | | | |
| | (j) | | |
| | (k) | | |
| | | | |
| | (l) | | |
| | | | |
| | (m) | | |
| | | | |
| | (n) | | |
| | | | |
| | (o) | | |
| | | | |
| | (p) | | |
| | | | |
| 10.3 | | * | | |
| | |
| 10.4 | * | | |
| | |
| | | | | | | | | | | | | | |
Exhibit Number | | Exhibit | |
| | | | |
| 10.5 | * | | |
| | |
| 10.6 | * | | |
| | |
| 10.7 | * | | |
| | |
| 10.8 | * | | |
| | |
| 10.9 | * | (a) | | |
| | | |
| | (b) | | |
| | | | |
| | (c) | | |
| | | | |
| | (d) | | |
| | | | |
| 10.10 | * | | |
| | | | |
| 10.11 | * | | |
| | | | |
| 10.12 | | | |
| | |
| 10.13 | | | |
| | | |
| 19.1 | | | |
| | | |
| 21 | | | |
| | |
| 23 | | | |
| | |
| 31.1 | | | |
| | |
| 31.2 | | | |
| | |
| 32.1 | | | |
| | |
| 32.2 | | | |
| | |
| 97.1 | | | |
| | | | |
| | | | | | | | | | | | | | |
Exhibit Number | | Exhibit | |
| | | | |
| 101.INS | | XBRL Instant Document - the instant document does not appear in the Interactive Data File because its XBRL tags are embedded within the Inline XBRL document. | |
| | | | |
| 101.SCH | | Inline XBRL Taxonomy Extension Schema Document. | |
| | | | |
| 101.CAL | | Inline XBRL Taxonomy Extension Calculation Linkbase Document. | |
| | | | |
| 101.DEF | | Inline XBRL Taxonomy Extension Definition Linkbase Document. | |
| | | | |
| 101.LAB | | Inline XBRL Taxonomy Extension Label Linkbase Document. | |
| | | | |
| 101.PRE | | Inline XBRL Taxonomy Extension Presentation Linkbase Document. | |
| | | | |
| 104 | | | Cover Page Interactive Data File formatted in Inline XBRL and contained in Exhibit 101. | |
| | | | |
| | | | |
| * | | Indicates management contracts or compensatory plans or arrangements. | |
(b) Exhibits
The response to this portion of Item 15 is set forth in paragraph (a) 3 above.
(c) Financial Statement Schedule
Schedule II—Condensed Financial Information of Registrant (Parent Company Only).
ITEM 16. FORM 10-K SUMMARY.
None.
Schedule II—Condensed Financial Information of Registrant
Elevance Health, Inc. (Parent Company Only)
Balance Sheets
| | | | | | | | | | | |
| (In millions, except share data) | December 31,
2024 | | December 31,
2023 |
| Assets | | | |
| Current assets: | | | |
| Cash and cash equivalents | $ | 1,870 | | | $ | 1,483 | |
| | | |
| | | |
| Equity securities | 487 | | | 80 | |
| | | |
| Other receivables | 49 | | | 58 | |
| | | |
| Net due from subsidiaries | 4,697 | | | — | |
| | | |
| Other current assets | 705 | | | 959 | |
| Total current assets | 7,808 | | | 2,580 | |
| Other invested assets | 3,636 | | | 822 | |
| Property and equipment, net | 159 | | | 178 | |
| Deferred tax assets, net | — | | | 199 | |
| Investments in subsidiaries | 63,173 | | | 63,426 | |
| Other noncurrent assets | 584 | | | 217 | |
| Total assets | $ | 75,360 | | | $ | 67,422 | |
| Liabilities and shareholders’ equity | | | |
| Liabilities | | | |
| Current liabilities: | | | |
| Accounts payable and accrued expenses | $ | 737 | | | $ | 1,709 | |
| | | |
| | | |
| | | |
| Net due to subsidiaries | — | | | 734 | |
| Current portion of long-term debt | 1,649 | | | 1,649 | |
| Other current liabilities | 610 | | | 413 | |
| Total current liabilities | 2,996 | | | 4,505 | |
| Long-term debt, less current portion | 29,193 | | | 23,221 | |
| Deferred tax liabilities, net | 55 | | | — | |
| Other noncurrent liabilities | 1,801 | | | 390 | |
| Total liabilities | 34,045 | | | 28,116 | |
| Commitments and contingencies—Note 5 | | | |
| Shareholders’ equity | | | |
| Preferred stock, without par value, shares authorized - 100,000,000; shares issued and outstanding - none | — | | | — | |
| Common stock, par value $0.01, shares authorized - 900,000,000; shares issued and outstanding - 227,479,695 and 233,071,088 | 2 | | | 2 | |
| Additional paid-in capital | 8,911 | | | 8,868 | |
| Retained earnings | 33,549 | | | 31,749 | |
| Accumulated other comprehensive loss | (1,147) | | | (1,313) | |
| Total shareholders’ equity | 41,315 | | | 39,306 | |
| Total liabilities and shareholders’ equity | $ | 75,360 | | | $ | 67,422 | |
See accompanying notes.
Elevance Health, Inc. (Parent Company Only)
Statements of Income
| | | | | | | | | | | | | | | | | |
| Years ended December 31 |
| (In millions) | 2024 | | 2023 | | 2022 |
| Revenues | | | | | |
| Net investment income | $ | 110 | | | $ | 25 | | | $ | 4 | |
| Net (losses) gains on financial instruments | (23) | | | (100) | | | 2 | |
| Service fees | 9 | | | 8 | | | 7 | |
| Total revenues (losses) | 96 | | | (67) | | | 13 | |
| Expenses | | | | | |
| Operating expense | 279 | | | 352 | | | 188 | |
| Interest expense | 1,172 | | | 1,017 | | | 845 | |
| | | | | |
| Total expenses | 1,451 | | | 1,369 | | | 1,033 | |
| Loss before income tax credits and equity in net income of subsidiaries | (1,355) | | | (1,436) | | | (1,020) | |
| Income tax credits | (477) | | | (214) | | | (461) | |
| Equity in net income of subsidiaries | 6,858 | | | 7,209 | | | 6,453 | |
| Shareholders’ net income | $ | 5,980 | | | $ | 5,987 | | | $ | 5,894 | |
See accompanying notes.
Elevance Health, Inc. (Parent Company Only)
Statements of Comprehensive Income
| | | | | | | | | | | | | | | | | |
| Years ended December 31 |
| (in millions) | 2024 | | 2023 | | 2022 |
| Shareholders’ net income | $ | 5,980 | | | $ | 5,987 | | | $ | 5,894 | |
| Other comprehensive income (loss), net of tax: | | | | | |
| Change in net unrealized gains/losses on investments | 109 | | | 1,123 | | | (2,249) | |
| Change in non-credit component of impairment losses on investments | 1 | | | — | | | (3) | |
| Change in net unrealized gains/losses on cash flow hedges | 4 | | | 18 | | | 10 | |
| Change in net periodic pension and other benefit costs | 60 | | | 40 | | | (70) | |
| Change in future policy benefits | (2) | | | (3) | | | 32 | |
| Foreign currency translation adjustments | (6) | | | (1) | | | (13) | |
| Other comprehensive income (loss) | 166 | | | 1,177 | | | (2,293) | |
| Total shareholders’ comprehensive income | $ | 6,146 | | | $ | 7,164 | | | $ | 3,601 | |
See accompanying notes.
Elevance Health, Inc. (Parent Company Only)
Statements of Cash Flows
| | | | | | | | | | | | | | | | | |
| Years ended December 31 |
| (In millions) | 2024 | | 2023 | | 2022 |
| | | | | |
| | | | | |
| | | | | |
| | | | | |
| | | | | |
| | | | | |
| | | | | |
| | | | | |
| | | | | |
| | | | | |
| | | | | |
| | | | | |
| | | | | |
| | | | | |
| | | | | |
| | | | | |
| | | | | |
| | | | | |
| | | | | |
| | | | | |
| | | | | |
| | | | | |
| | | | | |
| | | | | |
| Net cash provided by operating activities | $ | 1,451 | | | $ | 4,113 | | | $ | 1,447 | |
| Investing activities | | | | | |
| Purchases of investments | (3,240) | | | (95) | | | (367) | |
| Proceeds from sales, maturities, calls and redemptions of investments | 1,567 | | | 212 | | | 618 | |
| | | | | |
| Repayment of note to subsidiary | — | | | — | | | 1,500 | |
| Capitalization of subsidiaries | (324) | | | (363) | | | (411) | |
| Changes in securities lending collateral | (16) | | | 42 | | | 36 | |
| | | | | |
| Purchases of property and equipment, net of sales | (36) | | | (55) | | | (47) | |
| | | | | |
| Net cash (used in) provided by investing activities | (2,049) | | | (259) | | | 1,329 | |
| Financing activities | | | | | |
| Net repayments of short-term borrowings | — | | | — | | | (300) | |
| Proceeds from long-term borrowings | 7,710 | | | 2,574 | | | 3,071 | |
| Repayments of long-term borrowings | (1,650) | | | (1,909) | | | (1,899) | |
| Changes in securities lending payable | 16 | | | (42) | | | (36) | |
| | | | | |
| | | | | |
| | | | | |
| Repurchase and retirement of common stock | (2,900) | | | (2,676) | | | (2,316) | |
| | | | | |
| Cash dividends | (1,586) | | | (1,466) | | | (1,290) | |
| Proceeds from issuance of common stock under employee stock plans | 221 | | | 152 | | | 182 | |
| Taxes paid through withholding of common stock under employee stock plans | (109) | | | (99) | | | (93) | |
| Other, net | (717) | | | 153 | | | 217 | |
| Net cash provided by (used in) financing activities | 985 | | | (3,313) | | | (2,464) | |
| Change in cash and cash equivalents | 387 | | | 541 | | | 312 | |
| Cash and cash equivalents at beginning of year | 1,483 | | | 942 | | | 630 | |
| Cash and cash equivalents at end of year | $ | 1,870 | | | $ | 1,483 | | | $ | 942 | |
See accompanying notes.
Elevance Health, Inc.
(Parent Company Only)
Notes to Condensed Financial Statements
December 31, 2024
(In Millions, Except Per Share Data)
1. Basis of Presentation and Significant Accounting Policies
In the parent company only financial statements of Elevance Health, Inc. (“Elevance Health”), Elevance Health’s investment in subsidiaries is stated at cost plus equity in undistributed earnings of the subsidiaries. Elevance Health’s share of net income of its unconsolidated subsidiaries is included in income using the equity method of accounting.
Certain amounts presented in the parent company only financial statements are eliminated in the consolidated financial statements of Elevance Health.
Elevance Health’s parent company only financial statements should be read in conjunction with Elevance Health’s audited consolidated financial statements and the accompanying notes included in Part II, Item 8 of this Annual Report on Form 10-K.
2. Subsidiary Transactions
Dividends from Subsidiaries
Elevance Health received cash dividends from subsidiaries of $6,322, $4,909 and $3,097 during 2024, 2023 and 2022, respectively.
Dividends to Subsidiaries
Certain subsidiaries of Elevance Health own shares of Elevance Health common stock. Elevance Health paid cash dividends to subsidiaries related to these shares of common stock in the amount of $78, $71 and $61 during 2024, 2023 and 2022, respectively.
Investments in Subsidiaries
Capital contributions to subsidiaries were $324, $363 and $411 during 2024, 2023 and 2022, respectively.
Amounts Due From and To Subsidiaries
At December 31, 2024 and 2023, Elevance Health reported amounts due from and (to) subsidiaries of $4,697 and $(734), respectively. The amounts due from and (to) subsidiaries primarily include amounts for allocated operating expenses or daily cash management activities. These items are routinely settled, and as such, are classified as current liabilities or assets.
In June 2021 Elevance Health entered into a short-term loan agreement with a subsidiary for the amount of $1,500. This loan was repaid in February 2022.
Guarantees on Behalf of Subsidiaries
Elevance Health guarantees contractual or financial obligations or solvency requirements for certain of its subsidiaries. These guarantees approximated $912 at December 31, 2024. There were no payments made on these guarantees in 2024.
3. Derivative Financial Instruments
The information regarding derivative financial instruments contained in Note 6, “Derivative Financial Instruments,” of the Notes to Consolidated Financial Statements of Elevance Health and its subsidiaries, included in Part II, Item 8 of this Annual Report on Form 10-K, is incorporated herein by reference.
4. Long-Term Debt
The information regarding long-term debt contained in Note 13, “Debt,” of the Notes to Consolidated Financial Statements of Elevance Health and its subsidiaries, included in Part II, Item 8 of this Annual Report on Form 10-K, is incorporated herein by reference.
5. Commitments and Contingencies
The information regarding commitments and contingencies contained in Note 14, “Commitments and Contingencies,” of the Notes to Consolidated Financial Statements of Elevance Health and its subsidiaries, included in Part II, Item 8 of this Annual Report on Form 10-K, is incorporated herein by reference.
6. Capital Stock
The information regarding capital stock contained in Note 15, “Capital Stock,” of the Notes to Consolidated Financial Statements of Elevance Health and its subsidiaries, included in Part II, Item 8 of this Annual Report on Form 10-K, is incorporated herein by reference.
SIGNATURES
Pursuant to the requirements of Section 13 or 15(d) of the Securities Exchange Act of 1934, the registrant has duly caused this report to be signed on its behalf by the undersigned, thereunto duly authorized.
| | | | | |
ELEVANCE HEALTH, INC. |
| |
| By: | /s/ GAIL K. BOUDREAUX |
| Gail K. Boudreaux
President and Chief Executive Officer |
Dated: February 20, 2025
Pursuant to the requirements of the Securities Exchange Act of 1934, this report has been signed below by the following persons on behalf of the registrant and in the capacities and on the dates indicated.
| | | | | | | | | | | |
| Signature | | Title | Date |
| /s/ GAIL K. BOUDREAUX | | President and Chief Executive Officer, Director
(Principal Executive Officer) | February 20, 2025 |
| Gail K. Boudreaux | | | |
| /s/ MARK B. KAYE | | Executive Vice President and Chief Financial Officer (Principal Financial Officer) | February 20, 2025 |
| Mark B. Kaye | | | |
| /s/ RONALD W. PENCZEK | | Chief Accounting Officer and Controller (Principal Accounting Officer) | February 20, 2025 |
| Ronald W. Penczek | | | |
| /s/ ELIZABETH E. TALLETT | | Chair of the Board | February 20, 2025 |
| Elizabeth E. Tallett | | | |
| /s/ R. KERRY CLARK | | Director | February 20, 2025 |
| R. Kerry Clark | | | |
| /s/ SUSAN D. DEVORE | | Director | February 20, 2025 |
| Susan D. DeVore | | | |
| /s/ ROBERT L. DIXON, JR. | | Director | February 20, 2025 |
| Robert L. Dixon, Jr. | | | |
| /s/ LEWIS HAY III | | Director | February 20, 2025 |
| Lewis Hay III | | | |
| /s/ BAHIJA JALLAL | | Director | February 20, 2025 |
| Bahija Jallal | | | |
| /s/ ANTONIO F. NERI | | Director | February 20, 2025 |
| Antonio F. Neri | | | |
| /s/ RAMIRO G. PERU | | Director | February 20, 2025 |
| Ramiro G. Peru | | | |
| /s/ RYAN M. SCHNEIDER | | Director | February 20, 2025 |
| Ryan M. Schneider | | | |
| /s/ DEANNA D. STRABLE | | Director | February 20, 2025 |
| Deanna D. Strable | | | |