
July 11, 2008
John Hartz
United States
Securities and Exchange Commission
100 F Street, N.E., Stop 7010
Washington, D.C. 20549
|
| Re: |
| Form 10-K for the fiscal year ended December 31, 2007 |
|
|
|
| Form 10-Q for the period ended March 31, 2008 |
|
|
|
| File No. 0-50254 |
Dear Mr. Hartz:
We are in receipt of your letter dated May 27, 2008, providing comments on our Form 10-K for our fiscal year ended December 31, 2007 and our Form 10-Q for the three month period ended March 31, 2008. We have reviewed your comments and the purpose of this letter is to provide our responses to your comments. In order to facilitate your review of our responses, set forth below is each of your comments in chronological order immediately followed by our response.
FORM 10-K FOR THE YEAR ENDED DECEMBER 31, 2007
General
1. Where a comment below requests additional disclosures or other revisions to be made, please show us in your supplemental response what the revisions will look like. These revisions should be included in your future filings.
Business
2. Considering the nature of your raw materials and your end products, it appears that relevant market data concerning your basic inputs and outputs will make the disclosures about your business more meaningful to readers, by providing more context. Please provide disclosures showing the most relevant comparable market prices of the following items over time, including the three years presented:
· Ethanol;
· Distillers Grains, by type;
· Corn;
· Natural Gas.
RESPONSE: In future filings we will disclose the relevant comparable market prices of ethanol, distillers grains, corn and natural gas. Due to the fact that the distillers grains and ethanol markets are somewhat less developed than other markets, it may be difficult to establish reliable market price data for our products. Please see Exhibit A for examples of disclosures we anticipate making regarding the market prices for ethanol, distillers grains, corn and natural gas. These disclosures will be in addition to the disclosures that we have currently made in our Form 10-K.
Management Discussion and Analysis of Financial Condition and Results of Operations, page 25
3. We note that you include certain percentage increases and decreases in volumes for your revenues and costs of revenues. In future filings in order to provide a more clear understanding of your revenues and cost of revenues, please present your actual volume and actual price information for each period presented for the following items:
· Volumes sold and average selling price of ethanol;
· Volumes sold and average selling price for each type of distiller’s grain;
· Volumes used and average price per bushel of corn;
· Volumes used and average price of natural gas.
RESPONSE: In future filings we will not only provide the percentage changes in the volumes and average prices of our ethanol, distillers grains, corn, and natural gas, but will also provide the actual volume changes and price changes we experienced. Please see Exhibit B for examples of disclosures we anticipate making regarding the volumes sold and average price of ethanol, distillers grains, corn and natural gas in future filings. These disclosures will be in addition to the disclosures we have currently made in our Form 10-K.
4. Considering the proportional calculations of corn and natural gas costs in 2007 and 2006, it appears that costs unrelated to corn and natural gas increased by almost $6 million. Please explain this increase to us and in future filings, discuss all substantial increase in costs of revenue.
RESPONSE: For the year ended December 31, 2007, the Company’s cost of revenues increased $30.2 million over the prior year. This increase in the cost of revenues was a result of an increase to corn costs including derivative instruments of $35.8 million offset by a decrease in natural gas costs including derivative instruments of $3.4 million and a decrease in maintenance and other costs of $2.2 million.
We will make similar disclosures in future filings.
5. We note that your results of operations are materially impacted by the price of raw materials, in particular the price of corn. We also note general narrative disclosures concerning your use of derivatives and the overall impact of such instruments on pages 37 and 48. However, your discussions do not address in particular the underlying reasons such instruments impacted each year by the amounts disclosed. In other words, there is no analysis as to why you were impacted so heavily by the increase in corn prices in 2007 and the impact of your derivative contracts was so minimal. For example, it is unclear whether your positions were too small relative to raw material needs, or whether your strategies and assumptions resulted in less favorable impacts. In contrast, during a period of lower corn prices in 2006, you were materially and favorably impacted by the use of such instruments.
We also note that in the first quarter of 2008 you disclose that the 41% increase in corn prices was offset by your hedge position. You do not explain why your hedges did not offset the price increases in the comparable period in 2007. Comparative analysis should take into account all activities for each period. Considering how important such instruments are to your results of operations, their impact should be carefully analyzed. Please explain to us and revise future filings to provide a transparent analysis explaining to readers the impact of derivatives for each year and the underlying reasons for such impact.
Finally, at each reporting date, you should report the notional amounts of your derivatives by type, the basic terms and pricing of your contracts, and in MD&A explain your basic hedge position with regards to raw material costs. See Item 305 of Regulation S-K for more guidance on quantitative and qualitative disclosures about market risk.
RESPONSE: As the corn market prices increased over the course of 2006 and 2007 our cost of revenues increased. Our corn purchases increased from $34.8 million in 2006 to $56.7 million in 2007. The impact of the derivative instruments to the corn costs for the year ended December 2007 was a decrease to the cost of revenues of $1.4 million compared to a decrease of $15.3 million in 2006. The impact of the derivative instruments was different in 2007 compared to 2006 as we had taken a much larger position relative to our corn needs in 2006. Our 2007 derivative instruments resulted in less favorable impacts compared to the 2006 derivative instruments also.
With respect to our March 31, 2008 quarter, we had a much larger derivative position on corn compared to our corn usage as compared to the same quarter of 2007. The price of corn was falling slightly during our first fiscal quarter of 2007 while the market price of corn was increasing significantly during the first fiscal quarter of 2008. The net effect of the significant increases in corn prices during
the first fiscal quarter of 2008 and the Company’s larger derivative position compared to its corn usage resulted in a reduction to our cost of revenues of approximately $6 million. During the first fiscal quarter of 2007, our smaller hedge position and slightly decreasing corn prices resulted in an increase in our cost of revenues of approximately $3 million due to our corn derivatives. During the first fiscal quarters of 2008 and 2007 we experienced relatively small reductions in our cost of revenues of approximately $130,000 for 2007 and $65,000 for 2008 associated with our natural gas derivative instruments. We held a considerably smaller derivative position in natural gas during the first fiscal quarter of 2008 compared to the same period of 2007 that reduced the effect of our derivatives during that quarter.
In future filings we will provide a notional description of the basic terms and pricing of our contracts and hedge positions in an attempt to give our members a better understanding of our hedging positions and strategy.
Item 9A(T) – Controls and Procedures, page 57
6. Please disclose whether there have been any changes in your internal controls and procedures during the most recently completed quarter. See Item 308T of Regulation S-K.
RESPONSE: In our Form 10-K for our fiscal year ended December 31, 2007, we made our first management’s report on internal control over financial reporting. In preparation of this first management’s report, we made various changes to our internal controls and procedures. In reliance on Question Seven in the Commission’s Frequently Asked Questions regarding Management’s Report Over Financial Reporting as revised on September 24, 2007, we concluded that a discussion of the changes that were made to our internal controls prior to the first management’s report did not need to be disclosed unless a material weakness was identified. In our first management’s report, we concluded that there was no material weakness in our internal control over financial reporting. In future quarters, we will disclose changes in our internal control over financial reporting as required by Regulation S-K.
Exhibit 32 – Certifications
7. Your Exhibit 32 certifications pursuant to Section 906 of the Sarbanes-Oxley Act of 2002 refer to the three months ended December 31, 2007. Please revise the certifications so they refer to the year ended December 31, 2007.
RESPONSE: Our future Exhibit 32 certifications will be revised as requested.
FORM 10-Q FOR THE PERIOD ENDED MARCH 31, 2008
Item 4-Controls and Procedures, page 22
8. You currently disclose that your management concluded that your internal control over financial reporting was effective as of December 31, 2007. Please perform an evaluation of the effectiveness of the design and operation of your disclosure controls and procedures as of the end of the period covered by your report, which would be March 31, 2008. See Item 307 of Regulation S-K.
RESPONSE: Management determined that our disclosure controls and procedures were effective for the period ended March 31, 2008. In future reports management will provide disclosure regarding the effectiveness of the design and operation of our disclosure controls and procedures as required by Item 307 of Regulation S-K.
| Sincerely, |
|
|
|
|
| /s/ Robbi Buchholtz |
|
|
| Robbi Buchholtz, CFO |
EXHIBIT A
SUPPLEMENTAL DISCLOSURES PURSUANT TO COMMENT NUMBER 2
Principal Products and Their Markets – Ethanol
The market price of ethanol has been volatile during our last three fiscal years. The ethanol industry is experiencing rapid growth in ethanol production and demand. As these supply and demand forces interact, management expects continued volatility in the market price of ethanol. Below is a chart showing the price for ethanol at the Sioux Falls, South Dakota Rack since September 1997. The rack price for ethanol is the price at which ethanol is sold to wholesalers.
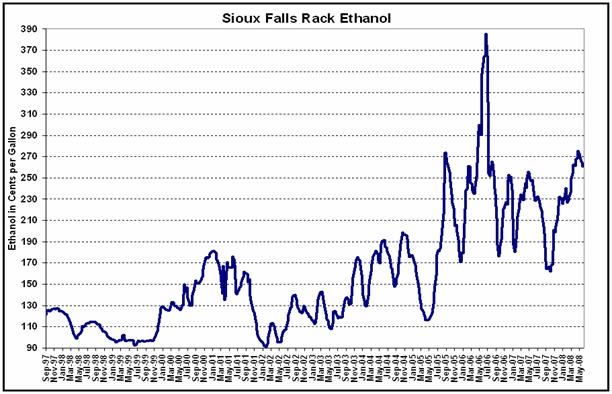
During our last three fiscal years, the ethanol market experienced a significant increase in ethanol prices during the middle of our 2006 fiscal year. Management attributes this increase in ethanol prices with the interaction of increased ethanol demand offset by smaller increases in ethanol supply. Below is a chart showing ethanol market prices during our last three fiscal years.

Principal Products and Their Markets – Distillers Grains
We produce both dried distillers grains and modified/wet distillers grains as co-products of the ethanol production process. Due to transportation and storage concerns, our modified/wet distillers grains are sold directly by us in our local market. Therefore, it is difficult to determine an overall market price for modified/wet distillers grains as it would not be feasible for us to serve markets other than our local market with modified/wet distillers grains.
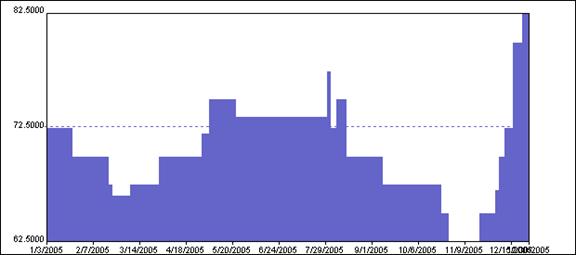
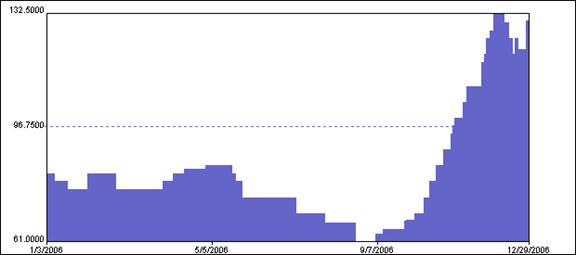
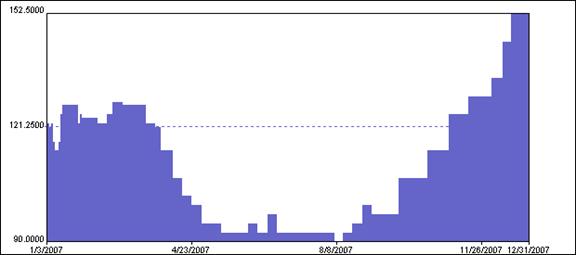
The national dried distillers grains market is expanding due to significant supply increases resulting from increased ethanol production. Accompanying this increase in distillers grains supply has been significantly increased distillers grains demand. Management believes the increased demand for distillers grains is a result of increased corn and soybean prices. Since distillers grains may be used as a substitute for corn and soybean based animal feed, increases in the price of corn and soybeans has favorably impacted the selling price of dried distillers grains. Below are three charts showing the market price of distillers grains in the Minnesota/Dakotas distillers grains markets during our last three fiscal years as reported by Jacobsen Publishing.
Fiscal Year 2005 Distillers Grains Prices
Fiscal Year 2006 Distillers Grains Prices
Fiscal Year 2007 Distillers Grains Prices
Sources and Availability of Raw Materials – Corn
The price of corn has trended higher during recent years. Below are three charts showing the average prices for the Minneapolis-based price of corn during our last three fiscal years according to Jacobsen Publishing.
Fiscal Year 2005 Corn Price

Fiscal Year 2006 Corn Price

Fiscal Year 2007 Corn Price
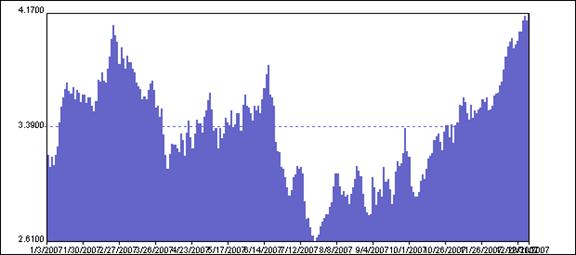
During our 2006 fiscal year, the ethanol industry experienced a significant increase in the price of corn. The market price of corn more than doubled during our 2006 fiscal year. Corn prices were volatile during our 2007 fiscal year and trended to over $4.00 per bushel by the end of our 2007 fiscal year. Below is a chart showing the rise in corn prices during our last two fiscal years.
Fiscal Years 2006 and 2007 Corn Price

Sources and Availability of Raw Materials – Natural Gas
The market price of natural gas during our last three fiscal years has been volatile, primarily as a result of supply disruptions that occurred as a result of hurricane activity during our 2006 fiscal year. Below is a chart showing the market prices of natural gas since 2002.

EXHIBIT B
SUPPLEMENTAL DISCLOSURES PURSUANT TO COMMENT NUMBER 3
Ethanol: Average Sales Price and Quantity Produced
The average price we received for our ethanol during our 2007 fiscal year was approximately 5% lower than the average price we received in fiscal year 2006. In our 2007 fiscal year we experienced an average sales price of $1.87 per gallon of ethanol sold compared to an average sales price of $1.97 per gallon in our 2006 fiscal year. Additionally, during our 2007 fiscal year, we increased the number of gallons of ethanol we produced by approximately 2.3% compared to the same period of 2006. Our total ethanol production during our 2007 fiscal year was approximately 48,885,000 gallons compared to approximately 47,809,000 gallons during our 2006 fiscal year.
Distillers Grains: Average Sales Price and Quantity Produced
In our 2007 fiscal year, we increased our distillers grains revenue by approximately 29% or approximately $2,402,000 compared to the same period of 2006. This increase in the revenue was a result of a combination of an increase in the average price we received for our distillers grains and an increase in the total distillers grains production by us during our 2007 fiscal year as compared to the same period of 2006. We experienced an increase of approximately 7% in the average price we received for our dried distillers grains during our 2007 fiscal year as compared to the same period 2006. In our 2007 fiscal year we experienced an average sales price of approximately $80.48 per ton of dried distillers grains sold compared to an average sales price of approximately $74.93 per ton in our 2006 fiscal year. Additionally, we experienced an increase of approximately 29% in the average price we received for our modified/wet distillers grains during our 2007 fiscal year as compared to the same period of 2006. This equated, in real terms, to an average sales price of approximately $38.61 per ton of modified/wet distillers grains sold in our 2007 fiscal year compared to an average sales price of approximately $29.97 per ton in our 2006 fiscal year.
We increased the total tons of distillers grains we produced during our 2007 fiscal year by approximately 6% compared to the same period of 2007 which equated to an increase in real terms of approximately 8,000 tons of distillers grains. This increase in the total distillers grains production was a result of increased ethanol production. Since distillers grains are the primary co-product of our ethanol production process, as ethanol production increases, distillers grains production will correspondingly increase.
We increased the amount of distillers grains we marketed as wet/modified distillers grains during our 2007 fiscal year as compared to our 2006 fiscal year. During our 2007 fiscal year we produced approximately 75,526 tons of dried distillers grains and approximately 75,922 tons of wet/modified distillers grains. In our 2006 fiscal year, we produced approximately 107,202 tons of dried distillers grains and approximately 35,243 tons of wet/modified distillers grains. Wet/modified distillers grains require less natural gas to produce than dried distillers grains, which decreases our cost of revenues.
Corn: Average Price Paid and Quantity Consumed
The average price we paid per bushel of corn increased by approximately 89% during our 2007 fiscal year as compared to the same period of 2006. The average price we paid per bushel of corn during our 2007 fiscal year was approximately $3.03 compared to approximately $1.60 per bushel that we paid during our 2006 fiscal year. We also experienced an approximately 3% increase in the amount of corn we used to produce ethanol during our 2007 fiscal year as compared to the same period of 2006. During our 2007 fiscal year, our ethanol plant consumed approximately 17,536,000 bushels of corn compared to approximately 16,966,000 bushels of corn consumed during our 2006 fiscal year.
Natural Gas: Average Price Paid and Quantity Consumed
Total cost of revenues attributed to natural gas decreased during our 2007 fiscal year by approximately 13% compared to the same period of 2006. This equaled a decrease in real terms of approximately $1,762,000. This decrease in cost of revenues attributed to natural gas costs was a result of decreased natural gas consumption and a decreased average price we paid for natural gas during our 2007 fiscal year. Total natural gas consumption at the ethanol plant decreased by approximately 3% during our 2007 fiscal year as compared to same period of 2006. During our 2007 fiscal year our ethanol plant consumed approximately 1,476,000 MMBTU of natural gas compared to approximately 1,529,000 MMBTU of natural gas in fiscal year 2006. Further, we experienced a decrease of approximately 10% in the average price we paid per MMBTU of natural gas in fiscal year 2007 as compared to the same period of 2006. During our 2007 fiscal year we paid an average price of approximately $8.01 per MMBTU of natural gas compared to approximately $8.89 per MMBTU of natural gas that we paid in fiscal year 2006.