Exhibit 99.2
| | |
|
| |
| Technical Report Preliminary Assessment based on Report Titled “Technical Assessment of Camino Rojo Project Zacatecas, Mexico” | |
| 
Prepared by: Minorex Consulting Ltd. Mine and Quarry Engineering Services, Inc.
For Canplats Resources Corporation
Authors: J. Douglas Blanchflower, P. Geo Christopher Kaye, MAusIMM, B,Eng. (Chemical) Howard Steidtmann, MAusIMM, B. Sc. Mining Engineering
Report Date: October 16, 2009 | |
| | |
IMPORTANT NOTICE
This report was prepared as a National Instrument 43-101 Technical Report for Canplats Resources Corporation (“Canplats”) by Mine and Quarry Engineering Services, Inc. (“MQes”) and Minorex Consulting Ltd. (“Minorex”). The quality of information, conclusions, and estimates contained herein is consistent with the level of effort involved in MQes’ and Minorex’s services, based upon: i) information available at the time of preparation, ii) data supplied by outside sources, and iii) the assumptions conditions, and qualifications set for the in this report. This report is intended to be used by Canplats, subject to the terms and conditions of its contracts with MQes and Minorex. These contracts permit Canplats to file this report as a Technical Report with Canadian Securities Regulatory Authorities pursuant to provincial securities legislation. Except for the purposes legislated under provincial secur ities laws, any other use of this report by any third party is at that party’s sole risk.
| | | | |
| SECTION | PAGE |
| |
| 1.0 | SUMMARY | 1-1 |
| 1.1 | General Summary | 1-1 |
| 1.2 | Mineral Resource Estimate | 1-2 |
| 1.3 | Mining | 1-3 |
| 1.4 | Metallurgy | 1-4 |
| 1.5 | Operating Cost Estimate | 1-5 |
| 1.6 | Capital Cost Estimate | 1-6 |
| 1.7 | Economic Analysis | 1-7 |
| 1.8 | Project Development Schedule | 1-8 |
| 1.9 | Conclusions and Recommendations | 1-8 |
| 2.0 | INTRODUCTION AND TERMS OF REFERENCE | 2-1 |
| 2.1 | Sources of Information | 2-2 |
| 2.2 | Units of Measure | 2-3 |
| 3.0 | RELIANCE ON OTHER EXPERTS | 3-1 |
| 4.0 | PROPERTY DESCRIPTION AND LOCATION | 4-1 |
| 4.1 | Property Location | 4-1 |
| 4.2 | Property Description | 4-1 |
| 4.3 | Property Ownership | 4-6 |
| 4.4 | Environmental, Reclamation and Permitting Issues | 4-6 |
| 5.0 | ACCESSIBILITY, CLIMATE, LOCAL RESOURCES, INFRASTRUCTURE and PHYSIOGRAPHY | 5-1 |
| 5.1 | Accessibility | 5-1 |
| 5.2 | Physiography, Climate and Vegetation | 5-1 |
| 5.3 | Local Resources and Infrastructure | 5-1 |
| 6.0 | HISTORY | 6-1 |
| 7.0 | GEOLOGICAL SETTING | 7-1 |
| 7.1 | Regional Geology | 7-1 |
| 7.2 | Property Geology | 7-9 |
| | 7.2.1 | | Lithology | 7-9 |
| | 7.2.2 | | Structure | 7-10 |
| | 7.2.3 | | Alteration | 7-10 |
| 8.0 | DEPOSIT TYPES | 8-1 |
| 9.0 | MINERALIZATION | 9-1 |
| 10.0 | EXPLORATION | 10-1 |
| 10.1 | 2007 and Early Exploration Programs | 10-1 |
| 10.2 | Mid-2008 Exploration Program | 10-2 |
| 10.3 | Results of the Exploration Programs | 10-2 |
| 11.0 | DRILLING | 11-1 |
| 11.1 | Reverse Circulation Drilling | 11-1 |
| 11.2 | Diamond Drilling | 11-1 |
| 11.3 | Results of the Drilling Programs | 11-16 |
| 12.0 | SAMPLING METHOD and APPROACH | 12-1 |
i
| | | | |
| 12.1 | Trench Sampling and Logging | 12-1 |
| 12.2 | Reverse Circulation Sampling, Handling, Logging and Storage | 12-1 |
| | 12.2.1 | | Reverse Circulation Sample Handling | 12-1 |
| | 12.2.2 | | Reverse Circulation Sample Geological Logging | 12-1 |
| | 12.2.3 | | Reverse Circulation Sample Storage | 12-2 |
| 12.3 | Drill Core Handling, Logging, Sampling and Storage | 12-2 |
| | 12.3.1 | | Drill Core Photography | 12-2 |
| | 12.3.2 | | Geotechnical Logging | 12-2 |
| | 12.3.3 | | Geological Logging | 12-2 |
| | 12.3.4 | | Drill Core Storage | 12-3 |
| 13.0 | SAMPLE PREPARATION, ANALYSIS and SECURITY | 13-1 |
| 13.1 | Sample Preparation | 13-1 |
| 13.2 | Sample Analyses and Assays | 13-1 |
| 13.3 | Sample Security | 13-2 |
| 14.0 | DATA VERIFICATION | 14-1 |
| 14.1 | 2008 Quality Assurance and Quality Control Program | 14-1 |
| 14.2 | Drilling Data Verification | 14-3 |
| 14.3 | Independent Verification Sampling | 14-3 |
| 15.0 | ADJACENT PROPERTIES | 15-1 |
| 16.0 | MINERAL PROCESSING and METALLURGICAL TESTWORK | 16-1 |
| 16.1 | Metallurgical Testwork | 16-1 |
| | 16.1.1 | | Samples | 16-1 |
| | 16.1.2 | | Mineralogy, Bond Work Index and Crusher Abrasion Index | 16-3 |
| | 16.1.3 | | Column Leach Tests | 16-3 |
| | 16.1.4 | | Bottle Roll Tests | 16-9 |
| | 16.1.5 | | Flotation Tests | 16-14 |
| | 16.1.6 | | Metallurgical Testwork Recommendations | 16-15 |
| 16.2 | Process Description | 16-15 |
| | 16.2.1 | | Process Overview | 16-16 |
| | 16.2.2 | | Primary Crushing, Ore Stockpile and Reclaim | 16-16 |
| | 16.2.3 | | Fine Crushing and Reclaim, Fine Ore Stockpiles | 16-17 |
| | 16.2.4 | | Heap Leaching | 16-18 |
| | 16.2.5 | | Merrill-Crowe Refinery | 16-18 |
| | 16.2.6 | | Refinery | 16-19 |
| 17.0 | MINERAL RESOURCE and MINERAL RESERVE ESTIMATES | 17-1 |
| 17.1 | Introduction | 17-1 |
| 17.2 | Database | 17-1 |
| 17.3 | Data Verification | 17-2 |
| 17.4 | Compositing | 17-2 |
| 17.5 | Geological Modelling | 17-3 |
| 17.6 | Rock code Determination | 17-7 |
| 17.7 | Grade Capping | 17-7 |
| 17.8 | Bulk Density | 17-8 |
| 17.9 | Variography | 17-8 |
| 17.10 | Block Model | 17-9 |
| 17.11 | Interpolation | 17-9 |
ii
| | | | |
| 17.12 | Interpolation Validation | 17-12 |
| 17.13 | Resource classification | 17-13 |
| 17.14 | Resource Estimate | 17-14 |
| 17.15 | Resource Validation | 17-18 |
| 17.16 | Dilution and Mining Recovery | 17-20 |
| 17.17 | Open Pit Optimization | 17-20 |
| 17.18 | Reserve Estimate | 17-23 |
| 18.0 | OTHER RELEVANT DATA and INFORMATION | 18-1 |
| 19.0 | ADDITIONAL REQUIREMENTS for TECHNICAL REPORTS on DEVELOPMENT PROPERTIES and PRODUCTION PROPERTIES | 19-1 |
| 19.1 | Geotechnical | 19-1 |
| 19.2 | Proposed Mining Operations | 19-1 |
| | 19.2.1 | | Mining Method and Equipment | 19-1 |
| | 19.2.2 | | Open Pit Design | 19-1 |
| | 19.2.3 | | Waste Storage Area | 19-1 |
| | 19.2.4 | | Grade Control | 19-2 |
| | 19.2.5 | | Production Schedules and Blending | 19-2 |
| 19.3 | Hydrology and Hydrogeology | 19-4 |
| | 19.3.1 | | Open Pit Dewatering | 19-4 |
| | 19.3.2 | | Water Supply | 19-4 |
| 19.4 | Dam Designs and Management | 19-4 |
| 19.5 | Infrastructure and Services | 19-4 |
| | 19.5.1 | | Sterilization Drilling | 19-4 |
| | 19.5.2 | | Power Supply | 19-4 |
| | 19.5.3 | | Buildings | 19-4 |
| | 19.5.4 | | Roads | 19-4 |
| 19.6 | Project Development Schedule | 19-5 |
| 19.7 | Project Economics | 19-5 |
| | 19.7.1 | | Capital Cost Estimate | 19-5 |
| | 19.7.2 | | Operating Cost Estimate | 19-7 |
| | 19.7.3 | | Economic Analysis | 19-8 |
| 19.8 | Risk and Opportunity Analysis | 19-10 |
| | 19.8.1 | | Data Collection | 19-10 |
| | 19.8.2 | | Resources | 19-11 |
| | 19.8.3 | | Mining and Reserves | 19-11 |
| | 19.8.4 | | Geotechnics and Hydrology | 19-12 |
| | 19.8.5 | | Metallurgy and Processing | 19-12 |
| | 19.8.6 | | Infrastructure and Services | 19-13 |
| | 19.8.7 | | Environmental Impacts and Permitting | 19-13 |
| | 19.8.8 | | Project Implementation | 19-13 |
| | 19.8.9 | | Project Economics | 19-13 |
| 20.0 | INTERPRETATIONS AND CONCLUSIONS | 20-1 |
| 21.0 | RECOMMENDATIONS | 21-1 |
| 21.1 | Proposed Exploration Budget | 21-3 |
| 21.2 | Proposed Work Program to Advance Project to Prefeasibility Level | 21-3 |
| 22.0 | REFERENCES | 22-1 |
| | |
| 23.0 | DATE and SIGNATURE PAGE | 23-1 |
iii
| |
| TABLE | PAGE |
| |
| Table 1-1: Estimated Mineral Resources – Represa Zone | 1-3 |
| Table 1-2: Process Operating Costs | 1-6 |
| Table 1-3: Initial Capital Cost Summary | 1-6 |
| Table 1-4: Effect of Metal Prices on Project Economics | 1-7 |
| Table 4-1: Summary of Mining Concession Data | 4-2 |
| Table 11-1: Summary of Drilling Data Reverse Circulation Drill Holes | 11-3 |
| Table 11-2: Diamond Drill Holes for Metallurgical Sampling | 11-5 |
| Table 11-3: Summary of Drilling Data Diamond Drill Holes | 11-6 |
| Table 11-4: Summary of Drilling Reports Reverse Circulation Drill Hole Intercepts | 11-12 |
| Table 14-1: Description of Verification Samples | 14-4 |
| Table 16-1: Metallurgical Testwork Composites – SGS Program 1 | 16-2 |
| Table 16-2: Metallurgical Testwork Composites – SGS Program 2 | 16-3 |
| Table 17-1: Summary of Types of Sample Data | 17-2 |
| Table 17-2: Rock code Description | 17-7 |
| Table 17-3: Grade Capping Values | 17-7 |
| Table 17-4: Summary of Statistics of Uncapped and Capped Composites | 17-8 |
| Table 17-5: Block Model Parameters | 17-9 |
| Table 17-6: Interpolation Parameters | 17-10 |
| Table 17-7: Summary of ‘One Out’ Cross-Validation Results | 17-13 |
| Table 17-8: Cut-Off Gold Grade Data for Open Pit and Heap Leach Operations** | 17-15 |
| Table 17-9: Represa Mineral Resource Estimate | 17-15 |
| Table 17-10: Cut-Off Gold Grade Sensitivity for Represa Resource Estimate | 17-17 |
| Table 17-11: Reblocked Resource (10mx10mx5m SMU) at 0.2g/t Gold Cutoff | 17-20 |
| Table 17-12: Pit Optimization Economic Parameters | 17-21 |
| Table 17-13: Top Ten NPV5 Results | 17-22 |
| Table 19-1: Annual Mine Production Schedule | 19-3 |
| Table 19-2: Estimated Initial Capital Cost - Summary | 19-6 |
| Table 19-3: Conceptual Process Operating Cost Summary | 19-8 |
| Table 19-4: General and Administration Costs | 19-8 |
| Table 19-5: Effect of Metal Prices on Project Economics | 19-10 |
| Table 19-6: Comparison of NPV at 5% and IRR Versus Processing Rates | 19-10 |
| Table 20-1:Undiluted Global Resource-Oxide, Transition & Sulphide Mineralization | 20-2 |
| Table 21-1: Proposed Exploration Development Program – Estimated Expenses | 21-3 |
| Table 21-2: Requirements for Pre-Feasibility Study – Eng. & Design Perspective | 21-4 |
| Table 21-3: Estimated Budget to Advance Project to a Pre-Feasibility Level | 21-5 |
iv
| |
| FIGURE | PAGE |
| |
| Figure 1-1: NPV at 5% - Sensitivity Analysis | 1-7 |
| Figure 4-1: Location Map | 4-3 |
| Figure 4-2: Mineral Concessions Map | 4-4 |
| Figure 4-3: Infrastructure Map | 4-5 |
| Figure 7-1: Regional Geology Map | 7-3 |
| Figure 7-2: Legend for Geology Maps | 7-4 |
| Figure 7-3: Symbols for Geology Maps | 7-5 |
| Figure 7-4: Stratagraphic Section Concepcion Del Oro District | 7-6 |
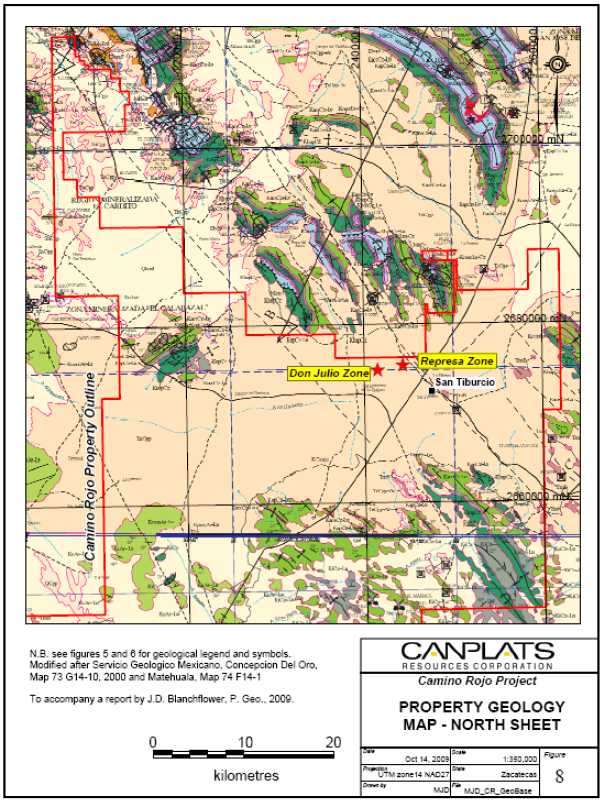
| Figure 7-5: Property Geology Map – North Sheet | 7-8 |
| Figure 11-1: Drill Hole Plan – Represa and Don Julio Zones | 11-7 |
| Figure 11-2: Vertical Section 244250 E Represa Zone | 11-8 |
| Figure 11-3: Vertical Section 244400 E Represa Zone | 11-9 |
| Figure 11-4: Vertical Section 244500 E Represa Zone | 11-10 |
| Figure 11-5: Vertical Section 244600 E Represa Zone | 11-11 |
| Figure 16-1: Effect of Crush Size on Gold Recovery – Oxide Material | 16-4 |
| Figure 16-2: Effect of Crush size on Silver Recovery – Oxide Material | 16-5 |
| Figure 16-3: Effect of Leach Time on gold Recovery | 16-6 |
| Figure 16-4: Effect of Leach Time on Silver Recovery | 16-7 |
| Figure 16-5: Gold Recovery Versus Gold Head Grade | 16-8 |
| Figure 16-6: Silver Recovery Versus Silver Head Grade | 16-9 |
| Figure 16-7: Effect of Leach Time on Gold Recovery | 16-10 |
| Figure 16-8: Effect of Leach Time on Silver Recovery | 16-11 |
| Figure 16-9: Gold Recovery Versus Gold Head Grade | 16-12 |
| Figure 16-10: Silver Recovery Versus Silver Head Grade | 16-13 |
| Figure 17-1: Views of the Represa Mineral Domain | 17-5 |
| Figure 17-2: OS and SX Surfaces Represa Zone | 17-6 |
| Figure 17-3: Log Normal Histrogram Plot of Capped Gold Composites | 17-11 |
| Figure 17-4: Log Normal Probability Plot of Capped Gold Composites | 17-11 |
| Figure 17-5: Gold Block Grade, Gold Sample Grade and Tonnage | 17-18 |
| Figure 17-6: Number of Gold Composite Samples Versus Tonnage | 17-19 |
| Figure 17-7: Tonnage Versus Classification | 17-19 |
| Figure 17-8: Project Economic Performance NPV5: US$800/oz Au | 17-22 |
| Figure 17-9: Base Case Ultimate Pit Limit, Pit Shell 58 | 17-23 |
| Figure 19-1: NPV@5% - Sensitivity Analysis | 19-9 |
v
SECTION 1
SUMMARY
1.0
SUMMARY
1.1
General Summary
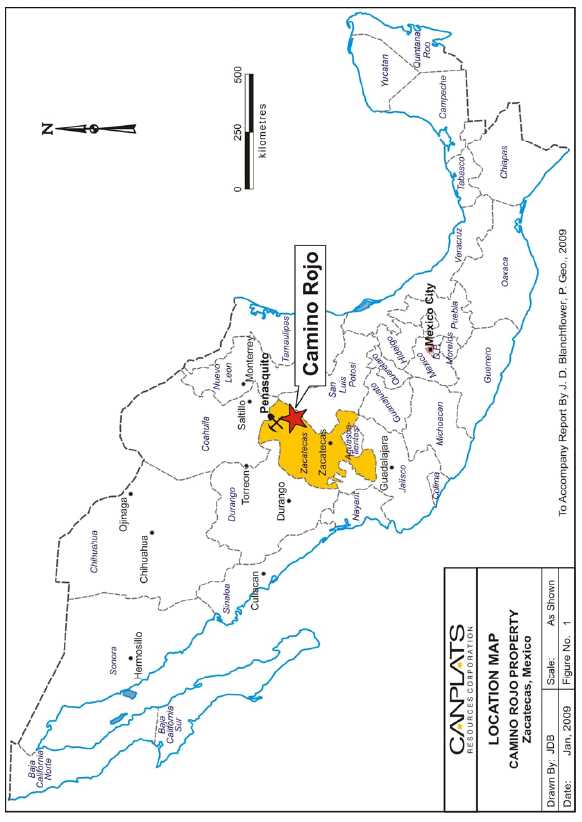
The Camino Rojo property is situated near the town of San Tiburcio within the southern portion of the Concepciòn del Oro district in the northeastern part of Zacatecas State, Mexico; approximately 206 kilometres northeast of the state capital city of Zacatecas. At the request of Canplats Resources Corporation (“Canplats”), Minorex Consulting Ltd. (“Minorex”) previously reviewed and compiled the 2007 and 2008 exploration results and estimated the mineral resources of the Represa zone within the property (Blanchflower, 2008 and 2009). Two preliminary metallurgical testwork programs have been completed investigating the recoveries of gold and silver from oxide and transition samples as well as recoveries of lead, zinc, gold and silver from sulphide samples from the Represa Zone. In April, 2009 Mine and Quarry Engineering Services, Inc. (“MQes”) was retained by Canplats Resource Corporation (“Canplats”) to perform a Technical Assessment which evaluated the recovery of gold and silver via heap leaching (20,000tpd) from oxide and transition material in the Represa zone.
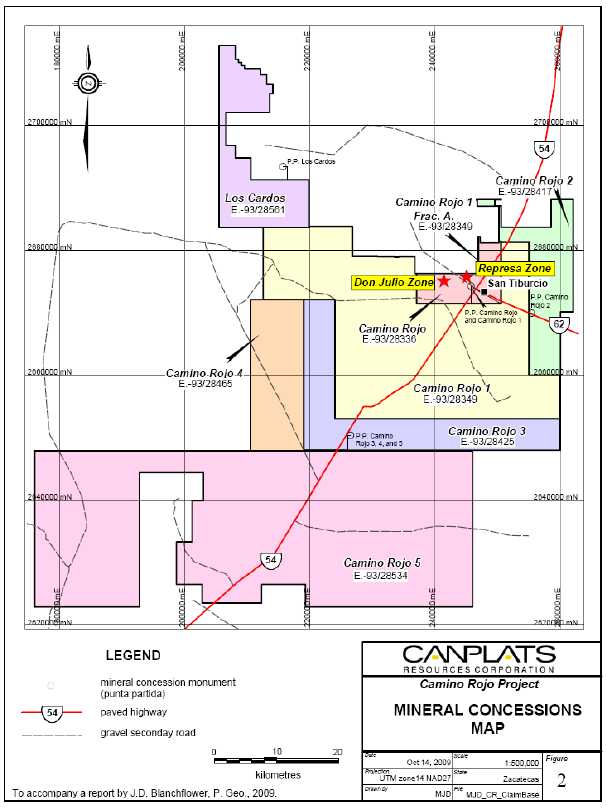
The Camino Rojo property is comprised of six mining concessions and one fractional concession that are owned and operated by Canplats de Mexico, S.A. de C.V., a wholly-owned Mexican-registered subsidiary of Canplats Resource Corporation. These mining concessions are: ‘Camino Rojo’, ‘Camino Rojo 1’, ‘Camino Rojo 2’, ‘Camino Rojo 3’, ‘Camino Rojo 4’, ‘Camino Rojo 5’ and the fractional concession ‘Camino Rojo 1 Fracc. A’. Title to a seventh mining concession, the Los Cardos mining concession, is currently being transferred into Canplats de Mexico, S. A. de C.V. In total these concessions cover approximately 338,930 hectares or 1,309 square miles.
The Camino Rojo gold-silver-lead-zinc occurrence is a new discovery with no evidence of prior exploration. Canplats has carried out aggressive and continuous exploration work on the property since its discovery in July 2007. During the intervening time, this exploration work has included: prospecting, reconnaissance geological mapping, test pitting with geochemical sampling, trenching with geological mapping and geochemical sampling, induced polarization surveying, and reverse circulation and diamond drilling.
The 2007 to 2008 exploration work has dominantly focused on the Represa zone where a large occurrence of gold-, silver-, lead- and zinc-bearing mineralization is hosted by highly altered, silicified and oxidized metasedimentary rocks. The Represa zone has been traced by drilling for more than 1,000 m east-west, 460 m north-south and vertically to a depth of 820 m. Drill hole intercepts (not true widths) with gold and silver values exceeding 0.25g/t and 5g/t respectively range from 52 to 728 m. Within these drilling intercepts the precious metal-bearing mineralization has good lateral and vertical continuity.
1-1
A second nearby zone, the ‘Don Julio’ zone, has been identified by a 1,000 m long by 400 m wide induced polarization anomaly and tested by eight drill holes. This drilling has intersected favourable alteration of the country rocks with local gold values, and extended Represa-style mineralization to its eastern margin at depth. Only a small portion of the Don Julio zone has been tested and more extensive drilling is warranted. Two diamond drill holes also tested a favourable geophysical anomaly situated approximately 1,200 m west-southwest of the Don Julio zone. These drill holes intersected favourably altered country rocks but no significant mineralization.
A compilation of regional geological, geophysical and structural features shows that the Camino Rojo property covers at least seven additional geological and/or geophysical targets with good exploration potential. Three targets are hydrothermal alteration zones spatially associated with northwesterly trending regional faults, and the other four targets are inferred intrusive centres with possibly related precious metal mineralization.
1.2
Mineral Resource Estimate
The Represa zone has been explored with 86 reverse circulation drill holes, 25 diamond drill holes and more than 11 excavator trenches. Canplats provided an audited database that included multi-element analyses for 19,913 drill hole samples and 320 trench samples situated within the Represa zone.
Polylines were plotted on sections spaced at 25-metre intervals to define the greater than 0.1g/t gold assay boundary for the mineralization while maintaining zonal continuity along strike and downdip. Thirteen individual geometric solids were formed reflecting the three-dimensional boundaries of the Represa mineral domain. Using the constructed solids as constraints, statistical analyses were carried out on the assay samples within the mineral domain and grade capping levels were determined at: 9.50g/t for gold, 87.00g/t for silver, 1.40% for lead and 2.50% for zinc. Once the assay data had been capped 2-metre composites were calculated for grade interpolation.
The Represa block model was created with 5m by 5m by 5m blocks for 300 columns, 180 rows and 180 levels, it was not rotated, and it was coded to partial blocks. Ordinary kriging was used to interpolate grades for gold, silver, lead and zinc, and inverse distance power 2 (ID2) was utilized to define measured resource blocks for classification. A bulk density of 2.681 g/cc was used for tonnage calculations of all mineralized material. Mineral resources were estimated individually for the near-surface oxidized mineralization, transitional mixed oxidized and sulphide mineralization, and buried sulphide mineralization. The boundary for each type of mineralization was based upon data provided by Canplats. Cut-off gold grades were established at 0.2g/t gold for the oxide and transitional mineralization, and 0.3g/t for the sulphide mineralization. The undiluted mineral resources of the Represa zone ar e estimated as shown in Table 1-1.
1-2
Table 1-1: Estimated Mineral Resources – Represa Zone
| | | | | | | |
Oxide | Tonnes | Gold | Silver | Lead | Zinc | Gold | Silver |
0.2 g/t Au Cut-Off | (000's) | (g/t) | (g/t) | (%) | (%) | (000's oz) | (000's oz) |
Measured | 9,571 | 0.76 | 13.40 | 0.29 | 0.34 | 234 | 4,122 |
Indicated | 54,372 | 0.69 | 13.24 | 0.25 | 0.34 | 1,210 | 23,146 |
Meas & Ind | 63,943 | 0.70 | 13.26 | 0.26 | 0.34 | 1,444 | 27,268 |
Inferred | 2,407 | 0.55 | 10.89 | 0.19 | 0.27 | 42 | 843 |
| | | | | | | |
Transitional | Tonnes | Gold | Silver | Lead | Zinc | Gold | Silver |
0.2 g/t Au Cut-Off | (000's) | (g/t) | (g/t) | (%) | (%) | (000's oz) | (000's oz) |
Measured | 5 | 1.04 | 19.94 | 0.28 | 0.47 | 0.2 | 3 |
Indicated | 24,548 | 0.64 | 15.39 | 0.21 | 0.49 | 507 | 12,145 |
Meas & Ind | 24,553 | 0.64 | 15.39 | 0.21 | 0.49 | 507 | 12,148 |
Inferred | 2,411 | 0.51 | 11.74 | 0.16 | 0.41 | 39 | 910 |
| | | | | | | |
Sulphide | Tonnes | Gold | Silver | Lead | Zinc | Gold | Silver |
0.3 g/t Au Cut-Off | (000's) | (g/t) | (g/t) | (%) | (%) | (000's oz) | (000's oz) |
Measured | 4 | 0.77 | 8.85 | 0.15 | 0.19 | 0.1 | 1 |
Indicated | 74,890 | 0.62 | 8.84 | 0.13 | 0.36 | 1,494 | 21,290 |
Meas & Ind | 74,894 | 0.62 | 8.84 | 0.13 | 0.36 | 1,494 | 21,291 |
Inferred | 26,211 | 0.56 | 6.95 | 0.08 | 0.31 | 474 | 5,858 |
1.3
Mining
It was assumed the Camino Rojo project will be developed using conventional truck-shovel open pit mining technology involving contractor mining. It has been anticipated that the primary production equipment in the contractor’s mining fleet will consist of 14.3 cubic metre hydraulic excavators operating in backhoe configuration paired with 91 tonne capacity haul trucks. The open pit will operate 24 hours per day; 365 days per year with a five day allowance for bad weather and major holidays. Ore will be drilled and blasted on 5m high benches, while waste will be drilled and blasted on 10m high benches. Blasting will be performed using bulk ANFO (ammonium nitrate fuel oil) at powder factors in the range of 0.20 to 0.40kg/t. The waste storage area will be located east and adjacent to the open pit. A separate area will be devoted to topsoil storage near the waste storage area, with this material used du ring surface reclamation activities. Lower grade stockpile(s) will be located in the vicinity of the primary crusher.
This technical assessment has identified a Base Case ultimate pit containing 74.9Mt of mineralized material grading 0.71g/t Au and 14.2g/t Ag at a stripping ratio of 0.70 tonnes of waste per tonne of material processed. Due to a variety of deficiencies such as geotechnical studies, hydrological studies, metallurgical testwork and land status, this mine plan does not currently meet the criteria for a Mineral Reserve under NI 43-101 reporting requirements.
1-3
The northern edge of the open pit identified in this technical assessment extends onto land for which Canplats does not currently hold a mining concession. To clarify, the mineral resources identified in this technical assessment are located entirely within the mining concessions held by Canplats. While it is possible that the northern portion of the open pit may contain economically viable extensions of the Represa Zone, the existence of such extensions is currently unknown. As such, this technical assessment assumed only waste will be mined from this area; however, without such waste mining a portion of the mineral resources identified in this technical assessment may be inaccessible by open pit.
1.4
Metallurgy
Two metallurgical testwork programs have been completed investigating the metallurgical response of mineralized samples from the Camino Rojo project. The programs investigated the recovery of gold and silver from oxide and transition samples as well as recoveries of lead, zinc, gold and silver from oxide, transition and sulphide samples. Comparisons between assayed and calculated head grades in several of the tests were in excess of what is considered acceptable and this casts doubt on the accuracy of reported recoveries in some tests.
Column leach tests indicate crush sizes between 1.5 and 0.375 inches for oxide material has a negligible effect on gold recovery. Silver recoveries tend to increase as the crush size is reduced to 0.375 inches. The effect of crush size on transition material has only been evaluated on 2 samples and there is insufficient data to show any meaningful trends. In general, gold recovery is higher for oxide material than transition material. Silver recoveries are consistently higher in transition samples than in oxide samples. Head grades for silver in the transition material tested are slightly higher than in oxide material and this could partly explain this discrepancy. Maximum gold and silver recoveries for oxide material are achieved between 40 and 50 days. Different recovery trends for gold and silver based on material classification (oxide or transition) are evident.
Bottle roll tests do not show any clear distinction between gold and silver recoveries for the oxide, transition and sulphide materials tested. It would be expected that oxide samples would show consistently higher gold recoveries followed by transition and then sulphide samples. Issues that can cloud this effect are head grade and crush/grind size, assaying and classification of samples. Mineralogical evaluations can give valuable insight into recovery details. Dissolution of gold and silver is essentially complete after 48 hours. Slightly different recovery trends for gold associated with oxide and transition material are evident with recoveries being marginally higher for oxide material. Results for silver in oxide material are too scattered to determine a trend.
Flotation tests indicate that oxide material is not amenable to treatment by flotation and sulphidization does not improve the metallurgical response of this material. Flotation tests on sulphide samples produced some encouraging results for recoveries of base metals. Considerable upgrading of both lead and zinc rougher concentrates, however, are required to produce a marketable concentrate. Recoveries of gold and silver to the lead rougher concentrate were reasonable in some tests. Additional flotation testwork is warranted and this should focus on sulphide material.
1-4
Metallurgical testwork performed on the Camino Rojo project to date is encouraging, however, very preliminary. In order to advance the project to pre-feasibility and feasibility levels additional metallurgical testwork is required. The objective of this testwork should be to focus on the recovery of gold and silver from the oxide and transition zones in order to better define metallurgical responses as well as develop criteria for ongoing engineering assessment. The recovery of silver in testwork to date has been very modest. Additional recovery of silver at current prices has considerable upside potential for the project and ongoing testwork should target improving this recovery.
The conceptual processing route chosen to recover gold and silver from oxide and transition material involves heap leaching at a treatment rate of 20,000tpd. The process comprises of a crushing plant supplying feed material to the heap leach processing circuit. Processing considers a primary gyratory crusher will reduce the run-of-mine (ROM) feed size to a P80 of 120mm. Primary crushed material will be stockpiled on a coarse ore stockpile and reclaimed by apron feeders. Secondary and tertiary crushing will reduce the size of material to a nominal minus 100% passing 19mm (¾"). Fine crushed material will be screened and fed to a fine ore bin. Material will discharge the fine ore bin through dump gates onto a conveyor where lime is added before feeding into the truck loadout bin. Material will discharge from the truck loadout bin into 91t haul trucks and transported to the heap le ach pad where it will be stacked. Gold and silver will be leached using sodium cyanide solution. The gold and silver will then be recovered from pregnant leach solution in a Merrill Crowe plant. Zinc precipitate will be mixed with fluxes and smelted to produce silver-gold doré, the final product from the processing facility.
1.5
Operating Cost Estimate
Mine production activities are considered to be performed by a mining contractor. The unit mining cost was estimated to be US$1.87/t moved.
Conceptual process operating costs, broken down into operating labor, maintenance labor, power, process consumables, maintenance spares and rehandling, are summarized in Table 1-2.
1-5
Table 1-2: Process Operating Costs
| | |
Category | Annual Cost US$ | Cost US$/t Processed |
Operating Labor | 836,700 | 0.11 |
Maintenance Labor | 378,200 | 0.05 |
Power | 2,345,563 | 0.32 |
Reagents and Consumables | 19,458,055 | 2.67 |
Spares | 1,100,000 | 0.15 |
Re-handling | 3,650,000 | 0.50 |
TOTAL | 27,768,518 | 3.80 |
The general and administration cost was estimated to be US$0.42/t processed.
1.6
Capital Cost Estimate
The Project’s initial capital cost to treat 20,000tpd was estimated to be US$133.8 million (±35% accuracy) and is summarized in Table 1-3. Costs are expressed in first quarter 2009 US dollars.
Table 1-3: Initial Capital Cost Summary
| |
Item | US$ (000’s) |
Direct Field Costs | |
Project Direct Costs | 81,356 |
Total Direct Field Costs | 81,356 |
| |
Indirect Costs | |
Project Indirect Costs | 20,622 |
Total Indirect Field Costs | 20,622 |
| |
Contingency | 30,593 |
Other Costs | 1,200 |
Total Project Costs | 133,770 |
Capital costs are confined to the battery limits of ROM delivery to the primary crusher dump hopper, barren solution distribution, pregnant solution handling, precipitation, smelting, raw water delivery and tie-in to the main power transmission line as defined in the equipment list, process flowsheets, and the narrative of the technical assessment document. Costs have been included for the initial haul road, waste haul road and in-plant roads.
As mining is assumed to be performed on a contract basis, initial and sustaining mine fleet capital requirements will be the responsibility of the contractor.
1-6
1.7
Economic Analysis
Estimated capital and operating costs, preliminary metallurgical parameters and projected third party refining and transportation charges were incorporated into a proforma, 100% equity, pre-tax cash flow model to evaluate project economics. A treatment rate of 20,000tpd was considered. The cash flow indicates that the project generates an IRR of 32.5% with an NPV at a 5% discount rate of US$195 million (assumes the prices of gold and silver are US$750 per ounce and US$13.50 per ounce respectively). The base case cash operating cost is estimated to be approximately $340/oz gold (includes credit for silver). The Project’s sensitivity to variations in capital cost, operating cost and metal prices in terms of NPV at 5% is shown in Figure 1-1. The effect of metal prices on the undiscounted cashflow, NPV at 5% and IRR is shown in Table 1-4.
Figure 1-1: NPV at 5% - Sensitivity Analysis
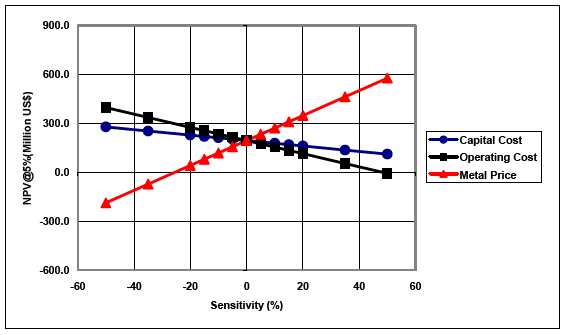
Table 1-4: Effect of Metal Prices on Project Economics
| | | | | |
Alternative | Metal Price (US$/oz) | NPV (US$ M)(ii) | IRR(ii) |
Au | Ag | 0% | 5% | % |
Base Case | 750 | 13.50 | 313.4 | 194.9 | 32.5 |
Alternative 1 | 850 | 15.30 | 457.5 | 296.8 | 44.7 |
Alternative 2 | 950 | 17.10 | 601.6 | 398.7 | 56.5 |
Spot Price(i) | 1036 | 17.19 | 711.9 | 477.2 | 65.7 |
(i)
=Source: www.Kitco.com on 6 October, 2009.
(ii)
=Amounts are on a Pre-Tax Basis.
The project economics at treatment rates of 15,000tpd, 20,000tpd and 25,000tpd were evaluated to assess the affects on IRR and NPV at 5%. Although these results indicate the maximum NPV at 5% and IRR are achieved at a throughput of 25,000tpd, the improvement is minimal.
1-7
The operational plans prepared by MQes as part of these economic analyses are preliminary in nature and too speculative to be categorized as mineral reserves under NI 43-101 guidelines.
1.8
Project Development Schedule
Assuming there are no a major impediments (land ownership, environmental impact study, permitting, etc.) to project development, and with no attempt to fast track the project schedule, it is estimated that approximately 4 years will be required to bring the Camino Rojo project into production.
1.9
Conclusions and Recommendations
The 2007 and 2008 exploration work on the Represa zone has identified a potentially economic gold-silver deposit with the continuity of a large, intrusive-related mineralizing system. Additional in-fill, technical and condemnation drilling will be required prior to a pre-feasibility study. It is the opinion of Minorex that continued exploration is justified.
Future exploration work should involve continued drilling of the Represa zone to better define the estimated resources, and to provide bore hole information for preliminary geotechnical, hydrological, environmental and site design studies required prior to a pre-feasibility study. In addition, there are several coincident geological, geochemical and/or geophysical exploration targets on the property that should be investigated during the advanced exploration work on the Represa zone. The following recommendations have been subdivided accordingly:
1)
Represa Zone
·
Carry out strategically-sited, in-fill diamond drilling to better define the mineral resources and provide bore holes for hydrological studies and/or samples for advanced metallurgical, geotechnical, and acid base accounting studies. The sites of such drilling will be determined by the technical personnel and project consultants involved with the various studies at the time;
·
Conduct reverse circulation and diamond drilling around the periphery of the known mineralization to delineate the limits of mineralization for pit slope design and geotechnical studies. This drilling should be continued to depths determined by preliminary pit design work;
·
Commence preliminary condemnation drilling of possible sites for waste dumps, leach pads and processing facilities. Bore holes should provide samples for sterilization determinations and sites for hydrological and environmental testing; and
·
All bore hole sampling should be subject to strict quality assurance – quality control protocols.
1-8
2)
Property-wide Exploration
·
Prospect, geologically map and sample the exploration target areas within the property;
·
Conduct reconnaissance induced polarization surveys over high priority exploration targets; and
·
Excavate trenches across any coincident geological, geochemical and/or geophysical targets, and map and sample the exposed bedrock.
The estimated expenses for the above recommended drilling and exploration program total US $4.35 Million.
Conclusions and recommendations from the technical assessment performed by MQes are as follows:
·
Metallurgical testwork results show higher than expected differences between calculated and assayed head samples. This casts doubt on the accuracy of some reported metal recoveries. Consequently, gold and silver recovery values should be treated with caution until additional testwork is performed to substantiate them. It is recommended that in ongoing testwork such differences are resolved by either re-assaying samples or repeating tests. Canplats should consider establishing a QA/QC program for future metallurgical testwork which involves submitting assays standards to the laboratory for confirmation checks.
·
The nominal crush size used in the technical assessment was 0.75 inches. This can be achieved with a three stage crushing circuit. A finer crush size would likely require an additional crushing stage and add to the capital for the project. There is insufficient testwork data at this time to support a final crush size. The 0.75 inch crush size has been chosen as a suitable interim size for this assessment. It is recommended the effect of crush size on gold and silver recoveries is further evaluated.
·
Column leach tests indicate that in general gold recovery is higher for oxide material than transition material; as expected. Silver recoveries are consistently higher in transition samples than in oxide samples. This is not as expected, however, it is noted that the head grades for silver in the transition material tested was slightly higher than in the oxide material and may partially explain this discrepancy. It is recommended that mineralogical evaluations be initiated to identify if there are reasons other than head grade for this. Maximum gold and silver recovery for oxide material is achieved between 40 and 50 days. It is recommended that additional testwork be performed to confirm this. For the purposes of the technical assessment a leach cycle of 45 days was chosen.
·
Bottle roll tests indicate gold and silver dissolution is essentially complete after 48 hours. Neither gold nor silver recoveries show clear distinction between oxide, transition and sulphide samples. It is expected that oxide samples would show consistently higher recoveries followed by transition and then sulphide samples. Issues that can cloud this effect are head grade and crush/grind size. It is recommended that Canplats check sample classifications (oxide, transition and sulphide) against their criteria and that mineralogical evaluations be performed to identify potential reasons.
1-9
·
Given the preliminary nature of the flotation tests to date, some encouraging results have been obtained. Additional flotation testwork is warranted and it is recommended that this be focused on sulphide material.
·
In order to advance the project to a pre-feasibility study level, additional metallurgical testwork is required. This testwork should focus on the recovery of gold and silver from the oxide and transition zones in order to better define metallurgical responses as well as develop criteria for ongoing engineering assessment. The recovery of silver in the testwork performed to date has been very modest. Additional silver recovery at current prices has considerable upside potential for the project and ongoing testwork should target improving this recovery. A secondary objective of future testwork should be to begin assessing the treatment of sulphides material.
·
It is recommended that the selection of metallurgical samples for ongoing metallurgical testwork be coordinated with Canplat’s geological staff to ensure that representative samples of the different zones and rock types are correctly chosen. The testwork goal should be to develop a geo-metallurgical model of the deposit which can be used to reasonably predict metallurgical responses. As mine planning progresses, it is recommended that metallurgical testwork samples be chosen which are representative of the mine plan and emphasize the early period of production. These samples should be tested to confirm that the metallurgical response is consistent with that predicted from the geo-metallurgical model.
·
The process developed for this assessment does not consider agglomeration of material for heap leaching. It is recommended that this be evaluated in ongoing testwork.
·
Assuming there are no major impediments (land ownership, environmental impact study, permitting, etc.) to project development and with no attempt to fast track the project schedule it is estimated that approximately 4 years is required to bring the Camino Rojo project into production.
·
It is recommended that work be commenced/progressed in the areas of land ownership, permits, geotechnical and hydrological investigations, metallurgical testwork, ARD testwork, infrastructure and environmental, so that the project can be advanced to a pre-feasibility study level
·
This technical assessment has addressed the treatment of oxide and transition material via heap leaching. Some of the metallurgical testwork to date indicates significantly higher recoveries for gold and silver at fine grinds. It is recommended that a CIP/CIL processing route be evaluated upon better definition of metallurgical recoveries. Evaluation of a ROM leaching alternative should also be considered.
·
Mine planning has assumed several basic design criteria. It is recommended that geotechnical and hydrological studies be performed to more definitively determine such criteria. Geotechnical studies should develop detailed slope design recommendations and hydrological studies should address pit dewatering requirements and costs from ground water intrusion and precipitation.
1-10
·
It is recommended that the ultimate pit design be re-evaluated using project specific geotechnical design criteria
·
Environmental impact studies should be performed that address the potential for ARD and environmental contamination from the waste storage area. Lake water chemistry (assuming the pit will flood when abandoned) should also be studied and mine closure reclamation requirements and a cost estimate developed.
·
Estimated contract mining costs have been developed. It is recommended that quotations from a recognized contract mining company be obtained using the mine plan prepared for the technical assessment.
·
It is recommended that owner operated mining be evaluated to determine its affect on the project economics. This will also help evaluate the contract miner quotations.
·
Future mine planning should investigate different phasing options, including splitting mining phase three into two parts.
·
A counter-clockwise ramp design was assumed for the technical assessment. It is recommended that future mine planning investigate other ramp layouts, including a clockwise design.
·
Mine planning for the technical assessment considered only in-pit road layouts. It is recommended that future mine planning include both in-pit and ex-pit road layouts.
·
The location of the waste storage area needs to be confirmed and condemnation drilling performed.
·
A detailed design of the waste storage area should be prepared, showing its build-up on an annual basis.
·
It is recommended that the drill density in the toe areas of the ultimate pit be investigated.
·
The northern edge of the open pit identified in this technical assessment extends onto land for which Canplats does not currently hold a mining concession. At this time, the area involved solely contains waste that must be removed in order to expose mineral resources that lie within Canplats’ mining concessions. Thus it is recommended that mining concession(s) for this area be acquired, or an arrangement to allow waste mining on the adjacent concession be made, as soon as possible.
·
MQes understands that Canplats is negotiating for the acquisition of surface rights for the project area. MQes recommends that this acquisition be completed as soon as possible.
·
The initial capital cost for the project is estimated to be $133.8 million with an accuracy of ±35%. In order to improve the accuracy of this estimate it is recommended that meteorological, geotechnical and hydrological data for the site be obtained. Other information that is required includes water availability (quantity and quality), power supply criteria/battery limits, local community infrastructure requirements, condemnation drilling, detailed topographical data and additional engineering.
·
The estimated operating costs for the project are $3.80/t material processed, $0.42/t material processed for general and administration and $1.87/t material moved for mining. The processing and G&A costs were based on preliminary data from metallurgical testwork and MQes in-house data for labor costs. Budgetary quotations have been obtained for reagent and consumable costs. It is recommended that reagent and consumable consumption rates be updated upon completion of additional testwork. Staffing levels should be confirmed, and accurate operating labor costs obtained for the project area, along with a more detailed build up of the general expenses.
1-11
·
A proforma, 100% equity pre-tax cash flow model indicates that at a treatment rate of 20,000tpd, the Camino Rojo project generates an IRR of 32.5% with an NPV at a 5% discount rate of US$195 million (assuming the prices of gold and silver are US$750 per ounce and US$13.50 per ounce respectively). The base case cash operating cost is estimated to be approximately $340/oz gold (includes credit for silver). The project is most sensitive to metal price/production followed by operating cost and capital cost.
·
Economic evaluations of 15,000tpd, 20,000tpd and 25,000tpd processing rates indicate that for the current resource, the 25,000tpd alternative yields the highest IRR and NPV at 5%. However, the improvement from 20,000tpd to 25,000tpd is within the accuracy of the evaluations.
The estimated expenses for the above recommended pre-feasibility work program totals US$1.99 Million, which combined with the recommended drilling and exploration programs brings the entire budget to US$6.34 Million. This budget is considered suitable for initiating the studies/work required for a pre-feasibility study but may need supplemental funding.
1-12
SECTION 2
INTRODUCTION AND TERMS OF REFERENCE
2.0
INTRODUCTION AND TERMS OF REFERENCE
The Camino Rojo property is situated near the town of San Tiburcio, approximately 206 kilometres northeast of the state capital city of Zacatecas in Zacatecas State, Mexico. The property is comprised of six mining concessions and one fractional concession, totalling 319,927 hectares or approximately 1,235 square miles, that are owned and operated by Canplats de Mexico, S.A. de C.V. (“Canplats Mexico”), a wholly-owned subsidiary of Canplats Resources Corporation (“Canplats”).
At the request of Canplats, Minorex reviewed and compiled the 2007 and 2008 exploration results, estimated the mineral resources of the Represa zone within the property, and prepared the relevant sections of this independent technical report with recommendations for future exploration work. In April, 2009 MQes was retained to perform a technical assessment of the project which evaluated the treatment of oxide and transition material in the Represa zone via heap leaching to recovery of gold and silver. The assessment included:
·
Reviewing metallurgical testwork data, preparing comments on the testwork and recommending ongoing metallurgical testwork programs.
·
Prepare conceptual process flowsheets for recovering gold and silver via heap leaching through to the production of doré at a treatment rate of 20,000tpd.
·
Preparing a major stream material balance for the proposed process flowsheets.
·
Preparing preliminary process design criteria.
·
Performing equipment sizing for major equipment and developing a major equipment list.
·
Preparing a preliminary electrical load analysis.
·
Preparing preliminary general arrangement drawings for crushing and gold recovery facilities as well as sketches for ancillary facilities.
·
Preparing a preliminary general site plan identifying the locations of the process plant and major ancillary facilities.
·
Developing a conceptual level capital cost estimate for the project.
·
Developing operating cost estimates for the proposed plant.
·
Developing general and administration cost estimates.
·
Preparing a Base Case pre-tax cashflow indicating expected net present value and internal rate of return.
·
Preparing a preliminary mine plan and production schedule.
·
Preparing a conceptual project development schedule.
The results of this study were presented in a report titled “Technical Assessment, Camino Rojo project, Zacatecas, Mexico” and is the basis on which the relevant sections of this report have been prepared. Use of the term “Ore” throughout this report is intended for mine design purposes but does not imply economic viability of currently defined resources. Under NI 43-101 reporting requirements, mineral resources that are not reserves do not have demonstrated economic viability.
2-1
This report has been prepared in accordance with the formatting requirements of National Instrument 43-101 (‘NI 43-101’) and Form 43-101F1 (Standards of Disclosure for Mineral Properties). It is intended to be read in its entirety.
2.1
Sources of Information
Mr. J. Douglas Blanchflower, an independent qualified person according to NI 43-101, visited the Camino Rojo property on February 8, 2008. Mr. Blanchflower examined the surface areas of the Represa and Don Julio zones; collected nine verification samples; and reviewed drilling results, sampling and shipping procedures, geological and geotechnical logging techniques, surveying records and documentation procedures with the field geological personnel. A technical report was later prepared by Minorex, titled ‘Technical Report on the Camino Rojo Property, Concepciòn del Oro District, Zacatecas, Mexico’ and dated June 18, 2008. This report is available for viewing or downloading from SEDAR.
Upon completion of the 2007-2008 drilling program in August 2008, Canplats provided Minorex with all exploration data, assay and analytical results, maps, company reports and other public and private information required to compile a database for estimation of the mineral resources within the Represa zone. Canplats also provided cross-sectional interpretations of the mineral distribution and oxidation boundaries of the mineralization. Minorex has no reason to believe that any of the information is inaccurate. Consistent with Form 43-101F1, portions of this report concerning information that has not changed substantially since January, 2009 are abbreviated since it was documented in detail by Minorex’s June 18, 2008 and January 5, 2009 technical reports (Blanchflower, 2008 and 2009).
Canplats contracted Ms. Caroline Vallat of GeoSpark Consulting, based in Nanaimo, British Columbia, to collate, compile, analyse and document their 2007 and 2008 Quality Assurance and Quality Control results. Minorex has referenced this work in the ‘Sample Verification’ section of this report. Survey documents pertaining to the locations of the relevant mining concessions and their current status were provided by Canplats, effective October 15, 2008. These documents were in addition to previous property status information and an earlier title opinion referenced in the technical report by Blanchflower (2008).
Mr. Blanchflower (Minorex) relies on over 38 years of field experience with intrusion-related precious metal deposits similar to that within the subject property. Minorex has assumed that all of the referenced information and technical documents are accurate and complete in all material aspects. All sources of information have been listed in the ‘References’ section of this report.
2-2
2.2
Units of Measure
Metric units are used throughout this report unless otherwise stated. A list of abbreviations that may be used in this report is provided below.
| | | |
°C | degree Celsius | % | percent |
°F | degree Fahrenheit | km2 | square kilometres |
CDN $ | Canadian dollars | kW | kilowatt |
cm | centimetre | l | litre |
cm2 | square centimetres | m | metre |
cm3 | cubic centimetres | m2 | square metres |
ft | feet | m3 | cubic metres |
ft2 | square feet | AMSL | above mean sea level |
ft3 | cubic feet | mm | millimetre |
g | gram | m.y. | million years |
g/t | gram per tonne | opT | ounces per short ton |
hr | hour | oz | troy ounce (31.1035 g) |
ha | hectare | ppm | part per million |
in | inch | ppb | parts per billion |
K | kilo (thousand) | T | short ton |
kg | kilogram | t | metric tonne |
km | kilometre | US$ | United States dollar |
2-3
SECTION 3
RELIANCE ON OTHER EXPERTS
3.0
RELIANCE ON OTHER EXPERTS
Minorex has relied on the following individuals to provide necessary information during the preparation of this report. Messrs Kenneth McNaughton, Canplats Qualified Person and Vice President Exploration until January, 2009, and Bruce Youngman, Canplats President and Chief Operating Officer, provided corporate information and data for the 2007 and 2008 exploration work. Mr. Zoran Lukic, Canplats Database Manager until January, 2009, provided drilling and assay data for the collation and compilation of the drilling database. Minorex considers the information of good quality and has no reason to believe that any of the information is inaccurate.
The November 26, 2008 report on the 2007 – 2008 Quality Assurance and Quality Control program, prepared for Canplats by Ms. Caroline Vallat, G.I.T., has been referenced and quoted in this report. In addition, other references to the title opinion by Mr. J. M. G. Olguin (2008); geological work, including the regional mapping and diamond drill core logging, undertaken by Mr. Tom Turner on behalf of Canplats; and the geophysical survey report titled ‘Report on Induced Polarization Surveys’ by Gerard Lambert, P. Eng., have been quoted in this report. Minorex considers the information contained in these reports of high quality and has no reason to believe that any of the information is inaccurate.
Minorex was not involved in any exploration work on the Camino Rojo property, and therefore this report has made extensive reference to the works undertaken by other qualified geologists, geophysicists and field personnel. Other non-project specific reports by qualified personnel have been referenced whenever possible. MQes has not carried out any independent exploration work, drilled any holes nor carried out any sampling and assaying.
The various agreements under which Canplats holds title to the mineral lands for the Camino Rojo project have not been investigated or confirmed by MQes or Minorex. MQes and Minorex were provided a list of tenements by Canplats and their land title lawyer (Bufete González Olguín, S.A.) for the concessions Camino Rojo, Camino Rojo 1, Camino Rojo 1 Fracc. A, Camino Rojo 2, Camino Rojo 3, Camino Rojo 4 and Camino Rojo 5. Canplats provided details for the Los Cardos concession. MQes/Minorex have relied upon the legal due diligence of Canplat’s land title lawyer and upon Canplats Resources Corporation to confirm the validity of the mineral title claimed by Canplats.
This report is for the sole use of Canplats Resources Corporation. It is not intended to be a guarantee of mineral title, nor is it intended to be a thorough description of past, existing, or future option, sale, or title agreements, nor is it intended to include a thorough description of all possible liabilities, environmental or otherwise, of assessment, access, land claims, and exploration requirements and programs completed, planned, or contemplated.
3-1
SECTION 4
PROPERTY DESCRIPTION AND LOCATION
4.0
PROPERTY DESCRIPTION AND LOCATION
4.1
Property Location
The property covers the area near the town of San Tiburcio within the southern portion of the Concepciòn del Oro district in the northeastern part of Zacatecas State, Mexico; approximately 206 kilometres northeast of the state capital city of Zacatecas. The geographic centre of the property is at 24˚00’ North latitude by 101˚45’ West longitude or U.T.M. 2,655,000 m North by 220,000 m East, within Mexico map sheets G14-10 and F14-1 (see Figures 4-1, 4-2 and 4-3).
4.2
Property Description
Canplats de Mexico, S.A. de C.V. is a mining company incorporated and existing pursuant to the laws of the United Mexican States. Canplats Mexico has been duly formed and exists per the terms of Public Instrument No. 10815, dated November 19, 2003 (Olguin, 2008).
The property is comprised of seven mining concessions with one of the mining concessions being subdivided as a fractional portion (see Figure 4-2 and Table 4-1). The mining concessions are dominantly located in the municipality of Mazapil, State of Zacatecas with the extreme southeastern corner of the property extending into the State of San Luis Potosi, Mexico (see Figure 7-1). According to concession applications filed by Canplats Mexico at the General Mining Bureau within the Ministry of Economy in Mexico City through the Mining Agency No. 8093 for Zacatecas (Olguin, 2008) and information provided by Canplats (2008), the mining concessions appear to be in good standing and owned by or are currently being transferred into Canplats Mexico.
4-1
Table 4-1: Summary of Mining Concession Data
| | | | |
Name of | Surface | Title | Date of | Date of |
Mining Claim | Area (ha) | Certificate | Title | Expiry |
Camino Rojo | 8,340.7905 | 230914 | 6-Nov-2007 | 5-Nov-2057 |
Camino Rojo 1 | 88,897.3255 | 231922 | 16-May-2008 | 15-May-2058 |
Camino Rojo 1 Fracc. A | 96.8888 | 231923 | 16-May-2008 | 15-May-2058 |
Camino Rojo 2 | 17,847.4398 | 232076 | 10-Jun-2008 | 9-Jun-2058 |
Camino Rojo 3 | 30,050.0000 | 232014 | 3-Jun-2008 | 2-Jun-2058 |
Camino Rojo 4 | 20,640.0000 | 232644 | 2-Oct-2008 | 1-Oct-2058 |
Camino Rojo 5 | 154,055.0200 | 232647 | 2-Oct-2008 | 1-Oct-2058 |
Los Cardos | 19,002.5020 | 232652 | 2-Oct-2008 | 1-Oct-2058 |
| | | | |
| Total Area: | 338,929.97 | hectares | |
| or | 1,308.62 | sq miles | |
4-2
Figure 4-1: Location Map
4-3
Figure 4-2: Mineral Concessions Map
4-4
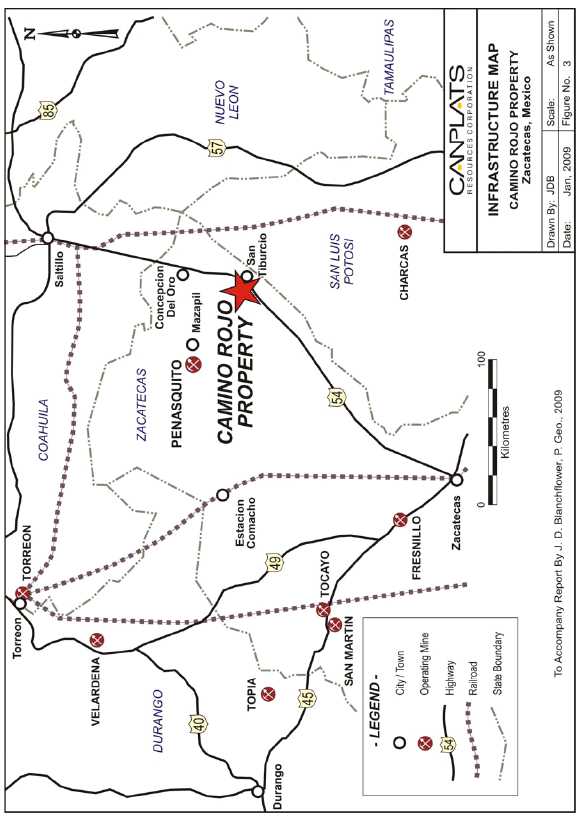
Figure 4-3: Infrastructure Map
4-5
4.3
Property Ownership
Canplats de Mexico, S.A. de C.V., a wholly-owned subsidiary of Canplats Resource Corporation, owns entirely (100%) the rights to the six ‘Camino Rojo’, ‘Camino Rojo 1’, ‘Camino Rojo 2’, ‘Camino Rojo 3’, ‘Camino Rojo 4’ and ‘Camino Rojo 5’ mining concessions and the one fractional concession, ‘Camino Rojo 1 Fracc. A’. The titles to these mining concessions have been granted to Canplats Mexico by the Mexican Ministry of Economy for a period of 50 years, and are reportedly free of liens and encumbrances (Canplats, 2008; Olguin, October 7, 2009). The title to a seventh mining concession, the Los Cardos mining concession, is currently being transferred into Canplats de Mexico S.A. de C.V.
All minerals found in Mexico are the property of the government of Mexico, and may be exploited by private entities under concessions granted by the Mexican federal government. The process was defined under the Mexican Mining Law of 1992, and excludes petroleum and nuclear resources from consideration. The Mining Law also requires that non-Mexicans entities must either establish a Mexican corporation, or partner with a Mexican entity.
Under current Mexican mining law, amended April 29, 2005, the Direccion General de Minas (‘DGM’) grant concessions for a period of 50 years, provided the concession is maintained in good standing. There is no distinction between mineral exploration and exploitation concessions. As part of the requirements to maintain a concession in good standing, bi-annual fees must be paid based upon a per-hectare escalating fee, and a report submitted to the DGM each May. This report covers work conducted over the previous year on the concession.
The northern edge of the open pit identified in this technical assessment extends onto land for which Canplats does not currently hold a mining concession. To clarify, the mineral resources identified in this technical assessment are located entirely within the mining concessions held by Canplats. While it is possible that the northern portion of the open pit may contain economically viable extensions of the Represa Zone, the existence of such extensions is currently unknown. As such, this technical assessment assumed only waste will be mined from this area; however, without such waste mining a portion of the mineral resources identified in this technical assessment may be inaccessible by open pit.
4.4
Environmental, Reclamation and Permitting Issues
Minorex is not aware of any outstanding environmental, reclamation or permitting issues that would impact future exploration work. All drill sites were cleaned and rehabilitated on an ongoing basis. Future exploration work will require the usual permitting requirements and reclamation commitments appropriate with work in this area.
4-6
SECTION 5
ACESSIBILITY, CLIMATE, LOCAL RESOURCES, INFRASTRUCTURE and PHYSIOGRAPHY
5.0
ACCESSIBILITY, CLIMATE, LOCAL RESOURCES, INFRASTRUCTURE and PHYSIOGRAPHY
5.1
Accessibility
The property is dominantly situated along a wide, flat valley near the town of San Tiburcio. San Tiburcio is situated on Mexican highway 54, a well-maintained, paved highway linking the major city of Zacatecas in Zacatecas State with Saltillo in Coahuila State (see Figure 4-3). Both of these cities have airports with regularly scheduled flights south to Mexico City or north to the U.S.A.
There are numerous gravel roads within the property linking the surrounding countryside with the two highways, Highways 54 and 62, which transect the property (see Figures 4-2 and 4-3). There are very few locations within the property that are not readily accessible by four-wheel drive vehicles.
5.2
Physiography, Climate and Vegetation
The broad valley around San Tiburcio is bounded to the north by the low rolling hills of Sierra La Arracada and Sierra El Barros, to the east by Sierra La Cucaracha, and to the south by the Sierra Los Colgados. The terrain is generally flat. Bedrock exposures are rare, limited to road cuts or creek beds. The elevations within the property range from approximately 1,850 to 2,460 m AMSL and relief is low.
The climate is typical of the high altitude Mesa Central, dry and semi-arid. Annual precipitation for the area is approximately 700 mm, mostly during the rainy season in June and July. Temperatures commonly range from +30o to 20o C in the summer and 15o to 0o C in the winter.
The vegetation is dominantly scrub bushes with cacti, maguey, sage and coarse grasses with rare yucca. The natural grasses are used to locally graze domestic livestock. Wild fauna is not abundant but several varieties of birds, rabbits, coyote, lizards, snakes and deer reportedly inhabit the area.
5.3
Local Resources and Infrastructure
There is a good network of road and rail services in the region. Road access to most of the property is possible via numerous gravel roads from both Highways 54 and 62. In addition, there is a railway approximately 40 km east of San Tiburcio that crosses both highways, and there is a high voltage power line transecting the property near San Tiburcio which might be accessed for future electrical requirements. See accompanying Figure 4-3 showing the regional transportation corridors.
5-1
The project site is generally flat with adequate space for any future development of mining and processing facilities. Surface rights are owned by local cooperative farmers, landowners and ranchers, and their permission is required to conduct any physical work. Any drilling access roads should be planned to assist the locals with access. Gates and/or cattle guards would be required. It is MQes’ understanding that Canplats is negotiating for the acquisition of surface rights for the project area.
Ground waters are currently being purchased from owners of local wells and trucked to the site for drilling fluid. Future exploration efforts should consider acquiring water rights within the property and casing any water producing drill holes. Most exploration supplies may be purchased in the nearby historic mining cities of Zacatecas, Fresnillo and Saltillo. Experienced mining personnel are available locally and from nearby mining towns of Concepciòn del Oro and Mazapil.
5-2
SECTION 6
HISTORY
6.0
HISTORY
Mexico is the second largest silver producer in the world (96.4 million ounces per annum), after Peru. It used to be the top global silver producer (http://www.silverinstitute.org/supply/production.php , 2008). This position is chiefly due to production from Zacatecas state, at Fresnillo and Somberete, which produces more silver than all the other Mexican states combined (http://www.coremisgm.gob.mx/productos/anuario/).
Zacatecas was founded in 1546, after the discovery of silver vein systems by Juan de Tolosa; although, it likely experienced some pre-Hispanic mining. In a little more than a century afterwards, Zacatecas became Mexico’s largest silver producer, and the city was the second largest in the country after Mexico City. As with many other mining districts in Mexico, production ceased during the Mexican Revolution of 1910 to 1917 but resumed in some areas by about 1936. Historic silver production estimates exceed 1.5 billion ounces from the state, and 750 million ounces from the Zacatecas district (Ponce and Clark, 1988).
The Mesa Central region near Concepciòn del Oro and San Tiburcio has experienced many periods of exploration and mining since the Spaniards. Recent exploration activity led to the discovery, exploration and development of the Peñasquito gold-silver-lead-zinc mine owned by Goldcorp (2009). The Peñasquito property has two main deposits, called Peñasco and Chile Colorado, that are being developed for open pit mining.
According to Goldcorp (http://www.goldcorp.com/operations/penasquito/project_
summary, 2009), “At December 31, 2008, proven and probable gold reserves totalled 17.4 million ounces. Silver reserves totalled 1,045.7 million ounces while lead and zinc rose to 7.07 million tonnes and 15.36 million tonnes respectively. Measured and indicated gold resources, inclusive of proven and probable reserves, increased 39% to 17.8 million ounces. Measured and indicated silver resources increased 55% to 1.3 billion ounces.
Mechanical completion at Peñasquito was achieved as of mid-July, 2009. Construction of the first sulphide process line (Line 1) is complete and commissioning work is advancing on schedule. The primary crusher is complete and has filled the coarse ore stockpile with crushed ore in preparation for initial milling. The Line 1 feeders and conveying systems are complete. Construction of the Line 1 SAG mill and two ball mills is complete and commissioning is under way. The Line 1 lead and zinc flotation circuits are essentially complete.
Annual production over the life of mine (estimated 22 years) is expected to ramp up to approximately 500,000 ounces of gold, 30 million ounces of silver and over 400 million pounds of zinc.”
6-1
The Camino Rojo gold-silver occurrence is a new discovery with no obvious evidence of prior exploration. According to Canplats, two contract geologists were driving along the gravel road north of San Tiburcio when they saw gossanous red gravel along the shoulder of the road. They returned to San Tiburcio and inquired where the source was for the local road building material. When told, they found a quarried ‘borrow’ pit approximately 500 m off the road that had exposed highly fractured and hematitized limy siltstone-sandstone bedrock, now called the ‘Represa’ zone. They collected samples of the gossanous bedrock material and sent the samples for analysis. Initial assay results returned values of 0.5 to over 1 g/t gold and 5 to 30 ppm silver with low lead and zinc values. These results led to the staking of the original ‘Camino Rojo’ (Red Road) mining concession which covered the site of the quarry and bedrock discovery.
Since its discovery Canplats has expanded the property; carried out geological mapping, geophysical surveying; excavator trenching and test pitting; and drill testing.
6-2
SECTION 7
GEOLOGICAL SETTING
7.0
GEOLOGICAL SETTING
This section has been summarized from the discussion of geology in the recent technical report by Blanchflower (2008). It is included to provide context for the mineral resources of the Represa zone but it is not essential to the resource estimation.
The following text is derived largely from regional geology maps and reports by the Servicios Geologico de Mexico (‘SGM’, 2007) and on geological reports by Mr. Tom Turner, a geological consultant to Canplats, who has worked extensively throughout the region (see accompanying Figures 7-1 to 7-5).
7.1
Regional Geology
The Camino Rojo gold-silver-lead-zinc prospect is situated in the southern part of the Concepciòn del Oro mineral district, a well-known silver-gold-copper-lead-zinc mineral district in northcentral Mexico. The district is situated regionally within the Mexico Geosyncline, a Jurassic- to Cretaceous-age, shelf-margin, carbonate sequence that sits unconformably on a basement of metamorphic rocks and is conformably overlain by a back-arc successor basin of Cretaceous-age marine siltstone-sandstone flysch origin.
Basement rocks are comprised of metamorphosed and complexly folded, subaerial to submarine rhyolite with lesser intercalated carbonaceous pelitic sediments and chloritic tuff ranging in age from Paleozoic to middle Precambrian. These rocks were unconformably overlain in Triassic time by a thin, irregular sequence of tuffaceous red beds, called the ‘La Joya’ Formation, and its more regional equivalent called the ‘Huizachal’ Formation. The La Joya Formation represents possible erosion prior to the onset of marine transgression, but it is discontinuous due to a regional series of northwesterly striking, normal, horst- and graben-producing faults that were active during its deposition.
Mesozoic carbonate platform limestones overlie the red beds, representing deposition on a slowly subsiding shallow marine shelf. The limestone group has been subdivided into six formations (Imlay, 1947), from oldest to youngest, the late Jurassic ‘Zualoga’ and ‘Caja’ Formations are overlain by the ‘Traises’, ‘El Cupido’, ‘La Peña’ and ‘Cuesta de Cura’ Formations which range from early to middle Cretaceous in age.
A late Cretaceous carbonaceous and calcareous turbiditic flysch sequence, subdivided into the ‘Indidura’ and ‘Caracol’ Formations comprising fine-grained calcareous, carbonaceous siltstone with thin basal sands and occasional thick ribbon channel sands, conformably overlies the carbonate platform stratigraphy. The flysch sequence is considered to represent deposition in a back-arc successor basin which formed as a result of subduction of the Pacific Ocean plates beneath the North American plate.
7-1
The Caracol Formation, an important host rock within the Camino Rojo property, grades upwards to one additional formation, ‘Difunta’ Formation, which is a shallow water deltaic sequence that was deposited around the margins of the Coahuila Platform at the end of Cretaceous time (see Figure 7-1).
Northcentral Mexico was subjected to the compressional Laramide orogeny in Late Cretaceous to Early Tertiary time. The geosynclinal limestone-flysch sequence was folded across all of northcentral Mexico. Deformation shifted from compressive folding to translational faulting in Eocene time. The pre-existing regional northwesterly striking fault-bounded horst and graben structures were reactivated with right-lateral offset and renewed extension. These fault systems often cut across and displace the Laramide folds and northeasterly striking basement faults.
7-2
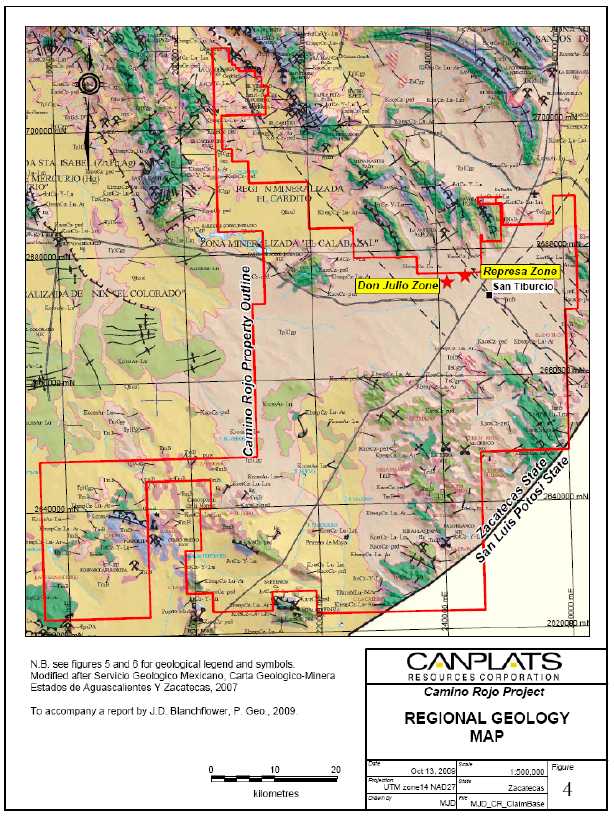
Figure 7-1: Regional Geology Map
7-3
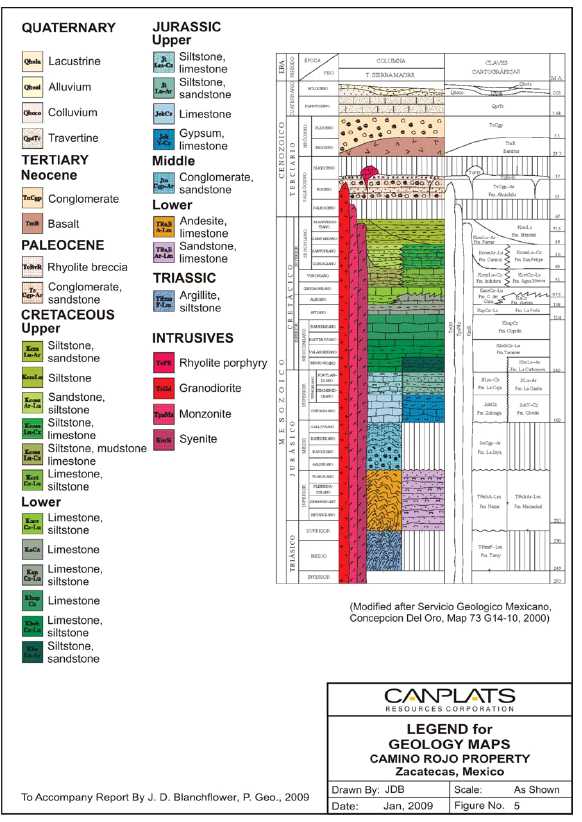
Figure 7-2: Legend for Geology Maps
7-4
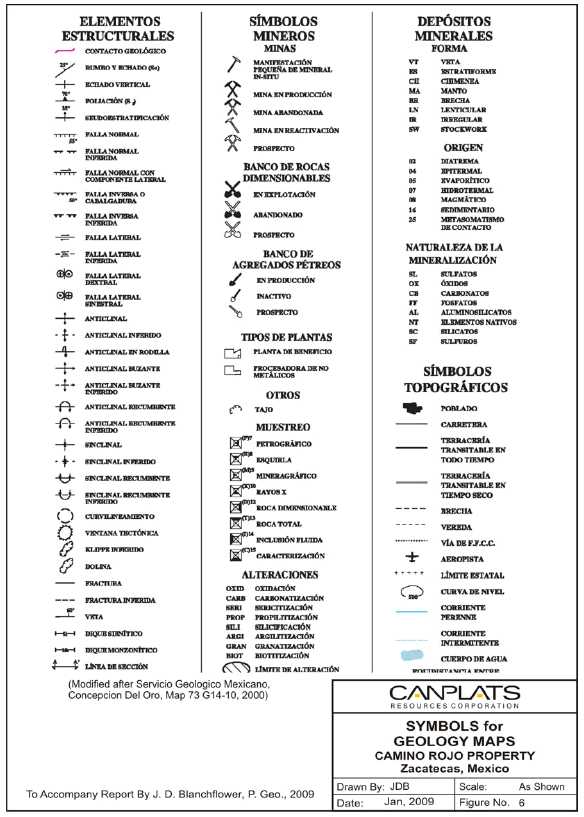
Figure 7-3: Symbols for Geology Maps
7-5
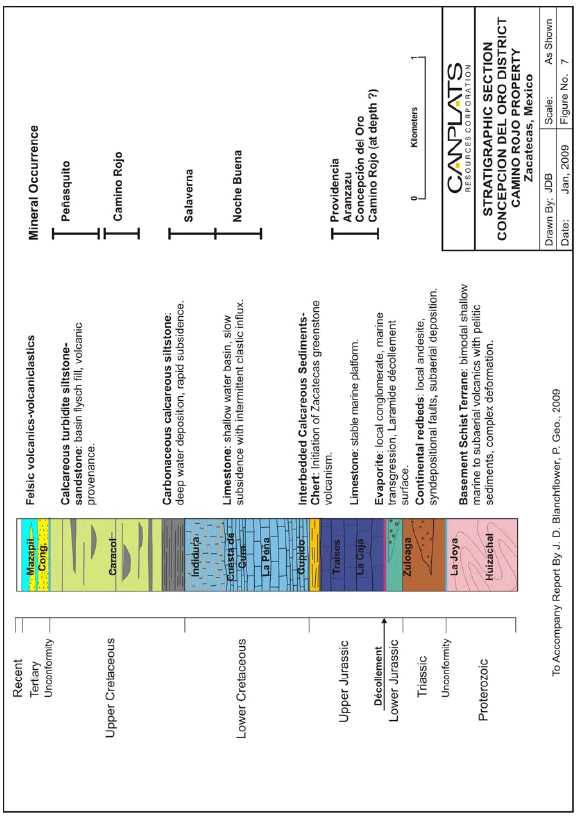
Figure 7-4: Stratagraphic Section Concepcion Del Oro District
7-6
The southern half of the Concepciòn del Oro mining district covers a series of subparallel sierras that strike east and curve around to the south. Several of these sierras are anticlines or limbs of anticlines that are cored by the Jurassic to Cretaceous-age limestone. The sierras are separated by synclinal valleys underlain by the Upper Cretaceous Indidura and Caracol Formations. The synclinal keels are generally wide and flat lying with occasional small parasitic anticlines and drag folds along faults.
The Concepciòn del Oro district is bounded to the east and west by Eocene-age grabens that are filled with poorly consolidated alluvium. The western graben, named the ‘Cedros Graben’, has a regional north-northwesterly strike and is about five kilometres wide. It is bounded to the west by the Caopas horst block which is a regional northwesterly striking fault system that has been mapped for 250 kilometres from the village of San Tiburcio to Llano San Juan just east of Torreon, Coahuila.
Numerous intermediate to felsic stocks were emplaced across northcentral Mexico coincident with the Eocene translational deformation. They are a somewhat linear series of differentiated composite stocks that have a general east-west alignment. There are two age groups of intrusive rock that overlap in time. The older group ranges in age from 57 to 40 m.y. and tends towards weakly magnetic dioritic to granodioritic composition. The second set of intrusives ranges in age from about 30 to 20 m.y. and tends to be felsic in composition, usually described as dacitic to rhyolitic porphyry, quartz-feldspar porphyry and felsite. It is common to see the younger intrusions proximal or superimposed upon the older intrusives.
Coincident with the younger intrusive event, there were large eruptions of subaerial rhyolite ash flow tuff further to the west in the Sierra Madre Occidental. Slightly inboard or east of the rhyolite ignimbrite tuff, there is a regional series of elongate red rhyolitic flow domes that appear to have emplaced in an imbricated series of northwest-striking, shallow east-dipping extensional faults. They may represent the end of Laramide deformation, and the renewal of left-lateral translational-extensional fault offset.
Northcentral Mexico is famous for its mineral production, especially its rich silver deposits. Most of the mineral deposits are intrusive–related silver-gold-lead-zinc (+ copper) deposits. The styles of mineralization vary from low sulfidation epithermal vein deposits to limestone-hosted chimney, manto replacements and contact skarn deposits. Many of these deposits cropped out and were discovered by the Spanish in the late 16th century. Some of these deposits, such as Fresnillo, San Martin and Salaverna in Zacatecas State and Las Charcas and Santa Maria de la Paz in San Luis Potosi State are still in production.
Within the Concepciòn del Oro district, the Peñasquito property silver-gold-lead-zinc mineralization is hosted by intrusive-related stockwork veinlets and two diatreme breccias. Other district occurrences include the gold-copper-magnetite contact skarn and chimney deposits at Aranzazu on the western contact of the Concepciòn del Oro granodiorite, the silver-lead-zinc carbonate replacement deposits at Salaverna, and the copper-gold skarn deposits at Saltillito (see Figures 4-3 and 7-1).
7-7
Figure 7-5: Property Geology Map – North Sheet
7-8
7.2
Property Geology
The Camino Rojo property is situated in the southern half of the Concepciòn del Oro district at the possible junction of the regional northwesterly striking Caopas horst with the projected extension of the north-south trending San Carlos graben. It is in an area with very poor bedrock exposure, which may account for its mineralization not being recognized until recently. Most of the northern half of the property, except in the extreme northwestern corner, has been mapped as being extensively covered by alluvium (see Figure 7-5).
7.2.1
Lithology
Based upon 2006 regional mapping studies by the Servicios Geologico de Mexico, the oldest rocks within the property are reportedly Upper Jurassic limestones and cherts of the Zuloaga Formation that are overlain by a series of thinly bedded phosphatic chert and silty to sandy limestone units of the Upper Jurassic La Caja Formation, and by limestone and argillaceous limestone units of the Upper Jurassic to Lower Cretaceous Taraises and Cupido Formations. The Cupido Formation is in turn overlain by Lower Cretaceous cherty limestone of the La Pena Formation, the limestone units of the Cuesta del Cura Formation, a series of shales and calcareous siltstones and argillaceous limestones belonging to the Indidura Formation, and an Upper Cretaceous, interbedded shale and sandstone of the Caracol Formation. Tertiary-age conglomerate of the Mazapil Formation or erosion remnants of Tertiary basaltic flow and flow breccias are the youngest s tratigraphic units.
Drilling and trenching results indicate that much of the poorly exposed ‘Represa’ and ‘Don Julio’ zones are underlain by a thinly-bedded sequence of calcareous siltstones and calcareous sandstones belonging to the Upper Cretaceous Caracol Formation. According to Turner (2008c), the Caracol Formation is a thin to thick interbedded sequence of calcareous siltstone and sandstone with a distinct felsic volcaniclastic component in the sandy members. The bedding to core axis angles are consistently 70o to 80o implying a flat to very shallow dipping sequence with no folding and bedding tops up. Turner (2008c) has tentatively subdivided this upper formation into three members as follows:
·
Calcareous siltstone with more than 50% silty layers and moderate to thin bedding.
·
Calcareous sandstone with more than 50% sandy layers and coarse bedding up to 5 m thick.
·
Interbedded calcareous siltstone and sandstone with equal portions of silty and sandy layers and thin to moderate bedding.
All three members host fracture infilling and replacement mineralization with the more sandy members being better mineralized.
Trenching in the Represa zone has exposed a weak to moderate propylitically-altered hornblende-biotite granodioritic dyke cutting the calcareous sedimentary rocks. Channel sampling results indicate that gold- and silver-bearing mineralization increases adjacent to the dyke. Diamond drilling has also intersected two types of hydrothermally-altered intrusive breccia dykes cutting the limestone sequence (Turner, 2008c). They include a sedimentary clast breccia dyke and a mixed porphyry-sediment clast breccia dyke with a milled quartz porphyry groundmass. Both dyke types are reportedly propylitically altered but the sediment-clast breccia dyke is less altered. Turner (2008c) considers these dykes to be indicative of an advanced hydrothermal system spatially and genetically related to a buried calc-alkaline stock.
7-9
7.2.2
Structure
The central portion of the property is situated within the northwesterly striking Caopas horst that is bounded on the northeast and southwest by similarly-oriented strike-slip faulting (SGM, 2006). The Represa zone occurs immediately west of the eastern faulted boundary of the horst, and similarly oriented parasitic faults have been identified cutting the sedimentary country rocks within this zone (see Figures 7-1 and 7-4).
The thinly bedded, calcareous sedimentary rocks of the Caracol Formation locally strike southwesterly at 220o and dip -15o to -20o southeasterly (Turner, 2008c). Local fracture sets have three common orientations, including: 130o/-70o to -80o NE, 340o/-80o W and 270o/-80o S, with the latter set sub-paralleling the orientation of a granodioritic dyke.
Geological modelling and variography studies of the Represa zone mineralization indicate that the precious metal-bearing mineralization is associated with both northeasterly and northwesterly trending, steeply dipping fractures and shallow dipping sedimentary bedding features.
7.2.3
Alteration
The alteration of the sedimentary country rocks and various dyke-like intrusions within the Represa zone appears to be largely controlled by both structure and lithology. The intensity of the alteration appears to be related to the porosity of the host rock units and controlled by fracturing. Coarser-grained sandy units generally tend to exhibit a higher degree of alteration and mineralization than the finer-grained, calcareous siltstone units. Some of the alteration facies identified to data include:
Propylitic - grey-green alteration colour with chlorite-epidote-calcite-pyrite-silica alteration assemblage with quartz+ calcite+ pyrite fracture filling veinlets. Granodioritic dykes are also similarly altered.
Quartz – Sericite - Pyrite+ Calcite – variable from grey-green to mottled intensely bleached bluff colour with correspondingly weak to intense silicification and pyritization. Limy siltstone and sandstone units become less calcareous and harder with increased silicification. Pyrite bands often occur along bedding planes and adjacent to the pyrite – calcite+ quartz veinlets. This alteration is commonly associated with weak to intense fracture and bedding plane infilling pyrite+ sphalerite+ galena veinlet mineralization.
7-10
According to Turner (2008c), oxidation of the sulphide mineralization may occur continuously to depths of 200 metres or more. Beneath the dominantly oxidized mineralization, partial oxidation of the sulphide minerals is controlled by the intensity of fracturing and bedding planes. At increasing depths, faults and fractures localize the oxidized mineralization prior to grading vertically into sulphide-dominant mineralization.
7-11
SECTION 8
DEPOSIT TYPES
8.0
DEPOSIT TYPES
The gold-silver-lead-zinc mineralization within the Represa zone on the Camino Rojo property appears to be intrusive-related, similar in metallogenesis to the Peñasquito deposit and others in the Concepciòn del Oro district. Intrusive-related gold (+ silver, lead, zinc) mineralization, as fracture filling veins and veinlets with accompanying propylitic to phyllic alteration of the host rocks, commonly occurs peripheral to subvolcanic plutons in the transitional setting between subvolcanic porphyry and epithermal systems (Alldrick, 1996). The host rocks may vary from volcanics and volcaniclastics to sedimentary rocks to early intrusive phases around the periphery of phaneritic, locally porphyritic, granodiorite stocks or batholiths.
Intrusive-related deposits may include planar veins, en echelon vein sets, shear veins, cymoid veins and loops, sigmoidal veins, extension veins, tension gashes, ladder veins and synthetic Reidel shear veins. The ore mineralogy may include: native gold, electrum, pyrite, pyrrhotite, sphalerite, galena, chalcopyrite, bornite, argentite and various other telluride and sulphosalt minerals. Gangue mineralogy is commonly quartz, calcite, ankerite and chlorite with or without minor sericite, orthoclase, biotite and rhodochrosite (Alldrick, 1996).
The mineralization is syn-intrusive, formed in the thermally-controlled ‘brittle-ductile transition envelope’ that surrounds subvolcanic intrusions. Local shear stress caused by late magma movement results in en echelon fracture sets which were filled by sulphides and gangue minerals precipitating from circulating hydrothermal fluids (Alldrick, 1996).
8-1
SECTION 9
MINERALIZATION
9.0
MINERALIZATION
Gold- and silver-bearing oxide and sulphide mineralization at the Represa zone is dominantly controlled by steeply dipping shears and fractures cutting the calcareous metasedimentary country rocks. Metal-bearing hydrothermal fluids circulating upwards along dilational fractures precipitated sulphide and gangue minerals within fracture sets and along sandy, volcaniclastic-rich beds in the upper formation, causing decalcification of the enclosing calcareous beds and increasing porosity along bedding planes for further metal precipitation.
Coarse-grained, subhedral pyrite is the primary sulphide mineral in the upper formation, and is commonly associated with some higher gold values. It occurs as fracture infillings, replacements along sandy beds, fine-grained disseminations and micro-fracture fillings in the less permeable silty beds, or as coarse-grained crystals along bedding planes (Turner, 2008c). Pyritic veinlets often cut the country rocks, spreading laterally along bedding planes, and locally replacing the calcareous sandstone laminations.
Coarse-grained black sphalerite disseminations, in the order of 1 to 2 percent, are often associated with the strong pyrite mineralization, plus minor polybasite, galena and trace amounts of chalcopyrite and bornite. Gangue minerals include: calcite, quartz, and minor clear fluorite. Turner (2008c) has identified a number of distinct veining episodes including: platy, pyrite fracture infillings; calcite-pyrite veinlets associated with deeper quartz-pyrite+ fluorite veining; coarse-grained, subhedral pyrite+ sphalerite veining; and late-stage calcite and euhedral pyrite fracture filling.
Sulphide mineralization hosted by the lower limestone formation is dominantly fine-grained, disseminated and micro-fracture filling, dark red sphalerite that is commonly associated with fine-grained pyrite. The sphalerite content may vary from trace to several percent by volume. Disseminated mineralization commonly occurs proximal to narrow pyrite+ sphalerite veinlets (Turner, 2008c).
9-1
SECTION 9
EXPLORATION
10.0
EXPLORATION
Canplats has carried out aggressive and continuous exploration work on the subject property since its discovery in July 2007. This work has included: prospecting, reconnaissance geological mapping, test pitting with rock geochemical sampling, trenching with geological mapping and sampling, induced polarization surveying, reverse circulation and diamond drilling, and collection of bulk samples for metallurgical studies.
10.1
2007 and Early Exploration Programs
The following section summarizes the July 2007 to March 2008 exploration activities. A detailed description of this work by Canplats is contained in the June 18, 2008 technical report by Minorex (Blanchflower, 2008).
·
Prospecting – Initial prospecting and rock geochemical sampling has been carried out over limited portions of the property in areas with better bedrock exposure.
·
Test Pitting- A total of 178 rock geochemical samples were collected from 123 test pits excavated at regular intervals within the Represa zone. The results identified a concentric zone of anomalous gold-in-rock geochemistry with a 450-metre east-west by 250-metre north-south core of anomalous rock geochemistry exceeding 0.4 ppm gold within a larger area measuring approximately 500 by 350 metres with gold-in-rock geochemistry exceeding 0.2 ppm.
·
Trenching – Seventeen trenches were excavated within the Represa zone from July 2007 to February 2008. Fourteen trenches exposed bedrock and 486 rock geochemical samples were collected from these trenches.
·
Geophysical Surveying - Between October 2007 and March 2008, Canplats Mexico contracted Geofisica TMC S.A. de C.V. to carry out ground magnetics and induced polarization (‘IP’) geophysical surveys over the Represa and Don Julio zones. The results of ground magnetics survey were inconclusive and did not positively identify any sizeable magnetic anomaly or buried intrusion. The pole-dipole induced polarization survey confirmed the extent of the Represa zone with anomalous chargeability measurements over a wide area measuring 600 by 700 m at depths of+ 15 m. The Don Julio zone was identified as a large geophysical anomaly that is elliptically-shaped, approximately 1,000 m long by 400 m wide, and trends northeasterly-southwesterly. The induced polarization survey results were documented in the report by Gerard Lambert (2008).
·
Reverse Circulation Drilling – Canplats contracted Tiger Drilling de Mexico, S.A. de C.V. (‘Tiger’) in late October 2007 to drill twelve reverse circulation (‘RC’) drill holes (i.e. BCR-001 to -012) within the Represa and Don Julio zones, totalling 2,257 m. Two drilling contractors, Tiger and Layne de Mexico, S.A. de C.V. (‘Layne’), completed an additional fifteen RC drill holes (i.e. BCR-013 to -027), totalling 3,275.62 m, in early 2008. Most of this drilling was collared within the Represa zone, but the Don Julio zone was also tested with four drill holes (i.e. BCR-005, -024, -026 and -027). Minorex’s previous technical report documented this drilling.
10-1
·
Diamond Drilling – Canplats contracted the diamond drilling work to Major de Mexico, S.A. de C.V. (‘Major’), and began testing of the Represa zone on January 18, 2008. Three HQ-size diamond drill holes (i.e. CRD-01 to -03), totalling 1,723.52 m, were completed in early 2008 (see Blanchflower, 2008).
10.2
Mid-2008 Exploration Program
The 2007-2008 reverse circulation and diamond drilling program continued until August, 2008, primarily directed at delineating the Represa zone mineralization. In addition, one RC and three diamond drill holes continued testing the Don Julio zone, and two diamond drill holes tested a geophysical anomaly situated approximately 1,200 metres west-southwest of the Don Julio zone.
Prior to the completion of the drilling program, Canplats drilled four PQ-size diamond drill holes, twinning previous bore holes, to provide bulk core samples for metallurgical testing. See the following ‘Drilling’ section for detailed descriptions of all reverse circulation and diamond drill hole locations, collar information and results.
The following list is a summary of the drilling work from March to August 2008.
Reverse Circulation Drilling – Canplats contracted two drilling contractors, Tiger and Layne, to complete an additional sixty-five RC drill holes (i.e. BCR-028 to -092), totalling 17,852.14 m. All but one of these RC drill holes were collared within the Represa zone; and
Diamond Drilling – Canplats contracted Major to complete an additional twenty-seven HQ- and PQ-size diamond drill holes (i.e. CRD-004 to -026, and CRM-006, -014, -020 and -038), totalling 14,323.64 m. Three drill holes (i.e. CRD-017, -018 and -019) were collared within the Don Julio zone, two exploration drill holes tested an interesting geophysical anomaly situated 1,200 m west-southwest of the Don Julio zone (i.e. CRD-025 and -026), and four PQ- size ‘twin’ diamond drill holes (i.e. CRM-006, -014, -020 and -038) were collared beside existing diamond drill holes as grade checks and to provide bulk core samples for metallurgical testing.
10.3
Results of the Exploration Programs
Exploration work has investigated a large zone of gold-, silver-, lead- and zinc-bearing mineralization hosted by highly altered, silicified and oxidized metasedimentary rocks within the Represa zone. Precious metal values appear to be genetically and spatially associated with fracture filling, replacement and disseminated pyrite with lesser sphalerite and galena mineralization that has been generally oxidized within 200 m of the topographic surface.
10-2
Drilling and trenching results traced the Represa zone laterally for more than 1,000 m east-west, 460 m north-south and vertically to a depth of 820 m. The mineralized zone remains open for extension westward, eastward and to depth.
A second nearby zone, the ‘Don Julio’ zone, has been identified by a 1,000 m long by 400 m wide induced polarization anomaly and tested by eight drill holes. This drilling has intersected favourable alteration of the country rocks with local gold values, and extended Represa-style mineralization to its eastern margin at depth. Only a small portion of the Don Julio zone has been tested and more extensive drilling is warranted.
The results from the two exploration drill holes that tested the geophysical anomaly west-southwest of the Don Julio zone intersected favourably altered country rocks but no significant mineralization.
10-3
SECTION 11
DRILLING
11.0
DRILLING
Canplats undertook an aggressive drilling program on the property from late October 2007 to early August 2008. A total of 39,727.07 m of drilling had been completed including ninety-two reverse circulation drill holes totalling 23,679.91 m, twenty-six HQ-size diamond drill holes totalling 14,440.16 m, and four PQ-size ‘twin’ diamond drill holes, totalling 1,407.0 m, were completed for metallurgical sample collection.
As previously mentioned, Minorex documented the initial drilling, including the first twenty-seven reverse circulation and three diamond drill holes, in their June 18, 2008 technical report on this property and all of the 2007 and 2008 drilling in their January 5, 2009 technical report.
Figure 11-1 of this report shows the locations of the drill holes within the Represa and Don Julio zones, and the locations and orientations of the vertical sections plotted as Figures 11-2 through 11-5. Tables 11-1 to 11-3 document the collar locations, lengths and orientations of the 2007 and 2008 drill holes, and Table 11-4 documents the drilling results. The drilling information shown on these figures and tables was provided by Canplats.
11.1
Reverse Circulation Drilling
Since October 2007, Canplats has utilized up to three different rigs with support personnel to carry out the ongoing reverse circulation drilling program. One drill rig, equipment and personnel were contracted from Tiger Drilling de Mexico, S.A. de C.V. and two drill rigs with support equipment and personnel were contracted from Layne de Mexico, S.A. de C.V. These drill rigs were capable of drilling holes in excess of 300 m long, although reverse circulation drill holes are commonly less than 250 m long.
Eighty-six RC drill holes (38,297.55 m) were completed to depth within the Represa zone; five RC drill holes (1,185.68 m) tested the nearby Don Julio zone; and one RC hole (i.e. BCR-022) was drilled southeast of the Represa zone to test for similarly-oriented mineralization (see Figure 11-1).
11.2
Diamond Drilling
Thirty HQ-size diamond drill holes (i.e. CRD-01 to -26, and CRM-006, -014, -020 and -038), totalling 16,047.16 m of drilling, have been completed since January 18, 2008. Major Drilling provided qualified drilling personnel and equipment for diamond drilling program. Twenty-one diamond drill holes evaluated the Represa zone; three drill holes tested the nearby Don Julio zone; two drill holes tested a geophysical anomaly situated 1,200 m west-southwest of the Don Julio zone, and four ‘twin’ PQ-size holes (CRM-006, -014, -020 and -038) were drilled for metallurgical samples (see Figure 11-1).
11-1
Minorex verified this drilling information during their property examination and later while compiling the drilling data. Minorex considers the information of good quality and has no reason to believe that any of the information is inaccurate.
11-2
Table 11-1: Summary of Drilling Data Reverse Circulation Drill Holes
| | | | | | | |
Drill | UTM East | UTM North | Elevation | Length | Azimuth | Inclination | Zone |
Hole No. | (m) | (m) | (m) | (m) | (deg) | (deg) | Name |
BCR-001 | 244250.300 | 2676072.045 | 1944.694 | 148.34 | 0.00 | -50.00 | REPRESA |
BCR-002 | 244248.219 | 2676088.476 | 1944.477 | 149.35 | 270.00 | -50.00 | REPRESA |
BCR-003 | 244250.640 | 2676088.347 | 1944.382 | 149.35 | 90.00 | -50.00 | REPRESA |
BCR-004 | 244251.213 | 2675957.717 | 1941.931 | 179.83 | 0.00 | -50.00 | REPRESA |
BCR-005 | 243191.432 | 2675659.903 | 1956.709 | 244.86 | 270.00 | -60.00 | DON JULIO |
BCR-006 | 244248.510 | 2676030.387 | 1944.669 | 185.93 | 0.00 | -50.00 | REPRESA |
BCR-007 | 244300.118 | 2676097.400 | 1947.491 | 214.38 | 90.00 | -50.00 | REPRESA |
BCR-008 | 244402.189 | 2676150.319 | 1947.526 | 195.07 | 180.00 | -50.00 | REPRESA |
BCR-009 | 244403.516 | 2676099.408 | 1947.242 | 241.81 | 180.00 | -50.00 | REPRESA |
BCR-010 | 244401.854 | 2676099.161 | 1947.322 | 198.12 | 270.00 | -50.00 | REPRESA |
BCR-011 | 244401.456 | 2676049.845 | 1946.175 | 222.50 | 180.00 | -50.00 | REPRESA |
BCR-012 | 244500.791 | 2676098.540 | 1944.878 | 237.74 | 0.00 | -50.00 | REPRESA |
BCR-013 | 244500.256 | 2676148.333 | 1945.237 | 240.79 | 0.00 | -50.00 | REPRESA |
BCR-014 | 244500.573 | 2676048.975 | 1944.019 | 240.79 | 0.00 | -50.00 | REPRESA |
BCR-015 | 244401.594 | 2676050.319 | 1946.167 | 243.84 | 0.00 | -50.00 | REPRESA |
BCR-016 | 244248.265 | 2676148.468 | 1946.846 | 237.74 | 0.00 | -50.00 | REPRESA |
BCR-017 | 244147.523 | 2676048.095 | 1944.053 | 225.55 | 0.00 | -50.00 | REPRESA |
BCR-018 | 244147.033 | 2676098.705 | 1944.793 | 223.52 | 0.00 | -50.00 | REPRESA |
BCR-019 | 244151.967 | 2675928.308 | 1942.741 | 223.52 | 0.00 | -50.00 | REPRESA |
BCR-020 | 244401.348 | 2676000.479 | 1944.642 | 254.00 | 0.00 | -50.00 | REPRESA |
BCR-021 | 244841.969 | 2676063.444 | 1937.666 | 254.00 | 270.00 | -50.00 | REPRESA |
BCR-022 | 245017.349 | 2675458.807 | 1929.921 | 243.84 | 90.00 | -50.00 | GP ANOMALY |
BCR-023 | 244599.965 | 2676147.599 | 1942.659 | 223.52 | 0.00 | -50.00 | REPRESA |
BCR-024 | 243125.564 | 2675573.394 | 1957.086 | 243.84 | 0.00 | -50.00 | DON JULIO |
BCR-025 | 244601.275 | 2676099.982 | 1942.461 | 121.92 | 0.00 | -50.00 | REPRESA |
BCR-026 | 243126.474 | 2675659.857 | 1957.434 | 243.84 | 0.00 | -50.00 | DON JULIO |
BCR-027 | 243010.611 | 2675383.065 | 1956.944 | 239.78 | 0.00 | -50.00 | DON JULIO |
BCR-028 | 244602.810 | 2675999.550 | 1941.320 | 304.80 | 0.00 | -50.00 | REPRESA |
BCR-029 | 243009.880 | 2675509.610 | 1958.150 | 213.36 | 0.00 | -50.00 | DON JULIO |
BCR-030 | 244601.600 | 2675999.560 | 1941.310 | 304.80 | 270.00 | -50.00 | REPRESA |
BCR-031 | 244499.270 | 2676003.130 | 1943.150 | 260.10 | 0.00 | -50.00 | REPRESA |
BCR-032 | 244300.410 | 2675997.000 | 1944.570 | 304.80 | 270.00 | -50.00 | REPRESA |
BCR-033 | 244498.170 | 2676001.590 | 1943.150 | 292.61 | 270.00 | -50.00 | REPRESA |
BCR-034 | 244299.970 | 2675996.950 | 1944.530 | 304.80 | 0.00 | -60.00 | REPRESA |
BCR-035 | 244296.990 | 2676045.600 | 1946.630 | 304.80 | 0.00 | -60.00 | REPRESA |
BCR-036 | 244298.450 | 2676097.110 | 1947.520 | 304.80 | 0.00 | -60.00 | REPRESA |
BCR-037 | 244397.550 | 2676000.270 | 1944.620 | 260.10 | 270.00 | -50.00 | REPRESA |
BCR-038 | 244297.940 | 2676147.740 | 1947.650 | 284.48 | 0.00 | -60.00 | REPRESA |
BCR-039 | 244403.470 | 2676102.070 | 1947.170 | 227.58 | 0.00 | -60.00 | REPRESA |
11-3
| | | | | | | |
Drill | UTM East | UTM North | Elevation | Length | Azimuth | Inclination | Zone |
Hole No. | (m) | (m) | (m) | (m) | (deg) | (deg) | Name |
BCR-040 | 244402.150 | 2676152.950 | 1947.400 | 237.74 | 0.00 | -60.00 | REPRESA |
BCR-041 | 244299.430 | 2676205.400 | 1947.140 | 182.88 | 0.00 | -60.00 | REPRESA |
BCR-042 | 244301.250 | 2676205.240 | 1947.220 | 304.80 | 90.00 | -50.00 | REPRESA |
BCR-043 | 244404.280 | 2676198.810 | 1946.810 | 182.88 | 0.00 | -60.00 | REPRESA |
BCR-044 | 244402.160 | 2676199.100 | 1946.910 | 302.77 | 90.00 | -50.00 | REPRESA |
BCR-045 | 244350.980 | 2676097.450 | 1947.710 | 304.80 | 0.00 | -60.00 | REPRESA |
BCR-046 | 244446.080 | 2675998.040 | 1943.940 | 304.80 | 0.00 | -60.00 | REPRESA |
BCR-047 | 244348.530 | 2676149.300 | 1947.910 | 284.48 | 0.00 | -60.00 | REPRESA |
BCR-048 | 244345.900 | 2676200.210 | 1947.210 | 284.48 | 0.00 | -60.00 | REPRESA |
BCR-049 | 244449.120 | 2676096.310 | 1946.110 | 304.80 | 0.00 | -60.00 | REPRESA |
BCR-050 | 244200.210 | 2676090.740 | 1944.900 | 304.80 | 0.00 | -60.00 | REPRESA |
BCR-051 | 244200.770 | 2676090.600 | 1944.940 | 286.51 | 90.00 | -50.00 | REPRESA |
BCR-052 | 244498.650 | 2676098.870 | 1944.960 | 304.80 | 270.00 | -50.00 | REPRESA |
BCR-053 | 244698.900 | 2676198.790 | 1940.930 | 182.88 | 0.00 | -60.00 | REPRESA |
BCR-054 | 243998.560 | 2675900.360 | 1946.250 | 304.80 | 0.00 | -60.00 | REPRESA |
BCR-055 | 244699.520 | 2676101.050 | 1940.400 | 284.48 | 0.00 | -60.00 | REPRESA |
BCR-056 | 244098.630 | 2675896.250 | 1943.970 | 304.80 | 0.00 | -60.00 | REPRESA |
BCR-057 | 244202.350 | 2675900.050 | 1942.100 | 304.80 | 0.00 | -60.00 | REPRESA |
BCR-058 | 244701.690 | 2676005.540 | 1939.730 | 304.80 | 0.00 | -60.00 | REPRESA |
BCR-059 | 244105.470 | 2675847.470 | 1943.930 | 304.80 | 0.00 | -60.00 | REPRESA |
BCR-060 | 244804.120 | 2676202.650 | 1939.210 | 182.88 | 0.00 | -60.00 | REPRESA |
BCR-061 | 244200.000 | 2676200.000 | 1950.000 | 182.88 | 0.00 | -60.00 | REPRESA |
BCR-062 | 244204.880 | 2676203.700 | 1946.710 | 304.80 | 90.00 | -50.00 | REPRESA |
BCR-063 | 244445.910 | 2676153.330 | 1946.680 | 284.48 | 0.00 | -60.00 | REPRESA |
BCR-064 | 244444.440 | 2676200.470 | 1946.210 | 182.88 | 0.00 | -60.00 | REPRESA |
BCR-065 | 244199.280 | 2676150.990 | 1945.950 | 284.48 | 0.00 | -60.00 | REPRESA |
BCR-066 | 244499.180 | 2676201.500 | 1944.940 | 182.88 | 0.00 | -60.00 | REPRESA |
BCR-067 | 244352.740 | 2675995.910 | 1944.780 | 213.36 | 0.00 | -60.00 | REPRESA |
BCR-068 | 244602.760 | 2676049.520 | 1941.840 | 304.80 | 0.00 | -50.00 | REPRESA |
BCR-069 | 244501.300 | 2676201.850 | 1944.870 | 304.80 | 90.00 | -50.00 | REPRESA |
BCR-070 | 244552.270 | 2676204.970 | 1943.760 | 182.88 | 0.00 | -60.00 | REPRESA |
BCR-071 | 244549.290 | 2676148.510 | 1943.780 | 284.48 | 0.00 | -60.00 | REPRESA |
BCR-072 | 244550.800 | 2676101.800 | 1943.540 | 304.80 | 0.00 | -60.00 | REPRESA |
BCR-073 | 244598.940 | 2676198.520 | 1942.730 | 142.24 | 0.00 | -50.00 | REPRESA |
BCR-074 | 244597.820 | 2676199.410 | 1942.750 | 304.80 | 90.00 | -50.00 | REPRESA |
BCR-075 | 244550.390 | 2675998.150 | 1942.120 | 301.75 | 0.00 | -60.00 | REPRESA |
BCR-076 | 244348.960 | 2676252.140 | 1946.410 | 177.80 | 0.00 | -90.00 | REPRESA |
BCR-077 | 244400.260 | 2676250.360 | 1945.850 | 177.80 | 0.00 | -90.00 | REPRESA |
BCR-078 | 244453.800 | 2676250.530 | 1945.340 | 177.80 | 0.00 | -90.00 | REPRESA |
BCR-079 | 244505.110 | 2676250.770 | 1944.480 | 177.80 | 0.00 | -90.00 | REPRESA |
BCR-080 | 244600.424 | 2676098.896 | 1942.371 | 304.80 | 270.00 | -50.00 | REPRESA |
11-4
| | | | | | | |
Drill | UTM East | UTM North | Elevation | Length | Azimuth | Inclination | Zone |
Hole No. | (m) | (m) | (m) | (m) | (deg) | (deg) | Name |
BCR-081 | 244105.954 | 2675749.601 | 1943.777 | 426.72 | 0.00 | -60.00 | REPRESA |
BCR-082 | 244697.033 | 2676101.476 | 1940.503 | 304.80 | 270.00 | -50.00 | REPRESA |
BCR-083 | 244098.496 | 2676145.587 | 1945.753 | 406.40 | 180.00 | -60.00 | REPRESA |
BCR-084 | 244149.856 | 2675907.766 | 1942.988 | 406.40 | 0.00 | -60.00 | REPRESA |
BCR-085 | 244651.908 | 2676159.764 | 1941.936 | 284.48 | 0.00 | -60.00 | REPRESA |
BCR-086 | 244649.938 | 2676101.532 | 1942.693 | 341.38 | 0.00 | -60.00 | REPRESA |
BCR-087 | 244801.245 | 2676099.392 | 1938.720 | 304.80 | 0.00 | -60.00 | REPRESA |
BCR-088 | 244800.505 | 2676098.258 | 1938.778 | 304.80 | 270.00 | -50.00 | REPRESA |
BCR-089 | 244699.612 | 2676198.460 | 1941.058 | 304.80 | 90.00 | -50.00 | REPRESA |
BCR-090 | 244596.797 | 2676101.536 | 1943.840 | 304.80 | 0.00 | -50.00 | REPRESA |
BCR-091 | 244699.510 | 2676149.252 | 1940.797 | 284.48 | 0.00 | -60.00 | REPRESA |
BCR-092 | 244752.151 | 2676160.794 | 1939.868 | 264.16 | 0.00 | -60.00 | REPRESA |
Total 2007-2008 Reverse Circulation Drilling
23,679.91 m
Table 11-2: Diamond Drill Holes for Metallurgical Sampling
| | | | | | | |
Drill Hole | UTM East | UTM North | Elevation | Length | Azimuth | Inclination | Zone |
No. | (m) | (m) | (m) | (m) | (deg) | (deg) | Name |
CRM-006 | 244243.713 | 2676032.107 | 1945.978 | 395.55 | 0.00 | -50.00 | REPRESA |
CRM-014 | 244496.717 | 2676049.675 | 1945.381 | 365.40 | 0.00 | -50.00 | REPRESA |
CRM-020 | 244403.066 | 2676000.211 | 1945.874 | 445.35 | 0.00 | -50.00 | REPRESA |
CRM-038 | 244299.463 | 2676147.995 | 1949.039 | 200.70 | 0.00 | -60.00 | REPRESA |
Total 2008 Metallurgical Sample Drilling
1,407.00 m
11-5
Table 11-3: Summary of Drilling Data Diamond Drill Holes
| | | | | | | |
Drill Hole | UTM East | UTM North | Elevation | Length | Azimuth | Inclination | Zone |
No. | (m) | (m) | (m) | (m) | (deg) | (deg) | Name |
CRD-001 | 244249.930 | 2676028.720 | 1944.690 | 844.48 | 0.00 | -75.00 | REPRESA |
CRD-002 | 244250.240 | 2676039.220 | 1945.140 | 54.56 | 270.00 | -75.00 | REPRESA |
CRD-003 | 244401.790 | 2676096.240 | 1947.120 | 824.48 | 270.00 | -75.00 | REPRESA |
CRD-004 | 244250.270 | 2675797.530 | 1940.340 | 692.20 | 0.00 | -60.00 | REPRESA |
CRD-005 | 244497.180 | 2675947.440 | 1941.830 | 642.52 | 0.00 | -60.00 | REPRESA |
CRD-006 | 244399.180 | 2676000.140 | 1944.590 | 116.74 | 0.00 | -60.00 | REPRESA |
CRD-007 | 244405.810 | 2675945.990 | 1942.400 | 682.08 | 0.00 | -60.00 | REPRESA |
CRD-008 | 244353.142 | 2675947.299 | 1942.314 | 662.00 | 0.00 | -60.00 | REPRESA |
CRD-009 | 243898.540 | 2675801.410 | 1947.430 | 791.05 | 0.00 | -60.00 | REPRESA |
CRD-010 | 244351.110 | 2676048.470 | 1945.000 | 469.75 | 0.00 | -60.00 | REPRESA |
CRD-011 | 244551.196 | 2676048.923 | 1942.823 | 469.70 | 0.00 | -60.00 | REPRESA |
CRD-012 | 244150.760 | 2675798.626 | 1942.638 | 738.00 | 0.00 | -60.00 | REPRESA |
CRD-013 | 244199.837 | 2675942.515 | 1941.611 | 667.55 | 0.00 | -60.00 | REPRESA |
CRD-014 | 243901.266 | 2675925.021 | 1947.977 | 716.70 | 0.00 | -60.00 | REPRESA |
CRD-015 | 244451.982 | 2676048.981 | 1945.018 | 445.30 | 0.00 | -60.00 | REPRESA |
CRD-016 | 244147.443 | 2675677.118 | 1943.978 | 749.20 | 0.00 | -60.00 | REPRESA |
CRD-017 | 243337.851 | 2675662.198 | 1954.465 | 600.85 | 270.00 | -60.00 | DON JULIO |
CRD-018 | 243600.705 | 2675700.433 | 1952.739 | 576.45 | 0.00 | -60.00 | DON JULIO |
CRD-019 | 243129.627 | 2675819.661 | 1959.277 | 600.40 | 180.00 | -60.00 | DON JULIO |
CRD-020 | 244050.234 | 2675800.299 | 1944.841 | 790.15 | 0.00 | -60.00 | REPRESA |
CRD-021 | 244348.076 | 2675819.759 | 1939.624 | 771.60 | 0.00 | -60.00 | REPRESA |
CRD-022 | 244301.828 | 2675948.674 | 1942.320 | 665.85 | 0.00 | -60.00 | REPRESA |
CRD-023 | 244050.473 | 2675860.164 | 1944.813 | 423.95 | 0.00 | -60.00 | REPRESA |
CRD-024 | 244150.514 | 2676175.005 | 1947.478 | 122.00 | 180.00 | -60.00 | REPRESA |
CRD-025 | 241497.759 | 2675002.651 | 1957.131 | 221.65 | 0.00 | -60.00 | GP ANOMALY |
CRD-026 | 241497.759 | 2675002.651 | 1957.131 | 300.95 | 180.00 | -60.00 | GP ANOMALY |
Total 2007-2008 Diamond Drilling
14,640.16 m
11-6
Figure 11-1: Drill Hole Plan – Represa and Don Julio Zones
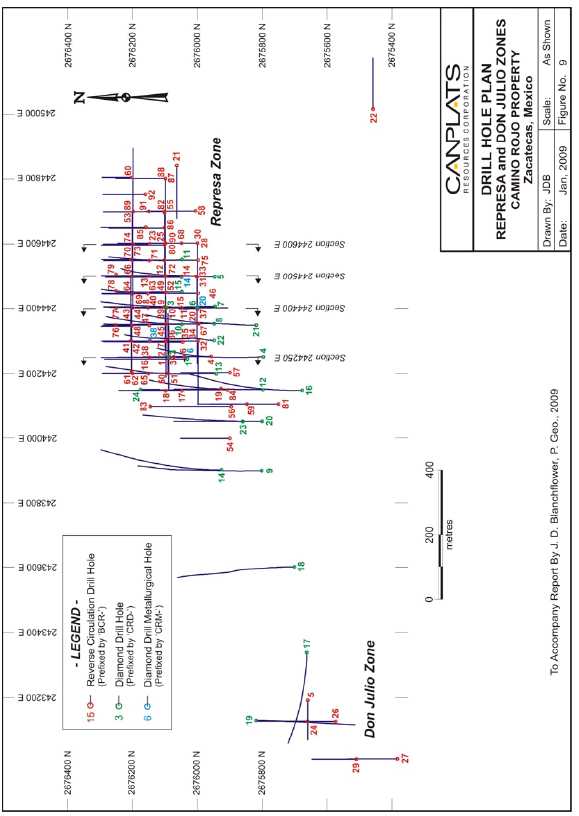
11-7
Figure 11-2: Vertical Section 244250 E Represa Zone
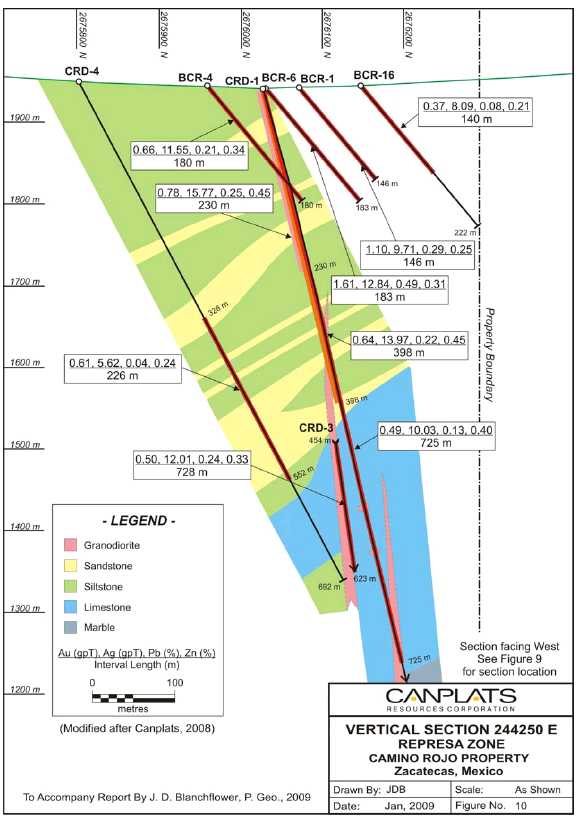
11-8
Figure 11-3: Vertical Section 244400 E Represa Zone
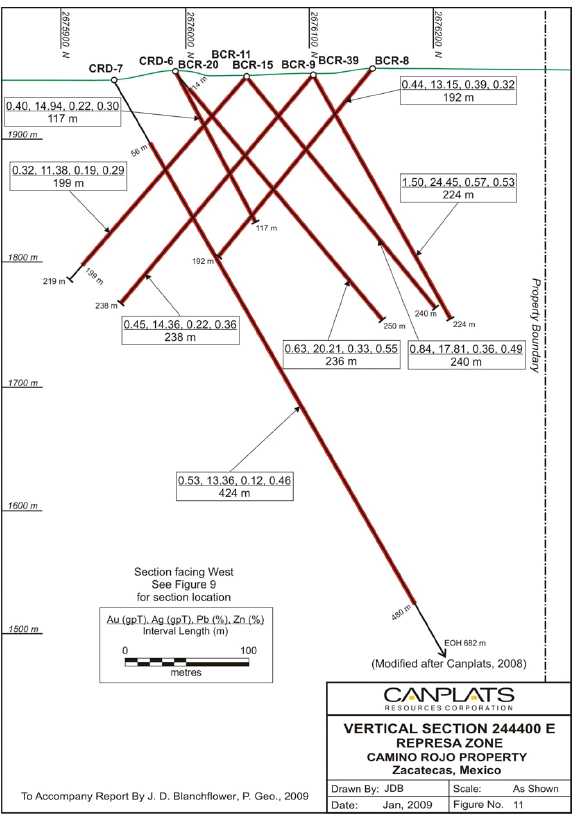
11-9
Figure 11-4: Vertical Section 244500 E Represa Zone
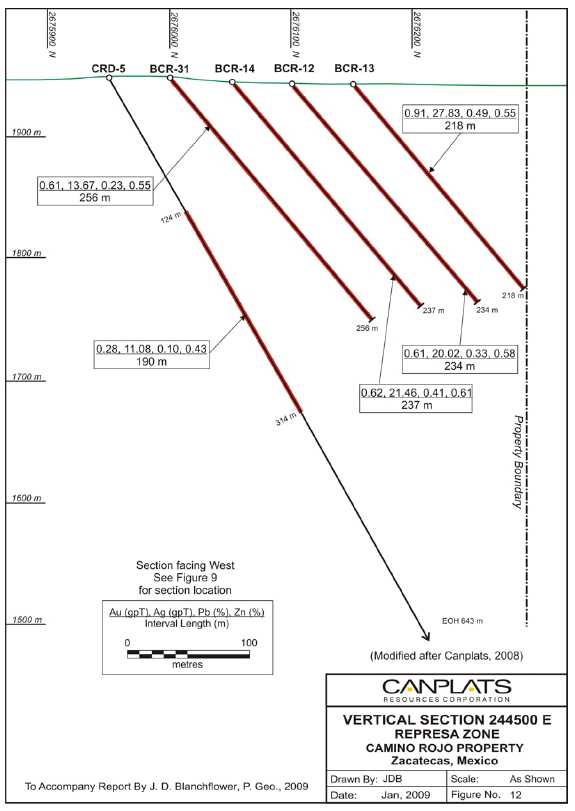
11-10
Figure 11-5: Vertical Section 244600 E Represa Zone
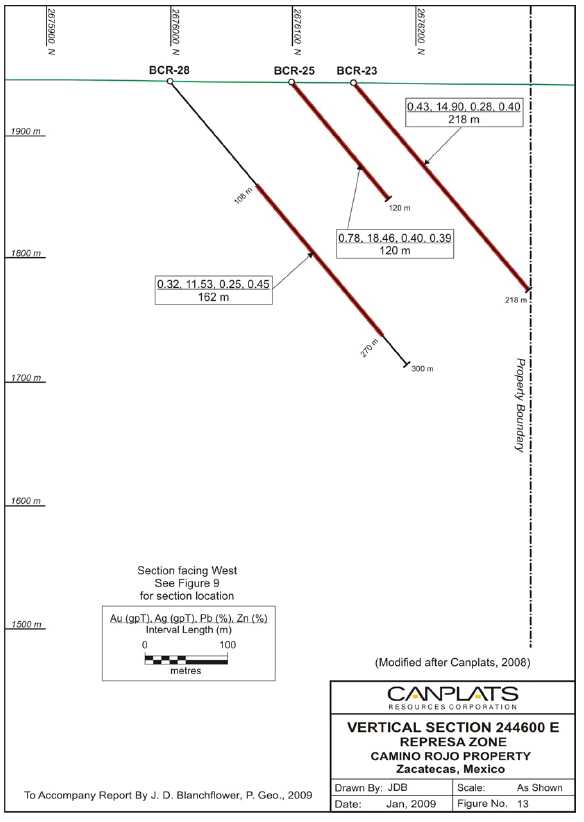
11-11
Table 11-4: Summary of Drilling Reports Reverse Circulation Drill Hole Intercepts
| | | | | | | | |
Drill | | From | To | Interval | Gold | Silver | Lead | Zinc |
Hole No. | | (m) | (m) | (m) | (g/t) | (g/t) | (%) | (%) |
BCR-001 | | 0.00 | 146.00 | 146.00 | 1.10 | 9.71 | 0.29 | 0.25 |
BCR-002 | | 0.00 | 129.00 | 129.00 | 0.76 | 11.87 | 0.29 | 0.25 |
BCR-003 | | 0.00 | 147.00 | 147.00 | 1.05 | 10.87 | 0.38 | 0.27 |
BCR-004 | | 0.00 | 180.00 | 180.00 | 0.66 | 11.55 | 0.21 | 0.34 |
| incl | 170.00 | 180.00 | 10.00 | 0.78 | 11.04 | 0.16 | 0.49 |
BCR-005 | | 110.00 | 118.00 | 8.00 | 2.27 | 5.56 | NSV | NSV |
BCR-006 | | 0.00 | 183.00 | 183.00 | 1.61 | 12.84 | 0.49 | 0.31 |
| incl | 68.00 | 140.00 | 72.00 | 2.59 | 18.03 | 0.76 | 0.33 |
BCR-007 | | 0.00 | 211.00 | 211.00 | 0.92 | 15.52 | 0.31 | 0.47 |
| incl | 152.00 | 211.00 | 59.00 | 1.02 | 25.14 | 0.34 | 0.88 |
BCR-008 | | 0.00 | 192.00 | 192.00 | 0.44 | 13.15 | 0.39 | 0.32 |
| incl | 177.00 | 192.00 | 15.00 | 1.07 | 26.01 | 0.17 | 0.41 |
BCR-009 | | 0.00 | 238.00 | 238.00 | 0.45 | 14.36 | 0.22 | 0.36 |
BCR-010 | | 0.00 | 195.00 | 195.00 | 1.03 | 13.96 | 0.30 | 0.32 |
| incl | 42.00 | 115.00 | 73.00 | 1.61 | 10.66 | 0.38 | 0.28 |
BCR-011 | | 0.00 | 199.00 | 199.00 | 0.32 | 11.38 | 0.19 | 0.29 |
BCR-012 | | 0.00 | 234.00 | 234.00 | 0.61 | 20.02 | 0.33 | 0.58 |
| incl | 26.00 | 54.00 | 28.00 | 1.02 | 26.66 | 0.48 | 0.89 |
BCR-013 | | 0.00 | 218.00 | 218.00 | 0.91 | 27.83 | 0.49 | 0.55 |
| incl | 109.00 | 218.00 | 109.00 | 1.27 | 41.42 | 0.51 | 0.63 |
BCR-014 | | 0.00 | 237.00 | 237.00 | 0.62 | 21.46 | 0.41 | 0.61 |
| incl | 116.00 | 237.00 | 121.00 | 0.87 | 24.90 | 0.39 | 0.81 |
BCR-015 | | 0.00 | 240.00 | 240.00 | 0.84 | 17.81 | 0.36 | 0.49 |
| incl | 90.00 | 176.00 | 86.00 | 1.38 | 23.40 | 0.31 | 0.51 |
BCR-016 | | 0.00 | 140.00 | 140.00 | 0.37 | 8.09 | 0.08 | 0.21 |
BCR-017 | | 68.00 | 188.00 | 120.00 | 0.50 | 6.20 | 0.07 | 0.12 |
BCR-018 | | 0.00 | 112.00 | 112.00 | 0.37 | 8.10 | 0.07 | 0.16 |
| incl | 58.00 | 112.00 | 54.00 | 0.62 | 10.36 | 0.05 | 0.07 |
BCR-019 | | 140.00 | 192.00 | 52.00 | 0.66 | 7.92 | 0.11 | 0.14 |
BCR-020 | | 14.00 | 250.00 | 236.00 | 0.63 | 20.21 | 0.33 | 0.55 |
| incl | 102.00 | 250.00 | 148.00 | 0.72 | 21.46 | 0.35 | 0.65 |
BCR-021 | | 50.00 | 250.00 | 200.00 | 0.25 | 6.56 | 0.12 | 0.22 |
| incl | 190.00 | 250.00 | 60.00 | 0.47 | 9.21 | 0.16 | 0.40 |
BCR-022 | | | | | NSV | NSV | NSV | NSV |
BCR-023 | | 0.00 | 218.00 | 218.00 | 0.43 | 14.90 | 0.28 | 0.40 |
BCR-024 | | | | | NSV | NSV | NSV | NSV |
BCR-025 | | 0.00 | 120.00 | 120.00 | 0.78 | 18.46 | 0.40 | 0.39 |
| incl | 78.00 | 120.00 | 42.00 | 1.43 | 25.64 | 0.40 | 0.28 |
BCR-026 | | | | | NSV | NSV | NSV | NSV |
11-12
| | | | | | | | |
Drill | | From | To | Interval | Gold | Silver | Lead | Zinc |
Hole No. | | (m) | (m) | (m) | (g/t) | (g/t) | (%) | (%) |
BCR-027 | | | | | NSV | NSV | NSV | NSV |
BCR-028 | | 108.00 | 270.00 | 162.00 | 0.32 | 11.53 | 0.25 | 0.45 |
BCR-029 | | | | | NSV | NSV | NSV | NSV |
BCR-030 | | 92.00 | 300.00 | 208.00 | 0.29 | 11.87 | 0.13 | 0.36 |
BCR-031 | | 0.00 | 256.00 | 256.00 | 0.61 | 13.67 | 0.23 | 0.55 |
| incl | 162.00 | 256.00 | 94.00 | 1.13 | 18.41 | 0.26 | 0.93 |
BCR-032 | | 0.00 | 300.00 | 300.00 | 0.70 | 11.18 | 0.19 | 0.35 |
| incl | 140.00 | 300.00 | 160.00 | 0.82 | 11.66 | 0.18 | 0.41 |
BCR-033 | | 0.00 | 288.00 | 288.00 | 0.39 | 12.45 | 0.13 | 0.32 |
BCR-034 | | 0.00 | 300.00 | 300.00 | 0.97 | 8.07 | 0.32 | 0.39 |
| incl | 94.00 | 232.00 | 138.00 | 1.18 | 21.08 | 0.29 | 0.41 |
BCR-035 | | 0.00 | 300.00 | 300.00 | 0.75 | 15.81 | 0.33 | 0.37 |
| incl | 134.00 | 228.00 | 94.00 | 1.14 | 22.94 | 0.29 | 0.41 |
BCR-036 | | 0.00 | 300.00 | 300.00 | 0.88 | 10.68 | 0.32 | 0.29 |
| incl | 12.00 | 202.00 | 190.00 | 1.14 | 12.75 | 0.42 | 0.31 |
BCR-037 | | 0.00 | 256.00 | 256.00 | 0.49 | 10.09 | 0.20 | 0.38 |
| incl | 174.00 | 256.00 | 82.00 | 0.81 | 12.38 | 0.20 | 0.55 |
BCR-038 | | 0.00 | 248.00 | 248.00 | 1.46 | 9.64 | 0.21 | 0.26 |
| incl | 0.00 | 116.00 | 116.00 | 2.58 | 11.48 | 0.32 | 0.32 |
BCR-039 | | 0.00 | 224.00 | 224.00 | 1.50 | 24.45 | 0.57 | 0.53 |
| incl | 92.00 | 224.00 | 132.00 | 2.20 | 33.41 | 0.69 | 0.62 |
BCR-040 | | 0.00 | 220.00 | 220.00 | 1.47 | 13.01 | 0.30 | 0.41 |
BCR-041 | | 0.00 | 34.00 | 34.00 | 0.63 | 8.37 | 0.17 | 0.24 |
| and | 60.00 | 86.00 | 26.00 | 0.59 | 8.18 | 0.13 | 0.27 |
BCR-042 | | 0.00 | 300.00 | 300.00 | 0.79 | 11.39 | 0.19 | 0.46 |
BCR-043 | | 0.00 | 78.00 | 78.00 | 0.97 | 12.68 | 0.22 | 0.28 |
| and | 102.00 | 116.00 | 14.00 | 4.34 | 17.19 | 0.31 | 0.28 |
BCR-044 | | 0.00 | 300.00 | 300.00 | 0.86 | 15.74 | 0.30 | 0.50 |
| incl | 2.00 | 168.00 | 166.00 | 1.14 | 19.42 | 0.36 | 0.47 |
BCR-045 | | 0.00 | 300.00 | 300.00 | 1.27 | 18.11 | 0.39 | 0.52 |
| incl | 8.00 | 180.00 | 172.00 | 1.59 | 18.75 | 0.46 | 0.44 |
BCR-046 | | 0.00 | 300.00 | 300.00 | 0.58 | 20.02 | 0.31 | 0.60 |
| incl | 160.00 | 228.00 | 68.00 | 1.06 | 35.59 | 0.43 | 0.88 |
BCR-047 | | 0.00 | 254.00 | 254.00 | 1.01 | 10.59 | 0.27 | 0.31 |
| incl | 72.00 | 124.00 | 52.00 | 1.51 | 10.34 | 0.20 | 0.27 |
BCR-048 | | 0.00 | 84.00 | 84.00 | 0.57 | 11.01 | 0.17 | 0.27 |
BCR-049 | | 72.00 | 300.00 | 228.00 | 0.65 | 14.97 | 0.28 | 0.58 |
BCR-050 | | 0.00 | 198.00 | 198.00 | 0.65 | 8.84 | 0.14 | 0.21 |
BCR-051 | | 0.00 | 282.00 | 282.00 | 0.99 | 16.27 | 0.27 | 0.37 |
BCR-052 | | 0.00 | 300.00 | 300.00 | 0.96 | 22.56 | 0.47 | 0.66 |
| incl | 148.00 | 230.00 | 82.00 | 2.25 | 41.26 | 0.67 | 1.19 |
11-13
| | | | | | | | |
Drill | | From | To | Interval | Gold | Silver | Lead | Zinc |
Hole No. | | (m) | (m) | (m) | (g/t) | (g/t) | (%) | (%) |
BCR-053 | | 48.00 | 148.00 | 100.00 | 0.44 | 16.17 | 0.24 | 0.41 |
| incl | 118.00 | 148.00 | 30.00 | 0.75 | 29.39 | 0.47 | 0.85 |
BCR-054 | | 202.00 | 210.00 | 8.00 | 1.67 | 18.00 | 0.03 | 0.08 |
BCR-055 | | 12.00 | 234.00 | 222.00 | 0.85 | 19.27 | 0.28 | 0.50 |
| incl | 122.00 | 208.00 | 86.00 | 1.44 | 30.45 | 0.39 | 0.84 |
BCR-056 | | 178.00 | 300.00 | 122.00 | 1.06 | 12.96 | 0.18 | 0.31 |
| incl | 208.00 | 300.00 | 92.00 | 1.22 | 13.88 | 0.20 | 0.36 |
BCR-057 | | 206.00 | 300.00 | 94.00 | 1.73 | 20.42 | 0.25 | 0.61 |
| incl | 274.00 | 300.00 | 26.00 | 3.49 | 26.97 | 0.26 | 1.18 |
BCR-058 | | 2.00 | 46.00 | 44.00 | 0.47 | 8.00 | 0.18 | 0.18 |
| and | 190.00 | 242.00 | 52.00 | 0.44 | 16.84 | 0.37 | 0.60 |
BCR-059 | | 114.00 | 300.00 | 186.00 | 1.07 | 14.97 | 0.26 | 0.63 |
| incl | 198.00 | 248.00 | 50.00 | 1.96 | 23.28 | 0.50 | 0.97 |
BCR-060 | | 72.00 | 160.00 | 88.00 | 0.75 | 14.06 | 0.24 | 0.26 |
BCR-061 | | 2.00 | 34.00 | 32.00 | 0.69 | 5.74 | 0.11 | 0.17 |
BCR-062 | | 2.00 | 300.00 | 298.00 | 0.60 | 10.05 | 0.11 | 0.26 |
| incl | 150.00 | 300.00 | 150.00 | 0.71 | 11.29 | 0.11 | 0.29 |
BCR-063 | | 0.00 | 258.00 | 258.00 | 0.98 | 12.20 | 0.35 | 0.35 |
| incl | 0.00 | 58.00 | 58.00 | 1.61 | 11.04 | 0.63 | 0.24 |
BCR-064 | | 0.00 | 180.00 | 180.00 | 0.94 | 11.47 | 0.21 | 0.26 |
| incl | 0.00 | 94.00 | 94.00 | 1.29 | 16.14 | 0.31 | 0.31 |
BCR-065 | | 58.00 | 74.00 | 16.00 | 0.62 | 7.95 | 0.12 | 0.28 |
BCR-066 | | 0.00 | 162.00 | 162.00 | 1.43 | 13.47 | 0.30 | 0.42 |
| incl | 92.00 | 162.00 | 70.00 | 2.26 | 12.87 | 0.26 | 0.37 |
BCR-067 | | 0.00 | 210.00 | 210.00 | 1.16 | 15.11 | 0.27 | 0.32 |
| incl | 134.00 | 204.00 | 70.00 | 2.15 | 20.74 | 0.22 | 0.30 |
BCR-068 | | 2.00 | 270.00 | 268.00 | 0.88 | 16.39 | 0.26 | 0.56 |
BCR-069 | | 0.00 | 272.00 | 272.00 | 0.71 | 16.56 | 0.35 | 0.45 |
BCR-070 | | 0.00 | 136.00 | 136.00 | 0.83 | 15.64 | 0.35 | 0.28 |
BCR-071 | | 0.00 | 280.00 | 280.00 | 0.61 | 15.66 | 0.32 | 0.50 |
BCR-072 | | 0.00 | 270.00 | 270.00 | 0.71 | 15.37 | 0.31 | 0.52 |
BCR-073 | | 0.00 | 132.00 | 132.00 | 0.65 | 10.86 | 0.31 | 0.23 |
BCR-074 | | 0.00 | 270.00 | 270.00 | 0.94 | 18.83 | 0.32 | 0.52 |
| incl | 154.00 | 214.00 | 60.00 | 2.07 | 38.35 | 0.40 | 0.98 |
BCR-075 | | 4.00 | 238.00 | 234.00 | 0.33 | 9.07 | 0.19 | 0.44 |
BCR-076 | | 2.00 | 175.00 | 173.00 | 0.57 | 4.69 | 0.08 | 0.17 |
BCR-077 | | 0.00 | 172.00 | 172.00 | 0.54 | 6.06 | 0.12 | 0.18 |
BCR-078 | | 4.00 | 174.00 | 170.00 | 0.76 | 8.57 | 0.16 | 0.22 |
| incl | 54.00 | 118.00 | 64.00 | 1.30 | 10.80 | 0.26 | 0.24 |
BCR-079 | | 2.00 | 172.00 | 170.00 | 0.53 | 11.03 | 0.20 | 0.28 |
BCR-080 | | 0.00 | 264.00 | 264.00 | 1.01 | 17.24 | 0.29 | 0.62 |
| incl | 148.00 | 264.00 | 116.00 | 1.56 | 21.99 | 0.30 | 0.82 |
11-14
| | | | | | | | |
Drill | | From | To | Interval | Gold | Silver | Lead | Zinc |
Hole No. | | (m) | (m) | (m) | (g/t) | (g/t) | (%) | (%) |
BCR-081 | | | | | NSV | NSV | NSV | NSV |
BCR-082 | | 12.00 | 300.00 | 288.00 | 0.52 | 11.33 | 0.17 | 0.47 |
| incl | 190.00 | 274.00 | 84.00 | 1.09 | 13.17 | 0.14 | 0.67 |
BCR-083 | | 194.00 | 400.00 | 206.00 | 1.34 | 7.65 | 0.11 | 0.23 |
| incl | 274.00 | 336.00 | 62.00 | 3.10 | 11.38 | 0.16 | 0.40 |
BCR-084 | | 168.00 | 364.00 | 196.00 | 1.00 | 14.53 | 0.22 | 0.42 |
BCR-085 | | 0.00 | 260.00 | 260.00 | 0.44 | 12.44 | 0.26 | 0.39 |
BCR-086 | | 6.00 | 210.00 | 204.00 | 0.83 | 15.61 | 0.25 | 0.56 |
BCR-087 | | 90.00 | 198.00 | 108.00 | 0.45 | 8.46 | 0.20 | 0.18 |
BCR-088 | | 200.00 | 290.00 | 90.00 | 0.39 | 10.08 | 0.18 | 0.45 |
BCR-089 | | 64.00 | 300.00 | 236.00 | 0.76 | 12.11 | 0.27 | 0.30 |
BCR-090 | | 4.00 | 300.00 | 296.00 | 0.81 | 17.40 | 0.32 | 0.45 |
| incl | 66.00 | 136.00 | 70.00 | 1.27 | 26.41 | 0.40 | 0.35 |
BCR-091 | | 18.00 | 264.00 | 246.00 | 0.96 | 13.71 | 0.32 | 0.42 |
BCR-092 | | 52.00 | 256.00 | 204.00 | 0.91 | 17.15 | 0.32 | 0.41 |
| incl | 106.00 | 182.00 | 76.00 | 1.58 | 31.29 | 0.55 | 0.63 |
CRD-01 | | 0.00 | 724.73 | 724.73 | 0.49 | 10.03 | 0.13 | 0.40 |
| incl | 0.00 | 230.00 | 230.00 | 0.78 | 15.77 | 0.25 | 0.45 |
| incl | 0.00 | 398.00 | 398.00 | 0.64 | 13.97 | 0.22 | 0.45 |
| incl | 650.00 | 724.73 | 74.73 | 0.81 | 12.82 | 0.04 | 0.51 |
CRD-02 | | 0.00 | 54.56 | 54.56 | 0.97 | 11.73 | 0.27 | 0.26 |
CRD-03 | | 0.00 | 728.00 | 728.00 | 0.50 | 12.01 | 0.11 | 0.28 |
| incl | 0.00 | 214.00 | 214.00 | 0.95 | 24.83 | 0.24 | 0.33 |
| incl | 0.00 | 417.00 | 417.00 | 0.71 | 18.81 | 0.19 | 0.33 |
CRD-04 | | 326.00 | 552.00 | 226.00 | 0.61 | 5.62 | 0.04 | 0.24 |
| incl | 516.00 | 552.00 | 36.00 | 1.39 | 12.53 | 0.06 | 0.26 |
CRD-05 | | 124.26 | 314.00 | 189.74 | 0.28 | 11.08 | 0.10 | 0.43 |
CRD-06 | | 0.00 | 116.74 | 116.74 | 0.40 | 14.94 | 0.22 | 0.30 |
CRD-07 | | 56.00 | 480.00 | 424.00 | 0.53 | 13.36 | 0.12 | 0.46 |
CRD-08 | | 28.00 | 662.00 | 634.00 | 0.44 | 12.84 | 0.13 | 0.33 |
| incl | 28.00 | 262.50 | 234.50 | 0.61 | 20.54 | 0.17 | 0.36 |
| incl | 164.00 | 244.00 | 80.00 | 1.06 | 39.87 | 0.26 | 0.57 |
CRD-09 | | 298.00 | 314.00 | 16.00 | 2.34 | 18.58 | 0.03 | 0.12 |
| and | 491.00 | 724.00 | 233.00 | 1.18 | 6.11 | 0.06 | 0.33 |
CRD-10 | | 3.05 | 469.75 | 466.70 | 0.82 | 18.19 | 0.25 | 0.56 |
| incl | 3.05 | 196.00 | 192.95 | 0.95 | 28.15 | 0.38 | 0.60 |
CRD-11 | | 12.00 | 420.00 | 408.00 | 0.63 | 13.51 | 0.17 | 0.51 |
| incl | 118.00 | 230.00 | 112.00 | 1.49 | 24.27 | 0.22 | 0.80 |
CRD-12 | | 138.00 | 165.50 | 27.50 | 2.24 | 16.85 | 0.17 | 0.17 |
| and | 274.00 | 566.00 | 292.00 | 1.16 | 11.65 | 0.07 | 0.40 |
| incl | 326.00 | 419.00 | 93.00 | 2.05 | 20.57 | 0.13 | 0.84 |
11-15
| | | | | | | | |
Drill | | From | To | Interval | Gold | Silver | Lead | Zinc |
Hole No. | | (m) | (m) | (m) | (g/t) | (g/t) | (%) | (%) |
CRD-13 | | 78.00 | 580.40 | 502.40 | 0.46 | 8.68 | 0.13 | 0.33 |
| incl | 277.20 | 344.80 | 67.60 | 0.67 | 15.87 | 0.34 | 0.61 |
CRD-14 | | 578.00 | 692.00 | 114.00 | 1.03 | 4.41 | 0.05 | 0.17 |
CRD-15 | | 0.00 | 445.30 | 445.30 | 0.73 | 17.13 | 0.33 | 0.63 |
| incl | 134.00 | 250.00 | 116.00 | 0.88 | 25.90 | 0.30 | 0.78 |
CRD-16 | | 516.00 | 692.00 | 176.00 | 0.65 | 3.70 | 0.03 | 0.15 |
CRD-17 | | 64.00 | 68.00 | 4.00 | 4.03 | 18.95 | 0.01 | 0.02 |
| and | 160.00 | 196.00 | 36.00 | 0.24 | 0.27 | NSV | 0.03 |
CRD-18 | | 502.00 | 576.45 | 74.45 | 0.54 | 4.91 | 0.04 | 0.10 |
CRD-20 | | 234.00 | 790.15 | 556.15 | 0.58 | 4.43 | 0.04 | 0.20 |
| incl | 368.00 | 404.00 | 36.00 | 1.80 | 7.71 | 0.08 | 0.27 |
CRD-21 | | 490.00 | 522.00 | 32.00 | 0.48 | 1.46 | 0.01 | 0.07 |
| and | 615.29 | 642.00 | 26.71 | 1.52 | 17.84 | 0.44 | 0.83 |
CRD-22 | | 78.00 | 392.00 | 314.00 | 0.56 | 14.64 | 0.19 | 0.44 |
| incl | 180.00 | 227.60 | 47.60 | 1.34 | 26.52 | 0.26 | 0.56 |
CRD-23 | | 130.90 | 136.00 | 5.10 | 4.69 | 169.99 | 1.01 | 0.58 |
| and | 262.00 | 372.00 | 110.00 | 1.17 | 13.44 | 0.19 | 0.32 |
* NSV = No Significant Values
11.3
Results of the Drilling Programs
The results from the reverse circulation and diamond drilling programs indicate that the gold, silver, lead and zinc mineralization within the Represa zone extends laterally for more than 1,000 m east-west, 460 m north-south and vertically for 820 m or more.
The precious metal-bearing mineralization of the Represa zone is dominantly hosted by an upper interbedded sequence of hydrothermally altered, calcareous siltstone and calcareous, volcanically-derived sandstone units, and a lower conformably bedded sequence of hydrothermally altered, silty and/or sandy limestone and marble units. The entire section exhibits weak to locally advanced quartz-sericite-pyrite hydrothermal alteration with weak bleaching (Turner, 2008c). Local quartz porphyry-metasedimentary clast breccia dykes and granodioritic dykes have been intersected at depth supporting the hydrothermal alteration evidence for an inferred calc-alkaline intrusion at depth.
According to Turner (2008c), the upper calcareous siltstone and sandstone sequence may extend from surface to a vertical depth of approximately 400 m. It has variable apparent dips, is not folded and tops are up. All sedimentary facies host mineralization; although the sandstone members are more permeable and more favourable hosts. The lower interbedded sequence of silty to sandy limestone occurs at depths of approximately 400 to 700 m. Based on initial drilling results, this sequence is locally folded but not overturned, and is mineralized but not as well as the upper metasedimentary sequence.
11-16
Sulphide mineralization was structurally controlled by moderately to steeply dipping fractures that cut the stratigraphy. It is inferred that the metal-bearing hydrothermal fluids ascended along dilational fractures, infilling the voids and flowing laterally along permeable bedding units, especially the volcaniclastic sandy beds that were decalcified increasing their porosity (Turner, 2008c).
It is apparent from the drilling results that the Represa surface mineralization, which was initially identified by test pitting and trenching, does have substantial vertical dimensions. Furthermore, drilling has yet to fully test the lateral dimensions of the mineralization indicated by the surface sampling and induced polarization results. Initial drill testing of the Don Julio zone has only intersected precious metal-bearing mineralization over moderate lengths, but further drilling will be required to investigate its large I.P. anomaly.
11-17
SECTION 12
SAMPLING METHOD and APPROACH
12.0
SAMPLING METHOD and APPROACH
12.1
Trench Sampling and Logging
After each trench had been excavated and geologically mapped, rock chip samples were collected using a hammer and chisel, commonly along the northern wall. The samples from each trench were surveyed using a G.P.S. instrument and properly bagged, labelled and transported to the Canplats Mexico warehouse in San Tiburcio where they were recorded, packed and secured pending shipping.
According to Canplats (2008), a total of 486 geochemical chip samples were collected during this work. All of the samples were shipped by truck to the ALS Chemex assay facility in Guadalajara, Jalisco State, Mexico. There the trench samples were dried crushed and a sample pulp of each was prepared. These pulps were later air-shipped directly to the ALS Chemex assay laboratories in North Vancouver, British Columbia for analysis using the same procedures as those utilized for the drilling samples. These analytical procedures will be discussed in the ‘Sample Preparation and Analyses’ section of this report.
During the preparation of the database for the mineral resource estimation study, Minorex utilized the assay results from 230 trench samples that were collected from seven trenches within the Represa zone.
12.2
Reverse Circulation Sampling, Handling, Logging and Storage
Reverse circulation drill hole samples were collected at one-metre intervals from bedrock surface to near the termination of each hole. A total of 12,869 samples has been collected, logged, processed and analysed from the reverse circulation drill holes.
12.2.1
Reverse Circulation Sample Handling
A cyclone splitter at the drill head split the recovered material providing a smaller but representative sample of each one-metre drilling interval. Each split sample fraction was recovered directly in a 6-mil plastic sample bag. Prior to securing each bag, a spoon-size portion of each sample was placed in a small section of a divided plastic container. Each container has a number of sections representing that number of metres of drilling. The bagged samples were then securely tied and transported to the Canplats logging and storage warehouse.
12.2.2
Reverse Circulation Sample Geological Logging
At the warehouse the reverse circulation sample bags were opened for air drying prior to shipping. The individual samples in each divided plastic container were then logged, and all observed lithologic, alteration and mineralization features were described and recorded. This information was later transcribed into a drill hole-specific spreadsheet-style file.
12-1
12.2.3
Reverse Circulation Sample Storage
Over-size reverse circulation samples were split at the warehouse after drying using a riffle splitter. The split sample was re-bagged for shipping to the analytical lab and the other portion was bagged and stored in the secure warehouse, as were the representative sample containers after logging.
12.3
Drill Core Handling, Logging, Sampling and Storage
A total of 8,308 diamond drill core samples was handled, logged and sampled according to company protocols. The recovered drill core was transported by truck to the Canplats core handling, logging and storage warehouse where it was gently washed to remove any drilling fluids.
12.3.1
Drill Core Photography
Prior to any logging, the entire drill core was photographed in detail. Digital colour photographs were taken, and the digital images were uploaded daily to the on-site computer. The best images for each interval of core were later filed with the digital geological logs.
12.3.2
Geotechnical Logging
After initial processing the drill core boxes were placed on the logging tables in chronologic order and a trained geotechnician recorded the core recovery and rock quality data for each measured drill run.
Rock quality designation (“RQD”) was recorded for each drill run. Drilling induced breaks and breaks from loading core boxes were not included. Veined sections of core were lightly hammer-tapped. Those pieces that remained intact were included as the solid fraction of core for the RQD determinations.
12.3.3
Geological Logging
All lithological, structural, alteration and mineralogical features of the drill core were observed and recorded during the geological logging procedure. This information was later transcribed into a drill hole-specific spreadsheet-style file that could be readily entered into the Gemcom mineral exploration software program.
The geologist responsible for the geological logging assigned drill core sample intervals with the criteria that the intervals did not cross geologic contacts. However, within any geologic unit 2-metre sample intervals could be extended or reduced to coincide with any geologic contact. Sample lengths were rarely greater than 2 metres or less than 0.5 metres, averaging 2.0 metres long.
12-2
Once the geological logging was complete the drill core from each assigned sample interval was individually removed and split in half lengthwise. One-half of the drill core was placed in a 6-mil sample bag and the other half was returned to its original position in the core box. The individual drill core sample bags were securely tied with non-slip plastic straps properly labelled and stored in the core storage facility under the supervision of the project geologist until they were shipped to the assay laboratory. Drill core samples, like the other trench and reverse circulation drill samples, were shipped by truck directly to the ALS Chemex in Guadalajara, Jalisco State, Mexico for processing and pulp preparation.
It is Minorex’s opinion that the core logging procedures employed on this project were thorough and provide sufficient geotechnical and geological information. There are no apparent drilling or recovery factors that would materially impact the accuracy and reliability of the drilling results.
12.3.4
Drill Core Storage
After the logging and sampling operations, the core boxes were stored in racks within the secure warehouse for any later re-examination.
12-3
SECTION 13
SAMPLE PREPARATION, ANALYSIS and SECURITY
13.0
SAMPLE PREPARATION, ANALYSIS and SECURITY
All of the trench, reverse circulation and diamond drill core samples were prepared at the ALS Chemex facilities in Guadalajara, Jalisco State, Mexico, and analysed at their assay facilities in North Vancouver, British Columbia, Canada. ALS Chemex Laboratories is an internationally recognized minerals testing laboratory operating in 16 countries and has an ISO 9001:2000 certification.
Appendix I of “Technical Report on the Mineral Resources of the Camino Rojo Property (Minorex; January 5, 2009)” contains ALS Chemex technical summaries of the various sample preparation and analytical procedures employed for the trench, reverse circulation and diamond drill core samples submitted by Canplats Mexico, and the verification samples collected and submitted by Minorex after their February 2008 property examination.
13.1
Sample Preparation
Upon arrival at the ALS Chemex laboratory in Guadalajara, Mexico the samples were logged into their system. Each sample was placed into a stainless steel tray and dried for approximately 4 to 8 hours, depending upon its moisture content. Then each sample was progressively crushed by primary and secondary crushers until more than 70% of the crushed sample passed through a 2 mm (Tyler 10 mesh) screen. Standard crushing practices also included repeatedly cleaning the crusher, prior to, during and after each sample batch using coarse quartz material, and air cleaning the crushers after each sample. The sample material was then riffle split to obtain approximately 250 to 500 grams and the remaining coarse reject material was returned to Canplats Mexico for storage in their warehouse for possible future use.
The 250 to 500 gram sample, its size dependent upon requested analyses, was pulverized using a disk pulverizer until 85% of the pulverized material passed through a 75 micron (Tyler 200 mesh) screen. Then 250 grams of finely pulverized material was transferred to a paper envelope. The bagged sample pulps were later air-shipped directly to the ALS Chemex facilities in North Vancouver, Canada for analysis. This same preparation procedure was used for both rock chip and drilling samples.
13.2
Sample Analyses and Assays
All of the sample pulps were initially analysed for 35 elements using conventional ICP-AES analysis (ALS Chemex Procedure ME-ICP61). This analytical procedure uses a mixture of nitric, perchloric and hydrofluoric acids to digest the sample pulp. Elements are determined by inductively coupled plasma and atomic emission spectroscopy (‘ICP-AES’). The determined elements are: Al, Ca, Fe, K, Mg, Na, S, Ti, As, B, Ba, Be, Bi, Cd, Co, Cr, Cu, Ga, La, Mn, Mo, Nb, Ni, P, Pb, Sb, Sc, Sn, Sr, Tl, V, W, Y, and Zn. A summary of the lower and upper detection limits for each of these elements accompanies the ALS Chemex procedures documented in Appendix I of “Technical Report on the Mineral Resources of the Camino Rojo Property (Minorex; January 5, 2009)”.
13-1
Gold values were determined using a combination of fire assay fusion with atomic absorption spectroscopy analysis (ALS Chemex Procedures Au-AA23). The Au-AA23 fire assay/AA procedure utilizes a 30g weight of the sample pulp for analysis with 0.005 and 10 ppm as the lower and upper detection limits. The procedure involves the fusion of a metal bead that is then digested in acids, cooled, diluted and analysed by atomic absorption spectroscopy versus matrix-matched standards. When the analytical result exceeded 10 ppm gold a re-analysis was requested using a second method (Au-GRA21) which is a fire assay of a 30-gram charge with a gravimetric finish.
If any analytical result exceeded 100 ppm silver, a 30-gram sample charge would be re-analysed using a fire assay fusion and gravimetric analysis finish procedure (Ag-GRA21) which has lower and upper detection limits of 5 and 10,000 ppm respectively.
13.3
Sample Security
After each drill core sample was split and bagged, the sample bags were tied shut with non-slip plastic ties. The sample bags were then moved to a locked storage area in the core logging and storage facility controlled by the company geologists. Prior to shipping, several sample bags were placed into large woven nylon ‘rice’ bags, their contents were marked on each bag, and each bag was securely sealed.
The sample bags were delivered directly to the ALS Chemex assay laboratory in Guadalajara, Jalisco State, Mexico by company personnel. This same procedure was followed by Minorex after collection of their verification samples.
13-2
SECTION 14
DATA VERIFICATION
14.0
DATA VERIFICATION
14.1
2008 Quality Assurance and Quality Control Program
Canplats established a quality assurance (‘QA’) program utilizing quality control (‘QC’) samples to monitor accuracy (i.e. sample standards), contamination (i.e. sample blanks), precision (i.e. duplicates) and other possible sampling errors (i.e. sample mis-labelling). Sample results were monitored by Canplats personnel for any quality control failures or problems. Should any occur, they were to be reported to the assay laboratory and check analyses would be performed to rectify the failure.
The QA-QC protocol utilized on the project targeted an insertion of quality control samples at a rate of 5 percent to the assay laboratory. Thus, a quality control sample was to be inserted randomly within every 20 consecutive samples, alternating between standard, blank or duplicate samples. The standard and blank samples were inserted into the sample sequence as the sample shipment was being readied. Any duplicate samples were inserted into the sample sequence at the time of collection. The quality control samples were numbered in the same way as the primary samples and were not identified in any other manner.
In August 2008 Canplats contracted Ms. Caroline Vallat, G.I.T. (APEGBC), of GeoSparks Consulting based in Nanaimo, British Columbia to compile all of the 2007 and 2008 primary and QA-QC assay results, and identify any possible erroneous sample results that should be check assayed and/or umpire assayed at a different assay laboratory. The assaying facilities of Assayers Canada in Vancouver, British Columbia were chosen for ‘outside’ check and umpire assaying work. Like ALS Chemex, Assayers Canada is an internationally recognized minerals testing laboratory.
The compiled assay database of the 2007 and 2008 primary samples includes 8,308 diamond drill samples, 12,869 RC drill samples and 283 surface trench samples. This database also includes 1,078 field duplicate and 2,165 standard and blank quality control samples.
Using the compiled assay database, field standard samples were statistically analyzed to determine whether any of their assay results exceeded three standard deviations from their predetermined assay values. Primary samples included in the assay batch with any failing field standard sample were re-submitted for analysis by ALS Chemex. According to Vallat (2008), 71 primary samples were re-analysed for gold and 266 samples were re-analysed for other ICP elements. These re-analyses represent approximately 1.5 percent of the total number of primary samples. The original primary sample assay results were later replaced in the database by the re-run primary sample assays after their precision and accuracy had been cross-checked with internal laboratory QA-QC samples.
14-1
Umpire check assaying was undertaken on 152 primary samples that were shipped directly from ALS Chemex laboratory to Assayers Canada laboratory. The umpire check samples were analysed for the same elements and used the same or very similar analytical procedures as those carried out originally by ALS Chemex. The umpire check sample results from Assayers Canada were then compared to the original assay results from ALS Chemex to determine if there was any assay bias inferred for the original assay results (Vallat, 2008).
Ms. Vallat prepared and submitted the ‘2007 – 2008 Quality Assurance and Quality Control Report for the Camino Rojo Property’ documenting the results of her QA-QC study. The following text is quoted from the ‘Conclusions’ section of the report (Vallat, 2008).
“Overall strong precision has been inferred for the primary sample results obtained from ALS Chemex for the 2007 and 2008 Camino Rojo project. The field duplicate sample results have shown that there were some issues with sample heterogeneity as well as likely issues with the sample splitting for duplicate submission. This was apparent due to the diamond drill hole duplicate samples showing less precision than the rotary chip samples, and only moderate precision shown within the rotary chip samples. It is my recommendation that either a sampling method that is more precise is used in the field (i.e. crushing of sample material in the field and weighing each half for primary sample and duplicate sample preparation) or the lab is requested to separate the two halves for analysis as primary sample and duplicate sample following the lab sample preparation (pulp split).
Overall strong accuracy has been inferred for the primary sample results obtained from ALS Chemex for the 2007 and 2008 Camino Rojo project. Both the standards inserted in the field and the laboratory standards have inferred strong accuracy for the Camino Rojo project. There were some cases where the field standard instance was determined to be inaccurate and further review of the analytical batch of the inaccurate standard instance showed that re-analysis was required. Wherever the field standard instance exceeded three standard deviations from the expected mean for the standard, the analytical batch was reviewed in order to determine if re-analysis was merited for the samples in the vicinity of the failed standard instance. A resultant 337 primary samples were re-analyzed in order to ensure that the final assay database for the Camino Rojo project is accurate throughout.
Umpire lab check samples submitted to Assayers Canada were analyzed to show that there is no inferred bias in the analytical results obtained from ALS Chemex for the 2007 and 2008 Camino Rojo project.
In conclusion, it is my opinion that the final assay results for the 2007 and 2008 Camino Rojo project are of high quality.”
It is Minorex’s opinion that the 2007 and 2008 assay database has been thoroughly scrutinized and found to be of good quality for use during the mineral estimation study.
14-2
14.2
Drilling Data Verification
Reverse circulation and diamond drilling data, including hole location, elevation, length, orientation, lithology, sample intervals and analytical results, were provided to Minorex by Canplats in the form of digital spreadsheets. This data was field checked for input errors, and later compiled by Vallat (2008).
Minorex also compiled the provided drilling data into specific tables, and imported the data into a drilling database using the Gemcom geological software program. Minorex then ran a series of validation checks verifying the location of the drilling and sampling data after which vertical sections were plotted and visually checked for any obvious errors. Minorex considers the drilling and sampling location information to be of good quality and has no reason to believe that the drilling information is inaccurate.
14.3
Independent Verification Sampling
Minorex collected nine verification samples during their property examination work on February 8, 2008. Five of the samples were one-quarter duplicate drill core samples of various mineralized intercepts in diamond drill holes CRD-01 and -03. The other four samples were collected from excavated bedrock exposures at the Discovery Pit and Trench 12, situated centrally within the Represa zone.
The collection, sampling and analytical procedures utilized for the verification sampling, plus the sample assay results and their comparisons with Canplats samples from the same drill hole interval, are well documented by Blanchflower (2008). A summary of the independent verification sample descriptions follows in Table 14-1 (after Blanchflower, 2008).
14-3
Table 14-1: Description of Verification Samples
| | | | |
Sample | Sample | Length | Location | Description |
No. | Type | (m) |
E901338 | 1/4 Core | 2.14 | DDH CRD-01, 324.0 to 326.14 m | Laminated, calcareous, py-rich slst - sdst |
E901339 | 1/4 Core | 2.00 | DDH CRD-01, 386.0 to 388.0 m | Banded, limy slst w/ hematitic fractures |
E901340 | 1/4 Core | 2.00 | DDH CRD-01, 442.0 to 444.0 m | Laminated, py-rich limy slst and sdst w/ hm |
E901341 | 1/4 Core | 2.85 | DDH CRD-03, 379.0 to 381.85 m | Metasomatized, hematitic limy slst - sdst |
E901342 | 1/4 Core | 2.00 | DDH CRD-03, 411.0 to 413.0 m | Laminated, brecciated, pyritic limy slst-sdst |
E901343 | Chip | 2.00 | South wall of Discovery Pit | Silicified, limy siltstone w/ fracture filling hm |
E901344 | Chip | 2.00 | South wall of Discovery Pit | Silicified, limy siltstone w/ fracture filling hm |
E901345 | Grab | 10.00 | East wall slope of Discovery Pit | Silicified, limy, hematitic siltstone-f.g. sdst |
E901346 | Grab | 20.00 | Northeast wall of Trench 12 | Silicified, limy, hematitic siltstone-f.g. sdst |
Note:
hm = hematite
py = pyrite
sdst = sandstone
slst=siltstone
lmst=limestone
14-4
SECTION 15
ADJACENT PROPERTIES
15.0
ADJACENT PROPERTIES
The Peñasquito property is the most notable property in the vicinity of the Camino Rojo property. This property has a similar geological setting and mineralization to the subject property, and is presently constructing mine and mill infrastructures for production. The following text is quoted from the Goldcorp Inc. website (2008and 2009) describing the Peñasquito property and its gold-silver-lead-zinc mineralization.
“The Peñasquito property, located in the mining state of Zacatecas, Mexico, possesses flat topography and excellent proximity to roads, power, rail, skilled labor and smelters. It is composed of two main deposits called Peñasco and Chile Colorado containing gold, silver, lead and zinc deposits.
According to Goldcorp (http://www.goldcorp.com/operations/penasquito/project_
summary, 2009), “At December 31, 2008, proven and probable gold reserves totalled 17.4 million ounces. Silver reserves totalled 1,045.7 million ounces while lead and zinc rose to 7.07 million tonnes and 15.36 million tonnes respectively. Measured and indicated gold resources, inclusive of proven and probable reserves, increased 39% to 17.8 million ounces. Measured and indicated silver resources increased 55% to 1.3 billion ounces.
Mechanical completion at Peñasquito was achieved as of mid-July, 2009. Construction of the first sulphide process line (Line 1) is complete and commissioning work is advancing on schedule. The primary crusher is complete and has filled the coarse ore stockpile with crushed ore in preparation for initial milling. The Line 1 feeders and conveying systems are complete. Construction of the Line 1 SAG mill and two ball mills is complete and commissioning is under way. The Line 1 lead and zinc flotation circuits are essentially complete.
Annual production over the life of mine (estimated 22 years) is expected to ramp up to approximately 500,000 ounces of gold, 30 million ounces of silver and over 400 million pounds of zinc.”
Other mineral occurrences in the vicinity of the Camino Rojo property have had only limited exploration. Some have been ‘high graded’ by local miners who have extracted hand-cobbed mineralization for custom milling at the Concepciòn del Oro facilities.
15-1
SECTION 16
MINERAL PROCESSING and METALLURGICAL TESTWORK
16.0
MINERAL PROCESSING and METALLURGICAL TESTWORK
16.1
Metallurgical Testwork
Mineralized material for the Camino Rojo project has been classified into Oxide, Transition and Sulphide zones.
Two preliminary metallurgical testwork programs have been completed investigating the metallurgical response of mineralized samples from the project. Both programs were performed by SGS Mineral Services (“SGS”) in Durango, Mexico. They investigated the recovery of gold and silver from oxide and transition samples as well as recoveries of lead, zinc, gold and silver from oxide, transition and sulphide samples.
Metallurgical testwork samples used in these programs were chosen by Canplats. Additional metallurgical testwork is planned to establish metallurgical treatment criteria and better define metallurgical responses which can be used in ongoing engineering development of the project. Metallurgical testwork performed to date along with planned additional testwork is aimed at developing a geo-metallurgical model for the project.
This section addresses the results from the metallurgical testwork programs performed to date. The results are very preliminary and further testwork is required to better define the metallurgical characteristics of the project.
16.1.1
Samples
Composite samples for metallurgical testwork program 1 were obtained from diamond drill core specifically drilled for metallurgical testing purposes (PQ size core). The holes were identified as “CRM” and were twins of reverse circulation holes that were drilled for geological purposes (“BCR” holes). The CRM holes had the same number as the twin BCR holes. For example metallurgical drill core CRM-006 was the twin for BCR-006. Intervals used in developing the metallurgical sample composites are shown in Table 16-1.
16-1
Table 16-1: Metallurgical Testwork Composites – SGS Program 1
| | | |
Hole ID | Interval (m) | Classification |
From | To |
CRM-0062 | 0 | 65.58 | Oxide |
CRM-0063 | 65.58 | 138.7 | Oxide |
CRM-0063 | 138.7 | 178.35 | Oxide |
CRM-014 | 0 | 120 | Oxide |
CRM-014 | 120 | 182 | Transition |
CRM-020 | 0 | 149.75 | Oxide |
CRM-020 | 149.75 | 249.8 | Transition |
CRM-038 | 0 | 200.7 | Oxide |
2 = Identified as Composite #1 in Testwork report
3 = Sample sets were combined to form the Composite #2-3 that is noted in the SGS Testwork report
(SGS-54-08)
Metallurgical tests performed on the samples were bottle roll, column leach and flotation. The flotation tests investigated production of a bulk rougher concentrate. Cleaning of the rougher concentrate was not investigated.
Composite samples for metallurgical testwork program 2 were obtained from diamond drill holes. Identification of the drill holes, intervals used and sample classifications are shown in Table 16-2.
16-2
Table 16-2: Metallurgical Testwork Composites – SGS Program 2
| | | | |
Hole ID | Composite ID | Interval (m) | Classification |
To | From |
CRD-005 | A | 168 | 198 | Transition |
CRD-005 | B | 218 | 248 | Transition |
CRD-009 | A | 532 | 560 | Sulphide |
CRD-009 | B | 674 | 700 | Sulphide |
CRD-012 | A | 290 | 320 | Sulphide |
CRD-012 | B | 360.6 | 390 | Sulphide |
CRD-012 | C | 522 | 556 | Sulphide |
CRD-013 | A | 260 | 288 | Transition |
CRD-013 | B | 316 | 348 | Sulphide |
CRD-015 | A | 164 | 194 | Transition |
CRD-015 | B | 220 | 250 | Transition |
CRD-015 | C | 296 | 326 | Sulphide |
CRD-022 | A | 180 | 210 | Transition |
CRD-023 | A | 312 | 346 | Sulphide |
BCR-038 | 10-20 | 10.16 | 20.32 | Oxide |
BCR-038 | 54-64 | 54.86 | 65.02 | Oxide |
BCR-038 | 100-110 | 101.6 | 109.73 | Oxide |
BCR-038 | 150-160 | 150.37 | 160.53 | Oxide |
BCR-038 | 200-210 | 201.17 | 211.33 | Oxide |
BCR-038 | 240-250 | 239.78 | 249.94 | Sulphide4 |
BCR-038 | 270-280 | 270.26 | 280.42 | Sulphide4 |
4 = Originally labeled as oxide for testwork. In Block model the intervals were labeled as sulphide. Canplats indicated sulphide is correct classification.
Except for hole ID BCR-038, both bottle roll tests and flotation tests were performed on all composite samples. Bottle roll tests only were performed on composite samples from hole BCR-038. The flotation tests investigated the potential to recover lead and zinc (along with associated gold and silver) into separate concentrates.
16.1.2
Mineralogy, Bond Work Index and Crusher Abrasion Index
No mineralogical analyses have been performed to date. Neither have any Bond work index or crusher abrasion index estimations. Future metallurgical testwork programs are planned to determine these.
16.1.3
Column Leach Tests
Eighteen column leach tests have been performed as part of testwork program 1. Twelve tests were performed on material identified as oxide (low grade and high grade) and 6 were performed on transition material. The tests investigated gold and silver recoveries associated with crush sizes (1.5inches, 0.75inches and 0.375inches) and leach time.
16-3
Differences between calculated and assayed head gradesin some tests are in excess of what is considered acceptable. This casts doubt on the accuracy of reported recoveries of gold and silver in some tests. For the purposes of completing the technical assessment, calculated assays have been used in evaluations. Consequently gold and silver recovery values should be treated with caution until additional testwork is performed to substantiate these values. It needs to be ensured in ongoing testwork that such differences are resolved by either re-assaying samples or repeating tests.
The effect of crush sizes from 1.5 inches to 0.375 inches on gold and silver recoveries for oxide samples are shown in Figures 16-1 and 16-2. The effect of crush size on transition material has only been evaluated on 2 samples and this is insufficient tests to show any meaningful trends.
Figure 16-1: Effect of Crush Size on Gold Recovery – Oxide Material

16-4
Figure 16-2: Effect of Crush size on Silver Recovery – Oxide Material

A difference in crush size between 1.5 and 0.375 inches has a negligible effect on gold recovery. Silver recoveries tend to increase as the crush size is reduced to 0.375 inches.
The crush size used in the technical assessment is 0.75 inches. There is insufficient testwork data at this stage to support a final crush size. The 0.75 inch crush size was been chosen as a suitable interim size for the assessment.
The effect of leach time on gold and silver recoveries is shown in Figures 16-3 and 16-4. The figures show the results for oxide and transition samples.
16-5
Figure 16-3: Effect of Leach Time on gold Recovery
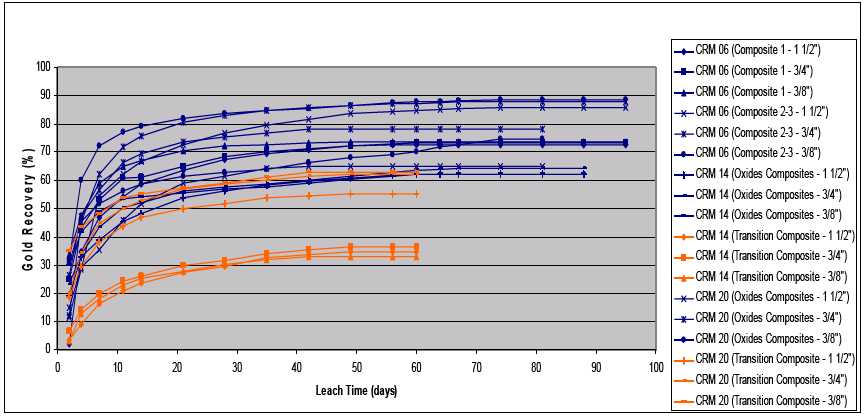
16-6
Figure 16-4: Effect of Leach Time on Silver Recovery
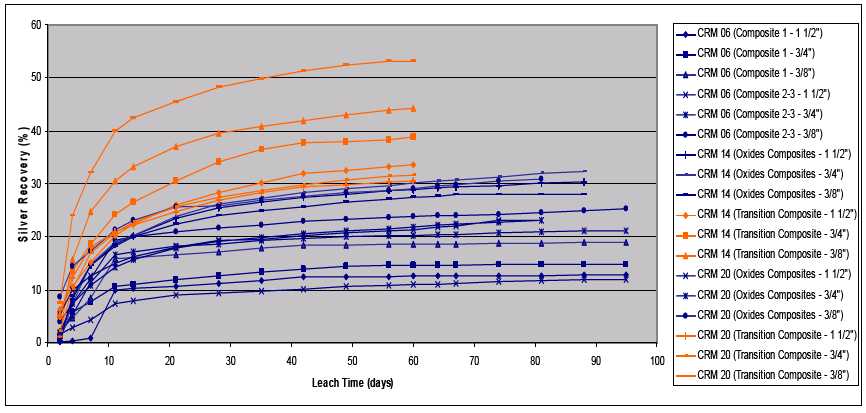
16-7
In general gold recovery is higher for oxide material than transition material. This is expected. The results indicate maximum gold recovery is achieved between 40 and 50 days of leaching.
Silver recoveries are consistently higher in transition samples than in oxide samples. It is also noted that head grades for silver in transition material tested were slightly higher than in oxide material. This could partly explain this discrepancy. Planned mineralogical evaluations should identify if there are reasons other than head grade for this. As with gold recoveries, maximum silver recovery for oxide material was achieved between 40 and 50 days. Maximum silver recoveries for transition material may be slightly longer than this. Additional testwork is required to better define this.
For the purposes of the technical assessment a leach cycle of 45 days was chosen.
The effect of gold and silver in head grades on recoveries is shown in Figures 16-5 and 16-6. The figures show the results for oxide and transition samples after 60 days of leaching.
Figure 16-5: Gold Recovery Versus Gold Head Grade
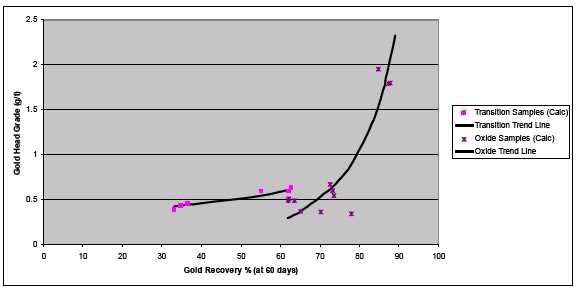
16-8
Figure 16-6: Silver Recovery Versus Silver Head Grade
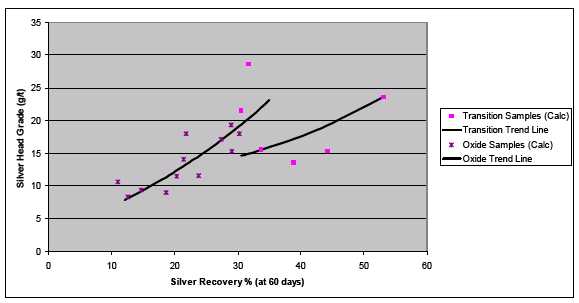
The results indicate different recovery trends for both gold and silver based on material classification (oxide or transition). Gold recoveries are indicated to be higher in oxide material than transition material while the opposite occurs for silver; silver recoveries are higher in transition material than oxide. As indicated above, this may be partly due to higher silver head grades in the transition samples tested.
At a 0.7g/t Au head grade, Figure 16-5 indicates a gold recovery of approximately 74% for oxide material and 69% for transition material. At a 14g/t Ag head grade, Figure 16-6 indicates a silver recovery of approximately 23% for oxide material and 28% for transition material. The 0.7g/t Au and 14g/t Ag are average plant feed grades used in the technical assessment.
16.1.4
Bottle Roll Tests
A total of 61 bottle roll tests have been performed as part of the SGS testwork programs 1 and 2. The tests investigated the recoveries of gold and silver from samples of oxide, transition and sulphide material. Most of the tests were performed at a primary grind of P80≈ 100 micron. Eight tests were performed at a primary grind of P80≈ 210 micron. Twenty four tests were performed at crush/grind sizes ranging from 1 inch to ¼ inch. Leach times in testwork program 1 were 48 hours for tests performed at grind sizes of P80≈ 100 micron and P80≈ 240 micron. Leach times of up to 196 hours were used for samples crushed to 1 inch, ½ inch and ¼ inch. Leach times in testwork program 2 were 96 hours. Seven tests were repeated as part of program 2 and the leach time for five of these tests was 120 hours.
As with column leach tests, differences between calculated and assayed head grades in some tests are in excess of what is considered acceptable. As such, this casts doubt on the accuracy of reported recoveries of gold and silver in some tests. For the purposes of completing the technical assessment, calculated assays have been used in evaluations. Consequently gold and silver recovery values should be treated with caution until additional testwork is performed to substantiate these values. Future metallurgical testwork should be monitored closely to ensure assaying accuracy and proper correlation occurs between calculated and assayed head grades. As part of this, Canplats should consider establishing a QA/QC program for ongoing metallurgical testwork which involves submitting assays standards to the laboratory for confirmation checks.
16-9
The effect of leach time on gold and silver recoveries is shown in Figures 16-7 and 16-8. The figures show results for oxide, transition and sulphide samples.
Figure 16-7: Effect of Leach Time on Gold Recovery
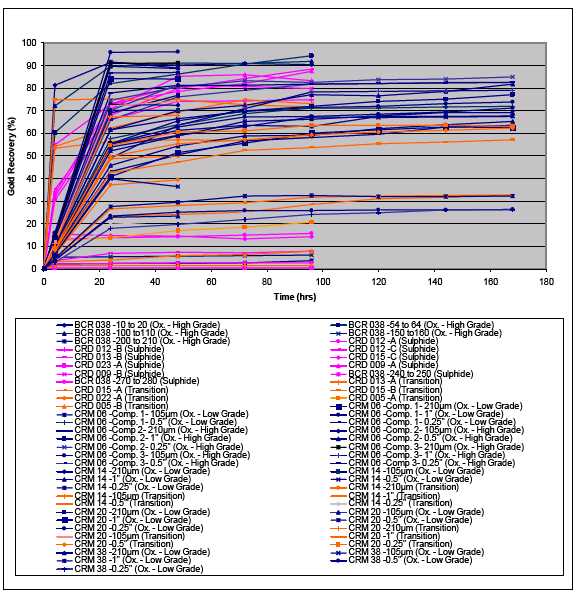
16-10
The gold recoveries show no clear distinction between oxide, transition and sulphide. It is expected that oxide samples would show consistently higher gold recoveries followed by transition and then sulphide samples. Issues that can cloud this effect are head grade and crush/grind size. These two items alone, however, do not explain the lack of distinction. Items such as assaying and classification of samples are also considered to be factors. Canplats should check sample classifications against their criteria. Assaying issues are discussed above. Mineralogical evaluations are recommended and these will also supply information on expected recoveries.
The data in Figure 16-7 indicates that gold dissolution is essentially complete after 48 hours.
Figure 16-8: Effect of Leach Time on Silver Recovery

16-11
As with gold, silver dissolution is essentially complete after 48 hours.
Silver recoveries show no clear distinction between oxide, transition and sulphide samples. As indicated above this could be due to a combination of:
·
Head grade.
·
Crush/grind size.
·
Assaying.
·
Classification of samples.
Mineralogical investigations are planned as part of the ongoing metallurgical evaluation and it is anticipated that this will give valuable insight into recovery details.
The effect of gold and silver in head grades on recoveries is shown in Figures 16-9 and 16-10. The figures show the results for oxide and transition samples after 2 days of leaching.
Figure 16-9: Gold Recovery Versus Gold Head Grade

16-12
Figure 16-10: Silver Recovery Versus Silver Head Grade
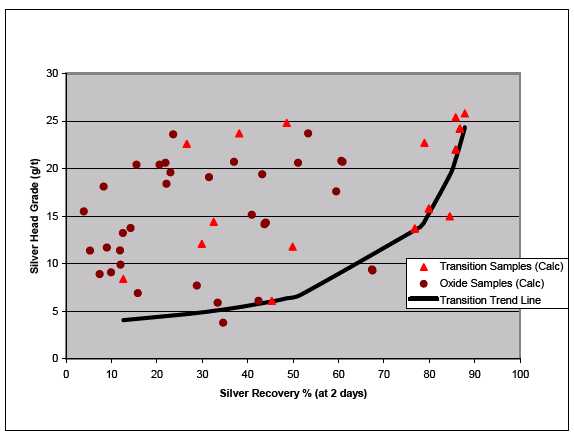
Results indicate slightly different recovery trends for gold associated with oxide and transition material. Recoveries are slightly higher with oxide material as expected. It should be noted that the data points are highly scattered (particularly for oxide material) and the trend lines are very preliminary.
Results for silver in oxide material are too scattered to determine a trend. A preliminary trend line has been developed for silver in transition material.
The reasons for the highly scattered nature of the data to date are uncertain. As indicated above it is expected to be a combination of:
·
Head grade.
·
Crush/grind size.
·
Assaying.
·
Classification of samples.
These issues should be addressed in future metallurgical testwork. Mineralogical evaluations should also provide valuable information into these causes.
16-13
16.1.5
Flotation Tests
A total of 35 flotation tests have been performed investigating recoveries of lead, zinc, gold and silver into rougher concentrates (bulk as well as lead and zinc). No tests investigating the cleaning of the rougher concentrates have been completed nor has any optimization of reagents been performed.
Twenty one tests were performed as part of testwork program 1 and 14 tests were performed as part of program 2. The program 1 tests investigated the recovery of lead and zinc along with gold and silver into a bulk rougher concentrate. These tests also investigated the effect of sulphidization on oxide samples. Two tests were performed to investigate the leaching of gold and silver from flotation tails. In program 2 the recovery of lead and zinc (along with associated gold and silver) into separate rougher concentrates were investigated. Primary grinds of between 65% and 75% passing 75 micron were used in the tests.
Oxide material is not normally amenable to treatment by flotation and the tests performed as part of SGS program 1 support this for the Camino Rojo material. Tests evaluating the effect of sulphidization indicate no significant improvement in metallurgical response.
Sodium cyanide leaching tests on flotation tails indicate additional gold and silver can be recovered, however, the practicality of performing this would most likely be cost prohibitive.
SGS program 2 investigated the flotation of sulphide and transition samples.
Given the preliminary nature of the flotation tests some encouraging results for recoveries of base metals were obtained as part of program 2 with sulphide samples. Three tests recorded recoveries of lead to the lead rougher concentrate in excess of 85% while two indicated recoveries in excess of 70%. Apart from these two tests, however, lead grades were mostly low and considerable upgrading would be required to produce a marketable lead concentrate. Recoveries of gold and silver to the lead rougher concentrate were reasonable in some tests. The results indicate increased recoveries of lead, gold and silver is required and further investigation is warranted; particularly in the areas of mineralogy and grind size evaluation.
Recoveries of zinc to the zinc rougher concentrate were mostly modest although two tests recorded recoveries in excess of 75%. Recoveries of gold and silver were mixed. Where these metals were not well recovered in the lead rougher concentrate they appeared as higher recoveries in the zinc rougher concentrate. Zinc grades in the zinc rougher concentrate were mixed. Considerable upgrading is needed to produce a marketable zinc concentrate.
Additional flotation testwork is warranted but this should be focused on sulphide material. Development of a flotation flowsheet needs to be performed in stages so proper evaluation of results can be performed and appropriate paths forward determined before proceeding to the next phase.
16-14
16.1.6
Metallurgical Testwork Recommendations
Metallurgical testwork performed on the Camino Rojo project to date is encouraging, however, very preliminary. In order to advance the project to a pre-feasibility level, additional metallurgical testwork is required. The primary objective of this testwork should be to focus on the recovery of gold and silver from the oxide and transition zones in order to better define metallurgical responses as well as develop criteria for ongoing engineering assessment. The recovery of silver in testwork to date has been very modest. Additional recovery of silver at current prices has considerable upside potential for the project and ongoing testwork should target improving this recovery. The secondary objective of future testwork should be to begin assessing the treatment of sulphides material. To these ends the following metallurgical testwork is required:
1.
Mineralogical assessments.
2.
Bond Work Index determinations.
3.
Crusher Work Index determinations.
4.
Bottle Roll Tests.
5.
Column Leach Tests.
6.
Flotation Tests.
Selection of metallurgical samples for testwork needs to be coordinated with the project’s geological staff to ensure representative samples of the different zones and rock types are correctly chosen. The testwork goal should be to develop a geo-metallurgical model of the deposit which can be used to reasonably predict metallurgical responses. As mine planning progresses, metallurgical samples should be chosen that are representative of the mine plan with an emphasis on samples in the early period of production. These samples should be tested to confirm that the metallurgical response is consistent with that predicted from the geo-metallurgical model.
16.2
Process Description
Using the metallurgical test results to date, MQes assembled a preliminary processing route to treat oxide and transition material from the Camino Rojo project via heap leaching. Information used in developing the proposed treatment route involved using preliminary testwork data supplemented by assumptions and data from MQes’ in-house database. Much of this information requires confirmation as the project is developed.
Following is a process description on the heap leach operation.
16-15
16.2.1
Process Overview
The following items summarize the conceptual processing operation to treat 20,000tpd of feed and extract gold and silver from the Camino Rojo project. The process comprises of a 20,000tpd crushing plant which will supply feed material to a heap leach processing circuit. Processing criteria considers:
·
The mining department will schedule plant feed and blend ore types to prevent plant throughput impacts from items such as over size rock at the primary crusher, plugging due to high moisture, etc.
·
A primary gyratory crusher will reduce the run-of-mine (ROM) feed size to a P80 of 120mm.
·
Primary crushed material will be stockpiled on a coarse ore stockpile and reclaimed by apron feeders.
·
Secondary and tertiary crushing will reduce the size of material to a nominal minus 100% passing 19mm (¾").
·
Fine crushed material will be screened and fed to a fine ore bin. Material will discharge the fine ore bin through dump gates onto a conveyor where lime is added before feeding into a truck loadout bin.
·
Material will discharge from the truck loadout bin into 91t haul trucks and transported to the heap leach pad where it will be stacked.
·
Gold and silver will be leached using sodium cyanide solution.
·
Gold and silver will be recovered for pregnant leach solution in a Merrill Crowe plant.
·
Zinc precipitate will be mixed with fluxes and smelted to produce silver-gold doré, the final product from the processing facility.
Heap leach processing will operate as a closed circuit, with barren solution recycled. Plant streams will include pregnant solution, barren solution, process water, fresh water, and potable water.
Reagents used in the process include sodium cyanide, pebble lime, diatomaceous earth, zinc dust, and antiscalant. Storing, preparing and distributing these reagents is included as a part of the process plant.
Processing control and monitoring is considered to be accomplished using a system of PLC’s (Programmable Logic Controllers) interfaced with workstations running supervisor human machine interface (HMI) operator software. Three control rooms are assumed; one at the primary crusher area, one at the secondary crusher area and one at the Merrill-Crowe Plant.
16.2.2
Primary Crushing, Ore Stockpile and Reclaim
Run of Mine (ROM) material is trucked from the mine to the primary crusher where it is dumped by 91 tonne haul trucks directly into a gyratory crusher.
16-16
A hydraulically operated, pedestal-mounted, rock breaker is installed at the dump pocket.
Primary crushed ore is withdrawn from the crusher discharge pocket by an apron feeder onto a transfer conveyor that discharges to the coarse ore stockpile. A magnet over the transfer conveyor picks up any tramp metal. A metal detector is also installed over the transfer conveyor ahead of the stockpile to further insure no metal enters the secondary circuit. A belt scale on the transfer conveyor records the amount of material crushed by the primary crusher.
Primary crushed ore is stockpiled on a prepared pad in an uncovered, conical shaped stockpile. The ore stockpile capacity is approximately 31,000 tonnes total storage (7,700 tonne live storage). A reclaim tunnel is installed under the stockpile. Ore is withdrawn from the coarse ore stockpile by 2 variable speed apron feeders that discharge material onto the secondary screen feed conveyor. A magnet over the secondary screen feed conveyor picks up tramp metal. ��A metal detector is installed over the conveyor ahead of the screen.
The secondary screen feed conveyor discharges material directly to the secondary screen. Screen undersize discharges to a transfer conveyor and is then be combined with secondary and tertiary crusher discharge on a collecting conveyor. Screen oversize is feed to the secondary crusher.
16.2.3
Fine Crushing and Reclaim, Fine Ore Stockpiles
As indicated above, oversize from the secondary screen discharges directly into the secondary crusher. Secondary screen undersize is combined with secondary and tertiary crusher discharge on a collecting conveyor. Crusher product is conveyed via the collecting conveyor belt and two transfer conveyors to the tertiary screens. Tertiary screen oversize is fed into the tertiary crushers. Tertiary screen undersize (crushing plant final product) discharges to the product conveyor belts and is fed into the fine ore storage bin. Material is withdrawn from the fine ore bin by dump gates onto a transfer conveyor to a truck loadout bin. A lime silo is mounted above the transfer conveyor and adds lime to material feeding this bin. A belt scale installed on the truck loadout bin feed conveyor is used for control of lime addition and metallurgical accounting on the heap leach pad.
Ore is withdrawn from the truck load out bin by a dump gate. The gate is activated by the truck driver and discharges its contents directly into a 91 tonne haul truck in approximately 0.5 minutes. The crushed material is then transported to the heap leach pad. At the leach pad it is stacked by end dumping in 11 metre thick lifts.
Dust control in the crushing area is accomplished by a combination of control measures including suppression, collection and containment. Suppression is used in the primary crushing and coarse ore stockpile area. Dust collection is used in the fine crushing and screening areas.
16-17
No fixed cranes have been included in the primary or fine crushing areas. Mobile cranes are considered to be used for maintenance purposes.
16.2.4
Heap Leaching
The heap leach pad consists of a prepared sub-base surface and a double liner system (geomembrane and clay/geosynthetic clay liner (GCL)). A crushed ore drainage layer with perforated pipe forms the drainage system on top of the liner to enhance drainage and recovery of pregnant leach solution.
The leach pad is loaded by haul trucks which end dump to form 11 metre thick lifts. Barren process solution is applied over a 45 day primary leach cycle. During steady state operation with the 45 day primary leach cycle, a total of approximately 900,000 tonnes is under primary leach (single lift basis). Secondary leaching, tertiary leaching, etc., occurs in the lower lifts as the leach pad is loaded in multiple lifts. Buried drip emitters are used to minimize evaporation losses and reduce surface ponding.
The configuration of the leach pad is such that there are six 10 metre lifts (settled). The average material depth over the entire pad is approximately 60 metres. When the last leach period is completed on the last lift, the heaps are allowed to drain down and solution quality is monitored for compliance. Appropriate environmental action is taken as solution quality during drain down is obtained. This could include rinsing, cyanide destruction, or microbial treatment to bring solutions into compliance.
Solution exiting the heap is collected in a pregnant solution pond (double lined geomembrane). Adjacent to this pond is a lined containment pond (single geomembrane liner) sized for an estimated 100 year, 24 hour maximum storm event. Any overflow from the pregnant solution pond reports to the containment pond via a spillway. The overflow is then returned to the process.
16.2.5
Merrill-Crowe Refinery
Gold and silver is recovered from heap leach pregnant solution by zinc precipitation of metal ions using zinc dust and then smelting of silver and gold.
The process of recovering silver and gold by the Merrill Crowe process includes:
·
Clarification and filtering of pregnant solution to remove suspended solids.
·
Deaeration of pregnant solution to reduce dissolved oxygen.
·
Precipitation of gold and silver metal by addition of zinc dust.
·
Filtering and drying of precipitate.
·
Smelting the precious metal precipitate in a furnace to produce Doré bars.
The precious metal recovery circuit is designed to process approximately 123,000 ounces of gold and 755,500 ounces of silver annually.
16-18
Pregnant solution from the heap leach circuit is pumped to a pregnant solution tank located in the plant area. Pregnant solution from the tank is pumped to three (two operating and one standby), self-cleaning pressure leaf clarifier filters. The clarifier filters are leaf type with an automated leaf wash sequence that activates as needed based on pressure or time. Filters are precoated using diatomaceous earth as a filter aid and in addition, have a continuous body feed addition of diatomaceous earth to assist filtering as needed. For these purposes, two pumps with a common tank are provided with the filter units. Pressure for filter operations are provided by the pregnant solution pumps. Filtrate (clarified solution) discharges directly to the deaeration tower.
Clarified solution is passed through the deaeration tower to remove dissolved oxygen to less than 0.5 ppm prior to zinc dust addition. The deaeration tower is connected through a barometric seal to a vacuum pump.
The clarified, deaerated, pregnant solution is withdrawn from the bottom of the deaerator tower by a single-stage, vertical, in-line, centrifugal pump, submerged in water to prevent re-entry of air through the pump gland. The pump discharges to the precipitation filter presses. An emulsion of zinc dust and pregnant solution is added to the pregnant solution at the pump suction to precipitate the silver and gold.
Zinc dust is hand loaded into a zinc feeder hopper from as-delivered 45-kg capacity pails, and discharges via a rotary feeder into a mixing cone which emulsifies the zinc dust with pregnant solution. The mixing cone is continuously supplied with pregnant solution to prevent air from entering the suction of the precipitation feed pump. The slurry is then pumped to three (two operating and one standby) plate-and-frame filter presses in parallel, where the precipitated precious metals are collected. The plate and frame presses are pre-coated with diatomaceous earth similarly to the clarifier filters, and are manually opened and cleaned with precipitate being collected in carts.
Barren solution (filtrate) exiting the Merrill Crowe circuit returns to the barren solution pond. Cyanide is added as needed to the barren solution to maintain operating parameters in the barren solution prior to being pumped to the heap leach pad.
16.2.6
Refinery
Zinc precipitate is placed in carts and dried in ovens. The carts containing dry filter cake are removed from the ovens by forklift and tipped into the furnace feed hopper. A smelting flux mixture is then added.
The smelting furnace is propane fired. The charge is melted and the majority of the slag is decanted into conical molds. The decant slag is cooled and checked for any contained metal prior to short term storage and disposal. Following the final decant step, doré bullion comprised of silver and gold, is poured and sinks to the bottom of semi-cylindrical bar molds for subsequent handling. Small quantities of bar slag, containing fused fluxes, impurities, and minor amounts of doré splash and prills are recycled to the next smelting charge.
16-19
Bars are cleaned at a bar cleaning station using a sand blasting technique and a needle gun, weighed and stamped with an I.D. number and weight. Doré bars weighing approximately 110 kilograms are the final product of the operation and stored in a vault until shipment to an off site facility for further refining.
Fumes from the melting furnace are collected through ductwork and cleaned in a dust collector before discharging to atmosphere.
16-20
SECTION 17
MINERAL RESOURCE and MINERAL RESERVE ESTIMATES
17.0
MINERAL RESOURCE and MINERAL RESERVE ESTIMATES
17.1
Introduction
This section of the report will document an independent, NI 43-101-compliant estimate of the mineral resources for the Represa zone. This estimate represents anin situ global resource, and does not explicitly or implicitly refer to possible resources contained in any other mineralized zone within the Camino Rojo property. This resource estimate was undertaken by J. Douglas Blanchflower, P. Geo. of Minorex Consulting Ltd. of Aldergrove, British Columbia. The effective date of this resource estimate is November 24, 2008.
The principal components of the resource estimation study included:
·
Database compilation and data verification;
·
Domain interpretation and 3D wire-frame construction;
·
Geostatistical analysis for grade capping, compositing and density determinations;
·
Variography study;
·
Interpolation and validation; and
·
Resource classification, estimation and validation.
17.2
Database
All of the topographic, drilling and trenching data and assay results were provided by Canplats in the form of Excel spreadsheet files, drawing files, drill logs and plotted geological cross-sections. The assay data was also provided by Canplats after the compilation and validation work undertaken by Vallat (2008).
The complete database contained data for 92 reverse circulation drill holes, 30 diamond drill holes and 11 surface trenches of which the data from 86 reverse circulation drill holes, 25 diamond drill holes and 7 surface trenches were utilized in the resource estimation. The remaining data from the drilling were not within the Represa area and the remaining trenches had incomplete survey and/or analytical data. A surface drill hole plan accompanies this report as Figure 11-1.
The compiled drilling and assay database was validated with Gemcom software with only minor corrections. The entire assay database contains 21,382 assays for gold and analyses for silver, lead and zinc. In addition, there are analyses for 30 other elements determined by I.C.P. analysis. The Represa Zone portion of the assay database that apples to the resource estimate and is summarized in Table 17-1, includes 19,423 analyses for gold, silver, lead and/or zinc. All data are expressed in metric units and grid coordinates are in NAD 27 UTM reference system.
17-1
Table 17-1: Summary of Types of Sample Data
| | | |
Type | Number | Metres | Number of Samples |
RC Drill Holes | 86 | 22,250.39 | 12,058 |
Diamond Drill Holes | 25 | 13,546.16 | 7,135 |
Trench Channel Samples | 230 | 257.79 | 230 |
17.3
Data Verification
The entire assay database for the drilling and trenching was verified by Vallat (2008) during her assay database compilation and QA-QC study. All assay data entries were checked against digital assay lab certificates from ALS Chemex. After the receipt of the umpire check assay results, Vallat delivered the final assay database to Minorex for use during the resource estimation work.
Minorex validated the assay database using Gemcom software while incorporating it into the Camino Rojo drilling database and found no obvious data errors. This is not to say that the assay database may be 100% accurate but that there were no obvious or detectable data errors using conventional validation techniques.
17.4
Compositing
Length-weighted composites were generated for the drill hole data within the Represa zone. Most of the reverse circulation samples had been collected at 1-metre intervals but 2 metres was the dominant length for most of the diamond drill samples. The average sample length for all drill samples within the Represa zone is 1.86 m. Thus, composites were calculated for gold, silver, lead and zinc over 2.0-metre lengths commencing at each drill collar and extending to or near the end of each drill hole. Any missing assay values for the four principal elements were assigned a ‘NE’ designation (i.e. Not Entered) that prevented a composite calculation using a zero value for the missing element value. Assay intervals with ‘below limits’ values were assigned one-half the assay lab detection limit values. Any composites less than 2.0 metres, commonly at the end of the drill hole, were discarded s o as to not introduce any bias in the interpolation process.
Sampling of the seven excavator trenches within the Represa zone was not continuous, often alternating between trench walls. Thus, the 320 trench samples that were utilized in the geological modelling and later interpolation were not composited but only samples with lengths greater than 0.8 metre, with 3-coordinate survey locations at the start and finish of each sample interval, and complete and validated analyses were considered for this study.
Drill hole compositing produced a total of 17,336 two-metre composites within the entire Represa zone which were transferred to other tables in the Gemcom database for geomodelling. There were an additional 612 composite lengths with missing assay values for any one or all of the principal elements, commonly situated beyond the mineralization where the recovered drill core or chips had not warranted analysis.
17-2
17.5
Geological Modelling
The gold with attendant silver lead and zinc mineralization of the Represa zone is quite continuous and well distributed laterally and vertically within the explored portion of the zone. It has been drill tested laterally for more than 1,000 m east-west from U.T.M. grid 243900 to 244900 East, 460 m north-south from U.T.M. 2675830 to 2676290 North, and vertically for 820 m from surface to 1130 m AMSL The emplacement of the mineralization appears to have been controlled by a combination of steeply dipping, northwesterly trending strike-slip fracturing with associated northeasterly dilational fracturing cutting shallow dipping permeable sandy host rocks that allowed the ascending metal-bearing hydrothermal fluids to flow laterally along bedding. There does not appear to be any predominant lithologic or alteration control to the mineralization but rather a gradational assay boundary where the fracturing and permeability of th e host rocks decreased and restricted hydrothermal fluidization.
Based upon the zonal continuity of the mineralization and the reported incremental cut-off grades for current mining operations in Mexico employing open pit mining and heap leach recovery methods, it was decided to initially outline the greater than 0.1 grams per tonne gold mineralization using the uncapped 2-metre gold composites as a means of determining an assay boundary for the Represa mineralization.
Forty-nine (49) vertical cross-sections were generated using Gemcom software at 25-metre intervals facing due east from U.T.M. 243800 to 245000 East between U.T.M. 2675300 to 2676400 North and extending from an elevation of 1100 m AMSL to above the topographic surface. Canplats also provided 18 drilling cross-sections at 50-metre intervals with geological interpretations of the mineralization distribution. These sections faced westward from 244000 to 244850 East.
The assay boundary of the Represa mineralization was digitized using Gemcom software to display the uncapped 2-metre gold composites on cross-sections at 25-metre intervals. The domain boundaries were influenced by the selection of mineralized material in excess of 0.1 g/t gold and demonstrated zonal continuity along strike and down dip. Occasionally, mineralization grading below 0.1 g/t gold was included for the purpose of maintaining zonal continuity. Polylines were snapped to composite interval points first using North-South oriented section, next using a second set of East-West oriented sections, and lastly on a North-South set of sections using the outlines resulting by the two previous sectional interpretations to generate a final set of polylines that best reflected the three-dimensional boundaries of the mineralized material. At model extremities, polylines were extrapolated for approximately 50 metres beyon d the last drill hole intercept. The final polylines were smoothed, wobbled on section, and joined using tie lines forming three-dimensional wire-frame solids.
The western end of the Represa zone appears to have been displaced downward and slightly northward by northwesterly trending strike-slip faulting and fracturing, which together with local wider-spaced drilling, has resulted in mineralized intercepts appearing to be isolated and discontinuous. Where the mineralization appeared to be discontinuous beyond 50 metres section-to-section, due to structural displacement and/or lack of detailed drill testing, several smaller wire-frame models were constructed and extended 12.5 m along strike (i.e. halfway to the next section).
17-3
A total of 13 wire-frame solids were constructed and all were validated error-free. These solids were used to code the ‘Rock Type’ model in the block model, control the interpolation, and filter the composites for grade capping and variogram analysis. See Figure 17-1 for various views of the modelled solids.
Canplats provided Minorex with 19 drill cross sections spaced at 50-metre intervals showing the interpreted base of the oxidized mineralization and the underlying top of the sulphide-dominant mineralization. Minorex imported the plotted lines and created two, three-dimensional surfaces using Gemcom software. These surfaces were later used to subdivide the mineral resources between those within the oxide, transitional (i.e. the intervening zone between oxide- and sulphide-dominant mineralization) and sulphide mineralization (see Figure 17-2).
17-4
Figure 17-1: Views of the Represa Mineral Domain
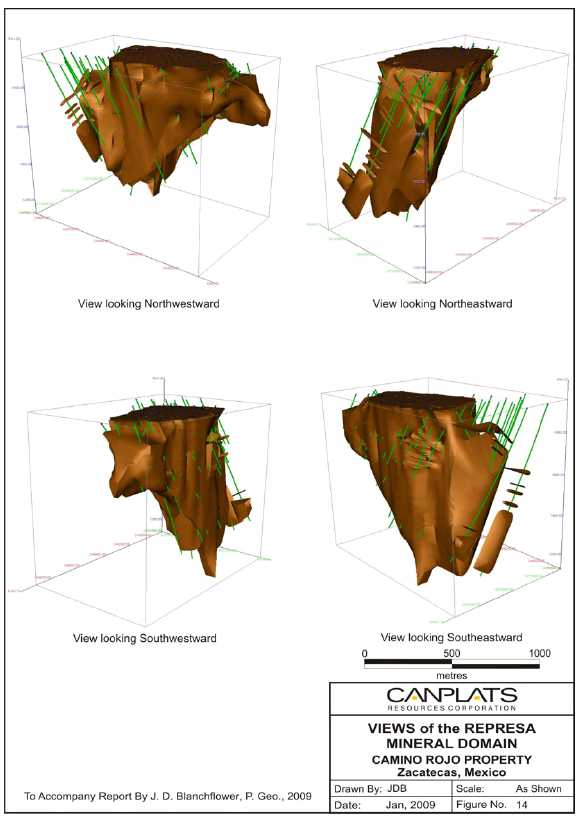
17-5
Figure 17-2: OS and SX Surfaces Represa Zone
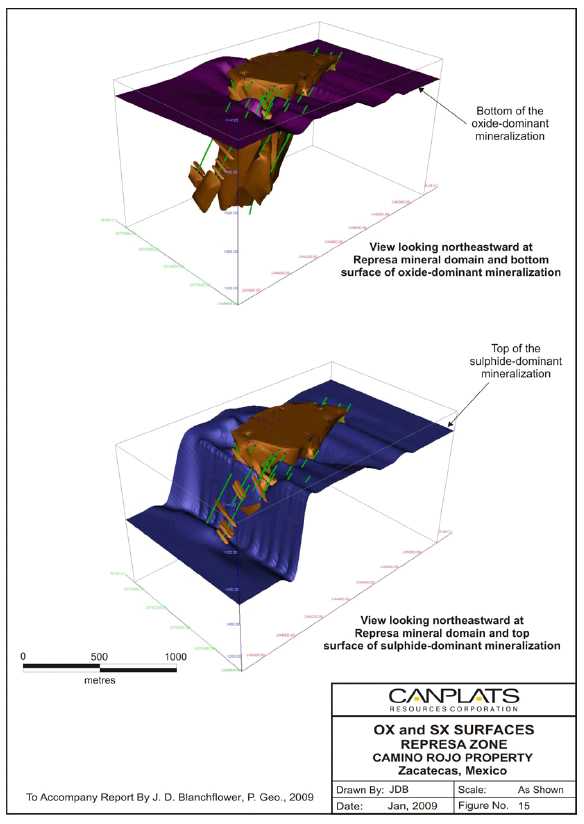
17-6
17.6
Rock code Determination
The rock codes used for the resource model were derived from the thirteen mineralized domain solids and are shown in Table 17-2 below.
Table 17-2: Rock code Description
| | | | |
0 | Air | | 8 | Au01 G |
1 | All Au01 A - M | | 9 | Au01 H |
2 | Au01 A | | 10 | Au01 I |
3 | Au01 B | | 11 | Au01 J |
4 | Au01 C | | 12 | Au01 K |
5 | Au01 D | | 13 | Au01 L |
6 | Au01 E | | 14 | Au01 M |
7 | Au01 F | | 99 | Waste Rock |
17.7
Grade Capping
Grade capping was investigated on the raw assay values to insure that possible erratically high values did not bias the resource estimate. Frequency and cumulative probability graphs were plotted to visually determine grade capping levels. These graphs are available in Appendix II of “Technical Report on the Mineral Resources of the Camino Rojo Property (Minorex; January 5, 2009)”. The capping levels are listed in Table 17-3 below and are consistent with industry standard practices.
Table 17-3: Grade Capping Values
| | | | | |
Element | Capping | Units | Cumulative Percent | Raw Coefficient | Capped Coefficient |
Value | for Capping | Of Variation | of Variation |
Au | 9.50 | g/t | 99.7 | 1.84 | 1.63 |
Ag | 87.00 | g/t | 99.3 | 1.59 | 1.19 |
Pb | 1.40 | % | 99.2 | 1.32 | 1.25 |
Zn | 2.50 | % | 99.4 | 1.33 | 1.05 |
Note:
Coefficient of Variation = Standard Deviation/Mean
Once the grade capping levels had been determined erratically high values for the gold, silver, lead and zinc in the raw assay database were capped accordingly, and 2-metre composites were recalculated using the capped assay data following the parameters documented in section 17.4. A summary of the resultant capped composites which were utilized during interpolation and estimation of the mineral resources is presented in Table 17-4.
17-7
Table 17-4: Summary of Statistics of Uncapped and Capped Composites
| | | | | | | | | | |
| Uncapped Drill Hole Composite | Capped Drill Hole Composite |
| | | | | | | | | | |
Metal | Min | Max | Mean | Std | CV | Min | Max | Mean | Std | CV |
Dev | Dev |
Au | 0.001 | 40.438 | 0.688 | 0.988 | 1.438 | 0.001 | 9.50 | 0.677 | 0.877 | 1.295 |
Ag | 0.010 | 1500.000 | 12.445 | 18.851 | 1.515 | 0.010 | 87.00 | 12.187 | 11.606 | 0.952 |
Pb | 0.001 | 3.447 | 0.215 | 0.228 | 1.06 | 0.001 | 1.40 | 0.214 | 0.214 | 0.998 |
Zn | 0.001 | 5.366 | 0.374 | 0.326 | 0.87 | 0.001 | 2.50 | 0.371 | 0.308 | 0.831 |
17.8
Bulk Density
The global bulk density used for the resource model was determined from specific gravity and/or bulk density measurements on 297 selected drill core samples. In total 357 drill samples were analyzed from various drill holes on sections 50 metres apart along the trend of the Represa zone. After modelling the Represa mineral domain (i.e. > 0.1 g/t gold grade shell), it was determined that 297 specific gravity or bulk density measurement points were situated within the domain of which 156 points were situated within the oxide-dominant mineralization and 141 points were within the sulphide-dominant mineralization.
A statistical analysis of the specific gravity and bulk density measurements determined that the mean density for samples within the oxide-dominant mineralization is 2.681 g/cc, the mean density for samples within the sulphide-dominant mineralization is 2.687 g/cc, and the mean density of the combined samples is 2.681 g/cc. Given the very similar mean density values, it was decided to apply a common density of 2.681 g/cc for all thirteen rock codes (see Section 17.6), and the ‘Density’ block model was coded accordingly within the mineral domain.
17.9
Variography
The Sage2001 variography software was utilized to evaluate the spatial continuity of the gold, silver, lead and zinc mineralization, using the capped 2-metre composite data within the constrained mineral domain.
Standardized conventional variography was used to model the grade continuity. Nugget effects were estimated from true downhole semi-variograms. Correlations between grade-elements within the domain were investigated when determining ranges of the semi-variograms. The major, semi-major and minor axes for grade continuity were determined using oriented semi-variogram fans. Anisotropic directional semi-variograms were then defined for resource estimation utilizing the Gemcom Azimuth-Dip-Azimuth convention.
Directional semi-variograms were produced for each of the four grade-elements after multiple experimental semi-variograms had been generated at 15 degree intervals for both strike and dip directions. Modelling of the gold and zinc continuity produced good experimental semi-variograms, silver produced moderate quality experimental semi-variograms, and lead produced poor experimental semi-variograms. The semi-variogram parameters for each of the four grade-elements can be found in Appendix III of “Technical Report on the Mineral Resources of the Camino Rojo Property (Minorex; January 5, 2009)”.
17-8
17.10
Block Model
A three-dimensional block model was created in Gemcom to cover the Represa mineralized zone. The block model was not rotated and its parameters are summarized as in Table 17-5.
Table 17-5: Block Model Parameters
| | | | | | |
Axis | Actual | Axis | Axis | Origin | Block | No. of |
Direction | Orientation | Nomenclature | Coordinates | Size (m) | Blocks |
Easting | 090o | X | Column | 243650 | 5 | 300 |
Northing | 000o | Y | Row | 2675600 | 5 | 180 |
Elevation | Vertical | Z | Level | 2000 | 5 | 180 |
Separate block models were created for Rock Type, Density, Percent, Class, Gold, Silver, Lead and Zinc. In addition, several special models were created including: Distance (to the Closest Sample for first pass), Distance 2 (to the Closest Sample for second pass), Number of Samples (used in block estimation), Measured (used to determine measured resources), and various interpolation and classification verification models (i.e. Tonnes, GxT Au, GxT Ag, GxT Pb, GxT Zn).
The percent block model was created to accurately represent the volume and subsequent tonnage that was occupied by each block inside the constraining Represa mineral domain. The block model was coded for air (i.e. above topography), background and the mineralized domain by coding blocks with a one percent (1%) threshold. Blocks with more than 1% of the block inside the domain were given the code of the domain. Thus, the domain boundaries were properly represented by the percent model with the ability to measure infinitely variable inclusion percentages within the domain.
17.11
Interpolation
Gold, silver, lead and zinc grades were estimated for each block in the block model using capped grade composites with ordinary kriging interpolation. Histogram distributions and probability plots for gold, the primary element of interest, showed unusually good grade distribution justifying an ordinary kriging interpolation (see Figures 17-3 and 17-4).
Grade interpolation was carried with two passes. The first pass estimated grade in the most densely drilled portion of the mineral domain, requiring a minimum of 4 samples and maximum of 12 samples to estimate a block with a maximum of three samples from each drill hole within the search ranges. Any higher gold grades (> 3.0 g/t) encountered during kriging reduced the interpolation distance to one-quarter of the search range; thus, reducing any possible ‘grade smearing’ from isolated higher grade composites. During interpolation the number of samples used for each grade-element interpolation and the closest distance to an actual composite sample were written to the ‘Number of Samples’ and ‘Distance’ block models respectively.
17-9
The second kriging pass was carried out like the first but without the restriction of number of samples per drill hole. This second pass estimated grades in portions of the mineral domain with a paucity of composites due to more widely-spaced drilling. As with the first pass, the number of samples used for each grade-element interpolation was written to the ‘Number of Samples’ but the closest distance to an actual composite sample was written to the ‘Distance 2’ block model. Table 17-6 provides a summary of the interpolation parameters.
Table 17-6: Interpolation Parameters
| | | | | | | | | | | |
Element | Pass | Z | Rotation | Z | Nugget | X | Range | (m) | Max # | Min # | Max # |
| No. | Y | | Y | Z | per hole | Samples | Samples |
Gold | 1 | 58o | -12o | 69o | 0.30 | 91.8 | 313.8 | 153.9 | 3 | 4 | 12 |
Gold | 1(HG) | 58o | -12o | 69o | 0.30 | 23.0 | 78.5 | 38.5 | 3 | 4 | 12 |
Gold | 2 | 58o | -12o | 69o | 0.30 | 91.8 | 313.8 | 153.9 | | 4 | 12 |
| | | | | | | | | | | |
Silver | 1 | -78o | 44o | 22o | 0.30 | 111.3 | 318.8 | 160.5 | 3 | 4 | 12 |
Silver | 2 | -78o | 44o | 22o | 0.30 | 111.3 | 318.8 | 160.5 | | 4 | 12 |
| | | | | | | | | | | |
Lead | 1 | 21o | -3o | -72o | 0.15 | 112.1 | 220.0 | 150.0 | 3 | 4 | 12 |
Lead | 2 | 21o | -3o | -72o | 0.15 | 112.1 | 220.0 | 150.0 | | 4 | 12 |
| | | | | | | | | | | |
Zinc | 1 | -64o | -42o | -10o | 0.30 | 215.8 | 443.8 | 141.7 | 3 | 4 | 12 |
Zinc | 2 | -64o | -42o | -10o | 0.30 | 215.8 | 443.8 | 141.7 | | 4 | 12 |
17-10
Figure 17-3: Log Normal Histrogram Plot of Capped Gold Composites
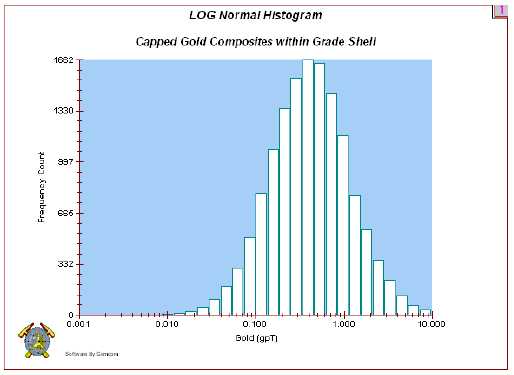
Figure 17-4: Log Normal Probability Plot of Capped Gold Composites
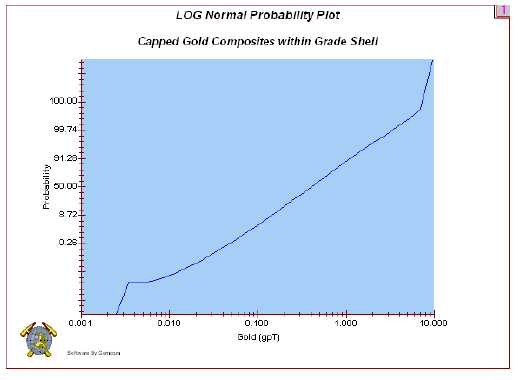
17-11
17.12
Interpolation Validation
The validation of the Represa block model included visual inspections of the block grades versus composite data values and ‘one out’ cross-validation.
A preliminary kriging interpolation run was conducted to provide a visual check on the kriging parameters. Visual inspections of the silver, lead and zinc block models showed that the kriging interpolation had extrapolated grades with reasonable values and distribution throughout the modelled domain, but that the preliminary kriging parameters had also extrapolated gold grades into some areas from very isolated, single high composite intervals. Search parameters were modified to limit the extrapolation from such instances to twenty-five percent (25%) of the search distance for grades exceeding 3.0 g/t gold. Re-kriging of the gold composites showed that the re-interpolated gold grades closely matched expected values and distribution.
The ‘one out’ cross-validation routine is used for validating kriged and inverse distance weighted models. It is a discretionary sub-routine within the Gemcom kriging profile that involves the removal of a single point from the data set and the estimation of that point using the remaining data. Values are then estimated for all the data points in the data set. The original values and the estimated values for all the data points in the data set can then be statistically analysed and graphed. The graphs are used to examine the relationship of the original values to the estimated values, and check if the interpolation is under or over estimating.
The ‘one out’ cross-validation was used to ‘fine tune’ the number of samples used for kriging. The cross-validation graphs were produced for a range of kriging profiles for each element with a different maximum number of samples used in the interpolation. The graphs were used to check on the effects of more data or averaging during interpolation, thus, optimizing the kriging parameters. The final interpolation profiles were revised to maximize the number of samples for each metal that produced the best cross-validation results.
The results of the ‘one out’ cross-validation show the difference between the mean of the estimated grades from interpolation and the mean of the actual grades from the composite dataset as a percentage of the mean of the actual composite grades. The difference between the mean estimated grades and mean actual composite grades for two interpolation passes for all grade-elements were less than 0.61 percent. Table 17-7 contains a summary of the ‘one out’ cross validation results. Appendix IV of “Technical Report on the Mineral Resources of the Camino Rojo Property (Minorex; January 5, 2009)” contains example cross-sections and bench plans of the gold model.
17-12
Table 17-7: Summary of ‘One Out’ Cross-Validation Results
| | | | |
Interpolation | Unit | Estimated | Actual | Difference |
Run | Grade | Grade | (%) |
Ag First Pass | g/t | 12.256900 | 12.186850 | 0.57 |
Ag Second Pass | g/t | 12.215490 | 12.186850 | 0.23 |
| | | | |
Au First Pass | g/t | 0.676179 | 0.677372 | -0.18 |
Au Second Pass | g/t | 0.678286 | 0.677372 | 0.13 |
| | | | |
Pb First Pass | % | 0.214345 | 0.214301 | 0.02 |
Pb Second Pass | % | 0.214506 | 0.214301 | 0.10 |
| | | | |
Zn First Pass | % | 0.368598 | 0.370846 | -0.61 |
Zn Second Pass | % | 0.371366 | 0.370846 | 0.14 |
17.13
Resource classification
The mineral resources of the Represa zone were classified as measured, indicated or inferred based upon true distance from a block to the nearest capped grade composite. Only blocks inside the three-dimensional mineral domain were classified; all other blocks were not interpolated or classified.
After all of the blocks within the mineral domain had been interpolated and thoroughly checked, blocks with ‘Measured’ resources were selected. The block selection process for a ‘Measured’ classification had to meet multiple criteria, including: the true distance to the nearest capped assay composite had be within 0.01 to 20.0 m (i.e. this distance determined from gold semi-variogram results); selected blocks had to be situated vertically beneath excavator trenching and only where multiple chip samples had returned greater than 0.1 g/t gold values; and the resources had to occur within 150 m of surface restricted almost exclusively to oxidized mineralization. An ‘Inverse Distance Squared’ interpolation procedure was used to code a separate block model identifying those blocks with the aforementioned criteria. Thus, ‘Measured’ resources were only selected and coded vertically beneath positive trenching results providing visible evidence for lateral continuity of the mineralization within an area of high drilling density.
The classification of ‘Indicated’ and ‘Inferred’ resources were coded in two passes, as with the kriging interpolation. The first pass ‘Distance’ model was used to classify all interpolated blocks within true distances of 20.01 to 60.0 metres as ‘Indicated’, and these blocks were coded as ‘Indicated’ in the ‘Class’ block model. Next, all interpolated blocks within true distances of 60.01 to 100.0 metres, as reported in the first pass ‘Distance’ model, were classified and coded as ‘Inferred’ in the ‘Class’ block model.
Any interpolated blocks with a true distance of 0.01 to 100.0 m in the ‘Distance 2’ block model (second pass interpolation) were classified and coded as ‘inferred’ in the ‘Class’ block model. These blocks were commonly situated in areas of low data density and have the lowest confidence level. Blocks beyond the 100.0-metre maximum distance for Inferred resources were not classified or reported in the resource estimates.
17-13
Appendix V of “Technical Report on the Mineral Resources of the Camino Rojo Property (Minorex; January 5, 2009)” contains example cross-sections and bench plans of the classification model.
17.14
Resource Estimate
The resource estimate was derived from applying a gold cut-off grade to the block model and reporting the resulting tonnes and grades for potentially economic areas. The rationale supporting the calculation of the gold cut-off grades was based largely upon research of reported cut-off grades for proposed and operating open pit mining operations with heap leach precious metal recovery facilities in Mexico and the U.S.A., and estimations of mining, recovery and general and administrative expenses for such operations using 4- to 5- year trailing average gold prices. These cut-off gold grades were estimated without the benefit of the results from the metallurgical studies.
A cut-off grade of 0.2 g/t gold was used to estimate the resources of the dominantly oxidized and transitional (mixed oxide and sulphide) mineralization. It is expected that some of the silver resources within these two types of mineralization may also be recovered by a possible heap leach recovery operation but they have not been factored into cut-off grade calculation.
It was assumed that at the base of the oxide and transitional mineralization the treatment of the precious metal-bearing sulphide mineralization would require more expensive conventional milling to recover gold and some portions of the silver, lead and zinc values. Such treatment would require a higher cut-off grade of 0.3 g/t gold with additional credits for the attendant silver, lead and zinc values.
Table 17-8 documents information provided to Minorex by Canplats (2008) showing the cut-off grades reported for several U.S.A. and Mexican open pit mining and heap leach operations.
17-14
Table 17-8: Cut-Off Gold Grade Data for Open Pit and Heap Leach Operations**
| | | | |
Project | Company | Cut-Off | Reference | Gold Price |
(g/t Au) | Source | (US $/oz) |
Cortez | Barrick | 0.17 | Mar 27/08 AIF | $575 |
Round Mountain | Barrick | 0.24 | Mar 27/08 AIF | $575 |
Hycroft | Allied Nevada | 0.17 | Sept 3/08 News Release | $650 |
El Castillo | Castle Gold | 0.15 | Aug 20/08 News Release | $625 |
Los Filos | Goldcorp | 0.22 | Mar 25/08 AIF | $550 |
Bermejal | Goldcorp | 0.20 | Mar 25/08 AIF | $550 |
Peñasquito | Goldcorp | 0.14* | Dec/07 Technical Report | $525 |
| Mean Au Cut-off Grade | 0.18 | Mean Au Price | $578 |
*
Recoverable gold cut-off grade at Peñasquito Mine ($2.29 per tonne including mining, heap leaching and G & A expenses).
**
Data provided by Canplats, 2008.
The resource estimates for the oxide, transitional and sulphide mineralization of the Represa deposit have been summarized in Table 17-9.
Table 17-9: Represa Mineral Resource Estimate
| | | | | | | |
Oxide | Tonnes | Gold | Silver | Lead | Zinc | Gold | Silver |
0.2 g/t Au Cut-Off | (000's) | (g/t) | (g/t) | (%) | (%) | (000's oz) | (000's oz) |
Measured | 9,571 | 0.76 | 13.40 | 0.29 | 0.34 | 234 | 4,122 |
Indicated | 54,372 | 0.69 | 13.24 | 0.25 | 0.34 | 1,210 | 23,146 |
Meas & Ind | 63,943 | 0.70 | 13.26 | 0.26 | 0.34 | 1,444 | 27,268 |
Inferred | 2,407 | 0.55 | 10.89 | 0.19 | 0.27 | 42 | 843 |
| | | | | | | |
Transitional | Tonnes | Gold | Silver | Lead | Zinc | Gold | Silver |
0.2 g/t Au Cut-Off | (000's) | (g/t) | (g/t) | (%) | (%) | (000's oz) | (000's oz) |
Measured | 5 | 1.04 | 19.94 | 0.28 | 0.47 | 0.2 | 3 |
Indicated | 24,548 | 0.64 | 15.39 | 0.21 | 0.49 | 507 | 12,145 |
Meas & Ind | 24,553 | 0.64 | 15.39 | 0.21 | 0.49 | 507 | 12,148 |
Inferred | 2,411 | 0.51 | 11.74 | 0.16 | 0.41 | 39 | 910 |
| | | | | | | |
Sulphide | Tonnes | Gold | Silver | Lead | Zinc | Gold | Silver |
0.3 g/t Au Cut-Off | (000's) | (g/t) | (g/t) | (%) | (%) | (000's oz) | (000's oz) |
Measured | 4 | 0.77 | 8.85 | 0.15 | 0.19 | 0.1 | 1 |
Indicated | 74,890 | 0.62 | 8.84 | 0.13 | 0.36 | 1,494 | 21,290 |
Meas & Ind | 74,894 | 0.62 | 8.84 | 0.13 | 0.36 | 1,494 | 21,291 |
Inferred | 26,211 | 0.56 | 6.95 | 0.08 | 0.31 | 474 | 5,858 |
17-15
1.
Mineral resources which are not mineral reserves do not have demonstrated economic viability. The estimate of mineral resources may be materially affected by environmental, permitting, legal, title, socio-political, marketing, or other relevant issues. There is no guarantee that Canplats Resources Corporation will be successful in obtaining any or all of the requisite consents, permits or approvals, regulatory or otherwise for the project or that the project will be placed into production.
2.
The quantity and grade of reported Inferred resources in this estimation are uncertain in nature and there has been insufficient exploration to define these Inferred resources as an Indicated or Measured mineral resource and further exploration drilling is required to determine whether they can be upgraded to an Indicated or Measured mineral resource category.
3.
The mineral resources in this study were estimated using the Canadian Institute of Mining, Metallurgy and Petroleum (‘CIM’), CIM Standards on Mineral Resources and Reserves, Definitions and Guidelines prepared by the Standing Committee on Reserve Definitions and adopted by the CIM Council on December 11, 2005.
Table 17-10 provides a summary of the mineral resource estimates sensitivity to cut-off gold grade.
17-16
Table 17-10: Cut-Off Gold Grade Sensitivity for Represa Resource Estimate
| | | | | |
Oxide Resources | | | | |
Measured and Indicated | | | | |
Cut-Off | Tonnes | Gold | Silver | Lead | Zinc |
Au (g/t) | (000's) | (g/t) | (g/t) | (%) | (%) |
0.4 | 47,743 | 0.84 | 14.18 | 0.28 | 0.36 |
0.3 | 56,212 | 0.76 | 13.76 | 0.27 | 0.35 |
0.2 | 63,943 | 0.70 | 13.26 | 0.26 | 0.34 |
0.1 | 67,025 | 0.68 | 13.04 | 0.25 | 0.34 |
Inferred | | | | | |
Cut-Off | Tonnes | Gold | Silver | Lead | Zinc |
Au (g/t) | (000's) | (g/t) | (g/t) | (%) | (%) |
0.4 | 1,445 | 0.71 | 12.02 | 0.21 | 0.29 |
0.3 | 1,982 | 0.61 | 11.34 | 0.20 | 0.28 |
0.2 | 2,407 | 0.55 | 10.89 | 0.19 | 0.27 |
0.1 | 2,643 | 0.51 | 10.65 | 0.19 | 0.27 |
| | | | | |
Transitional Resources | | | | |
Measured and Indicated | | | | |
Cut-Off | Tonnes | Gold | Silver | Lead | Zinc |
Au (g/t) | (000's) | (g/t) | (g/t) | (%) | (%) |
0.4 | 16,902 | 0.79 | 17.37 | 0.24 | 0.54 |
0.3 | 21,048 | 0.71 | 16.23 | 0.22 | 0.52 |
0.2 | 24,553 | 0.64 | 15.39 | 0.21 | 0.49 |
0.1 | 25,425 | 0.63 | 15.18 | 0.21 | 0.49 |
Inferred | | | | | |
Cut-Off | Tonnes | Gold | Silver | Lead | Zinc |
Au (g/t) | (000's) | (g/t) | (g/t) | (%) | (%) |
0.4 | 1,466 | 0.63 | 12.61 | 0.17 | 0.42 |
0.3 | 1,999 | 0.56 | 12.15 | 0.16 | 0.42 |
0.2 | 2,411 | 0.51 | 11.74 | 0.16 | 0.41 |
0.1 | 2,492 | 0.50 | 11.70 | 0.16 | 0.40 |
| | | | | |
Sulphide Resources | | | | |
Measured and Indicated | | | | |
Cut-Off | Tonnes | Gold | Silver | Lead | Zinc |
Au (g/t) | (000's) | (g/t) | (g/t) | (%) | (%) |
0.5 | 38,729 | 0.83 | 10.64 | 0.16 | 0.41 |
0.4 | 54,315 | 0.72 | 9.80 | 0.14 | 0.39 |
0.3 | 74,894 | 0.62 | 8.84 | 0.13 | 0.36 |
0.2 | 100,884 | 0.52 | 7.88 | 0.11 | 0.33 |
Inferred | | | | | |
Cut-Off | Tonnes | Gold | Silver | Lead | Zinc |
Au (g/t) | (000's) | (g/t) | (g/t) | (%) | (%) |
0.5 | 11,963 | 0.77 | 7.83 | 0.10 | 0.33 |
0.4 | 17,937 | 0.66 | 7.53 | 0.09 | 0.32 |
0.3 | 26,211 | 0.56 | 6.95 | 0.08 | 0.30 |
0.2 | 35,760 | 0.48 | 6.42 | 0.08 | 0.29 |
17-17
17.15
Resource Validation
The east-west (X), north-south (Y) and elevation (Z) trends of the interpolated grades in the block model and their classification were plotted graphically for gold, silver, lead and zinc, including: sample grades versus block grades and tonnage, number of samples versus tonnage, and classification versus tonnage. The graphs slice the deposit into 10-metre intervals for each of the three directions, and plot the block grades, number of samples, sample grades and tonnages for each interval. Thus, the three-dimensional trends of the mineralization can be graphically represented from which any interpolation or classification irregularities or anomalies can be readily detected.
The validation graphs for each of the four elements did not show any interpolation or classification irregularities. Figures 17-5 through 17-7 show an example of the elevation (Z) graphs for gold.
Figure 17-5: Gold Block Grade, Gold Sample Grade and Tonnage
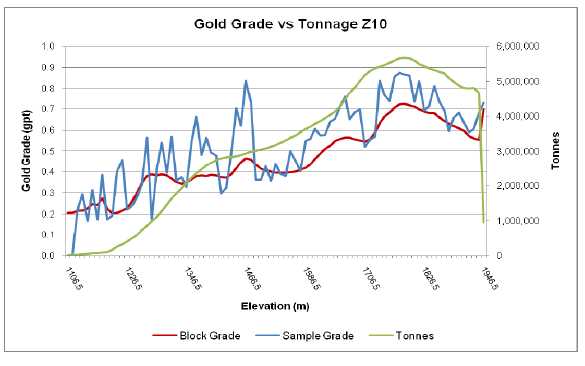
17-18
Figure 17-6: Number of Gold Composite Samples Versus Tonnage

Figure 17-7: Tonnage Versus Classification
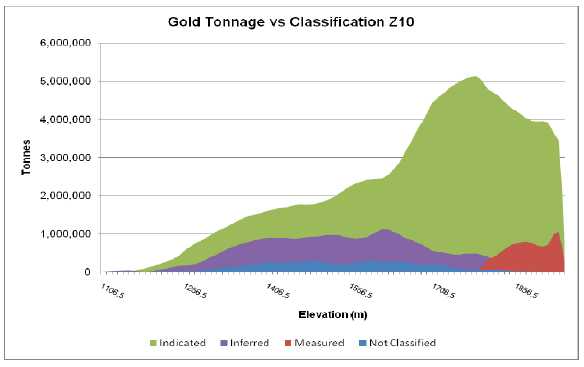
17-19
17.16
Dilution and Mining Recovery
MQes reblocked Minorex’s resource model to 10m x 10m x 5m blocks in order to approximate the degree of selectivity obtainable with the anticipated mining equipment. A tabulation of the oxide and transition resources after reblocking is presented in Table 17-11.
Table 17-11: Reblocked Resource (10mx10mx5m SMU) at 0.2g/t Gold Cutoff
| | | | | | |
Material Type | Resource Class | Tonnage | Average | Average | Average | Average |
Above | Gold | Silver | Lead | Zinc |
Cutoff | Grade | Grade | Grade | Grade |
(kt) | (g/t) | (g/t) | (%) | (%) |
Oxide | Measured | 10,790 | 0.76 | 13.37 | 0.29 | 0.34 |
Oxide | Indicated | 54,718 | 0.68 | 13.05 | 0.24 | 0.34 |
Oxide | Total | 65,508 | 0.69 | 13.11 | 0.25 | 0.34 |
|
Transition | Measured | 3 | 1.23 | 23.33 | 0.34 | 0.53 |
Transition | Indicated | 25,374 | 0.63 | 15.17 | 0.21 | 0.49 |
Transition | Total | 25,377 | 0.63 | 15.17 | 0.21 | 0.49 |
|
Total | Total | 90,885 | 0.67 | 13.68 | 0.24 | 0.38 |
17.17
Open Pit Optimization
Pit optimization was performed using thePitOptimizationPackage (POP!) software, which is developed and maintained by the Mine Planning Group of Stateline, Nevada. POP! generates a series of pit shells at declining economic cutoff values which it then subjects to a discounted cash flow analysis using phased/un-phased scheduling scenarios. The pit shells are then ranked by economic performance, using either Net Present Value (NPV) or Internal Rate of Return (IRR), with the best performing pit shell indicating the ultimate pit limit.
Contract mining was assumed for this technical assessment and a unit mining cost was estimated from owner/operator costs developed for similar projects in Latin America with an allowance added for contractor profit and capital recovery. The resulting contractor mining cost was estimated to be $1.87/t moved. This cost was included in the pit optimization as a combination of fixed and incremental components. Due to the longer ex-pit haulage profile for plant feed, US$0.10/t was added to the fixed ore mining cost. The economic criteria used for pit optimization and mine planning are presented in Table 17-12.
17-20
Table 17-12: Pit Optimization Economic Parameters
| | | | |
Metal Recoveries (Heap Leaching) |
| Material Type | Gold | Silver | |
| Oxide | 75.0% | 23.0% | |
| Transition | 75.0% | 23.0% | |
| Sulfide | 0.0% | 0.0% | |
| | | | |
Revenue Criteria |
| Gold Sales Price | = US$25.7210/g (US$800.00/troy ounce) |
| Gold Shipping and Refining Charge | = US$ 0.1608/g (US$5.00/troy ounce) |
| Silver Sales Price | = US$ 0.4340/g (US$13.50/troy ounce) |
| Silver Shipping and Refining Charge | = US$ 0.0161/g (US$ 0.50/troy ounce) |
| Discount Rate for Financial Analysis | = 5 percent |
| Royalty | = None (100% Ownership Assumed) |
| | | | |
Operating Costs |
| Fixed Mining Cost (Ore) | = US$1.6100/t moved |
| Fixed Mining Cost (Waste) | = US$1.5100/t moved |
| Incremental Haulage (above 1940m elev) | = US$0.0045/t•bench moved |
| Incremental Haulage (below 1940m elev) | = US$0.0080/t•bench moved |
| Stockpile Rehandle | = US$0.8900/t moved |
| Processing (Heap Leaching) | = US$2.94/t processed |
| G&A | = US$0.45/t processed |
Only material classified as Measured or Indicated was allowed to generate a positive economic return during pit optimization and production scheduling.
During discounted cash flow analysis, a series of production schedules were prepared using an annual processing rate of 7.2Mt per year. This was reduced to 6.93Mt during the first year of operation in order to allow for startup inefficiencies.
The pit optimization results are presented in Figure 17-8.
17-21
Figure 17-8: Project Economic Performance NPV5: US$800/oz Au

The results presented in Figure 17-8 show the combination of 95 different external monetary cutoff values (pit shells) ranging from $19.00/t to -$10.00/t with 51 different internal monetary cutoff values ranging from $10.00/t to $0.00/t. Material having a value per tonne below the internal monetary cutoff value and above the stockpile rehandle cost of US$0.89/t was designated as being stockpile material and scheduled at the end of the mine’s life. Table 17-13 presents the top ten NPV5 results. For comparison purposes, the break-even results are presented at the bottom of the table (shaded).
Table 17-13: Top Ten NPV5 Results
| | | | | | | | | | | | |
| | Camino Rojo Project; Minorex January 2009 Resource Model; Measured & Indicated Resources; Low Grade Stockpile | |
| 7.2 Mt/y Heap Leach Ore Production; Mine and Mill Capital Excluded; 5% Discount Rate |
Shell
Number | Internal
Cutoff
(US$/t) | Mine
Life
(Yrs) | Heap Leach Ore | Strip
Ratio | Best Case | Worst Case |
Ore
Tonnes
(Mt) | Avg.
Au
Grade
(g/t) | Avg.
Ag
Grade
(g/t) | Avg.
Pb
Grade
(%) | Avg.
Zn
Grade
(%) |
|
NPV
(US$M) | IRR
(%) | NPV
(US$M) | IRR
(%) |
|
| 58 | $5.40 | 11 | 74.9 | 0.71 | 14.2 | 0.256 | 0.373 | 0.70 | $492.5 | n/a | $469.0 | n/a |
| 56 | $5.40 | 11 | 74.6 | 0.71 | 14.2 | 0.256 | 0.373 | 0.70 | $492.2 | n/a | $468.9 | n/a |
| 58 | $5.80 | 11 | 74.9 | 0.71 | 14.2 | 0.256 | 0.373 | 0.70 | $492.0 | n/a | $469.3 | n/a |
| 56 | $6.00 | 11 | 74.6 | 0.71 | 14.2 | 0.256 | 0.373 | 0.70 | $491.6 | n/a | $469.6 | n/a |
| 56 | $6.20 | 11 | 74.6 | 0.71 | 14.2 | 0.256 | 0.373 | 0.70 | $491.4 | n/a | $469.8 | n/a |
| 56 | $5.20 | 11 | 74.6 | 0.71 | 14.2 | 0.256 | 0.373 | 0.70 | $492.4 | n/a | $468.7 | n/a |
| 56 | $5.60 | 11 | 74.6 | 0.71 | 14.2 | 0.256 | 0.373 | 0.70 | $492.0 | n/a | $468.9 | n/a |
| 56 | $5.80 | 11 | 74.6 | 0.71 | 14.2 | 0.256 | 0.373 | 0.70 | $491.7 | n/a | $469.3 | n/a |
| 54 | $6.00 | 11 | 74.4 | 0.71 | 14.2 | 0.257 | 0.373 | 0.70 | $491.3 | n/a | $469.5 | n/a |
| 54 | $6.20 | 11 | 74.4 | 0.71 | 14.2 | 0.257 | 0.373 | 0.70 | $491.2 | n/a | $469.6 | n/a |
| 77 | $0.00 | 12 | 79.5 | 0.69 | 14.0 | 0.251 | 0.371 | 0.75 | $493.6 | n/a | $448.6 | n/a |
| | The results presented in this table reflect the relative performance of each case and MAY NOT reflect the actual project economics. | |
17-22
The best performing NPV5 pit shell and internal cutoff value combination, shell number 58 at a US$5.40/t internal cutoff value, was selected as the Base Case Ultimate Pit Limit, and is shown in Figure 17-9.
Figure 17-9: Base Case Ultimate Pit Limit, Pit Shell 58

17.18
Reserve Estimate
The technical assessment identified a Base Case ultimate pit containing 74.9Mt of mineralized material grading 0.71g/t Au and 14.2g/t Ag at a stripping ratio of 0.70 tonnes of waste per tonne of material processed. Due to a variety of deficiencies such as geotechnical studies, hydrological studies, metallurgical testwork and land status, this mine plan does not currently meet the criteria for a Mineral Reserve under NI 43-101 reporting requirements.
The northern edge of the open pit identified in this technical assessment extends onto land for which Canplats does not currently hold a mining concession. To clarify, the mineral resources identified in this technical assessment are located entirely within the mineral concessions held by Canplats. While it is possible that the northern portion of the open pit may contain economically viable extensions of the Represa Zone, the existence of such extensions is currently unknown. As such, this technical assessment assumed only waste will be mined from this area; however, without such waste mining a portion of the mineral resources identified in this technical assessment may be inaccessible by open pit.
17-23
SECTION 18
OTHER RELEVANT DATA and INFORMATION
18.0
OTHER RELEVANT DATA and INFORMATION
The authors are not currently aware of any other additional or relevant information on this Property that would adversely affect its exploration and possible development.
18-1
SECTION 19
ADDITIONAL REQUIREMENTS for TECHNICAL REPORTS on DEVELOPMENT PROPERTIES and PRODUCTION PROPERTIES
19.0
ADDITIONAL REQUIREMENTS for TECHNICAL REPORTS on DEVELOPMENT PROPERTIES and PRODUCTION PROPERTIES
19.1
Geotechnical
No geotechnical studies have been undertaken for the project to date. As such, MQes assumed an inter-ramp slope angle of 45 degrees for this technical assessment.
19.2
Proposed Mining Operations
The Camino Rojo Project will be developed using conventional truck-shovel open pit mining technology. Contractor mining has been assumed and it was anticipated that the primary production equipment in the contractor’s mining fleet would consist of 14.3 cubic metre hydraulic excavators operating in backhoe configuration paired with 91 tonne capacity haul trucks. The open pit will operate 24 hours per day, 365 days per year with a five day allowance for bad weather and major holidays. Ore will be drilled and blasted on 5m high benches, while waste will be drilled and blasted on 10m high benches. Blasting will be performed using bulk ANFO (ammonium nitrate fuel oil) at powder factors in the range of 0.20 to 0.40kg/t. The waste storage area will be located east of and adjacent to the open pit. A separate area will be devoted to topsoil storage near the waste storage area, with this material used during surface reclamation activities. Lower grade stockpile(s) will be located in the vicinity of the primary crusher.
19.2.1
Mining Method and Equipment
Conventional open pit truck-shovel mining technology will be employed by a mining contractor to develop the resource. The contractor’s primary production equipment was anticipated to consist of 14.3 cubic metre hydraulic excavators operating in backhoe configuration paired with 91 tonne capacity haul trucks.
19.2.2
Open Pit Design
No detailed pit designs were prepared for this technical assessment. A phased pit design was prepared and scheduled for the ultimate pit limit and annual mining progress maps were prepared, all at a conceptual level. More detailed open pit design work is required once geotechnical, hydrological, and other relevant information becomes available.
19.2.3
Waste Storage Area
A single waste storage area will be located adjacent to and east of the open pit. Environmental studies to assess the waste rock’s potential for Acid Rock Drainage (ARD) and as a source of environmental contamination have not been undertaken. As such, it has been assumed that all waste rock would be benign in nature.
19-1
Reclamation of the exposed slope faces will be an on-going process, with stockpiled topsoil being spread over the face of each lift, followed by planting with native grasses and plants.
19.2.4
Grade Control
A 5m bench height will be used in areas identified by the resource model as potentially being ore. Areas identified by the resource model and confirmed through in-pit surface mapping as being waste will be drilled and blasted on a 10m bench height. As a cost saving measure, blasthole sampling and assaying will not be performed on waste holes.
Mining dilution is not perceived to be a significant issue. Metal grades typically diminish gradually as distance increases from higher grade areas of the deposit. The transition from oxide to sulphide material is also gradational in nature. Prior to startup, a suitable blasthole sampling technique and grade control protocol will need to be established.
19.2.5
Production Schedules and Blending
A phased mine plan was prepared for the ultimate pit limit which deferred waste stripping and mined higher grade material ahead of lower grade as much as practicable. Secondary goals of the mine plan included: a) providing continual access to all mining faces, b) maintaining a minimum mining width on all active benches, c) minimizing the sinking rate, d) maintaining uniform equipment requirements and e) minimizing haulage distances. Three mining phases were designed and subsequently scheduled to maximize the NPV5. The resulting production schedule is shown in Table 19-1.
19-2
Table 19-1: Annual Mine Production Schedule
| | | | | | | | | | | | | | | | | | | | | | | | | | |
| Camino Rojo Project: Heap Leach with ccw Ramp; US$800/oz Au & US$13.50/oz Ag; NPV5 Optimization |
| Minorex Jan 2009 Resource Model; Measured & Indicated Resources; Contractor Mining; Low Grade Stockpile |
| Year | Material
Type | Mining Schedule | Ore Delivered Directly to the Primary Crusher | Ore Delivered to the Stockpile | Ore Reclaimed from the Stockpile |
Ore
Tonnes
(kt) | Waste
Tonnes
(kt) | Unit
Mining
Cost
(US$/t ore) | Unit
Rehandle
Cost
(US$/t ore) | Ore
Tonnes
(kt) | Average Grades | Recov
Au
(koz) | Recov.
Ag
(koz) | Ore
Tonnes
(kt) | Average Grades | Recov
Au
(koz) | Recov.
Ag
(koz) | Ore
Tonnes
(kt) | Average Grades | Recov
Au
(koz) | Recov.
Ag
(koz) |
Au
(g/t) | Ag
(g/t) | Pb
(%) | Zn
(%) | Au
(g/t) | Ag
(g/t) | Pb
(%) | Zn
(%) | Au
(g/t) | Ag
(g/t) | Pb
(%) | Zn
(%) |
|
| 0 | Oxide | 0 | 0 | n/a | n/a | 0 | 0.000 | 0.00 | 0.000 | 0.000 | 0.0 | 0.0 | 0 | 0.000 | 0.00 | 0.000 | 0.000 | 0.0 | 0.0 | n/a | n/a | n/a | n/a | n/a | n/a | n/a |
| 0 | Transition | 0 | 0 | n/a | n/a | 0 | 0.000 | 0.00 | 0.000 | 0.000 | 0.0 | 0.0 | 0 | 0.000 | 0.00 | 0.000 | 0.000 | 0.0 | 0.0 | n/a | n/a | n/a | n/a | n/a | n/a | n/a |
| 0 | Sulfide | 0 | 0 | n/a | n/a | 0 | 0.000 | 0.00 | 0.000 | 0.000 | 0.0 | 0.0 | 0 | 0.000 | 0.00 | 0.000 | 0.000 | 0.0 | 0.0 | n/a | n/a | n/a | n/a | n/a | n/a | n/a |
| 0 | TOTAL | 0 | 0 | n/a | n/a | 0 | 0.000 | 0.00 | 0.000 | 0.000 | 0.0 | 0.0 | 0 | 0.000 | 0.00 | 0.000 | 0.000 | 0.0 | 0.0 | n/a | n/a | n/a | n/a | n/a | n/a | n/a |
| 1 | Oxide | 9,155 | 3,468 | n/a | n/a | 6,930 | 0.781 | 10.49 | 0.303 | 0.284 | 130.5 | 537.6 | 2,225 | 0.310 | 8.90 | 0.217 | 0.264 | 16.7 | 146.5 | n/a | n/a | n/a | n/a | n/a | n/a | n/a |
| 1 | Transition | 0 | 0 | n/a | n/a | 0 | 0.000 | 0.00 | 0.000 | 0.000 | 0.0 | 0.0 | 0 | 0.000 | 0.00 | 0.000 | 0.000 | 0.0 | 0.0 | n/a | n/a | n/a | n/a | n/a | n/a | n/a |
| 1 | Sulfide | 0 | 0 | n/a | n/a | 0 | 0.000 | 0.00 | 0.000 | 0.000 | 0.0 | 0.0 | 0 | 0.000 | 0.00 | 0.000 | 0.000 | 0.0 | 0.0 | n/a | n/a | n/a | n/a | n/a | n/a | n/a |
| 1 | TOTAL | 9,155 | 3,468 | $2.4543 | n/a | 6,930 | 0.781 | 10.49 | 0.303 | 0.284 | 130.5 | 537.6 | 2,225 | 0.310 | 8.90 | 0.217 | 0.264 | 16.7 | 146.5 | n/a | n/a | n/a | n/a | n/a | n/a | n/a |
| 2 | Oxide | 9,138 | 3,081 | n/a | n/a | 7,200 | 0.908 | 11.57 | 0.314 | 0.311 | 157.7 | 615.9 | 1,938 | 0.301 | 8.80 | 0.210 | 0.281 | 14.0 | 126.1 | n/a | n/a | n/a | n/a | n/a | n/a | n/a |
| 2 | Transition | 0 | 0 | n/a | n/a | 0 | 0.000 | 0.00 | 0.000 | 0.000 | 0.0 | 0.0 | 0 | 0.000 | 0.00 | 0.000 | 0.000 | 0.0 | 0.0 | n/a | n/a | n/a | n/a | n/a | n/a | n/a |
| 2 | Sulfide | 0 | 0 | n/a | n/a | 0 | 0.000 | 0.00 | 0.000 | 0.000 | 0.0 | 0.0 | 0 | 0.000 | 0.00 | 0.000 | 0.000 | 0.0 | 0.0 | n/a | n/a | n/a | n/a | n/a | n/a | n/a |
| 2 | TOTAL | 9,138 | 3,081 | $2.4405 | n/a | 7,200 | 0.908 | 11.57 | 0.314 | 0.311 | 157.7 | 615.9 | 1,938 | 0.301 | 8.80 | 0.210 | 0.281 | 14.0 | 126.1 | n/a | n/a | n/a | n/a | n/a | n/a | n/a |
| 3 | Oxide | 9,120 | 2,678 | n/a | n/a | 7,194 | 0.738 | 13.44 | 0.290 | 0.338 | 128.1 | 715.2 | 1,925 | 0.307 | 10.72 | 0.199 | 0.283 | 14.3 | 152.6 | n/a | n/a | n/a | n/a | n/a | n/a | n/a |
| 3 | Transition | 6 | 12 | n/a | n/a | 6 | 0.870 | 5.79 | 0.118 | 0.130 | 0.1 | 0.2 | 0 | 0.000 | 0.00 | 0.000 | 0.000 | 0.0 | 0.0 | n/a | n/a | n/a | n/a | n/a | n/a | n/a |
| 3 | Sulfide | 0 | 67 | n/a | n/a | 0 | 0.000 | 0.00 | 0.000 | 0.000 | 0.0 | 0.0 | 0 | 0.000 | 0.00 | 0.000 | 0.000 | 0.0 | 0.0 | n/a | n/a | n/a | n/a | n/a | n/a | n/a |
| 3 | TOTAL | 9,125 | 2,758 | $2.4321 | n/a | 7,200 | 0.739 | 13.44 | 0.290 | 0.338 | 128.2 | 715.4 | 1,925 | 0.307 | 10.72 | 0.199 | 0.283 | 14.3 | 152.6 | n/a | n/a | n/a | n/a | n/a | n/a | n/a |
| 4 | Oxide | 7,997 | 13,806 | n/a | n/a | 6,822 | 0.879 | 15.04 | 0.299 | 0.361 | 144.6 | 758.6 | 1,174 | 0.265 | 8.68 | 0.157 | 0.243 | 7.5 | 75.4 | n/a | n/a | n/a | n/a | n/a | n/a | n/a |
| 4 | Transition | 383 | 15 | n/a | n/a | 378 | 0.905 | 22.66 | 0.388 | 0.462 | 8.2 | 63.3 | 5 | 0.312 | 5.08 | 0.064 | 0.133 | 0.0 | 0.2 | n/a | n/a | n/a | n/a | n/a | n/a | n/a |
| 4 | Sulfide | 0 | 179 | n/a | n/a | 0 | 0.000 | 0.00 | 0.000 | 0.000 | 0.0 | 0.0 | 0 | 0.000 | 0.00 | 0.000 | 0.000 | 0.0 | 0.0 | n/a | n/a | n/a | n/a | n/a | n/a | n/a |
| 4 | TOTAL | 8,380 | 14,001 | $4.7972 | n/a | 7,200 | 0.880 | 15.44 | 0.303 | 0.366 | 152.9 | 822.0 | 1,180 | 0.266 | 8.66 | 0.157 | 0.242 | 7.6 | 75.6 | n/a | n/a | n/a | n/a | n/a | n/a | n/a |
| 5 | Oxide | 8,420 | 17,330 | n/a | n/a | 6,563 | 0.661 | 12.78 | 0.269 | 0.352 | 104.6 | 620.2 | 1,858 | 0.239 | 7.81 | 0.152 | 0.244 | 10.7 | 107.3 | n/a | n/a | n/a | n/a | n/a | n/a | n/a |
| 5 | Transition | 674 | 244 | n/a | n/a | 637 | 0.938 | 22.30 | 0.353 | 0.604 | 14.4 | 105.1 | 37 | 0.229 | 9.45 | 0.155 | 0.289 | 0.2 | 2.6 | n/a | n/a | n/a | n/a | n/a | n/a | n/a |
| 5 | Sulfide | 0 | 616 | n/a | n/a | 0 | 0.000 | 0.00 | 0.000 | 0.000 | 0.0 | 0.0 | 0 | 0.000 | 0.00 | 0.000 | 0.000 | 0.0 | 0.0 | n/a | n/a | n/a | n/a | n/a | n/a | n/a |
| 5 | TOTAL | 9,094 | 18,190 | $5.4576 | n/a | 7,200 | 0.686 | 13.62 | 0.277 | 0.375 | 119.0 | 725.3 | 1,894 | 0.239 | 7.84 | 0.152 | 0.245 | 10.9 | 109.9 | n/a | n/a | n/a | n/a | n/a | n/a | n/a |
| 6 | Oxide | 7,014 | 3,587 | n/a | n/a | 6,423 | 0.666 | 15.05 | 0.236 | 0.361 | 103.1 | 715.0 | 591 | 0.232 | 9.19 | 0.128 | 0.240 | 3.3 | 40.1 | n/a | n/a | n/a | n/a | n/a | n/a | n/a |
| 6 | Transition | 986 | 1,001 | n/a | n/a | 777 | 0.733 | 19.35 | 0.259 | 0.561 | 13.7 | 111.2 | 209 | 0.220 | 10.41 | 0.121 | 0.269 | 1.1 | 16.1 | n/a | n/a | n/a | n/a | n/a | n/a | n/a |
| 6 | Sulfide | 0 | 1,827 | n/a | n/a | 0 | 0.000 | 0.00 | 0.000 | 0.000 | 0.0 | 0.0 | 0 | 0.000 | 0.00 | 0.000 | 0.000 | 0.0 | 0.0 | n/a | n/a | n/a | n/a | n/a | n/a | n/a |
| 6 | TOTAL | 8,000 | 6,415 | $3.4427 | n/a | 7,200 | 0.673 | 15.52 | 0.239 | 0.383 | 116.9 | 826.2 | 800 | 0.229 | 9.51 | 0.126 | 0.248 | 4.4 | 56.2 | n/a | n/a | n/a | n/a | n/a | n/a | n/a |
| 7 | Oxide | 4,543 | 464 | n/a | n/a | 4,297 | 0.714 | 15.33 | 0.220 | 0.372 | 74.0 | 487.1 | 247 | 0.242 | 8.60 | 0.089 | 0.222 | 1.4 | 15.7 | n/a | n/a | n/a | n/a | n/a | n/a | n/a |
| 7 | Transition | 3,136 | 419 | n/a | n/a | 2,903 | 0.728 | 18.38 | 0.254 | 0.475 | 51.0 | 394.7 | 233 | 0.226 | 11.57 | 0.100 | 0.290 | 1.3 | 19.9 | n/a | n/a | n/a | n/a | n/a | n/a | n/a |
| 7 | Sulfide | 0 | 2,094 | n/a | n/a | 0 | 0.000 | 0.00 | 0.000 | 0.000 | 0.0 | 0.0 | 0 | 0.000 | 0.00 | 0.000 | 0.000 | 0.0 | 0.0 | n/a | n/a | n/a | n/a | n/a | n/a | n/a |
| 7 | TOTAL | 7,680 | 2,977 | $2.7446 | n/a | 7,200 | 0.720 | 16.56 | 0.234 | 0.413 | 124.9 | 881.7 | 480 | 0.234 | 10.04 | 0.094 | 0.255 | 2.7 | 35.6 | n/a | n/a | n/a | n/a | n/a | n/a | n/a |
| 8 | Oxide | 3,260 | 69 | n/a | n/a | 3,260 | 0.882 | 19.17 | 0.199 | 0.455 | 69.3 | 462.1 | 0 | 0.000 | 0.00 | 0.000 | 0.000 | 0.0 | 0.0 | n/a | n/a | n/a | n/a | n/a | n/a | n/a |
| 8 | Transition | 3,940 | 81 | n/a | n/a | 3,940 | 0.828 | 19.84 | 0.259 | 0.565 | 78.7 | 578.0 | 0 | 0.000 | 0.00 | 0.000 | 0.000 | 0.0 | 0.0 | n/a | n/a | n/a | n/a | n/a | n/a | n/a |
| 8 | Sulfide | 0 | 1,196 | n/a | n/a | 0 | 0.000 | 0.00 | 0.000 | 0.000 | 0.0 | 0.0 | 0 | 0.000 | 0.00 | 0.000 | 0.000 | 0.0 | 0.0 | n/a | n/a | n/a | n/a | n/a | n/a | n/a |
| 8 | TOTAL | 7,200 | 1,346 | $2.4287 | n/a | 7,200 | 0.853 | 19.53 | 0.232 | 0.515 | 148.0 | 1,040.1 | 0 | 0.000 | 0.00 | 0.000 | 0.000 | 0.0 | 0.0 | n/a | n/a | n/a | n/a | n/a | n/a | n/a |
| 9 | Oxide | 3,121 | 96 | n/a | $0.89 | 3,121 | 0.787 | 19.83 | 0.213 | 0.439 | 59.3 | 457.6 | 0 | 0.000 | 0.00 | 0.000 | 0.000 | 0.0 | 0.0 | 94 | 0.337 | 8.23 | 0.189 | 0.244 | 0.8 | 5.7 |
| 9 | Transition | 3,985 | 78 | n/a | $0.89 | 3,985 | 0.730 | 18.57 | 0.228 | 0.600 | 70.2 | 547.4 | 0 | 0.000 | 0.00 | 0.000 | 0.000 | 0.0 | 0.0 | n/a | n/a | n/a | n/a | n/a | n/a | n/a |
| 9 | Sulfide | 0 | 388 | n/a | $0.89 | 0 | 0.000 | 0.00 | 0.000 | 0.000 | 0.0 | 0.0 | 0 | 0.000 | 0.00 | 0.000 | 0.000 | 0.0 | 0.0 | n/a | n/a | n/a | n/a | n/a | n/a | n/a |
| 9 | TOTAL | 7,106 | 562 | $2.3027 | $0.89 | 7,106 | 0.755 | 19.13 | 0.222 | 0.529 | 129.4 | 1,005.1 | 0 | 0.000 | 0.00 | 0.000 | 0.000 | 0.0 | 0.0 | 94 | 0.337 | 8.23 | 0.189 | 0.244 | 0.8 | 5.7 |
| 10 | Oxide | 0 | 0 | n/a | $0.89 | 0 | 0.000 | 0.00 | 0.000 | 0.000 | 0.0 | 0.0 | 0 | 0.000 | 0.00 | 0.000 | 0.000 | 0.0 | 0.0 | 7,162 | 0.300 | 9.37 | 0.202 | 0.271 | 51.8 | 496.4 |
| 10 | Transition | 38 | 0 | n/a | $0.89 | 38 | 0.383 | 11.11 | 0.176 | 0.506 | 0.3 | 3.1 | 0 | 0.000 | 0.00 | 0.000 | 0.000 | 0.0 | 0.0 | n/a | n/a | n/a | n/a | n/a | n/a | n/a |
| 10 | Sulfide | 0 | 0 | n/a | $0.89 | 0 | 0.000 | 0.00 | 0.000 | 0.000 | 0.0 | 0.0 | 0 | 0.000 | 0.00 | 0.000 | 0.000 | 0.0 | 0.0 | n/a | n/a | n/a | n/a | n/a | n/a | n/a |
| 10 | TOTAL | 38 | 0 | $2.2396 | $0.89 | 38 | 0.383 | 11.11 | 0.176 | 0.506 | 0.3 | 3.1 | 0 | 0.000 | 0.00 | 0.000 | 0.000 | 0.0 | 0.0 | 7,162 | 0.300 | 9.37 | 0.202 | 0.271 | 51.8 | 496.4 |
| 11 | Oxide | 0 | 0 | n/a | $0.89 | 0 | 0.000 | 0.00 | 0.000 | 0.000 | 0.0 | 0.0 | 0 | 0.000 | 0.00 | 0.000 | 0.000 | 0.0 | 0.0 | 2,702 | 0.236 | 8.09 | 0.139 | 0.240 | 15.4 | 161.5 |
| 11 | Transition | 0 | 0 | n/a | $0.89 | 0 | 0.000 | 0.00 | 0.000 | 0.000 | 0.0 | 0.0 | 0 | 0.000 | 0.00 | 0.000 | 0.000 | 0.0 | 0.0 | 484 | 0.225 | 10.84 | 0.113 | 0.279 | 2.6 | 38.8 |
| 11 | Sulfide | 0 | 0 | n/a | $0.89 | 0 | 0.000 | 0.00 | 0.000 | 0.000 | 0.0 | 0.0 | 0 | 0.000 | 0.00 | 0.000 | 0.000 | 0.0 | 0.0 | 0 | 0.000 | 0.00 | 0.000 | 0.000 | 0.0 | 0.0 |
| 11 | TOTAL | 0 | 0 | n/a | $0.89 | 0 | 0.000 | 0.00 | 0.000 | 0.000 | 0.0 | 0.0 | 0 | 0.000 | 0.00 | 0.000 | 0.000 | 0.0 | 0.0 | 3,186 | 0.234 | 8.50 | 0.135 | 0.246 | 18.0 | 200.3 |
| TOTAL | Oxide | 61,768 | 44,580 | n/a | $0.89 | 51,810 | 0.777 | 14.01 | 0.271 | 0.351 | 971.2 | 5,369.4 | 9,958 | 0.283 | 9.01 | 0.185 | 0.262 | 67.9 | 663.7 | n/a | n/a | n/a | n/a | n/a | n/a | n/a |
| TOTAL | Transition | 13,148 | 1,851 | n/a | $0.89 | 12,664 | 0.775 | 19.25 | 0.256 | 0.554 | 236.7 | 1,803.0 | 484 | 0.225 | 10.84 | 0.113 | 0.279 | 2.6 | 38.8 | n/a | n/a | n/a | n/a | n/a | n/a | n/a |
| TOTAL | Sulfide | 0 | 6,367 | n/a | $0.89 | 0 | 0.000 | 0.00 | 0.000 | 0.000 | 0.0 | 0.0 | 0 | 0.000 | 0.00 | 0.000 | 0.000 | 0.0 | 0.0 | n/a | n/a | n/a | n/a | n/a | n/a | n/a |
| TOTAL | TOTAL | 74,916 | 52,798 | $3.1949 | $0.89 | 64,474 | 0.777 | 15.04 | 0.268 | 0.391 | 1,207.9 | 7,172.3 | 10,442 | 0.280 | 9.10 | 0.181 | 0.263 | 70.6 | 702.4 | 10,442 | 0.280 | 9.10 | 0.181 | 0.263 | 70.6 | 702.4 |
19-3
19.3
Hydrology and Hydrogeology
No hydrological studies have been undertaken for the project to date.
19.3.1
Open Pit Dewatering
Open pit dewatering requirements result from direct precipitation over the pit area and ground water intrusion into the pit. Surface runoff adjacent to the open pit will be routed away from the pit. As no hydrological studies have been completed to date, MQes assumed that the pit dewatering requirements would be minimal for this technical assessment.
19.3.2
Water Supply
The technical assessment study assumed sufficient water was available at site for the project. The source and quantity of this water needs to be determined.
19.4
Dam Designs and Management
A storm water pond has been included in the technical assessment. The capacity of this pond needs confirming along with meteorological data.
19.5
Infrastructure and Services
19.5.1
Sterilization Drilling
No sterilization drilling has been performed to date.
19.5.2
Power Supply
Line power has been assumed in the technical assessment. Power available from this source and connection criteria need determining.
19.5.3
Buildings
Ancillary buildings necessary to operate the project have been included in the technical assessment.
19.5.4
Roads
On-site roads have been considered in the technical assessment.
19-4
19.6
Project Development Schedule
A preliminary project development schedule for the Camino Rojo has been prepared. The schedule considers advancing the project from its current level to a pre-feasibility followed by bankable feasibility and then into detailed engineering design, construction and startup. Major areas addressed in the schedule include:
·
Land Ownership.
·
Environmental impact study.
·
Permitting.
·
Confirmation of Resources.
·
Mine Planning.
·
Confirmation of Reserves.
·
Metallurgical Testwork.
·
Process Selection.
·
Engineering Design.
·
Infrastructure development.
·
Capital cost estimating.
·
Operating cost estimating.
·
General and administration cost estimating.
·
Project implementation.
·
Economic analyses.
·
Construction of surface facilities and mine development.
Assuming there are no major impediments (land ownership, environmental impact study, permitting, etc.) to project development and with no attempt to fast track the project schedule it is estimated that approximately 4 years is required to bring the Camino Rojo project into production.
19.7
Project Economics
19.7.1
Capital Cost Estimate
The initial capital cost of the project to treat 20,000tpd is estimated at US$133,770,000 (±35% accuracy) and is summarized in Table 19-2. Costs are expressed in first quarter, 2009 US$.
19-5
Table 19-2: Estimated Initial Capital Cost - Summary
| | |
Accounts | $US(000’s) |
0 | Civil/Earthworks/Site | 17,889 |
1 | Concrete | 6,439 |
2 | Structural Steel | 3,196 |
3 | Architectural and Buildings | 2,525 |
4 | Mechanical | 25,853 |
5 | Piping | 5,445 |
6 | Electrical | 7,228 |
7 | Instrumentation | 2,198 |
8 | Painting, Coatings and Insulation | 18 |
| Sub-Total Direct Field Costs Costs | 70,791 |
| | |
| Freight, Ocean | 2,977 |
| Freight, Inland | 2,053 |
| Import Duties | 4,060 |
| Spare Parts | 1,059 |
| Vendor Representatives | 415 |
| Total Direct Field Costs Costs | 10,564 |
| | |
Indirect Field Costs | |
| Indirect Field Costs | 18,498 |
| Initial Consumable and Reagents | 2,124 |
| Total Indirect Field Costs Costs | 20,622 |
| | |
| Total Field Costs | 101,977 |
| | |
| Contingency | 30,593 |
| | |
| Other Costs | |
| Mine Prestripping | 1,200 |
| | |
Total Project Costs | 133,770 |
The capital costs considers mining will be performed by a contract miner. As such, initial and sustaining mine fleet capital requirements will be the responsibility of the contractor.
Preproduction development activities will also be performed by the mining contractor. Although no waste movement is scheduled during the preproduction period, a minor amount of waste stripping will likely occur along with some ore mining in advance of process facility commissioning. An allowance of $1.2 million is included for this.
The capital cost estimate for the process plant and ancillary facilities is based on the following project data:
19-6
·
Process design criteria.
·
Process flowsheets.
·
Major equipment list.
·
Budgetary quotations for major process equipment.
·
General arrangement drawings.
·
Architectural drawings.
·
Parametric civil model.
·
In-house database.
All owners’ costs such as the following have been excluded:
·
Pre-operations expense.
·
Land acquisition.
·
Environmental impact report and permitting.
·
Owner's project management.
·
Hiring and relocation.
·
Legal.
·
Public relations.
·
Communications systems.
·
Geotechnical investigations.
·
Testwork.
·
Sunk costs prior to and including this study.
·
Power supply to the battery limits.
·
Water supply to the battery limits.
·
Off-site facilities.
19.7.2
Operating Cost Estimate
19.7.2.1
Mining
This Study assumes all mine production activities will be performed by a mining contractor. This unit cost for this is estimated at US$1.87/t mined.
The unit cost for contractor mining was estimated based on owner/operator costs from a similar sized Latin American gold mining project. This cost was subsequently marked up to include contractor profit and capital recovery, which resulted in a net cost of US$1.87/t mined. Details are provided below:
| |
Owner/operator Mining Cost (20ktpd plant feed) | = US$1.2470/t mined |
Contractor Profit (15%) | = US$0.1871/t mined |
Mine Fleet Capital Cost Allowance | = US$0.4400/t mined |
Estimated Contractor Mining Cost | = US$1.8741/t mined |
19-7
Oversight of the mining contractor and mine planning will be the responsibility of Canplats. The cost for a Chief Mining Engineer has been included in the G&A costs for this purpose.
19.7.2.2
Processing
Conceptual operating costs broken down into operating labor, maintenance labor, power, process consumables and maintenance spares are summarized in Table 19-3.
Table 19-3: Conceptual Process Operating Cost Summary
| | |
Category | Annual Cost US$ | Cost US$/t Processed |
Operating Labor | 836,700 | 0.11 |
Maintenance Labor | 378,200 | 0.05 |
Power | 2,345,563 | 0.32 |
Reagents and Consumables | 19,458,055 | 2.67 |
Spares | 1,100,000 | 0.15 |
Re-handling | 3,650,000 | 0.50 |
TOTAL | 27,768,518 | 3.80 |
19.7.2.3
General and Administration Costs
General and administration cost is estimated at US$0.42/t processed. Buildup of this cost is summarized in Table 19-4.
Table 19-4: General and Administration Costs
| | |
Category | Annual Cost | Unit Cost |
US$ | US$/t processed |
Staff Labor | 947,669 | 0.14 |
Electric Power | 174,850 | 0.02 |
Maintenance | 250,000 | 0.03 |
General Expenses | 1,585,000 | 0.22 |
Total | 3,058,219 | 0.42 |
19.7.3
Economic Analysis
Estimated capital and operating costs, preliminary metallurgical parameters and projected third party refining and transportation charges were incorporated into a proforma, 100% equity, pre-tax cash flow model to evaluate project economics. A treatment rate of 20,000tpd was considered. Other key criteria included in the cashflow include:
·
The total initial pre-production capital cost (leach pad, process plant and ancillary facilities) is estimated to be US$133.77 million.
19-8
·
Ongoing costs for leach pad expansion are $10.2 million every two years through to year 8.
·
The average life of project operating cost (mining, process, material transportation from crushing to heap and G&A) is US$6.62/t processed.
·
The metallurgical recovery for gold ranges from 52.4% to 78.2% over the life of the project. The metallurgical recovery for silver ranges from 13.3% to 38.6%.
·
The price of gold is assumed to be US$750 per ounce and the price of silver is assumed to be US$13.50 per ounce. These are based on the three year trailing averages for these metals.
·
The cost for refining and shipping is assumed to be US$5.50 per ounce of gold equivalent.
The proforma cash flow indicates that the project generates an IRR of 32.5% with an NPV at a 5% discount rate of US$195 million. The base case cash operating cost is estimated to be approximately $340/oz gold (includes credit for silver). The sensitivity of NPV at 5% to variations in capital cost, operating cost and metal price is shown in Figure 19-1. The effect of metal prices on the undiscounted cashflow, NPV at 5% and IRR is also shown in Table 19-5.
Figure 19-1: NPV@5% - Sensitivity Analysis

19-9
Table 19-5: Effect of Metal Prices on Project Economics
| | | | | |
Alternative | Metal Price (US$/oz) | NPV (US$ M)(ii) | IRR(ii) |
Au | Ag | 0% | 5% | % |
Base Case | 750 | 13.50 | 313.4 | 194.9 | 32.5 |
Alternative 1 | 850 | 15.30 | 457.5 | 296.8 | 44.7 |
Alternative 2 | 950 | 17.10 | 601.6 | 398.7 | 56.5 |
Spot Price(i) | 1036 | 17.19 | 711.9 | 477.2 | 65.7 |
(iii)
=Source: www.Kitco.com on 6 October, 2009.
(iv)
=Amounts are on a Pre-Tax Basis.
It should be noted that the operational plan prepared by MQes as part of the cashflow is preliminary in nature. The plan is based on the current Camino Rojo resource estimates (Measured and Indicated) for Oxide and Transition material and is too speculative to be categorized as mineral reserves under NI 43-101 guidelines.
19.7.3.1
Affect of Treatment Rate on Project Economics
The project economics at three processing throughput rates (15,000tpd, 20,000tpd and 25,000tpd) were evaluated to assess the effects on IRR and NPV at 5%. For each case the metallurgical recovery for gold was assumed to be 75% and the metallurgical recovery for silver was fixed at 23%. The price of gold was assumed to be US$800 per ounce and the price of silver was assumed to be $13.50 per ounce. A cost of US$5.50 per ounce of gold equivalent was used for refining and shipping. The NPV’s at 5% and IRR’s for the best and worst cases at each throughput are shown in Table 19-6.
Table 19-6: Comparison of NPV at 5% and IRR Versus Processing Rates
| | | | |
Throughput (tpd) | Best Case | Worst Case |
NPV @ 5% | IRR | NPV @ 5% | IRR |
15,000 | $243.7 | 31.3 | $227.3 | 24.4 |
20,000 | $266.6 | 37.1 | $255.2 | 30.7 |
25,000 | $271.0 | 37.4 | $261.3 | 31.7 |
The results indicate that, for the criteria used, the maximum NPV at 5% and IRR are achieved at a throughput of 25,000tpd. Improvements in the NPV and IRR in going from 20,000tpd to 25,000tpd throughputs are minimal.
19.8
Risk and Opportunity Analysis
Following is a list of technical risks and opportunities identified to date associated with the Camino Rojo project. The list is not complete and will change as development of the project proceeds.
19.8.1
Data Collection
19-10
·
The drilling and trenching results utilized for the estimation of the Represa zone mineral resources were collected and compiled by Canplats personnel, and subsequently reviewed in detail by Vallat (2008) during the preparation of the QA/QC report. Finally, Minorex validated the assay database using Gemcom software.
·
This is not to say that the exploration database is 100% accurate but that there were no obvious or detectable data errors using conventional validation techniques.
19.8.2
Resources
·
Data pertaining to the spatial distribution of oxide-, transitional- or sulphide-dominant mineralization was provided to Minorex by Canplats based upon geological logging observations and lithogeochemical results from drilling samples. Occasionally geological observations were in conflict with geochemical results indicating differing degrees of oxidation. Correct identification of dominantly oxidized and transitional mineralization will be necessary for future resource estimations and pit designs.
·
The Represa zone was largely tested with northerly-directed, inclined drill holes on 50-metre drill sections. During the program some testing included westerly-directed, inclined drill holes. This drilling pattern resulted in several alternate 25-metre drill sections with only pierce point intercepts of westerly-directed drill holes. As a consequence, there are near-surface, inferred resources and uncategorized mineralized material within the Represa zone. Future in-fill drilling should be strategically sited to evaluate this mineralization while providing geotechnical and metallurgical information.
·
Mineral resources were classified using the criteria discussed in the report. These criteria were influenced by the unusually consistent gold distribution resulting in good semi-variogram and the use of ordinary kriging interpolation. Criteria utilized to classify future mineral resource estimates may differ from those used by Minorex.
19.8.3
Mining and Reserves
·
The slope angles assumed for this assessment are not supported by a geotechnical study. If subsequent study yields slope design criteria that is steeper, it is likely that the stripping ratio would be reduced thus allowing the pit to go deeper and possibly extract additional resource. If the geotechnical design criteria are less favourable, then the stripping ratio is likely to increase and some of the resource currently in the ultimate pit may become uneconomic.
·
Pit dewatering was not assumed to be a significant issue for this assessment. If hydrological studies indicate otherwise, a significant capital expenditure may be required to install dewatering wells and/or install a grout curtain. Significant dewatering requirements would also adversely affect the mine operating costs.
19-11
·
Certain environmental factors have been assumed to be non-problematic. These include water quality issues related to run off and ground water intrusion from the waste storage area, lower grade stockpile and open pit.
·
The contractor mining cost assumed in this assessment was an estimate. Actual costs could be significantly different which would affect the conversion of the resources to reserves.
·
This assessment has assumed an unbiased resource model. If there are any significant biases in the model it will affect actual deliveries to the processing facility.
·
The northern edge of the open pit identified in this technical assessment extends onto land for which Canplats does not currently hold a mining concession. At this time, the area involved solely contains waste that must be removed in order to expose mineral resources that lie within Canplats’ mining concessions. Without such waste mining, a portion of the mineral resource identified in this technical assessment may be inaccessible by open pit.
·
MQes understands that surface rights for the project area are in the process of being obtained by Canplats. Should surface rights be unobtainable for some or all of the project area, the project would be negatively impacted.
19.8.4
Geotechnics and Hydrology
·
Development of geotechnical and hydrological data is pending.
19.8.5
Metallurgy and Processing
·
Metallurgical criteria used in this technical assessment have been developed from preliminary testwork. Although some of the teswork results are encouraging, additional metallurgical testwork is required to confirm and better define project criteria. There currently exists the risk that the criteria used will not be confirmed by additional testwork. Reductions in criteria such as metallurgical recoveries will have a negative impact on the project economics.
·
Agglomeration of heap leach material has not been considered as part of this assessment. Preliminary evaluations using agglomeration were performed as part of the column leach tests. Further testwork is required to confirm agglomeration and to determine cement and lime requirements. If agglomeration is necessary, modifications to the process flowsheet will be necessary. This will result in additional capital and an increase in process operating costs.
·
A significant opportunity to improve the project economics exists if silver recovery can be improved.
·
Potential opportunities to improve the project economics may exist via CIP/CIL or ROM processing routes.
·
Reagent consumptions used in developing operating costs are based on metallurgical testwork performed to date supplemented by data from MQes’ database. Consumption rates and costs for these may change following additional testwork.
19-12
·
An opportunity exists to potentially reduce operating costs by considering crushed material conveying and on-pad stacking. Transporting of crushed material to the leach pads currently involves trucking. A trade-off study is required to evaluate these two alternatives.
19.8.6
Infrastructure and Services
·
Supply of services such as water, power etc. have not yet been established.
19.8.7
Environmental Impacts and Permitting
·
An environmental impact assessment or applications for permits to develop and operate the project has not yet commenced.
19.8.8
Project Implementation
·
Assuming there are no a major impediments (land ownership, environmental impact study, permitting, etc.) to project development it is estimated that approximately 4 years is required to bring the Camino Rojo project into production. There may be the opportunity to decrease this time by “Fast Tracking” the project.
19.8.9
Project Economics
·
Several assumptions have been made in generation of the capital cost estimate due to a lack of technical data. These assumptions are currently a source of risk to the accuracy of the developed capital cost estimate. The risks include potential cost impacts to civil (leach pad, ponds, site drainage, groundwater diversion), infrastructure (water supply, dewatering, power supply), logistics (proximity to village, highway and tertiary road as well as claim boundary), plant/equipment (agglomeration, crush size, pond sizes for maximum storm events). An opportunity to reduce the capital cost exists if additional metallurgical testwork supports a coarser product crush size.
·
The base case for economic evaluation of the project in the technical assessment used a gold price of US750/oz and a silver price of US$13.50/oz. The economics of the project will be negatively affected by decreases in prices for these metals. Conversely the economics will improve for the project at higher metal prices.
19-13
SECTION 20
INTERPRETATIONS AND CONCLUSIONS
20.0
INTERPRETATIONS AND CONCLUSIONS
The Camino Rojo property hosts a large, intrusive-related deposit of gold-silver-lead zinc mineralization. Since its discovery in July 2007 Canplats Mexico has carried out: prospecting, reconnaissance and detailed geological mapping, rock geochemical sampling, test pitting, trenching, ground magnetics and induced polarization surveying, and reverse circulation and diamond drilling. Most of this exploration work has been focused on evaluating the Represa zone of mineralization but there are also several other similar exploration targets on the property with good potential.
The gold-silver-lead-zinc mineralization of the Represa zone occurs dominantly as fracture fillings and replacements hosted by an upper, interbedded sequence of hydrothermally altered, calcareous siltstone and calcareous, volcanically-derived sandstone belonging to the Upper Cretaceous Caracol Formation, and a lower, older, interbedded sequence of hydrothermally altered, silty and/or sandy limestone of possibly late Jurassic age. Quartz porphyry–metasedimentary clast intrusive breccias and buried granodioritic dykes cut the local stratigraphy indicating the hydrothermal alteration and precious metal-bearing mineralization may be spatially and genetically associated with a buried calc-alkaline intrusion.
Precious metal-bearing sulphide mineralization, including pyrite and lesser sphalerite, galena, polybasite with trace amounts of chalcopyrite and chalcocite, and their near-surface oxidized equivalents are structurally controlled by moderately to steeply dipping fractures, probably related to northwesterly and northeasterly trending faulting and fracturing. It is inferred that the metal-bearing hydrothermal fluids ascended along dilational fractures, infilling the voids, and flowing laterally along permeable bedding units, especially along the decalcified and porous volcaniclastic sandy beds.
Between late October 2007 to early August 2008 Canplats completed a total of 39,727.07 m of drilling including 92 reverse circulation drill holes, 26 HQ-size diamond drill holes, and 4 large-bore diamond drill holes for metallurgical sample collection. Most of this work has focused on evaluating the Represa zone mineralization laterally for 1,000 m east-west, 460 m north-south and vertically to a depth of 820 m. The mineralized zone remains open for expansion eastward, westward and to depth.
The mineral resources for the Represa zone have been estimated using assay data from eighty-six RC and twenty-five diamond drill holes, plus seven surface excavator trenches. In all, a total of 19,193 drill hole samples were composited into 17,336 2-metre composites that were statistically analysed and capped prior to ordinary kriging interpolation of the block models. Subsequent classification of the interpolated mineral resources into measured, indicated and inferred categories was based largely on true distance from a block to the nearest capped grade composite. Only blocks inside the three-dimensional mineral domain were classified; all other blocks were not interpolated or classified. The combined, undiluted, global resources for the oxide, transitional and sulphide types of mineralization are shown in Table 20-1.
20-1
Table 20-1:Undiluted Global Resource-Oxide, Transition & Sulphide Mineralization
| | | | | | | |
Classification | Tonnes | Metal (g/t) | Lead | Zinc | Metal (000’s oz) |
Million | Au | Ag | (%) | (%) | Au | Ag |
Measured | 9.58 | 0.76 | 13.4 | 0.29 | 0.34 | 235 | 4,126 |
Indicated | 153.81 | 0.65 | 11.44 | 0.18 | 0.37 | 3,210 | 56,582 |
Measured & Indicated | 163.39 | 0.66 | 11.56 | 0.19 | 0.37 | 3,445 | 60.708 |
Inferred | 31.03 | 0.56 | 7.63 | 0.10 | 0.31 | 555 | 7,612 |
The above resources are comprised of oxide and transitional resources at a cut-off grade of 0.2 gpt gold, and sulphide-rich resources at a 0.3 gpt gold cut-off grade.
Further delineation and in-fill drilling will be required to fully evaluate the Represa zone mineralization. Future work should be directed at defining the inferred and unclassified mineralization where there has been widely-spaced drilling, and exploration drilling should investigate the undefined limits of the known mineralization.
The technical assessment has identified a Base Case ultimate pit containing 74.9Mt of mineralized material grading 0.71g/t Au and 14.2g/t Ag at a stripping ratio of 0.70 tonnes of waste per tonne of material processed. Due to a variety of deficiencies such as geotechnical studies, hydrological studies, metallurgical testwork and land status, this mine plan does not currently meet the criteria for a Mineral Reserve under NI 43-101 reporting requirements.
The northern edge of the open pit identified in this technical assessment extends onto land for which Canplats does not currently hold a mining concession. At this time, the area involved solely contains waste that must be removed in order to expose mineral resources that lie within Canplats’ mining concessions. Without the ability to mine waste from this area, a portion of the mineral resource in the Represa Zone may be inaccessible by open pit.
Surface rights over the project area are not currently held by Cansplats, and need to be obtained. It is MQes’ understanding that Canplats is negotiating for the acquisition of such rights.
The Don Julio zone will require further diamond drilling to fully test this high priority exploration target.
According to Blanchflower (2008), a compilation of the district geology, structural features, mapped hydrothermal alteration zones and inferred intrusive centres shows that the northern portion of the Camino Rojo property covers at least seven geological and/or geophysical targets with good exploration potential. Three clusters of mapped hydrothermal alteration occur on or adjacent to mapped northwesterly trending regional faults, similar in structural setting to the Represa zone. Four exploration targets are situated on inferred intrusive centres, based upon aeromagnetic data and/or geological and geophysical data (SGM, 2007). All of the inferred intrusive centres are situated within the property and along major regional northwesterly trending structures, a likely location for ascending metal-bearing hydrothermal fluids. Thus, each of these inferred intrusive centres is a high priority target with good exploration potential for discovering Represa-style precious metal-bearing mineralization.
20-2
The 2007 and 2008 exploration work on the Represa zone has identified a potentially economic gold-silver deposit with the continuity of a large, intrusive-related mineralizing system. Further work will require metallurgical studies to investigate the metal recoveries by various processes and additional definition drilling prior to a pre-feasibility study. It is the opinion of Minorex that continued exploration is justified.
Conclusions from the technical assessment performed by MQes are as follows:
·
Metallurgical testwork results show higher than expected differences between calculated and assayed head samples. This casts doubt on the accuracy of some reported metal recoveries. Consequently, gold and silver recovery values should be treated with caution until additional testwork is performed to substantiate them. It is recommended that in ongoing testwork such differences are resolved by either re-assaying samples or repeating tests.
·
The nominal crush size used in this technical assessment is 0.75 inches. This can be achieved with a three stage crushing circuit. A finer crush size would likely require an additional crushing stage and add to the capital for the project. There is insufficient testwork data at this stage to support a final crush size. The 0.75 inch crush size has been chosen as a suitable interim size for this assessment.
·
Column leach tests indicate that in general gold recovery is higher for oxide material than transition material; as expected. Silver recoveries are consistently higher in transition samples than in oxide samples. This is not as expected, however, it is noted that the head grades for silver in transition material tested is slightly higher than in oxide material and may partly explain this discrepancy.
·
Maximum gold and silver recovery for oxide material is achieved between 40 and 50 days. For the purposes of this technical assessment a leach cycle of 45 days has been chosen.
·
Bottle roll tests indicate gold and silver dissolution is essentially complete after 48 hours. Neither gold nor silver recoveries show clear distinction between oxide, transition and sulphide samples. It is expected that oxide samples would show consistently higher recoveries followed by transition and then sulphide samples. Issues that can cloud this effect are head grade and crush/grind size.
·
Given the preliminary nature of the flotation tests do date, some encouraging results have been obtained and additional flotation testwork is warranted.
·
Metallurgical testwork performed on the Camino Rojo project to date is encouraging, however, very preliminary. In order to advance the project to pre-feasibility and to feasibility levels additional metallurgical testwork is required. This testwork should be to focus on the recovery of gold and silver from the oxide and transition zones in order to better define metallurgical responses as well as develop criteria for ongoing engineering assessment. The recovery of silver in testwork to date has been very modest. Additional recovery of silver at current prices has considerable upside potential for the project.
20-3
·
Assuming there are no major impediments (land ownership, environmental impact study, permitting, etc.) to project development and with no attempt to fast track the project schedule it is estimated that approximately 4 years is required to bring the Camino Rojo project into production.
·
The initial capital cost for the project is estimated at $133,770,000 to an accuracy of ±35%.
·
The estimated operating costs for the project are $3.80/t material treated for processing, $0.42/t material treated for general and administration and $1.87/t material moved for mining. These costs are based on preliminary data from metallurgical testwork and MQes in-house data for labor costs. Budgetary quotations have been obtained for reagent and consumable costs.
·
A proforma, 100% equity pre-tax cash flow model indicates that at a treatment rate of 20,000tpd, the Camino Rojo project generates an IRR of 32.5% with an NPV at a 5% discount rate of US$195 million (assumes the prices of gold and silver are US$750 per ounce and US$13.50 per ounce respectively). The base case cash operating cost is estimated to be approximately $340/oz gold (includes credit for silver). The project is most sensitive to metal price/production followed by operating cost and capital cost.
·
Economic evaluations of treatment rates at 15,000tpd, 20,000tpd and 25,000tpd indicate the 25,000tpd alternative produces the highest NPV at 5% and IRR. Improvements in NPV and IRR in going from 20,000tpd to 25,000tpd are minimal.
20-4
SECTION 21
RECOMMENDATIONS
21.0
RECOMMENDATIONS
The exploration potential of the Camino Rojo property is excellent, and further work is warranted. Results of the technical assessment indicate the Camino Rojo project is very robust. It is recommended the project is advanced to a pre-feasibility level of development.
Future exploration work should involve continued drilling of the Represa zone to better define the estimated resources, and to provide bore hole information for preliminary geotechnical, hydrological, environmental and site design studies required prior to a pre-feasibility study. In addition, there are several coincident geological, geochemical and/or geophysical exploration targets on the property that should be investigated during the advanced exploration work on the Represa zone. The following recommendations have been subdivided accordingly:
1)
Represa Zone
·
Carry out strategically-sited, in-fill diamond drilling to better define the mineral resources and provide bore holes for hydrological studies and/or samples for advanced metallurgical, geotechnical, and acid base accounting studies. The sites of such drilling will be determined by the technical personnel and project consultants involved with the various studies at the time;
·
Conduct reverse circulation and diamond drilling around the periphery of the known mineralization to delineate the limits of mineralization for pit slope design and geotechnical studies. This drilling should be continued to depths determined by preliminary pit design work;
·
Commence preliminary condemnation drilling of possible sites for waste dumps, leach pads and processing facilities. Bore holes should provide samples for sterilization determinations and sites for hydrological and environmental testing; and
·
All bore hole sampling should be subject to strict quality assurance – quality control protocols.
2)
Property-wide Exploration
·
Prospect, geologically map and sample the exploration target areas within the property;
·
Conduct reconnaissance induced polarization surveys over high priority exploration targets; and
·
Excavate trenches across any coincident geological, geochemical and/or geophysical targets, and map and sample the exposed bedrock.
Recommendations from the technical assessment performed by MQes are as follows:
·
Canplats establish a QA/QC program for ongoing metallurgical teswork.
21-1
·
The effect of gold and silver recoveries on crush size is further evaluated.
·
Mineralogical evaluations are initiated to identify the gold and silver mineralogy.
·
For the purposes of the technical assessment, a leach cycle of 45 days was chosen. It is recommended that additional testwork is performed to confirm this.
·
Canplats check sample classifications (oxide, transition and sulphide) against their criteria.
·
Additional flotation testwork should be focused on sulphide material.
·
Ongoing metallurgical testwork should target improving silver recovery.
·
It is recommended that selection of metallurgical samples for ongoing metallurgical testwork is coordinated with Canplats’ geological staff to ensure representative samples of the different zones and rock types are correctly chosen. The testwork goal should be to develop a geo-metallurgical model of the deposit which can be used to reasonably predict metallurgical responses. As mine planning is developed it is recommended that metallurgical testwork samples are chosen representative of the mine plan and with an emphasis on the early period of production. These samples should be tested to confirm the metallurgical response is consistent with that predicted from the geo-metallurgical model.
·
Agglomeration should be evaluated in ongoing metallurgical testwork.
·
Work should be commenced/progressed in the areas of land ownership, permits, geotechnical investigation, metallurgical testwork, ARD testwork, infrastructure and environmental in order to advance the project to a pre-feasibility study.
·
Evaluation of a CIP/CIL processing route should be performed. A ROM leaching alternative should also be considered.
·
Mine planning has assumed several basic design criteria. It is recommended geotechnical and hydrological studies are performed to more definitively determine such criteria. Geotechnical studies should develop detailed slope design recommendations and hydrological studies should address pit dewatering requirements and costs from ground water intrusion and precipitation.
·
It is recommended ultimate pit designs are re-evaluated using project specific geotechnical design criteria.
·
It is recommended that environmental impact studies are performed that address the potential for ARD from the waste storage area, lake water chemistry (assuming the pit will flood when abandoned) and mine closure reclamation requirements and costs.
·
Estimated contract mining costs have been developed. It is recommended quotations from a recognized contract mining company are obtained.
·
It is recommended owner operated mining is evaluated to determine the effects on the project economics as well as to assist in evaluating contract miner quotations.
·
Counter-clockwise ramp design has been assumed in this assessment. It is recommended a clockwise ramp design is also evaluated for the ultimate pit.
·
Better definition on the design and location of the waste storage and low grade stockpiles is required. It is recommended this is performed.
·
The current mine plan considered only in-pit road layouts. It is recommended that future evaluations consider both in-pit and ex-pit road layouts. Future mine plan evaluations should also investigate splitting mining phase three into two parts.
21-2
·
It is recommended the drill density in the toe areas of the ultimate pit is evaluated.
·
Mining concession(s) for the area covering the northern edge of the open pit need to be acquired or an arrangement made to allow waste mining on the adjacent concession.
·
Surface rights need to be acquired over the entire project area.
·
Meteorological, geotechnical and hydrological data for the site should be obtained.
·
Water availability (quantity and quality), power supply criteria/battery limits, local community infrastructure requirements, condemnation drilling, detailed topographical data should be obtained/investigated.
·
Reagent and consumable consumption rates should be updated upon completion of additional testwork. Staffing levels should be confirmed, accurate operating labor costs for the area obtained and general expenses better defined.
21.1
Proposed Exploration Budget
The estimated expenses of the recommended 2009 exploration and development program are as shown in Table 21-1.
Table 21-1: Proposed Exploration Development Program – Estimated Expenses
| |
Description | Estimated |
Cost (US$) |
Repressa Zone | |
Fill-in, delineation and technical drilling within Represa zone | |
Diamond drilling – ‘all-in’ drilling, assays and support (10,000 m @ $200/m) | 2,000,000 |
RC drilling – ‘all-in’ drilling, assays and support (5,000 m @ $130/m) | 650,000 |
Condemnation and technical drilling outside Represa zone | |
Diamond drilling – ‘all-in’ drilling, assays and support (5,000 m @ $200/m) | 1,000,000 |
RC drilling – ‘all-in’ drilling, assays and support (3,000 m @ $130/m) | 390,000 |
| |
Property-wide Exploration | |
Evaluation of exploration targets including: Reconnaissance prospecting and rock geochemical sampling Geological mapping and rock geochemical sampling Geophysical surveying – ground magnetics Excavator trenching with follow-up sampling of surface exploration targets | 310,000 |
| |
Total Estimated Cost of Recommended Drilling and Exploration Work | 4,350,000 |
21.2
Proposed Work Program to Advance Project to Prefeasibility Level
Table 21-2 presents a general list of requirements necessary to advance the Camino Rojo project to a pre-feasibility level study. The intent of the table is to indicate where ongoing work needs to be focused in the immediate future. The list is not definitive as several sub-activities are required under some of the topics.
21-3
Table 21-2: Requirements for Pre-Feasibility Study – Eng. & Design Perspective
|
Area/Item |
General |
Plant Product and Capacity-Selected |
Geographical Location-Firm |
Topographical Maps-Detailed |
Land Ownership/Permits |
Statutory Requirements-Major/Intermediate Issues Identified |
Mining Claims/Tenements-Negotiated Minor Parcels/Held |
Land Usage Permits-Major/Intermediate Issues Identified |
Operational Permit-Major/Intermediate Issues Identified |
Surface Rights acquisition for project area |
Acquisition of mineral concessions relevant to the open pit |
Geology |
Property Location & Description-Verified |
Geological Setting-Verified |
Deposit Type-Verified |
Mineralization-Verified |
Exploration-Verified |
Drilling-Verified |
Sampling Method & Approach-Verified |
Sample Preparation, Analyses & Security-Verified |
Data Verification-Verified |
Mineral Resource Estimation-Preliminary Block Model |
Resource Estimates/Classification-Indicated |
Mining |
Geotechnical Investigations/Reports-Preliminary |
Hydrological Investigations/Reports - Preliminary |
Process |
Metallurgical Testwork-Preliminary |
Geometallurgical Models-Preliminary |
Infrastructure |
ARD Testwork-Preliminary |
Geotechnical Investigations/Reports-Preliminary |
Water Supply-Preliminary |
Power-Preliminary |
Environmental |
Statutory Requirements-Outlined & Listed |
Environmental Impact Assessment-Major/Intermediate Issues Identified |
Environmental Monitoring Plan-Draft |
Environmental Risks-Detailed |
Environmental Policy-Outlined |
Emergency Preparedness-Outlined |
Environmental Communications Plan-Issued |
Closure Plan-Verified |
EHS Program-Compliant |
Environmental Permits-Major/Intermediate Issues Identified |
Capital Cost Estimates |
Owners Costs-Preliminary |
Fuel Unit Costs-Budgetary |
Power Unit Costs-Budgetary |
Water Unit Costs-Budgetary |
21-4
An estimate of costs to advance the engineering of the Camino Rojo project to a Pre-feasibility Level of development is presented in Table 21-3.
Table 21-3: Estimated Budget to Advance Project to a Pre-Feasibility Level
| |
Item | Estimated |
Cost US$ |
Processing trade-off studies | 275,000 |
Geotechnical studies | 75,000 |
Hydrological studies | 75,000 |
ARD testwork | 35,000 |
Metallurgical testwork (considers current testwork program) | 250,000 |
Environmental Impact Study | 350,000 |
Trade-off Studies (power, mining, accommodation) | 150,000 |
Site visit for pre-feasibility study | 20,000 |
Acquisition of mining data (MARC, fleet purchase) | 10,000 |
Pre-feasibility Study | 750,000 |
Total Estimated Cost | 1,990,000 |
The expenses for the entire recommended drilling, exploration and pre-feasibility programs are estimated at US$6.34 Million.
The above recommended programs and budgets will initiate the studies required for a pre-feasibility study but may not be sufficient to complete all the studies necessary to prepare such a report.
21-5
SECTION 22
REFERENCES
22.0
REFERENCES
Alldrick, D. J.(1996): Intrusion-related Au Pyrrhotite Veins, in Selected British Columbia Mineral Deposit Profiles, Volume 2 Metallic Deposits, Lefebure, D.V. and Hõy, T, Editors,British Columbia Ministry of Employment and Investment, Open File 1996-13, pages 57-58.
Bending, David A., 2002: Geological Report and Summary of Exploration Data for the MacMillian Gold Corp. on the Cerro de Oro Project in the State of Zacatecas, Mexico. Private company report, MacMillian Gold Corp., Toronto, Canada.
Blanchflower, J. D., 2008: Technical Report on the Camino Rojo Property, Zacatecas, Mexico. Technical report posted by the company on SEDAR, June 18, 2008, 58 p plus appendices.
Blanchflower, J. D., 2009: Technical Report on the Mineral Resources of the Camino Rojo Property, Zacatecas, Mexico. Technical report posted by the company on SEDAR, January 15, 2009, 70 p plus appendices.
Busek, Peter R., 1966: Contact Metasomatism and Gold Deposition: Concepciòn del Oro, Mexico.Economic Geology, Vol. 61, pp. 97-136.
Canplats Resources Corporation, 2008: Various drilling data, maps, sections and reports; private company data prepared by Canplats Resources Corporation personnel.
Canplats Mexico, 2008: Drilling data, maps, sections and reports; private company data prepared by Canplats de Mexico, S.A. de C.V. field personnel.
Goldcorp, 2008/2009: Peñasquito mine,http://www.goldcorp.com/operations/penasquito/project_summary.
Hawkes, H., 1997: Peñasquito Project Exploration Summary, December, 1997. Private company report, Minera Kennecott S.A. de C.V., Guadalajara, Jalisco, Mexico.
Imlay, R. W., 1938: Studies of the Mexican Geosyncline, Bull. Geol Soc. America, Vol. 49, No. 11, pp. 1651-1694.
Lambert, G., 2008: Report on Induced Polarization Surveys, Camino Rojo Project, Zacatecas State, Mexico; private geophysical report prepared for Canplats Resource Corporation and Canplats de Mexico S.A. de C.V., 15 p. plus plans and sections.
M3 Engineering & Technology Corp., 2005: Peñasquito feasibility study - Volume 1 NI 43-101 technical report. Technical Report prepared for Western Silver Corporation by M3 Engineering & Technology Corp., Tucson, dated November 2005.
MacMillian Gold, 2004: Macmillian Gold Hits ore Grade Gold and Silver Mineralization at the Cerro de Oro. Company Press Release, MacMillian Gold Corp., Toronto, Canada.
22-1
Martinez, Valentina Garza and Zevallos, Juan Manuel Pèrez, 2004: El Real y Minas De San Gregorio de Mazapil 1568-1700. Instituto Zacatecano de Cultura “Ramòn Lòpoz Velarde”, Lomas de Calvario s/n, Colonia Diaz Ordàz, Zacactecas, Mexico CP 98060.
Olguin, J. M. G., 2008: Title Opinion on the Camino Rojo Property, prepared on behalf of De Ovando Y Martinex Del Campo, S.C., Lawyers for Canplats Resources Corporation, 6 p.
Pargas Perez, Josè et al, 1992: Geologic-Mining Monograph of the State of Zacatecas, Publishing Number: M-2e, Consejo de Recursos Minerales, Centro Minero, Blvd. Felipe Angeles s/n, Carretera Mexico-Pachuca s/n K. 93.5, CP 42080, Pachuca, Hildalgo, Mexico.
Rogers, C. L., Cserna, Z., Tavera, E., Ulloa, S., 1956: General geology and phosphate deposits of Concepciòn del Oro District, Zacatecas, Mexico. Geological Survey Bulletin 1037-A, U. S. Geological Survey, Washington D.C.
Ponce, B. F. and K. F. Clark, 1988, The Zacatecas Mining District: A Tertiary Caldera Complex Associated with Precious and Base Metal Mineralisation: Economic Geology, v. 83, p. 1668-1682
Servicios Geologico de Mexico, 2006:http://www.coremisgm.gob.mx/productos/anuario/Capitulo_2.pdf
Servicios Geologico de Mexico, 2007: Carta Geologico-Minera Estados de Aguascalientes Y Zacatecas; compiled regional geology map available athttp://www.coremisgm.gob.mx/productos/cartas.html, 1:250,000 scale.
Sillitoe, R. H. and J. W. Hedenquist. 2003: Linkages between volcanotectonic settings, ore-fluid compositions, and epithermal precious-metal deposits.InVolcanic, Geothermal, and ore-forming fluids: Rulers and witnesses of processes within the Earth, Simmons, S.F. and I. Graham, eds.Society of Economic Geologist, Special Publication Number 10, p. 315 – 343.
Turner, T., 2008a: Personal communications regarding the exploration and geology of the Concepciòn del Oro district and the Camino Rojo property.
Turner, T., 2008b: Report on the Geology of the Concepciòn del Oro Mining District; private report prepared for Canplats Resources Corporation, 6 p.
Turner, T., 2008c: Geologic Summary of CRD-01, Camino Rojo Project, Zacatecas, Mexico; private report prepared for Canplats Resources Corporation, 4 p.
Report SGS-54-08 Progress Report 1August 17, 2009: Evaluation of the Amenability of Camino RojoDrill Hole Samples to Cyanide Leaching and Flotation Processes.
Report SGS-09-09 Progress Report 2 August 21, 2009: The Evaluation of 21 Camino RojoSamples to Leaching and Flotation Processes.
Mine and Quarry Engineering Services, September 2009: Technical Assessment Camino, Rojo Project Zacatecas, Mexico
22-2
SECTION 23
DATE and SIGNATURE PAGE
23.0
DATE and SIGNATURE PAGE
The undersigned prepared this Technical Report, titled Technical Report Preliminary Economic Assessment Camino Rojo Project, Zacatecas, Mexico, dated 16th October, 2009 in support of the public disclosure of technical aspects of the Camino Rojo project by Canplats Resources Corporation. The format and content of the report are intended to conform to Form 43-101F1 of National Instrument 43-101 (NI 43-101) of the Canadian Securities Administrators.
Signed,
Signed by Christopher Kaye (signed copy on file)
____________________________________
Christopher Kaye, MAusIMM, B. Eng (Chemical).
16th October, 2009
Signed by Howard Steidtmann (signed copy on file)
____________________________________
Howard Steidtmann, MAusIMM,B. Sc. Mining Engineering 16th October, 2009
Signed by J. Douglas Blanchflower (signed copy on file)
_______________________________________
J. Douglas Blanchflower, P. Geo.
16th October, 2009
Consulting Geologist
23-1
CERTIFICATE OF QUALIFIED PERSON
Christopher Kaye, MAusIMM
1730 S. Amphlett Blvd., Suite 200,
San Mateo, CA 94402
I, Christopher Edward Kaye am a Principal Process Engineer, with the firm of Mine and Quarry Engineering Services, Inc. (MQes) of 1730 S. Amphlett Blvd. Suite 200, San Mateo, CA 94402, USA. I carried out this assignment for MQes;
This certificate applies to the technical report entitled “Technical Report, Preliminary Economic Assessment, Camino Rojo Project, Zacatecas, Mexico” dated 16th October, 2009;
I am a member of Australasian Institute of Mining and Metallurgy in Australia. I graduated from the University of Queensland, Australia, with a B. Eng. in Chemical Engineering in 1984;
I have worked as a process engineer in the minerals industry for over 20 years. I have been directly involved in the mining, exploration and evaluation of mineral properties internationally for gold and base metals;
I have not personally visited the Camino Rojo project site;
I am responsible for the preparation of parts or all of Sections 1.4, 1.5, 1.6 to 1.9, 3.0,16.0, 18.0, 19.4 to 19.8, 20 and 21 of the “Technical Report, Preliminary Economic Assessment, Camino Rojo Project, Zacatecas, Mexico” dated 16th October, 2009;
I am independent of Canplats Resources Corporation as independence is described by Section 1.4 of NI 43-101. I have not received, nor do I expect to receive, any interest, directly or indirectly, in Canplats Resources Corporation;
MQes and Minorex were retained by Canplats Resources Corporation to prepare a Technical Report on the Technical Report, Preliminary Economic Assessment, Camino Rojo Project, Zacatecas, Mexico in accordance with National Instrument 43-101. The report is based on our review of project files and information provided by Canplats Resources Corporation and discussions with company personnel;
I have read National Instrument 43-101 and Form 43-101F1 and, by reason of education and past relevant work experience, I fulfill the requirements to be a “Qualified Person” for the purposes of NI 43-101. This technical report has been prepared in compliance with National Instrument 43-101 and Form 43-101F1;
As of the date of this certificate, to the best of my knowledge, information and belief, the technical report contains all scientific and technical information that is required to be disclosed to make the technical report not misleading.
Signed by Christopher Kaye (signed copy on file)
_______________________
Christopher Edward Kaye, MAusIMM
Dated: 16th October, 2009
23-2
CERTIFICATE OF QUALIFIED PERSON
Howard Steidtmann,
118 Drew Court
Stateline, NV 89449
I, Howard Steidtmann, am a consulting Mining Engineer and owner of the Mine Planning Group with offices at 118 Drew Court, Stateline, Nevada 89449, USA. I personally carried out this assignment for the firm of Mine and Quarry Engineering Services, Inc. (MQes) with offices at 1730 S. Amphlett Blvd. Suite 200, San Mateo, CA 94402, USA;
This certificate applies to the technical report entitled “Technical Report, Preliminary Economic Assessment, Camino Rojo Project, Zacatecas, Mexico” dated 16th October, 2009;
I am a member of the Australasian Institute of Mining and Metallurgy. I graduated from the Colorado School of Mines, Golden, Colorado 80401, USA with a B. Sc. degree in Mining Engineering in 1986;
I have worked as a mining engineer in the minerals industry for over 20 years. I have been directly involved in the mining, exploration and evaluation of mineral properties internationally for gold and base metals;
I have not personally visited the Camino Rojo project site;
I am responsible for the preparation of parts or all of Sections 1.3, 1.5, 1.9, 17.16 to 17.18, 18.0, 19.1, 19.2, 19.3, 19.8, 20.0 and 21.0 of the “Technical Report, Preliminary Economic Assessment, Camino Rojo Project, Zacatecas, Mexico” dated 16th October, 2009;
I am independent of Canplats Resources Corporation as independence is described by Section 1.4 of NI 43-101. I have not received, nor do I expect to receive, any interest, directly or indirectly, in Canplats Resources Corporation;
MQes and Minorex were retained by Canplats Resources Corporation to prepare a Technical Report on the Technical Report, Preliminary Economic Assessment, Camino Rojo Project, Zacatecas, Mexico in accordance with National Instrument 43-101. The report is based on our review of project files and information provided by Canplats Resources Corporation and discussions with company personnel;
I have read National Instrument 43-101 and Form 43-101F1 and, by reason of education and past relevant work experience, I fulfill the requirements to be a “Qualified Person” for the purposes of NI 43-101. This technical report has been prepared in compliance with National Instrument 43-101 and Form 43-101F1;
As of the date of this certificate, to the best of my knowledge, information and belief, the technical report contains all scientific and technical information that is required to be disclosed to make the technical report not misleading.
Signed by Howard Steidtmann (signed copy on file)
_______________________
Howard Steidtmann
Dated: 16th October, 2009
23-3
I, J. DOUGLAS BLANCHFLOWER, of Aldergrove, British Columbia, DO HEREBY CERTIFY THAT:
1)
I am a Consulting Geologist with a business office at 25856 – 28th Avenue, Aldergrove, British Columbia, V4W 2Z8; and President of Minorex Consulting Ltd.
2)
I am a graduate of Economic Geology with a Bachelor of Science, Honours Geology degree from the University of British Columbia in 1971. I have practised my profession as a Professional Geologist since graduation.
3)
I am a Registered Professional Geoscientist in good standing with the Association of Professional Engineers and Geoscientists of British Columbia (No. 19086), and a Registered Professional Geologist in good standing with the Association of Professional Engineers, Geologists and Geophysicists of Alberta (No. M69488).
4)
I am a ‘Qualified Person’ as defined in Section 1.2 of National Instrument 43-101.
5)
I was retained by Canplats Resources Corporation in February 2008 to examine the property, collect verification samples, and review all exploration results. I later prepared and submitted the ‘Technical Report on the Camino Rojo Property, Zacatecas, Mexico’ dated June 18, 2008.
6)
I was subsequently retained by Canplats Resources Corporation in September 2008 to estimate the mineral resources of the Represa zone incorporating the 2007 and 2008 drilling results. I later prepared and submitted the “Technical Report on the Mineral Resources of the Camino Rojo Property, Concepcion del Oro District, Zacatecas, Mexico”, dated January 5, 2009.
7)
I am responsible for sections 1.1, 1.2, 1.9, 2.0, 3.0, 4.0, 5.0, 6.0,7.0, 8.0, 9.0, 10.0, 11.0, 12.0, 13.0, 14.0, 15.0, 17.1 to 17.15, 19.8, 20.0 and 21.0 of this report titled “Technical Report, Preliminary Economic Assessment, Camino Rojo Project, Zacatecas, Mexico” dated 16th October, 2009;
8)
I am not aware of any material fact or material change with respect to the subject matter of this technical report which is not reflected in the technical report.
9)
I am an independent consultant with no promised or implied affiliation with Canplats Resources Corporation; subject to the criteria set out in Section 1.5 of National Instrument 43-101.
10)
I am familiar with intrusion-related porphyry-type deposit models, and have experience estimating mineral resources and writing technical reports.
11)
I have read National Instrument 43-101 and Form 43-101F, and this technical report has been prepared in compliance with this Instrument and Form 43-101F1.
Respectfully submitted by,
Signed by J. Douglas Blanchflower (signed copy on file)
------------------------------------------------------
J. Douglas Blanchflower, P. Geo.
Consulting Geologist
Dated: 16th October, 2009
23-4