UNITED STATES
SECURITIES AND EXCHANGE COMMISSION
Washington, D.C. 20549
FORM N-CSR
CERTIFIED SHAREHOLDER REPORT OF REGISTERED
MANAGEMENT INVESTMENT COMPANIES
Investment Company Act File Number 811-10467
Causeway Capital Management Trust
(Exact name of registrant as specified in charter)
11111 Santa Monica Boulevard, 15th Floor
Los Angeles, CA 90025
(Address of principal executive offices) (Zip code)
SEI Investments Global Funds Services
One Freedom Valley Drive
Oaks, PA 19456
(Name and address of agent for service)
Registrant’s telephone number, including area code: 1-866-947-7000
Date of fiscal year end: September 30, 2011
Date of reporting period: September 30, 2011
| Item 1. | Reports to Stockholders. |
TABLE OF CONTENTS
LETTER TO SHAREHOLDERS
For the fiscal year ended September 30, 2011, the Causeway Emerging Markets Fund’s (“Fund’s”) Institutional Class returned -13.33% and Investor Class returned -13.41%, compared to -15.89% for the MSCI Emerging Markets Index (“EM Index”). Since the Fund’s inception on March 30, 2007, its average annual total returns are 1.41% for the Institutional Class and 1.36% for the Investor Class, compared to 1.60% for the EM Index for the same period. At fiscal year-end, the Fund had net assets of $80.8 million.
Performance Review
In our investment process, we select securities using a combination of “bottom-up” and “top-down” quantitative factors. The bottom-up factors we measure include companies’ valuation multiples, earnings growth data, and stock price momentum. Our top-down process measures companies’ country, sector, and macroeconomic information. We combine a company’s scores in each category to rank it in our investable universe. The highest ranking stocks become investment candidates for the Fund. In the fiscal year, the Fund’s exposure to our bottom-up factors contributed positively to relative performance over the course of the year, meaning that the top ranked companies based on our bottom-up factors outperformed the lowest ranked companies. Two of the three factor groups were positive, with the strongest performance coming from our earnings growth factors followed by our technical factors. Only our value factors had negative relative performance. Our top-down factors, which have smaller weights in the model, detracted from relative performance. Our macroeconomic factors did the poorest, followed by our sector factors. Our country factors were the only top-down factors that delivered positive relative performance this fiscal year.
Fund holdings in the telecommunication services, materials, and food beverage & tobacco industry groups added to performance relative to the EM Index, while holdings in the food & staples retailing, banks, and automobiles & components industry groups detracted from relative performance during the period. At the stock level, some of the notable contributors to return this fiscal year were telecommunication services company, Advanced Info Service (Thailand), oil refining company China Petroleum & Chemical Corp. ADR (China), liquid crystal display manufacturer, Radiant Opto-Electronics Corp. (Taiwan), shipbuilding and heavy industrial manufacturing company, Hyundai Heavy Industries Co., Ltd. (South Korea), and tobacco manufacturing company, KT&G Corp. (South Korea). The notable underperformers compared to the EM Index included steel manufacturing company, Dongkuk Steel Mill Co. Ltd. (South Korea), China Railway Construction Corp. Ltd. (China), Bank of India (India), IDBI Bank Ltd. (India), and real estate company, Renhe Commercial Holdings Co. Ltd. (China).
Most free floating emerging markets currencies (including the Brazilian real, Korean won, and Indian rupee) depreciated relative to the US dollar in the twelve months ended September 30, 2011. Most of that depreciation came during the final quarter of the period as investors decreased their appetite for risk.
| | |
2 | | Causeway Emerging Markets Fund |
Investors became risk averse over the course of the quarter as a number of problems affected financial markets including European solvency issues, the slowdown of economic growth in China, and the inability of politicians to agree on a solution to the US’ fiscal debt woes.
Significant Portfolio Changes
As a result of our quantitative security selection model that includes bottom-up and top-down inputs, the Fund’s active exposure to several industries and countries changed during the fiscal year. The Fund’s active weightings (i.e., compared to EM Index weightings) in the food beverage & tobacco, telecommunication services, and software & services industry groups increased, while active weightings in the technology hardware & equipment, real estate, and pharmaceuticals & biotechnology industry groups decreased. The largest changes in the Fund’s active country weightings (compared to the country weightings in the EM Index) during the fiscal year included increased exposure to Thailand and Brazil, and decreased exposure to Poland, India, Korea, and China.
Significant net purchases this year included oil and natural gas exploration and production company, Gazprom OAO ADR (Russia), telecommunication services company, China Mobile Ltd. ADR, tobacco manufacturing company, KT&G Corp. (South Korea), Banco Do Brasil SA (Brazil), and automobile and motorcycle distribution company, Astra International (Indonesia). The largest sales during the period included oil and natural gas exploration and production company, Petroleo Brasileiro SA (Brazil), Taiwan Semiconductor Manufacturing Co. Ltd. ADR (Taiwan), oil and natural gas exploration and production company, Sasol (South Africa), shipbuilding and heavy industrial manufacturing company, Hyundai Heavy Industries Co., Ltd. (South Korea), and integrated aluminum manufacturing company, Hindalco Industries Ltd. (India).
Investment Outlook
Growth in the emerging markets has slowed down as restrictive monetary policy and the global economic slowdown have taken their toll. China’s real gross domestic product (“GDP”) growth was an annualized 10% in the first quarter of calendar 2011 (“1Q11”); however, a consensus of economists expects growth to fall to 9% in the second half of this year. Taiwan continued its slowdown from double digit GDP growth rates last year to a modest 5.0% year-over-year (“ y/y”) in 2Q11. Korea likewise fell noticeably to 3.4% y/y in 2Q11, with some of the slowdown being attributed to a decline in net exports. In Latin America, Brazil’s GDP grew by 3.1% y/y in 2Q11, down from 4.2% y/y in 1Q11; Mexico likewise fell to 3.3% y/y GDP growth in 2Q11, down from 4.6% in 1Q11. Growth rates in EEMEA (Eastern Europe, Middle East, Africa) are also falling. Russia’s GDP came in at 3.4% y/y in 2Q11, down from 4.1% in 1Q11, primarily attributable to falling oil and other commodity prices. Turkey slowed to a growth rate of 8.8% in 2Q11 and is expected to fall further to 5.1% in 3Q11 due to declining external demand.
| | |
Causeway Emerging Markets Fund | | 3 |
The silver lining of the global slowdown is that inflation is less concerning for most monetary authorities. The Chinese central bank’s tightening is likely on hold, as the latest consumer price index (“CPI”) reading in August showed a fractional retreat to 6.2% y/y. The Reserve Bank of India was one of the few banks that continued to tighten as its latest move was to raise interest rates 25 basis points to 8.25%, the 12th increase in the current cycle. Inflation continues to be a problem in India, as the latest CPI reading came in at 9.75%, the highest level in over a year. Even though inflation in Brazil reached 7.1%, y/y in August, well ahead of the central bank’s target of 4.5%, the latest move by that central bank was to lower interest rates. Authorities are concerned about the impact of the global economic slowdown; forecasters are predicting further rate cuts over the course of the next year. Similarly, interest rates are forecast to decline in Russia, given falling oil and other commodity prices coupled with a fall in the CPI in August to 8.2% from 9% in July.
The investment outlook for emerging markets appears positive, especially after the sell-off in the asset class in 3Q11. From a valuation perspective, the Fund currently has a forward price-to-earnings (P/E) ratio of less than 7. The Fund’s portfolio also contains high quality companies, with a weighted average return-on-equity (ROE) in excess of 22%. In terms of growth, the outlook is somewhat mixed. From a bottom-up, shorter-term perspective, we are witnessing downgrades of emerging markets companies’ earnings estimates by sell-side analysts. However, from a longer-term, top-down perspective, GDP growth rates for emerging countries are still strong and remain the growth engine for the world. The risk aversion indicators that we monitor are also currently positive on emerging markets. Both the Chicago Board Options Exchange Market Volatility (VIX) and the JP Morgan EMBI Spread signal that investors have become risk averse. These indicators are actually contrarian indicators — when they signal that investors are fearful, our research indicates that this is the time to buy riskier assets such as emerging markets. One negative for the asset class, however, is that global yield curves are relatively flat compared to historical yield curves. Flat yield curves are not conducive to emerging markets outperformance as they indicate that liquidity is not plentiful and future growth expectations are muted.
Our investment process combines value, growth, and momentum factors, while monitoring the portfolio’s exposure to quality factors. Value had negative relative performance during the last twelve months. It often underperforms during crisis periods because investors seek the safety of high quality stocks, which typically trade at a valuation premium. However, we expect this factor will perform better going forward, as the difference between cheap and expensive stocks has increased materially. We also anticipate that our earnings growth factors will perform well in the current environment, which we would characterize as one of slowing growth. In such circumstances, investors typically seek companies that still have strong growth prospects. We currently have a modest positive exposure to our quality factors. However, quality is no longer as inexpensive as it was earlier in the year, given its strong performance during the market sell-off. Nevertheless, since quality has not yet reached levels that we would characterize as expensive and because our quality exposure serves as a good hedge against our value exposure, we currently are maintaining a positive bias to our quality factors.
| | |
4 | | Causeway Emerging Markets Fund |
We thank you for your continued confidence in Causeway Emerging Markets Fund, and look forward to serving you in the future.
| | | | |

| | 
| | |
| Arjun Jayaraman | | MacDuff Kuhnert | | |
| Portfolio Manager | | Portfolio Manager | | |
The above commentary expresses the portfolio managers’ views as of the date shown and should not be relied upon by the reader as research or investment advice. These views are subject to change. There is no guarantee that any forecasts made will come to pass.
| | |
Causeway Emerging Markets Fund | | 5 |
Comparison of Change in the Value of a $10,000 Investment in Causeway Emerging Markets Fund, Investor Class shares versus the MSCI Emerging Markets Index (Gross)
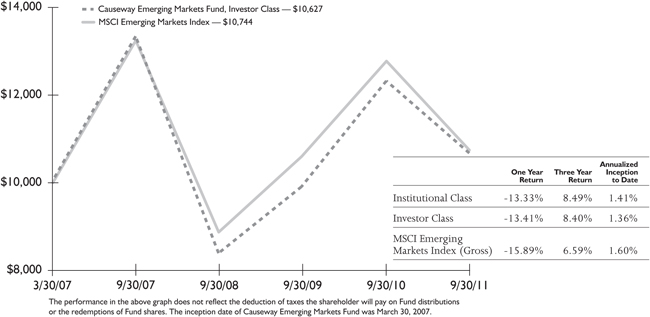
The performance data represents past performance and is not an indication of future results. Investment return and the principal value of an investment will fluctuate so that an investor’s shares, when redeemed, may be worth less than their original cost and current performance may be higher or lower than the performance quoted. For performance data current to the most recent month end, please call 1-866-947-7000 or visit www.causewayfunds.com. Investment performance reflects fee waivers in effect. In the absence of such fee waivers, total return would be reduced. Total returns assume reinvestment of dividends and capital gains distributions at net asset value when paid. Investor Class shares pay a shareholder service fee of up to 0.25% per annum of average daily net assets. Institutional Class shares pay no shareholder service fee. The Fund imposes a 2% redemption fee on the value of shares redeemed less than 60 days after purchase. If your account incurred a redemption fee, your performance will be lower than the performance shown here. For more information, please see the prospectus.
The MSCI Emerging Markets Index (Gross) is a free float-adjusted market capitalization index that is designed to measure equity market performance in the global emerging markets. The Index does not reflect the payment of transaction costs, fees and expenses associated with an investment in the Fund. It is not possible to invest directly in an index. There are special risks in foreign investing (please see Note 5 in the Notes to Financial Statements).
| | |
6 | | Causeway Emerging Markets Fund |
SCHEDULE OF INVESTMENTS (000) *
September 30, 2011
| | | | | | | | |
Causeway Emerging Markets Fund | | Number of Shares | | | Value | |
COMMON STOCK | | | | | | | | |
Brazil — 11.8% | | | | | | | | |
Banco Bradesco SA ADR | | | 29,700 | | | $ | 357 | |
Banco do Brasil SA | | | 131,700 | | | | 1,706 | |
Centrais Eletricas Brasileiras SA | | | 51,900 | | | | 447 | |
Cia de Bebidas das Americas ADR | | | 16,700 | | | | 512 | |
Cia de Saneamento Basico do Estado de Sao Paulo ADR | | | 19,400 | | | | 899 | |
Cia de Saneamento de Minas Gerais | | | 20,100 | | | | 315 | |
Cielo SA | | | 42,300 | | | | 932 | |
Light SA | | | 16,100 | | | | 212 | |
Petroleo Brasileiro SPON SA, Class A ADR | | | 32,700 | | | | 678 | |
Randon Participacoes SA | | | 60,200 | | | | 328 | |
Telecomunicacoes de Sao Paulo SA ADR | | | 46,960 | | | | 1,242 | |
Tim Participacoes SA ADR | | | 22,730 | | | | 535 | |
Vale SA, Class B ADR | | | 61,100 | | | | 1,393 | |
| | | | | | | | |
| | | | | | | 9,556 | |
| | | | | | | | |
Chile — 0.7% | | | | | | | | |
ENTEL Chile SA | | | 27,795 | | | | 533 | |
| | | | | | | | |
China — 17.6% | | | | | | | | |
Agricultural Bank of China Ltd., Class H | | | 1,735,000 | | | | 566 | |
Bank of China Ltd., Class H | | | 3,142,000 | | | | 972 | |
Chigo Holding Ltd. | | | 3,570,000 | | | | 192 | |
China Communications Construction Co. Ltd., Class H | | | 1,454,000 | | | | 944 | |
China Construction Bank Corp., Class H | | | 2,089,000 | | | | 1,264 | |
China Metal Recycling Holdings Ltd. | | | 353,600 | | | | 304 | |
China Minsheng Banking Corp. Ltd., Class H | | | 172,000 | | | | 105 | |
China Minzhong Food Corp. Ltd.1 | | | 281,000 | | | | 187 | |
China Mobile Ltd. ADR | | | 52,800 | | | | 2,572 | |
China Petroleum & Chemical Corp. ADR | | | 21,500 | | | | 2,060 | |
China Railway Construction Corp. Ltd., Class H | | | 647,500 | | | | 271 | |
China Shanshui Cement Group Ltd. | | | 996,000 | | | | 674 | |
China Yuchai International Ltd. | | | 27,200 | | | | 397 | |
The accompanying notes are an integral part of the financial statements.
| | |
Causeway Emerging Markets Fund | | 7 |
SCHEDULE OF INVESTMENTS (000) * (continued)
September 30, 2011
| | | | | | | | |
Causeway Emerging Markets Fund | | Number of Shares | | | Value | |
China — (continued) | | | | | | | | |
CNOOC Ltd. ADR | | | 1,900 | | | $ | 304 | |
FerroChina Ltd.1,2,3 | | | 258,000 | | | | — | |
Great Wall Motor Co. Ltd., Class H | | | 642,000 | | | | 731 | |
Guangzhou R&F Properties Co. Ltd. | | | 393,200 | | | | 290 | |
Industrial & Commercial Bank of China, Class H | | | 585,000 | | | | 282 | |
Jiangxi Copper Co. Ltd., Class H | | | 143,000 | | | | 248 | |
Kingboard Chemical Holdings Ltd. | | | 96,500 | | | | 260 | |
Lonking Holdings Ltd. | | | 691,000 | | | | 225 | |
PetroChina Co. Ltd. ADR | | | 4,100 | | | | 494 | |
Renhe Commercial Holdings Co. Ltd. | | | 3,378,000 | | | | 360 | |
Shenzhen Investment Ltd. | | | 1,132,000 | | | | 207 | |
Tianneng Power International Ltd. | | | 806,000 | | | | 332 | |
| | | | | | | | |
| | | | | | | 14,241 | |
| | | | | | | | |
Hong Kong — 0.6% | | | | | | | | |
China Lumena New Materials Corp. | | | 1,362,000 | | | | 210 | |
Skyworth Digital Holdings Ltd. | | | 862,000 | | | | 299 | |
| | | | | | | | |
| | | | | | | 509 | |
| | | | | | | | |
India — 5.4% | | | | | | | | |
Bank of India | | | 49,431 | | | | 316 | |
Coal India Ltd. | | | 47,279 | | | | 321 | |
Hero Motocorp Ltd. | | | 10,400 | | | | 411 | |
Hindalco Industries Ltd. | | | 39 | | | | — | |
Hindustan Petroleum Corp. Ltd. | | | 14,553 | | | | 109 | |
IDBI Bank Ltd. | | | 241,917 | | | | 503 | |
ITC Ltd. | | | 113,376 | | | | 456 | |
Jubilant Foodworks Ltd.1 | | | 18,566 | | | | 299 | |
Oil & Natural Gas Corp. Ltd. | | | 188,378 | | | | 1,019 | |
Tata Consultancy Services Ltd. | | | 45 | | | | 1 | |
Tata Motors Ltd. | | | 175,105 | | | | 553 | |
Titan Industries Ltd. | | | 88,544 | | | | 376 | |
| | | | | | | | |
| | | | | | | 4,364 | |
| | | | | | | | |
The accompanying notes are an integral part of the financial statements.
| | |
8 | | Causeway Emerging Markets Fund |
SCHEDULE OF INVESTMENTS (000) * (continued)
September 30, 2011
| | | | | | | | |
Causeway Emerging Markets Fund | | Number of Shares | | | Value | |
Indonesia — 3.4% | | | | | | | | |
AKR Corporindo | | | 1,591,500 | | | $ | 430 | |
Astra International | | | 198,000 | | | | 1,417 | |
Indofood CBP Sukses Makmur | | | 569,000 | | | | 316 | |
Indofood Sukses Makmur Tbk PT | | | 375,000 | | | | 214 | |
Kawasan Industri Jababeka1 | | | 14,935,000 | | | | 233 | |
Timah | | | 657,000 | | | | 130 | |
| | | | | | | | |
| | | | | | | 2,740 | |
| | | | | | | | |
Malaysia — 3.2% | | | | | | | | |
DiGi.Com Bhd | | | 54,400 | | | | 518 | |
Kuala Lumpur Kepong Bhd | | | 73,600 | | | | 484 | |
Sime Darby Bhd | | | 156,900 | | | | 413 | |
Telekom Malaysia Bhd | | | 667,700 | | | | 854 | |
UMW Holdings Bhd | | | 138,400 | | | | 296 | |
| | | | | | | | |
| | | | | | | 2,565 | |
| | | | | | | | |
Mexico — 3.2% | | | | | | | | |
Alfa SAB de CV, Class A | | | 45,200 | | | | 464 | |
America Movil SAB de CV, Class L ADR | | | 18,600 | | | | 411 | |
Arca Continental SAB de CV | | | 74,852 | | | | 309 | |
Fomento Economico Mexicano SAB de CV ADR | | | 22,000 | | | | 1,426 | |
| | | | | | | | |
| | | | | | | 2,610 | |
| | | | | | | | |
Poland — 3.5% | | | | | | | | |
KGHM Polska Miedz SA | | | 34,442 | | | | 1,349 | |
PGE SA | | | 77,445 | | | | 452 | |
Polski Koncern Naftowy Orlen SA | | | 56,655 | | | | 617 | |
Tauron Polska Energia SA | | | 254,803 | | | | 389 | |
| | | | | | | | |
| | | | | | | 2,807 | |
| | | | | | | | |
The accompanying notes are an integral part of the financial statements.
| | |
Causeway Emerging Markets Fund | | 9 |
SCHEDULE OF INVESTMENTS (000) * (continued)
September 30, 2011
| | | | | | | | |
Causeway Emerging Markets Fund | | Number of Shares | | | Value | |
Russia — 7.2% | | | | | | | | |
Gazprom OAO ADR | | | 292,223 | | | $ | 2,798 | |
LUKOIL OAO ADR | | | 39,264 | | | | 1,979 | |
Tatneft ADR | | | 19,855 | | | | 488 | |
VimpelCom Ltd. ADR | | | 54,500 | | | | 519 | |
| | | | | | | | |
| | | | | | | 5,784 | |
| | | | | | | | |
South Africa — 5.5% | | | | | | | | |
Aveng Ltd. | | | 143,096 | | | | 613 | |
Exxaro Resources Ltd. | | | 39,316 | | | | 829 | |
Growthpoint Properties Ltd. | | | 237,681 | | | | 524 | |
Imperial Holdings Ltd. | | | 23,430 | | | | 306 | |
Kumba Iron Ore Ltd. | | | 4,819 | | | | 254 | |
Liberty Holdings Ltd. | | | 34,100 | | | | 338 | |
MMI Holdings Ltd. | | | 204,825 | | | | 433 | |
Redefine Properties Ltd. | | | 274,320 | | | | 273 | |
Sanlam Ltd. | | | 259,867 | | | | 873 | |
| | | | | | | | |
| | | | | | | 4,443 | |
| | | | | | | | |
South Korea — 14.0% | | | | | | | | |
BS Financial Group Inc.1 | | | 36,300 | | | | 395 | |
Daesang Corp. | | | 48,970 | | | | 505 | |
Daishin Securities Co. Ltd. | | | 43,450 | | | | 368 | |
DGB Financial Group Inc.1 | | | 31,770 | | | | 375 | |
Dongkuk Steel Mill Co. Ltd. | | | 38,300 | | | | 711 | |
Hana Financial Group Inc. | | | 9,060 | | | | 263 | |
Honam Petrochemical Corp. | | | 1,243 | | | | 297 | |
Hyundai Mipo Dockyard | | | 3,110 | | | | 267 | |
Hyundai Securities Co. | | | 35,410 | | | | 278 | |
Industrial Bank of Korea | | | 65,430 | | | | 758 | |
ISU Chemical Co. Ltd. | | | 13,410 | | | | 258 | |
Korea Exchange Bank | | | 60,810 | | | | 356 | |
KT Corp. ADR | | | 45,000 | | | | 665 | |
The accompanying notes are an integral part of the financial statements.
| | |
10 | | Causeway Emerging Markets Fund |
SCHEDULE OF INVESTMENTS (000) * (continued)
September 30, 2011
| | | | | | | | |
Causeway Emerging Markets Fund | | Number of Shares | | | Value | |
South Korea — (continued) | | | | | | | | |
KT&G Corp. | | | 28,768 | | | $ | 1,786 | |
LG Fashion Corp. | | | 11,792 | | | | 399 | |
Meritz Fire & Marine Insurance Co. Ltd. | | | 31,857 | | | | 282 | |
Paradise Co. Ltd. | | | 34,012 | | | | 237 | |
Samsung Electronics Co. Ltd. | | | 2,019 | | | | 1,406 | |
SK Telecom Co. Ltd. ADR | | | 35,400 | | | | 498 | |
Sungwoo Hitech Co. Ltd. | | | 25,328 | | | | 449 | |
Woori Finance Holdings Co. Ltd. | | | 87,740 | | | | 742 | |
| | | | | | | | |
| | | | | | | 11,295 | |
| | | | | | | | |
Taiwan — 11.4% | | | | | | | | |
Asia Cement Corp. | | | 270,000 | | | | 278 | |
Asustek Computer Inc. | | | 124,300 | | | | 927 | |
China Development Financial Holding Corp. | | | 1,031,003 | | | | 307 | |
China Petrochemical Development Corp. | | | 270,200 | | | | 289 | |
Chong Hong Construction Co. | | | 123,000 | | | | 259 | |
Compal Electronics Inc. | | | 687,316 | | | | 625 | |
Coretronic Corp. | | | 174,000 | | | | 133 | |
Formosa Plastics Corp. | | | 294,000 | | | | 776 | |
Fubon Financial Holding Co. Ltd. | | | 670,871 | | | | 693 | |
Gigabyte Technology Co. Ltd. | | | 498,000 | | | | 432 | |
Grand Pacific Petrochemical | | | 546,000 | | | | 225 | |
Highwealth Construction Corp. | | | 149,000 | | | | 246 | |
Huaku Development Co. Ltd. | | | 3,197 | | | | 7 | |
Kindom Construction Co. | | | 582,000 | | | | 382 | |
Lite-On Technology Corp. | | | 369,511 | | | | 335 | |
Neo Solar Power Corp. | | | 234,000 | | | | 218 | |
Radiant Opto-Electronics Corp. | | | 314,360 | | | | 883 | |
Taiwan Semiconductor Manufacturing Co. Ltd. ADR | | | 55,702 | | | | 637 | |
Taiwan Surface Mounting Technology Co. Ltd. | | | 260,400 | | | | 524 | |
United Microelectronics Corp. ADR | | | 278,200 | | | | 531 | |
The accompanying notes are an integral part of the financial statements.
| | |
Causeway Emerging Markets Fund | | 11 |
SCHEDULE OF INVESTMENTS (000) * (continued)
September 30, 2011
| | | | | | | | |
Causeway Emerging Markets Fund | | Number of Shares | | | Value | |
Taiwan — (continued) | | | | | | | | |
Wistron Corp. | | | 168,971 | | | $ | 190 | |
WT Microelectronics Co. Ltd. | | | 247,000 | | | | 299 | |
| | | | | | | | |
| | | | | | | 9,196 | |
| | | | | | | | |
Thailand — 4.1% | | | | | | | | |
Advanced Info Service | | | 359,800 | | | | 1,471 | |
Bangchak Petroleum | | | 943,400 | | | | 497 | |
Bangkok Bank | | | 49,000 | | | | 221 | |
Charoen Pokphand Foods PCL | | | 993,000 | | | | 848 | |
TPI Polene | | | 714,000 | | | | 279 | |
| | | | | | | | |
| | | | | | | 3,316 | |
| | | | | | | | |
Turkey — 3.5% | | | | | | | | |
Ford Otomotiv Sanayi AS | | | 34,563 | | | | 241 | |
GSD Holding1 | | | 455 | | | | — | |
Tupras Turkiye Petrol Rafinerileri AS | | | 74,067 | | | | 1,519 | |
Turk Traktor ve Ziraat Makineleri AS | | | 27,110 | | | | 517 | |
Turkiye Sise ve Cam Fabrikalari AS | | | 295,196 | | | | 563 | |
| | | | | | | | |
| | | | | | | 2,840 | |
| | | | | | | | |
Total Common Stock
(Cost $90,453) — 95.1% | | | | | | | 76,799 | |
| | | | | | | | |
PREFERENCE STOCK | | | | | | | | |
Brazil — 1.8% | | | | | | | | |
Banco do Estado do Rio Grande do Sul | | | 39,100 | | | | 328 | |
Eletropaulo Metropolitana Eletricidade de Sao Paulo SA | | | 62,629 | | | | 950 | |
Itau Unibanco Banco Multiplo SA ADR | | | 11,700 | | | | 182 | |
| | | | | | | | |
| | | | | | | 1,460 | |
| | | | | | | | |
The accompanying notes are an integral part of the financial statements.
| | |
12 | | Causeway Emerging Markets Fund |
SCHEDULE OF INVESTMENTS (000) * (concluded)
September 30, 2011
| | | | | | | | |
Causeway Emerging Markets Fund | | Number of Shares | | | Value | |
South Korea — 1.0% | | | | | | | | |
Hyundai Motor Co. | | | 10,583 | | | $ | 599 | |
LG Chemical Ltd. | | | 2,232 | | | | 200 | |
| | | | | | | | |
| | | | | | | 799 | |
| | | | | | | | |
Total Preference Stock
(Cost $2,603) — 2.8% | | | | | | | 2,259 | |
| | | | | | | | |
SHORT-TERM INVESTMENT | | | | | | | | |
Dreyfus Cash Management, Institutional Class, 0.050%** | | | 1,543,035 | | | | 1,543 | |
| | | | | | | | |
Total Short-Term Investment
(Cost $1,543) — 1.9% | | | | | | | 1,543 | |
| | | | | | | | |
Total Investments — 99.8%
(Cost $94,599) | | | | | | | 80,601 | |
| | | | | | | | |
Other Assets in Excess of Liabilities — 0.2% | | | | | | | 174 | |
| | | | | | | | |
Net Assets — 100.0 % | | | | | | $ | 80,775 | |
| | | | | | | | |
| ** | The rate reported is the 7-day effective yield as of September 30, 2011. |
| 1 | Non-income producing security. |
| 2 | Security is fair valued at zero due to company’s insolvency. |
| 3 | Security is considered illiquid. The total market value of such security as of September 30, 2011 was $— and represented 0.0% of net assets. |
ADR American Depositary Receipt
Amounts designated as “—” are $0 or are rounded to $0.
The accompanying notes are an integral part of the financial statements.
| | |
Causeway Emerging Markets Fund | | 13 |
SECTOR DIVERSIFICATION
As of September 30, 2011, the sector diversification was as follows (Unaudited):
| | | | | | | | | | | | |
Causeway Emerging Markets Fund | | Common
Stock | | | Preference
Stock | | | % of
Net Assets | |
Financials | | | 19.2 | % | | | 0.6 | % | | | 19.8 | % |
Energy | | | 16.0 | | | | 0.0 | | | | 16.0 | |
Telecommunication Services | | | 12.2 | | | | 0.0 | | | | 12.2 | |
Materials | | | 10.5 | | | | 0.3 | | | | 10.8 | |
Information Technology | | | 10.3 | | | | 0.0 | | | | 10.3 | |
Consumer Discretionary | | | 8.8 | | | | 0.7 | | | | 9.5 | |
Consumer Staples | | | 8.7 | | | | 0.0 | | | | 8.7 | |
Industrials | | | 6.0 | | | | 0.0 | | | | 6.0 | |
Utilities | | | 3.4 | | | | 1.2 | | | | 4.6 | |
| | | | | | | | | | | | |
Total | | | 95.1 | | | | 2.8 | | | | 97.9 | |
Short-Term Investment | | | | | | | | | | | 1.9 | |
| | | | | | | | | | | | |
Other Assets in Excess of Liabilities | | | | | | | | | | | 0.2 | |
| | | | | | | | | | | | |
Net Assets | | | | | | | | | | | 100.0 | % |
| | | | | | | | | | | | |
The accompanying notes are an integral part of the financial statements.
| | |
14 | | Causeway Emerging Markets Fund |
STATEMENT OF ASSETS AND LIABILITIES (000) *
| | | | |
| | | CAUSEWAY
EMERGING
MARKETS FUND | |
| | | 9/30/11 | |
ASSETS: | | | | |
Investments at Value (Cost $94,599) | | $ | 80,601 | |
Receivable for Investment Securities Sold | | | 3,758 | |
Receivable for Fund Shares Sold | | | 304 | |
Receivable for Dividends and Interest | | | 203 | |
Foreign Currency (Cost $39) | | | 39 | |
Prepaid Expenses | | | 9 | |
| | | | |
Total Assets | | | 84,914 | |
| | | | |
LIABILITIES: | | | | |
Payable for Investment Securities Purchased | | | 3,875 | |
Accumulated Foreign Capital Gains Tax on Appreciated Securities | | | 75 | |
Payable due to Adviser | | | 64 | |
Payable for Fund Shares Redeemed | | | 20 | |
Payable for Trustees’ Fees | | | 5 | |
Payable due to Administrator | | | 4 | |
Other Accrued Expenses | | | 96 | |
| | | | |
Total Liabilities | | | 4,139 | |
| | | | |
Net Assets | | $ | 80,775 | |
| | | | |
NET ASSETS: | | | | |
Paid-in Capital (unlimited authorization — no par value) | | $ | 103,265 | |
Undistributed Net Investment Income | | | 808 | |
Accumulated Net Realized Loss on Investments and Foreign Currency Transactions | | | (9,223 | ) |
Accrued Foreign Capital Gains Tax on Appreciated Securities | | | (75 | ) |
Net Unrealized Depreciation on Investments | | | (13,998 | ) |
Net Unrealized Depreciation on Foreign Currencies and Translation of Other Assets and Liabilities Denominated in Foreign Currencies | | | (2 | ) |
| | | | |
Net Assets | | $ | 80,775 | |
| | | | |
Net Asset Value Per Share (based on net assets of $53,748,092 ÷ 5,721,793 shares) — Institutional Class | | $ | 9.39 | |
| | | | |
Net Asset Value Per Share (based on net assets of $27,026,441 ÷ 2,860,044 shares) — Investor Class | | $ | 9.45 | |
| | | | |
| * | Except for Net Asset Value data. |
The accompanying notes are an integral part of the financial statements.
| | |
Causeway Emerging Markets Fund | | 15 |
STATEMENT OF OPERATIONS (000)
| | | | |
| | | CAUSEWAY
EMERGING
MARKETS FUND | |
| | | 10/01/10 TO
9/30/11 | |
INVESTMENT INCOME: | | | | |
Dividend Income (net of foreign taxes withheld of $231) | | $ | 1,991 | |
| | | | |
Total Investment Income | | | 1,991 | |
| | | | |
EXPENSES: | | | | |
Investment Advisory Fees | | | 522 | |
Custodian Fees | | | 83 | |
Transfer Agent Fees | | | 58 | |
Professional Fees | | | 47 | |
Shareholder Service Fees — Investor Class | | | 47 | |
Administration Fees | | | 30 | |
Registration Fees | | | 28 | |
Printing Fees | | | 22 | |
Trustees’ Fees | | | 10 | |
Other Fees | | | 27 | |
| | | | |
Total Expenses | | | 874 | |
Less: | | | | |
Waiver of Investment Advisory Fees | | | (122 | ) |
| | | | |
Net Expenses | | | 752 | |
| | | | |
Net Investment Income | | | 1,239 | |
| | | | |
Net Realized and Unrealized Gain (Loss) on Investments and Foreign Currency Transactions: | | | | |
Net Realized Gain from Security Transactions | | | 1,181 | |
Net Realized Loss from Foreign Currency Transactions | | | (222 | ) |
Net Change in Unrealized Depreciation on Investments | | | (18,015 | ) |
Net Change in Accrued Foreign Capital Gains Tax on Appreciated Securities | | | (18 | ) |
Net Change in Unrealized Depreciation on Foreign Currency and Translation of Other Assets and Liabilities Denominated in Foreign Currency | | | (7 | ) |
| | | | |
Net Realized and Unrealized Loss on Investments and Foreign Currency Transactions | | | (17,081 | ) |
| | | | |
Net Decrease in Net Assets Resulting from Operations | | $ | (15,842 | ) |
| | | | |
The accompanying notes are an integral part of the financial statements.
| | |
16 | | Causeway Emerging Markets Fund |
STATEMENT OF CHANGES IN NET ASSETS (000)
| | | | | | | | |
| | | CAUSEWAY EMERGING MARKETS FUND | |
| | | 10/01/10 TO
9/30/11 | | | 10/01/09 TO
9/30/10 | |
OPERATIONS: | | | | | | | | |
Net Investment Income | | $ | 1,239 | | | $ | 508 | |
Net Realized Gain from Security Transactions | | | 1,181 | | | | 3,474 | |
Net Realized Loss from Foreign Currency Transactions | | | (222 | ) | | | (43 | ) |
Net Change in Unrealized Appreciation (Depreciation) on Investments | | | (18,015 | ) | | | 2,706 | |
Net Change in Accrued Foreign Capital Gains Tax on Appreciated Securities | | | (18 | ) | | | 9 | |
Net Change in Unrealized Depreciation on Foreign Currency and Translation of Other Assets and Liabilities Denominated in Foreign Currency | | | (7 | ) | | | (10 | ) |
| | | | | | | | |
Net Increase (Decrease) in Net Assets Resulting from Operations | | | (15,842 | ) | | | 6,644 | |
| | | | | | | | |
DIVIDENDS AND DISTRIBUTIONS TO SHAREHOLDERS: | | | | | | | | |
Dividends from Net Investment Income: | | | | | | | | |
Institutional Class | | | (476 | ) | | | (609 | ) |
Investor Class | | | (256 | ) | | | (159 | ) |
| | | | | | | | |
Total Dividends from Net Investment Income | | | (732 | ) | | | (768 | ) |
| | | | | | | | |
Net Increase (Decrease) in Net Assets Derived from Capital Share Transactions(1) | | | 66,984 | | | | (9,320 | ) |
Redemption Fees(2) | | | 15 | | | | 2 | |
| | | | | | | | |
Total Increase (Decrease) in Net Assets | | | 50,425 | | | | (3,442 | ) |
| | | | | | | | |
NET ASSETS: | | | | | | | | |
Beginning of Year | | | 30,350 | | | | 33,792 | |
| | | | | | | | |
End of Year | | $ | 80,775 | | | $ | 30,350 | |
| | | | | | | | |
Undistributed Net Investment Income | | $ | 808 | | | $ | 442 | |
| | | | | | | | |
| (1) | See Note 7 in the Notes to Financial Statements. |
| (2) | See Note 2 in the Notes to Financial Statements. |
The accompanying notes are an integral part of the financial statements.
| | |
Causeway Emerging Markets Fund | | 17 |
FINANCIAL HIGHLIGHTS
For the year or period ended September 30,
For a Share Outstanding Throughout the Periods
| | | | | | | | | | | | | | | | | | | | | | | | | | | | | | | | |
| | | Net Asset
Value,
Beginning
of Period ($) | | | Net
Investment
Income ($) | | | Net Realized
and
Unrealized
Gain
(Loss) on
Investments ($) | | | Total
from
Operations ($) | | | Dividends
from Net
Investment
Income ($) | | | Distributions
from
Capital
Gains ($) | | | Total
Dividends
and
Distributions ($) | | | Redemption
Fees ($) | |
CAUSEWAY EMERGING MARKETS FUND† | |
Institutional Class | | | | | | | | | | | | | | | | | | | | | | | | | |
2011 | | | 11.07 | | | | 0.26 | | | | (1.68 | ) | | | (1.42 | ) | | | (0.26 | ) | | | — | | | | (0.26 | ) | | | — | |
2010 | | | 9.15 | | | | 0.16 | | | | 2.05 | | | | 2.21 | | | | (0.29 | ) | | | — | | | | (0.29 | ) | | | — | |
2009 | | | 7.96 | | | | 0.16 | | | | 1.18 | | | | 1.34 | | | | (0.15 | ) | | | — | | | | (0.15 | ) | | | — | |
2008 | | | 13.26 | | | | 0.31 | | | | (5.00 | ) | | | (4.69 | ) | | | (0.21 | ) | | | (0.40 | ) | | | (0.61 | ) | | | — | |
2007(1) | | | 10.00 | | | | 0.08 | | | | 3.18 | | | | 3.26 | | | | — | | | | — | | | | — | | | | — | |
Investor Class | | | | | | | | | | | | | | | | | | | | | | | | | | | | | | | | |
2011 | | | 11.14 | | | | 0.30 | | | | (1.75 | ) | | | (1.45 | ) | | | (0.25 | ) | | | — | | | | (0.25 | ) | | | 0.01 | |
2010 | | | 9.21 | | | | 0.18 | | | | 2.03 | | | | 2.21 | | | | (0.28 | ) | | | — | | | | (0.28 | ) | | | — | |
2009 | | | 7.97 | | | | 0.17 | | | | 1.19 | | | | 1.36 | | | | (0.12 | ) | | | — | | | | (0.12 | ) | | | — | |
2008 | | | 13.29 | | | | 0.22 | | | | (4.94 | ) | | | (4.72 | ) | | | (0.20 | ) | | | (0.40 | ) | | | (0.60 | ) | | | — | |
2007(1) | | | 10.00 | | | | 0.06 | | | | 3.23 | | | | 3.29 | | | | — | | | | — | | | | — | | | | — | |
| (1) | Commenced operations on March 30, 2007. All ratios for the period are annualized. Total return and portfolio turnover are for the period indicated and have not been annualized. |
| † | Per share amounts calculated using average shares method. |
Amounts designated as “—” are $0 or are rounded to $0.
The accompanying notes are an integral part of the financial statements.
| | |
18 | | Causeway Emerging Markets Fund |
| | | | | | | | | | | | | | | | | | | | | | | | | | |
Net Asset Value, End of Period ($) | | | Total
Return (%) | | | Net Assets
End of
Period
($000) | | | Ratio of
Expenses to
Average Net
Assets (%) | | | Ratio of
Expenses
to Average
Net Assets
(Excluding
Waivers and
Reimburse-
ments) (%) | | | Ratio
of Net
Investment
Income
to Average
Net Assets (%) | | | Portfolio
Turnover
Rate (%) | |
| | | | | | | | | | | | | | | | | | | | | | | | | | |
| | | | | | | | | | | | | | | | | | | | | | | | | | |
| | 9.39 | | | | (13.33 | ) | | | 53,748 | | | | 1.35 | | | | 1.59 | | | | 2.25 | | | | 95 | |
| | 11.07 | | | | 24.59 | | | | 21,600 | | | | 1.35 | | | | 1.96 | | | | 1.75 | | | | 83 | |
| | 9.15 | | | | 18.25 | | | | 29,754 | | | | 1.35 | | | | 1.88 | | | | 2.46 | | | | 92 | |
| | 7.96 | | | | (37.10 | ) | | | 28,851 | | | | 1.35 | | | | 1.56 | | | | 2.69 | | | | 100 | |
| | 13.26 | | | | 32.60 | | | | 22,376 | | | | 1.35 | | | | 3.24 | | | | 1.44 | | | | 77 | |
| | | | | | | | | | | | | | | | | | | | | | | | | | |
| | 9.45 | | | | (13.41 | ) | | | 27,027 | | | | 1.55 | | | | 1.78 | | | | 2.52 | | | | 95 | |
| | 11.14 | | | | 24.49 | | | | 8,750 | | | | 1.46 | | | | 2.11 | | | | 1.96 | | | | 83 | |
| | 9.21 | | | | 18.15 | | | | 4,038 | | | | 1.45 | | | | 1.98 | | | | 2.61 | | | | 92 | |
| | 7.97 | | | | (37.22 | ) | | | 3,325 | | | | 1.60 | | | | 1.82 | | | | 1.79 | | | | 100 | |
| | 13.29 | | | | 32.90 | | | | 4,517 | | | | 1.58 | | | | 3.16 | | | | 1.02 | | | | 77 | |
The accompanying notes are an integral part of the financial statements.
| | |
Causeway Emerging Markets Fund | | 19 |
NOTES TO FINANCIAL STATEMENTS
Causeway Emerging Markets Fund (the “Fund”) is a series of Causeway Capital ManagementTrust (the “Trust”). The Trust is an open-end management investment company registered under the Investment Company Act of 1940, as amended (the “1940 Act”) and is a Delaware statutory trust that was established on August 10, 2001. The Fund began operations on March 30, 2007. The Fund is authorized to offer two classes of shares, the Institutional Class and the Investor Class. The Declaration of Trust authorizes the issuance of an unlimited number of shares of beneficial interest of the Fund. The Fund is diversified. The Fund’s prospectus provides a description of the Fund’s investment objectives, policies and strategies. The Trust has four additional series, the financial statements of which are presented separately.
| 2. | Significant Accounting Policies |
The following is a summary of the significant accounting policies consistently followed by the Fund.
Use of Estimates in the Preparation of Financial Statements –The preparation of financial statements in conformity with generally accepted accounting principles (“GAAP”) in the United States of America requires management to make estimates and assumptions that affect the reported amount of net assets and liabilities and disclosure of contingent assets and liabilities at the date of the financial statements and the reported amounts of increases and decreases in net assets from operations during the reporting period. Actual results could differ from those estimates.
Security Valuation – Except as described below, securities listed on a securities exchange (except the NASDAQ Stock Market (“NASDAQ”)) or Over-the-Counter (“OTC”) for which market quotations are available are
valued at the last reported sale price as of the close of regular trading on each business day, or, if there is no such reported sale, at the last reported bid price for long positions. For securities traded on NASDAQ, the NASDAQ Official Closing Price will be used. Securities listed on multiple exchanges or OTC markets are valued on the exchange or OTC market considered by the Fund to be the primary market. The prices for foreign securities are reported in local currency and converted to U.S. dollars using currency exchange rates. Prices for most securities held in the Fund are provided daily by recognized independent pricing agents. If a security price cannot be obtained from an independent pricing agent, the Fund seeks to obtain a bid price from at least one independent broker. Investments in the Dreyfus Cash Management money market fund are valued daily at the net asset value per share.
Securities for which market prices are not “readily available” are valued in accordance with fair value pricing procedures approved by the Fund’s Board of Trustees (the “Board”). The Fund’s fair value pricing procedures are implemented through a Fair Value Committee (the “Committee”) designated by the Board. Some of the more common reasons that may necessitate that a security be valued using fair value pricing procedures include: the security’s trading has been halted or suspended; the security has been delisted from a national exchange; the security’s primary trading market is temporarily closed at a time when under normal conditions it would be open; or the security’s primary pricing source is not able or willing to provide a price. When the Committee values a security in accordance with the fair value pricing procedures, the Committee will determine the value after taking into consideration relevant information reasonably available to the Committee.
| | |
20 | | Causeway Emerging Markets Fund |
NOTES TO FINANCIAL STATEMENTS
(continued)
The Fund uses a third party vendor to fair value certain non-U.S. securities if there is a movement in the U.S. market that exceeds thresholds established by the Committee. The vendor provides fair values for foreign securities based on factors and methodologies involving, generally, tracking valuation correlations between the U.S. market and each non-U.S. security.
In accordance with the authoritative guidance on fair value measurements and disclosure under GAAP, the Fund discloses fair value of its investments in a hierarchy that prioritizes the inputs to valuation techniques used to measure the fair value. The objective of a fair value measurement is to determine the price that would be received to sell an asset or paid to transfer a liability in an orderly transaction between market participants at the measurement date (an exit price). Accordingly, the fair value hierarchy gives the highest priority to quoted prices (unadjusted) in active markets for identical assets or liabilities (Level 1) and the lowest priority to unobservable inputs (Level 3).The guidance establishes three levels of fair value hierarchy as follows:
• Level 1 — Unadjusted quoted prices in active markets for identical, unrestricted assets or liabilities that the Fund has the ability to access at the measurement date;
• Level 2 — Quoted prices which are not active, or inputs that are observable (either directly or indirectly) for substantially the full term of the asset or liability; and
• Level 3 — Prices, inputs or exotic modeling techniques which are both significant to the fair value measurement and unobservable (supported by little or no market activity).
Investments are classified within the level of the lowest significant input considered in determining fair value.
Investments classified within Level 3 whose fair value measurement considers several inputs may include Level 1 or Level 2 inputs as components of the overall fair value measurement. The table below sets forth information about the level within the fair value hierarchy at which the Fund’s investments are measured at September 30, 2011:
| | | | | | | | | | | | | | | | |
Investments in Securities | | Level 1
(000) | | | Level 2†
(000) | | | Level 3
(000) | | | Total
(000) | |
Common Stock | | | | | | | | | | | | | | | | |
Brazil | | $ | 9,556 | | | $ | — | | | $ | — | | | $ | 9,556 | |
Chile | | | 533 | | | | — | | | | — | | | | 533 | |
China | | | 5,827 | | | | 8,414 | | | | — | | | | 14,241 | |
Hong Kong | | | — | | | | 509 | | | | — | | | | 509 | |
India | | | 109 | | | | 4,255 | | | | — | | | | 4,364 | |
Indonesia | | | — | | | | 2,740 | | | | — | | | | 2,740 | |
Malaysia | | | — | | | | 2,565 | | | | — | | | | 2,565 | |
Mexico | | | 2,610 | | | | — | | | | — | | | | 2,610 | |
Poland | | | — | | | | 2,807 | | | | — | | | | 2,807 | |
Russia | | | 519 | | | | 5,265 | | | | — | | | | 5,784 | |
South Africa | | | — | | | | 4,443 | | | | — | | | | 4,443 | |
South Korea | | | 1,538 | | | | 9,757 | | | | — | | | | 11,295 | |
Taiwan | | | 1,168 | | | | 8,028 | | | | — | | | | 9,196 | |
Thailand | | | — | | | | 3,316 | | | | — | | | | 3,316 | |
Turkey | | | — | | | | 2,840 | | | | — | | | | 2,840 | |
| | | | | | | | | | | | | | | | |
Total Common Stock | | $ | 21,860 | | | $ | 54,939 | | | $ | — | | | $ | 76,799 | |
Preference Stock | | | | | | | | | | | | | | | | |
Brazil | | $ | 1,460 | | | $ | — | | | $ | — | | | $ | 1,460 | |
South Korea | | | — | | | | 799 | | | | — | | | | 799 | |
| | | | | | | | | | | | | | | | |
Total Preference Stock | | $ | 1,460 | | | $ | 799 | | | $ | — | | | $ | 2,259 | |
Short-Term Investment United States | | $ | 1,543 | | | $ | — | | | $ | — | | | $ | 1,543 | |
| | | | | | | | | | | | | | | | |
Total Investments in Securities | | $ | 24,863 | | | $ | 55,738 | | | $ | — | | | $ | 80,601 | |
| | | | | | | | | | | | | | | | |
| † | Represents securities trading outside the United States, the values of which were adjusted as a result of significant market movements following the close of local trading. |
Please refer to the Schedule of Investments for additional information regarding the composition of the amounts listed above.
As of and for the year ended September 30, 2011 the fair value of Level 3 assets was $0.
Changes in valuation techniques may result in transfers in or out of an investment’s assigned level within the
| | |
Causeway Emerging Markets Fund | | 21 |
NOTES TO FINANCIAL STATEMENTS
(continued)
hierarchy during the reporting period. For the Fund there were no transfers between Level 1 and Level 2 during the reporting period, based on the input level assigned under the hierarchy at the beginning and end of the reporting period.
For the year ended September 30, 2011, there were no significant changes to the Fund’s fair value methodologies.
Federal Income Taxes — It is the Fund’s intention to continue to qualify as a regulated investment company under Subchapter M of the Internal Revenue Code and to distribute all of its taxable income. Accordingly, no provision for Federal income taxes has been made in the financial statements.
The Fund evaluates tax positions taken or expected to be taken in the course of preparing the Fund’s tax returns to determine whether it is “more-likely-than-not” (i.e., greater than 50-percent) that each tax position will be sustained upon examination by a taxing authority based on the technical merits of the position. Tax positions not deemed to meet the more-likely-than-not threshold are recorded as a tax benefit or expense in the current year. The Fund did not record any tax provision in the current period. However, management’s conclusions regarding tax positions taken may be subject to review and adjustment at a later date based on factors including, but not limited to, examination by tax authorities (i.e., the last 3 tax year ends, as applicable), on-going analysis of and changes to tax laws, regulations and interpretations thereof.
As of and during the year ended September 30, 2011, the Fund did not have a liability for any unrecognized tax benefits. The Fund recognizes interest and penalties, if any, related to unrecognized tax benefits as income tax expense in the Statement of Operations. During the period
the Fund did not incur any significant interest or penalties.
Security Transactions and Related Income – Security transactions are accounted for on the date the security is purchased or sold (trade date). Dividend income is recognized on the ex-dividend date, and interest income is recognized using the accrual basis of accounting. Costs used in determining realized gains and losses on the sales of investment securities are those of the specific securities sold.
Foreign Currency Translation –The books and records of the Fund are maintained in U.S. dollars on the following basis:
| (1) | the market value or fair value of investment securities, assets and liabilities is converted at the current rate of exchange; and |
| (2) | purchases and sales of investment securities, income and expenses are converted at the relevant rates of exchange prevailing on the respective dates of such transactions. |
The Fund does not isolate that portion of gains and losses on investments in equity securities that is due to changes in the foreign exchange rates from that which is due to changes in market prices of equity securities.
Foreign Currency Exchange Contracts – When the Fund purchases or sells foreign securities, it may enter into foreign currency exchange contracts to minimize foreign exchange risk from the trade date to the settlement date of the transaction. Losses from these transactions may arise from changes in the value of the foreign currency or if the counterparties do not perform under the contract’s terms.
Expense/Classes – Expenses that are directly related to one Fund of the Trust are charged directly to that Fund.
| | |
22 | | Causeway Emerging Markets Fund |
NOTES TO FINANCIAL STATEMENTS
(continued)
Other operating expenses of the Trust are prorated to the Fund and the other series of the Trust on the basis of relative daily net assets. Class specific expenses are borne by that class of shares. Income, realized and unrealized gains/losses and non-class specific expenses are allocated to the respective classes on the basis of relative daily net assets.
Dividends and Distributions – Dividends from net investment income, if any, are declared and paid on an annual basis. Any net realized capital gains on sales of securities are distributed to shareholders at least annually.
Redemption Fee –The Fund imposes a redemption fee of 2% on the value of capital shares redeemed by shareholders less than 60 days after purchase. The redemption fee does not apply to shares purchased through reinvested distributions or shares redeemed through designated systematic withdrawal plans. The redemption fee does not normally apply to omnibus account arrangements through financial intermediaries where the purchase and sale orders of a number of persons are aggregated before being communicated to the Fund. However, the Fund seeks agreements with these intermediaries to impose the Fund’s redemption fee or a different redemption fee on their customers if feasible, or to impose other appropriate restrictions on excessive short-term trading. The officers of the Fund may waive the redemption fee for shareholders in asset allocation and similar investment programs reasonably believed not to be engaged in short-term market timing, including for holders of shares purchased by Causeway Capital Management LLC (the “Adviser”) for its clients to rebalance their portfolios. The Fund’s redemption fee also does not apply to shares redeemed by Causeway International Opportunities Fund, which is a fund-of-funds that invests in the Fund. For the year
ended September 30, 2011, the Institutional Class and Investor Class retained $— and $15,262 in redemption fees, respectively.
| 3. | Investment Advisory, Administration, Shareholder Service and Distribution Agreements |
The Trust, on behalf of the Fund, has entered into an Investment Advisory Agreement (the “Advisory Agreement”) with the Adviser. Under the Advisory Agreement, the Adviser is entitled to a monthly fee equal to an annual rate of 1.00% of the Fund’s average daily net assets. The Adviser contractually agreed through January 31, 2012 to waive its fee and, to the extent necessary, reimburse the Fund to keep total annual fund operating expenses (excluding brokerage fees and commissions, interest, taxes, shareholder service fees, fees and expenses of other funds in which the Fund invests, and extraordinary expenses) from exceeding 1.35% of Institutional Class and Investor Class average daily net assets. For the year ended September 30, 2011, the Adviser waived $122,240.
The Trust and SEI Investments Global Funds Services (the “Administrator”) have entered into an Administration Agreement. Under the terms of the Administration Agreement, the Administrator is entitled to an annual fee which is calculated daily and paid monthly based on the aggregate average daily net assets of the Trust as follows: 0.06% up to $1 billion; 0.05% of the assets exceeding $1 billion up to $2 billion; 0.04% of the assets exceeding $2 billion up to $3 billion; 0.03% of the assets exceeding $3 billion up to $4 billion; and 0.02% of the assets exceeding $4 billion. The Fund is subject to a minimum annual fee of $30,000. If the Fund has three or more share classes, it is subject to an additional minimum fee of $20,000 per additional share class (over two).
| | |
Causeway Emerging Markets Fund | | 23 |
NOTES TO FINANCIAL STATEMENTS
(continued)
The Trust has adopted a Shareholder Service Plan and Agreement for Investor Class shares that allows the Trust to pay broker-dealers and other financial intermediaries a fee of up to 0.25% per annum of average daily net assets for services provided to Investor Class shareholders. For the year ended September 30, 2011, the Investor Class paid 0.20% of average daily net assets under this plan.
The Trust and SEI Investments Distribution Co. (the “Distributor”) have entered into a Distribution Agreement. The Distributor receives no fees from the Fund for its distribution services under this agreement.
The officers of the Trust are also officers or employees of the Administrator or Adviser. They receive no fees for serving as officers of the Trust.
| 4. | Investment Transactions |
The cost of security purchases and the proceeds from sales of securities, other than short-term investments, during the year ended September 30, 2011, for the Fund were as follows:
| | | | | | |
| | | Purchases
(000) | | Sales
(000) | | |
| | $114,908 | | $49,061 | |
| | | | | |
| 5. | Risks of Foreign Investing |
Because the Fund invests most of its assets in foreign securities, the Fund is subject to further risks. For example, the value of the Fund’s securities may be affected by social, political and economic developments and U.S. and foreign laws relating to foreign investment. Further, because the Fund invests in securities denominated in foreign currencies, the Fund’s securities may go down in value depending on foreign exchange rates. Other risks include trading, settlement, custodial, and other operational risks; withholding or other taxes; and the less stringent investor protection and disclosure standards of some foreign markets.
All of these factors can make foreign securities less liquid, more volatile and harder to value than U.S. securities. These risks are higher for emerging markets investments.
| 6. | Federal Tax Information |
The Fund is classified as a separate taxable entity for Federal income tax purposes. The Fund intends to continue to qualify as a separate “regulated investment company” under Subchapter M of the Internal Revenue Code and make the requisite distributions to shareholders that will be sufficient to relieve it from Federal income tax and Federal excise tax. Therefore, no Federal tax provision is required. To the extent that dividends from net investment income and distributions from net realized capital gains exceed amounts reported in the financial statements, such amounts are reported separately.
The Fund may be subject to taxes imposed by countries in which it invests in issuers existing or operating in such countries. Such taxes are generally based on income earned. The Fund accrues such taxes when the related income is earned. Dividend and interest income is recorded net of non-U.S. taxes paid. Gains realized by the Fund on the sale of securities in certain countries are subject to non-U.S. taxes. The Fund records a liability based on unrealized gains to provide for potential non-U.S. taxes payable upon the sale of these securities. For the year ended September 30, 2011, non-U.S. taxes paid on realized gains were $5,343 and non-U.S. taxes accrued on unrealized gains were $75,241.
The amounts of distributions from net investment income and net realized capital gains are determined in accordance with Federal income tax regulations, which may differ from those amounts determined under generally accepted accounting principles in the United States of America. These book/tax differences are either temporary or permanent in nature. The character of
| | |
24 | | Causeway Emerging Markets Fund |
NOTES TO FINANCIAL STATEMENTS
(continued)
distributions made during the year from net investment income or net realized gains, and the timing of distributions made during the year may differ from the year that the income or realized gains (losses) were recorded by the Fund. To the extent these differences are permanent, adjustments are made to the appropriate equity accounts in the period that the differences arise.
Accordingly, the following permanent differences, which are primarily due to realized losses on foreign currency transactions and reclassifications of realized gains from passive foreign investment companies, were reclassified to/(from) the following accounts as of September 30, 2011 (000):
| | | | | | |
| | | Undistributed
Net Investment
Income | | Accumulated
Net Realized
Gain | | |
| | $ (141) | | $ 141 | | |
| | | | | | |
These reclassifications had no impact on net assets or net asset value per share.
The tax character of dividends and distributions declared during the fiscal years ended September 30, 2011, and September 30, 2010 were as follows (000):
| | | | | | | | | | | | |
| | | Ordinary
Income | | | Long-Term
Capital Gain | | | Total | |
2011 | | $ | 732 | | | $ | — | | | $ | 732 | |
2010 | | | 768 | | | | — | | | | 768 | |
| | | | | | | | | | | | |
As of September 30, 2011, the components of accumulated losses on a tax basis were as follows (000):
| | | | |
Undistributed Ordinary Income | | $ | 1,098 | |
Capital Loss Carryforwards | | | (8,489 | ) |
Unrealized Depreciation | | | (15,004 | ) |
Post-October Currency Losses | | | (95 | ) |
| | | | |
Total Accumulated Losses | | $ | (22,490 | ) |
| | | | |
Post-October Capital and Currency Losses represent losses realized on securities and currency transactions from November 1, 2010 through September 30, 2011
that, in accordance with Federal income tax regulations, the Fund may elect to defer and treat as having arisen in the following fiscal year.
For Federal income tax purposes, capital loss carryforwards represent realized losses that the Fund may carryforward for a maximum period of eight years and apply against future net realized gains. The following summarizes the capital loss carryforwards as of September 30, 2011 (000):
| | | | | | |
Expiring in Fiscal Year | | Amount | | | |
2017 | | $ | 1,421 | | |
2018 | | | 7,068 | | |
| | | | | |
| Total capital loss carryforwards | | $ | 8,489 | | |
| | | | | | |
For the year ended September 30, 2011, the Fund used $1,485,153 of capital loss carryforwards.
Under the recently enacted Regulated Investment Company Modernization Act of 2010, the Fund will be permitted to carry forward capital losses incurred in taxable years beginning after December 22, 2010 for an unlimited period. However, any losses incurred during those future taxable years will be required to be used prior to the losses incurred in pre-enactment taxable years. As a result of this ordering rule, pre-enactment capital loss carryforwards may be more likely to expire unused. Additionally, post-enactment capital losses that are carried forward will retain their character as either short-term or long-term capital losses rather than being considered all short-term as under previous law.
At September 30, 2011, the total cost of securities for Federal income tax purposes and the aggregate gross unrealized appreciation and depreciation on investment securities for the Fund were as follows (000):
| | | | | | | | | | | | |
Federal
Tax Cost | | Appreciated
Securities | | | Depreciated
Securities | | | Net
Unrealized
Depreciation | |
| $95,480 | | $ | 319 | | | $ | (15,198 | ) | | $ | (14,879 | ) |
| | | | | | | | | | | | |
| | |
Causeway Emerging Markets Fund | | 25 |
NOTES TO FINANCIAL STATEMENTS
(concluded)
| 7. | Capital Shares Issued and Redeemed (000) |
| | | | | | | | | | | | | | | | |
| | | Year Ended
September 30, 2011 | | | Year Ended
September 30, 2010 | |
| | | Shares | | | Value | | | Shares | | | Value | |
Institutional Class: | | | | | | | | | | | | | | | | |
Shares Sold | | | 3,954 | | | $ | 43,814 | | | | 45 | | | $ | 429 | |
Shares Issued in Reinvestment of Dividends and Distributions | | | 39 | | | | 462 | | | | 62 | | | | 595 | |
Shares Redeemed | | | (223 | ) | | | (2,565 | ) | | | (1,408 | ) | | | (13,941 | ) |
| | | | | | | | | | | | | | | | |
Increase (Decrease) in Shares Outstanding Derived from Institutional Class Transactions | | | 3,770 | | | | 41,711 | | | | (1,301 | ) | | | (12,917 | ) |
| | | | | | | | | | | | | | | | |
Investor Class: | | | | | | | | | | | | | | | | |
Shares Sold | | | 2,911 | | | | 35,079 | | | | 583 | | | | 5,888 | |
Shares Issued in Reinvestment of Dividends and Distributions | | | 21 | | | | 252 | | | | 17 | | | | 156 | |
Shares Redeemed | | | (858 | ) | | | (10,058 | ) | | | (253 | ) | | | (2,447 | ) |
| | | | | | | | | | | | | | | | |
Increase in Shares Outstanding Derived from Investor Class Transactions | | | 2,074 | | | | 25,273 | | | | 347 | | | | 3,597 | |
| | | | | | | | | | | | | | | | |
Increase (Decrease) in Shares Outstanding from Capital Share Transactions | | | 5,844 | | | $ | 66,984 | | | | (954 | ) | | $ | (9,320 | ) |
| | | | | | | | | | | | | | | | |
| 8. | Significant Shareholder Concentration |
As of September 30, 2011, two of the Fund’s shareholders owned 75% of net assets in the Institutional Class.
| 9. | New Accounting Pronouncements |
In May 2011, the Financial Accounting Standards Board issued ASU No. 2011-04 “Amendments to Achieve Common Fair Value Measurement and Disclosure Requirements in U.S. GAAP and International Financial Reporting Standards (“IFRS”).” ASU 2011-04 includes common requirements for measurement of and disclosure about fair value between U.S. GAAP and IFRS. ASU 2011-04 will require reporting entities to disclose the following information for fair value measurements categorized within Level 3 of the fair value hierarchy: quantitative information about the unobservable inputs used in the fair value measurement, the valuation processes used
by the reporting entity, and a narrative description of the sensitivity of the fair value measurement to changes in unobservable inputs and the interrelationships between those unobservable inputs. In addition, ASU 2011-04 will require reporting entities to make disclosures about amounts and reasons for all transfers in and out of Level 1 and Level 2 fair value measurements. The new and revised disclosures are effective for interim and annual reporting periods beginning after December 15, 2011. At this time, management is evaluating the implications of ASU 2011-04 and its impact on the financial statements.
The Fund has evaluated the need for disclosures and/or adjustments resulting from subsequent events through the date the financial statements were issued. Based on this evaluation, no adjustments were required to the financial statements.
| | |
26 | | Causeway Emerging Markets Fund |
REPORT OF INDEPENDENT REGISTERED PUBLIC ACCOUNTING FIRM
To the Board of Trustees and Shareholders of
Causeway Emerging Markets Fund
In our opinion, the accompanying statement of assets and liabilities, including the schedule of investments, and the related statements of operations and of changes in net assets and the financial highlights present fairly, in all material respects, the financial position of Causeway Emerging Markets Fund (the “Fund”) at September 30, 2011, the results of its operations for the year then ended, the changes in its net assets for each of the two years in the period then ended and its financial highlights for each of the periods presented, in conformity with accounting principles generally accepted in the United States of America. These financial statements and financial highlights (hereafter referred to as “financial statements”) are the responsibility of the Fund’s management. Our responsibility is to express an opinion on these financial statements based on our audits. We conducted our audits of these financial statements in accordance with the standards of the Public Company Accounting Oversight Board (United States). Those standards require that we plan and perform the audit to obtain reasonable assurance about whether the financial statements are free of material misstatement. An audit includes examining, on a test basis, evidence supporting the amounts and disclosures in the financial statements, assessing the accounting principles used and significant estimates made by management, and evaluating the overall financial statement presentation. We believe that our audits, which included confirmation of securities at September 30, 2011 by correspondence with the custodian and brokers, provide a reasonable basis for our opinion.
PricewaterhouseCoopers LLP
Los Angeles, California
November 28, 2011
| | |
Causeway Emerging Markets Fund | | 27 |
NOTICE TO SHAREHOLDERS (Unaudited)
The information set forth below is for the Fund’s fiscal year as required by federal laws. Shareholders, however, must report distributions on a calendar year basis for income tax purposes, which may include distributions for portions of two fiscal years of the Fund. Accordingly, the information needed by shareholders for income tax purposes will be sent to them in early 2012. Please consult your tax adviser for proper treatment of this information.
For the fiscal year ended September 30, 2011, the Fund is designating the following items with regard to distributions paid during the year:
| | | | | | | | | | | | | | | | | | |
| | (A) | | | | (B) | | | | (C) | | | | (D ) | | | | (E ) | |
| | | | |
Long Term Capital Gains Distributions (Tax Basis) | | | Ordinary
Income
Distributions
(Tax Basis) | | | Tax Exempt
Distributions
(Tax Basis) | | | Total
Distributions
(Tax Basis) | | | Dividends (1)
for Corporate
Dividends Received
Deduction | |
| | 0.00 | % | | | 100.00 | % | | | 0.00 | % | | | 100.00 | % | | | 0.00 | % |
| | | | |
| | (F) | | | | (G ) | | | | (H) | | | | (I ) | | | | | |
| | | | |
Qualified Dividend Income | | | Foreign
Tax
Credit | | | Interest
Related
Dividends | | | Qualified
Short-Term
Capital
Gain
Dividends | | | | |
| | 75.09 | % | | | 21.55 | % | | | 0.00 | % | | | 0.00 | % | | | | |
Foreign taxes accrued during the fiscal year ended September 30, 2011, amounted to $201,119 and are expected to be passed through to shareholders as foreign tax credits on Form 1099 – Dividend for the year ending December 31, 2011. In addition, for the fiscal year ended September 30, 2011, gross income derived from sources within foreign countries amounted to $1,315,401 for the Fund.
| (1) | Qualified Dividends represent dividends which qualify for the corporate dividends received deduction. |
Items (A), (B), (C) and (D) are based on a percentage of the Fund’s total distribution including pass-through as foreign tax credit.
Item (E) is based on a percentage of ordinary income distributions of the Fund.
Item (F) represents the amount of “Qualified Dividend Income” as defined in the Jobs and Growth Tax Relief Reconciliation Act of 2003 and is reflected as a percentage of “Ordinary Income Distributions”. It is the Fund’s intention to designate the maximum amount permitted by the law up to 100%.
Item (G) is based on a percentage of ordinary income distributions of the Fund.
Item (H) is the amount of “Interest Related Dividends” as created by the American Jobs Creation Act of 2004 and is reflected as a percentage of net investment income distributions that is exempt from U.S. withholding tax when paid to foreign investors.
Item (I) is the amount of “Qualified Short-Term Capital Gain Dividends” as created by the American Jobs Creation Act of 2004 and is reflected as a percentage of short-term capital gain distributions that is exempt from U.S. withholding tax when paid to foreign investors.
| | |
28 | | Causeway Emerging Markets Fund |
TRUSTEES AND OFFICERS INFORMATION (Unaudited)
Information pertaining to the Trustees and officers of the Trust is set forth below. Trustees who are not deemed to be “interested persons” of the Trust as defined in the 1940 Act are referred to as “Independent Trustees.” The Trustee who is deemed to be an “interested person” of the Trust is referred to as an “Interested Trustee.” The Trust’s Statement of Additional Information (“SAI”) includes additional information about the Trustees and officers. The SAI may be obtained without charge by calling 1-866-947-7000.
| | | | | | | | | | |
Name Address, Age1 | | Position(s)
Held with the
Company | | Term of Office and Length of Time Served2 | | Principal Occupation(s) During Past Five Years | | Number of
Portfolios
in Trust
Complex
Overseen by
Trustee3 | | Other Directorships
Held by Trustee4 |
INDEPENDENT TRUSTEES | | | | | | | | | | |
| | | | | |
John A. G. Gavin Age: 80 | | Trustee; Chairman of the Board | | Trustee since 9/01; Chairman since 10/04 | | Chairman, Gamma Holdings (international consulting and investment holding company) (since 1968); Senior Counselor, Hicks TransAmerica Partners (private equity investment firm) (since 2001). | | 5 | | Director, TCW Funds, Inc. and TCW Strategic Income Fund, Inc.; Trustee, Hotchkis and Wiley Funds |
| | | | | |
John R. Graham Age: 50 | | Trustee | | Since 10/08 | | Film Composer (since 2005); Senior Vic President, Corporate Financial Development and Communications, The Walt Disney Company (2004-2005); Senior Vice President, Mergers and Acquisitions, Lehman Brothers Inc. (2000-2004). | | 5 | | none |
| | | | | |
Lawry J. Meister Age: 49 | | Trustee | | Since 10/08 | | President, Steaven Jones Development Company, Inc. (real estate firm) (since 1995). | | 5 | | none |
| | | | | |
Eric H. Sussman Age: 45 | | Trustee; Chairman of the Audit Committee | | Trustee since 9/01; Chairman since 10/04 | | Tenured Lecturer, Anderson Graduate School of Management, University of California, Los Angeles (since 1995); President, Amber Capital, Inc. (real estate investment and financial planning firm) (since 1993). | | 5 | | Trustee, Presidio Funds (until 2010) |
| | | | | |
INTERESTED TRUSTEE5 | | | | | | | | | | |
| | | | | |
Mark D. Cone Age: 43 | | Trustee | | Since 10/08 | | Executive Vice President and Chief Marketing Officer of the Adviser (since 2001). | | 5 | | none |
| | |
Causeway Emerging Markets Fund | | 29 |
TRUSTEES AND OFFICERS INFORMATION (Unaudited)
(continued)
| | | | | | | | | | |
Name Address, Age1 | | Position(s) Held with the
Company | | Term of Office and Length of Time Served2 | | Principal Occupation(s) During Past Five Years | | Number of
Portfolios
in Trust
Complex
Overseen by
Trustee3 | | Other
Directorships
Held by
Trustee4 |
OFFICERS | | | | | | | | | | |
| | | | | |
Turner Swan 11111 Santa Monica Blvd., 15th Floor Los Angeles, CA 90025 Age: 49 | | President | | Since 8/01 | | General Counsel, Secretary, and Member of the Adviser (since 2001); Compliance Officer of the Adviser (since 2010). | | N/A | | N/A |
| | | | | |
Gracie V. Fermelia 11111 Santa Monica Blvd., 15th Floor Los Angeles, CA 90025 Age: 49 | | Chief Compliance Officer and Assistant Secretary | | CCO since 7/05; Asst. Sect. since 8/01 | | Chief Compliance Officer of the Adviser (since July 2005); Chief Operating Officer and Member of the Adviser (since 2001). | | N/A | | N/A |
| | | | | |
Michael Lawson6 One Freedom Valley Drive Oaks, PA 19456 Age: 50 | | Treasurer | | Since 7/05 | | Director of the Administrator’s Fund Accounting department (since July 2005); Manager in the Administrator’s Fund Accounting department (November 1998 to July 2005). | | N/A | | N/A |
| | | | | |
Gretchen W. Corbell 11111 Santa Monica Blvd., 15th Floor Los Angeles, CA 90025 Age: 40 | | Secretary | | Since 10/11 | | Associate Attorney of the Adviser (since 2004). | | N/A | | N/A |
| | | | | |
Dianne Sulzbach6 One Freedom Valley Drive Oaks, PA 19456 Age: 34 | | Vice President and Assistant Secretary | | Since 8/11 | | Corporate Counsel of the Administrator (since 2011); Associate Counsel, Morgan Lewis & Bockius (2006-2010). | | N/A | | N/A |
| | | | | |
Carolyn F. Mead6 One Freedom Valley Drive Oaks, PA 19456 Age: 54 | | Vice President and Assistant Secretary | | Since 7/08 | | Corporate Counsel of the Administrator (since 2007); Associate Counsel, Stradley, Ronan, Stevens & Young LLP (2004-2007). | | N/A | | N/A |
| | |
30 | | Causeway Emerging Markets Fund |
TRUSTEES AND OFFICERS INFORMATION (Unaudited)
(concluded)
| | | | | | | | | | |
Name Address, Age1 | | Position(s) Held with the
Company | | Term of Office and Length of Time Served2 | | Principal Occupation(s) During Past Five Years | | Number of
Portfolios in Trust
Complex
Overseen by
Trustee3 | | Other
Directorships
Held by
Trustee4 |
Bernadette Sparling6 One Freedom Valley Drive Oaks, PA 19456 Age: 34 | | Vice President and Assistant Secretary | | Since 7/08 | | Corporate Counsel of the Administrator (since 2005); Associate Counsel, Blank Rome LLP (2001-2005). | | N/A | | N/A |
| 1 | Each Trustee may be contacted by writing to the Trustee c/o Causeway Capital Management Trust, One Freedom Valley Drive, Oaks, PA 19456. |
| 2 | Each Trustee holds office during the lifetime of the Trust or until his or her sooner resignation, retirement, removal, death or incapacity in accordance with the Trust’s Declaration of Trust. The president, treasurer and secretary each holds office at the pleasure of the Board of Trustees or until he or she sooner resigns in accordance with the Trust’s Bylaws. |
| 3 | The “Trust Complex” consists of all registered investment companies for which Causeway Capital Management LLC serves as investment adviser. As of September 30, 2010, the Trust Complex consisted of one investment company with five portfolios — International Value Fund, Emerging Markets Fund, Global Value Fund, International Opportunities Fund and Global Absolute Return Fund. |
| 4 | Directorships of companies required to report to the Securities and Exchange Commission under the Securities Exchange Act of 1934 (i.e., “public companies”) or other investment companies registered under the 1940 Act. |
| 5 | Mr. Cone is considered an “interested person” of the Trust as defined in the 1940 Act because he is an employee of the Adviser. |
| 6 | These officers of the Trust also serve as officers of one or more mutual funds for which SEI Investments Company or an affiliate acts as investment manager, administrator or distributor. |
| | |
Causeway Emerging Markets Fund | | 31 |
DISCLOSURE OF FUND EXPENSES (Unaudited)
As a shareholder of the Fund, you incur two types of costs: (1) transaction costs, including redemption fees, and (2) ongoing costs, including management fees, shareholder service fees, and other Fund expenses. It is important for you to understand the impact of these costs on your investment returns.
Ongoing operating expenses are deducted from a mutual fund’s gross income and directly reduce its final investment return. These expenses are expressed as a percentage of a mutual fund’s average net assets; this percentage is known as a mutual fund’s expense ratio.
The following examples use the expense ratio and are intended to help you understand the ongoing costs (in dollars) of investing in the Fund and to compare these costs with those of other mutual funds. The examples are based on an investment of $1,000 made at the beginning of the period shown and held for the entire period.
The table on the next page illustrates the Fund’s costs in two ways:
Actual Fund Return. This section helps you to estimate the actual expenses after fee waivers that the Fund incurred over the period. The “Expenses Paid During Period” column shows the actual dollar expense cost incurred by a $1,000 investment in the Fund, and the “Ending Account Value” number is derived from deducting that expense cost from the Fund’s gross investment return.
You can use this information, together with the actual amount you invested in the Fund, to estimate the expenses you paid over that period. Simply divide your actual account value by $1,000 to arrive at a ratio (for example, an $8,600 account value divided by $1,000 = 8.6), then multiply that ratio by the number shown under “Expenses Paid During Period.”
Hypothetical 5% Return. This section helps you compare the Fund’s costs with those of other mutual funds. It assumes that the Fund had an annual 5% return before expenses during the year, but that the expense ratio (Column 3) for the period is unchanged. This example is useful in making comparisons because the Securities and Exchange Commission requires all mutual funds to make this 5% calculation. You can assess the Fund’s comparative cost by comparing the hypothetical result for the Fund in the “Expenses Paid During Period” column with those that appear in the same charts in the shareholder reports for other mutual funds.
NOTE: Because the return is set at 5% for comparison purposes — NOT the Fund’s actual return — the account values shown may not apply to your specific investment.
| | |
32 | | Causeway Emerging Markets Fund |
DISCLOSURE OF FUND EXPENSES (Unaudited)
(concluded)
| | | | | | | | | | | | | | | | |
| | | Beginning
Account
Value
4/1/11 | | | Ending
Account
Value
9/30/11 | | | Annualized
Expense
Ratios | | | Expenses
Paid
During
Period* | |
Causeway Emerging Markets Fund | | | | | | | | | | | | | | | | |
Actual Fund Return | | | | | | | | | | | | | | | | |
Institutional Class | | $ | 1,000.00 | | | $ | 757.30 | | | | 1.35 | % | | $ | 5.95 | |
Hypothetical 5% Return | | | | | | | | | | | | | | | | |
Institutional Class | | $ | 1,000.00 | | | $ | 1,018.29 | | | | 1.35 | % | | $ | 6.84 | |
Causeway Emerging Markets Fund | | | | | | | | | | | | | | | | |
Actual Fund Return | | | | | | | | | | | | | | | | |
Investor Class | | $ | 1,000.00 | | | $ | 756.60 | | | | 1.55 | % | | $ | 6.82 | |
Hypothetical 5% Return | | | | | | | | | | | | | | | | |
Investor Class | | $ | 1,000.00 | | | $ | 1,017.30 | | | | 1.55 | % | | $ | 7.84 | |
| * | Expenses are equal to the Fund’s annualized expense ratio multiplied by the average account value over the period, multiplied by 183/365 (to reflect the one-half year period). |
| | |
Causeway Emerging Markets Fund | | 33 |
STATEMENT REGARDING BASIS FOR APPROVAL OF INVESTMENT ADVISORY AGREEMENT (Unaudited)
Section 15(c) of the Investment Company Act of 1940, as amended (the “1940 Act”) requires the Board of Trustees (the “Board”) of Causeway Capital Management Trust (the “Trust”) annually to approve continuance of the investment advisory agreement (the “Advisory Agreement”) between the Trust and Causeway Capital Management LLC (the “Adviser”) with respect to Causeway Emerging Markets Fund (the “Fund”). Continuance of the Advisory Agreement must be approved by a majority of the Trustees and a majority of the independent Trustees (i.e., Trustees who are not “interested persons” of the Trust as defined in the 1940 Act).The Board was comprised of four independent Trustees and one interested Trustee when the continuation of the Advisory Agreement was considered.
Information Received. At each regular quarterly meeting, the Board reviews a wide variety of materials relating to the nature, extent and quality of the Adviser’s services, including information concerning the Fund’s performance. At least annually, the Board is provided with additional quantitative and qualitative information to assist it in evaluating whether to approve the continuance of the Advisory Agreement. The Board met on August 1, 2011, to consider whether to approve the continuance of the Advisory Agreement for an additional one-year period. In connection with the meeting, the Trustees received and reviewed extensive materials prepared by the Adviser relating to the Advisory Agreement in response to information requested on the independent Trustees’ behalf by their independent legal counsel.
Factors Considered. In reviewing the Advisory Agreement, the Trustees considered a number of factors including, but not limited to: (1) the nature, extent and quality of the services to be provided by the Adviser, (2) the investment performance of the Fund, (3) comparisons of the services to be rendered and the amounts to be paid under the Advisory Agreement with those of other funds and those of the Adviser under other investment advisory agreements with other registered investment companies and other types of clients, (4) the costs of the services to be provided and estimated profits to be realized by the Adviser and its affiliates from their relationship with the Fund, (5) the extent to which economies of scale would be realized as the Fund grows and whether fee levels reflect these economies of scale for the benefit of Fund investors, and (6) any other benefits derived by the Adviser from its relationship with the Fund.
First, regarding the nature, extent and quality of the services to be provided by the Adviser, the Trustees considered, among other things, the Adviser’s personnel, experience, track record and compliance program. The Trustees considered the qualifications, backgrounds and responsibilities of the Adviser’s principal personnel who provide services to the Fund, as well as the level of attention those individuals provide to the Fund. The Trustees noted the Adviser’s commitment to devoting resources to staffing and technology in support of its investment management services. They also reviewed the Adviser’s investment philosophy and processes and its compliance program, and considered the scope of the Adviser’s services. The Trustees concluded that the nature, extent and quality of the services provided by the Adviser have benefited and will continue to benefit the Fund and its shareholders.
| | |
34 | | Causeway Emerging Markets Fund |
STATEMENT REGARDING BASIS FOR APPROVAL OF INVESTMENT ADVISORY AGREEMENT (Unaudited) (continued)
Second, regarding the investment performance of the Fund, the Trustees reviewed the investment results of the Fund’s Institutional and Investor share classes for various periods ended June 30, 2011, compared to the MSCI Emerging Markets Index (the “Index”) and the mutual funds included in the Morningstar U.S. Open End Diversified Emerging Markets funds category of funds. They noted that that the Fund had outperformed the Index and the Morningstar category averages for the one-year, three-year, and since inception periods. The Trustees concluded that the Adviser’s record in managing the Fund indicates that its continued management will benefit the Fund and its shareholders.
Third, the Trustees compared the Fund’s advisory fee and total expenses with those of other similar mutual funds. They noted that the Fund’s advisory fee is below the average and median advisory fees charged by funds in the Morningstar U.S. Open End Diversified Emerging Markets funds category, and its expense ratios, after application of the Adviser’s expense limit agreement, are well below the average and median of the funds in that Morningstar category. The Trustees noted that the Adviser does not currently manage assets of other clients pursuant to its emerging markets equity strategy, but compared the Fund’s advisory fee with the standard advisory fee offered by the Adviser to separate account clients. The Trustees noted that, although the separate account fee is lower than the advisory fee paid by the Fund, for accounts with assets over $100 million, the differences appropriately reflected the Adviser’s significantly greater responsibilities with respect to the Fund, which include the provision of many additional administrative and shareholder services (such as services related to the Fund’s disclosure documents, financial statements, 1940 Act compliance policies and procedures, preparation of Board and committee materials and meetings, annual Board reports and certifications, participation in regulatory examinations and legal and compliance matters, oversight of daily valuation, oversight of Fund service providers, negotiation of Fund intermediary agreements, coordination with Fund intermediaries providing shareholder recordkeeping services, shareholder communications, and due diligence for advisers, consultants and institutional investors). The Trustees concluded that the Fund’s advisory fee and expense ratio are reasonable and appropriate under the circumstances.
Fourth, the Trustees considered the Adviser’s costs of providing services to the Fund and estimated profits realized by the Adviser from its relationship with the Fund. They reviewed the Adviser’s estimated after-tax profit margin with respect to such services and the methodology used to generate that estimate, and noted that the cost allocation methodology presented to the Trustees is reasonable. They noted that, due to the expense limit agreement, the Adviser experienced significant losses managing the Fund in the past year, and that the Adviser’s sponsorship of the Fund, at least in the Fund’s early years, could involve further expenses to the Adviser.
Fifth, regarding economies of scale, the Trustees observed that, although the Fund’s advisory fee schedule does not contain fee breakpoints, it is difficult to determine the existence or extent of any economies of scale. They noted that the Adviser is sharing economies of scale through reasonable advisory fee levels, the expense limit agreement, and devoting additional resources to staff and technology to focus on continued performance and service to the Fund’s shareholders. They also noted that the Adviser, at least in the Fund’s early years, would incur significant losses in managing the Fund. The Trustees concluded that under the circumstances the Adviser is sharing any economies of scale with the Fund appropriately.
| | |
Causeway Emerging Markets Fund | | 35 |
STATEMENT REGARDING BASIS FOR APPROVAL OF INVESTMENT ADVISORY AGREEMENT (Unaudited) (concluded)
Sixth, regarding any other benefits derived by the Adviser from its relationship with the Fund – often called “fall-out” benefits – the Trustees observed that the Adviser does not earn common “fall-out” benefits such as affiliated custody fees, affiliated transfer agency fees, affiliated brokerage commissions, profits from rule 12b-1 fees, “contingent deferred sales commissions” or “float” benefits on short-term cash. The Trustees concluded that the primary “fall-out” benefit received by the Adviser is research services provided by brokers used by the Fund and that this benefit is reasonable in relation to the value of the services that the Adviser provides to the Fund.
Approval. At the August 1, 2011 meeting, the Trustees considered the approval of the Advisory Agreement and discussed the information and factors noted above with representatives of the Adviser. The independent Trustees also met in a private session with independent counsel at which no representatives of the Adviser were present. In their deliberations, the independent Trustees did not identify any particular information or factor that was determinative or controlling, and the foregoing summary does not detail all the matters considered. Based on their review, the Trustees (including the independent Trustees) unanimously concluded that the Advisory Agreement is fair and reasonable to the Fund and its shareholders, the Fund’s advisory fee is reasonable and renewal of the Advisory Agreement is in the best interests of the Fund and its shareholders, and the Board of Trustees approved the renewal of the Advisory Agreement for a twelve-month period beginning September 20, 2011.
| | |
36 | | Causeway Emerging Markets Fund |
INVESTMENT ADVISER
Causeway Capital Management LLC
11111 Santa Monica Blvd.
15th Floor
Los Angeles, CA 90025
DISTRIBUTOR
SEI Investments Distribution Co.
One Freedom Valley Drive
Oaks, Pennsylvania 19456
TO OBTAIN MORE INFORMATION
Call 1-866-947-7000 or visit us online at
www.causewayfunds.com
This material must be preceded or accompanied by a current prospectus.
The Fund files its complete schedule of portfolio holdings with the Securities and Exchange Commission (“Commission”) for the first and third quarters of each fiscal year on Form N-Q within sixty days after the end of the period. The Fund’s Forms N-Q are available on the Commission’s website at http://www.sec.gov, and may be reviewed and copied at the Commission’s Public Reference Room in Washington, DC. Information on the operation of the Public Reference Room may be obtained by calling 1-800-SEC-0330.
A description of the policies and procedures that the Fund uses to determine how to vote proxies relating to portfolio securities, as well as information relating to how the Trust voted proxies relating to portfolio securities during the most recent 12-month period ended June 30, is available (i) without charge, upon request, by calling 1-866-947-7000; and (ii) on the Commission’s website at http://www.sec.gov.
CCM-AR-002-0500
The registrant has adopted a code of ethics that applies to the registrant’s principal executive officer, principal financial officer and principal accounting officer. During the fiscal year ended September 30, 2011, there were no material changes or waivers to the code of ethics.
| Item 3. | Audit Committee Financial Expert. |
(a)(1) The registrant’s board of trustees has determined that the registrant has at least one audit committee financial expert serving on the audit committee.
(a)(2) The audit committee financial expert is Eric Sussman. Mr. Sussman is independent as defined in Form N-CSR Item 3(a)(2).
| Item 4. | Principal Accountant Fees and Services. |
Aggregate fees billed to the registrant for professional services rendered by the registrant’s principal accountant for the fiscal years ended September 30, 2011 and 2010 were as follows:
| | | | | | | | | | |
| | | 2011 | | | 2010 | |
| (a) | | Audit Fees | | $ | 166,895 | | | $ | 131,900 | |
| (b) | | Audit-Related Fees | | | None | | | | None | |
| (c) | | Tax Fees(1) | | $ | 42,700 | | | $ | 27,700 | |
| (d) | | All Other Fees | | | None | | | | None | |
Note:
| (1) | Tax fees include amounts related to tax return and excise tax calculation reviews and foreign tax reclaim analysis. |
(e)(1) The registrant’s audit committee has adopted a charter that requires it to pre-approve the engagement of auditors to (i) audit the registrant’s financial statements, (ii) provide other audit or non-audit services to the registrant, or (iii) provide non-audit services to the registrant’s investment adviser if the engagement relates directly to the operations and financial reporting of the registrant.
(e)(2) No services included in paragraphs (b) through (d) of this Item were approved by the audit committee pursuant to paragraph (c)(7)(i)(C) of Rule 2-01 of Regulation S-X.
(f) Not applicable.
(g) For the fiscal year ended September 30, 2011, the aggregate non-audit fees billed by the registrant’s accountant for services rendered to the registrant and the registrant’s investment adviser were $42,700 and $178,492, respectively. For the fiscal year ended September 30, 2010, the aggregate non-audit fees billed by the registrant’s accountant for services rendered to the registrant and the registrant’s investment adviser were $27,700 and $168,975, respectively.
(h) The audit committee considered whether the provision of non-audit services rendered to the registrant’s investment adviser by the registrant’s principal accountant that were not pre-approved pursuant to paragraph (c)(7)(ii) of Rule 2-01 of Regulation S-X was compatible with maintaining the principal accountant’s independence.
| Item 5. | Audit Committee of Listed Registrants. |
Not applicable to open-end management investment companies.
| Item 6. | Schedule of Investments |
See Item 1.
| Item 7. | Disclosure of Proxy Voting Policies and Procedures for Closed-End Management Investment Companies. |
Not applicable to open-end management investment companies.
| Item 8. | Portfolio Managers of Closed-End Management Investment Companies |
Not applicable to open-end management investment companies.
| Item 9. | Purchases of Equity Securities by Closed-End Management Investment Company and Affiliated Purchasers. |
Not applicable to open-end management investment companies.
| Item 10. | Submission of Matters to a Vote of Security Holders. |
There have been no material changes to the registrant’s procedures by which shareholders may recommend nominees to the registrant’s board of trustees since the registrant’s last filing on Form N-CSR.
| Item 11. | Controls and Procedures. |
(a) The certifying officers, whose certifications are included herewith, have evaluated the registrant’s disclosure controls and procedures within 90 days of the filing date of this report. In their opinion, based on their evaluation, the registrant’s disclosure controls and procedures are adequately designed, and are operating effectively to ensure, that information required to be disclosed by the registrant in the reports it files or submits under the Securities Exchange Act of 1934 is recorded, processed, summarized and reported within the time periods specified in the Securities and Exchange Commission’s rules and forms.
(b) There were no changes in the registrant’s internal control over financial reporting that occurred during the registrant’s second fiscal quarter of the period covered by this report that have materially affected, or are reasonably likely to materially affect, the registrant’s internal control over financial reporting.
(a)(1) Code of Ethics attached hereto.
(a)(2) Separate certifications for the principal executive officer and the principal financial officer of the registrant as required by Rule 30a-2(a) under the Investment Company Act of 1940 (17 CFR 270.30a-2(a)) are filed herewith.
(b) Officer certifications as required by Rule 30a-2(b) under the Investment Company Act of 1940 (17 CFR 270.30a-2(b)) also accompany this filing as an exhibit.
SIGNATURES
Pursuant to the requirements of the Securities Exchange Act of 1934 and the Investment Company Act of 1940, the registrant has duly caused this report to be signed on its behalf by the undersigned, thereunto duly authorized.
| | | | | | |
(Registrant) | | | | Causeway Capital Management Trust | | |
| | | |
By (Signature and Title)* | | | | /s/ Turner Swan | | |
| | | | Turner Swan, President | | |
| | | |
Date: December 2, 2011 | | | | | | |
Pursuant to the requirements of the Securities Exchange Act of 1934 and the Investment Company Act of 1940, this report has been signed below by the following persons on behalf of the registrant and in the capacities and on the dates indicated.
| | | | | | |
By (Signature and Title)* | | | | /s/ Turner Swan | | |
| | | | Turner Swan, President | | |
| | | |
| Date: December 2, 2011 | | | | | | |
| | | |
| By (Signature and Title)* | | | | /s/ Michael Lawson | | |
| | | | Michael Lawson, Treasurer | | |
| | | |
| Date: December 2, 2011 | | | | | | |
| * | Print the name and title of each signing officer under his or her signature. |