UNITED STATES
SECURITIES AND EXCHANGE COMMISSION
Washington, D.C. 20549
FORM N-CSR
CERTIFIED SHAREHOLDER REPORT OF REGISTERED
MANAGEMENT INVESTMENT COMPANIES
Investment Company Act File Number 811-10467
Causeway Capital Management Trust
(Exact name of registrant as specified in charter)
11111 Santa Monica Boulevard, 15th Floor
Los Angeles, CA 90025
(Address of principal executive offices) (Zip code)
SEI Investments Global Funds Services
One Freedom Valley Drive
Oaks, PA 19456
(Name and address of agent for service)
Registrant’s telephone number, including area code: 1-866-947-7000
Date of fiscal year end: September 30, 2011
Date of reporting period: September 30, 2011
| Item 1. | Reports to Stockholders. |
LETTER TO SHAREHOLDERS
For the fiscal year ended September 30, 2011, the Causeway Global Value Fund’s (“Fund’s”) Institutional Class returned -3.56% compared to -3.84% for the MSCI World Index (“World Index”). Since the Fund’s Institutional Class inception on April 29, 2008, its average annual total return is -6.19% for the Institutional Class compared to -6.12% for the World Index. Since the Fund’s Investor Class inception on January 31, 2011, the cumulative total return was -16.12% compared to -13.79% for the World Index. At fiscal year-end, the Fund had net assets of $5.0 million.
Performance Review
Global equity markets continued their ascent through late 2010 and early 2011. The effects of monetary stimulus in the United States spilled into real assets prices and propelled markets. Energy and other raw materials prices spiked dramatically, pressuring developing markets policy makers to continue tightening monetary policy to thwart inflation. Quality cyclicals (stocks exposed to global economic recovery) performed especially well in this climate, extending their recovery from the market troughs of early 2009. Many of the Fund’s cyclical holdings were purchased in the depth of the 2008 financial crisis, at low valuations. As their share prices climbed, many of the Fund’s holdings became less competitive with other purchase candidates in our ranking of stocks by projected risk-adjusted returns. As a result, our portfolio management team trimmed or exited these positions. Market volatility subsided and reached fiscal year lows in the spring of 2 011. The Chicago Board Options Exchange Market Volatility Index (VIX) dropped below 15 in April 2011. Analysis from our quantitative team showed growing investor complacency. By April 2011, our annualized two-year expected return of the stocks in the Fund’s portfolio had diminished to the low double digits from the robust forecasts of late-2008/early-2009. Under these conditions, we deliberately decreased portfolio risk (defined as standard deviation of returns), bringing our forecasted portfolio volatility in-line with that of the World Index, and reducing forecasted portfolio beta (a measure of sensitivity to index moves) to 1.
In May 2011, investor sentiment suddenly reversed and markets performed extremely poorly through the end of the 2011 fiscal year. Global equities declined each of the last five months, with the most significant sell-offs occurring in August and September. The lack of resolution to the euro sovereign debt crisis and the increasing prospect of a double-dip recession caused investor confidence to plunge. During this period, every industry group and every developed stock market was in the red. A “risk-off” mentality permeated markets globally: correlations rose dramatically, as evidenced by VIX climbing into the mid-40s; emerging markets substantially underperforming developed markets; high yield bond spreads widening; and commodity prices plunging. The flight-to-safety trade was on, sending yields on 10-year US Treasury bonds to the lowest level ever recorded. In this environment, economically defensive sectors (consumer staples, health care, and telecommunication services) significantly outperformed the most economically cyclical sectors (materials, financials, and industrials).
| | |
2 | | Causeway Global Value Fund |
For the fiscal year, Fund holdings in the health care & equipment, capital goods, food beverage & tobacco, energy, and technology hardware & equipment industry groups contributed to the Fund’s performance relative to the World Index, while holdings in the transportation, materials, consumer services, and commercial & professional services industry groups as well as an underweight to the retailing industry group detracted from relative performance. The largest individual detractor to performance was Post NL (Netherlands). The Company delivers mail and parcels primarily in the Netherlands and other European neighboring countries. While the mail business is slowly shrinking, the parcels business is growing handsomely through demand from internet retailing. Since the May 2011 spinoff of its global overnight delivery business, TNT Express (Netherlands), both companies’ share prices have performed poorly. We continue to own Post NL because of its free-cash-flow generation and low valuation. Additional notable detractors included Chinese timber company, Sino-Forest (Canada), shipbuilder, SembCorp Marine Ltd. (Singapore), bank, Unicredit (Italy), and oil services engineering firm, Tecnicas Reunidas SA (Spain). The largest individual contributor to return during the fiscal year was energy services firms, National Oilwell Varco (United States). Additional top contributors included two health care services companies, Centene (United States) and United Health Group Inc. (United States), plant construction engineering firm, JGC Corp. (Japan), and motorcycle manufacturer, Harley-Davidson (United States).
Currency fluctuations made dollar-based returns for international equities even more volatile over the period. Although the European debt crisis (which first erupted in the spring of 2010) was not resolved, the euro strengthened through most of the fiscal year, only to decline during the fourth fiscal quarter of 2011. Meanwhile, the Japanese yen — considered a safe haven currency — continued its ascent relative to both the euro and the US dollar. The Swiss franc also experienced massive buying as a beneficiary of a healthy underlying economy and financial system. Swiss authorities, concerned that the strength of their currency could thwart the competitive landscape of their export economy, intervened, pegging the Swiss franc to the euro. Due primarily to the Fund’s relative overweight to the strong Japanese yen, the Fund modestly benefited from currency movements this fiscal year. The Fund’s currency allocation is a residual of our bottom-up stock selection process. We believe that some of the greatest upside potential in global equities at present can be found in Europe. As a result, the Fund is overweight euro zone-listed companies versus the World Index. We recognize investors are worried about the fallout from Greece’s debt woes and the lack of clear leadership in resolving the crisis. Facing the nightmare scenario head-on, we adhere to our long-standing premise that the euro zone will remain intact, primarily because the costs of a breakup would greatly exceed the costs of funding peripheral sovereign debt. While the US can postpone serious fiscal discipline, the heavily-indebted European countries do not have that option. We are concerned about the economic challenges facing the euro zone, and believe it is unlikely that the euro will appreciate relative to the US dollar in the mid-to long-term. During the final month of the fiscal year, we initiated a small euro/dollar hedge by entering the Fund into a forward foreign currency contract to provide a degree of protection for a portion of the Fund’s portfolio from euro weakness and allow us to continue seeking alpha (performance above the benchmark) from stock selection. We will continue to monitor the euro currency closely.
| | |
Causeway Global Value Fund | | 3 |
Significant Portfolio Changes
Significant purchases this fiscal year included postage & parcel delivery company, Post NL (Netherlands), athletic shoe manufacturer & retailer, YueYuen Industrial Holdings Ltd. (Hong Kong), motorcycle and automobile manufacturer, Honda Motor Co. Ltd. (Japan), metals & mining extractor, Eurasian Natural Resources Corp. PLC (United Kingdom), and industrial gases company, Air Products & Chemicals Inc. (United States). Our disciplined purchase and sale process led the portfolio management team to reduce exposure or exit completely out of several holdings that no longer ranked as competitively as they had earlier in the year. The largest sales during the period included polyvinyl chloride (PVC) & silicones manufacturer, Shin-Etsu Chemical (Japan), oil services company, National Oilwell Varco (United States), two health care services providers, Centene (United States) and Medco (United States), and shipbuilder & heavy equipment manufacturer, Hyundai Heavy Industries Co. Ltd. (South Korea).
Fund exposures to currencies (excluding hedges), sectors and countries are entirely a by-product of our bottom-up portfolio construction process. With that said, the Fund’s weights in the energy, telecommunication services, and health care sectors decreased the most compared to the beginning of the fiscal year, while weights in the information technology, consumer discretionary, and financials sectors increased the most. From a regional perspective, the most notable weight changes included increased exposure to companies listed in the United States. Meanwhile, the most significantly reduced country weight was Japan.
Investment Outlook
As we experienced most recently in 2008, negative sentiment can be self-fulfilling. Fear and lack of confidence causes individuals and businesses to postpone both consumption and investment. Without decisive government policy action, concerns of contagion have taken hold, tainting the outlook by investors for risk-bearing assets, including equities. Panic selling, while discomforting, has a silver lining. Indiscriminate selling fills our weekly value screens with well-managed companies generating enviable levels of free cash flow. We find bargains in bear markets. Not just bargains, but high-quality, leading franchise companies whose share prices have suffered with the market declines. The euro zone crisis, the US debt downgrade, Middle East political tensions, and some severe natural disasters have not changed the underlying long-term revenue growth profile for the vast majority of companies we follow closely. We have used this opportunity to buy a company that dominates the global market for corporate information technology, Oracle Corp. (United States), a highly-efficient retailer such as Tesco, and a shipbuilder, SembCorp Marine Ltd., each able to expand in the more dynamic emerging countries while becoming even more efficient in the developed world. Our fundamental analysts are scouring the output of quantitative screens, looking for opportunities to upgrade the quality of the portfolio in genuinely mispriced securities. European banking and insurance stocks are significantly undervalued, but the risks (political, regulatory, and economic) remain elevated. We retain an exposure to European financials, but keep that exposure well diversified. We continue to prefer the highest quality defensive and industrial companies with strong balance sheets that can deliver reasonably good earnings, even in a recessionary environment. Generous dividend pay-outs and well-timed share repurchases will pay equity shareholders to wait for the ultimate reward of stock price appreciation.
| | |
4 | | Causeway Global Value Fund |
As value investors, we believe that there is a price that discounts the most likely negative scenario. As a team, we have the discipline to weather bear markets, and we use price weakness to upgrade client portfolios to the companies we have always wanted to own. We believe these world-class franchises should perform strongly during the next market cycle. We have a thorough understanding of companies and industry fundamentals, a long-term perspective, and a focus on superior financial strength. The tide always turns. Positive sentiment can also be self-fulfilling: confidence creates demand for products and services; companies begin to invest in their businesses through hiring, productivity enhancements, and inventory accumulation. Capitalizing on volatile sentiment — in anticipation of the inevitable up cycle — rewards the patient, disciplined investor.
We thank you for your continued confidence in Causeway Global Value Fund.
| | | | |
 | |  | |  |
| | |
Harry W. Hartford Portfolio Manager | | Sarah H. Ketterer Portfolio Manager | | James A. Doyle Portfolio Manager |
| | |
 | |  | |  |
| | |
Jonathan P. Eng Portfolio Manager | | Kevin Durkin Portfolio Manager | | Conor Muldoon Portfolio Manager |
The above commentary expresses the portfolio managers’ views as of the date shown and should not be relied upon by the reader as research or investment advice regarding any stock. These views and the portfolio holdings are subject to change. There is no guarantee that any forecasts made will come to pass.
| | |
Causeway Global Value Fund | | 5 |
COMPARISONOF CHANGEINTHE VALUEOFA $ 1,000,000 INVESTMENTIN CAUSEWAY GLOBAL VALUE FUND, INSTITUTIONAL CLASSSHARESVERSUSTHE MSCI WORLD INDEX (gross)
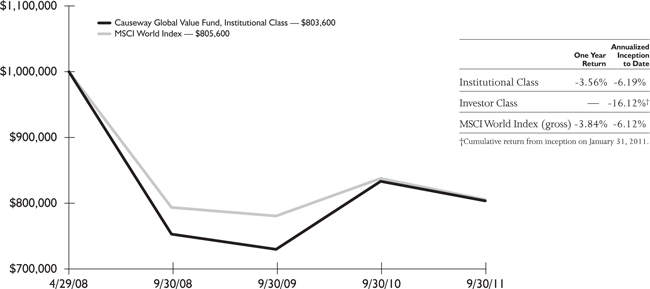
The performance in the above graph does not reflect the deduction of taxes the shareholder will pay on Fund distributions or the redemptions of Fund shares. The inception date of the Institutional Class was April 29, 2008, and the Investor Class was January 31, 2011.
The performance data represents past performance and is not an indication of future results. Investment return and the principal value of an investment will fluctuate so that an investor’s shares, when redeemed, may be worth less than their original cost and current performance may be higher or lower than the performance quoted. For performance data current to the most recent month-end, please call 1-866-947-7000 or visit www.causewayfunds.com. Investment performance reflects fee waivers in effect. In the absence of such fee waivers, total return would be reduced. Total returns assume reinvestment of dividends and capital gains distributions at net asset value when paid. The Fund imposes a 2% redemption fee on the value of shares redeemed less than 60 days after purchase. If your account incurred a redemption fee, your performance will be lower than the performance shown here. For more information, please see the prospectus.
The MSCI World Index (gross) is a free float-adjusted market capitalization index, designed to measure developed market equity performance, consisting of 24 developed country indexes, including the U.S. The Index is gross of withholding taxes, assumes reinvestment of dividends and capital gains, and does not reflect the payment of transaction costs, fees and expenses associated with an investment in the Fund. It is not possible to invest directly in an index. There are special risks in foreign investing (please see Note 5 in the Notes to Financial Statements).
| | |
6 | | Causeway Global Value Fund |
SCHEDULE OF INVESTMENTS (000)*
September 30, 2011
| | | | | | | | |
Causeway Global Value Fund | | Number of Shares | | | Value | |
COMMON STOCK | | | | | | | | |
France — 9.3% | | | | | | | | |
AXA SA | | | 6,128 | | | $ | 80 | |
Gemalto NV | | | 2,469 | | | | 117 | |
Legrand SA | | | 3,097 | | | | 96 | |
Sanofi-Aventis SA | | | 1,534 | | | | 101 | |
Technip SA | | | 909 | | | | 73 | |
| | | | | | | | |
| | | | | | | 467 | |
| | | | | | | | |
Germany — 3.6% | | | | | | | | |
Deutsche Post AG | | | 6,852 | | | | 88 | |
Siemens AG | | | 1,025 | | | | 92 | |
| | | | | | | | |
| | | | | | | 180 | |
| | | | | | | | |
Greece — 1.1% | | | | | | | | |
OPAP SA | | | 5,221 | | | | 53 | |
| | | | | | | | |
Hong Kong — 2.5% | | | | | | | | |
YueYuen Industrial Holdings Ltd. | | | 48,500 | | | | 126 | |
| | | | | | | | |
| | | | | | | | |
Japan — 10.3% | | | | | | | | |
Honda Motor Co. Ltd. | | | 3,900 | | | | 114 | |
JGC Corp. | | | 6,000 | | | | 147 | |
Sony Financial Holdings Inc. | | | 7,800 | | | | 119 | |
Toyota Motor Corp. | | | 3,900 | | | | 134 | |
| | | | | | | | |
| | | | | | | 514 | |
| | | | | | | | |
Netherlands — 7.0% | | | | | | | | |
Akzo Nobel NV | | | 3,094 | | | | 137 | |
Post NL | | | 17,010 | | | | 74 | |
Reed Elsevier NV | | | 12,952 | | | | 142 | |
| | | | | | | | |
| | | | | | | 353 | |
| | | | | | | | |
The accompanying notes are an integral part of the financial statements.
| | |
Causeway Global Value Fund | | 7 |
SCHEDULE OF INVESTMENTS (000)* (continued)
September 30, 2011
| | | | | | | | |
Causeway Global Value Fund | | Number of Shares | | | Value | |
Singapore — 2.7% | | | | | | | | |
SembCorp Marine Ltd. | | | 27,000 | | | $ | 66 | |
Singapore Airlines Ltd. | | | 8,000 | | | | 69 | |
| | | | | | | | |
| | | | | | | 135 | |
| | | | | | | | |
South Korea — 3.5% | | | | | | | | |
Hyundai Heavy Industries Co. Ltd. | | | 296 | | | | 68 | |
KT&G Corp. | | | 1,687 | | | | 105 | |
| | | | | | | | |
| | | | | | | 173 | |
| | | | | | | | |
Spain — 1.4% | | | | | | | | |
Tecnicas Reunidas SA | | | 2,235 | | | | 71 | |
| | | | | | | | |
Switzerland — 7.6% | | | | | | | | |
Kuoni Reisen Holding AG | | | 282 | | | | 85 | |
Novartis AG | | | 2,701 | | | | 151 | |
Roche Holding AG | | | 323 | | | | 52 | |
UBSAG | | | 7,995 | | | | 91 | |
| | | | | | | | |
| | | | | | | 379 | |
| | | | | | | | |
United Kingdom — 10.4% | | | | | | | | |
Balfour Beatty PLC | | | 24,845 | | | | 98 | |
Barclays PLC | | | 25,739 | | | | 63 | |
Eurasian Natural Resources Corp. PLC | | | 8,820 | | | | 78 | |
Michael Page International PLC | | | 10,472 | | | | 60 | |
Petrofac Ltd. | | | 4,481 | | | | 83 | |
Rolls-Royce Group PLC | | | 15,152 | | | | 139 | |
| | | | | | | | |
| | | | | | | 521 | |
| | | | | | | | |
United States — 39.9% | | | | | | | | |
Air Products & Chemicals Inc. | | | 1,300 | | | | 99 | |
Altria Group Inc. | | | 3,800 | | | | 102 | |
Anadarko Petroleum Corp. | | | 1,682 | | | | 106 | |
The accompanying notes are an integral part of the financial statements.
| | |
8 | | Causeway Global Value Fund |
SCHEDULE OF INVESTMENTS (000)* (continued)
September 30, 2011
| | | | | | | | |
Causeway Global Value Fund | | Number of Shares | | | Value | |
United States — (continued) | | | | | | | | |
Apollo Group Inc., Class A1 | | | 3,286 | | | $ | 130 | |
Babcock & Wilcox Co.1 | | | 6,060 | | | | 118 | |
Boeing Co. | | | 1,500 | | | | 91 | |
DeVry Inc. | | | 2,000 | | | | 74 | |
Johnson & Johnson | | | 2,250 | | | | 143 | |
Mattel Inc. | | | 3,800 | | | | 98 | |
Microsoft Corp. | | | 6,652 | | | | 166 | |
Molina Healthcare Inc.1 | | | 5,600 | | | | 87 | |
Oracle Corp. | | | 4,600 | | | | 132 | |
Progressive Corp. | | | 3,800 | | | | 68 | |
Total System Services Inc. | | | 5,700 | | | | 96 | |
UnitedHealth Group Inc. | | | 3,818 | | | | 176 | |
Walt Disney Co. | | | 3,400 | | | | 103 | |
Wells Fargo & Co. | | | 4,500 | | | | 109 | |
Western Union Co. | | | 6,465 | | | | 99 | |
| | | | | | | | |
| | | | | | | 1,997 | |
| | | | | | | | |
Total Common Stock
(Cost $5,702) — 99.3% | | | | | | | 4,969 | |
| | | | | | | | |
SHORT-TERM INVESTMENT | | | | | | | | |
Dreyfus Cash Management , Institutional Class, 0.050% ** | | | 61,806 | | | | 62 | |
| | | | | | | | |
Total Short-Term Investment
(Cost $62) — 1.2% | | | | | | | 62 | |
| | | | | | | | |
The accompanying notes are an integral part of the financial statements.
| | |
Causeway Global Value Fund | | 9 |
SCHEDULE OF INVESTMENTS (000)* (concluded)
September 30, 2011
| | | | |
Causeway Global Value Fund | | Value | |
Total Investments — 100.5%
(Cost $5,764) | | $ | 5,031 | |
| | | | |
Liabilities in Excess of Other Assets — -0.5% | | | (26 | ) |
| | | | |
Net Assets — 100.0% | | $ | 5,005 | |
| | | | |
| ** | The rate reported is the 7-day effective yield as of September 30, 2011. |
| 1 | Non-income producing security. |
A summary of the outstanding forward foreign currency contracts held by the Fund at September 30, 2011, is as follows:
| | | | | | | | | | | | | | |
Counterparty | | Settlement Date | | Currency to
Deliver (000) | | | Currency to
Receive (000) | | | Unrealized Appreciation
(000) | |
Bank of New York Mellon | | 12/21/11 | | EUR | 77 | | | USD | 106 | | | $ | 2 | |
| | | | | | | | | | | | | | |
EUR Euro
USD US Dollar
The accompanying notes are an integral part of the financial statements.
| | |
10 | | Causeway Global Value Fund |
SECTOR DIVERSIFICATION
As of September 30, 2011, the sector diversification was as follows (Unaudited):
| | | | |
Causeway Global Value Fund | | % of Net Assets | |
Common Stock | | | | |
| Industrials | | | 24.1 | % |
| Consumer Discretionary | | | 21.1 | |
| Health Care | | | 14.2 | |
| Information Technology | | | 12.2 | |
| Financials | | | 10.6 | |
| Energy | | | 6.7 | |
| Materials | | | 6.3 | |
| Consumer Staples | | | 4.1 | |
| | | | |
Total Common Stock | | | 99.3 | |
Short-Term Investment | | | 1.2 | |
| | | | |
Liabilities in Excess of Other Assets | | | -0.5 | |
| | | | |
Net Assets | | | 100.0 | % |
| | | | |
The accompanying notes are an integral part of the financial statements.
| | |
Causeway Global Value Fund | | 11 |
STATEMENT OF ASSETS AND LIABILITIES (000)*
| | | | |
| | | CAUSEWAY
GLOBAL
VALUE FUND
9/30/11 | |
ASSETS: | | | | |
Investments at Value (Cost $5,764) | | $ | 5,031 | |
Receivable due from Adviser | | | 12 | |
Receivable for Dividends and Interest | | | 8 | |
Receivable for Tax Reclaims | | | 6 | |
Prepaid Expenses | | | 5 | |
Receivable for Investment Securities Sold | | | 3 | |
Unrealized Appreciation on Forward Foreign Currency Contracts | | | 2 | |
| | | | |
Total Assets | | | 5,067 | |
| | | | |
LIABILITIES: | | | | |
Payable due to Adviser | | | 4 | |
Payable due to Administrator | | | 2 | |
Other Accrued Expenses | | | 56 | |
| | | | |
Total Liabilities | | | 62 | |
| | | | |
Net Assets | | $ | 5,005 | |
| | | | |
NET ASSETS: | | | | |
Paid-in Capital (unlimited authorization — no par value) | | $ | 6,526 | |
Undistributed Net Investment Income | | | 103 | |
Accumulated Net Realized Loss on Investments and Foreign Currency Transactions | | | (894 | ) |
Net Unrealized Depreciation on Investments | | | (733 | ) |
Net Unrealized Appreciation on Foreign Currencies and Translation of Other Assets and Liabilities Denominated in Foreign Currencies | | | 3 | |
| | | | |
Net Assets | | $ | 5,005 | |
| | | | |
Net Asset Value Per Share (based on net assets of $4,871,844 ÷ 635,338 shares) — Institutional Class | | $ | 7.67 | |
| | | | |
Net Asset Value Per Share (based on net assets of $133,092 ÷ 17,394 shares) — Investor Class | | $ | 7.65 | |
| | | | |
| * | Except for Net Asset Value data. |
The accompanying notes are an integral part of the financial statements.
| | |
12 | | Causeway Global Value Fund |
STATEMENT OF OPERATIONS (000)
| | | | |
| | | CAUSEWAY
GLOBAL
VALUE FUND
10/01/10 TO
9/30/11 | |
INVESTMENT INCOME: | | | | |
Dividend Income (net of foreign taxes withheld of $ 13) | | $ | 188 | |
| | | | |
Total Investment Income | | | 188 | |
| | | | |
EXPENSES: | | | | |
Investment Advisory Fees | | | 47 | |
Administration Fees | | | 14 | |
Transfer Agent Fees | | | 46 | |
Professional Fees | | | 26 | |
Custodian Fees | | | 17 | |
Registration Fees | | | 16 | |
Printing Fees | | | 8 | |
Trustees Fees | | | 1 | |
Shareholder Servicing – Investor Class | | | 13 | |
Other Fees | | | — | |
| | | | |
Total Expenses | | | 188 | |
| | | | |
LESS: Waiver of Investment Advisory Fee | | | (47 | ) |
Reimbursement of Other Expenses by Adviser | | | (80 | ) |
| | | | |
Total Waiver and Reimbursement | | | (127 | ) |
| | | | |
Net Expenses | | | 61 | |
| | | | |
Net Investment Income | | | 127 | |
| | | | |
Net Realized and Unrealized Gain (Loss) on Investments: | | | | |
Net Realized Gain from Security Transactions | | | 647 | |
Net Realized Loss from Foreign Currency Transactions | | | (2 | ) |
Net Change in Unrealized Depreciation on Investments | | | (1,067 | ) |
Net Change in Unrealized Appreciation on Foreign Currency and Translation of Other Assets and Liabilities Denominated in Foreign Currency | | | 3 | |
| | | | |
Net Realized and Unrealized Loss on Investments and Foreign Currency Transactions | | | (419 | ) |
| | | | |
Net Decrease in Net Assets Resulting from Operations | | $ | (292 | ) |
| | | | |
Amounts designated as “ — ” are $0 or have rounded to $0.
The accompanying notes are an integral part of the financial statements.
| | |
Causeway Global Value Fund | | 13 |
STATEMENT OF CHANGES IN NET ASSETS (000)
| | | | | | | | |
| | | CAUSEWAY GLOBAL VALUE FUND | |
| | | 10/01/10 to
9/30/11 | | | 10/1/09 to
9/30/10 | |
OPERATIONS: | | | | | | | | |
Net Investment Income | | $ | 127 | | | $ | 45 | |
Net Realized Gain from Security Transactions | | | 647 | | | | 418 | |
Net Realized Loss from Foreign Currency Transactions | | | (2 | ) | | | (1 | ) |
Net Change in Unrealized Appreciation (Depreciation) on Investments | | | (1 ,067 | ) | | | 74 | |
Net Change in Unrealized Appreciation on Foreign Currency and Translation of Other Assets and Liabilities Denominated in Foreign Currency | | | 3 | | | | — | |
| | | | | | | | |
Net Increase (Decrease) in Net Assets Resulting from Operations | | | (292 | ) | | | 536 | |
| | | | | | | | |
DIVIDENDS AND DISTRIBUTIONS TO SHAREHOLDERS: | | | | | | | | |
Dividends from Net Investment Income: | | | | | | | | |
Institutional Class | | | (45 | ) | | | (42 | ) |
Investor Class | | | — | | | | — | |
| | | | | | | | |
Total Dividends from Net Investment Income | | | (45 | ) | | | (42 | ) |
| | | | | | | | |
Net Increase in Net Assets Derived from Capital Share Transactions(1) | | | 827 | | | | 254 | |
| | | | | | | | |
Total Increase in Net Assets | | | 490 | | | | 748 | |
| | | | | | | | |
NET ASSETS: | | | | | | | | |
Beginning of Year | | | 4,515 | | | | 3,767 | |
| | | | | | | | |
End of Year | | $ | 5,005 | | | $ | 4,515 | |
| | | | | | | | |
Undistributed Net Investment Income | | $ | 103 | | | $ | 34 | |
| | | | | | | | |
| (1) | See Note 7 in the Notes to Financial Statements. |
The accompanying notes are an integral part of the financial statements.
| | |
14 | | Causeway Global Value Fund |
FlNANCIAL HIGHLIGHTS
For the year or period ended September 30,
For a Share Outstanding Throughout the Period
| | | | | | | | | | | | | | | | | | | | | | | | | | | | | | | | | | | | | | | | | | | | | | | | |
| | | Net Asset
Value,
Beginning
of Period ($) | | | Net
Investment
Income ($) | | | Net
Realized
and
Unrealized
Gain
(Loss) on
Investments ($) | | | Total
from
Operations ($) | | | Dividends
from
Net
Investment
Income ($) | | | Net
Assets
Value,
End
of
Period ($) | | | Total
Return (%) | | | Net
Assets
End
of
Period
($000) | | | Ratio
of
Expenses
to
Average
Net
Assets (%) | | | Ratio
of
Expenses
to
Average
Net
Assets
(Excluding
Wavers)
and
Reimburse-
ments (%) | | | Ratio
of
Net
Investment
Income
to
Average
Net
Assets (%) | | | Portfolio
Turnover
Rate (%) | |
CAUSEWAY GLOBAL VALUE FUND† | | | | | | | | | | | | | | | | | | | | | | | | | | | | | | | | | |
Institutional Class | | | | | | | | | | | | | | | | | | | | | | | | | | | | | | | | | | | | | | | | | |
2011 | | | 8.03 | | | | 0.21 | | | | (0.49 | ) | | | (0.28 | ) | | | (0.08 | ) | | | 7.67 | | | | (3.56 | ) | | | 4,872 | | | | 1.10 | | | | 3.41 | | | | 2.30 | | | | 76 | |
2010 | | | 7.11 | | | | 0.08 | | | | 0.92 | | | | 1.00 | | | | (0.08 | ) | | | 8.03 | | | | 14.17 | | | | 4,515 | | | | 1.10 | | | | 4.75 | | | | 1.15 | | | | 88 | |
2009 | | | 7.53 | | | | 0.09 | | | | (0.38 | ) | | | (0.29 | ) | | | (0.13 | ) | | | 7.11 | | | | (3.07 | ) | | | 3,767 | | | | 1.10 | | | | 4.94 | | | | 1.59 | | | | 92 | |
2008(1) | | | 10.00 | | | | 0.09 | | | | (2.56 | ) | | | (2.47 | ) | | | — | | | | 7.53 | | | | (24.70 | ) | | | 4,313 | | | | 1.10 | | | | 3.83 | | | | 2.27 | | | | 32 | |
Investor Class | | | | | | | | | | | | | | | | | | | | | | | | | | | | | | | | | | | | | | | | | | | | | |
2011(2) | | | 9.12 | | | | 0.19 | | | | (1.66 | ) | | | (1.47 | ) | | | — | | | | 7.65 | | | | (16.12 | ) | | | 133 | | | | 1.34 | | | | 3.81 | | | | 3.20 | | | | 76 | |
| (1) | Commenced operations on April 29, 2008. All ratios for the period are annualized. Total return and portfolio turnover rate are for the period indicated and have not been annualized. |
| (2) | Commenced operations on January 31, 2011. All ratios for the period are annualized. Total return is for the period indicated and has not been annualized. Portfolio turnover rate represents the rate for the Fund as a whole for the year ended September 30, 201 I. |
| † | Per share amounts calculated using average shares method. |
Amounts designated as “—” are $0 or have been rounded to $0.
The accompanying notes are an integral part of the financial statements.
| | |
Causeway Global Value Fund | | 15 |
NOTES TO FINANCIAL STATEMENTS
Causeway Global Value Fund (the “Fund”) is a series of Causeway Capital Management Trust (the “Trust”). The Trust is an open-end management investment company registered under the Investment Company Act of 1940, as amended (the “ 1940 Act”) and is a Delaware statutory trust that was established on August 10, 2001. The Fund began operations on April 29, 2008. The Fund is authorized to offer two classes of shares, the Institutional Class and the Investor Class. The inception of performance for Institutional Class shares was April 29, 2008, and for Investor Class shares was January 31, 2011. The Declaration of Trust authorizes the issuance of an unlimited number of shares of beneficial interest of the Fund. The Fund is diversified. The Fund’s prospectus provides a description of the Fund’s investment objectives, policies and strategies. The Trust has four additional series, the financial statements of which are presented separately.
| 2. | Significant Accounting Policies |
The following is a summary of the significant accounting policies consistently followed by the Fund.
Use of Estimates in the Preparation of Financial Statements – The preparation of financial statements in conformity with generally accepted accounting principles (“GAAP”) in the United States of America requires management to make estimates and assumptions that affect the reported amount of net assets and liabilities and disclosure of contingent assets and liabilities at the date of the financial statements and the reported amounts of increases and decreases in net assets from operations during the reporting period. Actual results could differ from those estimates.
Security Valuation – Except as described below, securities listed on a securities exchange (except the NASDAQ Stock Market (“NASDAQ”)), or Over-the-Counter (“OTC”) for which market quotations are available are
valued at the last reported sale price as of the close of trading on each business day, or, if there is no such reported sale, at the last reported bid price for long positions. For securities traded on NASDAQ, the NASDAQ Official Closing Price will be used. Securities listed on multiple exchanges or OTC markets are valued on the exchange or OTC market considered by the Fund to be the primary market. The prices for foreign securities are reported in local currency and converted to U.S. dollars using currency exchange rates. Prices for most securities held in the Fund are provided daily by recognized independent pricing agents. If a security price cannot be obtained from an independent pricing agent, the Fund seeks to obtain a bid price from at least one independent broker. Investments in the Dreyfus Cash Management money market fund are valued daily at the net asset value per share.
Securities for which market prices are not “readily available” are valued in accordance with fair value pricing procedures approved by the Fund’s Board of Trustees (the “Board”).The Fund’s fair value pricing procedures are implemented through a Fair Value Committee (the “Committee”) designated by the Board. Some of the more common reasons that may necessitate that a security be valued using fair value pricing procedures include: the security’s trading has been halted or suspended; the security has been de-listed from a national exchange; the security’s primary trading market is temporarily closed at a time when under normal conditions it would be open; or the security’s primary pricing source is not able or willing to provide a price. When the Committee values a security in accordance with the fair value pricing procedures, the Committee will determine the value after taking into consideration relevant information reasonably available to the Committee.
The Fund uses a third party vendor to fair value certain non-US, securities if there is a movement in the U.S. market that exceeds thresholds established by the
| | |
16 | | Causeway Global Value Fund |
NOTES TO FINANCIAL STATEMENTS
(continued)
Committee. The vendor provides fair values for foreign securities based on factors and methodologies involving, generally, tracking valuation correlations between the U.S. market and each non-U.S. security.
In accordance with the authoritative guidance on fair value measurements and disclosure under GAAP, the Fund discloses fair value of its investments in a hierarchy that prioritizes the inputs to valuation techniques used to measure the fair value. The objective of a fair value measurement is to determine the price that would be received to sell an asset or paid to transfer a liability in an orderly transaction between market participants at the measurement date (an exit price). Accordingly the fair value hierarchy gives the highest priority to quoted prices (unadjusted) in active markets for identical assets or liabilities (Level 1) and the lowest priority to unobservable inputs (Level 3). The guidance establishes three levels of fair value hierarchy as follows:
| | • | | Level 1 — Unadjusted quoted prices in active markets for identical, unrestricted assets or liabilities that the Fund has the ability to access at the measurement date; |
| | • | | Level 2 — Quoted prices which are not active, or inputs that are observable (either directly or indirectly) for substantially the full term of the asset or liability; and |
| | • | | Level 3 — Prices, inputs or exotic modeling techniques which are both significant to the fair value measurement and unobservable (supported by little or no market activity). |
Investments are classified within the level of the lowest significant input considered in determining fair value. Investments classified within Level 3 whose fair value measurement considers several inputs may include Level 1 or Level 2 inputs as components of the overall fair value measurement. The table below sets forth
information about the level, within the fair value hierarchy at which the Fund’s investments are measured at September 30, 2011:
| | | | | | | | | | | | | | | | |
Investments in Securities | | Level 1
(000) | | | Level 2†
(000) | | | Level 3
(000) | | | Total
(000) | |
Common Stock | | | | | | | | | | | | | | | | |
France | | $ | — | | | $ | 467 | | | $ | — | | | $ | 467 | |
Germany | | | — | | | | 180 | | | | — | | | | 180 | |
Greece | | | — | | | | 53 | | | | — | | | | 53 | |
Hong Kong | | | | | | | 126 | | | | | | | | 126 | |
Japan | | | | | | | 514 | | | | | | | | 514 | |
Netherlands | | | | | | | 353 | | | | | | | | 353 | |
Singapore | | | | | | | 135 | | | | | | | | 135 | |
South Korea | | | — | | | | 173 | | | | — | | | | 173 | |
Spain | | | — | | | | 71 | | | | — | | | | 71 | |
Switzerland | | | — | | | | 379 | | | | — | | | | 379 | |
United Kingdom | | | | | | | 521 | | | | | | | | 521 | |
United States | | | 1,997 | | | | — | | | | — | | | | 1,997 | |
| | | | | | | | | | | | | | | | |
Total Common Stock | | $ | 1,997 | | | $ | 2,972 | | | $ | — | | | $ | 4,969 | |
| | | | |
Short-Term Investment United States | | | 62 | | | $ | — | | | $ | — | | | | 62 | |
| | | | | | | | | | | | | | | | |
Total Investments in Securities | | $ | 2,059 | | | $ | 2,972 | | | $ | — | | | | 5,031 | |
| | | | | | | | | | | | | | | | |
| | | | |
Other Financial Instruments – Assets | | Level 1
(000) | | | Level 2
(000) | | | Level 3
(000) | | | Total
(000) | |
| | | | | | | | | | | | | | | | |
Forward Foreign Currency Contracts | | $ | — | | | $ | 2 | | | $ | — | | | $ | 2 | |
| | | | | | | | | | | | | | | | |
Total Other Financial
Instruments–Assets | | $ | — | | | $ | 2 | | | $ | — | | | $ | 2 | |
| | | | | | | | | | | | | | | | |
| † | Represents securities trading outside the United States, the values of which were adjusted as a result of significant market movements following the close of local trading. |
Please refer to the Schedule of Investments for additional information regarding the composition of the amounts listed above.
Changes in valuation techniques may result in transfers in or out of an investment’s assigned level within the hierarchy during the reporting period. For the Fund there were no transfers between Level 1 and Level 2 during the reporting period, based on the input level assigned under the hierarchy at the beginning and end of the reporting period.
| | |
Causeway Global Value Fund | | 17 |
NOTES TO FINANCIAL STATEMENTS
(continued)
For the year ended September 30,2011, there were no significant changes to the Fund’s fair value methodologies.
Federal Income Taxes — It is the Fund’s intention to continue to qualify as a regulated investment company under Subchapter M of the Internal Revenue Code and to distribute all of its taxable income. Accordingly no provision for Federal income taxes has been made in the financial statements.
The Fund evaluates tax positions taken or expected to be taken in the course of preparing the Fund’s tax returns to determine whether it is “more-likely-than-not” (i.e., greater than 50-percent) that each tax position will be sustained upon examination by a taxing authority based on the technical merits of the position. Tax positions not deemed to meet the more-likely-than-not threshold are recorded as a tax benefit or expense in the current year. The Fund did not record any tax provision in the current year. However, management’s conclusions regarding tax positions taken may be subject to review and adjustment at a later date based on factors including, but not limited to, examination by tax authorities (i.e., the last 3 tax year ends, as applicable), on-going analysis of and changes to tax laws, regulations and interpretations thereof.
As of and during the year ended September 30, 2011, the Fund did not have a liability for any unrecognized tax benefits. The Fund recognizes interest and penalties, if any, related to unrecognized tax benefits as income tax expense in the Statement of Operations. During the year, the Fund did not incur any significant interest or penalties.
Security Transactions and Related Income – Security transactions are accounted for on the date the security is purchased or sold (trade date). Dividend income is recognized on the ex-dividend date, and interest income is recognized using the accrual basis of accounting. Costs used in determining realized gains and losses on the
sales of investment securities are those of the specific securities sold.
Foreign Currency Translation – The books and records of the Fund are maintained in U.S. dollars on the following basis:
| (1) | the market value or fair value of investment securities, assets and liabilities is converted at the current rate of exchange; and |
| (2) | purchases and sales of investment securities, income and expenses are converted at the relevant rates of exchange prevailing on the respective dates of such transactions. |
The Fund does not isolate that portion of gains and losses on investments in equity securities that is due to changes in the foreign exchange rates from that which is due to changes in market prices of equity securities.
Foreign Currency Exchange Contracts – When the Fund purchases or sells foreign securities, it may enter into foreign currency exchange contracts to minimize foreign exchange risk from the trade date to the settlement date of the transaction. Losses from these transactions may arise from changes in the value of the foreign currency or if the counterparties do not perform under the contract’s terms.
Expenses/Classes – Expenses that are directly related to one Fund of the Trust are charged directly to that Fund. Other operating expenses of the Trust are prorated to the Fund and the other series of the Trust on the basis of relative daily net assets. Class specific expenses are borne by that class of shares. Income, realized and unrealized gains/losses and non-class specific expenses are allocated to the respective classes on the basis of relative daily net assets.
Dividends and Distributions – Dividends from net investment income, if any, are declared and paid on an annual
| | |
18 | | Causeway Global Value Fund |
NOTES TO FINANCIAL STATEMENTS
(continued)
basis. Any net realized capital gains on sales of securities are distributed to shareholders at least annually.
Redemption Fee – The Fund imposes a redemption fee of 2% on the value of capital shares redeemed by shareholders less than 60 days after purchase. The redemption fee does not apply to shares purchased through reinvested distributions or shares redeemed through designated systematic withdrawal plans. The redemption fee does not normally apply to omnibus account arrangements through financial intermediaries where the purchase and sale orders of a number of persons are aggregated before being communicated to the Fund. However, the Fund seeks agreements with these intermediaries to impose the Fund’s redemption fee or a different redemption fee on their customers if feasible, or to impose other appropriate restrictions on excessive short-term trading. The officers of the Fund may waive the redemption fee for shareholders in asset allocation and similar investment programs reasonably believed not to be engaged in short-term market timing, including for holders of shares purchased by Causeway Capital Management LLC (the “Adviser”) for its clients to rebalance their portfolios. For the year ended September 30, 2011, the Institutional Class retained $345 in redemption fees.
| 3. | Investment Advisory, Administration and Distribution Agreements |
The Trust, on behalf of the Fund, has entered into an Investment Advisory Agreement (the “Advisory Agreement”) with the Adviser. Under the Advisory Agreement, the Adviser is entitled to a monthly fee equal to an annual rate of 0.85% of the Fund’s average daily net assets. The Adviser contractually agreed through January 31, 2012 to waive its fee and, to the extent necessary, reimburse the Fund to keep total annual fund operating expenses (excluding brokerage fees and commissions, interest, taxes, shareholder service fees, fees and expenses of other funds in which
the Fund invests, and extraordinary expenses) from exceeding 1.10% of Institutional Class and Investor Class average daily net assets. For the year ended September 30, 2011, the Adviser waived $46,892 and reimbursed $80,404.
The Trust and SEI Investments Global Funds Services (the “Administrator”) have entered into an Administration Agreement. Under the terms of the Administration Agreement, the Administrator is entitled to an annual fee which is calculated daily and paid monthly based on the aggregate average daily net assets of the Trust as follows: 0.06% up to $1 billion; 0.05% of the assets exceeding $1 billion up to $2 billion; 0.04% of the assets exceeding $2 billion up to $3 billion; 0.03% of the assets exceeding $3 billion up to $4 billion; and 0.02% of the assets exceeding $4 billion. The Fund is subject to a minimum annual fee of $20,000. If the Fund has three or more share classes, it is subject to an additional minimum fee of $20,000 per additional share class (over two).
The Trust has adopted a Shareholder Service Plan and Agreement for Investor Class shares that allows the Trust to pay broker-dealers and other financial intermediaries a fee of up to 0.25% per annum of average daily net assets for services provided to Investor Class shareholders. For the period ended September 30, 2011, the Investor Class paid 0.24% of average daily net assets under this plan.
The Trust and SEI Investments Distribution Co. (the “Distributor”) have entered into a Distribution Agreement. The Distributor receives no fees for its distribution services under this agreement.
The officers of the Trust are also officers or employees of the Administrator or Adviser. They receive no fees for serving as officers of the Trust.
As of September 30, 2011, approximately $2.839 million of net assets were held by affiliated investors.
| | |
Causeway Global Value Fund | | 19 |
NOTES TO FINANCIAL STATEMENTS
(continued)
| 4. | Investment Transactions |
The cost of security purchases and the proceeds from sales of securities, other than short-term investments, during the year ended September 30, 2011, for the Fund were as follows:
| | |
Purchases (000) | | Sales
(000) |
| $ 5,042 | | $ 4,051 |
| | |
| 5. | Risks of Foreign Investing |
Because the Fund invests significant assets in foreign securities, the Fund is subject to further risks. For example, the value of the Fund’s securities may be affected by social, political and economic developments and U.S. and foreign laws relating to foreign investment. Further, because the Fund invests in securities denominated in foreign currencies, the Fund’s securities may go down in value depending on foreign exchange rates. Other risks include trading, settlement, custodial, and other operational risks; withholding or other taxes; and the less stringent investor protection and disclosure standards of some foreign markets. All of these factors can make foreign securities less liquid, more volatile and harder to value than U.S. securities. These risks are higher for emerging markets investments.
| 6. | Federal Tax Information |
The Fund is classified as a separate taxable entity for Federal income tax purposes. The Fund intends to continue to qualify as a separate “regulated investment company” under Subchapter M of the Internal Revenue Code and make the requisite distributions to shareholders that will be sufficient to relieve it from Federal income tax and Federal excise tax. Therefore, no Federal tax provision is required. To the extent that dividends from net investment income and distributions from net realized capital gains exceed amounts reported in the financial statements, such amounts are reported separately.
The Fund may be subject to taxes imposed by countries in which it invests in issuers existing or operating in such countries. Such taxes are generally based on income earned. The Fund accrues such taxes when the related income is earned. Dividend and interest income is recorded net of non-U.S. taxes paid.
The amounts of distributions from net investment income and net realized capital gains are determined in accordance with Federal income tax regulations, which may differ from those amounts determined under generally accepted accounting principles in the United States of America. These book/tax differences are either temporary or permanent in nature. The character of distributions made during the year from net investment income or net realized gains, and the timing of distributions made during the year may differ from the year that the income or realized gains (losses) were recorded by the Fund. To the extent these differences are permanent, adjustments are made to the appropriate equity accounts in the period that the differences arise.
Accordingly, the following permanent differences, which are primarily due to realized losses on foreign currency transactions and sale of master limited partnership, were reclassified to/(from) the following accounts as of September 30,2011 (000):
| | |
Undistributed
Net Investment
Income | | Accumulated
Net Realized
Gain |
| $ (13) | | $ 13 |
| | |
These reclassifications had no impact on net assets or net asset value per share.
The tax character of dividends and distributions declared during the fiscal years ended September 30, 2011 and September 30, 2010 was as follows (000):
| | | | | | | | | | | | |
| | | Ordinary
Income | | | Long-Term
Capital Gain | | | Total | |
2011 | | $ | 45 | | | $ | — | | | $ | 45 | |
2010 | | $ | 42 | | | $ | — | | | $ | 42 | |
| | | | | | | | | | | | |
| | |
20 | | Causeway Global Value Fund |
NOTES TO FINANCIAL STATEMENTS
(continued)
As of September 30, 2011, the components of accumulated losses on a tax basis were as follows (000):
| | | | |
Undistributed Ordinary Income | | $ | 108 | |
Capital Loss Carryforwards | | | (881 | ) |
Unrealized Depreciation | | | (746 | ) |
Other Temporary Differences | | | (2 | ) |
| | | | |
Total Accumulated Losses | | $ | (1,521 | ) |
| | | | |
Post-October Capital and Currency Losses represent losses realized on securities from November 1, 2010 through September 30, 2011 that, in accordance with Federal income tax regulations, the Fund may elect to defer and treat as having arisen in the following fiscal year.
For Federal income tax purposes, capital loss carryforwards represent realized losses that the Fund may carryforward for a maximum period of eight years and apply against future net realized gains. The following summarizes the capital loss carryforwards as of September 30, 2011 (000).
| | | | |
| Expiring in Fiscal Year | | Amount | |
2018 | | $ | 881 | |
| | | | |
Total capital loss carryforwards | | $ | 881 | |
Under the recently enacted Regulated Investment Company Modernization Act of 2010, the Fund will be permitted to carry forward capital losses incurred in taxable years beginning after December 22, 2010 for an unlimited period. However, any losses incurred during those future taxable years will be required to be used prior to the losses incurred in pre-enactment taxable years. As a result of this ordering rule, pre-enactment capital loss carryforwards may be more likely to expire unused. Additionally, post-enactment capital losses that are carried forward will retain their character as either short-term or long-term capital losses rather than being considered all short-term as under previous law.
At September 30, 2011, the total cost of securities for Federal income tax purposes and the aggregate gross unrealized appreciation and depreciation on investment securities for the Fund were as follows (000):
| | | | | | | | | | | | | | |
Federal
Tax Cost | | | Appreciated
Securities | | | Depreciated
Securities | | | Net
Unrealized
Depreciation | |
| $ | 5,780 | | | $ | 265 | | | $ | (1,014 | ) | | $ | (749 | ) |
| | | | | | | | | | | | | | |
For the year ended September 30, 2011, the Fund used
$564,985 of capital loss carryforwards.
| 7. | Capital Shares Issued and Redeemed (000) |
| | | | | | | | | | | | | | | | | | | | | | | | |
| | | Fiscal Year Ended September 30,
2011 | | | Fiscal Year Ended
September 30,
2010 | |
| | | Institutional Class | | | Investor Class® | | | Institutional Class | |
| | | Shares | | | Value | | | Shares | | | Value | | | Shares | | | Value | |
| Shares Sold | | | 110 | | | $ | 999 | | | | 17 | | | $ | 165 | | | | 28 | | | $ | 223 | |
| Shares Issued in Reinvestment of Dividends and Distributions | | | 5 | | | | 44 | | | | | | | | | | | | 6 | | | | 42 | |
| Shares Redeemed | | | (42 | ) | | | (378 | ) | | | — | | | | (3 | ) | | | (1 | ) | | | (11 | ) |
| | | | | | | | | | | | | | | | | | | | | | | | |
| Increase in Shares Outstanding | | | | | | | | | | | | | | | | | | | | | | | | |
Derived from Institutional Class Transactions | | | 73 | | | $ | 665 | | | | 17 | | | $ | 162 | | | | 33 | | | $ | 254 | |
| | | | | | | | | | | | | | | | | | | | | | | | |
| (i) | Commenced operations on January 31, 2011. |
| | |
Causeway Global Value Fund | | 21 |
NOTES TO FINANCIAL STATEMENTS
(concluded)
| 8. | Significant Shareholder Concentration |
As of September 30, 2011, one shareholder of the Fund owned 41 % of net assets in the Institutional Class.
| 9. | New Accounting Pronouncement |
In May 2011, the Financial Accounting Standards Board issued ASU No. 2011-04 “Amendments to Achieve Common Fair Value Measurement and Disclosure Requirements in U.S. GAAP and International Financial Reporting Standards (“IFRS”).” ASU 2011 -04 includes common requirements for measurement of and disclosure about fair value between U.S. GAAP and IFRS. ASU 2011 -04 will require reporting entities to disclose the following information for fair value measurements categorized within Level 3 of the fair value hierarchy: quantitative information about the unobservable inputs used in the fair value measurement, the valuation processes used by the reporting entity, and a narrative description of the sensitivity of the fair value measurement to changes in unobservable inputs and the interrelationships between those unobservable inputs. In addition, ASU 2011 -04 will require reporting entities to make disclosures about amounts and reasons for all transfers in and out of Level 1 and Level 2 fair value measurements. The new and revised disclosures are effective for interim and annual reporting periods beginning after December 15, 2011. At this time, management is evaluating the implications of ASU 2011-04 and its impact on the financial statements.
The Fund has evaluated the need for disclosures and/or adjustments resulting from subsequent events through the date the financial statements were issued. Based on this evaluation, no adjustments were required to the financial statements.
| | |
22 | | Causeway Global Value Fund |
REPORT OF INDEPENDENT REGISTERED PUBLIC ACCOUNTING FIRM
To the Board of Trustees and Shareholders of
Causeway Global Value Fund
In our opinion, the accompanying statement of assets and liabilities, including the schedule of investments, and the related statements of operations and of changes in net assets and the financial highlights present fairly, in all material respects, the financial position of Causeway Global Value Fund (the “Fund”) at September 30, 2011, the results of its operations for the year then ended, the changes in its net assets for each of the two years in the period then ended and its financial highlights for each of the periods presented, in conformity with accounting principles generally accepted in the United States of America. These financial statements and financial highlights (hereafter referred to as “financial statements”) are the responsibility of the Fund’s management. Our responsibility is to express an opinion on these financial statements based on our audits. We conducted our audits of these financial statements in accordance with the standards of the Public Company Accounting Oversight Board (United States). Those standards require that we plan and perform the audit to obtain reasonable assurance about whether the financial statements are free of material misstatement. An audit includes examining, on a test basis, evidence supporting the amounts and disclosures in the financial statements, assessing the accounting principles used and significant estimates made by management, and evaluating the overall financial statement presentation. We believe that our audits, which included confirmation of securities at September 30, 2011 by correspondence with the custodian and brokers, provide a reasonable basis for our opinion.
PricewaterhouseCoopers LLP
Los Angeles, California
November 28, 2011
| | |
Causeway Global Value Fund | | 23 |
NOTICE TO SHAREHOLDERS (Unaudited)
The information set forth below is for the Fund’s fiscal year as required by federal laws. Shareholders, however, must report distributions on a calendar year basis for income tax purposes, which may include distributions for portions of two fiscal years of the Fund. Accordingly, the information needed by shareholders for income tax purposes will be sent to them in early 2012. Please consult your tax adviser for proper treatment of this information.
For the fiscal year ended September 30, 2011, the Fund is designating the following items with regard to distributions paid during the year:
| | | | | | | | | | | | | | | | | | |
| (A) | | | (B) | | | (C) | | | (D) | | | (E) | |
| | | | |
Long Term
Capital Gains
Distributions
(Tax Basis) | | | Ordinary
Income
Distributions
(Tax Basis) | | | Tax Exempt
Distributions
(Tax Basis) | | | Total
Distributions
(Tax Basis) | | | Dividends (1)
for Corporate
Dividends Received
Deduction | |
| | 0.00% | | | | 100.00 | % | | | 0.00 | % | | | 100.00 | % | | | 33.37 | % |
| | | | |
| (F) | | | (G) | | | (H) | | | (1) | | | | |
| | | | |
Qualified
Dividend
Income | | | Foreign
Tax
Credit | | | Interest
Related
Dividends | | | Qualified
Short-Term
Capital Gain
Dividends | | | | |
| | 100.00% | | | | 19.11 | % | | | 0.00 | % | | | 0.00 | % | | | | |
Foreign taxes accrued during the fiscal year ended September 30, 2011, amounted to $10,531 and are expected to be passed through to shareholders as foreign tax credits on Form 1099 – Dividend for the year ending December 31, 2011. In addition, for the fiscal period ended September 30, 2011, gross income derived from sources within foreign countries amounted to $106,210 for the Fund.
| (1) | Qualified Dividends represent dividends which qualify for the corporate dividends received deduction. |
Items (A), (B), (C) and (D) are based on a percentage of the Fund’s total distribution including pass-through as foreign tax credit.
Item (E) is based on a percentage of ordinary income distributions of the Fund.
Item (F) represents the amount of “Qualified Dividend Income” as defined in the Jobs and Growth Tax Relief Reconciliation Act of 2003 and is reflected as a percentage of “Ordinary Income Distributions.” It is the Fund’s intention to designate the maximum amount permitted by the law up to 100%.
Item (G) is based on a percentage of ordinary income distributions of the Fund.
Item (H) is the amount of “Interest Related Dividends” as created by the American Jobs Creation Act of 2004 and is reflected as a percentage of net investment income distributions that is exempt from U.S. withholding tax when paid to foreign investors.
Item (I) is the amount of “Qualified Short-Term Capital Gain Dividends” as created by the American Jobs Creation Act of 2004 and is reflected as a percentage of short-term capital gain distributions that is exempt from U.S. withholding tax when paid to foreign investors.
| | |
24 | | Causeway Global Value Fund |
TRUSTEES AND OFFICERS INFORMATION (Unaudited)
Information pertaining to the Trustees and officers of the Trust is set forth below. Trustees who are not deemed to be “interested persons” of the Trust as defined in the 1940 Act are referred to as “Independent Trustees.” The Trustee who is deemed to be an “interested person” of the Trust is referred to as an “Interested Trustee.” The Trust’s Statement of Additional Information (“SAI”) includes additional information about the Trustees and officers. The SAI may be obtained without charge by calling 1-866-947-7000.
| | | | | | | | | | |
Name, Age’ | | Position(s)
Held with the Company | | Term of
Office and Length of
Time Served2 | | Principal Occupation(s) During Past Five Years | | Number of
Portfolios in
Trust
Complex
Overseen by
Trustee3 | | Other Directorships Held by Trustee4 |
| INDEPENDENT TRUSTEES5 | | | | | | | | | | |
John A. G. Gavin Age: 80 | | Trustee; Chairman of the Board | | Trustee since 9 701; Chairman since 10/04 | | Chairman, Gamma Holdings (international consulting and investment holding company) (since 1968); Senior Counselor, Hicks TransAmerica Partners (private equity investment firm) (since 2001). | | 5 | | Director, TCW Funds, Inc. and TCW Strategic Income Fund, Inc.; Trustee, HotchMs and Wiley Funds |
| | | | | |
| JohnR. Graham Age: 50 | | Trustee | | Since 10/08 | | Film composer (since 2005); Senior Vice President, Corporate Financial Development and Communications, The Walt Disney Company (2004-2005); Senior Vice President, Mergers and Acquisitions, Lehman Brothers Inc. (2000-2004). | | 5 | | none |
| | | | | |
| Lawry J. Meister Age: 49 | | Trustee | | Since 10/08 | | President, Steaven Jones Development Company, Inc. (real estate firm) (since 1995). | | 5 | | none |
| | | | | |
Eric H. Sussman Age: 45 | | Trustee; Chairman of the Audit Committee | | Trustee since 9/01; Chairman since 10/04 | | Tenured Lecturer, Anderson Graduate School of Management, University of California, Los Angeles (since 1995); President, Amber Capital, Inc. (real estate investment and financial planning firm ( since 1993) | | 5 | | Trustee, Presidio Funds (until 2010) |
| INTERESTED TRUSTEE5 | | | | | | | | | | |
Mark D. Cone Age: 43 | | Trustee | | Since 10/08 | | Executive Vice President and Chief Marketing Officer of the Adviser (since 2001). | | 5 | | none |
| | |
Causeway Global Value Fund | | 25 |
TRUSTEES AND OFFICERS INFORMATION (Unaudited)
(continued)
| | | | | | | | | | |
Name Address, Age1 | | Position(s) Held with the
Company | | Term of
Office and
Length of
Time Served2 | | Principal Occupation(s) During Past Five Years | | Number of
Portfolios in
Trust
Complex
Overseen by
Trustee3 | | Other
Directorships
Held by
Trustee4 |
OFFICERS | | | | | | | | | | |
Turner Swan 11111 Santa Monica Blvd., 15th Floor, Los Angeles, CA 90025 Age: 49 | | President | | Since 8/01 | | General Counsel, Secretary, and Member of the Adviser (since 2001); Compliance Officer of the Adviser (since 20 10). | | N/A | | N/A |
| | | | | |
Gracie V Fermelia 11111 Santa Monica Blvd., 15th Floor, Los Angeles, CA 90025 Age: 49 | | Chief Compliance Officer and Assistant Secretary | | CCO since 7/05; Asst. Sect, since 8/01 | | Chief Compliance Officer of the Adviser (since July 2005); Chief Operating Officer and Member of the Adviser (since 2001). | | N/A | | N/A |
| | | | | |
Michael Lawson6 One Freedom Valley Drive Oaks, PA 19456 Age: 50 | | Treasurer | | Since 7/05 | | Director of the Administrator’s Fund Accounting department (since July 2005); Manager in the Administrator’s Fund Accounting department (November 1998 to July 2005). | | N/A | | N/A |
| | | | | |
GretchenW Corbell 11111 Santa Monica Blvd., 15th Floor, Los Angeles, CA 90025 Age: 40 | | Secretary | | Since 10/11 | | Associate Attorney of the Adviser (since 2004). | | N/A | | N/A |
| | | | | |
Dianne Sulzbach6 One Freedom Valley Drive Oaks, PA 19456 Age: 34 | | Vice President and Assistant Secretary | | Since 8/11 | | Corporate Counsel of the Administrator (since 2011); Associate Counsel, Morgan Lewis & Bockius (2006-2010). | | N/A | | N/A |
| | | | | |
Carolyn F. Mead6 One Freedom Valley Drive Oaks, PA 19456 Age: 54 | | Vice President and Assistant Secretary | | Since 7/08 | | Corporate Counsel of the Administrator (since 2007); Associate Counsel, Stradley, Ronan, Stevens & Young LLP (2004-2007). | | N/A | | N/A |
| | |
26 | | Causeway Global Value Fund |
TRUSTEES AND OFFICERS INFORMATION (Unaudited)
(concluded)
| | | | | | | | | | |
Name Address, Age1 | | Position(s)
Held with the
Company | | Term of
Office and
Length of
Time
Served2 | | Principal Occupation(s) During Past Five Years | | Number of
Portfolios in Trust
Complex
Overseen by
Trustee3 | | Other
Directorships
Held by
Trustee4 |
Bernadette Sparling6 One Freedom Valley Drive Oaks, PA 19456 Age: 34 | | Vice President and Assistant Secretary | | Since 7/08 | | Corporate Counsel of the Administrator (since 2005); Associate Counsel, Blank Rome LLP (2001-2005). | | N/A | | N/A |
| 1 | Each Trustee may be contacted by writing to the Trustee c/o Causeway Capital Management Trust, One Freedom Valley Drive, Oaks, PA 19456. |
| 2 | Each Trustee holds office during the lifetime of the Trust or until his or her sooner resignation, retirement, removal, death or incapacity in accordance with the Trust’s Declaration of Trust. The president, treasurer and secretary each holds office at the pleasure of the Board of Trustees or until he or she sooner resigns in accordance with the Trust’s Bylaws. |
| 3 | The “Trust Complex” consists of all registered investment companies for which Causeway Capital Management LLC serves as investment adviser. As of September 30, 2011, the Trust Complex consisted of one investment company with five portfolios — International Value Fund, Emerging Markets Fund, Global Value Fund, International Opportunities Fund, and Global Absolute Return Fund. |
| 4 | Directorships of companies required to report to the Securities and Exchange Commission under the Securities Exchange Act of 1934 (i.e., “public companies”) or other investment companies registered under the 1940 Act. |
| 5 | Mr. Cone is considered an “interested person” of the Trust as defined in the 1940 Act, because he is an employee of the Adviser. |
| 6 | These officers of the Trust also serve as officers of one or more mutual funds for which SEI Investments Company or an affiliate acts as investment manager, administrator or distributor. |
| | |
Causeway Global Value Fund | | 27 |
DISCLOSURE OF FUND EXPENSES (Unaudited)
As a shareholder of the Fund, you incur two types of costs: (1) transaction costs, including redemption fees, and (2) ongoing costs, including management fees, shareholder service fees, and other Fund expenses. It is important for you to understand the impact of these costs on your investment returns.
Ongoing operating expenses are deducted from a mutual fund’s gross income and directly reduce its final investment return. These expenses are expressed as a percentage of a mutual fund’s average net assets; this percentage is known as a mutual fund’s expense ratio.
The following examples use the expense ratio and are intended to help you understand the ongoing costs (in dollars) of investing in the Fund and to compare these costs with those of other mutual funds. The examples are based on an investment of $ 1,000 made at the beginning of the period shown and held for the entire period.
The table on the next page illustrates the Fund’s costs in two ways:
Actual Fund Return. This section helps you to estimate the actual expenses after fee waivers that the Fund incurred over the period. The “Expenses Paid During Period” column shows the actual dollar expense cost incurred by a $1,000 investment in the Fund, and the “Ending Account Value” number is derived from deducting that expense cost from the Fund’s gross investment return.
You can use this information, together with the actual amount you invested in the Fund, to estimate the expenses you paid over that period. Simply divide your actual account value by $ 1,000 to arrive at a ratio (for example, an $8,600 account value divided by $ 1,000 = 8.6), then multiply that ratio by the number shown under “Expenses Paid During Period.”
Hypothetical 5% Return. This section helps you compare the Fund’s costs with those of other mutual funds. It assumes that the Fund had an annual 5% return before expenses during the year, but that the expense ratio (Column 3) for the period is unchanged. This example is useful in making comparisons because the Securities and Exchange Commission requires all mutual funds to make this 5% calculation. You can assess the Fund’s comparative cost by comparing the hypothetical result for the Fund in the “Expenses Paid During Period” column with those that appear in the same charts in the shareholder reports for other mutual funds.
NOTE: Because the return is set at 5% for comparison purposes—NOT the Fund’s actual return—the account values shown may not apply to your specific investment.
| | |
28 | | Causeway Global Value Fund |
DISCLOSURE OF FUND EXPENSES (Unaudited)
(concluded)
| | | | | | | | | | | | | | | | |
| | | Beginning
Account
Value
4/1/11 | | | Ending
Account
Value
9/30/11 | | | Annualized
Expense
Ratios | | | Expenses
Paid
During
Period* | |
Causeway Global Value Fund | | | | | | | | | | | | | | | | |
Actual Fund Return | | | | | | | | | | | | | | | | |
Institutional Class | | $ | 1,000.00 | | | $ | 815.10 | | | | 1.10 | % | | $ | 5.00 | |
Hypothetical 5% Return | | | | | | | | | | | | | | | | |
Institutional Class | | $ | 1,000.00 | | | $ | 1,019.56 | | | | 1.10 | % | | $ | 5.56 | |
Causeway Global Value Fund | | | | | | | | | | | | | | | | |
Actual Fund Return | | | | | | | | | | | | | | | | |
Investor Class | | $ | 1,000.00 | | | $ | 813.00 | | | | 1.34 | % | | $ | 6.11 | |
Hypothetical 5% Return | | | | | | | | | | | | | | | | |
Investor Class | | $ | 1,000.00 | | | $ | 1,018.33 | | | | 1.34 | % | | $ | 6.80 | |
| * | Expenses are equal to the Fund’s annualized expense ratio multiplied by the average account value over the period multiplied by 183/365 (to reflect the one-half year period). |
| | |
Causeway Global Value Fund | | 29 |
STATEMENT REGARDING BASIS FOR APPROVAL OF INVESTMENT ADVISORY AGREEMENT (Unaudited)
Section 15(c) of the Investment Company Act of 1940, as amended (the “1940 Act”) requires the Board of Trustees (the “Board”) of Causeway Capital Management Trust (the “Trust”) annually to approve continuance of the investment advisory agreement (the “Advisory Agreement”) between the Trust and Causeway Capital Management LLC (the “Adviser”) with respect to Causeway Global Value Fund (the “Fund”). Continuance of the Advisory Agreement must be approved by a majority of the Trustees and a majority of the independent Trustees (i.e., Trustees who are not “interested persons” of the Trust as defined in the 1940 Act). The Board was comprised of four independent Trustees and one interested Trustee when the continuation of the Advisory Agreement was considered.
Information Received. At each regular quarterly meeting, the Board reviews a wide variety of materials relating to the nature, extent and quality of the Adviser’s services, including information concerning the Fund’s performance. At least annually, the Board is provided with additional quantitative and qualitative information to assist it in evaluating whether to approve the continuance of the Advisory Agreement. The Board met on August 1, 2011, to consider whether to approve the continuance of the Advisory Agreement for an additional one-year period. In connection with the meeting, the Trustees received and reviewed extensive materials prepared by the Adviser relating to the Advisory Agreement in response to information requested on the independent Trustees’ behalf by their independent legal counsel.
Factors Considered. In reviewing the Advisory Agreement, the Trustees considered a number of factors including, but not limited to: (1) the nature, extent and quality of the services to be provided by the Adviser, (2) the investment performance of the Fund, (3) comparisons of the services to be rendered and the amounts to be paid under the Advisory Agreement with those of other funds and those of the Adviser under other investment advisory agreements with other registered investment companies and other types of clients, (4) the costs of the services to be provided and estimated profits to be realized by the Adviser and its affiliates from their relationship with the Fund, (5) the extent to which economies of scale would be realized as the Fund grows and whether fee levels reflect these economies of scale for the benefit of Fund investors, and (6) any other benefits derived by the Adviser from its relationship with the Fund.
First, regarding the nature, extent and quality of the services to be provided by the Adviser, the Trustees considered, among other things, the Adviser’s personnel, experience, track record and compliance program. The Trustees considered the qualifications, backgrounds and responsibilities of the Adviser’s principal personnel who provide services to the Fund, as well as the level of attention those individuals provide to the Fund. The Trustees noted the Adviser’s commitment to devoting resources to staffing and technology in support of its investment management services. They also reviewed the Adviser’s investment philosophy and processes and its compliance program, and considered the scope of the Adviser’s services. The Trustees concluded that the nature, extent and quality of the services provided by the Adviser have benefited and will continue to benefit the Fund and its shareholders.
| | |
30 | | Causeway Global Value Fund |
STATEMENT REGARDING BASIS FOR APPROVAL OF INVESTMENT ADVISORY AGREEMENT (Unaudited) (continued)
Second, regarding the investment performance of the Fund, the Trustees reviewed the investment results of the Fund’s Institutional and Investor share classes for various periods ended June 30, 2011, compared to the MSCI World Index (the “Index”) and the mutual funds included in the Morningstar U.S. Open End World Stock funds category of funds. They noted that the Fund had outperformed the Index and the Morningstar category averages for the one-year, three-year, and since-inception periods. The Trustees concluded that the Adviser’s record in managing the Fund indicates that its continued management will benefit the Fund and its shareholders.
Third, the Trustees compared the Fund’s advisory fee and total expenses with those of other similar mutual funds. They noted that although the Fund’s advisory fee is 5 basis points higher than the average and the median advisory fee charged by funds in the Morningstar U.S. Open End World Stock funds category, its expense ratios, after application of the Adviser’s expense limit agreement, are below the average and median of the funds in that Morningstar category. The Trustees noted that the Adviser does not currently manage assets of other clients pursuant to its global value equity strategy, but compared the Fund’s advisory fee with the standard advisory fee offered by the Adviser to separate account clients. The Trustees noted that, although the separate account fee is lower than the fee paid by the Fund for accounts with assets over $20 million, the difference appropriately reflected the Adviser’s significantly greater responsibilities with respect to the Fund, which include the provision of many additional administrative and shareholder services (such as services related to the Fund’s disclosure documents, financial statements, 1940 Act compliance policies and procedures, preparation of Board and committee materials and meetings, annual Board reports and certifications, participation in regulatory examinations and legal and compliance matters, oversight of daily valuation, oversight of Fund service providers, negotiation of Fund intermediary agreements, coordination with Fund intermediaries providing shareholder recordkeeping services, shareholder communications, and due diligence for advisers, consultants and institutional investors). The Trustees concluded that the Fund’s advisory fee and expense ratio are reasonable and appropriate under the circumstances.
Fourth, the Trustees considered the Adviser’s costs of providing services to the Fund and estimated profits realized by the Adviser from its relationship with the Fund. They reviewed the Adviser’s estimated after-tax profit margin with respect to such services and the methodology used to generate that estimate, and noted that the cost allocation methodology presented to the Trustees is reasonable. They noted that, due to the expense limit agreement, the Adviser experienced significant losses managing the Fund in the past year, and that the Adviser’s sponsorship of the Fund, at least in the Fund’s early years, could involve significant further expenses to the Adviser.
Fifth, regarding economies of scale, the Trustees observed that, although the Fund’s advisory fee schedule does not contain fee breakpoints, it is difficult to determine the existence or extent of any economies of scale. They noted that the Adviser is sharing economies of scale through reasonable advisory fee levels, the expense limit agreement, and devoting additional resources to staff and technology to focus on continued performance and service to the Fund’s
| | |
Causeway Global Value Fund | | 31 |
STATEMENT REGARDING BASIS FOR APPROVAL OF INVESTMENT ADVISORY AGREEMENT (Unaudited) (concluded)
shareholders. They also noted that the Adviser, at least in the Fund’s early years, would incur significant losses in managing the Fund. The Trustees concluded that under the circumstances the Adviser is sharing any economies of scale with the Fund appropriately.
Sixth, regarding any other benefits derived by the Adviser from its relationship with the Fund – often called “fall-out” benefits – the Trustees observed that the Adviser does not earn common “fall-out” benefits such as affiliated custody fees, affiliated transfer agency fees, affiliated brokerage commissions, profits from rule 12b-l fees, “contingent deferred sales commissions” or “float” benefits on short-term cash. The Trustees concluded that the primary “fall-out” benefit received by the Adviser is research services provided by brokers used by the Fund and that this benefit is reasonable in relation to the value of the services that the Adviser provides to the Fund.
Approval. At the August 1, 2011 meeting, the Trustees considered the approval of the Advisory Agreement and discussed the information and factors noted above with representatives of the Adviser. The independent Trustees also met in a private session with independent counsel at which no representatives of the Adviser were present. In their deliberations, the independent Trustees did not identify any particular information or factor that was determinative or controlling, and the foregoing summary does not detail all the matters considered. Based on their review, the Trustees (including the independent Trustees) unanimously concluded that the Advisory Agreement is fair and reasonable to the Fund and its shareholders, the Fund’s advisory fee is reasonable and renewal of the Advisory Agreement is in the best interests of the Fund and its shareholders, and the Board of Trustees approved the renewal of the Advisory Agreement for a twelve-month period beginning September 20, 2011.
| | |
32 | | Causeway Global Value Fund |
INVESTMENT ADVISER
Causeway Capital Management LLC
11111 Santa Monica Blvd.
15th Floor
Los Angeles, CA 90025
DISTRIBUTOR
SEI Investments Distribution Co.
One Freedom Valley Drive
Oaks, Pennsylvania 19456
TO OBTAIN MORE INFORMATION
Call 1-866-947-7000 or visit us online at
www.causewayfunds.com
This material must be preceded or accompanied by a current prospectus.
The Fund files its complete schedule of portfolio holdings with the Securities and Exchange Commission (“Commission”) for the first and third quarters of each fiscal year on Form N-Q within sixty days after the end of the period. The Fund’s Forms N-Q are available on the Commission’s website at http://www.sec.gov, and may be reviewed and copied at the Commission’s Public Reference Room in Washington, DC. Information on the operation of the Public Reference Room may be obtained by calling 1-800-SEC-0330.
A description of the policies and procedures that the Fund uses to determine how to vote proxies relating to portfolio securities, as well as information relating to how the Trust voted proxies relating to portfolio securities during the most recent 12-month period ended June 30, is available (i) without charge, upon request, by calling 1 -866-947-7000; and (ii) on the Commission’s website at http://www.sec.gov.
CCM-AR-003-0400
The registrant has adopted a code of ethics that applies to the registrant’s principal executive officer, principal financial officer and principal accounting officer. During the fiscal year ended September 30, 2011, there were no material changes or waivers to the code of ethics.
| Item 3. | Audit Committee Financial Expert. |
(a)(1) The registrant’s board of trustees has determined that the registrant has at least one audit committee financial expert serving on the audit committee.
(a)(2) The audit committee financial expert is Eric Sussman. Mr. Sussman is independent as defined in Form N-CSR Item 3(a)(2).
| Item 4. | Principal Accountant Fees and Services. |
Aggregate fees billed to the registrant for professional services rendered by the registrant’s principal accountant for the fiscal years ended September 30, 2011 and 2010 were as follows:
| | | | | | | | | | |
| | | 2011 | | | 2010 | |
| (a) | | Audit Fees | | $ | 166,895 | | | $ | 131,900 | |
| (b) | | Audit-Related Fees | | | None | | | | None | |
| (c) | | Tax Fees(1) | | $ | 42,700 | | | $ | 27,700 | |
| (d) | | All Other Fees | | | None | | | | None | |
Note:
| (1) | Tax fees include amounts related to tax return and excise tax calculation reviews and foreign tax reclaim analysis. |
(e)(1) The registrant’s audit committee has adopted a charter that requires it to pre-approve the engagement of auditors to (i) audit the registrant’s financial statements, (ii) provide other audit or non-audit services to the registrant, or (iii) provide non-audit services to the registrant’s investment adviser if the engagement relates directly to the operations and financial reporting of the registrant.
(e)(2) No services included in paragraphs (b) through (d) of this Item were approved by the audit committee pursuant to paragraph (c)(7)(i)(C) of Rule 2-01 of Regulation S-X.
(f) Not applicable.
(g) For the fiscal year ended September 30, 2011, the aggregate non-audit fees billed by the registrant’s accountant for services rendered to the registrant and the registrant’s investment adviser were $42,700 and $178,492, respectively. For the fiscal year ended September 30, 2010, the aggregate non-audit fees billed by the registrant’s accountant for services rendered to the registrant and the registrant’s investment adviser were $27,700 and $168,975, respectively.
(h) The audit committee considered whether the provision of non-audit services rendered to the registrant’s investment adviser by the registrant’s principal accountant that were not pre-approved pursuant to paragraph (c)(7)(ii) of Rule 2-01 of Regulation S-X was compatible with maintaining the principal accountant’s independence.
| Item 5. | Audit Committee of Listed Registrants. |
Not applicable to open-end management investment companies.
| Item 6. | Schedule of Investments |
See Item 1.
| Item 7. | Disclosure of Proxy Voting Policies and Procedures for Closed-End Management Investment Companies. |
Not applicable to open-end management investment companies.
| Item 8. | Portfolio Managers of Closed-End Management Investment Companies |
Not applicable to open-end management investment companies.
| Item 9. | Purchases of Equity Securities by Closed-End Management Investment Company and Affiliated Purchasers. |
Not applicable to open-end management investment companies.
| Item 10. | Submission of Matters to a Vote of Security Holders. |
There have been no material changes to the registrant’s procedures by which shareholders may recommend nominees to the registrant’s board of trustees since the registrant’s last filing on Form N-CSR.
| Item 11. | Controls and Procedures. |
(a) The certifying officers, whose certifications are included herewith, have evaluated the registrant’s disclosure controls and procedures within 90 days of the filing date of this report. In their opinion, based on their evaluation, the registrant’s disclosure controls and procedures are adequately designed, and are operating effectively to ensure, that information required to be disclosed by the registrant in the reports it files or submits under the Securities Exchange Act of 1934 is recorded, processed, summarized and reported within the time periods specified in the Securities and Exchange Commission’s rules and forms.
(b) There were no changes in the registrant’s internal control over financial reporting that occurred during the registrant’s second fiscal quarter of the period covered by this report that have materially affected, or are reasonably likely to materially affect, the registrant’s internal control over financial reporting.
(a)(1) Code of Ethics attached hereto.
(a)(2) Separate certifications for the principal executive officer and the principal financial officer of the registrant as required by Rule 30a-2(a) under the Investment Company Act of 1940 (17 CFR 270.30a-2(a)) are filed herewith.
(b) Officer certifications as required by Rule 30a-2(b) under the Investment Company Act of 1940 (17 CFR 270.30a-2(b)) also accompany this filing as an exhibit.
SIGNATURES
Pursuant to the requirements of the Securities Exchange Act of 1934 and the Investment Company Act of 1940, the registrant has duly caused this report to be signed on its behalf by the undersigned, thereunto duly authorized.
| | | | | | |
(Registrant) | | | | Causeway Capital Management Trust | | |
| | | |
By (Signature and Title)* | | | | /s/ Turner Swan | | |
| | | | Turner Swan, President | | |
| | | |
Date: December 2, 2011 | | | | | | |
Pursuant to the requirements of the Securities Exchange Act of 1934 and the Investment Company Act of 1940, this report has been signed below by the following persons on behalf of the registrant and in the capacities and on the dates indicated.
| | | | | | |
By (Signature and Title)* | | | | /s/ Turner Swan | | |
| | | | Turner Swan, President | | |
| | | |
| Date: December 2, 2011 | | | | | | |
| | | |
| By (Signature and Title)* | | | | /s/ Michael Lawson | | |
| | | | Michael Lawson, Treasurer | | |
| | | |
| Date: December 2, 2011 | | | | | | |
| * | Print the name and title of each signing officer under his or her signature. |